| | | FREE WRITING PROSPECTUS |
| | | FILED PURSUANT TO RULE 433 |
| | | REGISTRATION FILE NO.: 333-226486-12 |
| | | |
Free Writing Prospectus
Structural and Collateral Term Sheet
$1,634,271,868
(Approximate Initial Pool Balance)
$1,401,183,000
(Approximate Aggregate Certificate Balance of Offered Certificates)
BANK 2020-BNK25
as Issuing Entity
Wells Fargo Commercial Mortgage Securities, Inc.
as Depositor
Morgan Stanley Mortgage Capital Holdings LLC
Bank of America, National Association
Wells Fargo Bank, National Association
National Cooperative Bank, N.A.
as Sponsors and Mortgage Loan Sellers
Commercial Mortgage Pass-Through Certificates
Series 2020-BNK25
January 21, 2020
WELLS FARGO SECURITIES | BofA SECURITIES | MORGAN STANLEY |
| | |
Co-Lead Manager and Joint Bookrunner | Co-Lead Manager and Joint Bookrunner | Co-Lead Manager and Joint Bookrunner |
| | |
Academy Securities, Inc. Co-Manager | | Drexel Hamilton Co-Manager |
STATEMENT REGARDING THIS FREE WRITING PROSPECTUS
The depositor has filed a registration statement (including a prospectus) with the Securities and Exchange Commission (‘‘SEC’’) (SEC File No. 333-226486) for the offering to which this communication relates. Before you invest, you should read the prospectus in the registration statement and other documents the depositor has filed with the SEC for more complete information about the depositor, the issuing entity and this offering. You may get these documents for free by visiting EDGAR on the SEC Web site at www.sec.gov. Alternatively, the depositor, any underwriter, or any dealer participating in the offering will arrange to send you the prospectus after filing if you request it by calling toll free 1-800-745-2063 (8 a.m. – 5 p.m. EST) or by emailing wfs.cmbs@wellsfargo.com.
Nothing in this document constitutes an offer of securities for sale in any jurisdiction where the offer or sale is not permitted. The information contained herein is preliminary as of the date hereof, supersedes any such information previously delivered to you and will be superseded by any such information subsequently delivered and ultimately by the final prospectus relating to the securities. These materials are subject to change, completion, supplement or amendment from time to time.
This free writing prospectus has been prepared by the underwriters for information purposes only and does not constitute, in whole or in part, a prospectus for the purposes of Regulation (EU) 2017/1129 (as amended) and/or Part VI of the Financial Services and Markets Act 2000, as amended, or other offering document.
STATEMENT REGARDING ASSUMPTIONS AS TO SECURITIES, PRICING ESTIMATES AND OTHER INFORMATION
The attached information contains certain tables and other statistical analyses (the “Computational Materials”) which have been prepared in reliance upon information furnished by the Mortgage Loan Sellers. Numerous assumptions were used in preparing the Computational Materials, which may or may not be reflected herein. As such, no assurance can be given as to the Computational Materials’ accuracy, appropriateness or completeness in any particular context; or as to whether the Computational Materials and/or the assumptions upon which they are based reflect present market conditions or future market performance. The Computational Materials should not be construed as either projections or predictions or as legal, tax, financial or accounting advice. You should consult your own counsel, accountant and other advisors as to the legal, tax, business, financial and related aspects of a purchase of these securities. Any weighted average lives, yields and principal payment periods shown in the Computational Materials are based on prepayment and/or loss assumptions, and changes in such prepayment and/or loss assumptions may dramatically affect such weighted average lives, yields and principal payment periods. In addition, it is possible that prepayments or losses on the underlying assets will occur at rates higher or lower than the rates shown in the attached Computational Materials. The specific characteristics of the securities may differ from those shown in the Computational Materials due to differences between the final underlying assets and the preliminary underlying assets used in preparing the Computational Materials. The principal amount and designation of any security described in the Computational Materials are subject to change prior to issuance. None of Wells Fargo Securities, LLC, BofA Securities, Inc., Morgan Stanley & Co. LLC, Academy Securities, Inc., Drexel Hamilton, LLC or any of their respective affiliates, make any representation or warranty as to the actual rate or timing of payments or losses on any of the underlying assets or the payments or yield on the securities. The information in this presentation is based upon management forecasts and reflects prevailing conditions and management’s views as of this date, all of which are subject to change. In preparing this presentation, we have relied upon and assumed, without independent verification, the accuracy and completeness of all information available from public sources or which was provided to us by or on behalf of the Mortgage Loan Sellers or which was otherwise reviewed by us.
This free writing prospectus contains certain forward-looking statements. If and when included in this free writing prospectus, the words “expects”, “intends”, “anticipates”, “estimates” and analogous expressions and all statements that are not historical facts, including statements about our beliefs or expectations, are intended to identify forward-looking statements. Any forward-looking statements are made subject to risks and uncertainties which could cause actual results to differ materially from those stated. Those risks and uncertainties include, among other things, declines in general economic and business conditions, increased competition, changes in demographics, changes in political and social conditions, regulatory initiatives and changes in customer preferences, many of which are beyond our control and the control of any other person or entity related to this offering. The forward-looking statements made in this free writing prospectus are made as of the date stated on the cover. We have no obligation to update or revise any forward-looking statement.
Wells Fargo Securities is the trade name for the capital markets and investment banking services of Wells Fargo & Company and its subsidiaries, including but not limited to Wells Fargo Securities, LLC, a member of NYSE, FINRA, NFA and SIPC, Wells Fargo Prime Services, LLC, a member of FINRA, NFA and SIPC, and Wells Fargo Bank, N.A. Wells Fargo Securities, LLC and Wells Fargo Prime Services, LLC are distinct entities from affiliated banks and thrifts.
IMPORTANT NOTICE REGARDING THE OFFERED CERTIFICATES
The information herein is preliminary and may be supplemented or amended prior to the time of sale. In addition, the Offered Certificates referred to in these materials and the asset pool backing them are subject to modification or revision (including the possibility that one or more classes of certificates may be split, combined or eliminated at any time prior to issuance or availability of a final prospectus) and are offered on a “when, as and if issued” basis.
The underwriters described in these materials may from time to time perform investment banking services for, or solicit investment banking business from, any company named in these materials. The underwriters and/or their affiliates or respective employees may from time to time have a long or short position in any security or contract discussed in these materials.
The information contained herein supersedes any previous such information delivered to any prospective investor and will be superseded by information delivered to such prospective investor prior to the time of sale.
IMPORTANT NOTICE RELATING TO AUTOMATICALLY-GENERATED EMAIL DISCLAIMERS
Any legends, disclaimers or other notices that may appear at the bottom of any email communication to which this free writing prospectus is attached relating to (1) these materials not constituting an offer (or a solicitation of an offer), (2) any representation that these materials are accurate or complete and may not be updated or (3) these materials possibly being confidential, are not applicable to these materials and should be disregarded. Such legends, disclaimers or other notices have been automatically generated as a result of these materials having been sent via Bloomberg or another system.
THE INFORMATION IN THIS STRUCTURAL AND COLLATERAL TERM SHEET IS NOT COMPLETE AND MAY BE AMENDED PRIOR TO THE TIME OF SALE. THIS TERM SHEET IS NOT AN OFFER TO SELL THESE SECURITIES AND IT IS NOT A SOLICITATION OF AN OFFER TO BUY THESE SECURITIES IN ANY JURISDICTION WHERE THE OFFER OR SALE IS NOT PERMITTED.
2
BANK 2020-BNK25 | Certificate Structure |
I. Certificate Structure
Class | Expected Ratings
(Fitch/KBRA/S&P)(1) | Approximate Initial
Certificate Balance or
Notional Amount(2) | Approx.
Initial Credit
Support(3) | Pass-Through
Rate Description | Weighted
Average
Life
(Years)(4) | Expected
Principal
Window(4) | Certificate
Principal to
Value
Ratio(5) | Certificate
Principal
U/W NOI
Debt Yield(6) |
| Offered Certificates | | | | |
A-1 | AAAsf/AAA(sf)/AAA(sf) | $15,250,000 | 30.000% | (7) | 2.63 | 03/20 - 01/25 | 36.0% | 19.7% |
A-2 | AAAsf/AAA(sf)/AAA(sf) | $8,461,000 | 30.000% | (7) | 4.92 | 01/25 - 01/25 | 36.0% | 19.7% |
A-3 | AAAsf/AAA(sf)/AAA(sf) | $61,183,000 | 30.000% | (7) | 6.85 | 12/26 - 01/27 | 36.0% | 19.7% |
A-SB | AAAsf/AAA(sf)/AAA(sf) | $22,612,000 | 30.000% | (7) | 7.25 | 01/25 - 08/29 | 36.0% | 19.7% |
A-4 | AAAsf/AAA(sf)/AAA(sf) | (8) | 30.000% | (7) | (8) | (8) | 36.0% | 19.7% |
A-5 | AAAsf/AAA(sf)/AAA(sf) | (8) | 30.000% | (7) | (8) | (8) | 36.0% | 19.7% |
X-A | AAAsf/AAA(sf)/AAA(sf) | $1,086,790,000(9) | N/A | Variable(10) | N/A | N/A | N/A | N/A |
X-B | A-sf/AAA(sf)/A(sf) | $314,393,000(11) | N/A | Variable(12) | N/A | N/A | N/A | N/A |
A-S | AAAsf/AAA(sf)/AAA(sf) | $194,070,000 | 17.500% | (7) | 9.92 | 01/30 - 01/30 | 42.5% | 16.7% |
B | AA-sf/AA-(sf)/AA(sf) | $62,102,000 | 13.500% | (7) | 9.92 | 01/30 - 01/30 | 44.5% | 16.0% |
C | A-sf/A-(sf)/A(sf) | $58,221,000 | 9.750% | (7) | 9.92 | 01/30 - 01/30 | 46.5% | 15.3% |
| Non-Offered Certificates | | | | | | | |
X-D | BBB-sf/BBB-(sf)/NR | $58,221,000(13) | N/A | Variable(14) | N/A | N/A | N/A | N/A |
X-F | BB-sf/BB-(sf)/NR | $29,111,000(15) | N/A | Variable(16) | N/A | N/A | N/A | N/A |
X-G | B-sf/B-(sf)/NR | $15,525,000(15) | N/A | Variable(16) | N/A | N/A | N/A | N/A |
X-H | NR/NR/NR | $48,518,274(15) | N/A | Variable(16) | N/A | N/A | N/A | N/A |
D | BBBsf/BBB(sf)/NR | $36,874,000 | 7.375% | (7) | 9.92 | 01/30 - 01/30 | 47.7% | 14.9% |
E | BBB-sf/BBB-(sf)/NR | $21,347,000 | 6.000% | (7) | 9.92 | 01/30 - 01/30 | 48.4% | 14.7% |
F | BB-sf/BB-(sf)/NR | $29,111,000 | 4.125% | (7) | 9.96 | 01/30 - 02/30 | 49.4% | 14.4% |
G | B-sf/B-(sf)/NR | $15,525,000 | 3.125% | (7) | 10.01 | 02/30 - 02/30 | 49.9% | 14.2% |
H | NR/NR/NR | $48,518,274 | 0.000% | (7) | 10.01 | 02/30 - 02/30 | 51.5% | 13.8% |
| Non-Offered Eligible Vertical Interest | | | | | |
RR Interest | NR/NR/NR | $81,713,593.41 | N/A | WAC(17) | 9.60 | 03/20 - 02/30 | N/A | N/A |
Notes:
| (1) | The expected ratings presented are those of Fitch Ratings, Inc. (“Fitch”), Kroll Bond Rating Agency, Inc. (“KBRA”) and S&P Global Ratings (“S&P”), which the depositor hired to rate the Offered Certificates. One or more other nationally recognized statistical rating organizations that were not hired by the depositor may use information they receive pursuant to Rule 17g-5 under the Securities Exchange Act of 1934, as amended (the “Exchange Act”) or otherwise, to rate or provide market reports and/or published commentary related to the Offered Certificates. We cannot assure you as to what ratings a non-hired nationally recognized statistical rating organization would assign or that its reports will not express differing, possibly negative, views of the mortgage loans and/or the Offered Certificates. The ratings of each Class of Offered Certificates address the likelihood of the timely distribution of interest and, except in the case of the Class X-A and X-B Certificates, the ultimate distribution of principal due on those Classes on or before the Rated Final Distribution Date. See “Risk Factors—Other Risks Relating to the Certificates—Nationally Recognized Statistical Rating Organizations May Assign Different Ratings to the Certificates; Ratings of the Certificates Reflect Only the Views of the Applicable Rating Agencies as of the Dates Such Ratings Were Issued; Ratings May Affect ERISA Eligibility; Ratings May Be Downgraded” and “Ratings” in the Preliminary Prospectus, expected to be dated January 21, 2020 (the “Preliminary Prospectus”). Fitch, KBRA and S&P have informed us that the “sf” designation in their ratings represents an identifier for structured finance product ratings. |
| (2) | The Certificate Balances and Notional Amounts set forth in the table are approximate. The actual initial Certificate Balances and Notional Amounts may be larger or smaller depending on the initial pool balance of the mortgage loans definitively included in the pool of mortgage loans, which aggregate cut-off date balance may be as much as 5% larger or smaller than the amount presented in the Preliminary Prospectus. In addition, the Notional Amounts of the Class X-A, Class X-B, Class X-D, Class X-F, Class X-G and Class X-H Certificates (collectively referred to herein as “Class X Certificates”) may vary depending upon the final pricing of the Classes of Principal Balance Certificates (as defined in the Preliminary Prospectus) whose Certificate Balances comprise such Notional Amounts and, if as a result of such pricing the pass-through rate of any Class of the Class X Certificates would be equal to zero at all times, such Class of Certificates will not be issued on the closing date of this securitization. |
| (3) | The approximate initial credit support with respect to the Class A-1, A-2, A-3, A-SB, A-4 and A-5 Certificates represents the approximate credit enhancement for the Class A-1, A-2, A-3, A-SB, A-4 and A-5 Certificates in the aggregate. The RR Interest only provides credit support to the limited extent that losses incurred on the underlying mortgage loans are allocated to it, on the one hand, and to the Offered Certificates and the Non-Offered Certificates, on the other hand, pro rata, in accordance with their respective Percentage Allocation Entitlements. |
| (4) | Weighted Average Lives and Expected Principal Windows are calculated based on an assumed prepayment rate of 0% CPR and the “Structuring Assumptions” described under “Yield and Maturity Considerations—Weighted Average Life” in the Preliminary Prospectus. |
| (5) | The Certificate Principal to Value Ratio for each Class of Certificates (other than the Class A-1, A-2, A-3, A-SB, A-4 and A-5 Certificates) is calculated as the product of (a) the weighted average Cut-off Date LTV Ratio for the mortgage loans and (b) a fraction, the numerator of which is the total initial Certificate Balance of such Class of Certificates and all Classes of Principal Balance Certificates senior to such Class of Certificates and the denominator of which is the total initial Certificate Balance of all of the Principal Balance Certificates (other than the RR Interest). The Certificate Principal to Value Ratio for each of the Class A-1, A-2, A-3, A-SB, A-4 and A-5 Certificates is calculated in the aggregate for those Classes as if they were a single Class and is calculated as the product of (a) the weighted average Cut-off Date LTV Ratio for the mortgage loans and (b) a fraction, the numerator of which is the total initial aggregate Certificate Balances of such Classes of Certificates and the denominator of which is the total initial Certificate Balance of all of the Principal Balance Certificates (other than the RR Interest). In any event, however, excess mortgaged property value associated with a mortgage loan will not be available to offset losses on any other mortgage loan. |
THE INFORMATION IN THIS STRUCTURAL AND COLLATERAL TERM SHEET IS NOT COMPLETE AND MAY BE AMENDED PRIOR TO THE TIME OF SALE. THIS TERM SHEET IS NOT AN OFFER TO SELL THESE SECURITIES AND IT IS NOT A SOLICITATION OF AN OFFER TO BUY THESE SECURITIES IN ANY JURISDICTION WHERE THE OFFER OR SALE IS NOT PERMITTED.
3
BANK 2020-BNK25 | Certificate Structure |
| (6) | The Certificate Principal U/W NOI Debt Yield for each Class of Certificates (other than the Class A-1, A-2, A-3, A-SB, A-4 and A-5 Certificates) is calculated as the product of (a) the weighted average U/W NOI Debt Yield for the mortgage loans and (b) a fraction, the numerator of which is the total initial Certificate Balance of all of the Classes of Principal Balance Certificates (other than the RR Interest) and the denominator of which is the total initial Certificate Balance for such Class of Certificates and all Classes of Principal Balance Certificates senior to such Class of Certificates. The Certificate Principal U/W NOI Debt Yield for each of the Class A-1, A-2, A-3, A-SB, A-4 and A-5 Certificates is calculated in the aggregate for those Classes as if they were a single Class and is calculated as the product of (a) the weighted average U/W NOI Debt Yield for the mortgage loans and (b) a fraction, the numerator of which is the total initial Certificate Balance of all of the Classes of Principal Balance Certificates (other than the RR Interest) and the denominator of which is the total aggregate initial Certificate Balances for the Class A-1, A-2, A-3, A-SB, A-4 and A-5 Certificates. In any event, however, cash flow from each mortgaged property supports only the related mortgage loan and will not be available to support any other mortgage loan. |
| (7) | The pass-through rates for the Class A-1, A-2, A-3, A-SB, A-4, A-5, A-S, B, C, D, E, F, G and H Certificates will, in each case, be one of the following: (i) a fixed rate per annum, (ii) a variable rate per annum equal to the weighted average of the net mortgage interest rates on the mortgage loans for the related distribution date, (iii) a variable rate per annum equal to the lesser of (a) a fixed rate and (b) the weighted average of the net mortgage interest rates on the mortgage loans for the related distribution date or (iv) a variable rate per annum equal to the weighted average of the net mortgage interest rates on the mortgage loans for the related distribution date minus a specified percentage. For purposes of the calculation of the weighted average of the net mortgage interest rates on the mortgage loans for each distribution date, the mortgage interest rates will be adjusted as necessary to a 30/360 basis. |
| (8) | The exact initial Certificate Balances of the Class A-4 and A-5 Certificates are unknown and will be determined based on the final pricing of those Classes of Certificates. However, the respective approximate initial Certificate Balances, weighted average lives and principal windows of the Class A-4 and A-5 Certificates are expected to be within the applicable ranges reflected in the following chart. The aggregate initial Certificate Balance of the Class A-4 and A-5 Certificates is expected to be approximately $979,284,000, subject to a variance of plus or minus 5%. |
Class of Certificates | | Expected Range of Approximate Initial
Certificate Balance | | Expected Range of Weighted Average Life (Years) | | Expected Range of
Principal Window |
| Class A-4 | | $100,000,000 - $480,000,000 | | 9.59 – 9.76 | | 08/29 – 10/29 / 08/29 – 12/29 |
| Class A-5 | | $499,284,000 - $879,284,000 | | 9.84 – 9.86 | | 10/29 – 01/30 / 12/29 – 01/30 |
| (9) | The Class X-A Certificates are notional amount certificates. The Notional Amount of the Class X-A Certificates will be equal to the aggregate Certificate Balance of the Class A-1, A-2, A-3, A-SB, A-4 and A-5 Certificates outstanding from time to time. The Class X-A Certificates will not be entitled to distributions of principal. |
| (10) | The pass-through rate for the Class X-A Certificates for any distribution date will be a per annum rate equal to the excess, if any, of (a) the weighted average of the net mortgage interest rates on the mortgage loans for the related distribution date, over (b) the weighted average of the pass-through rates on the Class A-1, A-2, A-3, A-SB, A-4 and A-5 Certificates for the related distribution date, weighted on the basis of their respective Certificate Balances outstanding immediately prior to that distribution date. For purposes of the calculation of the weighted average of the net mortgage interest rates on the mortgage loans for each distribution date, the mortgage interest rates will be adjusted as necessary to a 30/360 basis. |
| (11) | The Class X-B Certificates are notional amount certificates. The Notional Amount of the Class X-B Certificates will be equal to the aggregate Certificate Balance of the Class A-S, B and C Certificates outstanding from time to time. The Class X-B Certificates will not be entitled to distributions of principal. |
| (12) | The pass-through rate for the Class X-B Certificates for any distribution date will be a per annum rate equal to the excess, if any, of (a) the weighted average of the net mortgage interest rates on the mortgage loans for the related distribution date, over (b) the weighted average of the pass-through rates on the Class A-S, B and C Certificates for the related distribution date, weighted on the basis of their respective Certificate Balances outstanding immediately prior to that distribution date. For purposes of the calculation of the weighted average of the net mortgage interest rates on the mortgage loans for each distribution date, the mortgage interest rates will be adjusted as necessary to a 30/360 basis. |
| (13) | The Class X-D Certificates are notional amount certificates. The Notional Amount of the Class X-D Certificates will be equal to the aggregate Certificate Balance of the Class D and E Certificates outstanding from time to time. The Class X-D Certificates will not be entitled to distributions of principal. |
| (14) | The pass-through rate for the Class X-D Certificates for any distribution date will be a per annum rate equal to the excess, if any, of (a) the weighted average of the net mortgage interest rates on the mortgage loans for the related distribution date, over (b) the weighted average of the pass-through rates on the Class D and E Certificates for the related distribution date, weighted on the basis of their respective Certificate Balances outstanding immediately prior to that distribution date. For purposes of the calculation of the weighted average of the net mortgage interest rates on the mortgage loans for each distribution date, the mortgage interest rates will be adjusted as necessary to a 30/360 basis. |
| (15) | The Class X-F, Class X-G and Class X-H Certificates are notional amount certificates. The Notional Amounts of the Class X-F, Class X-G and Class X-H Certificates will be equal to the Certificate Balance of the Class F, Class G and Class H Certificates, respectively, outstanding from time to time. None of the Class X-F, Class X-G and Class X-H Certificates will be entitled to distributions of principal. |
| (16) | The pass-through rates for the Class X-F, Class X-G and Class X-H Certificates for any distribution date will, in each case, be a per annum rate equal to the excess, if any, of (a) the weighted average of the net mortgage interest rates on the mortgage loans for the related distribution date, over (b) the pass-through rate on the Class F, Class G and Class H Certificates, respectively, for the related distribution date. For purposes of the calculation of the weighted average of the net mortgage interest rates on the mortgage loans for each distribution date, the mortgage interest rates will be adjusted as necessary to a 30/360 basis. |
| (17) | The effective interest rate for the RR Interest will be a variable rate per annum (described in the table as “WAC”) equal to the weighted average of the net mortgage interest rates on the mortgage loans for the related distribution date. For purposes of calculation of the weighted average of the net mortgage interest rates on the mortgage loans for each distribution date, the mortgage interest rates will be adjusted as necessary to a 30/360 basis. |
THE INFORMATION IN THIS STRUCTURAL AND COLLATERAL TERM SHEET IS NOT COMPLETE AND MAY BE AMENDED PRIOR TO THE TIME OF SALE. THIS TERM SHEET IS NOT AN OFFER TO SELL THESE SECURITIES AND IT IS NOT A SOLICITATION OF AN OFFER TO BUY THESE SECURITIES IN ANY JURISDICTION WHERE THE OFFER OR SALE IS NOT PERMITTED.
4
BANK 2020-BNK25 | Transaction Highlights |
II. Transaction Highlights
Mortgage Loan Sellers:
Mortgage Loan Seller | | Number
of
Mortgage
Loans | | Number of
Mortgaged
Properties | | Aggregate Cut-off
Date Balance | | Approx. % of
Initial Pool
Balance |
Morgan Stanley Mortgage Capital Holdings LLC | | 17 | | 26 | | $528,035,571 | | 32.3% |
Bank of America, National Association | | 23 | | 34 | | 520,230,000 | | 31.8 |
Wells Fargo Bank, National Association | | 12 | | 12 | | 376,185,669 | | 23.0 |
National Cooperative Bank, N.A. | | 24 | | 24 | | 109,820,629 | | 6.7 |
Wells Fargo Bank, National Association / Morgan Stanley Mortgage Capital Holdings LLC | | 1 | | 1 | | 100,000,000 | | 6.1 |
Total | | 77 | | 97 | | $1,634,271,868 | | 100.0% |
Loan Pool:
Initial Pool Balance: | $1,634,271,868 |
Number of Mortgage Loans: | 77 |
Average Cut-off Date Balance per Mortgage Loan: | $21,224,310 |
Number of Mortgaged Properties: | 97 |
Average Cut-off Date Balance per Mortgaged Property(1): | $16,848,164 |
Weighted Average Mortgage Interest Rate: | 3.433% |
Ten Largest Mortgage Loans as % of Initial Pool Balance: | 48.3% |
Weighted Average Original Term to Maturity or ARD (months): | 118 |
Weighted Average Remaining Term to Maturity or ARD (months): | 116 |
Weighted Average Original Amortization Term (months)(2): | 375 |
Weighted Average Remaining Amortization Term (months)(2): | 374 |
Weighted Average Seasoning (months): | 2 |
(1) | Information regarding mortgage loans secured by multiple properties is based on an allocation according to relative appraised values or the allocated loan amounts or property-specific release prices set forth in the related loan documents or such other allocation as the related mortgage loan seller deemed appropriate. |
(2) | Excludes any mortgage loan that does not amortize. |
Credit Statistics:
Weighted Average U/W Net Cash Flow DSCR(1): | 3.56x |
Weighted Average U/W Net Operating Income Debt Yield(1): | 13.8% |
Weighted Average Cut-off Date Loan-to-Value Ratio(1): | 51.5% |
Weighted Average Balloon or ARD Loan-to-Value Ratio(1): | 50.5% |
% of Mortgage Loans with Additional Subordinate Debt(2): | 34.2% |
% of Mortgage Loans with Single Tenants(3): | 15.1% |
(1) | With respect to any mortgage loan that is part of a whole loan, loan-to-value ratio, debt service coverage ratio and debt yield calculations include the related pari passu companion loan(s) but exclude any related subordinate companion loan(s) (unless otherwise stated). For mortgaged properties securing residential cooperative mortgage loans, the debt service coverage ratio and debt yield for each such mortgaged property are calculated using U/W Net Operating Income or U/W Net Cash Flow, as applicable, for the related residential cooperative property which is the projected net operating income or net cash flow, as applicable, reflected in the most recent appraisal obtained by or otherwise in the possession of the related mortgage loan seller as of the cut-off date, and the loan-to-value ratio is calculated based upon the appraised value of the residential cooperative property determined as if such residential cooperative property is operated as a residential cooperative, inclusive of the amount of the underlying debt encumbering such residential cooperative property. The debt service coverage ratio, debt yield and loan-to-value ratio information do not take into account any subordinate debt (whether or not secured by the related mortgaged property), that currently exists or is allowed under the terms of any mortgage loan. See “Description of the Mortgage Pool—Mortgage Pool Characteristics” in the Preliminary Prospectus and Annex A-1 to the Preliminary Prospectus. |
(2) | Twenty (20) of the mortgage loans, each of which is secured by a residential cooperative property sold to the depositor by National Cooperative Bank, N.A., currently have in place subordinate secured lines of credit to the related mortgage borrowers that permit future advances (such loans, collectively, the “Subordinate Coop LOCs”). The percentage figure expressed as “% of Mortgage Loans with Additional Subordinate Debt” is determined as a percentage of the initial pool balance and does not take into account any future subordinate debt (whether or not secured by the mortgaged property), if any, that may be permitted under the terms of any mortgage loan or the pooling and servicing agreement. See “Description of the Mortgage Pool—Additional Indebtedness—Other Unsecured Indebtedness” and “Description |
of the Mortgage Pool—Additional Indebtedness—Other Secured Indebtedness—Additional Debt Financing for Mortgage Loans Secured by Residential Cooperatives Sold to the Depositor by National Cooperative Bank, N.A.” in the Preliminary Prospectus.
(3) | Excludes mortgage loans that are secured by multiple single tenant properties. |
THE INFORMATION IN THIS STRUCTURAL AND COLLATERAL TERM SHEET IS NOT COMPLETE AND MAY BE AMENDED PRIOR TO THE TIME OF SALE. THIS TERM SHEET IS NOT AN OFFER TO SELL THESE SECURITIES AND IT IS NOT A SOLICITATION OF AN OFFER TO BUY THESE SECURITIES IN ANY JURISDICTION WHERE THE OFFER OR SALE IS NOT PERMITTED.
5
BANK 2020-BNK25 | Transaction Highlights |
Loan Structural Features:
Amortization: Based on the Initial Pool Balance, 15.5% of the mortgage pool (35 mortgage loans) has scheduled amortization, as follows:
9.5% (26 mortgage loans) requires amortization during the entire loan term; and
6.1% (9 mortgage loans) provides for an interest-only period followed by an amortization period.
Interest-Only: Based on the Initial Pool Balance, 84.5% of the mortgage pool (42 mortgage loans) provides for interest-only payments during the entire loan term through maturity or ARD. The weighted average Cut-off Date Loan-to-Value Ratio and weighted average U/W Net Cash Flow DSCR for those mortgage loans are 53.0% and 3.45x, respectively.
Hard Lockboxes: Based on the Initial Pool Balance, 51.2% of the mortgage pool (16 mortgage loans) has hard lockboxes in place.
Reserves: The mortgage loans require amounts to be escrowed monthly as follows (excluding any mortgage loans with springing provisions):
Real Estate Taxes: | 48.8% of the pool |
Insurance: | 25.5% of the pool |
Capital Replacements: | 42.6% of the pool |
TI/LC: | 37.5% of the pool(1) |
(1) The percentage of Initial Pool Balance for mortgage loans with TI/LC reserves is based on the aggregate principal balance allocable to loans that include office, mixed use, retail and industrial properties. |
Call Protection/Defeasance: Based on the Initial Pool Balance, the mortgage pool has the following call protection and defeasance features:
52.0% of the mortgage pool (37 mortgage loans) features a lockout period, then defeasance only until an open period;
17.5% of the mortgage pool (8 mortgage loans) features a lockout period, then the greater of a prepayment premium or yield maintenance until an open period; and
11.6% of the mortgage pool (5 mortgage loans) features a lockout period, then the greater of a prepayment premium or yield maintenance or defeasance until an open period;
9.1% of the mortgage pool (2 mortgage loans) features no lockout period, but the greater of a prepayment premium or yield maintenance, then the greater of a prepayment premium or yield maintenance or defeasance until an open period;
6.7% of the mortgage pool (24 mortgage loans) features no lockout period, but requires the greater of a prepayment premium or yield maintenance, then a prepayment premium until an open period;
3.1% of the mortgage pool (1 mortgage loan) features a lockout period, then yield maintenance until an open period;
Prepayment restrictions for each mortgage loan reflect the entire life of the mortgage loan. Please refer to Annex A-1 to the Preliminary Prospectus and the footnotes related thereto for further information regarding individual loan call protection.
THE INFORMATION IN THIS STRUCTURAL AND COLLATERAL TERM SHEET IS NOT COMPLETE AND MAY BE AMENDED PRIOR TO THE TIME OF SALE. THIS TERM SHEET IS NOT AN OFFER TO SELL THESE SECURITIES AND IT IS NOT A SOLICITATION OF AN OFFER TO BUY THESE SECURITIES IN ANY JURISDICTION WHERE THE OFFER OR SALE IS NOT PERMITTED.
6
BANK 2020-BNK25 | Issue Characteristics |
III. Issue Characteristics
Securities Offered: | $1,401,183,000 approximate monthly pay, multi-class, commercial mortgage REMIC pass-through certificates consisting of eleven classes (Classes A-1, A-2, A-3, A-SB, A-4, A-5, A-S, B, C, X-A and X-B), which are offered pursuant to a registration statement filed with the SEC (such classes of certificates, the “Offered Certificates”). |
Mortgage Loan Sellers: | Morgan Stanley Mortgage Capital Holdings LLC (“MSMCH”), Bank of America, National Association (“BANA”), Wells Fargo Bank, National Association (“WFB”) and National Cooperative Bank, N.A. (“NCB”). |
Joint Bookrunners and Co-Lead Managers: | Wells Fargo Securities, LLC, BofA Securities, Inc. and Morgan Stanley & Co. LLC |
Co-Manager: | Academy Securities, Inc. and Drexel Hamilton, LLC |
Rating Agencies: | Fitch Ratings, Inc., Kroll Bond Rating Agency, Inc. and S&P Global Ratings |
Master Servicers: | Wells Fargo Bank, National Association and National Cooperative Bank, N.A. |
Special Servicers: | KeyBank National Association and National Cooperative Bank, N.A. |
Certificate Administrator: | Wells Fargo Bank, National Association |
Trustee: | Wilmington Trust, National Association |
Operating Advisor: | Pentalpha Surveillance LLC |
Asset Representations Reviewer: | Pentalpha Surveillance LLC |
U.S. Credit Risk Retention: | For a discussion of the manner in which the U.S. credit risk retention requirements are being addressed by Wells Fargo Bank, National Association, as the retaining sponsor, see “Credit Risk Retention” in the Preliminary Prospectus. |
EU Risk Retention: | None of the sponsors, the depositor, the underwriters or their respective affiliates, or any other person is required or intends to retain a material net economic interest in the securitization constituted by the issue of the Certificates, or to take any other action in respect of such securitization, in a manner prescribed or contemplated by the European Union’s Securitization Regulation (Regulation (EU) 2017/2402). In particular, no such person undertakes to take any action which may be required by any investor for the purposes of its compliance with such regulations or any similar requirements. Furthermore, the arrangements described under “Credit Risk Retention” in the Preliminary Prospectus have not been structured with the objective of ensuring compliance by any investor with such Regulation. |
Initial Risk Retention Consultation Party: | Wells Fargo Bank, National Association |
Initial Majority Controlling Class Certificateholder: | Ellington Management Group, LLC or its affiliate |
Cut-off Date: | The Cut-off Date with respect to each mortgage loan is the due date for the monthly debt service payment that is due in February 2020 (or, in the case of any mortgage loan that has its first due date in March 2020, the date that would have been its due date in February 2020 under the terms of that mortgage loan if a monthly debt service payment were scheduled to be due in that month). |
Expected Closing Date: | On or about February 13, 2020. |
Determination Dates: | The 11th day of each month (or if that day is not a business day, the next succeeding business day), commencing in March 2020. |
Distribution Dates: | The fourth business day following the Determination Date in each month, commencing in March 2020. |
Rated Final Distribution Date: | The Distribution Date in January 2063. |
Interest Accrual Period: | With respect to any Distribution Date, the calendar month immediately preceding the month in which such Distribution Date occurs. |
THE INFORMATION IN THIS STRUCTURAL AND COLLATERAL TERM SHEET IS NOT COMPLETE AND MAY BE AMENDED PRIOR TO THE TIME OF SALE. THIS TERM SHEET IS NOT AN OFFER TO SELL THESE SECURITIES AND IT IS NOT A SOLICITATION OF AN OFFER TO BUY THESE SECURITIES IN ANY JURISDICTION WHERE THE OFFER OR SALE IS NOT PERMITTED.
7
BANK 2020-BNK25 | Issue Characteristics |
Day Count: | The Offered Certificates will accrue interest on a 30/360 basis. |
| | |
Minimum Denominations: | $10,000 for each Class of Offered Certificates (other than the Class X-A and X-B Certificates) and $1,000,000 for the Class X-A and X-B Certificates. Investments may also be made in any whole dollar denomination in excess of the applicable minimum denomination. |
Clean-up Call: | 1.0% |
Delivery: | DTC, Euroclear and Clearstream Banking |
ERISA/SMMEA Status: | Each Class of Offered Certificates is expected to be eligible for exemptive relief under ERISA. No Class of Offered Certificates will be SMMEA eligible. |
Risk Factors: | THE CERTIFICATES INVOLVE CERTAIN RISKS AND MAY NOT BE SUITABLE FOR ALL INVESTORS. SEE THE “RISK FACTORS” SECTION OF THE PRELIMINARY PROSPECTUS. |
Bond Analytics Information: | The Certificate Administrator will be authorized to make distribution date statements, CREFC® reports and certain supplemental reports (other than confidential information) available to certain financial modeling and data provision services, including Bloomberg, L.P., Trepp, LLC, Intex Solutions, Inc., Markit Group Limited, Interactive Data Corp., BlackRock Financial Management, Inc., CMBS.com, Inc., Moody’s Analytics and Thomson Reuters Corporation. |
Tax Treatment | For U.S. federal income tax purposes, the issuing entity will consist of one or more REMICs and the Offered Certificates will represent REMIC regular interests. |
THE INFORMATION IN THIS STRUCTURAL AND COLLATERAL TERM SHEET IS NOT COMPLETE AND MAY BE AMENDED PRIOR TO THE TIME OF SALE. THIS TERM SHEET IS NOT AN OFFER TO SELL THESE SECURITIES AND IT IS NOT A SOLICITATION OF AN OFFER TO BUY THESE SECURITIES IN ANY JURISDICTION WHERE THE OFFER OR SALE IS NOT PERMITTED.
8
BANK 2020-BNK25 | Characteristics of the Mortgage Pool |
IV. Characteristics of the Mortgage Pool(1)
A. Ten Largest Mortgage Loans
Mortgage
Loan
Seller | Mortgage Loan Name | City | State | Number of Mortgage Loans / Mortgaged Properties | Mortgage Loan Cut-off Date Balance ($) | % of Initial Pool Balance (%) | Property Type | Number of
SF, Rooms
or Units | Cut-off Date Balance Per SF, Room or Unit ($) | Cut-off
Date LTV Ratio (%) | Balloon or ARD LTV Ratio (%) | U/W NCF DSCR (x) | U/W NOI Debt
Yield (%) |
WFB; MSMCH | 55 Hudson Yards | New York | NY | 1 / 1 | $100,000,000 | 6.1% | Office | 1,431,212 | $660 | 39.4% | 39.4% | 3.53x | 11.0% |
WFB | 1633 Broadway | New York | NY | 1 / 1 | 100,000,000 | 6.1 | Office | 2,561,512 | 391 | 41.7 | 41.7 | 3.83 | 11.9 |
MSMCH | Bellagio Hotel and Casino | Las Vegas | NV | 1 / 1 | 100,000,000 | 6.1 | Hospitality | 3,933 | 426,189 | 39.3 | 39.3 | 8.42 | 28.3 |
MSMCH | 545 Washington Boulevard | Jersey City | NJ | 1 / 1 | 81,285,000 | 5.0 | Office | 866,706 | 290 | 61.4 | 61.4 | 2.50 | 8.8 |
BANA | Jackson Park | Long Island City | NY | 1 / 1 | 75,000,000 | 4.6 | Multifamily | 1,871 | 293,960 | 34.4 | 34.4 | 3.92 | 13.0 |
WFB | Kings Plaza | Brooklyn | NY | 1 / 1 | 75,000,000 | 4.6 | Retail | 811,797 | 600 | 54.1 | 54.1 | 3.06 | 10.7 |
MSMCH | 1412 Broadway | New York | NY | 1 / 1 | 70,000,000 | 4.3 | Office | 421,396 | 498 | 58.3 | 58.3 | 1.92 | 7.5 |
MSMCH | Houston-Austin Multifamily Portfolio | Various | TX | 1 / 3 | 68,000,000 | 4.2 | Multifamily | 671 | 101,341 | 67.9 | 67.9 | 1.91 | 7.6 |
BANA | Parklawn Building | Rockville | MD | 1 / 1 | 65,400,000 | 4.0 | Office | 1,283,646 | 204 | 60.0 | 60.0 | 2.68 | 9.4 |
WFB | Hilton Denver Dual Brand Hotel | Denver | CO | 1 / 1 | 54,650,000 | 3.3 | Hospitality | 302 | 180,960 | 63.2 | 63.2 | 2.81 | 12.4 |
Top Three Total/Weighted Average | | | 3 / 3 | $300,000,000 | 18.4% | | | | 40.1% | 40.1% | 5.26x | 17.1% |
Top Five Total/Weighted Average | | | 5 / 5 | $456,285,000 | 27.9% | | | | 43.0% | 43.0% | 4.55x | 14.9% |
Top Ten Total/Weighted Average | | | 10 / 12 | $789,335,000 | 48.3% | | | | 50.4% | 50.4% | 3.67x | 12.6% |
Non-Top Ten Total/Weighted Average | | | 67 / 85 | $844,936,868 | 51.7% | | | | 52.5% | 50.6% | 3.46x | 14.9% |
(1) | With respect to any mortgage loan that is part of a whole loan, Cut-off Date Balance Per SF/Room/Unit($) loan-to-value ratio, debt service coverage ratio and debt yield calculations include the related pari passu companion loan(s) but exclude any related subordinate companion loan(s) (unless otherwise stated). With respect to each mortgage loan, debt service coverage ratio, debt yield and loan-to-value ratio information do not take into account subordinate debt (whether or not secured by the related mortgaged property), if any, that currently exists or is allowed under the terms of such mortgage loan. |
THE INFORMATION IN THIS STRUCTURAL AND COLLATERAL TERM SHEET IS NOT COMPLETE AND MAY BE AMENDED PRIOR TO THE TIME OF SALE. THIS TERM SHEET IS NOT AN OFFER TO SELL THESE SECURITIES AND IT IS NOT A SOLICITATION OF AN OFFER TO BUY THESE SECURITIES IN ANY JURISDICTION WHERE THE OFFER OR SALE IS NOT PERMITTED.
9
BANK 2020-BNK25 | Characteristics of the Mortgage Pool |
B. Summary of the Whole Loans
Property Name | Mortgage Loan Seller in BANK 2020-BNK25 | Note(s)(1) | Original Balance | Holder of Note | Lead Servicer for Whole Loan | Master Servicer Under Lead Securitization Servicing Agreement | Special Servicer Under Lead Securitization Servicing Agreement |
55 Hudson Yards | WFB/MSMCH | A-1-S1, A-2-S2, A-2-S3, A-3-S1, A-1-S2, A-1-S3, A-2-S1, A-3-S2, A-3-S3, A-1-C1, A-1-C2, A-1-C8, A-2-C1, A-2-C2, A-2-C8, A-3-C1, A-3-C2, A-3-C8 | $510,500,000 | Hudson Yards 2019-55HY | Yes | Wells Fargo Bank, National Association | CWCapital Asset Management LLC |
A-1-C5, A-3-C5 | $100,000,000 | BANK 2019-BNK24 | No |
A-1-C6, A-3-C6 | $100,000,000 | BANK 2020-BNK25 | No |
A-1-C3, A-1-C4, A-1-C7 | $110,700,000 | Wells Fargo Bank, National Association | No |
A-2-C3, A-2-C4, A-2-C5, A-2-C6, A-2-C7 | $86,900,000 | DBR Investments Co. Limited | No |
A-3-C3, A-3-C4, A-3-C7 | $36,900,000 | Morgan Stanley Bank, N.A | No |
B-1, B-2, B-3 | $300,000,000 | Hudson Yards 2019-55HY | Yes |
1633 Broadway | WFB | A-1-S-1, A-2-S-1, A-3-S-1, A-4-S-1 | $1,000,000 | BWAY 2019-1633 | No | KeyBank National Association | Situs Holdings, LLC |
A-1-C-1, A-1-C-3, A-1-C-4, A-1-C-5, A-1-C-6, A-1-C-7 | $205,000,000 | Goldman Sachs Bank USA | No |
A-2-C-1-B, A-3-C-1-B | $45,000,000 | Benchmark 2020-B16(2) | No |
A-2-C-1-A, A-2-C-2, A-2-C-3, A-2-C-4, A-2-C-6, A-2-C-7 | $212,500,000 | DBR Investments Co. Limited | No |
A-3-C-1-A, A-3-C-2, A-3-C-3, A-3-C-4, A-3-C-5, A-3-C-6, A-3-C-7 | $227,500,000 | JPMorgan Chase Bank, National Association | No |
A-1-C-2, A-2-C-5 | $60,000,000 | GSMS 2020-GC45(3) | No |
A-4-C-1, A-4-C-2 | $100,000,000 | BANK 2020-BNK25 | No |
A-4-C-3, A-4-C-4, A-4-C-5, A-4-C-6, A-4-C-7 | $150,000,000 | Wells Fargo Bank, N.A | No |
B-1, B-2, B-3, B-4 | $249,000,000 | BWAY 2019-1633 | Yes(4) |
Bellagio Hotel and Casino | MSMCH | A-1-S1, A-1-S2, A-2-S1, A-2-S2, A-3-S1, A-3-S2 | $716,000,000 | BX 2019-OC11 | Yes | KeyBank National Association | Situs Holdings, LLC |
A-1-C1 | $100,000,000 | BANK 2020-BNK25 | No |
A-1-RL, A-2-RL, A-3-RL | $360,200,000 | Third Party | No |
A-1-C2, A-1-C3, A-1-C4, A-1-C5 | $200,000,000 | Morgan Stanley Bank, N.A | No |
A-2-C1 | $50,000,000 | GSMS 2020-GC45(3) | No |
A-2-C3, A-2-C4, A-2-C5 | $70,000,000 | Citi Real Estate Funding Inc. | No |
A-2-C2, A-3-C2 | $60,000,000 | Benchmark 2020-B16(2) | No |
A-3-C1, A-3-C3, A-3-C4, A-3-C5 | $120,000,000 | JPMorgan Chase Bank, National Association | No |
B-1-S, B-2-S, B-3-S | $510,700,000 | BX 2019-OC11 | Yes |
B-1-RL, B-2-RL, B-3-RL | $139,800,000 | Third Party | No |
C-1-S, C-2-S, C-3-S | $683,300,000 | BX 2019-OC11 | Yes |
545 Washington Boulevard | MSMCH | A-1 | $81,285,000 | BANK 2020-BNK25 | Yes | | KeyBank National Association |
THE INFORMATION IN THIS STRUCTURAL AND COLLATERAL TERM SHEET IS NOT COMPLETE AND MAY BE AMENDED PRIOR TO THE TIME OF SALE. THIS TERM SHEET IS NOT AN OFFER TO SELL THESE SECURITIES AND IT IS NOT A SOLICITATION OF AN OFFER TO BUY THESE SECURITIES IN ANY JURISDICTION WHERE THE OFFER OR SALE IS NOT PERMITTED.
10
BANK 2020-BNK25 | Characteristics of the Mortgage Pool |
Property Name | Mortgage Loan Seller in BANK 2020-BNK25 | Note(s)(1) | Original Balance | Holder of Note | Lead Servicer for Whole Loan | Master Servicer Under Lead Securitization Servicing Agreement | Special Servicer Under Lead Securitization Servicing Agreement |
| | A-2, A-3 | $120,000,000 | Morgan Stanley Bank, N.A. | No | Wells Fargo Bank, National Association | |
A-4 | $50,321,250 | Barclays Capital Real Estate Inc. | No |
Jackson Park | BANA | A-1, A-2, A-4, A-9, A-10 | $275,000,000 | JAX 2019-LIC | Yes | Wells Fargo Bank, National Association | AEGON USA Realty Advisors, LLC. |
A-3 | $75,000,000 | BANK 2020-BNK25 | No |
A-5, A-6 | $100,000,000 | BANK 2019-BNK23 | No |
A-7, A-8 | $100,000,000 | BANK 2019-BNK24 | No |
B-1, B-2 | $450,000,000 | JAX 2019-LIC | No |
Kings Plaza | WFB | A-1-1 | $70,000,000 | JPMorgan Chase Bank, National Association | Yes | Midland Loan Services, a Division of PNC Bank, National Association(5) | KeyBank National Association(5) |
A-1-2 | $50,000,000 | Benchmark 2020-B16(2) | No |
A-1-3, A-1-4 | $51,108,108 | JPMorgan Chase Bank, National Association | No |
A-2-1, A-2-2, A-2-3, A-2-4 | $157,945,946 | Société Générale Financial Corporation | No |
A-3-1, A-3-4 | $75,000,000 | BANK 2020-BNK25 | No |
A-3-2, A-3-3 | $82,945,946 | Wells Fargo Bank, N.A | No |
1412 Broadway | MSMCH | A-1 | $100,000,000 | BANK 2019-BNK24 | Yes | Wells Fargo Bank, National Association | Midland Loan Services, a Division of PNC Bank, National Association |
A-2 | $70,000,000 | BANK 2020-BNK25 | No |
A-3 | $40,000,000 | Morgan Stanley Bank, N.A. | No |
Parklawn Building | BANA | A-1 | $70,000,000 | MSC 2019-L3 | Yes | Wells Fargo Bank, National Association | LNR Partners, LLC |
A-2, A-3 | $60,800,000 | CF 2019-CF3 | No |
A-4 | $65,400,000 | BANK 2019-BNK24 | No |
A-5 | $65,400,000 | BANK 2020-BNK25 | No |
Park Tower at Transbay | BANA | A-1, A-8 | $120,000,000 | BANK 2019-BNK20 | No | Wells Fargo Bank, National Association | Rialto Capital Advisors, LLC |
A-2 | $100,000,000 | BANK 2019-BNK23 | No |
A-3, A-9 | $115,000,000 | BANK 2019-BNK21 | Yes |
A-4, A-7, A-10 | $115,000,000 | BANK 2019-BNK22 | No |
A-5 | $50,000,000 | BANK 2019-BNK24 | No |
A-6 | $50,000,000 | BANK 2020-BNK25 | No |
560 Mission Street | BANA | A-1-1 | $60,000,000 | GSMS 2020-GC45(3) | No | Midland Loan Services, a Division of PNC Bank, National Association | KeyBank National Association |
A-1-2 | $50,000,000 | Benchmark 2020-B16(2) | Yes |
A-1-3, A-1-4 | $40,000,000 | DBR Investments Co. Limited | No |
A-2-A | $100,000,000 | Bank of America, National Association | No |
A-2-B | $50,000,000 | BANK 2020-BNK25 | No |
Chroma Apartments | WFB | A-1 | $35,000,000 | UBS 2019-C18 | Yes | | Rialto Capital Advisors, LLC |
THE INFORMATION IN THIS STRUCTURAL AND COLLATERAL TERM SHEET IS NOT COMPLETE AND MAY BE AMENDED PRIOR TO THE TIME OF SALE. THIS TERM SHEET IS NOT AN OFFER TO SELL THESE SECURITIES AND IT IS NOT A SOLICITATION OF AN OFFER TO BUY THESE SECURITIES IN ANY JURISDICTION WHERE THE OFFER OR SALE IS NOT PERMITTED.
11
BANK 2020-BNK25 | Characteristics of the Mortgage Pool |
Property Name | Mortgage Loan Seller in BANK 2020-BNK25 | Note(s)(1) | Original Balance | Holder of Note | Lead Servicer for Whole Loan | Master Servicer Under Lead Securitization Servicing Agreement | Special Servicer Under Lead Securitization Servicing Agreement |
| | A-2 | $15,000,000 | BANK 2020-BNK25 | No | Wells Fargo Bank, National Association | |
Sacramento Office Portfolio | BANA | A-1 | $35,000,000 | BANK 2019-BNK23 | Yes | Wells Fargo Bank, National Association | KeyBank National Association |
A-2 | $14,400,000 | BANK 2020-BNK25 | No |
| (1) | No assurance can be provided that any unsecuritized note will not be split further. |
| (2) | The Benchmark 2020-B16 transaction is expected to close on or about February 12, 2020. |
| (3) | The GSMS 2020-GC45 transaction is expected to close on or about January 30, 2020. |
| (4) | No single promissory note comprising a part of the whole loan is the related control note; however, the BWAY 2019-1633 securitization trust is the related controlling note holder, and a party designated under the related trust and servicing agreement is entitled to exercise the rights thereof. |
| (5) | The related whole loan is expected to initially be serviced under the Benchmark 2020-B16 securitization pooling and servicing agreement until the securitization of the related “lead” pari passu note (namely, the related pari passu note marked “Yes” in the column entitled “Lead Servicer for Whole Loan”), after which the related whole loan will be serviced under the pooling and servicing agreement governing such securitization of the related “lead” pari passu note. The master servicer and special servicer for such securitization will be identified in a notice, report or statement to holders of the BANK 2020-BNK25 certificates after the closing of such securitization. |
THE INFORMATION IN THIS STRUCTURAL AND COLLATERAL TERM SHEET IS NOT COMPLETE AND MAY BE AMENDED PRIOR TO THE TIME OF SALE. THIS TERM SHEET IS NOT AN OFFER TO SELL THESE SECURITIES AND IT IS NOT A SOLICITATION OF AN OFFER TO BUY THESE SECURITIES IN ANY JURISDICTION WHERE THE OFFER OR SALE IS NOT PERMITTED.
12
BANK 2020-BNK25 | Characteristics of the Mortgage Pool |
| C. | Mortgage Loans with Additional Secured and Mezzanine Financing(1) |
Loan
No. | Mortgage Loan Seller | Mortgage Loan Name | Mortgage
Loan
Cut-off Date
Balance ($) | % of Cut-
off Date
Balance
(%) | Sub Debt Cut-off
Date Balance ($) | Mezzanine Debt
Cut-off Date
Balance ($) | Total Debt
Interest
Rate (%)(2) | Mortgage
Loan U/W
NCF DSCR
(x)(3) | Total Debt
U/W NCF
DSCR (x) | Mortgage
Loan Cut-
off Date
U/W NOI
Debt Yield
(%)(3) | Total Debt
Cut-off Date
U/W NOI
Debt Yield
(%) | Mortgage
Loan Cut-
off Date
LTV Ratio
(%)(3) | Total Debt Cut-
off Date
LTV Ratio
(%) |
1 | WFB; MSMCH | 55 Hudson Yards | $100,000,000 | 6.1 | % | $300,000,000 | $0 | 2.9500 | % | 3.53 | x | 2.68 | x | 11.0 | % | 8.3 | % | 39.4 | % | 51.9 | % |
2 | WFB | 1633 Broadway | 100,000,000 | 6.1 | | 249,000,000 | 0 | 2.9900 | | 3.83 | | 3.07 | | 11.9 | | 9.5 | | 41.7 | | 52.1 | |
3 | MSMCH | Bellagio Hotel and Casino | 100,000,000 | 6.1 | | 1,333,800,000 | 0 | 3.6650 | | 8.42 | | 4.06 | | 28.3 | | 15.7 | | 39.3 | | 70.7 | |
5 | BANA | Jackson Park | 75,000,000 | 4.6 | | 450,000,000 | 0 | 3.2500 | | 3.92 | | 2.15 | | 13.0 | | 7.1 | | 34.4 | | 62.5 | |
6 | WFB | Kings Plaza | 75,000,000 | 4.6 | | 0 | 53,000,000 | 3.6180 | | 3.06 | | 1.73 | | 10.7 | | 9.6 | | 54.1 | | 60.0 | |
29 | WFB | Chroma Apartments | 15,000,000 | 0.9 | | 0 | 10,100,000 | 4.9767 | | 1.81 | | 1.20 | | 7.4 | | 6.2 | | 68.5 | | 82.3 | |
Total/Weighted Average | $465,000,000 | 28.5 | % | $2,332,800,000 | $63,100,000 | 3.3339 | % | 4.58 | x | 2.77 | x | 15.1 | % | 10.1 | % | 42.4 | % | 60.0 | % |
(1) | In addition, twenty (20) of the mortgage loans, each of which is secured by a residential cooperative property sold to the depositor by National Cooperative Bank, N.A, currently have in place Subordinate Coop LOCs. See “Description of the Mortgage Pool—Additional Indebtedness—Other Unsecured Indebtedness“ and “Description of the Mortgage Pool—Additional Indebtedness—Other Secured Indebtedness—Additional Debt Financing for Mortgage Loans Secured by Residential Cooperatives Sold to the Depositor by National Cooperative Bank, N.A.” in the Preliminary Prospectus. |
(2) | Total Debt Interest Rate for any specified mortgage loan reflects the weighted average of the interest rates on the respective components of the total debt. |
(3) | With respect to any mortgage loan that is part of a whole loan, the loan-to-value ratio, debt service coverage ratio and debt yield calculations include the related pari passu companion loan(s). |
THE INFORMATION IN THIS STRUCTURAL AND COLLATERAL TERM SHEET IS NOT COMPLETE AND MAY BE AMENDED PRIOR TO THE TIME OF SALE. THIS TERM SHEET IS NOT AN OFFER TO SELL THESE SECURITIES AND IT IS NOT A SOLICITATION OF AN OFFER TO BUY THESE SECURITIES IN ANY JURISDICTION WHERE THE OFFER OR SALE IS NOT PERMITTED.
13
BANK 2020-BNK25 | Characteristics of the Mortgage Pool |
| D. | Previous Securitization History(1) |
Loan
No. | Mortgage
Loan Seller | Mortgage
Loan or Mortgaged
Property Name | City | State | Property
Type | Mortgage Loan
or Mortgaged
Property Cut-off
Date Balance ($) | % of Initial
Pool Balance
(%) | Previous
Securitization |
6 | WFB | Kings Plaza | Brooklyn | NY | Retail | $75,000,000 | 4.6 | % | GSMS 2013-KING |
8.03 | MSMCH | Stonecreek Apartments | Katy | TX | Multifamily | 18,200,000 | 1.1 | | XAN 2018-RSO6 |
14 | MSMCH | Stop & Shop Portfolio | Various | Various | Retail | 45,000,000 | 2.8 | | JPMCC 2011-C4 |
20 | BANA | Marriott - Bakersfield | Bakersfield | CA | Hospitality | 24,700,000 | 1.5 | | WFRBS 2014-C23 |
38 | NCB | 440 East 79th Street Owners Corp. | New York | NY | Multifamily | 10,483,982 | 0.6 | | WFCM 2016-C32 |
40 | WFB | Best Storage - Henderson, NV | Henderson | NV | Self Storage | 10,000,000 | 0.6 | | JPMBB 2013-C15 |
41 | NCB | 310/312 East 23rd Apartment Corp. | New York | NY | Multifamily | 9,135,614 | 0.6 | | MSC 2007-IQ13 |
42 | NCB | Crest Manor Housing Corporation | Yonkers | NY | Multifamily | 8,986,243 | 0.5 | | CSMC 2006-C1 |
44 | BANA | Proguard Self Storage - Houston | Houston | TX | Self Storage | 8,520,000 | 0.5 | | WFRBS 2011-C4 |
46 | NCB | Rocky Point Owners, Inc. | Rocky Point | NY | Multifamily | 8,392,798 | 0.5 | | WFRBS 2013-C16 |
53 | NCB | Chateau Villa Corp. | Staten Island | NY | Multifamily | 6,843,818 | 0.4 | | WFRBS 2014-C23 |
60 | NCB | Hillcrest Point Apartments Owners, Corp. | Spring Valley | NY | Multifamily | 5,491,745 | 0.3 | | BSCMS 2006-T22 |
76 | NCB | 6035 Broadway Owners Corp. | Bronx | NY | Multifamily | 1,291,037 | 0.1 | | CSFB 2004-C1 |
| Total | | | | | $232,045,237 | 14.2 | % | |
(1) | The table above represents the most recent securitization with respect to the mortgaged property securing the related mortgage loan, based on information provided by the related borrower or obtained through searches of a third-party database. While loans secured by the above mortgaged properties may have been securitized multiple times in prior transactions, mortgage loans in this securitization are only listed in the above chart if the mortgage loan paid off a loan in another securitization. The information has not otherwise been confirmed by the mortgage loan sellers. |
THE INFORMATION IN THIS STRUCTURAL AND COLLATERAL TERM SHEET IS NOT COMPLETE AND MAY BE AMENDED PRIOR TO THE TIME OF SALE. THIS TERM SHEET IS NOT AN OFFER TO SELL THESE SECURITIES AND IT IS NOT A SOLICITATION OF AN OFFER TO BUY THESE SECURITIES IN ANY JURISDICTION WHERE THE OFFER OR SALE IS NOT PERMITTED.
14
BANK 2020-BNK25 | Characteristics of the Mortgage Pool |
E. Mortgage Loans with Scheduled Balloon Payments and Related Classes
Class A-2(1) |
Loan
No. | Mortgage
Loan
Seller | Mortgage Loan Name | State | Property
Type | Mortgage Loan
Cut-off Date
Balance ($) | % of
Initial
Pool
Balance
(%) | Mortgage Loan
Balance at
Maturity ($) | % of Class
A-2
Certificate
Principal
Balance
(%)(2) | SF/
Rooms/
Pads/
Units | Loan
per SF/
Room/
Pad/
Unit ($) | U/W NCF
DSCR (x) | U/W NOI
Debt
Yield
(%) | Cut-off
Date LTV
Ratio (%) | Balloon
or ARD
LTV Ratio
(%) | Rem. IO
Period
(mos.) | Rem.
Term to
Maturity
(mos.) |
44 | BANA | Proguard Self Storage - Houston | TX | Self Storage | $8,520,000 | 0.5% | $8,520,000 | 100.7% | 76,587 | $111 | 2.30x | 9.5% | 60.0% | 60.0% | 59 | 59 |
Total/Weighted Average | | | $8,520,000 | 0.5% | $8,520,000 | 100.7% | | | 2.30x | 9.5% | 60.0% | 60.0% | 59 | 59 |
(1) | The table above presents the mortgage loan whose balloon payment would be applied to pay down the principal balance of the Class A-2 Certificates, assuming a 0% CPR and applying the “Structuring Assumptions” described in the Preliminary Prospectus, including the assumptions that (i) none of the mortgage loans in the pool experience prepayments prior to maturity, defaults or losses; (ii) there are no extensions of maturity dates of any mortgage loans in the pool; and (iii) each mortgage loan in the pool is paid in full on its stated maturity date. Each Class of Certificates evidences undivided ownership interests in the entire pool of mortgage loans. Debt service coverage ratio, debt yield and loan-to-value ratio information do not take into account subordinate debt (whether or not secured by the related mortgaged property), if any, that currently exists or is allowed under the terms of any mortgage loan. See Annex A-1 to the Preliminary Prospectus. |
| (2) | Reflects the percentage equal to the Balloon Balance divided by the initial Class A-2 Certificate Balance. |
Class A-3(1) |
Loan No. | Mortgage Loan Seller | Mortgage Loan Name | State | Property Type | Mortgage Loan Cut-off Date Balance ($) | % of Initial Pool Balance (%) | Mortgage Loan Balance at Maturity ($) | % of Class A-3 Certificate Principal Balance (%)(2) | SF/
Rooms/ Pads/ Units | Loan per SF/
Room/
Pad/
Unit ($) | U/W NCF DSCR (x) | U/W
NOI
Debt Yield
(%) | Cut-off Date LTV Ratio (%) | Balloon or ARD LTV Ratio (%) | Rem. IO Period (mos.) | Rem. Term to Maturity (mos.) |
10 | WFB | Hilton Denver Dual Brand Hotel | CO | Hospitality | $54,650,000 | 3.3% | $54,650,000 | 89.3% | 302 | $180,960 | 2.81x | 12.4% | 63.2% | 63.2% | 82 | 82 |
37 | BANA | Southern CVS Portfolio | Various | Retail | 11,000,000 | 0.7 | 9,752,856 | 15.9 | 38,070 | 289 | 1.81 | 10.5 | 64.9 | 57.5 | 11 | 83 |
Total/Weighted Average | | | $65,650,000 | 4.0% | $64,402,856 | 105.3% | | | 2.64x | 12.1% | 63.5% | 62.2% | 70 | 82 |
1) | The table above presents the mortgage loan(s) whose balloon payments would be applied to pay down the principal balance of the Class A-3 Certificates, assuming a 0% CPR and applying the “Structuring Assumptions” described in the Preliminary Prospectus, including the assumptions that (i) none of the mortgage loans in the pool experience prepayments prior to maturity (or, in the case of an ARD loan, its anticipated repayment date), defaults or losses; (ii) there are no extensions of maturity dates of any mortgage loans in the pool; and (iii) each mortgage loan in the pool is paid in full on its stated maturity date (or, in the case of an ARD loan, its anticipated repayment date). Each Class of Certificates evidences undivided ownership interests in the entire pool of mortgage loans. Debt service coverage ratio, debt yield and loan-to-value ratio information do not take into account subordinate debt (whether or not secured by the related mortgaged property), if any, that currently exists or is allowed under the terms of any mortgage loan. See Annex A-1 to the Preliminary Prospectus. |
2) | Reflects the percentage equal to the Balloon Balance divided by the initial Class A-3 Certificate Balance. |
THE INFORMATION IN THIS STRUCTURAL AND COLLATERAL TERM SHEET IS NOT COMPLETE AND MAY BE AMENDED PRIOR TO THE TIME OF SALE. THIS TERM SHEET IS NOT AN OFFER TO SELL THESE SECURITIES AND IT IS NOT A SOLICITATION OF AN OFFER TO BUY THESE SECURITIES IN ANY JURISDICTION WHERE THE OFFER OR SALE IS NOT PERMITTED.
15
BANK 2020-BNK25 | Characteristics of the Mortgage Pool |
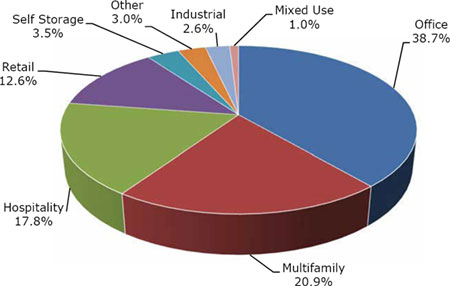
| F. | Property Type Distribution(1) |
Property Type | Number of
Mortgaged
Properties | Aggregate Cut-off Date Balance ($) | % of Cut-off Date Balance (%) | Weighted Average Cut- off Date LTV Ratio (%) | Weighted Average Balloon or ARD LTV Ratio (%) | Weighted Average U/W NCF DSCR (x) | Weighted Average U/W NOI Debt Yield (%) | Weighted Average U/W NCF Debt Yield (%) | Weighted Average Mortgage Rate (%) |
Office | 14 | $632,387,040 | 38.7 | % | 52.1 | % | 51.9 | % | 3.08 | x | 10.4 | % | 10.0 | % | 3.257 | % |
CBD | 6 | 451,285,000 | 27.6 | | 47.5 | | 47.5 | | 3.28 | | 10.5 | | 10.2 | | 3.159 | |
Suburban | 8 | 181,102,040 | 11.1 | | 63.5 | | 63.0 | | 2.56 | | 9.9 | | 9.3 | | 3.504 | |
Multifamily | 41 | 341,154,479 | 20.9 | | 42.2 | | 40.6 | | 4.28 | | 19.5 | | 19.2 | | 3.539 | |
Garden | 8 | 115,550,000 | 7.1 | | 65.6 | | 65.4 | | 2.00 | | 8.2 | | 8.0 | | 3.842 | |
Cooperative | 24 | 109,820,629 | 6.7 | | 17.9 | | 14.7 | | 7.68 | | 39.4 | | 38.7 | | 3.326 | |
High Rise | 1 | 75,000,000 | 4.6 | | 34.4 | | 34.4 | | 3.92 | | 13.0 | | 12.9 | | 3.250 | |
Townhouse | 2 | 20,110,000 | 1.2 | | 58.1 | | 52.9 | | 2.79 | | 11.2 | | 11.0 | | 3.509 | |
Student Housing | 1 | 11,250,000 | 0.7 | | 59.2 | | 54.0 | | 1.54 | | 9.3 | | 9.1 | | 4.270 | |
Mid Rise | 5 | 9,423,850 | 0.6 | | 46.3 | | 46.3 | | 2.19 | | 9.0 | | 8.5 | | 3.800 | |
Hospitality | 10 | 290,235,669 | 17.8 | | 51.4 | | 49.2 | | 4.91 | | 19.0 | | 17.6 | | 3.529 | |
Full Service | 2 | 124,700,000 | 7.6 | | 44.1 | | 42.9 | | 7.14 | | 25.3 | | 23.9 | | 3.301 | |
Select Service | 3 | 101,150,000 | 6.2 | | 56.9 | | 56.9 | | 3.34 | | 13.9 | | 12.6 | | 3.729 | |
Limited Service | 5 | 64,385,669 | 3.9 | | 57.1 | | 49.5 | | 3.06 | | 14.7 | | 13.4 | | 3.655 | |
Retail | 13 | 206,705,837 | 12.6 | | 57.6 | | 56.6 | | 2.78 | | 10.8 | | 10.4 | | 3.554 | |
Super Regional Mall | 1 | 75,000,000 | 4.6 | | 54.1 | | 54.1 | | 3.06 | | 10.7 | | 10.5 | | 3.359 | |
Anchored | 3 | 67,979,687 | 4.2 | | 59.6 | | 57.7 | | 2.56 | | 11.2 | | 10.5 | | 3.748 | |
Single Tenant | 7 | 56,000,000 | 3.4 | | 61.8 | | 60.4 | | 2.66 | | 10.3 | | 10.1 | | 3.554 | |
Unanchored | 2 | 7,726,150 | 0.5 | | 43.0 | | 43.0 | | 2.81 | | 12.3 | | 10.7 | | 3.738 | |
Self Storage | 7 | 56,490,917 | 3.5 | | 60.5 | | 58.9 | | 2.36 | | 9.7 | | 9.5 | | 3.679 | |
Self Storage | 7 | 56,490,917 | 3.5 | | 60.5 | | 58.9 | | 2.36 | | 9.7 | | 9.5 | | 3.679 | |
Other | 2 | 48,900,000 | 3.0 | | 60.4 | | 60.4 | | 2.73 | | 9.4 | | 9.0 | | 3.268 | |
Data Center | 2 | 48,900,000 | 3.0 | | 60.4 | | 60.4 | | 2.73 | | 9.4 | | 9.0 | | 3.268 | |
Industrial | 7 | 42,652,960 | 2.6 | | 62.7 | | 62.7 | | 2.42 | | 9.9 | | 9.1 | | 3.736 | |
Warehouse | 5 | 26,940,000 | 1.6 | | 61.2 | | 61.2 | | 2.46 | | 10.2 | | 9.3 | | 3.750 | |
Flex | 2 | 15,712,960 | 1.0 | | 65.3 | | 65.3 | | 2.34 | | 9.4 | | 8.8 | | 3.711 | |
Mixed Use | 3 | 15,744,967 | 1.0 | | 60.5 | | 57.2 | | 2.56 | | 10.3 | | 9.8 | | 3.659 | |
Office/Retail | 1 | 6,500,000 | 0.4 | | 58.0 | | 58.0 | | 2.52 | | 9.7 | | 9.2 | | 3.610 | |
Office/Industrial | 1 | 5,554,083 | 0.3 | | 55.0 | | 55.0 | | 3.27 | | 11.4 | | 10.8 | | 3.250 | |
Multifamily/Retail | 1 | 3,690,884 | 0.2 | | 73.1 | | 59.0 | | 1.57 | | 9.8 | | 9.4 | | 4.360 | |
Total/Weighted Average: | 97 | $1,634,271,868 | 100.0 | % | 51.5 | % | 50.5 | % | 3.56 | x | 13.8 | % | 13.2 | % | 3.433 | % |
(1) | Because this table presents information relating to the mortgaged properties and not the mortgage loans, the information for mortgage loans secured by more than one mortgaged property is based on allocated loan amounts (allocating the principal balance of the mortgage loan to each of those properties according to the relative appraised values of the mortgaged properties or the allocated loan amounts or property-specific release prices set forth in the related mortgage loan documents or such other allocation as the related mortgage loan seller deemed appropriate). For mortgaged properties securing residential cooperative mortgage loans, the debt service coverage ratio and debt yield for each such mortgaged property is calculated using U/W Net Operating Income or U/W Net Cash Flow, as applicable, for the related residential cooperative property which is the projected net operating income or net cash flow, as applicable, reflected in the most recent appraisal obtained by or otherwise in the possession of the related mortgage loan seller as of the cut-off date and the loan-to-value ratio, is calculated based upon the appraised value of the residential cooperative property determined as if such residential cooperative property is operated as a residential cooperative, inclusive of the amount of the underlying debt encumbering such residential cooperative property. With respect to any mortgage loan that is part of a whole loan, the loan-to-value ratio, debt service coverage ratio and debt yield calculations include the related pari passu companion loan(s) but exclude any related subordinate companion loan(s) (unless otherwise stated). With respect to each mortgage loan, debt service coverage ratio, debt yield and loan-to-value ratio information do not take into account any subordinate debt (whether or not secured by the related mortgaged property) that currently exists or is allowed under the terms of such mortgage loan. See Annex A-1 to the Preliminary Prospectus. |
THE INFORMATION IN THIS STRUCTURAL AND COLLATERAL TERM SHEET IS NOT COMPLETE AND MAY BE AMENDED PRIOR TO THE TIME OF SALE. THIS TERM SHEET IS NOT AN OFFER TO SELL THESE SECURITIES AND IT IS NOT A SOLICITATION OF AN OFFER TO BUY THESE SECURITIES IN ANY JURISDICTION WHERE THE OFFER OR SALE IS NOT PERMITTED.
16
BANK 2020-BNK25 | Characteristics of the Mortgage Pool |
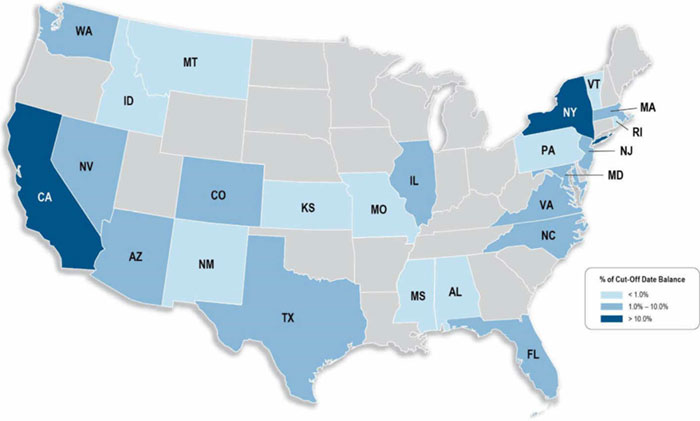
| G. | Geographic Distribution(1)(2) |
Location | Number of Mortgaged Properties | Aggregate
Cut-off Date Balance ($) | % of
Cut-off Date Balance (%) | Weighted Average Cut-off Date LTV Ratio (%) | Weighted Average Balloon or ARD LTV Ratio (%) | Weighted Average U/W NCF DSCR (x) | Weighted Average U/W NOI Debt Yield (%) | Weighted Average U/W NCF Debt Yield (%) | Weighted Average Mortgage Rate (%) |
New York | 36 | | $547,470,629 | | 33.5 | % | 39.6 | % | 39.0 | % | 4.16 | x | 16.6 | % | 16.2 | % | 3.239 | % |
California | 16 | | 290,979,687 | | 17.8 | | 54.4 | | 52.9 | | 2.94 | | 11.3 | | 10.7 | | 3.505 | |
Northern California | 9 | | 160,950,000 | | 9.8 | | 50.8 | | 50.4 | | 3.48 | | 11.5 | | 11.1 | | 3.274 | |
Southern California | 7 | | 130,029,687 | | 8.0 | | 58.8 | | 55.9 | | 2.28 | | 11.1 | | 10.2 | | 3.790 | |
Nevada | 3 | | 115,450,000 | | 7.1 | | 41.9 | | 41.1 | | 7.51 | | 25.8 | | 24.7 | | 3.255 | |
Texas | 6 | | 106,088,000 | | 6.5 | | 66.2 | | 66.2 | | 2.29 | | 9.0 | | 8.6 | | 3.744 | |
Other(3) | 36 | | 574,283,553 | | 35.1 | | 60.6 | | 59.2 | | 2.74 | | 10.9 | | 10.2 | | 3.560 | |
Total/Weighted Average | 97 | | $1,634,271,868 | | 100.0 | % | 51.5 | % | 50.5 | % | 3.56 | x | 13.8 | % | 13.2 | % | 3.433 | % |
(1) | The mortgaged properties are located in 24 states. |
(2) | Because this table presents information relating to the mortgaged properties and not the mortgage loans, the information for mortgage loans secured by more than one mortgaged property is based on allocated amounts (allocating the principal balance of the mortgage loan to each of those properties according to the relative appraised values of the mortgaged properties or the allocated loan amounts or property-specific release prices set forth in the related mortgage loan documents or such other allocation as the related mortgage loan seller deemed appropriate). For mortgaged properties securing residential cooperative mortgage loans, the debt service coverage ratio and debt yield for each such mortgaged property is calculated using U/W Net Operating Income or U/W Net Cash Flow, as applicable, for the related residential cooperative property, which is the projected net operating income or net cash flow, as applicable, reflected in the most recent appraisal obtained by or otherwise in the possession of the related mortgage loan seller as of the cut-off date, and the loan-to-value ratio, is calculated based upon the appraised value of the residential cooperative property determined as if such residential cooperative property is operated as a residential cooperative, inclusive of the amount of the underlying debt encumbering such residential cooperative property. With respect to any mortgage loan that is part of a whole loan, the loan-to-value ratio, debt service coverage ratio and debt yield calculations include the related pari passu companion loan(s) but exclude any related subordinate companion loan(s) (unless otherwise stated). With respect to each mortgage loan, debt service coverage ratio, debt yield and loan-to-value ratio information do not take into account any subordinate debt (whether or not secured by the related mortgaged property) that currently exists or is allowed under the terms of such mortgage loan. See Annex A-1 to the Preliminary Prospectus. |
(3) | Includes 20 other states. |
THE INFORMATION IN THIS STRUCTURAL AND COLLATERAL TERM SHEET IS NOT COMPLETE AND MAY BE AMENDED PRIOR TO THE TIME OF SALE. THIS TERM SHEET IS NOT AN OFFER TO SELL THESE SECURITIES AND IT IS NOT A SOLICITATION OF AN OFFER TO BUY THESE SECURITIES IN ANY JURISDICTION WHERE THE OFFER OR SALE IS NOT PERMITTED.
17
BANK 2020-BNK25 | Characteristics of the Mortgage Pool |
H. Characteristics of the Mortgage Pool(1)
CUT-OFF DATE BALANCE |
Range of Cut-off Date
Balances ($) | Number of
Mortgage
Loans | Aggregate
Cut-off Date Balance ($) | Percent by
Aggregate
Cut-off Date
Pool Balance (%) |
998,487 - 1,000,000 | 1 | $998,487 | 0.1% |
1,000,001 - 2,000,000 | 6 | 8,929,316 | 0.5 |
2,000,001 - 3,000,000 | 4 | 11,257,409 | 0.7 |
3,000,001 - 4,000,000 | 3 | 10,684,444 | 0.7 |
4,000,001 - 5,000,000 | 1 | 4,046,323 | 0.2 |
5,000,001 - 6,000,000 | 7 | 39,573,300 | 2.4 |
6,000,001 - 7,000,000 | 3 | 19,843,818 | 1.2 |
7,000,001 - 8,000,000 | 6 | 46,317,930 | 2.8 |
8,000,001 - 9,000,000 | 5 | 42,995,889 | 2.6 |
9,000,001 - 10,000,000 | 2 | 19,135,614 | 1.2 |
10,000,001 - 15,000,000 | 11 | 137,328,669 | 8.4 |
15,000,001 - 20,000,000 | 7 | 116,335,669 | 7.1 |
20,000,001 - 30,000,000 | 6 | 156,140,000 | 9.6 |
30,000,001 - 50,000,000 | 5 | 231,350,000 | 14.2 |
50,000,001 - 70,000,000 | 4 | 258,050,000 | 15.8 |
70,000,001 - 80,000,000 | 2 | 150,000,000 | 9.2 |
80,000,001 - 90,000,000 | 1 | 81,285,000 | 5.0 |
90,000,001 - 100,000,000 | 3 | 300,000,000 | 18.4 |
Total: | 77 | $1,634,271,868 | 100.0% |
Average | $21,224,310 | | |
|
UNDERWRITTEN NOI DEBT SERVICE COVERAGE RATIO |
Range of U/W NOI
DSCRs (x) | Number of
Mortgage
Loans | Aggregate
Cut-off Date Balance ($) | Percent by
Aggregate
Cut-off Date
Pool Balance (%) |
1.57 - 1.60 | 1 | $11,250,000 | 0.7% |
1.61 - 1.70 | 4 | 32,720,884 | 2.0 |
1.71 - 1.80 | 1 | 10,000,000 | 0.6 |
1.81 - 1.90 | 2 | 26,000,000 | 1.6 |
1.91 - 2.00 | 1 | 68,000,000 | 4.2 |
2.01 - 2.50 | 14 | 237,829,673 | 14.6 |
2.51 - 3.00 | 12 | 374,976,709 | 22.9 |
3.01 - 3.50 | 9 | 259,911,323 | 15.9 |
3.51 - 4.00 | 5 | 292,500,000 | 17.9 |
4.01 - 23.88 | 28 | 321,083,279 | 19.6 |
Total: | 77 | $1,634,271,868 | 100.0% |
Weighted Average: | 3.72x | | |
|
UNDERWRITTEN NCF DEBT SERVICE COVERAGE RATIO |
Range of U/W NCF
DSCRs (x) | Number of
Mortgage
Loans | Aggregate
Cut-off Date Balance ($) | Percent by
Aggregate
Cut-off Date
Pool Balance (%) |
1.54 - 1.60 | 3 | $29,910,884 | 1.8% |
1.61 - 1.80 | 3 | 24,060,000 | 1.5 |
1.81 - 1.90 | 2 | 26,000,000 | 1.6 |
1.91 - 2.00 | 6 | 212,979,673 | 13.0 |
2.01 - 2.50 | 14 | 238,435,682 | 14.6 |
2.51 - 3.00 | 13 | 373,356,026 | 22.8 |
3.01 - 3.50 | 4 | 121,946,323 | 7.5 |
3.51 - 4.00 | 6 | 333,000,000 | 20.4 |
4.01 - 23.52 | 26 | 274,583,279 | 16.8 |
Total: | 77 | $1,634,271,868 | 100.0% |
Weighted Average: | 3.56x | | |
LOAN PURPOSE |
Loan Purpose | Number of
Mortgage
Loans | Aggregate
Cut-off Date Balance ($) | Percent by
Aggregate
Cut-off Date
Pool Balance (%) |
Refinance | 56 | $948,676,868 | 58.0% |
Acquisition | 15 | 505,345,000 | 30.9 |
Recapitalization | 6 | 180,250,000 | 11.0 |
Total: | 77 | $1,634,271,868 | 100.0% |
|
MORTGAGE RATE |
Range of Mortgage
Rates (%) | Number of
Mortgage
Loans | Aggregate
Cut-off Date Balance ($) | Percent by
Aggregate
Cut-off Date
Pool Balance (%) |
2.589 - 3.500 | 42 | $1,045,612,831 | 64.0% |
3.501 - 3.750 | 14 | 244,687,485 | 15.0 |
3.751 - 4.000 | 15 | 282,410,669 | 17.3 |
4.001 - 4.250 | 4 | 46,620,000 | 2.9 |
4.251 - 4.360 | 2 | 14,940,884 | 0.9 |
Total: | 77 | $1,634,271,868 | 100.0% |
Weighted Average: | 3.433% | | |
|
UNDERWRITTEN NOI DEBT YIELD |
Range of U/W NOI
Debt Yields (%) | Number of
Mortgage
Loans | Aggregate
Cut-off Date Balance ($) | Percent by
Aggregate
Cut-off Date
Pool Balance (%) |
7.4 - 8.0 | 3 | $153,000,000 | 9.4% |
8.1 - 9.0 | 6 | 152,685,000 | 9.3 |
9.1 - 10.0 | 15 | 232,395,884 | 14.2 |
10.1 - 11.0 | 8 | 366,390,000 | 22.4 |
11.1 - 12.0 | 4 | 140,015,000 | 8.6 |
12.1 - 13.0 | 6 | 192,929,673 | 11.8 |
13.1 - 14.0 | 3 | 44,679,687 | 2.7 |
14.1 - 15.0 | 5 | 81,093,345 | 5.0 |
15.1 - 16.0 | 1 | 29,500,000 | 1.8 |
16.1 - 20.0 | 2 | 34,000,000 | 2.1 |
20.1 - 125.3 | 24 | 207,583,279 | 12.7 |
Total: | 77 | $1,634,271,868 | 100.0% |
Weighted Average: | 13.8% | | |
|
UNDERWRITTEN NCF DEBT YIELD |
Range of U/W NCF
Debt Yields (%) | Number of
Mortgage
Loans | Aggregate
Cut-off Date Balance ($) | Percent by
Aggregate
Cut-off Date
Pool Balance (%) |
7.0 - 8.0 | 4 | $173,000,000 | 10.6% |
8.1 - 9.0 | 9 | 224,885,000 | 13.8 |
9.1 - 10.0 | 15 | 270,585,884 | 16.6 |
10.1 - 11.0 | 8 | 292,244,673 | 17.9 |
11.1 - 12.0 | 6 | 220,900,000 | 13.5 |
12.1 - 13.0 | 4 | 116,235,682 | 7.1 |
13.1 - 14.0 | 3 | 85,000,000 | 5.2 |
14.1 - 15.0 | 4 | 43,837,350 | 2.7 |
15.1 - 20.0 | 1 | 7,600,000 | 0.5 |
20.1 - 123.2 | 23 | 199,983,279 | 12.2 |
Total: | 77 | $1,634,271,868 | 100.0% |
Weighted Average: | 13.2% | | |
| (1) | For mortgaged properties securing residential cooperative mortgage loans, the debt service coverage ratio and debt yield for each such mortgaged property is calculated using U/W Net Operating Income or U/W Net Cash Flow, as applicable, for the related residential cooperative property, which is the projected net operating income or net cash flow, as applicable, reflected in the most recent appraisal obtained by or otherwise in the possession of the related mortgage loan seller as of the cut-off date, and the loan-to-value ratio is calculated based upon the appraised value of the residential cooperative property determined as if such residential cooperative property is operated as a residential cooperative, inclusive of the amount of the underlying debt encumbering such residential cooperative. With respect to any mortgage loan that is part of a whole loan, the loan-to-value ratio, debt service coverage ratio and debt yield calculations include the related pari passu companion loan(s) but exclude any related subordinate companion loan(s) (unless otherwise stated). With respect to each mortgage loan, debt service coverage ratio, debt yield and loan-to-value ratio information do not take into account any subordinate debt (whether or not secured by the related mortgaged property), that currently exists or is allowed under the terms of such mortgage loan. See Annex A-1 to the Preliminary Prospectus. Prepayment provisions for each mortgage loan reflects the entire life of the loan (from origination to maturity). |
THE INFORMATION IN THIS STRUCTURAL AND COLLATERAL TERM SHEET IS NOT COMPLETE AND MAY BE AMENDED PRIOR TO THE TIME OF SALE. THIS TERM SHEET IS NOT AN OFFER TO SELL THESE SECURITIES AND IT IS NOT A SOLICITATION OF AN OFFER TO BUY THESE SECURITIES IN ANY JURISDICTION WHERE THE OFFER OR SALE IS NOT PERMITTED.
18
BANK 2020-BNK25 | Characteristics of the Mortgage Pool |
ORIGINAL TERM TO MATURITY OR ARD |
Original Terms to
Maturity or ARD (months) | Number of
Mortgage
Loans | Aggregate Cut-
off Date Balance | Percent by
Aggregate
Cut-off Date
Pool Balance (%) |
60 | 1 | $8,520,000 | 0.5% |
84 | 2 | 65,650,000 | 4.0 |
120 | 74 | 1,560,101,868 | 95.5 |
Total: | 77 | $1,634,271,868 | 100.0% |
Weighted Average: | 118 months | | |
REMAINING TERM TO MATURITY OR ARD |
Range of Remaining
Terms to Maturity or
ARD (months) | Number of
Mortgage
Loans | Aggregate Cut-
off Date Balance | Percent by
Aggregate
Cut-off Date
Pool Balance (%) |
59 - 81 | 1 | $8,520,000 | 0.5% |
82 - 113 | 2 | 65,650,000 | 4.0 |
114 - 120 | 74 | 1,560,101,868 | 95.5 |
Total: | 77 | $1,634,271,868 | 100.0% |
Weighted Average: | 116 months | | |
ORIGINAL AMORTIZATION TERM(2) |
Original
Amortization Terms
(months) | Number of
Mortgage
Loans | Aggregate Cut-
off Date Balance | Percent by
Aggregate
Cut-off Date
Pool Balance (%) |
Non-Amortizing | 42 | $1,380,515,000 | 84.5% |
120 | 1 | 1,291,037 | 0.1 |
300 | 1 | 1,397,100 | 0.1 |
360 | 27 | 216,799,301 | 13.3 |
480 | 6 | 34,269,430 | 2.1 |
Total: | 77 | $1,634,271,868 | 100.0% |
Weighted Average(4): | 375 months | | |
REMAINING AMORTIZATION TERM(3) |
Range of Remaining Amortization Terms
(months) | Number of
Mortgage
Loans | Aggregate Cut-
off Date Balance | Percent by
Aggregate
Cut-off Date
Pool Balance (%) |
Non-Amortizing | 42 | $1,380,515,000 | 84.5% |
119 | 1 | 1,291,037 | 0.1 |
299 - 357 | 1 | 1,397,100 | 0.1 |
358 - 360 | 27 | 216,799,301 | 13.3 |
361 - 479 | 6 | 34,269,430 | 2.1 |
Total: | 77 | $1,634,271,868 | 100.0% |
Weighted Average(4): | 374 months | | |
LOCKBOXES |
Type of Lockbox | Number of
Mortgage
Loans | Aggregate Cut-
off Date Balance | Percent by
Aggregate
Cut-off Date
Pool Balance (%) |
Hard/Springing Cash Management | 12 | $664,690,000 | 40.7% |
Springing | 33 | 565,961,239 | 34.6 |
Hard/Upfront Cash Management | 4 | 172,650,000 | 10.6 |
Soft/Springing Cash Management | 4 | 121,150,000 | 7.4 |
None | 24 | 109,820,629 | 6.7 |
Total: | 77 | $1,634,271,868 | 100.0% |
PREPAYMENT PROVISION SUMMARY |
Prepayment Provision | Number of
Mortgage
Loans | Aggregate Cut-
off Date Balance | Percent by
Aggregate
Cut-off Date
Pool Balance (%) |
Lockout / Defeasance / Open | 37 | $849,626,239 | 52.0% |
Lockout / GRTR 1% or YM / Open | 8 | 285,735,000 | 17.5 |
Lockout / GRTR 1% or YM or Defeasance / Open | 5 | 190,190,000 | 11.6 |
GRTR 0.5% or YM / GRTR 0.5% or YM or Defeasance / Open | 2 | 148,900,000 | 9.1 |
GRTR 1% or YM / 1% / Open | 24 | 109,820,629 | 6.7 |
Lockout / YM / Open | 1 | 50,000,000 | 3.1 |
Total: | 77 | $1,634,271,868 | 100.0% |
| | | |
CUT-OFF DATE LOAN-TO-VALUE RATIO |
Range of Cut-off
Date LTV Ratios (%) | Number of
Mortgage
Loans | Aggregate Cut-
off Date Balance | Percent by
Aggregate
Cut-off Date
Pool Balance (%) |
2.2 - 20.0 | 18 | $73,615,699 | 4.5% |
20.1 - 25.0 | 2 | 11,282,771 | 0.7 |
25.1 - 30.0 | 2 | 12,483,037 | 0.8 |
30.1 - 35.0 | 1 | 75,000,000 | 4.6 |
35.1 - 40.0 | 5 | 263,100,000 | 16.1 |
40.1 - 45.0 | 3 | 119,979,687 | 7.3 |
45.1 - 50.0 | 6 | 102,089,121 | 6.2 |
50.1 - 55.0 | 4 | 136,650,000 | 8.4 |
55.1 - 60.0 | 9 | 204,920,000 | 12.5 |
60.1 - 65.0 | 17 | 425,809,673 | 26.1 |
65.1 - 70.0 | 8 | 197,040,996 | 12.1 |
70.1 - 75.0 | 2 | 12,300,884 | 0.8 |
Total: | 77 | $1,634,271,868 | 100.0% |
Weighted Average: | 51.5% | | |
BALLOON OR ARD LOAN-TO-VALUE RATIO |
Range of Balloon or
ARD LTV Ratios (%) | Number of
Mortgage
Loans | Aggregate Cut-
off Date Balance | Percent by
Aggregate
Cut-off Date
Pool Balance (%) |
0.0 - 20.0 | 20 | $84,898,471 | 5.2% |
20.1 - 25.0 | 1 | 8,986,243 | 0.5 |
25.1 - 30.0 | 1 | 3,496,794 | 0.2 |
30.1 - 35.0 | 3 | 94,479,687 | 5.8 |
35.1 - 40.0 | 4 | 257,600,000 | 15.8 |
40.1 - 45.0 | 4 | 118,439,121 | 7.2 |
45.1 - 50.0 | 5 | 105,879,673 | 6.5 |
50.1 - 55.0 | 9 | 186,905,996 | 11.4 |
55.1 - 60.0 | 8 | 209,810,884 | 12.8 |
60.1 - 65.0 | 16 | 397,460,000 | 24.3 |
65.1 – 68.5 | 6 | 166,315,000 | 10.2 |
Total: | 77 | $1,634,271,868 | 100.0% |
Weighted Average: | 50.5% | | |
AMORTIZATION TYPE |
Amortization Type | Number of
Mortgage
Loans | Aggregate Cut-
off Date Balance | Percent by
Aggregate
Cut-off Date
Pool Balance (%) |
Interest-only, Balloon | 41 | $1,330,515,000 | 81.4% |
Amortizing Balloon | 25 | 153,185,831 | 9.4 |
Interest-only, Amortizing Balloon | 8 | 88,280,000 | 5.4 |
Interest-only, ARD | 1 | 50,000,000 | 3.1 |
Interest-only, Amortizing ARD | 1 | 11,000,000 | 0.7 |
Fully Amortizing | 1 | 1,291,037 | 0.1 |
Total: | 77 | $1,634,271,868 | 100.0% |
ORIGINAL TERM OF INTEREST-ONLY PERIOD FOR PARTIAL IO LOANS |
IO Terms (months)
| Number of
Mortgage
Loans | Aggregate Cut-
off Date Balance | Percent by
Aggregate
Cut-off Date
Pool Balance (%) |
12 | 1 | $11,000,000 | 0.7% |
24 | 1 | 8,610,000 | 0.5 |
36 | 2 | 13,300,000 | 0.8 |
60 | 5 | 66,370,000 | 4.1 |
Total: | 9 | $99,280,000 | 6.1% |
Weighted Average: | 48 months | | |
SEASONING |
Seasoning (months) | Number of
Mortgage
Loans | Aggregate Cut-
off Date Balance | Percent by
Aggregate
Cut-off Date
Pool Balance (%) |
0 | 1 | $81,285,000 | 5.0% |
1 | 45 | 601,189,926 | 36.8 |
2 | 25 | 707,296,942 | 43.3 |
3 | 3 | 94,800,000 | 5.8 |
4 | 2 | 99,700,000 | 6.1 |
6 | 1 | 50,000,000 | 3.1 |
Total: | 77 | $1,634,271,868 | 100.0% |
Weighted Average: | 2 months | | |
(2) The original amortization term shown for any mortgage loan that is interest-only for part of its term does not include the number of months in its interest-only period and reflects only the number of months as of the commencement of amortization remaining from the end of such interest-only period. (3) The remaining amortization term shown for any mortgage loan that is interest-only for part of its term does not include the number of months in its interest-only period and reflects only the number of months as of the commencement of amortization remaining from the end of such interest-only period. (4) Excludes the non-amortizing mortgage loans. |
THE INFORMATION IN THIS STRUCTURAL AND COLLATERAL TERM SHEET IS NOT COMPLETE AND MAY BE AMENDED PRIOR TO THE TIME OF SALE. THIS TERM SHEET IS NOT AN OFFER TO SELL THESE SECURITIES AND IT IS NOT A SOLICITATION OF AN OFFER TO BUY THESE SECURITIES IN ANY JURISDICTION WHERE THE OFFER OR SALE IS NOT PERMITTED.
19
| BANK 2020-BNK25 | Certain Terms and Conditions |
V. Certain Terms and Conditions
Allocation Between the RR Interest and the Non-Retained Certificates: | Amounts available for distributions to the holders of the Certificates (including the RR Interest) will be allocated between amounts available for distribution to the holders of the RR Interest, on the one hand, and to all other Certificates, referred to herein as the “Non-Retained Certificates”, on the other hand. The portion of such amount allocable to (a) the RR Interest will at all times be the product of such amount multiplied by 5% and (b) the Non-Retained Certificates will at all times be the product of such amount multiplied by 95% (each, the respective “Percentage Allocation Entitlement”). |
Interest Entitlements: | The interest entitlement of each Class of Non-Retained Certificates on each Distribution Date generally will be the interest accrued during the related Interest Accrual Period on the related Certificate Balance or Notional Amount at the related pass-through rate, net of any prepayment interest shortfalls allocated to that Class for such Distribution Date as described below. If prepayment interest shortfalls arise from voluntary prepayments (without the applicable Master Servicer consent) on particular non-specially serviced loans during any collection period, the applicable Master Servicer is required to make a compensating interest payment to offset those shortfalls, generally up to an amount equal to the portion of its master servicing fees that accrue at 0.25 basis points per annum. The remaining amount of prepayment interest shortfalls will be allocated between the RR Interest, on one hand, and the Non-Retained Certificates, on the other hand, in accordance with their respective Percentage Allocation Entitlements. The prepayment interest shortfalls allocated to the Non-Retained Certificates (other than the Class V and Class R Certificates) will be allocated among such Classes of Certificates entitled to interest, on a pro rata basis, based on their respective amounts of accrued interest for the related Distribution Date, to reduce the interest entitlement on each such Class of Certificates. If a Class receives less than the entirety of its interest entitlement on any Distribution Date, then the shortfall (excluding any shortfall due to prepayment interest shortfalls), together with interest thereon, will be added to its interest entitlement for the next succeeding Distribution Date. |
Aggregate Principal Distribution Amount: | The Aggregate Principal Distribution Amount for each Distribution Date generally will be the aggregate amount of principal received or advanced in respect of the mortgage loans, net of any non-recoverable advances and interest thereon and workout-delayed reimbursement amounts that are reimbursed to the applicable Master Servicer, the Special Servicer or the Trustee during the related collection period. Non-recoverable advances and interest thereon are reimbursable from principal collections and advances before reimbursement from other amounts. Workout-delayed reimbursement amounts are reimbursable from principal collections. The Non-Retained Certificates will be entitled to the portion of the Aggregate Principal Distribution Amount equal to their Percentage Allocation Entitlement, which is referred to herein as the “Principal Distribution Amount”. |
Subordination, Allocation of Losses and Certain Expenses | The chart below describes the manner in which the payment rights of certain Classes of Non-Retained Certificates will be senior or subordinate, as the case may be, to the payment rights of other Classes of Non-Retained Certificates. The chart also shows the allocation between the RR Interest and the Non-Retained Certificates and the corresponding entitlement to receive principal and/or interest of certain Classes of Non-Retained Certificates (other than excess interest that accrues on each mortgage loan that has an anticipated repayment date) on any distribution date in descending order. It also shows the manner in which losses are allocated between the RR Interest and the Non-Retained Certificates and the manner in which the Non-Retained Certificate allocations are further allocated to certain Classes of those Certificates in ascending order (beginning with the Non-Offered Certificates, other than the Class V and Class R Certificates and the RR Interest) to reduce the balance of each such Class to zero; provided that no principal payments or mortgage loan losses will be allocated to the Class X-A, Class X-B, Class X-D, Class X-F, Class X-G, Class X-H, Class V or Class R Certificates, although principal payments and losses may reduce the Notional Amounts of the Class X-A, Class X-B, Class X-D, Class X-F, Class X-G and Class X-H Certificates and, therefore, the amount of interest they accrue. |
THE INFORMATION IN THIS STRUCTURAL AND COLLATERAL TERM SHEET IS NOT COMPLETE AND MAY BE AMENDED PRIOR TO THE TIME OF SALE. THIS TERM SHEET IS NOT AN OFFER TO SELL THESE SECURITIES AND IT IS NOT A SOLICITATION OF AN OFFER TO BUY THESE SECURITIES IN ANY JURISDICTION WHERE THE OFFER OR SALE IS NOT PERMITTED.
20
| BANK 2020-BNK25 | Certain Terms and Conditions |
| 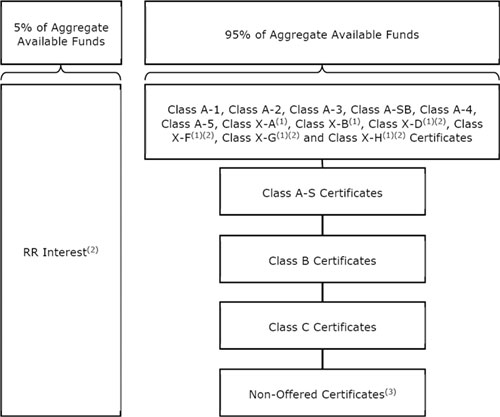
(1) The Class X-A, Class X-B, Class X-D, Class X-F, Class X-G and Class X-H Certificates are interest-only certificates. (2) The Class X-D, Class X-F, Class X-G and Class X-H Certificates and the RR Interest are Non-Offered Certificates. (3) Other than the Class X-D, Class X-F, Class X-G, Class X-H, Class V and Class R Certificates and the RR Interest. |
| | |
Distributions: | On each Distribution Date, funds available for distribution from the mortgage loans, net of specified trust fees, expenses and reimbursements that are allocable to the Non-Retained Certificates will generally be distributed in the following amounts and order of priority (in each case to the extent of remaining available funds): |
| 1. Class A-1, A-2, A-3, A-SB, A-4, A-5, X-A, X-B, X-D, X-F, X-G and X-H Certificates: To interest on the Class A-1, A-2, A-3, A-SB, A-4, A-5, X-A, X-B, X-D, X-F, X-G and X-H Certificates, pro rata, according to their respective interest entitlements. |
| 2. Class A-1, A-2, A-3, A-SB, A-4 and A-5 Certificates: To principal on the Class A-1, A-2, A-3, A-SB, A-4 and A-5 Certificates in the following amounts and order of priority: (i) first, to principal on the Class A-SB Certificates, in an amount up to the Principal Distribution Amount for such Distribution Date until their Certificate Balance is reduced to the Class A-SB Planned Principal Balance for such Distribution Date; (ii) second, to principal on the Class A-1 Certificates until their Certificate Balance is reduced to zero, up to the remainder of the Principal Distribution Amount for such Distribution Date; (iii) third, to principal on the Class A-2 Certificates until their Certificate Balance is reduced to zero, up to the remainder of the Principal Distribution Amount for such Distribution Date; (iv) fourth, to principal on the Class A-3 Certificates, until their Certificate Balance is reduced to zero, up to the remainder of the Principal Distribution Amount for such Distribution Date; (v) fifth, to principal on the Class A-4 Certificates, until their Certificate Balance is reduced to zero, up to the remainder of the Principal Distribution Amount for such Distribution Date; (vi) sixth, to principal on the Class A-5 Certificates, until their Certificate Balance is reduced to zero, up to the remainder of the Principal Distribution Amount for such Distribution Date; and (vii) seventh, to principal on the Class A-SB Certificates until their Certificate Balance is reduced to zero, up to the remainder of the Principal Distribution Amount for such Distribution Date. However, if the Certificate Balance of each and every Class of Principal Balance Certificates, other than the Class A-1, A-2, A-3, A-SB, A-4 and A-5 Certificates and the RR Interest, has been reduced to zero as a result of the allocation of Mortgage Loan losses and expenses and any of the Class A-1, A-2, A-3, A-SB, A-4 and A-5 Certificates remains outstanding, then the Principal Distribution Amount will be distributed to the Class A-1, A-2, A-3, A- |
THE INFORMATION IN THIS STRUCTURAL AND COLLATERAL TERM SHEET IS NOT COMPLETE AND MAY BE AMENDED PRIOR TO THE TIME OF SALE. THIS TERM SHEET IS NOT AN OFFER TO SELL THESE SECURITIES AND IT IS NOT A SOLICITATION OF AN OFFER TO BUY THESE SECURITIES IN ANY JURISDICTION WHERE THE OFFER OR SALE IS NOT PERMITTED.
21
| BANK 2020-BNK25 | Certain Terms and Conditions |
| SB, A-4 and A-5 Certificates, pro rata, based on their respective outstanding Certificate Balances, until their Certificate Balances have been reduced to zero. 3. Class A-1, A-2, A-3, A-SB, A-4 and A-5 Certificates: To reimburse the holders of the Class A-1, A-2, A-3, A-SB, A-4 and A-5 Certificates, pro rata, on the basis of previously allocated unreimbursed losses, for any previously unreimbursed losses (plus interest thereon) on the mortgage loans that were previously allocated in reduction of the Certificate Balances of such Classes. |
| 4. Class A-S Certificates: To make distributions on the Class A-S Certificates as follows: (a) first, to interest on the Class A-S Certificates in the amount of the interest entitlement for that Class; (b) next, to the extent of the portion of the Principal Distribution Amount remaining after distributions in respect of principal to each Class with a higher distribution priority (in this case, the Class A-1, A-2, A-3, A-SB, A-4 and A-5 Certificates), to principal on the Class A-S Certificates until their Certificate Balance is reduced to zero; and (c) next, to reimburse the holders of the Class A-S Certificates for any previously unreimbursed losses (plus interest thereon) on the mortgage loans that were previously allocated to that Class in reduction of their Certificate Balance. 5. Class B Certificates: To make distributions on the Class B Certificates as follows: (a) first, to interest on the Class B Certificates in the amount of the interest entitlement for that Class; (b) next, to the extent of the portion of the Principal Distribution Amount remaining after distributions in respect of principal to each Class with a higher distribution priority (in this case, the Class A-1, A-2, A-3, A-SB, A-4, A-5 and A-S Certificates), to principal on the Class B Certificates until their Certificate Balance is reduced to zero; and (c) next, to reimburse the holders of the Class B Certificates for any previously unreimbursed losses (plus interest thereon) on the mortgage loans that were previously allocated to that Class in reduction of their Certificate Balance. 6. Class C Certificates: To make distributions on the Class C Certificates as follows: (a) first, to interest on the Class C Certificates in the amount of the interest entitlement for that Class; (b) next, to the extent of the portion of the Principal Distribution Amount remaining after distributions in respect of principal to each Class with a higher distribution priority (in this case, the Class A-1, A-2, A-3, A-SB, A-4, A-5, A-S and B Certificates), to principal on the Class C Certificates until their Certificate Balance is reduced to zero; and (c) next, to reimburse the holders of the Class C Certificates for any previously unreimbursed losses (plus interest thereon) on the mortgage loans that were previously allocated to that Class in reduction of their Certificate Balance. 7. After the Class A-1, A-2, A-3, A-SB, A-4, A-5, A-S, B and C Certificates are paid all amounts to which they are entitled, the remaining funds available for distribution will be used to pay interest, principal and loss reimbursement amounts on the Class D, E, F, G and H Certificates sequentially in that order in a manner analogous to the Class C Certificates. |
Allocation of Yield Maintenance and Prepayment Premiums: | If any yield maintenance charge or prepayment premium is collected during any particular collection period with respect to any mortgage loan, then on the Distribution Date corresponding to that collection period, the certificate administrator will pay that yield maintenance charge or prepayment premium (net of liquidation fees payable therefrom) in the following manner: (x)(1) to each of the Class A-1, A-2, A-3, A-SB, A-4, A-5, A-S, B, C, D and E Certificates, the product of (a) the Non-Retained Certificates’ Percentage Allocation Entitlement of the yield maintenance charge or prepayment premium, (b) the related Base Interest Fraction (as defined in the Preliminary Prospectus) for such Class, and (c) a fraction, the numerator of which is equal to the amount of principal distributed to such Class for that Distribution Date, and the denominator of which is the total amount of principal distributed to all Principal Balance Certificates (other than the RR Interest) for that Distribution Date, (2) to the Class X-A Certificates, the excess, if any, of (a) the product of (i) the Non-Retained Certificates’ Percentage Allocation Entitlement of such yield maintenance charge or prepayment premium and (ii) a fraction, the numerator of which is equal to the amount of principal distributed to the Class A-1, A-2, A-3, A-SB, A-4 and A-5 Certificates for that Distribution Date, and the denominator of which is the total amount of principal distributed to all Principal Balance Certificates (other than the RR Interest) for that Distribution Date, over (b) the amount of such yield maintenance charge or prepayment premium distributed to the Class A-1, A-2, A-3, A-SB, A-4 and A-5 Certificates as described above, and (3) to the Class X-B Certificates, any remaining portion of the Non-Retained Percentage of such yield maintenance charge or prepayment premium not distributed as described above, and (y) to the RR Interest, its Percentage Allocation Entitlement of the yield maintenance charge or prepayment premium. |
THE INFORMATION IN THIS STRUCTURAL AND COLLATERAL TERM SHEET IS NOT COMPLETE AND MAY BE AMENDED PRIOR TO THE TIME OF SALE. THIS TERM SHEET IS NOT AN OFFER TO SELL THESE SECURITIES AND IT IS NOT A SOLICITATION OF AN OFFER TO BUY THESE SECURITIES IN ANY JURISDICTION WHERE THE OFFER OR SALE IS NOT PERMITTED.
22
| BANK 2020-BNK25 | Certain Terms and Conditions |
| No prepayment premiums or yield maintenance charges will be distributed to the holders of the Class X-D, X-F, X-G, X-H, F, G, H, V or R Certificates. For a description of when prepayment premiums and yield maintenance charges are generally required on the mortgage loans, see Annex A-1 to the Preliminary Prospectus. See also “Risk Factors—Risks Relating to the Mortgage Loans—Risks Relating to Enforceability of Yield Maintenance Charges, Prepayment Premiums or Defeasance Provisions“ and “Risk Factors—Other Risks Relating to the Certificates—Your Yield May Be Affected by Defaults, Prepayments and Other Factors” in the Preliminary Prospectus. Prepayment premiums and yield maintenance charges will be distributed on each Distribution Date only to the extent they are actually received on the mortgage loans as of the related Determination Date. |
Realized Losses: | The Certificate Balances of the Class A-1, A-2, A-3, A-SB, A-4, A-5, A-S, B, C, D, E, F, G and H Certificates, will be reduced without distribution on any Distribution Date as a write-off to the extent of the Non-Retained Certificates’ Percentage Allocation Entitlement of any losses realized on the mortgage loans allocated to such Class on such Distribution Date. Such losses will be applied in the following order, in each case until the related Certificate Balance is reduced to zero: first, to the Class H Certificates; second, to the Class G Certificates; third, to the Class F Certificates; fourth, to the Class E Certificates; fifth, to the Class D Certificates; sixth, to the Class C Certificates; seventh, to the Class B Certificates; eighth, to the Class A-S Certificates; and, finally, pro rata, to the Class A-1, A-2, A-3, A-SB, A-4 and A-5 Certificates based on their outstanding Certificate Balances. The Notional Amount of the Class X-A Certificates will be reduced by the amount of all losses that are allocated to the Class A-1, A-2, A-3, A-SB, A-4 or A-5 Certificates as write-offs in reduction of their Certificate Balances. The Notional Amount of the Class X-B Certificates will be reduced by the amount of all losses that are allocated to the Class A-S, B or C Certificates as write-offs in reduction of their Certificate Balances. The Notional Amount of the Class X-D Certificates will be reduced by the amount of all losses that are allocated to the Class D or E Certificates as write-offs in reduction of their Certificate Balance. The Notional Amount of the Class X-F Certificates will be reduced by the amount of all losses that are allocated to the Class F Certificates as write-offs in reduction of their Certificate Balance. The Notional Amount of the Class X-G Certificates will be reduced by the amount of all losses that are allocated to the Class G Certificates as write-offs in reduction of their Certificate Balance. The Notional Amount of the Class X-H Certificates will be reduced by the amount of all losses that are allocated to the Class H Certificates as write-offs in reduction of their Certificate Balance. |
P&I Advances: | Each Master Servicer or, if such Master Servicer fails to do so, the Trustee, will be obligated to advance delinquent debt service payments with respect to the mortgage loans it services (other than balloon payments, excess interest and default interest) and assumed debt service payments on mortgage loans with delinquent balloon payments (excluding any related companion loan), except to the extent any such advance is deemed non-recoverable from collections on the related mortgage loan. In addition, if an Appraisal Reduction Amount exists for a given mortgage loan, the interest portion of any P&I advance for such mortgage loan will be reduced, which will have the effect of reducing the amount of interest available for distribution to the Certificates, which with respect to the Non-Retained Certificates will be applied in reverse alphabetical order of their Class designations (except that interest payments on the Class A-1, A-2, A-3, A-SB, A-4, A-5, X-A, X-B, X-D, X-F, X-G and X-H Certificates would be affected on a pari passu basis). |
Servicing Advances: | Each Master Servicer or, if such Master Servicer fails to do so, the Trustee, will be obligated to make servicing advances, including the payment of delinquent property taxes, insurance premiums and ground rent, except to the extent that those advances are deemed non-recoverable from collections on the related mortgage loan. The related Master Servicer or the Trustee, as applicable, will have the primary obligation to make any required servicing advances with respect to any serviced whole loan. With respect to any non-serviced whole loan, the master servicer or trustee, as applicable, under the related lead securitization servicing agreement will have the primary obligation to make any required servicing advances with respect to such non-serviced whole loan. |
Appraisal Reduction Amounts and Collateral Deficiency Amounts: | An “Appraisal Reduction Amount” generally will be created in the amount, if any, by which the principal balance of a required appraisal loan (which is a mortgage loan (other than a non-serviced mortgage loan) with respect to which certain defaults, modifications or insolvency events have occurred as further described in the Preliminary Prospectus) plus other amounts overdue or advanced in connection with such mortgage loan exceeds 90% of the appraised value of the related mortgaged property plus certain escrows and reserves (including letters of credit) held with respect to the mortgage loan. With respect to any serviced whole loan, any Appraisal Reduction Amount will be allocated first to the related subordinate companion loan, if any, and then to the related mortgage loan and the related pari passu companion loan(s). With respect to any non-serviced mortgage loan, appraisal reduction amounts are expected to be calculated in a similar manner under the related non-serviced pooling and servicing agreement. |
THE INFORMATION IN THIS STRUCTURAL AND COLLATERAL TERM SHEET IS NOT COMPLETE AND MAY BE AMENDED PRIOR TO THE TIME OF SALE. THIS TERM SHEET IS NOT AN OFFER TO SELL THESE SECURITIES AND IT IS NOT A SOLICITATION OF AN OFFER TO BUY THESE SECURITIES IN ANY JURISDICTION WHERE THE OFFER OR SALE IS NOT PERMITTED.
23
| BANK 2020-BNK25 | Certain Terms and Conditions |
| A mortgage loan will cease to be a required appraisal loan when the same has ceased to be a specially serviced loan (if applicable), has been brought current for at least three consecutive months and no other circumstances exist that would cause such mortgage loan to be a required appraisal loan. A “Collateral Deficiency Amount” will exist with respect to any mortgage loan that is modified into an AB loan structure and remains a corrected mortgage loan and will generally equal the excess of (i) the stated principal balance of such AB modified loan (taking into account the related junior note(s) and any pari passu notes included therein), over (ii) the sum of (in the case of a whole loan, solely to the extent allocable to the subject mortgage loan) (x) the most recent appraised value of the related mortgaged property plus (y) solely to the extent not reflected or taken into account in such appraised value (or in the calculation of any related Appraisal Reduction Amount) and to the extent on deposit with, or otherwise under the control of, the lender as of the date of such determination, any capital or additional collateral contributed by the related borrower at the time the mortgage loan (and as part of the modification thereto) became an AB modified loan plus (z) any other escrows or reserves (in addition to any amounts set forth in the immediately preceding clause (y) and solely to the extent not reflected or taken into account in the calculation of any related Appraisal Reduction Amount) held by the lender with respect to the mortgage loan as of the date of such determination. A “Cumulative Appraisal Reduction Amount” with respect to any mortgage loan will be the sum of any Appraisal Reduction Amount and any Collateral Deficiency Amount. Appraisal Reduction Amounts will affect the amount of debt service advances in respect of the related mortgage loan. Additionally, Cumulative Appraisal Reduction Amounts will be taken into account in the determination of the identity of the Class whose majority constitutes the “majority controlling class certificateholder” and is entitled to appoint the directing certificateholder. |
Clean-Up Call and Exchange Termination: | On each Distribution Date occurring after the aggregate unpaid principal balance of the pool of mortgage loans is less than 1.0% of the principal balance of the mortgage loans as of the cut-off date (solely for the purposes of this calculation, if such right is being exercised after the distribution date in February 2030 and any of the Park Tower at Transbay mortgage loan or the Southern CVS Portfolio mortgage loan is still an asset of the issuing entity, then such mortgage loan will be excluded from the then-aggregate principal balance of the pool of mortgage loans and from the initial pool balance), certain specified persons will have the option to purchase all of the remaining mortgage loans (and the trust’s interest in all property acquired through exercise of remedies in respect of any mortgage loan) at the price specified in the Preliminary Prospectus. Exercise of the option will terminate the trust and retire the then-outstanding Certificates. If the aggregate Certificate Balances of each of the Class A-1, A-2, A-3, A-SB, A-4, A-5, A-S, B, C, D and E Certificates have been reduced to zero, the trust may also be terminated in connection with an exchange of all the then-outstanding Certificates (other than the Class V and Class R Certificates and the RR Interest) for the mortgage loans and REO properties then remaining in the issuing entity, subject to payment of a price specified in the Preliminary Prospectus, but all of the holders of those outstanding Classes (other than the Class V and Class R Certificates and the RR Interest) of Certificates would have to voluntarily participate in the exchange. |
Liquidation Loan Waterfall: | Following the liquidation of any mortgage loan or mortgaged property, the net liquidation proceeds generally will be applied (after reimbursement of advances and certain trust fund expenses), first, as a recovery of accrued interest, other than delinquent interest that was not advanced as a result of Appraisal Reduction Amounts, second, as a recovery of principal until all principal has been recovered, and then as a recovery of delinquent interest that was not advanced as a result of Appraisal Reduction Amounts. Please see “Description of the Certificates—Distributions—Application Priority of Mortgage Loan Collections or Whole Loan Collections” in the Preliminary Prospectus. |
Control Eligible Certificates: | The Class F, G and H Certificates. |
Directing Certificateholder/ Controlling Class: | A directing certificateholder may be appointed by the “majority controlling class certificateholder”, which will be the holder(s) of a majority of the Controlling Class. The “Controlling Class” will be, as of any time of determination, the most subordinate Class of Control Eligible Certificates then-outstanding that has an aggregate Certificate Balance (as notionally reduced by any Cumulative Appraisal Reduction Amounts allocable to such Class) at least equal to 25% of the initial Certificate Balance of that Class; provided, however, that if at any time the Certificate Balances of the Certificates other than the Control Eligible Certificates and the RR Interest have been reduced to zero as a result of principal payments on the Mortgage Loans, then the Controlling Class will be the most subordinate Class of Control Eligible Certificates that has a Certificate Balance greater than zero without regard to any Cumulative Appraisal Reduction Amounts. The Controlling Class as of the Closing Date will be the Class H Certificates. |
THE INFORMATION IN THIS STRUCTURAL AND COLLATERAL TERM SHEET IS NOT COMPLETE AND MAY BE AMENDED PRIOR TO THE TIME OF SALE. THIS TERM SHEET IS NOT AN OFFER TO SELL THESE SECURITIES AND IT IS NOT A SOLICITATION OF AN OFFER TO BUY THESE SECURITIES IN ANY JURISDICTION WHERE THE OFFER OR SALE IS NOT PERMITTED.
24
| BANK 2020-BNK25 | Certain Terms and Conditions |
Control and Consultation/
Replacement of Special Servicer by Directing Certificateholder: | The rights of various parties to replace the Special Servicer and approve or consult with respect to major actions of the Special Servicer will vary according to defined periods. A “Control Termination Event” will occur when the Class F Certificates have a Certificate Balance (taking into account the application of any Cumulative Appraisal Reduction Amounts to notionally reduce the Certificate Balance of such Class) of less than 25% of the initial Certificate Balance of that Class; provided, that a Control Termination Event will not be deemed continuing in the event that the Certificate Balances of the Certificates other than the Control Eligible Certificates and the RR Interest have been reduced to zero as a result of principal payments on the Mortgage Loans. A “Consultation Termination Event” will occur when there is no Class of Control Eligible Certificates that has a then-outstanding Certificate Balance at least equal to 25% of the initial Certificate Balance of that Class, in each case, without regard to the application of any Cumulative Appraisal Reduction Amounts; provided, however, that a Consultation Termination Event will not be deemed continuing in the event that the Certificate Balances of the Certificates other than the Control Eligible Certificates and the RR Interest have been reduced to zero as a result of principal payments on the Mortgage Loans. If no Control Termination Event has occurred and is continuing, except with respect to the Excluded Loans (as defined below) with respect to the directing certificateholder (i) the directing certificateholder will be entitled to grant or withhold approval of asset status reports prepared, and material servicing actions proposed, by the Special Servicer, and (ii) the directing certificateholder will be entitled to terminate and replace the Special Servicer with or without cause, and appoint itself or another person as the successor special servicer. It will be a condition to such appointment that Fitch, KBRA and S&P (and any rating agency rating any securities backed by any pari passu companion loan(s) serviced under this transaction) confirm that the appointment would not result in a qualification, downgrade or withdrawal of any of their then-current ratings of Certificates (and any certificates backed by any pari passu companion loan(s) serviced under this transaction). If a Control Termination Event has occurred and is continuing but no Consultation Termination Event has occurred and is continuing, the Special Servicer will be required to consult with the directing certificateholder (other than with respect to Excluded Loans as to such party) and the Operating Advisor in connection with asset status reports and material special servicing actions. If a Consultation Termination Event has occurred and is continuing, the Special Servicer must seek to consult with the Operating Advisor in connection with asset status reports and material special servicing actions, and, in general, no directing certificateholder will be recognized or have any right to terminate the Special Servicer or approve, direct or consult with respect to servicing matters. With respect to each serviced whole loan, the rights of the directing certificateholder described above will be subject to the consultation rights of the holders of the related pari passu companion loans. Those consultation rights will generally extend to asset status reports and material special servicing actions involving the related whole loan, will be as set forth in the related intercreditor agreement, and will be in addition to the rights of the directing certificateholder in this transaction described above. With respect to each non-serviced whole loan, the applicable servicing agreement for the related controlling pari passu companion loan(s) generally grants (or will grant) the directing certificateholder under the related securitization control rights that may include the right to approve or disapprove various material servicing actions involving the related whole loan. The directing certificateholder for this securitization (so long as no Consultation Termination Event has occurred and is occurring) generally will nonetheless have the right to be consulted on a non-binding basis with respect to such actions. For purposes of the servicing of any such whole loan contemplated by this paragraph, the occurrence and continuance of a Control Termination Event or Consultation Termination Event under this securitization will not limit the control or other rights of the directing certificateholder (or equivalent) under the securitization of the related controlling pari passu companion loan(s). The control rights and consent and consultation rights described in the preceding paragraphs are subject to various limitations, conditions and exceptions as described in the Preliminary Prospectus. Notwithstanding any contrary description set forth above, in the event that, with respect to any mortgage loan, the majority controlling class certificateholder or the directing certificateholder is a Borrower Party, the majority controlling class certificateholder and the directing certificateholder will have no right to receive asset status reports or such other information as may be specified in the BANK 2020-BNK25 pooling and servicing agreement, to grant or withhold approval of, or consult with respect to, asset status reports prepared, and material servicing |
THE INFORMATION IN THIS STRUCTURAL AND COLLATERAL TERM SHEET IS NOT COMPLETE AND MAY BE AMENDED PRIOR TO THE TIME OF SALE. THIS TERM SHEET IS NOT AN OFFER TO SELL THESE SECURITIES AND IT IS NOT A SOLICITATION OF AN OFFER TO BUY THESE SECURITIES IN ANY JURISDICTION WHERE THE OFFER OR SALE IS NOT PERMITTED.
25
| BANK 2020-BNK25 | Certain Terms and Conditions |
| actions proposed, by the Special Servicer, with respect to such mortgage loan, and such mortgage loan will be referred to as an “Excluded Loan” as to such party. In addition, notwithstanding any contrary description set forth above, in the event that, with respect to any mortgage loan, a controlling class certificateholder is a Borrower Party, such controlling class certificateholder will have no right to receive asset status reports or such other information as may be specified in the BANK 2020-BNK25 pooling and servicing agreement with respect to such mortgage loan. “Borrower Party” means a borrower, a mortgagor or a manager of a mortgaged property, an Accelerated Mezzanine Loan Lender, or any Borrower Party Affiliate. “Accelerated Mezzanine Loan Lender” means a mezzanine lender under a mezzanine loan that has been accelerated or as to which foreclosure or enforcement proceedings have been commenced against the equity collateral pledged to secure such mezzanine loan. “Borrower Party Affiliate” means, with respect to a borrower, a mortgagor, a manager of a Mortgaged Property or an Accelerated Mezzanine Loan Lender, (x) any other person controlling or controlled by or under common control with such borrower, mortgagor, manager or Accelerated Mezzanine Loan Lender, as applicable, or (y) any other person owning, directly or indirectly, 25% or more of the beneficial interests in such borrower, mortgagor, manager or Accelerated Mezzanine Loan Lender. With respect to a mortgage loan secured by a residential cooperative property, a person will not be considered a “Borrower Party” solely by reason of such person holding one or more cooperative unit loans that are secured by direct equity interests in the related borrower or owning one or more residential cooperative units comprising the related mortgaged property as a result of any foreclosure, transfer in lieu of foreclosure or other exercise of remedies with respect to any such unit loan(s). |
Risk Retention Consultation Party: | A risk retention consultation party may be appointed by the holder or holders of more than 50% of the RR Interest, by Certificate Balance. The majority RR Interest holder will have a continuing right to appoint, remove or replace the risk retention consultation party in its sole discretion. This right may be exercised at any time and from time to time. Except with respect to an Excluded Loan as to such party, the risk retention consultation party will be entitled to consult with each Special Servicer, upon request of the risk retention consultation party, with respect to certain material servicing actions proposed by such Special Servicer. |
Replacement of Special Servicer by General Vote of Certificateholders: | If a Control Termination Event has occurred and is continuing, either Special Servicer may be removed and replaced without cause upon the affirmative direction of certificate owners holding not less than 66-2/3% of a certificateholder quorum, following a proposal from certificate owners holding not less than 25% of the appraisal-reduced voting rights of all Principal Balance Certificates other than the RR Interest. The certificateholders who initiate a vote on a termination and replacement of a Special Servicer without cause must cause Fitch, KBRA and S&P to confirm the then-current ratings of the Certificates (or decline to review the matter) and cause the payment of the fees and expenses incurred in the replacement. If no Control Termination Event has occurred and is continuing, either Special Servicer may be replaced by the directing certificateholder, subject to Fitch, KBRA and S&P (and any rating agency rating any securities backed by any pari passu companion loan(s) serviced under this transaction) confirming the then-current ratings of the Certificates (and any certificates backed by any pari passu companion loans serviced under this transaction) or declining to review the matter. |
Excluded Special Servicer: | In the event that, with respect to any mortgage loan, a Special Servicer is a Borrower Party, such Special Servicer will be required to resign as special servicer of such mortgage loan (referred to as an “excluded special servicer loan”). If no Control Termination Event has occurred and is continuing, the directing certificateholder will be entitled to appoint (and may replace with or without cause) a separate special servicer that is not a Borrower Party (referred to as an “excluded special servicer”) with respect to such excluded special servicer loan unless such excluded special servicer loan is also an excluded loan. Otherwise, upon resignation of the applicable Special Servicer with respect to an excluded special servicer loan, such resigning Special Servicer will be required to use reasonable efforts to appoint the excluded special servicer. |
Appraisal Remedy: | If the Class of Certificates comprising the Controlling Class loses its status as Controlling Class because of the application of an Appraisal Reduction Amount or Collateral Deficiency Amount, the holders of a majority of the voting rights of such Class may require the applicable Special Servicer to order a second appraisal for any mortgage loan in respect of which an Appraisal Reduction Amount or Collateral Deficiency Amount has been applied. Such Special Servicer must thereafter determine whether, based on its assessment of such second appraisal, any recalculation of the Appraisal Reduction Amount or Collateral Deficiency Amount is warranted, and if so warranted, the Special Servicer will recalculate such Appraisal Reduction Amount or Collateral Deficiency Amount. Such Class will not be able to exercise any direction, control, consent and/or similar rights of the Controlling Class unless and until reinstated as the Controlling Class through such determination; and pending such determination, the rights of the Controlling |
THE INFORMATION IN THIS STRUCTURAL AND COLLATERAL TERM SHEET IS NOT COMPLETE AND MAY BE AMENDED PRIOR TO THE TIME OF SALE. THIS TERM SHEET IS NOT AN OFFER TO SELL THESE SECURITIES AND IT IS NOT A SOLICITATION OF AN OFFER TO BUY THESE SECURITIES IN ANY JURISDICTION WHERE THE OFFER OR SALE IS NOT PERMITTED.
26
| BANK 2020-BNK25 | Certain Terms and Conditions |
| Class will be exercised by the Control Eligible Certificates, if any, that would be the Controlling Class taking into account the subject appraisal reduction amount. |
Sale of Defaulted Assets: | There will be no “fair value” purchase option. Instead, the BANK 2020-BNK25 pooling and servicing agreement will authorize the Special Servicer to sell defaulted mortgage loans serviced by such Special Servicer to the highest bidder in a manner generally similar to sales of REO properties. The sale of a defaulted loan (other than a non-serviced whole loan) for less than par plus accrued interest and certain other fees and expenses owed on the loan will be subject to consent or consultation rights of the directing certificateholder and/or Operating Advisor, as described in the Preliminary Prospectus. Generally speaking, the holder of a pari passu companion loan will have consent and/or consultation rights, as described in the Preliminary Prospectus. If the subject whole loan includes one or more subordinate companion loans, those subordinate companion loans may be included in such sale as well. With respect to any serviced whole loan, if such whole loan becomes a defaulted loan under the BANK 2020-BNK25 pooling and servicing agreement, the Special Servicer will generally be required to sell both the mortgage loan and the related pari passu companion loan(s) as a single whole loan. If the subject whole loan includes one or more subordinate companion loans, those subordinate companion loans may be included in such sale as well. With respect to each non-serviced whole loan, the applicable servicing agreement governing the servicing of such whole loan generally will provide that, if the related pari passu companion loan(s) serviced under such agreement become a defaulted loan under such servicing agreement, then the related special servicer may offer to sell to any person (or may offer to purchase) for cash such whole loan during such time as such applicable pari passu companion loan(s) constitutes a defaulted loan under such servicing agreement. Generally speaking, in connection with any such sale, the related special servicer is required to sell both the mortgage loan and the related pari passu companion loan(s) as a whole loan. The directing certificateholder for this securitization generally will have consent and/or consultation rights as the holder of an interest in the related mortgage loan, as described in the Preliminary Prospectus. If the subject whole loan includes one or more subordinate companion loans, those subordinate companion loans may be included in such sale as well. The procedures for the sale of any whole loan that becomes a defaulted whole loan, and any associated consultation rights, are subject to various limitations, conditions and exceptions as described in the Preliminary Prospectus. |
“As-Is” Appraisals: | Appraisals must be conducted on an “as-is” basis, and must be no more than 12 months old, for purposes of determining Appraisal Reduction Amounts and market value in connection with REO sales. Required appraisals may consist of updates of prior appraisals. Internal valuations by the applicable Special Servicer are permitted if the principal balance of a mortgage loan is less than $2,000,000. |
Operating Advisor: | The Operating Advisor will perform certain review duties if a Control Termination Event has occurred and is continuing, which will generally include a limited annual review of, and the delivery of a report regarding, certain actions of each Special Servicer with respect to the resolution and/or liquidation of specially serviced loans to the Certificate Administrator. The review and report generally will be based on any asset status reports and additional information delivered to the Operating Advisor by each Special Servicer. In addition, if a Control Termination Event has occurred and is continuing, each Special Servicer must seek to consult with the Operating Advisor (in addition to the directing certificateholder if no Consultation Termination Event has occurred and is continuing) in connection with material special servicing actions with respect to specially serviced loans serviced by such Special Servicer. Furthermore, under certain circumstances, but only if a Consultation Termination Event has occurred and is continuing, the Operating Advisor may recommend the replacement of a Special Servicer, in which case the Certificate Administrator will deliver notice of such recommendation to the certificateholders, and certificateholders with specified percentages of the voting rights may direct the replacement of such Special Servicer at their expense. If a Consultation Termination Event has occurred and is continuing, the Operating Advisor may be removed and replaced without cause upon the affirmative direction of certificate owners holding at least 75% of the appraisal-reduced voting rights of all Certificates (other than the RR Interest), following a proposal from certificate owners holding not less than 25% of the appraisal-reduced voting rights of all Certificates (other than the RR Interest). The certificateholders who initiate a vote on a termination and replacement of the Operating Advisor without cause must cause Fitch, KBRA and S&P to confirm the then-current ratings of the Certificates (or decline to review the matter) and cause the payment of the fees and expenses incurred in the replacement. |
THE INFORMATION IN THIS STRUCTURAL AND COLLATERAL TERM SHEET IS NOT COMPLETE AND MAY BE AMENDED PRIOR TO THE TIME OF SALE. THIS TERM SHEET IS NOT AN OFFER TO SELL THESE SECURITIES AND IT IS NOT A SOLICITATION OF AN OFFER TO BUY THESE SECURITIES IN ANY JURISDICTION WHERE THE OFFER OR SALE IS NOT PERMITTED.
27
| BANK 2020-BNK25 | Certain Terms and Conditions |
| The Operating Advisor generally may be discharged from its duties if and when the Class A-1, A-2, A-3, A-SB, A-4, A-5, A-S, B, C, D and E Certificates are retired. |
Asset Representations Reviewer: | The Asset Representations Reviewer will be required to review certain delinquent mortgage loans after a specified delinquency threshold has been exceeded (an “Asset Review Trigger”) and the required percentage of certificateholders vote to direct a review of such delinquent loans. An Asset Review Trigger will occur when either (1) mortgage loans with an aggregate outstanding principal balance of 25.0% or more of the aggregate outstanding principal balance of all of the mortgage loans (including any REO loans (or a portion of any REO loan in the case of a whole loan)) held by the issuing entity as of the end of the applicable collection period are delinquent loans or (2)(A) prior to and including the second anniversary of the Closing Date, at least 10 mortgage loans are delinquent loans as of the end of the applicable collection period and the outstanding principal balance of such delinquent loans in the aggregate constitutes at least 15.0% of the aggregate outstanding principal balance of all of the mortgage loans (including any REO loans (or a portion of any REO loan in the case of a whole loan)) held by the issuing entity as of the end of the applicable collection period, or (B) after the second anniversary of the Closing Date, at least 15 mortgage loans are delinquent loans as of the end of the applicable collection period and the outstanding principal balance of such delinquent loans in the aggregate constitutes at least 20.0% of the aggregate outstanding principal balance of all of the mortgage loans (including any REO loans (or a portion of any REO loan in the case of a whole loan)) held by the issuing entity as of the end of the applicable collection period. See “Pooling and Servicing Agreement—The Asset Representations Reviewer—Asset Review” in the Preliminary Prospectus. The Asset Representations Reviewer may be terminated and replaced without cause. Upon (i) the written direction of certificateholders evidencing not less than 25% of the voting rights (without regard to the application of any Cumulative Appraisal Reduction Amounts) requesting a vote to terminate and replace the Asset Representations Reviewer with a proposed successor Asset Representations Reviewer that is an eligible asset representations reviewer, and (ii) payment by such holders to the certificate administrator of the reasonable fees and expenses to be incurred by the certificate administrator in connection with administering such vote, the certificate administrator will promptly provide notice to all certificateholders and the Asset Representations Reviewer of such request by posting such notice on its internet website, and by mailing such notice to all certificateholders and the Asset Representations Reviewer. Upon the written direction of certificateholders evidencing at least 75% of a certificateholder quorum (without regard to the application of any Cumulative Appraisal Reduction Amounts), the Trustee will terminate all of the rights and obligations of the Asset Representations Reviewer under the BANK 2020-BNK25 pooling and servicing agreement by written notice to the Asset Representations Reviewer, and the proposed successor Asset Representations Reviewer will be appointed. See “Pooling and Servicing Agreement—The Asset Representations Reviewer” in the Preliminary Prospectus. |
Dispute Resolution Provisions: | The mortgage loan sellers will be subject to the dispute resolution provisions set forth in the BANK 2020-BNK25 pooling and servicing agreement to the extent those provisions are triggered with respect to any mortgage loan sold to the depositor by a mortgage loan seller and such mortgage loan seller will be obligated under the related mortgage loan purchase agreement to comply with all applicable provisions and to take part in any mediation or arbitration proceedings that may result. Generally, in the event that a Repurchase Request (as defined in the Preliminary Prospectus) is not “Resolved” (as defined below) within 180 days after the related mortgage loan seller receives such Repurchase Request, then the enforcing servicer will be required to send a notice to the “Initial Requesting Certificateholder” (if any) and the Certificate Administrator indicating the enforcing servicer’s intended course of action with respect to the Repurchase Request. If (a) the enforcing servicer’s intended course of action with respect to the Repurchase Request does not involve pursuing further action to exercise rights against the related mortgage loan seller with respect to the Repurchase Request and the Initial Requesting Certificateholder, if any, or any other certificateholder or certificate owner wishes to exercise its right to refer the matter to mediation (including non-binding arbitration) or arbitration, or (b) the enforcing servicer’s intended course of action is to pursue further action to exercise rights against the related mortgage loan seller with respect to the Repurchase Request but the Initial Requesting Certificateholder, if any, or any other certificateholder or certificate owner does not agree with the dispute resolution method selected by the enforcing servicer, then the Initial Requesting Certificateholder, if any, or such other certificateholder or certificate owner may deliver a written notice to the applicable Special Servicer indicating its intent to exercise its right to refer the matter to either mediation or arbitration. “Resolved” means, with respect to a Repurchase Request, (i) that the related Material Defect has been cured, (ii) the related mortgage loan has been repurchased in accordance with the related mortgage loan purchase agreement, (iii) a mortgage loan has been substituted for the related mortgage loan in accordance with the related mortgage loan purchase agreement, (iv) the |
THE INFORMATION IN THIS STRUCTURAL AND COLLATERAL TERM SHEET IS NOT COMPLETE AND MAY BE AMENDED PRIOR TO THE TIME OF SALE. THIS TERM SHEET IS NOT AN OFFER TO SELL THESE SECURITIES AND IT IS NOT A SOLICITATION OF AN OFFER TO BUY THESE SECURITIES IN ANY JURISDICTION WHERE THE OFFER OR SALE IS NOT PERMITTED.
28
| BANK 2020-BNK25 | Certain Terms and Conditions |
| applicable mortgage loan seller has made a Loss of Value Payment (as defined in the Preliminary Prospectus), (v) a contractually binding agreement is entered into between the enforcing servicer, on behalf of the issuing entity, and the related mortgage loan seller that settles the related mortgage loan seller’s obligations under the related mortgage loan purchase agreement, or (vi) the related mortgage loan is no longer property of the issuing entity as a result of a sale or other disposition in accordance with the BANK 2020-BNK25 pooling and servicing agreement. See “Pooling and Servicing Agreement—Dispute Resolution Provisions” in the Preliminary Prospectus. |
Investor Communications: | The certificate administrator is required to include on any Form 10–D any request received from a certificateholder to communicate with other certificateholders related to certificateholders exercising their rights under the terms of the BANK 2020-BNK25 pooling and servicing agreement. Any certificateholder wishing to communicate with other certificateholders regarding the exercise of its rights under the terms of the BANK 2020-BNK25 pooling and servicing agreement will be able to deliver a written request signed by an authorized representative of the requesting investor to the certificate administrator. |
Certain Fee Offsets: | If a workout fee is earned by a Special Servicer following a loan default with respect to any mortgage loan that it services, then certain limitations will apply based on modification fees paid by the borrower. The modification fee generally must not exceed 1% of the principal balance of the loan as modified in any 12-month period. In addition, if the loan re-defaults, any subsequent workout fee on that loan must be reduced by a portion of the modification fees paid by the borrower in the previous 12 months. Likewise, liquidation fees collected in connection with a liquidation or partial liquidation of a mortgage loan must be reduced by a portion of the modification fees paid by the borrower in the previous 12 months. |
Deal Website: | The Certificate Administrator will be required to maintain a deal website, which will include, among other items: (a) summaries of asset status reports prepared by each Special Servicer, (b) inspection reports, (c) appraisals, (d) various “special notices” described in the Preliminary Prospectus, (e) the “Investor Q&A Forum”, (f) a voluntary “Investor Registry” and (g) the “Risk Retention Special Notices” tab. Investors may access the deal website following execution of a certification and confidentiality agreement. |
Initial Majority Controlling Class Certificateholder: | It is expected that Ellington Management Group, LLC or its affiliate will be the initial majority controlling class certificateholder. |
Whole Loans: | Each of the mortgaged properties identified above under “IV. Characteristics of the Mortgage Pool—B. Summary of the Whole Loans” secures both a mortgage loan to be included in the trust fund and one or more other mortgage loans that will not be included in the trust fund, each of which will be pari passu or subordinate in right of payment with the mortgage loan included in the trust fund. We refer to each such group of mortgage loans as a “whole loan”. Such “—Summary of the Whole Loans” section includes further information regarding the various notes in each whole loan, the holders of such notes, the lead servicing agreement for each such whole loan, and the applicable master servicer and applicable special servicer under such lead servicing agreement. |
THE INFORMATION IN THIS STRUCTURAL AND COLLATERAL TERM SHEET IS NOT COMPLETE AND MAY BE AMENDED PRIOR TO THE TIME OF SALE. THIS TERM SHEET IS NOT AN OFFER TO SELL THESE SECURITIES AND IT IS NOT A SOLICITATION OF AN OFFER TO BUY THESE SECURITIES IN ANY JURISDICTION WHERE THE OFFER OR SALE IS NOT PERMITTED.
29
Office – CBD | Loan #1 | Cut-off Date Balance: | | $100,000,000 |
550 West 34th Street
New York, New York 10001
| 55 Hudson Yards | Cut-off Date LTV:
U/W NCF DSCR:
U/W NOI Debt Yield: | | 39.4%
3.53x
11.0% |
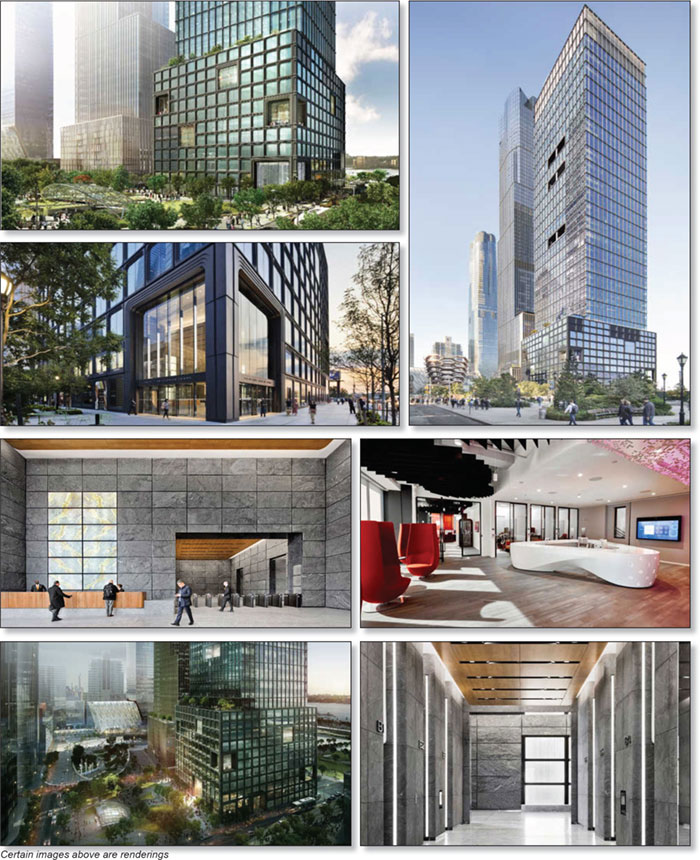
THE INFORMATION IN THIS STRUCTURAL AND COLLATERAL TERM SHEET IS NOT COMPLETE AND MAY BE AMENDED PRIOR TO THE TIME OF SALE. THIS TERM SHEET IS NOT AN OFFER TO SELL THESE SECURITIES AND IT IS NOT A SOLICITATION OF AN OFFER TO BUY THESE SECURITIES IN ANY JURISDICTION WHERE THE OFFER OR SALE IS NOT PERMITTED.
30
Office – CBD | Loan #1 | Cut-off Date Balance: | | $100,000,000 |
550 West 34th Street
New York, New York 10001
| 55 Hudson Yards | Cut-off Date LTV:
U/W NCF DSCR:
U/W NOI Debt Yield: | | 39.4%
3.53x
11.0% |
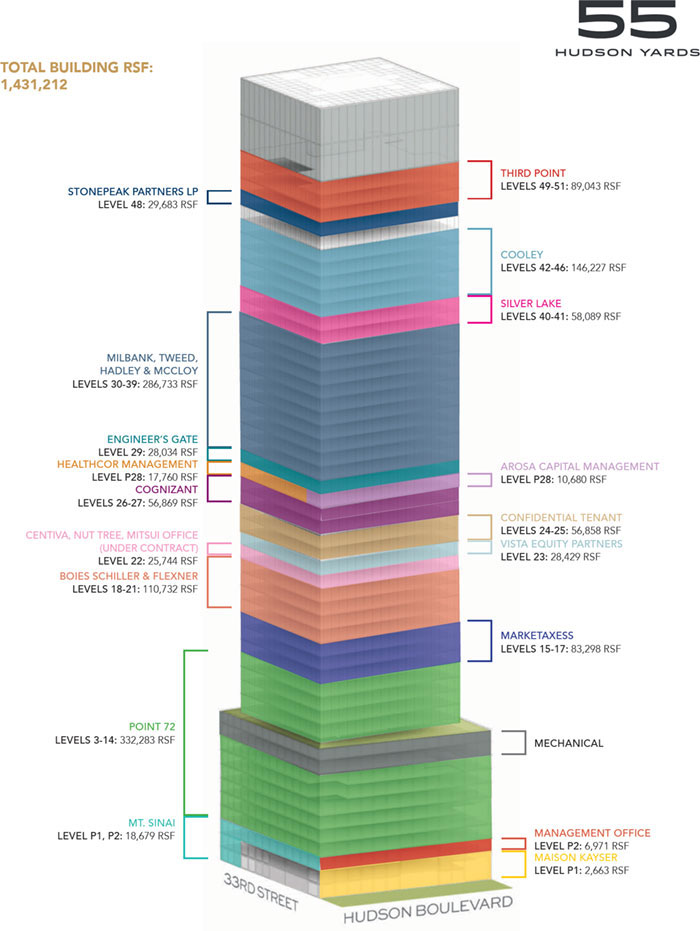
THE INFORMATION IN THIS STRUCTURAL AND COLLATERAL TERM SHEET IS NOT COMPLETE AND MAY BE AMENDED PRIOR TO THE TIME OF SALE. THIS TERM SHEET IS NOT AN OFFER TO SELL THESE SECURITIES AND IT IS NOT A SOLICITATION OF AN OFFER TO BUY THESE SECURITIES IN ANY JURISDICTION WHERE THE OFFER OR SALE IS NOT PERMITTED.
31
Office – CBD | Loan #1 | Cut-off Date Balance: | | $100,000,000 |
550 West 34th Street
New York, New York 10001
| 55 Hudson Yards | Cut-off Date LTV:
U/W NCF DSCR:
U/W NOI Debt Yield: | | 39.4%
3.53x
11.0% |
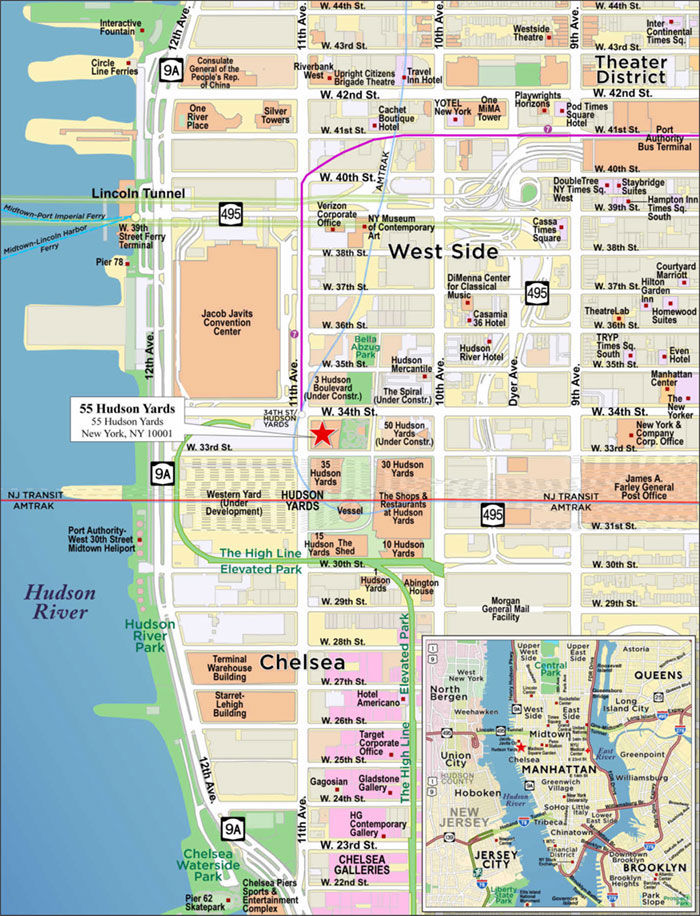
THE INFORMATION IN THIS STRUCTURAL AND COLLATERAL TERM SHEET IS NOT COMPLETE AND MAY BE AMENDED PRIOR TO THE TIME OF SALE. THIS TERM SHEET IS NOT AN OFFER TO SELL THESE SECURITIES AND IT IS NOT A SOLICITATION OF AN OFFER TO BUY THESE SECURITIES IN ANY JURISDICTION WHERE THE OFFER OR SALE IS NOT PERMITTED.
32
Mortgage Loan Information | | Mortgaged Property Information |
Mortgage Loan Seller: | Wells Fargo Bank, National Association; Morgan Stanley Mortgage Capital Holdings LLC | | Single Asset/Portfolio: | Single Asset |
Credit Assessment (Fitch/KBRA/S&P): | BBB-sf/A-(sf)/BBB(sf) | | Property Type – Subtype: | Office – CBD |
Original Principal Balance(1): | $100,000,000 | | Location: | New York, NY |
Cut-off Date Balance(1): | $100,000,000 | | Size: | 1,431,212 SF |
% of Initial Pool Balance: | 6.1% | | Cut-off Date Balance Per SF(1): | $660.28 |
Loan Purpose: | Recapitalization | | Maturity Date Balance Per SF(1): | $660.28 |
Borrower Sponsors: | Mitsui Fudosan America, Inc.; The Related Companies, L.P.; OP Olympic Capital Corp (US), Inc. | | Year Built/Renovated: | 2018/NAP |
Guarantor(2): | One Hudson Yards Owner LLC | | Title Vesting: | Fee |
Mortgage Rate: | 2.9500% | | Property Manager: | Related Hudson Yards Manager LLC (borrower-related) |
Note Date: | November 21, 2019 | | Current Occupancy (As of): | 97.3% (11/19/2019) |
Seasoning: | 2 months | | YE 2018 Occupancy(6): | NAP |
Maturity Date: | December 6, 2029 | | YE 2017 Occupancy(6): | NAP |
IO Period: | 120 months | | YE 2016 Occupancy(6): | NAP |
Loan Term (Original): | 120 months | | YE 2015 Occupancy(6): | NAP |
Amortization Term (Original): | NAP | | As-Is Appraised Value: | $2,400,000,000 |
Loan Amortization Type: | Interest-only, Balloon | | As-Is Appraised Value Per SF: | $1,676.90 |
Call Protection(3): | L(26),GRTR 1% or YM or D(87),O(7) | | As-Is Appraisal Valuation Date: | October 15, 2019 |
Lockbox Type: | Hard/Springing Cash Management | | Underwriting and Financial Information |
Additional Debt(1)(4): | Yes | | TTM NOI(6): | NAP |
Additional Debt Type
(Balance) (1)(4): | Pari Passu ($845,000,000) /Subordinate ($300,000,000) | | YE 2018 NOI(6): | NAP |
| | | YE 2017 NOI(6): | NAP |
| | | YE 2016 NOI(6): | NAP |
| | | U/W Revenues: | $149,111,008 |
| | | U/W Expenses: | $45,210,677 |
Escrows and Reserves(5) | | U/W NOI: | $103,900,331 |
| Initial | Monthly | Cap | | U/W NCF: | $100,036,059 |
Taxes | $0 | Springing | NAP | | U/W DSCR based on NOI/NCF(1): | 3.67x / 3.53x |
Insurance | $0 | Springing | NAP | | U/W Debt Yield based on NOI/NCF(1): | 11.0% / 10.6% |
Replacement Reserve | $0 | Springing | NAP | | U/W Debt Yield at Maturity based on NOI/NCF(1): | 11.0% / 10.6% |
TI/LC Reserve | $0 | Springing | NAP | | Cut-off Date LTV Ratio(1): | 39.4% |
Tenant Specific TI/LC Reserve | $34,260,641 | $0 | NAP | | LTV Ratio at Maturity(1): | 39.4% |
Free Rent Reserve | $11,482,346 | $0 | NAP | | | |
Milbank Lease Landlord Delay Dispute Reserve | $11,000,000 | $0 | NAP | | | |
MarketAxess Lease Takeover Reserve | $4,474,631 | $0 | NAP | | | |
| | | | | | |
Sources and Uses |
Sources | | | | | Uses | | | |
Original whole loan amount | $1,245,000,000 | | 100.0% | | Upfront Reserves | $61,217,618 | | 4.9% |
| | | | | Closing costs | 46,767,347 | | 3.8 |
| | | | | Return of Equity(7) | 1,137,015,035 | | 91.3 |
Total Sources | $1,245,000,000 | | 100.0% | | Total Uses | $1,245,000,000 | | 100.0% |
(1) | The 55 Hudson Yards Mortgage Loan (as defined below) is part of the 55 Hudson Yards Whole Loan (as defined below) with an original aggregate principal balance of $1,245,000,000. The Cut-off Date Balance Per SF, Maturity Date Balance Per SF, U/W DSCR based on NOI/NCF, U/W Debt Yield at Maturity based on NOI/NCF, Cut-off Date LTV Ratio and LTV Ratio at Maturity numbers presented above are based on the 55 Hudson Yards Senior Loan (as defined below). The Cut-off Date Balance Per SF and Maturity Date Balance Per SF, U/W Debt Yield based on NOI, U/W Debt Yield at Maturity based on NOI, U/W DSCR based on NCF, Cut-off Date LTV Ratio and Maturity Date LTV Ratio based upon the 55 Hudson Yards Whole Loan (as defined below) are $870, $870, 8.3%, 8.3%, 2.68x, 51.9% and 51.9%, respectively. |
(2) | One Hudson Yards Owner LLC is the single purpose entity borrower. The 55 Hudson Yards Whole Loan is recourse to the single purpose entity borrower. There is no separate non-recourse carveout guarantor or environmental indemnitor for the 55 Hudson Yards Whole Loan. |
THE INFORMATION IN THIS STRUCTURAL AND COLLATERAL TERM SHEET IS NOT COMPLETE AND MAY BE AMENDED PRIOR TO THE TIME OF SALE. THIS TERM SHEET IS NOT AN OFFER TO SELL THESE SECURITIES AND IT IS NOT A SOLICITATION OF AN OFFER TO BUY THESE SECURITIES IN ANY JURISDICTION WHERE THE OFFER OR SALE IS NOT PERMITTED.
33
Office – CBD | Loan #1 | Cut-off Date Balance: | | $100,000,000 |
550 West 34th Street
New York, New York 10001
| 55 Hudson Yards | Cut-off Date LTV:
U/W NCF DSCR:
U/W NOI Debt Yield: | | 39.4%
3.53x
11.0% |
(3) | Defeasance or prepayment of the 55 Hudson Yards Whole Loan is permitted at any time after the earlier to occur of (a) the end of the two-year period commencing on the closing date of the securitization of the last promissory note representing a portion of the 55 Hudson Yards Whole Loan to be securitized and (b) November 21, 2022. The assumed defeasance lockout period of 26 payments is based on the closing date of this transaction in February 2020. |
(4) | See “The Mortgage Loan” and “Subordinate and Mezzanine Indebtedness” below for further discussion of additional debt. |
(5) | See “Escrows” below for further discussion of reserve requirements. |
(6) | Prior historical operating statements and occupancy are not applicable, as the 55 Hudson Yards Property (as defined below) was constructed in 2018 and tenants began taking occupancy in 2019. |
(7) | Prior to the origination of the 55 Hudson Yards Whole Loan, the 55 Hudson Yards Property was unencumbered by debt. The borrower sponsor’s cost basis to date is approximately $1.31 billion. |
The Mortgage Loan. The mortgage loan (the “55 Hudson Yards Mortgage Loan”) is part of a whole loan (the “55 Hudson Yards Whole Loan”) that is evidenced by 33pari passusenior promissory notes in the aggregate original principal amount of $945,000,000 (collectively, the “55 Hudson Yards Senior Loan”) and threepari passusubordinate promissory notes in the aggregate original principal amount of $300,000,000 (collectively, the “55 Hudson Yards Subordinate Companion Loan”). The 55 Hudson Yards Whole Loan was co-originated on November 21, 2019 by Wells Fargo Bank, National Association (“WFB”); DBR Investments Co. Limited (“DBRI”); and Morgan Stanley Bank, N.A. (“MSBNA”). The 55 Hudson Yards Whole Loan is secured by a first priority fee mortgage encumbering an office building located in New York, New York (the “55 Hudson Yards Property”). The 55 Hudson Yards Mortgage Loan is evidenced by the non-controlling promissory notes A-1-C6 (being contributed by WFB) and A-3-C6 (being contributed by Morgan Stanley Mortgage Capital Holdings LLC, an affiliate of MSBNA) in the aggregate original principal amount of $100,000,000. As shown in the “55 Hudson Yards Whole Loan Summary” table below, 21 promissory notes in the original aggregate principal amount of $810,500,000 were contributed to the Hudson Yards 2019-55HY securitization trust. The 55 Hudson Yards Whole Loan is serviced pursuant to the trust and servicing agreement for the Hudson Yards 2019-55HY securitization trust. The 55 Hudson Yards Senior Loanpari passu notes other than those evidencing the 55 Hudson Yards Mortgage Loan are referred to herein as the “55 Hudson Yards Non-ServicedPari Passu Companion Loans”. See “Description of the Mortgage Pool—The Whole Loans—The 55 Hudson Yards Pari Passu-A/B Whole Loan” and “Pooling and Servicing Agreement—Servicing of the Non-Serviced Mortgage Loans”. The proceeds of the 55 Hudson Yards Whole Loan were primarily used to fund upfront reserves, pay closing costs and return equity to the borrower sponsor.
THE INFORMATION IN THIS STRUCTURAL AND COLLATERAL TERM SHEET IS NOT COMPLETE AND MAY BE AMENDED PRIOR TO THE TIME OF SALE. THIS TERM SHEET IS NOT AN OFFER TO SELL THESE SECURITIES AND IT IS NOT A SOLICITATION OF AN OFFER TO BUY THESE SECURITIES IN ANY JURISDICTION WHERE THE OFFER OR SALE IS NOT PERMITTED.
34
Office – CBD | Loan #1 | Cut-off Date Balance: | | $100,000,000 |
550 West 34th Street
New York, New York 10001
| 55 Hudson Yards | Cut-off Date LTV:
U/W NCF DSCR:
U/W NOI Debt Yield: | | 39.4%
3.53x
11.0% |
Note Summary
Notes | Original Balance | Cut-off Date Balance | Note Holder | Controlling Piece |
55 Hudson Yards Senior Loan |
A-1-S1 | $28,350,000 | $28,350,000 | Hudson Yards 2019-55HY | Yes(1) |
A-2-S2 | $9,450,000 | $9,450,000 | Hudson Yards 2019-55HY | Yes(1) |
A-2-S3 | $56,700,000 | $56,700,000 | Hudson Yards 2019-55HY | Yes(1) |
A-3-S1 | $9,450,000 | $9,450,000 | Hudson Yards 2019-55HY | Yes(1) |
A-1-S2 | $28,350,000 | $28,350,000 | Hudson Yards 2019-55HY | Yes(1) |
A-1-S3 | $170,100,000 | $170,100,000 | Hudson Yards 2019-55HY | Yes(1) |
A-2-S1 | $9,450,000 | $9,450,000 | Hudson Yards 2019-55HY | Yes(1) |
A-3-S2 | $9,450,000 | $9,450,000 | Hudson Yards 2019-55HY | Yes(1) |
A-3-S3 | $56,700,000 | $56,700,000 | Hudson Yards 2019-55HY | Yes(1) |
A-1-C1 | $28,350,000 | $28,350,000 | Hudson Yards 2019-55HY | Yes(1) |
A-1-C2 | $28,350,000 | $28,350,000 | Hudson Yards 2019-55HY | Yes(1) |
A-1-C3 | $28,350,000 | $28,350,000 | WFB | No |
A-1-C4 | $28,350,000 | $28,350,000 | WFB | No |
A-1-C5 | $75,000,000 | $75,000,000 | BANK 2019-BNK24 | No |
A-1-C6 | $75,000,000 | $75,000,000 | BANK 2019-BNK25 | No |
A-1-C7 | $54,000,000 | $54,000,000 | WFB | No |
A-1-C8 | $22,800,000 | $22,800,000 | Hudson Yards 2019-55HY | Yes(1) |
A-2-C1 | $9,450,000 | $9,450,000 | Hudson Yards 2019-55HY | Yes(1) |
A-2-C2 | $9,450,000 | $9,450,000 | Hudson Yards 2019-55HY | Yes(1) |
A-2-C3 | $9,450,000 | $9,450,000 | DBRI | No |
A-2-C4 | $9,450,000 | $9,450,000 | DBRI | No |
A-2-C5 | $25,000,000 | $25,000,000 | DBRI | No |
A-2-C6 | $25,000,000 | $25,000,000 | DBRI | No |
A-2-C7 | $18,000,000 | $18,000,000 | DBRI | No |
A-2-C8 | $7,600,000 | $7,600,000 | Hudson Yards 2019-55HY | Yes(1) |
A-3-C1 | $9,450,000 | $9,450,000 | Hudson Yards 2019-55HY | Yes(1) |
A-3-C2 | $9,450,000 | $9,450,000 | Hudson Yards 2019-55HY | Yes(1) |
A-3-C3 | $9,450,000 | $9,450,000 | MSBNA | No |
A-3-C4 | $9,450,000 | $9,450,000 | MSBNA | No |
A-3-C5 | $25,000,000 | $25,000,000 | BANK 2019-BNK24 | No |
A-3-C6 | $25,000,000 | $25,000,000 | BANK 2019-BNK25 | No |
A-3-C7 | $18,000,000 | $18,000,000 | MSBNA | No |
A-3-C8 | $7,600,000 | $7,600,000 | Hudson Yards 2019-55HY | No |
Total (Senior Loan) | $945,000,000 | $945,000,000 | | |
|
55 Hudson Yards Subordinate Companion Loan |
B-1 | $180,000,000 | $180,000,000 | Hudson Yards 2019-55HY | Yes(1)(2) |
B-2 | $60,000,000 | $60,000,000 | Hudson Yards 2019-55HY | Yes(1)(2) |
B-3 | $60,000,000 | $60,000,000 | Hudson Yards 2019-55HY | Yes(1)(2) |
Total (Subordinate Companion Loan) | $300,000,000 | $300,000,000 | | |
Total (Whole Loan) | $1,245,000,000 | $1,245,000,000 | | |
(1) | No single promissory note comprising a part of the whole loan is the related control note; however, the Hudson Yards 2019-55HY securitization trust is the related controlling note holder, and a party designated under the related trust and servicing agreement is entitled to exercise the rights thereof. |
(2) | The 55 Hudson Yards Subordinate Companion Loan is subordinate to the 55 Hudson Yards Senior Loan. |
The Borrower and Borrower Sponsors.The borrower is One Hudson Yards Owner LLC (the “55 Hudson Yards Borrower”), a Delaware limited liability company and single purpose entity with two independent directors. The 55 Hudson Yards Whole Loan is recourse solely to the single purpose entity borrower. There is no separate non-recourse carveout guarantor or environmental indemnitor with respect to the 55 Hudson Yards Whole Loan. Legal counsel to the 55 Hudson Yards Borrower delivered a non-consolidation opinion in connection with the origination of the 55 Hudson Yards Whole Loan.
The 55 Hudson Yards Borrower’s sole member is One Hudson Yards Holdings LLC, which is a joint venture between MFA 55 HY LLC (“Mitsui Member”) and 55 Hudson Yards Member LLC (“Hudson Yards Member”). Mitsui Member is owned by Mitsui Fudosan America, Inc. (“Mitsui”). The managing member and owner of Hudson Yards Member is Hudson Yards Gen-Par, LLC, a joint venture between Related Hudson Yards, LLC (“Related Member”) and Oxford Hudson Yards LLC (“Oxford Member”). Related Member is wholly owned
THE INFORMATION IN THIS STRUCTURAL AND COLLATERAL TERM SHEET IS NOT COMPLETE AND MAY BE AMENDED PRIOR TO THE TIME OF SALE. THIS TERM SHEET IS NOT AN OFFER TO SELL THESE SECURITIES AND IT IS NOT A SOLICITATION OF AN OFFER TO BUY THESE SECURITIES IN ANY JURISDICTION WHERE THE OFFER OR SALE IS NOT PERMITTED.
35
Office – CBD | Loan #1 | Cut-off Date Balance: | | $100,000,000 |
550 West 34th Street
New York, New York 10001
| 55 Hudson Yards | Cut-off Date LTV:
U/W NCF DSCR:
U/W NOI Debt Yield: | | 39.4%
3.53x
11.0% |
by The Related Companies, L.P. (“Related”) and Oxford Member is wholly owned by OP Olympic Capital Corp (US), Inc. (“Oxford”, and together with Mitsui and Related, the “Borrower Sponsor”).
Founded by Stephen M. Ross in 1972, Related is a privately owned, fully integrated and diversified real estate company with experience in development, acquisition, management, finance, marketing and sales. Headquartered in New York City, Related owns and manages a portfolio of assets and has offices and major developments in Boston, Chicago, Los Angeles, San Francisco, South Florida, Washington, D.C. and London. Oxford Properties Group, comprising Oxford and its affiliates, make up the real estate investment arm of OMERS, one of Canada’s largest pension plans. OMERS was established in 1962 as a pension plan for employees of municipal governments, schoolboards, libraries, police and fire services, Children’s Aid Societies, and other local agencies throughout Ontario. The OMERS pension plan has approximately half a million active and retired members and 1,000 participating employers, and is funded by contributions and investment earnings. Oxford Properties Group, comprising Oxford and its affiliates, manages over $58 billion of office, retail, industrial, hotel and multifamily residential assets across the globe, including over 100 million square feet in cities across four continents. Mitsui is the U.S. subsidiary of Japan’s largest real estate company, Mitsui Fudosan Co., Ltd. (“Mitsui Fudosan”). Mitsui is headquartered in New York, and is responsible for Mitsui Fudosan’s real estate investment and development activities in North America. Mitsui’s U.S. portfolio currently includes eight office buildings totaling 5.6 million square feet; 4.7 million square feet of office space under development; 1,300 residential apartments; 5,000 additional apartments under development; 360 condominiums and townhomes under development; and 753 hotel rooms. Mitsui has been active in the United States since the 1970s, and currently owns assets in the New York, Washington, D.C., Boston, Denver, Los Angeles, San Francisco, Seattle and Honolulu metropolitan areas.
One of the borrower sponsors (The Related Companies, L.P.), and/or its affiliates, has sponsored other real estate projects that have been the subject of mortgage loan defaults, foreclosure proceedings and/or deed-in-lieu of foreclosure.
The Property. The 55 Hudson Yards Property is a 1,431,212 square foot, 51-story, Class A office building located within the Hudson Yards development of Manhattan in New York City. Constructed in 2018, the 55 Hudson Yards Property is situated on a 0.9-acre parcel of land with frontage along Eleventh Avenue and Hudson Boulevard between West 34th and West 35th Streets (adjacent to a No. 7 subway station entrance). The building was designed by Kohn Pedersen Fox and architect Kevin Roche, and features a unique façade consisting of matte metal and stepped articulation of the window frames that are defined by aluminum extrusions, castings, and built-up shapes. According to the appraisal, the 55 Hudson Yards Property is currently the shortest skyscraper within phase 1 of the Hudson Yards plan and is known for its distinct construction compared to the remainder of the development. The 55 Hudson Yards Property is LEED Gold certified and has incorporated technology for indoor air quality and a flexible workplace environment.
According to the appraisal, the 55 Hudson Yards Property offers amenities such as a dispatch elevator system, fingerprint access within the office lobby, floor-to-ceiling glass windows, column-free space allowing tenants to maximize the floor plates, terrace overlooking the new Hudson Boulevard Park that wraps around the 10th floor (podium level), and private terraces throughout the office component that were constructed for tenants upon request.
The 55 Hudson Yards Property was 97.3% leased to 20 tenants as of November 19, 2019. Three tenants (Milbank, Cooley and Boies Schiller) comprising approximately 38.0% of net rentable area and 35.9% of underwritten base rent are ranked within the top 100 law firms by gross revenue in the United States, according to a third party legal publication.
Major Tenants.
Point72 (332,283 square feet, 23.2% net rentable area, 21.9% underwritten base rent, April 30, 2034 expiration). Point72 Asset Management (“Point72”) is an American hedge fund founded by Steven A. Cohen. The firm has over 1,400 employees across 10 global offices. The 55 Hudson Yards Property serves as Point72’s New York headquarters, after consolidating from 11 floors in two buildings previously occupied at 510 and 330 Madison Avenue. Point72 currently occupies floors 3-14 at the 55 Hudson Yards Property but is not yet paying full rent on all of its space. All outstanding gap rent and free rent through March 2020, in the amount of $987,380, was reserved at the time of origination of the 55 Hudson Yards Whole Loan. The rent commencement dates are as follows: April 16, 2019 for floors 5-14; December 1, 2019 for floor 4; and May 1, 2020 for floor 3 (there is no assurance that Point72 will begin paying rent by the estimated dates noted herein). Effective as of the 10th anniversary of the initial rent commencement date (which was April 16, 2019), and upon 15 months’ prior notice, the tenant has a one-time option to terminate either (i) the entirety of its leased premises or (ii) any one or more contiguous floors starting at either the highest or lowest office floor of the largest contiguous block of office floors then-leased by the tenant, such termination subject to a fee of the unamortized portion of allowances, commissions and free rent with respect to the terminated premises (calculated on a straight line basis over the period commencing on the rent commencement date and ending on the expiration date of the lease and bearing a 6% interest rate per annum). Point72 has either (i) two renewal options of 5-years each or (ii) one 10-year renewal option, each with 15 months’ prior notice and at the fair market rental rate, following its April 2034 lease expiration. Point 72 has signed a sublease for the entire 3rd floor (31,246 square feet) of its space to Elite World Group, LLC, with an expected sublease commencement date of February 2020, a 5-year term and an annual rate of $90.00 PSF. Point72 also subleases 11,844 square feet of its space to Light Sky Macro LP, with a sublease expiration of August 2029 and a rate of $99.00 PSF.
Milbank, Tweed, Hadley & McCloy (287,333 square feet, 20.1% net rentable area, 17.9% underwritten base rent, March 31, 2034 expiration).Milbank,Tweed Hadley & McCloy (“Milbank”) is an international law firm ranked within the top 100 law firms by gross revenue according to a third party legal publication, and is headquartered at the 55 Hudson Yards Property. The firm also has offices in Washington, D.C., Los Angeles, London, Frankfurt, Munich, Tokyo, Hong Kong, São Paulo, Seoul, Singapore and Beijing. The firm was founded in 1866 and as of 2018 had 728 attorneys. Milbank currently occupies space on floors 30-39 along with 600 square feet of storage space at the 55 Hudson Yards Property. Milbank has the one-time right to contract by up to one floor upon the tenth anniversary of the rent commencement date (which was April 1, 2019) with notice no less than 15 months prior to the contraction
THE INFORMATION IN THIS STRUCTURAL AND COLLATERAL TERM SHEET IS NOT COMPLETE AND MAY BE AMENDED PRIOR TO THE TIME OF SALE. THIS TERM SHEET IS NOT AN OFFER TO SELL THESE SECURITIES AND IT IS NOT A SOLICITATION OF AN OFFER TO BUY THESE SECURITIES IN ANY JURISDICTION WHERE THE OFFER OR SALE IS NOT PERMITTED.
36
Office – CBD | Loan #1 | Cut-off Date Balance: | | $100,000,000 |
550 West 34th Street
New York, New York 10001
| 55 Hudson Yards | Cut-off Date LTV:
U/W NCF DSCR:
U/W NOI Debt Yield: | | 39.4%
3.53x
11.0% |
date. Milbank has either (i) two renewal options of 5-years each or (ii) one 10-year renewal option, each with 18 months’ prior notice and at the fair market rental rate, following its March 2034 expiration.
Cooley (146,227 square feet, 10.2% net rentable area, 11.2% underwritten base rent, September 30, 2039 expiration). Cooley LLP (“Cooley”) is a law firm ranked within the top 100 law firms by gross revenue according to a third party legal publication and is headquartered in Palo Alto, California with 16 other offices in San Francisco, Los Angeles, New York, Boston, Washington, D.C., San Diego, Seattle, Colorado, Virginia, London, Beijing and Shanghai. The firm had 946 attorneys in 2018. The firm’s major practice areas include corporate, litigation, intellectual property and regulatory law. Cooley currently occupies space on floors 42-46 of the 55 Hudson Yards Property. Effective as of the 10th anniversary of the rent commencement date (which was September 1, 2019), with 18 months’ prior notice, tenant has the one-time right to surrender either (i) the highest or lowest floor of any contiguous block or (ii) if the tenant did not exercise its initial expansion option, all of the square footage leased on the lowest floor of the leased premises (if the tenant leases less than all of the square footage on such lowest floor), subject to a fee equal to the sum of the unamortized portion of allowances, commissions and rent concessions applicable to such space. In addition, effective as of the 15th anniversary of the rent commencement date, with 24 months’ prior notice, Cooley has the one-time right to terminate its lease subject to a fee of the sum of (i) unamortized allowances, commissions, rent concessions (each including interest at the rate of 6% per annum, compounded monthly) and (ii) four months of fixed rent and recurring additional charges at the rate immediately preceding the termination date. Cooley has either (i) two renewal options of 5-years each or (ii) one 10-year renewal option, each with 18 months’ prior notice and at the fair market rental rate, following its September 2039 expiration. Cooley subleases 12,229 square feet of its space to Cinctive Capital LLC, with a sublease expiration of June 2022 and an annual rate of $110 PSF.
Boies, Schiller & Flexner (110,732 square feet, 7.7% net rentable area, 6.8% underwritten base rent, June 30, 2035 expiration). Founded by David Boies and Jonathan D. Schiller in 1997, Boies, Schiller & Flexner (“Boies Schiller”) is a law firm ranked within the top 100 law firms by gross revenue according to a third party legal publication, specializing in litigation and headquartered at the 55 Hudson Yards Property. The firm has 10 offices with a total of 320 attorneys. Boies Schiller currently occupies space on floors 18-21 of the 55 Hudson Yards Property, but is not yet paying full rent on all of its space. All outstanding gap rent and free rent through June 2020, in the amount of $5,480,125, was reserved at the time of origination of the 55 Hudson Yards Whole Loan. Effective as of the 10th anniversary of the rent commencement date (July 1, 2020), with 18 months’ prior notice, the tenant has a one-time right to surrender either (i) the highest or lowest floor of any contiguous block or (ii) any partial floor, each subject to a fee of 150% of the applicable per square foot base rent and 150% of the recurring additional charges due with respect to the contracted space for the immediately preceding 12-month period. Boies Schiller has either (i) two renewal options of 5-years each or (ii) one 10-year renewal option, each with 24 months’ prior notice and at the fair market rental rate, following its June 2035 expiration. Boies Schiller subleases 18,224 square feet of its space to Ashurst LLP, with a sublease expiration date of June 2026 and an annual rate of $94.00 PSF.
Third Point (89,043 square feet, 6.2% net rentable area, 8.6% underwritten base rent, July 31, 2029 expiration). Third Point Management (“Third Point”) is a New York-based hedge fund founded by Daniel S. Loeb in 1995. The firm operates as an employee-owned and SEC-registered investment advisor. Third Point currently occupies spaces on floors 49-51 of the 55 Hudson Yards Property. Third Point has either (i) a renewal option of 5-years or (ii) a renewal option of 10-years, each with 15 months’ prior notice and at the fair market rental rate, following its July 2029 expiration.
THE INFORMATION IN THIS STRUCTURAL AND COLLATERAL TERM SHEET IS NOT COMPLETE AND MAY BE AMENDED PRIOR TO THE TIME OF SALE. THIS TERM SHEET IS NOT AN OFFER TO SELL THESE SECURITIES AND IT IS NOT A SOLICITATION OF AN OFFER TO BUY THESE SECURITIES IN ANY JURISDICTION WHERE THE OFFER OR SALE IS NOT PERMITTED.
37
Office – CBD | Loan #1 | Cut-off Date Balance: | | $100,000,000 |
550 West 34th Street
New York, New York 10001
| 55 Hudson Yards | Cut-off Date LTV:
U/W NCF DSCR:
U/W NOI Debt Yield: | | 39.4%
3.53x
11.0% |
The following table presents certain information relating to the tenancy at the 55 Hudson Yards Property:
Major Tenant
Tenant Name | Credit Rating (Fitch/ Moody’s/
S&P) | Tenant NRSF | % of
NRSF | Annual U/W Base Rent PSF(1) | Annual
U/W Base Rent(1) | % of Total Annual U/W Base Rent | Lease
Expiration
Date | Extension Options | Termination Option (Y/N) |
Major Tenant | | | | | | | | |
Point72 | NR/NR/NR | 332,283(2) | 23.2% | $88.37(2)(3) | $29,364,626(2)(3) | 21.9% | 4/30/2034 | 2-5 yr or 1-10 yr | Y(4) |
Milbank | NR/NR/NR | 287,333 | 20.1% | $83.67 | $24,040,889 | 17.9% | 3/31/2034 | 2-5 yr or 1-10 yr | Y(5) |
Cooley | NR/NR/NR | 146,227(6) | 10.2% | $103.00(6) | $15,061,381(6) | 11.2% | 9/30/2039 | 2-5 yr or 1-10 yr | Y(7) |
Boies Schiller | NR/NR/NR | 110,732(8) | 7.7% | $82.50(8)(9) | $9,135,390(8)(9) | 6.8% | 6/30/2035 | 2-5 yr or 1-10 yr | Y(10) |
Third Point | NR/NR/NR | 89,043 | 6.2% | $130.00 | $11,575,590 | 8.6% | 7/31/2029 | 1-5 yr or 1-10 yr | N |
Total Major Tenants | 965,618 | 67.5% | $92.35 | $89,177,876 | 66.4% | | | |
| | | | | | | | |
Non-Major Tenants | 426,582 | 29.8% | $105.55 | $45,026,413 | 33.6% | | | |
| | | | | | | | |
Occupied Collateral Total | 1,392,200 | 97.3% | $96.40 | $134,204,289 | 100.0% | | | |
| | | | | | | | |
Vacant Space | 39,012 | 2.7% | | | | | | |
| | | | | | | | |
Collateral Total | 1,431,212 | 100.0% | | | | | | |
| | | | | | | | | |
(1) | The Annual U/W Base Rent and Annual U/W Base Rent PSF shown above include contractual rent steps through December 2020 totalling $57,080. The lender’s underwriting gives separate credit for straight-line rent averaging for the investment grade tenant Mount Sinai through the loan term and for Milbank, Cooley and Boies Schiller through the loan term. The total implied underwritten rental rate for Milbank, Cooley and Boies Schiller, inclusive of the straight line credit, is approximately $87.72, $106.62 and $85.59 PSF, respectively. See “Underwritten Net Cash Flow” below. |
(2) | Point 72 has signed a sublease for the entire 3rd floor (31,246 square feet) of its space with Elite World Group, LLC, with an expected sublease commencement date of February 2020, a 5-year term and an annual rate of $90.00 PSF. Point72 also subleases 11,844 square feet of its space to Light Sky Macro LP, with a sublease expiration of August 2029 and an annual rate of $99.00 PSF. Underwriting reflects the prime lease rent. |
(3) | Point72 has an executed lease and has taken full occupancy of its spaces but has not yet fully commenced paying rent on all of its space (see tenant description in “Major Tenants” above for further information). |
(4) | Point72 has a one-time termination or contraction option that is further described in the “Major Tenants” section above. |
(5) | Milbank has a one-time contraction option that is further described in the “Major Tenants” section above. |
(6) | Cooley subleases 12,229 square feet of its space to Cinctive Capital LLC, with a sublease expiration of June 30, 2022 and an annual rate of $110 PSF. Underwriting reflects the prime lease rent. |
(7) | Cooley has a one-time termination or contraction option that is further described in the “Major Tenants” section above. |
(8) | Boies Schiller subleases 18,224 square feet of its space to Ashurst LLP, with a sublease expiration date of June 28, 2026 and an annual rate of $94.00 PSF. Underwriting reflects the prime lease rent. |
(9) | Boies Schiller has an executed lease and has taken full occupancy of its spaces but has not yet fully commenced paying rent on all of its space (see tenant description in “Major Tenants” above for further information). |
(10) | Boies Schiller has a one-time contraction option that is further described in the “Major Tenants” section above. |
THE INFORMATION IN THIS STRUCTURAL AND COLLATERAL TERM SHEET IS NOT COMPLETE AND MAY BE AMENDED PRIOR TO THE TIME OF SALE. THIS TERM SHEET IS NOT AN OFFER TO SELL THESE SECURITIES AND IT IS NOT A SOLICITATION OF AN OFFER TO BUY THESE SECURITIES IN ANY JURISDICTION WHERE THE OFFER OR SALE IS NOT PERMITTED.
38
Office – CBD | Loan #1 | Cut-off Date Balance: | | $100,000,000 |
550 West 34th Street
New York, New York 10001
| 55 Hudson Yards | Cut-off Date LTV:
U/W NCF DSCR:
U/W NOI Debt Yield: | | 39.4%
3.53x
11.0% |
The following table presents certain information relating to the lease rollover schedule at the 55 Hudson Yards Property:
Lease Expiration Schedule(1)(2)
Year Ending
December 31, | No. of Leases Expiring | Expiring NRSF | % of Total NRSF | Cumulative Expiring NRSF | Cumulative % of Total NRSF | Annual
U/W
Base Rent(3) | % of Total Annual U/W Base Rent | Annual
U/W
Base Rent
PSF(3) |
MTM | 0 | 0 | 0.0% | 0 | 0.0% | $0 | 0.0% | $0.00 |
2020 | 0 | 0 | 0.0% | 0 | 0.0% | $0 | 0.0% | $0.00 |
2021 | 0 | 0 | 0.0% | 0 | 0.0% | $0 | 0.0% | $0.00 |
2022 | 0 | 0 | 0.0% | 0 | 0.0% | $0 | 0.0% | $0.00 |
2023 | 0 | 0 | 0.0% | 0 | 0.0% | $0 | 0.0% | $0.00 |
2024 | 2 | 84,892 | 5.9% | 84,892 | 5.9% | $9,679,268 | 7.2% | $114.02 |
2025 | 2 | 18,765 | 1.3% | 103,657 | 7.2% | $2,045,385 | 1.5% | $109.00 |
2026 | 0 | 0 | 0.0% | 103,657 | 7.2% | $0 | 0.0% | $0.00 |
2027 | 0 | 0 | 0.0% | 103,657 | 7.2% | $0 | 0.0% | $0.00 |
2028 | 0 | 0 | 0.0% | 103,657 | 7.2% | $0 | 0.0% | $0.00 |
2029 | 6 | 149,603 | 10.5% | 253,260 | 17.7% | $18,838,620 | 14.0% | $125.92 |
2030 | 2 | 9,642 | 0.7% | 262,902 | 18.4% | $1,194,842 | 0.9% | $123.92 |
Thereafter | 21 | 1,138,940 | 79.6% | 1,392,200 | 97.3% | $103,641,016 | 77.2% | $91.00 |
Vacant | 0 | 39,012 | 2.7% | 1,431,212 | 100.0% | $0 | 0.0% | $0.00 |
Total/Weighted Average | 31 | 1,431,212 | 100.0% | | | $134,204,289 | 100.0% | $96.40 |
(1) | Information obtained from the underwritten rent roll. |
(2) | Certain tenants may have lease termination options that are exercisable prior to the originally stated expiration date of the subject lease and that are not considered in the Lease Expiration Schedule. |
(3) | Total/Weighted Average Annual U/W Base Rent and Annual U/W Base Rent PSF exclude vacant space. |
The following table presents historical occupancy percentages at the 55 Hudson Yards Property:
Historical Occupancy
12/31/2015(1) | | 12/31/2016(1) | | 12/31/2017(1) | | 12/31/2018(1) | | 11/19/2019(2) |
| NAP | | NAP | | NAP | | NAP | | 97.3% |
(1) | Historical occupancy is not applicable, as the 55 Hudson Yards Property was constructed in 2018 and tenants began taking occupancy in 2019. |
(2) | Information obtained from the underwritten rent roll. |
THE INFORMATION IN THIS STRUCTURAL AND COLLATERAL TERM SHEET IS NOT COMPLETE AND MAY BE AMENDED PRIOR TO THE TIME OF SALE. THIS TERM SHEET IS NOT AN OFFER TO SELL THESE SECURITIES AND IT IS NOT A SOLICITATION OF AN OFFER TO BUY THESE SECURITIES IN ANY JURISDICTION WHERE THE OFFER OR SALE IS NOT PERMITTED.
39
Office – CBD | Loan #1 | Cut-off Date Balance: | | $100,000,000 |
550 West 34th Street
New York, New York 10001
| 55 Hudson Yards | Cut-off Date LTV:
U/W NCF DSCR:
U/W NOI Debt Yield: | | 39.4%
3.53x
11.0% |
Underwritten Net Cash Flow. The following table presents certain information relating to the underwritten net cash flow at the 55 Hudson Yards Property:
Cash Flow Analysis(1)
| U/W | | %(2) | | U/W $ per SF | |
Base Rent | $134,147,209 | | 87.0% | | $93.73 | |
Rent Average Benefit(3) | 2,242,507 | | 1.5 | | 1.57 | |
Contractual Rent Step(4) | 57,080 | | 0.0 | | 0.04 | |
Grossed Up Vacant Space | 5,108,740 | | 3.3 | | 3.57 | |
Gross Potential Rent | $141,555,536 | | 91.8% | | $98.91 | |
Other Income | 147,949 | | 0.1 | | 0.10 | |
Total Recoveries | 12,516,263 | | 8.1 | | 8.75 | |
Net Rental Income | $154,219,748 | | 100.0% | | $107.75 | |
(Vacancy & Credit Loss) | (5,108,740) | | (3.6)(5) | | (3.57) | |
Effective Gross Income | $149,111,008 | | 96.7% | | $104.19 | |
| | | | | | |
Real Estate Taxes (PILOT) | 19,160,307(6) | | 12.8 | | 13.39 | |
Insurance | 807,380 | | 0.5 | | 0.56 | |
Management Fee | 1,000,000 | | 0.7 | | 0.70 | |
Other Operating Expenses | 24,242,990 | | 16.3 | | 16.94 | |
Total Operating Expenses | $45,210,677 | | 30.3% | | $31.59 | |
| | | | | | |
Net Operating Income | $103,900,331 | | 69.7% | | $72.60 | |
Replacement Reserves | 286,242 | | 0.2 | | 0.20 | |
TI/LC | 3,578,030 | | 2.4 | | 2.50 | |
Net Cash Flow | $100,036,059 | | 67.1% | | $69.90 | |
| | | | | | |
NOI DSCR(7) | 3.67x | | | | | |
NCF DSCR(7) | 3.53x | | | | | |
NOI Debt Yield(7) | 11.0% | | | | | |
NCF Debt Yield(7) | 10.6% | | | | | |
(1) | Prior historical operating statements are not applicable, as the 55 Hudson Yards Property was constructed in 2018 and tenants began taking occupancy in 2019. |
(2) | Represents (i) percent of Net Rental Income for all revenue fields, (ii) percent of Gross Potential Rent for Vacancy & Credit Loss and (iii) percent of Effective Gross Income for all other fields. |
(3) | Represents straight-line rent averaging for the investment grade tenant Mount Sinai through the loan term and for Milbank, Cooley and Boies Schiller through the loan term (see “Tenant Summary” above for further information). |
(4) | Represents contractual rent steps through December 2020. |
(5) | The underwritten economic vacancy is 3.6%. The 55 Hudson Yards Property was 97.3% leased as of November 19, 2019. |
(6) | Represents the average of the projected PILOT payments over the loan term (see “PILOT/IDA Leases” for further details on the PILOT agreement). |
(7) | The debt service coverage ratios and debt yields are based on the 55 Hudson Yards Senior Loan, and exclude the 55 Hudson Yards Subordinate Companion Loan. |
Appraisal. The appraiser concluded to an “as-is” Appraised Value for the 55 Hudson Yards Property of $2,400,000,000 as of October 15, 2019.
Environmental Matters. According to the Phase I environmental site assessment dated October 9, 2019, there was no evidence of any recognized environmental conditions at the 55 Hudson Yards Property.
Market Overview and Competition. The 55 Hudson Yards Property is located at 550 West 34th Street, on the southeast corner of the intersection of 34th Street and 11th Avenue in New York, New York. The 55 Hudson Yards Property is situated within the Hudson Yards development, one of the largest private real estate development projects in the United States. Once fully developed, Hudson Yards is expected to include more than 18.0 million square feet of commercial and residential space, along with more than 100 shops, a collection of restaurants, approximately 4,000 residences, affordable housing, The Shed (entertainment venue), 14 acres of open space, a 750-seat public school and an Equinox Hotel. The Hudson Yards neighborhood is traditionally bound by the Hell’s Kitchen neighborhood to the north, the Midtown, Times Square, Garment District and Penn Station neighborhoods to the east, and the West Chelsea neighborhood to the south. In September 2015, the Metropolitan Transportation Authority (MTA) completed an approximately $2.4 billion, 7,000-foot extension of the MTA’s No. 7 Flushing subway line (providing access to Queens), which was extended to include an additional subway stop at the corner of 34th Street and Eleventh Avenue (adjacent to the 50 Hudson Yards Property), from the previous last stop at 41st Street and Seventh Avenue (approximately 1.0 mile northeast of the 55 Hudson Yards Property). The 55 Hudson Yards Property is situated approximately 0.6 miles northwest of Penn Station.
THE INFORMATION IN THIS STRUCTURAL AND COLLATERAL TERM SHEET IS NOT COMPLETE AND MAY BE AMENDED PRIOR TO THE TIME OF SALE. THIS TERM SHEET IS NOT AN OFFER TO SELL THESE SECURITIES AND IT IS NOT A SOLICITATION OF AN OFFER TO BUY THESE SECURITIES IN ANY JURISDICTION WHERE THE OFFER OR SALE IS NOT PERMITTED.
40
Office – CBD | Loan #1 | Cut-off Date Balance: | | $100,000,000 |
550 West 34th Street
New York, New York 10001
| 55 Hudson Yards | Cut-off Date LTV:
U/W NCF DSCR:
U/W NOI Debt Yield: | | 39.4%
3.53x
11.0% |
The 55 Hudson Yards Property is situated approximately 0.3 miles northwest of the Shops & Restaurants at Hudson Yards, a seven-story, 676,229 square foot retail center, with retailers such as Cartier, Coach, Zara, H&M, Watches of Switzerland and Fendi, as well as restaurant and food options including Hudson Yards Grill, Bouchon Bakery, Shake Shack and Jack’s Coffee. The Vessel, a 16-story structure comprising 154 interconnecting flights of stairs with approximately 2,500 individual steps and 80 landings, is located approximately 0.2 miles southwest of the 55 Hudson Yards Property.
According to the appraisal, the 55 Hudson Yards Property is situated within the Far West Side submarket of the New York Office Market. As of the third quarter of 2019, the Far West Side submarket reported a total inventory of approximately 9.1 million square feet with a 1.4% vacancy rate (and a 12.2% availability rate) and average asking rents of $108.47 PSF, gross. The appraiser concluded to market rents ranging from $95.00 to $130.00 PSF, modified gross, for the various floors of office space at the 55 Hudson Yards Property (see table below).
The following table presents certain information relating to the appraisal’s market rent conclusion for the 55 Hudson Yards Property:
Market Rent Summary(1)
| Office – Floor 2-9 | Office Floor 10-16 | Office Floor 17-23 | Office – Floor 24-30 | Office – Floor 31-37 | Office Floor 38-44 | Office Floor 45-51 |
Market Rent (PSF) | $95.00 | $100.00 | $110.00 | $115.00 | $120.00 | $125.00 | $130.00 |
Lease Term (Years) | 15 | 15 | 15 | 15 | 15 | 15 | 15 |
Lease Type (Reimbursements) | MG | MG | MG | MG | MG | MG | MG |
Rent Increase Projection | $10.00 PSF every 5 years | $10.00 PSF every 5 years | $10.00 PSF every 5 years | $10.00 PSF every 5 years | $10.00 PSF every 5 years | $10.00 PSF every 5 years | $10.00 PSF every 5 years |
(1) | Information obtained from the appraisal. |
The following table presents information relating to comparable office property sales for the 55 Hudson Yards Property:
Comparable Sales(1)
Property Name/Location | Sale Date | Year Built/ Renovated | Total NRA (SF) | Occupancy | Sale Price | Sale Price PSF |
55 Hudson Yards Property New York, NY | NAP | 2018/NAP | 1,431,212(2) | 97.3%(2) | | |
711 Fifth Avenue New York, NY | Sep. 2019 | 1927/NAP | 354,361 | 76% | $955,000,000 | $2,695 |
330 Madison Avenue New York, NY | Jul. 2019 | 1963/NAP | 855,000 | 95% | $900,000,000 | $1,053 |
30 Hudson Yards(3) New York, NY | Apr. 2019 | 2019/NAP | 1,463,234 | 100% | $2,155,000,000 | $1,473 |
640 Fifth Avenue New York, NY | Apr. 2019 | 1948/2014 | 315,886 | 100% | $975,000,000 | $3,087 |
237 Park Avenue New York, NY | Jan. 2019 | 1915/2015 | 1,260,160 | 98% | $1,200,000,000 | $952 |
3 Columbus Circle New York, NY | Nov. 2018 | 1927/2011 | 753,405 | 100% | $1,035,000,000 | $1,374 |
1515 Broadway New York, NY | Nov. 2017 | 1972/2010 | 1,897,131 | 99% | $1,950,000,000 | $1,028 |
10 Hudson Yards(3) New York, NY | Aug. 2016 | 2015/NAP | 1,861,084 | 100% | $2,150,000,000 | $1,155 |
(1) | Information obtained from the appraisal. |
(2) | Information obtained from the underwritten rent roll. |
(3) | Owned by affiliates of the 55 Hudson Yards Borrower. |
THE INFORMATION IN THIS STRUCTURAL AND COLLATERAL TERM SHEET IS NOT COMPLETE AND MAY BE AMENDED PRIOR TO THE TIME OF SALE. THIS TERM SHEET IS NOT AN OFFER TO SELL THESE SECURITIES AND IT IS NOT A SOLICITATION OF AN OFFER TO BUY THESE SECURITIES IN ANY JURISDICTION WHERE THE OFFER OR SALE IS NOT PERMITTED.
41
Office – CBD | Loan #1 | Cut-off Date Balance: | | $100,000,000 |
550 West 34th Street
New York, New York 10001
| 55 Hudson Yards | Cut-off Date LTV:
U/W NCF DSCR:
U/W NOI Debt Yield: | | 39.4%
3.53x
11.0% |
The following table presents certain information relating to comparable office leases for the 55 Hudson Yards Property:
Comparable Leases(1)
Property Name/Location | Year Built/ Renovated | Total GLA (SF) | Distance from Subject | Tenant Name | Lease Date/Term | Lease Area (SF) | Annual Base Rent PSF | Lease Type |
55 Hudson Yards Property
New York, NY | 2018/NAP | 1,431,212(2) | NAP | | | | | |
30 Hudson Yards(3)
New York, NY | 2019/NAP | 1,463,234 | 0.1 Miles | Confidential Tenant
Warner Media | Oct. 2019 /16.3 Yrs
Jun. 2019 / 15.0 Yrs | 175,000
1,463,234 | $156.38
$120.37 | MG
Net to MG adj. |
460 West 34th Street
New York, NY | 1927/2021(4) | 633,530 | 0.2 Miles | First Republic Bank | Sep. 2019 /16.0 Yrs | 233,782 | $85.00 | MG |
441 Ninth Avenue
New York, NY | 1962/2019 | 697,958 | 0.3 Miles | Brevert
Peloton Interactive, LLC
Lyft | Sep. 2019 /10.8 Yrs
Nov. 2018 / 15.0 Yrs
Nov. 2018 / 10.0 Yrs | 16,178
312,000
100,000 | $116.00
$106.66
$87.00 | MG
MG
MG |
50 Hudson Yards(3)
New York, NY | 2022(4)/NAP | 2,900,000 | 0.1 Miles | Confidential | Sep. 2019 / 15.0 Yrs | 1,250,000 | $130.00 | MG |
1 Manhattan West
New York, NY | 2019/N/A | 2,216,609 | 0.4 Miles | Accenture
NHL
McKool School
Skadden, Arps, Slate, Meagher & Florn LLP | Jul. 2019 /16.1 Yrs
Jun. 2019 / 22.0 Yrs
Apr. 2019 / 16.0 Yrs
Mar. 2019 / 21.0 Yrs | 248,673
176,007
64,120
600,867 | $119.00
$93.80
$108.00
$76.11 | MG
MG
MG
MG |
66 Hudson Boulevard
New York, NY | 2022(4)/NAP | 2,814,581 | 0.2 Miles | AllianceBernstein
Pfizer Inc. | May 2019 /20.0 Yrs
Apr. 2018 / 21.3 Yrs. | 186,226
790,000 | $105.00
$95.00 | MG
MG |
10 Hudson Yards(3)
New York, NY | 2015/NAP | 1,861,084 | 0.3 Miles | Huatai Securities | Apr. 2018 /3.6 Yrs | 5,992 | $120.00 | MG |
1 Vanderbilt Avenue
New York, NY | 2020(4)/NAP | 1,730,989 | 1.6 Miles | The Carlyle Group | Jul. 2018 /15.8 Yrs | 95,367 | $166.00 | MG |
(1) | Information obtained from the appraisal. |
(2) | Information obtained from the underwritten rent roll. |
(3) | Owned by affiliates of the 55 Hudson Yards Borrower. |
(4) | Denotes expected completion or renovation dates (as applicable) per the appraisal. |
Escrows.
Real Estate Taxes - Upon the occurrence and continuance of a Cash Trap Event Period (as defined below under “Lockbox and Cash Management”), the 55 Hudson Yards Whole Loan documents require ongoing monthly real estate tax reserves in an amount equal to one-twelfth of the real estate taxes that the lender reasonably estimates will be payable during the next 12 months.
Insurance - Upon the occurrence and continuance of a Cash Trap Event Period, the 55 Hudson Yards Whole Loan documents require ongoing monthly insurance reserves in an amount equal to one-twelfth of the insurance premiums that the lender estimates will be payable for the renewal of the coverage during the next 12 months; provided, however, that, notwithstanding any prior springing conditions, the reserve will not be required if the 55 Hudson Yards Borrower maintains a blanket insurance policy reasonably acceptable to the lender.
Replacement Reserve – Upon the occurrence and continuance of a Cash Trap Event Period, the 55 Hudson Yards Whole Loan documents require ongoing monthly replacement reserves of $23,584.
TI/LC Reserve – Upon the occurrence and continuance of a Cash Trap Event Period, the 55 Hudson Yards Whole Loan documents require ongoing monthly general rollover reserves of $119,268.
Tenant Specific TI/LC Reserve – The 55 Hudson Yards Whole Loan documents require an upfront deposit of $34,260,641 for approved leasing expenses outstanding at the time of origination of the 55 Hudson Yards Whole Loan.
Free Rent Reserve – The 55 Hudson Yards Whole Loan documents require an upfront reserve of $11,482,346 for the free rent and gap rent outstanding for seven tenants at the time of origination of the 55 Hudson Yards Whole Loan.
Milbank Lease Landlord Delay Dispute Reserve – The 55 Hudson Yards Whole Loan documents require an upfront reserve of $11,000,000 relating to the potential settlement of a dispute between the 55 Hudson Yards Borrower and Milbank relating to a delay in the delivery of such tenant’s leased premises.
MarketAxess Lease Takeover Reserve – The 55 Hudson Yards Whole Loan documents require an upfront reserve of $4,474,631 relating to the rental expenses to be incurred by MarketAxess Holdings Inc., a tenant at the 55 Hudson Yards Property, under a prior sublease at an unrelated property which the 55 Hudson Yards Borrower agreed to pay as an inducement to such tenant’s new lease at the 55 Hudson Yards Property.
THE INFORMATION IN THIS STRUCTURAL AND COLLATERAL TERM SHEET IS NOT COMPLETE AND MAY BE AMENDED PRIOR TO THE TIME OF SALE. THIS TERM SHEET IS NOT AN OFFER TO SELL THESE SECURITIES AND IT IS NOT A SOLICITATION OF AN OFFER TO BUY THESE SECURITIES IN ANY JURISDICTION WHERE THE OFFER OR SALE IS NOT PERMITTED.
42
Office – CBD | Loan #1 | Cut-off Date Balance: | | $100,000,000 |
550 West 34th Street
New York, New York 10001
| 55 Hudson Yards | Cut-off Date LTV:
U/W NCF DSCR:
U/W NOI Debt Yield: | | 39.4%
3.53x
11.0% |
Lockbox and Cash Management. The 55 Hudson Yards Whole Loan documents require that the 55 Hudson Yards Borrower establish and maintain a lender-controlled lockbox account, which is already in-place, and direct all tenants to pay rent directly into such lockbox account. The 55 Hudson Yards Whole Loan documents also require that all rents received by the 55 Hudson Yards Borrower be deposited into the lockbox account within two business days of receipt. Prior to the occurrence of a Cash Trap Event Period, all funds on deposit in the lockbox account will be disbursed to the 55 Hudson Yards Borrower’s operating account. During a Cash Trap Event Period, all funds in the lockbox account are required to be swept each business day into the cash management account controlled by the lender and, on each payment date, all funds in the cash management account are required to be applied in accordance with the 55 Hudson Yards Whole Loan documents. During a Cash Trap Event Period, any excess cash flow remaining after satisfaction of the waterfall items is required to be swept to an excess cash flow subaccount to be held by the lender as additional security for the 55 Hudson Yards Whole Loan; provided, however, that, so long as no event of default exists under the 55 Hudson Yards Whole Loan, if amounts on deposit in the TI/LC Reserve are not sufficient to pay approved leasing expenses, then upon request of the 55 Hudson Yards Borrower, funds in the excess cash flow subaccount are required to be disbursed for approved leasing expenses.
A “Cash Trap Event Period” will commence upon the earlier of the following:
| (i) | the occurrence and continuance of an event of default; or |
| (ii) | the net cash flow debt yield (“NCF DY”) for the 55 Hudson Yards Whole Loan falling below 6.0% at the end of any calendar quarter. |
A Cash Trap Event Period will end upon the occurrence of the following:
| | with regard to clause (i) above, the cure of such event of default; or |
| | with regard to clause (ii) above: |
| (a) | the NCF DY for the 55 Hudson Yards Whole Loan being greater than or equal to 6.0% for two consecutive calendar quarters; or |
| (b) | the 55 Hudson Yards Borrower delivering to the lender as additional collateral and security for the payment of the debt, immediately available funds or one or more letters of credits (not to exceed, in the aggregate, 10.0% of the outstanding principal balance of the 55 Hudson Yards Whole Loan) having an aggregate notional amount, that, if applied as a prepayment of the outstanding principal balance of the 55 Hudson Yards Whole Loan, would cause the NCF DY to equal or exceed 6.0%. |
Property Management. The 55 Hudson Yards Property is managed by Related Hudson Yards Manager LLC, a borrower sponsor affiliate.
Partial Release. Not permitted.
Real Estate Substitution. Not permitted.
Subordinate and Mezzanine Indebtedness. The 55 Hudson Yards Property also secures the 55 Hudson Yards Non-Serviced Pari Passu Companion Loans, which have an aggregate Cut-off Date principal balance of $845,000,000 and the 55 Hudson Yards Subordinate Companion Loan, which has an aggregate Cut-off Date principal balance of $300,000,000. The 55 Hudson Yards Non-Serviced Pari Passu Companion Loans and the 55 Hudson Yards Subordinate Companion Loan are coterminous with the 55 Hudson Yards Mortgage Loan. The 55 Hudson Yards Non-Serviced Pari Passu Companion Loans accrue interest at the same rate as the 55 Hudson Yards Mortgage Loan, and the 55 Hudson Yards Subordinate Companion Loan accrues interest at an interest rate of 2.9500%. The 55 Hudson Yards Mortgage Loan and the 55 Hudson Yards Non-Serviced Pari Passu Companion Loans are each pari passu in right of payment and together are senior in right of payment to the 55 Hudson Yards Subordinate Companion Loan. The holders of the 55 Hudson Yards Mortgage Loan, the 55 Hudson Yards Non-Serviced Pari Passu Companion Loans and the 55 Hudson Yards Subordinate Companion Loan have entered into a co-lender agreement which sets forth the allocation of collections on the 55 Hudson Yards Whole Loan. See “Description of the Mortgage Pool—The Whole Loans—The 55 Hudson Yards Pari Passu-A/B Whole Loan”.
The following table presents certain information relating to the 55 Hudson Yards Subordinate Companion Loan:
B-Note Summary
| B-Note
Original Principal
Balance | B-Note
Interest Rate | Original Term (mos.) | Original Amort.
Term (mos.) | Original IO
Term (mos.) | Total Debt UW
NCF DSCR | Total Debt UW
NOI Debt Yield | Total Debt Cutoff
Date LTV |
55 Hudson Yards Subordinate Companion Loan | $300,000,000 | 2.9500% | 120 | 0 | 120 | 2.68x | 8.3% | 51.9% |
| | | | | | | | | | |
Ground Lease. None.
PILOT/IDA Leases. The 55 Hudson Yards Borrower leases the 55 Hudson Yards Property to the New York City Industrial Development Agency (the “Agency”) (such lease, the “Company Lease”), and the Agency subleases the 55 Hudson Yards Property back to the 55 Hudson Yards Borrower (the “Agency Lease”) (the Company Lease and Agency Lease, collectively, the “IDA Leases”). The benefits of this lease structure to the 55 Hudson Yards Borrower are a mortgage recording tax exemption and real property tax abatements. As such, the 55 Hudson Yards Borrower pays installment payments in lieu of real estate taxes as the rent under the Agency Lease (the “PILOT Payments”). In order for the PILOT Payments to achieve the same priority as would real estate tax payments (i.e., ahead of
THE INFORMATION IN THIS STRUCTURAL AND COLLATERAL TERM SHEET IS NOT COMPLETE AND MAY BE AMENDED PRIOR TO THE TIME OF SALE. THIS TERM SHEET IS NOT AN OFFER TO SELL THESE SECURITIES AND IT IS NOT A SOLICITATION OF AN OFFER TO BUY THESE SECURITIES IN ANY JURISDICTION WHERE THE OFFER OR SALE IS NOT PERMITTED.
43
Office – CBD | Loan #1 | Cut-off Date Balance: | | $100,000,000 |
550 West 34th Street
New York, New York 10001
| 55 Hudson Yards | Cut-off Date LTV:
U/W NCF DSCR:
U/W NOI Debt Yield: | | 39.4%
3.53x
11.0% |
any mortgage or other lien), the 55 Hudson Yards Borrower (with the Agency as holder of the leasehold under the Company Lease) provided mortgages in favor of the Hudson Yards Infrastructure Corporation, a not-for-profit local development corporation (“HYIC”), to secure the PILOT Payments (collectively, the “PILOT Mortgage”). The HYIC has issued revenue bonds for which the PILOT Payments are used to repay the bondholders. The term of the IDA Leases runs to June 30, 2044 (such period, the “Initial Term”), with annual automatic one-year extensions thereafter, unless within 60 days preceding the expiration of the current term the Agency provides written notice of termination to the 55 Hudson Yards Borrower (such date, the “Expiration Date”); provided that, after the Initial Term, the IDA Leases will automatically terminate within 60 days after the repayment in full or defeasance of all revenue bonds issued by HYIC for which an assignment of the PILOT Amount payable under the Agency Lease is used to repay the bondholders.
The 55 Hudson Yards Property is subject to tax abatements in the following amounts through 2038:
| | 29.7% tax abatement through 2023; |
| | 2024 through 2034: taxes are due in amount equal to 103% of the preceding year’s PILOT payment; |
| | 2035: taxes due in amount equal to the greater of (a) 76.3% of unabated taxes and (b) 103% of the preceding year’s PILOT payment; |
| | 2036: taxes due in amount equal to the greater of (a) 82.2% of unabated taxes and (b) 103% of the preceding year’s PILOT payment; |
| | 2037: taxes due in amount equal to the greater of (a) 88.1% of unabated taxes and (b) 103% of the preceding year’s PILOT payment; and |
| | 2038: taxes due in amount equal to the greater of (a) 94.1% of unabated taxes and (b) 103% of the preceding year’s PILOT payment. |
For additional information with respect to the IDA Leases and PILOT Payments, see “Description of the Mortgage Pool—Real Estate and Other Tax Considerations” in the Preliminary Prospectus.
Terrorism Insurance. The 55 Hudson Yards Whole Loan documents require that the “all risk” insurance policy required to be maintained by the 55 Hudson Yards Borrower, in an amount equal to the full replacement cost of the 55 Hudson Yards Property, contain no exclusion for damage or destruction caused by acts of terrorism, as well as business interruption insurance covering a period of restoration of 24 months and a 6-month extended period of indemnity (provided that if TRIPRA or a similar statute is not in effect, the 55 Hudson Yards Borrower will not be obligated to pay terrorism insurance premiums in excess of two times the annual premium for the casualty and business interruption coverage (without giving effect to the cost of terrorism, flood and earthquake and business interruption components of such coverage).
The 55 Hudson Yards Whole Loan documents provide that required terrorism insurance may be written by a non-rated captive insurer subject to certain conditions, including, among other things: (i) TRIPRA is in full force and effect; (ii) the terrorism policy issued by such captive insurer, together with any other qualified terrorism policies in-place, provide per occurrence limit in an amount not less than replacement cost and rent loss coverage as otherwise required; (iii) covered losses that are not reinsured by the federal government under TRIPRA and paid to the captive insurer are reinsured with a cut-through endorsement by an insurance company rated S&P “A”/ Moody’s “A2” or better; (iv) all reinsurance agreements between the captive insurer and other reinsurance providers are reasonably acceptable to the lender; (v) such captive insurer is licensed in the State of New York or other jurisdiction to the extent reasonably approved by the lender and qualified to issue the terrorism policy in accordance with applicable legal requirements; and (vi) the related policy will not contain a provision that terrorism coverage will expire or be excluded or limited in the event TRIPRA expires or is no longer in effect, so long as an insurance policy that does not contain such a provision is commercially available.
THE INFORMATION IN THIS STRUCTURAL AND COLLATERAL TERM SHEET IS NOT COMPLETE AND MAY BE AMENDED PRIOR TO THE TIME OF SALE. THIS TERM SHEET IS NOT AN OFFER TO SELL THESE SECURITIES AND IT IS NOT A SOLICITATION OF AN OFFER TO BUY THESE SECURITIES IN ANY JURISDICTION WHERE THE OFFER OR SALE IS NOT PERMITTED.
44
(THIS PAGE INTENTIONALLY LEFT BLANK)
THE INFORMATION IN THIS STRUCTURAL AND COLLATERAL TERM SHEET IS NOT COMPLETE AND MAY BE AMENDED PRIOR TO THE TIME OF SALE. THIS TERM SHEET IS NOT AN OFFER TO SELL THESE SECURITIES AND IT IS NOT A SOLICITATION OF AN OFFER TO BUY THESE SECURITIES IN ANY JURISDICTION WHERE THE OFFER OR SALE IS NOT PERMITTED.
45
Office – CBD | Loan # 2 | Cut-off Date Balance: | | $100,000,000 |
1633 Broadway New York, NY 10019 | 1633 Broadway | Cut-off Date LTV: U/W NCF DSCR: U/W NOI Debt Yield: | | 41.7% 3.83x 11.9% |

THE INFORMATION IN THIS STRUCTURAL AND COLLATERAL TERM SHEET IS NOT COMPLETE AND MAY BE AMENDED PRIOR TO THE TIME OF SALE. THIS TERM SHEET IS NOT AN OFFER TO SELL THESE SECURITIES AND IT IS NOT A SOLICITATION OF AN OFFER TO BUY THESE SECURITIES IN ANY JURISDICTION WHERE THE OFFER OR SALE IS NOT PERMITTED.
46
Office – CBD | Loan # 2 | Cut-off Date Balance: | | $100,000,000 |
1633 Broadway New York, NY 10019 | 1633 Broadway | Cut-off Date LTV: U/W NCF DSCR: U/W NOI Debt Yield: | | 41.7% 3.83x 11.9% |
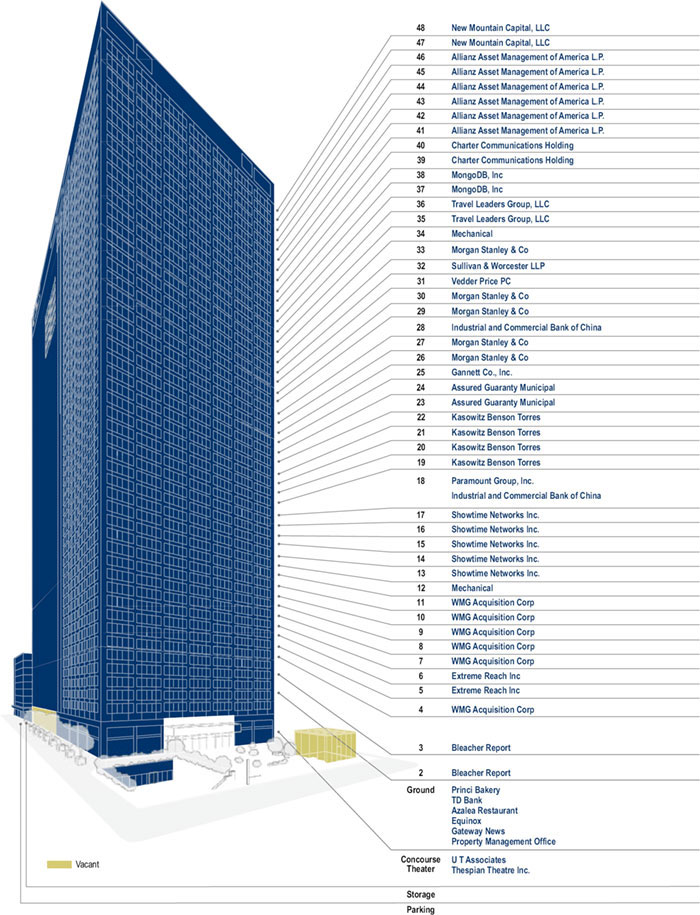
THE INFORMATION IN THIS STRUCTURAL AND COLLATERAL TERM SHEET IS NOT COMPLETE AND MAY BE AMENDED PRIOR TO THE TIME OF SALE. THIS TERM SHEET IS NOT AN OFFER TO SELL THESE SECURITIES AND IT IS NOT A SOLICITATION OF AN OFFER TO BUY THESE SECURITIES IN ANY JURISDICTION WHERE THE OFFER OR SALE IS NOT PERMITTED.
47
Office – CBD | Loan # 2 | Cut-off Date Balance: | | $100,000,000 |
1633 Broadway New York, NY 10019 | 1633 Broadway | Cut-off Date LTV: U/W NCF DSCR: U/W NOI Debt Yield: | | 41.7% 3.83x 11.9% |

THE INFORMATION IN THIS STRUCTURAL AND COLLATERAL TERM SHEET IS NOT COMPLETE AND MAY BE AMENDED PRIOR TO THE TIME OF SALE. THIS TERM SHEET IS NOT AN OFFER TO SELL THESE SECURITIES AND IT IS NOT A SOLICITATION OF AN OFFER TO BUY THESE SECURITIES IN ANY JURISDICTION WHERE THE OFFER OR SALE IS NOT PERMITTED.
48
No. 2 – 1633 Broadway |
|
Mortgage Loan Information | | Mortgaged Property Information |
Mortgage Loan Seller: | Wells Fargo Bank, National Association | | Single Asset/Portfolio: | Single Asset |
Credit Assessment (Fitch/KBRA/S&P): | BBB-sf/A(sf)/A(sf) | | Property Type – Subtype: | Office – CBD |
Original Principal Balance(1): | $100,000,000 | | Location: | New York, NY |
Cut-off Date Balance(1): | $100,000,000 | | Size: | 2,561,512 SF |
% of Initial Pool Balance: | 6.1% | | Cut-off Date Balance Per SF(1): | $390.78 |
Loan Purpose: | Refinance | | Maturity Date Balance Per SF(1): | $390.78 |
Borrower Sponsor: | Paramount Group Operating Partnership LP | | Year Built/Renovated: | 1972/2013 |
Guarantor: | NAP | | Title Vesting: | Fee |
Mortgage Rate: | 2.9900% | | Property Manager: | Paramount Group Property-Asset Management LLC |
Note Date: | November 25, 2019 | | Current Occupancy (As of): | 98.4% (10/31/2019) |
Seasoning: | 2 months | | YE 2018 Occupancy: | 95.4% |
Maturity Date: | December 6, 2029 | | YE 2017 Occupancy: | 95.4% |
IO Period: | 120 months | | YE 2016 Occupancy: | 86.3% |
Loan Term (Original): | 120 months | | YE 2015 Occupancy: | 92.7% |
Amortization Term (Original): | NAP | | As-Is Appraised Value: | $2,400,000,000 |
Loan Amortization Type: | Interest-only, Balloon | | As-Is Appraised Value Per SF: | $936.95 |
Call Protection(2): | L(26),D(87),O(7) | | As-Is Appraisal Valuation Date: | October 24, 2019 |
Lockbox Type: | Hard/Springing Cash Management | | Underwriting and Financial Information |
Additional Debt(1)(3): | Yes | | TTM NOI (9/30/2019): | $110,809,315 |
Additional Debt Type (Balance) (1) (3): | Pari Passu ($901,000,000)/ Subordinate ($249,000,000)/ Future Mezzanine/ Future Unsecured | | YE 2018 NOI: | $109,098,450 |
| | | YE 2017 NOI: | $94,190,007 |
| | | YE 2016 NOI: | $93,821,386 |
| | | U/W Revenues: | $190,585,947 |
| | | U/W Expenses: | $71,435,784 |
Escrows and Reserves(4) | | U/W NOI: | $119,150,163 |
| Initial | Monthly | Cap | | U/W NCF: | $116,677,727 |
Taxes | $0 | Springing | NAP | | U/W DSCR based on NOI/NCF(1): | 3.92x / 3.83x |
Insurance | $0 | Springing | NAP | | U/W Debt Yield based on NOI/NCF(1): | 11.9% / 11.7% |
Replacement Reserve | $0 | Springing | $1,024,605 | | U/W Debt Yield at Maturity based on
NOI/NCF(1): | 11.9% / 11.7% |
TI/LC Reserve | $0 | Springing | $5,123,024 | | Cut-off Date LTV Ratio(1): | 41.7% |
Unfunded Obligations Reserve | $36,389,727 | $0 | NAP | | LTV Ratio at Maturity(1): | 41.7% |
| | | | | | |
| | | | | | | |
Sources and Uses |
Sources | | | | | Uses | | | |
Original senior loan amount | $1,001,000,000 | | 80.1% | | Loan payoff | $1,052,884,467 | | 84.2% |
Subordinate companion loan amount | 249,000,000 | | 19.9 | | Closing Costs | 20,840,154 | | 1.7 |
| | | | | Reserves | 36,389,727 | | 2.9 |
| | | | | Return of equity | 139,885,652 | | 11.2 |
Total Sources | $1,250,000,000 | | 100.0% | | Total Uses | $1,250,000,000 | | 100.0% |
| (1) | The Cut-off Date Balance Per SF, Maturity Date Balance Per SF, U/W DSCR based on NOI/NCF, U/W Debt Yield based on NOI/NCF, U/W Debt Yield at Maturity based on NOI/NCF, Cut-off Date LTV Ratio and LTV Ratio at Maturity numbers presented above are based on the 1633 Broadway Senior Loan (as defined below). The U/W DSCR based on NOI/NCF, U/W Debt Yield based on NOI/NCF, U/W Debt Yield at Maturity based on NOI/NCF, Cut-off Date LTV Ratio and LTV Ratio at Maturity based upon the 1633 Broadway Whole Loan (as defined below) are 3.14x/3.07x, 9.5%/9.3%, 9.5%/9.3%, 52.1% and 52.1%, respectively. |
| (2) | Defeasance of the 1633 Broadway Whole Loan is permitted, in whole or in part without any partial release, at any time after the earlier to occur of (a) the end of the two year period commencing on the closing date of the securitization of the last promissory note representing a portion of the 1633 Broadway Whole Loan to be securitized and (b) November 25, 2022. The assumed defeasance lockout period of 26 payments is based on the closing date of this transaction in February 2020. |
| (3) | See “Subordinate and Mezzanine Indebtedness” and “Permitted Equityholder Debt” below for a further discussion of additional debt. |
| (4) | See “Escrows” section. |
THE INFORMATION IN THIS STRUCTURAL AND COLLATERAL TERM SHEET IS NOT COMPLETE AND MAY BE AMENDED PRIOR TO THE TIME OF SALE. THIS TERM SHEET IS NOT AN OFFER TO SELL THESE SECURITIES AND IT IS NOT A SOLICITATION OF AN OFFER TO BUY THESE SECURITIES IN ANY JURISDICTION WHERE THE OFFER OR SALE IS NOT PERMITTED.
49
Office – CBD | Loan # 2 | Cut-off Date Balance: | | $100,000,000 |
1633 Broadway New York, NY 10019 | 1633 Broadway | Cut-off Date LTV: U/W NCF DSCR: U/W NOI Debt Yield: | | 41.7% 3.83x 11.9% |
The Mortgage Loan. The mortgage loan (the “1633 Broadway Mortgage Loan”) is part of a whole loan (the “1633 Broadway Whole Loan”) that is evidenced by 34 pari passu senior promissory notes in the aggregate original principal amount of $1,001,000,000 (the “1633 Broadway Senior Loan”) and four pari passu subordinate promissory notes in the aggregate original principal amount of $249,000,000 (the “1633 Broadway Subordinate Companion Loan”). The 1633 Broadway Whole Loan is secured by a first priority fee mortgage encumbering a 48-story office tower located in New York, New York (the “1633 Broadway Property”). The 1633 Broadway Whole Loan was co-originated on November 25, 2019 by Goldman Sachs Bank USA, JPMorgan Chase Bank, National Association, DBR Investments Co. Limited and Wells Fargo Bank, National Association. The 1633 Broadway Mortgage Loan is evidenced by the non-controlling promissory Notes A-4-C-1 and A-4-C-2 in the aggregate original principal amount of $100,000,000. As shown in the “Note Summary” table below, eight promissory notes in the original aggregate principal amount of $250,000,000 were contributed to the BWAY 2019-1633 securitization trust. The 1633 Broadway Whole Loan will be serviced pursuant to the pooling and servicing agreement for the BWAY 2019-1633 securitization trust. The remaining 1633 Broadway Senior Loan pari passu notes are referred to herein as the “1633 Broadway Pari Passu Companion Loans”. See “Description of the Mortgage Pool—The Whole Loans—The Non-Serviced AB Whole Loans—The 1633 Broadway Whole Loan“ and “Pooling and Servicing Agreement” in the Preliminary Prospectus.
Note Summary
| Notes | Original Balance | Cut-off Date Balance | Note Holder | Controlling Piece |
| 1633 Broadway Senior Loan |
| A-1-S-1 | $250,000 | $250,000 | BWAY 2019-1633 | No |
| A-2-S-1 | $250,000 | $250,000 | BWAY 2019-1633 | No |
| A-3-S-1 | $250,000 | $250,000 | BWAY 2019-1633 | No |
| A-4-S-1 | $250,000 | $250,000 | BWAY 2019-1633 | No |
| A-1-C-1 | $50,000,000 | $50,000,000 | Goldman Sachs Bank USA | No |
| A-1-C-2 | $45,000,000 | $45,000,000 | GSMS 2020-GC45 | No |
| A-1-C-3 | $45,000,000 | $45,000,000 | Goldman Sachs Bank USA | No |
| A-1-C-4 | $40,000,000 | $40,000,000 | Goldman Sachs Bank USA | No |
| A-1-C-5 | $30,000,000 | $30,000,000 | Goldman Sachs Bank USA | No |
| A-1-C-6 | $20,000,000 | $20,000,000 | Goldman Sachs Bank USA | No |
| A-1-C-7 | $20,000,000 | $20,000,000 | Goldman Sachs Bank USA | No |
| A-2-C-1-A | $27,500,000 | $27,500,000 | DBR Investments Co. Limited | No |
| A-2-C-1-B | $22,500,000 | $22,500,000 | Benchmark 2020-B16 | No |
| A-2-C-2 | $50,000,000 | $50,000,000 | DBR Investments Co. Limited | No |
| A-2-C-3 | $40,000,000 | $40,000,000 | DBR Investments Co. Limited | No |
| A-2-C-4 | $40,000,000 | $40,000,000 | DBR Investments Co. Limited | No |
| A-2-C-5 | $15,000,000 | $15,000,000 | GSMS 2020-GC45 | No |
| A-2-C-6 | $35,000,000 | $35,000,000 | DBR Investments Co. Limited | No |
| A-2-C-7 | $20,000,000 | $20,000,000 | DBR Investments Co. Limited | No |
| A-3-C-1-A | $27,500,000 | $27,500,000 | JPMorgan Chase Bank, National Association | No |
| A-3-C-1-B | $22,500,000 | $22,500,000 | Benchmark 2020-B16 | No |
| A-3-C-2 | $50,000,000 | $50,000,000 | JPMorgan Chase Bank, National Association | No |
| A-3-C-3 | $40,000,000 | $40,000,000 | JPMorgan Chase Bank, National Association | No |
| A-3-C-4 | $40,000,000 | $40,000,000 | JPMorgan Chase Bank, National Association | No |
| A-3-C-5 | $30,000,000 | $30,000,000 | JPMorgan Chase Bank, National Association | No |
| A-3-C-6 | $20,000,000 | $20,000,000 | JPMorgan Chase Bank, National Association | No |
| A-3-C-7 | $20,000,000 | $20,000,000 | JPMorgan Chase Bank, National Association | No |
| A-4-C-1 | $50,000,000 | $50,000,000 | BANK 2020-BNK25 | No |
| A-4-C-2 | $50,000,000 | $50,000,000 | BANK 2020-BNK25 | No |
| A-4-C-3 | $40,000,000 | $40,000,000 | Wells Fargo Bank, National Association | No |
| A-4-C-4 | $40,000,000 | $40,000,000 | Wells Fargo Bank, National Association | No |
| A-4-C-5 | $30,000,000 | $30,000,000 | Wells Fargo Bank, National Association | No |
| A-4-C-6 | $20,000,000 | $20,000,000 | Wells Fargo Bank, National Association | No |
| A-4-C-7 | $20,000,000 | $20,000,000 | Wells Fargo Bank, National Association | No |
| Total (Senior Loan) | $1,001,000,000 | $1,001,000,000 | | |
| |
| 1633 Broadway Subordinate Companion Loan |
| B-1 | $62,250,000 | $62,250,000 | BWAY 2019-1633 | Yes(1)(2) |
| B-2 | $62,250,000 | $62,250,000 | BWAY 2019-1633 | Yes(1)(2) |
| B-3 | $62,250,000 | $62,250,000 | BWAY 2019-1633 | Yes(1)(2) |
| B-4 | $62,250,000 | $62,250,000 | BWAY 2019-1633 | Yes(1)(2) |
| Total (Subordinate Companion Loan) | $249,000,000 | $249,000,000 | | |
| Total (Whole Loan) | $1,250,000,000 | $1,250,000,000 | | |
THE INFORMATION IN THIS STRUCTURAL AND COLLATERAL TERM SHEET IS NOT COMPLETE AND MAY BE AMENDED PRIOR TO THE TIME OF SALE. THIS TERM SHEET IS NOT AN OFFER TO SELL THESE SECURITIES AND IT IS NOT A SOLICITATION OF AN OFFER TO BUY THESE SECURITIES IN ANY JURISDICTION WHERE THE OFFER OR SALE IS NOT PERMITTED.
50
Office – CBD | Loan # 2 | Cut-off Date Balance: | | $100,000,000 |
1633 Broadway New York, NY 10019 | 1633 Broadway | Cut-off Date LTV: U/W NCF DSCR: U/W NOI Debt Yield: | | 41.7% 3.83x 11.9% |
(1) | No single promissory note comprising a part of the whole loan is the related control note; however, the BWAY 2019-1633 securitization trust is the related controlling note holder, and a party designated under the related trust and servicing agreement is entitled to exercise the rights thereof. |
(2) | The 1633 Broadway Subordinate Companion Loan is subordinate to the 1633 Broadway Senior Loan. |
The Borrowers and Borrower Sponsor. The borrowers are PGREF I 1633 Broadway Tower, L.P. and PGREF I 1633 Broadway Land, L.P., each a Delaware limited partnership with two independent directors (the “1633 Broadway Borrower”). PGREF I 1633 Broadway Land, L.P. owns the 1633 Broadway Property entirely in fee and also ground leases the 1633 Broadway Property to PGREF I 1633 Broadway Tower, L.P. (i.e., both landlord and tenant interests in the ground lease are pledged as collateral, in addition to the fee interest in the 1633 Broadway Property). Legal counsel to the borrowers delivered a non-consolidation opinion in connection with the origination of the 1633 Broadway Whole Loan. There is no non-recourse carveout guarantor or separate environmental indemnitor with respect to the 1633 Broadway Loan.
The borrower sponsor is Paramount Group Operating Partnership LP, which indirectly owns and controls the borrowers. Paramount Group, Inc. (NYSE: PGRE), an approximately 91% general partner of the borrower sponsor, is a real estate investment trust that currently owns and/or manages a 13.4 million square foot portfolio of 18 Class A office and retail buildings in New York, Washington, D.C., and San Francisco. Paramount Group, Inc. has a New York portfolio that includes: 1633 Broadway, 1301 Avenue of the Americas, 1325 Avenue of the Americas, 31 West 52nd Street, 900 Third Avenue, 712 Fifth Avenue, 60 Wall Street, 745 Fifth Avenue, 718 Fifth Avenue, and 0 Bond Street.
The Property.
The 1633 Broadway Property is an approximately 2.6 million square foot, 48-story office tower that is situated with a full block of Broadway frontage between 50th and 51st Streets in Midtown Manhattan. The 1633 Broadway Property contains views of the Hudson River, Central Park, and Midtown from above the 36th floor. In addition to the office space, the 1633 Broadway Property includes retail space (anchored by Equinox), a parking garage across three levels below grade, two theaters comprising a total of 145,192 square feet (the Gershwin Theatre and Circle in the Square) and storage space comprising 18,384 square feet.
The 1633 Broadway Property is located on a 90,400 square foot parcel comprising the entire western block front of Broadway between West 50th and West 51st Streets within the Westside office submarket of Midtown. The 1633 Broadway Property was constructed in 1972 and was most recently renovated in 2013. Since 2010, the borrower sponsor has invested a total of approximately $41.6 million in lobby renovations, plaza redevelopment, and retail renovations. In addition, the borrower sponsor has invested approximately $230 million in tenant improvements and leasing commissions since 2010. The borrower sponsor provided a 10-year renovation budget which totals approximately $55.98 million; the renovation budget is anticipated to be utilized for items including a roof replacement, structural upgrades, fire alarm system upgrades, Gershwin Theatre upgrades, completion of the terrace on the 47th and 48th floors, and development of the Retail Cube. Such renovations are not required by the 1633 Broadway Whole Loan documents, and have not been reserved for. The lender can provide no assurances that such renovation will proceed as expected or at all.
The 1633 Broadway Property comprises 2,561,512 square feet and was 98.4% leased as of October 31, 2019. The office component of the 1633 Broadway Property is currently 100.0% leased to 17 tenants and represents approximately 93.4% of underwritten base rent. The retail space within the 1633 Broadway Property totals approximately 80,000 square feet of net rentable area and is anchored by Equinox (25,458 square feet) with a lease expiration date in February 2040.
The 1633 Broadway Property features two theatres that comprise 5.7% of the total net rentable area and account for 1.2% of the underwritten rental revenue. The larger of the two theatres is UT Associates (“Gershwin Theatre”), which is notable for having hosting Wicked since 2003. The Gershwin Theatre’s lease contains three, five-year renewal options that could potentially extend the term through May 2042. The 1633 Broadway Property contains an additional theatre known as the Circle in the Square, which encompasses 34,570 square feet and currently hosts the show OKLAHOMA! The 1633 Broadway Property also houses the Circle in the Square Theatre School, the only accredited training conservatory associated with a Broadway theatre, which offers two, two-year training programs, in acting and musical theatre. The tenant currently pays a total contract rent of $864,250, or $25.00 PSF through September 2021.
The parking component within the 1633 Broadway Property consists of a 250-space parking garage across three levels below grade and comprises 64,158 square feet of net rentable area. The space is currently leased to ABM Parking Services, Inc., a parking garage operator, which has a lease expiration date in July 2026. The operator is responsible for a contract rent of approximately $2.39 million, or $10,168 per space, which will increase by at least 1.50% per annum throughout the remainder of the lease.
Major Tenants.
Largest Tenant by UW Base Rent: Allianz Asset Mgmt of America (“Allianz”; AA-/Aa3/AA by Fitch/Moody’s/S&P; 320,911 square feet; 12.5% of net rentable area; 15.7% of underwritten base rent; 1/31/2031 lease expiration) – Allianz occupies six suites with leases expiring in January 2031. Allianz is an asset manager with over 800 investment professionals in 25 offices worldwide and manages assets for individuals, families and institutions. The 1633 Broadway Property serves as the United States headquarters for Allianz.
2nd Largest Tenant by UW Base Rent: Morgan Stanley & Co (“Morgan Stanley”; A/A3/BBB+ by Fitch/Moody’s/S&P; 260,829 square feet; 10.2% of net rentable area; 11.1% of underwritten base rent; 3/31/2032 lease expiration) – Morgan Stanley occupies five suites with leases expiring in March 2032. Morgan Stanley, a financial holding company, provides various financial products and services to corporations, governments, financial institutions and individuals in the Americas, Europe, the Middle East, Africa and Asia. The company operates through three segments: Institutional Securities, Wealth Management and Investment Management.
3rd Largest Tenant by UW Base Rent: WMG Acquisition Corp (“Warner Music Group”; 293,888 square feet; 11.5% of net rentable area; 10.4% of underwritten base rent; 7/31/2029 lease expiration and month-to-month storage space) – Warner Music Group is an
THE INFORMATION IN THIS STRUCTURAL AND COLLATERAL TERM SHEET IS NOT COMPLETE AND MAY BE AMENDED PRIOR TO THE TIME OF SALE. THIS TERM SHEET IS NOT AN OFFER TO SELL THESE SECURITIES AND IT IS NOT A SOLICITATION OF AN OFFER TO BUY THESE SECURITIES IN ANY JURISDICTION WHERE THE OFFER OR SALE IS NOT PERMITTED.
51
Office – CBD | Loan # 2 | Cut-off Date Balance: | | $100,000,000 |
1633 Broadway New York, NY 10019 | 1633 Broadway | Cut-off Date LTV: U/W NCF DSCR: U/W NOI Debt Yield: | | 41.7% 3.83x 11.9% |
American multinational entertainment and record label conglomerate. It is one of the “Big Three” recording companies and the third largest in the global music industry, next to Universal Music Group and Sony Music Entertainment. Warner Music Group is headquartered at the 1633 Broadway Property.
The following table presents certain information relating to the tenancy at the 1633 Broadway Property:
Major Tenants
Tenant Name | Credit Rating
(Fitch/
Moody’s/
S&P)(1) | Tenant
NRSF | % of
NRSF | Annual
U/W Base
Rent PSF(2) | Annual
U/W Base
Rent(2) | % of
Total
Annual
U/W
Base
Rent | Lease
Expiration
Date | Extension Options | Term. Option
(Y/N) |
Major Tenants | | | | | | | | |
Allianz(3) | AA-/Aa3/AA | 320,911 | 12.5% | $82.66(3) | $26,527,064(3) | 15.7% | 1/31/2031 | 5 or 10 years(4) | N |
Morgan Stanley | A/A3/BBB+ | 260,829 | 10.2% | $71.61 | $18,677,050 | 11.1% | 3/31/2032 | 2, 5-year or 1, 10-year | Y(5) |
WMG Acquisition Corp(6) | NR/NR/NR | 293,888 | 11.5% | $59.62(6) | $17,520,179(6) | 10.4% | Various | 1, 5-year or 10-year | N |
Showtime Networks Inc | BBB/Baa2/BBB | 261,196 | 10.2% | $55.28 | $14,438,861 | 8.6% | 1/31/2026 | 1, 5-year or 10-year | N |
Kasowitz Benson Torres(7) | NR/NR/NR | 203,394 | 7.9% | $68.00(7) | $13,830,452(7) | 8.2% | 3/31/2037 | 2, 5-year | Y(8) |
New Mountain Capital, LLC(9) | NR/NR/NR | 108,374 | 4.2% | $86.00(9) | $9,320,164(9) | 5.5% | 10/15/2035 | 1, 5-year | N |
Charter Communications Holding | NR/Ba2/BB+ | 106,176 | 4.1% | $84.00 | $8,918,784 | 5.3% | 12/15/2025 | NAP | N |
MongoDB, Inc. | NR/NR/NR | 106,230 | 4.1% | $76.00 | $8,073,480 | 4.8% | 12/31/2029 | 1, 5-year | N |
Travel Leaders Group, LLC | NR/NR/B+ | 107,205 | 4.2% | $74.58 | $7,994,846 | 4.7% | 12/31/2033 | 1, 5-year | N |
Assured Guaranty Municipal | NR/NR/A | 103,838 | 4.1% | $69.88 | $7,256,550 | 4.3% | 2/28/2032 | 1, 5-year | N |
Total Major Tenants | 1,872,041 | 73.1% | $70.81 | $132,557,430 | 78.5% | | | |
| | | | | | | | |
Non-Major Tenant | 649,710 | 25.4% | $55.74 | $36,213,171 | 21.5% | | | |
| | | | | | | | |
Occupied Collateral Total | 2,521,751 | 98.4% | $66.93 | $168,770,601 | 100.0% | | | |
| | | | | | | | |
Vacant Space | 39,761 | 1.6% | | | | | | |
| | | | | | | | |
Collateral Total | 2,561,512 | 100.0% | | | | | | |
| | | | | | | | | |
(1) | Certain ratings are those of the parent company whether or not the parent company guarantees the lease. |
(2) | Annual U/W Base Rent PSF and Annual U/W Base Rent include contractual rent steps through November 2020 totaling $1,272,795. The lender’s underwriting gives separate credit for the net present value of contractual rent step increments over the lease term using a discount rate of 7.0% (for investment grade tenants) totaling $7,558,579 (see “Operating History and Underwritten Net Cash Flow” below). The Annual U/W Base Rent PSF and Annual U/W Base Rent shown in the table above do not include credit given for such investment grade tenants. |
(3) | Allianz Asset Mgmt of America subleases 20,600 square feet of suite 4600 (totaling 54,118 square feet) to Triumph Hospitality at a base rent of $46.80 PSF through December 30, 2030. Triumph Hospitality further subleases 3,000 square feet of suite 4600 to Stein Adler Dabah & Zelkowitz at a base rent of $41.33 PSF through July 31, 2022. Underwritten base rent is based on the contractual rent under the prime lease. |
(4) | Subject to a maximum of 15 years in the aggregate. |
(5) | Morgan Stanley has the option to terminate its lease as to all or any portion (but not less than one full floor) of its space at any time after April 1, 2027, upon 18 months’ notice and payment of a termination fee. |
(6) | WMG Acquisition Corp subleases 3,815 square feet of suite 0400 (totaling 36,854 square feet) to Cooper Investment Partners LLC at a base rent of $58.37 PSF on a month-to-month basis. Underwritten base rent is based on the contractual rent under the prime lease. |
(7) | Kasowitz Benson Torres subleases a collective 32,487 square feet of Suite 2200 (totaling 50,718 square feet) to three tenants. Delcath Systems, Inc. subleases 6,877 square feet and pays a rent of $68.50 PSF through February 28, 2021; Avalonbay Communities subleases 12,145 square feet through October 31, 2026 and pays a current rent of $74.00 PSF; Cresa New York subleases 13,195 square feet and pays a rent of $65.00 PSF through April 30, 2021. Underwritten base rent is based on the contractual rent under the prime lease. |
(8) | Kasowitz Benson Torres has the right to terminate one full floor of the premises located on the uppermost or lowermost floors, effective as of March 31, 2024, upon notice by March 31, 2023. |
(9) | New Mountain Capital, LLC has executed a lease but has not yet taken occupancy or begun paying rent. We cannot assure you that they will take occupancy or begin paying rent as expected or at all. |
THE INFORMATION IN THIS STRUCTURAL AND COLLATERAL TERM SHEET IS NOT COMPLETE AND MAY BE AMENDED PRIOR TO THE TIME OF SALE. THIS TERM SHEET IS NOT AN OFFER TO SELL THESE SECURITIES AND IT IS NOT A SOLICITATION OF AN OFFER TO BUY THESE SECURITIES IN ANY JURISDICTION WHERE THE OFFER OR SALE IS NOT PERMITTED.
52
Office – CBD | Loan # 2 | Cut-off Date Balance: | | $100,000,000 |
1633 Broadway New York, NY 10019 | 1633 Broadway | Cut-off Date LTV: U/W NCF DSCR: U/W NOI Debt Yield: | | 41.7% 3.83x 11.9% |
The following table presents certain information relating to the lease rollover schedule at the 1633 Broadway Property:
Lease Expiration Schedule(1)(2)
Year Ending
December 31, | No. of
Leases Expiring | Expiring
NRSF | % of
Total
NRSF | Cumulative
Expiring
NRSF | Cumulative
% of Total
NRSF | Annual
U/W
Base Rent(3) | % of Total
Annual U/W
Base Rent | Annual
U/W
Base Rent
PSF(3) |
MTM | 13 | 9,482 | 0.4% | 9,482 | 0.4% | $638,145 | 0.4% | $67.30 |
2020 | 2 | 960 | 0.0% | 10,442 | 0.4% | $28,800 | 0.0% | $30.00 |
2021 | 3 | 86,460 | 3.4% | 96,902 | 3.8% | $4,756,000 | 2.8% | $55.01 |
2022 | 4 | 116,337 | 4.5% | 213,239 | 8.3% | $2,813,374 | 1.7% | $24.18 |
2023 | 7 | 38,550 | 1.5% | 251,789 | 9.8% | $1,299,854 | 0.8% | $33.72 |
2024 | 1 | 51,276 | 2.0% | 303,065 | 11.8% | $4,666,116 | 2.8% | $91.00 |
2025 | 4 | 106,176 | 4.1% | 409,241 | 16.0% | $8,918,784 | 5.3% | $84.00 |
2026 | 11 | 383,584 | 15.0% | 792,825 | 31.0% | $20,397,741 | 12.1% | $53.18 |
2027 | 3 | 55,247 | 2.2% | 848,072 | 33.1% | $4,584,436 | 2.7% | $82.98 |
2028 | 4 | 90,001 | 3.5% | 938,073 | 36.6% | $6,043,229 | 3.6% | $67.15 |
2029 | 10 | 399,717 | 15.6% | 1,337,790 | 52.2% | $25,579,624 | 15.2% | $63.99 |
2030 | 0 | 0 | 0.0% | 1,337,790 | 52.2% | $0 | 0.0% | $0.00 |
Thereafter | 28 | 1,183,961 | 46.2% | 2,521,751 | 98.4% | $89,044,498 | 52.8% | $75.21 |
Vacant | 0 | 39,761 | 1.6% | 2,561,512 | 100.0% | $0 | 0.0% | $0.00 |
Total/Weighted Average | 90 | 2,561,512 | 100.0% | | | $168,770,601 | 100.0% | $66.93 |
(1) | Information obtained from the underwritten rent roll. |
(2) | Certain tenants may have lease termination options that are exercisable prior to the originally stated expiration date of the subject lease and that are not considered in the Lease Expiration Schedule. |
(3) | Total/Weighted Average Annual U/W Base Rent and Annual U/W Base Rent PSF exclude vacant space. |
The following table presents historical occupancy percentages at the 1633 Broadway Property:
Historical Occupancy
12/31/2015(1) | | 12/31/2016(1) | | 12/31/2017(1) | | 12/31/2018(1) | | 10/31/2019(2) |
92.7% | | 86.3% | | 95.4% | | 95.4% | | 98.4% |
| (1) | Information obtained from the borrower. |
| (2) | Information obtained from the underwritten rent roll. |
THE INFORMATION IN THIS STRUCTURAL AND COLLATERAL TERM SHEET IS NOT COMPLETE AND MAY BE AMENDED PRIOR TO THE TIME OF SALE. THIS TERM SHEET IS NOT AN OFFER TO SELL THESE SECURITIES AND IT IS NOT A SOLICITATION OF AN OFFER TO BUY THESE SECURITIES IN ANY JURISDICTION WHERE THE OFFER OR SALE IS NOT PERMITTED.
53
Office – CBD | Loan # 2 | Cut-off Date Balance: | | $100,000,000 |
1633 Broadway New York, NY 10019 | 1633 Broadway | Cut-off Date LTV: U/W NCF DSCR: U/W NOI Debt Yield: | | 41.7% 3.83x 11.9% |
Operating History and Underwritten Net Cash Flow. The following table presents certain information relating to the underwritten net cash flow at the 1633 Broadway Property:
Cash Flow Analysis
| | 2016 | | 2017 | | 2018 | | TTM
9/30/2019 | | U/W | | %(1) | | U/W $
per SF | |
Base Rent | | $141,156,682 | | $143,219,431 | | $160,621,035 | | $161,646,240 | | $167,497,806 | | 84.3% | | $65.39 | |
Contractual Rent Steps(2) | | 0 | | 0 | | 0 | | 0 | | 1,272,795 | | 0.6 | | 0.50 | |
Credit Tenant Rent Average(3) | | 0 | | 0 | | 0 | | 0 | | 7,558,579 | | 3.8 | | 2.95 | |
Grossed Up Vacant Space | | 0 | | 0 | | 0 | | 0 | | 2,879,875 | | 1.4 | | 1.12 | |
Gross Potential Rent | | $141,156,682 | | $143,219,431 | | $160,621,035 | | $161,646,240 | | $179,209,055 | | 90.2% | | $69.96 | |
Other Income(4) | | 5,692,549 | | 5,017,065 | | 4,645,691 | | 4,240,034 | | 4,279,853 | | 2.2 | | 1.67 | |
Total Recoveries | | 9,150,315 | | 11,228,307 | | 13,952,510 | | 16,874,074 | | 15,267,588 | | 7.7 | | 5.96 | |
Net Rental Income | | $155,999,546 | | $159,464,803 | | $179,219,236 | | $182,760,348 | | $198,756,496 | | 100.0% | | $77.59 | |
(Vacancy & Credit Loss) | | (309,756) | | 0 | | 0 | | 0 | | (8,170,549)(5) | | (4.6) | | (3.19) | |
Effective Gross Income | | $155,689,790 | | $159,464,803 | | $179,219,236 | | $182,760,348 | | $190,585,947 | | 95.9% | | $74.40 | |
| | | | | | | | | | | | | | | |
Real Estate Taxes | | 35,413,254 | | 38,391,946 | | 41,366,170 | | 43,693,114 | | 45,478,153 | | 23.9 | | 17.75 | |
Insurance | | 1,061,417 | | 908,564 | | 1,009,544 | | 1,082,131 | | 1,069,190 | | 0.6 | | 0.42 | |
Management Fee | | 2,507,162 | | 2,981,306 | | 3,149,432 | | 3,287,347 | | 1,000,000 | | 0.5 | | 0.39 | |
Other Operating Expenses | | 22,886,571 | | 22,992,980 | | 24,595,640 | | 23,888,441 | | 23,888,441 | | 12.5 | | 9.33 | |
Total Operating Expenses | | $61,868,404 | | $65,274,796 | | $70,120,786 | | $71,951,033 | | $71,435,784 | | 37.5% | | $27.89 | |
| | | | | | | | | | | | | | | |
Net Operating Income | | $93,821,386 | | $94,190,007 | | $109,098,450 | | $110,809,315 | | $119,150,163 | | 62.5% | | $46.52 | |
Replacement Reserves | | 0 | | 0 | | 0 | | 0 | | 461,072 | | 0.2 | | 0.18 | |
TI/LC | | 0 | | 0 | | 0 | | 0 | | 2,011,364 | | 1.1 | | 0.79 | |
Net Cash Flow | | $93,821,386 | | $94,190,007 | | $109,098,450 | | $110,809,315 | | $116,677,727 | | 61.2% | | $45.55 | |
| | | | | | | | | | | | | | | |
NOI DSCR(6) | | 3.08x | | 3.10x | | 3.59x | | 3.64x | | 3.92x | | | | | |
NCF DSCR(6) | | 3.08x | | 3.10x | | 3.59x | | 3.64x | | 3.83x | | | | | |
NOI Debt Yield(6) | | 9.4% | | 9.4% | | 10.9% | | 11.1% | | 11.9% | | | | | |
NCF Debt Yield(6) | | 9.4% | | 9.4% | | 10.9% | | 11.1% | | 11.7% | | | | | |
(1) | Represents (i) percent of Net Rental Income for all revenue fields, (ii) percent of Gross Potential Rent for Vacancy & Credit Loss and (iii) percent of Effective Gross Income for all other fields. |
(2) | Includes contractual rent steps through November 30, 2020. |
(3) | Reflects the net present value of contractual rent step increments over the lease term using a discount rate of 7.0% (for investment grade tenants). |
(4) | Other Income consists of overage rent, storage income, parking income, lease termination income, tenant work order income and other miscellaneous income. |
(5) | The underwritten economic vacancy is 4.6%. The 1633 Broadway Property was 98.4% occupied as of October 31, 2019. |
(6) | The debt service coverage ratios and debt yields are based on the 1633 Broadway Senior Loan and excludes subordinate debt. |
Appraisal. The appraiser concluded to an “as-is” Appraised Value for the 1633 Broadway Property of $2,400,000,000 as of October 24, 2019.
Environmental Matters. According to the Phase I environmental site assessment dated October 30, 2019, there was no evidence of any recognized environmental conditions at the 1633 Broadway Property.
THE INFORMATION IN THIS STRUCTURAL AND COLLATERAL TERM SHEET IS NOT COMPLETE AND MAY BE AMENDED PRIOR TO THE TIME OF SALE. THIS TERM SHEET IS NOT AN OFFER TO SELL THESE SECURITIES AND IT IS NOT A SOLICITATION OF AN OFFER TO BUY THESE SECURITIES IN ANY JURISDICTION WHERE THE OFFER OR SALE IS NOT PERMITTED.
54
Office – CBD | Loan # 2 | Cut-off Date Balance: | | $100,000,000 |
1633 Broadway New York, NY 10019 | 1633 Broadway | Cut-off Date LTV: U/W NCF DSCR: U/W NOI Debt Yield: | | 41.7% 3.83x 11.9% |
Market Overview and Competition. The 1633 Broadway Property is located in the Times Square neighborhood of Midtown Manhattan, a high traffic commercial corridor that produces 15% of New York City’s economic output. The neighborhood is bounded by 41st Street to the south and 52nd Street to the north between Avenue of the Americas and Eighth Avenue. The 1633 Broadway Property is located within one block of the 50th Street/Broadway, 50th Street and 49th Street subway stations, which serve the 1, 2, C, E, N, R and W lines.
According to the appraisal, the 1633 Broadway Property is located within the Westside office submarket of Midtown within the Manhattan market. Historically, the submarket has benefitted from the office space located around the boundaries of Central Park along major corridors such as West 57th Street, Broadway and Seventh Avenue, which consist primarily of Class A office product that take advantage of protected Central Park views. The area’s proximity to these locations has assisted with the historically low vacancy and availability rates exhibited by this submarket since 2010. As of the third quarter of 2019, the Westside office submarket had an existing inventory of approximately 25.7 million square feet, a vacancy rate of 5.4% and an average asking rent of $66.21 PSF. As of the third quarter of 2019, the Manhattan office market had an existing inventory of approximately 456.1 million square feet, a vacancy rate of 5.9% and an average asking rent of $79.25 PSF.
The following table presents certain information relating to the appraiser’s market rent conclusions for the 1633 Broadway Property:
Market Rent Summary(1)
| Office Floors
2 to 9 | Office
Floors 10 to
18 | Office Floors
19 to 26 | Office Floors
27 to 35 | Office Floors
36 to 43 | Office Floors
44 to 48 |
Market Rent (PSF) | $65.00 | $68.00 | $72.00 | $76.00 | $85.00 | $90.00 |
Lease Term (Years) | 15 | 15 | 15 | 15 | 15 | 15 |
Lease Type (Reimbursements) | MG | MG | MG | MG | MG | MG |
Rent Increase Projection | 10% increase every 5 years | 10% increase every 5 years | 10% increase every 5 years | $10% increase every 5 years | 10% increase every 5 years | 10% increase every 5 years |
| (1) | Information obtained from the appraisal. |
The table below presents certain information relating to comparable sales pertaining to the 1633 Broadway Property identified by the appraiser:
Comparable Sales(1)
Property Name | Location | Rentable
Area (SF) | Sale Date | Sale Price | Sale Price
(PSF) |
150 East 42nd Street | New York, NY | 1,698,603 | Oct-19 | $1,300,000,000 | $765.33 |
330 Madison Avenue | New York, NY | 855,000 | Jul-19 | $900,000,000 | $1,052.63 |
30 Hudson Yards | New York, NY | 1,463,234 | Apr-19 | $2,155,000,000 | $1,472.77 |
237 Park Avenue | New York, NY | 1,260,160 | Jan-19 | $1,200,000,000 | $952.26 |
425 Lexington Avenue | New York, NY | 728,171 | Nov-18 | $701,000,000 | $962.69 |
666 Fifth Avenue | New York, NY | 1,437,546 | Aug-18 | $1,286,082,681 | $894.64 |
1515 Broadway | New York, NY | 1,897,131 | Nov-17 | $1,950,000,000 | $1,027.87 |
825 Eighth Avenue | New York, NY | 2,080,000 | Oct-17 | $1,700,000,000 | $817.31 |
245 Park Avenue | New York, NY | 1,779,515 | May-17 | $2,210,000,000 | $1,241.91 |
| (1) | Information obtained from the appraisal. |
THE INFORMATION IN THIS STRUCTURAL AND COLLATERAL TERM SHEET IS NOT COMPLETE AND MAY BE AMENDED PRIOR TO THE TIME OF SALE. THIS TERM SHEET IS NOT AN OFFER TO SELL THESE SECURITIES AND IT IS NOT A SOLICITATION OF AN OFFER TO BUY THESE SECURITIES IN ANY JURISDICTION WHERE THE OFFER OR SALE IS NOT PERMITTED.
55
Office – CBD | Loan # 2 | Cut-off Date Balance: | | $100,000,000 |
1633 Broadway New York, NY 10019 | 1633 Broadway | Cut-off Date LTV: U/W NCF DSCR: U/W NOI Debt Yield: | | 41.7% 3.83x 11.9% |
The following tables present certain information relating to comparable office leases for the 1633 Broadway Property:
Comparable Leases(1)
Property
Name/Location | Year Built/
Renovated | Total GLA
(SF) | Distance
from
Subject | Occupancy | Tenant | Tenant
Size (SF) | Lease
Start
Date | Lease Term | Annual
Base
Rent
PSF | Lease Type |
1155 Avenue of the Americas New York, NY | 1984/2016 | 752,996 | 1.0 mile | 74.8% | BKD, LLC | 20,899 | Sep-19 | 13.5 Yrs | $77.00 | MG |
1 Rockefeller Plaza New York, NY | 1936/NAV | 603,397 | 0.5 miles | 99.1%(2) | Veteran Advisers, Inc. | 2,552 | Sep-19 | 7.7 Yrs | $83.50 | MG |
1675 Broadway New York, NY | 1990/NAV | 878,321 | 0.4 miles | 96.9% | Davis & Gilbert LLP | 85,852 | Aug-19 | 16.0 Yrs | $72.00 | MG |
142 West 57th Street New York, NY | 1986/NAV | 255,586 | 0.7 miles | 88.2%(2) | Wedbush Securities Inc. | 15,626 | Aug-19 | 10.8 Yrs | $65.00 | MG |
1251 Avenue of the Americas New York, NY | 1971/NAV | 2,364,000 | 0.2 miles | 94.4% | IHI Americas, Inc. | 9,438 | Jul-19 | 10.3 Yrs | $70.50 | MG |
1345 Avenue of the Americas New York, NY | 1969/1988 | 1,998,994 | 0.5 miles | 94.8% | Global Infrastructure Partners | 84,856 | Jun-19 | 17.0 Yrs | $89.50 | MG |
810 Seventh Avenue New York, NY | 1970/NAV | 765,000 | 0.5 miles | 93.3% | Colonial Consulting LLC | 17,320 | May-19 | 12.5 Yrs | $71.00 | MG |
1271 Avenue of the Americas New York, NY | 1957/2019 | 2,100,000 | 0.2 miles | 98.0% | Greenhill & Company AIG – American International Group, Inc. | 77,622 320,237 | May-19 Apr-19 | 15.3 Yrs 16.5 Yrs | $91.00 $97.13 | MG MG |
1700 Broadway New York, NY | 1968/2003 | 625,000 | 0.6 miles | 81.5%(2) | Excel Sports Management, LLC M. Arthur Gensler, Jr. & Associates, Inc. | 17,078 13,237 | Apr-19 Jan-19 | 7.6 Yrs 9.9 Yrs | $79.00 $71.00 | MG MG |
1325 Avenue of the Americas New York, NY | 1989/NAV | 808,998 | 0.5 miles | 88.3% | Dominus Capital, L.P. | 9,361 | Mar-19 | 10.5 Yrs | $75.00 | MG |
1290 Avenue of the Americas New York, NY | 1963/1996 | 2,113,000 | 0.3 miles | 100.0% | Linklaters, LLP | 90,508 | Mar-19 | 16.1 Yrs | $84.00 | MG |
1177 Avenue of the Americas New York, NY | 1992/2013 | 1,000,000 | 0.9 miles | 90.2% | Mill Point Capital | 11,644 | Jan-19 | 10.5 Yrs | $87.00 | MG |
114 West 47th Street New York, NY | 1989/NAV | 658,000 | 0.8 miles | 94.3%(2) | IFM Investments | 18,000 | Oct-18 | 15.0 Yrs | $68.00 | MG |
(1) | Information obtained from the appraisal. |
(2) | Information obtained from a third party market research provider. |
Escrows.
Real Estate Taxes – Upon the occurrence and continuance of a Cash Trap Event Period (see “Lockbox and Cash Management” section), the 1633 Broadway Whole Loan documents require ongoing monthly real estate tax reserves in an amount equal to one-twelfth of the real estate taxes that the lender reasonably estimates will be payable during the next 12 months.
Insurance – Upon the occurrence and continuance of a Cash Trap Event Period, the 1633 Broadway Whole Loan documents require ongoing monthly insurance reserves in an amount equal to one-twelfth of the insurance premiums that the lender reasonably estimates will be payable for the renewal of the coverage during the next 12 months;provided, however, that, notwithstanding any prior springing conditions, the reserve will not be required if the 1633 Broadway Borrower maintains a blanket insurance policy reasonably acceptable to the lender and no event of default is continuing.
THE INFORMATION IN THIS STRUCTURAL AND COLLATERAL TERM SHEET IS NOT COMPLETE AND MAY BE AMENDED PRIOR TO THE TIME OF SALE. THIS TERM SHEET IS NOT AN OFFER TO SELL THESE SECURITIES AND IT IS NOT A SOLICITATION OF AN OFFER TO BUY THESE SECURITIES IN ANY JURISDICTION WHERE THE OFFER OR SALE IS NOT PERMITTED.
56
Office – CBD | Loan # 2 | Cut-off Date Balance: | | $100,000,000 |
1633 Broadway New York, NY 10019 | 1633 Broadway | Cut-off Date LTV: U/W NCF DSCR: U/W NOI Debt Yield: | | 41.7% 3.83x 11.9% |
Replacement Reserve – Upon the occurrence and continuance of a Cash Trap Event Period, the 1633 Broadway Whole Loan documents require ongoing monthly replacement reserves of $42,692 subject to a cap of $1,024,605.
TI/LC Reserve – Upon the occurrence and continuance of a Cash Trap Event Period, the 1633 Broadway Whole Loan documents require ongoing monthly rollover reserves of $213,459 subject to a cap of $5,123,024.
Unfunded Obligations Reserve – The 1633 Broadway Whole Loan documents require an upfront deposit of $36,389,727, along with a $4,000,000 guaranty made by Paramount Group Operating Partnership LP, for outstanding tenant improvements, leasing commissions and free rent pertaining to 11 tenants at the 1633 Broadway Property at the time of origination of the 1633 Broadway Whole Loan.
Lockbox and Cash Management. The 1633 Broadway Whole Loan documents require that the 1633 Broadway Borrower establish and maintain a lender-controlled lockbox account, which is already in place, and that the borrower direct all tenants to pay rent directly into such lockbox account and the 1633 Broadway Borrower or property manager deposit any rent received within one business day. Prior to the occurrence of a Cash Trap Event Period (as defined below), all funds on deposit in the lockbox account will be disbursed to the 1633 Broadway Borrower. During a Cash Trap Event Period, all funds in the lockbox account are required to be swept each business day into the cash management account controlled by the lender and, on each payment date, all funds in the cash management account are required to be applied in accordance with the 1633 Broadway Whole Loan documents. During a Cash Trap Event Period, any excess cash flow remaining after satisfaction of the waterfall items is required to be swept to an excess cash flow subaccount to be held by the lender as additional security for the 1633 Broadway Whole Loan and, provided no event of default exists, disbursed for budgeted operating expenses, reserves or to the lender and/or the 1633 Broadway Borrower in accordance with the 1633 Broadway Whole Loan documents.
A “Cash Trap Event Period” will commence upon the earlier of the following:
| (i) | the occurrence and continuance of an event of default; |
| (ii) | the net operating income debt yield (“NOI DY”) for the 1633 Broadway Whole Loan falling below 5.75% at the end of two consecutive calendar quarter; or |
| (iii) | the failure to deliver financial reports to the lender as and when required pursuant to the 1633 Broadway Whole Loan documents. |
A Cash Trap Event Period will end upon the occurrence of the following:
| | with regard to clause (i) above, the cure of such event of default; |
| | with regard to clause (ii) above: |
| ○ | (a) the NOI DY for the 1633 Broadway Whole Loan being greater than or equal to 5.75% for two consecutive calendar quarters; |
| ○ | (b) provided no event of default is continuing, the 1633 Broadway Borrower delivering to the lender as additional collateral and security a combination of one or more of the following reasonably acceptable to the lender: (x) sponsor guarantees (not to exceed an aggregate notional amount of $4,000,000), (y) letters of credit (subject in the aggregate notional amount, along with any sponsor guarantees, to a cap of 10% of the outstanding principal balance of the 1633 Broadway Whole Loan) and/or cash collateral, which, if applied to the principal balance, would cause the NOI DY to equal or exceed 5.75%; or |
| | with regard to clause (iii), such financial reports having been received by the lender and indicating that no Cash Trap Event Period is ongoing. |
Property Management. The 1633 Broadway Property is managed by an affiliate of the borrower sponsor.
Partial Release. Not permitted.
Real Estate Substitution. Not permitted.
Subordinate and Mezzanine Indebtedness. The 1633 Broadway Property also secures the 1633 Broadway Pari Passu Companion Loans, which have an aggregate Cut-off Date principal balance of $901,000,000 and the 1633 Broadway Subordinate Companion Loans, which have an aggregate Cut-off Date principal balance of $249,000,000. The 1633 Broadway Pari Passu Companion Loans and the 1633 Broadway Subordinate Companion Loan are coterminous with the 1633 Broadway Mortgage Loan. The 1633 Broadway Pari Passu Companion Loans accrue interest at the same rate as the 1633 Broadway Mortgage Loan, and the 1633 Broadway Subordinate Companion Loan accrues interest at an interest rate of 2.9900%. The 1633 Broadway Mortgage Loan and the 1633 Broadway Pari Passu Companion Loans are each pari passu in right of payment and together are senior in right of payment to the 1633 Broadway Subordinate Companion Loan. The holders of the 1633 Broadway Mortgage Loan, the 1633 Broadway Pari Passu Companion Loans and the 1633 Broadway Subordinate Companion Loan have entered into a co-lender agreement which sets forth the allocation of collections on the 1633 Broadway Whole Loan. See “Description of the Mortgage Pool—The Whole Loans—The Non-Serviced AB Whole Loans—The 1633 Broadway Whole Loan “ in the Preliminary Prospectus.
THE INFORMATION IN THIS STRUCTURAL AND COLLATERAL TERM SHEET IS NOT COMPLETE AND MAY BE AMENDED PRIOR TO THE TIME OF SALE. THIS TERM SHEET IS NOT AN OFFER TO SELL THESE SECURITIES AND IT IS NOT A SOLICITATION OF AN OFFER TO BUY THESE SECURITIES IN ANY JURISDICTION WHERE THE OFFER OR SALE IS NOT PERMITTED.
57
Office – CBD | Loan # 2 | Cut-off Date Balance: | | $100,000,000 |
1633 Broadway New York, NY 10019 | 1633 Broadway | Cut-off Date LTV: U/W NCF DSCR: U/W NOI Debt Yield: | | 41.7% 3.83x 11.9% |
The following table presents certain information relating to the 1633 Broadway Subordinate Companion Loan:
Subordinate Note Summary
| B-Note Original
Principal Balance | B-Note Interest Rate | Original
Term
(mos.) | Original
Amort. Term (mos.) | Original IO Term
(mos.) | Total Debt
UW NCF DSCR | Total Debt
UW NOI Debt
Yield | Total Debt
Cut-off Date LTV |
1633 Broadway Subordinate Companion Loan | $249,000,000 | 2.9900% | 120 | 0 | 120 | 3.07x | 9.5% | 52.1% |
Ground Lease. None.
Permitted Equityholder Debt. The direct or indirect equity owners of the 1633 Broadway Borrower are permitted to incur equityholder debt from an institutional lender secured by a pledge of their direct or indirect equity interests in the 1633 Broadway Borrower so long as, among other conditions pursuant to the 1633 Broadway Whole Loan documents: (a) the lender and such institutional lender have entered into a customary subordination and intercreditor agreement reasonably acceptable to the lender, (b) such loan is coterminous with the 1633 Broadway Whole Loan or is freely pre-payable without premium or penalty from and after the maturity date, (c) immediately after giving effect to the closing of such loan, the net operating income debt yield (as calculated in the 1633 Broadway Whole Loan documents) is not less than 9.35%, (d) immediately after giving effect to the closing of such loan, the loan-to-value ratio (as calculated in the 1633 Broadway Whole Loan documents) does not exceed 52.08%, (e) immediately after giving effect to the closing of such debt, the net operating income debt service coverage ratio (as calculated in the 1633 Broadway Whole Loan documents) is not less than 3.08x, (f) such loan is current-pay only, with no “pay-in-kind” or similar accrual feature, (g) if the permitted equityholder debt bears a floating rate of interest, the borrower acquires and maintains an interest rate cap or swap agreement from a counterparty acceptable to the lender in its reasonable discretion with a notional amount that is not less than the outstanding principal balance of the permitted equityholder debt and with a reasonable strike price; (h) rating agency confirmation is obtained; and (i) the permitted equityholder debt is not closed prior to the date that is at least one year after the closing date of the 1633 Broadway Whole Loan. See “Description of the Mortgage Pool—Additional Indebtedness—Mezzanine Indebtedness” in the Preliminary Prospectus.
Terrorism Insurance. The 1633 Broadway Whole Loan documents require that the “all risk” insurance policy required to be maintained by the 1633 Broadway Borrower provides coverage for terrorism in an amount equal to the full replacement cost of the 1633 Broadway Property, as well as business interruption insurance covering no less than the 24-month period following the occurrence of a casualty event, together with a 12-month extended period of indemnity (provided that if TRIPRA or a similar statute is not in effect, the 1633 Broadway Borrower will not be obligated to pay terrorism insurance premiums in excess of two times the premium for the casualty and business interruption coverage on a stand-alone basis).
THE INFORMATION IN THIS STRUCTURAL AND COLLATERAL TERM SHEET IS NOT COMPLETE AND MAY BE AMENDED PRIOR TO THE TIME OF SALE. THIS TERM SHEET IS NOT AN OFFER TO SELL THESE SECURITIES AND IT IS NOT A SOLICITATION OF AN OFFER TO BUY THESE SECURITIES IN ANY JURISDICTION WHERE THE OFFER OR SALE IS NOT PERMITTED.
58
(THIS PAGE INTENTIONALLY LEFT BLANK)
THE INFORMATION IN THIS STRUCTURAL AND COLLATERAL TERM SHEET IS NOT COMPLETE AND MAY BE AMENDED PRIOR TO THE TIME OF SALE. THIS TERM SHEET IS NOT AN OFFER TO SELL THESE SECURITIES AND IT IS NOT A SOLICITATION OF AN OFFER TO BUY THESE SECURITIES IN ANY JURISDICTION WHERE THE OFFER OR SALE IS NOT PERMITTED.
59
Hospitality – Full Service | Loan # 3 | Cut-off Date Balance: | | $100,000,000 |
3600 South Las Vegas Boulevard | Bellagio Hotel and Casino | Cut-off Date LTV: | | 39.3% |
Las Vegas, NV 89109 | | UW NCF DSCR: | | 8.42x |
| | UW NOI Debt Yield: | | 28.3% |

THE INFORMATION IN THIS STRUCTURAL AND COLLATERAL TERM SHEET IS NOT COMPLETE AND MAY BE AMENDED PRIOR TO THE TIME OF SALE. THIS TERM SHEET IS NOT AN OFFER TO SELL THESE SECURITIES AND IT IS NOT A SOLICITATION OF AN OFFER TO BUY THESE SECURITIES IN ANY JURISDICTION WHERE THE OFFER OR SALE IS NOT PERMITTED.
60
Hospitality – Full Service | Loan # 3 | Cut-off Date Balance: | | $100,000,000 |
3600 South Las Vegas Boulevard | Bellagio Hotel and Casino | Cut-off Date LTV: | | 39.3% |
Las Vegas, NV 89109 | | UW NCF DSCR: | | 8.42x |
| | UW NOI Debt Yield: | | 28.3% |

THE INFORMATION IN THIS STRUCTURAL AND COLLATERAL TERM SHEET IS NOT COMPLETE AND MAY BE AMENDED PRIOR TO THE TIME OF SALE. THIS TERM SHEET IS NOT AN OFFER TO SELL THESE SECURITIES AND IT IS NOT A SOLICITATION OF AN OFFER TO BUY THESE SECURITIES IN ANY JURISDICTION WHERE THE OFFER OR SALE IS NOT PERMITTED.
61
No. 3 – Bellagio Hotel and Casino |
Mortgage Loan Information | | Mortgaged Property Information |
Mortgage Loan Seller: | Morgan Stanley Mortgage Capital
Holdings LLC | | Single Asset/Portfolio: | Single Asset |
Credit Assessment (Fitch/KBRA/S&P): | BBB-sf/AA+(sf)/AA(sf) | | Property Type – Subtype: | Hospitality – Full Service |
Original Principal Balance(1): | $100,000,000 | | Location: | Las Vegas, NV |
Cut-off Date Balance(1): | $100,000,000 | | Size(5): | 3,933 Rooms |
% of Initial Pool Balance: | 6.1% | | Cut-off Date Balance Per Room(1): | $426,188.66 |
Loan Purpose: | Acquisition | | Maturity Date Balance Per Room(1): | $426,188.66 |
Borrower Sponsor: | BREIT Operating Partnership L.P. | | Year Built/Renovated: | 1997/2019 |
Guarantor: | BREIT Operating Partnership L.P. | | Title Vesting: | Fee and Leasehold |
Mortgage Rate(2): | 3.170153% | | Property Manager: | Tenant-managed |
Note Date: | November 15, 2019 | | Current Occupancy (As of)(5): | 94.8% (9/30/2019) |
Seasoning: | 2 months | | YE 2018 Occupancy(5): | 94.9% |
Maturity Date: | December 5, 2029 | | YE 2017 Occupancy(5): | 92.9% |
IO Period: | 120 months | | YE 2016 Occupancy(5): | 93.5% |
Loan Term (Original): | 120 months | | YE 2015 Occupancy(5): | 93.2% |
Amortization Term (Original): | NAP | | Appraised Value(6): | $4,260,000,000 |
Loan Amortization Type: | Interest-only, Balloon | | Appraised Value Per Room: | $1,083,142.64 |
Call Protection(3): | GRTR 0.5% or YM(26), GRTR 0.5% or YM or D(87), O(7) | | Appraisal Valuation Date: | October 16, 2019 |
Lockbox Type: | Hard/Springing Cash Management | | Underwriting and Financial Information(7) |
Additional Debt(1): | Yes | | TTM NOI (9/30/2019): | $474,065,315 |
Additional Debt Type (Balance)(1): | Pari Passu ($1,576,200,000); | | YE 2018 NOI: | $489,866,042 |
| Subordinate ($1,333,800,000); Future Mezzanine | | YE 2017 NOI: | $505,736,234 |
| | | YE 2016 NOI: | $480,822,095 |
| | | U/W Revenues: | $1,349,062,464 |
| | | U/W Expenses: | $874,997,149 |
Escrows and Reserves(4) | | U/W NOI: | $474,065,315 |
| Initial | Monthly | Cap | | U/W NCF: | $453,829,378 |
Taxes | $0 | Springing | NAP | | U/W DSCR based on NOI/NCF(1)(7): | 8.80x / 8.42x |
Insurance | $0 | Springing | NAP | | U/W Debt Yield based on NOI/NCF(1) (7): | 28.3% / 27.1% |
Recurring Replacements | $0 | Springing | NAP | | U/W Debt Yield at Maturity based on NOI/NCF(1)(7): | 28.3% / 27.1% |
| | | | | Cut-off Date LTV Ratio(1)(6): | 39.3% |
| | | | | LTV Ratio at Maturity(1)(6): | 39.3% |
Sources and Uses |
Sources | | | | | Uses | | | |
Original Senior Loan Amount(1) | $1,676,200,000 | | 39.3% | | Purchase Price | $4,250,000,000 | | 99.8% |
Original Subordinate Loan Amount | 1,333,800,000 | | 31.3 | | Closing Costs | 10,591,035 | | 0.2 |
Borrower Equity(8) | 1,250,591,035 | | 29.4 | | | | | |
Total Sources | $4,260,591,035 | | 100.0% | | Total Uses | $4,260,591,035 | | 100.0% |
(1) | The Bellagio Hotel and Casino Mortgage Loan (as defined below) is part of the Bellagio Hotel and Casino Whole Loan (as defined below), which is comprised of 24 pari passu senior promissory notes with an aggregate original principal balance of $1,676,200,000 (the “Bellagio Hotel and Casino Senior Notes”), six promissory notes with an aggregate original principal balance of $650,500,000 which are pari passu with each other and subordinate to the Bellagio Hotel and Casino Senior Notes (the “Bellagio Hotel and Casino Junior A Notes”), and three promissory notes with an aggregate original principal balance of $683,300,000 which are pari passu with each other and subordinate to the Bellagio Hotel and Casino Senior Notes and the Bellagio Hotel and Casino Junior A Notes (the “Bellagio Hotel and Casino Junior B Notes” and collectively with the Bellagio Hotel and Casino Junior A Notes, the “Bellagio Hotel and Casino Subordinate Companion Loan”. The Cut-off Date Balance Per Room, Maturity Date Balance Per Room, U/W DSCR based on NOI/NCF, U/W Debt Yield based on NOI/NCF, U/W Debt Yield at Maturity based on NOI/NCF, Cut-off Date LTV Ratio and LTV Ratio at Maturity numbers presented above are based on the Bellagio Hotel and Casino Senior Notes. The Cut-off Date Balance Per Room, Maturity Date Balance Per Room, U/W DSCR based on NOI/NCF, U/W Debt Yield based on NOI/NCF, U/W Debt Yield at Maturity based on NOI/NCF, Cut-off Date LTV Ratio and LTV Ratio at Maturity based on the Bellagio Hotel and Casino Whole Loan are $765,319, $765,319, 4.24x/4.06x, 15.7%/15.1%, 15.7%/15.1%, 70.7% and 70.7%, respectively. The Bellagio Hotel and Casino Whole Loan was co-originated by MSBNA, JPMCB and CREFI (all as defined below). |
(2) | Reflects the Bellagio Hotel and Casino Senior Notes only. The Bellagio Hotel and Casino Junior A Notes also accrue interest at the rate of 3.170153% per annum. The Bellagio Hotel and Casino Junior B Notes accrue interest at the rate of 5.350000% per annum. |
(3) | The assumed defeasance lockout period of 26 payments is based on the closing date of this transaction in February 2020. Defeasance in whole is permitted at any time after the earlier to occur of (A) two years after the latest startup day of the final REMIC that holds any note evidencing a portion of the Bellagio Hotel and Casino Whole Loan and (B) November 15, 2022. The Bellagio Hotel and Casino Whole Loan may be prepaid in whole or in part at any time, subject to payment of the applicable yield maintenance premium if such prepayment occurs prior to June 5, 2029. |
(4) | See “Escrows” below for further discussion of reserve requirements. |
(5) | Size and Occupancy are based solely on the hotels at the Bellagio Hotel and Casino Property (as defined below). As of the trailing twelve months ended September 30, 2019, approximately 29.6% of revenues were from gaming, 28.4% from hotel, 24.7% from food & beverage, 9.0% from entertainment and 8.3% from other sources. |
(6) | The Appraised Value of $4,260,000,000 set forth above is the appraised value solely with respect to real property at the Bellagio Hotel and Casino Property, excluding personal property and intangible property attributable to the Bellagio Hotel and Casino Property (the “As-Is Real Property Appraised Value”). The appraisal also includes an “As Leased-Sale-Leaseback Appraised Value,” which is equal to the As-Is Real Property Appraised Value. The appraisal also included an Appraised Value of $6,500,000,000 (“As-Is Total Appraised Value”), which includes personal property and intangible property attributable to the Bellagio Hotel and Casino Property. The personal property and |
THE INFORMATION IN THIS STRUCTURAL AND COLLATERAL TERM SHEET IS NOT COMPLETE AND MAY BE AMENDED PRIOR TO THE TIME OF SALE. THIS TERM SHEET IS NOT AN OFFER TO SELL THESE SECURITIES AND IT IS NOT A SOLICITATION OF AN OFFER TO BUY THESE SECURITIES IN ANY JURISDICTION WHERE THE OFFER OR SALE IS NOT PERMITTED.
62
Hospitality – Full Service | Loan # 3 | Cut-off Date Balance: | | $100,000,000 |
3600 South Las Vegas Boulevard | Bellagio Hotel and Casino | Cut-off Date LTV: | | 39.3% |
Las Vegas, NV 89109 | | UW NCF DSCR: | | 8.42x |
| | UW NOI Debt Yield: | | 28.3% |
intangible property relating to the Bellagio Hotel and Casino Property are owned by the Bellagio Tenant (as defined below), as more particularly provided in the Bellagio Lease (as defined below). The Bellagio Tenant granted a security interest in certain property of Bellagio Tenant (with certain exclusions as more particularly described in the Bellagio Lease) in favor of the Bellagio Hotel and Casino Borrower (as defined below), and such security interest was collaterally assigned by the Bellagio Hotel and Casino Borrower to the lender. The Cut-off Date LTV Ratio and LTV Ratio at Maturity based on the As-Is Total Appraised Value are 46.3% and 46.3%, respectively, based on the Bellagio Hotel and Casino Whole Loan and 25.8% and 25.8% respectively, based on the Bellagio Hotel and Casino Senior Notes.
(7) | The Bellagio Hotel and Casino Property was acquired by the Bellagio Hotel and Casino Borrower in a sale-leaseback transaction from Bellagio, LLC, an indirectly wholly owned subsidiary of MGM Resorts International, which entered into a new 30-year lease, with two 10-year extension options to operate the Bellagio Hotel and Casino Property. The Bellagio Tenant owns a 5% equity interest in the Bellagio Hotel and Casino Borrower. Financial and other information presented in this term sheet is presented on a “look through” basis, before rent due under the Bellagio Lease. For so long as the Bellagio Lease is in effect, the Bellagio Hotel and Casino Borrower will be entitled only to the rent due under the Bellagio Lease and not to the underlying rent and other income from the Bellagio Hotel and Casino Property. The initial Bellagio Lease annual rent is $245,000,000, and U/W DSCR, U/W Debt Yield and U/W Debt Yield at Maturity for the Bellagio Hotel and Casino Whole Loan based on such initial annual rent are 2.19x, 8.1% and 8.1% respectively. |
(8) | Includes MGM’s approximately $62.4 million of retained equity interest in the Bellagio Hotel and Casino Property after the sale-leaseback. |
The Mortgage Loan. The mortgage loan (the “Bellagio Hotel and Casino Mortgage Loan”) is part of a whole loan (the “Bellagio Hotel and Casino Whole Loan”) in the original principal balance of $3,010,000,000. The Bellagio Hotel and Casino Whole Loan is secured by a first priority fee and leasehold mortgage encumbering a hotel in Las Vegas, Nevada (the “Bellagio Hotel and Casino Property” or “Bellagio” or “Property”). The Bellagio Hotel and Casino Whole Loan was co-originated by Morgan Stanley Bank, N.A. (“MSBNA”), JPMorgan Chase Bank, National Association (“JPMCB”) and Citi Real Estate Funding Inc. (“CREFI”). The Bellagio Hotel and Casino Whole Loan is comprised of (i) the Bellagio Hotel and Casino Senior Notes, comprised of 24 senior notes with an aggregate original principal balance of $1,676,200,000, (ii) the Bellagio Hotel and Casino Junior A Notes, comprised of six subordinate notes that are pari passu with each other and subordinate to the Bellagio Hotel and Casino Senior Notes, with an aggregate original principal balance of $650,500,000, and (iii) the Bellagio Hotel and Casino Junior B Notes, comprised of three subordinate notes that are pari passu with each other and subordinate to the Bellagio Hotel and Casino Senior Notes and the Bellagio Hotel and Casino Junior A Notes, with an aggregate original principal balance of $683,300,000, each as described in the table below. Promissory Note A-1-C1, in the original principal balance of $100,000,000, which is being contributed by Morgan Stanley Mortgage Capital Holdings LLC (“MSMCH”) represents the Bellagio Hotel and Casino Mortgage Loan and will be included in the BANK 2020-BNK25 securitization trust. Of the remaining Bellagio Hotel and Casino Senior Notes (collectively, the “Bellagio Hotel and Casino Non-Serviced Pari Passu Companion Loans”), the Bellagio Hotel and Casino Non-Serviced Pari Passu Companion Loans evidenced by promissory Notes A-1-S1, A-1-S2, A-2-S1, A-2-S2, A-3-S1, and A-3-S2 in the aggregate original principal balance of $716,000,000, as well as $510,700,000 of the Bellagio Hotel and Casino Junior A Notes and all of the Bellagio Hotel and Casino Junior B Notes were contributed to the BX 2019-OC11 securitization trust. In addition, $360,200,000 of the Bellagio Hotel and Casino Senior Notes and $139,800,000 of the Bellagio Hotel and Casino Junior A Notes were sold in a private sale to a third party. The Bellagio Hotel and Casino Whole Loan will be serviced pursuant to the trust and servicing agreement for the BX 2019-OC11 securitization trust. The remaining Bellagio Hotel and Casino Non-Serviced Pari Passu Companion Loans, which had an aggregate original principal balance of $500,000,000, are expected to be contributed to future securitization trusts or may be otherwise transferred at any time. See “Description of the Mortgage Pool—The Whole Loans—The Non- Serviced AB Whole Loans—The Bellagio Hotel and Casino Whole Loan” and “Pooling and Servicing Agreement— Servicing of the Non- Serviced Mortgage Loans” in the Prospectus.
Note Summary
| Notes | Original Balance | Cut-off Date Balance | Note Holder | Controlling Piece |
| Bellagio Hotel and Casino Mortgage Loan | | | | |
| A-1-C1 | $100,000,000 | $100,000,000 | BANK 2020-BNK25 | No |
| Bellagio Hotel and Casino Non-Serviced Pari Passu Companion Loans | | | | |
| A-1-S1, A-1-S2, A-2-S1, A-2-S2, A-3-S1, A-3-S2 | $716,000,000 | $716,000,000 | BX 2019-OC11 | Yes(1) |
| A-1-RL, A-2-RL, A-3-RL | $360,200,000 | $360,200,000 | Third party | No |
| A-1-C2, A-1-C3, A-1-C4, A-1-C5 | $200,000,000 | $200,000,000 | MSBNA | No |
| A-2-C1 | $50,000,000 | $50,000,000 | GSMS 2020-GC45(3) | No |
| A-2-C3, A-2-C4, A-2-C5 | $70,000,000 | $70,000,000 | CREFI | No |
| A-2-C2, A-3-C2 | $60,000,000 | $60,000,000 | Benchmark 2020-B16(3) | |
| A-3-C1, A-3-C3, A-3-C4, A-3-C5 | $120,000,000 | $120,000,000 | JPMCB | No |
| Bellagio Hotel and Casino Junior A Notes | | | | |
| B-1-S, B-2-S, B-3-S | $510,700,000 | $510,700,000 | BX 2019-OC11 | No(2) |
| B-1-RL, B-2-RL, B-3-RL | $139,800,000 | $139,800,000 | Third party | No(2) |
| Bellagio Hotel and Casino Junior B Notes | | | | |
| C-1-S, C-2-S, C-3-S | $683,300,000 | $683,300,000 | BX 2019-OC11 | No(2) |
| Total | $3,010,000,000 | $3,010,000,000 | | |
(1) | Note A-1-S1 is the controlling note. |
(2) | The Bellagio Hotel and Casino Junior A Notes are subordinate to the Bellagio Hotel and Casino Senior Notes, and the Bellagio Hotel and Casino Junior B Notes are subordinate to the Bellagio Hotel and Casino Senior Notes and the Bellagio Hotel and Casino Junior A Notes. |
(3) | The GSMS 2020-GC45 and BMARK 2020-B16 transactions are expected to close on or about January 30, 2020 and on or about February 12, 2020, respectively. |
THE INFORMATION IN THIS STRUCTURAL AND COLLATERAL TERM SHEET IS NOT COMPLETE AND MAY BE AMENDED PRIOR TO THE TIME OF SALE. THIS TERM SHEET IS NOT AN OFFER TO SELL THESE SECURITIES AND IT IS NOT A SOLICITATION OF AN OFFER TO BUY THESE SECURITIES IN ANY JURISDICTION WHERE THE OFFER OR SALE IS NOT PERMITTED.
63
Hospitality – Full Service | Loan # 3 | Cut-off Date Balance: | | $100,000,000 |
3600 South Las Vegas Boulevard | Bellagio Hotel and Casino | Cut-off Date LTV: | | 39.3% |
Las Vegas, NV 89109 | | UW NCF DSCR: | | 8.42x |
| | UW NOI Debt Yield: | | 28.3% |
The Borrower and the Borrower Sponsor. The borrower is BCORE Paradise LLC (the “Bellagio Hotel and Casino Borrower”), a Delaware limited liability company and single purpose entity with two independent directors. Legal counsel to the Bellagio Hotel and Casino Borrower delivered a non-consolidation opinion in connection with the origination of the Bellagio Hotel and Casino Whole Loan. BREIT Operating Partnership L.P. (“BREIT OP”) is the borrower sponsor and the non-recourse carveout guarantor. BREIT OP is a subsidiary of Blackstone Real Estate Investment Trust, Inc. (“BREIT”). BREIT is a non-traded REIT focused on investing in commercial real estate properties diversified by sector with an emphasis on providing investors with access to Blackstone’s institutional real estate investment platform. BREIT seeks to directly own stabilized income-generating U.S. commercial real estate across the key property types, including multifamily, industrial, retail, hotel, healthcare and office. BREIT is managed by an external advisor, BX REIT Advisors L.L.C., which is an affiliate of The Blackstone Group Inc. (“Blackstone”) Blackstone’s real estate assets under management included 144,000 hotel rooms as of June 30, 2019, making the firm one of the largest hospitality investors in the United States. Blackstone’s experience of owning and managing hotels includes Cosmopolitan Las Vegas, Hotel Del Coronado, Grand Wailea, Arizona Biltmore, Ritz Carlton Kapalua, and Turtle Bay Resort.
The non-recourse carveout guarantor’s liability for bankruptcy related recourse events is capped at an amount equal to 10% of the outstanding principal balance of the Bellagio Hotel and Casino Whole Loan as of the date of the event. In addition, only the related single purpose entity borrower, and not the non-recourse carveout guarantor, is liable for breaches of environmental covenants, and the single purpose entity borrower is the only party liable under the environmental indemnity; provided, however, that if the Bellagio Hotel and Casino Borrower fails to maintain an environmental insurance policy required under the Bellagio Hotel and Casino Whole Loan documents, the non-recourse carveout guarantor is liable for losses other than (x) for any amounts in excess of the applicable coverage amounts under the environmental policy had the same been renewed, replaced or extended as required under the loan agreement and (y) for any amounts recovered under the environmental policy. In addition, recourse for transfers of the Bellagio Hotel and Casino Property or controlling equity interests in the Bellagio Hotel and Casino Borrower is loss recourse, rather than full recourse.
The Bellagio Hotel and Casino Borrower is affiliated with the borrower under the Powered Shell Portfolio-Sterling Mortgage Loan.
The Property. The Bellagio Hotel and Casino Property is a full-service luxury resort and casino property located on the Las Vegas Strip, between The Cosmopolitan and Caesar’s Palace, and across from the Paris Las Vegas Hotel & Casino and Bally’s Las Vegas Hotel & Casino. The Bellagio covers approximately 77 acres and consists of 3,933 hotel rooms and suites in two hotel towers – the Main Tower and the Spa Tower. The Main Tower offers panoramic views of the Las Vegas Strip and the Fountains of Bellagio. The Property contains approximately 154,000 square feet of casino space, featuring approximately 1,700 slot machines and 144 gaming tables, approximately 200,000 square feet of event space, 29 food and beverage outlets, an approximately 55,000 square feet spa, five swimming pools, approximately 85,000 square feet of retail space featuring approximately 30 retailers, and a botanical garden. The Bellagio is also the home to Cirque du Soleil’s “O”, an aquatic, acrobatic theater production that has been in residence at the Bellagio since October 1998. Guestrooms range from one to three bedrooms. Standard room amenities include a flat-panel television, high-speed internet and 24-hour in room dining. The guest bathrooms are finished with porcelain tile flooring and tub/shower surrounds, granite vanity countertops, and wall-mounted lighting fixtures. Additional amenities include access to five outdoor swimming pools with 51 private cabanas, four whirlpools, two wedding chapels, a fitness center, a spa, a salon and barber shop, concierge services, the Fountains of Bellagio, the Bellagio Gallery of Fine Art, the Conservatory and Botanical Gardens, on-site entertainment, retail outlets, a FedEx business center and transportation services.
As of the trailing twelve months ended September 30, 2019, approximately 29.6% of revenues were from gaming, 28.4% from hotel, 24.7% from food & beverage, 9.0% from entertainment and 8.3% from other sources.
Approximately $371.9 million (approximately $94,600 per key) has been invested in the Bellagio since 2010, including approximately $165 million on rooms renovations (approximately $42,000 per key). In 2011-2012, the Property underwent a $66.6 million renovation on the Main Tower and a $39.7 million renovation on the Spa Tower. ADR increased 2.9% from 2011 to 2012 and an additional 2.8% from 2012 to 2013. In 2014 and 2015, the Property underwent a $59.1 million renovation on the suites in the Main Tower. Total hotel operating revenue increased to approximately $363.7 million in 2016, representing a 6.3% year over year increase compared to 2015. ADR increased 5.1% year over year and RevPAR increased 5.5% in the same time period. Approximately $12.8 million was spent on the renovation of Sadelle’s and Spago restaurants. Sadelle’s replaced Café Bellagio in December 2018 and Spago opened in June 2018, replacing Todd English Olives.
The Bellagio Hotel and Casino Property was acquired by the Bellagio Hotel and Casino Borrower in a sale-leaseback transaction from Bellagio, LLC (the “Bellagio Tenant”), an indirectly wholly owned subsidiary of MGM Resorts International (“MGM”), which entered into a new 30-year lease, with two 10-year extension options (the “Bellagio Lease”) to operate the Property. Under the Bellagio Lease, the Bellagio Tenant is required to pay to the Bellagio Hotel and Casino Borrower an initial lease rent of $245.0 million per annum (the “Bellagio Lease Rent”), subject to annual increases of (i) 2.0% for the first ten years of the lease term, and (ii) thereafter, the greater of 2.0% or the United States Department of Labor, Bureau of Labor Statistics Revised Consumer Price Index for All Urban Consumers (1982-84=100), U.S. City Average (“CPI”) (capped at 3.0% in years 11-20 and 4.0% thereafter) for the remainder of the initial lease term. MGM (NYSE: MGM, rated Ba3/BB/BB- by Moody’s, Fitch and S&P) guarantees the payment and performance of all monetary obligations and certain other obligations of Bellagio Tenant under the Bellagio Lease. In connection with the sale-leaseback, the Bellagio Tenant is required under the Bellagio Lease to make capital improvements intended to ensure that the Property remains competitive with other top tier Las Vegas Strip offerings going forward. For the four year period from 2020 through 2023, under the Bellagio Lease, the Bellagio Tenant is required to spend 5.0% of net revenues (subject to a minimum of $275.0 million total) on capital expenditures, in the aggregate. During each four year period (on a rolling basis) beginning in 2024 through the end of the Bellagio Hotel and Casino Whole Loan term, the Bellagio Tenant is required to spend 3.0% of net revenues on capital expenditures. Under the terms of the Bellagio Lease, the Bellagio Tenant is also required to reserve on a monthly basis 1.5% of net revenues each year to fund capital expenditures (which are made available to the Bellagio Tenant for capital expenditures and FF&E).
THE INFORMATION IN THIS STRUCTURAL AND COLLATERAL TERM SHEET IS NOT COMPLETE AND MAY BE AMENDED PRIOR TO THE TIME OF SALE. THIS TERM SHEET IS NOT AN OFFER TO SELL THESE SECURITIES AND IT IS NOT A SOLICITATION OF AN OFFER TO BUY THESE SECURITIES IN ANY JURISDICTION WHERE THE OFFER OR SALE IS NOT PERMITTED.
64
Hospitality – Full Service | Loan # 3 | Cut-off Date Balance: | | $100,000,000 |
3600 South Las Vegas Boulevard | Bellagio Hotel and Casino | Cut-off Date LTV: | | 39.3% |
Las Vegas, NV 89109 | | UW NCF DSCR: | | 8.42x |
| | UW NOI Debt Yield: | | 28.3% |
The Bellagio Property includes a variety of retail tenants, including brands such as Chanel, Tiffany & Co., Gucci, Hermes, Christian Dior, Breguet and Harry Winston. The retail space totals approximately 85,000 square feet and generated approximately $54.6 million in revenue as of December 31, 2018. The Bellagio Tenant is currently budgeting for the addition of a luxury retail store in the Bellagio Property lobby. We cannot assure you that this change will occur as expected or at all.
The hotel component of the Bellagio has maintained an occupancy at or above 92.3% since 2006 with an 11-year average occupancy of 93.4%. As of TTM September 2019, the Bellagio had an average of 3,933 rooms available with an occupancy of 94.8%, an ADR of $281.69 and a RevPAR of $267.18.
Hotel Performance(1)
| 2008 | 2009 | 2010 | 2011 | 2012 | 2013 | 2014 | 2015 | 2016 | 2017 | 2018 | TTM Sept. 2019 | 11-Year Avg.(2) |
Occupancy | 95.0% | 94.2% | 92.5% | 93.3% | 92.9% | 92.3% | 93.1% | 93.2% | 93.5% | 92.9% | 94.9% | 94.8% | 93.4% |
ADR | $261 | $204 | $204 | $230 | $237 | $243 | $254 | $257 | $270 | $276 | $278 | $282 | $247 |
RevPAR | $248 | $192 | $189 | $215 | $220 | $225 | $236 | $240 | $253 | $257 | $264 | $267 | $231 |
Room Revenue ($mm) | $349.9 | $271.2 | $271.1 | $297.3 | $311.5 | $321.7 | $337.6 | $342.2 | $363.7 | $368.1 | $378.9 | $382.8 | $328.5 |
(1) | The financial information presented in this table is consistent with the manner in which MGM management assesses these results and allocates resources. Accordingly, the results and information presented in this table may differ, in some respects, from how such results and information would be presented in standalone financial statements. |
(2) | Average excludes TTM September 2019. |
The Property contains approximately 154,000 square feet of casino space, featuring approximately 1,700 slot machines and 144 gaming tables. The casino facilities include table games such as blackjack, craps, roulette, baccarat and poker.
Casino Performance(1)
| 2008 | 2009 | 2010 | 2011 | 2012 | 2013 | 2014 | 2015 | 2016 | 2017 | 2018 | 5-Year Avg. | 11-Year Avg. |
Slot Units | 2,376 | 2,298 | 2,250 | 2,205 | 2,100 | 2,118 | 2,063 | 1,935 | 1,873 | 1,827 | 1,732 | 1,886 | 2,071 |
Table Units | 151 | 153 | 154 | 152 | 147 | 146 | 144 | 146 | 145 | 145 | 144 | 145 | 148 |
Gaming Revenue ($mm) | $352.75 | $306.87 | $289.51 | $319.11 | $298.61 | $335.58 | $381.50 | $369.71 | $439.66 | $435.93 | $422.86 | $409.93 | $359.28 |
% Change in Gaming Revenue | - | -13.0% | -5.7% | 10.2% | -6.4% | 12.4% | 13.7% | -3.1% | 18.9% | -0.8% | -3.0% | NAP | NAP |
(1) | Information provided by the borrower sponsor. |
THE INFORMATION IN THIS STRUCTURAL AND COLLATERAL TERM SHEET IS NOT COMPLETE AND MAY BE AMENDED PRIOR TO THE TIME OF SALE. THIS TERM SHEET IS NOT AN OFFER TO SELL THESE SECURITIES AND IT IS NOT A SOLICITATION OF AN OFFER TO BUY THESE SECURITIES IN ANY JURISDICTION WHERE THE OFFER OR SALE IS NOT PERMITTED.
65
Hospitality – Full Service | Loan # 3 | Cut-off Date Balance: | | $100,000,000 |
3600 South Las Vegas Boulevard | Bellagio Hotel and Casino | Cut-off Date LTV: | | 39.3% |
Las Vegas, NV 89109 | | UW NCF DSCR: | | 8.42x |
| | UW NOI Debt Yield: | | 28.3% |
Operating History and Underwritten Net Cash Flow. The following table presents certain information relating to the historical operating performance and underwritten net cash flow at the Bellagio Hotel and Casino Property:
Cash Flow Analysis(1)
| | 2016 | | 2017 | | 2018 | | TTM 9/30/2019 | | UW | | %(2) | | U/W $ per Room | |
Occupancy | | 93.5% | | 92.9% | | 94.9% | | 94.8% | | 94.8% | | | | | | |
ADR | | $270.29 | | $276.24 | | $278.28 | | $281.69 | | $281.69 | | | | | | |
RevPAR | | $252.78 | | $256.53 | | $264.19 | | $267.18 | | $267.18 | | | | | | |
| | | | | | | | | | | | | | | | |
Room Revenue | | $363,677,441 | | $368,058,522 | | $378,860,233 | | $382,839,838 | | $382,839,838 | | 28.4 | % | | $97,340 | |
F&B Revenue | | 347,665,102 | | 341,830,126 | | 334,447,851 | | 333,149,122 | | 333,149,122 | | 24.7 | | | 84,706 | |
Gaming | | 439,662,976 | | 435,933,726 | | 422,862,787 | | 399,769,284 | | 399,769,284 | | 29.6 | | | 101,645 | |
Entertainment | | 121,953,371 | | 119,207,719 | | 120,427,525 | | 121,762,603 | | 121,762,603 | | 9.0 | | | 30,959 | |
Other Revenue(3) | | 91,179,322 | | 100,540,676 | | 111,236,871 | | 111,541,617 | | 111,541,617 | | 8.3 | | | 28,360 | |
Total Revenue | | $1,364,138,212 | | $1,365,570,769 | | $1,367,835,267 | | $1,349,062,464 | | $1,349,062,464 | | 100.0 | % | | $343,011 | |
| | | | | | | | | | | | | | | | |
Room Expense | | 105,289,765 | | 107,330,702 | | 111,385,859 | | 111,344,926 | | 111,344,926 | | 29.1 | | | 28,310 | |
F&B Expense | | 266,202,142 | | 258,789,184 | | 257,609,113 | | 256,340,473 | | 256,340,473 | | 76.9 | | | 65,177 | |
Other Department Exp.(3) | | 335,693,118 | | 322,639,400 | | 332,481,659 | | 330,066,360 | | 330,066,360 | | 52.1 | | | 83,922 | |
Total Depart. Exp. | | $707,185,025 | | $688,759,286 | | $701,476,631 | | $697,751,759 | | $697,751,759 | | 51.7 | % | | $177,410 | |
Gross Operating Inc. | | $656,953,187 | | $676,811,483 | | $666,358,636 | | $651,310,705 | | $651,310,705 | | 48.3 | % | | $165,602 | |
| | | | | | | | | | | | | | | | |
Total Undistributed Exp. | | 128,812,269 | | 127,583,150 | | 128,495,099 | | 128,324,048 | | 128,324,048 | | 9.5 | | | 32,628 | |
Gross Operating Profit | | $528,140,918 | | $549,228,333 | | $537,863,537 | | $522,986,657 | | $522,986,657 | | 38.8 | % | | $132,974 | |
| | | | | | | | | | | | | | | | |
Management Fee | | 26,957,472 | | 24,326,134 | | 26,005,109 | | 26,682,737 | | 26,682,737 | | 2.0 | | | 6,784 | |
| | | | | | | | | | | | | | | | |
Taxes | | 17,112,907 | | 16,070,971 | | 18,230,324 | | 17,763,857 | | 17,763,857 | | 1.3 | | | 4,517 | |
Insurance | | 3,248,444 | | 3,094,994 | | 3,762,062 | | 4,474,748 | | 4,474,748 | | 0.3 | | | 1,138 | |
Total Fixed Charges | | 20,361,351 | | 19,165,965 | | 21,992,386 | | 22,238,605 | | 22,238,605 | | 1.6 | | | 5,654 | |
Total Operating Exp. | | $883,316,117 | | $859,834,535 | | $877,969,225 | | $874,997,149 | | $874,997,149 | | 64.9 | % | | $222,476 | |
| | | | | | | | | | | | | | | | |
Net Operating Income | | $480,822,095 | | $505,736,234 | | $489,866,042 | | $474,065,315 | | $474,065,315 | | 35.1 | % | | $120,535 | |
FF&E | | 0 | | 0 | | 0 | | 0 | | 20,235,937 | | 1.5 | | | 5,145 | |
Net Cash Flow | | $480,822,095 | | $505,736,234 | | $489,866,042 | | $474,065,315 | | $453,829,378 | | 33.6 | % | | $115,390 | |
| | | | | | | | | | | | | | | | |
NOI DSCR(1)(4) | | 8.92x | | 9.39x | | 9.09x | | 8.80x | | 8.80x | | | | | | |
NCF DSCR(1)(4) | | 8.92x | | 9.39x | | 9.09x | | 8.80x | | 8.42x | | | | | | |
NOI DY(1)(4) | | 28.7% | | 30.2% | | 29.2% | | 28.3% | | 28.3% | | | | | | |
NCF DY(1)(4) | | 28.7% | | 30.2% | | 29.2% | | 28.3% | | 27.1% | | | | | | |
| | | | | | | | | | | | | | | | |
(1) | The information above is presented on a “look through” basis, before rent due under the Bellagio Lease. For so long as the Bellagio Lease is in effect, the Bellagio Hotel and Casino Borrower will be entitled only to the rent due under the Bellagio Lease and not to the underlying rent and other income from the Bellagio Hotel and Casino Property. The initial Bellagio Lease annual rent is $245,000,000, and DSCR and Debt Yield of the Bellagio Hotel and Casino Whole Loan based on such initial annual rent are 2.19x and 8.1% respectively. |
(2) | % of U/W Total Revenue for Room Expense and F&B Expense are based on their corresponding revenue line items. % of Other Departmental Expenses corresponds to the sum of Gaming, Entertainment and Other revenue items. The remaining values represent % of Total Revenue. |
(3) | Other Revenue and Other Departmental Expenses include retail and other operations. |
(4) | The debt service coverage ratios and debt yields are based on the Bellagio Hotel and Casino Senior Notes, and exclude the Bellagio Hotel and Casino Subordinate Companion Loan. |
Appraisal. The appraiser concluded to an As-Is Real Property Appraised Value as of October 16, 2019 of $4,260,000,000, solely with respect to real property at the Bellagio Property, excluding personal property and intangible property attributable to the Bellagio Hotel and Casino Property. The personal property and intangible property relating to the Bellagio Hotel and Casino Property are owned by the Bellagio Tenant, as more particularly provided in the Bellagio Lease. The Bellagio Tenant granted a security interest in certain property of Bellagio Tenant (with certain exclusions as more particularly described in the Bellagio Lease) in favor of the Bellagio Hotel and Casino Borrower, and such security interest was collaterally assigned by the Bellagio Hotel and Casino Borrower to the lender. The As Is Total Appraised Value, including personal property and intangible property attributable to the Bellagio Hotel and Casino
THE INFORMATION IN THIS STRUCTURAL AND COLLATERAL TERM SHEET IS NOT COMPLETE AND MAY BE AMENDED PRIOR TO THE TIME OF SALE. THIS TERM SHEET IS NOT AN OFFER TO SELL THESE SECURITIES AND IT IS NOT A SOLICITATION OF AN OFFER TO BUY THESE SECURITIES IN ANY JURISDICTION WHERE THE OFFER OR SALE IS NOT PERMITTED.
66
Hospitality – Full Service | Loan # 3 | Cut-off Date Balance: | | $100,000,000 |
3600 South Las Vegas Boulevard | Bellagio Hotel and Casino | Cut-off Date LTV: | | 39.3% |
Las Vegas, NV 89109 | | UW NCF DSCR: | | 8.42x |
| | UW NOI Debt Yield: | | 28.3% |
Property, is $6,500,000,000. The appraisal also includes an “As Leased-Sale-Leaseback Appraised Value,” of $4,260,000,000. The Cut-off Date LTV Ratio and LTV Ratio at Maturity based on the As-Is Total Appraised Value of $6,500,000,000 are 25.8% and 25.8%, respectively for the Bellagio Hotel and Casino Senior Notes and 46.3% and 46.3% respectively for the Bellagio Hotel and Casino Whole Loan.
Environmental Matters. According to the Phase I environmental site assessment dated November 6, 2019, there was no evidence of any recognized environmental conditions at the Bellagio Hotel and Casino Property.
Market Overview. Visitor volume and airport passenger traffic into the Las Vegas region have more than doubled from 1990 to 2018. In connection with the financial downturn in 2008 and 2009, the Las Vegas Market generally experienced a contraction. During 2010, the market began to rebound and visitation has returned to or near peak levels. 2018 Year-over-Year, Airport Passenger Traffic is up 2.5% and Clark County Gaming Revenues are up 2.7%.
Market Overview(1)
Category | 1990 | 2009 | 2010 | 2011 | 2012 | 2013 | 2014 | 2015 | 2016 | 2017 | 2018 |
Visitor Volume (thousands) | 20,954 | 36,351 | 37,335 | 38,929 | 39,727 | 39,668 | 41,127 | 42,312 | 42,936 | 42,214 | 42,117 |
YoY % Change | NAP | -3.0% | 2.7% | 4.3% | 2.0% | -0.1% | 3.7% | 2.9% | 1.5% | -1.7% | -0.2% |
Clark County Gaming Revenues ($mm) | $4,104 | $8,838 | $8,909 | $9,223 | $9,400 | $9,674 | $9,554 | $9,618 | $9,714 | $9,979 | $10,250 |
YoY % Change | NAP | -9.8% | 0.8% | 3.5% | 1.9% | 2.9% | -1.2% | 0.7% | 1.0% | 2.7% | 2.7% |
Hotel / Motel Rooms Inventory | 73,730 | 148,941 | 148,935 | 150,161 | 150,481 | 150,593 | 150,544 | 149,213 | 149,339 | 148,896 | 149,158 |
YoY % Change | NAP | 6.0% | 0.0% | 0.8% | 0.2% | 0.1% | 0.0% | -0.9% | 0.1% | -0.3% | 0.2% |
Airport Passenger Traffic (thousands) | 19,090 | 40,469 | 39,757 | 41,481 | 41,668 | 41,857 | 42,885 | 45,389 | 47,435 | 48,500 | 49,717 |
YoY % Change | NAP | -8.2% | -1.8% | 4.3% | 0.5% | 0.5% | 2.5% | 5.8% | 4.5% | 2.2% | 2.5% |
Convention Attendance (thousands) | 1,742 | 4,492 | 4,473 | 4,865 | 4,944 | 5,107 | 5,195 | 5,891 | 6,311 | 6,646 | 6,502 |
YoY % Change | NAP | -23.9% | -0.4% | 8.8% | 1.6% | 3.3% | 1.7% | 13.4% | 7.1% | 5.3% | -2.2% |
(1) | Source: Las Vegas marketing organization website. |
The Las Vegas Strip has traditionally enjoyed high occupancy rates compared to the national average. From 2014 to year to date May 2019, occupancy across the Las Vegas Strip increased from 88.8% to 90.3%. ADR for the Las Vegas Strip increased by approximately 18.3% from $126 in 2014 to $149 for year to date May 2019. Improving trends in ADR have been driven by more properties adding resort fees, improvement in the convention segment, as well as the addition of higher-quality room supply.
Historical Occupancy, ADR, RevPAR
| Competitive Set | Bellagio Property | Penetration Factor |
Year | Occupancy | ADR | RevPAR | Occupancy | ADR | RevPAR | Occupancy | ADR | RevPAR |
2018 | 91.1% | $281.66 | $257.01 | 94.9% | $278.28 | $264.19 | 104.2% | 98.8% | 102.8% |
Source: Appraisal
The primary competitive set for the Bellagio Hotel and Casino Property comprises five hotels located on the Las Vegas Strip. These properties total 22,840 rooms and include the 4,004 room Aria Resort & Casino, 4,748 room Wynn/Encore Resort and Casino, 7,117 room Venetian/Palazzo Resort and Casino, 2,995 room Cosmopolitan Resort and Casino and 3,976 room Caesar’s Palace.
Property Competitive Summary
Property Name | No. of Rooms | Year Opened | Meeting Space (SF) | Gaming Space (SF) | Estimated 2018 Occ. | Estimated 2018 ADR | Estimated 2018 RevPAR |
Bellagio Hotel and Casino Property | 3,933 | 1998 | 200,000 | 154,000 | 94.9% | $278.28 | $264.19 |
Aria Resort & Casino | 4,004 | 2009 | 500,000 | 150,000 | 91.0% | $265.00 | $241.15 |
Wynn/Encore Resort and Casino | 4,748 | 2006/2008 | 290,000 | 191,424 | 90.0% | $300.00 | $270.00 |
Venetian/Palazzo Resort and Casino | 7,117 | 1999/2010 | 450,000 | 335,878 | 91.0% | $295.00 | $268.45 |
Cosmopolitan Resort and Casino | 2,995 | 2010 | 152,000 | 68,981 | 95.0% | $325.00 | $308.75 |
Caesar’s Palace | 3,976 | 1966 | 300,000 | 124,200 | 90.0% | $220.00 | $198.00 |
THE INFORMATION IN THIS STRUCTURAL AND COLLATERAL TERM SHEET IS NOT COMPLETE AND MAY BE AMENDED PRIOR TO THE TIME OF SALE. THIS TERM SHEET IS NOT AN OFFER TO SELL THESE SECURITIES AND IT IS NOT A SOLICITATION OF AN OFFER TO BUY THESE SECURITIES IN ANY JURISDICTION WHERE THE OFFER OR SALE IS NOT PERMITTED.
67
Hospitality – Full Service | Loan # 3 | Cut-off Date Balance: | | $100,000,000 |
3600 South Las Vegas Boulevard | Bellagio Hotel and Casino | Cut-off Date LTV: | | 39.3% |
Las Vegas, NV 89109 | | UW NCF DSCR: | | 8.42x |
| | UW NOI Debt Yield: | | 28.3% |
Escrows.
Real Estate Taxes – For so long as the Bellagio Hotel and Casino Property is subject to the Bellagio Lease, no reserves for real estate taxes are required under the Bellagio Hotel and Casino Whole Loan documents. If the Bellagio Hotel and Casino Property is not subject to the Bellagio Lease, solely if a Cash Trap Period (as defined below) is in effect, the Bellagio Hotel and Casino Whole Loan documents provide for ongoing monthly reserves for real estate taxes in an amount equal to 1/12 of the real estate taxes that the lender estimates will be payable during the next twelve months. Notwithstanding the foregoing, the requirement for such monthly reserves will be reduced dollar for dollar by any taxes paid or reserved for by a brand manager or casino operator pursuant to a brand management or casino management agreement relating to the Bellagio Hotel and Casino Property.
Insurance – For so long as the Bellagio Hotel and Casino Property is subject to the Bellagio Lease, no reserves for insurance premiums are required under the Bellagio Hotel and Casino Whole Loan documents. If the Bellagio Hotel and Casino Property is not subject to the Bellagio Lease, solely if a Cash Trap Period is in effect, the Bellagio Hotel and Casino Whole Loan documents provide for ongoing monthly reserves for insurance premiums in an amount equal to 1/12 of the insurance premiums that the lender estimates will be payable for the renewal of the insurance policies. Notwithstanding the foregoing, the requirement for such monthly reserves will be reduced dollar for dollar by any insurance premiums paid or reserved for by a brand manager or casino operator pursuant to a brand management or casino management agreement relating to the Bellagio Hotel and Casino Property. In addition, such monthly reserves will not be required so long as (i) no event of default is continuing, and (ii) the insurance coverage for the Bellagio Hotel and Casino Property is included in a blanket policy reasonably acceptable to the lender.
Recurring Replacements – For so long as the Bellagio Hotel and Casino Property is subject to the Bellagio Lease, no reserves for replacements are required under the Bellagio Hotel and Casino Whole Loan documents. If the Bellagio Hotel and Casino Property is not subject to the Bellagio Lease, the Bellagio Hotel and Casino Whole Loan documents provide for monthly deposits into a replacement reserve equal to (i) on each payment date during a Cash Trap Period, the Replacement Reserve Monthly Deposit (as defined below) and (ii) if a Cash Trap Period does not exist, on the first payment date of each calendar quarter, an amount equal to the lesser of (x) the positive difference between (A) the aggregate amount of Replacement Reserve Monthly Deposits that would have been funded during the calendar year to date and (B) the sum of the aggregate amount for the calendar year to date of funds expended on replacements, property improvement plan work (“PIP Work”) and brand mandated work and any amounts actually deposited into the replacement reserve, and (y) from and after January 1, 2024, for each four year period commencing on January 1, 2020, the positive difference between (A) (i) 4.0% of net revenue from guest rooms and borrower-managed food and beverage operations and (ii) 0.5% of all other net revenue (other than non-recurring items), in each case during such four year period and (B) the sum of the aggregate amount expended on replacements, PIP Work and brand mandated work and any amounts actually deposited into the replacement reserve, in each case during such four year period. Notwithstanding the foregoing, the requirement for such reserves will be reduced dollar for dollar by any reserves for replacements, PIP Work or brand mandated work reserved for by a brand manager or casino operator pursuant to a brand management or casino management agreement relating to the Bellagio Hotel and Casino Property.
“Replacement Reserve Monthly Deposit” means an amount equal to (i) 4.0% of net revenue from guest rooms and borrower-managed food and beverage operations for the calendar month that is two calendar months prior to the calendar month in which the applicable deposit to the replacement reserve is to be made and (ii) 0.5% of all other net revenue (other than non-recurring items) for the calendar month that is two calendar months prior to the calendar month in which the applicable deposit to the replacement reserve is to be made.
A “Cash Trap Period” will commence (a) upon the occurrence of an event of default under the Bellagio Hotel and Casino Whole Loan documents, (b) upon the occurrence of a DSCR Trigger Event (as defined below) or (c) upon the occurrence of a Bellagio Tenant Bankruptcy Event (as defined below), and will terminate upon (x) with respect to clause (a), the cure of such event of default, (y) with respect to clause (b), the termination of such DSCR Trigger Event, or (z) with respect to clause (c), the occurrence of a Bellagio Tenant Bankruptcy Event Cure (as defined below).
A “Bellagio Tenant Bankruptcy Event” will occur if the Bellagio Tenant makes an assignment for the benefit of creditors or if a receiver, liquidator or trustee is appointed for the Bellagio Tenant or if the Bellagio Tenant is adjudicated a bankrupt or insolvent, or if any bankruptcy action is filed, provided that, if such bankruptcy action was involuntary and not consented to by the Bellagio Tenant, upon the same not being discharged, stayed or dismissed within 90 days.
A “Bellagio Tenant Bankruptcy Event Cure” means the occurrence of any of the following events: (i) the Bellagio Tenant, as debtor in possession, or a trustee for the Bellagio Tenant, has assumed the Bellagio Lease pursuant to the bankruptcy code, and an order authorizing the assumption of the Bellagio Lease has been granted by the applicable court and the Bellagio Tenant has satisfied its obligations under the bankruptcy code; or (ii) the Bellagio Tenant (or a qualifying replacement tenant) has entered into the Bellagio Lease (or a qualifying replacement lease) in accordance with the terms of the Bellagio Hotel and Casino Whole Loan documents, provided that, if the initial Bellagio Lease is terminated and not otherwise replaced in accordance with the terms of the Bellagio Hotel and Casino Whole Loan documents, a Bellagio Tenant Bankruptcy Event Cure will be deemed to have occurred if either (x) the debt service coverage ratio (based on the Adjusted EBITDA (as defined below) and the Bellagio Hotel and Casino Whole Loan debt service) (hereinafter, the “Whole Loan DSCR”) equals or exceeds 2.50x for two consecutive calendar quarters following the occurrence of the related Bellagio Tenant Bankruptcy Event or (y) the Bellagio Hotel and Casino Borrower makes voluntary prepayments in accordance with the terms of the Bellagio Hotel and Casino Whole Loan documents in an amount necessary to achieve a Whole Loan DSCR equal to or greater than 2.50x, in which case such Bellagio Tenant Bankruptcy Event will terminate upon such prepayment.
A “DSCR Trigger Event” will occur if the Whole Loan DSCR is less than 2.50x at the end of two consecutive calendar quarters, and will end if, provided no event of default is continuing under the Bellagio Hotel and Casino Whole Loan documents, (i) the Whole Loan DSCR
THE INFORMATION IN THIS STRUCTURAL AND COLLATERAL TERM SHEET IS NOT COMPLETE AND MAY BE AMENDED PRIOR TO THE TIME OF SALE. THIS TERM SHEET IS NOT AN OFFER TO SELL THESE SECURITIES AND IT IS NOT A SOLICITATION OF AN OFFER TO BUY THESE SECURITIES IN ANY JURISDICTION WHERE THE OFFER OR SALE IS NOT PERMITTED.
68
Hospitality – Full Service | Loan # 3 | Cut-off Date Balance: | | $100,000,000 |
3600 South Las Vegas Boulevard | Bellagio Hotel and Casino | Cut-off Date LTV: | | 39.3% |
Las Vegas, NV 89109 | | UW NCF DSCR: | | 8.42x |
| | UW NOI Debt Yield: | | 28.3% |
is equal to or greater than 2.50x for two consecutive calendar quarters, or (ii) the Bellagio Hotel and Casino Borrower has prepaid the Bellagio Hotel and Casino Whole Loan in accordance with the terms of the Bellagio Hotel and Casino Whole Loan documents in an amount necessary to achieve a Whole Loan DSCR equal to or greater than 2.50x, provided that, in the event that a prepayment under clause (ii) occurs, the DSCR Trigger Event will terminate upon such prepayment.
“Adjusted EBITDA” means EBITDA plus, without duplication, any Bellagio Lease rent reflected in Net Income, and, without duplication, in each case as determined in accordance with the Bellagio Lease and generally accepted accounting principles (“GAAP”) consistently applied using the Existing Accounting Guidelines.
“EBITDA” means for any test period and with respect to any Person or facility (as applicable), the sum of (a) Net Income of such Person or facility for that period, plus or minus the following (without duplication in each case) to the extent reflected in Net Income for that period, plus (b) any extraordinary loss, and, without duplication, any loss associated with the early retirement of indebtedness and with any disposition not in the ordinary course of business, minus (c) any extraordinary gain, and, without duplication, any gains associated with the early retirement of indebtedness and with any disposition not in the ordinary course of business, plus (d) interest charges of such Person or facility for that period, less (e) interest income of such Person or facility for that period, plus (f) the aggregate amount of expense for federal, foreign, state and local taxes on or measured by income of such Person or facility for that period excluding gaming taxes (whether or not payable during that period), minus (g) the aggregate amount of benefit for federal, foreign, state and local taxes on or measured by income of such Person or facility for that period excluding gaming taxes (whether or not receivable during that period), plus (h) depreciation, amortization, plus (i) all non-recurring and/or other non-cash expenses which will be limited to third party expenses in connection with an acquisition or disposition of an asset, plus (j) loss on sale or disposal of an asset, and write downs and impairments of an asset, minus (k) all non-recurring and/or other non-cash income in connection with an acquisition or disposition, and gain on sale of an asset, plus (l) expenses classified as “pre-opening and start-up expenses” on the applicable financial statements of that Person or facility for that fiscal period which will be limited to costs related directly to the facility’s primary intended use (hospitality, entertainment, gaming and/or pari mutual use, together with ancillary or complementary uses), minus (m) non-cash reversal of an accrual or reserve not recorded in the ordinary course, plus or minus (n) the impact of any foreign currency gains or losses and related swaps, plus (o) all long-term non-cash expenses realized in connection with or resulting from equity or equity-linked compensation plans, employee benefit plans or agreements or post-employment benefit plans or agreements, stock appreciation or similar rights, stock options, restricted stock, preferred stock, stock appreciation or other similar rights, in each case as determined in accordance with GAAP, consistently applied using the Existing Accounting Guidelines.
“Existing Accounting Guidelines” means the Bellagio Tenant’s accounting guidelines and policies in effect as of the Bellagio Lease commencement date and which are subject to change to the extent not material or to the extent needed to reflect changes in GAAP.
“Net Income” means, with respect to any fiscal period and with respect to any person, the net income (or net loss) of that person, determined in accordance with the Bellagio Lease and GAAP, consistently applied using the Existing Accounting Guidelines.
“Person” means any individual, corporation, partnership, joint venture, limited liability company, estate, trust, unincorporated association, any federal, state, county or municipal government or any bureau, department or agency thereof and any fiduciary acting in such capacity on behalf of any of the foregoing.
Lockbox and Cash Management. The Bellagio Hotel and Casino Whole Loan is structured with a hard lockbox solely for payments of rent made to the Bellagio Hotel and Casino Borrower by the Bellagio Tenant under the Bellagio Lease. However, if the Bellagio Hotel and Casino Property is no longer subject to the Bellagio Lease, then (i) if it is subject to a brand management agreement or casino management agreement, rents and cash receipts required to be remitted to the Bellagio Hotel and Casino Borrower pursuant to the brand management agreement and/or casino management agreement (which may be paid initially to the brand manager and/or casino manager or an account maintained by such manager, and from which such manager may have the right to deduct its fees, reserves and other funds), will be required to be remitted to the lockbox account within one business day of the date such amounts would have otherwise been transferred to the Bellagio Hotel and Casino Borrower, and (ii) if no brand management agreement is in effect, the Bellagio Hotel and Casino Borrower will be required to deposit rents from the Bellagio Hotel and Casino Property into the lockbox account within one business day of receipt.
The Bellagio Hotel and Casino Whole Loan is structured with springing cash management. If no Cash Trap Period exists, amounts on deposit in the lockbox account are required to be disbursed to the Bellagio Hotel and Casino Borrower’s operating account. During the continuance of a Cash Trap Period, funds in the lockbox account are required to be deposited into a lender controlled cash management account. During the continuance of a Cash Trap Period, funds in the cash management account are required to be applied (i) if the Bellagio Hotel and Casino Property is not subject to the Bellagio Lease, to make deposits into the tax and insurance reserves (if any), as described above under “Escrows”, (ii) if the Bellagio Hotel and Casino Property is not subject to the Bellagio Lease, to pay hotel taxes and custodial funds (funds collected by the Bellagio Hotel and Casino Borrower on a third party’s behalf that must be paid or remitted to a third party), (iii) to pay debt service on the Bellagio Hotel and Casino Whole Loan, (iv) if the Bellagio Hotel and Casino Property is not subject to the Bellagio Lease, to pay operating expenses set forth in the annual budget (which is required to be reasonably approved by the lender during an event of default or DSCR Trigger Period, subject to certain exceptions for life, health and safety matters, or if a brand management agreement and/or casino management agreement is in effect, for items as to which the Bellagio Hotel and Casino Borrower does not have approval rights under such agreement(s)), (v) if the Bellagio Hotel and Casino Property is not subject to the Bellagio Lease, to make deposits into the recurring replacements reserve, as described above under “Escrows”, and (vi) to pay any remainder into an excess cash flow account, (x) to be held by the lender as additional security for the Bellagio Hotel and Casino Whole Loan during the continuance of the Cash Sweep Event Period (unless the Bellagio Hotel and Casino Borrower has delivered an Excess Cash Flow Guaranty (as described below), in which event such remainder will be remitted to the
THE INFORMATION IN THIS STRUCTURAL AND COLLATERAL TERM SHEET IS NOT COMPLETE AND MAY BE AMENDED PRIOR TO THE TIME OF SALE. THIS TERM SHEET IS NOT AN OFFER TO SELL THESE SECURITIES AND IT IS NOT A SOLICITATION OF AN OFFER TO BUY THESE SECURITIES IN ANY JURISDICTION WHERE THE OFFER OR SALE IS NOT PERMITTED.
69
Hospitality – Full Service | Loan # 3 | Cut-off Date Balance: | | $100,000,000 |
3600 South Las Vegas Boulevard | Bellagio Hotel and Casino | Cut-off Date LTV: | | 39.3% |
Las Vegas, NV 89109 | | UW NCF DSCR: | | 8.42x |
| | UW NOI Debt Yield: | | 28.3% |
Bellagio Hotel and Casino Borrower), or (y) if no Cash Sweep Event Period is continuing, to be disbursed to an account designated by the Bellagio Hotel and Casino Borrower.
Notwithstanding the existence of an event of default under the Bellagio Hotel and Casino Whole Loan, unless a Priority Payment Cessation Event (as defined below) has occurred, the lender is required to apply amounts on deposit in the cash management account to pay taxes, insurance premiums, hotel taxes and custodial funds, and then to pay protective advances, and any amounts remaining after such payments may be applied to any obligations of the Bellagio Hotel and Casino Borrower under the loan documents as the lender may determine in its sole discretion. “Priority Payment Cessation Event” means (a) the initiation of (x) judicial or non-judicial foreclosure proceedings, (y) proceedings for appointment of a receiver or (z) similar remedies permitted by the loan documents relating to all or a material portion of the Bellagio Hotel and Casino Property, and/or (b) the imposition of a stay, an injunction or a similar judicially imposed device that has the effect of preventing the lender from exercising its remedies under the loan documents.
For so long as the Bellagio Hotel and Casino Property is subject to the Bellagio Lease, funds in the excess cash flow reserve are required to be disbursed, at the Bellagio Hotel and Casino Borrower’s request, to pay (i) debt service and/or debt service under any mezzanine loan entered into pursuant to the loan documents, (ii) amounts for voluntary prepayment of the (A) Bellagio Hotel and Casino Whole Loan or mandatory prepayment in connection with a casualty or condemnation or (B) amounts for voluntary prepayment of any mezzanine loan or mandatory prepayment thereof in connection with a casualty or condemnation (provided such prepayment is made pro rata between the Bellagio Hotel and Casino Whole Loan and any such mezzanine loan), (iii) amounts for prepayments to cure a DSCR Trigger Event, (iv) costs associated with the Bellagio Lease, (v) any fees and costs payable by the Bellagio Hotel and Casino Borrower, including to the lender, subject to and in compliance with the loan documents, including without limitation costs related to a letter of credit or renewal of the required environmental insurance policy, (vi) legal, audit, tax and accounting (including actual costs incurred by BREIT OP (directly or indirectly) and its service providers for back-office accounting and for costs associated with the Bellagio Hotel and Casino Property or Bellagio Hotel and Casino Borrower); provided that excess cash flow may not be used to enforce Bellagio Hotel and Casino Borrower’s rights under the loan documents or defend any enforcement by the lender of its rights under the loan documents, (vii) distributions to maintain the status of BREIT and other affiliated real estate investment trusts (“REITs”) as REITs and avoid imposition of any entity level tax on such REITs, provided such distributions may not exceed 10% of all deposits made into the excess cash flow reserve as of the date of determination, and (viii) other items reasonably approved by the lender. If the Bellagio Hotel and Casino Property is not subject to the Bellagio Lease, in addition to the items described above, funds in the excess cash flow reserve are required to be disbursed, at the request of the Bellagio Hotel and Casino Borrower, to pay (i) operating expenses (including management fees, franchise fees and other fees, charges or costs, payable to the manager under a casino management agreement or brand management agreement or the franchisor under a franchise agreement), (ii) costs associated with emergency repairs and/or life safety issues, (iii) capital expenditures, replacements, alterations, PIP Work or brand-mandated work, (iv) hotel taxes and custodial funds, (v) costs incurred in connection with the purchase of any furniture, fixtures and equipment, (vi) costs of restoration in excess of available net proceeds, (vii) costs associated with any ground lease or any other leases, and (viii) payment of shortfalls in required deposits to other reserve accounts.
For so long as no event of default is continuing, the Bellagio Hotel and Casino Borrower will be permitted to deliver a guaranty of the payment of excess cash flow in a form attached to the loan agreement from BREIT, BREIT OP or another affiliate of the Bellagio Hotel and Casino Borrower which is controlled by BREIT or BREIT OP and satisfies certain net worth requirements (an “Excess Cash Flow Guaranty”) in lieu of depositing excess cash flow into the excess cash flow reserve, provided, that it is a condition to delivery of an Excess Cash Flow Guaranty that (i) if the aggregate obligations under the Excess Cash Flow Guaranty (plus any outstanding amount under any letter of credit delivered under the Bellagio Hotel and Casino Whole Loan if the applicant thereunder is BREIT OP or a subsidiary of BREIT OP that directly or indirectly owns 49% or more of the equity interests in the Bellagio Hotel and Casino Borrower) exceed 15.00%, a new non-consolidation opinion in respect of the Excess Cash Flow Guaranty reasonably satisfactory to the lender must be delivered and (ii) an enforceability opinion must be delivered. Pursuant to the Bellagio Hotel and Casino Whole Loan documents, upon the earliest to occur of (i) a monetary event of default, (ii) a Priority Payment Cessation Event, and (iii) the delivery of a deed in lieu of foreclosure, the Bellagio Hotel and Casino Borrower (or guarantor under the Excess Cash Flow Guaranty) is required to remit to the lender an amount equal to the amount of excess cash flow that was disbursed to the Bellagio Hotel and Casino Borrower in lieu of being deposited into the excess cash flow reserve, less the amount that the Bellagio Hotel and Casino Borrower would have been permitted to withdraw from the excess cash flow reserve, as described above, as of such date, which amount will at the lender’s option either be deposited into the excess cash flow reserve or applied as if it had been contained in the excess cash flow reserve.
Property Management. The Bellagio Hotel and Casino Property is managed by the Bellagio Tenant.
Release of Property. Not permitted.
Real Estate Substitution. Not permitted.
Subordinate and Mezzanine Indebtedness. The Bellagio Hotel and Casino Property also secures the Bellagio Hotel and Casino Non- Serviced Pari Passu Companion Loans, which have an aggregate Cut-off Date principal balance of $1,576,200,000, the Bellagio Hotel and Casino Junior A Notes, which have an aggregate Cut-off Date principal balance of $650,500,000 and the Bellagio Hotel and Casino Junior B Notes, which have an aggregate Cut-off Date principal balance of $683,300,000. The Bellagio Hotel and Casino Non-Serviced Pari Passu Companion Loans and the Bellagio Hotel and Casino Subordinate Companion Loan are coterminous with the Bellagio Hotel and Casino Mortgage Loan. The Bellagio Hotel and Casino Non-Serviced Pari Passu Companion Loans and Bellagio Hotel and Casino Junior A Notes accrue interest at the same rate as the Bellagio Hotel and Casino Mortgage Loan, and the Bellagio Hotel and Casino Junior B Notes accrue interest at an interest rate of 5.350000% per annum. The Bellagio Hotel and Casino Mortgage Loan and the Bellagio Hotel and Casino Non-Serviced Pari Passu Companion Loans are each pari passu in right of payment and together are senior in right of payment to the Bellagio Hotel and Casino Subordinate Companion Loan, and the Bellagio Hotel and Casino Junior A Notes
THE INFORMATION IN THIS STRUCTURAL AND COLLATERAL TERM SHEET IS NOT COMPLETE AND MAY BE AMENDED PRIOR TO THE TIME OF SALE. THIS TERM SHEET IS NOT AN OFFER TO SELL THESE SECURITIES AND IT IS NOT A SOLICITATION OF AN OFFER TO BUY THESE SECURITIES IN ANY JURISDICTION WHERE THE OFFER OR SALE IS NOT PERMITTED.
70
Hospitality – Full Service | Loan # 3 | Cut-off Date Balance: | | $100,000,000 |
3600 South Las Vegas Boulevard | Bellagio Hotel and Casino | Cut-off Date LTV: | | 39.3% |
Las Vegas, NV 89109 | | UW NCF DSCR: | | 8.42x |
| | UW NOI Debt Yield: | | 28.3% |
are senior in right of payment to the Bellagio Hotel and Casino Junior B Notes. The holders of the Bellagio Hotel and Casino Mortgage Loan, the Bellagio Hotel and Casino Non-Serviced Pari Passu Companion Loans and the Bellagio Hotel and Casino Subordinate Companion Loan have entered into a co-lender agreement which sets forth the allocation of collections on the Bellagio Hotel and Casino Whole Loan. See “Description of the Mortgage Pool—The Whole Loans—The Non-Serviced AB Whole Loans—The Bellagio Hotel and Casino Whole Loan ” in the Preliminary Prospectus.
Subordinate Note Summary
| | B-Note Original Principal Balance | B-Note Interest Rate | Original Term (mos.) | Original Amort. Term (mos.) | Original IO Term (mos.) | Total Debt UW NCF DSCR | Total Debt UW NOI Debt Yield(2) | Total Debt Cutoff Date LTV(2) |
| Bellagio Hotel and Casino Subordinate Companion Loan | $1,333,800,000 | (1) | 120 | 0 | 120 | 4.06x | 15.7% | 70.7% |
| (1) | The Bellagio Hotel and Casino Subordinate Companion Loan is comprised of the Bellagio Hotel and Casino Junior A Notes, which accrue interest at the rate of 3.170153% per annum, and the Bellagio Hotel and Casino Junior B Notes, which accrue interest at the rate of 5.350000% per annum. |
| (2) | Based on the master lease annual rent of $245,000,000, Total Debt DSCR is 2.19x and Total Debt debt yield is 8.1%. |
The Bellagio Hotel and Casino Whole Loan documents provide for a one time right of a parent entity of the Bellagio Hotel and Casino Borrower to obtain a mezzanine loan secured by the direct or indirect equity interests in the Bellagio Hotel and Casino Borrower, provided that certain conditions are satisfied, including but not limited to (i) the principal amount of the mezzanine loan can in no event be greater than an amount equal to the amount which will yield (x) an aggregate loan-to-value ratio that does not exceed 72%, and (y) a Whole Loan DSCR that is not less than 4.24x and (ii) the mezzanine lender enters into an intercreditor agreement reasonably acceptable to the lender and the mezzanine lender. No rating agency confirmation is required for the mezzanine loan, and the mezzanine loan is not required to be co-terminous with the Bellagio Hotel and Casino Whole Loan. The mezzanine loan documents may permit voluntary prepayment of the mezzanine loan without corresponding prepayment of the Bellagio Hotel and Casino Whole Loan (except that prepayments of the mezzanine loan to cure a DSCR Trigger Event or prepayments from the excess cash flow reserve must be made concurrently with a pro rata prepayment of the Bellagio Hotel and Casino Whole Loan). In addition, the mezzanine loan documents may permit that, provided no event of default is continuing under the Bellagio Hotel and Casino Whole Loan, the mezzanine borrower may prepay the mezzanine loan at a discount pursuant to negotiated transactions with only the mezzanine lender.
Ground Lease. A portion of the Bellagio Hotel and Casino Property, consisting of approximately 0.84 acres located at the southeast corner of the Bellagio Hotel and Casino Property, which currently houses the Bellagio’s marquee sign and a portion of the walkway leading from the sidewalk on Las Vegas Boulevard to the main entrance to the hotel, is ground leased pursuant to a ground lease from MKB Company (the “MKB Ground Lease”). The initial term of the MKB Ground Lease expires on April 27, 2033. The Bellagio Hotel and Casino Borrower, as ground lessee, has two renewal options of 20 years each, so long as the Bellagio Hotel and Casino Borrower provides at least one year prior written notice to the ground lessor and is not in default under the MKB Ground Lease both as of the date it exercises its option and on the date of commencement of the option term. The initial annual ground rent was $225,000 beginning in April 1995 and has adjusted on an annual basis based on the Consumer Price Index since that time, plus an additional $75,000 increase in annual ground rent that occurred in April 2014. The current annual ground rent for the MKB Ground Lease is $503,702.77. The ground rent is subject to annual increase (including during the extension terms) based on a formula based on the Consumer Price Index. The MKB Ground Lease lacks certain customary lender protections. See the exceptions to representations and warranties set forth in the Preliminary Prospectus.
Letter of Credit. None.
Right of First Refusal. None.
Terrorism Insurance. The Bellagio Hotel and Casino Whole Loan documents require that the “all risk” insurance policy required to be maintained by the Bellagio Hotel and Casino Borrower provide coverage for terrorism in an amount equal to the full replacement cost of the Bellagio Hotel and Casino Property, and business interruption insurance covering no less than the 24-month period following the occurrence of a casualty event, together with a 12-month extended period of indemnity. So long as the Bellagio Hotel and Casino Property is subject to the Bellagio Lease, the Bellagio Hotel and Casino Borrower is permitted to rely on terrorism insurance provided by the Bellagio Tenant. The permitted deductible for terrorism insurance for the Bellagio Hotel and Casino Borrower under the Bellagio Hotel and Casino Whole Loan documents is $500,000 and for the Bellagio Tenant under the Bellagio Lease is $2,500,000. Notwithstanding the required amount of terrorism insurance above, if (A) the Terrorism Risk Insurance Program Reauthorization Act of 2015 or a similar or subsequent statute (“TRIPRA”) is not in effect (B) TRIPRA or a similar or subsequent statute, extension or reauthorization is modified which results in a material increase in terrorism insurance premiums, or (C) there is a disruption in the terrorism insurance marketplace as the result of a terrorism event which results in a material increase in terrorism insurance premiums, provided that terrorism insurance is commercially available, the Bellagio Hotel and Casino Borrower (or Bellagio Tenant) will be required to carry terrorism insurance coverage, but will not be required to spend on terrorism insurance coverage more than two times the amount of the insurance premium that is payable at such time in respect of the property and business interruption/rental loss insurance required under the Bellagio Hotel and Casino Whole Loan documents (without giving effect to the cost of the terrorism, flood, earthquake and windstorm components of such casualty and business interruption/rental loss insurance), and if the cost of terrorism insurance exceeds such amount, the Bellagio Hotel and Casino Borrower (or Bellagio Tenant) will be required to purchase the maximum amount of terrorism insurance available with funds equal to such amount.
In addition, terrorism insurance for the Bellagio Hotel and Casino Property may be written by a non-rated captive insurer subject to certain conditions, including, among other things: (i) TRIPRA is required to be in full force and effect; (ii) the terrorism policy issued
THE INFORMATION IN THIS STRUCTURAL AND COLLATERAL TERM SHEET IS NOT COMPLETE AND MAY BE AMENDED PRIOR TO THE TIME OF SALE. THIS TERM SHEET IS NOT AN OFFER TO SELL THESE SECURITIES AND IT IS NOT A SOLICITATION OF AN OFFER TO BUY THESE SECURITIES IN ANY JURISDICTION WHERE THE OFFER OR SALE IS NOT PERMITTED.
71
Hospitality – Full Service | Loan # 3 | Cut-off Date Balance: | | $100,000,000 |
3600 South Las Vegas Boulevard | Bellagio Hotel and Casino | Cut-off Date LTV: | | 39.3% |
Las Vegas, NV 89109 | | UW NCF DSCR: | | 8.42x |
| | UW NOI Debt Yield: | | 28.3% |
by such captive insurer, together with any other qualified terrorism policies in-place, provide per occurrence limit in an amount not less than replacement cost and rent loss coverage as otherwise required; (iii) except with respect to deductibles permitted under the Bellagio Lease, covered losses that are not reinsured by the federal government under TRIPRA and paid to the captive insurer is required to be reinsured with a cut-through endorsement by an insurance company rated “A” by S&P and “A2” by Moody’s (to the extent Moody’s rates securities which represent an interest in the Bellagio Hotel and Casino Whole Loan and rates the applicable insurance company); (iv) all reinsurance agreements between the captive insurer and other reinsurance providers is required to be subject to the reasonable approval of the lender; and (v) such captive insurer is required to be licensed in the State of Nevada or other jurisdiction to the extent reasonably approved by the lender and qualified to issue the terrorism policy in accordance with applicable legal requirements. See “Risk Factors—Risks Relating to the Mortgage Loans—Terrorism Insurance May Not Be Available for All Mortgaged Properties” in the Preliminary Prospectus.
THE INFORMATION IN THIS STRUCTURAL AND COLLATERAL TERM SHEET IS NOT COMPLETE AND MAY BE AMENDED PRIOR TO THE TIME OF SALE. THIS TERM SHEET IS NOT AN OFFER TO SELL THESE SECURITIES AND IT IS NOT A SOLICITATION OF AN OFFER TO BUY THESE SECURITIES IN ANY JURISDICTION WHERE THE OFFER OR SALE IS NOT PERMITTED.
72
(THIS PAGE INTENTIONALLY LEFT BLANK)
THE INFORMATION IN THIS STRUCTURAL AND COLLATERAL TERM SHEET IS NOT COMPLETE AND MAY BE AMENDED PRIOR TO THE TIME OF SALE. THIS TERM SHEET IS NOT AN OFFER TO SELL THESE SECURITIES AND IT IS NOT A SOLICITATION OF AN OFFER TO BUY THESE SECURITIES IN ANY JURISDICTION WHERE THE OFFER OR SALE IS NOT PERMITTED.
73
Office – CBD | Loan #4 | Cut-off Date Balance: | | $81,285,000 |
545 Washington Boulevard | 545 Washington Boulevard | Cut-off Date LTV: | | 61.4% |
Jersey City, NJ 07310 | | U/W NCF DSCR: | | 2.50x |
| | U/W NOI Debt Yield: | | 8.8% |
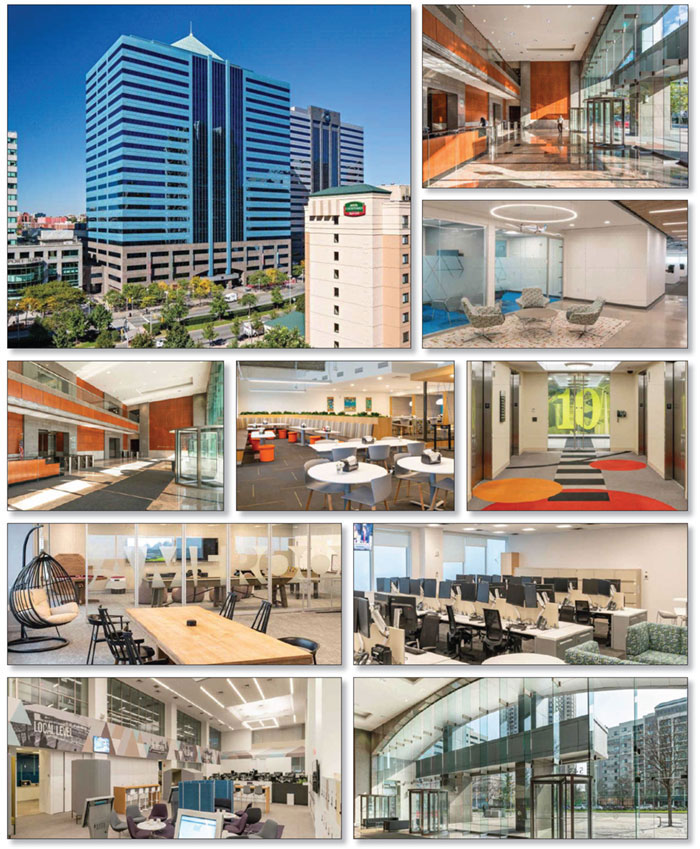
THE INFORMATION IN THIS STRUCTURAL AND COLLATERAL TERM SHEET IS NOT COMPLETE AND MAY BE AMENDED PRIOR TO THE TIME OF SALE. THIS TERM SHEET IS NOT AN OFFER TO SELL THESE SECURITIES AND IT IS NOT A SOLICITATION OF AN OFFER TO BUY THESE SECURITIES IN ANY JURISDICTION WHERE THE OFFER OR SALE IS NOT PERMITTED.
74
Office – CBD | Loan #4 | Cut-off Date Balance: | | $81,285,000 |
545 Washington Boulevard | 545 Washington Boulevard | Cut-off Date LTV: | | 61.4% |
Jersey City, NJ 07310 | | U/W NCF DSCR: | | 2.50x |
| | U/W NOI Debt Yield: | | 8.8% |
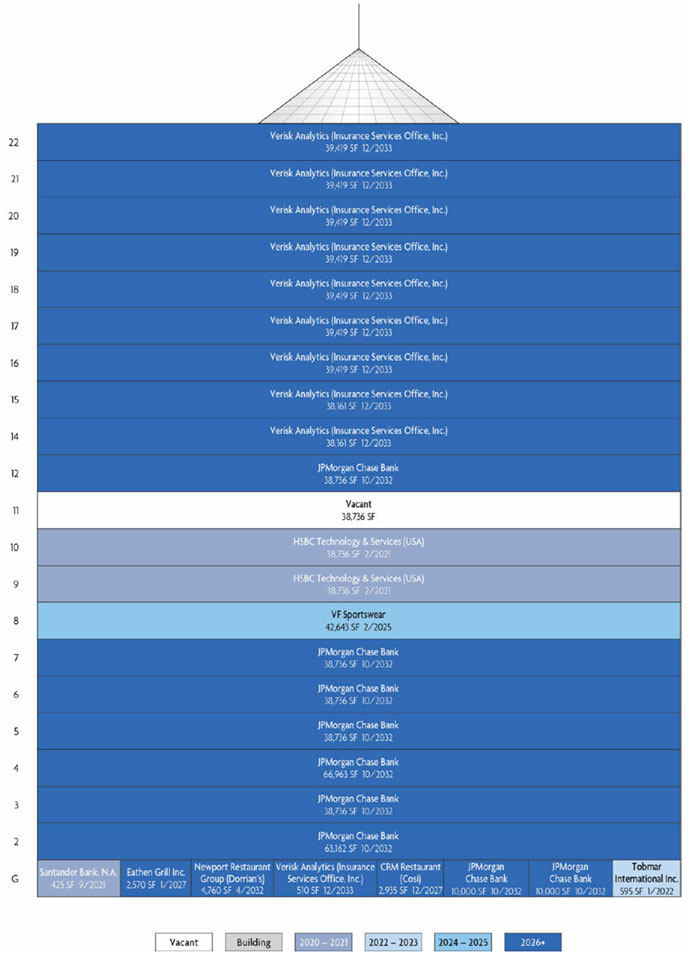
THE INFORMATION IN THIS STRUCTURAL AND COLLATERAL TERM SHEET IS NOT COMPLETE AND MAY BE AMENDED PRIOR TO THE TIME OF SALE. THIS TERM SHEET IS NOT AN OFFER TO SELL THESE SECURITIES AND IT IS NOT A SOLICITATION OF AN OFFER TO BUY THESE SECURITIES IN ANY JURISDICTION WHERE THE OFFER OR SALE IS NOT PERMITTED.
75
Office – CBD | Loan #4 | Cut-off Date Balance: | | $81,285,000 |
545 Washington Boulevard | 545 Washington Boulevard | Cut-off Date LTV: | | 61.4% |
Jersey City, NJ 07310 | | U/W NCF DSCR: | | 2.50x |
| | U/W NOI Debt Yield: | | 8.8% |
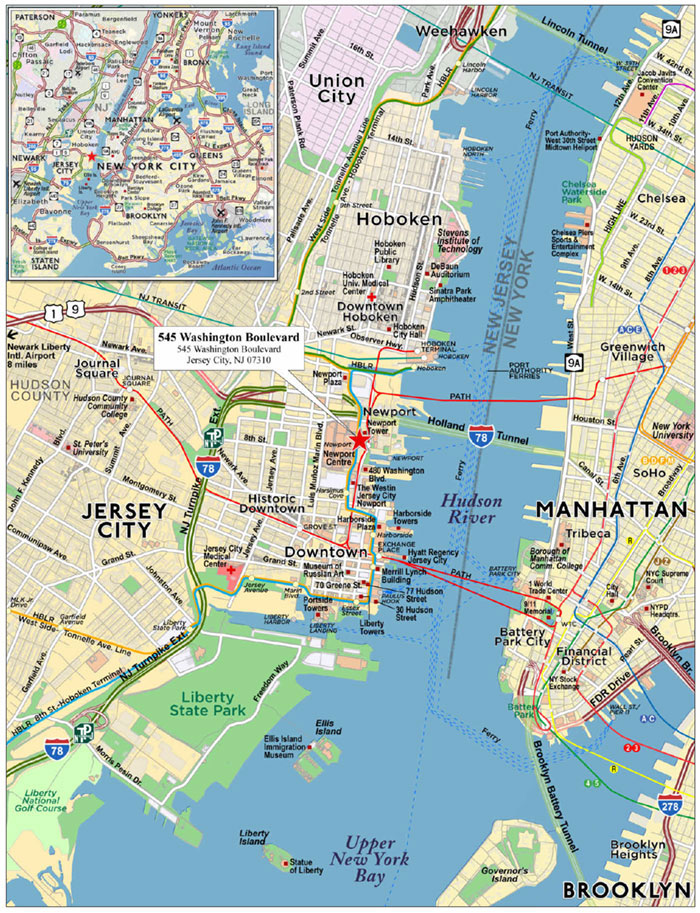
THE INFORMATION IN THIS STRUCTURAL AND COLLATERAL TERM SHEET IS NOT COMPLETE AND MAY BE AMENDED PRIOR TO THE TIME OF SALE. THIS TERM SHEET IS NOT AN OFFER TO SELL THESE SECURITIES AND IT IS NOT A SOLICITATION OF AN OFFER TO BUY THESE SECURITIES IN ANY JURISDICTION WHERE THE OFFER OR SALE IS NOT PERMITTED.
76
No. 4 – 545 Washington Boulevard |
|
Mortgage Loan Information | | Mortgaged Property Information |
Mortgage Loan Seller: | Morgan Stanley Mortgage Capital Holdings LLC | | Single Asset/Portfolio: | Single Asset |
Credit Assessment (Fitch/KBRA/S&P): | NR/NR/NR | | Property Type – Subtype: | Office – CBD |
Original Principal Balance(1): | $81,285,000 | | Location: | Jersey City, NJ |
Cut-off Date Balance(1): | $81,285,000 | | Size: | 866,706 SF |
% of Initial Pool Balance: | 5.0% | | Cut-off Date Balance Per SF(1): | $290.30 |
Loan Purpose: | Acquisition | | Maturity Date Balance Per SF(1): | $290.30 |
Borrower Sponsors: | HGI Opportunity Fund XIII, LP and HGGP Capital XIV, LP | | Year Built/Renovated: | 2001/NAP |
Guarantor(2): | Various | | Title Vesting: | Fee |
Mortgage Rate: | 3.4050% | | Property Manager: | Harbor Group Management Co., LLC (borrower-related) |
Note Date: | January 6, 2020 | | Current Occupancy (As of): | 95.5% (8/1/2019) |
Seasoning: | 0 months | | YE 2018 Occupancy: | 95.5% |
Maturity Date: | February 5, 2030 | | YE 2017 Occupancy: | 95.5% |
IO Period: | 120 months | | YE 2016 Occupancy: | 100.0% |
Loan Term (Original): | 120 months | | As-Is Appraised Value: | $410,000,000 |
Amortization Term (Original): | NAP | | As-Is Appraised Value Per SF: | $473.06 |
Loan Amortization Type: | Interest-only, Balloon | | As-Is Appraisal Valuation Date: | October 16, 2019 |
Call Protection(3): | L(24),D(89),O(7) | | | |
Lockbox Type: | Springing | | Underwriting and Financial Information |
Additional Debt(1): | Yes | | TTM NOI (11/30/2019): | $20,411,841 |
Additional Debt Type (Balance) (1): | Pari Passu ($170,321,250); Future Mezzanine | | YE 2018 NOI: | $21,825,858 |
| | | YE 2017 NOI: | $19,827,872 |
| | | YE 2016 NOI: | NAP |
| | | U/W Revenues: | $34,549,509 |
| | | U/W Expenses: | $12,284,114 |
| | | U/W NOI: | $22,265,395 |
Escrows and Reserves(4) | | U/W NCF: | $21,683,475 |
| Initial | Monthly | Cap | | U/W DSCR based on NOI/NCF(1): | 2.56x / 2.50x |
Taxes | $881,651 | Springing | NAP | | U/W Debt Yield based on NOI/NCF(1): | 8.8% / 8.6% |
Insurance | $0 | Springing | NAP | | U/W Debt Yield at Maturity based on NOI/NCF(1) | 8.8% / 8.6% |
Replacement Reserve | $0 | $10,834 | NAP | | Cut-off Date LTV Ratio(1): | 61.4% |
TI/LC | $0 | $72,226 | $1,500,000 | | LTV Ratio at Maturity(1): | 61.4% |
Outstanding TI/LC Reserve | $4,840,935 | $0 | NAP | | | |
Rent Concession Reserve | $21,201,910 | $0 | NAP | | | |
Major Tenant Rollover Reserve | $0 | Springing | NAP | | | |
| | | | | | | |
Sources and Uses |
Sources | | | | | Uses | | | |
Original Whole Loan amount(1) | $251,606,250 | | 62.1% | | Purchase price | $372,750,000 | | 92.0% |
Cash equity contribution | 153,568,618 | | 37.9 | | Upfront reserves | 26,924,496 | | 6.6 |
| | | | | Closing costs | 5,500,372 | | 1.4 |
Total Sources | $405,174,868 | | 100.0% | | Total Uses | $405,174,868 | | 100.0% |
(1) | The 545 Washington Boulevard Mortgage Loan (as defined below) is a part of the 545 Washington Boulevard Whole Loan (as defined below) with an original aggregate principal balance of $251,606,250. The Cut-off Date Balance Per SF, Maturity Date Balance Per SF, U/W DSCR based on NOI/NCF, U/W Debt Yield based on NOI/NCF, U/W Debt Yield at Maturity based on NOI/NCF, Cut-off Date LTV Ratio and LTV Ratio at Maturity numbers presented above are based on the 545 Washington Boulevard Whole Loan. The 545 Washington Boulevard Whole Loan was co-originated by Morgan Stanley Bank, N.A. (“MSBNA”), an affiliate of Morgan Stanley Mortgage Capital Holdings LLC, and Barclays Capital Real Estate Inc. (“Barclays”) on January 6, 2020. |
(2) | See “The Borrowers and Borrower Sponsors” below for further discussion. |
(3) | Defeasance of the 545 Washington Boulevard Whole Loan is permitted at any time after the earlier of (i) August 5, 2023, or (ii) two years from the closing date of the securitization that includes the last pari passu note of the 545 Washington Boulevard Whole Loan to be securitized. The assumed lockout period of 24 payments is based on the closing date of this transaction in February 2020. |
(4) | See “Escrows” below for further discussion of reserve requirements. |
The Mortgage Loan. The mortgage loan (the “545 Washington Boulevard Mortgage Loan”) is part of a whole loan (the “545 Washington Boulevard Whole Loan”) evidenced by four pari passu promissory notes in the aggregate original principal amount of $251,606,250. The 545 Washington Boulevard Whole Loan is secured by a first priority fee and leasehold mortgage on an 866,706 square feet office tower located in Jersey City, New Jersey (the “545 Washington Boulevard Property”). The 545 Washington Boulevard Whole Loan was co-originated by MSBNA and Barclays. The 545 Washington Boulevard Mortgage Loan is evidenced by the controlling
THE INFORMATION IN THIS STRUCTURAL AND COLLATERAL TERM SHEET IS NOT COMPLETE AND MAY BE AMENDED PRIOR TO THE TIME OF SALE. THIS TERM SHEET IS NOT AN OFFER TO SELL THESE SECURITIES AND IT IS NOT A SOLICITATION OF AN OFFER TO BUY THESE SECURITIES IN ANY JURISDICTION WHERE THE OFFER OR SALE IS NOT PERMITTED.
77
Office – CBD | Loan #4 | Cut-off Date Balance: | | $81,285,000 |
545 Washington Boulevard | 545 Washington Boulevard | Cut-off Date LTV: | | 61.4% |
Jersey City, NJ 07310 | | U/W NCF DSCR: | | 2.50x |
| | U/W NOI Debt Yield: | | 8.8% |
promissory Note A-1 in the original principal amount of $81,285,000. The non-controlling promissory Notes A-2, A-3 and A-4 are in the aggregate original principal amount of $170,321,250. Notes A-2 and A-3 are currently held by MSBNA and are expected to be contributed to future securitization trusts or may be otherwise transferred at any time. Note A-4 is currently held by Barclays and is expected to be contributed to future securitization trusts or may be otherwise transferred at any time. The 545 Washington Boulevard Whole Loan will be serviced pursuant to the pooling and servicing agreement for the BANK 2020-BNK25 securitization trust. See “Description of the Mortgage Pool—The Whole Loans—The Serviced Pari Passu Whole Loans” and “Pooling and Servicing Agreement” in the Preliminary Prospectus.
Note Summary
Notes | Original Principal Balance | Cut-off Date Balance | Note Holder | Controlling Interest |
A-1 | $81,285,000 | $81,285,000 | BANK 2020-BNK25 | Yes |
A-2 | $60,000,000 | $60,000,000 | MSBNA | No |
A-3 | $60,000,000 | $60,000,000 | MSBNA | No |
A-4 | $50,321,250 | $50,321,250 | Barclays | No |
Total | $251,606,250 | $251,606,250 | | |
The Borrowers and Borrower Sponsors. The borrower for the 545 Washington Boulevard Whole Loan is comprised of eighteen tenant-in-common co-borrowers which collectively own both fee and leasehold interests in the 545 Washington Boulevard Property, with (a) one such borrower owning approximately 75% of the fee interests, another owning approximately 12% of the fee interests and no other borrower owning more than approximately 5% of the fee interests (collectively, the “Fee Borrowers”), and (b) one such borrower owning approximately 75% of the leasehold interests, another owning approximately 12% of the leasehold interests, and no other borrower owning more than approximately 5% of the leasehold interests (collectively, the “Leasehold Borrowers”, and together with the Fee Borrowers, the “545 Washington Boulevard Borrowers”), each either a single purpose Delaware limited liability company or limited partnership, each with one independent director in its organizational structure. Legal counsel to the 545 Washington Boulevard Borrowers delivered a non-consolidation opinion in connection with the origination of the 545 Washington Boulevard Whole Loan. The borrower sponsors are HGI Opportunity Fund XIII, LP and HGGP Capital XIV, LP, each of which is controlled by principals of Harbor Group International (“HGI”), a global real estate investment and management firm. HGI invests in and manages diversified property portfolios including office, retail, and multifamily properties. Currently, HGI owns and manages 33,000 multifamily units, and 3.6 million square feet of commercial real estate. HGI has over 34 years of experience in the industry and over 750 employees worldwide. The non-recourse carveout guarantors are HGGP Capital VIII, LLC, HGGP Capital IX, LLC, HGGP Capital X, LLC, HGGP Capital XI, LLC, HGGP Capital XII, LLC, HGGP Capital XIII, LLC, each a Virginia limited liability company, and HGGP Capital XIV, LP, a Delaware limited partnership. The non-recourse carveout guarantors are affiliates of the borrower sponsors. An affiliate of the 545 Washington Boulevard Borrowers was subject to previous asset defaults. See “Description of the Mortgage Pool – Loan Purpose; Default History, Bankruptcy Issues and Other Proceedings” in the Preliminary Prospectus.
The Property. The 545 Washington Boulevard Property consists of a 22-story office building, totaling 866,706 square feet, on an approximately 2.7-acre site in Jersey City, New Jersey. Of the total 866,706 square foot rentable area, 11,285 square feet is ground floor retail space leased to Santander Bank, N.A., Eathen Grill Inc., Dorrian's, Cosi and Tobmar International Inc. The 545 Washington Boulevard Property was originally built in 2001. The 545 Washington Boulevard Property was 95.5% leased as of August 1, 2019 to 9 tenants. The two largest tenants, Insurance Services Office, Inc. (“ISO”) (40.7% of net rentable area) and JP Morgan Chase Bank (39.7% of net rentable area) comprise 80.4% of net rentable area and 82.8% of base rent and have leases extending through 2032 or beyond.
The 545 Washington Boulevard Property has a surface parking lot at the rear of the property that can accommodate up to 15 cars and is reserved for ISO executive parking. There is an irrevocable, perpetual parking easement in place pursuant to which the 545 Washington Boulevard Borrowers and all future owners of the improvements have the right to use 739 parking spaces in the parking garage located at 561 Washington Boulevard (the “North Garage”). Pursuant to a partnership (the “Garage Partnership”) between, among other parties, the owner of the North Garage and 545 Washington Parking Garage, LP, an affiliate of the 545 Washington Boulevard Borrowers (the “Garage Affiliate”), certain additional income generated from transient parking operations at the North Garage is additional collateral for the 545 Washington Boulevard Whole Loan. The Garage Affiliate’s 26.7752% interest in the Garage Partnership has been pledged as collateral for the 545 Washington Boulevard Whole Loan. Income from the parking garage represents only 5.5% of underwritten effective gross income. JPMorgan Chase Bank is entitled to use 343 spaces at the North Garage pursuant to its lease, ISO is entitled to use at least 343 spaces at the North Garage pursuant to its lease, and various other tenants are also entitled to use spaces at the North Garage, in each case, subject to the terms of each respective lease, for a total of 765 parking spaces at the North Garage; i.e. an overage of 26 spaces. There is an additional parking easement in place pursuant to which the 545 Washington Boulevard Borrowers and all future owners of the improvements have the right, for a period of 25 years from the origination date, to park up to 128 cars, on a non-exclusive basis, in an adjacent garage at 90 Town Square Place.
Major Tenants.
ISO (352,765 square feet, 40.7% of net rentable area, 42.0% of underwritten base rent, 12/31/2033 lease expiration). ISO has been a tenant at the 545 Washington Boulevard Property since 1999 and extended its lease in 2014. ISO has a lease expiration of December 31, 2033 with two five-year renewal options remaining. ISO is a subsidiary of Verisk Analytics. Verisk Analytics provides data analytics solutions in the United States and internationally, offering predictive analytics and decision support solutions to customers in rating,
THE INFORMATION IN THIS STRUCTURAL AND COLLATERAL TERM SHEET IS NOT COMPLETE AND MAY BE AMENDED PRIOR TO THE TIME OF SALE. THIS TERM SHEET IS NOT AN OFFER TO SELL THESE SECURITIES AND IT IS NOT A SOLICITATION OF AN OFFER TO BUY THESE SECURITIES IN ANY JURISDICTION WHERE THE OFFER OR SALE IS NOT PERMITTED.
78
Office – CBD | Loan #4 | Cut-off Date Balance: | | $81,285,000 |
545 Washington Boulevard | 545 Washington Boulevard | Cut-off Date LTV: | | 61.4% |
Jersey City, NJ 07310 | | U/W NCF DSCR: | | 2.50x |
| | U/W NOI Debt Yield: | | 8.8% |
underwriting, claims, catastrophe and weather risk, natural resources intelligence, economic forecasting, and various other fields. ISO serves insurers, reinsurers, agents and brokers, insurance regulators, risk managers, and other participants in the property and casualty insurance marketplace. ISO has the option to lease: (i) an entire floor containing 38,736 rentable square feet and located between the 3rd and 11th floors by notice at least 18 months in advance of the 10th anniversary of the rent commencement date, (ii) one additional floor containing 38,736 rentable square feet and located between the 3rd and 11th floors by notice at least 13 months in advance of the 15th anniversary of the rent commencement date and (iii) one additional floor containing 38,736 rentable square feet and located between the 3rd and 11th floors by notice at least 13 months in advance of the 20th anniversary of the rent commencement date. Provided that ISO waives its option on the third option space, ISO has the option to terminate the lease as to a full floor of the building, which must be either the top or the bottom floor, exercisable at least 15 months before the second giveback date (a date specified by ISO between January 2, 2025 and December 31, 2025). In the event that ISO exercises its option to terminate a floor, it is required to make a payment equal to the unamortized portion of the leasing commissions, free rent, landlord’s second contribution ($14,110,600), test-fit allowance ($52,915) and bathroom allowance ($80,000) allocable to the giveback space.
JPMorgan Chase Bank (343,805 square feet, 39.7% of net rentable area, 40.9% of underwritten base rent, 10/31/2032 lease expiration). JPMorgan Chase Bank has been a tenant at the 545 Washington Boulevard Property since 2016 and has a lease expiration of October 31, 2032 with two, 5-year renewal options remaining. At loan closing, $21,201,910 was reserved for 27 months of free rent for JPMorgan Chase Bank, beginning on and including the monthly payment date occurring in November 2021 at a rate of (i) $916,813 for the period from and including November 2021 through and including July 2022, (ii) $876,828 for August 2022 and (iii) $710,221 for the period from and including September 2022 through and including January 2024. JP Morgan Chase & Co. operates as a financial services company worldwide. It operates through four segments: Consumer & Community Banking (CCB), Corporate & Investment Bank (CIB), Commercial Banking (CB), and Asset & Wealth Management (AWM). The company also provides ATMs, digital covering online and mobile, and telephone banking services. JP Morgan Chase & Co. was founded in 1799 and is headquartered in New York, New York.
HSBC Technology & Services (USA) (77,472 square feet, 8.9% of net rentable area, 11.2% of underwritten base rent, 2/28/2021 lease expiration). HSBC Technology & Services (USA) (“HSBC”) has been a tenant at the 545 Washington Boulevard Property since 2009 and has a lease expiration of February 28, 2021 with one 5-year renewal option remaining. HSBC serves small enterprises, government, and corporate and institutional clients, as well as high net worth individuals and families. The company was founded in 1865 and is headquartered in London with 30,437 employees.
The following table presents certain information relating to the tenancy at the 545 Washington Boulevard Property:
Major Tenants(1)
Tenant Name | Credit Rating
(Fitch/Moody’s/
S&P)(2) | Tenant
NRSF | % of
NRSF | Annual
U/W
Base
Rent PSF | Annual
U/W Base
Rent | % of Total
Annual
U/W Base
Rent | Lease
Expiration
Date | Extension
Options | Term.
Option
(Y/N) |
Major Tenant
| | | | | | | | |
ISO(3) | BBB+/Baa2/BBB | 352,765 | 40.7% | $32.00 | $11,288,480 | 42.0% | 12/31/2033 | 2, 5-year | Y |
JPMorgan Chase Bank(4) | AA-/A2/A- | 343,805 | 39.7% | $32.00 | $11,001,760 | 40.9% | 10/31/2032 | 2, 5-year | N |
HSBC | A+/A2/A | 77,472 | 8.9% | $39.00 | $3,021,408 | 11.2% | 2/28/2021 | 1, 5-year | N |
Total Major Tenants | 774,042 | 89.3% | $32.70 | $25,311,648 | 94.1% | | | |
| | | | | | | | | |
Non-major Tenants | 53,928 | 6.2% | $29.57 | $1,594,829 | 5.9% | | | |
| | | | | | | | |
Occupied Collateral Total | 827,970 | 95.5% | $32.50 | $26,906,477 | 100.0% | | | |
| | | | | | | | |
Vacant Space | 38,736 | 4.5% | | | | | | |
| | | | | | | | |
Collateral Total | 866,706 | 100.0% | | | | | | |
| | | | | | | | | |
(1) | Information is based on the underwritten rent roll. |
(2) | Certain ratings are those of the parent company whether or not the parent guarantees the lease. |
(3) | ISO has the option to lease: (i) an entire floor containing 38,736 rentable square feet and located between the 3rd and 11th floors by notice at least 18 months in advance of the 10th anniversary of the rent commencement date, (ii) one additional floor containing 38,736 rentable square feet and located between the 3rd and 11th floors by notice at least 13 months in advance of the 15th anniversary of the rent commencement date and (iii) one additional floor containing 38,736 rentable square feet and located between the 3rd and 11th floors by notice at least 13 months in advance of the 20th anniversary of the rent commencement date. Provided that ISO waives its option on the third option space, ISO has the option to terminate the lease as to a full floor of the building, which must be either the top or the bottom floor, exercisable at least 15 months before the second giveback date (a date specified by Verisk Analytics between January 2, 2025 and December 31, 2025). ISO is required to make a payment equal to the unamortized portion of the leasing commissions, free rent, landlord’s second contribution ($14,110,600), test-fit allowance ($52,915) and bathroom allowance ($80,000) allocable to the giveback space. |
(4) | At loan closing, $21,201,910 was reserved for 27 months of free rent for JPMorgan Chase Bank, beginning on and including the monthly payment date occurring in November 2021 at a rate of (i) $916,813 for the period from and including November 2021 through and including July 2022, (ii) $876,828 for August 2022 and (iii) $710,221 for the period from and including September 2022 through and including January 2024. |
THE INFORMATION IN THIS STRUCTURAL AND COLLATERAL TERM SHEET IS NOT COMPLETE AND MAY BE AMENDED PRIOR TO THE TIME OF SALE. THIS TERM SHEET IS NOT AN OFFER TO SELL THESE SECURITIES AND IT IS NOT A SOLICITATION OF AN OFFER TO BUY THESE SECURITIES IN ANY JURISDICTION WHERE THE OFFER OR SALE IS NOT PERMITTED.
79
Office – CBD | Loan #4 | Cut-off Date Balance: | | $81,285,000 |
545 Washington Boulevard | 545 Washington Boulevard | Cut-off Date LTV: | | 61.4% |
Jersey City, NJ 07310 | | U/W NCF DSCR: | | 2.50x |
| | U/W NOI Debt Yield: | | 8.8% |
The following table presents certain information relating to the lease rollover schedule at the 545 Washington Boulevard Property:
Lease Expiration Schedule(1)(2)
Year Ending
December 31, | No. of
Leases
Expiring | Expiring
NRSF | % of
Total
NRSF | Cumulative
Expiring
NRSF | Cumulative
% of Total
NRSF | Annual
U/W
Base Rent | % of Total
Annual
U/W Base
Rent | Annual
U/W
Base Rent
PSF(3) |
MTM | 0 | 0 | 0.0% | 0 | 0.0% | $0 | 0.0% | $0.00 |
2020 | 0 | 0 | 0.0% | 0 | 0.0% | $0 | 0.0% | $0.00 |
2021 | 2 | 77,897 | 9.0% | 77,897 | 9.0% | $3,053,542 | 11.3% | $39.20 |
2022 | 1 | 595 | 0.1% | 78,492 | 9.1% | $35,700 | 0.1% | $60.00 |
2023 | 0 | 0 | 0.0% | 78,492 | 9.1% | $0 | 0.0% | $0.00 |
2024 | 0 | 0 | 0.0% | 78,492 | 9.1% | $0 | 0.0% | $0.00 |
2025 | 1 | 42,643 | 4.9% | 121,135 | 14.0% | $1,066,075 | 4.0% | $25.00 |
2026 | 0 | 0 | 0.0% | 121,135 | 14.0% | $0 | 0.0% | $0.00 |
2027 | 2 | 5,505 | 0.6% | 126,640 | 14.6% | $266,046 | 1.0% | $48.33 |
2028 | 0 | 0 | 0.0% | 126,640 | 14.6% | $0 | 0.0% | $0.00 |
2029 | 0 | 0 | 0.0% | 126,640 | 14.6% | $0 | 0.0% | $0.00 |
| 2030 | 0 | 0 | 0.0% | 126,640 | 14.6% | $0 | 0.0% | $0.00 |
Thereafter | 3 | 701,330 | 80.9% | 827,970 | 95.5% | $22,485,114 | 83.6% | $32.06 |
Vacant | 0 | 38,736 | 4.5% | 866,706 | 100.0% | $0 | 0.0% | $0.00 |
Total/Weighted Average | 9 | 866,706 | 100.0% | | | $26,906,477 | 100.0% | $32.50 |
(1) | Information obtained from the underwritten rent roll. |
(2) | Certain tenants may have lease termination options that are exercisable prior to the originally stated expiration date of the subject lease or leases and that are not considered in the Lease Expiration Schedule. |
(3) | Total/Weighted Average Annual U/W Base Rent PSF excludes Vacant space. |
Historical Occupancy
12/31/2012(1) | | 12/31/2013(1) | | 12/31/2014(1) | | 12/31/2015(1) | | 12/31/2016(1) | | 12/31/2017(1) | | 12/31/2018(1) | | 8/1/2019(2) | |
| | | | | | | | | | | | | | | | |
95.0% | | 99.6% | | 99.6% | | 81.6% | | 100.0% | | 95.5% | | 95.5% | | 95.5% | |
(1) | Information obtained from the borrower sponsor. |
(2) | Information obtained from the underwritten rent roll. |
THE INFORMATION IN THIS STRUCTURAL AND COLLATERAL TERM SHEET IS NOT COMPLETE AND MAY BE AMENDED PRIOR TO THE TIME OF SALE. THIS TERM SHEET IS NOT AN OFFER TO SELL THESE SECURITIES AND IT IS NOT A SOLICITATION OF AN OFFER TO BUY THESE SECURITIES IN ANY JURISDICTION WHERE THE OFFER OR SALE IS NOT PERMITTED.
80
Office – CBD | Loan #4 | Cut-off Date Balance: | | $81,285,000 |
545 Washington Boulevard | 545 Washington Boulevard | Cut-off Date LTV: | | 61.4% |
Jersey City, NJ 07310 | | U/W NCF DSCR: | | 2.50x |
| | U/W NOI Debt Yield: | | 8.8% |
Operating History and Underwritten Net Cash Flow. The following table presents certain information relating to the operating history and underwritten net cash flow at the 545 Washington Boulevard Property:
Cash Flow Analysis
| | 2017 | | 2018 | | TTM 11/30/2019 | | U/W | | %(1) | | U/W $ per SF | |
Base Rent | | $25,997,762 | | $25,521,204 | | $26,044,146 | | $26,906,477 | | 77.9% | | $31.04 | |
Rent Steps | | 0 | | 0 | | 0 | | 128,894 | | 0.4 | | 0.15 | |
IG Rent Steps | | 0 | | 0 | | 0 | | 1,191,882 | | 3.4 | | 1.38 | |
Gross Potential Rent(2) | | $25,997,762 | | $25,521,204 | | $ 26,044,146 | | $ 28,227,253 | | 81.7% | | $32.57 | |
Other Income(3) | | 5,818,330 | | 8,294,434 | | 5,571,786 | | 3,854,453 | | 11.2 | | 4.45 | |
Total Recoveries | | 3,207,532 | | 2,532,145 | | 2,502,662 | | 2,467,803 | | 7.1 | | 2.85 | |
Net Rental Income | | $35,023,625 | | $36,347,783 | | $34,118,594 | | $34,549,509 | | 100.0% | | 39.86 | |
(Vacancy & Credit Loss)(4) | | 0 | | 0 | | 0 | | 0 | | 0.0 | | 0.00 | |
Effective Gross Income | | $35,023,625 | | $36,347,783 | | $34,118,594 | | $34,549,509 | | 100.0% | | $39.86 | |
| | | | | | | | | | | | | |
Real Estate Taxes | | 3,674,396 | | 3,359,991 | | 3,202,185 | | 3,096,752 | | 9.0 | | 3.57 | |
Insurance | | 623,840 | | 617,352 | | 685,946 | | 666,023 | | 1.9 | | 0.77 | |
Management Fee | | 1,257,298 | | 1,036,722 | | 1,134,707 | | 1,000,000 | | 2.9 | | 1.15 | |
Other Operating Expenses | | 9,640,219 | | 9,507,860 | | 8,683,915 | | 7,521,339 | | 21.8 | | 8.68 | |
Total Operating Expenses(5) | | $15,195,753 | | $14,521,925 | | $13,706,753 | | $12,284,114 | | 35.6% | | $14.17 | |
| | | | | | | | | | | | | |
Net Operating Income | | $19,827,872 | | $21,825,858 | | $20,411,841 | | $22,265,395 | | 64.4% | | $25.69 | |
Replacement Reserves | | 0 | | 0 | | 0 | | 173,341 | | 0.5 | | 0.20 | |
TI/LC | | 0 | | 0 | | 0 | | 408,579 | | 1.2 | | 0.47 | |
Net Cash Flow | | $19,827,872 | | $21,825,858 | | $20,411,841 | | $ 21,683,475 | | 62.8% | | $25.02 | |
| | | | | | | | | | | | | |
NOI DSCR(6) | | 2.28x | | 2.51x | | 2.35x | | 2.56x | | | | | |
NCF DSCR(6) | | 2.28x | | 2.51x | | 2.35x | | 2.50x | | | | | |
NOI Debt Yield(6) | | 7.9% | | 8.7% | | 8.1% | | 8.8% | | | | | |
NCF Debt Yield(6) | | 7.9% | | 8.7% | | 8.1% | | 8.6% | | | | | |
| (1) | Represents (i) percent of Net Rental Income for all revenue fields, (ii) percent of Gross Potential Rent for Vacancy & Credit Loss and (iii) percent of Effective Gross Income for all other fields. |
| (2) | U/W Gross Potential Rent includes rent steps of $128,894 through December 31, 2020 and IG Rent Steps of $1,191,882 which represents the average rent payable during the loan term for the investment grade tenants, which include JPMorgan Chase Bank, ISO, Santander Bank and VF Sportswear. |
| (3) | Other Income is comprised of commercial revenue, sundry income, parking and telecom. |
| (4) | The underwritten economic vacancy is 0.0%. The 545 Washington Boulevard Property is 95.5% occupied as of August 1, 2019. |
| (5) | The decrease from 11/30/2019 TTM to U/W Total Operating Expenses is due to the ground lease expenses being excluded from the U/W as the 545 Washington Boulevard Borrowers are pledging both fee and leasehold interest as collateral, both of which are owned by the 545 Washington Boulevard Borrowers. |
| (6) | The debt service coverage ratios and debt yields shown are based on the 545 Washington Boulevard Whole Loan. |
Appraisal. The appraiser concluded to an “as is” appraised value of $410,000,000 with a valuation date of October 16, 2019.
Environmental Matters. According to a Phase I environmental site assessment dated August 15, 2019, a controlled recognized environmental condition exists stemming from the 545 Washington Boulevard Property’s location within a district historically occupied by a large industrial rail yard, the operations of which resulted in soil and groundwater contamination in and around the Mortgaged Property. See “Description of the Mortgage Pool – Environmental Considerations” in the Preliminary Prospectus.
Market Overview and Competition. The 545 Washington Boulevard Property is located within Jersey City, New Jersey. The 545 Washington Boulevard Property is located along the Hudson River waterfront in Jersey City, which is at the southeastern section of Hudson County. Jersey City is the largest city in Hudson County and the second largest in the state, containing approximately 19.2-square miles. The major influence for this immediate area is its accessibility to the highway system, as well as its proximity to New York City, Jersey City waterfront, and access to public transportation. Primary access to the 545 Washington Boulevard Property is provided by the ferry, bus, PATH and light rail, as well as via major highways. The area is within a maximum 20-minute commute (depending on mode of transportation) from Manhattan, and within a maximum 5 to 15 minutes of New Jersey’s main employment centers of Jersey City and Newark. Primary employers/employment centers consist of numerous office tenants who include a broad spectrum of financial service and service-oriented firms such as Goldman Sachs, First Chicago and Donaldson, Lufkin & Jenrette. Local businesses, Newark International Airport, and the ports of Newark and Elizabeth are also major employers offering opportunities in the general area. Major retail employers include 1.16 million square foot Newport Centre and 300,000-square foot Hudson Mall. According to the appraisal, as of the second quarter of 2019, the Northern New Jersey market had an inventory of approximately 105.5 million square feet, overall vacancy in the market of approximately 21.3% and direct asking rent of $30.02. The estimated 2018 population within a 0.5-, one- and three- mile radius is 27,478, 84,973 and 745,146, respectively. According to the appraisal, the estimated 2018 median household income within a 0.5-, one- and three- mile radius is $152,575, $129,094 and $96,836, respectively.
THE INFORMATION IN THIS STRUCTURAL AND COLLATERAL TERM SHEET IS NOT COMPLETE AND MAY BE AMENDED PRIOR TO THE TIME OF SALE. THIS TERM SHEET IS NOT AN OFFER TO SELL THESE SECURITIES AND IT IS NOT A SOLICITATION OF AN OFFER TO BUY THESE SECURITIES IN ANY JURISDICTION WHERE THE OFFER OR SALE IS NOT PERMITTED.
81
Office – CBD | Loan #4 | Cut-off Date Balance: | | $81,285,000 |
545 Washington Boulevard | 545 Washington Boulevard | Cut-off Date LTV: | | 61.4% |
Jersey City, NJ 07310 | | U/W NCF DSCR: | | 2.50x |
| | U/W NOI Debt Yield: | | 8.8% |
Submarket Information – According to the appraisal, as of the second quarter of 2019, the Hudson Waterfront submarket had an inventory of approximately 17.8 million square feet, overall vacancy in the submarket of approximately 13.1% and direct asking rent of $45.45 per square foot.
The following table presents certain information relating to the appraiser’s market rent conclusion for the 545 Washington Boulevard Property:
Market Rent Summary(1)
| Market Rent (PSF) | Lease Term (MOS.) | Lease Type (Reimbursements) | Rent Increase Projection |
Office | $40.00 | 120 | Gross + Tenant Electric
(“Gross + TE”) | 2.5% per annum |
Retail | $50.00 | 120 | Pro rata of RE Taxes | 2.5% per annum |
| (1) | Information obtained from the appraisal. |
The table below presents certain information relating to comparable sales for the 545 Washington Boulevard Property identified by the appraisal:
Comparable Sales(1)
Property Name/Location | Sale Date | Total NRA (SF) | Total Occupancy | Sale Price | Sale Price PSF |
545 Washington Boulevard Jersey City, NJ | Sept-2019 | 866,706 | 95.5% | $372,750,000 | $430.08 |
Newport Office Center VI Jersey City, NJ | Mar-2019 | 395,050 | 99.0% | $170,000,000 | $430.33 |
One Newark Center Newark, NJ | Nov-2017 | 423,028 | 91.0% | $93,900,000 | $221.97 |
Landmark III Secaucus, NJ | Jul-2017 | 445,060 | 99.0% | $115,000,000 | $258.39 |
Two Riverfront Center Newark, NJ | Dec-2016 | 337,543 | 100.0% | $165,000,000 | $488.83 |
Waterfront Corporate Center I Hoboken, NJ | Jun-2016 | 521,215 | 100.0% | $235,000,000 | $450.87 |
(1) | Information obtained from the appraisal. |
The following table presents certain information relating to eight comparable leases to those at the 545 Washington Boulevard Property:
Comparable Leases(1)
Property Name/Address | Year Built | Total GLA (SF) | Tenant Name | Lease Size (SF) | Lease Date |
Initial Rent/SF
| Reimbursements |
70 Hudson Street 70 Hudson Street Jersey City, NJ | 2001 | 431,438 | Gucci Federal Home Loan Fidessa Corporation | 51,824 51,824 78,000 | Mar. 2019 Jan. 2018 Mar. 2017 | $46.00 $43.00 $41.00 | Gross + TE Gross + TE Gross + TE |
200 Hudson Street 200 Hudson Street Jersey City, NJ | 1930 | 900,000 | E* Trade | 132,000 | Dec. 2018 | $40.00 | Gross + TE |
Newport Tower 525 Washington Boulevard Jersey City, NJ | 1990 | 1,091,469 | Pearl Capital Partners | 13,250 | July 2018 | $38.50 | Gross + TE |
Exchange Place 10 Exchange Place Jersey City, NJ | 1988 | 731,445 | NYSA ILA Pension Trust Appleagle, Inc. | 17,840 12,960 | Nov. 2017 Mar. 2017 | $39.50 $39.00 | Gross + TE Gross + TE |
(1) | Information obtained from the appraisal. |
Escrows.
Real Estate Taxes – The 545 Washington Boulevard Whole Loan documents provide for an upfront reserve of approximately $881,651 for real estate taxes and ongoing monthly reserves for real estate taxes in an amount equal to 1/12 of the annual real estate taxes that the lender estimates will be payable during the next twelve months (however, such monthly deposits are waived if (a) no Cash Sweep Event Period (as defined below) has occurred and is continuing and (b) the 545 Washington Boulevard Borrowers provide to the lender reasonably acceptable evidence that all taxes then due and payable have been paid in full on or prior to their due date (which evidence must be provided within 30 days after their due date)).
THE INFORMATION IN THIS STRUCTURAL AND COLLATERAL TERM SHEET IS NOT COMPLETE AND MAY BE AMENDED PRIOR TO THE TIME OF SALE. THIS TERM SHEET IS NOT AN OFFER TO SELL THESE SECURITIES AND IT IS NOT A SOLICITATION OF AN OFFER TO BUY THESE SECURITIES IN ANY JURISDICTION WHERE THE OFFER OR SALE IS NOT PERMITTED.
82
Office – CBD | Loan #4 | Cut-off Date Balance: | | $81,285,000 |
545 Washington Boulevard | 545 Washington Boulevard | Cut-off Date LTV: | | 61.4% |
Jersey City, NJ 07310 | | U/W NCF DSCR: | | 2.50x |
| | U/W NOI Debt Yield: | | 8.8% |
Insurance – The 545 Washington Boulevard Whole Loan documents provide for monthly deposits to an insurance reserve in an amount equal to 1/12 of the annual estimated insurance premiums. However, such monthly deposits are waived if either (a) (i) the 545 Washington Boulevard Borrowers maintain a blanket or umbrella policy approved by the lender in its reasonable discretion and (ii) the 545 Washington Boulevard Borrowers provide the lender with evidence of renewal of such policies at least 10 days prior to the expiration dates of the policies and provide paid receipts for the payment of the insurance premiums by no later than 30 days after such insurance premiums are due and payable or (b) (i) no Cash Sweep Event Period has occurred and is continuing and (ii) the 545 Washington Boulevard Borrowers provide to the lender reasonably acceptable evidence that all insurance premiums then due and payable have been paid in full on or prior to their due date (which evidence must be provided within 30 days after the date such insurance premiums are due and payable).
Replacement Reserve – The 545 Washington Boulevard Whole Loan documents provide for monthly deposits to a capital expenditure reserve of approximately $10,834.
TI/LC Reserve – The 545 Washington Boulevard Whole Loan documents provide for monthly deposits to a rollover reserve of approximately $72,226 for tenant improvements and leasing commissions, provided that the 545 Washington Boulevard Borrowers are not required to make such monthly deposits as long as the funds on deposit in the rollover reserve are equal to or greater than $1,500,000.
Outstanding TI/LC Reserve – The 545 Washington Boulevard Whole Loan documents provide for an upfront reserve of approximately $4,840,935 for outstanding unfunded tenant improvements and/or leasing commissions, including $3,030,603 for ISO and $1,810,332 for JPMorgan Chase Bank.
Rent Concession Reserve – The 545 Washington Boulevard Whole Loan documents provide for an upfront reserve of approximately $21,201,910 for free rent under the JPMorgan Chase Bank lease.
Major Tenant Rollover Reserve – The 545 Washington Boulevard Whole Loan documents provide for springing monthly deposits of approximately $144,451 following the occurrence of a Major Tenant Rollover Reserve Trigger (as defined below). “Major Tenant Rollover Reserve Trigger” means the earlier to occur of the following: (i) JPMorgan Chase Bank failing to satisfy the Credit Rating Condition (as defined below), (ii) Verisk Analytics failing to satisfy the Credit Rating Condition or (iii) ISO failing to be a wholly-owned subsidiary of Verisk Analytics or a successor parent to ISO which satisfies the Credit Rating Condition and wholly owns ISO. “Credit Rating Condition” means, as to any entity, a condition which is satisfied to the extent that, as of the applicable determination, such entity maintains a long-term unsecured debt rating of at least “BBB-” from S&P and an equivalent rating from each of the other rating agencies which rate such entity.
Lockbox and Cash Management. The 545 Washington Boulevard Whole Loan is structured with a springing lockbox and springing cash management. Upon the first occurrence of a Cash Sweep Event Period, the 545 Washington Boulevard Borrowers are required to direct tenants to deposit all rents directly into the lockbox account. If, notwithstanding such direction, any of the 545 Washington Boulevard Borrowers or property manager receive any rents, it is required to deposit such rents into the lockbox account within two business days of receipt. Upon the first occurrence of a Cash Sweep Event Period, the lender is required to establish, and the 545 Washington Boulevard Borrowers are required to cooperate with a cash management bank designated by the lender to establish, a lender-controlled cash management account, into which all funds in the lockbox account will be required to be deposited periodically so long as a Cash Sweep Event Period is continuing. So long as a Cash Sweep Event Period is continuing, and provided no event of default is continuing, funds in the cash management account are required to be applied (i) to make deposits into the tax and insurance escrows (if any are then required), as described above under “Escrows”, (ii) to pay debt service on the 545 Washington Boulevard Whole Loan, (iii) to make deposits into the replacement, TI/LC and major tenant rollover reserve (if any are then required), as described above under “Escrows”, (iv) to pay operating expenses set forth in the annual budget (which is required to be approved by the lender during the continuance of a Cash Sweep Event Period) and extraordinary operating or capital expenses approved by the lender, (v) if Mezzanine Debt (as defined below) is then outstanding, to pay Mezzanine Debt debt service, and (vi) to pay any remainder into an excess cash flow account to be held by the lender as additional security for the 545 Washington Boulevard Whole Loan during the continuance of the Cash Sweep Event Period (from which operating expenses may be disbursed, if permitted by the lender in its sole discretion). If no Cash Sweep Event Period is continuing, all funds in the lockbox account are required to be disbursed to an account designated by the 545 Washington Boulevard Borrowers.
A “Cash Sweep Event Period” means a period:
| (a) | commencing upon an event of default under the 545 Washington Boulevard Whole Loan and ending upon the cure (if applicable) of the event of default; or |
| (b) | commencing upon the debt service coverage ratio (assuming a 30 year amortization schedule) falling below 1.20x for two consecutive calendar quarters (a “DSCR Event”) and ending upon the debt service coverage ratio (assuming a 30 year amortization schedule) being at least 1.25x for the immediately preceding two consecutive calendar quarters (a “DSCR Cure”); or |
| (c) | commencing upon a bankruptcy or similar insolvency of a Major Tenant (as defined below) and ending upon receipt by the lender of reasonably acceptable evidence (including without limitation a reasonably acceptable tenant estoppel certificate (an “Acceptable Tenant Estoppel Certificate”) that one of the following has occurred: (i) the Major Tenant is no longer subject to any bankruptcy or insolvency proceedings and has affirmed its lease pursuant to a final non-appealable order of a court of competent jurisdiction and/or is in actual physical occupancy of its space, operating during customary business |
THE INFORMATION IN THIS STRUCTURAL AND COLLATERAL TERM SHEET IS NOT COMPLETE AND MAY BE AMENDED PRIOR TO THE TIME OF SALE. THIS TERM SHEET IS NOT AN OFFER TO SELL THESE SECURITIES AND IT IS NOT A SOLICITATION OF AN OFFER TO BUY THESE SECURITIES IN ANY JURISDICTION WHERE THE OFFER OR SALE IS NOT PERMITTED.
83
Office – CBD | Loan #4 | Cut-off Date Balance: | | $81,285,000 |
545 Washington Boulevard | 545 Washington Boulevard | Cut-off Date LTV: | | 61.4% |
Jersey City, NJ 07310 | | U/W NCF DSCR: | | 2.50x |
| | U/W NOI Debt Yield: | | 8.8% |
hours and paying full rent, or (ii) at least 50% of the Major Tenant’s space has been re-let to one or more replacement tenant(s) pursuant to replacement lease(s), which leases are reasonably acceptable to the lender and which tenants are in occupancy, open for business during customary hours and paying full rent (a “Major Tenant Space Re-Let”); or
| (d) | commencing upon a Major Tenant has, for 50% or more of such Major Tenant’s space, “gone dark”, vacated its space, or not opened for business during customary hours in its space (excluding temporary closures in connection with renovations in accordance with the 545 Washington Boulevard Whole Loan documents not exceeding 12 months or certain permitted transitions in occupancy of administrative employees) and ending upon receipt by the lender of reasonably acceptable evidence (including without limitation an Acceptable Tenant Estoppel Certificate), that either (i) such Major Tenant is in occupancy of, and open for business during customary hours in its space and paying full rent, or (ii) a Major Tenant Space Re-Let has occurred. |
A “Major Tenant” means each of (i) JPMorgan Chase Bank, (ii) ISO and (iii) any other lessee(s) under a lease which (together with any other leases for such tenant or its affiliates) exceeds 135,000 square feet and any guarantors of such leases.
The 545 Washington Boulevard Borrowers may avoid a Cash Sweep Event Period based on a DSCR Event by prepaying a portion of the 545 Washington Boulevard Whole Loan, without payment of any prepayment fee or yield maintenance premium, in an amount sufficient to achieve a DSCR Cure or by depositing with the lender a letter of credit meeting the requirements of the 545 Washington Boulevard Whole Loan documents in an amount that, if applied to reduce the outstanding principal balance of the 545 Washington Boulevard Whole Loan, would cause the debt service coverage ratio to be equal to or greater than required to achieve a DSCR Cure.
Property Management. The 545 Washington Boulevard Property is managed by Harbor Group Management Co., LLC, an affiliate of the 545 Washington Boulevard Borrowers.
Partial Release. Not permitted.
Real Estate Substitution. Not permitted.
Subordinate and Mezzanine Indebtedness. The holder of 100% of the equity interests in the 545 Washington Boulevard Borrowers (the “Mezzanine Borrower”) has a one-time right to obtain (i) a mezzanine loan from a third-party lender secured by a pledge of 100% of such Mezzanine Borrower’s direct or indirect equity interests in the 545 Washington Boulevard Borrowers, or (ii) a preferred equity investment (direct or indirect) in the 545 Washington Boulevard Borrowers (in the case of either (i) or (ii), the “Mezzanine Debt”), provided certain conditions are satisfied, including (a) no event of default is continuing, (b) the aggregate loan-to-value ratio of the 545 Washington Boulevard Whole Loan and the Mezzanine Debt is equal to or less than 61.4% (based on an updated appraisal acceptable to the lender), (c) the aggregate debt service coverage ratio of the 545 Washington Boulevard Whole Loan and the Mezzanine Debt is equal to or greater than 2.32x, (d) the aggregate debt yield of the 545 Washington Boulevard Whole Loan and the Mezzanine Debt is equal to or greater than 8.0%, (e) the lender and the mezzanine lender enter into an intercreditor agreement in form and substance reasonably acceptable to the lender, (f) if the lender requests, the lender has received a rating agency confirmation as to the implementation of the Mezzanine Debt, (g) the Mezzanine Debt is at least co-terminous with the 545 Washington Boulevard Whole Loan and (h) if the Mezzanine Debt has a floating rate, the Mezzanine Borrower must purchase a cap with a strike price such that as of the origination date of the Mezzanine Loan, the debt service coverage ratio is not less than 2.32x.
Ground Lease. The 545 Washington Boulevard Property is comprised of both a fee interest and a leasehold interest under a 99-year ground lease expiring June 30, 2097. The Fee Borrowers own the fee interest, the Leasehold Borrowers own the leasehold interest and both the fee and leasehold interest are collateral for the 545 Washington Boulevard Whole Loan. For purposes of the Preliminary Prospectus, the 545 Washington Boulevard Property has been treated as a fee interest.
Letter of Credit. None. However, a letter of credit may be posted to avoid a Cash Sweep Event Period as described under “Lockbox and Cash Management”.
Right of First Offer/Right of First Refusal. JPMorgan Chase has a right of first refusal to purchase the 545 Washington Boulevard Property pursuant to its lease. Pursuant to a subordination, non-disturbance and attornment agreement entered into at origination, such right does not apply to a foreclosure or deed-in-lieu thereof, but would apply to subsequent transfers.
Terrorism Insurance. The 545 Washington Boulevard Whole Loan documents require that the “all risk” insurance policy required to be maintained by the 545 Washington Boulevard Borrowers provide coverage for terrorism in an amount equal to the full replacement cost of the 545 Washington Boulevard Property. The loan documents also require business income/loss insurance covering no less than the 24-month period commencing at the time of loss, together with a 12 month extended period of indemnity. Notwithstanding the foregoing, for so long as the Terrorism Risk Insurance Act of 2002, as extended and modified by the Terrorism Risk Insurance Program Reauthorization Act of 2015 (“TRIPRA”) is in effect (including any extensions thereof or if another federal governmental program is in effect relating to “acts of terrorism” which provides substantially similar protections as TRIPRA), and covers both domestic and foreign acts of terrorism, the lender is required to accept terrorism insurance which insures against “covered acts” as defined by TRIPRA (or such other program). See “Risk Factors—Risks Relating to the Mortgage Loans—Terrorism Insurance May Not Be Available for All Mortgaged Properties” in the Preliminary Prospectus.
THE INFORMATION IN THIS STRUCTURAL AND COLLATERAL TERM SHEET IS NOT COMPLETE AND MAY BE AMENDED PRIOR TO THE TIME OF SALE. THIS TERM SHEET IS NOT AN OFFER TO SELL THESE SECURITIES AND IT IS NOT A SOLICITATION OF AN OFFER TO BUY THESE SECURITIES IN ANY JURISDICTION WHERE THE OFFER OR SALE IS NOT PERMITTED.
84
(THIS PAGE INTENTIONALLY LEFT BLANK)
THE INFORMATION IN THIS STRUCTURAL AND COLLATERAL TERM SHEET IS NOT COMPLETE AND MAY BE AMENDED PRIOR TO THE TIME OF SALE. THIS TERM SHEET IS NOT AN OFFER TO SELL THESE SECURITIES AND IT IS NOT A SOLICITATION OF AN OFFER TO BUY THESE SECURITIES IN ANY JURISDICTION WHERE THE OFFER OR SALE IS NOT PERMITTED.
85
Multifamily – High Rise | Loan #5 | Cut-off Date Balance: | | $75,000,000 |
28-10 Jackson Avenue, 28-40
Jackson Avenue, and 28-30 | Jackson Park | Cut-off Date LTV: | | 34.4% |
Jackson Avenue | | U/W NCF DSCR: | | 3.92x |
Long Island City, NY 11101 | | U/W NOI Debt Yield: | | 13.0% |

THE INFORMATION IN THIS STRUCTURAL AND COLLATERAL TERM SHEET IS NOT COMPLETE AND MAY BE AMENDED PRIOR TO THE TIME OF SALE. THIS TERM SHEET IS NOT AN OFFER TO SELL THESE SECURITIES AND IT IS NOT A SOLICITATION OF AN OFFER TO BUY THESE SECURITIES IN ANY JURISDICTION WHERE THE OFFER OR SALE IS NOT PERMITTED.
86
Multifamily – High Rise | Loan #5 | Cut-off Date Balance: | | $75,000,000 |
28-10 Jackson Avenue, 28-40
Jackson Avenue, and 28-30 | Jackson Park | Cut-off Date LTV: | | 34.4% |
Jackson Avenue | | U/W NCF DSCR: | | 3.92x |
Long Island City, NY 11101 | | U/W NOI Debt Yield: | | 13.0% |
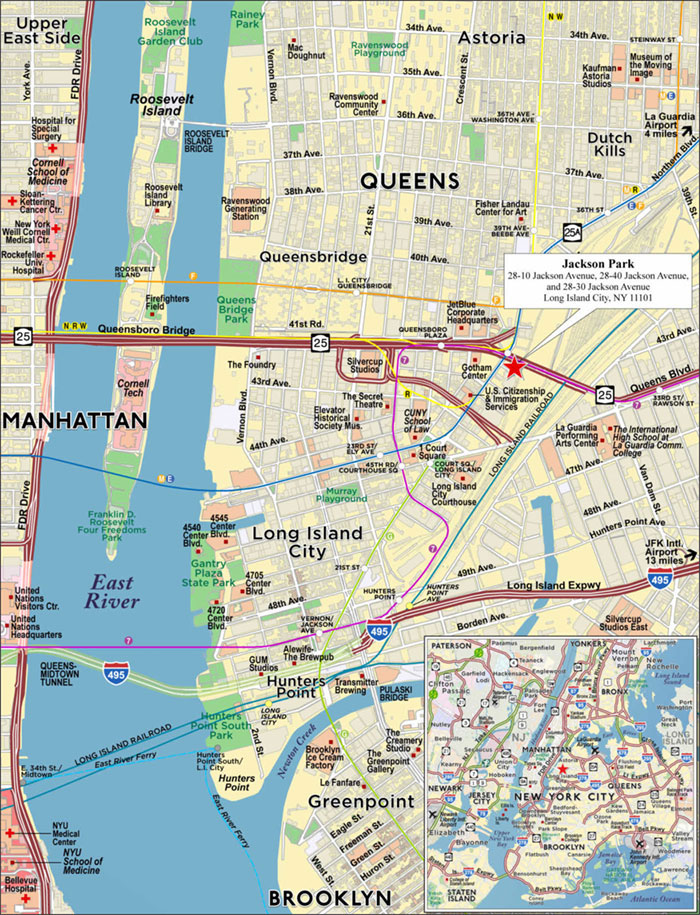
THE INFORMATION IN THIS STRUCTURAL AND COLLATERAL TERM SHEET IS NOT COMPLETE AND MAY BE AMENDED PRIOR TO THE TIME OF SALE. THIS TERM SHEET IS NOT AN OFFER TO SELL THESE SECURITIES AND IT IS NOT A SOLICITATION OF AN OFFER TO BUY THESE SECURITIES IN ANY JURISDICTION WHERE THE OFFER OR SALE IS NOT PERMITTED.
87
Mortgage Loan Information | | Mortgaged Property Information |
Mortgage Loan Seller: | Bank of America, National Association | | Single Asset/Portfolio: | Single Asset |
Credit Assessment (Fitch/KBRA/S&P): | Asf/ AA+(sf)/AA-(sf) | | Property Type – Subtype: | Multifamily – High Rise |
Original Principal Balance(1): | $75,000,000 | | Location: | Long Island City, NY |
Cut-off Date Balance(1): | $75,000,000 | | Size: | 1,871 Units |
% of Initial Pool Balance: | 4.6% | | Cut-off Date Balance Per Unit(1): | $293,960 |
Loan Purpose: | Refinance | | Maturity Date Balance Per Unit(1): | $293,960 |
Borrower Sponsor: | Tishman Speyer Crown Equities 2007, LLC | | Year Built/Renovated: | 2018/NAP |
Guarantor: | LIC Development Owner, L.P. | | Title Vesting: | Fee |
Mortgage Rate: | 3.2500% | | Property Manager: | Self-Managed |
Note Date: | September 27, 2019 | | Current Occupancy (As of): | 96.1% (8/31/2019) |
Seasoning: | 4 months | | YE 2018 Occupancy(3): | NAP |
Maturity Date: | October 10, 2029 | | YE 2017 Occupancy(3): | NAP |
IO Period: | 120 months | | YE 2016 Occupancy(3): | NAP |
Loan Term (Original): | 120 months | | YE 2015 Occupancy(3): | NAP |
Amortization Term (Original): | NAP | | Appraised Value: | $1,600,000,000 |
Loan Amortization Type: | Interest-only, Balloon | | Appraised Value Per Unit: | $855,158 |
Call Protection: | L(28), D(85), O(7) | | Appraisal Valuation Date: | September 4, 2019 |
Lockbox Type: | Soft/Springing Cash Management | | Underwriting and Financial Information |
Additional Debt(1): | Yes | | TTM NOI(3): | NAP |
Additional Debt Type (Balance)(1): | Pari Passu ($475,000,000) / Subordinate ($450,000,000) / Future Mezzanine | | YE 2018 NOI(3): | NAP |
| | | YE 2017 NOI(3): | NAP |
| | | YE 2016 NOI(3): | NAP |
| | | U/W Revenues: | $88,974,756 |
| | | U/W Expenses: | $17,579,385 |
| | | U/W NOI: | $71,395,371 |
| | | U/W NCF: | $71,001,095 |
| | | U/W DSCR based on NOI/NCF(1): | 3.94x / 3.92x |
Escrows and Reserves(2) | | U/W Debt Yield based on NOI/NCF(1): | 13.0% / 12.9% |
| Initial | Monthly | Cap | | U/W Debt Yield at Maturity based on NOI/NCF(1): | 13.0% / 12.9% |
Taxes | $0 | Springing | NAP | | Cut-off Date LTV Ratio(1): | 34.4% |
Insurance | $0 | Springing | NAP | | LTV Ratio at Maturity(1): | 34.4% |
| | | | | | |
Sources and Uses |
Sources | | | | | Uses | | | |
Original Senior loan amount(1) | $550,000,000 | | 55.0% | | Loan payoff(4) | $641,983,355 | | 64.2% |
Subordinate Companion loan amount(1) | 450,000,000 | | 45.0 | | Return of equity | 342,576,222 | | 34.3 |
| | | | | Closing costs | 15,440,423 | | 1.5 |
Total Sources | $1,000,000,000 | | 100.0% | | Total Uses | $1,000,000,000 | | 100.0% |
(1) | The Cut-off Date Balance Per Unit, Maturity Date Balance Per Unit, U/W DSCR based on NOI/NCF, U/W Debt Yield based on NOI/NCF, U/W Debt Yield at Maturity based on NOI/NCF, Cut-off Date LTV Ratio and LTV Ratio at Maturity numbers presented above are based on the Jackson Park Senior Loan (as defined below). |
(2) | See “Escrows” below for further discussion of reserve requirements. |
(3) | Historical financial information and occupancy are not available because the Jackson Park Property (as defined below) was constructed in 2018. |
(4) | The Jackson Park borrower sponsor’s cost of development for the Jackson Park Property was approximately $1.16 billion. The Jackson Park Whole Loan is refinancing the Jackson Park borrower sponsor’s construction debt. |
The Mortgage Loan. The mortgage loan (the “Jackson Park Mortgage Loan”) is part of a whole loan (the “Jackson Park Whole Loan”) in the original principal balance of $1,000,000,000 originated by Bank of America, National Association and Wells Fargo Bank, National Association. The Jackson Park Whole Loan is secured by a first priority fee mortgage encumbering a multifamily property located in Long Island City, New York (the “Jackson Park Property”). The Jackson Park Whole Loan is comprised of ten pari passu senior promissory notes with an original aggregate principal balance of $550,000,000 (the “Jackson Park Senior Loan”) and two pari passu subordinate promissory notes with an original aggregate principal balance of $450,000,000 (the “Jackson Park Subordinate Companion Loan”) which are subordinate to the Jackson Park Senior Loan. The Jackson Park Senior Loan is evidenced by Note A-3 (which represents the Jackson Park Mortgage Loan and is being contributed by Bank of America, National Association) and nine pari passu promissory notes (together the “Jackson Park Pari Passu Non-Serviced Companion Loans”) in the original aggregate principal balance of $475,000,000. The Jackson Park Pari Passu Non-Serviced Companion Loans have been contributed to the JAX 2019-LIC securitization transaction along with the Jackson Park Subordinate Companion Loan, or have been contributed to the BANK 2019-BNK23 and BANK 2019-BNK24 securitization transactions. The Jackson Park Whole Loan is being serviced pursuant to the trust and servicing agreement for the JAX 2019-LIC securitization transaction. See “Description of the Mortgage Pool—The Whole Loans—The Non-Serviced AB Whole Loans—The Jackson Park Whole Loan“ and “Pooling and Servicing Agreement—Servicing of the Non-Serviced Mortgage Loans” in the Preliminary Prospectus.
THE INFORMATION IN THIS STRUCTURAL AND COLLATERAL TERM SHEET IS NOT COMPLETE AND MAY BE AMENDED PRIOR TO THE TIME OF SALE. THIS TERM SHEET IS NOT AN OFFER TO SELL THESE SECURITIES AND IT IS NOT A SOLICITATION OF AN OFFER TO BUY THESE SECURITIES IN ANY JURISDICTION WHERE THE OFFER OR SALE IS NOT PERMITTED.
88
Multifamily – High Rise | Loan #5 | Cut-off Date Balance: | | $75,000,000 |
28-10 Jackson Avenue, 28-40
Jackson Avenue, and 28-30 | Jackson Park | Cut-off Date LTV: | | 34.4% |
Jackson Avenue | | U/W NCF DSCR: | | 3.92x |
Long Island City, NY 11101 | | U/W NOI Debt Yield: | | 13.0% |
Note Summary
Notes | Original Balance | Cut-off Date
Balance | Note Holder | Controlling Piece |
A-1 | $75,000,000 | $75,000,000 | JAX 2019-LIC | Yes |
A-2 | $75,000,000 | $75,000,000 | JAX 2019-LIC | No |
A-3 | $75,000,000 | $75,000,000 | BANK 2020-BNK25 | No |
A-4 | $75,000,000 | $75,000,000 | JAX 2019-LIC | No |
A-5 | $50,000,000 | $50,000,000 | BANK 2019-BNK23 | No |
A-6 | $50,000,000 | $50,000,000 | BANK 2019-BNK23 | No |
A-7 | $50,000,000 | $50,000,000 | BANK 2019-BNK24 | No |
A-8 | $50,000,000 | $50,000,000 | BANK 2019-BNK24 | No |
A-9 | $25,000,000 | $25,000,000 | JAX 2019-LIC | No |
A-10 | $25,000,000 | $25,000,000 | JAX 2019-LIC | No |
B-1 | $225,000,000 | $225,000,000 | JAX 2019-LIC | No |
B-2 | $225,000,000 | $225,000,000 | JAX 2019-LIC | No |
Total | $1,000,000,000 | $1,000,000,000 | | |
The Borrower and Borrower Sponsor. The borrower is LIC Development Owner, L.P. (the “Jackson Park Borrower”), a single-purpose Delaware limited partnership with a single-purpose Delaware limited liability company as its general partner, which general partner has at least two independent directors. Legal counsel to the Jackson Park Borrower delivered a non-consolidation opinion in connection with the origination of the Jackson Park Whole Loan.
The borrower sponsor is an investment venture managed and controlled by one or more affiliates of Tishman Speyer Properties, L.P. (“Tishman Speyer”). Tishman Speyer is an owner, developer, operator and fund manager of real estate assets across the United States, Europe, Brazil, China and India. There is no non-recourse carveout guarantor and no separate environmental indemnitor for the Jackson Park Whole Loan.
The Property. The Jackson Park Property is a recently built, Class A, highly amenitized, luxury multifamily high rise development located on 2.877 acres in Long Island City, New York. The Jackson Park Property is comprised of (i) 1 Jackson Park, a 42-story building containing 550 apartments and 4,920 square feet of ground floor retail space, (ii) 2 Jackson Park, a 53-story building containing 650 apartments and 4,545 square feet of ground floor retail space, and (iii) 3 Jackson Park, a 44-story building containing 671 apartments and 934 square feet of ground floor retail space. Each residential tower features a sky-deck, a party lounge and a children’s playroom. Residential building services include two 24-hour attended lobbies, dry cleaning and laundry, package receipt, housekeeping, a lifestyle coordinator, a virtual concierge, covered valet parking, bike storage and building-wide Wi-Fi. The apartment units feature floor-to-ceiling windows with solar shades, in-unit washer/dryers, 9-foot ceilings, white oak floors, key card entry systems, resident-controlled heating and air conditioning, USB-port outlets and LED lighting. The apartment kitchens feature European soft-close cabinetry with integrated Blomberg and Whirlpool appliances, seamless Ceasarstone countertops and Moen fixtures.
The Jackson Park Property includes a total of 1,871 apartments offered as 451 studio units, 919 one-bedroom units, 396 two-bedroom units, 101 three-bedroom units, and 4 four-bedroom units. The Jackson Park Property began construction in 2014 and began leasing in late 2017. Since opening, the Jackson Park Property has achieved an average of nearly 100 new leases per month. As of August 31, 2019, the Jackson Park Property was 96.1% leased. Additionally, the Jackson Park Property includes a total 10,399 square feet of retail space, which is 75.0% leased by four retail tenants including Sweetleaf (coffee shop), Murray’s LIC (cheese shop), a nail salon and a dog daycare facility. As of the loan origination date, the remaining retail unit (2,602 square feet) space was under negotiations with a potential national restaurant tenant according to the borrower sponsor.
Amenities at the Jackson Park Property include a five-story 45,796 square foot amenity building known as “The Club”. The lower level of The Club contains a 140-space underground parking garage. The first level of The Club includes a tech lounge, demo kitchen, conference room and private dining room, poker and game room, golf simulator, fireside lounge, billiards and foosball tables, outdoor gaming lounge with fireplace and a garden. The second and third levels of The Club feature a fitness center, yoga and Pilates studios, a 75’ indoor lap pool, locker rooms, meditation lounge, sauna, steam room and massage treatment rooms. The fourth level of The Club includes a squash court and full-size basketball/volleyball court. The fifth level of The Club features an outdoor heated pool, hot tub, cabanas, sun deck and wet bar. The three residential towers and the amenity building encircle a 1.6 acre private park containing a grilling and communal dining area, children’s play area, a dog park, bocce court, outdoor table tennis and patio sitting areas.
The Jackson Park Property benefits from a 15-year, 421-a tax exemption through 2034, during which all residential units are subject to New York City rent stabilization guidelines which currently limits annual rental increases to 1.5% and 2.5% for one and two year leases, respectively. Taxes are fully abated for the first 10 years post-construction (through June 2029), then phased in 20% each year for the next five years.
THE INFORMATION IN THIS STRUCTURAL AND COLLATERAL TERM SHEET IS NOT COMPLETE AND MAY BE AMENDED PRIOR TO THE TIME OF SALE. THIS TERM SHEET IS NOT AN OFFER TO SELL THESE SECURITIES AND IT IS NOT A SOLICITATION OF AN OFFER TO BUY THESE SECURITIES IN ANY JURISDICTION WHERE THE OFFER OR SALE IS NOT PERMITTED.
89
Multifamily – High Rise | Loan #5 | Cut-off Date Balance: | | $75,000,000 |
28-10 Jackson Avenue, 28-40
Jackson Avenue, and 28-30 | Jackson Park | Cut-off Date LTV: | | 34.4% |
Jackson Avenue | | U/W NCF DSCR: | | 3.92x |
Long Island City, NY 11101 | | U/W NOI Debt Yield: | | 13.0% |
The following table presents certain information relating to the unit mix at the Jackson Park Property:
Unit Mix(1)
Unit Mix/Type | Units | % Occupied | Average SF per Unit | Total SF | | Annual
Average Rent
per SF | | Monthly
Average Rent
per Unit | Annual
Market Rent
per SF | | Monthly
Market Rent
per Unit |
Studio | 451 | 97.8% | 469 | 211,466 | | $72.81 | | $2,846 | $73.00 | | $2,853 |
One-Bedroom | 919 | 95.3% | 656 | 602,522 | | $65.63 | | $3,590 | $66.00 | | $3,608 |
Two-Bedroom | 396 | 96.0% | 947 | 374,983 | | $65.70 | | $5,194 | $66.00 | | $5,209 |
Three-Bedroom | 101 | 96.0% | 1,254 | 126,692 | | $63.29 | | $6,619 | $64.00 | | $6,688 |
Four-Bedroom | 4 | 100.0% | 1,652 | 6,608 | | $58.92 | | $8,111 | $59.00 | | $8,122 |
Total/Wtd. Avg. | 1,871 | 96.1% | 707 | 1,322,271 | | $66.56 | | $3,920 | $66.89 | | $3,941 |
(1) | Information obtained from the appraisal and underwritten rent roll. |
The following table presents historical occupancy percentages at the Jackson Park Property:
Historical Occupancy
12/31/2015(1) | | 12/31/2016(1) | | 12/31/2017(1) | | 12/31/2018(1) | | 8/31/2019 | |
NAV | | NAV | | NAV | | NAV | | 96.1% | |
(1) | Historical occupancy is not available because the Jackson Park Property was constructed in 2018. |
THE INFORMATION IN THIS STRUCTURAL AND COLLATERAL TERM SHEET IS NOT COMPLETE AND MAY BE AMENDED PRIOR TO THE TIME OF SALE. THIS TERM SHEET IS NOT AN OFFER TO SELL THESE SECURITIES AND IT IS NOT A SOLICITATION OF AN OFFER TO BUY THESE SECURITIES IN ANY JURISDICTION WHERE THE OFFER OR SALE IS NOT PERMITTED.
90
Multifamily – High Rise | Loan #5 | Cut-off Date Balance: | | $75,000,000 |
28-10 Jackson Avenue, 28-40
Jackson Avenue, and 28-30 | Jackson Park | Cut-off Date LTV: | | 34.4% |
Jackson Avenue | | U/W NCF DSCR: | | 3.92x |
Long Island City, NY 11101 | | U/W NOI Debt Yield: | | 13.0% |
Underwritten Net Cash Flow. The following table presents certain information relating to the underwritten net cash flow at the Jackson Park Property:
Cash Flow Analysis(1)
| | U/W | | %(2) | | U/W $ per Unit | |
Gross Potential Rent(3) | | $88,062,437 | | 105.3% | | $47,067.04 | |
(Vacancy) | | (4,403,122) | | (5.0) | | (2,353.35) | |
Net Rental Income | | $83,659,316 | | 100.0% | | $44,713.69 | |
Other Income(4) | | 5,315,440 | | 6.4 | | 2,840.96 | |
Effective Gross Income | | $88,974,756 | | 106.4% | | $47,554.65 | |
| | | | | | | |
Real Estate Taxes(5) | | 613,865 | | 0.7 | | 328.09 | |
Insurance | | 871,159 | | 1.0 | | 465.61 | |
Other Operating Expenses | | 16,094,361 | | 18.1 | | 8,602.01 | |
Total Operating Expenses | | $17,579,385 | | 19.8% | | $9,395.72 | |
| | | | | | | |
Net Operating Income | | $71,395,371 | | 80.2% | | $38,158.94 | |
Replacement Reserves | | 394,276 | | 0.4 | | 210.73 | |
Net Cash Flow | | $71,001,095 | | 79.8% | | $37,948.21 | |
| | | | | | | |
NOI DSCR(6) | | 3.94x | | | | | |
NCF DSCR(6) | | 3.92x | | | | | |
NOI Debt Yield(6) | | 13.0% | | | | | |
NCF Debt Yield(6) | | 12.9% | | | | | |
(1) | Historical financial information is not available because the Jackson Park Property was constructed in 2018. |
(2) | Represents (i) percent of Net Rental Income for all revenue fields, (ii) percent of Gross Potential Rent for Vacancy & Credit Loss and (iii) percent of Effective Gross Income for all other fields. |
(3) | Gross Potential Rent is based on the in-place rent roll as of August 31, 2019 with the 73 vacant units grossed up at currently marketed rents. |
(4) | Other Income is comprised of budgeted parking income, commercial income as of February 2020 and budgeted other ancillary income. UW Other Income also includes $4,200,000 of budgeted amenity fee revenue for which there were $1,256,087 of corresponding amenity expenses underwritten. |
(5) | The Jackson Park Property benefits from a 15-year, 421-a tax abatement which extends through June 2034. Taxes are fully abated for the first 10 years post-construction (through June 2029), then phased in 20% each year for the next five years. UW Real Estate Taxes assume the full abatement. |
(6) | The debt service coverage ratios and debt yields are based on the Jackson Park Senior Loan and exclude the Jackson Park Subordinate Companion Loan. |
Appraisal. The appraiser concluded to an “as-is” Appraised Value for the Jackson Park Property of $1,600,000,000 as of September 4, 2019.
Environmental Matters. According to the Phase I environmental site assessment dated August, 2019, a controlled recognized environmental condition was identified at the Jackson Park Property. The site was historically operated as a chemical manufacturing plant with several historic petroleum spills. In 2016, the New York State Department of Environmental Conservation issued a certificate of completion documenting completion of remediation. A pollution legal liability policy from Great American E & S Insurance Company is in place which provides a limit of $10,000,000 per incident with an aggregate limit of $10,000,000. The policy term is 10 years and extends to the term of the Jackson Park Whole Loan.
Market Overview and Competition. The Jackson Park Property is located in Long Island City, which is located on the western tip of Queens, New York, with views of the Manhattan skyline. Long Island City is a residential and commercial neighborhood known for its arts community, with a high concentration of art galleries, art institutions and studio space. The New York City Department of Education and CUNY Law School are major employers in the area along with Brooks Brothers, Boyce Technologies Inc., DeppGlass, Doughnut Plant, J. Crew/Madewell, JetBlue Airways, Kaufman Astoria Studios, LaGuardia Community College, MANA Products, Nouveau Elevator, Silvercup Studios, and VaynerMedia. Major corporate tenants in the area include Estée Lauder, Macy’s/Bloomingdales, The New York Times and The Wirecutter. At the end of 2018, New York City announced it would invest $180 million in new funding toward Long Island City’s infrastructure including improvements to schools, transportation, parks and sewer/water systems.
Long Island City is accessible by eight subway lines, thirteen bus lines, the East River Ferry (2 stops), Citibike (13 stations) and the Long Island Railroad. The Jackson Park Property offers commuting times to Manhattan of about 10 minutes by being adjacent to the Queens Plaza subway station with service on the “E”, “M”, and “R” trains and within walking distance of the Queensboro Plaza subway station with service on the “7”, “N”, and “W” trains. The drives to LaGuardia and John F. Kennedy Airports are about 15 and 20 minutes, respectively.
THE INFORMATION IN THIS STRUCTURAL AND COLLATERAL TERM SHEET IS NOT COMPLETE AND MAY BE AMENDED PRIOR TO THE TIME OF SALE. THIS TERM SHEET IS NOT AN OFFER TO SELL THESE SECURITIES AND IT IS NOT A SOLICITATION OF AN OFFER TO BUY THESE SECURITIES IN ANY JURISDICTION WHERE THE OFFER OR SALE IS NOT PERMITTED.
91
Multifamily – High Rise | Loan #5 | Cut-off Date Balance: | | $75,000,000 |
28-10 Jackson Avenue, 28-40
Jackson Avenue, and 28-30 | Jackson Park | Cut-off Date LTV: | | 34.4% |
Jackson Avenue | | U/W NCF DSCR: | | 3.92x |
Long Island City, NY 11101 | | U/W NOI Debt Yield: | | 13.0% |
According to a neighborhood development association for Long Island City, as of October 2019, Long Island City had an estimated 170,000 residents, 127,000 employees and 6,800 businesses. According to the appraisal, the estimated 2018 population within a one-three- and five-mile radius of the Jackson Park Property was 69,225, 1,194,829 and 3,166,541, respectively. The estimated 2018 average household income within a one-, three- and five-mile radius was $94,863, $139,915 and $123,971, respectively.
According to a third party data provider, the Jackson Park Property is in the Long Island City multifamily submarket, which for 2019 in the highest (4 and 5 star) category had 14,786 units with an average rent per unit of $3,896, a vacancy rate of 4.7% and an absorption rate of 9.9%.
The following table presents certain information relating to comparable rental properties to the Jackson Park Property:
Comparable Rental Properties(1)
| | Jackson Park Property | 1 Queens Plaza South | Tower 28 | QLIC | Alta LIC(2) | Linc Long Island City |
| Year Built | 2018 | 2017 | 2017 | 2013 | 2018 | 2013 |
| Number of units | 1,871 | 391 | 450 | 422 | 467 | 711 |
| Occupancy(3) | 96.1% | 97.9% | 98.0% | 98.3% | 93.6% | 98.7% |
| Unit size (SF)(4): | | | | | | |
| - Studio | 469 | 468 | 428 | 400 | 516 | 503 |
| - 1-BR | 656 | 691 | 667 | 500 | 723 | 700 |
| - 2-BR | 947 | 979 | 936 | 800 | 1,153 | 1,038 |
| - 3-BR | 1,254 | NAP | 1,305 | 950 | 1,317 | 1,400 |
| Monthly Rent per Unit(5): | | | | | | |
| - Studio | $2,846 | $2,769 | $2,308 | $2,360 | $2,715 | $3,244 |
| - 1-BR | $3,590 | $3,808 | $3,361 | $3,029 | $3,324 | $3,813 |
| - 2-BR | $5,194 | $5,051 | $4,900 | $3,800 | $5,187 | $5,278 |
| - 3-BR | $6,619 | NAP | $6,486 | $4,999 | $6,201 | $6,329 |
| Annual Rent per SF(5): | | | | | | |
| - Studio | $72.81 | $71.00 | $64.71 | $70.80 | $63.14 | $77.39 |
| - 1-BR | $65.63 | $66.13 | $60.47 | $72.70 | $55.17 | $65.37 |
| - 2-BR | $65.70 | $61.91 | $62.82 | $57.00 | $53.98 | $61.02 |
| - 3-BR | $63.29 | NAP | $59.64 | $63.15 | $56.50 | $54.25 |
(1) | Information obtained from the appraisal. |
(2) | Alta LIC is in its initial lease-up period. |
(3) | Occupancy for the comparables is as of September 2019 and for the Jackson Park Property is as of the borrower rent roll dated August 31, 2019. |
(4) | Represents the average for each unit size at the Jackson Park Property. |
(5) | Rent for the Jackson Park Property is based on the underwritten rent roll. |
Escrows.
Real Estate Taxes – During a Cash Sweep Period (as defined below), the Jackson Park Borrower is required to deposit monthly 1/12th of the annual estimated real estate taxes.
Insurance – During a Cash Sweep Period or if the Jackson Park Property is no longer covered by a blanket insurance policy, the Jackson Park Borrower is required to deposit monthly 1/12th of the annual estimated insurance premiums.
Lockbox and Cash Management. The Jackson Park Whole Loan is structured with a soft lockbox and springing cash management upon the occurrence of a Cash Sweep Period (as defined below). During the continuance of a Cash Sweep Period, all funds in the lockbox account are required to be transferred to the lender-controlled cash management account and disbursed in accordance with the Jackson Park Whole Loan documents. During the continuance of a Low DSCR Period (as defined below), all excess cash flow is required to be held by the lender as additional security for the Jackson Park Whole Loan, however, the Jackson Park Borrower is permitted to request excess cash for debt service and reserve payments, leasing and operating expenses set forth in the annual budget, to cure a Low DSCR Period, and for required distributions to its REIT equity holders to avoid tax impositions (not to exceed $25,000 annually). During the continuance of an event of default under the Jackson Park Whole Loan, all excess cash flow may be applied by the lender in its sole discretion.
A “Cash Sweep Period” will occur during (i) an event of default under the Jackson Park Whole Loan until the event of default is cured or (ii) a Low DSCR Period.
A “Low DSCR Period” will commence when the debt service coverage ratio is less than 1.25x for two consecutive calendar quarters and continue until (x) the debt service coverage ratio is equal to or greater than 1.25x for two consecutive calendar quarters or (y) the Jackson Park Borrower deposits cash (which may be excess cash) or a letter of credit in an amount that if applied to the reduction of the outstanding principal balance of the Jackson Park Whole Loan would result in a debt service coverage ratio of at least 1.25x for the
THE INFORMATION IN THIS STRUCTURAL AND COLLATERAL TERM SHEET IS NOT COMPLETE AND MAY BE AMENDED PRIOR TO THE TIME OF SALE. THIS TERM SHEET IS NOT AN OFFER TO SELL THESE SECURITIES AND IT IS NOT A SOLICITATION OF AN OFFER TO BUY THESE SECURITIES IN ANY JURISDICTION WHERE THE OFFER OR SALE IS NOT PERMITTED.
92
Multifamily – High Rise | Loan #5 | Cut-off Date Balance: | | $75,000,000 |
28-10 Jackson Avenue, 28-40
Jackson Avenue, and 28-30 | Jackson Park | Cut-off Date LTV: | | 34.4% |
Jackson Avenue | | U/W NCF DSCR: | | 3.92x |
Long Island City, NY 11101 | | U/W NOI Debt Yield: | | 13.0% |
most recent two calendar quarters. For purposes of the Cash Sweep Period test, the debt service coverage ratio will be calculated based on the Jackson Park Whole Loan and any future mezzanine debt if applicable.
Property Management. The Jackson Park Property is managed by an affiliate of the Jackson Park Borrower.
Partial Release. After the end of the two-year period commencing on the closing date of the BANK 2020-BNK25 securitization, the Jackson Park Whole Loan documents permit the partial release of any residential tower within the Jackson Park Property (1 Jackson Park, 2 Jackson Park or 3 Jackson Park), but not the release of the amenity building or parking garage or any other portion of the Jackson Park Property, through (A) on or after April 10, 2029, prepayment equal to the Release Price or (B) prior to April 10, 2029, partial defeasance in an amount equal to the Release Price, provided (a) no event of default is continuing, (b) the released property is transferred on an arms-length basis, (c) rating agency confirmation is received and (d) after the partial release, the debt yield for the remaining property meets the “Debt Yield Test” of being at least the greater of (x) the debt yield immediately preceding the release and (y) 7.10% (provided that the Jackson Park Borrower may deposit as either cash or a letter of credit the amount which would cause the Jackson Park Property to meet the Debt Yield Test).
The “Release Price” is equal to 110% of the allocated loan amount for each residential building. The allocated loan amount for 1 Jackson Park is $375,000,000. The allocated loan amount for 2 Jackson Park is $359,375,000. The allocated loan amount for 3 Jackson Park is $265,625,000.
Real Estate Substitution. Not permitted.
Subordinate and Mezzanine Indebtedness. In addition to the Jackson Park Mortgage Loan, the Jackson Park Property also secures the Jackson Park Non-Serviced Pari Passu Companion Loans which have a Cut-off Date principal balance of $475,000,000 and the Jackson Park Subordinate Companion Loan, which has a Cut-off Date principal balance of $450,000,000. The Jackson Park Non-Serviced Pari Passu Companion Loans and the Jackson Park Subordinate Companion Loan all accrue interest at the rate of 3.2500% per annum. The Jackson Park Senior Loan is generally senior in right of payment to the Jackson Park Subordinate Companion Loan. The holders of the Jackson Park promissory notes have entered into a co-lender agreement which sets forth the allocation of collections on the Jackson Park Whole Loan. See “Description of the Mortgage Pool—The Whole Loans—The Non-Serviced AB Whole Loans—The Jackson Park Whole Loan“ and “Pooling and Servicing Agreement—Servicing of the Non-Serviced Mortgage Loans” in the Preliminary Prospectus.
The Jackson Park Borrower has a one-time right to obtain a future mezzanine loan, co-terminous with the Jackson Park Whole Loan, not to exceed the lesser of (x) $200,000,000 and (y) the amount that when added to the outstanding principal balance of the Jackson Park Whole Loan would result in (a) a combined loan to value ratio of no more than 95% of the origination date loan to value ratio of 62.5%, (b) a combined debt service coverage ratio of at least 105% of the origination date debt service coverage ratio of 2.15x and (c) a combined debt yield of at least 105% of the origination date debt yield of 7.1%, subject to (i) no event of default continuing, (ii) execution of an intercreditor agreement with the lender and (iii) receipt of rating agency confirmation.
Ground Lease. None.
Letter of Credit. None.
Right of First Offer. None.
Terrorism Insurance. The Jackson Park Borrower is required to obtain and maintain property insurance that covers acts of terrorism in an amount equal to the full replacement cost of the Jackson Park Property and business interruption insurance for actual loss sustained until the restoration is complete plus a 12-month extended period of indemnity, provided, if the Terrorism Risk Insurance Program Authorization Act of 2015 (as the same may be further modified, amended, or extended) is not in effect, the Jackson Park Borrower will not be required to pay annual premiums in excess of two times the premium then payable for the property and business interruption insurance (excluding earthquake and terrorism components) in order to obtain the terrorism coverage. See “Risk Factors—Risks Relating to the Mortgage Loans—Terrorism Insurance May Not Be Available for All Mortgaged Properties” in the Preliminary Prospectus.
THE INFORMATION IN THIS STRUCTURAL AND COLLATERAL TERM SHEET IS NOT COMPLETE AND MAY BE AMENDED PRIOR TO THE TIME OF SALE. THIS TERM SHEET IS NOT AN OFFER TO SELL THESE SECURITIES AND IT IS NOT A SOLICITATION OF AN OFFER TO BUY THESE SECURITIES IN ANY JURISDICTION WHERE THE OFFER OR SALE IS NOT PERMITTED.
93
Retail – Super Regional Mall | Loan #6 | Cut-off Date Balance: | | $75,000,000 |
5100 Kings Plaza | Kings Plaza | Cut-off Date LTV: | | 54.1% |
Brooklyn, NY 11234 | | U/W NCF DSCR: | | 3.06x |
| | U/W NOI Debt Yield: | | 10.7% |

THE INFORMATION IN THIS STRUCTURAL AND COLLATERAL TERM SHEET IS NOT COMPLETE AND MAY BE AMENDED PRIOR TO THE TIME OF SALE. THIS TERM SHEET IS NOT AN OFFER TO SELL THESE SECURITIES AND IT IS NOT A SOLICITATION OF AN OFFER TO BUY THESE SECURITIES IN ANY JURISDICTION WHERE THE OFFER OR SALE IS NOT PERMITTED.
94
Retail – Super Regional Mall | Loan #6 | Cut-off Date Balance: | | $75,000,000 |
5100 Kings Plaza | Kings Plaza | Cut-off Date LTV: | | 54.1% |
Brooklyn, NY 11234 | | U/W NCF DSCR: | | 3.06x |
| | U/W NOI Debt Yield: | | 10.7% |
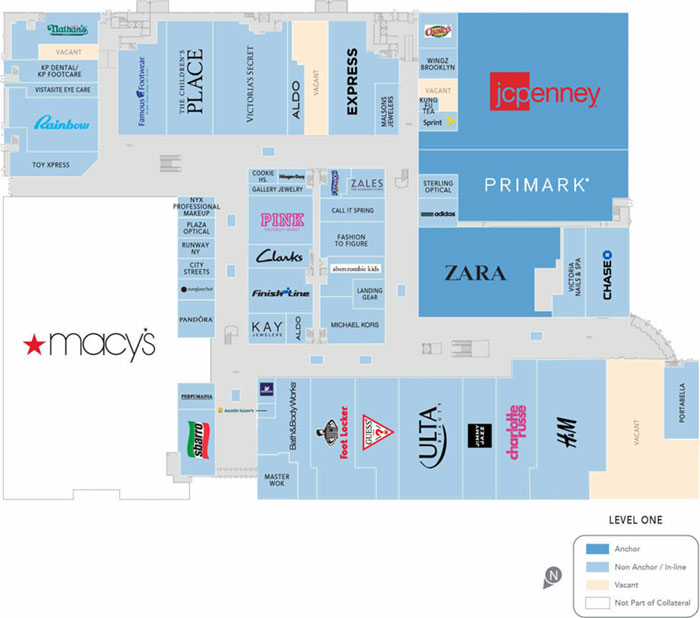
THE INFORMATION IN THIS STRUCTURAL AND COLLATERAL TERM SHEET IS NOT COMPLETE AND MAY BE AMENDED PRIOR TO THE TIME OF SALE. THIS TERM SHEET IS NOT AN OFFER TO SELL THESE SECURITIES AND IT IS NOT A SOLICITATION OF AN OFFER TO BUY THESE SECURITIES IN ANY JURISDICTION WHERE THE OFFER OR SALE IS NOT PERMITTED.
95
Retail – Super Regional Mall | Loan #6 | Cut-off Date Balance: | | $75,000,000 |
5100 Kings Plaza | Kings Plaza | Cut-off Date LTV: | | 54.1% |
Brooklyn, NY 11234 | | U/W NCF DSCR: | | 3.06x |
| | U/W NOI Debt Yield: | | 10.7% |
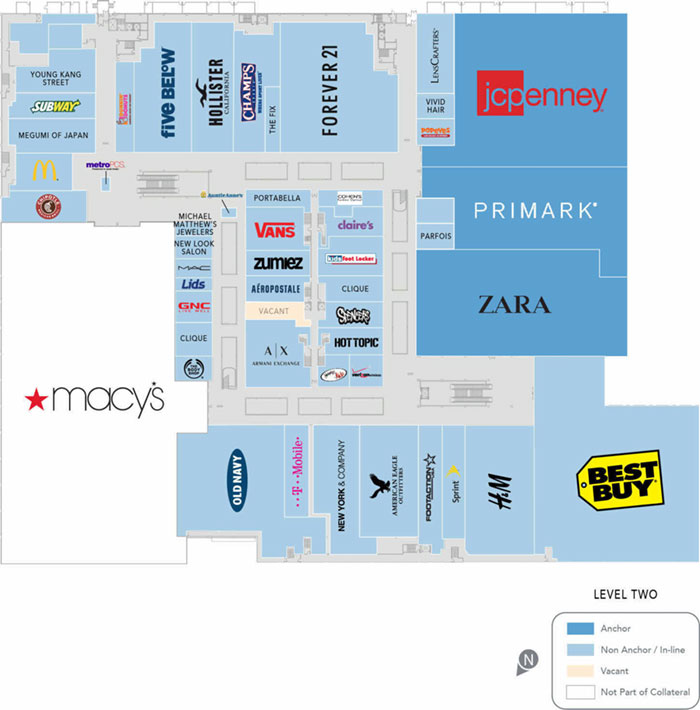
THE INFORMATION IN THIS STRUCTURAL AND COLLATERAL TERM SHEET IS NOT COMPLETE AND MAY BE AMENDED PRIOR TO THE TIME OF SALE. THIS TERM SHEET IS NOT AN OFFER TO SELL THESE SECURITIES AND IT IS NOT A SOLICITATION OF AN OFFER TO BUY THESE SECURITIES IN ANY JURISDICTION WHERE THE OFFER OR SALE IS NOT PERMITTED.
96
Retail – Super Regional Mall | Loan #6 | Cut-off Date Balance: | | $75,000,000 |
5100 Kings Plaza | Kings Plaza | Cut-off Date LTV: | | 54.1% |
Brooklyn, NY 11234 | | U/W NCF DSCR: | | 3.06x |
| | U/W NOI Debt Yield: | | 10.7% |
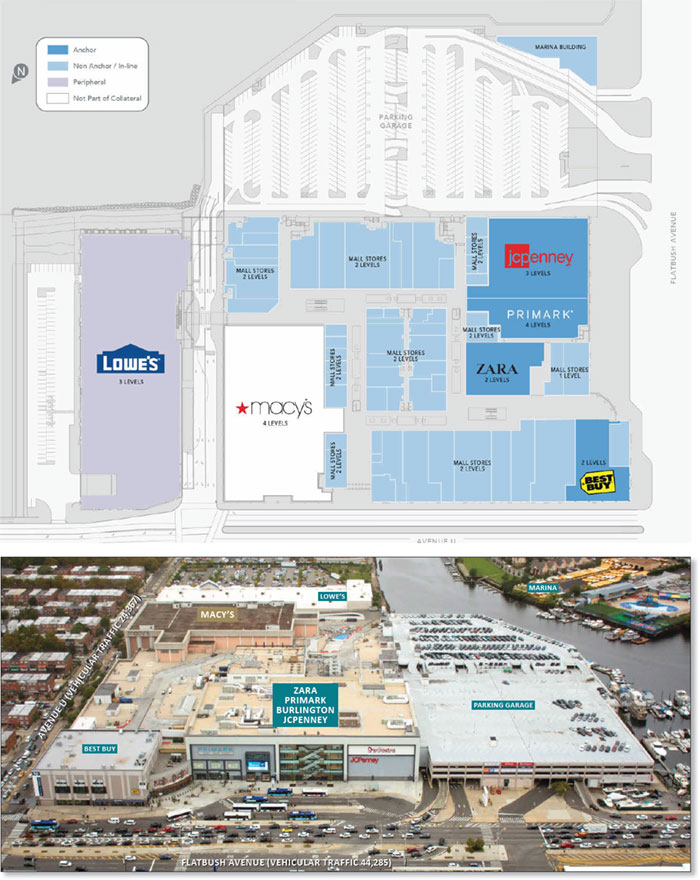
THE INFORMATION IN THIS STRUCTURAL AND COLLATERAL TERM SHEET IS NOT COMPLETE AND MAY BE AMENDED PRIOR TO THE TIME OF SALE. THIS TERM SHEET IS NOT AN OFFER TO SELL THESE SECURITIES AND IT IS NOT A SOLICITATION OF AN OFFER TO BUY THESE SECURITIES IN ANY JURISDICTION WHERE THE OFFER OR SALE IS NOT PERMITTED.
97
Retail – Super Regional Mall | Loan #6 | Cut-off Date Balance: | | $75,000,000 |
5100 Kings Plaza | Kings Plaza | Cut-off Date LTV: | | 54.1% |
Brooklyn, NY 11234 | | U/W NCF DSCR: | | 3.06x |
| | U/W NOI Debt Yield: | | 10.7% |
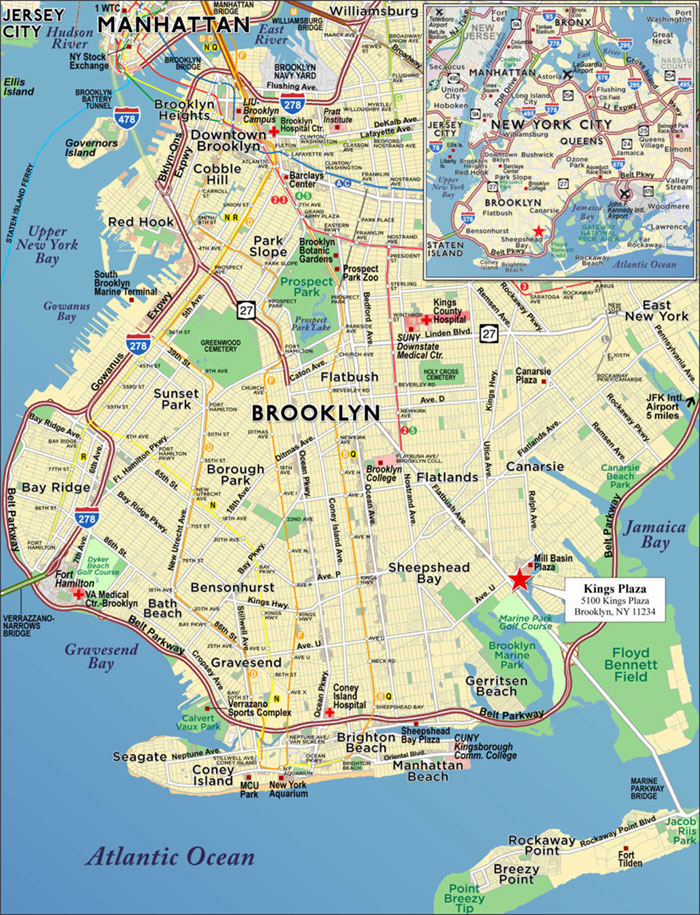
THE INFORMATION IN THIS STRUCTURAL AND COLLATERAL TERM SHEET IS NOT COMPLETE AND MAY BE AMENDED PRIOR TO THE TIME OF SALE. THIS TERM SHEET IS NOT AN OFFER TO SELL THESE SECURITIES AND IT IS NOT A SOLICITATION OF AN OFFER TO BUY THESE SECURITIES IN ANY JURISDICTION WHERE THE OFFER OR SALE IS NOT PERMITTED.
98
| No. 6 – Kings Plaza |
| |
| Mortgage Loan Information | | Mortgaged Property Information |
| Mortgage Loan Seller: | Wells Fargo Bank, National Association | | Single Asset/Portfolio: | Single Asset |
Credit Assessment (Fitch/KBRA/S&P): | BBBsf/NR/BBB(sf) | | Property Type – Subtype: | Retail – Super Regional Mall |
| Original Principal Balance(1): | $75,000,000 | | Location: | Brooklyn, NY |
| Cut-off Date Balance(1): | $75,000,000 | | Size: | 811,797 SF |
| % of Initial Pool Balance: | 4.6% | | Cut-off Date Balance Per SF(1): | $599.90 |
| Loan Purpose: | Refinance | | Maturity Date Balance Per SF(1): | $599.90 |
| Borrower Sponsor: | The Macerich Partnership, L.P. | | Year Built/Renovated: | 1969 / 2018 |
| Guarantor: | The Macerich Partnership, L.P. | | Title Vesting(5): | Fee / Leasehold |
| Mortgage Rate: | 3.3588% | | Property Manager: | Self-managed |
| Note Date: | December 3, 2019 | | Current Occupancy (As of): | 96.7% (10/31/2019) |
| Seasoning: | 1 month | | YE 2018 Occupancy: | 97.9% |
| Maturity Date: | January 1, 2030 | | YE 2017 Occupancy: | 96.6% |
| IO Period: | 120 months | | YE 2016 Occupancy: | 95.2% |
| Loan Term (Original): | 120 months | | YE 2015 Occupancy: | 92.3% |
| Amortization Term (Original): | NAP | | As-Is Appraised Value: | $900,000,000 |
| Loan Amortization Type: | Interest-only, Balloon | | As-Is Appraised Value Per SF: | $1,108.65 |
| Call Protection(2): | L(25),GRTR 1% or YM(90),O(5) | | As-Is Appraisal Valuation Date: | October 17, 2019 |
| Lockbox Type: | Hard/Springing Cash Management | | | |
| Additional Debt(1)(3): | Yes | | Underwriting and Financial Information |
| Additional Debt Type (Balance)(1)(3): | Pari Passu ($412,000,000); Mezzanine ($53,000,000) | | TTM NOI 9/30/2019: | $47,457,344 |
| | | | YE 2018 NOI: | $42,088,187 |
| | | | YE 2017 NOI: | $39,436,748 |
| | | | YE 2016 NOI: | $42,598,711 |
| | | | U/W Revenues: | $81,045,187 |
| | | | U/W Expenses: | $29,004,262 |
| Escrows and Reserves(4) | | U/W NOI: | $52,040,925 |
| | Initial | Monthly | Cap | | U/W NCF: | $50,905,970 |
| Taxes | $0 | Springing | NAP | | U/W DSCR based on NOI/NCF(1)(3): | 3.13x / 3.06x |
| Insurance | $0 | Springing | NAP | | U/W Debt Yield based on NOI/NCF(1)(3): | 10.7% / 10.5% |
| Replacement Reserve | $0 | Springing | (4) | | U/W Debt Yield at Maturity based on NOI/NCF(1)(3): | 10.7% / 10.5% |
| TI/LC | $0 | Springing | (4) | | Cut-off Date LTV Ratio(1)(3): | 54.1% |
| Ground Rent | $0 | Springing | NAP | | LTV Ratio at Maturity(1)(3): | 54.1% |
| | | | | | | |
| | | | | | | | |
Sources and Uses |
Sources | | | | | Uses | | | |
Original whole loan amount(1) | $487,000,000 | | 90.2% | | Loan payoff(6) | $428,649,060 | | 79.4% |
Mezzanine loan | 53,000,000 | | 9.8 | | Closing costs | 6,113,399 | | 1.1 |
| | | | | Return of equity | 105,237,541 | | 19.5 |
Total Sources | $540,000,000 | | 100.0% | | Total Uses | $540,000,000 | | 100.0% |
(1) | The Cut-off Date Balance Per SF, Maturity Date Balance Per SF, U/W DSCR based on NOI/NCF, U/W Debt Yield based on NOI/NCF, U/W Debt Yield at Maturity based on NOI/NCF, Cut-off Date LTV Ratio and LTV Ratio at Maturity numbers presented above are based on the Kings Plaza Whole Loan (as defined below). |
(2) | The Kings Plaza Borrower (as defined below) has the right to prepay the Kings Plaza Whole Loan in full, together with a yield maintenance premium equal to the greater of yield maintenance or 1% of the outstanding principal balance, at any time after the earlier to occur of (a) the end of the two-year period commencing on the closing date of the securitization of the last promissory note representing a portion of the Kings Plaza Whole Loan to be securitized and (b) February 1, 2023. The assumed lockout period of 25 payments is based on the closing date of this transaction in February 2020. |
(3) | The equity interest in the Kings Plaza Borrower has been pledged to secure mezzanine indebtedness with an outstanding principal balance of $53,000,000 (the “Kings Plaza Mezzanine Loan”). The Cut-off Date Balance Per SF, U/W Debt Yield Based on NOI, U/W DSCR based on NCF, and Cut-off Date LTV Ratio based on the Kings Plaza Whole Loan and the Kings Plaza Mezzanine Loan are $665, 9.6%, 1.73x, and 60.0%, respectively. See “Additional Secured Indebtedness (not including trade debts)” below. |
(4) | See “Escrows” section below. |
(5) | A portion of the Kings Plaza Property totaling approximately 10,278 square feet is subject to a ground lease with the City of New York (see “Ground Lease” section below). |
(6) | The Kings Plaza Property was previously securitized in the GSMS 2013-KING securitization trust. |
The Mortgage Loan. The mortgage loan (the “Kings Plaza Mortgage Loan”) is part of a whole loan (the “Kings Plaza Whole Loan”) that is evidenced by 12 pari passu promissory notes in the aggregate original principal amount of $487,000,000. The Kings Plaza Whole Loan is secured by a first priority mortgage encumbering the fee simple and leasehold interests in a super regional mall located in Brooklyn, New York (the “Kings Plaza Property”). The Kings Plaza Whole Loan was co-originated on December 3, 2019 by Wells Fargo Bank, National Association (“WFB”), Société Générale Financial Corporation (“SocGen”) and JPMorgan Chase Bank, National Association (“JPMorgan”). The Kings Plaza Mortgage Loan is evidenced by the non-controlling promissory notes A-3-1 and A-3-4. The
THE INFORMATION IN THIS STRUCTURAL AND COLLATERAL TERM SHEET IS NOT COMPLETE AND MAY BE AMENDED PRIOR TO THE TIME OF SALE. THIS TERM SHEET IS NOT AN OFFER TO SELL THESE SECURITIES AND IT IS NOT A SOLICITATION OF AN OFFER TO BUY THESE SECURITIES IN ANY JURISDICTION WHERE THE OFFER OR SALE IS NOT PERMITTED.
99
Retail – Super Regional Mall | Loan #6 | Cut-off Date Balance: | | $75,000,000 |
5100 Kings Plaza | Kings Plaza | Cut-off Date LTV: | | 54.1% |
Brooklyn, NY 11234 | | U/W NCF DSCR: | | 3.06x |
| | U/W NOI Debt Yield: | | 10.7% |
remaining notes are expected to be contributed to future securitization trusts or may be otherwise transferred at any time. The Kings Plaza Whole Loan is expected to be initially serviced pursuant to the pooling and servicing agreement for the Benchmark 2020-B16 securitization. Following the securitization of Note A-1-1, the Kings Plaza Whole Loan will be serviced under the pooling and servicing agreement governing such securitization. See “Description of the Mortgage Pool—The Whole Loans—The Non-Serviced Pari Passu Whole Loans” and “Pooling and Servicing Agreement—Servicing of the Non-Serviced Mortgage Loans” in the Preliminary Prospectus.
Note Summary
| Note | Original Balance | Cut-off Date Balance | Note Holder | Controlling Piece |
| A-1-1 | $70,000,000 | $70,000,000 | JPMorgan | Yes |
| A-1-2 | $50,000,000 | $50,000,000 | Benchmark 2020-B16(1) | No |
| A-1-3 | $30,000,000 | $30,000,000 | JPMorgan | No |
| A-1-4 | $21,108,108 | $21,108,108 | JPMorgan | No |
| A-2-1 | $60,000,000 | $60,000,000 | SocGen | No |
| A-2-2 | $50,000,000 | $50,000,000 | SocGen | No |
| A-2-3 | $35,000,000 | $35,000,000 | SocGen | No |
| A-2-4 | $12,945,946 | $12,945,946 | SocGen | No |
| A-3-1 | $50,000,000 | $50,000,000 | BANK 2020-BNK25 | No |
| A-3-2 | $50,000,000 | $50,000,000 | WFB | No |
| A-3-3 | $32,945,946 | $32,945,946 | WFB | No |
| A-3-4 | $25,000,000 | $25,000,000 | BANK 2020-BNK25 | No |
| Total | $487,000,000 | $487,000,000 | | |
(1) | Benchmark 2020-B16 is expected to close on or about February 12, 2020. |
The Borrowers and Borrower Sponsor. The borrowers are Brooklyn Kings Plaza LLC and Kings Plaza Ground Lease LLC (collectively, the “Kings Plaza Borrower”), each organized as a Delaware limited liability company and structured to be bankruptcy remote with two independent directors. Legal counsel to the borrower delivered a non-consolidation opinion in connection with the origination of the Kings Plaza Whole Loan. The borrower sponsor and non-recourse carve-out guarantor of the Kings Plaza Whole Loan is The Macerich Partnership, L.P. (the “Kings Plaza Guarantor”). The Macerich Partnership, L.P. is part of the parent organization The Macerich Company (“Macerich”). Founded in 1964, Macerich has a portfolio containing 47 properties in 15 states with a large concentration in California, Arizona and New York. Additionally, Macerich (NYSE:MAC), an S&P 500 company, reported total revenues of approximately $960 million as of December 31, 2018 and approximately $9.0 billion in total assets under management.
The Property. The Kings Plaza Property contains 811,797 square feet of a larger four-story super regional mall containing 1,146,035 square feet. Built in 1969 and renovated in 2018, the Kings Plaza Property is situated on a 19.1-acre parcel and also contains total of 3,739 parking spaces (including a parking garage), resulting in a parking ratio of approximately 4.6 spaces per 1,000 square feet. A portion of the Kings Plaza Property totaling approximately 10,278 square feet is subject to a ground lease with the City of New York as the ground lessor (see “Ground Lease” section below). The Kings Plaza Property was 96.7% occupied as of October 31, 2019 and has averaged 95.4% occupancy since 2012. For the trailing 12-month period ending September 30, 2019, the Kings Plaza Property reported comparable sales for in-line tenants less than 10,000 square feet of approximately $753 per square foot, which is up approximately 2.6% from full year 2018 ($734 per square foot) and 9.9% from full year 2017 ($685 per square foot)(see “Historical Sales” table below).
According to the appraisal, the Kings Plaza Property is the largest enclosed shopping center in Brooklyn. The Kings Plaza Property is anchored by Primark, Best Buy, Lowe’s Home Centers, Burlington, JCPenney and Macy’s (Macy’s is not part of the collateral) with additional major tenants including H&M, Old Navy, Zara, ULTA Beauty and Victoria’s Secret. According to the appraisal, the Kings Plaza Macy’s store was selected as one of Macy’s “Growth 100” locations for 2020 where Macy’s is experimenting with new concepts and improving store fixtures and facilities. Forever 21 currently occupies a 22,828 square foot space at the Kings Plaza Property but was underwritten as vacant due to a September 2019 Chapter 11 bankruptcy filing. Forever 21 has been in occupancy at the Kings Plaza Property since 2010, is currently open for business and has a lease expiration date of January 31, 2020.
Since acquiring the property in 2012, the sponsor has invested approximately $290.3 million in capital improvements including renovations of the mall and parking garage, leasing capital and power plant upgrades. In mid-2016, the borrower sponsor recaptured the former Sears box and completed an approximately $144.7 million redevelopment with a four-story glass atrium, new façade, exterior improvements and new entry with connections to all four levels. The redeveloped space re-opened in summer 2018 and comprises retailers including Primark (the first location in Brooklyn), Zara, Burlington and JCPenney. In 2014-2015, the Kings Plaza Property underwent approximately $22.0 million in interior renovations, including LED lighting, new flooring, improved ambient lighting, new signage, updated seating areas and security upgrades.
The Kings Plaza Property includes a stand-alone power plant located on the roof, which provides all electricity to the shopping center. Tenants at the Kings Plaza Property purchase their utilities directly from the power plant at prevailing Consolidated Edison (ConEd) rates and due to operating cost efficiencies, expenses are kept below the billed rates. In 2019, the borrower sponsor completed a two-year project totaling approximately $17.5 million, which allowed the power plant to interconnect with the local ConEd grid. This interconnection allows the Kings Plaza Property to export its surplus electric capacity during peak load demands. This system went
THE INFORMATION IN THIS STRUCTURAL AND COLLATERAL TERM SHEET IS NOT COMPLETE AND MAY BE AMENDED PRIOR TO THE TIME OF SALE. THIS TERM SHEET IS NOT AN OFFER TO SELL THESE SECURITIES AND IT IS NOT A SOLICITATION OF AN OFFER TO BUY THESE SECURITIES IN ANY JURISDICTION WHERE THE OFFER OR SALE IS NOT PERMITTED.
100
Retail – Super Regional Mall | Loan #6 | Cut-off Date Balance: | | $75,000,000 |
5100 Kings Plaza | Kings Plaza | Cut-off Date LTV: | | 54.1% |
Brooklyn, NY 11234 | | U/W NCF DSCR: | | 3.06x |
| | U/W NOI Debt Yield: | | 10.7% |
live in July 2019 and generates participation revenue as well as operating cost savings through reduced man-hours and engine operation.
The following table presents certain information relating to the tenancy at the Kings Plaza Property:
Major Tenants
Tenant Name | Credit Rating (Fitch/ Moody’s/
S&P)(1) | Tenant NRSF | % of
NRSF | Annual U/W Base Rent PSF(2) | Annual
U/W Base Rent(2) | % of Total Annual U/W Base Rent | Lease
Expiration
Date | Extension Options | Termination Option (Y/N) |
Non-Collateral Anchor Tenant | | | | | | | | |
Macy’s | BBB/Baa3/BBB- | 339,000 | | ANCHOR-OWNED – NOT PART OF THE COLLATERAL |
Anchor Tenants – Collateral | | | | | | | | |
Primark | NR/NR/NR | 102,805 | 12.7% | $35.17 | $3,615,390 | 9.2% | 7/31/2038 | 3, 5-year | Y(3) |
Best Buy | NR/Baa1/BBB | 53,371 | 6.6% | $52.80 | $2,817,989 | 7.2% | 1/31/2032 | None | N |
Lowe’s Home Centers | NR/Baa1/BBB+ | 114,000 | 14.0% | $19.30 | $2,200,000 | 5.6% | 5/31/2028 | (4) | N |
Burlington | BB+/NR/BB+ | 55,078 | 6.8% | $22.25 | $1,225,485 | 3.1% | 7/31/2028 | 3, 5-year | N |
JCPenney(5) | CCC+/Caa3/CCC | 94,895 | 11.7% | $7.57(5) | $718,054(5) | 1.8% | 7/31/2038 | 4, 5-year | N |
Total Anchor Tenants | | 420,149 | 51.8% | $25.17 | $10,576,918 | 27.0% | | | |
| | | | | | | | | |
Major Tenants | | | | | | | | | |
H&M | NR/NR/NR | 25,151 | 3.1% | $88.44 | $2,224,409 | 5.7% | 1/31/2024 | 1, 5-year | N |
Old Navy | NR/Baa2/BB | 18,256 | 2.2% | $68.94 | $1,258,638 | 3.2% | 1/31/2025 | None | N |
Zara | NR/NR/NR | 33,771 | 4.2% | $34.22 | $1,155,688 | 2.9% | 7/31/2028 | 1, 5-year | N |
ULTA Beauty | NR/NR/NR | 10,924 | 1.3% | $82.50 | $901,230 | 2.3% | 10/31/2027 | 1, 5-year | N |
Victoria’s Secret | NR/Ba2/BB- | 12,034 | 1.5% | $69.60 | $837,566 | 2.1% | 1/31/2023 | None | N |
Total Major Tenants | 100,136 | 12.3% | $63.69 | $6,377,530 | 16.3% | | | |
| | | | | | | | |
Non-Major Tenants(6) | 264,831 | 32.6% | $83.98 | $22,239,665 | 56.7% | | | |
| | | | | | | | |
Occupied Collateral Total | 785,116 | 96.7% | $49.92 | 39,194,113 | 100.0% | | | |
| | | | | | | | |
Vacant Space(7) | 26,681 | 3.3% | | | | | | |
| | | | | | | | |
Collateral Total | 811,797 | 100.0% | | | | | | |
| | | | | | | | | |
| (1) | Certain ratings are those of the parent company whether or not the parent guarantees the lease. |
| (2) | Annual U/W Base Rent PSF and Annual U/W Base Rent shown include (i) contractual rent bumps through February 2021 totaling $1,139,421 and (ii) percent-in-lieu totaling $1,189,076 (for three tenants including JCPenney, Charlotte Russe and Parfois). The lender’s underwriting gave separate credit totaling $735,253 for straight-line rent averaging for investment grade tenants including Best Buy, Old Navy, Michael Kors, Chase, Vans, Verizon Wireless, Haagen-Dazs, Starbucks Coffee and Aeropostale (see “Operating History and Underwritten Net Cash Flow” section below). |
| (3) | Primark has the right to terminate its lease on July 7, 2028 with 12 months’ notice provided that, as of the termination date, (i) the Primark tenant is not in default and (ii) there is not another Primark store within a defined market area set forth in the lease. |
| (4) | Lowe’s Home Centers has 5, 5-year renewal options and one 47-month renewal option. |
| (5) | Per JCPenney’s lease, the tenant’s base rent is equal to 5.0% of the tenant’s net retail sales. JCPenney’s underwritten base rent is on 5.0% of the tenant’s sales for the 12-month period ending September 30, 2019. JCPenney’s lease commenced in July 2018. |
| (6) | Includes All Seasons Marine Corp. which is a ground lease tenant and has no underwritten base rent. |
| (7) | Forever 21 currently occupies a 22,828 square foot space at the Kings Plaza Property but was underwritten as vacant. Forever 21 has been in occupancy at the Kings Plaza Property since 2010, is currently open for business and has a lease expiring in January 2020. The retailer filed for Chapter 11 bankruptcy in September 2019. |
THE INFORMATION IN THIS STRUCTURAL AND COLLATERAL TERM SHEET IS NOT COMPLETE AND MAY BE AMENDED PRIOR TO THE TIME OF SALE. THIS TERM SHEET IS NOT AN OFFER TO SELL THESE SECURITIES AND IT IS NOT A SOLICITATION OF AN OFFER TO BUY THESE SECURITIES IN ANY JURISDICTION WHERE THE OFFER OR SALE IS NOT PERMITTED.
101
Retail – Super Regional Mall | Loan #6 | Cut-off Date Balance: | | $75,000,000 |
5100 Kings Plaza | Kings Plaza | Cut-off Date LTV: | | 54.1% |
Brooklyn, NY 11234 | | U/W NCF DSCR: | | 3.06x |
| | U/W NOI Debt Yield: | | 10.7% |
The following table presents certain information relating to the historical sales at the Kings Plaza Property:
Historical Sales(1)
| 2015 (PSF) | 2016 (PSF) | 2017 (PSF) | 2018 (PSF) | TTM September 2019 Sales (Gross) | TTM September 2019 Sales (PSF) | Occupancy Cost(2) |
Lowe’s Home Center | $406 | $398 | $396 | $390 | $44,601,794 | $391 | 6.3% |
H&M | $587 | $601 | $544 | $459 | $11,101,789 | $441 | 19.2% |
Victoria’s Secret | $839 | $771 | $677 | $704 | $8,479,695 | $705 | 20.5% |
Old Navy | $454 | $435 | $445 | $412 | $7,352,403 | $403 | 19.6% |
JCPenney(3) | NAP | NAP | NAP | NAP | $14,361,075 | $159 | 9.8% |
ULTA Beauty(4) | NAP | NAP | NAP | $593 | $6,960,000 | $637 | 19.3% |
Zara(5) | NAP | NAP | NAP | NAP | $17,275,825 | $512 | 7.3% |
| | | | | | | |
Comparable In-Line Sales (<10,000 SF) | $695 | $718 | $685 | $734 | $137,113,597 | $753 | 19.0% |
| (1) | Information obtained from the borrower and underwritten rent roll. |
| (2) | Occupancy costs shown are based on each tenant’s actual base rent and reimbursements for the trailing 12-month period ending September 30, 2019. |
| (3) | JCPenney’s lease commenced in July 2018. |
| (4) | ULTA Beauty’s lease commenced in October 2017. |
| (5) | Zara’s lease commenced in September 2018. |
The following table presents certain information relating to the lease rollover schedule at the Kings Plaza Property:
Lease Expiration Schedule(1)(2)
Year Ending
December 31, | No. of Leases Expiring | Expiring NRSF | % of Total NRSF | Cumulative Expiring NRSF | Cumulative % of Total NRSF | Annual
U/W
Base Rent | % of Total Annual U/W Base Rent(3) | Annual
U/W
Base Rent
PSF(3)(4) |
MTM | 1 | 1,260 | 0.2% | 1,260 | 0.2% | $0 | 0.0% | $0.00 |
2020(5) | 40 | 50,406 | 6.2% | 51,666 | 6.4% | $3,051,598 | 7.8% | $60.54 |
2021 | 13 | 21,346 | 2.6% | 73,012 | 9.0% | $1,511,585 | 3.9% | $70.81 |
2022 | 19 | 26,624 | 3.3% | 99,636 | 12.3% | $2,485,936 | 6.3% | $93.37 |
2023 | 13 | 24,161 | 3.0% | 123,797 | 15.2% | $2,299,178 | 5.9% | $95.16 |
2024 | 11 | 43,309 | 5.3% | 167,106 | 20.6% | $3,868,632 | 9.9% | $89.33 |
2025 | 9 | 40,150 | 4.9% | 207,256 | 25.5% | $3,153,268 | 8.0% | $78.54 |
2026 | 13 | 41,603 | 5.1% | 248,859 | 30.7% | $3,894,646 | 9.9% | $93.61 |
2027 | 8 | 29,981 | 3.7% | 278,840 | 34.3% | $2,567,137 | 6.5% | $85.63 |
2028 | 10 | 219,491 | 27.0% | 498,331 | 61.4% | $6,129,071 | 15.6% | $27.92 |
2029 | 13 | 35,714 | 4.4% | 534,045 | 65.8% | $3,081,629 | 7.9% | $86.29 |
2030 | 0 | 0 | 0.0% | 534,045 | 65.8% | $0 | 0.0% | $0.00 |
Thereafter | 3 | 251,071 | 30.9% | 785,116 | 96.7% | $7,151,433 | 18.2% | $28.48 |
Vacant(6) | 0 | 26,681 | 3.3% | 811,797 | 100.0% | $0 | 0.0% | NAP |
Total/Weighted Average | 153 | 811,797 | 100.0% | | | $39,194,113 | 100.0% | $49.92 |
(1) | Information obtained from the underwritten rent roll. |
(2) | Certain tenants may have lease termination options that are exercisable prior to the originally stated expiration date of the subject lease and that are not considered in the Lease Expiration Schedule. |
(3) | Annual U/W Base Rent PSF and Annual U/W Base Rent shown include (i) contractual rent bumps through February 2021 totaling $1,139,421 and (ii) percent-in-lieu totaling $1,189,076 (for three tenants including JCPenney, Charlotte Russe and Parfois). |
(4) | Total/Weighted Average Annual U/W Base Rent and Annual U/W Base Rent PSF exclude vacant space. |
(5) | Includes All Seasons Marine Corp, which is a ground lease tenant at the Kings Plaza Property and has no underwritten base rent. |
(6) | Forever 21 currently occupies a 22,828 square foot space at the Kings Plaza Property but was underwritten as vacant. Forever 21 has been in occupancy at the Kings Plaza Property since 2010, is currently open for business and has a lease expiring in January 2020. The retailer filed for Chapter 11 bankruptcy in September 2019. |
THE INFORMATION IN THIS STRUCTURAL AND COLLATERAL TERM SHEET IS NOT COMPLETE AND MAY BE AMENDED PRIOR TO THE TIME OF SALE. THIS TERM SHEET IS NOT AN OFFER TO SELL THESE SECURITIES AND IT IS NOT A SOLICITATION OF AN OFFER TO BUY THESE SECURITIES IN ANY JURISDICTION WHERE THE OFFER OR SALE IS NOT PERMITTED.
102
Retail – Super Regional Mall | Loan #6 | Cut-off Date Balance: | | $75,000,000 |
5100 Kings Plaza | Kings Plaza | Cut-off Date LTV: | | 54.1% |
Brooklyn, NY 11234 | | U/W NCF DSCR: | | 3.06x |
| | U/W NOI Debt Yield: | | 10.7% |
The following table presents historical occupancy percentages at the Kings Plaza Property:
Historical Occupancy(1)
12/31/2015(2) | | 12/31/2016(2) | | 12/31/2017(2) | | 12/31/2018(2) | | 10/31/2019(3) | |
92.3% | | 95.2% | | 96.6% | | 97.9% | | 96.7% | |
| (1) | Occupancy includes all signed leases and specialty leasing greater than 6 months. |
| (2) | Information obtained from the borrower. |
| (3) | Information obtained from the underwritten rent roll. Current occupancy includes temporary tenants which account for 9,065 square feet at the Kings Plaza Property. |
Operating History and Underwritten Net Cash Flow. The following table presents certain information relating to the historical operating statements and underwritten net cash flow at the Kings Plaza Property:
Cash Flow Analysis
| | 2016 | | 2017 | | 2018 | | TTM 9/30/2019(1) | | U/W(1) | | %(2) | | U/W $ per SF | |
Base Rent | | $32,606,560 | | $28,991,086 | | $33,095,904 | | $36,690,592 | | $38,005,038 | | 46.9% | | $46.82 | |
Straight-Line Rent(3) | | 0 | | 0 | | 0 | | 0 | | 735,253 | | 0.9 | | 0.91 | |
Grossed Up Vacant Space | | 0 | | 0 | | 0 | | 0 | | 2,227,628 | | 2.7 | | 2.74 | |
Gross Potential Rent | | 32,606,560 | | 28,991,086 | | $33,095,904 | | 36,690,592 | | $40,967,919 | | 50.5% | | $50.47 | |
Other Reimbursements | | 29,793,723 | | 28,145,401 | | 28,424,111 | | 30,047,457 | | 30,961,099 | | 38.2 | | 38.14 | |
% in Lieu/Percentage Rent(4) | | 293,672 | | 201,320 | | 735,279 | | 1,476,667 | | 2,195,355 | | 2.7 | | 2.70 | |
Gross Potential Income | | $62,693,955 | | $57,337,807 | | $62,255,294 | | $68,214,717 | | $74,124,373 | | 91.5% | | $91.31 | |
Bad Debt | | (265,786) | | (597,346) | | (612,614) | | (338,749) | | 0 | | 0.0 | | 0.00 | |
Vacancy & Credit Loss | | 0 | | 0 | | 0 | | 0 | | (3,678,863)(5) | | (5.0) | | (4.53) | |
Temporary Specialty Leasing | | 3,312,047 | | 2,761,118 | | 2,254,340 | | 2,411,429 | | 2,411,429 | | 3.0 | | 2.97 | |
Power Plant Income | | 0 | | 0 | | 0 | | 960,000 | | 1,804,680(6) | | 2.2 | | 2.22 | |
Other Income(7) | | 6,019,024 | | 5,421,663 | | 5,787,129 | | 5,068,245 | | 6,383,568 | | 7.9 | | 7.86 | |
Effective Gross Income | | $71,759,240 | | $64,923,243 | | $69,684,148 | | $76,315,642 | | $81,045,187 | | 100.0% | | $99.83 | |
| | | | | | | | | | | | | | | |
Real Estate Taxes | | $13,832,938 | | $10,772,620 | | $12,489,143 | | $14,498,321 | | $15,242,004 | | 18.8% | | 18.78 | |
Insurance | | 329,601 | | 266,664 | | 243,524 | | 273,222 | | 320,964 | | 0.4 | | 0.40 | |
Other Operating Expenses | | 14,997,990 | | 14,447,211 | | 14,863,294 | | 14,086,756 | | 13,441,294(8) | | 16.6 | | 16.56 | |
Total Operating Expenses | | $29,160,529 | | $25,486,495 | | $27,595,961 | | $28,858,298 | | $29,004,262 | | 35.8% | | $35.73 | |
| | | | | | | | | | | | | | | |
Net Operating Income | | $42,598,711 | | $39,436,748 | | $42,088,187 | | $47,457,344 | | $52,040,925 | | 64.2% | | $64.11 | |
Replacement Reserves | | 0 | | 0 | | 0 | | 0 | | 139,559 | | 0.2 | | 0.17 | |
TI/LC | | 0 | | 0 | | 0 | | 0 | | 995,395 | | 1.2 | | 1.23 | |
Net Cash Flow | | $42,598,711 | | $39,436,748 | | $42,088,187 | | $47,457,344 | | $50,905,970 | | 62.8% | | $62.71 | |
| | | | | | | | | | | | | | | |
NOI DSCR(9) | | 2.56x | | 2.37x | | 2.53x | | 2.85x | | 3.13x | | | | | |
NCF DSCR(9) | | 2.56x | | 2.37x | | 2.53x | | 2.85x | | 3.06x | | | | | |
NOI Debt Yield(9) | | 8.7% | | 8.1% | | 8.6% | | 9.7% | | 10.7% | | | | | |
NCF Debt Yield(9) | | 8.7% | | 8.1% | | 8.6% | | 9.7% | | 10.5% | | | | | |
| (1) | Net Operating Income increased from 2018 to TTM 9/30/2019 and from TTM 9/30/2019 to U/W partially due to (i) leasing activity in 2018 representing 314,661 square feet of rentable area and approximately $9.2 million of base rent (including tenants related to the redevelopment of the former Sears space), (ii) leasing activity in 2019 representing 39,044 square feet of rentable area and approximately $2.5 million of base rent, (iii) Power Plant Income related to the power plant operated at the Kings Plaza Property that went live in July 2019, (iv) utility cost savings related to the power plant operated at the Kings Plaza Property (see “The Property” section above), (v) underwritten straight-line rent averaging for investment grade tenants ($735,253) and (vi) underwritten contractual rent bumps through February 2021 totaling $1,139,421. |
| (2) | Represents (i) percent of Gross Potential Income for Vacancy & Credit Loss and (ii) percent of Effective Gross Income for all other fields. |
| (3) | Represents straight-line rent averaging credit through the lesser of the loan term and remaining lease term for investment grade rated tenants including Best Buy, Old Navy, Michael Kors, Chase, Vans, Verizon Wireless, Haagen-Dazs, Starbucks Coffee and Aeropostale. |
| (4) | Includes percent-in-lieu totaling $1,189,076 for JCPenney, Charlotte Russe and Parfois per the tenants’ leases as well as overage percentage rent totaling $1,006,279 related to 11 tenants. |
| (5) | The underwritten economic vacancy is 5.0%. The Kings Plaza Property was 96.7% physically occupied as of October 31, 2019. |
| (6) | Power Plant Income is underwritten to the borrower sponsor’s 2020 projection. The power plant system went live in July 2019 (see “The Property” section above). |
| (7) | Other Income includes business development, storage income, ground rent income, parking income and other miscellaneous income. |
| (8) | U/W Other Operating Expenses are lower than TTM 9/30/2019 partially due to underwritten cost savings related to the power plant operated at the Kings Plaza Property, which went live in July 2019 (see “The Property” section above). |
THE INFORMATION IN THIS STRUCTURAL AND COLLATERAL TERM SHEET IS NOT COMPLETE AND MAY BE AMENDED PRIOR TO THE TIME OF SALE. THIS TERM SHEET IS NOT AN OFFER TO SELL THESE SECURITIES AND IT IS NOT A SOLICITATION OF AN OFFER TO BUY THESE SECURITIES IN ANY JURISDICTION WHERE THE OFFER OR SALE IS NOT PERMITTED.
103
Retail – Super Regional Mall | Loan #6 | Cut-off Date Balance: | | $75,000,000 |
5100 Kings Plaza | Kings Plaza | Cut-off Date LTV: | | 54.1% |
Brooklyn, NY 11234 | | U/W NCF DSCR: | | 3.06x |
| | U/W NOI Debt Yield: | | 10.7% |
| (9) | Metrics shown are based on the Kings Plaza Whole Loan. |
Appraisal. The appraiser concluded to an “as-is” Appraised Value of $900,000,000 as of October 17, 2019.
Environmental Matters. Based on a Phase I environmental report dated November 22, 2019, the environmental consultant did not identify any recognized environmental conditions at the Kings Plaza Property. The Phase I ESA consultant identified an open spill case affecting the mortgaged property, and provided an opinion of probable cost for related remedial activity with an upper range cost estimate of $500,000. The borrower has submitted a groundwater remediation plan to the New York State Department of Environmental Conservation that is currently under review. Pursuant to the terms of the loan documents, the sponsor is required to continue to perform all remediation work required to obtain final, non-appealable regulatory closure.
Market Overview and Competition. The Kings Plaza Property is situated at the intersection of Flatbush Avenue and Avenue U in Brooklyn, New York. Primary access to the Kings Plaza Property is provided via the Belt Parkway, the region’s primary north-south route, approximately 3.9 miles northeast of the Kings Plaza Property. The Kings Plaza Property is located approximately 1.4 miles southeast of Kings Highway and 10.6 miles southwest of the John F. Kennedy International Airport. Per the appraisal, the estimated 2019 population within a one-, three- and five-mile radius of the Kings Plaza Property was 51,596, 601,221 and 1,737,025, respectively; and the average household income within the same radii was approximately $117,474, $89,529, and $78,194, respectively.
The Kings Plaza Property is located in the South Brooklyn submarket of the New York retail market. According to a third party market research report, as of the fourth quarter of 2019, the New York retail market had an inventory of approximately 593.4 million square feet with a 4.0% vacancy rate and average asking rents of $42.34 per square foot. As of August 2019, the South Brooklyn submarket had an inventory of approximately 42.9 million square foot with a 3.1% vacancy rate and average asking rents of approximately $42.31 per square foot.
The following table presents certain information relating to the primary competition for the Kings Plaza Property:
Competitive Set(1) |
| Distance to Subject (mi.) | Property Type | Year Built/ Renovated | Total GLA | Total Occupancy | Sales per square foot | Anchors |
Kings Plaza | -- | Super Regional Mall | 1969/2018 | 811,797 | 96.7%(2) | $753(3) | Macy’s (non-collateral), Lowe’s Home Centers, Primark, JC Penney, Burlington, Best Buy, Forever 21, H&M, Zara |
Primary Competition | | | | | | | |
Gateway Center I & II | 6.4 | Power Center | 2001/NAP | 1,200,000 | 97.0% | $450 | BJ’s Wholesale Club, Burlington, Home Depot, JC Penney, Shoprite, Target |
Queens Center | 16.4 | Super Regional Mall | 1973/2004 | 1,172,180 | 99.0% | $1,430 | JC Penney, Macy’s |
Green Acres Mall | 14.3 | Super Regional Mall | 1956/2016 | 2,075,000 | 96.0% | $615 | JC Penney, Macy’s, Sears, Kohl’s (Vacant) |
Secondary Competition | | | | | | |
Staten Island Mall | 19.0 | Super Regional Mall | 1972/2018 | 1,700,000 | 92.0% | NAV | JC Penney, Macy’s, Primark, Sears (Vacant) |
Roosevelt Field | 28.7 | Super Regional Mall | 1956/2014 | 2,330,000 | 97.0% | $1,200 | Bloomingdales, Dick’s Sporting Goods, JC Penney, Macy’s, Neiman Marcus, Nordstrom |
(1) | Information obtained from the appraisal. |
(2) | Occupancy as of October 31, 2019. |
(3) | Represents comparable in-line sales for stores less than 10,000 square feet for the trailing 12-month period ending September 30, 2019. |
Escrows.
Real Estate Taxes – The Kings Plaza Whole Loan documents require ongoing monthly real estate tax reserves in an amount equal to one-twelfth of the real estate taxes that the lender estimates will be payable during the next 12 months upon (i) the occurrence and continuance of a Cash Trap Event Period (see “Lockbox and Cash Management” section below) and (ii) the Kings Plaza Borrower failing to deliver evidence reasonably satisfactory to the lender that all taxes have been paid in a timely manner.
Insurance – The Kings Plaza Whole Loan documents require ongoing monthly insurance reserves in an amount equal to one-twelfth of the insurance premiums that the lender estimates will be payable during the next 12 months upon (i) the occurrence and continuance of a Cash Trap Event Period and (ii) the Kings Plaza Borrower failing to deliver evidence reasonably satisfactory to the lender that all insurance premiums have been paid in a timely manner.
THE INFORMATION IN THIS STRUCTURAL AND COLLATERAL TERM SHEET IS NOT COMPLETE AND MAY BE AMENDED PRIOR TO THE TIME OF SALE. THIS TERM SHEET IS NOT AN OFFER TO SELL THESE SECURITIES AND IT IS NOT A SOLICITATION OF AN OFFER TO BUY THESE SECURITIES IN ANY JURISDICTION WHERE THE OFFER OR SALE IS NOT PERMITTED.
104
Retail – Super Regional Mall | Loan #6 | Cut-off Date Balance: | | $75,000,000 |
5100 Kings Plaza | Kings Plaza | Cut-off Date LTV: | | 54.1% |
Brooklyn, NY 11234 | | U/W NCF DSCR: | | 3.06x |
| | U/W NOI Debt Yield: | | 10.7% |
Replacement Reserve – Upon the occurrence and continuance of a Cash Trap Event Period, the Kings Plaza Whole Loan documents require ongoing monthly replacement reserve deposits equal to the gross leasable area of the Kings Plaza Property (excluding the portion that is occupied by Lowe’s Home Centers and any other tenant that is required to pay for all repairs and maintenance costs for its entire leased premises) multiplied by $0.25 and divided by 12 (subject to a cap of 24 months’ collection).
TI/LC Reserve – Upon the occurrence and continuance of a Cash Trap Event Period, the Kings Plaza Whole Loan documents require ongoing monthly TI/LC reserve deposits equal to the gross leasable area of the Kings Plaza Property multiplied by $1.50 and divided by 12 (subject to a cap of 24 months’ collection).
Ground Rent Reserve – Upon the occurrence and continuance of a Cash Trap Event Period, the Kings Plaza Whole Loan documents require ongoing monthly deposits equal to one-twelfth of the annual amounts due by the King Plaza Borrower, as applicable, under the ground leases (see “Ground Lease” section below).
Lockbox and Cash Management. The Kings Plaza Whole Loan is structured with a hard lockbox and springing cash management. The Kings Plaza Borrower was required at loan origination to deliver tenant direction letters to the tenants at the Kings Plaza Property to deposit all rents and payments directly into a lender-controlled lockbox account. In addition, Kings Plaza Energy LLC (“KPE”) is required to deposit amounts received by KPE directly into a lockbox account established and maintained by KPE. The Kings Plaza Borrower, the related managers, and KPE are required to deposit any additional funds received into the applicable lockbox account within three business days of receipt. As long as no Cash Trap Event Period (as defined below) is continuing, all funds deposited into each lockbox account are required to be transferred to or at the direction of the Kings Plaza Borrower. Upon the commencement of a Cash Trap Event Period, all funds on deposit in the lockbox accounts are required to be swept on a weekly basis and on the second business day preceding each payment date into a lender-controlled cash management account.
A “Cash Trap Event Period” will commence upon the earlier of the following:
| (i) | an event of default under the Kings Plaza Whole Loan; |
| (ii) | the commencement of a Low Debt Service Period (as defined below); or |
| (iii) | the occurrence of an event of default under the Kings Plaza Mezzanine Loan (as defined below). |
A Cash Trap Event Period will end upon the occurrence of the following:
| | with regard to clause (i) above, the cure of such event of default; |
| | with regard to clause (ii) above, a Low Debt Service Period Cure Event (as defined below); or |
| | with regard to clause (iii) above, the lender has received notice from the applicable mezzanine lender that no event of default under the Kings Plaza Mezzanine Loan is continuing. |
A “Low Debt Service Period” will commence upon the earlier of the following:
| (i) | the net cash flow DSCR (based on a hypothetical 30-year amortization term) under the Kings Plaza Whole Loan being less than 1.43x, or |
| (ii) | the combined DSCR (based on a hypothetical 30-year amortization term) under the Kings Plaza Whole Loan and the Kings Plaza Mezzanine Loan being less than 1.25x. |
A “Low Debt Service Period Cure Event” will occur upon the occurrence of the following:
| | with regard to clause (i) above, the amortizing DSCR under the Kings Plaza Whole Loan being equal to or greater than 1.48x for two consecutive calendar quarters, or |
| | with regard to clause (ii) above, the combined amortizing DSCR under the Kings Plaza Whole Loan and the Kings Plaza Mezzanine Loan being equal to or greater than 1.30x for two consecutive calendar quarters. |
Property Management. The Kings Plaza Property is managed by Macerich Property Management Company, LLC, a Delaware limited liability company and an affiliate of the Kings Plaza Borrower.
Partial Release. Provided no event of default is ongoing, the Kings Plaza Borrower has the right to transfer and obtain a release of all or a portion of the parking garage structure, provided that, among other conditions outlined in the loan documents:
| | the release parcel is transferred to an affiliate of the Kings Plaza Borrower; |
| | the Kings Plaza Borrower certifies to the lender that the release will not materially and adversely affect the use, value or revenue produced by the remaining improvements at the Kings Plaza Property; |
| | the net revenue generated by parking operations at the Kings Plaza Property is not diminished by more than a de minimis amount (other than temporary loss of net revenue during any construction); |
| | the remaining Kings Plaza Property constitutes a separate tax lot; |
| | the number of parking spaces at the Kings Plaza Property is not reduced below the number of parking spaces required to satisfy zoning requirements; |
| | the Kings Plaza Borrower certifies that the development of the release parcel will not materially impair the use of and/or the access to the garage by customers of the mall; and |
THE INFORMATION IN THIS STRUCTURAL AND COLLATERAL TERM SHEET IS NOT COMPLETE AND MAY BE AMENDED PRIOR TO THE TIME OF SALE. THIS TERM SHEET IS NOT AN OFFER TO SELL THESE SECURITIES AND IT IS NOT A SOLICITATION OF AN OFFER TO BUY THESE SECURITIES IN ANY JURISDICTION WHERE THE OFFER OR SALE IS NOT PERMITTED.
105
Retail – Super Regional Mall | Loan #6 | Cut-off Date Balance: | | $75,000,000 |
5100 Kings Plaza | Kings Plaza | Cut-off Date LTV: | | 54.1% |
Brooklyn, NY 11234 | | U/W NCF DSCR: | | 3.06x |
| | U/W NOI Debt Yield: | | 10.7% |
| | the development of the release parcel is restricted to the development for a non-retail use, provided, however, that up to 10% of the gross leasable area of the completed development may be used for retail purposes, provided, further, that none of the Kings Plaza Borrower (nor any affiliate) or Kings Plaza Guarantor shall cause or solicit any existing retail tenant at the Kings Plaza Property to lease space at the release parcel. |
Real Estate Substitution. Not permitted.
Subordinate and Mezzanine Indebtedness. Concurrently with the funding of the Kings Plaza Loan, JPMorgan, SocGen and WFB funded a mezzanine loan in the amount of $53,000,000 (the “Kings Plaza Mezzanine Loan”), which is held by Prima Capital Advisors LLC. The Kings Plaza Mezzanine Loan is secured by the pledge of the equity interest in the Kings Plaza Borrower and is coterminous with the Kings Plaza Whole Loan. The Kings Plaza Mezzanine Loan accrues interest at a rate of 6.00000% per annum and following a five-year interest only period, is fully amortized by the maturity date of January 1, 2030 pursuant to a fixed amortization schedule.
Mezzanine Debt Summary |
| Original Principal Balance | Interest Rate | Original Term (mos.) | Original Amort. Term (mos.) | Original IO Term (mos.) | Total Debt UW NCF DSCR | Total Debt UW NOI Debt Yield | Total Debt Cutoff Date LTV |
Kings Plaza Mezzanine Loan | $53,000,000 | 6.00000% | 120 | (1) | 60 | 1.73x | 9.6% | 60.0% |
(1) | Following a five-year interest only period, the Kings Plaza Mezzanine Loan will fully amortize by the maturity date of January 1, 2030 pursuant to a fixed amortization schedule. |
Ground Lease. A portion of the Kings Plaza Property, comprising the parking garage ingress/egress, the marina building (the “Marina Building”) and a portion of the ground under the parking garage covering a total of approximately 10,278 square feet, is subject to a ground lease with the City of New York. The original lease term expired on May 28, 2018 and the Kings Plaza Borrower exercised its 10-year extension option. Three 10-year, and one 9-year extension options remain with a fully-extended expiration date of May 28, 2067. The current annual ground rent payment is $122,957 through the payment date occurring in May 2028, at which point the ground rent will reset to $147,548 through the payment date in May 2038. All Seasons Marine Corp. (the “Ground Lease Subtenant”) currently subleases the Marina Building from the Kings Plaza Borrower. The initial ground sublease term expired in 2005, subsequent to which the Ground Lease Subtenant extended its sublease on a one- and two-year basis. A one-year extension through November 30, 2020 was recently executed by the Ground Lease Subtenant.
Terrorism Insurance. The Kings Plaza Whole Loan documents require that the “all risk” insurance policy required to be maintained by the borrower provides coverage for terrorism in an amount equal to the full replacement cost of the Kings Plaza Property, as well as business interruption insurance covering no less than the 24-month period following the occurrence of a casualty event, together with a 12-month extended period of indemnity (provided that if TRIPRA or a similar statute is not in effect, the Kings Plaza Borrower will not be obligated to pay terrorism insurance premiums in excess of two times the annual premium for the casualty and business interruption coverage).
THE INFORMATION IN THIS STRUCTURAL AND COLLATERAL TERM SHEET IS NOT COMPLETE AND MAY BE AMENDED PRIOR TO THE TIME OF SALE. THIS TERM SHEET IS NOT AN OFFER TO SELL THESE SECURITIES AND IT IS NOT A SOLICITATION OF AN OFFER TO BUY THESE SECURITIES IN ANY JURISDICTION WHERE THE OFFER OR SALE IS NOT PERMITTED.
106
(THIS PAGE INTENTIONALLY LEFT BLANK)
THE INFORMATION IN THIS STRUCTURAL AND COLLATERAL TERM SHEET IS NOT COMPLETE AND MAY BE AMENDED PRIOR TO THE TIME OF SALE. THIS TERM SHEET IS NOT AN OFFER TO SELL THESE SECURITIES AND IT IS NOT A SOLICITATION OF AN OFFER TO BUY THESE SECURITIES IN ANY JURISDICTION WHERE THE OFFER OR SALE IS NOT PERMITTED.
107
Office – CBD | Loan #7 | Cut-off Date Balance: | | $70,000,000 |
1412 Broadway | 1412 Broadway | Cut-off Date LTV: | | 58.3% |
New York, NY 10018 | | UW NCF DSCR: | | 1.92x |
| | UW NOI Debt Yield: | | 7.5% |
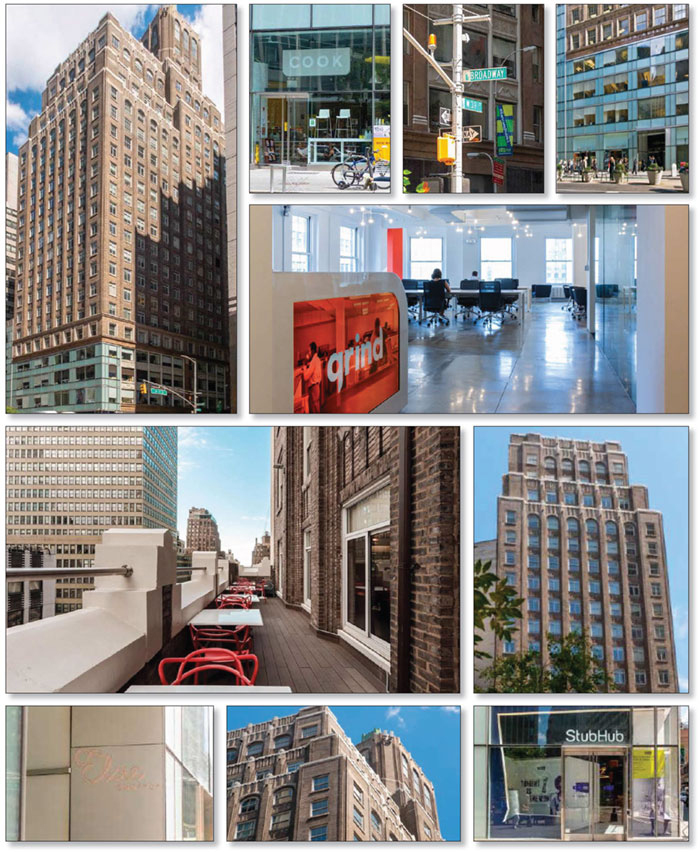
THE INFORMATION IN THIS STRUCTURAL AND COLLATERAL TERM SHEET IS NOT COMPLETE AND MAY BE AMENDED PRIOR TO THE TIME OF SALE. THIS TERM SHEET IS NOT AN OFFER TO SELL THESE SECURITIES AND IT IS NOT A SOLICITATION OF AN OFFER TO BUY THESE SECURITIES IN ANY JURISDICTION WHERE THE OFFER OR SALE IS NOT PERMITTED.
108
Office – CBD | Loan #7 | Cut-off Date Balance: | | $70,000,000 |
1412 Broadway | 1412 Broadway | Cut-off Date LTV: | | 58.3% |
New York, NY 10018 | | UW NCF DSCR: | | 1.92x |
| | UW NOI Debt Yield: | | 7.5% |
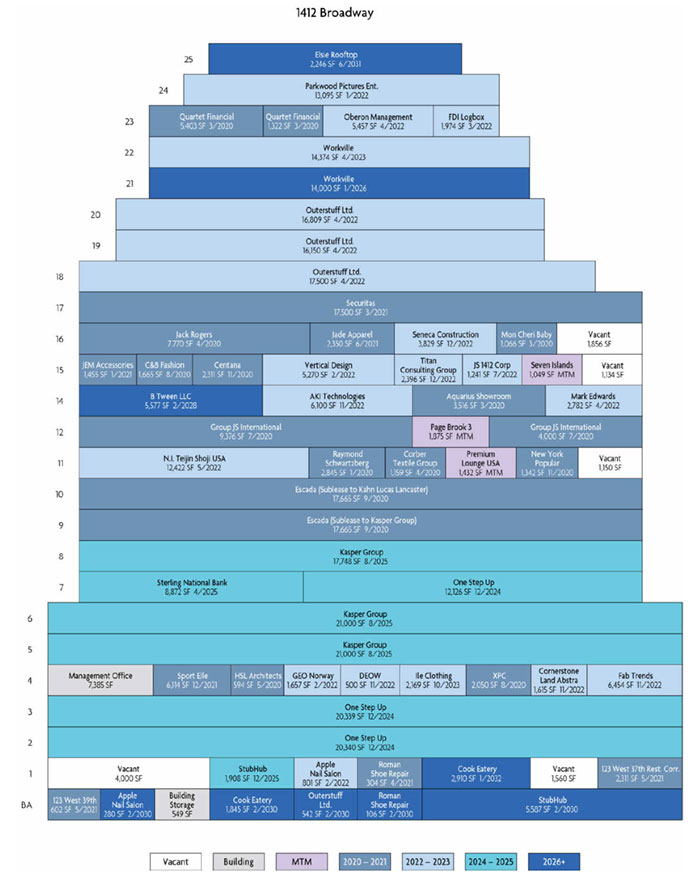
THE INFORMATION IN THIS STRUCTURAL AND COLLATERAL TERM SHEET IS NOT COMPLETE AND MAY BE AMENDED PRIOR TO THE TIME OF SALE. THIS TERM SHEET IS NOT AN OFFER TO SELL THESE SECURITIES AND IT IS NOT A SOLICITATION OF AN OFFER TO BUY THESE SECURITIES IN ANY JURISDICTION WHERE THE OFFER OR SALE IS NOT PERMITTED.
109
Office – CBD | Loan #7 | Cut-off Date Balance: | | $70,000,000 |
1412 Broadway | 1412 Broadway | Cut-off Date LTV: | | 58.3% |
New York, NY 10018 | | UW NCF DSCR: | | 1.92x |
| | UW NOI Debt Yield: | | 7.5% |

THE INFORMATION IN THIS STRUCTURAL AND COLLATERAL TERM SHEET IS NOT COMPLETE AND MAY BE AMENDED PRIOR TO THE TIME OF SALE. THIS TERM SHEET IS NOT AN OFFER TO SELL THESE SECURITIES AND IT IS NOT A SOLICITATION OF AN OFFER TO BUY THESE SECURITIES IN ANY JURISDICTION WHERE THE OFFER OR SALE IS NOT PERMITTED.
110
Mortgage Loan Information | | Mortgaged Property Information |
Mortgage Loan Seller: | Morgan Stanley Mortgage Capital Holdings LLC | | Single Asset/Portfolio: | Single Asset |
Credit Assessment (Fitch/KBRA/S&P): | NR/NR/NR | | Property Type – Subtype: | Office – CBD |
Original Principal Balance(1): | $70,000,000 | | Location: | New York, NY |
Cut-off Date Balance(1): | $70,000,000 | | Size: | 421,396 SF |
% of Initial Pool Balance: | 4.3% | | Cut-off Date Balance Per SF(1): | $498.34 |
Loan Purpose: | Refinance | | Maturity Date Balance Per SF(1): | $498.34 |
Borrower Sponsors: | Isaac Chetrit; Eli Chetrit; Raizada Vaid; Jacob Aini | | Year Built/Renovated: | 1926/2012 |
Guarantors: | Isaac Chetrit; Eli Chetrit; Raizada Vaid; Jacob Aini | | Title Vesting: | Fee |
Mortgage Rate: | 3.6100% | | Property Manager: | 1412 Management LLC (borrower-related) |
Note Date: | November 25, 2019 | | Current Occupancy (As of): | 95.2% (11/1/2019) |
Seasoning: | 2 months | | YE 2018 Occupancy: | 97.6% |
Maturity Date: | December 1, 2029 | | YE 2017 Occupancy: | 95.0% |
IO Period: | 120 months | | YE 2016 Occupancy: | NAP |
Loan Term (Original): | 120 months | | YE 2015 Occupancy: | NAP |
Amortization Term (Original): | NAP | | Appraised Value: | $360,000,000 |
Loan Amortization Type: | Interest-only, Balloon | | Appraised Value Per SF: | $854.30 |
Call Protection(2): | L(26),D(89),O(5) | | Appraisal Valuation Date: | October 1, 2019 |
Lockbox Type: | Hard/Upfront Cash Management | | Underwriting and Financial Information |
Additional Debt(1): | Yes | | TTM NOI (9/30/2019): | $16,486,637 |
Additional Debt Type (Balance)(1): | Pari Passu ($140,000,000) | | YE 2018 NOI: | $16,643,199 |
| | | YE 2017 NOI: | $14,043,950 |
| | | YE 2016 NOI: | $13,636,613 |
| | | U/W Revenues: | $24,681,662 |
| | | U/W Expenses: | $8,886,630 |
Escrows and Reserves(3) | | U/W NOI: | $15,795,032 |
| Initial | Monthly | Cap | | U/W NCF: | $14,764,726 |
Taxes | $395,861 | $395,861 | NAP | | U/W DSCR based on NOI/NCF(1): | 2.05x / 1.92x |
Insurance | $28,560 | $28,560 | NAP | | U/W Debt Yield based on NOI/NCF(1): | 7.5% / 7.0% |
Recurring Replacements | $0 | $6,991 | $251,670 | | U/W Debt Yield at Maturity based on NOI/NCF(1): | 7.5% / 7.0% |
TI/LC | $2,000,000 | Springing | $2,000,000 | | Cut-off Date LTV Ratio(1): | 58.3% |
Free Rent | $1,743,133 | $0 | NAP | | LTV Ratio at Maturity(1): | 58.3% |
| | | | | | | |
Sources and Uses |
Sources | | | | | Uses | | | |
Original Whole Loan Amount(1) | $210,000,000 | | 100.0% | | Loan Payoff | $145,311,576 | | 69.2% |
| | | | | Return of Equity | 53,746,155 | | 25.6 |
| | | | | Closing Costs | 6,774,716 | | 3.2 |
| | | | | Reserves | 4,167,553 | | 2.0 |
Total Sources | $210,000,000 | | 100.0% | | Total Uses | $210,000,000 | | 100.0% |
(1) | The 1412 Broadway Mortgage Loan (as defined below) is a part of the 1412 Broadway Whole Loan (as defined below) with an original aggregate principal balance of $210,000,000. The Cut-off Date Balance Per SF, Maturity Date Balance Per SF, U/W DSCR based on NOI/NCF, U/W Debt Yield based on NOI/NCF, U/W Debt Yield at Maturity based on NOI/NCF, Cut-off Date LTV Ratio and LTV Ratio at Maturity numbers presented above are based on the 1412 Broadway Whole Loan. |
(2) | Defeasance of the 1412 Broadway Whole Loan is permitted at any time after the earlier of (i) June 1, 2023, or (ii) two years from the closing date of the securitization that includes the last pari passu note of the 1412 Broadway Whole Loan to be securitized. The assumed lockout period of 26 payments is based on the closing date of this transaction in February 2020. |
(3) | See “Escrows” below for further discussion of reserve requirements. |
The Mortgage Loan. The mortgage loan (the “1412 Broadway Mortgage Loan”) is part of a whole loan (the “1412 Broadway Whole Loan”) evidenced by three pari passu promissory notes in the aggregate original principal amount of $210,000,000. The 1412 Broadway Whole Loan is secured by a first priority fee mortgage on a 421,396 square foot office property located in New York, New York (the “1412 Broadway Property”).
The 1412 Broadway Mortgage Loan is evidenced by the non-controlling promissory Note A-2 in the original principal amount of $70,000,000. The controlling promissory Note A-1 and the non-controlling promissory Note A-3 (collectively, the “1412 Broadway Non-Serviced Pari Passu Companion Loans”) are in the aggregate original principal amount of $140,000,000. Note A-1 has been contributed to the BANK 2019-BNK24 securitization trust. Note A-3 is currently held by Morgan Stanley Bank, N.A. and is expected to be contributed to future securitization trusts or may be otherwise transferred at any time. The 1412 Broadway Whole Loan will be serviced pursuant to the pooling and servicing agreement for the BANK 2019-BNK24 securitization trust. See “Description of the Mortgage Pool—The
THE INFORMATION IN THIS STRUCTURAL AND COLLATERAL TERM SHEET IS NOT COMPLETE AND MAY BE AMENDED PRIOR TO THE TIME OF SALE. THIS TERM SHEET IS NOT AN OFFER TO SELL THESE SECURITIES AND IT IS NOT A SOLICITATION OF AN OFFER TO BUY THESE SECURITIES IN ANY JURISDICTION WHERE THE OFFER OR SALE IS NOT PERMITTED.
111
Office – CBD | Loan #7 | Cut-off Date Balance: | | $70,000,000 |
1412 Broadway | 1412 Broadway | Cut-off Date LTV: | | 58.3% |
New York, NY 10018 | | UW NCF DSCR: | | 1.92x |
| | UW NOI Debt Yield: | | 7.5% |
Whole Loans—The Non-Serviced Pari Passu Whole Loans” and “Pooling and Servicing Agreement—Servicing of the Non-Serviced Mortgage Loans” in the Preliminary Prospectus.
Note Summary
Notes | Original Principal Balance | Cut-off Date Balance | Note Holder | Controlling Interest |
A-1 | $100,000,000 | $100,000,000 | BANK 2019-BNK24 | Yes |
A-2 | $70,000,000 | $70,000,000 | BANK 2020-BNK25 | No |
A-3 | $40,000,000 | $40,000,000 | MSBNA | No |
Total | $210,000,000 | $210,000,000 | | |
The Borrowers and the Borrower Sponsors. The borrowers are Chetrit 1412 LLC (50%), 1412-1416 RSVP DE LLC (25%) and 1412 BH DE LLC (25%), as tenants-in-common (collectively, the “1412 Broadway Borrower”), each a single purpose Delaware limited liability company with one independent director. Isaac Chetrit, Eli Chetrit, Raizada Vaid and Jacob Aini are the borrower sponsors and the non-recourse carveout guarantors. Legal counsel to the 1412 Broadway Borrower delivered a non-consolidation opinion in connection with the origination of the 1412 Broadway Whole Loan. The entities comprising the 1412 Broadway Borrower are owned by various members of the Chetrit, Aini and Vaid families. Jacob Aini has been in the real estate business for over 25 years. He has owned seven retail locations in New York and owns over 40 real estate assets comprised of partnerships and sole proprietorships. Isaac Chetrit and Eli Chetrit have acquired and currently manage a portfolio consisting of approximately one million SF of office space in Manhattan and 300,000 SF of retail and commercial space located in Brooklyn and Queens. Raizada Vaid is a businessman with numerous holdings and franchises and is the Chief Executive Officer of Fantasia World Inc., a costume jewelry company. In 2004, Mr. Vaid expanded his wholesale jewelry business to include retail stores.
The Property. The 1412 Broadway Property is a Class B, 24-story office property totaling 421,396 square feet including ground floor and roof retail space, on an approximately 0.41-acre site located in the garment district of Manhattan in New York City. The 1412 Broadway Property was built in 1926 and renovated from 2007-2012. The capital expenditure totaled approximately $14 million and included selective replacement of windows on the upper floors, installation of a new curtain wall and cooling tower, elevator modernization, and lobby, common corridor and Cycle 7 façade upgrades. Floor plans above the second floor are nearly identical and the majority of the spaces are multi-tenanted. The lobby of the 1412 Broadway Property is accessible via Broadway and a freight entrance is located on 39th Street. The grade level retail spaces have frontage along both Broadway and West 39th Street. The 1412 Broadway Property was 95.2% leased as of November 1, 2019 to 53 tenants. Other than the three largest tenants, no tenant accounts for more than 8.1% of the underwritten base rent. Three tenants, Workville, Elsie Rooftop and ILE Clothing, comprising 7.8% of net rentable area and 9.8% of underwritten rent, are affiliates of the 1412 Broadway Borrower.
Major Tenants.
Kasper Group (77,413 square feet, 18.4% of net rentable area, 19.5% of underwritten rent). Kasper Group is an apparel company offering work attire and special occasion attire for women. 59,748 square feet are leased under a direct lease with a rental rate of $56.65 PSF and an expiration date of August 1, 2025, with no renewal options remaining. Kasper Group is currently subleasing the remaining 17,665 square feet (4.2% of net rentable area and 3.4% of underwritten rent) of the 77,413 square feet from Escada at $41.68 PSF, which sublease has a lease expiration of September 1, 2020. The subleased space was underwritten to the sublease rent at $41.68 PSF (which is less than the prime lease rent for such space). The Kasper Group lease provides for free rent in July and August of each year of the lease term, which has been reserved for.
One Step Up (52,805 square feet, 12.5% of net rentable area, 10.4% of underwritten rent). One Step Up is a wholesale apparel company that designs, manufactures and distributes outerwear for women and children. The company supplies to retail stores in the United States, and also distributes globally to Canada, Mexico, Brazil, Europe, Asia and Australia. One Step Up has a lease expiration date of December 1, 2024 and has no renewal options remaining.
Outerstuff Ltd. (51,001 square feet, 12.1% of net rentable area, 11.5% of underwritten rent). Outerstuff Ltd. is a manufacturer and provider of licensed youth sports apparel for brands such as the NFL, MLB, NBA, NHL, MLS, US Olympic Committee, and more than 200 colleges and universities. Outerstuff Ltd. leases 50,459 square feet of office space and 542 square feet of basement space. Outerstuff Ltd. has a lease expiration date of April 1, 2022 for the office space and February 1, 2030 for the basement space, and has one, five-year renewal option remaining. Outerstuff Ltd. has the one-time option to terminate its lease with respect to all or any portion of the 19th floor space (16,150 square feet), provided that no event of default has occurred and is continuing under its lease, it provides notice not less than 12 months prior to termination and it pays a termination fee.
Workville (28,374 square feet, 6.7% of net rentable area, 8.1% of underwritten rent). Workville is a co-working space, offering private offices and open workspaces at the 1412 Broadway Property. Workville leases 14,000 square feet on the 21st floor and 14,374 square feet on the 22nd floor. Workville has a lease expiration date of January 1, 2026 and April 1, 2023 for the 21st floor space and 22nd floor space, respectively, and has no renewal options remaining. Workville is an affiliate of the 1412 Broadway Borrower.
Kahn Lucas Lancaster (17,665 square feet, 4.2% of net rentable area, 3.3% of underwritten rent). Kahn Lucas Lancaster is an apparel company with headquarters in New York, New York. Kahn Lucas Lancaster was established in 1889 and founded girls fashion lines Emily West, Youngland, Bloome and Sweet Heart Rose. Kahn Lucas Lancaster is subleasing all of its space from Escada at $39.98 PSF, with a sublease expiration date of September 1, 2020. The subleased space was underwritten to the sublease rent at $39.98 PSF (which is less than the prime lease rent for such space).
THE INFORMATION IN THIS STRUCTURAL AND COLLATERAL TERM SHEET IS NOT COMPLETE AND MAY BE AMENDED PRIOR TO THE TIME OF SALE. THIS TERM SHEET IS NOT AN OFFER TO SELL THESE SECURITIES AND IT IS NOT A SOLICITATION OF AN OFFER TO BUY THESE SECURITIES IN ANY JURISDICTION WHERE THE OFFER OR SALE IS NOT PERMITTED.
112
Office – CBD | Loan #7 | Cut-off Date Balance: | | $70,000,000 |
1412 Broadway | 1412 Broadway | Cut-off Date LTV: | | 58.3% |
New York, NY 10018 | | UW NCF DSCR: | | 1.92x |
| | UW NOI Debt Yield: | | 7.5% |
The following table presents certain information relating to the major tenants at the 1412 Broadway Property:
Major Tenants(1)
Tenant Name | Credit Rating
(Fitch/ Moody’s/
S&P) | Tenant
NRSF | % of
NRSF | Annual U/W
Base Rent
PSF | Annual
U/W Base
Rent | % of Total
Annual
U/W Base
Rent | Lease
Expiration
Date | Extension
Options | Termination
Option
(Y/N) |
Major Tenants | | | | | | | | |
Kasper Group(2) | NR/NR/NR | 77,413 | 18.4% | $53.23 | $4,120,949 | 19.5% | Various | N | N |
One Step Up | NR/NR/NR | 52,805 | 12.5% | $41.78 | $2,205,991 | 10.4% | 12/1/2024 | N | N |
Outerstuff Ltd.(3) | NR/NR/NR | 51,001 | 12.1% | $47.58 | $2,426,574 | 11.5% | Various | 1, 5-year | Y |
Workville(4) | NR/NR/NR | 28,374 | 6.7% | $60.56 | $1,718,353 | 8.1% | Various | N | N |
Kahn Lucas Lancaster(5) | NR/NR/NR | 17,665 | 4.2% | $39.98 | $706,200 | 3.3% | 9/1/2020 | N | N |
Total Major Tenants | 227,258 | 53.9% | $49.19 | $11,178,067 | 52.8% | | | |
| | | | | | | | |
Non-Major Tenants | 173,802 | 41.2% | $57.55 | $10,001,925 | 47.2% | | | |
| | | | | | | | |
Occupied Collateral Total | 401,060 | 95.2% | $52.81 | $21,179,992 | 100.0% | | | |
| | | | | | | | |
Vacant Space | 20,336 | 4.8% | | | | | | |
| | | | | | | | |
Collateral Total | 421,396 | 100.0% | | | | | | |
| | | | | | | | | |
| | | | | | | | | | |
| (1) | Information is based on the underwritten rent roll as of November 1, 2019. |
| (2) | Kasper Group leases 59,748 square feet under a direct lease with a rental rate of $56.65 PSF and an expiration date of August 1, 2025. Kasper Group is currently subleasing the remaining 17,665 square feet (4.2% of net rentable area and 3.5% of underwritten rent) of the 77,413 square feet from Escada at a rental rate of $41.68 PSF, with a sublease expiration of September 1, 2020. The $53.23 Annual UW Rent PSF is the blended rate (i.e. it reflects the direct lease rate of $56.65 PSF for the direct leased space and the sublease rate of $41.68 PSF for the subleased space). The subleased space was underwritten to the sublease rent at $41.68 PSF (which is less than the prime lease rent for such space). The Kasper Group lease provides for free rent in July and August of each year of the lease term, which has been reserved for. |
| (3) | Outerstuff, Ltd. leases 50,459 square feet of office space, which has a lease expiration date of April 1, 2022 and 542 square feet of basement space, which has a lease expiration of February 1, 2030. Outerstuff, Ltd. has the one-time option to terminate its lease with respect to all or any portion of the 19th floor space (16,150 SF), provided that no event of default has occurred and is continuing under its lease, it provides notice not less than 12 months prior to termination and it pays a termination fee. |
| (4) | Workville leases 14,000 square feet on the 21st floor and 14,374 square feet on the 22nd floor. Workville has a lease expiration date of January 1, 2026 and April 1, 2023 for the 21st floor space and 22nd floor space, respectively. Workville is an affiliate of the 1412 Broadway Borrower. |
| (5) | Kahn Lucas Lancaster is subleasing all of its space from Escada at $39.98 PSF. The subleased space was underwritten to the sublease rent at $39.98 PSF (which is less than the prime lease rent for such space). |
The following table presents certain information relating to the lease rollover schedule at the 1412 Broadway Property:
Lease Expiration Schedule(1)(2)
Year Ending
December 31, | No. of
Leases
Expiring | Expiring
NRSF | % of
Total
NRSF | Cumulative
Expiring
NRSF | Cumulative
% of Total
NRSF | Annual
U/W
Base Rent | % of Total
Annual
U/W Base
Rent | Annual
U/W
Base Rent
PSF |
MTM | 3 | 4,356 | 1.0% | 4,356 | 1.0% | $199,107 | 0.9% | $45.71 |
2020 | 11 | 69,113 | 16.4% | 73,469 | 17.4% | $3,390,206 | 16.0% | $49.05 |
2021 | 6 | 30,636 | 7.3% | 104,105 | 24.7% | $1,768,401 | 8.3% | $57.72 |
2022 | 16 | 116,052 | 27.5% | 220,157 | 52.2% | $5,761,295 | 27.2% | $49.64 |
2023 | 2 | 16,543 | 3.9% | 236,700 | 56.2% | $908,945 | 4.3% | $54.94 |
2024 | 1 | 52,805 | 12.5% | 289,505 | 68.7% | $2,205,991 | 10.4% | $41.78 |
2025 | 3 | 70,528 | 16.7% | 360,033 | 85.4% | $4,720,926 | 22.3% | $66.94 |
2026 | 1 | 14,000 | 3.3% | 374,033 | 88.8% | $901,460 | 4.3% | $64.39 |
2027 | 0 | 0 | 0.0% | 374,033 | 88.8% | $0 | 0.0% | $0.00 |
2028 | 1 | 5,577 | 1.3% | 379,610 | 90.1% | $315,937 | 1.5% | $56.65 |
2029 | 0 | 0 | 0.0% | 379,610 | 90.1% | $0 | 0.0% | $0.00 |
2030 | 6 | 8,909 | 2.1% | 388,519 | 92.2% | $0 | 0.0% | $0.00 |
Thereafter | 3 | 12,541 | 3.0% | 401,060 | 95.2% | $1,007,724 | 4.8% | $80.35 |
Vacant | 0 | 20,336 | 4.8% | 421,396 | 100.0% | $0 | 0.0% | $0.00 |
Total/Weighted Average(3) | 53 | 421,396 | 100.0% | | | $21,179,992 | 100.0% | $52.81 |
(1) | Information is based on the underwritten rent roll as of November 1, 2019. |
(2) | Certain tenants may have lease termination options that are exercisable prior to the stated expiration date of the subject lease or leases that are not considered in the lease rollover schedule. |
(3) | Total/Wtd. Avg. U/W Base Rent PSF excludes vacant space. |
THE INFORMATION IN THIS STRUCTURAL AND COLLATERAL TERM SHEET IS NOT COMPLETE AND MAY BE AMENDED PRIOR TO THE TIME OF SALE. THIS TERM SHEET IS NOT AN OFFER TO SELL THESE SECURITIES AND IT IS NOT A SOLICITATION OF AN OFFER TO BUY THESE SECURITIES IN ANY JURISDICTION WHERE THE OFFER OR SALE IS NOT PERMITTED.
113
Office – CBD | Loan #7 | Cut-off Date Balance: | | $70,000,000 |
1412 Broadway | 1412 Broadway | Cut-off Date LTV: | | 58.3% |
New York, NY 10018 | | UW NCF DSCR: | | 1.92x |
| | UW NOI Debt Yield: | | 7.5% |
The following table presents historical occupancy percentages at the 1412 Broadway Property:
Historical Occupancy
2017(1) | | 2018(1) | | 11/1/2019(2) |
95.0% | | 97.6% | | 97.7% |
(1) | Information obtained from the Borrower. |
(2) | Information based on the underwritten rent roll. |
Operating History and Underwritten Net Cash Flow. The following table presents certain information relating to the historical operating performance and underwritten net cash flow at the 1412 Broadway Property:
Cash Flow Analysis
| | 2016 | | 2017 | | 2018 | | TTM 9/30/2019 | | U/W | | %(1) | | U/W $
per SF | |
Base Rent | | $19,153,488 | | $20,076,624 | | $22,093,323 | | $21,904,363 | | $24,061,997 | | 87.0% | | $57.10 | |
Rent Steps | | 0 | | 0 | | 0 | | 0 | | 647,877 | | 2.3 | | 1.54 | |
Straight Line Rent | | 0 | | 0 | | 0 | | 0 | | 43,358 | | 0.2 | | 0.10 | |
Gross Potential Rent | | $19,153,488 | | $20,076,624 | | $22,093,323 | | $21,904,363 | | $24,753,232 | | 89.5% | | $58.74 | |
Reimbursements(2) | | 1,655,765 | | 1,772,790 | | 2,381,564 | | 2,586,311 | | 2,870,065 | | 10.4 | | 6.81 | |
Other Income | | 38,983 | | 12,489 | | 26,335 | | 29,605 | | 35,719 | | 0.1 | | 0.08 | |
Net Rental Income | | $20,848,236 | | $21,861,903 | | $24,501,222 | | $24,520,279 | | $27,659,016 | | 100.0% | | $65.64 | |
Vacancy | | 0 | | 0 | | 0 | | 0 | | (2,977,354) | | (12.0) | | (7.07) | |
Effective Gross Income | | $20,848,236 | | $21,861,903 | | $24,501,222 | | $24,520,279 | | $24,681,662 | | 89.2% | | $58.57 | |
| | | | | | | | | | | | | | | |
Real Estate Taxes | | 4,024,080 | | 4,357,119 | | 4,639,521 | | 4,734,101 | | 4,822,876 | | 19.5% | | 11.44 | |
Insurance | | 281,526 | | 281,531 | | 281,532 | | 282,405 | | 365,064 | | 1.5 | | 0.87 | |
Management Fee | | 0 | | 0 | | 0 | | 0 | | 740,450 | | 3.0 | | 1.76 | |
Other Operating Expenses(3) | | 2,906,016 | | 3,179,304 | | 2,936,969 | | 3,017,136 | | 2,958,240 | | 12.0 | | 7.02 | |
Total Operating Expenses | | $7,211,622 | | $7,817,954 | | $7,858,022 | | $8,033,642 | | $8,886,630 | | 36.0% | | $21.09 | |
| | | | | | | | | | | | | | | |
Net Operating Income | | $13,636,613 | | $14,043,950 | | $16,643,199 | | $16,486,637 | | $15,795,032 | | 64.0% | | $37.48 | |
Capital Reserves | | 0 | | 0 | | 0 | | 0 | | 84,279 | | 0.3 | | 0.20 | |
Tenant Improvements | | 0 | | 0 | | 0 | | 0 | | 495,390 | | 2.0 | | 1.18 | |
Leasing Commissions | | 0 | | 0 | | 0 | | 0 | | 650,637 | | 2.6 | | 1.54 | |
Upfront TI/LC Reserve | | 0 | | 0 | | 0 | | 0 | | (200,000) | | (0.8) | | (0.47) | |
Net Cash Flow | | $13,636,613 | | $14,043,950 | | $16,643,199 | | $16,486,637 | | $14,764,726 | | 59.8% | | $35.04 | |
| | | | | | | | | | | | | | | |
NOI DSCR(4) | | 1.77x | | 1.83x | | 2.17x | | 2.14x | | 2.05x | | | | | |
NCF DSCR(4) | | 1.77x | | 1.83x | | 2.17x | | 2.14x | | 1.92x | | | | | |
NOI Debt Yield(4) | | 6.5% | | 6.7% | | 7.9% | | 7.9% | | 7.5% | | | | | |
NCF Debt Yield(4) | | 6.5% | | 6.7% | | 7.9% | | 7.9% | | 7.0% | | | | | |
(1) | Represents (i) percent of Net Rental Income for all revenue fields, (ii) percent of Gross Potential Rent for Vacancy, and (iii) percent of Effective Gross Income for all other fields. |
(2) | The increase in U/W Total Recoveries from TTM 9/30/2019 is due to the inclusion of utility reimbursements. |
(3) | The increase in UW Other Expenses from TTM 9/30/2019 is due to the inclusion of a 3% management fee, equal to $740,450. The 1412 Broadway Property is managed by an affiliate of the 1412 Broadway Borrower and historical operating statements did not include a management fee. |
(4) | The debt service coverage ratios and debt yields shown are based on the 1412 Broadway Whole Loan. |
Appraisal. The appraiser concluded to an “as-is” value as of October 1, 2019 of $360,000,000
Environmental Matters. According to the Phase I environmental site assessment dated October 22, 2019, there was no evidence of any recognized environmental conditions at the 1412 Broadway Property.
Market Overview. The 1412 Broadway Property is located in New York, New York, approximately three blocks from the Times Square subway station, which has 11 subway lines, and also approximately one block from the Bryant Park subway station, which has an additional five subway lines. Furthermore, the 1412 Broadway Property is located in close proximity to Penn Station, Port Authority Bus Terminal, and Grand Central Terminal, providing access for both commuters and local residents. The 1412 Broadway Property is located in the Times Square South office submarket of the Midtown office market. According to the appraisal, as of the second quarter of 2019, the vacancy rate in the Times Square South office submarket was approximately 5.1%, with average asking rents of $57.70 PSF and inventory of approximately 35.5 million square feet. According to the appraisal, as of the second quarter of 2019, the Midtown
THE INFORMATION IN THIS STRUCTURAL AND COLLATERAL TERM SHEET IS NOT COMPLETE AND MAY BE AMENDED PRIOR TO THE TIME OF SALE. THIS TERM SHEET IS NOT AN OFFER TO SELL THESE SECURITIES AND IT IS NOT A SOLICITATION OF AN OFFER TO BUY THESE SECURITIES IN ANY JURISDICTION WHERE THE OFFER OR SALE IS NOT PERMITTED.
114
Office – CBD | Loan #7 | Cut-off Date Balance: | | $70,000,000 |
1412 Broadway | 1412 Broadway | Cut-off Date LTV: | | 58.3% |
New York, NY 10018 | | UW NCF DSCR: | | 1.92x |
| | UW NOI Debt Yield: | | 7.5% |
office market has average asking rents of $82.27 PSF and inventory of approximately 283 million square feet. According to the appraisal, the 2018 population within a half-, one- and one and a half-mile radius of the 1412 Broadway Property was 22,460, 199,380 and 380,361, respectively. The 2018 average household income within the same half-, one- and one and a half-mile radius was $165,220, $169,183 and $180,374, respectively.
The following table presents certain information relating to the appraisal’s market rent conclusion for the 1412 Broadway Property:
Market Rent Summary
| Office 2-9 Space | Office 10-19 Space | Office 20-24 Space | Broadway Retail Space | Side Street/Roof Space |
Market Rent (PSF) | $54.00 | $56.00 | $58.00 | $375.00 | $125.00 |
Lease Term (Months) | 120 | 120 | 120 | 120 | 120 |
Lease Type (Reimbursements) | Modified Gross | Modified Gross | Modified Gross | Modified Gross | Modified Gross |
Rent Increase Projection | 3.0% per annum | 3.0% per annum | 3.0% per annum | 3.0% per annum | 3.0% per annum |
The following table presents comparable office leases with respect to the 1412 Broadway Property:
Comparable Office Lease Summary
Property/Location | Year Built | SF | Tenant Name | Size (SF) | Lease Date | Lease Term (Mos.) | Rent PSF | Lease Type |
1430 Broadway New York, NY | 1955 | 364,000 | Life Adjustment | 4,236 | 8/1/2019 | 85 | $53.25 | Modified Gross |
1407 Broadway New York, NY | 1950 | 1,118,834 | Amore Pacific | 24,714 | 6/1/2019 | 125 | $56.85 | Modified Gross |
1359 Broadway New York, NY | 1924 | - | NYS Energy | 4,618 | 8/1/2019 | 114 | $60.00 | Modified Gross |
1370 Broadway New York, NY | 1922 | 244,883 | Collection ’18 | 16,790 | 7/1/2019 | 91 | $64.50 | Modified Gross |
498 Seventh Avenue New York, NY | 1920 | 960,000 | Tetra Tech | 59,798 | 4/1/2019 | 154 | $64.50 | Modified Gross |
25 West 39th Street New York, NY | 1907 | 185,384 | The Wing | 12,252 | 3/1/2019 | 130 | $58.00 | Modified Gross |
1400 Broadway New York, NY | 1930 | 929,405 | Signature Bank | 20,961 | 11/1/2018 | 180 | $62.00 | Modified Gross |
500 Seventh Avenue New York, NY | 1922 | 609,000 | WeWork | 255,610 | 3/1/2018 | 178 | $68.00 | Modified Gross |
Source: Appraisal.
Escrows.
Real Estate Taxes – The 1412 Broadway Whole Loan documents provide for an upfront reserve of approximately $395,861 for real estate taxes and ongoing monthly reserves for real estate taxes in an amount equal to 1/12 of the real estate taxes that the lender estimates will be payable during the next twelve months (initially $395,861).
Insurance – The 1412 Broadway Whole Loan documents provide for an upfront reserve of approximately $28,560 for insurance premiums, and ongoing monthly reserve deposits for insurance premiums in an amount equal to 1/12 of the insurance premiums that the lender estimates will be payable for the renewal of coverage upon the expiration of the insurance policies (initially $28,560); provided that such monthly deposits are not required so long as (i) no event of default is continuing, (ii) the insurance coverage for the 1412 Broadway Property is included in a blanket policy approved by the lender in its reasonable discretion, and (iii) the 1412 Broadway Borrower provides the lender with evidence of payment of the insurance premiums and renewals of the insurance policies, no later than ten days prior to the expiration of the current policy (initially $28,560).
Recurring Replacements – The 1412 Broadway Whole Loan documents provide for monthly deposits of approximately $6,991 into a replacement reserve; provided that such monthly deposits are not required on any monthly payment date on which the amount then held in such reserve is equal to or greater than $251,670.
TI/LC Reserve – The 1412 Broadway Whole Loan documents provide for an upfront reserve of $2,000,000 for future tenant improvements and leasing commissions. In addition, if at any time the amount in such reserve (including the initial upfront deposit) is less than $2,000,000, monthly deposits of approximately $52,431 are required to be made into such reserve until the amount in such reserve equals $2,000,000.
Free Rent Reserve – The 1412 Broadway Whole Loan documents provide for an upfront reserve of approximately $1,743,133 for outstanding free rent under the Kasper Group lease.
THE INFORMATION IN THIS STRUCTURAL AND COLLATERAL TERM SHEET IS NOT COMPLETE AND MAY BE AMENDED PRIOR TO THE TIME OF SALE. THIS TERM SHEET IS NOT AN OFFER TO SELL THESE SECURITIES AND IT IS NOT A SOLICITATION OF AN OFFER TO BUY THESE SECURITIES IN ANY JURISDICTION WHERE THE OFFER OR SALE IS NOT PERMITTED.
115
Office – CBD | Loan #7 | Cut-off Date Balance: | | $70,000,000 |
1412 Broadway | 1412 Broadway | Cut-off Date LTV: | | 58.3% |
New York, NY 10018 | | UW NCF DSCR: | | 1.92x |
| | UW NOI Debt Yield: | | 7.5% |
Lockbox and Cash Management. The 1412 Broadway Whole Loan documents require a hard lockbox and in place cash management. The 1412 Broadway Whole Loan documents require the 1412 Broadway Borrower to establish a lockbox account and to direct tenants to pay rents directly into the lockbox account, and, if notwithstanding such direction, the 1412 Broadway Borrower or property manager receives any rents, to deposit or cause to be deposited such rents into the lockbox account within three business days of receipt. All funds in the lockbox account are required to be deposited on each business day into a lender controlled cash management account. So long as no event of default is continuing under the 1412 Broadway Whole Loan, funds in the cash management account are required to be applied (i) to make deposits into the tax and insurance reserves (if any), as described above under “Escrows and Reserves”, (ii) to pay debt service on the 1412 Broadway Whole Loan, (iii) to make deposits into the recurring replacements reserve and TI/LC reserve, as described above under “Escrows and Reserves,” (iv) if a Cash Sweep Event Period (as defined below) is continuing, to pay operating expenses set forth in the annual budget (which is required to be reasonably approved by the lender) and extraordinary operating or capital expenses reasonably approved by the lender, and (v) to pay any remainder into an excess cash flow account, to be held by the lender as additional security for the 1412 Broadway Whole Loan during the continuance of the Cash Sweep Event Period, or if no Cash Sweep Event Period is continuing, to be disbursed to an account designated by the 1412 Broadway Borrower.
A “Cash Sweep Event Period” means a period:
| (a) | commencing upon an event of default under the 1412 Broadway Whole Loan and ending upon the cure (if applicable) of such event of default; or |
| (b) | commencing upon the debt yield of the 1412 Broadway Whole Loan being less than 6.25% at the end of any calendar quarter and ending upon the date that the debt yield has been equal to or greater than 6.50% for two consecutive calendar quarters. |
Property Management. The 1412 Broadway Property is managed by 1412 Management LLC, an affiliate of the 1412 Broadway Borrowers.
Partial Release. Not permitted.
Real Estate Substitution. Not permitted.
Subordinate and Mezzanine Indebtedness. Not permitted.
Ground Lease. None.
Letter of Credit. None.
Right of First Refusal. None.
Terrorism Insurance. The 1412 Broadway Whole Loan documents require that the “all risk” insurance policy required to be maintained by the 1412 Broadway Borrower provide coverage for terrorism in an amount equal to the full replacement cost of the 1412 Broadway Property, and business interruption insurance covering no less than the 18-month period following the occurrence of a casualty event, together with a six-month extended period of indemnity. Notwithstanding the foregoing, for so long as the Terrorism Risk Insurance Act of 2002, as extended and modified by the Terrorism Risk Insurance Program Reauthorization Act of 2015 (“TRIPRA”) is in effect (including any extensions thereof or if another federal governmental program is in effect relating to “acts of terrorism” which provides substantially similar protections as TRIPRA), and covers both domestic and foreign acts of terrorism, the lender is required to accept terrorism insurance that insures against “covered acts” as defined by TRIPRA (or such other program). See “Risk Factors—Risks Relating to the Mortgage Loans—Terrorism Insurance May Not Be Available for All Mortgaged Properties” in the Preliminary Prospectus.
THE INFORMATION IN THIS STRUCTURAL AND COLLATERAL TERM SHEET IS NOT COMPLETE AND MAY BE AMENDED PRIOR TO THE TIME OF SALE. THIS TERM SHEET IS NOT AN OFFER TO SELL THESE SECURITIES AND IT IS NOT A SOLICITATION OF AN OFFER TO BUY THESE SECURITIES IN ANY JURISDICTION WHERE THE OFFER OR SALE IS NOT PERMITTED.
116
(THIS PAGE INTENTIONALLY LEFT BLANK)
THE INFORMATION IN THIS STRUCTURAL AND COLLATERAL TERM SHEET IS NOT COMPLETE AND MAY BE AMENDED PRIOR TO THE TIME OF SALE. THIS TERM SHEET IS NOT AN OFFER TO SELL THESE SECURITIES AND IT IS NOT A SOLICITATION OF AN OFFER TO BUY THESE SECURITIES IN ANY JURISDICTION WHERE THE OFFER OR SALE IS NOT PERMITTED.
117
| Multifamily – Garden | Loan #8 | Cut-off Date Balance: | | $68,000,000 |
| Various | Houston-Austin Multifamily Portfolio | Cut-off Date LTV: | | 67.9% |
| Various, TX | | U/W NCF DSCR: | | 1.91x |
| | | U/W NOI Debt Yield: | | 7.6% |
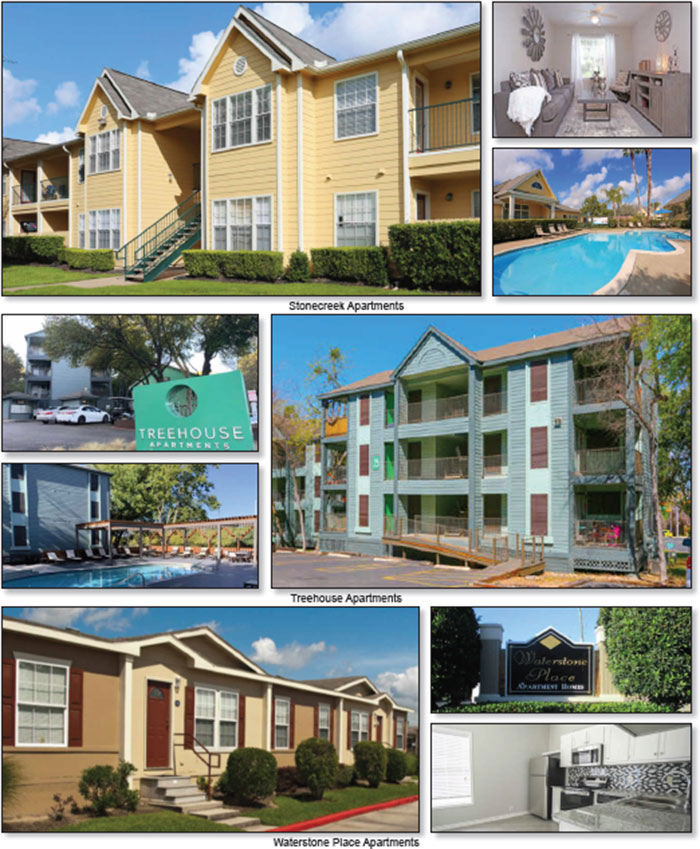
THE INFORMATION IN THIS STRUCTURAL AND COLLATERAL TERM SHEET IS NOT COMPLETE AND MAY BE AMENDED PRIOR TO THE TIME OF SALE. THIS TERM SHEET IS NOT AN OFFER TO SELL THESE SECURITIES AND IT IS NOT A SOLICITATION OF AN OFFER TO BUY THESE SECURITIES IN ANY JURISDICTION WHERE THE OFFER OR SALE IS NOT PERMITTED.
118
| Multifamily – Garden | Loan #8 | Cut-off Date Balance: | | $68,000,000 |
| Various | Houston-Austin Multifamily Portfolio | Cut-off Date LTV: | | 67.9% |
| Various, TX | | U/W NCF DSCR: | | 1.91x |
| | | U/W NOI Debt Yield: | | 7.6% |
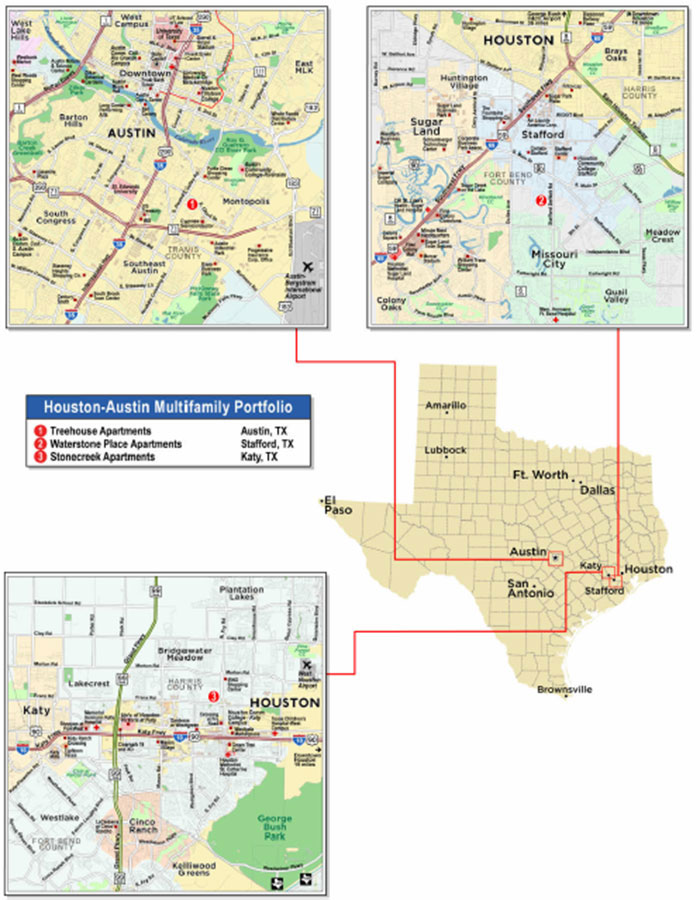
THE INFORMATION IN THIS STRUCTURAL AND COLLATERAL TERM SHEET IS NOT COMPLETE AND MAY BE AMENDED PRIOR TO THE TIME OF SALE. THIS TERM SHEET IS NOT AN OFFER TO SELL THESE SECURITIES AND IT IS NOT A SOLICITATION OF AN OFFER TO BUY THESE SECURITIES IN ANY JURISDICTION WHERE THE OFFER OR SALE IS NOT PERMITTED.
119
| No.8 – Houston-Austin Multifamily Portfolio |
| |
| Mortgage Loan Information | | Mortgaged Property Information |
| Mortgage Loan Seller: | Morgan Stanley Mortgage Capital Holdings LLC | | Single Asset/Portfolio: | Portfolio |
| Credit Assessment (Fitch/KBRA/S&P): | NR/NR/NR | | Property Type – Subtype: | Multifamily – Garden |
| Original Principal Balance: | $68,000,000 | | Location: | Various, TX |
| Cut-off Date Balance: | $68,000,000 | | Size: | 671 Units |
| % of Initial Pool Balance: | 4.2% | | Cut-off Date Balance Per Unit: | $101,341 |
| Loan Purpose: | Refinance | | Maturity Date Balance Per Unit: | $101,341 |
| Borrower Sponsor: | Nitya Capital, LLC | | Year Built/Renovated: | Various/NAP |
| Guarantor: | Swapnil Agarwal | | Title Vesting: | Fee |
| Mortgage Rate: | 3.8000% | | Property Manager: | Karya Property Management, LLC (borrower-related) |
| Note Date: | December 16, 2019 | | Current Occupancy (As of): | 94.5% (11/21/2019) |
| Seasoning: | 1 month | | YE 2018 Occupancy: | 94.7% |
| Maturity Date: | January 1, 2030 | | YE 2017 Occupancy: | 94.8% |
| IO Period: | 120 months | | YE 2016 Occupancy: | NAP |
| Loan Term (Original): | 120 months | | YE 2015 Occupancy: | NAP |
| Amortization Term (Original): | NAP | | As-Is Appraised Value: | $100,100,000 |
| Loan Amortization Type: | Interest-only, Balloon | | As-Is Appraised Value Per Unit: | $149,180 |
| Call Protection: | L(23),GRTR 1% or YM(92),O(5) | | As-Is Appraisal Valuation Date: | Various |
| Lockbox Type: | Springing | | | |
| Additional Debt: | Yes | | Underwriting and Financial Information |
| Additional Debt Type (Balance): | Future Mezzanine | | TTM NOI (10/31/2019): | $4,789,111 |
| | | | YE 2018 NOI(1): | $4,624,405 |
| | | | YE 2017 NOI: | $4,892,142 |
| | | | YE 2016 NOI: | NAP |
| | | | U/W Revenues: | $9,372,122 |
| | | | U/W Expenses: | $4,188,746 |
| Escrows and Reserves(2) | | U/W NOI: | $5,183,377 |
| | Initial | Monthly | Cap | | U/W NCF: | $5,008,611 |
| Taxes | $123,467 | $123,467 | NAP | | U/W DSCR based on NOI/NCF: | 1.98x / 1.91x |
| Insurance | $286,096 | $35,762 | NAP | | U/W Debt Yield based on NOI/NCF: | 7.6% / 7.4% |
| Deferred Maintenance | $439,890 | $0 | NAP | | U/W Debt Yield at Maturity based on NOI/NCF: | 7.6% / 7.4% |
| Replacement Reserves | $0 | $14,564 | NAP | | Cut-off Date LTV Ratio: | 67.9% |
| Upfront Capital Improvements | $1,020,276 | $0 | NAP | | LTV Ratio at Maturity: | 67.9% |
| | | | | | | |
| | | | | | | | |
| Sources and Uses |
| Sources | | | | Uses | | |
| Original loan amount | $68,000,000 | 98.9% | | Loan Payoff | $64,579,926 | 93.9% |
| Borrower equity | 745,699 | 1.1 | | Closing Costs | 2,296,044 | 3.3 |
| | | | | Reserves | 1,869,729 | 2.7 |
| Total Sources | $68,745,699 | 100.0% | | Total Uses: | $68,745,699 | 100.0% |
| (1) | YE 2018 NOI represents annualized statements from May 2018 to December 2018. |
| (2) | See “Escrows” below for further discussion of reserve requirements. |
The Mortgage Loan. The mortgage loan (the “Houston-Austin Multifamily Portfolio Mortgage Loan”) is evidenced by one promissory note in the original principal balance of $68,000,000. The Houston-Austin Multifamily Portfolio Mortgage Loan is secured by a first priority fee mortgage encumbering three multifamily properties located in various cities in Texas (the “Houston-Austin Multifamily Portfolio” or “Properties”).
The Borrowers and the Borrower Sponsors. The borrowers are Stonecreek Apartments, LLC, Treehouse Apartments Austin, LLC and Waterstone Place, LLC (collectively, the “Houston-Austin Multifamily Portfolio Borrowers”), each of which is a single purpose Delaware limited liability company with one independent director. Legal counsel to the Houston-Austin Multifamily Portfolio Borrowers delivered a non-consolidation opinion in connection with the origination of the Houston Austin Multifamily Portfolio Mortgage Loan. The borrower sponsor is Nitya Capital, LLC and the non-recourse carve-out guarantor is Swapnil Agarwal, the founder and managing principal of Nitya Capital, LLC. Nitya Capital, LLC is a privately held real estate investment firm that focuses on the acquisition and management of multifamily properties. Since inception, Nitya Capital, LLC has acquired over 16,300 multifamily units and over 400,000 square feet of commercial office space throughout Texas.
THE INFORMATION IN THIS STRUCTURAL AND COLLATERAL TERM SHEET IS NOT COMPLETE AND MAY BE AMENDED PRIOR TO THE TIME OF SALE. THIS TERM SHEET IS NOT AN OFFER TO SELL THESE SECURITIES AND IT IS NOT A SOLICITATION OF AN OFFER TO BUY THESE SECURITIES IN ANY JURISDICTION WHERE THE OFFER OR SALE IS NOT PERMITTED.
120
| Multifamily – Garden | Loan #8 | Cut-off Date Balance: | | $68,000,000 |
| Various | Houston-Austin Multifamily Portfolio | Cut-off Date LTV: | | 67.9% |
| Various, TX | | U/W NCF DSCR: | | 1.91x |
| | | U/W NOI Debt Yield: | | 7.6% |
The Properties. The Houston-Austin Multifamily Portfolio is comprised of three multifamily garden properties totaling 671 units located in various cities in Texas. The Properties were constructed between 1985 and 2001. As of November 21, 2019, the Houston-Austin Multifamily Portfolio was 94.5% leased. Since acquiring the Houston-Austin Multifamily Portfolio, according to the borrower sponsor, they have invested approximately $3.6 million in capital improvements across the Properties. According to the borrower sponsor, the Houston-Austin Multifamily Portfolio Borrowers plan to invest an additional $1.02 million ($1,521 per unit) in interior and exterior capital improvements, which amount was escrowed at loan origination.
The following table presents detailed information with respect to each of the Properties included in the Houston-Austin Multifamily Portfolio:
Houston-Austin Multifamily Portfolio Properties Summary
| Building | Occ. %(1) | Units(1) | % of Total Units | Appraised Value | Allocated Loan Amount (“ALA”) | % of ALA | UW NOI | % of UW NOI |
| Treehouse Apartments | 98.0% | 296 | 44.1% | $42,000,000 | $28,700,000 | 42.2% | $2,166,788 | 41.8% |
| Waterstone Place Apartments | 88.7% | 168 | 25.0% | $32,000,000 | $21,100,000 | 31.0% | $1,577,119 | 30.4% |
| Stonecreek Apartments | 94.2% | 207 | 30.8% | $26,100,000 | $18,200,000 | 26.8% | $1,439,469 | 27.8% |
| Total/Wtd. Avg. | 94.5% | 671 | 100.0% | $100,100,000 | $68,000,000 | 100.0% | $5,183,377 | 100.0% |
| (1) | Based on the borrower rent roll dated November 21, 2019. |
The Properties.
Treehouse Apartments
The Treehouse Apartments Property is a three story, 296-unit garden-style apartment complex located in Austin, Texas. The Treehouse Apartments Property was built in 1985 and is situated on 12.5 acres with 441 parking spaces (approximately 1.5 spaces per unit). The unit mix comprises studio, one-, and two-bedroom floorplans, a net rentable area of 207,548 square feet and average unit size of 701 square feet. As of November 21, 2019, the Treehouse Apartments Property was 98.0% occupied, with average in place rent of $1,133/unit ($1.62 PSF). Since acquiring the Treehouse Apartments Property, according to the borrower sponsor, they have invested $718,487 in capital improvements at approximately 62.2% of the units at the Treehouse Apartments Property. Renovated units are leased out at a slightly higher rent. Common amenities at the Treehouse Apartments Property include a swimming pool, leasing office, fitness center, dog park, moderate landscaping and two common area laundry facilities. Unit amenities include standard appliances package, walk-in closet(s), a pantry and a ceiling fan. Most units feature upgraded appliances (stainless/black), flooring, quartz countertops, new fixtures, faucets, and kitchen backsplash, with updated fixtures and faucets in the bathroom.
Waterstone Place Apartments
The Waterstone Place Apartments Property is a one story, 168-unit garden-style apartment complex located in Stafford, Texas. The Waterstone Place Apartments Property was built in 2001 and is situated on 18.7 acres with 432 parking spaces (approximately 2.6 spaces per unit). The unit mix comprises three-bedroom floorplans, a net rentable area of 181,440 square feet and average unit size of 1,080 square feet. As of November 21, 2019, the Waterstone Place Apartments Property was 88.7% occupied, with average in place rent of $1,291/unit ($1.20 PSF). Since acquiring the Waterstone Place Apartments Property, according to the borrower sponsor, they have invested approximately $1.7 million in capital improvements at approximately 35.7% of the units at the Waterstone Place Apartments Property. Renovated units are leased out at a slightly higher rent. Common amenities at the Waterstone Place Apartments Property include a business center, playground, fitness center and an on-site manager. Unit amenities include a range/stove, a refrigerator, a dishwasher, a garbage disposal, walk-in closets, a crown molding, ceiling fans, washer/dryer in-unit, vaulted ceilings, air conditioning, premium flooring, an alarm system, premium countertops, premium appliances, microwave and washer/dryer hookups.
Stonecreek Apartments
The Stonecreek Apartments Property is a two story, 207-unit garden-style apartment complex located in Katy, Texas. The Stonecreek Apartments Property was built in 1997 and is situated on 11.1 acres with 355 parking spaces (approximately 1.7 spaces per unit). The unit mix comprises one-, two-, and three-bedroom floorplans, a net rentable area of 172,041 square feet and average unit size of 831 square feet. As of November 21, 2019, the Stonecreek Apartments Property was 94.2% occupied, with average in place rent of $1,052/unit ($1.26 PSF). Since acquiring the Stonecreek Apartments Property, according to the borrower sponsor, they have invested approximately $1.2 million in capital improvements at approximately 63.8% of the units at the Stonecreek Apartments Property. Renovated units are leased out at a slightly higher rent. Common amenities at the Stonecreek Apartments Property include a fitness center, a swimming pool, an electronic gate, a dog park, a clubhouse, common laundry, and a barbecue and picnic area. Unit amenities include premium countertops, premium flooring, premium appliances, a microwave, washer/dryer hookups, walk-in closets, vaulted ceilings, ceiling fans, storage, balcony/patio, complete appliance package and air conditioning.
THE INFORMATION IN THIS STRUCTURAL AND COLLATERAL TERM SHEET IS NOT COMPLETE AND MAY BE AMENDED PRIOR TO THE TIME OF SALE. THIS TERM SHEET IS NOT AN OFFER TO SELL THESE SECURITIES AND IT IS NOT A SOLICITATION OF AN OFFER TO BUY THESE SECURITIES IN ANY JURISDICTION WHERE THE OFFER OR SALE IS NOT PERMITTED.
121
| Multifamily – Garden | Loan #8 | Cut-off Date Balance: | | $68,000,000 |
| Various | Houston-Austin Multifamily Portfolio | Cut-off Date LTV: | | 67.9% |
| Various, TX | | U/W NCF DSCR: | | 1.91x |
| | | U/W NOI Debt Yield: | | 7.6% |
Operating History and Underwritten Net Cash Flow. The following table presents certain information relating to the operating history and underwritten net cash flow at the Houston-Austin Multifamily Portfolio Properties:
Cash Flow Analysis
| | 2017 | 2018 (May-Dec Annualized) | TTM 10/31/2019 | U/W | %(1) | U/W $
per Unit |
| Gross Potential Rent | $8,534,994 | $8,781,065 | $9,109,137 | $9,251,882 | 90.7% | $13,788.20 |
| Other Income(2) | 776,926 | 893,889 | 950,143 | 950,143 | 9.3 | 1,416.01 |
| Total Recoveries | 0 | 0 | 0 | 0 | 0.0 | 0.00 |
| Net Rental Income | $9,311,919 | $9,674,953 | $10,059,280 | $10,202,025 | 100.0% | $15,204.21 |
| Concessions | (54,001) | (56,027) | (134,717) | (27,196) | (0.3) | (40.53) |
| (Vacancy & Credit Loss)(3) | (600,639) | (671,305) | (799,093) | (802,706) | (8.7) | (1,196.28) |
| Effective Gross Income | $8,657,279 | $8,947,622 | $9,125,470 | $9,372,122 | 91.9% | $13,967.40 |
| | | | | | | |
| Real Estate Taxes | 1,082,707 | 1,460,184 | 1,457,166 | 1,411,360 | 15.1 | 2,103.37 |
| Insurance | 255,383 | 252,141 | 314,586 | 294,953 | 3.1 | 439.57 |
| Management Fee | 111,742 | 355,864 | 363,339 | 281,164 | 3.0 | 419.02 |
| Other Operating Expenses | 2,315,305 | 2,255,028 | 2,201,269 | 2,201,269 | 23.5 | 3,280.58 |
| Total Operating Expenses | $3,765,137 | $4,323,217 | $4,336,359 | $4,188,746 | 44.7% | $6,242.54 |
| | | | | | | |
| Net Operating Income | $4,892,142 | $4,624,405 | $4,789,111 | $5,183,377 | 55.3% | $7,724.85 |
| Replacement Reserves | 0 | 0 | 0 | 174,766 | 1.9 | 260.46 |
| TI/LC | 0 | 0 | 0 | 0 | 0.0 | 0.00 |
| Net Cash Flow | $4,892,142 | $4,624,405 | $4,789,111 | $5,008,611 | 53.4% | $7,464.40 |
| | | | | | | |
| NOI DSCR | 1.87x | 1.77x | 1.83x | 1.98x | | |
| NCF DSCR | 1.87x | 1.77x | 1.83x | 1.91x | | |
| NOI Debt Yield | 7.2% | 6.8% | 7.0% | 7.6% | | |
| NCF Debt Yield | 7.2% | 6.8% | 7.0% | 7.4% | | |
| (1) | Represents (i) percent of Net Rental Income for all revenue fields, (ii) percent of Gross Potential Rent for Vacancy & Credit Loss and (iii) percent of Effective Gross Income for all other fields. |
| (2) | Other Income is comprised of utility reimbursements as well as other miscellaneous fees and charges. |
| (3) | The underwritten economic vacancy is 8.7%. The Houston-Austin Multifamily Portfolio is 94.5% occupied as of November 21, 2019. |
Appraisal. The Properties were valued individually, with the individual values reflecting a cumulative “as-is” appraised value of $100,100,000. The valuation dates of the appraisals are dated between October 23, 2019 and October 24, 2019.
Environmental Matters. According to Phase I environmental site assessments dated October 31, 2019, there was no evidence of any recognized environmental conditions at the Houston-Austin Multifamily Portfolio.
Market Overview and Competition.The Treehouse Apartments Property is located within the Riverside submarket of the Austin-Round Rock multifamily market. According to the appraisal, as of the second quarter of 2019, the vacancy rate in the Riverside submarket was approximately 4.9%, with average asking rents of $1,237 per unit and inventory of approximately 18,202 units. According to the appraisal, as of the second quarter of 2019, the vacancy rate in the Austin-Round Rock multifamily market was approximately 4.8%, with average asking rents of $1,289 per unit and inventory of approximately 245,170 units. According to the appraisal, the 2018 population within a one-, three- and five-mile radius of the Treehouse Apartments Property was 23,469, 129,982 and 303,955, respectively. The 2018 average household income within the same one-, three- and five-mile radius was $47,206, $68,552 and $75,008, respectively.
The Waterstone Place Apartments Property is located within the Sugar Land/Stafford submarket of the Houston-The Woodlands-Sugar Land multifamily market. According to the appraisal, as of the third quarter of 2019, the vacancy rate in the Sugar Land/Stafford submarket was approximately 4.7%, with average asking rents of $1,221 per unit and inventory of approximately 14,207 units. According to the appraisal, as of the third quarter of 2019, the vacancy rate in the Houston-The Woodlands-Sugar Land multifamily market was approximately 5.7%, with average asking rents of $1,128 per unit and inventory of approximately 688,315 units. According to the appraisal, the 2018 population within a one-, three- and five-mile radius of the Waterstone Place Apartments Property was 15,860, 91,333 and 319,246, respectively. The 2018 average household income within the same one-, three- and five-mile radius was $83,048, $103,839 and $96,284, respectively.
The Stonecreek Apartments Property is located within the Katy submarket of the Houston-The Woodlands-Sugar Land multifamily market. According to the appraisal, as of the third quarter of 2019, the vacancy rate in the Katy submarket was approximately 5.0%, with average asking rents of $1,245 per unit and inventory of approximately 19,435 units. According to the appraisal, as of the third quarter of 2019, the vacancy rate in the Houston-The Woodlands-Sugar Land multifamily market was approximately 5.7%, with average asking rents of $1,128 per unit and inventory of approximately 688,315 units. According to the appraisal, the 2018 population
THE INFORMATION IN THIS STRUCTURAL AND COLLATERAL TERM SHEET IS NOT COMPLETE AND MAY BE AMENDED PRIOR TO THE TIME OF SALE. THIS TERM SHEET IS NOT AN OFFER TO SELL THESE SECURITIES AND IT IS NOT A SOLICITATION OF AN OFFER TO BUY THESE SECURITIES IN ANY JURISDICTION WHERE THE OFFER OR SALE IS NOT PERMITTED.
122
| Multifamily – Garden | Loan #8 | Cut-off Date Balance: | | $68,000,000 |
| Various | Houston-Austin Multifamily Portfolio | Cut-off Date LTV: | | 67.9% |
| Various, TX | | U/W NCF DSCR: | | 1.91x |
| | | U/W NOI Debt Yield: | | 7.6% |
within a one-, three- and five-mile radius of the Stonecreek Apartments Property was 22,268, 130,577 and 267,911, respectively. The 2018 average household income within the same one-, three- and five-mile radius was $82,061, $110,935 and $114,222, respectively.
The following table presents certain information relating to the appraiser’s market rent conclusion for the Houston-Austin Multifamily Portfolio Properties:
Market Rent Summary
| Building | Units(1) | Avg. Size(1) | Avg. Monthly In Place Rent per Unit(1) | Avg. Monthly In Place Rent PSF(1) | Avg. Monthly Market Rent per Unit | Avg. Monthly Market Rent PSF |
| Treehouse Apartments | 296 | 701 | $1,133 | $1.62 | $1,171 | $1.67 |
| Waterstone Place Apartments | 168 | 1,080 | $1,291 | $1.20 | $1,360 | $1.26 |
| Stonecreek Apartments | 207 | 831 | $1,052 | $1.27 | $1,066 | $1.28 |
| (1) | Based on the borrower rent roll dated November 21, 2019. |
The following table presents certain information relating to comparable rental properties to the Treehouse Apartments Property:
Comparable Rental Properties (Treehouse Apartments Property)
| Property | Year Built | # Units | Unit Mix | Average SF per Unit | Average Rent per Unit | Average Monthly Rent PSF |
| Treehouse Apartments | 1985 | 296 | Studio 1BR 2BR | 408 697 1,003 | $947 $1,099 $1,392 | $2.32 $1.58 $1.39 |
The Social 1817 E Oltorf Street Austin, TX, 78741 | 1973 | 223 | Studio 1BR 2BR 3BR | 519 657 980 1,263 | $876 $1,027 $1,358 $1,609 | $1.69 $1.56 $1.39 $1.27 |
Avesta South Shore 2005 Willow Creek Drive Austin, TX, 78741 | 1974 | 301 | Studio 1BR 2BR | 400 700 916 | $898 $1,045 $1,405 | $2.25 $1.49 $1.53 |
Verde 2310 Wickersham Lane Austin, TX, 78741 | 1974 | 190 | 1BR 2BR | 643 919 | $1,020 $1,227 | $1.59 $1.33 |
Hillside Villas 2207 Wickersham Lane Austin, TX, 78741 | 1985 | 249 | 1BR 2BR | 680 1,025 | $1,076 $1,393 | $1.58 $1.36 |
Metropolis 2200 S Pleasant Valley Road Austin, TX, 78741 | 1973 | 308 | Studio 1BR 2BR 3BR | 400 684 943 1,123 | $975 $973 $1,141 $1,367 | $2.44 $1.42 $1.21 $1.22 |
THE INFORMATION IN THIS STRUCTURAL AND COLLATERAL TERM SHEET IS NOT COMPLETE AND MAY BE AMENDED PRIOR TO THE TIME OF SALE. THIS TERM SHEET IS NOT AN OFFER TO SELL THESE SECURITIES AND IT IS NOT A SOLICITATION OF AN OFFER TO BUY THESE SECURITIES IN ANY JURISDICTION WHERE THE OFFER OR SALE IS NOT PERMITTED.
123
| Multifamily – Garden | Loan #8 | Cut-off Date Balance: | | $68,000,000 |
| Various | Houston-Austin Multifamily Portfolio | Cut-off Date LTV: | | 67.9% |
| Various, TX | | U/W NCF DSCR: | | 1.91x |
| | | U/W NOI Debt Yield: | | 7.6% |
The following table presents certain information relating to comparable rental properties to the Waterstone Place Apartments Property:
Comparable Rental Properties (Waterstone Place Apartments Property)
| Property | Year Built | # Units | Unit Mix | Average SF per Unit | Average Rent per Unit | Average Monthly Rent PSF |
| Waterstone Place Apartments | 2001 | 168 | 3BR | 1,080 | $1,291 | $1.20 |
Lakeland Estates 630 Colony Lakes Estates Dr Stafford, TX, 77477 | 2008 | 264 | 1BR 2BR 3BR | 736 1,097 1,388 | $1,099 $1,299 $1,499 | $1.49 $1.18 $1.08 |
Preserve at Colony Lake 1000 Farrah Lane Stafford, TX, 77477 | 2004 | 420 | 1BR 2BR 3BR | 731 1,073 1,219 | $996 $1,274 $1,429 | $1.36 $1.19 $1.17 |
Silverbrooke 1020 Brand Lane Stafford, TX, 77477 | 2007 | 312 | 1BR 2BR 3BR | 768 1,067 1,286 | $1,068 $1,425 $1,569 | $1.39 $1.34 $1.22 |
Shadow brooke 1025 Dulles Ave Stafford , TX, 77477 | 2002 | 240 | 1BR 2BR 3BR | 819 1,154 1,375 | $1,035 $1,264 $1,459 | $1.26 $1.10 $1.06 |
Stafford Oaks 3759 Country Place Drive Stafford, TX, 77477 | 1978 | 175 | 1BR 2BR 3BR | 715 900 1,129 | $845 $979 $1,045 | $1.18 $1.09 $0.93 |
The following table presents certain information relating to comparable rental properties to the Stonecreek Apartments Property:
Comparable Rental Properties (Stonecreek Apartments Property)
| Property | Year Built | # Units | Unit Mix | Average SF per Unit | Average Rent per Unit | Average Monthly Rent PSF |
| Stonecreek Apartments | 1997 | 207 | 1BR 2BR 3BR | 610 949 1,100 | $894 $1,130 $1,298 | $1.47 $1.19 $1.18 |
Kenwood Club at the Park 2000 Westborough Dr Katy, TX, 77449 | 1999 | 320 | 1BR 2BR 3BR | 825 1,115 1,326 | $949 $1,137 $1,428 | $1.15 $1.02 $1.08 |
Station at Mason Creek 21500 Park Row Katy, TX, 77449 | 2001 | 291 | 1BR 2BR 3BR | 657 867 1,300 | $933 $1,158 $1,575 | $1.42 $1.34 $1.21 |
Mason Park 222 Mason Creek Dr. Katy, TX, 77450 | 2007 | 312 | 1BR 2BR 3BR | 716 1,061 1,261 | $997 $1,236 $1,531 | $1.39 $1.16 $1.21 |
Vineyards 21550 Provincial Blvd. Katy, TX, 77450 | 2003 | 369 | 1BR 2BR 3BR | 901 1,180 1,308 | $1,127 $1,295 $1,568 | $1.25 $1.10 $1.20 |
Reserve by the Lake 18600 South Park View Lane Houston, TX, 77084 | 2004 | 348 | 1BR 2BR 3BR | 798 1,105 1,341 | $1,024 $1,231 $1,450 | $1.28 $1.11 $1.08 |
Escrows.
Real Estate Taxes– The Houston-Austin Multifamily Portfolio Mortgage Loan documents provide for an upfront reserve of approximately $123,467 for real estate taxes and ongoing monthly reserves for real estate taxes in an amount equal to 1/12 of the real estate taxes that the lender estimates will be payable during the next twelve months (initially $123,467).
Insurance– The Houston-Austin Multifamily Portfolio Mortgage Loan documents provide for an upfront reserve of approximately $286,096 for insurance premiums and ongoing monthly reserves for insurance premiums of 1/12 of the annual estimated insurance premiums (initially $35,762);provided that such deposits are not required if (i) the liability and casualty policies covering the Houston-Austin Multifamily Portfolio are included in a blanket or umbrella insurance policy approved by the lender in its reasonable discretion, (ii) the Houston-Austin Multifamily Portfolio Borrowers provide to the lender evidence of renewal and paid receipts for insurance premiums for such policies at least 10 days prior to their expiration, and (iii) no event of default exists under the Houston-Austin Multifamily Portfolio Mortgage Loan.
THE INFORMATION IN THIS STRUCTURAL AND COLLATERAL TERM SHEET IS NOT COMPLETE AND MAY BE AMENDED PRIOR TO THE TIME OF SALE. THIS TERM SHEET IS NOT AN OFFER TO SELL THESE SECURITIES AND IT IS NOT A SOLICITATION OF AN OFFER TO BUY THESE SECURITIES IN ANY JURISDICTION WHERE THE OFFER OR SALE IS NOT PERMITTED.
124
| Multifamily – Garden | Loan #8 | Cut-off Date Balance: | | $68,000,000 |
| Various | Houston-Austin Multifamily Portfolio | Cut-off Date LTV: | | 67.9% |
| Various, TX | | U/W NCF DSCR: | | 1.91x |
| | | U/W NOI Debt Yield: | | 7.6% |
Deferred Maintenance Reserve– The Houston-Austin Multifamily Portfolio Mortgage Loan documents provide for an upfront deferred maintenance reserve of approximately $439,890, for various items, the majority of which are for the Treehouse Apartments Property, including among others, replacement and/or repair of water damaged wood floor deck and wood joists, test and repair of plumbing lines to eliminate source of water damage, renovation of two fire-damaged units, and inspection of fire-extinguishers.
Upfront Capital Improvement Reserve– The Houston-Austin Multifamily Portfolio Mortgage Loan documents provide for an upfront reserve of approximately $1,020,276 for capital improvements at the Houston-Austin Multifamily Portfolio.
Replacement Reserves– The Houston-Austin Multifamily Portfolio Mortgage Loan documents provide for ongoing monthly replacement reserves of $14,564 for annual replacements reasonably approved by the lender.
Lockbox and Cash Management. The Houston-Austin Multifamily Portfolio Mortgage Loan is structured with a springing lockbox and springing cash management. Upon the first occurrence of a Cash Sweep Event Period (as defined below), (a) the Houston-Austin Multifamily Portfolio Borrowers are required to establish a lockbox account for the benefit of the lender, into which all rents and other revenue from the Houston-Austin Multifamily Portfolio is required to be deposited by the Houston-Austin Multifamily Portfolio Borrowers and property manager within one business day of receipt; and (b) the lender is required to establish, and the Houston-Austin Multifamily Portfolio Borrowers are required to cooperate with the cash management bank to establish, a lender-controlled cash management account, into which all sums on deposit in the lockbox account are required to be deposited during the continuance of a Cash Sweep Event Period.
During the continuance of a Cash Sweep Event Period,provided no event of default under the Houston-Austin Multifamily Portfolio Mortgage Loan documents is continuing, all funds in the cash management account are required to be applied on each monthly payment date: (i) to make the monthly deposits into the real estate tax and insurance reserves as described above under “Escrows”, (ii) to pay debt service on the Houston-Austin Multifamily Portfolio Mortgage Loan, (iii) to make the monthly deposits into the replacement reserve as described above under “Escrows”, (iv) to pay operating expenses set forth in the annual budget (which is required to be reasonably approved by the lender) and lender-approved extraordinary expenses, and (v) to deposit any remainder into an excess cash flow subaccount to be held as additional security for the Houston-Austin Multifamily Portfolio Mortgage Loan during the continuance of such Cash Sweep Event Period. If no Cash Sweep Event Period exists, all funds on deposit in the lockbox account are required to be disbursed to an account designated by the Houston-Austin Multifamily Portfolio Borrowers.
A “Cash Sweep Event Period” means a period:
| (i) | commencing upon the occurrence of an event of default under the Houston-Austin Multifamily Portfolio Mortgage Loan documents and ending if no event of default under the Houston-Austin Multifamily Portfolio Mortgage Loan documents exists, or |
| (ii) | commencing upon the debt service coverage ratio on the Houston-Austin Multifamily Portfolio Mortgage Loan (assuming a 30-year amortization schedule) and any then-existing Mezzanine Debt (as defined below) falling below 1.10x as of the end of any calendar quarter based upon the trailing six months operating statements and current in place rent rolls, and ending on the date the debt service coverage ratio on the Houston-Austin Multifamily Portfolio Mortgage Loan (assuming a 30-year amortization schedule) and any then-existing Mezzanine Debt equals or exceeds 1.10x as of the end of two consecutive calendar quarters based upon the trailing six months operating statements and current in place rent rolls. |
Property Management.The Houston-Austin Multifamily Portfolio Properties are managed by Karya Property Management, LLC, an affiliate of the Houston-Austin Multifamily Portfolio Borrowers.
Release of Property.The Houston-Austin Multifamily Portfolio Borrowers have the one-time right, at any time after the expiration of the prepayment lockout period, andprovided no event of default under the Houston-Austin Multifamily Portfolio Mortgage Loan documents exists, to obtain the release of any one individual Property,provided certain conditions are satisfied, including (i) prepayment of a release price equal to 105% of the allocated loan amount of the related individual Property, together with, if prior to the open prepayment date, a prepayment fee equal to the greater of (x) 1.00% of the principal amount prepaid and (y) a yield maintenance premium, (ii) the aggregate debt yield of the Houston-Austin Multifamily Portfolio Mortgage Loan and any then-existing Mezzanine Debt after giving effect to the release is greater than the greater of (x) the aggregate debt yield immediately prior to the release, and (y) 7.4%; (iii) the aggregate loan-to-value ratio of the Houston-Austin Multifamily Portfolio Mortgage Loan and any then-existing Mezzanine Debt after giving effect to the release is no greater than the lesser of (x) the aggregate loan-to-value ratio immediately prior to the release and (y) 67.9% (based on an updated appraisal); (iv) the aggregate debt service coverage ratio of the Houston-Austin Multifamily Portfolio Mortgage Loan and any then-existing Mezzanine Debt after giving effect to the release is greater than the greater of (x) the aggregate debt service coverage ratio (assuming that debt service payments are being made based on a 30 year amortization schedule) immediately prior to the release, and (y)1.32x, and (v) satisfaction of REMIC-related requirements.
Real Estate Substitution. Not permitted.
Subordinate and Mezzanine Indebtedness. One or more of the owners of direct or indirect ownership interests in the Houston-Austin Multifamily Portfolio Borrowers (but not including any general partner or managing member thereof) have a one-time right to obtain a mezzanine loan (or preferred equity investment) (in either case, “Mezzanine Debt”) from a third-party lender secured by such owners’ ownership interest in the Houston-Austin Multifamily Portfolio Borrowers,provided certain conditions are satisfied, including (a) no event of default under the Houston-Austin Multifamily Portfolio Mortgage Loan documents is then continuing; (b) the aggregate debt yield of the Houston-Austin Multifamily Portfolio Mortgage Loan and the Mezzanine Debt is not less than 7.4%; (c) the aggregate loan-to-value ratio of the Houston-Austin Multifamily Portfolio Mortgage Loan and the Mezzanine Debt is equal to or less than 67.9%
THE INFORMATION IN THIS STRUCTURAL AND COLLATERAL TERM SHEET IS NOT COMPLETE AND MAY BE AMENDED PRIOR TO THE TIME OF SALE. THIS TERM SHEET IS NOT AN OFFER TO SELL THESE SECURITIES AND IT IS NOT A SOLICITATION OF AN OFFER TO BUY THESE SECURITIES IN ANY JURISDICTION WHERE THE OFFER OR SALE IS NOT PERMITTED.
125
| Multifamily – Garden | Loan #8 | Cut-off Date Balance: | | $68,000,000 |
| Various | Houston-Austin Multifamily Portfolio | Cut-off Date LTV: | | 67.9% |
| Various, TX | | U/W NCF DSCR: | | 1.91x |
| | | U/W NOI Debt Yield: | | 7.6% |
(based on an updated appraisal acceptable to the lender); (d) the aggregate debt service coverage ratio of the Houston-Austin Multifamily Portfolio Mortgage Loan (assuming that debt service payments are being made based on a 30 year amortization schedule) and the Mezzanine Debt is not less than 1.32x, (e) the maturity date of the Mezzanine Debt is not earlier than the maturity date of the Houston-Austin Multifamily Portfolio Mortgage Loan; (f) the lender and the mezzanine lender enter into an intercreditor agreement in form and substance reasonably acceptable to the lender and acceptable to the rating agencies; and (g) the lender has received a rating agency confirmation as to the implementation of the Mezzanine Debt.
Ground Lease. None.
Letter of Credit. None.
Right of First Offer/Right of First Refusal. None.
Terrorism Insurance. The Houston-Austin Multifamily Portfolio Borrowers are required to obtain and maintain an “all risk” or “special form” property insurance policy that covers perils of terrorism and acts of terrorism in an amount equal to the “full replacement cost” of the Houston-Austin Multifamily Portfolio together with business income insurance covering no less than the 24-month period commencing at the time of loss, together with a 12-month extended period of indemnity. Notwithstanding the foregoing, for so long as the Terrorism Risk Insurance Act of 2002, as extended and modified by the Terrorism Risk Insurance Program Reauthorization Act of 2015 (“TRIPRA”) is in effect (including any extensions thereof or if another federal governmental program is in effect relating to “acts of terrorism” which provides substantially similar protections as TRIPRA), and covers both domestic and foreign acts of terrorism, the lender is required to accept terrorism insurance which insures against “covered acts” as defined by TRIPRA (or such other program). See “Risk Factors—Risks Relating to the Mortgage Loans—Terrorism Insurance May Not Be Available for All Mortgaged Properties” in the Preliminary Prospectus.
THE INFORMATION IN THIS STRUCTURAL AND COLLATERAL TERM SHEET IS NOT COMPLETE AND MAY BE AMENDED PRIOR TO THE TIME OF SALE. THIS TERM SHEET IS NOT AN OFFER TO SELL THESE SECURITIES AND IT IS NOT A SOLICITATION OF AN OFFER TO BUY THESE SECURITIES IN ANY JURISDICTION WHERE THE OFFER OR SALE IS NOT PERMITTED.
126
(THIS PAGE INTENTIONALLY LEFT BLANK)
THE INFORMATION IN THIS STRUCTURAL AND COLLATERAL TERM SHEET IS NOT COMPLETE AND MAY BE AMENDED PRIOR TO THE TIME OF SALE. THIS TERM SHEET IS NOT AN OFFER TO SELL THESE SECURITIES AND IT IS NOT A SOLICITATION OF AN OFFER TO BUY THESE SECURITIES IN ANY JURISDICTION WHERE THE OFFER OR SALE IS NOT PERMITTED.
127
| Office – Suburban | Loan # 9 | Cut-off Date Balance: | | $65,400,000 |
| 5600 Fishers Lane | Parklawn Building | Cut-off Date LTV: | | 60.0% |
| Rockville, MD 20852 | | U/W NCF DSCR: | | 2.68x |
| | | U/W NOI Debt Yield: | | 9.4% |

THE INFORMATION IN THIS STRUCTURAL AND COLLATERAL TERM SHEET IS NOT COMPLETE AND MAY BE AMENDED PRIOR TO THE TIME OF SALE. THIS TERM SHEET IS NOT AN OFFER TO SELL THESE SECURITIES AND IT IS NOT A SOLICITATION OF AN OFFER TO BUY THESE SECURITIES IN ANY JURISDICTION WHERE THE OFFER OR SALE IS NOT PERMITTED.
128
| Office – Suburban | Loan # 9 | Cut-off Date Balance: | | $65,400,000 |
| 5600 Fishers Lane | Parklawn Building | Cut-off Date LTV: | | 60.0% |
| Rockville, MD 20852 | | U/W NCF DSCR: | | 2.68x |
| | | U/W NOI Debt Yield: | | 9.4% |
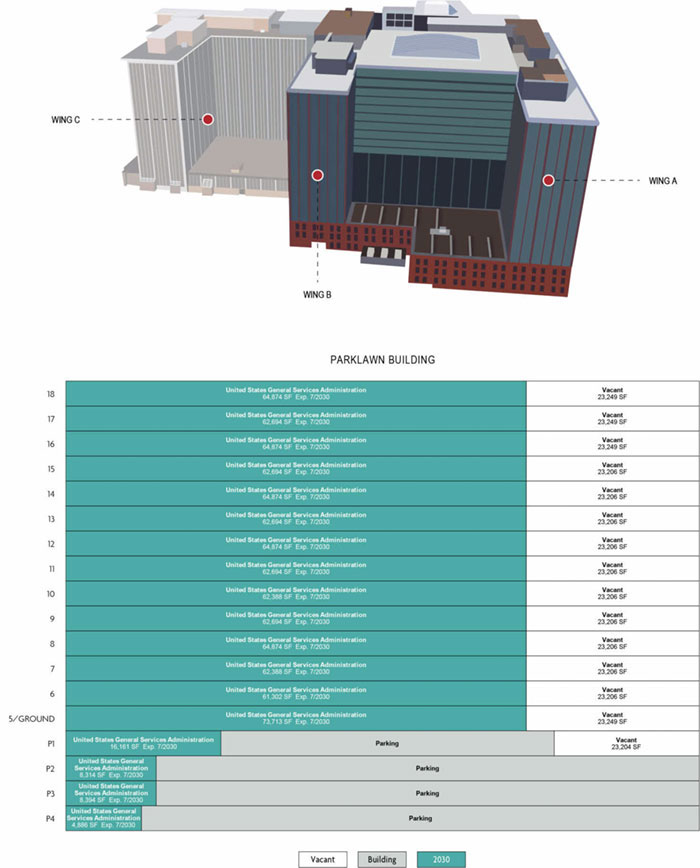
THE INFORMATION IN THIS STRUCTURAL AND COLLATERAL TERM SHEET IS NOT COMPLETE AND MAY BE AMENDED PRIOR TO THE TIME OF SALE. THIS TERM SHEET IS NOT AN OFFER TO SELL THESE SECURITIES AND IT IS NOT A SOLICITATION OF AN OFFER TO BUY THESE SECURITIES IN ANY JURISDICTION WHERE THE OFFER OR SALE IS NOT PERMITTED.
129
| Office – Suburban | Loan # 9 | Cut-off Date Balance: | | $65,400,000 |
| 5600 Fishers Lane | Parklawn Building | Cut-off Date LTV: | | 60.0% |
| Rockville, MD 20852 | | U/W NCF DSCR: | | 2.68x |
| | | U/W NOI Debt Yield: | | 9.4% |

THE INFORMATION IN THIS STRUCTURAL AND COLLATERAL TERM SHEET IS NOT COMPLETE AND MAY BE AMENDED PRIOR TO THE TIME OF SALE. THIS TERM SHEET IS NOT AN OFFER TO SELL THESE SECURITIES AND IT IS NOT A SOLICITATION OF AN OFFER TO BUY THESE SECURITIES IN ANY JURISDICTION WHERE THE OFFER OR SALE IS NOT PERMITTED.
130
| No. 9 – Parklawn Building |
| |
| Mortgage Loan Information | | Mortgaged Property Information |
| Mortgage Loan Seller: | Bank of America, National Association | | Single Asset/Portfolio: | Single Asset |
Credit Assessment (Fitch/KBRA/S&P): | NR/NR/NR | | Property Type – Subtype: | Office – Suburban |
| Original Principal Balance(1): | $65,400,000 | | Location: | Rockville, MD |
| Cut-off Date Balance(1): | $65,400,000 | | Size: | 1,283,646 SF |
| % of Initial Pool Balance: | 4.0% | | Cut-off Date Balance Per SF(1): | $203.79 |
| Loan Purpose: | Acquisition | | Maturity Date Balance Per SF(1): | $203.79 |
| Borrower Sponsor: | Boyd Watterson Asset Management | | Year Built/Renovated: | 1970/2015 |
| Guarantor: | BW Government Properties II, LLC | | Title Vesting: | Fee |
| Mortgage Rate: | 3.3980% | | Property Manager: | JBGS/TRS, L.L.C. |
| Note Date: | October 25, 2019 | | Current Occupancy (As of): | 72.9% (7/1/2019) |
| Seasoning: | 3 months | | YE 2018 Occupancy: | 72.9% |
| Maturity Date: | November 1, 2029 | | YE 2017 Occupancy: | 72.9% |
| IO Period: | 120 months | | YE 2016 Occupancy: | 72.9% |
| Loan Term (Original): | 120 months | | YE 2015 Occupancy: | 72.9% |
| Amortization Term (Original): | NAP | | As-Is Appraised Value: | $436,000,000 |
| Loan Amortization Type: | Interest-only, Balloon | | As-Is Appraised Value Per SF: | $339.66 |
| Call Protection: | L(27), D(87), O(6) | | As-Is Appraisal Valuation Date: | September 18, 2019 |
| Lockbox Type: | Hard/Upfront Cash Management | | Underwriting and Financial Information |
| Additional Debt(1): | Yes | | TTM NOI (8/31/2019): | $25,437,810 |
| Additional Debt Type (Balance)(1): | Pari Passu($196,200,000) | | YE 2018 NOI: | $23,893,473 |
| | | | YE 2017 NOI: | $27,578,749 |
| | | | YE 2016 NOI(3): | NAP |
| | | | U/W Revenues: | $35,282,884 |
| | | | U/W Expenses: | $10,656,482 |
| | | | U/W NOI: | $24,626,402 |
| | | | U/W NCF: | $24,159,260 |
| Escrows and Reserves(2) | | U/W DSCR based on NOI/NCF(1): | 2.73x / 2.68x |
| | Initial | Monthly | Cap | | U/W Debt Yield based on NOI/NCF(1): | 9.4% / 9.2% |
| Taxes | $372,746 | $124,249 | NAP | | U/W Debt Yield at Maturity based on NOI/NCF(1): | 9.4% / 9.2% |
| Insurance | $19,441 | $9,720 | NAP | | Cut-off Date LTV Ratio(1): | 60.0% |
| Deferred Maintenance | $111,869 | $0 | NAP | | LTV Ratio at Maturity(1): | 60.0% |
| | | | | | | | |
| Sources and Uses |
| Sources | | | | Uses | | |
| Original whole loan amount | $261,600,000 | | 58.8% | Purchase price | $436,000,000 | 97.9% |
| Borrower Equity | 183,626,789 | | 41.2 | Closing costs | 8,722,733 | 2.0 |
| | | | | Reserves | 504,056 | 0.1 |
| Total Sources | $445,226,789 | | 100.0% | Total Uses | $445,226,789 | 100.0% |
| (1) | The Cut-off Date Balance Per SF, Maturity Date Balance Per SF, U/W DSCR based on NOI/NCF, U/W Debt Yield based on NOI/NCF, U/W Debt Yield at Maturity based on NOI/NCF, Cut-off Date LTV Ratio and LTV Ratio at Maturity numbers presented above are based on the Parklawn Building Whole Loan (as defined below). |
| (2) | See “Escrows” section. |
| (3) | Further historical NOI was not made available at the time of the Parklawn Building Property’s (as defined below) acquisition. |
The Mortgage Loan. The mortgage loan (the “Parklawn Building Mortgage Loan”) is part of a whole loan (the “Parklawn Building Whole Loan”) that is evidenced by fivepari passu promissory notes with an aggregate original principal balance of $261,600,000, all secured by a first priority fee mortgage encumbering a suburban office property located in Rockville, Maryland ( the “Parklawn Building Property”). The Parklawn Building Whole Loan was co-originated by Bank of America, National Association and KeyBank National Association. The non-controlling Note A-5, with an original principal balance of $65,400,000, represents the Parklawn Building Mortgage Loan. See the Note Summary table below. The Parklawn Building Whole Loan is serviced pursuant to the pooling and servicing agreement for the MSC 2019-L3 securitization transaction. See “Description of the Mortgage Pool—The Whole Loans—The Non-Serviced Pari Passu Whole Loans” and “Pooling and Servicing Agreement—Servicing of the Non-Serviced Mortgage Loans” in the Preliminary Prospectus.
THE INFORMATION IN THIS STRUCTURAL AND COLLATERAL TERM SHEET IS NOT COMPLETE AND MAY BE AMENDED PRIOR TO THE TIME OF SALE. THIS TERM SHEET IS NOT AN OFFER TO SELL THESE SECURITIES AND IT IS NOT A SOLICITATION OF AN OFFER TO BUY THESE SECURITIES IN ANY JURISDICTION WHERE THE OFFER OR SALE IS NOT PERMITTED.
131
| Office – Suburban | Loan # 9 | Cut-off Date Balance: | | $65,400,000 |
| 5600 Fishers Lane | Parklawn Building | Cut-off Date LTV: | | 60.0% |
| Rockville, MD 20852 | | U/W NCF DSCR: | | 2.68x |
| | | U/W NOI Debt Yield: | | 9.4% |
Note Summary
| Notes | Original Balance | Cut-off Date Balance | Note Holder | Controlling Piece |
| A-1 | $70,000,000 | $70,000,000 | MSC 2019-L3 | Yes |
| A-2 | $50,000,000 | $50,000,000 | CF 2019-CF3 | No |
| A-3 | $10,800,000 | $10,800,000 | CF 2019-CF3 | No |
| A-4 | $65,400,000 | $65,400,000 | BANK 2019-BNK24 | No |
| A-5 | $65,400,000 | $65,400,000 | BANK 2020-BNK25 | No |
| Total | $261,600,000 | $261,600,000 | | |
The Borrower and Borrower Sponsor.The borrower is 5600 Fishers Lane, LLC (the “Parklawn Building Borrower”), a single-purpose Delaware limited liability company, with two independent directors. Legal counsel to the borrower delivered a non-consolidation opinion in connection with the origination of the Parklawn Building Whole Loan.
The borrower sponsor is Boyd Watterson Asset Management (“Boyd Watterson”). Headquartered in Cleveland, Ohio and formed in 2009, Boyd Watterson is an independent investment advisor specializing in fixed income, real estate and equities. Boyd Watterson invests in commercial properties leased to local, state, and federal government tenants and manages such assets in separate client accounts and private funds. As of September 30, 2019, Boyd Watterson managed over $4.2 billion in real estate assets. The non-recourse carveout guarantor is BW Government Properties II, LLC, which is an entity owned by Boyd Watterson and Government Properties Investments II Limited, a fund managed by Union Bancaire Privée. Union Bancaire Privée is a wealth management firm headquartered in Geneva, Switzerland, that focuses on private and institutional clients throughout the world.
The Property.The Parklawn Building Property is a 14-story suburban office building totaling 1,283,646 square feet across three wings originally constructed in 1970. Wings A and B contain an aggregate of 935,386 square feet and wing C contains 348,260 square feet. The Parklawn Building Property was originally 100.0% leased to the United States of America General Services Administration (“GSA”) on behalf of the U.S. Department of Health & Human Services (“HHS”), with the Parklawn Building Property serving as the headquarters for HHS. In 2015, the GSA and the prior owner of the Parklawn Building Property collectively spent nearly $300 million to completely renovate wings A and B into Class A office space featuring a 14-story atrium with a glass ceiling and glass exterior. Following the renovation, the GSA consolidated operations of HHS into wings A and B, and as a result, wing C was left vacant and in its original condition. There are no immediate plans to renovate or lease the space. As of July 1, 2019, wings A and B were 100.0% occupied by the GSA; however, the entire Parklawn Building Property, inclusive of wing C, was 72.9% occupied.
The Parklawn Building Property is LEED Platinum and Energy Star rated and features on-site amenities that include a one-acre park with a fountain, an outdoor plaza, café tables and seating, an on-site bank, a convenience store, a fitness center, and a direct trail to the nearby 1,700-acre Rock Creek Park. As part of the 2015 renovation, HHS invested more than $165 million of the total $300 million on specific upgrades including the main HHS data center for all national operations, back-up generators, modular conference center, full service cafeteria, and employee retail amenities. The 14-story, main interior atrium serves as the focal point of the Parklawn Building Property and allows HHS to host national and international symposiums and major training events on-site. Approximately 2,147 parking spaces are available throughout the Parklawn Building Property, consisting of 909 surface parking spaces and 1,238 parking spaces in a four-level below-grade parking garage beneath wings A, B, and C.
The Parklawn Building Property is situated on a 12.03-acre site in the Twinbrook neighborhood of Rockville, Maryland, approximately one-half mile northeast of Rockville Pike (Route 355) and two miles east of the Interstate 270 and Montrose Road interchange. The Twinbrook Metrorail station is located approximately one-half mile to the west, connecting the area to Bethesda and downtown Washington, D.C. The Parklawn Building Property is located in a government life sciences district that features the 550,000 square foot national headquarters for the companion agency, the National Institute of Allergy and Infectious Diseases, and two laboratory buildings leased to the National Institute of Health, directly across the street.
The Parklawn Building Borrower is a party to that certain Economic Development Fund Agreement (the “Grant”) with Montgomery County, Maryland (the “County”). Pursuant to the Grant, the Parklawn Building Borrower is entitled to 15 annual disbursements of $1,300,000 from 2017 through and including 2031. The County is only obligated to make disbursements once it has verified that the Parklawn Building Borrower has paid real property taxes in full for the corresponding tax year. The Parklawn Building Borrower was assigned the Grant at closing, but any further assignment of the Grant requires the assignee to demonstrate to the County that it is financially capable of fulfilling the Parklawn Building Borrower’s obligations and execute an assignment in form and substance reasonably satisfactory to the County. See “Description of the Mortgage Pool—Mortgage Pool Characteristics—Property Types—Office Properties” in the Preliminary Prospectus.
Major Tenant.
The GSA utilizes the Parklawn Building Property for HHS which occupies the space via a lease that expires in July 2030. The lease contains one, 10-year renewal option with a notice period of at least 36 months. The lease does not provide any termination or contraction options.
HHS is a department of the United States government with the stated objective of improving the health, safety, and well-being of Americans. HHS originally took occupancy of the Parklawn Building Property after it was constructed approximately 50 years ago. As part of the most recent renovation and lease renewal, HHS aggregated the Agency for Healthcare Research and Quality, the Indian
THE INFORMATION IN THIS STRUCTURAL AND COLLATERAL TERM SHEET IS NOT COMPLETE AND MAY BE AMENDED PRIOR TO THE TIME OF SALE. THIS TERM SHEET IS NOT AN OFFER TO SELL THESE SECURITIES AND IT IS NOT A SOLICITATION OF AN OFFER TO BUY THESE SECURITIES IN ANY JURISDICTION WHERE THE OFFER OR SALE IS NOT PERMITTED.
132
| Office – Suburban | Loan # 9 | Cut-off Date Balance: | | $65,400,000 |
| 5600 Fishers Lane | Parklawn Building | Cut-off Date LTV: | | 60.0% |
| Rockville, MD 20852 | | U/W NCF DSCR: | | 2.68x |
| | | U/W NOI Debt Yield: | | 9.4% |
Health Service and the Substance Abuse and Mental Health Services Administration into the Parklawn Building Property. In total, approximately 4,500 government healthcare employees are housed at the Parklawn Building Property.
The following table presents certain information relating to the tenancy at the Parklawn Building Property:
Tenant Summary(1)
| Tenant Name | Credit Rating (Fitch/ Moody’s/
S&P) | Tenant NRSF | % of
NRSF | Annual U/W Base Rent PSF | Annual
U/W Base Rent | % of Total Annual U/W Base Rent | Lease
Expiration
Date | Extension Options | Termination Option (Y/N) |
| United States General Services Administration | AAA/Aaa/AA+ | 935,386 | 72.9% | $31.75 | $29,695,152 | 100.0% | 7/31/2030 | 1 x 10 Yr | N |
| Vacant Space | 348,260 | 27.1% | | | | | | |
| | | | | | �� | | | |
| Total/Wtd. Avg. | 1,283,646 | 100.0% | $31.75(2) | $29,695,152 | 100.0% | | | |
| | | | | | | | | | |
| (1) | Information obtained from the underwritten rent roll. |
| (2) | Total/Wtd. Avg. Annual U/W Base Rent PSF excludes vacant space. |
The following table presents certain information relating to the lease rollover schedule at the Parklawn Building Property:
Lease Expiration Schedule(1)
Year Ending
December 31, | No. of Leases Expiring | Expiring NRSF | % of Total NRSF Expiring | Cumulative Expiring NRSF | Cumulative % of Total NRSF Expiring | Annual
U/W
Base Rent Expiring | % of Total Annual U/W Base Rent Expiring | Annual
U/W
Base Rent
PSF Expiring |
| MTM | 0 | 0 | 0.0% | 0 | 0.0% | $0 | 0.0% | $0.00 |
| 2020 | 0 | 0 | 0.0% | 0 | 0.0% | $0 | 0.0% | $0.00 |
| 2021 | 0 | 0 | 0.0% | 0 | 0.0% | $0 | 0.0% | $0.00 |
| 2022 | 0 | 0 | 0.0% | 0 | 0.0% | $0 | 0.0% | $0.00 |
| 2023 | 0 | 0 | 0.0% | 0 | 0.0% | $0 | 0.0% | $0.00 |
| 2024 | 0 | 0 | 0.0% | 0 | 0.0% | $0 | 0.0% | $0.00 |
| 2025 | 0 | 0 | 0.0% | 0 | 0.0% | $0 | 0.0% | $0.00 |
| 2026 | 0 | 0 | 0.0% | 0 | 0.0% | $0 | 0.0% | $0.00 |
| 2027 | 0 | 0 | 0.0% | 0 | 0.0% | $0 | 0.0% | $0.00 |
| 2028 | 0 | 0 | 0.0% | 0 | 0.0% | $0 | 0.0% | $0.00 |
| 2029 | 0 | 0 | 0.0% | 0 | 0.0% | $0 | 0.0% | $0.00 |
| 2030 | 0 | 0 | 0.0% | 0 | 0.0% | $0 | 0.0% | $0.00 |
| Thereafter | 1 | 935,386 | 72.9% | 935,386 | 72.9% | $29,695,152 | 100.0% | $31.75 |
| Vacant | 0 | 348,260 | 27.1% | 1,283,646 | 100.0% | $0 | 0.0% | $0.00 |
| Total/Wtd. Avg. | 1 | 1,283,646 | 100.0% | | | $29,695,152 | 100.0% | $31.75(2) |
| (1) | Information obtained from the underwritten rent roll. |
| (2) | Total/Wtd. Avg. Annual U/W Base Rent PSF Expiring excludes vacant space. |
The following table presents historical occupancy percentages at the Parklawn Building Property:
Historical Occupancy(1)
| 12/31/2015 | | 12/31/2016 | | 12/31/2017 | | 12/31/2018 | | 7/1/2019 |
| 72.9% | | 72.9% | | 72.9% | | 72.9% | | 72.9% |
| (1) | The Parklawn Building Property was renovated in 2015, after which time the GSA consolidated operations into wings A and B, which were 100.0% occupied by the GSA; however, the entire Parklawn Building Property, inclusive of wing C, was 72.9% occupied. |
THE INFORMATION IN THIS STRUCTURAL AND COLLATERAL TERM SHEET IS NOT COMPLETE AND MAY BE AMENDED PRIOR TO THE TIME OF SALE. THIS TERM SHEET IS NOT AN OFFER TO SELL THESE SECURITIES AND IT IS NOT A SOLICITATION OF AN OFFER TO BUY THESE SECURITIES IN ANY JURISDICTION WHERE THE OFFER OR SALE IS NOT PERMITTED.
133
| Office – Suburban | Loan # 9 | Cut-off Date Balance: | | $65,400,000 |
| 5600 Fishers Lane | Parklawn Building | Cut-off Date LTV: | | 60.0% |
| Rockville, MD 20852 | | U/W NCF DSCR: | | 2.68x |
| | | U/W NOI Debt Yield: | | 9.4% |
Operating History and Underwritten Net Cash Flow. The following table presents certain information relating to the operating history and the underwritten net cash flow at the Parklawn Building Property:
Cash Flow Analysis
| | 2017 | 2018 | TTM 8/31/2019 | U/W | %(1) | U/W $ per
SF |
| Gross Potential Rent | $29,333,705 | $29,307,147 | $29,307,147 | $40,142,952 | 87.8% | $31.27 |
| Total Recoveries(2) | 1,075,796 | (71,488) | (779,982) | 276,172 | 0.6 | 0.22 |
| Parking Income | 3,474,485 | 3,547,672 | 3,631,939 | 4,011,560 | 8.8 | 3.13 |
| Other Income(3) | (798) | 0 | 57,118 | 1,300,000 | 2.8 | 1.01 |
| Net Rental Income | $33,883,188 | $32,783,331 | $32,216,222 | $45,730,684 | 100.0% | $35.63 |
| (Vacancy & Credit Loss) | 0 | 0 | 0 | (10,447,800) | (26.0) | (8.14) |
| Effective Gross Income | $33,883,188 | $32,783,331 | $32,216,222 | $35,282,884 | 77.2% | $27.49 |
| | | | | | | |
| Real Estate Taxes | 393,436 | 2,779,279 | 1,459,065 | 4,212,000 | 11.9 | 3.28 |
| Insurance | 180,883 | 138,229 | 126,910 | 179,664 | 0.5 | 0.14 |
| Other Operating Expenses | 5,730,120 | 5,972,350 | 5,192,436 | 6,264,818 | 17.8 | 4.88 |
| Total Operating Expenses | $6,304,439 | $8,889,858 | $6,778,412 | $10,656,482 | 30.2% | $8.30 |
| | | | | | | |
| Net Operating Income | $27,578,749 | $23,893,473 | $25,437,810 | $24,626,402 | 69.8% | $19.18 |
| Replacement Reserves | 0 | 0 | 0 | 319,897 | 0.9 | 0.25 |
| TI/LC(4) | 0 | 0 | 0 | 147,245 | 0.4 | 0.11 |
| Net Cash Flow | $27,578,749 | $23,893,473 | $25,437,810 | $24,159,260 | 68.5% | $18.82 |
| | | | | | | |
| NOI DSCR(5) | 3.06x | 2.65x | 2.82x | 2.73x | | |
| NCF DSCR(5) | 3.06x | 2.65x | 2.82x | 2.68x | | |
| NOI Debt Yield(5) | 10.5% | 9.1% | 9.7% | 9.4% | | |
| NCF Debt Yield(5) | 10.5% | 9.1% | 9.7% | 9.2% | | |
| (1) | Represents (i) percent of Net Rental Income for all revenue fields, (ii) percent of Gross Potential Rent for Vacancy & Credit Loss and (iii) percent of Effective Gross Income for all other fields. |
| (2) | Negative amounts for 2018 and TTM 8/31/2019 Total Recoveries reflect CPI and tax reconciliations as a result of estimated payments made during the respective year exceeding actual amounts due at the end of the respective year. |
| (3) | U/W Other Income represents a Montgomery County grant, which includes 15 annual payments of $1.3 million to be paid out from 2017 through 2031. The Parklawn Building Borrower was assigned the grant at closing, but any further assignment of the grant requires the assignee to demonstrate to the County that it is financially capable of fulfilling the Parklawn Building Borrower’s obligations and execute an assignment in form and substance reasonably satisfactory to the County. |
| (4) | U/W TI/LC includes a credit associated with the springing major tenant cash flow sweep set to occur 29 months prior to lease expiration and estimated to collect $1,901,631. |
| (5) | The debt service coverage ratios and debt yields are based on the Parklawn Building Whole Loan. |
Appraisal.The appraiser concluded to an “as-is” Appraised Value for the Parklawn Building Property of $436,000,000 as of September 18, 2019. The “as-is” value includes $16,235,773 attributed to the present value of an economic development grant and the remainder of a LEED tax credit.
Environmental Matters. According to the Phase I environmental site assessment dated August 21, 2019, there was no evidence of any recognized environmental conditions at the Parklawn Building Property.
Market Overview and Competition.The Parklawn Building Property is located in Rockville, Montgomery County, Maryland, within the Washington-Arlington-Alexandria, DC-VA-MD-WV metropolitan statistical area and approximately 13 miles northwest of the Washington D.C. central business district. Historically, Rockville’s main office demand driver has been government and quasi-government tenants, accounting for nearly 40% of occupied office space; however, the biotechnology industry has increased its presence. The I-270 Technology Corridor, which serves as a local demand generator for the Rockville market area, is a life science corridor that is home to numerous biotechnology companies and federal government institutions. Health institutions located in the area include Johns Hopkins Montgomery County campus and University of Maryland Institute for Bioscience and Biotechnology Research, as well as large pharmaceutical companies including GlaxoSmithKline, Sanofi and MedImmune.
According to a third party research report, the Parklawn Building Property is part of the Washington office market and the Rockville office submarket. As of the third quarter of 2019, the Washington office market had a total office inventory of approximately 501.4 million square feet with a vacancy rate of 12.9% and an average asking rent of $37.96 PSF. The Rockville office submarket had a total office inventory of approximately 10.8 million square feet with a vacancy rate of 10.8% and an average asking rent of $30.18 PSF. The submarket had no additional inventory delivered in the third quarter of 2019 and had positive net absorption of 14,921 square feet. No office buildings are currently under construction in the submarket.
According to the appraisal, the estimated 2019 populations within a one-, three- and five-mile radius of the Parklawn Building Property were 27,386, 160,957, and 357,052, respectively. The 2019 average household incomes within the same radii were $96,465, $117,574, and $130,980, respectively.
THE INFORMATION IN THIS STRUCTURAL AND COLLATERAL TERM SHEET IS NOT COMPLETE AND MAY BE AMENDED PRIOR TO THE TIME OF SALE. THIS TERM SHEET IS NOT AN OFFER TO SELL THESE SECURITIES AND IT IS NOT A SOLICITATION OF AN OFFER TO BUY THESE SECURITIES IN ANY JURISDICTION WHERE THE OFFER OR SALE IS NOT PERMITTED.
134
| Office – Suburban | Loan # 9 | Cut-off Date Balance: | | $65,400,000 |
| 5600 Fishers Lane | Parklawn Building | Cut-off Date LTV: | | 60.0% |
| Rockville, MD 20852 | | U/W NCF DSCR: | | 2.68x |
| | | U/W NOI Debt Yield: | | 9.4% |
The following table presents certain information relating to the appraiser’s market rent conclusions for the Parklawn Building Property:
Market Rent Summary
| | Office |
| Market Rent (PSF) | $35.00 |
| Lease Term (Years) | 10 |
| Rent Increase Projection | 0.0%per annum |
The following table presents recent government agency leasing data at comparable office properties with respect to the Parklawn Building Property:
Comparable Leases(1)
| Property Name/Location | Year Built/ Renovated(2) | Distance from Subject | Total GLA (SF)(2) | Tenant | Tenant Size (SF) | Lease Start Date | Annual Base Rent PSF | Lease Term (Yrs) | Lease Type |
Parklawn Building(3)
Rockville, MD | 1970 / 2015 | NAP | 1,283,646 | United States General Services Administration | 935,386 | Aug-15 | $31.75 | 15.0 | Modified Gross |
Centerstone at Tysons McLean, VA | NAP | 14.5 miles | NAP | Freddie Mac | 151,949 | May-19 | $27.50 | 10.2 | NNN |
West Gude Office Park
Rockville, MD | NAP | 4.7 miles | NAP | FBI (renewal) | 10,646 | Jan-19 | $23.36 | 10.0 | Full Service |
Reston Sunrise
Reston, VA | NAP | 23.5 miles | NAP | GSA | 43,346 | Dec-18 | $35.00 | 15.0 | Full Service |
Centerpark I
Calverton, MD | NAP | 12.7 miles | NAP | FDA | 78,918 | Nov-18 | $24.51 | 10.0 | Full Service |
American Square at Quantum Park
Ashburn, VA | NAP | 31.2 miles | NAP | GSA – CBP | 444,595 | May-18 | $38.25 | 15.0 | Full Service |
American Center West
Tysons, VA | NAP | 15.6 miles | NAP | GSA (renewal) | 21,214 | Apr-18 | $33.00 | 5.3 | Full Service |
The Cinema Building
Hyattsville, MD | NAP | 14.8 miles | NAP | FEMA (renewal) | 54,000 | Nov-17 | $30.30 | 4.0 | Full Service |
2115 East Jefferson
Rockville, MD | NAP | 1.6 miles | NAP | NIH (extension) | 89,708 | Nov-17 | $29.00 | 2.1 | None |
Campus at Sunrise
Reston, VA | NAP | 20.7 miles | NAP | CIA (renewal) | 31,230 | Oct-17 | $33.50 | 5.0 | Plus Electric |
Freedom Forum
Arlington, VA | NAP | 21.0 miles | NAP | Trade and Development Agency | 36,346 | Jun-17 | $45.00 | 10.75 | Full Service |
1701 Fort Myer
Arlington, VA | NAP | 21.0 miles | NAP | Department of State | 342,967 | Jun-17 | $39.00 | 15.0 | Full Service |
Woodmont Place
Rockville, MD | NAP | 1.4 miles | NAP | FDA | 44,761 | Mar-16 | $27.00 | 5.0 | Full Service |
| (1) | Information obtained from the appraisal. |
| (2) | Year Built/Renovated and Total GLA (SF) for the comparable leases were not provided in the appraisal. |
| (3) | Based on the underwritten rent roll with the exception of Year Built/Renovated. |
THE INFORMATION IN THIS STRUCTURAL AND COLLATERAL TERM SHEET IS NOT COMPLETE AND MAY BE AMENDED PRIOR TO THE TIME OF SALE. THIS TERM SHEET IS NOT AN OFFER TO SELL THESE SECURITIES AND IT IS NOT A SOLICITATION OF AN OFFER TO BUY THESE SECURITIES IN ANY JURISDICTION WHERE THE OFFER OR SALE IS NOT PERMITTED.
135
| Office – Suburban | Loan # 9 | Cut-off Date Balance: | | $65,400,000 |
| 5600 Fishers Lane | Parklawn Building | Cut-off Date LTV: | | 60.0% |
| Rockville, MD 20852 | | U/W NCF DSCR: | | 2.68x |
| | | U/W NOI Debt Yield: | | 9.4% |
Escrows.
Real Estate Taxes – The Parklawn Building Borrower deposited $372,746 into a real estate tax reserve at origination and is required to deposit an ongoing monthly real estate tax reserve payment in an amount equal to 1/12 of the annual estimated real estate taxes, which currently equates to $124,249.
Insurance – The Parklawn Building Borrower deposited $19,441 into an insurance reserve at origination and is required to deposit an ongoing monthly insurance reserve payment in an amount equal to 1/12 of the annual estimated insurance premiums, which currently equates to $9,720.
Deferred Maintenance – The Parklawn Building Borrower deposited $111,869 for deferred maintenance at origination.
Lockbox and Cash Management. The Parklawn Building Whole Loan is structured with a hard lockbox and in-place cash management. Revenues from the Parklawn Building Property are required to be deposited directly into the clearing account controlled by the lender and transferred daily into the cash management account to be applied and disbursed in accordance with the Parklawn Building Whole Loan documents. During the occurrence and continuance of a Cash Sweep Period, all excess cash is required to be held by the lender as additional collateral for the Parklawn Building Whole Loan.
A “Cash Sweep Period” will:
| (a) | commence upon the occurrence of an event of default under the Parklawn Building Whole Loan, and will continue until such event of default is cured; |
| (b) | commence when the amortizing debt service coverage ratio based on the trailing three-month period is less than 1.55x, and will continue until the amortizing debt service coverage ratio based on the trailing three-month period is at least 1.60x for two consecutive calendar quarters; |
| (c) | commence upon the occurrence of any bankruptcy action of (i) the Parklawn Building Borrower or (ii) the property manager, and will continue either (x) as it relates to the Parklawn Building Borrower, until the full repayment of the Parklawn Building Whole Loan or (y) as it relates to the property manager, until the manager is replaced by a qualified manager within 60 days of such bankruptcy action; or |
| (d) | commence when a Sweep Tenant (as defined below) either: |
| I. | fails to exercise a renewal option under its lease on or prior to the date by which notice of such renewal option is required, and will continue until a Sweep Tenant Re-Leasing Event (as defined below) occurs; |
| II. | terminates or cancels its lease, and will continue until a Sweep Tenant Re-Leasing Event occurs; |
| III. | ceases to operate in 50% or more of its leased space unless such dark space has been subleased to a subtenant which has and maintains a credit rating of at least BBB- by S&P and Baa3 by Moody’s, and will continue until (x) such Sweep Tenant has resumed operations in more than 50% of its leased space, or (y) a Sweep Tenant Re-Leasing Event occurs; |
| IV. | defaults (beyond applicable notice and cure periods) under its lease, and will continue until the Parklawn Building Borrower’s acceptance of the cure of the default in a manner acceptable to the lender; |
| V. | is the subject (or its parent is the subject) of any bankruptcy or insolvency proceedings, and will continue until the insolvency proceedings have terminated and the Sweep Tenant’s lease has been affirmed, assumed, or assigned in a manner satisfactory to the lender; or |
| VI. | has its (or its parent’s) credit rating fall below BBB- by S&P or Baa3 by Moody’s, and will continue until (x) the credit rating has been restored to at least BBB- by S&P and Baa3 by Moody’s, or (y) a Sweep Tenant Re-Leasing Event has occurred. |
A “Sweep Tenant” means each of (i) the United States of America, acting by and through the designated representative of the General Services Administration and/or (ii) its replacement tenant of at least 75% of its leased space.
A “Sweep Tenant Re-Leasing Event” means the Parklawn Building Borrower enters into a replacement lease(s) acceptable to the lender for the applicable Sweep Tenant’s entire leased space, with such replacement tenant(s) having and maintaining a credit rating of at least BBB- by S&P and Baa3 by Moody’s, provided that all tenant improvements and landlord obligations with respect to such replacement lease(s) have been paid and performed in full and that the replacement tenant(s) has commenced payment of full, unabated rent.
Property Management.The Parklawn Building Property is managed by JBGS/TRS, L.L.C.
Partial Release. Any time after two years from the closing date of the BANK 2020-BNK25 securitization trust, the Parklawn Building Borrower may establish a condominium regime acceptable to the lender for the Parklawn Building Property in order to release a portion of the collateral comprised of the above-grade portion of wing C (the “Release Unit”), provided that, among other things, (i) no Cash Sweep Period is continuing, (ii) the Parklawn Building Borrower establishes a condominium in accordance with the requirements of the Parklawn Building Whole Loan documents, (iii) the Parklawn Building Borrower defeases a portion of the Parklawn Building Whole Loan in an amount equal to (1) $2,400,000 if released to an unaffiliated third-party or (2) in connection with a transfer to any affiliate of the Parklawn Building Borrower, the greater of (A) $2,400,000, or (B) 100% of the net sales proceeds, (iv) following the release of the Release Unit and partial defeasance of the Parklawn Building Whole Loan, the debt yield (calculated with a vacancy adjustment equal to the greater of actual vacancy or 3%) is equal to or greater than the greater of (x) the debt yield immediately preceding such release and (y) 9.24%, (v) the debt service coverage ratio (calculated with a vacancy adjustment equal to the greater of actual vacancy or 3% and assuming a 30-year amortization period) is equal to or greater than the greater of (x) the debt service coverage ratio
THE INFORMATION IN THIS STRUCTURAL AND COLLATERAL TERM SHEET IS NOT COMPLETE AND MAY BE AMENDED PRIOR TO THE TIME OF SALE. THIS TERM SHEET IS NOT AN OFFER TO SELL THESE SECURITIES AND IT IS NOT A SOLICITATION OF AN OFFER TO BUY THESE SECURITIES IN ANY JURISDICTION WHERE THE OFFER OR SALE IS NOT PERMITTED.
136
| Office – Suburban | Loan # 9 | Cut-off Date Balance: | | $65,400,000 |
| 5600 Fishers Lane | Parklawn Building | Cut-off Date LTV: | | 60.0% |
| Rockville, MD 20852 | | U/W NCF DSCR: | | 2.68x |
| | | U/W NOI Debt Yield: | | 9.4% |
immediately preceding such release and (y) 1.74x and (vi) the loan to value ratio is equal to or less than the lesser of (x) the loan to value ratio immediately preceding such partial release and (y) 60.0%; provided that if the tests in clauses (iv), (v), and (vi) above are not satisfied, the Parklawn Building Borrower may deposit cash with the lender in the amount that if applied to the reduction of the outstanding principal balance of the Parklawn Building Whole Loan, would result in the satisfaction of such tests, which cash will be held as additional collateral for the Parklawn Building Whole Loan.
Real Estate Substitution.Not permitted.
Subordinate and Mezzanine Indebtedness.Not permitted.
Ground Lease. None.
Terrorism Insurance. The Parklawn Building Borrower is required to obtain and maintain “all risk” property insurance that covers perils of terrorism and acts of terrorism in an amount equal to the full replacement cost of the Parklawn Building Property and business interruption insurance for 18 months with a six-month extended period of indemnity. See “Risk Factors—Risks Relating to the Mortgage Loans—Terrorism Insurance May Not Be Available for All Mortgaged Properties” in the Preliminary Prospectus.
THE INFORMATION IN THIS STRUCTURAL AND COLLATERAL TERM SHEET IS NOT COMPLETE AND MAY BE AMENDED PRIOR TO THE TIME OF SALE. THIS TERM SHEET IS NOT AN OFFER TO SELL THESE SECURITIES AND IT IS NOT A SOLICITATION OF AN OFFER TO BUY THESE SECURITIES IN ANY JURISDICTION WHERE THE OFFER OR SALE IS NOT PERMITTED.
137
| Hospitality – Select Service | Loan #10 | Cut-off Date Balance: | | $54,650,000 |
| 550 15th Street | Hilton Denver Dual Brand Hotel | Cut-off Date LTV: | | 63.2% |
| Denver, CO 80202 | | U/W NCF DSCR: | | 2.81x |
| | | U/W NOI Debt Yield: | | 12.4% |

THE INFORMATION IN THIS STRUCTURAL AND COLLATERAL TERM SHEET IS NOT COMPLETE AND MAY BE AMENDED PRIOR TO THE TIME OF SALE. THIS TERM SHEET IS NOT AN OFFER TO SELL THESE SECURITIES AND IT IS NOT A SOLICITATION OF AN OFFER TO BUY THESE SECURITIES IN ANY JURISDICTION WHERE THE OFFER OR SALE IS NOT PERMITTED.
138
| Hospitality – Select Service | Loan #10 | Cut-off Date Balance: | | $54,650,000 |
| 550 15th Street | Hilton Denver Dual Brand Hotel | Cut-off Date LTV: | | 63.2% |
| Denver, CO 80202 | | U/W NCF DSCR: | | 2.81x |
| | | U/W NOI Debt Yield: | | 12.4% |

THE INFORMATION IN THIS STRUCTURAL AND COLLATERAL TERM SHEET IS NOT COMPLETE AND MAY BE AMENDED PRIOR TO THE TIME OF SALE. THIS TERM SHEET IS NOT AN OFFER TO SELL THESE SECURITIES AND IT IS NOT A SOLICITATION OF AN OFFER TO BUY THESE SECURITIES IN ANY JURISDICTION WHERE THE OFFER OR SALE IS NOT PERMITTED.
139
| No. 10 – Hilton Denver Dual Brand Hotel |
| |
| Mortgage Loan Information | | Mortgaged Property Information |
| Mortgage Loan Seller: | Wells Fargo Bank, National Association | | Single Asset/Portfolio: | Single Asset |
| Credit Assessment (Fitch/KBRA/S&P): | NR/NR/NR | | Property Type – Subtype: | Hospitality – Select Service |
| Original Principal Balance: | $54,650,000 | | Location: | Denver, CO |
| Cut-off Date Balance: | $54,650,000 | | Size: | 302 Rooms |
| % of Initial Pool Balance: | 3.3% | | Cut-off Date Balance Per Room | $180,960 |
| Loan Purpose: | Acquisition | | Maturity Date Balance Per Room: | $180,960 |
| Borrower Sponsor: | Noble Hospitality Fund IV - Income, L.P. | | Year Built/Renovated: | 1962 / 2019 |
| Guarantor: | Noble Hospitality Fund IV - Income, L.P. | | Title Vesting: | Fee |
| Mortgage Rate: | 3.8820% | | Property Manager: | Interstate Management Company, LLC |
| Note Date: | November 21, 2019 | | Current Occupancy (As of): | 97.0% (9/30/2019) |
| Seasoning: | 2 months | | YE 2018 Occupancy: | 92.3% |
| Maturity Date: | December 11, 2026 | | YE 2017 Occupancy: | 84.4% |
| IO Period: | 84 months | | YE 2016 Occupancy: | 78.2% |
| Loan Term (Original): | 84 months | | YE 2015 Occupancy: | 79.2% |
| Amortization Term (Original): | NAP | | As-Is Appraised Value: | $86,500,000 |
| Loan Amortization Type: | Interest-only, Balloon | | As-Is Appraised Value Per Room: | $286,424 |
| Call Protection: | L(24),GRTR 1% or YM(53),O(7) | | As-Is Appraisal Valuation Date: | October 29, 2019 |
| Lockbox Type: | Springing | | | |
| Additional Debt: | None | | | |
| Additional Debt Type (Balance): | NAP | | Underwriting and Financial Information |
| | | | TTM NOI (9/30/2019): | $6,900,385 |
| | | | YE 2018 NOI: | $6,933,697 |
| | | | YE 2017 NOI: | $6,813,303 |
| | | | YE 2016 NOI: | $6,755,847 |
| | | | U/W Revenues: | $18,805,119 |
| | | | U/W Expenses: | $12,002,735 |
| | | | | | U/W NOI: | $6,802,384 |
| Escrows and Reserves(1) | | U/W NCF: | $6,050,180 |
| | Initial | Monthly | Cap | | U/W DSCR based on NOI/NCF: | 3.15x / 2.81x |
| Taxes | $572,462 | $81,780 | NAP | | U/W Debt Yield based on NOI/NCF: | 12.4% / 11.1% |
| Insurance | $0 | Springing | NAP | | U/W Debt Yield at Maturity based on NOI/NCF: | 12.4% / 11.1% |
| FF&E Reserve | $0 | $62,684 | NAP | | Cut-off Date LTV Ratio: | 63.2% |
| PIP Reserve | $4,500,000 | Springing | NAP | | LTV Ratio at Maturity: | 63.2% |
| | | | | | | |
| | | | | | | | |
| Sources and Uses |
| Sources | | | | Uses | | |
| Original Mortgage Loan Amount | $54,650,000 | 59.7% | | Purchase price | $86,600,000 | 94.6% |
| Borrower’s equity | 36,886,912 | 40.3 | | Seller credit(2) | ($1,000,000) | (1.1)% |
| | | | | Upfront reserves | 5,072,462 | 5.5 |
| | | | | Closing costs | 864,450 | 0.9 |
| Total Sources | $91,536,912 | 100.0% | | Total Uses | $91,536,912 | 100.0% |
| (1) | See “Escrows” section. |
| (2) | The $1.0 million seller credit is related to capital expenditure items at the Hilton Denver Dual Brand Hotel. |
The Mortgage Loan. The mortgage loan (the “Hilton Denver Dual Brand Mortgage Loan”) is evidenced by a single promissory note secured by a first mortgage encumbering the fee interest in a select service hotel located in Denver, Colorado (the “Hilton Denver Dual Brand Center Property”).
The Borrower and Borrower Sponsor.The borrower is NF IV – I Denver CC, LLC, a Delaware limited liability company and single purpose entity with one independent director (the “Hilton Denver Dual Brand Borrower”). The Hilton Denver Dual Brand Borrower is directly owned by a real estate investment trust (“REIT”), which requires the borrower entity to lease the related hotel via an operating lease to a taxable REIT subsidiary. Legal counsel to the borrower delivered a non-consolidation opinion in connection with the origination of the Hilton Denver Dual Brand Mortgage Loan. The borrower sponsor and nonrecourse carve-out guarantor of the Hilton Denver Dual Brand Mortgage Loan is Noble Hospitality Fund IV - Income, L.P., an affiliate of Noble Investment Group.
THE INFORMATION IN THIS STRUCTURAL AND COLLATERAL TERM SHEET IS NOT COMPLETE AND MAY BE AMENDED PRIOR TO THE TIME OF SALE. THIS TERM SHEET IS NOT AN OFFER TO SELL THESE SECURITIES AND IT IS NOT A SOLICITATION OF AN OFFER TO BUY THESE SECURITIES IN ANY JURISDICTION WHERE THE OFFER OR SALE IS NOT PERMITTED.
140
| Hospitality – Select Service | Loan #10 | Cut-off Date Balance: | | $54,650,000 |
| 550 15th Street | Hilton Denver Dual Brand Hotel | Cut-off Date LTV: | | 63.2% |
| Denver, CO 80202 | | U/W NCF DSCR: | | 2.81x |
| | | U/W NOI Debt Yield: | | 12.4% |
Founded in 1993, Noble Investment Group (“Noble”) is a real estate investment firm specializing in upscale select service and extended-stay hotels affiliated with Marriott, Hyatt and Intercontinental. As of December 2019, Noble had invested over $3 billion in hotels throughout the United States. As of January 2020, Noble operated more than 7,000 hotel and resort guest rooms (including one other hotel totaling 228 rooms in Denver) including over 800,000 square feet of meeting space, convention and conference centers, championship golf courses, spas, and fine dining operations. The sponsor owned a property that secured a loan which was subject to a loan modification in 2010. See“Description of the Mortgage Pool–Loan Purpose; Default History, Bankruptcy Issues and Other Proceedings”in the Preliminary Prospectus.
The Property.The Hilton Denver Dual Brand Property is a 12-story, 302-key select service hotel located in Denver, Colorado. Built in 2013, the Hilton Denver Dual Brand Property operates as a dual-branded Hampton Inn and Suites (“Hampton Inn”) (120 rooms) and Homewood Suites (182 rooms) hotel with a combined lobby, front desk, and amenities. Amenities at the Hilton Denver Dual Brand Property include a complimentary breakfast buffet and seating area, a small restaurant and bar, 7,606 square feet of meeting space, a fitness center, an indoor swimming pool, a 24-hour convenience market, and a 52-space below grade parking garage that can accommodate 104 vehicles via automated stacking lifts.
The Hampton Inn features 47 standard king rooms, 11 king studio rooms, 10 king ADA rooms, 40 double queen rooms, 7 double queen studios and 5 double queen ADA rooms. The Hampton Inn guestrooms, which are generally smaller and located on floors 2 through 5, feature 42” HD flat screen televisions, work desks with ergonomic chairs, lounge chairs, mini-refrigerators and mini-microwaves. The Homewood Suites features 108 standard king rooms, 12 large studio king rooms, 34 mountain view king rooms, 14 panoramic studio king rooms, and 14 ADA king rooms. The Homewood Suites guestrooms, which are located on floors 6 through 12, feature a full kitchen with refrigerator, two-burner stovetops, a dining area, and a separate living area.
The Hilton Denver Dual Brand Property, which previously operated as an office property from 1963 until 2012, was gut renovated and opened in April 2013 as a select service hotel. The Hilton Denver Dual Brand Property underwent a $1.0 million lobby renovation in July 2019 that combined the front desks and breakfast areas for the Hampton Inn and Homewood Suites. The Hilton Denver Dual Brand Borrower is required to complete a $5.5 million ($18,212/key) brand-mandated property improvement plan (“PIP”), which is expected to begin at the end of 2021 and is required to be completed by May 2022. Of the $5.5 million budget, approximately $3.3 million has been allocated to the Homewood Suites and $2.2 million has been allocated to the Hampton Inn. The PIP is expected to include upgrades to guestrooms ($2.4 million), meeting space, recreation facilities, and technological upgrades, amongst other items. The lender reserved $4.5 million for the planned PIP upfront at loan closing (see “Escrows” section below). At closing, the Hilton Denver Dual Brand Borrower executed two new 15-year franchise agreements with Hilton, each of which expires on November 30, 2034, approximately 8 years beyond loan maturity.
The following table presents certain information relating to the demand analysis with respect to the Hilton Denver Dual Brand Property based on market segmentation for the trailing 12-month period ending August 31, 2019:
Market Segmentation(1)
Flag | Corporate | Meeting/Group | Leisure |
| Hampton Inn | 40.0% | 35.0% | 25.0% |
| Homewood Suites | 40.0% | 35.0% | 25.0% |
| (1) | Information obtained from the appraisal. |
THE INFORMATION IN THIS STRUCTURAL AND COLLATERAL TERM SHEET IS NOT COMPLETE AND MAY BE AMENDED PRIOR TO THE TIME OF SALE. THIS TERM SHEET IS NOT AN OFFER TO SELL THESE SECURITIES AND IT IS NOT A SOLICITATION OF AN OFFER TO BUY THESE SECURITIES IN ANY JURISDICTION WHERE THE OFFER OR SALE IS NOT PERMITTED.
141
| Hospitality – Select Service | Loan #10 | Cut-off Date Balance: | | $54,650,000 |
| 550 15th Street | Hilton Denver Dual Brand Hotel | Cut-off Date LTV: | | 63.2% |
| Denver, CO 80202 | | U/W NCF DSCR: | | 2.81x |
| | | U/W NOI Debt Yield: | | 12.4% |
Operating History and Underwritten Net Cash Flow. The following table presents certain information relating to the historical operating performance and the underwritten net cash flow at the Hilton Denver Dual Brand Property:
Cash Flow Analysis
| | 2016 | 2017 | 2018 | TTM 9/30/2019 | U/W | % of U/W Total Revenue(1) | U/W $ per Room |
| Occupancy | 78.2% | 84.4% | 92.3% | 97.0% | 90.0% | | |
| ADR | $170.45 | $168.02 | $163.54 | $160.13 | $172.60 | | |
| RevPAR | $133.23 | $141.74 | $150.93 | $155.34 | $155.34 | | |
| | | | | | | | |
| Room Revenue | $14,726,156 | $15,623,537 | $16,636,668 | $17,122,934 | $17,122,934 | 91.1% | $56,698 |
| Food & Beverage Revenue | 467,611 | 547,242 | 602,633 | 579,742 | 602,633 | 3.2 | 1,995 |
| Other Revenue(2) | 1,005,741 | 1,034,562 | 1,074,937 | 1,079,552 | 1,079,552 | 5.7 | 3,575 |
| Total Revenue | $16,199,508 | $17,205,341 | $18,314,238 | $18,782,228 | 18,805,119 | 100.0% | $62,269 |
| | | | | | | | |
| Room Expense | 2,964,645 | 3,152,232 | 3,811,165 | 4,093,904 | 4,093,904 | 23.9 | 13,556 |
| Food & Beverage Expense | 241,044 | 325,455 | 386,980 | 410,784 | 410,784 | 68.2 | 1,360 |
| Other Department Expense | 495,454 | 475,175 | 515,752 | 568,066 | 568,066 | 52.6 | 1,881 |
| Total Department Expenses | 3,701,143 | 3,952,862 | 4,713,897 | 5,072,754 | 5,072,754 | 27.0 | 16,797 |
| Gross Operating Income | $12,498,365 | $13,252,479 | $13,600,341 | $13,709,474 | $13,732,365 | 73.0% | $45,471 |
| | | | | | | | |
| Total Undistributed Expenses | 4,854,973 | 5,354,113 | 5,627,691 | 5,667,789 | 5,643,877 | 30.0 | 18,688 |
| Gross Operating Profit | $7,643,392 | $7,898,366 | $7,972,650 | $8,041,685 | $8,088,488 | 43.0% | $26,783 |
| | | | | | | | |
| Total Fixed Charges | 887,545 | 1,085,063 | 1,038,953 | 1,141,300 | 1,286,104 | 6.8 | 4,259 |
| Total Operating Expenses | $9,443,661 | $10,392,038 | $11,380,541 | $11,881,843 | $12,002,735 | 63.8% | $39,744 |
| | | | | | | | |
| Net Operating Income | $6,755,847 | $6,813,303 | $6,933,697 | $6,900,385 | $6,802,384 | 36.2% | $22,524 |
| FF&E | 0 | 0 | 0 | 0 | 752,205 | 4.0 | 2,491 |
| Net Cash Flow | $6,755,847 | $6,813,303 | $6,933,697 | $6,900,385 | $6,050,180 | 32.2% | $20,034 |
| | | | | | | | |
| NOI DSCR | 3.13x | 3.16x | 3.21x | 3.20x | 3.15x | | |
| NCF DSCR | 3.13x | 3.16x | 3.21x | 3.20x | 2.81x | | |
| NOI DY | 12.4% | 12.5% | 12.7% | 12.6% | 12.4% | | |
| NCF DY | 12.4% | 12.5% | 12.7% | 12.6% | 11.1% | | |
| | | | | | | | |
| (1) | % of U/W Total Revenue for Room Expense, F&B Expense and Other Department Expenses are based on their corresponding revenue line items. All other line items represent percent of Total Revenue. |
| (2) | Other Revenue includes parking income, telephone, valet, coin laundry, vending, gift shop and other miscellaneous items. |
Appraisal.The appraiser concluded to an “as-is” appraised value of $86,500,000 with an appraisal valuation date of October 29, 2019.
Environmental Matters. According to a Phase I environmental assessment dated September 20, 2019, there was no evidence of any recognized environmental conditions at the Hilton Denver Dual Brand Property.
Market Overview and Competition.The Hilton Denver Dual Brand Property is located in the central business district of Denver, Colorado. The Hilton Denver Dual Brand Property is located approximately 1.4 miles southeast of Interstate 25, 0.5 miles northwest of Interstate 70, 0.9 miles southeast of Union Station, and 24.8 miles southwest of Denver International Airport.
The Hilton Denver Dual Brand Property is situated adjacent to the Colorado Convention Center. According to the appraisal, the Colorado Convention Center hosted 182 events with approximately 900,000 attendees in 2018. The Colorado Convention Center expansion project, which is expected to cost approximately $233.0 million and add approximately 80,000 square feet of meeting space and a 50,000 square foot rooftop terrace, was approved in 2015. The Hilton Denver Dual Brand Property is also situated proximate to Block 162, a 30-story office property with approximately 595,000 square feet of office space and 9,900 square feet of ground floor retail that is expected to be completed by year-end 2020. The Hilton Denver Dual Brand Property is situated within approximately 1 mile of various tourist attractions including Coors Field (home of the Major League Baseball Colorado Rockies), Pepsi Center (home of the NBA Denver Nuggets), Colorado State Capitol, and the Denver Performing Arts Complex. According to a third party market research report, for the third consecutive year, Denver experienced over 31.0 million total visitors in 2018 who spent an estimated $6.5 billion. For the 15th year in a row, leisure travelers grew in 2018 reaching a record 7.1 million people. According to the appraisal, Occupancy, ADR and RevPAR within the Downtown Denver submarket increased by 12.2%, 19.9% and 40.9%, respectively, from 2008 to September 2019 YTD. According to the appraisal, there is a dual-branded 383-room Home 2 Suites and Tru by Hilton located one block northwest of the Hilton Denver Dual Brand Property that recently opened in November 2019, which is expected to compete directly with the Hilton Denver Dual Brand Property.
According to the Appraisal, the City of Denver has experienced annual population growth of approximately 2.1% since 2010, and is projected to increase by 1.6% annually through 2024. Additionally, the estimated 2019 population within a one- and three- mile radius
THE INFORMATION IN THIS STRUCTURAL AND COLLATERAL TERM SHEET IS NOT COMPLETE AND MAY BE AMENDED PRIOR TO THE TIME OF SALE. THIS TERM SHEET IS NOT AN OFFER TO SELL THESE SECURITIES AND IT IS NOT A SOLICITATION OF AN OFFER TO BUY THESE SECURITIES IN ANY JURISDICTION WHERE THE OFFER OR SALE IS NOT PERMITTED.
142
| Hospitality – Select Service | Loan #10 | Cut-off Date Balance: | | $54,650,000 |
| 550 15th Street | Hilton Denver Dual Brand Hotel | Cut-off Date LTV: | | 63.2% |
| Denver, CO 80202 | | U/W NCF DSCR: | | 2.81x |
| | | U/W NOI Debt Yield: | | 12.4% |
of the Hilton Denver Dual Brand Property was 44,653 and 233,287, respectively; and the estimated 2019 average household income within the same radii was $93,731 and $98,591, respectively.
The following tables present historical occupancy, ADR, RevPAR and penetration rates relating to the Hampton Inn and the Homewood Suites’ competitive sets.
Hampton Inn and Market Historical Occupancy, ADR and RevPAR(1)
| | Competitive Set | Hampton Inn | Penetration Factor |
Year | Occupancy | ADR | RevPAR | Occupancy | ADR | RevPAR | Occupancy | ADR | RevPAR |
| TTM 10/31/2019 | 77.0% | $163.02 | $125.48 | 96.9% | $162.82 | $157.73 | 125.9% | 99.9% | 125.7% |
| 12/31/2018 | 73.6% | $167.16 | $123.05 | 92.0% | $163.18 | $150.21 | 125.0% | 97.6% | 122.1% |
| 12/31/2017 | 75.8% | $174.37 | $132.11 | 83.5% | $168.62 | $140.72 | 110.2% | 96.7% | 106.5% |
| 12/31/2016 | 73.7% | $170.54 | $125.67 | 76.4% | $171.11 | $130.80 | 103.7% | 100.3% | 104.1% |
| (1) | Information obtained from third party hospitality research reports dated November 18, 2019 and January 17, 2019. The competitive set includes the following hotels: Hampton Inn Denver Downtown Convention Center, Holiday Inn Express Denver Downtown, Hampton Inn Denver Downtown, Hilton Garden Inn Denver Downtown, aloft Hotel Denver Downtown, and Hyatt Place Denver Downtown. |
Homewood Suites and Market Historical Occupancy, ADR and RevPAR(1)
| | Competitive Set | Homewood Suites | Penetration Factor |
Year | Occupancy | ADR | RevPAR | Occupancy | ADR | RevPAR | Occupancy | ADR | RevPAR |
| TTM 10/31/2019 | 79.6% | $169.13 | $134.61 | 96.9% | $161.06 | $156.14 | 121.8% | 95.2% | 116.0% |
| 12/31/2018 | 78.2% | $171.23 | $133.95 | 92.5% | $165.13 | $152.77 | 118.3% | 96.4% | 114.0% |
| 12/31/2017 | 77.5% | $175.76 | $136.13 | 84.7% | $168.14 | $142.44 | 109.4% | 95.7% | 104.6% |
| 12/31/2016 | 72.5% | $175.49 | $127.26 | 78.7% | $171.36 | $134.89 | 108.6% | 97.6% | 106.0% |
| (1) | Information obtained from third party hospitality research reports dated November 18, 2019 and January 17, 2019. The competitive set includes the following hotels: Homewood Suites by Hilton Denver Downtown Convention Center, Crowne Plaza Denver, Courtyard Denver Downtown, Residence Inn Denver City Center, Hilton Garden Inn Denver Downtown, SpringHill Suites Denver Downtown, Hyatt House Denver Downtown, Hyatt Place Denver Downtown. |
Escrows.
Real Estate Taxes – The loan documents require an upfront real estate tax reserve of $572,462 and ongoing monthly real estate tax reserves in an amount equal to one-twelfth of the real estate taxes that the lender estimates will be payable during the next 12 months (initially $81,780).
Insurance – The loan documents do not require ongoing monthly escrows for insurance premiums as long as (i) no event of default has occurred and is continuing, (ii) the borrower or borrower affiliate provides the lender with evidence that the Hilton Denver Dual Brand Property’s insurance coverage is included in a blanket policy and such policy is in full force and effect and (iii) the borrower pays all applicable insurance premiums and provides the lender with evidence of payment of insurance premiums/renewals within ten business days.
FF&E Reserve – The loan documents require ongoing monthly FF&E Reserves of 4.0% of the total revenue (the initial estimated FF&E monthly deposit is $62,684).
PIP Reserve – The loan documents require an upfront reserve of $4,500,000 for estimated expenses related to remaining planned renovations, and an additional springing deposit of 100% of the estimated cost reasonably determined by lender to complete any additional PIP work required by the franchisor under the franchise agreement.
Lockbox and Cash Management.Upon the occurrence of a Cash Trap Event Period (as defined below), the Hilton Denver Dual Brand Borrower is required to establish a lender-controlled lockbox account and deposits all rents and direct all credit card companies to pay all amounts due directly into such lockbox account. During the continuance of a Cash Trap Event Period, all funds in the lockbox account are required to be swept into the cash management account controlled by the lender and disbursed on each payment date in accordance with the Hilton Denver Dual Brand Mortgage Loan documents and all excess funds are required to be swept to an excess cash flow subaccount controlled by the lender.
A “Cash Trap Event Period” will commence upon the earlier of the following:
| (i) | the occurrence and continuance of an event of default; or |
| (ii) | the net operating income debt yield falling below 8.5% at the end of any calendar quarter. |
THE INFORMATION IN THIS STRUCTURAL AND COLLATERAL TERM SHEET IS NOT COMPLETE AND MAY BE AMENDED PRIOR TO THE TIME OF SALE. THIS TERM SHEET IS NOT AN OFFER TO SELL THESE SECURITIES AND IT IS NOT A SOLICITATION OF AN OFFER TO BUY THESE SECURITIES IN ANY JURISDICTION WHERE THE OFFER OR SALE IS NOT PERMITTED.
143
| Hospitality – Select Service | Loan #10 | Cut-off Date Balance: | | $54,650,000 |
| 550 15th Street | Hilton Denver Dual Brand Hotel | Cut-off Date LTV: | | 63.2% |
| Denver, CO 80202 | | U/W NCF DSCR: | | 2.81x |
| | | U/W NOI Debt Yield: | | 12.4% |
A Cash Trap Event Period will end upon the occurrence of the following:
| | with regard to clause (i) above, the cure of such event of default; or |
| | with regard to clause (ii) above, (a) the net operating income debt yield being at least 8.75% for two consecutive calendar quarters or (b) the Hilton Denver Dual Brand Borrower making a prepayment to the Hilton Denver Dual Brand Mortgage Loan in an amount sufficient for the net operating income debt yield to be equal to or greater than 8.5% with yield maintenance premium and any interest shortfall relating to such prepayment. |
Property Management.The Hilton Denver Dual Brand Property is managed by Interstate Management Company, LLC (“Interstate”). Founded in 1960, Interstate has over 35,000 employees and manages approximately 82,000 hotel rooms across 500 hotels, resorts and conference centers.
Partial Release.Not permitted.
Real Estate Substitution.Not permitted.
Subordinate and Mezzanine Indebtedness.Not permitted.
Ground Lease.None.
Terrorism Insurance.The Hilton Denver Dual Brand Mortgage Loan documents require that the “all risk” insurance policy required to be maintained by the borrower provide coverage for terrorism in an amount equal to the full replacement cost of The Hilton Denver Dual Brand Property, as well as business interruption insurance covering no less than the 18-month period following the occurrence of a casualty event, together with a six-month extended period of indemnity (provided that if TRIPRA or a similar statute is not in effect, the borrower will not be obligated to pay terrorism insurance premiums in excess of two times the premium for the casualty and business interruption coverage on a stand-alone basis).
THE INFORMATION IN THIS STRUCTURAL AND COLLATERAL TERM SHEET IS NOT COMPLETE AND MAY BE AMENDED PRIOR TO THE TIME OF SALE. THIS TERM SHEET IS NOT AN OFFER TO SELL THESE SECURITIES AND IT IS NOT A SOLICITATION OF AN OFFER TO BUY THESE SECURITIES IN ANY JURISDICTION WHERE THE OFFER OR SALE IS NOT PERMITTED.
144
(THIS PAGE INTENTIONALLY LEFT BLANK)
THE INFORMATION IN THIS STRUCTURAL AND COLLATERAL TERM SHEET IS NOT COMPLETE AND MAY BE AMENDED PRIOR TO THE TIME OF SALE. THIS TERM SHEET IS NOT AN OFFER TO SELL THESE SECURITIES AND IT IS NOT A SOLICITATION OF AN OFFER TO BUY THESE SECURITIES IN ANY JURISDICTION WHERE THE OFFER OR SALE IS NOT PERMITTED.
145
No. 11 – Park Tower at Transbay |
|
Mortgage Loan Information | | Mortgaged Property Information |
Mortgage Loan Seller: | Bank of America, National Association | | Single Asset/Portfolio: | Single Asset |
Credit Assessment (Fitch/KBRA/S&P): | BBB-sf/A(sf)/BBB(sf) | | Property Type – Subtype: | Office – CBD |
Original Principal Balance(1): | $50,000,000 | | Location: | San Francisco, CA |
Cut-off Date Balance(1): | $50,000,000 | | Size: | 764,659 SF |
% of Initial Pool Balance: | 3.1% | | Cut-off Date Balance Per SF(1): | $719.27 |
Loan Purpose: | Refinance | | Maturity Date/ARD Balance Per SF(1)(2): | $719.27 |
Borrower Sponsor: | MetLife, Inc. | | Year Built/Renovated: | 2018/NAP |
Guarantor: | Park Tower Owner LLC | | Title Vesting: | Fee |
Mortgage Rate: | 3.4500% | | Property Manager: | Self-Managed |
Note Date: | July 23, 2019 | | Current Occupancy (As of)(4): | 98.9% (10/1/2019) |
Seasoning: | 6 months | | YE 2018 Occupancy(5): | NAP |
Anticipated Repayment Date(2): | August 1, 2029 | | YE 2017 Occupancy(5): | NAP |
Maturity Date(2): | August 1, 2034 | | YE 2016 Occupancy(5): | NAP |
IO Period: | 120 months | | YE 2015 Occupancy(5): | NAP |
Loan Term (ARD)(2): | 120 months | | Appraised Value(6): | $1,120,000,000 |
Amortization Term: | NAP | | Appraised Value Per SF(6): | $1,464.71 |
Loan Amortization Type: | Interest-only, Balloon | | Appraisal Valuation Date(6): | October 1, 2019 |
Call Protection: | L(23),YM(90),O(7) | | Underwriting and Financial Information |
Lockbox Type: | Hard/Springing Cash Management | | TTM NOI(5): | NAP |
Additional Debt(1): | Yes | | YE 2018 NOI(5): | NAP |
Additional Debt Type (Balance)(1): | Pari Passu ($500,000,000) | | YE 2017 NOI(5): | NAP |
| | | YE 2016 NOI(5): | NAP |
| | | U/W Revenues: | $85,332,264 |
| | | U/W Expenses: | $28,981,596 |
Escrows and Reserves(3) | | U/W NOI: | $56,350,668 |
| Initial | Monthly | Cap | | U/W NCF: | $56,277,673 |
Taxes | $0 | Springing | NAP | | U/W DSCR based on NOI/NCF(1): | 2.93x / 2.93x |
Insurance | $0 | Springing | NAP | | U/W Debt Yield based on NOI/NCF(1): | 10.2% / 10.2% |
Deferred Maintenance | $4,412,926 | $0 | NAP | | U/W Debt Yield at Maturity/ARD based on NOI/NCF(1)(2): | 10.2% / 10.2% |
TI/LC | $80,198,366 | $0 | NAP | | Cut-off Date LTV Ratio(1)(6): | 49.1% |
Regulatory Fees Reserve | $5,528,653 | $0 | NAP | | LTV Ratio at Maturity/ARD(1)(2)(6): | 49.1% |
| | | | | | | |
Sources and Uses |
Sources | | | | | Uses | | | |
Original whole loan amount(1) | $550,000,000 | | 100.0% | | Loan payoff | $294,460,472 | | 53.5% |
| | | | | Upfront reserves(7) | 145,173,206 | | 26.4 |
| | | | | Return of equity | 108,543,869 | | 19.7 |
| | | | | Closing costs | 1,822,453 | | 0.3 |
Total Sources | $550,000,000 | | 100.0% | | Total Uses | $550,000,000 | | 100.0% |
(1) | The Park Tower at Transbay Mortgage Loan (as defined below) is a part of the Park Tower at Transbay Whole Loan (as defined below) with an original aggregate principal balance of $550,000,000. The Cut-off Date Balance Per SF, Maturity Date/ARD Balance Per SF, U/W DSCR based on NOI/NCF, U/W Debt Yield based on NOI/NCF, U/W Debt Yield at Maturity/ARD based on NOI/NCF, Cut-off Date LTV Ratio and LTV Ratio at Maturity/ARD numbers presented above are based on the Park Tower at Transbay Whole Loan. |
(2) | The Park Tower at Transbay Whole Loan is structured with a 120-month loan term until the Anticipated Repayment Date (“ARD”) of August 1, 2029 and will be interest-only prior to the ARD. From and after the ARD, the Park Tower at Transbay Whole Loan will accrue additional interest at a fixed rate of 2.5000% which will be deferred and due and payable on the Maturity Date of August 1, 2034 (or earlier repayment in full of the Park Tower at Transbay Whole Loan). The ARD automatically triggers a Cash Sweep Period (see “Lockbox and Cash Management”) whereby all excess cash flow is required to be used to pay down the principal balance of the Park Tower at Transbay Whole Loan and repay the additional accrued interest. |
(3) | Monthly escrows for taxes and insurance will be waived so long as (x) no cash sweep period exists and (y) the Park Tower at Transbay borrower (provides evidence to the lender that all property taxes and insurance premiums have been paid in full. The Park Tower at Transbay Borrower deposited at loan origination (i) $4,412,926, which is equal to 110% of the estimated cost for the completion of the outstanding project costs for the construction of the Park Tower at Transbay Property, (ii) 80,198,366 for outstanding tenant improvement allowances owed to Facebook and (iii) $5,528,653 which is equal to 100% of the estimated cost for the regulatory fees in connection with the development of the Park Tower at Transbay Property as required pursuant to an owner participation/disposition and development agreement between the Successor Agency to the Redevelopment Agency of the City of San Francisco and the Park Tower at Transbay borrower and as required for Municipal Transportation Agency additional street use fees. |
(4) | The sole office tenant, Facebook, Inc. (98.9% of NRA), is currently in the process of building out its space and, according to the borrower sponsor, is in occupancy of floors 2-12 (Phase I) and is expected to move into its remaining space by September 2020. |
(5) | Prior historical operating statements and occupancy are not applicable, as the Park Tower at Transbay Property (as defined below) was constructed in 2018-2019. |
(6) | The Appraised Value shown reflects a “Prospective Market Value At Stabilization” value as of October 1, 2019, which assumes that Facebook, Inc. has commenced rent payments (which began in August 2019) and that all remaining construction project costs due by September 30, 2019 have been incurred (110% of the cost of which has been reserved by the lender). The “as-is” value as of May 30, 2019 of $959,000,000 results in both a Cut-off Date LTV Ratio and LTV Ratio at Maturity/ARD of 57.4% for the Park Tower at Transbay Whole Loan. The appraiser also provided an “as dark” value as of May 30, 2019 of $1,004,000,000, which results in both a Cut-off Date LTV Ratio and LTV Ratio at Maturity/ARD of 54.8% for the Park Tower at Transbay Whole Loan. The “as dark” value is greater than the “as-is” value due to the market rent being higher than the current contract rent at the Park Tower at Transbay Property. |
(7) | Reserves include $55,033,261 paid by the Park Tower at Transbay borrower at loan origination, which amount was subsequently disbursed to Facebook, Inc. by the escrow agent to buy out Facebook Inc.’s rent abatement period. |
THE INFORMATION IN THIS STRUCTURAL AND COLLATERAL TERM SHEET IS NOT COMPLETE AND MAY BE AMENDED PRIOR TO THE TIME OF SALE. THIS TERM SHEET IS NOT AN OFFER TO SELL THESE SECURITIES AND IT IS NOT A SOLICITATION OF AN OFFER TO BUY THESE SECURITIES IN ANY JURISDICTION WHERE THE OFFER OR SALE IS NOT PERMITTED.
146
Office – CBD | Loan #11 | Cut-off Date Balance: | | $50,000,000 |
250 Howard Street | Park Tower at Transbay | Cut-off Date LTV: | | 49.1% |
San Francisco, CA 94105 | | UW NCF DSCR: | | 2.93x |
| | UW NOI Debt Yield: | | 10.2% |
The Mortgage Loan. The mortgage loan (the “Park Tower at Transbay Mortgage Loan”) is a part of a whole loan (the “Park Tower at Transbay Whole Loan”) evidenced by ten pari passu promissory notes in the aggregate original principal amount of $550,000,000. The Park Tower at Transbay Whole Loan is secured by a first priority fee mortgage on a 764,659 square foot newly constructed, Class A office tower located in San Francisco, California (the “Park Tower at Transbay Property”).
The Park Tower at Transbay Mortgage Loan is evidenced by the non-controlling promissory Note A-6 in the original aggregate principal amount of $50,000,000. The controlling promissory Note A-3 and the non-controlling promissory Notes A-1, A-2, A-4, A-5, A-7, A-8, A-9 and A-10 are in the aggregate original principal amount of $500,000,000. See the Note Summary table below. The Park Tower at Transbay Whole Loan is being serviced pursuant to the pooling and servicing agreement for the BANK 2019-BNK21 securitization trust. See “Description of the Mortgage Pool—The Whole Loans—The Non-Serviced Pari Passu Whole Loans“ and “Pooling and Servicing Agreement” in the Preliminary Prospectus.
Note Summary
Notes | Original Principal Balance | Cut-off Date Balance | Note Holder | Controlling Piece |
A-1 | $100,000,000 | $100,000,000 | BANK 2019-BNK20 | No |
A-2 | $100,000,000 | $100,000,000 | BANK 2019-BNK23 | No |
A-3 | $100,000,000 | $100,000,000 | BANK 2019-BNK21 | Yes |
A-4 | $80,000,000 | $80,000,000 | BANK 2019-BNK22 | No |
A-5 | $50,000,000 | $50,000,000 | BANK 2019-BNK24 | No |
A-6 | $50,000,000 | $50,000,000 | BANK 2020-BNK25 | No |
A-7 | $25,000,000 | $25,000,000 | BANK 2019-BNK22 | No |
A-8 | $20,000,000 | $20,000,000 | BANK 2019-BNK20 | No |
A-9 | $15,000,000 | $15,000,000 | BANK 2019-BNK21 | No |
A-10 | $10,000,000 | $10,000,000 | BANK 2019-BNK22 | No |
Total | $550,000,000 | $550,000,000 | | |
The Property. The Park Tower at Transbay Property is comprised of a newly constructed, Class A, pre-certified LEED Gold, 43-story high-rise office building located on the northeast corner of Beale Street and Howard Street in the Transbay Transit District in the South Financial District of downtown San Francisco, California. The Park Tower at Transbay Property contains a total of 764,659 square feet. All of the office space (755,914 square feet) and the two-level subterranean parking are leased to Facebook, Inc. (“Facebook”). Facebook’s space includes a mix of open and private offices, various common areas, a cafeteria, fitness/wellness center and a child care center. There is 50,000 square feet of outdoor space including fourteen sky decks: large rooftop terraces on floors 12 and 28, and outside terraces on every third floor starting on floor 13 and ending on the top floor, 43. 70% of the floors have San Francisco Bay views.
The remaining rentable area is comprised of three retail spaces (8,745 square feet) on the ground floor. One of the retail spaces was leased to Blue Bottle after loan origination and the other spaces have been in lease negotiations with prospective tenants, according to the borrower sponsor. Building amenities include bike parking, an open plaza on the ground level, and two non-collateral adjacent public park spaces which are required to be maintained by the Park Tower at Transbay borrower sponsor.
The Park Tower at Transbay Property is located adjacent to the recently completed multi-billion-dollar Salesforce (f/k/a Transbay) Transit Center and City Park, providing immediate proximity to all forms of public transportation. The Park Tower at Transbay Property is within walking distance to the Ferry Building, waterfront AT&T Park, Moscone Center, Westfield Shopping Centre, SF MoMA, Union Square and South Park.
Major Tenant. Facebook leases all of the office space (755,914 square feet) on a long term, triple-net lease which commenced on March 1, 2019. Facebook’s lease is divided into three phases: Phase I includes floors 2-12, Phase II includes floors 13-25 and Phase III includes floors 26-43. The initial rent for Phase I, Phase II and Phase III is $60.00 PSF, $66.00 PSF and $72.00 PSF, respectively, resulting in a current weighted average rent of $65.82 PSF. The Facebook office lease requires annual rental increases of 3.0%. Facebook also leases the subterranean parking (110 spaces with capacity for 140 spaces with valet operations) based on an annual rent of $594,000 ($450/space per month), with increases to market rent every five years.
Facebook is currently in the process of building out its space and, according to the borrower sponsor, is in occupancy of Phase I and is expected to move into its remaining space by September 2020. The Park Tower at Transbay borrower provided Facebook with a tenant improvement allowance of $110 PSF (of which $80,198,366 ($106 PSF) was outstanding as of the loan origination date and has been fully reserved by the lender) and estimates that Facebook will be spending an additional $300-$350 PSF on its build-out. Pursuant to its lease, Facebook was entitled to rent abatements, which have been bought out by the Park Tower at Transbay borrower as of July 25, 2019. Facebook is now paying full unabated rent.
Facebook’s lease expiration for Phase I is February 28, 2033 and for Phases II and III are February 28, 2034. Each phase has two eight-year renewal options at fair market rent. In order to exercise the renewal option for Phase II, Facebook must exercise its option for Phase I. In order to exercise the renewal option for Phase III, Facebook must exercise both options for Phase I and II.
THE INFORMATION IN THIS STRUCTURAL AND COLLATERAL TERM SHEET IS NOT COMPLETE AND MAY BE AMENDED PRIOR TO THE TIME OF SALE. THIS TERM SHEET IS NOT AN OFFER TO SELL THESE SECURITIES AND IT IS NOT A SOLICITATION OF AN OFFER TO BUY THESE SECURITIES IN ANY JURISDICTION WHERE THE OFFER OR SALE IS NOT PERMITTED.
147
Office – CBD | Loan #11 | Cut-off Date Balance: | | $50,000,000 |
250 Howard Street | Park Tower at Transbay | Cut-off Date LTV: | | 49.1% |
San Francisco, CA 94105 | | UW NCF DSCR: | | 2.93x |
| | UW NOI Debt Yield: | | 10.2% |
Facebook has a right of first offer to purchase the Park Tower at Transbay Property at the same terms as any purchase offer received by the Park Tower at Transbay borrower. If Facebook fails to exercise its right of first offer, the Park Tower at Transbay borrower will be free to sell the Park Tower at Transbay Property to another party other than a Facebook competitor, namely Alphabet Inc., Amazon.com, Inc., Apple Inc., Microsoft Corporation, salesforce.com, inc., Snap Inc. and Samsung Electronics, which list of competitors is subject to change by Facebook in accordance with its lease.
Facebook (NYSE: FB) provides various products to connect and share “online”. The company’s products include Facebook, which enables people to connect, share and discover through mobile devices and personal computers; Instagram, a community for sharing photos, videos, and messages; and Messenger and WhatsApp, both messaging applications. Facebook also provides Oculus, a hardware, software and developer platform, which allows people to connect through its virtual reality products. As of December 31, 2018, Facebook had approximately 1.52 billion daily active users. The company was founded in 2004 and is headquartered in Menlo Park, California. Facebook also has large block leases at 181 Fremont and 215 Fremont, in downtown San Francisco, both within one block of the Park Tower at Transbay Property. For the fiscal year ending December 31, 2018, Facebook reported total revenue of $55.8 billion, up from $40.7 billion in the prior year and $27.6 billion in 2016. Facebook has a current market capitalization of $478 billion.
The following table presents certain information relating to the tenant at the Park Tower at Transbay Property:
Major Tenant(1)
Tenant Name | Credit Rating (Fitch/Moody’s/
S&P) | Tenant NRSF | % of
NRSF | Annual U/W Base Rent PSF | Annual
U/W Base Rent | % of Total Annual U/W Base Rent | Lease
Expiration
Date | Extension Options | Termination
Option
(Y/N) |
Major Tenant | | | | | | | | |
Facebook, Inc. – Phase I | NR/NR/NR | 269,814 | 35.3% | $60.00 | $16,188,822 | 32.5% | 2/28/2033 | 2, 8-year | N |
Facebook, Inc. – Phase II(2) | NR/NR/NR | 238,962 | 31.3% | $66.00 | $15,771,464 | 31.7% | 2/28/2034 | 2, 8-year | N |
Facebook, Inc. – Phase III(2) | NR/NR/NR | 247,138 | 32.3% | $72.00 | $17,793,967 | 35.8% | 2/28/2034 | 2, 8-year | N |
Office Total/Wtd. Avg. | 755,914 | 98.9% | $65.82 | $49,754,253 | 100.0% | | | |
| | | | | | | | | |
Vacant Space (Retail) | 8,745 | 1.1% | | | | | | |
| | | | | | | | |
Collateral Total | 764,659 | 100.0% | | | | | | |
| | | | | | | | | |
(1) | Information based on the underwritten rent roll. |
(2) | Facebook is currently in the process of building out its space and expected to move into Phase II and Phase III by September 2020. |
The following table presents certain information relating to the lease rollover schedule at the Park Tower at Transbay Property:
Lease Expiration Schedule
Year Ending
December 31, | No. of Leases Expiring | Expiring NRSF | % of Total NRSF | Cumulative Expiring NRSF | Cumulative % of Total NRSF | Annual
U/W
Base Rent | % of Total Annual U/W Base Rent | Annual
U/W
Base Rent
PSF |
2020 | 0 | 0 | 0.0% | 0 | 0.0% | $0 | 0.0% | $0.00 |
2021 | 0 | 0 | 0.0% | 0 | 0.0% | $0 | 0.0% | $0.00 |
2022 | 0 | 0 | 0.0% | 0 | 0.0% | $0 | 0.0% | $0.00 |
2023 | 0 | 0 | 0.0% | 0 | 0.0% | $0 | 0.0% | $0.00 |
2024 | 0 | 0 | 0.0% | 0 | 0.0% | $0 | 0.0% | $0.00 |
2025 | 0 | 0 | 0.0% | 0 | 0.0% | $0 | 0.0% | $0.00 |
2026 | 0 | 0 | 0.0% | 0 | 0.0% | $0 | 0.0% | $0.00 |
2027 | 0 | 0 | 0.0% | 0 | 0.0% | $0 | 0.0% | $0.00 |
2028 | 0 | 0 | 0.0% | 0 | 0.0% | $0 | 0.0% | $0.00 |
2029 | 0 | 0 | 0.0% | 0 | 0.0% | $0 | 0.0% | $0.00 |
2030 | 0 | 0 | 0.0% | 0 | 0.0% | $0 | 0.0% | $0.00 |
Thereafter | 1 | 755,914 | 98.9% | 755,914 | 98.9% | $49,754,253 | 100.0% | $65.82 |
Vacant | 0 | 8,745 | 1.1% | 764,659 | 100.0% | $0 | 0.0% | $0.00 |
Total/Wtd. Avg | 1 | 764,659 | 100.0% | | | $49,754,253 | 100.0% | $65.82(1) |
(1) | Wtd. Avg. U/W Rent PSF excludes vacant space. |
THE INFORMATION IN THIS STRUCTURAL AND COLLATERAL TERM SHEET IS NOT COMPLETE AND MAY BE AMENDED PRIOR TO THE TIME OF SALE. THIS TERM SHEET IS NOT AN OFFER TO SELL THESE SECURITIES AND IT IS NOT A SOLICITATION OF AN OFFER TO BUY THESE SECURITIES IN ANY JURISDICTION WHERE THE OFFER OR SALE IS NOT PERMITTED.
148
Office – CBD | Loan #11 | Cut-off Date Balance: | | $50,000,000 |
250 Howard Street | Park Tower at Transbay | Cut-off Date LTV: | | 49.1% |
San Francisco, CA 94105 | | UW NCF DSCR: | | 2.93x |
| | UW NOI Debt Yield: | | 10.2% |
The following table presents historical occupancy percentages at the Park Tower at Transbay Property:
Historical Occupancy
12/31/2015(1) | | 12/31/2016(1) | | 12/31/2017(1) | | 12/31/2018(1) | | 10/1/2019 |
NAP | | NAP | | NAP | | NAP | | 98.9% |
(1) | Prior occupancy is not applicable, as the Park Tower at Transbay Property was constructed in 2018-2019. |
Underwritten Net Cash Flow. The following table presents certain information relating to the underwritten net cash flow at the Park Tower at Transbay Property:
Cash Flow Analysis(1)
| | U/W | | %(2) | | U/W $ per SF | |
Base Rent(3) | | $50,322,681 | | 57.0% | | $65.81 | |
Straight Line Rent | | 7,996,394 | | 9.1 | | 10.46 | |
Gross Potential Rent | | $58,319,075 | | 66.1% | | $76.27 | |
Reimbursements | | 29,328,101 | | 33.2 | | 38.35 | |
Parking Income | | 594,000 | | 0.7 | | 0.78 | |
Net Rental Income | | $88,241,176 | | 100.0% | | $115.40 | |
Vacancy(4) | | (2,908,912) | | (5.0) | | (3.80) | |
Effective Gross Income | | $85,332,264 | | 96.7% | | $111.60 | |
| | | | | | | |
Real Estate Taxes | | 16,161,609 | | 18.9 | | 21.14 | |
Insurance | | 1,561,863 | | 1.8 | | 2.04 | |
Other Operating Expenses | | 11,258,124 | | 13.2 | | 14.72 | |
Total Operating Expenses | | $28,981,596 | | 34.0% | | $37.90 | |
| | | | | | | |
Net Operating Income | | $56,350,668 | | 66.0% | | $73.69 | |
TI/LC | | 0 | | 0.0 | | 0.00 | |
Capital Expenditures | | 72,995 | | 0.1 | | 0.10 | |
Net Cash Flow | | $56,277,673 | | 66.0% | | $73.60 | |
| | | | | | | |
NOI DSCR(5) | | 2.93x | | | | | |
NCF DSCR(5) | | 2.93x | | | | | |
NOI Debt Yield(5) | | 10.2% | | | | | |
NCF Debt Yield(5) | | 10.2% | | | | | |
(1) | Prior historical operating statements are not applicable, as the Park Tower at Transbay Property was constructed in 2018-2019. |
(2) | Represents (i) percent of Net Rental Income for all revenue fields, (ii) percent of Gross Potential Rent for Vacancy, and (iii) percent of Effective Gross Income for all other fields. |
(3) | Base Rent includes the ground floor retail space (8,745 square feet) grossed up to an estimated NNN rent of $65.00 PSF. |
(4) | The Park Tower at Transbay Property is 98.9% leased to Facebook. UW Vacancy is 2.5% for the office floors and 100.0% for the retail space. |
(5) | The debt service coverage ratios and debt yields shown are based on the Park Tower at Transbay Whole Loan. |
THE INFORMATION IN THIS STRUCTURAL AND COLLATERAL TERM SHEET IS NOT COMPLETE AND MAY BE AMENDED PRIOR TO THE TIME OF SALE. THIS TERM SHEET IS NOT AN OFFER TO SELL THESE SECURITIES AND IT IS NOT A SOLICITATION OF AN OFFER TO BUY THESE SECURITIES IN ANY JURISDICTION WHERE THE OFFER OR SALE IS NOT PERMITTED.
149
Office – CBD | Loan #11 | Cut-off Date Balance: | | $50,000,000 |
250 Howard Street | Park Tower at Transbay | Cut-off Date LTV: | | 49.1% |
San Francisco, CA 94105 | | UW NCF DSCR: | | 2.93x |
| | UW NOI Debt Yield: | | 10.2% |
Market Overview. The Park Tower at Transbay Property is located in the South Financial District of San Francisco, California, just north of the Rincon Hill/South Beach/SOMA District, which has seen a resurgence in leasing activity particularly with respect to the technology sector, and east of the Yerba Buena District, home to several major redevelopment projects including the Yerba Buena complex, Moscone convention center and Westfield Shopping Center.
A significant development in the San Francisco central business district is the redevelopment of the approximately 40-acre area surrounding the Transbay Terminal, the primary transit hub in the downtown area. Redevelopment plans include replacing the outdated Transbay Terminal (which was completed in August 2018), extending Caltrain 1.3 miles (which construction began in 2012) and developing the surrounding neighborhood by widening Folsom Street and promoting sidewalk cafes and markets, and developing approximately 2,600 new homes, 3 million square feet of office and commercial space, and 100,000 square feet of retail space. Recent developments of the office space include the 61-story Salesforce Tower.
Salesforce has also leased approximately 325,000 square feet at Transbay Parcel F (550 Howard) and approximately 335,000 square feet at 350 Mission. Other technology firms leasing large blocks of space in the area include Facebook at 181 Fremont (432,000 square feet) and at 215 Fremont (300,000 square feet), Adobe at 100 Hooper (280,000 square feet), Stripe at 510 Townsend (269,063 square feet), Blend Labs at 500 Pine Street (72,000 square feet), Twitch at 350 Bush Street (185,000 square feet), LinkedIn at 222 Second Street (430,650 square feet) and Pinterest at 88 Bluxome Street (490,000 square feet). As of the first quarter of 2019, large block demand greater than 50,000 square feet has climbed 41% year over year, outpacing supply. According to the appraisal, there are currently 20 tenant requirements of 100,000 square feet or more but only five contiguous space options that can offer occupancy through 2023.
According to a third party market report, the Park Tower at Transbay Property is located in the South Financial District office submarket of the San Francisco office market. For the first quarter of 2019, the submarket had total inventory of approximately 28.2 million square feet with a vacancy rate of 6.7% and average asking rents of $83.02 PSF.
According to the appraisal, the estimated 2019 population within a one-half-, one- and three-mile radius of the Park Tower at Transbay Property was 16,122, 59,433 and 378,299, respectively. The 2019 median household income within the same radii was $204,917, $105,624 and $113,407, respectively.
The following table presents certain information relating to the appraiser’s market rent conclusion for the Park Tower at Transbay Property:
Market Rent Summary
| Office – Low | Office – Mid | Office – High | Retail |
Market Rent (PSF) | $75.00 | $80.00 | $85.00 | $65.00 |
Lease Term (Years) | 12 | 12 | 12 | 10 |
Rent Increase Projection | 3.0% per annum | 3.0% per annum | 3.0% per annum | 3.0% per annum |
The following table presents certain information from the appraisal relating to comparable properties to the Park Tower at Transbay Property:
Comparable Properties
Property Name | Year Built/ Renovated | Distance from Subject (miles) | Property Size (SF) | Tenant | Lease Area (SF) | Lease Date | Initial Rent PSF NNN | Lease Term (Yrs.) | TI PSF |
Park Tower at Transbay(1) | 2018 | NAP | 764,659 | Facebook | 755,914 | Mar-19 | $65.82 | 15 | $110 |
Parcel F 546-550 Howard Street | 2023 (projected) | 0.2 | 1,100,000 | Salesforce | 325,000 | 4Q18 | $80.00 | 15 | $100 |
88 Bluxome Street | TBD | 1.4 | 1,000,000 | Pinterest | 490,000 | 1Q19 | $78.00 | 10-15 | NAP |
181 Fremont Street | 2018 | 0.1 | 432,000 | Facebook | 432,000 | Sep-17 | $65.00 | 10 | $100 |
45 Fremont | 1978 | 0.3 | 602,780 | Slack Technologies | 208,459 | Aug-19 | $69.00 | 11.3 | $100-$130 |
One Tehama | 1929 | 0.2 | 98,566 | Social Finance | 98,566 | Sep-18 | $70.00 | 11 | $105 |
(1) | Information obtained from the underwritten rent roll and Facebook lease. |
THE INFORMATION IN THIS STRUCTURAL AND COLLATERAL TERM SHEET IS NOT COMPLETE AND MAY BE AMENDED PRIOR TO THE TIME OF SALE. THIS TERM SHEET IS NOT AN OFFER TO SELL THESE SECURITIES AND IT IS NOT A SOLICITATION OF AN OFFER TO BUY THESE SECURITIES IN ANY JURISDICTION WHERE THE OFFER OR SALE IS NOT PERMITTED.
150
(THIS PAGE INTENTIONALLY LEFT BLANK)
THE INFORMATION IN THIS STRUCTURAL AND COLLATERAL TERM SHEET IS NOT COMPLETE AND MAY BE AMENDED PRIOR TO THE TIME OF SALE. THIS TERM SHEET IS NOT AN OFFER TO SELL THESE SECURITIES AND IT IS NOT A SOLICITATION OF AN OFFER TO BUY THESE SECURITIES IN ANY JURISDICTION WHERE THE OFFER OR SALE IS NOT PERMITTED.
151
No. 12 – 560 Mission Street |
|
Mortgage Loan Information | | Mortgaged Property Information |
Mortgage Loan Seller: | Bank of America, National Association | | Single Asset/Portfolio: | Single Asset |
Credit Assessment (Fitch/KRBA/S&P): | AAsf/AA-(sf)/A(sf) | | Property Type – Subtype: | Office – CBD |
Original Principal Balance(1): | $50,000,000 | | Location: | San Francisco, CA |
Cut-off Date Balance(1): | $50,000,000 | | Size: | 668,149 SF |
% of Initial Pool Balance: | 3.1% | | Cut-off Date Balance Per SF(1): | $449.00 |
Loan Purpose: | Recapitalization | | Maturity Date/ARD Balance Per SF(1): | $449.00 |
Borrower Sponsor: | National Office Partners LLC | | Year Built/Renovated: | 2002/NAP |
Guarantor: | NOP 560 Mission, LLC | | Title Vesting: | Fee |
Mortgage Rate: | 2.5890% | | Property Manager: | Self-managed |
Note Date: | December 5, 2019 | | Current Occupancy (As of): | 98.4% (10/31/2019) |
Seasoning: | 2 months | | YE 2018 Occupancy: | 97.3% |
Maturity Date: | December 6, 2029 | | YE 2017 Occupancy: | 97.8% |
IO Period: | 120 months | | YE 2016 Occupancy: | 100.0% |
Loan Term (Original): | 120 months | | As-Is Appraised Value: | $842,000,000 |
Amortization Term (Original): | NAP | | As-Is Appraised Value Per SF: | $1,260.20 |
Loan Amortization Type: | Interest-only, Balloon | | As-Is Appraisal Valuation Date: | October 31, 2019 |
Call Protection(2): | L(26),GRTR 1% or YM or D(87),O(7) | | | |
Lockbox Type: | Hard/Springing Cash Management | | Underwriting and Financial Information |
Additional Debt(1): | Yes | | TTM NOI (9/30/2019): | $38,313,473 |
Additional Debt Type (Balance)(1): | Pari Passu ($250,000,000); Future Mezzanine | | YE 2018 NOI: | $37,869,525 |
| | | YE 2017 NOI: | $30,771,436 |
| | | YE 2016 NOI: | $37,844,766 |
| | | U/W Revenues: | $54,738,187 |
| | | U/W Expenses: | $12,064,089 |
Escrows and Reserves | | U/W NOI: | $42,674,098 |
| Initial | Monthly | Cap | | U/W NCF: | $41,204,170 |
Taxes | $0 | Springing(3) | NAP | | U/W DSCR based on NOI/NCF(1): | 5.42x / 5.23x |
Insurance | $0 | Springing(3) | NAP | | U/W Debt Yield based on NOI/NCF(1): | 14.2% / 13.7% |
Replacement Reserve | $0 | Springing(3) | $267,260 | | U/W Debt Yield at Maturity based on NOI/NCF(1): | 14.2% / 13.7% |
TI/LC Reserve | $2,152,612 | Springing(3) | $2,004,447 | | Cut-off Date LTV Ratio(1): | 35.6% |
| | | | | LTV Ratio at Maturity(1): | 35.6% |
| | | | | | | |
Sources and Uses |
Sources | | | | | Uses | | | |
Original whole loan amount(1) | $300,000,000 | | 100.0% | | Return of equity(4) | $295,451,251 | | 98.5% |
| | | | | Closing costs | 2,396,137 | | 0.8 |
| | | | | Upfront reserve | 2,152,612 | | 0.7 |
Total Sources | $300,000,000 | | 100.0% | | Total Uses | $300,000,000 | | 100.0% |
(1) | The Cut-off Date Balance Per SF, Maturity Date Balance Per SF, U/W DSCR based on NOI/NCF, U/W Debt Yield based on NOI/NCF, U/W Debt Yield at Maturity based on NOI/NCF, Cut-off Date LTV Ratio and LTV Ratio at Maturity numbers presented above are based on the 560 Mission Street Whole Loan (as defined below). |
(2) | Defeasance or prepayment of the 560 Mission Street Whole Loan is permitted at any time after the earlier to occur of (a) the end of the two-year period commencing on the closing date of the securitization of the last promissory note representing a portion of the 560 Mission Street Whole Loan to be securitized and (b) December 5, 2022. The assumed defeasance lockout period of 26 payments is based on the closing date of this transaction in February 2020. |
(3) | On each due date during the continuance of a 560 Mission Street Trigger Period (as defined below), the borrower will be required to fund (i) a tax and insurance reserve in an amount equal to one-twelfth of the taxes and insurance premiums that the lender estimates will be payable during the next ensuing 12 months, unless in the case of insurance premiums, the borrower is maintaining a blanket policy in accordance with the related loan documents, (ii) a monthly replacement reserve in the amount of approximately $11,136 capped at 24 times the monthly required deposit and (iii) a monthly TI/LC reserve in the amount of approximately $83,519 capped at 24 times the monthly required deposit. A “560 Mission Street Trigger Period” means each period commencing upon (i) an event of default under the 560 Mission Street Whole Loan or, if a mezzanine loan is then outstanding, under such mezzanine loan, or (ii) if as of the last day of any calendar quarter, the debt yield is less than 7.0% for two consecutive calendar quarters. |
(4) | The 560 Mission Street Property (as defined below) was previously unencumbered. The borrower sponsors constructed the 560 Mission Street Property in 2002. |
The Mortgage Loan. The mortgage loan (the “560 Mission Street Mortgage Loan”) is part of a whole loan (the “560 Mission Street Whole Loan”) co-originated by DBR Investments Co. Limited and Bank of America, National Association and is evidenced by six pari passu promissory notes with an aggregate original principal balance of $300,000,000. The 560 Mission Street Whole Loan is secured by a first priority fee mortgage encumbering a 668,149 square foot office building located in San Francisco, California (the “560 Mission Street Property”). The 560 Mission Street Mortgage Loan is evidenced by the non-controlling Note A-2-B with an original principal balance of $50,000,000. The below table summarizes the 560 Mission Street Whole Loan, including the remaining promissory notes, which are currently held by DBR Investments Co. Limited and Bank of America, National Association and may otherwise be transferred
THE INFORMATION IN THIS STRUCTURAL AND COLLATERAL TERM SHEET IS NOT COMPLETE AND MAY BE AMENDED PRIOR TO THE TIME OF SALE. THIS TERM SHEET IS NOT AN OFFER TO SELL THESE SECURITIES AND IT IS NOT A SOLICITATION OF AN OFFER TO BUY THESE SECURITIES IN ANY JURISDICTION WHERE THE OFFER OR SALE IS NOT PERMITTED.
152
Office – CBD | Loan #12 | Cut-off Date Balance: | | $50,000,000 |
560 Mission Street | 560 Mission Street | Cut-off Date LTV: | | 35.6% |
San Francisco, CA 94105 | | UW NCF DSCR: | | 5.23x |
| | UW NOI Debt Yield: | | 14.2% |
at any time. The 560 Mission Street Whole Loan is expected to be serviced pursuant to the pooling and servicing agreement for the BMARK 2020-B16 securitization trust. See “Description of the Mortgage Pool—The Whole Loans—The Non-Serviced Pari Passu Whole Loans“ and “Pooling and Servicing Agreement—Servicing of the Non-Serviced Mortgage Loans” in the Preliminary Prospectus.
Note Summary
Notes | Original Balance | Cut-off Date Balance | Note Holder | Controlling Piece |
A-1-1 | $60,000,000 | $60,000,000 | GSMS 2020-GC45(1) | No |
A-1-2 | $50,000,000 | $50,000,000 | BMARK 2020-B16(2) | Yes |
A-1-3 | $25,000,000 | $25,000,000 | DBR Investments Co. Limited | No |
A-1-4 | $15,000,000 | $15,000,000 | DBR Investments Co. Limited | No |
A-2-A | $100,000,000 | $100,000,000 | Bank of America, National Association | No |
A-2-B | $50,000,000 | $50,000,000 | BANK 2020-BNK25 | No |
Total | $300,000,000 | $300,000,000 | | |
| (1) | The GSMS 2020-GC45 transaction is expected to close on or about January 30, 2020. |
| (2) | The BMARK 2020-B16 transaction is expected to close on or about February 12, 2020. |
The Borrower and the Borrower Sponsor. The borrower is NOP 560 Mission Street, LLC, (the “560 Mission Street Borrower”), a Delaware limited liability company, structured to be bankruptcy-remote with at least two independent directors.
The borrower is owned by a joint venture between CalPERS and CommonWealth Partners. CalPERS is the nation’s largest public pension fund with approximately $346 billion in assets. The CalPERS retirement system serves more than 1.9 million members and the CalPERS health program administers benefits for 1.4 million members and their families. CommonWealth Partners is a privately held, vertically integrated real estate investment, development and management firm based in Los Angeles, with offices across the United States.
The Property. The 560 Mission Street Property is a 31-story Class A LEED Platinum office building totaling 668,149 square feet located in San Francisco, California. The 560 Mission Street Property is 98.4% leased, as of October 31, 2019, to a diversified rent roll of 13 tenants from industries including technology, financial services, consulting services, insurance and law. No tenant comprises more than 36.9% of NRA or 36.6% of UW Base Rent.
The 560 Mission Street Property has floor-to-ceiling glass windows and column-free space throughout the building allowing for 360-degree access to light and air. The glass and metal curtain wall design, enhanced by the building’s setbacks and cornice, was inspired by the composition of the Hallidie Building, which is San Francisco’s first curtain wall building. The 560 Mission Street Property has held the LEED Platinum designation since 2010 and received BOMA Earth Awards in 2010 and 2011. The 560 Mission Street Property includes a two-level, below-grade parking garage that has 117 parking spaces including seven handicapped parking spaces.
The borrower sponsor built the 560 Mission Street Property in 2002 and has invested approximately $2.5 million in capital improvements since 2014. Since 2018, 90,621 square feet of new and renewal leases have been signed, including new leases with Delta Dental (43,396 square feet) and expansion leases with TIAA-CREF (21,661 square feet) and EY (14,525 square feet). The borrower sponsor has made investments to both the common areas and back-of-house infrastructure including a new lobby and plaza furniture, an elevator lobby upgrade, a garage enhancement with bike area, and restroom and shower room upgrades. The bike area is able to house 70 bicycles on a first come, first serve basis.
Major Tenants.
JP Morgan (246,384 square feet, 36.9% of net rentable area; 36.6% of underwritten base rent; September 30, 2025 expiration) JPMorgan is an American multinational investment bank and financial services holding company headquartered in New York City. JPMorgan is ranked by S&P Global as the largest bank in the United States and the sixth largest bank in the world by total assets, with total assets of US$2.62 trillion. JP Morgan has 2, 5-year options to renew at least 50% of its leased space with 17 - 20 months’ notice. The first option is at 95% of base rent and the second option is at market rent. JPMorgan has an option to terminate one full floor effective until September 30, 2021 with 12 months’ notice and a payment between $137,136 and $210,495 (depending on the floor terminated, along with any other costs stated in the lease) plus the unamortized leasing costs at 8% interest.
EY (122,760 square feet, 18.4% of net rentable area; 16.9% of underwritten base rent; December 31, 2028 expiration) Ernst & Young is a multinational professional services firm headquartered in London, England, United Kingdom. EY is one of the largest professional services firms in the world. Along with Deloitte, KPMG and PricewaterhouseCoopers, EY is considered one of the Big Four accounting firms. EY has 2, 5-year options to renew its entire premises at market rent with 12 - 15 months’ notice. The tenant also has an option to expand and occupy 50%-100% of a full floor with notice by October 1, 2021 and delivery date between April 1, 2022 and October 1, 2024.
TIAA-CREF (64,696 square feet, 9.7% of net rentable area; 9.8% of underwritten base rent; September 30, 2027 expiration) The Teachers Insurance and Annuity Association of America-College Retirement Equities Fund is a Fortune 100 financial services organization that is the leading provider of financial services in the academic, research, medical, cultural and governmental fields. TIAA-CREF has a 5-year option to renew at least two contiguous floors at market rent with 15 - 18 months’ notice and a one-time option to terminate any or all of the premises effective on March 31, 2023 with 12 months’ notice and a payment equal to the unamortized leasing costs at 8% interest.
THE INFORMATION IN THIS STRUCTURAL AND COLLATERAL TERM SHEET IS NOT COMPLETE AND MAY BE AMENDED PRIOR TO THE TIME OF SALE. THIS TERM SHEET IS NOT AN OFFER TO SELL THESE SECURITIES AND IT IS NOT A SOLICITATION OF AN OFFER TO BUY THESE SECURITIES IN ANY JURISDICTION WHERE THE OFFER OR SALE IS NOT PERMITTED.
153
Office – CBD | Loan #12 | Cut-off Date Balance: | | $50,000,000 |
560 Mission Street | 560 Mission Street | Cut-off Date LTV: | | 35.6% |
San Francisco, CA 94105 | | UW NCF DSCR: | | 5.23x |
| | UW NOI Debt Yield: | | 14.2% |
The following table presents certain information relating to the tenants at the 560 Mission Street Property:
Major Tenants
Tenant Name | Credit Rating (Fitch/ Moody’s/
S&P)(1) | Tenant NRSF | % of
NRSF | Annual U/W Base Rent PSF | Annual
U/W Base Rent | % of Total Annual U/W Base Rent | Lease
Expiration
Date | Extension Options | Termination Option (Y/N) |
Major Tenants | | | | | | | | |
JP Morgan | AA-/A2/A- | 246,384 | 36.9% | $75.04 | $18,489,301 | 36.6% | 9/30/2025 | 2, 5-yr | Y(2) |
EY | NR/NR/NR | 122,760 | 18.4% | $69.68 | $8,553,330 | 16.9% | 12/31/2028 | 2, 5-yr | N |
TIAA-CREF | AA+/Aa2/AA+ | 64,696 | 9.7% | $76.39 | $4,942,127 | 9.8% | 9/30/2027 | 1, 5-yr | Y(3) |
Seyfarth Shaw | NR/NR/NR | 49,695 | 7.4% | $93.36 | $4,639,525 | 9.2% | 9/30/2027 | 1, 5-yr | Y(4) |
Munger Tolles & Olson | NR/NR/NR | 41,869 | 6.3% | $91.24 | $3,820,128 | 7.6% | 9/30/2027 | 1, 5-yr | N |
Total Major Tenants | 525,404 | 78.6% | $76.98 | $40,444,411 | 80.1% | | | |
| | | | | | | | |
Non-Major Tenants | 131,727 | 19.7% | $76.16 | $10,032,182 | 19.9% | | | |
| | | | | | | | |
Occupied Collateral Total | 657,131 | 98.4% | $76.81 | $50,476,593 | 100.0% | | | |
| | | | | | | | |
Vacant Space | 11,018 | 1.6% | | | | | | |
| | | | | | | | |
Collateral Total | 668,149 | 100.0% | | | | | | |
| | | | | | | | | |
| | | | | | | | | | |
(1) | Certain ratings are those of the parent company whether or not the parent guarantees the lease. |
(2) | JP Morgan has the right at any time through September 30, 2021 to terminate its lease with respect to one full floor of its leased premises upon 12 months’ prior notice and payment of a termination fee. |
(3) | TIAA-CREF has the one-time right to terminate its lease or any portion thereof effective as of March 31, 2023 upon written notice on or before March 31, 2022 and payment of a termination fee. |
(4) | Seyfarth Shaw has the one-time right to terminate its lease with respect to the 29th floor effective as of September 30, 2022 upon written notice on or before September 30, 2021 and payment of a termination fee. |
The following table presents certain information relating to the lease rollover schedule at the 560 Mission Street Property:
Lease Expiration Schedule(1)
Year Ending
December 31, | No. of Leases Expiring | Expiring NRSF | % of Total NRSF | Cumulative Expiring NRSF | Cumulative % of Total NRSF | Annual
U/W
Base Rent | % of Total Annual U/W Base Rent | Annual
U/W
Base Rent
PSF(2) |
MTM | 0 | 0 | 0.0% | 0 | 0.0% | $0 | 0.0% | $0.00 |
2020 | 0 | 0 | 0.0% | 0 | 0.0% | $0 | 0.0% | $0.00 |
2021 | 2 | 10,784 | 1.6% | 10,784 | 1.6% | $897,426 | 1.8% | $83.22 |
2022 | 2 | 4,420 | 0.7% | 15,204 | 2.3% | $261,610 | 0.5% | $59.19 |
2023 | 0 | 0 | 0.0% | 15,204 | 2.3% | $0 | 0.0% | $0.00 |
2024 | 3 | 20,735 | 3.1% | 35,939 | 5.4% | $1,856,856 | 3.7% | $89.55 |
2025 | 15 | 292,340 | 43.8% | 328,279 | 49.1% | $21,910,710 | 43.4% | $74.95 |
2026 | 2 | 49,832 | 7.5% | 378,111 | 56.6% | $3,594,880 | 7.1% | $72.14 |
2027 | 8 | 156,260 | 23.4% | 534,371 | 80.0% | $13,401,780 | 26.6% | $85.77 |
2028 | 6 | 122,760 | 18.4% | 657,131 | 98.4% | $8,553,330 | 16.9% | $69.68 |
2029 | 0 | 0 | 0.0% | 657,131 | 98.4% | $0 | 0.0% | $0.00 |
2030 | 0 | 0 | 0.0% | 657,131 | 98.4% | $0 | 0.0% | $0.00 |
Thereafter | 0 | 0 | 0.0% | 657,131 | 98.4% | $0 | 0.0% | $0.00 |
Vacant | 0 | 11,018 | 1.6% | 668,149 | 100.0% | $0 | 0.0% | $0.00 |
Total/Weighted Average | 38 | 668,149 | 100.0% | | | $50,476,593 | 100.0% | $76.81 |
(1) | Information obtained from the underwritten rent roll. |
(2) | The Total/Weighted Average Annual UW Base Rent PSF excludes vacant space. |
The following table presents historical occupancy percentages at the 560 Mission Street Property:
Historical Occupancy
12/31/2016 | | 12/31/2017 | | 12/31/2018 | | 10/31/2019 |
| | | | | | | |
100.0% | | 97.8% | | 97.3% | | 98.4% |
THE INFORMATION IN THIS STRUCTURAL AND COLLATERAL TERM SHEET IS NOT COMPLETE AND MAY BE AMENDED PRIOR TO THE TIME OF SALE. THIS TERM SHEET IS NOT AN OFFER TO SELL THESE SECURITIES AND IT IS NOT A SOLICITATION OF AN OFFER TO BUY THESE SECURITIES IN ANY JURISDICTION WHERE THE OFFER OR SALE IS NOT PERMITTED.
154
Office – CBD | Loan #12 | Cut-off Date Balance: | | $50,000,000 |
560 Mission Street | 560 Mission Street | Cut-off Date LTV: | | 35.6% |
San Francisco, CA 94105 | | UW NCF DSCR: | | 5.23x |
| | UW NOI Debt Yield: | | 14.2% |
Operating History and Underwritten Net Cash Flow. The following table presents certain information relating to the operating history and underwritten net cash flow at the 560 Mission Street Property:
Cash Flow Analysis
| | 2016 | | 2017 | | 2018 | | TTM
9/30/2019 | | U/W | | %(1) | | U/W $ per SF | |
Base Rent | | $36,190,949 | | $31,345,165 | | $47,586,908 | | $48,362,119 | | $50,476,593 | | 88.7% | | $75.55 | |
Rent Average Benefit(2) | | 0 | | 0 | | 0 | | 0 | | 2,163,939 | | 3.8 | | 3.24 | |
Contractual Rent Steps(3) | | 0 | | 0 | | 0 | | 0 | | 1,099,025 | | 1.9 | | 1.64 | |
Grossed Up Vacant Space | | 0 | | 0 | | 0 | | 0 | | 946,514 | | 1.7 | | 1.42 | |
Gross Potential Rent | | $36,190,949 | | $31,345,165 | | $47,586,908 | | $48,362,119 | | $54,686,071 | | 96.1% | | $81.85 | |
Other Income(4) | | 2,886,498 | | 2,749,759 | | 1,944,237 | | 2,008,255 | | 2,008,255 | | 3.5 | | 3.01 | |
Total Recoveries | | 11,308,135 | | 8,261,973 | | 40,660 | | 422,347 | | 229,001 | | 0.4 | | 0.34 | |
Net Rental Income | | $50,385,582 | | $42,356,897 | | $49,571,805 | | $50,792,721 | | $56,923,327 | | 100.0% | | $85.20 | |
(Vacancy & Credit Loss) | | 0 | | 0 | | 0 | | 0 | | (2,185,140) | | (4.0) | | (3.27) | |
Effective Gross Income | | $50,385,582 | | $42,356,897 | | $49,571,805 | | $50,792,721 | | $54,738,187 | | 96.2% | | $81.93 | |
| | | | | | | | | | | | | | | |
Real Estate Taxes | | 2,901,633 | | 3,060,589 | | 2,988,259 | | 2,930,953 | | 3,085,825 | | 5.6 | | 4.62 | |
Insurance | | 648,379 | | 607,821 | | 669,313 | | 858,742 | | 1,042,282 | | 1.9 | | 1.56 | |
Management Fee | | 1,526,013 | | 1,182,649 | | 1,462,233 | | 1,651,605 | | 1,000,000 | | 1.8 | | 1.50 | |
Other Operating Expenses | | 7,464,791 | | 6,734,402 | | 6,582,475 | | 7,037,948 | | 6,935,981 | | 12.7 | | 10.38 | |
Total Operating Expenses | | $12,540,816 | | $11,585,462 | | $11,702,280 | | $12,479,248 | | $12,064,089 | | 22.0% | | $18.06 | |
| | | | | | | | | | | | | | | |
Net Operating Income | | $37,844,766 | | $30,771,436 | | $37,869,525 | | $38,313,473 | | $42,674,098 | | 78.0% | | $63.87 | |
Replacement Reserves | | 0 | | 0 | | 0 | | 0 | | 133,630 | | 0.2 | | 0.20 | |
TI/LC | | 0 | | 0 | | 0 | | 0 | | 1,336,298 | | 2.4 | | 2.00 | |
Net Cash Flow | | $37,844,766 | | $30,771,436 | | $37,869,525 | | $38,313,473 | | $41,204,170 | | 75.3% | | $61.67 | |
| | | | | | | | | | | | | | | |
NOI DSCR(5) | | 4.81x | | 3.91x | | 4.81x | | 4.87x | | 5.42x | | | | | |
NCF DSCR(5) | | 4.81x | | 3.91x | | 4.81x | | 4.87x | | 5.23x | | | | | |
NOI Debt Yield(5) | | 12.6% | | 10.3% | | 12.6% | | 12.8% | | 14.2% | | | | | |
NCF Debt Yield(5) | | 12.6% | | 10.3% | | 12.6% | | 12.8% | | 13.7% | | | | | |
| (1) | Represents (i) percent of Net Rental Income for all revenue fields, (ii) percent of Gross Potential Rent for Vacancy & Credit Loss and (iii) percent of Effective Gross Income for all other fields. |
| (2) | Represents straight-line rent averaging for TIAA-CREF, JP Morgan, Seyfarth Shaw and Munger Tolles & Olson through the earlier of the loan term or lease term. |
| (3) | Represents contractual rent steps through November 2020. |
| (4) | Other Income consists of parking income ($1,491,645), net tenant service revenue ($191,861), and miscellaneous income ($324,748). |
| (5) | The debt service coverage ratios and debt yields are based on the 560 Mission Street Whole Loan. |
Market Overview and Competition. The 560 Mission Street Property is located in San Francisco, in the South Financial District submarket.
The South Financial District submarket is the historic center of business activity in San Francisco. The submarket represents half of the metropolitan’s central business district, in conjunction with the North Financial District. The Financial District contains well-known buildings, including the Transamerica Pyramid, 555 California Street (formerly Bank of America Center), 101 California Street, and Embarcadero Center. These skyscrapers are heavily tenanted by financial institutions, and house many Fortune 500 firms, including Wells Fargo, Citigroup, Amazon’s Twitch division, and PricewaterhouseCoopers. According to a third party market research report, the South Financial District office submarket has a total inventory of 30,506,228 square feet as of October 1, 2019.
THE INFORMATION IN THIS STRUCTURAL AND COLLATERAL TERM SHEET IS NOT COMPLETE AND MAY BE AMENDED PRIOR TO THE TIME OF SALE. THIS TERM SHEET IS NOT AN OFFER TO SELL THESE SECURITIES AND IT IS NOT A SOLICITATION OF AN OFFER TO BUY THESE SECURITIES IN ANY JURISDICTION WHERE THE OFFER OR SALE IS NOT PERMITTED.
155
Office – CBD | Loan #12 | Cut-off Date Balance: | | $50,000,000 |
560 Mission Street | 560 Mission Street | Cut-off Date LTV: | | 35.6% |
San Francisco, CA 94105 | | UW NCF DSCR: | | 5.23x |
| | UW NOI Debt Yield: | | 14.2% |
The following table presents certain information relating to comparable leases related to 560 Mission Street Property:
Comparable Leases(1)
Property Name/Location | Year Built/ Renovated | Total GLA (SF) | Distance from Subject | Tenant | Lease Date/ Term | Annual Base Rent PSF | Lease Type |
560 Mission Street Property 560 Mission Street San Francisco, CA | 2002/NAP | 668,149(2) | - | Various | Various / Various | $76.81(2) | Modified |
Blue Shield California Building 50 Beale Street San Francisco, CA | 1969/2012 | 639,450 | 0.3 Miles | Glassdoor | June 2019 / 10.3 years | $87.96 | Modified |
140 New Montgomery Street San Francisco, CA | 1925/2013 | 285,100 | 0.2 miles | Benchmark Capital Partners | June 2019 / 10 years | $114.96 | Modified |
303 Second Street San Francisco, CA | 1988/NAP | 700,945 | 0.4 Miles | Sony (PlayStation) | June 2019 / 10.3 years | $90.00 | Modified |
101 California Street San Francisco, CA | 1982/2002 | 1,203,065 | 0.5 Miles | The Blackstone Group | June 2019 / 10.0 years | $114.96 | Modified |
201 Mission Street San Francisco, CA | 1981/NAP | 483,289 | 0.3 Miles | Silicon Legal Strategy | July 2019 / 5.1 years | $81.96 | Modified |
Pine Street Center 100 Pine Street San Francisco, CA | 1972/NAP | 365,808 | 0.4 Miles | Bank of the Orient | October 2019 / 6.2 years | $84.00 | Modified |
| | | | | | | |
(1) | Information obtained from the appraisal. |
(2) | Information obtained for the underwritten rent roll. |
THE INFORMATION IN THIS STRUCTURAL AND COLLATERAL TERM SHEET IS NOT COMPLETE AND MAY BE AMENDED PRIOR TO THE TIME OF SALE. THIS TERM SHEET IS NOT AN OFFER TO SELL THESE SECURITIES AND IT IS NOT A SOLICITATION OF AN OFFER TO BUY THESE SECURITIES IN ANY JURISDICTION WHERE THE OFFER OR SALE IS NOT PERMITTED.
156
(THIS PAGE INTENTIONALLY LEFT BLANK)
THE INFORMATION IN THIS STRUCTURAL AND COLLATERAL TERM SHEET IS NOT COMPLETE AND MAY BE AMENDED PRIOR TO THE TIME OF SALE. THIS TERM SHEET IS NOT AN OFFER TO SELL THESE SECURITIES AND IT IS NOT A SOLICITATION OF AN OFFER TO BUY THESE SECURITIES IN ANY JURISDICTION WHERE THE OFFER OR SALE IS NOT PERMITTED.
157
No. 13 – Powered Shell Portfolio - Sterling |
Mortgage Loan Information | | Mortgaged Property Information |
Mortgage Loan Seller: | Bank of America, National Association | | Single Asset/Portfolio: | Portfolio |
Credit Assessment (Fitch/KBRA/S&P): | NR/NR/NR | | Property Type – Subtype: | Other – Data Center |
Original Principal Balance: | $48,900,000 | | Location: | Sterling, VA |
Cut-off Date Balance: | $48,900,000 | | Size: | 297,160 SF |
% of Initial Pool Balance: | 3.0% | | Cut-off Date Balance Per SF: | $164.56 |
Loan Purpose: | Acquisition | | Maturity Date/ARD Balance Per SF: | $164.56 |
Borrower Sponsor: | BREIT Operating Partnership L.P. | | Year Built/Renovated: | 2016/NAP |
Guarantor: | BREIT Operating Partnership L.P. | | Title Vesting: | Fee |
Mortgage Rate: | 3.2678% | | Property Manager: | Self-managed |
Note Date: | December 5, 2019 | | Current Occupancy (As of): | 100.0% (2/1/2020) |
Seasoning: | 1 month | | YE 2018 Occupancy: | 100.0% |
Maturity Date: | January 6, 2030 | | YE 2017 Occupancy(2): | NAV |
IO Period: | 120 months | | YE 2016 Occupancy(2): | NAV |
Loan Term (Original): | 120 months | | YE 2015 Occupancy(2): | NAV |
Amortization Term (Original): | NAP | | As-Is Appraised Value(3): | $81,000,000 |
Loan Amortization Type : | Interest-only, Balloon | | As-Is Appraised Value Per SF: | $272.58 |
Call Protection: | GRTR 0.5% or YM(25),GRTR 0.5% or YM or D(89),O(6) | | As-Is Appraisal Valuation Date: | November 20, 2019 |
Lockbox Type: | Hard/Springing Cash Management | | Underwriting and Financial Information |
Additional Debt: | None | | TTM NOI (9/30/2019): | $3,895,694 |
Additional Debt Type (Balance): | NAP | | YE 2018 NOI(2): | NAV |
| | | YE 2017 NOI(2): | NAV |
| | | YE 2016 NOI(2): | NAV |
| | | U/W Revenues: | $5,204,380 |
| | | U/W Expenses: | $588,137 |
| | U/W NOI: | $4,616,243 |
| | | | | U/W NCF: | $4,415,024 |
| | | | | U/W DSCR based on NOI/NCF: | 2.85x / 2.73x |
Escrows and Reserves | | U/W Debt Yield based on NOI/NCF: | 9.4% / 9.0% |
| Initial | Monthly | Cap | | U/W Debt Yield at Maturity based on NOI/NCF: | 9.4% / 9.0% |
Taxes | $0 | Springing(1) | N/A | | Cut-off Date LTV Ratio: | 60.4% |
Insurance | $0 | Springing(1) | N/A | | LTV Ratio at Maturity: | 60.4% |
| | | | | | | |
Sources and Uses |
Sources | | | | Uses | | |
Original Loan Amount | $48,900,000 | 62.8% | | Purchase Price | $76,927,388 | 98.8% |
Borrower Equity | 28,991,897 | 37.2 | | Closing costs | 964,509 | 1.2 |
Total Sources | $77,891,897 | 100.0% | | Total Uses | $77,891,897 | 100.0% |
| (1) | On each payment date during the continuance of an event of default or when the debt service coverage ratio, determined as of the last day of each of two consecutive fiscal quarters, is less than 1.20x, the borrower is required to fund a tax and insurance reserve in an amount equal to one-twelfth of the property taxes and insurance premiums that the lender reasonably estimates will be payable during the next ensuing 12 months. Such insurance premiums may be suspended if a blanket policy is in place. |
| (2) | Prior historical operating statements and occupancy are not applicable, as the Powered Shell Portfolio – Sterling Properties (as defined below) were constructed in 2016 and the sole tenant, Vadata, Inc., signed two triple-net leases that commenced on October 1, 2017 and November 1, 2017, respectively. |
| (3) | The appraiser also provided a “Go Dark” value as of November 20, 2019 of $53,600,000, which results in both a Cut-off Date LTV Ratio and LTV Ratio at Maturity/ARD of 91.2% for the Powered Shell Portfolio – Sterling Mortgage Loan. |
The Mortgage Loan. The mortgage loan (the “Powered Shell Portfolio – Sterling Mortgage Loan”) is evidenced by a single promissory note secured by a first priority fee mortgage for two adjacent powered shell data centers totaling 297,160 square feet located in Sterling, Virginia (the “Powered Shell Portfolio – Sterling Properties”).
The Borrower and the Borrower Sponsor. The borrower is BCORE COPT DC-21 LLC, (the “Powered Shell Portfolio – Sterling Borrower”), a Delaware limited liability company, structured to be bankruptcy-remote with at least one independent director.
The general partner of the non-recourse carveout guarantor, BREIT Operating Partnership L.P., is Blackstone Real Estate Income Trust, Inc. (“BREIT”), a real estate investment trust that seeks to directly own stabilized income generating U.S. commercial real estate across property types including industrial, data center, multifamily, hospitality and retail properties. As of September 30, 2019, BREIT
THE INFORMATION IN THIS STRUCTURAL AND COLLATERAL TERM SHEET IS NOT COMPLETE AND MAY BE AMENDED PRIOR TO THE TIME OF SALE. THIS TERM SHEET IS NOT AN OFFER TO SELL THESE SECURITIES AND IT IS NOT A SOLICITATION OF AN OFFER TO BUY THESE SECURITIES IN ANY JURISDICTION WHERE THE OFFER OR SALE IS NOT PERMITTED.
158
Other – Data Center | Loan #13 | Cut-off Date Balance: | | $48,900,000 |
45295 & 45305 West Severn Way | Powered Shell Portfolio – Sterling | Cut-off Date LTV: | | 60.4% |
Sterling, VA 20166 | | UW NCF DSCR: | | 2.73x |
| | UW NOI Debt Yield: | | 9.4% |
had a net asset value of approximately $10.4 billion and total asset value of approximately $26.3 billion. The Powered Shell Portfolio – Sterling Borrower is affiliated with the borrower under the Bellagio Hotel and Casino Mortgage Loan.
The Property. The Powered Shell Portfolio – Sterling Properties consist of two single-story powered shell data center buildings located in Sterling, Virginia, which total 297,160 square feet. The Powered Shell Portfolio – Sterling Properties were built to suit for the sole tenant, Vadata, Inc., a wholly owned subsidiary of Amazon.com, Inc. (“Amazon”) (NASDAQ: AMZN), and are fully utilized by the tenant with two triple-net leases in place. “Powered shells” are upgraded industrial properties with access to power and fiber optics that are utilized as data centers. The landlord only initially invests in the industrial properties and the tenant invests all additional capital required to convert the asset into a fully operational data center with tenant specific specifications. Vadata, Inc. invested $386.3 million in permanent improvements including HVAC systems, fiber connectivity, UPS batteries and power generators. Additionally, the tenant invested $594.3 million to transform the Powered Shell Portfolio – Sterling Properties into technologically advanced data center facilities.
Major Tenant. Vadata, Inc. is a wholly owned subsidiary of Amazon and is the data center arm of Amazon Web Services (“AWS”). Vadata, Inc. occupies all 297,160 square feet of the portfolio. The tenant signed two triple-net leases that commenced on October 1, 2017 and November 1, 2017 and expire on September 30, 2029 and October 31, 2029, respectively. The leases provide four renewal options of five years each with a 12 month notice at 100.0% fair market value and call for 2.25% annual rent increases. The leases do not include termination options. Amazon has provided a guaranty for 12 months of rent at all times during the lease term.
Amazon is a multinational technology company focusing in e-commerce, cloud computing, and artificial intelligence. It is recognized as one of the Big Four of technology, along with Google, Apple and Facebook, due to its market capitalization, disruptive innovation, brand equity and hyper-competitive application process. AWS is one of the first major cloud computing platforms widely available and offers a broad set of global cloud-based products including computing, storage, databases, analytics, networking, mobile, developer tools, management tools, IoT, security, and enterprise applications. Since its introduction, AWS has grown to be a dominant market leader in the cloud computing industry. In 2018, Amazon controlled an estimated 35% of the $70 billion market revenue, more than its next four competitors – Microsoft (15%), Google (7%), IBM (7%), and Alibaba (5%) – combined. AWS accounts for 59% of net income for Amazon.com, Inc.
The following table presents certain information relating to the tenant at the Powered Shell Portfolio – Sterling Properties:
Major Tenant
Tenant Name | Credit Rating
(Fitch/Moody’s/
S&P)(1) | Tenant
NRSF | % of
NRSF | Annual
U/W
Base
Rent PSF | Annual
U/W Base
Rent | % of
Total
Annual
U/W
Base
Rent | Lease
Expiration
Date | Extension
Options | Termination
Option
(Y/N) |
Vadata, Inc. (DC-21) | A+/A3/AA- | 148,580 | 50.0% | $14.42 | $2,142,123 | 49.6% | 9/30/2029 | 4, 5-year | N |
Vadata, Inc. (DC-22) | A+/A3/AA- | 148,580 | 50.0% | $14.63 | $2,173,719 | 50.4% | 10/31/2029 | 4, 5-year | N |
Total/Wtd. Avg. | | 297,160 | 100.0% | $14.52 | $4,315,842 | 100.0% | | | |
| | | | | | | | | |
Collateral Total | | 297,160 | 100.0% | | | | | | |
| | | | | | | | | |
| (1) | Ratings are those of the parent company, Amazon.com, Inc., which provides a limited parent guaranty. |
THE INFORMATION IN THIS STRUCTURAL AND COLLATERAL TERM SHEET IS NOT COMPLETE AND MAY BE AMENDED PRIOR TO THE TIME OF SALE. THIS TERM SHEET IS NOT AN OFFER TO SELL THESE SECURITIES AND IT IS NOT A SOLICITATION OF AN OFFER TO BUY THESE SECURITIES IN ANY JURISDICTION WHERE THE OFFER OR SALE IS NOT PERMITTED.
159
Other – Data Center | Loan #13 | Cut-off Date Balance: | | $48,900,000 |
45295 & 45305 West Severn Way | Powered Shell Portfolio – Sterling | Cut-off Date LTV: | | 60.4% |
Sterling, VA 20166 | | UW NCF DSCR: | | 2.73x |
| | UW NOI Debt Yield: | | 9.4% |
The following table presents certain information relating to the lease rollover schedule at the Powered Shell Portfolio – Sterling Properties:
Lease Expiration Schedule(1)
Year Ending
December 31, | No. of
Leases
Expiring | Expiring
NRSF | % of
Total
NRSF | Cumulative
Expiring
NRSF | Cumulative
% of Total
NRSF | Annual
U/W
Base Rent | % of Total
Annual
U/W Base
Rent | Annual
U/W
Base Rent
PSF |
MTM | 0 | 0 | 0.0% | 0 | 0.0% | $0 | 0.0% | $0.00 |
2020 | 0 | 0 | 0.0% | 0 | 0.0% | $0 | 0.0% | $0.00 |
2021 | 0 | 0 | 0.0% | 0 | 0.0% | $0 | 0.0% | $0.00 |
2022 | 0 | 0 | 0.0% | 0 | 0.0% | $0 | 0.0% | $0.00 |
2023 | 0 | 0 | 0.0% | 0 | 0.0% | $0 | 0.0% | $0.00 |
2024 | 0 | 0 | 0.0% | 0 | 0.0% | $0 | 0.0% | $0.00 |
2025 | 0 | 0 | 0.0% | 0 | 0.0% | $0 | 0.0% | $0.00 |
2026 | 0 | 0 | 0.0% | 0 | 0.0% | $0 | 0.0% | $0.00 |
2027 | 0 | 0 | 0.0% | 0 | 0.0% | $0 | 0.0% | $0.00 |
2028 | 0 | 0 | 0.0% | 0 | 0.0% | $0 | 0.0% | $0.00 |
2029 | 2 | 297,160 | 100.0% | 297,160 | 100.0% | $4,315,842 | 100.0% | $14.52 |
2030 | 0 | 0 | 0.0% | 297,160 | 100.0% | $0 | 0.0% | $0.00 |
Thereafter | 0 | 0 | 0.0% | 297,160 | 100.0% | $0 | 0.0% | $0.00 |
Vacant | 0 | 0 | 0.0% | 297,160 | 100.0% | $0 | 0.0% | $0.00 |
Total/Weighted Average | 2 | 297,160 | 100.0% | | | $4,315,842 | 100.0% | $14.52 |
(1) | Information obtained from the underwritten rent roll. |
The following table presents historical occupancy percentages at the Powered Shell Portfolio – Sterling Properties:
Historical Occupancy(1)
12/31/2015 | | 12/31/2016 | | 12/31/2017 | | 12/31/2018 | | 2/1/2020 |
NAV | | NAV | | NAV | | 100.0% | | 100.0% |
| (1) | Occupancy prior to 2018 is not applicable, as the Powered Shell Portfolio – Sterling Properties were constructed in 2016 and the tenant, Vadata, Inc., signed two triple-net leases that commenced on October 1, 2017 and November 1, 2017, respectively. |
THE INFORMATION IN THIS STRUCTURAL AND COLLATERAL TERM SHEET IS NOT COMPLETE AND MAY BE AMENDED PRIOR TO THE TIME OF SALE. THIS TERM SHEET IS NOT AN OFFER TO SELL THESE SECURITIES AND IT IS NOT A SOLICITATION OF AN OFFER TO BUY THESE SECURITIES IN ANY JURISDICTION WHERE THE OFFER OR SALE IS NOT PERMITTED.
160
Other – Data Center | Loan #13 | Cut-off Date Balance: | | $48,900,000 |
45295 & 45305 West Severn Way | Powered Shell Portfolio – Sterling | Cut-off Date LTV: | | 60.4% |
Sterling, VA 20166 | | UW NCF DSCR: | | 2.73x |
| | UW NOI Debt Yield: | | 9.4% |
Underwritten Net Cash Flow. The following table presents certain information relating to the underwritten net cash flow at the Powered Shell Portfolio – Sterling Properties:
Cash Flow Analysis(1)
| | TTM 9/30/2019 | | U/W | | %(2) | | U/W $ per SF | |
Base Rent(3) | | $3,917,829 | | $4,315,842 | | 80.4% | | $14.52 | |
Straight Line Rent | | 0 | | 470,129 | | 8.8 | | 1.58 | |
Gross Potential Rent | | $3,917,829 | | $4,785,971 | | 89.2% | | $16.11 | |
Reimbursements | | 453,120 | | 579,369 | | 10.8 | | 1.95 | |
Net Rental Income | | $4,370,949 | | $5,365,340 | | 100.0% | | $18.06 | |
Vacancy | | 0 | | (160,960) | | (3.4) | | (0.54) | |
Effective Gross Income | | $4,370,949 | | $5,204,380 | | 97.0% | | $17.51 | |
| | | | | | | | | |
Real Estate Taxes | | 284,649 | | 0 | | 0.0 | | 0.00 | |
Insurance | | 13,611 | | 0 | | 0.0 | | 0.00 | |
Other Operating Expenses | | 176,725 | | 588,137 | | 11.3 | | 1.98 | |
Total Operating Expenses | | $474,985 | | $588,137 | | 11.3% | | $1.98 | |
| | | | | | | | | |
Net Operating Income | | $3,895,964 | | $4,616,243 | | 88.7% | | $15.53 | |
TI/LC | | 0 | | 156,645 | | 3.0 | | 0.53 | |
Capital Expenditures | | 0 | | 44,574 | | 0.9 | | 0.15 | |
Net Cash Flow | | $3,895,964 | | $4,415,024 | | 84.8% | | $14.86 | |
| | | | | | | | | |
NOI DSCR | | 2.40x | | 2.85x | | | | | |
NCF DSCR | | 2.40x | | 2.73x | | | | | |
NOI Debt Yield | | 8.0% | | 9.4% | | | | | |
NCF Debt Yield | | 8.0% | | 9.0% | | | | | |
| (1) | Prior historical operating statements are not applicable, as the Powered Shell Portfolio – Sterling Properties were constructed in 2016 and the tenant, Vadata, Inc., signed two triple-net leases that commenced on October 1, 2017 and November 1, 2017, respectively. |
| (2) | Represents (i) percent of Net Rental Income for all revenue fields, (ii) percent of Gross Potential Rent for Vacancy, and (iii) percent of Effective Gross Income for all other fields. |
| (3) | Base Rent for TTM 9/30/2019 includes straight line rent of $307,642. |
Market Overview and Competition. The Powered Shell Portfolio – Sterling Properties are located in Washington, DC market in Northern Virginia. Northern Virginia is the largest multi-tenant data center market in the United States, with over 4.8 million square feet of space currently in operation. Market leaders located here include Amazon, Google, Microsoft, Facebook and Alibaba. Northern Virginia’s history as one of the main internet exchange points on the East Coast, plus its available land, low overall risk to natural disaster, relatively low power rates and tax breaks available for some large data center owners and their tenants, have encouraged the development of large campuses. With state incentives recently extended through 2035, there continue to be exemptions for sales and use taxes for companies that invest more than $150 million in computer equipment and software.
The greater Washington, D.C., area serves as the capital of the United States and home to over six million people throughout the area sprawling across the District to Maryland and Virginia. Through December 2018, the unemployment rates were 2.9% and 2.6% for the Washington core based statistical area and the State of Virginia, respectively. The estimated 2019 population within a one-, three-, and five-mile radius of the Powered Shell Portfolio – Sterling Properties is 3,852, 80,341, and 234,724, respectively. The estimated 2019 median household income within a one-, three-, and five-mile radius of the Powered Shell Portfolio – Sterling Properties is $119,166, $106,654, and $122,405, respectively.
THE INFORMATION IN THIS STRUCTURAL AND COLLATERAL TERM SHEET IS NOT COMPLETE AND MAY BE AMENDED PRIOR TO THE TIME OF SALE. THIS TERM SHEET IS NOT AN OFFER TO SELL THESE SECURITIES AND IT IS NOT A SOLICITATION OF AN OFFER TO BUY THESE SECURITIES IN ANY JURISDICTION WHERE THE OFFER OR SALE IS NOT PERMITTED.
161
Other – Data Center | Loan #13 | Cut-off Date Balance: | | $48,900,000 |
45295 & 45305 West Severn Way | Powered Shell Portfolio – Sterling | Cut-off Date LTV: | | 60.4% |
Sterling, VA 20166 | | UW NCF DSCR: | | 2.73x |
| | UW NOI Debt Yield: | | 9.4% |
The following table presents certain information from the appraisal relating to sales comparable properties to the Powered Shell Portfolio – Sterling Properties:
Sales Comparables
Building Name / Address | Date of
Sale | Year Built | Total Building
Area (SF) | Sales Price | Sales Price
PSF | %
Occupied |
Powered Shell Portfolio – Sterling 45295 & 45305 West Severn Way Sterling, VA | NAP | NAP | 297,160 | $76,927,388 | $272.58 | 100% |
INAP 2500 W. Frye Road Chandler, AZ | Aug-19 | 1985 | 191,061 | $72,750,000 | $380.77 | 100% |
SunGuard 601 2nd Avenue South Hopkins, MN | Aug-19 | 1980 | 29,660 | $4,750,000 | $160.15 | 100% |
Confidential (East Coast) | Jun-19 | 2016-2017 | 1,174,200 | $256,000,000 | $218.02 | 100% |
Amazon (AWS) 26415 Corporate Avenue Hayward, CA | Nov-18 | 2016 | 145,850 | $ 34,975,000 | $239.80 | 100% |
Secure Data 365 4726 Hills and Dales Road NW Canton, OH | Oct-18 | 2008 | 29,960 | $9,425,000 | $314.59 | 100% |
AT&T Data Center 400 Holger Way San Jose, CA | Jun-18 | 1999 | 76,410 | $49,000,000 | $641.28 | 100% |
A Powered Shell 194 Washington Avenue Albany, NY | April-18 | 1950 | 73,000 | $9,200,000 | $126.03 | 100% |
Skybox Legacy 6815 Communications Pkwy. Plano, TX | Mar-18 | 2017 | 149,200 | $55,000,000 | $368.63 | 100% |
Pathfinder Plaza 45900, 45930 & 45950 Pathfinder Plaza Sterling, VA | Mar-18 | 2017 | 446,811 | $111,577,310 | $249.72 | 100% |
InfoCrossing 11707 Miracle Hills Drive Omaha, NE | Mar-18 | 1988/1995(Ren.) | 85,200 | $16,400,000 | $192.49 | 100% |
Partial Release. Provided no event of default is continuing, the related Powered Shell Portfolio – Sterling Borrower has the right to obtain the release of one or more of the Powered Shell Portfolio – Sterling Properties subject to the satisfaction of certain conditions, including, among others: (i) prepayment, together with any applicable yield maintenance premium (or, from and after the second anniversary of the closing date of this securitization, delivery of defeasance collateral) in an amount equal to the product of its amortized allocated loan amount times 110% (the “Minimum Release Price”); (ii) after giving effect to such release, either (a) the debt yield is at least 8.92% or (b) if each applicable mortgaged property is being sold to an unaffiliated third party, the debt yield requirement will be satisfied if the aggregate amount of such prepayment relating to such release is not less than the greater of (1) the Minimum Release Price of such mortgaged property and (2) the lesser of (x) the gross sales proceeds actually received by the borrower from such sale or (y) the amount necessary to achieve a debt yield of 8.92%; (iii) delivery of a Rating Agency Confirmation; and (iv) delivery of a REMIC opinion.
The borrower is also permitted to obtain the release of a property in connection with curing an event of default with respect to such property by defeasance or prepayment of the Minimum Release Price without meeting the requirements of clause (ii) above if the Powered Shell Portfolio – Sterling Borrower has demonstrated in good faith to the lender that it has pursued a cure of such event of default, and such cure does not require any capital contribution to the Powered Shell Portfolio – Sterling Borrower or any obligation of the Powered Shell Portfolio – Sterling Borrower or the non-recourse carveout guarantor to use revenues from any property other than the property that is the subject of such event of default to effectuate such cure and such release cures such event of default.
THE INFORMATION IN THIS STRUCTURAL AND COLLATERAL TERM SHEET IS NOT COMPLETE AND MAY BE AMENDED PRIOR TO THE TIME OF SALE. THIS TERM SHEET IS NOT AN OFFER TO SELL THESE SECURITIES AND IT IS NOT A SOLICITATION OF AN OFFER TO BUY THESE SECURITIES IN ANY JURISDICTION WHERE THE OFFER OR SALE IS NOT PERMITTED.
162
(THIS PAGE INTENTIONALLY LEFT BLANK)
THE INFORMATION IN THIS STRUCTURAL AND COLLATERAL TERM SHEET IS NOT COMPLETE AND MAY BE AMENDED PRIOR TO THE TIME OF SALE. THIS TERM SHEET IS NOT AN OFFER TO SELL THESE SECURITIES AND IT IS NOT A SOLICITATION OF AN OFFER TO BUY THESE SECURITIES IN ANY JURISDICTION WHERE THE OFFER OR SALE IS NOT PERMITTED.
163
| No. 14 – Stop & Shop Portfolio |
Mortgage Loan Information | | Mortgaged Property Information |
Mortgage Loan Seller: | Morgan Stanley Mortgage Capital Holdings LLC | | Single Asset/Portfolio: | Portfolio |
Credit Assessment (Fitch/KBRA/S&P): | NR/NR/NR | | Property Type – Subtype: | Retail – Single Tenant |
Original Principal Balance: | $45,000,000 | | Location: | Various |
Cut-off Date Balance: | $45,000,000 | | Size: | 272,542 SF |
% of Initial Pool Balance: | 2.8% | | Cut-off Date Balance Per SF: | $165.11 |
Loan Purpose: | Refinance | | Maturity Date Balance Per SF: | $165.11 |
Borrower Sponsor: | American Finance Trust, Inc.(1) | | Year Built/Renovated: | Various/Various |
Guarantor: | American Finance Operating Partnership, L.P. | | Title Vesting: | Fee |
Mortgage Rate: | 3.4450% | | Property Manager: | American Finance Properties, LLC (borrower-related) |
Note Date: | December 18, 2019 | | Current Occupancy (As of): | 100.0% (2/1/2020) |
Seasoning: | 1 month | | YE 2018 Occupancy: | 100.0% |
Maturity Date: | January 1, 2030 | | YE 2017 Occupancy: | 100.0% |
IO Period: | 120 months | | YE 2016 Occupancy: | 100.0% |
Loan Term (Original): | 120 months | | YE 2015 Occupancy: | 100.0% |
Amortization Term (Original): | NAP | | As-Is Appraised Value: | $73,600,000 |
Loan Amortization Type: | Interest-only, Balloon | | As-Is Appraised Value Per SF: | $270.05 |
Call Protection: | L(25),GRTR 1% or YM(91),O(4) | | As-Is Appraisal Valuation Date: | Various |
Lockbox Type: | Hard/Springing Cash Management | | | |
Additional Debt: | None | | Underwriting and Financial Information |
Additional Debt Type (Balance): | NAP | | TTM NOI (6/30/2019): | | $4,954,856 |
| | | YE 2018 NOI: | | $4,954,935 |
| | | YE 2017 NOI: | | $4,958,458 |
| | | YE 2016 NOI: | | $4,826,208 |
| | | U/W Revenues: | | $6,653,994 |
| | | U/W Expenses: | | $2,037,126 |
Escrows and Reserves | | U/W NOI: | | $4,616,868 |
| Initial | Monthly | Cap | | U/W NCF: | | $4,509,052 |
Taxes(2) | $0 | Springing | NAP | | U/W DSCR based on NOI/NCF: | | 2.94x / 2.87x |
Insurance(2) | $0 | Springing | NAP | | U/W Debt Yield based on NOI/NCF: | | 10.3% / 10.0% |
Recurring Replacements(3) | $0 | Springing | NAP | | U/W Debt Yield at Maturity based on NOI/NCF: | | 10.3% / 10.0% |
| | | | | Cut-off Date LTV Ratio: | | 61.1% |
| | | | | LTV Ratio at Maturity: | | 61.1% |
Sources and Uses |
Sources | | | | | Uses | | | |
Original loan amount | $45,000,000 | | 100.0% | | Loan Payoff | $38,210,948 | | 84.9% |
| | | | | Return of Equity | 6,253,271 | | 13.9 |
| | | | | Closing Costs | 535,780 | | 1.2 |
Total Sources | $45,000,000 | | 100.0% | | Total Uses: | $45,000,000 | | 100.0% |
(1) | See “Description of the Mortgage Pool--Litigation and Other Considerations” in the Preliminary Prospectus. |
(2) | Monthly tax and insurance reserves are springing upon (i) a critical tenant not being obligated to directly pay taxes or insurance under the terms of its lease and (ii) failure to provide evidence that the critical tenant has paid taxes or insurance prior to the date upon which taxes become delinquent. A “critical tenant” means Stop & Shop (as defined below) or any replacement tenant occupying the property presently leased to Stop & Shop pursuant to the leases in place at origination. |
(3) | Monthly recurring replacement reserves are springing upon (i) (a) an event of default; (b) the debt service coverage ratio being less than 1.20x for the immediately preceding two calendar quarters; (c) a critical tenant lease expiration event as defined in the loan documents or (d) a critical tenant cash sweep event as defined in the loan documents and (ii) the borrower not being controlled by American Finance Operating Partnership, L.P. |
The Mortgage Loan. The mortgage loan (the “Stop & Shop Portfolio Mortgage Loan”) is evidenced by one promissory note in the original principal balance of $45,000,000. The Stop & Shop Portfolio Mortgage Loan is secured by a first priority fee mortgage encumbering four single tenant retail properties located in Massachusetts and Rhode Island (the “Stop & Shop Portfolio “ or “Stop & Shop Portfolio Properties”).
The Properties. The Stop & Shop Portfolio Properties are comprised of four retail properties containing a total of 272,542 square feet. Three of the Stop & Shop Portfolio Properties are located in Massachusetts (76.8% of total square feet) and one is located in Rhode Island (23.2% of total square feet). As of February 1, 2020, the Stop & Shop Portfolio Properties were 100.0% leased to The Stop & Shop Supermarket Company (“Stop & Shop”). Stop & Shop has a right of first refusal with respect to each of the Stop & Shop Portfolio Properties.
THE INFORMATION IN THIS STRUCTURAL AND COLLATERAL TERM SHEET IS NOT COMPLETE AND MAY BE AMENDED PRIOR TO THE TIME OF SALE. THIS TERM SHEET IS NOT AN OFFER TO SELL THESE SECURITIES AND IT IS NOT A SOLICITATION OF AN OFFER TO BUY THESE SECURITIES IN ANY JURISDICTION WHERE THE OFFER OR SALE IS NOT PERMITTED.
164
Retail – Single Tenant | Loan #14 | Cut-off Date Balance: | | $45,000,000 |
Property Address - Various | Stop & Shop Portfolio | Cut-off Date LTV: | | 61.1% |
| | U/W NCF DSCR: | | 2.87x |
| | U/W NOI Debt Yield: | | 10.3% |
Stop & Shop - Malden
The Stop & Shop - Malden Property is a retail center comprised of one, one-story building totaling 79,229 square feet located in Malden, Massachusetts. The Stop & Shop - Malden Property is situated on an approximately 9.0-acre site and features 494 parking spaces (6.2 spaces per 1,000 square feet). The Stop & Shop - Malden Property was built in 1992 and, as of February 1, 2020, the Stop & Shop - Malden Property was 100.0% leased to Stop & Shop. Stop & Shop is operating on a triple net lease, which commenced on December 21, 2001 and expires on December 31, 2026. The original lease provides two five-year fixed rate extensions and one three-year and 90-day fixed-rate extension at $19.65 PSF, followed by successive five-year fair market extensions to not exceed 75 years after December 21, 2001. The Malden Stop & Shop has a current rent of $1,519,520 ($19.18 PSF). The rental amount will increase to $1,556,636 ($19.65 PSF) on January 1, 2022.
Stop & Shop - Swampscott
The Stop & Shop - Swampscott Property is a single tenant retail center comprised of one, one-story building totaling 65,268 square feet located in Swampscott, Massachusetts. The Stop & Shop - Swampscott Property is situated on an approximately 11.8-acre site and features 397 parking spaces (6.1 spaces per 1,000 square feet). The Stop & Shop - Swampscott Property was built in 1992 and, as of February 1, 2020, the Stop & Shop - Swampscott Property was 100.0% leased to Stop & Shop. Stop & Shop is operating on a triple net lease, which commenced on December 21, 2001 and expires on December 31, 2026. The lease includes two five-year fixed rate extensions and one one-year and 272-day fixed rate extension at $20.72 PSF, followed by successive five-year fair market extensions to not exceed 75 years after December 21, 2001. The Swampscott Stop & Shop has a current rent of $1,319,449 ($20.22 PSF). The rental amount will increase to $1,352,083 ($20.72 PSF) on January 1, 2022.
Stop & Shop - Framingham
The Stop & Shop - Framingham Property is a retail center comprised of one, one-story building totaling 64,917 square feet located in Framingham, Massachusetts. The Stop & Shop - Framingham Property is situated on an approximately 7.6-acre site and features 434 parking spaces (6.7 spaces per 1,000 square feet). The Stop & Shop - Framingham Property was built in 1973 and, as of February 1, 2020, the Stop & Shop - Framingham Property was 100.0% leased to Stop & Shop. Stop & Shop is operating on a triple net lease, which commenced on December 21, 2001 and expires on December 31, 2026. The lease includes two five-year fixed rate extensions and one three-year and 364-day fixed rate extension at $17.68 PSF, followed by successive five-year fair market extensions to not exceed 75 years after December 21, 2001. The Framingham Stop & Shop has a current rent of $1,115,332 ($17.18 PSF). The rental amount will increase to $1,147,790 ($17.68 PSF) on January 1, 2022.
Stop & Shop - Bristol
The Stop & Shop - Bristol Property is a retail center comprised of one, one-story building totaling 63,128 square feet located in Bristol, Rhode Island. The Stop & Shop - Bristol Property is situated on an approximately 14.0-acre site and features 430 parking spaces (6.8 spaces per 1,000 square feet). The Stop & Shop - Bristol Property was built in 1998 and, as of February 1, 2020, the Stop & Shop - Bristol Property was 100.0% leased to Stop & Shop. Stop & Shop is operating on a triple net lease, which commenced on December 21, 2001 and expires on December 31, 2026. The lease includes two five-year fixed rate extensions and one three-year and 90-day fixed rate extension at $16.55, followed by successive five-year fair market extensions to not exceed 75 years after December 21, 2001. The Bristol Stop & Shop has a current rent of $1,012,778 ($16.04 PSF). The rental amount will increase to $1,044,984 ($16.55 PSF) on January 1, 2022.
The following table presents a summary of certain information relating to the Stop & Shop Portfolio Properties.
Stop & Shop Portfolio Properties Summary (1)
Property Name | City | State | Year Built | Total GLA (SF) | % of Total GLA | Occ. % | Cut-off Date Allocated Loan Amount | % of ALA | Appraised Value | TTM 6/30/2019 NOI |
Stop & Shop - Malden | Malden | MA | 1992 | 79,229 | 29.1% | 100.0% | $13,645,553 | 30.3% | $22,500,000 | $1,516,830 |
Stop & Shop - Swampscott | Swampscott | MA | 1992 | 65,268 | 23.9% | 100.0% | $11,886,792 | 26.4% | $19,600,000 | $1,315,867 |
Stop & Shop - Framingham | Framingham | MA | 1973 | 64,917 | 23.8% | 100.0% | $10,006,739 | 22.2% | $16,500,000 | $1,111,865 |
Stop & Shop - Bristol | Bristol | RI | 1998 | 63,128 | 23.2% | 100.0% | $9,460,916 | 21.0% | $15,000,000 | $1,010,294 |
Total/Wtd. Avg.: | | | | 272,542 | 100.0% | 100.0% | $45,000,000 | 100.0% | $73,600,000 | $4,954,856 |
| (1) | Based on the underwritten rent roll dated February 1, 2020. |
THE INFORMATION IN THIS STRUCTURAL AND COLLATERAL TERM SHEET IS NOT COMPLETE AND MAY BE AMENDED PRIOR TO THE TIME OF SALE. THIS TERM SHEET IS NOT AN OFFER TO SELL THESE SECURITIES AND IT IS NOT A SOLICITATION OF AN OFFER TO BUY THESE SECURITIES IN ANY JURISDICTION WHERE THE OFFER OR SALE IS NOT PERMITTED.
165
Retail – Single Tenant | Loan #14 | Cut-off Date Balance: | | $45,000,000 |
Property Address - Various | Stop & Shop Portfolio | Cut-off Date LTV: | | 61.1% |
| | U/W NCF DSCR: | | 2.87x |
| | U/W NOI Debt Yield: | | 10.3% |
The following table presents certain information relating to the major tenants at the Stop & Shop Portfolio:
Major Tenants(1)
Tenant Name | Credit Rating (Fitch/Moody’s/ S&P)(2) | Tenant NRSF | % of Portfolio NRSF | Annual U/W Rent | % of Portfolio Annual U/W Rent | Annual U/W Rent PSF | Most Recent Sales | Term. Option | Renewal Options | Lease Expiration |
$ | PSF | Occ. Cost % |
Major Tenants | | | | | | | | | | | | |
Stop & Shop - Malden | BBB+/Baa1/BBB | 79,229 | 29.1% | $1,519,520 | 30.6% | $19.18 | NAV | NAV | NAV | N | Various | 12/31/2026 |
Stop & Shop - Swampscott | BBB+/Baa1/BBB | 65,268 | 23.9% | $1,319,449 | 26.6% | $20.22 | NAV | NAV | NAV | N | Various | 12/31/2026 |
Stop & Shop - Framingham | BBB+/Baa1/BBB | 64,917 | 23.8% | $1,115,332 | 22.5% | $17.18 | NAV | NAV | NAV | N | Various | 12/31/2026 |
Stop & Shop - Bristol | BBB+/Baa1/BBB | 63,128 | 23.2% | $1,012,778 | 20.4% | $16.04 | NAV | NAV | NAV | N | Various | 12/31/2026 |
Subtotal/Wtd. Avg. | | 272,542 | 100.0% | $4,967,079 | 100.0% | $18.23 | | | | | | |
| | | | | | | | | | | | |
Vacant Space | | 0 | 0.0% | $0 | 0.0% | $0.00 | | | | | | |
Total/Wtd. Avg. | | 272,542 | 100.0% | $4,967,079 | 100.0% | $18.23 | | | | | | |
(1) | Information is based on the underwritten rent roll as of February 1, 2020. |
(2) | Certain ratings are those of the parent entity whether or not the parent entity guarantees the lease. |
The following table presents certain information relating to the lease expiration schedule at the Stop & Shop Portfolio:
Lease Expiration Schedule(1)
Year | No. of Leases Expiring | Expiring NRSF | % of Total NRSF | Cumulative Expiring NRSF | Cumulative % of Total NRSF | Annual U/W Base Rent | % of Total Annual U/W Base Rent | Annual U/W Base Rent PSF |
MTM | 0 | 0 | 0.0% | 0.0% | 0.0% | $0 | 0.0% | $0.00 |
2020 | 0 | 0 | 0.0% | 0.0% | 0.0% | $0 | 0.0% | $0.00 |
2021 | 0 | 0 | 0.0% | 0.0% | 0.0% | $0 | 0.0% | $0.00 |
2022 | 0 | 0 | 0.0% | 0.0% | 0.0% | $0 | 0.0% | $0.00 |
2023 | 0 | 0 | 0.0% | 0.0% | 0.0% | $0 | 0.0% | $0.00 |
2024 | 0 | 0 | 0.0% | 0.0% | 0.0% | $0 | 0.0% | $0.00 |
2025 | 0 | 0 | 0.0% | 0.0% | 0.0% | $0 | 0.0% | $0.00 |
2026 | 4 | 272,542 | 100.0% | 272,542 | 100.0% | $4,967,079 | 100.0% | $18.23 |
2027 | 0 | 0 | 0.0% | 272,542 | 100.0% | $0 | 0.0% | $0.00 |
2028 | 0 | 0 | 0.0% | 272,542 | 100.0% | $0 | 0.0% | $0.00 |
2029 | 0 | 0 | 0.0% | 272,542 | 100.0% | $0 | 0.0% | $0.00 |
2030 | 0 | 0 | 0.0% | 272,542 | 100.0% | $0 | 0.0% | $0.00 |
2031 & Beyond | 0 | 0 | 0.0% | 272,542 | 100.0% | $0 | 0.0% | $0.00 |
Vacant Space | 0 | 0 | 0.0% | 272,542 | 100.0% | $0 | 0.0% | $0.00 |
Total/Wtd. Avg. | 4 | 272,542 | 100.0% | | | $4,967,079 | 100.0% | $18.23 |
(1) | Information is based on the underwritten rent roll as of February 1, 2020. |
THE INFORMATION IN THIS STRUCTURAL AND COLLATERAL TERM SHEET IS NOT COMPLETE AND MAY BE AMENDED PRIOR TO THE TIME OF SALE. THIS TERM SHEET IS NOT AN OFFER TO SELL THESE SECURITIES AND IT IS NOT A SOLICITATION OF AN OFFER TO BUY THESE SECURITIES IN ANY JURISDICTION WHERE THE OFFER OR SALE IS NOT PERMITTED.
166
Retail – Single Tenant | Loan #14 | Cut-off Date Balance: | | $45,000,000 |
Property Address - Various | Stop & Shop Portfolio | Cut-off Date LTV: | | 61.1% |
| | U/W NCF DSCR: | | 2.87x |
| | U/W NOI Debt Yield: | | 10.3% |
Operating History and Underwritten Net Cash Flow. The following table presents certain information relating to the operating history and underwritten net cash flow at the Stop & Shop Portfolio:
Cash Flow Analysis
| | 2016 | | 2017 | | 2018 | | TTM
6/30/2019 | | U/W | | %(1) | | U/W $ per
SF | |
Gross Potential Rent | | $4,832,664 | | $4,967,088 | | $4,967,088 | | $4,967,088 | | $4,967,079 | | 70.9% | | $18.23 | |
Other Income | | 0 | | 0 | | 0 | | 0 | | 0 | | 0.0% | | 0.00 | |
Total Recoveries | | 0 | | 0 | | 0 | | 0 | | 2,037,125 | | 29.1% | | 7.47 | |
Net Rental Income | | $4,832,664 | | $4,967,088 | | $4,967,088 | | $4,967,088 | | $7,004,204 | | 100.0% | | $25.70 | |
Concessions | | 0 | | 0 | | 0 | | 0 | | 0 | | 0.0% | | 0.00 | |
(Vacancy & Credit Loss) | | 0 | | 0 | | 0 | | 0 | | -350,210 | | -7.1% | | (1.28) | |
Effective Gross Income | | $4,832,664 | | $4,967,088 | | $4,967,088 | | $4,967,088 | | $6,653,994 | | 95.0% | | $24.41 | |
| | | | | | | | | | | | | | | |
Real Estate Taxes | | 0 | | 0 | | 0 | | 0 | | 1,120,296 | | 16.8% | | 4.11 | |
Insurance | | 6,456 | | 6,354 | | 6,570 | | 6,887 | | 95,390 | | 1.4% | | 0.35 | |
Management Fee | | 0 | | 0 | | 0 | | 0 | | 140,084 | | 2.1% | | 0.51 | |
Other Operating Expenses(2) | | 0 | | 2,276 | | 5,583 | | 5,345 | | 681,356 | | 10.2% | | 2.50 | |
Total Operating Expenses | | $6,456 | | $8,630 | | $12,153 | | $12,232 | | $2,037,126 | | 30.6% | | $7.47 | |
| | | | | | | | | | | | | | | |
Net Operating Income | | $4,826,208 | | $4,958,458 | | $4,954,935 | | $4,954,856 | | $4,616,868 | | 69.4% | | $16.94 | |
Replacement Reserves | | 0 | | 0 | | 0 | | 0 | | 72,627 | | 1.1% | | 0.27 | |
TI/LC | | 0 | | 0 | | 0 | | 0 | | 35,188 | | 0.5% | | 0.13 | |
Net Cash Flow | | $4,826,208 | | $4,958,458 | | $4,954,935 | | $4,954,856 | | $4,509,052 | | 67.8% | | $16.54 | |
| | | | | | | | | | | | | | | |
NOI DSCR | | 3.07x | | 3.15x | | 3.15x | | 3.15x | | 2.94x | | | | | |
NCF DSCR | | 3.07x | | 3.15x | | 3.15x | | 3.15x | | 2.87x | | | | | |
NOI Debt Yield | | 10.7% | | 11.0% | | 11.0% | | 11.0% | | 10.3% | | | | | |
NCF Debt Yield | | 10.7% | | 11.0% | | 11.0% | | 11.0% | | 10.0% | | | | | |
(1) | Represents (i) percent of Net Rental Income for all revenue fields, (ii) percent of Gross Potential Rent for Vacancy & Credit Loss and (iii) percent of Effective Gross Income for all other fields. |
(2) | Historical Other Operating Expenses are comprised of general maintenance and UW Other Operating Expenses are comprised of repairs and maintenance. |
Market Overview and Competition. The Stop & Shop Portfolio Properties are located in two different markets across two states. The greatest concentration of Stop & Shop Portfolio Properties is in Massachusetts (76.8% of total square feet) and one Stop & Shop Portfolio Property is located in Rhode Island (23.2% of total square feet). The Stop & Shop - Malden, Stop & Shop - Swampscott and Stop & Shop - Framingham Properties are located within the Boston retail market. According to the appraisal, as of the third quarter of 2019, the vacancy rate in the Boston retail market was approximately 7.4%, with average asking rents of $24.28 PSF and inventory of approximately 37.6 million square feet. The Stop & Shop - Bristol Property is located within the Providence retail market. According to the appraisal, as of the third quarter of 2019, the vacancy rate in the Providence retail market was approximately 10.9%, with average asking rents of $21.90 PSF and inventory of approximately 6.5 million square feet.
The Stop & Shop - Malden and Stop & Shop – Swampscott Properties are located within the North Shore/Route 128 North retail submarket. According to the appraisal, as of the third quarter of 2019, the vacancy rate in the North Shore/Route 128 North retail submarket was approximately 8.6%, with average asking rents of $25.09 PSF and inventory of approximately 6.1 million square feet. According to the appraisal, the 2019 population within a one-, three- and five-mile radius of the Stop & Shop - Malden Property was 45,102, 244,971 and 643,271, respectively. The 2019 average household income within the same one-, three- and five-mile radius was $93,867, $95,643 and $112,735, respectively. According to the appraisal, the 2019 population within a one-, three- and five-mile radius of the Stop & Shop – Swampscott Property was 15,150, 117,720 and 220,912, respectively. The 2019 average household income within the same one-, three- and five-mile radius was $139,026, $91,732 and $94,470, respectively.
The Stop & Shop - Framingham Property is located within the West retail submarket. According to the appraisal, as of the third quarter of 2019, the vacancy rate in the West retail submarket was approximately 5.8%, with average asking rents of $25.62 PSF and inventory of approximately 4.3 million square feet. According to the appraisal, the 2019 population within a one-, three- and five-mile radius of the Stop & Shop - Malden, MA Property was 10,060, 76,688 and 137,140, respectively. The 2019 average household income within the same one-, three- and five-mile radius was $92,319, $115,042 and $138,179, respectively.
The Stop & Shop - Bristol Property is located within the Central Providence retail submarket. According to the appraisal, as of the third quarter of 2019, the vacancy rate in the Central Providence retail submarket was approximately 14.7%, with average asking rents of $23.69 PSF and inventory of approximately 3.0 million square feet. According to the appraisal, the 2019 population within a one-, three- and five-mile radius of the Stop & Shop - Bristol Property was 26,870, 71,463 and 340,314, respectively. The 2019 average household income within the same one-, three- and five-mile radius was $95,064, $92,731 and $85,459, respectively.
THE INFORMATION IN THIS STRUCTURAL AND COLLATERAL TERM SHEET IS NOT COMPLETE AND MAY BE AMENDED PRIOR TO THE TIME OF SALE. THIS TERM SHEET IS NOT AN OFFER TO SELL THESE SECURITIES AND IT IS NOT A SOLICITATION OF AN OFFER TO BUY THESE SECURITIES IN ANY JURISDICTION WHERE THE OFFER OR SALE IS NOT PERMITTED.
167
Retail – Single Tenant | Loan #14 | Cut-off Date Balance: | | $45,000,000 |
Property Address - Various | Stop & Shop Portfolio | Cut-off Date LTV: | | 61.1% |
| | U/W NCF DSCR: | | 2.87x |
| | U/W NOI Debt Yield: | | 10.3% |
The following table presents certain information relating to the appraiser’s market rent conclusion for tenants at the Stop & Shop Portfolio Properties:
Market Rent Summary
Building | Market Rent (PSF) | Lease Term (Years) | Rent Increase Projection |
Stop & Shop - Malden | $19.00 | 10.0 | 10.0% Year 6 |
Stop & Shop - Swampscott | $19.00 | 10.0 | 10.0% Year 6 |
Stop & Shop - Framingham | $16.00 | 10.0 | 10.0% Year 6 |
Stop & Shop - Bristol | $17.50 | 10.0 | 10.0% Year 6 |
The following table presents certain information relating to eight comparable leases to those at the Stop & Shop Portfolio:
Comparable Leases(1)
Property Name/Address | Year Built | Total GLA (SF) | Tenant Name | Lease Size (SF) | Lease Date |
Initial Rent/SF
| Lease Type |
Lincoln Mall 622 George Washington Highway Lincoln, RI | 1975 | 578,790 | Stop & Shop | 56,040 | 9/1/2020 | $18.00 | Net |
North Shore Crossing 140 Brimball Avenue Beverly, MA | 2018 | 65,389 | Whole Foods | 35,000 | 6/1/2019 | $18.75 | Net |
Newton Nexus 165 Needham Street Newton Highlands, MA | 2018 | 131,000 | Stop & Shop | 20,950 | 1/1/2019 | $33.00 | Net |
Milford Crossing 120 Medway Road Milford, MA | 2017 | 158,627 | Stop & Shop | 68,483 | 11/1/2017 | $12.81 | Net |
Lakeway Commons 195 Boston Turnpike Shrewsbury, MA | 2017 | 100,000 | Whole Foods | 50,000 | 7/1/2017 | $18.50 | Net |
Shrewsbury Commons 529 Boston Turnpike Shrewsbury, MA | 1992 | 77,015 | Stop & Shop | 64,215 | 5/1/2017 | $12.00 | Net |
(1) | Information obtained from the appraisal. |
Release of Property. The borrowers have the right, at any time after the expiration of the prepayment lockout period, and provided no event of default under the Stop & Shop Portfolio Mortgage Loan documents exists, to obtain the release of any one or more individual Stop & Shop Portfolio Properties, provided certain conditions are satisfied, including (i) prepayment of a release price equal to 110% of the allocated loan amount of the related individual Stop & Shop Portfolio Property, together with, if prior to the open prepayment date, a prepayment fee equal to the greater of (x) 1.00% of the principal amount prepaid and (y) a yield maintenance premium, (ii) the debt yield of the Stop & Shop Portfolio Mortgage Loan after giving effect to the release is greater than the greater of (x) the debt yield immediately prior to the release, and (y) 10.2%; provided, however, that if the then debt yield does not satisfy such requirement, the borrowers may prepay the Stop & Shop Portfolio Mortgage Loan in part, together with, if prior to the open prepayment date, the above prepayment fee, in order to satisfy the requirement, and (iii) satisfaction of REMIC-related requirements.
THE INFORMATION IN THIS STRUCTURAL AND COLLATERAL TERM SHEET IS NOT COMPLETE AND MAY BE AMENDED PRIOR TO THE TIME OF SALE. THIS TERM SHEET IS NOT AN OFFER TO SELL THESE SECURITIES AND IT IS NOT A SOLICITATION OF AN OFFER TO BUY THESE SECURITIES IN ANY JURISDICTION WHERE THE OFFER OR SALE IS NOT PERMITTED.
168
(THIS PAGE INTENTIONALLY LEFT BLANK)
THE INFORMATION IN THIS STRUCTURAL AND COLLATERAL TERM SHEET IS NOT COMPLETE AND MAY BE AMENDED PRIOR TO THE TIME OF SALE. THIS TERM SHEET IS NOT AN OFFER TO SELL THESE SECURITIES AND IT IS NOT A SOLICITATION OF AN OFFER TO BUY THESE SECURITIES IN ANY JURISDICTION WHERE THE OFFER OR SALE IS NOT PERMITTED.
169
| No. 15 – 3900 Camelback |
|
Mortgage Loan Information | | Mortgaged Property Information |
Mortgage Loan Seller: | Morgan Stanley Mortgage Capital Holdings LLC | | Single Asset/Portfolio: | Single Asset |
Credit Assessment (Fitch/KBRA/S&P): | NR/NR/NR | | Property Type – Subtype: | Office – Suburban |
Original Principal Balance: | $37,450,000 | | Location: | Phoenix, AZ |
Cut-off Date Balance: | $37,450,000 | | Size: | 177,520 SF |
% of Initial Pool Balance: | 2.3% | | Cut-off Date Balance Per SF: | $210.96 |
Loan Purpose: | Acquisition | | Maturity Date Balance Per SF: | $210.96 |
Borrower Sponsors: | Paragon Outcomes Management; Wilshire Capital Partners | | Year Built/Renovated: | 2009/NAP |
Guarantors(1): | Scott Sorenson; R. Taylor Bennett | | Title Vesting: | Fee |
Mortgage Rate: | 3.4800% | | Property Manager: | Ryan Companies US, Inc. |
Note Date: | November 15, 2019 | | Current Occupancy (As of): | 91.0% (10/31/2019) |
Seasoning: | 2 months | | YE 2018 Occupancy: | 94.5% |
Maturity Date: | December 1, 2029 | | YE 2017 Occupancy: | 94.1% |
IO Period: | 120 months | | YE 2016 Occupancy: | 92.4% |
Loan Term (Original): | 120 months | | YE 2015 Occupancy: | 58.8% |
Amortization Term (Original): | NAP | | As-Is Appraised Value: | $55,000,000 |
Loan Amortization Type: | Interest-only, Balloon | | As-Is Appraised Value Per SF: | $309.82 |
Call Protection: | L(26),D(89),O(5) | | As-Is Appraisal Valuation Date: | October 18, 2019 |
Lockbox Type: | Hard/Springing Cash Management | | | |
Additional Debt: | None | | Underwriting and Financial Information |
Additional Debt Type (Balance): | NAP | | TTM NOI (9/30/2019): | $3,947,577 |
| | | YE 2018 NOI: | $3,737,040 |
| | | YE 2017 NOI: | $3,790,613 |
| | | YE 2016 NOI: | $2,934,512 |
| | | U/W Revenues: | $6,044,368 |
| | | U/W Expenses: | $2,061,632 |
Escrows and Reserves | | U/W NOI: | $3,982,736 |
| Initial | Monthly | Cap | | U/W NCF: | $3,553,432 |
Taxes | $0 | $53,905 | NAP | | U/W DSCR based on NOI/NCF: | 3.01x / 2.69x |
Insurance | $6,638 | $3,319 | NAP | | U/W Debt Yield based on NOI/NCF: | 10.6% / 9.5% |
Deferred Maintenance | $8,125 | $0 | NAP | | U/W Debt Yield at Maturity based on NOI/NCF | 10.6% / 9.5% |
Replacement Reserve | $0 | $2,959 | $106,512 | | Cut-off Date LTV Ratio: | 68.1% |
TI/LC | $500,000 | $18,492 | $1,000,000 | | LTV Ratio at Maturity: | 68.1% |
| | | | | | | |
Sources and Uses |
Sources | | | | | Uses | | | |
Original loan amount | $37,450,000 | | 65.6% | | Purchase price | $54,500,000 | | 95.5% |
Cash equity contribution | 19,629,149 | | 34.4 | | Closing costs | 2,064,386 | | 3.6 |
| | | | | Upfront reserves | 514,763 | | 0.9 |
Total Sources | $57,079,149 | | 100.0% | | Total Uses | $57,079,149 | | 100.0% |
(1) | The mortgage loan documents permit certain transfers of interests in the borrower to Paragon Real Assets LLC (“Paragon”). If such transfers occur such that Paragon obtains control over the borrower, Paragon will be permitted to act as replacement guarantor provided it meets certain net worth and liquidity requirements. |
The Mortgage Loan. The mortgage loan (the “3900 Camelback Mortgage Loan”) is evidenced by a single promissory note secured by a first mortgage encumbering the fee interest in an office building located in Phoenix, Arizona (the “3900 Camelback Property”). The proceeds of the 3900 Camelback Mortgage Loan were used to acquire the 3900 Camelback Property, to fund reserves and to pay closing costs.
The Property. The 3900 Camelback Property consists of a three-story office building, totaling 177,520 square feet, on an approximately 4.6-acre site in Phoenix, Arizona. The 3900 Camelback Property was originally built in 2009. The 3900 Camelback Property also includes a subterranean parking garage with direct access to the office portion of the 3900 Camelback Property. The 3900 Camelback Property was 91.0% leased as of October 31, 2019 to 10 tenants.
Major Tenants.
Shamrock Foods Company (76,943 square feet, 43.3% of net rentable area, 49.0% of underwritten base rent, 5/31/2026 lease expiration). Shamrock Foods Company has been a tenant at the 3900 Camelback Property since 2010 and has expanded its space twice since then. Shamrock Foods Company extended its lease relating to two suites at the 3900 Camelback Property such that it will expire on May 31, 2026, and has two, five-year renewal options remaining. Shamrock Foods Company was founded in 1922 as a
THE INFORMATION IN THIS STRUCTURAL AND COLLATERAL TERM SHEET IS NOT COMPLETE AND MAY BE AMENDED PRIOR TO THE TIME OF SALE. THIS TERM SHEET IS NOT AN OFFER TO SELL THESE SECURITIES AND IT IS NOT A SOLICITATION OF AN OFFER TO BUY THESE SECURITIES IN ANY JURISDICTION WHERE THE OFFER OR SALE IS NOT PERMITTED.
170
Office - Suburban | Loan #15 | Cut-off Date Balance: | | $37,450,000 |
3900 East Camelback Road | 3900 Camelback | Cut-off Date LTV: | | 68.1% |
Phoenix, AZ 85018 | | U/W NCF DSCR: | | 2.69x |
| | U/W NOI Debt Yield: | | 10.6% |
company specializing in the distribution of fresh and frozen foods, specialty items and gourmet foods to food service customers. The company is now the largest family owned dairy in the Southwest, with over 10,000 head of cattle and has a full line of organic and conventional dairy products. Shamrock Foods Company is an affiliate of the seller of the 3900 Camelback Property.
Ryan Companies US Inc. (17,485 square feet, 9.8% of net rentable area, 12.3% of underwritten base rent, 5/31/2026 lease expiration). Ryan Companies US Inc. has been in occupancy at the 3900 Camelback Property since 2010 and has amended its lease twice since then. Ryan Companies US Inc. has extended its lease relating to a suite at the 3900 Camelback Property such that it will expire on May 31, 2026, with two five-year renewal options remaining. Ryan Companies US Inc. was founded in the 1930s as Ryan Lumber and Coal and quickly grew into a full-service and multi-platform company with offices around the country engaging in construction, architecture and engineering, development, real estate management, and capital markets. Ryan Companies US Inc. is the property manager of the 3900 Camelback Property and an affiliate of the seller of the 3900 Camelback Property.
Nova Financial / Nova Home Loans (13,598 square feet, 7.7% of net rentable area, 7.2% of underwritten base rent, 5/31/2023 lease expiration). Nova Financial / Nova Home Loans has been a tenant at the 3900 Camelback Property since 2016 and has a lease expiration of May 31, 2023 with one, five-year renewal option remaining. Nova Financial / Nova Home Loans has served the needs of homeowners and homebuyers since 1980. The company has offices in Arizona, California, Colorado, and Nevada and is able to originate loans in 12 states.
Fidelity National Title / Grand Canyon (12,680 square feet, 7.1% of net rentable area, 7.1% of underwritten base rent, 1/31/2022 lease expiration). Fidelity National Title / Grand Canyon has been a tenant at the 3900 Camelback Property since 2016 and has a lease expiration of January 31, 2022, with two three-year renewal options remaining. Grand Canyon, a division of Fidelity National Title Agency (“FNTA”) began servicing the Arizona real estate market in 1982 and has grown into one of the largest title and escrow companies in Arizona. The parent company, FNTA, is a member of the Fidelity National Financial family of companies, the largest and most profitable title insurance company in the industry providing centralized and distributed title and settlement services through the United States, Canada, and many international locations.
The Pain Center of Arizona (11,924 square feet, 6.7% of net rentable area, 7.3% of underwritten base rent, various lease expirations). The Pain Center of Arizona has been a tenant at the 3900 Camelback Property since 2012 and has executed three lease amendments and one lease expansion since then. The Pain Center of Arizona extended its lease relating to two of its suites at the 3900 Camelback Property such that it will expire on June 30, 2023 and one of its suites such that it will expire on February 28, 2022; it has one five-year renewal option remaining. As of June 2019, The Pain Center of Arizona subleased 2,152 square feet in Suite 185 to ATI Holdings of Arizona, LLC until June 14, 2023 at the same rate as the lease. In addition, approximately 2,712 square feet is currently unoccupied.
The following table presents certain information relating to the tenancy at the 3900 Camelback Property:
Major Tenants(1)
Tenant Name | Credit Rating
(Fitch/Moody’s/
S&P)(2) | Tenant
NRSF | % of
NRSF | Annual
U/W
Base
Rent PSF | Annual
U/W Base
Rent | % of Total
Annual
U/W Base
Rent | Lease
Expiration
Date | Extension Options | Termination
Option
(Y/N) |
Major Tenant | | | | | | | | |
Shamrock Foods Company | NR/NR/NR | 76,943 | 43.3% | $34.28 | $2,637,492 | 49.0% | 5/31/2026 | 2, 5-year | N |
Ryan Companies US Inc | NR/NR/NR | 17,485 | 9.8% | $37.79 | $660,758 | 12.3% | 5/31/2026 | 2, 5-year | N |
Nova Financial / Nova Home Loans | NR/NR/NR | 13,598 | 7.7% | $28.70 | $390,263 | 7.2% | 5/31/2023 | 1, 5-year | N |
Fidelity National Title / Grand Canyon | NR/NR/NR | 12,680 | 7.1% | $30.25 | $383,570 | 7.1% | 1/31/2022 | 2, 3-year | N |
The Pain Center of Arizona(3) | NR/NR/NR | 11,924 | 6.7% | $32.76 | $390,592 | 7.3% | Various | 1, 5-year | N |
Total Major Tenants | 132,630 | 74.7% | $33.65 | $4,462,675 | 82.8% | | | |
| | | | | | | | | |
Other Tenants | 28,927 | 16.3% | $31.95 | $924,233 | 17.2% | | | |
| | | | | | | | |
Occupied Collateral Total | 161,557 | 91.0% | $33.34 | $5,386,908 | 100.0% | | | |
| | | | | | | | |
Vacant Space | 15,963 | 9.0% | | | | | | |
| | | | | | | | |
Collateral Total | 177,520 | 100.0% | | | | | | |
| | | | | | | | | |
(1) | Information is based on the underwritten rent roll. |
(2) | Certain ratings are those of the parent company whether or not the parent guarantees the lease. |
(3) | The lease on one of The Pain Center of Arizona suites at the 3900 Camelback Property expires on June 30, 2023 (7,981 square feet) and the lease on its second suite expires on February 28, 2022 (3,943 square feet). As of June 2019, Pain Center of Arizona subleased 2,152 square feet in Suite 185 to ATI Holdings of Arizona, LLC until June 14, 2023 at the same rate as the lease. In addition, approximately 2,712 square feet is currently unoccupied. |
THE INFORMATION IN THIS STRUCTURAL AND COLLATERAL TERM SHEET IS NOT COMPLETE AND MAY BE AMENDED PRIOR TO THE TIME OF SALE. THIS TERM SHEET IS NOT AN OFFER TO SELL THESE SECURITIES AND IT IS NOT A SOLICITATION OF AN OFFER TO BUY THESE SECURITIES IN ANY JURISDICTION WHERE THE OFFER OR SALE IS NOT PERMITTED.
171
Office - Suburban | Loan #15 | Cut-off Date Balance: | | $37,450,000 |
3900 East Camelback Road | 3900 Camelback | Cut-off Date LTV: | | 68.1% |
Phoenix, AZ 85018 | | U/W NCF DSCR: | | 2.69x |
| | U/W NOI Debt Yield: | | 10.6% |
The following table presents certain information relating to the lease rollover schedule at the 3900 Camelback Property:
Lease Expiration Schedule(1)(2)
Year Ending
December 31, | No. of
Leases Expiring | Expiring
NRSF | % of
Total
NRSF | Cumulative
Expiring
NRSF | Cumulative %
of Total
NRSF | Annual
U/W
Base Rent | % of Total
Annual
U/W Base
Rent | Annual
U/W
Base Rent
PSF |
MTM | 1 | 2,677 | 1.5% | 2,677 | 1.5% | $91,018 | 1.7% | $34.00 |
2020 | 1 | 4,456 | 2.5% | 7,133 | 4.0% | $139,250 | 2.6% | $31.25 |
2021 | 1 | 3,517 | 2.0% | 10,650 | 6.0% | $107,269 | 2.0% | $30.50 |
2022 | 3 | 25,174 | 14.2% | 35,824 | 20.2% | $793,540 | 14.7% | $31.52 |
2023 | 2 | 21,579 | 12.2% | 57,403 | 32.3% | $661,619 | 12.3% | $30.66 |
2024 | 1 | 9,726 | 5.5% | 67,129 | 37.8% | $295,962 | 5.5% | $30.43 |
2025 | 0 | 0 | 0.0% | 67,129 | 37.8% | $0 | 0.0% | $0.00 |
2026 | 2 | 94,428 | 53.2% | 161,557 | 91.0% | $3,298,251 | 61.2% | $34.93 |
2027 | 0 | 0 | 0.0% | 161,557 | 91.0% | $0 | 0.0% | $0.00 |
2028 | 0 | 0 | 0.0% | 161,557 | 91.0% | $0 | 0.0% | $0.00 |
2029 | 0 | 0 | 0.0% | 161,557 | 91.0% | $0 | 0.0% | $0.00 |
2030 | 0 | 0 | 0.0% | 161,557 | 91.0% | $0 | 0.0% | $0.00 |
Thereafter | 0 | 0 | 0.0% | 161,557 | 91.0% | $0 | 0.0% | $0.00 |
Vacant | 0 | 15,963 | 9.0% | 177,520 | 100.0% | $0 | 0.0% | $0.00 |
Total/Weighted Average(3) | 11 | 177,520 | 100.0% | | | $5,386,908 | 100.0% | $33.34 |
(1) | Information obtained from the underwritten rent roll. |
(2) | Certain tenants may have lease termination options that are exercisable prior to the originally stated expiration date of the subject lease and that are not considered in the Lease Expiration Schedule. |
(3) | Total/Weighted Average Annual U/W Base Rent PSF excludes Vacant space. |
The following table presents historical occupancy percentages at the 3900 Camelback Property:
Historical Occupancy
12/31/2016(1) | | 12/31/2017(1) | | 12/31/2018(1) | | 10/31/2019(2) | |
92.4% | | 94.1% | | 94.5% | | 91.0% | |
| (1) | Information obtained from the borrower sponsor. |
| (2) | Information obtained from the underwritten rent roll. |
THE INFORMATION IN THIS STRUCTURAL AND COLLATERAL TERM SHEET IS NOT COMPLETE AND MAY BE AMENDED PRIOR TO THE TIME OF SALE. THIS TERM SHEET IS NOT AN OFFER TO SELL THESE SECURITIES AND IT IS NOT A SOLICITATION OF AN OFFER TO BUY THESE SECURITIES IN ANY JURISDICTION WHERE THE OFFER OR SALE IS NOT PERMITTED.
172
Office - Suburban | Loan #15 | Cut-off Date Balance: | | $37,450,000 |
3900 East Camelback Road | 3900 Camelback | Cut-off Date LTV: | | 68.1% |
Phoenix, AZ 85018 | | U/W NCF DSCR: | | 2.69x |
| | U/W NOI Debt Yield: | | 10.6% |
Operating History and Underwritten Net Cash Flow. The following table presents certain information relating to the operating history and underwritten net cash flow at the 3900 Camelback Property:
Cash Flow Analysis
| | 2016 | | 2017 | | 2018 | | TTM
9/30/2019 | | U/W | | %(1) | | U/W $ per
SF |
Rents in Place | | $4,323,704 | | $5,134,739 | | $5,112,162 | | $5,333,141 | | $5,370,197 | | 80.9% | | $30.25 | |
Contractual Rent Steps | | 0 | | 0 | | 0 | | 0 | | 16,712 | | 0.3 | | 0.09 | |
Grossed Up Vacant Space | | 0 | | 0 | | 0 | | 0 | | 542,742 | | 8.2 | | 3.06 | |
Gross Potential Rent | | $4,323,704 | | $5,134,739 | | $5,112,162 | | $5,333,141 | | $5,929,650 | | 89.3% | | $33.40 | |
Other Income | | 303,476 | | 412,911 | | 398,421 | | 400,263 | | 444,187 | | 6.7 | | 2.50 | |
Total Recoveries | | 24,369 | | 153,545 | | 273,537 | | 270,871 | | 263,496 | | 4.0 | | 1.48 | |
Net Rental Income | | $4,651,549 | | $5,701,195 | | $5,784,121 | | $6,004,275 | | $6,637,333 | | 100.0% | | $37.39 | |
(Vacancy & Credit Loss)(2) | | 0 | | 0 | | 0 | | 0 | | (592,965) | | (10.0) | | (3.34) | |
Effective Gross Income | | $4,651,549 | | $5,701,195 | | $5,784,121 | | $6,004,275 | | $6,044,368 | | 91.1% | | $34.05 | |
| | | | | | | | | | | | | | | |
Real Estate Taxes | | 556,233 | | 579,891 | | 603,221 | | 586,848 | | 628,011 | | 10.4 | | 3.54 | |
Insurance | | 27,224 | | 29,397 | | 21,232 | | 22,553 | | 37,933 | | 0.6 | | 0.21 | |
Management Fee | | 179,156 | | 229,122 | | 233,572 | | 232,940 | | 181,331 | | 3.0 | | 1.02 | |
Other Operating Expenses | | 954,424 | | 1,072,171 | | 1,189,056 | | 1,214,357 | | 1,214,357 | | 20.1 | | 6.84 | |
Total Operating Expenses | | $1,717,037 | | $1,910,581 | | $2,047,081 | | $2,056,699 | | $2,061,632 | | 34.1% | | $11.61 | |
| | | | | | | | | | | | | | | |
Net Operating Income | | $2,934,512 | | $3,790,613 | | $3,737,040 | | $3,947,577 | | $3,982,736 | | 65.9% | | $22.44 | |
Replacement Reserves | | 0 | | 0 | | 0 | | 0 | | 35,504 | | 0.6 | | 0.20 | |
TI/LC | | 0 | | 0 | | 0 | | 0 | | 393,800 | | 6.5 | | 2.22 | |
Net Cash Flow | | $2,934,512 | | $3,790,613 | | $3,737,040 | | $3,947,577 | | $3,553,432 | | 58.8% | | $20.02 | |
| | | | | | | | | | | | | | | |
NOI DSCR | | 2.22x | | 2.87x | | 2.83x | | 2.99x | | 3.01x | | | | | |
NCF DSCR | | 2.22x | | 2.87x | | 2.83x | | 2.99x | | 2.69x | | | | | |
NOI Debt Yield | | 7.8% | | 10.1% | | 10.0% | | 10.5% | | 10.6% | | | | | |
NCF Debt Yield | | 7.8% | | 10.1% | | 10.0% | | 10.5% | | 9.5% | | | | | |
(1) | Represents (i) percent of Net Rental Income for all revenue fields, (ii) percent of Gross Potential Rent for Vacancy & Credit Loss and (iii) percent of Effective Gross Income for all other fields. |
(2) | The underwritten economic vacancy is 10.0%. The 3900 Camelback Property is 91.0% leased as of October 31, 2019. |
Market Overview and Competition. The 3900 Camelback Property is located in Phoenix, Arizona within Maricopa County, which is 5 miles northeast of the Phoenix Central Business District. Land uses immediately surrounding the 3900 Camelback Property are predominantly a mix of mid-level and executive housing, average- to high-quality apartments, retail centers, and office employment areas within the neighborhood. Primary access to the 3900 Camelback Property is provided by Piestewa Peak Parkway, which provides access to the southeastern portions of metropolitan Phoenix via connections with the Maricopa Freeway (Interstate 10), Red Mountain Freeway (State Route 202), and Pima Freeway (State Route 101). According to the appraisal, as of the second quarter of 2019, the Phoenix office market had an inventory of approximately 90.0 million square feet, overall vacancy in the market of approximately 14.9% and direct asking rent of $26.89 per square foot. The estimated 2019 population within a one-, three- and five- mile radius is 12,325, 96,898 and 291,199, respectively, according to the appraisal. The estimated 2019 median household income within a one-, three- and five- mile radius is $85,666, $61,340 and $56,179, respectively, according to the appraisal.
Submarket Information – According to the appraisal, as of the second quarter of 2019, the related Camelback Corridor office submarket had an inventory of approximately 7.0 million square feet, overall vacancy in the submarket of approximately 18.9% and direct asking rent of $33.22 per square foot.
THE INFORMATION IN THIS STRUCTURAL AND COLLATERAL TERM SHEET IS NOT COMPLETE AND MAY BE AMENDED PRIOR TO THE TIME OF SALE. THIS TERM SHEET IS NOT AN OFFER TO SELL THESE SECURITIES AND IT IS NOT A SOLICITATION OF AN OFFER TO BUY THESE SECURITIES IN ANY JURISDICTION WHERE THE OFFER OR SALE IS NOT PERMITTED.
173
Office - Suburban | Loan #15 | Cut-off Date Balance: | | $37,450,000 |
3900 East Camelback Road | 3900 Camelback | Cut-off Date LTV: | | 68.1% |
Phoenix, AZ 85018 | | U/W NCF DSCR: | | 2.69x |
| | U/W NOI Debt Yield: | | 10.6% |
The following table presents certain information relating to the appraiser’s market rent conclusion for the 3900 Camelback Property:
Market Rent Summary(1)
| > 10,000
SF | 3rd Floor | < 10,000 SF |
Market Rent (PSF) | $33.00 | $34.00 | $33.00 |
Lease Term (Mos.) | 84 | 84 | 60 |
Lease Type (Reimbursements) | Base Year Stop | Base Year Stop | Base Year Stop |
Rent Increase Projection | $0.75 PSF per annum | $0.75 PSF per annum | $0.75 PSF per annum |
| (1) | Information obtained from the appraisal. |
The table below presents certain information relating to comparable sales for the 3900 Camelback Property identified by the appraiser:
Comparable Sales(1)
Property Name/Location | Sale Date | Total NRA
(SF) | Total
Occupancy | Sale Price | Sale Price
PSF |
3900 Camelback Phoenix, AZ (subject) | Sep-2019 | 177,520(2) | 91.0%(2) | $54,500,000 | $307.01 |
24th at Camelback I Phoenix, AZ | Jun-2018 | 302,209 | 95.0% | $100,000,000 | $330.90 |
The Quad Scottsdale, AZ | Jul-2018 | 166,606 | 98.0% | $51,000,000 | $306.11 |
Liberty Center @ Rio Salado Tempe, AZ | Sep-2018 | 682,406 | 100.0% | $215,250,000 | $315.43 |
Kierland Corporate Center II Scottsdale, AZ | Nov-2018 | 78,273 | 93.0% | $25,000,000 | $319.39 |
Camelback Square Scottsdale, AZ | Jan-2019 | 175,268 | 84.0% | $53,200,000 | $303.54 |
The Alameda Tempe, AZ | Feb-2019 | 236,188 | 100.0% | $71,500,000 | $302.72 |
Camelback Esplanade III Phoenix, AZ | Jul-2019 | 218,387 | 50.0% | $60,250,000 | $275.89 |
| (1) | Information obtained from the appraisal. |
| (2) | Information obtained from the underwritten rent roll. |
THE INFORMATION IN THIS STRUCTURAL AND COLLATERAL TERM SHEET IS NOT COMPLETE AND MAY BE AMENDED PRIOR TO THE TIME OF SALE. THIS TERM SHEET IS NOT AN OFFER TO SELL THESE SECURITIES AND IT IS NOT A SOLICITATION OF AN OFFER TO BUY THESE SECURITIES IN ANY JURISDICTION WHERE THE OFFER OR SALE IS NOT PERMITTED.
174
Office - Suburban | Loan #15 | Cut-off Date Balance: | | $37,450,000 |
3900 East Camelback Road | 3900 Camelback | Cut-off Date LTV: | | 68.1% |
Phoenix, AZ 85018 | | U/W NCF DSCR: | | 2.69x |
| | U/W NOI Debt Yield: | | 10.6% |
The following table presents certain information relating to eight comparable leases to those at the 3900 Camelback Property:
Comparable Leases(1)
Property Name/Address | Year
Built | Total GLA
(SF) | Tenant Name | Lease
Size (SF) | Lease Date |
Initial
Rent/SF
| Reimbursements |
The Camelback 3131 & 3133 E Camelback Rd Phoenix, AZ | 1998 | 295,334 | Teachers Insurance | 8,636 | 2/1/2019 | $35.00 | Base Year Stop |
The 5090 Building 5090 N 40th St Phoenix, AZ | 1988 | 175,186 | Arizona Advisors | 1,969 | 3/1/2019 | $32.00 | Base Year Stop |
Biltmore Commerce Center 3200 E Camelback Rd Phoenix, AZ | 1985 | 259,730 | Mutual of Omaha | 5,939 | 3/1/2019 | $33.00 | Base Year Stop |
Camelback Lakes 2710-2850 E Camelback Rd Phoenix, AZ | 1982 | 201,134 | BBVA | 24,000 | 1/1/2020 | $33.00 | Base Year Stop |
Camelback Collective 2801 E Camelback Rd Phoenix, AZ | 2019 | 118,500 | Camelback Services | 12,090 | 10/1/2018 | $41.50 | Base Year Stop |
Anchor Centre East & West 2201 & 2231 E Camelback Rd Phoenix, AZ | 1984 | 337,538 | World Wide Technology | 13,115 | 1/1/2019 | $32.50 | Base Year Stop |
Biltmore Center 2390, 2394 & 2398 E Camelback Rd Phoenix, AZ | 1985 | 629,366 | Dentons | 5,752 | 4/1/2019 | $40.00 | Base Year Stop |
24th at Camelback I 2375 E Camelback Rd Phoenix, AZ | 2000 | 302,209 | Davis RE | 1,649 | 1/1/2019 | $39.00 | Base Year Stop |
| | | | | | | |
(1) | Information obtained from the appraisal. |
THE INFORMATION IN THIS STRUCTURAL AND COLLATERAL TERM SHEET IS NOT COMPLETE AND MAY BE AMENDED PRIOR TO THE TIME OF SALE. THIS TERM SHEET IS NOT AN OFFER TO SELL THESE SECURITIES AND IT IS NOT A SOLICITATION OF AN OFFER TO BUY THESE SECURITIES IN ANY JURISDICTION WHERE THE OFFER OR SALE IS NOT PERMITTED.
175
BANK 2020-BNK25 | Transaction Contact Information |
VI. Transaction Contact Information
Questions regarding this Structural and Collateral Term Sheet may be directed to any of the following individuals:
Wells Fargo Securities, LLC | |
| |
Brigid Mattingly | Tel. (312) 269-3062 |
| |
A.J. Sfarra | Tel. (212) 214-5613 |
| |
Alex Wong | Tel. (212) 214-5615 |
BofA Securities, Inc. | |
| |
Leland F. Bunch, III | Tel. (646) 855-3953 |
| |
Danielle Caldwell | Tel. (646) 855-3421 |
Morgan Stanley & Co. | |
| |
Nishant Kapur | Tel. (212) 761-1483 |
| |
Jane Lam | Tel. (212) 296-8567 |
| |
Brandon Atkins | Tel. (212) 761-4846 |
THE INFORMATION IN THIS STRUCTURAL AND COLLATERAL TERM SHEET IS NOT COMPLETE AND MAY BE AMENDED PRIOR TO THE TIME OF SALE. THIS TERM SHEET IS NOT AN OFFER TO SELL THESE SECURITIES AND IT IS NOT A SOLICITATION OF AN OFFER TO BUY THESE SECURITIES IN ANY JURISDICTION WHERE THE OFFER OR SALE IS NOT PERMITTED.
176