| | | FREE WRITING PROSPECTUS |
| | | FILED PURSUANT TO RULE 433 |
| | | REGISTRATION FILE NO.: 333-257991-03 |
| | | |
Free Writing Prospectus
Structural and Collateral Term Sheet
$1,173,324,212
(Approximate Initial Pool Balance)
$999,012,000
(Approximate Aggregate Certificate Balance of Offered Certificates)
BANK 2022-BNK40
as Issuing Entity
Wells Fargo Commercial Mortgage Securities, Inc.
as Depositor
Wells Fargo Bank, National Association
Morgan Stanley Mortgage Capital Holdings LLC
Bank of America, National Association
National Cooperative Bank, N.A.
as Sponsors and Mortgage Loan Sellers
Commercial Mortgage Pass-Through Certificates
Series 2022-BNK40
February 21, 2022
| WELLS FARGO SECURITIES | BofA SECURITIES | MORGAN STANLEY |
| | | |
Co-Lead Manager and Joint Bookrunner | Co-Lead Manager and Joint Bookrunner | Co-Lead Manager and Joint Bookrunner |
| | | |
Academy Securities, Inc. Co-Manager | Drexel Hamilton Co-Manager | Siebert Williams Shank Co-Manager |
| | | |
STATEMENT REGARDING THIS FREE WRITING PROSPECTUS
The depositor has filed a registration statement (including a prospectus) with the Securities and Exchange Commission (‘‘SEC’’) (SEC File No. 333-257991) for the offering to which this communication relates. Before you invest, you should read the prospectus in the registration statement and other documents the depositor has filed with the SEC for more complete information about the depositor, the issuing entity and this offering. You may get these documents for free by visiting EDGAR on the SEC Web site at www.sec.gov. Alternatively, the depositor, any underwriter, or any dealer participating in the offering will arrange to send you the prospectus after filing if you request it by calling toll free 1-800-745-2063 (8 a.m. – 5 p.m. EST) or by emailing wfs.cmbs@wellsfargo.com.
Nothing in this document constitutes an offer of securities for sale in any jurisdiction where the offer or sale is not permitted. The information contained herein is preliminary as of the date hereof, supersedes any such information previously delivered to you and will be superseded by any such information subsequently delivered and ultimately by the final prospectus relating to the securities. These materials are subject to change, completion, supplement or amendment from time to time.
This free writing prospectus has been prepared by the underwriters for information purposes only and does not constitute, in whole or in part, a prospectus for the purposes of Regulation (EU) 2017/1129 (as amended) and/or Part VI of the Financial Services and Markets Act 2000, as amended, or other offering document.
STATEMENT REGARDING ASSUMPTIONS AS TO SECURITIES, PRICING ESTIMATES AND OTHER INFORMATION
The attached information contains certain tables and other statistical analyses (the “Computational Materials”) which have been prepared in reliance upon information furnished by the Mortgage Loan Sellers. Numerous assumptions were used in preparing the Computational Materials, which may or may not be reflected herein. As such, no assurance can be given as to the Computational Materials’ accuracy, appropriateness or completeness in any particular context; or as to whether the Computational Materials and/or the assumptions upon which they are based reflect present market conditions or future market performance. The Computational Materials should not be construed as either projections or predictions or as legal, tax, financial or accounting advice. You should consult your own counsel, accountant and other advisors as to the legal, tax, business, financial and related aspects of a purchase of these securities. Any weighted average lives, yields and principal payment periods shown in the Computational Materials are based on prepayment and/or loss assumptions, and changes in such prepayment and/or loss assumptions may dramatically affect such weighted average lives, yields and principal payment periods. In addition, it is possible that prepayments or losses on the underlying assets will occur at rates higher or lower than the rates shown in the attached Computational Materials. The specific characteristics of the securities may differ from those shown in the Computational Materials due to differences between the final underlying assets and the preliminary underlying assets used in preparing the Computational Materials. The principal amount and designation of any security described in the Computational Materials are subject to change prior to issuance. None of Wells Fargo Securities, LLC, Morgan Stanley & Co. LLC, BofA Securities, Inc., Academy Securities, Inc., Drexel Hamilton, LLC, Siebert Williams Shank & Co., LLC or any of their respective affiliates, make any representation or warranty as to the actual rate or timing of payments or losses on any of the underlying assets or the payments or yield on the securities. The information in this presentation is based upon management forecasts and reflects prevailing conditions and management’s views as of this date, all of which are subject to change. In preparing this presentation, we have relied upon and assumed, without independent verification, the accuracy and completeness of all information available from public sources or which was provided to us by or on behalf of the Mortgage Loan Sellers or which was otherwise reviewed by us.
This free writing prospectus contains certain forward-looking statements. If and when included in this free writing prospectus, the words “expects”, “intends”, “anticipates”, “estimates” and analogous expressions and all statements that are not historical facts, including statements about our beliefs or expectations, are intended to identify forward-looking statements. Any forward-looking statements are made subject to risks and uncertainties which could cause actual results to differ materially from those stated. Those risks and uncertainties include, among other things, declines in general economic and business conditions, increased competition, changes in demographics, changes in political and social conditions, regulatory initiatives and changes in customer preferences, many of which are beyond our control and the control of any other person or entity related to this offering. The forward-looking statements made in this free writing prospectus are made as of the date stated on the cover. We have no obligation to update or revise any forward-looking statement.
Wells Fargo Securities is the trade name for the capital markets and investment banking services of Wells Fargo & Company and its subsidiaries, including but not limited to Wells Fargo Securities, LLC, a member of NYSE, FINRA, NFA and SIPC, Wells Fargo Prime Services, LLC, a member of FINRA, NFA and SIPC, and Wells Fargo Bank, N.A. Wells Fargo Securities, LLC and Wells Fargo Prime Services, LLC are distinct entities from affiliated banks and thrifts.
“BofA Securities” is the marketing name for the global banking and global markets businesses of Bank of America Corporation. Lending, derivatives, and other commercial banking activities are performed globally by banking affiliates of Bank of America Corporation, including Bank of America, N.A., member FDIC. Securities, strategic advisory, and other investment banking activities are performed globally by investment banking affiliates of Bank of America Corporation, including, in the United States, BofA Securities, Inc., which is a registered broker-dealer and member of FINRA and SIPC, and, in other jurisdictions, locally registered entities.
IMPORTANT NOTICE REGARDING THE OFFERED CERTIFICATES
The information herein is preliminary and may be supplemented or amended prior to the time of sale. In addition, the Offered Certificates referred to in these materials and the asset pool backing them are subject to modification or revision (including the possibility that one or more classes of certificates may be split, combined or eliminated at any time prior to issuance or availability of a final prospectus) and are offered on a “when, as and if issued” basis.
The underwriters described in these materials may from time to time perform investment banking services for, or solicit investment banking business from, any company named in these materials. The underwriters and/or their affiliates or respective employees may from time to time have a long or short position in any security or contract discussed in these materials.
The information contained herein supersedes any previous such information delivered to any prospective investor and will be superseded by information delivered to such prospective investor prior to the time of sale.
IMPORTANT NOTICE RELATING TO AUTOMATICALLY-GENERATED EMAIL DISCLAIMERS
Any legends, disclaimers or other notices that may appear at the bottom of any email communication to which this free writing prospectus is attached relating to (1) these materials not constituting an offer (or a solicitation of an offer), (2) any representation that these materials are accurate or complete and may not be updated or (3) these materials possibly being confidential, are not applicable to these materials and should be disregarded. Such legends, disclaimers or other notices have been automatically generated as a result of these materials having been sent via Bloomberg or another system.
THE INFORMATION IN THIS STRUCTURAL AND COLLATERAL TERM SHEET IS NOT COMPLETE AND MAY BE AMENDED PRIOR TO THE TIME OF SALE. THIS TERM SHEET IS NOT AN OFFER TO SELL THESE SECURITIES AND IT IS NOT A SOLICITATION OF AN OFFER TO BUY THESE SECURITIES IN ANY JURISDICTION WHERE THE OFFER OR SALE IS NOT PERMITTED.
2
| BANK 2022-BNK40 | Certificate Structure |
I. Certificate Structure
| | | Class | Expected Ratings
(Fitch/KBRA/S&P)(1) | Approximate Initial
Certificate Balance or
Notional Amount(2) | Approx.
Initial Credit Support(3) | Pass-Through
Rate Description | Weighted Average Life (Years)(4) | Expected
Principal
Window(4) | Certificate Principal to Value
Ratio(5) | Certificate Principal
U/W NOI
Debt Yield(6) |
| | | Offered Certificates | | | | |
| | | A-1 | AAAsf/AAA(sf)/AAA(sf) | $11,750,000 | 30.000% | (7) | 2.90 | 04/22 - 03/27 | 34.5% | 20.1% |
| | | A-2 | AAAsf/AAA(sf)/AAA(sf) | $6,857,000 | 30.000% | (7) | 5.01 | 03/27 - 03/27 | 34.5% | 20.1% |
| | | A-SB | AAAsf/AAA(sf)/AAA(sf) | $20,730,000 | 30.000% | (7) | 7.46 | 03/27 - 12/31 | 34.5% | 20.1% |
| | | A-3(8) | AAAsf/AAA(sf)/AAA(sf) | (8)(9) | 30.000% | (7) | (9) | (9) | 34.5% | 20.1% |
| | | A-4(8) | AAAsf/AAA(sf)/AAA(sf) | (8)(9) | 30.000% | (7) | (9) | (9) | 34.5% | 20.1% |
| | | X-A | AAAsf/AAA(sf)/AAA(sf) | $780,260,000(10) | N/A | Variable(11) | N/A | N/A | N/A | N/A |
| | | X-B | A-sf/AAA(sf)/NR | $218,752,000(12) | N/A | Variable(13) | N/A | N/A | N/A | N/A |
| | | A-S(8) | AAAsf/AAA(sf)/AA+(sf) | $133,759,000(8) | 18.000% | (7) | 10.00 | 02/32 - 03/32 | 40.4% | 17.2% |
| | | B(8) | AA-sf/AA(sf)/AA-(sf) | $43,193,000(8) | 14.125% | (7) | 10.01 | 03/32 - 03/32 | 42.3% | 16.4% |
| | | C(8) | A-sf/A-(sf)/NR | $41,800,000(8) | 10.375% | (7) | 10.01 | 03/32 - 03/32 | 44.1% | 15.7% |
| | | Non-Offered Certificates | | | | | | |
| | | X-D | BBB-sf/BBB-(sf)/NR | $45,979,000(14) | N/A | Variable(15) | N/A | N/A | N/A | N/A |
| | | X-F | BB-sf/BB-(sf)/NR | $23,687,000(16) | N/A | Variable(17) | N/A | N/A | N/A | N/A |
| | | X-G | B-sf/B-(sf)/NR | $11,146,000(16) | N/A | Variable(17) | N/A | N/A | N/A | N/A |
| | | X-HJ | NR/NR/NR | $34,834,001(18) | N/A | Variable(19) | N/A | N/A | N/A | N/A |
| | | D | BBBsf/BBB+(sf)/NR | $26,473,000 | 8.000% | (7) | 10.01 | 03/32 - 03/32 | 45.3% | 15.3% |
| | | E | BBB-sf/BBB-(sf)/NR | $19,506,000 | 6.250% | (7) | 10.01 | 03/32 - 03/32 | 46.1% | 15.0% |
| | | F | BB-sf/BB-(sf)/NR | $23,687,000 | 4.125% | (7) | 10.01 | 03/32 - 03/32 | 47.2% | 14.7% |
| | | G | B-sf/B-(sf)/NR | $11,146,000 | 3.125% | (7) | 10.01 | 03/32 - 03/32 | 47.7% | 14.6% |
| | | H | NR/NR/NR | $11,147,000 | 2.125% | (7) | 10.01 | 03/32 - 03/32 | 48.2% | 14.4% |
| | | J | NR/NR/NR | $23,687,001 | 0.000% | (7) | 10.01 | 03/32 - 03/32 | 49.2% | 14.1% |
| | | | Non-Offered Eligible Vertical Interest | | | | |
| | | RR
Interest | NR/NR/NR | $58,666,210.61 | N/A | WAC(20) | 9.76 | 04/22 - 03/32 | N/A | N/A |
| |
| Notes: |
| (1) | The expected ratings presented are those of Fitch Ratings, Inc. (“Fitch”), Kroll Bond Rating Agency, LLC (“KBRA”) and S&P Global Ratings (“S&P”), which the depositor hired to rate the Offered Certificates. One or more other nationally recognized statistical rating organizations that were not hired by the depositor may use information they receive pursuant to Rule 17g-5 under the Securities Exchange Act of 1934, as amended (the “Exchange Act”) or otherwise, to rate or provide market reports and/or published commentary related to the Offered Certificates. We cannot assure you as to what ratings a non-hired nationally recognized statistical rating organization would assign or that its reports will not express differing, possibly negative, views of the mortgage loans and/or the Offered Certificates. The ratings of each Class of Offered Certificates address the likelihood of the timely distribution of interest and, except in the case of the Class X-A and X-B Certificates, the ultimate distribution of principal due on those Classes on or before the Rated Final Distribution Date. See “Risk Factors—Other Risks Relating to the Certificates—Nationally Recognized Statistical Rating Organizations May Assign Different Ratings to the Certificates; Ratings of the Certificates Reflect Only the Views of the Applicable Rating Agencies as of the Dates Such Ratings Were Issued; Ratings May Affect ERISA Eligibility; Ratings May Be Downgraded” and “Ratings” in the Preliminary Prospectus, expected to be dated February 21, 2022 (the “Preliminary Prospectus”). Fitch, KBRA and S&P have informed us that the “sf” designation in their ratings represents an identifier for structured finance product ratings. |
| (2) | The Certificate Balances and Notional Amounts set forth in the table are approximate. The actual initial Certificate Balances and Notional Amounts may be larger or smaller depending on the initial pool balance of the mortgage loans definitively included in the pool of mortgage loans, which aggregate cut-off date balance may be as much as 5% larger or smaller than the amount presented in the Preliminary Prospectus. In addition, the Notional Amounts of the Class X-A, Class X-B, Class X-D, Class X-F, Class X-G and Class X-HJ Certificates (collectively referred to herein as “Class X Certificates”) may vary depending upon the final pricing of the Classes of Principal Balance Certificates (as defined below) or trust components whose Certificate Balances comprise such Notional Amounts and, if as a result of such pricing the pass-through rate of any Class of the Class X Certificates would be equal to zero at all times, such Class of Certificates will not be issued on the closing date of this securitization. |
| (3) | The Approximate Initial Credit Support with respect to the Class A-1, A-2, A-SB, A-3 and A-4 Certificates represents the approximate credit enhancement for the Class A-1, A-2, A-SB, A-3 and A-4 Certificates in the aggregate, taking into account the Certificate Balances of the Class A-3 and Class A-4 trust components. The Approximate Initial Credit Support set forth for the Class A-S certificates represents the approximate credit support for the underlying Class A-S trust component. The Approximate Initial Credit Support set forth for the Class B certificates represents the approximate credit support for the underlying Class B trust component. The Approximate Initial Credit Support set forth for the Class C certificates represents the approximate credit support for the underlying Class C trust component. The RR Interest only provides credit support to the limited extent that losses incurred on the underlying mortgage loans are allocated to it, on the one hand, and to the Offered Certificates and the Non-Offered Certificates, on the other hand, pro rata, in accordance with their respective Percentage Allocation Entitlements. |
| (4) | Weighted Average Lives and Expected Principal Windows are calculated based on an assumed prepayment rate of 0% CPR and the “Structuring Assumptions” described under “Yield and Maturity Considerations—Weighted Average Life” in the Preliminary Prospectus. |
| (5) | The Certificate Principal to Value Ratio for each Class of Certificates (other than the Class A-1, A-2, A-SB, A-3 and A-4 Certificates) is calculated as the product of (a) the weighted average Cut-off Date LTV Ratio for the mortgage loans and (b) a fraction, the numerator of which is the total initial Certificate Balance of such Class of Certificates and all Classes of Principal Balance Certificates (or, with respect to the Class A-3, A-4, A-S, B or C Certificates, the trust component with the same alphanumeric designation) senior to such Class of Certificates and the denominator of which is the total initial Certificate Balance of all of the Principal Balance Certificates (or, with respect to the Class A-3, A-4, A-S, B or C Certificates, the trust component with the same alphanumeric designation)(other than the RR Interest). The Certificate Principal to Value Ratio for each of the Class A-1, A-2, A-SB, A-3 and A-4 Certificates is calculated in the aggregate for those Classes as if they were a single Class and is calculated as the product of (a) the weighted average Cut-off Date LTV Ratio for the mortgage loans and (b) a fraction, the numerator of which is the total initial aggregate Certificate Balances of such Classes of Certificates (or, with respect to the Class A-3 or A-4 Certificates, the trust component with the same alphanumeric designation) and the denominator of which is the total initial Certificate Balance of all of the Principal Balance Certificates (or, with respect to the Class A-3, A-4, A-S, |
| | |
THE INFORMATION IN THIS STRUCTURAL AND COLLATERAL TERM SHEET IS NOT COMPLETE AND MAY BE AMENDED PRIOR TO THE TIME OF SALE. THIS TERM SHEET IS NOT AN OFFER TO SELL THESE SECURITIES AND IT IS NOT A SOLICITATION OF AN OFFER TO BUY THESE SECURITIES IN ANY JURISDICTION WHERE THE OFFER OR SALE IS NOT PERMITTED.
3
| BANK 2022-BNK40 | Certificate Structure |
| | B or C Certificates, the trust component with the same alphanumeric designation)(other than the RR Interest). In any event, however, excess mortgaged property value associated with a mortgage loan will not be available to offset losses on any other mortgage loan. |
| (6) | The Certificate Principal U/W NOI Debt Yield for each Class of Certificates (other than the Class A-1, A-2, A-SB, A-3 and A-4 Certificates) is calculated as the product of (a) the weighted average U/W NOI Debt Yield for the mortgage loans and (b) a fraction, the numerator of which is the total initial Certificate Balance of all of the Classes of Principal Balance Certificates (or, with respect to the Class A-3, A-4, A-S, B or C Certificates, the trust component with the same alphanumeric designation) (other than the RR Interest) and the denominator of which is the total initial Certificate Balance for such Class of Certificates and all Classes of Principal Balance Certificates (or, with respect to the Class A-3, A-4, A-S, B or C Certificates, the trust component with the same alphanumeric designation) senior to such Class of Certificates. The Certificate Principal U/W NOI Debt Yield for each of the Class A-1, A-2, A-SB, A-3 and A-4 Certificates is calculated in the aggregate for those Classes as if they were a single Class and is calculated as the product of (a) the weighted average U/W NOI Debt Yield for the mortgage loans and (b) a fraction, the numerator of which is the total initial Certificate Balance of all of the Classes of Principal Balance Certificates (or, with respect to the Class A-3, A-4, A-S, B or C Certificates, the trust component with the same alphanumeric designation)(other than the RR Interest) and the denominator of which is the total aggregate initial Certificate Balances for the Class A-1, A-2, A-SB, A-3 and A-4 Certificates (or, with respect to the Class A-3 or A-4 Certificates, the trust component with the same alphanumeric designation). In any event, however, cash flow from each mortgaged property supports only the related mortgage loan and will not be available to support any other mortgage loan. |
| (7) | The pass-through rates for the Class A-1, A-2, A-SB, A-3, A-4, A-S, B, C, D, E, F, G, H and J Certificates for any distribution date will, in each case, be one of the following: (i) a fixed rate per annum, (ii) a variable rate per annum equal to the weighted average of the net mortgage interest rates on the mortgage loans for the related distribution date, (iii) a variable rate per annum equal to the lesser of (a) a fixed rate and (b) the weighted average of the net mortgage interest rates on the mortgage loans for the related distribution date or (iv) a variable rate per annum equal to the weighted average of the net mortgage interest rates on the mortgage loans for the related distribution date minus a specified percentage. For purposes of the calculation of the weighted average of the net mortgage interest rates on the mortgage loans for each distribution date, the mortgage interest rates will be adjusted as necessary to a 30/360 basis. |
| (8) | The Class A-3-1, A-3-2, A-3-X1, A-3-X2, A-4-1, A-4-2, A-4-X1, A-4-X2, A-S-1, A-S-2, A-S-X1, A-S-X2, B-1, B-2, B-X1, B-X2, C-1, C-2, C-X1 and C-X2 Certificates are also offered certificates. Such Classes of Certificates, together with the Class A-3, A-4, A-S, B and C Certificates, constitute the “Exchangeable Certificates”. The Class A-1, A-2, A-SB, D, E, F, G, H and J Certificates, together with the Exchangeable Certificates with a Certificate Balance, are referred to as the “Principal Balance Certificates.” Each Class of Exchangeable Certificates will have the Certificate Balance or Notional Amount and pass-through rate described below under “Exchangeable Certificates.” |
| (9) | The exact initial Certificate Balances or Notional Amounts of the Class A-3, A-3-X1, A-3-X2, A-4, A-4-X1 and A-4-X2 trust components (and consequently, the exact aggregate Initial Certificate Balances or Notional Amounts of the Exchangeable Certificates with an “A-3” or “A-4” designation) are unknown and will be determined based on the final pricing of those Classes of Certificates. However, the initial Certificate Balances, weighted average lives and principal windows of the Class A-3 and A-4 trust components are expected to be within the applicable ranges reflected in the following chart. The aggregate initial Certificate Balance of the Class A-3 and A-4 trust components is expected to be approximately $740,923,000, subject to a variance of plus or minus 5%. The Class A-3-X1 and A-3-X2 trust components will have initial Notional Amounts equal to the initial Certificate Balance of the Class A-3 trust component. The Class A-4-X1 and A-4-X2 trust components will have initial Notional Amounts equal to the initial Certificate Balance of the Class A-4 trust component. In the event that the Class A-4 trust component is issued with an initial certificate balance of $740,923,000, the Class A-3 trust component will not be issued. |
| | Trust
Components | | Expected Range of
Approximate Initial
Certificate Balance | | Expected Range of
Weighted Average
Life (Years) | | Expected Range of Principal Window | |
| | Class A-3 | | $0 - $350,000,000 | | N/A – 9.82 | | N/A / 12/31 - 01/32 | |
| | Class A-4 | | $390,923,000 - $740,923,000 | | 9.87 – 9.91 | | 12/31-02/32 / 01/32-02/32 | |
| (10) | The Class X-A Certificates are notional amount certificates. The Notional Amount of the Class X-A Certificates will be equal to the aggregate Certificate Balance of the Class A-1, A-2 and A-SB Certificates and the Class A-3 and A-4 trust components outstanding from time to time. The Class X-A Certificates will not be entitled to distributions of principal. |
| (11) | The pass-through rate for the Class X-A Certificates for any distribution date will be a per annum rate equal to the excess, if any, of (a) the weighted average of the net mortgage interest rates on the mortgage loans for the related distribution date, over (b) the weighted average of the pass-through rates on the Class A-1, A-2 and A-SB Certificates and the Class A-3, A-3-X1, A-3-X2, A-4, A-4-X1 and A-4-X2 trust components for the related distribution date, weighted on the basis of their respective Certificate Balances or Notional Amounts outstanding immediately prior to that distribution date (but excluding trust components with a Notional Amount in the denominator of such weighted average calculation). For purposes of the calculation of the weighted average of the net mortgage interest rates on the mortgage loans for each distribution date, the mortgage interest rates will be adjusted as necessary to a 30/360 basis. |
| (12) | The Class X-B Certificates are notional amount certificates. The Notional Amount of the Class X-B Certificates will be equal to the aggregate Certificate Balance of the Class A-S, B and C trust components outstanding from time to time. The Class X-B Certificates will not be entitled to distributions of principal. |
| (13) | The pass-through rate for the Class X-B Certificates for any distribution date will be a per annum rate equal to the excess, if any, of (a) the weighted average of the net mortgage interest rates on the mortgage loans for the related distribution date, over (b) the weighted average of the pass-through rates on the Class A-S, A-S-X1, A-S-X2, B, B-X1, B-X2, C, C-X1 and C-X2 trust components for the related distribution date, weighted on the basis of their respective Certificate Balances or Notional Amounts outstanding immediately prior to that distribution date (but excluding trust components with a Notional Amount in the denominator of such weighted average calculation). For purposes of the calculation of the weighted average of the net mortgage interest rates on the mortgage loans for each distribution date, the mortgage interest rates will be adjusted as necessary to a 30/360 basis. |
| (14) | The Class X-D Certificates are notional amount certificates. The Notional Amount of the Class X-D Certificates will be equal to the aggregate Certificate Balance of the Class D and E Certificates outstanding from time to time. The Class X-D Certificates will not be entitled to distributions of principal. |
| (15) | The pass-through rate for the Class X-D Certificates for any distribution date will be a per annum rate equal to the excess, if any, of (a) the weighted average of the net mortgage interest rates on the mortgage loans for the related distribution date, over (b) the weighted average of the pass-through rates on the Class D and E Certificates for the related distribution date, weighted on the basis of their respective Certificate Balances outstanding immediately prior to that distribution date. For purposes of the calculation of the weighted average of the net mortgage interest rates on the mortgage loans for each distribution date, the mortgage interest rates will be adjusted as necessary to a 30/360 basis. |
| (16) | The Class X-F and X-G Certificates are notional amount certificates. The Notional Amount of the Class X-F and X-G Certificates will be equal to the Certificate Balance of the Class F and G Certificates, respectively, outstanding from time to time. None of the Class X-F and X-G Certificates will be entitled to distributions of principal. |
| (17) | The pass-through rate for the Class X-F and X-G Certificates for any distribution date will, in each case, be a per annum rate equal to the excess, if any, of (a) the weighted average of the net mortgage interest rates on the mortgage loans for the related distribution date, over (b) the pass-through rates on the Class F and G Certificates, respectively, for the related distribution date. |
| (18) | The Class X-HJ Certificates are notional amount certificates. The Notional Amount of the Class X-HJ Certificates will be equal to the aggregate Certificate Balance of the Class H and J Certificates outstanding from time to time. The Class X-HJ Certificates will not be entitled to distributions of principal. |
| (19) | The pass-through rate for the Class X-HJ Certificates for any distribution date will be a per annum rate equal to the excess, if any, of (a) the weighted average of the net mortgage interest rates on the mortgage loans for the related distribution date, over (b) the weighted average of the pass-through rates on the Class H and J Certificates for the related distribution date, weighted on the basis of their respective Certificate Balances outstanding immediately prior to that distribution date. For purposes of the calculation of the weighted average of the net mortgage interest rates on the mortgage loans for each distribution date, the mortgage interest rates will be adjusted as necessary to a 30/360 basis. |
| (20) | The effective interest rate for the RR Interest will be a variable rate per annum (described in the table as “WAC”) equal to the weighted average of the net mortgage interest rates on the mortgage loans for the related distribution date. For purposes of calculation of the weighted average of the net mortgage interest rates on the mortgage loans for each distribution date, the mortgage interest rates will be adjusted as necessary to a 30/360 basis. |
| | |
THE INFORMATION IN THIS STRUCTURAL AND COLLATERAL TERM SHEET IS NOT COMPLETE AND MAY BE AMENDED PRIOR TO THE TIME OF SALE. THIS TERM SHEET IS NOT AN OFFER TO SELL THESE SECURITIES AND IT IS NOT A SOLICITATION OF AN OFFER TO BUY THESE SECURITIES IN ANY JURISDICTION WHERE THE OFFER OR SALE IS NOT PERMITTED.
4
| BANK 2022-BNK40 | Transaction Highlights |
II. Transaction Highlights
Mortgage Loan Sellers:
| Mortgage Loan Seller | | Number
of
Mortgage
Loans | | Number of
Mortgaged
Properties | | Aggregate Cut-off
Date Balance | | Approx. % of
Initial Pool
Balance |
| Wells Fargo Bank, National Association | | 16 | | 21 | | $324,798,437 | | 27.7% |
| Morgan Stanley Mortgage Capital Holdings LLC | | 21 | | 33 | | 315,949,120 | | 26.9 |
| Bank of America, National Association | | 8 | | 15 | | 242,125,000 | | 20.6 |
| Wells Fargo Bank, National Association / Morgan Stanley Mortgage Capital Holdings LLC | | 1 | | 1 | | 110,000,000 | | 9.4 |
| Wells Fargo Bank, National Association / Bank of America, National Association | | 1 | | 9 | | 110,000,000 | | 9.4 |
| National Cooperative Bank, N.A. | | 23 | | 23 | | 70,451,655 | | 6.0 |
| Total | | 70 | | 102 | | $1,173,324,212 | | 100.0% |
Loan Pool:
| Initial Pool Balance: | $1,173,324,212 |
| Number of Mortgage Loans: | 70 |
| Average Cut-off Date Balance per Mortgage Loan: | $16,761,774 |
| Number of Mortgaged Properties: | 102 |
| Average Cut-off Date Balance per Mortgaged Property(1): | $11,503,179 |
| Weighted Average Interest Rate: | 3.4155% |
| Ten Largest Mortgage Loans as % of Initial Pool Balance: | 60.8% |
| Weighted Average Original Term to Maturity (months): | 120 |
| Weighted Average Remaining Term to Maturity (months): | 118 |
| Weighted Average Original Amortization Term (months)(2): | 370 |
| Weighted Average Remaining Amortization Term (months)(2): | 370 |
| Weighted Average Seasoning (months): | 1 |
| (1) | Information regarding mortgage loans secured by multiple properties is based on an allocation according to relative appraised values or the allocated loan amounts or property-specific release prices set forth in the related loan documents or such other allocation as the related mortgage loan seller deemed appropriate. |
| (2) | Excludes any mortgage loan that does not amortize. |
Credit Statistics:
| Weighted Average U/W Net Cash Flow DSCR(1): | 4.00x |
| Weighted Average U/W Net Operating Income Debt Yield(1): | 14.1% |
| Weighted Average Cut-off Date Loan-to-Value Ratio(1): | 49.2% |
| Weighted Average Balloon Loan-to-Value Ratio(1): | 47.8% |
| % of Mortgage Loans with Additional Subordinate Debt(2): | 18.8% |
| % of Mortgage Loans with Single Tenants(3): | 3.0% |
| (1) | With respect to any mortgage loan that is part of a whole loan, loan-to-value ratio, debt service coverage ratio and debt yield calculations include the related pari passu companion loan(s) but exclude any related subordinate companion loan(s) (unless otherwise stated). The information for each mortgaged property that relates to a mortgage loan that is cross-collateralized or cross-defaulted with one or more other mortgage loans is based upon the principal balance of that mortgage loan, except that the applicable loan-to-value ratio, debt service coverage ratio, and debt yield for each such mortgage loan is based upon the ratio or yield (as applicable) for the aggregate indebtedness evidenced by all loans in the group (without regard to any limitation on the amount of indebtedness secured by any mortgaged property in such cross-collateralized group). For mortgaged properties securing residential cooperative mortgage loans, the debt service coverage ratio and debt yield for each such mortgaged property are calculated using U/W Net Operating Income or U/W Net Cash Flow, as applicable, for the related residential cooperative property which is the projected net operating income or net cash flow, as applicable, reflected in the most recent appraisal obtained by or otherwise in the possession of the related mortgage loan seller as of the cut-off date, and the loan-to-value ratio is calculated based upon the appraised value of the residential cooperative property determined as if such residential cooperative property is operated as a residential cooperative, inclusive of the amount of the underlying debt encumbering such residential cooperative property. The debt service coverage ratio, debt yield and loan-to-value ratio information do not take into account any subordinate debt (whether or not secured by the related mortgaged property), that currently exists or is allowed under the terms of any mortgage loan. See “Description of the Mortgage Pool—Mortgage Pool Characteristics” in the Preliminary Prospectus and Annex A-1 to the Preliminary Prospectus. |
| (2) | Seventeen (17) of the mortgage loans, each of which is secured by a residential cooperative property sold to the depositor by National Cooperative Bank, N.A., currently have in place subordinate secured lines of credit to the related mortgage borrowers that permit future advances (such loans, collectively, the “Subordinate Coop LOCs”). The percentage figure expressed as “% of Mortgage Loans with Additional Subordinate Debt” is determined as a percentage of the initial pool balance and does not take into account any future subordinate debt (whether or not secured by the mortgaged property), if any, that may be permitted under the terms of any mortgage loan or the pooling and servicing agreement. See “Description of the Mortgage Pool—Additional Indebtedness—Other Unsecured Indebtedness” and “Description of the Mortgage Pool—Additional Indebtedness—Other Secured Indebtedness—Additional Debt Financing for Mortgage Loans Secured by Residential Cooperatives Sold to the Depositor by National Cooperative Bank, N.A.” in the Preliminary Prospectus. |
| (3) | Excludes mortgage loans that are secured by multiple single tenant properties. |
THE INFORMATION IN THIS STRUCTURAL AND COLLATERAL TERM SHEET IS NOT COMPLETE AND MAY BE AMENDED PRIOR TO THE TIME OF SALE. THIS TERM SHEET IS NOT AN OFFER TO SELL THESE SECURITIES AND IT IS NOT A SOLICITATION OF AN OFFER TO BUY THESE SECURITIES IN ANY JURISDICTION WHERE THE OFFER OR SALE IS NOT PERMITTED.
5
| BANK 2022-BNK40 | Transaction Highlights |
Loan Structural Features:
Amortization: Based on the Initial Pool Balance, 18.5% of the mortgage pool (27 mortgage loans) has scheduled amortization, as follows:
11.1% (6 mortgage loans) provides for an interest-only period followed by an amortization period; and
7.4% (21 mortgage loans) requires amortization during the entire loan term
Interest-Only: Based on the Initial Pool Balance, 81.5% of the mortgage pool (43 mortgage loans) provides for interest-only payments during the entire loan term through maturity. The weighted average Cut-off Date Loan-to-Value Ratio and weighted average U/W Net Cash Flow DSCR for those mortgage loans are 48.3% and 4.24x, respectively.
Hard Lockboxes: Based on the Initial Pool Balance, 38.1% of the mortgage pool (7 mortgage loans) has hard lockboxes in place.
Reserves: The mortgage loans require amounts to be escrowed monthly as follows (excluding any mortgage loans with springing provisions):
| Real Estate Taxes: | 51.0% of the pool |
| Insurance: | 22.6% of the pool |
| Capital Replacements: | 50.6% of the pool |
| TI/LC: | 29.0% of the pool (1) |
| (1) | The percentage of Initial Pool Balance for mortgage loans with TI/LC reserves is based on the aggregate principal balance allocable to loans that include office, mixed use, retail and industrial properties. |
Call Protection/Defeasance: Based on the Initial Pool Balance, the mortgage pool has the following call protection and defeasance features:
69.3% of the mortgage pool (33 mortgage loans) features a lockout period, then defeasance only until an open period;
13.5% of the mortgage pool (4 mortgage loans) features a lockout period, then defeasance or greater of a prepayment premium (1.0%) or yield maintenance until an open period;
11.2% of the mortgage pool (10 mortgage loans) features a lockout period, then the greater of a prepayment premium (1.0%) or yield maintenance until an open period;
6.0% of the mortgage pool (23 mortgage loans) features no lockout period, but requires the greater of a prepayment premium (1.0%) or yield maintenance, then a prepayment premium (1.0%) until an open period;
Prepayment restrictions for each mortgage loan reflect the entire life of the mortgage loan. Please refer to Annex A-1 to the Preliminary Prospectus and the footnotes related thereto for further information regarding individual loan call protection.
THE INFORMATION IN THIS STRUCTURAL AND COLLATERAL TERM SHEET IS NOT COMPLETE AND MAY BE AMENDED PRIOR TO THE TIME OF SALE. THIS TERM SHEET IS NOT AN OFFER TO SELL THESE SECURITIES AND IT IS NOT A SOLICITATION OF AN OFFER TO BUY THESE SECURITIES IN ANY JURISDICTION WHERE THE OFFER OR SALE IS NOT PERMITTED.
6
| BANK 2022-BNK40 | Issue Characteristics |
III. Issue Characteristics
| Securities Offered: | $999,012,000 approximate monthly pay, multi-class, commercial mortgage REMIC pass-through certificates consisting of thirty classes (Classes A-1, A-2, A-SB, A-3, A-3-1, A-3-2, A-3-X1, A-3-X2, A-4, A-4-1, A-4-2, A-4-X1, A-4-X2, A-S, A-S-1, A-S-2, A-S-X1, A-S-X2, B, B-1, B-2, B-X1, B-X2, C, C-1, C-2, C-X1, C-X2, X-A and X-B), which are offered pursuant to a registration statement filed with the SEC (such Classes of certificates, the “Offered Certificates”). |
| Mortgage Loan Sellers: | Wells Fargo Bank, National Association (“WFB”), Morgan Stanley Mortgage Capital Holdings LLC (“MSMCH”), Bank of America, National Association (“BANA”) and National Cooperative Bank, N.A. (“NCB”). |
| Joint Bookrunners and Co-Lead Managers: | Wells Fargo Securities, LLC, Morgan Stanley & Co. LLC and BofA Securities, Inc. |
| Co-Manager: | Academy Securities, Inc., Drexel Hamilton, LLC and Siebert Williams Shank & Co., LLC |
| Rating Agencies: | Fitch Ratings, Inc., Kroll Bond Rating Agency, LLC and S&P Global Ratings, acting through Standard and Poor’s Financial Services LLC |
| Master Servicers: | Wells Fargo Bank, National Association and National Cooperative Bank, N.A. |
| Special Servicers: | CWCapital Asset Management LLC and National Cooperative Bank, N.A. |
| Certificate Administrator: | Wells Fargo Bank, National Association |
| Trustee: | Wilmington Trust, National Association |
| Operating Advisor: | Pentalpha Surveillance LLC |
| Asset Representations Reviewer: | Pentalpha Surveillance LLC |
| U.S. Credit Risk Retention: | For a discussion of the manner in which the U.S. credit risk retention requirements are being addressed by Wells Fargo Bank, National Association, as the retaining sponsor, see “Credit Risk Retention” in the Preliminary Prospectus. |
| EU Securitization Regulation and UK Securitization Regulation: | None of the sponsors, the depositor, the underwriters, or their respective affiliates, or any other party to the transaction intends to retain a material net economic interest in the securitization constituted by the issue of the Certificates, or take any other action in respect of such securitization, in a manner prescribed or contemplated by (i) Regulation (EU) 2017/2402, or (ii) such Regulation as it forms part of UK domestic law. In particular, no such person undertakes to take any action which may be required by any investor for the purposes of its compliance with any applicable requirement under either such Regulation. Furthermore, the arrangements described under “Credit Risk Retention” in the Preliminary Prospectus have not been structured with the objective of ensuring compliance by any person with any requirements of either such Regulation. See “Risk Factors—Other Risks Relating to the Certificates—EU Securitization Regulation and UK Securitization Regulation Due Diligence Requirements” in the Preliminary Prospectus. |
| Initial Risk Retention Consultation Party: | Wells Fargo Bank, National Association |
| Initial Majority Controlling Class Certificateholder: | Ellington Management Group, LLC |
| Cut-off Date: | The Cut-off Date with respect to each mortgage loan is the due date for the monthly debt service payment that is due in March 2022 (or, in the case of any mortgage loan that has its first due date after March 2022, the date that would have been its due date in March 2022 under the terms of that mortgage loan if a monthly debt service payment were scheduled to be due in that month). |
| Expected Closing Date: | On or about March 10, 2022. |
| Determination Dates: | The 11th day of each month (or if that day is not a business day, the next succeeding business day), commencing in April 2022. |
| Distribution Dates: | The fourth business day following the Determination Date in each month, commencing in April 2022. |
| | |
THE INFORMATION IN THIS STRUCTURAL AND COLLATERAL TERM SHEET IS NOT COMPLETE AND MAY BE AMENDED PRIOR TO THE TIME OF SALE. THIS TERM SHEET IS NOT AN OFFER TO SELL THESE SECURITIES AND IT IS NOT A SOLICITATION OF AN OFFER TO BUY THESE SECURITIES IN ANY JURISDICTION WHERE THE OFFER OR SALE IS NOT PERMITTED.
7
| BANK 2022-BNK40 | Issue Characteristics |
| Rated Final Distribution Date: | The Distribution Date in March 2064. |
| Interest Accrual Period: | With respect to any Distribution Date, the calendar month immediately preceding the month in which such Distribution Date occurs. |
| Day Count: | The Offered Certificates will accrue interest on a 30/360 basis. |
| Minimum Denominations: | $10,000 for each Class of Offered Certificates (other than the Class X-A and X-B Certificates) and $1,000,000 for the Class X-A and X-B Certificates. Investments may also be made in any whole dollar denomination in excess of the applicable minimum denomination. |
| Clean-up Call: | 1.0% |
| Delivery: | DTC, Euroclear and Clearstream Banking |
| ERISA/SMMEA Status: | Each Class of Offered Certificates is expected to be eligible for exemptive relief under ERISA. No Class of Offered Certificates will be SMMEA eligible. |
| Risk Factors: | THE CERTIFICATES INVOLVE CERTAIN RISKS AND MAY NOT BE SUITABLE FOR ALL INVESTORS. SEE THE “SUMMARY OF RISK FACTORS” AND “RISK FACTORS” SECTIONS OF THE PRELIMINARY PROSPECTUS. |
| Bond Analytics Information: | The Certificate Administrator will be authorized to make distribution date statements, CREFC® reports and certain supplemental reports (other than confidential information) available to certain financial modeling and data provision services, including Bloomberg, L.P., Trepp, LLC, Intex Solutions, Inc., Markit Group Limited, Interactive Data Corp., BlackRock Financial Management, Inc., CMBS.com, Inc., Moody’s Analytics, Inc., Morningstar Credit Information & Analytics, LLC, KBRA Analytics, LLC, MBS Data, LLC, RealInsight and Thomson Reuters Corporation. |
| Tax Treatment | For U.S. federal income tax purposes, the issuing entity will consist of one or more REMICs arranged in a tiered structure and a trust (the “grantor trust”). The upper-most REMIC will issue REMIC regular interests some of which will be held by the grantor trust (such grantor trust-held REMIC regular interests, the “trust components”). The Offered Certificates (other than the Exchangeable Certificates) will represent REMIC regular interests (other than the trust components). The Exchangeable Certificates will represent beneficial ownership of one or more of the trust components held by the grantor trust. |
THE INFORMATION IN THIS STRUCTURAL AND COLLATERAL TERM SHEET IS NOT COMPLETE AND MAY BE AMENDED PRIOR TO THE TIME OF SALE. THIS TERM SHEET IS NOT AN OFFER TO SELL THESE SECURITIES AND IT IS NOT A SOLICITATION OF AN OFFER TO BUY THESE SECURITIES IN ANY JURISDICTION WHERE THE OFFER OR SALE IS NOT PERMITTED.
8
| BANK 2022-BNK40 | Characteristics of the Mortgage Pool |
IV. Characteristics of the Mortgage Pool(1)
A. Ten Largest Mortgage Loans or Groups
Mortgage Loan
Seller | | Mortgage Loan Name | | City | | State | | Number of Mortgage Loans / Mortgaged Properties | | Mortgage Loan Cut-off Date Balance ($) | | % of Initial Pool Balance (%) | | Property
Type | | Number
of
SF / Units | | Cut-off Date Balance
Per SF / Unit ($) | | Cut-off Date LTV Ratio (%) | | Balloon LTV Ratio (%) | | U/W
NCF
DSCR
(x) | | U/W NOI Debt
Yield (%) |
| WFB/MSMCH | | 601 Lexington Avenue | | New York | | NY | | 1 / 1 | | $110,000,000 | | 9.4 | % | | Office | | 1,675,659 | | | $432 | | 42.5 | % | | 42.5 | % | | 4.50 | x | | 13.2 | % |
| WFB | | Journal Squared Tower 2 | | Jersey City | | NJ | | 1 / 1 | | 110,000,000 | | 9.4 | | | Multifamily | | 704 | | | 260,653 | | 38.0 | | | 38.0 | | | 3.37 | | | 12.0 | |
| WFB/BANA | | Life Science Office Portfolio | | Various | | Various | | 1 / 9 | | 110,000,000 | | 9.4 | | | Office | | 737,871 | | | 257 | | 62.3 | | | 62.3 | | | 2.50 | | | 9.2 | |
| BANA | | UCI Research Park Phases 12 & 13 | | Irvine | | CA | | 1 / 1 | | 100,000,000 | | 8.5 | | | Office | | 686,276 | | | 219 | | 50.0 | | | 50.0 | | | 3.66 | | | 12.1 | |
| BANA | | Silver Sands Premium Outlets | | Miramar Beach | | FL | | 1 / 1 | | 65,000,000 | | 5.5 | | | Retail | | 435,156 | | | 322 | | 50.7 | | | 50.7 | | | 3.27 | | | 13.8 | |
| MSMCH | | 333 River Street | | Hoboken | | NJ | | 1 / 1 | | 50,000,000 | | 4.3 | | | Multifamily | | 526 | | | 237,643 | | 34.5 | | | 34.5 | | | 5.22 | | | 12.4 | |
| MSMCH | | Midtown Square | | Troy | | MI | | 1 / 1 | | 50,000,000 | | 4.3 | | | Retail | | 580,251 | | | 139 | | 62.9 | | | 53.1 | | | 1.55 | | | 9.3 | |
| WFB | | One Merriweather | | Columbia | | MD | | 1 / 1 | | 49,800,000 | | 4.2 | | | Office | | 206,865 | | | 241 | | 58.5 | | | 58.5 | | | 2.62 | | | 10.1 | |
| WFB | | GS Foods Portfolio | | Various | | Various | | 1 / 6 | | 40,000,000 | | 3.4 | | | Industrial | | 516,288 | | | 111 | | 67.2 | | | 60.9 | | | 1.45 | | | 8.6 | |
| MSMCH | | The Ashton | | Jersey City | | NJ | | 1 / 1 | | 28,500,000 | | 2.4 | | | Multifamily | | 93 | | | 306,452 | | 59.0 | | | 59.0 | | | 1.54 | | | 6.2 | |
| Top Three Total/Weighted Average | | 3 / 11 | | $330,000,000 | | 28.1 | % | | | | | | | | | 47.6 | % | | 47.6 | % | | 3.46 | x | | 11.5 | % |
| Top Five Total/Weighted Average | | 5 / 13 | | $495,000,000 | | 42.2 | % | | | | | | | | | 48.5 | % | | 48.5 | % | | 3.47 | x | | 11.9 | % |
| Top Ten Total/Weighted Average | | 10 / 23 | | $713,300,000 | | 60.8 | % | | | | | | | | | 50.7 | % | | 49.6 | % | | 3.21 | x | | 11.2 | % |
| Non-Top Ten Total/Weighted Average | | 60 / 79 | | $460,024,212 | | 39.2 | % | | | | | | | | | 46.9 | % | | 44.9 | % | | 5.23 | x | | 18.6 | % |
| | | | | | | | | | | | | | | | | | | | | | | | | | | | | | | | | |
| (1) | With respect to any mortgage loan that is part of a whole loan, Cut-off Date Balance Per SF/Unit($) loan-to-value ratio, debt service coverage ratio and debt yield calculations include the related pari passu companion loan(s) but exclude any related subordinate companion loan(s) (unless otherwise stated). With respect to each mortgage loan, debt service coverage ratio, debt yield and loan-to-value ratio information do not take into account subordinate debt (whether or not secured by the related mortgaged property), if any, that currently exists or is allowed under the terms of such mortgage loan. |
THE INFORMATION IN THIS STRUCTURAL AND COLLATERAL TERM SHEET IS NOT COMPLETE AND MAY BE AMENDED PRIOR TO THE TIME OF SALE. THIS TERM SHEET IS NOT AN OFFER TO SELL THESE SECURITIES AND IT IS NOT A SOLICITATION OF AN OFFER TO BUY THESE SECURITIES IN ANY JURISDICTION WHERE THE OFFER OR SALE IS NOT PERMITTED.
9
| BANK 2022-BNK40 | Characteristics of the Mortgage Pool |
B. Summary of the Whole Loans
| No. | Property Name | Mortgage Loan Seller in BANK 2021-BNK37 | Trust Cut-off Date Balance | Aggregate Pari-Passu Companion Loan Cut-off Date Balance(1) | Controlling Pooling / Trust & Servicing Agreement | Master Servicer | Special Servicer | Related Pari Passu Companion Loan(s) Securitizations | Related Pari Passu Companion Loan(s) Original Balance |
| 1 | 601 Lexington Avenue | WFB/MSMCH | $110,000,000 | $723,300,000 | BXP 2021-601L | Wells Fargo Bank, National Association | Situs Holdings, LLC | BANK 2022-BNK39 | $613,300,000 |
| 2 | Journal Squared Tower 2 | WFB | $110,000,000 | $183,500,000 | WFCM 2022-JS2 | Wells Fargo Bank, National Association | Wells Fargo Bank, National Association | Future securitizations | $73,500,000 |
| 3 | Life Science Office Portfolio | WFB/BANA | $110,000,000 | $189,800,000 | BANK 2022-BNK40 | Wells Fargo Bank, National Association | CWCapital Asset Management LLC | Future securitizations | $79,800,000 |
| 4 | UCI Research Park Phases 12 & 13 | BANA | $100,000,000 | $150,000,000 | BANK 2022-BNK40 | Wells Fargo Bank, National Association | CWCapital Asset Management LLC | Future securitizations | $50,000,000 |
| 5 | Silver Sands Premium Outlets | BANA | $65,000,000 | $140,000,000 | BANK 2022-BNK40 | Wells Fargo Bank, National Association | CWCapital Asset Management LLC | Future securitizations | $75,000,000 |
| 6 | 333 River Street | MSMCH | $50,000,000 | $125,000,000 | BANK 2022-BNK39 | Wells Fargo Bank, National Association | LNR Partners, LLC | BANK 2022-BNK39 | $75,000,000 |
| 7 | Midtown Square | MSMCH | $50,000,000 | $80,430,000 | BANK 2022-BNK40 | Wells Fargo Bank, National Association | CWCapital Asset Management LLC | Future securitizations | $30,430,000 |
| 9 | GS Foods Portfolio | WFB | $40,000,000 | $57,520,000 | BANK 2022-BNK40 | Wells Fargo Bank, National Association | CWCapital Asset Management LLC | Future securitizations | $17,520,000 |
| (1) | The Aggregate Pari Passu Companion Loan Cut-off Date Balance excludes the related Subordinate Companion Loans. |
THE INFORMATION IN THIS STRUCTURAL AND COLLATERAL TERM SHEET IS NOT COMPLETE AND MAY BE AMENDED PRIOR TO THE TIME OF SALE. THIS TERM SHEET IS NOT AN OFFER TO SELL THESE SECURITIES AND IT IS NOT A SOLICITATION OF AN OFFER TO BUY THESE SECURITIES IN ANY JURISDICTION WHERE THE OFFER OR SALE IS NOT PERMITTED.
10
| BANK 2022-BNK40 | Characteristics of the Mortgage Pool |
C. Mortgage Loans with Additional Secured and Mezzanine Financing(1)
| Loan No. | Mortgage Loan Seller | Mortgage Loan Name | Mortgage Loan Cut-off Date Balance ($) | % of Cut-off Date Balance (%) | Sub Debt Cut-off Date Balance ($) | Mezzanine Debt Cut-off Date Balance ($) | Total Debt Interest Rate (%)(2) | Mortgage Loan U/W NCF DSCR (x)(3) | Total Debt U/W NCF DSCR (x) | Mortgage Loan Cut-off Date U/W NOI Debt Yield (%)(3) | Total Debt Cut-off Date U/W NOI Debt Yield (%) | Mortgage Loan Cut-off Date LTV Ratio (%)(3) | Total Debt Cut-off Date LTV Ratio (%) |
| 1 | WFB/MSMCH | 601 Lexington Avenue | $110,000,000 | 9.4% | $276,700,000 | $0 | 2.7920% | 4.50x | 3.25x | 13.2% | 9.5% | 42.5% | 58.8% |
| 2 | WFB | Journal Squared Tower 2 | 110,000,000 | 9.4 | 166,500,000 | 0 | 3.4900 | 3.37 | 1.77 | 12.0 | 6.3 | 38.0 | 72.4 |
| Total/Weighted Average | $220,000,000 | 18.8% | $443,200,000 | $0 | 3.1410% | 3.94x | 2.51x | 12.6% | 7.9% | 40.3% | 65.6% |
| (1) | In addition, seventeen (17) of the mortgage loans, each of which is secured by a residential cooperative property sold to the depositor by National Cooperative Bank, N.A, currently have in place Subordinate Coop LOCs. See “Description of the Mortgage Pool—Additional Indebtedness—Other Unsecured Indebtedness” and “Description of the Mortgage Pool—Additional Indebtedness—Other Secured Indebtedness—Additional Debt Financing for Mortgage Loans Secured by Residential Cooperatives Sold to the Depositor by National Cooperative Bank, N.A.” in the Preliminary Prospectus. |
| (2) | Total Debt Interest Rate for any specified mortgage loan reflects the weighted average of the interest rates on the respective components of the total debt. |
| (3) | With respect to any mortgage loan that is part of a whole loan, the loan-to-value ratio, debt service coverage ratio and debt yield calculations include the related pari passu companion loan(s) but exclude any related subordinate companion loan(s) (unless otherwise stated). |
THE INFORMATION IN THIS STRUCTURAL AND COLLATERAL TERM SHEET IS NOT COMPLETE AND MAY BE AMENDED PRIOR TO THE TIME OF SALE. THIS TERM SHEET IS NOT AN OFFER TO SELL THESE SECURITIES AND IT IS NOT A SOLICITATION OF AN OFFER TO BUY THESE SECURITIES IN ANY JURISDICTION WHERE THE OFFER OR SALE IS NOT PERMITTED.
11
| BANK 2022-BNK40 | Characteristics of the Mortgage Pool |
D. Previous Securitization History(1)
Loan
No. | Mortgage Loan Seller | Mortgage
Loan or Mortgaged
Property Name | City | State | Property
Type | Mortgage Loan
or Mortgaged Property Cut-off Date Balance ($) | % of Initial Pool
Balance (%) | Previous Securitization |
| 5 | BANA | Silver Sands Premium Outlets | Miramar Beach | FL | Retail | $65,000,000 | 5.5% | MSBAM 2012-C5 |
| 6 | MSMCH | 333 River Street | Hoboken | NJ | Multifamily | 50,000,000 | 4.3 | FN 470772 |
| 11.01 | BANA | BS&L Industrial Drive | Bethlehem | PA | Self Storage | 9,041,063 | 0.8 | WFRBS 2014-C19 |
| 11.02 | BANA | BS&L Schantz Road | Allentown | PA | Self Storage | 8,294,327 | 0.7 | WFRBS 2014-C19 |
| 16 | WFB | Market at Liberty Crossing - OH | Powell | OH | Retail | 19,930,922 | 1.7 | WFRBS 2013-C16 |
| 21.01 | BANA | MySpace Self Storage - Lansing | Lansing | MI | Self Storage | 4,599,909 | 0.4 | CGCMT 2016-C1 |
| 21.02 | BANA | MySpace Self Storage - Pierson | Flint | MI | Self Storage | 3,859,348 | 0.3 | CGCMT 2016-C1 |
| 21.03 | BANA | MySpace Self Storage - Brighton | Brighton | MI | Self Storage | 2,378,225 | 0.2 | CGCMT 2016-C1 |
| 21.04 | BANA | MySpace Self Storage - Hill Road | Flint | MI | Self Storage | 1,788,185 | 0.2 | CGCMT 2016-C1 |
| 27 | NCB | 159 Madison Owners Corp. | New York | NY | Multifamily | 10,487,100 | 0.9 | WFRBS 2014-C19 |
| 33 | WFB | Stadium Industrial Park | Las Vegas | NV | Industrial | 7,500,000 | 0.6 | RAITF 2016-FL6 |
| 39 | WFB | Out O’ Space Storage - Cantonment | Cantonment | FL | Self Storage | 5,125,000 | 0.4 | WFCM 2015-C27 |
| 44 | WFB | Out O’ Space Storage - Dade City | Dade City | FL | Self Storage | 4,000,000 | 0.3 | WFCM 2016-C32 |
| 45 | WFB | Out O’ Space Storage - Pensacola | Pensacola | FL | Self Storage | 3,750,000 | 0.3 | WFCM 2015-C28 |
| 46 | BANA | Coachella MHC | Coachella | CA | Manufactured Housing | 3,600,000 | 0.3 | WFRBS 2013-C13 |
| 47 | WFB | Out O’ Space Storage - Tavares | Tavares | FL | Self Storage | 3,575,000 | 0.3 | WFCM 2016-C35 |
| 48 | NCB | 67-35 Yellowstone Blvd. Owners Corp. | Forest Hills | NY | Multifamily | 3,295,978 | 0.3 | WFRBS 2014-C21 |
| 52 | NCB | 17th Street Artists Corp. | New York | NY | Multifamily | 2,794,840 | 0.2 | WFRBS 2013-C15 |
| | Total | | | | | $209,019,898 | 17.8% | |
| (1) | The table above represents the most recent securitization with respect to the mortgaged property securing the related mortgage loan, based on information provided by the related borrower or obtained through searches of a third-party database. While loans secured by the above mortgaged properties may have been securitized multiple times in prior transactions, mortgage loans in this securitization are only listed in the above chart if the mortgage loan paid off a loan in another securitization. The information has not otherwise been confirmed by the mortgage loan sellers. |
THE INFORMATION IN THIS STRUCTURAL AND COLLATERAL TERM SHEET IS NOT COMPLETE AND MAY BE AMENDED PRIOR TO THE TIME OF SALE. THIS TERM SHEET IS NOT AN OFFER TO SELL THESE SECURITIES AND IT IS NOT A SOLICITATION OF AN OFFER TO BUY THESE SECURITIES IN ANY JURISDICTION WHERE THE OFFER OR SALE IS NOT PERMITTED.
12
| BANK 2022-BNK40 | Characteristics of the Mortgage Pool |
E. Mortgage Loans with Scheduled Balloon Payments and Related Classes
| Class A-2(1) |
| Loan No. | Mortgage Loan Seller | Mortgage Loan Name | State | Property Type | Mortgage Loan Cut-off Date Balance ($) | % of Initial Pool
Balance (%) | Mortgage
Loan Balance at Maturity ($) | % of Class A-2 Certificate Principal
Balance (%)(2) | SF | Loan per
SF ($) | U/W NCF DSCR
(x) | U/W NOI Debt Yield (%) | Cut-off Date LTV Ratio (%) | Balloon
LTV Ratio (%) | Rem. IO Period (mos.) | Rem. Term to Maturity (mos.) |
| 35 | MSMCH | Galveston Self Storage | TX | Self Storage | $6,825,000 | 0.6% | $6,825,000 | 99.5% | 57,057 | $120 | 1.69x | 9.1% | 63.8% | 63.8% | 60 | 60 |
| Total/Weighted Average | | | $6,825,000 | 0.6% | $6,825,000 | 99.5% | | | 1.69x | 9.1% | 63.8% | 63.8% | 60 | 60 |
| | | | | | | | | | | | | | | | | |
| (1) | The table above presents the mortgage loan whose balloon payments would be applied to pay down the principal balance of the Class A-2 Certificates, assuming a 0% CPR and applying the “Structuring Assumptions” described in the Preliminary Prospectus, including the assumptions that (i) none of the mortgage loans in the pool experience prepayments prior to maturity, defaults or losses; (ii) there are no extensions of maturity dates of any mortgage loans in the pool; and (iii) each mortgage loan in the pool is paid in full on its stated maturity date. Each Class of Certificates evidences undivided ownership interests in the entire pool of mortgage loans. Debt service coverage ratio, debt yield and loan-to-value ratio information do not take into account subordinate debt (whether or not secured by the related mortgaged property), if any, that currently exists or is allowed under the terms of any mortgage loan. See Annex A-1 to the Preliminary Prospectus. |
| (2) | Reflects the percentage equal to the Balloon Balance divided by the initial Class A-2 Certificate Balance. |
THE INFORMATION IN THIS STRUCTURAL AND COLLATERAL TERM SHEET IS NOT COMPLETE AND MAY BE AMENDED PRIOR TO THE TIME OF SALE. THIS TERM SHEET IS NOT AN OFFER TO SELL THESE SECURITIES AND IT IS NOT A SOLICITATION OF AN OFFER TO BUY THESE SECURITIES IN ANY JURISDICTION WHERE THE OFFER OR SALE IS NOT PERMITTED.
13
| BANK 2022-BNK40 | Characteristics of the Mortgage Pool |
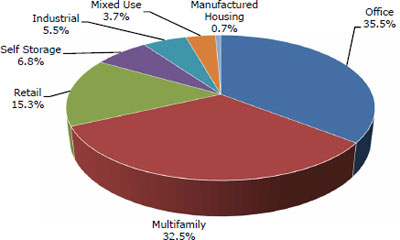
F. Property Type Distribution(1)
| Property Type | Number of Mortgaged Properties | Aggregate Cut-off
Date Balance ($) | % of Cut-off
Date Balance (%) | Weighted
Average Cut-
off Date LTV
Ratio (%) | Weighted
Average
Balloon LTV
Ratio (%) | Weighted
Average
U/W NCF
DSCR (x) | Weighted
Average
U/W NOI
Debt Yield
(%) | Weighted
Average
U/W NCF
Debt Yield
(%) | Weighted
Average
Interest
Rate (%) |
| Office | 14 | $417,070,000 | 35.5% | 53.3% | 53.3% | 3.32x | 11.1% | 10.6% | 3.2413% |
| Suburban | 3 | 175,400,000 | 14.9 | 52.8 | 52.8 | 3.25 | 11.5 | 10.9 | 3.3413 |
| CBD | 2 | 131,670,000 | 11.2 | 46.4 | 46.4 | 4.09 | 12.2 | 11.8 | 2.9279 |
| Medical | 9 | 110,000,000 | 9.4 | 62.3 | 62.3 | 2.50 | 9.2 | 8.8 | 3.4570 |
| Multifamily | 49 | 381,426,655 | 32.5 | 34.4 | 34.0 | 6.57 | 21.1 | 20.8 | 3.0753 |
| High Rise | 2 | 160,000,000 | 13.6 | 36.9 | 36.9 | 3.95 | 12.1 | 12.0 | 3.1228 |
| Cooperative | 24 | 86,451,655 | 7.4 | 10.9 | 9.5 | 15.70 | 52.6 | 51.9 | 2.9440 |
| Garden | 7 | 85,700,000 | 7.3 | 41.6 | 41.6 | 4.92 | 13.6 | 13.2 | 2.6626 |
| Mid Rise | 2 | 38,500,000 | 3.3 | 53.0 | 53.0 | 2.05 | 7.7 | 7.5 | 3.7534 |
| Low Rise | 14 | 10,775,000 | 0.9 | 63.0 | 58.4 | 1.63 | 9.3 | 9.0 | 4.2823 |
| Retail | 8 | 179,630,042 | 15.3 | 59.2 | 53.7 | 2.28 | 11.1 | 10.5 | 4.0438 |
| Anchored | 4 | 91,900,922 | 7.8 | 64.9 | 55.7 | 1.69 | 9.4 | 8.9 | 4.0004 |
| Outlet Center | 1 | 65,000,000 | 5.5 | 50.7 | 50.7 | 3.27 | 13.8 | 13.1 | 3.9590 |
| Unanchored | 3 | 22,729,120 | 1.9 | 60.8 | 54.5 | 1.85 | 10.5 | 9.7 | 4.4618 |
| Self Storage | 17 | 79,595,056 | 6.8 | 59.8 | 59.1 | 2.14 | 9.0 | 8.9 | 4.0132 |
| Self Storage | 17 | 79,595,056 | 6.8 | 59.8 | 59.1 | 2.14 | 9.0 | 8.9 | 4.0132 |
| Industrial | 9 | 64,327,459 | 5.5 | 61.9 | 57.2 | 1.79 | 9.8 | 9.2 | 3.7248 |
| Cold Storage | 2 | 23,661,445 | 2.0 | 67.2 | 60.9 | 1.45 | 8.6 | 8.1 | 3.7900 |
| Warehouse | 2 | 16,827,459 | 1.4 | 52.0 | 49.0 | 2.30 | 13.0 | 11.9 | 3.6284 |
| Warehouse/Cold Storage | 2 | 11,779,284 | 1.0 | 67.2 | 60.9 | 1.45 | 8.6 | 8.1 | 3.7900 |
| Manufacturing | 1 | 7,500,000 | 0.6 | 56.0 | 56.0 | 2.44 | 9.4 | 8.9 | 3.5930 |
| Cold Storage/Warehouse/Distribution | 1 | 3,413,608 | 0.3 | 67.2 | 60.9 | 1.45 | 8.6 | 8.1 | 3.7900 |
| Manufacturing/Cold Storage/Warehouse | 1 | 1,145,663 | 0.1 | 67.2 | 60.9 | 1.45 | 8.6 | 8.1 | 3.7900 |
| Mixed Use | 3 | 43,475,000 | 3.7 | 61.1 | 57.1 | 2.06 | 9.5 | 8.8 | 3.7757 |
| Multifamily/Retail | 1 | 19,250,000 | 1.6 | 68.0 | 58.9 | 1.29 | 7.5 | 7.4 | 3.9700 |
| Office/Industrial/Retail | 1 | 13,000,000 | 1.1 | 60.5 | 60.5 | 2.58 | 10.5 | 9.3 | 3.5430 |
| Medical Office/Retail | 1 | 11,225,000 | 1.0 | 49.9 | 49.9 | 2.79 | 11.7 | 10.5 | 3.7120 |
| Manufactured Housing | 2 | 7,800,000 | 0.7 | 46.2 | 46.2 | 2.94 | 12.6 | 12.2 | 4.2442 |
| RV Park | 1 | 4,200,000 | 0.4 | 58.3 | 58.3 | 2.22 | 11.2 | 10.6 | 4.7200 |
| Manufactured Housing | 1 | 3,600,000 | 0.3 | 32.0 | 32.0 | 3.77 | 14.2 | 14.1 | 3.6890 |
| Total | 102 | $1,173,324,212 | 100.0% | 49.2% | 47.8% | 4.00x | 14.1% | 13.7% | 3.4155% |
| (1) | Because this table presents information relating to the mortgaged properties and not the mortgage loans, (a) the information for mortgage loans secured by more than one mortgaged property (other than through cross-collateralization with other mortgage loans) is based on allocated loan amounts (allocating the principal balance of the mortgage loan to each of those properties according to the relative appraised values of the mortgaged properties or the allocated loan amounts or property-specific release prices set forth in the related mortgage loan documents or such other allocation as the related mortgage loan seller deemed appropriate) and (b) the information for each mortgaged property that relates to a mortgage loan that is cross-collateralized or cross-defaulted with other mortgage loans is based upon the principal balance of that mortgage loan, except that the applicable loan-to-value ratio, debt service coverage ratio and debt yield for each such mortgage loan is based upon the ratio or yield (as applicable) for the aggregate indebtedness evidenced by all loans in the group (without regard to any limitation on the amount of indebtedness secured by any mortgaged property in such cross-collateralized group). On an individual basis, without regard to the cross-collateralization feature, any mortgage loan that is part of a cross-collateralized group of mortgage loans may have a higher loan-to-value ratio, lower debt service coverage ratio and/or lower debt yield than is presented herein. For mortgaged properties securing residential cooperative mortgage loans, the debt service coverage ratio and debt yield for each such mortgaged property is calculated using U/W Net Operating Income or U/W Net Cash Flow, as applicable, for the related residential cooperative property which is the projected net operating income or net cash flow, as applicable, reflected in the most recent appraisal obtained by or otherwise in the possession of the related mortgage loan seller as of the cut-off date and the loan-to-value ratio, is calculated based upon the appraised value of the residential cooperative property determined as if such residential cooperative property is operated as a residential cooperative, inclusive of the amount of the underlying debt encumbering such residential cooperative property. With respect to any mortgage loan that is part of a whole loan, the loan-to-value ratio, debt service coverage ratio and debt yield calculations include the related pari passu companion loan(s) but exclude any related subordinate companion loan(s) (unless otherwise stated). With respect to each mortgage loan, debt service coverage ratio, debt yield and loan-to-value ratio information do not take into account any subordinate debt (whether or not secured by the related mortgaged property) that currently exists or is allowed under the terms of such mortgage loan. See Annex A-1 to the Preliminary Prospectus. |
THE INFORMATION IN THIS STRUCTURAL AND COLLATERAL TERM SHEET IS NOT COMPLETE AND MAY BE AMENDED PRIOR TO THE TIME OF SALE. THIS TERM SHEET IS NOT AN OFFER TO SELL THESE SECURITIES AND IT IS NOT A SOLICITATION OF AN OFFER TO BUY THESE SECURITIES IN ANY JURISDICTION WHERE THE OFFER OR SALE IS NOT PERMITTED.
14
| BANK 2022-BNK40 | Characteristics of the Mortgage Pool |
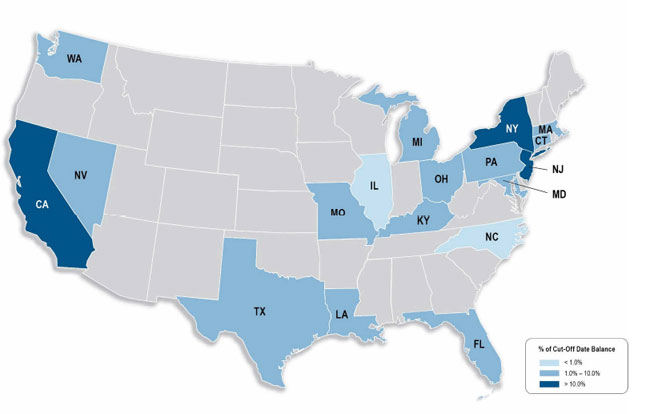
G. Geographic Distribution(1)(2)
| Location | Number of Mortgaged Properties | Aggregate
Cut-off Date Balance ($) | % of
Cut-off Date Balance (%) | Weighted Average Cut-off Date LTV Ratio (%) | Weighted Average Balloon LTV Ratio (%) | Weighted Average U/W NCF DSCR (x) | Weighted Average U/W NOI Debt Yield (%) | Weighted Average U/W NCF Debt Yield (%) | Weighted Average Interest Rate (%) |
| New York | 28 | $233,146,334 | 19.9% | 34.4% | 33.1% | 8.24x | 27.0% | 26.5% | 2.9954% |
| New Jersey | 3 | 188,500,000 | 16.1 | 40.2 | 40.2 | 3.58 | 11.2 | 11.1 | 3.2449 |
| California | 6 | 152,417,703 | 13.0 | 52.6 | 52.6 | 3.30 | 11.4 | 10.9 | 3.2790 |
| Southern California | 3 | 114,825,000 | 9.8 | 49.4 | 49.4 | 3.58 | 12.1 | 11.6 | 3.2009 |
| Northern California | 3 | 37,592,703 | 3.2 | 62.4 | 62.4 | 2.45 | 9.1 | 8.8 | 3.5174 |
| Kentucky | 7 | 85,700,000 | 7.3 | 41.6 | 41.6 | 4.92 | 13.6 | 13.2 | 2.6626 |
| Florida | 5 | 81,450,000 | 6.9 | 53.5 | 53.2 | 3.05 | 12.9 | 12.3 | 3.9456 |
| Michigan | 7 | 76,600,000 | 6.5 | 62.6 | 56.2 | 1.84 | 9.5 | 9.1 | 3.9905 |
| Maryland | 2 | 75,400,000 | 6.4 | 56.5 | 56.5 | 2.70 | 10.7 | 9.9 | 3.6269 |
| Other(3) | 44 | 280,110,176 | 23.9 | 61.3 | 58.1 | 2.09 | 9.4 | 9.0 | 3.8165 |
| Total/Weighted Average | 102 | $1,173,324,212 | 100.0% | 49.2% | 47.8% | 4.00x | 14.1% | 13.7% | 3.4155% |
| | | | | | | | | | |
| (1) | The mortgaged properties are located in 18 states. |
| (2) | Because this table presents information relating to the mortgaged properties and not the mortgage loans, (a) the information for mortgage loans secured by more than one mortgaged property (other than through cross-collateralization with other mortgage loans) is based on allocated loan amounts (allocating the principal balance of the mortgage loan to each of those properties according to the relative appraised values of the mortgaged properties or the allocated loan amounts or property-specific release prices set forth in the related mortgage loan documents or such other allocation as the related mortgage loan seller deemed appropriate) and (b) the information for each mortgaged property that relates to a mortgage loan that is cross-collateralized or cross-defaulted with other mortgage loans is based upon the principal balance of that mortgage loan, except that the applicable loan-to-value ratio, debt service coverage ratio and debt yield for each such mortgage loan is based upon the ratio or yield (as applicable) for the aggregate indebtedness evidenced by all loans in the group (without regard to any limitation on the amount of indebtedness secured by any mortgaged property in such cross-collateralized group). On an individual basis, without regard to the cross-collateralization feature, any mortgage loan that is part of a cross-collateralized group of mortgage loans may have a higher loan-to-value ratio, lower debt service coverage ratio and/or lower debt yield than is presented herein. For mortgaged properties securing residential cooperative mortgage loans, the debt service coverage ratio and debt yield for each such mortgaged property is calculated using U/W Net Operating Income or U/W Net Cash Flow, as applicable, for the related residential cooperative property, which is the projected net operating income or net cash flow, as applicable, reflected in the most recent appraisal obtained by or otherwise in the possession of the related mortgage loan seller as of the cut-off date, and the loan-to-value ratio, is calculated based upon the appraised value of the residential cooperative property determined as if such residential cooperative property is operated as a residential cooperative, inclusive of the amount of the underlying debt encumbering such residential cooperative property. With respect to any mortgage loan that is part of a whole loan, the loan-to-value ratio, debt service coverage ratio and debt yield calculations include the related pari passu companion loan(s) but exclude any related subordinate companion loan(s) (unless otherwise stated). With respect to each mortgage loan, debt service coverage ratio, debt yield and loan-to-value ratio information do not take into account any subordinate debt (whether or not secured by the related mortgaged property) that currently exists or is allowed under the terms of such mortgage loan. See Annex A-1 to the Preliminary Prospectus. |
| (3) | Includes 11 other states. |
THE INFORMATION IN THIS STRUCTURAL AND COLLATERAL TERM SHEET IS NOT COMPLETE AND MAY BE AMENDED PRIOR TO THE TIME OF SALE. THIS TERM SHEET IS NOT AN OFFER TO SELL THESE SECURITIES AND IT IS NOT A SOLICITATION OF AN OFFER TO BUY THESE SECURITIES IN ANY JURISDICTION WHERE THE OFFER OR SALE IS NOT PERMITTED.
15
| BANK 2022-BNK40 | Characteristics of the Mortgage Pool |
H. Characteristics of the Mortgage Pool(1)
| CUT-OFF DATE BALANCE |
Range of Cut-off Date
Balances ($) | Number of
Mortgage
Loans | Aggregate
Cut-off Date
Balance ($) | Percent by
Aggregate
Cut-off Date
Pool Balance (%) |
| 997,000 - 1,000,000 | 3 | $2,993,403 | 0.3% |
| 1,000,001 - 2,000,000 | 9 | 16,230,896 | 1.4 |
| 2,000,001 - 3,000,000 | 8 | 20,764,385 | 1.8 |
| 3,000,001 - 4,000,000 | 7 | 24,594,353 | 2.1 |
| 4,000,001 - 5,000,000 | 3 | 12,889,874 | 1.1 |
| 5,000,001 - 6,000,000 | 4 | 21,689,159 | 1.8 |
| 6,000,001 - 7,000,000 | 2 | 13,325,000 | 1.1 |
| 7,000,001 - 8,000,000 | 3 | 22,229,120 | 1.9 |
| 8,000,001 - 9,000,000 | 3 | 25,695,000 | 2.2 |
| 9,000,001 - 10,000,000 | 1 | 10,000,000 | 0.9 |
| 10,000,001 - 15,000,000 | 8 | 96,262,100 | 8.2 |
| 15,000,001 - 20,000,000 | 4 | 70,280,922 | 6.0 |
| 20,000,001 - 30,000,000 | 6 | 151,570,000 | 12.9 |
| 30,000,001 - 50,000,000 | 4 | 189,800,000 | 16.2 |
| 50,000,001 - 70,000,000 | 1 | 65,000,000 | 5.5 |
| 70,000,001 - 100,000,000 | 1 | 100,000,000 | 8.5 |
| 100,000,001 - 110,000,000 | 3 | 330,000,000 | 28.1 |
| Total: | 70 | $1,173,324,212 | 100.0% |
| Average: | $16,761,774 | | |
| UNDERWRITTEN NOI DEBT SERVICE COVERAGE RATIO |
Range of U/W NOI
DSCRs (x) | Number of
Mortgage
Loans | Aggregate
Cut-off Date
Balance ($) | Percent by
Aggregate
Cut-off Date
Pool Balance (%) |
| 1.31 - 1.40 | 1 | $19,250,000 | 1.6% |
| 1.41 - 1.50 | 2 | 27,060,042 | 2.3 |
| 1.51 - 1.60 | 4 | 85,945,000 | 7.3 |
| 1.61 - 1.70 | 2 | 53,750,000 | 4.6 |
| 1.71 - 1.80 | 2 | 9,820,056 | 0.8 |
| 1.81 - 2.00 | 1 | 13,300,000 | 1.1 |
| 2.01 - 2.25 | 4 | 43,070,000 | 3.7 |
| 2.26 - 2.50 | 8 | 61,075,000 | 5.2 |
| 2.51 - 2.75 | 4 | 128,877,459 | 11.0 |
| 2.76 - 3.00 | 3 | 76,100,000 | 6.5 |
| 3.01 - 3.50 | 4 | 211,825,000 | 18.1 |
| 3.51 - 4.00 | 3 | 113,600,000 | 9.7 |
| 4.01 - 6.00 | 12 | 258,519,894 | 22.0 |
| 6.01 - 8.00 | 5 | 26,275,167 | 2.2 |
| 8.01 - 10.00 | 2 | 5,792,769 | 0.5 |
| 10.01 - 20.00 | 9 | 17,773,812 | 1.5 |
| 20.01 - 30.00 | 3 | 5,290,013 | 0.5 |
| 30.01 - 46.13 | 1 | 16,000,000 | 1.4 |
| Total: | 70 | $1,173,324,212 | 100.0% |
| Weighted Average: | 4.13x | | |
| UNDERWRITTEN NOI DEBT YIELD |
Range of U/W NOI
Debt Yields (%) | Number of
Mortgage
Loans | Aggregate
Cut-off Date Balance ($) | Percent by
Aggregate
Cut-off Date
Pool Balance (%) |
| 6.2 - 7.0 | 1 | $28,500,000 | 2.4% |
| 7.1 - 8.0 | 2 | 40,920,000 | 3.5 |
| 8.1 - 9.0 | 8 | 128,335,042 | 10.9 |
| 9.1 - 10.0 | 12 | 219,465,056 | 18.7 |
| 10.1 - 11.0 | 5 | 88,600,000 | 7.6 |
| 11.1 - 12.0 | 5 | 161,025,000 | 13.7 |
| 12.1 - 13.0 | 5 | 204,900,000 | 17.5 |
| 13.1 - 14.0 | 2 | 175,000,000 | 14.9 |
| 14.1 - 15.0 | 2 | 11,200,000 | 1.0 |
| 15.1 - 20.0 | 4 | 36,550,000 | 3.1 |
| 20.1 - 118.8 | 24 | 78,829,114 | 6.7 |
| Total: | 70 | $1,173,324,212 | 100.0% |
| Weighted Average: | 14.1% | | |
| LOAN PURPOSE |
| Loan Purpose | Number of
Mortgage
Loans | Aggregate
Cut-off Date Balance ($) | Percent by
Aggregate
Cut-off Date
Pool Balance (%) |
| Refinance | 57 | $827,951,873 | 70.6% |
| Recapitalization | 7 | 250,498,219 | 21.3 |
| Acquisition | 6 | 94,874,120 | 8.1 |
| Total: | 70 | $1,173,324,212 | 100.0% |
| INTEREST RATE |
Range of Interest
Rates (%) | Number of
Mortgage
Loans | Aggregate
Cut-off Date Balance ($) | Percent by
Aggregate
Cut-off Date
Pool Balance (%) |
| 2.3150 - 2.5000 | 1 | $50,000,000 | 4.3% |
| 2.5001 - 2.7500 | 7 | 99,200,000 | 8.5 |
| 2.7501 - 3.0000 | 9 | 143,654,021 | 12.2 |
| 3.0001 - 3.2500 | 11 | 138,954,231 | 11.8 |
| 3.2501 - 3.5000 | 8 | 227,843,403 | 19.4 |
| 3.5001 - 3.7500 | 12 | 173,672,459 | 14.8 |
| 3.7501 - 4.0000 | 11 | 250,550,000 | 21.4 |
| 4.0001 - 4.2500 | 3 | 28,050,978 | 2.4 |
| 4.2501 - 5.2500 | 8 | 61,399,120 | 5.2 |
| Total: | 70 | $1,173,324,212 | 100.0% |
| Weighted Average: | 3.4155% | | |
| UNDERWRITTEN NCF DEBT SERVICE COVERAGE RATIO |
Range of U/W NCF
DSCRs (x) | Number of
Mortgage
Loans | Aggregate
Cut-off Date Balance ($) | Percent by
Aggregate
Cut-off Date
Pool Balance (%) |
| 1.29 - 1.30 | 1 | $19,250,000 | 1.6% |
| 1.31 - 1.40 | 2 | 27,060,042 | 2.3 |
| 1.41 - 1.50 | 3 | 57,445,000 | 4.9 |
| 1.51 - 1.60 | 2 | 78,500,000 | 6.7 |
| 1.61 - 1.70 | 2 | 10,575,000 | 0.9 |
| 1.71 - 1.80 | 1 | 2,995,056 | 0.3 |
| 1.81 - 2.00 | 2 | 34,970,000 | 3.0 |
| 2.01 - 2.25 | 7 | 35,827,459 | 3.1 |
| 2.26 - 2.50 | 8 | 175,525,000 | 15.0 |
| 2.51 - 2.75 | 2 | 62,800,000 | 5.4 |
| 2.76 - 3.00 | 3 | 50,125,000 | 4.3 |
| 3.01 - 3.50 | 3 | 185,000,000 | 15.8 |
| 3.51 - 4.00 | 2 | 103,600,000 | 8.8 |
| 4.01 - 6.00 | 14 | 278,109,768 | 23.7 |
| 6.01 - 8.00 | 3 | 6,685,293 | 0.6 |
| 8.01 - 10.00 | 3 | 7,536,698 | 0.6 |
| 10.01 - 20.00 | 8 | 16,029,883 | 1.4 |
| 20.01 - 30.00 | 3 | 5,290,013 | 0.5 |
| 30.01 - 45.53 | 1 | 16,000,000 | 1.4 |
| Total: | 70 | $1,173,324,212 | 100.0% |
| Weighted Average: | 4.00x | | |
| UNDERWRITTEN NCF DEBT YIELD |
Range of U/W NCF
Debt Yields (%) | Number of
Mortgage
Loans | Aggregate
Cut-off Date Balance ($) | Percent by
Aggregate
Cut-off Date
Pool Balance (%) |
| 6.1 - 7.0 | 1 | $28,500,000 | 2.4% |
| 7.1 - 8.0 | 2 | 40,920,000 | 3.5 |
| 8.1 - 9.0 | 14 | 320,105,042 | 27.3 |
| 9.1 - 10.0 | 10 | 102,995,056 | 8.8 |
| 10.1 - 11.0 | 3 | 28,725,000 | 2.4 |
| 11.1 - 12.0 | 5 | 271,200,000 | 23.1 |
| 12.1 - 13.0 | 4 | 189,300,000 | 16.1 |
| 13.1 - 14.0 | 1 | 65,000,000 | 5.5 |
| 14.1 - 15.0 | 3 | 15,400,000 | 1.3 |
| 15.1 - 20.0 | 3 | 32,350,000 | 2.8 |
| 20.1 - 118.2 | 24 | 78,829,114 | 6.7 |
| Total: | 70 | $1,173,324,212 | 100.0% |
| Weighted Average: | 13.7% | | |
| (1) | The information for each mortgaged property that relates to a mortgage loan that is cross-collateralized or cross-defaulted with one or more other mortgage loans is based upon the principal balance of that mortgage loan, except that the applicable loan-to-value ratio, debt service coverage ratio, and debt yield for each such mortgage loan is based upon the ratio or yield (as applicable) for the aggregate indebtedness evidenced by all loans in the group (without regard to any limitation on the amount of indebtedness secured by any mortgaged property in such cross-collateralized group). For mortgaged properties securing residential cooperative mortgage loans, the debt service coverage ratio and debt yield for each such mortgaged property is calculated using U/W Net Operating Income or U/W Net Cash Flow, as applicable, for the related residential cooperative property, which is the projected net operating income or net cash flow, as applicable, reflected in the most recent appraisal obtained by or otherwise in the possession of the related mortgage loan seller as of the cut-off date, and the loan-to-value ratio is calculated based upon the appraised value of the residential cooperative property determined as if such residential cooperative property is operated as a residential cooperative, inclusive of the amount of the underlying debt encumbering such residential cooperative. With respect to any mortgage loan that is part of a whole loan, the loan-to-value ratio, debt service coverage ratio and debt yield calculations include the related pari passu companion loan(s) but exclude any related subordinate companion loan(s) (unless otherwise stated). With respect to each mortgage loan, debt service coverage ratio, debt yield and loan-to-value ratio information do not take into account any subordinate debt (whether or not secured by the related mortgaged property), that currently exists or is allowed under the terms of such mortgage loan. See Annex A-1 to the Preliminary Prospectus. Prepayment provisions for each mortgage loan reflects the entire life of the loan (from origination to maturity). |
THE INFORMATION IN THIS STRUCTURAL AND COLLATERAL TERM SHEET IS NOT COMPLETE AND MAY BE AMENDED PRIOR TO THE TIME OF SALE. THIS TERM SHEET IS NOT AN OFFER TO SELL THESE SECURITIES AND IT IS NOT A SOLICITATION OF AN OFFER TO BUY THESE SECURITIES IN ANY JURISDICTION WHERE THE OFFER OR SALE IS NOT PERMITTED.
16
| BANK 2022-BNK40 | Characteristics of the Mortgage Pool |
| ORIGINAL TERM TO MATURITY |
Original Terms to
Maturity (months) | Number of
Mortgage
Loans | Aggregate Cut-
off Date Balance | Percent by
Aggregate
Cut-off Date
Pool Balance (%) |
| 60 | 1 | $6,825,000 | 0.6% |
| 120 | 69 | 1,166,499,212 | 99.4 |
| Total: | 70 | $1,173,324,212 | 100.0% |
| Weighted Average: | 120 months | |
| REMAINING TERM TO MATURITY |
Range of Remaining
Terms to Maturity (months) | Number of
Mortgage
Loans | Aggregate Cut-
off Date Balance | Percent by
Aggregate
Cut-off Date
Pool Balance (%) |
| 60 | 1 | $6,825,000 | 0.6% |
| 117 - 120 | 69 | 1,166,499,212 | 99.4 |
| Total: | 70 | $1,173,324,212 | 100.0% |
| Weighted Average: | 118 months | |
| ORIGINAL AMORTIZATION TERM(1) |
Original
Amortization Terms
(months) | Number of
Mortgage
Loans | Aggregate Cut-
off Date Balance | Percent by
Aggregate
Cut-off Date
Pool Balance (%) |
| Non-Amortizing | 43 | $956,145,000 | 81.5% |
| 120 | 1 | 3,127,459 | 0.3 |
| 360 | 20 | 189,039,094 | 16.1 |
| 480 | 6 | 25,012,659 | 2.1 |
| Total: | 70 | $1,173,324,212 | 100.0% |
| Weighted Average(3): | 370 months | |
| REMAINING AMORTIZATION TERM(2) |
Range of Remaining Amortization Terms
(months) | Number of
Mortgage
Loans | Aggregate Cut-
off Date Balance | Percent by
Aggregate
Cut-off Date
Pool Balance (%) |
| Non-Amortizing | 43 | $956,145,000 | 81.5% |
| 119 | 1 | 3,127,459 | 0.3 |
| 358 - 360 | 20 | 189,039,094 | 16.1 |
| 477 - 479 | 6 | 25,012,659 | 2.1 |
| Total: | 70 | $1,173,324,212 | 100.0% |
| Weighted Average(3): | 370 months | |
| LOCKBOXES |
| Type of Lockbox | Number of
Mortgage
Loans | Aggregate Cut-
off Date Balance | Percent by
Aggregate
Cut-off Date
Pool Balance (%) |
| Springing | 27 | $462,574,176 | 39.4% |
| Hard/ Springing Cash Management | 4 | 315,000,000 | 26.8 |
| Soft/ Springing Cash Management | 5 | 145,500,922 | 12.4 |
| Hard/ In Place Cash Management | 3 | 132,370,000 | 11.3 |
| None | 31 | 117,879,114 | 10.0 |
| Total: | 70 | $1,173,324,212 | 100.0% |
| PREPAYMENT PROVISION SUMMARY |
| Prepayment Provision | Number of
Mortgage
Loans | Aggregate Cut-
off Date Balance | Percent by
Aggregate
Cut-off Date
Pool Balance (%) |
| Lockout / Defeasance / Open | 33 | $812,793,437 | 69.3% |
| Lockout / GRTR 1% or YM or Defeasance / Open | 4 | 158,775,000 | 13.5 |
| Lockout / GRTR 1% or YM / Open | 10 | 131,304,120 | 11.2 |
| GRTR 1% or YM / 1% / Open | 23 | 70,451,655 | 6.0 |
| Total: | 70 | $1,173,324,212 | 100.0% |
| | | | |
CUT-OFF DATE LOAN-TO-VALUE RATIO |
Range of Cut-off
Date LTV Ratios (%) | Number of
Mortgage
Loans | Aggregate Cut-
off Date Balance | Percent by
Aggregate
Cut-off Date
Pool Balance (%) |
| 2.3 - 20.0 | 23 | $82,689,955 | 7.0% |
| 20.1 - 25.0 | 1 | 1,200,000 | 0.1 |
| 25.1 - 35.0 | 5 | 80,889,159 | 6.9 |
| 35.1 - 40.0 | 3 | 124,200,000 | 10.6 |
| 40.1 - 45.0 | 4 | 167,400,000 | 14.3 |
| 45.1 - 50.0 | 3 | 116,325,000 | 9.9 |
| 50.1 - 55.0 | 3 | 92,600,000 | 7.9 |
| 55.1 - 60.0 | 7 | 126,750,000 | 10.8 |
| 60.1 - 65.0 | 13 | 257,295,056 | 21.9 |
| 65.1 - 69.6 | 8 | 123,975,042 | 10.6 |
| Total: | 70 | $1,173,324,212 | 100.0% |
| Weighted Average: | 49.2% | | |
| BALLOON LOAN-TO-VALUE RATIO |
| Range of Balloon LTV Ratios (%) | Number of
Mortgage
Loans | Aggregate Cut-
off Date Balance | Percent by
Aggregate
Cut-off Date
Pool Balance (%) |
| 0.2 - 20.0 | 23 | $82,689,955 | 7.0% |
| 20.1 - 25.0 | 1 | 1,200,000 | 0.1 |
| 25.1 - 30.0 | 1 | 5,689,159 | 0.5 |
| 30.1 - 35.0 | 4 | 75,200,000 | 6.4 |
| 35.1 - 40.0 | 4 | 129,300,000 | 11.0 |
| 40.1 - 45.0 | 4 | 167,400,000 | 14.3 |
| 45.1 - 50.0 | 3 | 114,220,056 | 9.7 |
| 50.1 - 55.0 | 4 | 142,600,000 | 12.2 |
| 55.1 - 60.0 | 12 | 190,505,042 | 16.2 |
| 60.1 - 65.0 | 12 | 239,275,000 | 20.4 |
| 65.1 - 66.8 | 2 | 25,245,000 | 2.2 |
| Total: | 70 | $1,173,324,212 | 100.0% |
| Weighted Average: | 47.8% | | |
| AMORTIZATION TYPE |
| Amortization Type | Number of
Mortgage
Loans | Aggregate Cut-
off Date Balance | Percent by
Aggregate
Cut-off Date
Pool Balance (%) |
| Interest Only | 43 | $956,145,000 | 81.5% |
| Interest Only, Amortizing Balloon | 6 | 130,445,000 | 11.1 |
| Amortizing Balloon | 21 | 86,734,212 | 7.4 |
| Total: | 70 | $1,173,324,212 | 100.0% |
ORIGINAL TERM OF INTEREST-ONLY PERIOD FOR PARTIAL IO LOANS |
IO Terms (months) | Number of
Mortgage
Loans | Aggregate Cut-
off Date Balance | Percent by
Aggregate
Cut-off Date
Pool Balance (%) |
| 24 | 2 | $58,670,000 | 5.0% |
| 36 | 1 | 19,250,000 | 1.6 |
| 60 | 3 | 52,525,000 | 4.5 |
| Total: | 6 | $130,445,000 | 11.1% |
| Weighted Average: | 40 months | | |
SEASONING |
| Seasoning (months) | Number of
Mortgage
Loans | Aggregate Cut-
off Date Balance | Percent by
Aggregate
Cut-off Date
Pool Balance (%) |
| 0 | 15 | $352,795,000 | 30.1% |
| 1 | 32 | 343,328,239 | 29.3 |
| 2 | 20 | 344,533,973 | 29.4 |
| 3 | 3 | 132,667,000 | 11.3 |
| Total: | 70 | $1,173,324,212 | 100.0% |
| Weighted Average: | 1 month | | |
| (1) | The original amortization term shown for any mortgage loan that is interest only for part of its term does not include the number of months in its interest only period and reflects only the number of months as of the commencement of amortization remaining from the end of such interest-only period. |
| (2) | The remaining amortization term shown for any mortgage loan that is interest only for part of its term does not include the number of months in its interest only period and reflects only the number of months as of the commencement of amortization remaining from the end of such interest-only period. |
| (3) | Excludes the non-amortizing mortgage loans. |
THE INFORMATION IN THIS STRUCTURAL AND COLLATERAL TERM SHEET IS NOT COMPLETE AND MAY BE AMENDED PRIOR TO THE TIME OF SALE. THIS TERM SHEET IS NOT AN OFFER TO SELL THESE SECURITIES AND IT IS NOT A SOLICITATION OF AN OFFER TO BUY THESE SECURITIES IN ANY JURISDICTION WHERE THE OFFER OR SALE IS NOT PERMITTED.
17
| BANK 2022-BNK40 | Certain Terms and Conditions |
V. Certain Terms and Conditions
Allocation Between the RR
Interest and the Non-
Retained Certificates: | Amounts available for distributions to the holders of the Certificates (including the RR Interest) will be allocated between amounts available for distribution to the holders of the RR Interest, on the one hand, and to all other Certificates, referred to herein as the “Non-Retained Certificates”, on the other hand. The portion of such amount allocable to (a) the RR Interest will at all times be the product of such amount multiplied by 5% and (b) the Non-Retained Certificates will at all times be the product of such amount multiplied by 95% (each, the respective “Percentage Allocation Entitlement”). |
| | |
| Interest Entitlements: | The interest entitlement of each Class of Non-Retained Certificates (other than the Class R Certificates) or trust component on each Distribution Date generally will be the interest accrued during the related Interest Accrual Period on the related Certificate Balance or Notional Amount at the related pass-through rate, net of any prepayment interest shortfalls allocated to that Class or trust component for such Distribution Date as described below. If prepayment interest shortfalls arise from voluntary prepayments (without the applicable Master Servicer consent) on particular non-specially serviced loans during any collection period, the applicable Master Servicer is required to make a compensating interest payment to offset those shortfalls, generally up to an amount equal to the portion of its master servicing fees that accrue at 0.25 basis points per annum. The remaining amount of prepayment interest shortfalls will be allocated between the RR Interest, on one hand, and the Non-Retained Certificates (other than the Class R Certificates) on the other hand, in accordance with their respective Percentage Allocation Entitlements. The prepayment interest shortfalls allocated to the Non-Retained Certificates (other than the Class R Certificates) will be allocated among such Classes of Certificates (other than the Exchangeable Certificates) and trust components that are entitled to interest, on a pro rata basis, based on their respective amounts of accrued interest for the related Distribution Date, to reduce the interest entitlement on each such Class of Certificates. For any distribution date, prepayment interest shortfalls allocated to a trust component will be allocated among the related Classes of Exchangeable Certificates, pro rata, in accordance with their Class Percentage Interests. If a Class or trust component receives less than the entirety of its interest entitlement on any Distribution Date, then the shortfall (excluding any shortfall due to prepayment interest shortfalls), together with interest thereon, will be added to its interest entitlement for the next succeeding Distribution Date. |
| | |
Aggregate Principal
Distribution Amount: | The Aggregate Principal Distribution Amount for each Distribution Date generally will be the aggregate amount of principal received or advanced in respect of the mortgage loans, net of any non-recoverable advances and interest thereon and workout-delayed reimbursement amounts that are reimbursed to the applicable Master Servicer, the Special Servicer or the Trustee during the related collection period. Non-recoverable advances and interest thereon are reimbursable from principal collections and advances before reimbursement from other amounts. Workout-delayed reimbursement amounts are reimbursable from principal collections. The Non-Retained Certificates will be entitled to the portion of the Aggregate Principal Distribution Amount equal to their Percentage Allocation Entitlement, which is referred to herein as the “Principal Distribution Amount”. |
| | |
Subordination, Allocation of
Losses and Certain
Expenses: | The chart below describes the manner in which the payment rights of certain Classes of Non-Retained Certificates will be senior or subordinate, as the case may be, to the payment rights of other Classes of Non-Retained Certificates. The chart also shows the allocation between the RR Interest and the Non-Retained Certificates and the corresponding entitlement to receive principal and/or interest of certain Classes of Non-Retained Certificates on any distribution date in descending order. It also shows the manner in which losses are allocated between the RR Interest and the Non-Retained Certificates and the manner in which the Non-Retained Certificate allocations are further allocated to certain Classes of those Certificates in ascending order (beginning with the Non-Offered Certificates, other than the Class R Certificates and the RR Interest) to reduce the balance of each such Class to zero; provided that no principal payments or mortgage loan losses will be allocated to the Class X-A, X-B, X-D, X-F, X-G, X-HJ or R Certificates, although principal payments and losses may reduce the Notional Amounts of the Class X-A, X-B, X-D, X-F, X-G and X-HJ Certificates and, therefore, the amount of interest they accrue. |
THE INFORMATION IN THIS STRUCTURAL AND COLLATERAL TERM SHEET IS NOT COMPLETE AND MAY BE AMENDED PRIOR TO THE TIME OF SALE. THIS TERM SHEET IS NOT AN OFFER TO SELL THESE SECURITIES AND IT IS NOT A SOLICITATION OF AN OFFER TO BUY THESE SECURITIES IN ANY JURISDICTION WHERE THE OFFER OR SALE IS NOT PERMITTED.
18
| BANK 2022-BNK40 | Certain Terms and Conditions |
| | 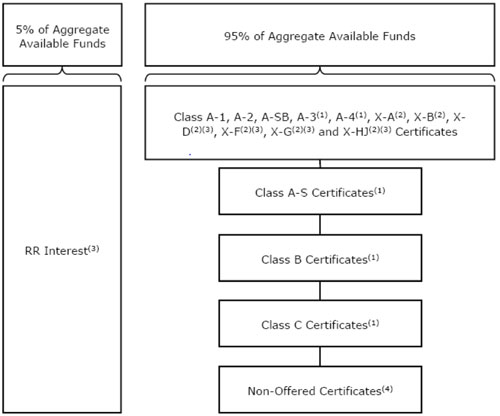 |
| | (1) The maximum certificate balances of the Class A-3, A-4, A-S, B and C certificates (subject to the constraint on the aggregate initial certificate balance of the Class A-3 and A-4 trust components discussed in footnote (9) to the table under “Certificate Structure”) will be issued on the closing date, and the certificate balance or notional amount of each other class of Exchangeable Certificates will be equal to zero on the closing date. The relative priorities of the Exchangeable Certificates are described more fully under “Exchangeable Certificates.” (2) The Class X-A, X-B, X-D, X-F, X-G and X-HJ Certificates are interest-only certificates. (3) The Class X-D, X-F, X-G and X-HJ Certificates and the RR Interest are Non-Offered Certificates. (4) Other than the Class X-D, X-F, X-G, X-HJ and R Certificates and the RR Interest. |
| Distributions: | On each Distribution Date, funds available for distribution from the mortgage loans, net of specified trust fees, expenses and reimbursements that are allocable to the Non-Retained Certificates will generally be distributed in the following amounts and order of priority (in each case to the extent of remaining available funds): |
| | |
| | 1. Class A-1, A-2, A-SB, A-3, A-4, X-A, X-B, X-D, X-F, X-G and X-HJ Certificates: To interest on the Class A-1, A-2, A-SB, X-A, X-B, X-D, X-F, X-G and X-HJ Certificates and the Class A-3, A-3-X1, A-3-X2, A-4, A-4-X1 and A-4-X2 trust components, pro rata, according to their respective interest entitlements. |
| | |
| | 2. Class A-1, A-2 and A-SB Certificates and the Class A-3 and A-4 trust components: To principal on the Class A-1, A-2 and A-SB Certificates and the Class A-3 and A-4 trust components in the following amounts and order of priority: (i) first, to principal on the Class A-SB Certificates, in an amount up to the Principal Distribution Amount for such Distribution Date until their Certificate Balance is reduced to the Class A-SB Planned Principal Balance for such Distribution Date; (ii) second, to principal on the Class A-1 Certificates until their Certificate Balance is reduced to zero, up to the remainder of the Principal Distribution Amount for such Distribution Date; (iii) third, to principal on the Class A-2 Certificates until their Certificate Balance is reduced to zero, up to the remainder of the Principal Distribution Amount for such Distribution Date; (iv) fourth, to principal on the Class A-3 trust component, until its Certificate Balance is reduced to zero, up to the remainder of the Principal Distribution Amount for such Distribution Date; (v) fifth, to principal on the Class A-4 trust component, until its Certificate Balance is reduced to zero, up to the remainder of the Principal Distribution Amount for such Distribution Date; and (vi) sixth, to principal on the Class A-SB Certificates until their Certificate Balance is reduced to zero, up to the remainder of the Principal Distribution Amount for such Distribution Date. However, if the Certificate Balance of each and every Class of Principal Balance Certificates, other than the Class A-1, A-2 and A-SB Certificates and the Class A-3 and A-4 trust components and the RR Interest, has been |
THE INFORMATION IN THIS STRUCTURAL AND COLLATERAL TERM SHEET IS NOT COMPLETE AND MAY BE AMENDED PRIOR TO THE TIME OF SALE. THIS TERM SHEET IS NOT AN OFFER TO SELL THESE SECURITIES AND IT IS NOT A SOLICITATION OF AN OFFER TO BUY THESE SECURITIES IN ANY JURISDICTION WHERE THE OFFER OR SALE IS NOT PERMITTED.
19
| BANK 2022-BNK40 | Certain Terms and Conditions |
| | reduced to zero as a result of the allocation of Mortgage Loan losses and expenses and any of the Class A-1, A-2 and A-SB Certificates and the Class A-3 and A-4 trust components remains outstanding, then the Principal Distribution Amount will be distributed to the Class A-1, A-2 and A-SB Certificates and the Class A-3 and A-4 trust components, pro rata, based on their respective outstanding Certificate Balances, until their Certificate Balances have been reduced to zero. |
| | |
| | 3. Class A-1, A-2 and A-SB Certificates and the Class A-3 and A-4 trust components: To reimburse the holders of the Class A-1, A-2 and A-SB Certificates and the Class A-3 and A-4 trust components, pro rata, on the basis of previously allocated unreimbursed losses, for any previously unreimbursed losses (plus interest thereon) on the mortgage loans that were previously allocated in reduction of the Certificate Balances of such Classes or trust components. |
| | |
| | 4. Class A-S, A-S-X1 and A-S-X2 trust components: To make distributions on the Class A-S, A-S-X1 and A-S-X2 trust components as follows: (a) first, to interest on the Class A-S, A-S-X1 and A-S-X2 trust components, pro rata, according to their respective interest entitlements; (b) next, to the extent of the portion of the Principal Distribution Amount remaining after distributions in respect of principal to each Class with a higher distribution priority (in this case, the Class A-1, A-2 and A-SB Certificates and the Class A-3 and A-4 trust components), to principal on the Class A-S trust component until its Certificate Balance is reduced to zero; and (c) next, to reimburse the holders of the Class A-S trust component for any previously unreimbursed losses (plus interest thereon) on the mortgage loans that were previously allocated to that trust component in reduction of their Certificate Balance. 5. Class B, B-X1 and B-X2 trust components: To make distributions on the Class B, B-X1 and B-X2 trust components as follows: (a) first, to interest on the Class B, B-X1 and B-X2 trust components, pro rata, according to their respective interest entitlements; (b) next, to the extent of the portion of the Principal Distribution Amount remaining after distributions in respect of principal to each Class with a higher distribution priority (in this case, the Class A-1, A-2 and A-SB Certificates and the Class A-3, A-4 and A-S trust components), to principal on the Class B trust component until its Certificate Balance is reduced to zero; and (c) next, to reimburse the holders of the Class B trust component for any previously unreimbursed losses (plus interest thereon) on the mortgage loans that were previously allocated to that trust component in reduction of their Certificate Balance. 6. Class C, C-X1 and C-X2 trust components: To make distributions on the Class C, C-X1 and C-X2 trust components as follows: (a) first, to interest on the Class C, C-X1 and C-X2 trust components, pro rata, according to their respective interest entitlements; (b) next, to the extent of the portion of the Principal Distribution Amount remaining after distributions in respect of principal to each Class with a higher distribution priority (in this case, the Class A-1, A-2 and A-SB Certificates and the Class A-3, A-4, A-S and B trust components), to principal on the Class C trust component until its Certificate Balance is reduced to zero; and (c) next, to reimburse the holders of the Class C trust component for any previously unreimbursed losses (plus interest thereon) on the mortgage loans that were previously allocated to that trust component in reduction of their Certificate Balance. 7. Class D Certificates: To make distributions on the Class D Certificates as follows: (a) first, to interest on the Class D Certificates in the amount of the interest entitlement for that Class; (b) next, to the extent of the portion of the Principal Distribution Amount remaining after distributions in respect of principal to each Class with a higher distribution priority (in this case, the Class A-1, A-2 and A-SB Certificates and the Class A-3, A-4, A-S, B and C trust components), to principal on the Class D Certificates until their Certificate Balance is reduced to zero; and (c) next, to reimburse the holders of the Class D Certificates for any previously unreimbursed losses (plus interest thereon) on the mortgage loans that were previously allocated to that Class in reduction of their Certificate Balance. 8. After the Class A-1, A-2, A-SB and D Certificates and the Class A-3, A-4, A-S, B and C trust components are paid all amounts to which they are entitled, the remaining funds available for distribution will be used to pay interest, principal and loss reimbursement amounts on the Class E, F, G, H and J Certificates sequentially in that order in a manner analogous to the Class D Certificates. Principal and interest payable on the Class A-3, A-3-X1, A-3-X2, A-4, A-4-X1, A-4-X2, A-S, A-S-X1, A-S-X2, B, B-X1, B-X2, C, C-X1 and C-X2 trust components will be distributed pro rata to the corresponding classes of Exchangeable Certificates representing interests therein in |
THE INFORMATION IN THIS STRUCTURAL AND COLLATERAL TERM SHEET IS NOT COMPLETE AND MAY BE AMENDED PRIOR TO THE TIME OF SALE. THIS TERM SHEET IS NOT AN OFFER TO SELL THESE SECURITIES AND IT IS NOT A SOLICITATION OF AN OFFER TO BUY THESE SECURITIES IN ANY JURISDICTION WHERE THE OFFER OR SALE IS NOT PERMITTED.
20
| BANK 2022-BNK40 | Certain Terms and Conditions |
| | accordance with their Class Percentage Interests therein as described below under “Exchangeable Certificates.” |
| | |
| Exchangeable Certificates: | Each class of Exchangeable Certificates may be exchanged for the corresponding classes of Exchangeable Certificates set forth next to such class in the table below, and vice versa. Following any exchange of one or more classes of Exchangeable Certificates (the applicable “Surrendered Classes”) for one or more classes of other Exchangeable Certificates (the applicable “Received Classes”), the Class Percentage Interests (as defined below) of the outstanding certificate balances or Notional Amounts of the Corresponding Trust Components that are represented by the Surrendered Classes (and consequently their related certificate balances or notional amounts) will be decreased, and those of the Received Classes (and consequently their related certificate balances or notional amounts) will be increased. The dollar denomination of each of the Received Classes of certificates must be equal to the dollar denomination of each of the Surrendered Classes of certificates. No fee will be required with respect to any exchange of Exchangeable Certificates. |
Surrendered Classes (or Received Classes) of Certificates | | Received Classes (or Surrendered Classes) of Certificates |
| Class A-3 | | Class A-3-1, Class A-3-X1 |
| Class A-3 | | Class A-3-2, Class A-3-X2 |
| Class A-4 | | Class A-4-1, Class A-4-X1 |
| Class A-4 | | Class A-4-2, Class A-4-X2 |
| Class A-S | | Class A-S-1, Class A-S-X1 |
| Class A-S | | Class A-S-2, Class A-S-X2 |
| Class B | | Class B-1, Class B-X1 |
| Class B | | Class B-2, Class B-X2 |
| Class C | | Class C-1, Class C-X1 |
| Class C | | Class C-2, Class C-X2 |
| | On the closing date, the issuing entity will issue the following “trust components,” each with the initial certificate balance (or, if such trust component has an “X” suffix, notional amount) and pass-through rate set forth next to it in the table below. Each trust component with an “X” suffix will not be entitled to distributions of principal. |
Trust Component | | Initial Certificate Balance or Notional Amount | | Pass-Through Rate |
| Class A-3 | | See footnote (9) to the table under “Certificate Structure” | | Class A-3 Certificate Pass-Through Rate minus 1.00% |
| Class A-3-X1 | | Equal to Class A-3 Trust Component Certificate Balance | | 0.50% |
| Class A-3-X2 | | Equal to Class A-3 Trust Component Certificate Balance | | 0.50% |
| Class A-4 | | See footnote (9) to the table under “Certificate Structure” | | Class A-4 Certificate Pass-Through Rate minus 1.00% |
| Class A-4-X1 | | Equal to Class A-4 Trust Component Certificate Balance | | 0.50% |
| Class A-4-X2 | | Equal to Class A-4 Trust Component Certificate Balance | | 0.50% |
THE INFORMATION IN THIS STRUCTURAL AND COLLATERAL TERM SHEET IS NOT COMPLETE AND MAY BE AMENDED PRIOR TO THE TIME OF SALE. THIS TERM SHEET IS NOT AN OFFER TO SELL THESE SECURITIES AND IT IS NOT A SOLICITATION OF AN OFFER TO BUY THESE SECURITIES IN ANY JURISDICTION WHERE THE OFFER OR SALE IS NOT PERMITTED.
21
| BANK 2022-BNK40 | Certain Terms and Conditions |
| Trust Component | | Initial Certificate Balance or Notional Amount | | Pass-Through Rate |
| | | | | |
| Class A-S | | $133,759,000 | | Class A-S Certificate Pass-Through Rate minus 1.00% |
| Class A-S-X1 | | Equal to Class A-S Trust Component Certificate Balance | | 0.50% |
| Class A-S-X2 | | Equal to Class A-S Trust Component Certificate Balance | | 0.50% |
| Class B | | $43,193,000 | | Class B Certificate Pass-Through Rate minus 1.00% |
| Class B-X1 | | Equal to Class B Trust Component Certificate Balance | | 0.50% |
| Class B-X2 | | Equal to Class B Trust Component Certificate Balance | | 0.50% |
| Class C | | $41,800,000 | | Class C Certificate Pass-Through Rate minus 1.00% |
| Class C-X1 | | Equal to Class C Trust Component Certificate Balance | | 0.50% |
| Class C-X2 | | Equal to Class C Trust Component Certificate Balance | | 0.50% |
| | Each class of Exchangeable Certificates represents an undivided beneficial ownership interest in the trust components set forth next to it in the table below (the “Corresponding Trust Components”). Each class of Exchangeable Certificates has a pass-through rate equal to the sum of the pass-through rates of the Corresponding Trust Components and represents a percentage interest (the related “Class Percentage Interest”) in each Corresponding Trust Component, including principal and interest payable thereon, equal to (x) the certificate balance (or, if such class has an “X” suffix, notional amount) of such class of certificates, divided by (y) the certificate balance of the Class A-3 trust component (if such class of Exchangeable Certificates has an “A-3” designation), the Class A-4 trust component (if such class of Exchangeable Certificates has an “A-4” designation), the Class A-S trust component (if such class of Exchangeable Certificates has an “A-S” designation), the Class B trust component (if such class of Exchangeable Certificates has a “B” designation) or the Class C trust component (if such class of Exchangeable Certificates has a “C” designation). |
Group of Exchangeable Certificates | | Class of Exchangeable Certificates | | Corresponding Trust Components |
| “Class A-3 Exchangeable Certificates” | | Class A-3 | | Class A-3, A-3-X1, A-3-X2 |
| | Class A-3-1 | | Class A-3, A-3-X2 |
| | Class A-3-2 | | Class A-3 |
| | Class A-3-X1 | | Class A-3-X1 |
| | Class A-3-X2 | | Class A-3-X1, A-3-X2 |
THE INFORMATION IN THIS STRUCTURAL AND COLLATERAL TERM SHEET IS NOT COMPLETE AND MAY BE AMENDED PRIOR TO THE TIME OF SALE. THIS TERM SHEET IS NOT AN OFFER TO SELL THESE SECURITIES AND IT IS NOT A SOLICITATION OF AN OFFER TO BUY THESE SECURITIES IN ANY JURISDICTION WHERE THE OFFER OR SALE IS NOT PERMITTED.
22
| BANK 2022-BNK40 | Certain Terms and Conditions |
| Group of Exchangeable Certificates | | Class of Exchangeable Certificates | | Corresponding Trust Components |
| “Class A-4 Exchangeable Certificates” | | Class A-4 | | Class A-4, A-4-X1, A-4-X2 |
| | Class A-4-1 | | Class A-4, A-4-X2 |
| | Class A-4-2 | | Class A-4 |
| | Class A-4-X1 | | Class A-4-X1 |
| | Class A-4-X2 | | Class A-4-X1, A-4-X2 |
| “Class A-S Exchangeable Certificates” | | Class A-S | | Class A-S, A-S-X1, A-S-X2 |
| | Class A-S-1 | | Class A-S, A-S-X2 |
| | Class A-S-2 | | Class A-S |
| | Class A-S-X1 | | Class A-S-X1 |
| | Class A-S-X2 | | Class A-S-X1, A-S-X2 |
| “Class B Exchangeable Certificates” | | Class B | | Class B, B-X1, B-X2 |
| | Class B-1 | | Class B, B-X2 |
| | Class B-2 | | Class B |
| | Class B-X1 | | Class B-X1 |
| | Class B-X2 | | Class B-X1, B-X2 |
| “Class C Exchangeable Certificates” | | Class C | | Class C, C-X1, C-X2 |
| | Class C-1 | | Class C, C-X2 |
| | Class C-2 | | Class C |
| | Class C-X1 | | Class C-X1 |
| | Class C-X2 | | Class C-X1, C-X2 |
| | The maximum Certificate Balance or Notional Amount of each class of Class A-3 Exchangeable Certificates that could be issued in an exchange is equal to the Certificate Balance of the Class A-3 trust component, the maximum Certificate Balance or Notional Amount of each class of Class A-4 Exchangeable Certificates that could be issued in an exchange is equal to the Certificate Balance of the Class A-4 trust component, the maximum Certificate Balance or Notional Amount of each class of Class A-S Exchangeable Certificates that could be issued in an exchange is equal to the Certificate Balance of the Class A-S trust component, the maximum Certificate Balance or Notional Amount of each class of Class B Exchangeable Certificates that could be issued in an exchange is equal to the Certificate Balance of the Class B trust component and the maximum Certificate Balance or Notional Amount of each class of Class C Exchangeable Certificates that could be issued in an exchange is equal to the Certificate Balance of the Class C trust component. The maximum Certificate Balances of Class A-3, A-4, A-S, B and C certificates (subject to the constraint on the aggregate initial Certificate Balance of the Class A-3 and A-4 trust components discussed in footnote (9) to table under “Certificate Structure”) will be issued on the closing date, and the Certificate Balance or Notional Amount of each other class of Exchangeable Certificates will be equal to zero on the Closing Date. Each class of Class A-3 Exchangeable Certificates, Class A-4 Exchangeable Certificates, Class A-S Exchangeable Certificates, Class B Exchangeable Certificates and Class C Exchangeable Certificates will have a Certificate Balance or Notional Amount equal to its Class Percentage Interest multiplied by the Certificate Balance of the Class A-3 trust component, Class A-4 trust component, Class A-S trust component, Class B trust component or Class C trust component, respectively. Each class of Class A-3 Exchangeable Certificates, Class A-4 Exchangeable Certificates, Class A-S Exchangeable Certificates, Class B Exchangeable Certificates and Class C Exchangeable Certificates with a Certificate Balance will have the same Approximate Initial Credit Support, Weighted Average Life, Expected Principal Window, Certificate Principal U/W NOI Debt Yield and Certificate Principal to Value Ratio as the Class A-3 Certificates, Class A-4 Certificates, Class A-S Certificates, Class B Certificates or Class C Certificates, respectively, shown above. |
THE INFORMATION IN THIS STRUCTURAL AND COLLATERAL TERM SHEET IS NOT COMPLETE AND MAY BE AMENDED PRIOR TO THE TIME OF SALE. THIS TERM SHEET IS NOT AN OFFER TO SELL THESE SECURITIES AND IT IS NOT A SOLICITATION OF AN OFFER TO BUY THESE SECURITIES IN ANY JURISDICTION WHERE THE OFFER OR SALE IS NOT PERMITTED.
23
| BANK 2022-BNK40 | Certain Terms and Conditions |
Allocation of Yield
Maintenance Charges and
Prepayment Premiums: | If any yield maintenance charge or prepayment premium is collected during any particular collection period with respect to any mortgage loan, then on the Distribution Date corresponding to that collection period, the certificate administrator will pay that yield maintenance charge or prepayment premium (net of liquidation fees payable therefrom) in the following manner: (x) to the Non-Retained Certificates (other than the Class X-D, X-F, X-G, X-HJ, F, G, H, J and R certificates), in the following amounts: (1) to each of the Class A-1, A-2, A-SB, A-3, A-3-1, A-3-2, A-4, A-4-1, A-4-2, A-S, A-S-1, A-S-2, B, B-1, B-2, C, C-1, C-2, D and E Certificates, the product of (a) the Non-Retained Percentage of the yield maintenance charge or prepayment premium, (b) the related Base Interest Fraction (as defined in the Preliminary Prospectus) for such class and the applicable principal prepayment, and (c) a fraction, the numerator of which is equal to the amount of principal distributed to such class for that Distribution Date, and the denominator of which is the total amount of principal distributed to the Class A-1, A-2, A-SB, D, E, F, G, H and J Certificates and the Class A-3 Exchangeable Certificates, the Class A-4 Exchangeable Certificates, the Class A-S Exchangeable Certificates, the Class B Exchangeable Certificates and the Class C Exchangeable Certificates for that Distribution Date, (2) to the Class A-3-X1 Certificates, the product of (a) the Non-Retained Percentage of such Yield Maintenance Charge or Prepayment Premium, (b) a fraction, the numerator of which is equal to the amount of principal distributed to the Class A-3-1 Certificates for that Distribution Date, and the denominator of which is the total amount of principal distributed to the Class A-1, A-2, A-SB, D, E, F, G, H and J and the Class A-3 Exchangeable Certificates, the Class A-4 Exchangeable Certificates, the Class A-S Exchangeable Certificates, the Class B Exchangeable Certificates and the Class C Exchangeable Certificates for that Distribution Date and (c) the difference between (i) the Base Interest Fraction for the Class A-3 Certificates and the applicable principal prepayment and (ii) the Base Interest Fraction for the Class A-3-1 Certificates and the applicable principal prepayment, (3) to the Class A-3-X2 Certificates, the product of (a) the Non-Retained Percentage of such Yield Maintenance Charge or Prepayment Premium, (b) a fraction, the numerator of which is equal to the amount of principal distributed to the Class A-3-2 Certificates for that Distribution Date, and the denominator of which is the total amount of principal distributed to the Class A-1, A-2, A-SB, D, E, F, G, H and J Certificates and the Class A-3 Exchangeable Certificates, the Class A-4 Exchangeable Certificates, the Class A-S Exchangeable Certificates, the Class B Exchangeable Certificates and the Class C Exchangeable Certificates for that Distribution Date and (c) the difference between (i) the Base Interest Fraction for the Class A-3 Certificates and the applicable principal prepayment and (ii) the Base Interest Fraction for the Class A-3-2 Certificates and the applicable principal prepayment, (4) to the Class A-4-X1 Certificates, the product of (a) the Non-Retained Percentage of such Yield Maintenance Charge or Prepayment Premium, (b) a fraction, the numerator of which is equal to the amount of principal distributed to the Class A-4-1 Certificates for that Distribution Date, and the denominator of which is the total amount of principal distributed to the Class A-1, A-2, A-SB, D, E, F, G, H and J Certificates and the Class A-3 Exchangeable Certificates, the Class A-4 Exchangeable Certificates, the Class A-S Exchangeable Certificates, the Class B Exchangeable Certificates and the Class C Exchangeable Certificates for that Distribution Date and (c) the difference between (i) the Base Interest Fraction for the Class A-4 Certificates and the applicable principal prepayment and (ii) the Base Interest Fraction for the Class A-4-1 Certificates and the applicable principal prepayment, (5) to the Class A-4-X2 Certificates, the product of (a) the Non-Retained Percentage of such Yield Maintenance Charge or Prepayment Premium, (b) a fraction, the numerator of which is equal to the amount of principal distributed to the Class A-4-2 Certificates for that Distribution Date, and the denominator of which is the total amount of principal distributed to the Class A-1, A-2, A-SB, D, E, F, G, H and J Certificates and the Class A-3 Exchangeable Certificates, the Class A-4 Exchangeable Certificates, the Class A-S Exchangeable Certificates, the Class B Exchangeable Certificates and the Class C Exchangeable Certificates for that Distribution Date and (c) the difference between (i) the Base Interest Fraction for |
THE INFORMATION IN THIS STRUCTURAL AND COLLATERAL TERM SHEET IS NOT COMPLETE AND MAY BE AMENDED PRIOR TO THE TIME OF SALE. THIS TERM SHEET IS NOT AN OFFER TO SELL THESE SECURITIES AND IT IS NOT A SOLICITATION OF AN OFFER TO BUY THESE SECURITIES IN ANY JURISDICTION WHERE THE OFFER OR SALE IS NOT PERMITTED.
24
| BANK 2022-BNK40 | Certain Terms and Conditions |
| | the Class A-4 Certificates and the applicable principal prepayment and (ii) the Base Interest Fraction for the Class A-4-2 Certificates and the applicable principal prepayment, (6) to the Class A-S-X1 Certificates, the product of (a) the Non-Retained Percentage of such Yield Maintenance Charge or Prepayment Premium, (b) a fraction, the numerator of which is equal to the amount of principal distributed to the Class A-S-1 Certificates for that Distribution Date, and the denominator of which is the total amount of principal distributed to the Class A-1, A-2, A-SB, D, E, F, G, H and J Certificates and the Class A-3 Exchangeable Certificates, the Class A-4 Exchangeable Certificates, the Class A-S Exchangeable Certificates, the Class B Exchangeable Certificates and the Class C Exchangeable Certificates for that Distribution Date and (c) the difference between (i) the Base Interest Fraction for the Class A-S Certificates and the applicable principal prepayment and (ii) the Base Interest Fraction for the Class A-S-1 Certificates and the applicable principal prepayment, (7) to the Class A-S-X2 Certificates, the product of (a) the Non-Retained Percentage of such Yield Maintenance Charge or Prepayment Premium, (b) a fraction, the numerator of which is equal to the amount of principal distributed to the Class A-S-2 Certificates for that Distribution Date, and the denominator of which is the total amount of principal distributed to the Class A-1, A-2, A-SB, D, E, F, G, H and J Certificates and the Class A-3 Exchangeable Certificates, the Class A-4 Exchangeable Certificates, the Class A-S Exchangeable Certificates, the Class B Exchangeable Certificates and the Class C Exchangeable Certificates for that Distribution Date and (c) the difference between (i) the Base Interest Fraction for the Class A-S Certificates and the applicable principal prepayment and (ii) the Base Interest Fraction for the Class A-S-2 Certificates and the applicable principal prepayment, (8) to the Class B-X1 Certificates, the product of (a) the Non-Retained Percentage of such Yield Maintenance Charge or Prepayment Premium, (b) a fraction, the numerator of which is equal to the amount of principal distributed to the Class B-1 Certificates for that Distribution Date, and the denominator of which is the total amount of principal distributed to the Class A-1, A-2, A-SB, D, E, F, G, H and J Certificates and the Class A-3 Exchangeable Certificates, the Class A-4 Exchangeable Certificates, the Class A-S Exchangeable Certificates, the Class B Exchangeable Certificates and the Class C Exchangeable Certificates for that Distribution Date and (c) the difference between (i) the Base Interest Fraction for the Class B Certificates and the applicable principal prepayment and (ii) the Base Interest Fraction for the Class B-1 Certificates and the applicable principal prepayment, (9) to the Class B-X2 Certificates, the product of (a) the Non-Retained Percentage of such Yield Maintenance Charge or Prepayment Premium, (b) a fraction, the numerator of which is equal to the amount of principal distributed to the Class B-2 Certificates for that Distribution Date, and the denominator of which is the total amount of principal distributed to the Class A-1, A-2, A-SB, D, E, F, G, H and J Certificates and the Class A-3 Exchangeable Certificates, the Class A-4 Exchangeable Certificates, the Class A-S Exchangeable Certificates, the Class B Exchangeable Certificates and the Class C Exchangeable Certificates for that Distribution Date and (c) the difference between (i) the Base Interest Fraction for the Class B Certificates and the applicable principal prepayment and (ii) the Base Interest Fraction for the Class B-2 Certificates and the applicable principal prepayment, (10) to the Class C-X1 Certificates, the product of (a) the Non-Retained Percentage of such Yield Maintenance Charge or Prepayment Premium, (b) a fraction, the numerator of which is equal to the amount of principal distributed to the Class C-1 Certificates for that Distribution Date, and the denominator of which is the total amount of principal distributed to the Class A-1, A-2, A-SB, D, E, F, G, H and J Certificates and the Class A-3 Exchangeable Certificates, the Class A-4 Exchangeable Certificates, the Class A-S Exchangeable Certificates, the Class B Exchangeable Certificates and the Class C Exchangeable Certificates for that Distribution Date and (c) the difference between (i) the Base Interest Fraction for the Class C Certificates and the applicable principal prepayment and (ii) the Base |
THE INFORMATION IN THIS STRUCTURAL AND COLLATERAL TERM SHEET IS NOT COMPLETE AND MAY BE AMENDED PRIOR TO THE TIME OF SALE. THIS TERM SHEET IS NOT AN OFFER TO SELL THESE SECURITIES AND IT IS NOT A SOLICITATION OF AN OFFER TO BUY THESE SECURITIES IN ANY JURISDICTION WHERE THE OFFER OR SALE IS NOT PERMITTED.
25
| BANK 2022-BNK40 | Certain Terms and Conditions |
| | Interest Fraction for the Class C-1 Certificates and the applicable principal prepayment, (11) to the Class C-X2 Certificates, the product of (a) the Non-Retained Percentage of such Yield Maintenance Charge or Prepayment Premium, (b) a fraction, the numerator of which is equal to the amount of principal distributed to the Class C-2 Certificates for that Distribution Date, and the denominator of which is the total amount of principal distributed to the Class A-1, A-2, A-SB, D, E, F, G, H and J Certificates and the Class A-3 Exchangeable Certificates, the Class A-4 Exchangeable Certificates, the Class A-S Exchangeable Certificates, the Class B Exchangeable Certificates and the Class C Exchangeable Certificates for that Distribution Date and (c) the difference between (i) the Base Interest Fraction for the Class C Certificates and the applicable principal prepayment and (ii) the Base Interest Fraction for the Class C-2 Certificates and the applicable principal prepayment, (12) to the Class X-A Certificates, the excess, if any, of (a) the product of (i) the Non-Retained Percentage of such yield maintenance charge or prepayment premium and (ii) a fraction, the numerator of which is equal to the total amount of principal distributed to the Class A-1, A-2 and A-SB Certificates and the Class A-3 Exchangeable Certificates and the Class A-4 Exchangeable Certificates for that Distribution Date, and the denominator of which is the total amount of principal distributed to the Class A-1, A-2, A-SB, D, E, F, G, H and J Certificates and the Class A-3 Exchangeable Certificates, the Class A-4 Exchangeable Certificates, the Class A-S Exchangeable Certificates, the Class B Exchangeable Certificates and the Class C Exchangeable Certificates for that Distribution Date, over (b) the total amount of such yield maintenance charge or prepayment premium distributed to the Class A-1, A-2 and Class A-SB Certificates and the Class A-3 Exchangeable Certificates and the Class A-4 Exchangeable Certificates as described above, and (13) to the Class X-B Certificates, any remaining portion of the Non-Retained Percentage of such yield maintenance charge or prepayment premium not distributed as described above, and (y) to the RR Interest, its Percentage Allocation Entitlement of the yield maintenance charge or prepayment premium. No prepayment premiums or yield maintenance charges will be distributed to the holders of the Class X-D, X-F, X-G, X-HJ, F, G, H, J or R Certificates. For a description of when prepayment premiums and yield maintenance charges are generally required on the mortgage loans, see Annex A-1 to the Preliminary Prospectus. See also “Risk Factors—Risks Relating to the Mortgage Loans—Risks Relating to Enforceability of Yield Maintenance Charges, Prepayment Premiums or Defeasance Provisions” and “Risk Factors—Other Risks Relating to the Certificates—Your Yield May Be Affected by Defaults, Prepayments and Other Factors” in the Preliminary Prospectus. Prepayment premiums and yield maintenance charges will be distributed on each Distribution Date only to the extent they are actually received on the mortgage loans as of the related Determination Date. |
| Realized Losses: | The Certificate Balances of the Class A-1, A-2, A-SB, D, E, F, G, H and J Certificates and the Class A-3, A-4, A-S, B and C trust components will be reduced without distribution on any Distribution Date as a write-off to the extent of the Non-Retained Percentage of any losses realized on the mortgage loans allocated to such Class on such Distribution Date. Such losses will be applied in the following order, in each case until the related Certificate Balance is reduced to zero: first, to the Class J Certificates; second, to the Class H Certificates; third, to the Class G Certificates; fourth, to the Class F Certificates; fifth, to the Class E Certificates; sixth, to the Class D Certificates; seventh, to the Class C trust component; eighth, to the Class B trust component; ninth, to the Class A-S trust component; and, finally, pro rata, to the Class A-1, A-2 and A-SB Certificates and the Class A-3 and A-4 trust components based on their outstanding Certificate Balances. Any portion of such amount applied to the Class A-3, A-4, A-S, B or C trust component will reduce the Certificate Balance or Notional Amount of each Class of Certificates in the related group of Exchangeable Certificates by an amount equal to the product of (x) its Certificate Balance or Notional Amount, divided by the Certificate Balance of such trust component prior to the applicable reduction, and (y) the amount applied to such trust component. The Notional Amount of the Class X-A Certificates will be reduced by the amount of all losses that are allocated to the Class A-1, A-2 or A-SB Certificates or the Class A-3 or A-4 trust components |
THE INFORMATION IN THIS STRUCTURAL AND COLLATERAL TERM SHEET IS NOT COMPLETE AND MAY BE AMENDED PRIOR TO THE TIME OF SALE. THIS TERM SHEET IS NOT AN OFFER TO SELL THESE SECURITIES AND IT IS NOT A SOLICITATION OF AN OFFER TO BUY THESE SECURITIES IN ANY JURISDICTION WHERE THE OFFER OR SALE IS NOT PERMITTED.
26
| BANK 2022-BNK40 | Certain Terms and Conditions |
| | as write-offs in reduction of their Certificate Balances. The Notional Amount of the Class X-B Certificates will be reduced by the amount of all losses that are allocated to the Class A-S, B or C trust components as write-offs in reduction of their Certificate Balances. The Notional Amount of the Class X-D Certificates will be reduced by the amount of all losses that are allocated to the Class D or E Certificates as write-offs in reduction of their Certificate Balances. The Notional Amount of the Class X-F Certificates will be reduced by the amount of all losses that are allocated to the Class F Certificates as write-offs in reduction of their Certificate Balance. The Notional Amount of the Class X-G Certificates will be reduced by the amount of all losses that are allocated to the Class G Certificates as write-offs in reduction of their Certificate Balance. The Notional Amount of the Class X-HJ Certificates will be reduced by the amount of all losses that are allocated to the Class H or J Certificates as write-offs in reduction of their Certificate Balances. |
| | |
| P&I Advances: | Each Master Servicer or, if such Master Servicer fails to do so, the Trustee, will be obligated to advance delinquent debt service payments with respect to the mortgage loans it services (other than balloon payments, excess interest and default interest) and assumed debt service payments on mortgage loans with delinquent balloon payments (excluding any related companion loan), except to the extent any such advance is deemed non-recoverable from collections on the related mortgage loan. In addition, if an Appraisal Reduction Amount exists for a given mortgage loan, the interest portion of any P&I advance for such mortgage loan will be reduced, which will have the effect of reducing the amount of interest available for distribution to the Certificates, which with respect to the Non-Retained Certificates (other than the Class R Certificates) will be applied in reverse alphabetical order of their Class designations (except that interest payments on the Class A-1, A-2, A-SB, A-3, A-3-X1, A-3-X2, A-4, A-4-X1, A-4-X2, X-A, X-B, X-D, X-F, X-G and X-HJ Certificates would be affected on a pari passu basis). |
| | |
| Servicing Advances: | Each Master Servicer or, if such Master Servicer fails to do so, the Trustee, will be obligated to make servicing advances, including the payment of delinquent property taxes, insurance premiums and ground rent, except to the extent that those advances are deemed non-recoverable from collections on the related mortgage loan. The related Master Servicer or the Trustee, as applicable, will have the primary obligation to make any required servicing advances with respect to any serviced whole loan. With respect to any non-serviced whole loan, the master servicer or trustee, as applicable, under the related lead securitization servicing agreement will have the primary obligation to make any required servicing advances with respect to such non-serviced whole loan. |
| | |
Appraisal Reduction Amounts and Collateral
Deficiency Amounts: | An “Appraisal Reduction Amount” generally will be created in the amount, if any, by which the principal balance of a required appraisal loan (which is a mortgage loan (other than a non-serviced mortgage loan) with respect to which certain defaults, modifications or insolvency events have occurred as further described in the Preliminary Prospectus) plus other amounts overdue or advanced in connection with such mortgage loan exceeds 90% of the appraised value of the related mortgaged property (together with any other mortgage loan cross-collateralized with such mortgage loan) plus certain escrows and reserves (including letters of credit) held with respect to the mortgage loan. With respect to any serviced whole loan, any Appraisal Reduction Amount will be allocated first to the related subordinate companion loan, if any, and then, pro rata, to the related mortgage loan and the related pari passu companion loan(s). With respect to any non-serviced mortgage loan, appraisal reduction amounts are expected to be calculated in a similar manner under the related non-serviced pooling and servicing agreement. A mortgage loan will cease to be a required appraisal loan when the same has ceased to be a specially serviced loan (if applicable), has been brought current for at least three consecutive months and no other circumstances exist that would cause such mortgage loan to be a required appraisal loan. A “Collateral Deficiency Amount” will exist with respect to any mortgage loan that is modified into an AB loan structure and remains a corrected mortgage loan and will generally equal the excess of (i) the stated principal balance of such AB modified loan (taking into account the related junior note(s) and any pari passu notes included therein), over (ii) the sum of (in the case of a whole loan, solely to the extent allocable to the subject mortgage loan) (x) the most recent appraised value of the related mortgaged property plus (y) solely to the extent not reflected or taken into account in such appraised value (or in the calculation of any related Appraisal Reduction Amount) and to the extent on deposit with, or otherwise under the control of, the lender as of the date of such determination, any capital or additional collateral contributed by the related borrower at the time the mortgage loan (and as part of the modification thereto) became an AB modified loan plus (z) any other escrows or reserves (in addition to any amounts set forth in the immediately preceding clause (y) and solely to the extent not reflected or taken into account in the calculation of any related Appraisal Reduction Amount) held by the lender with respect to the mortgage loan as of the date of such determination. A “Cumulative Appraisal Reduction Amount” with respect to any mortgage loan will be the sum of any Appraisal Reduction Amount and any Collateral Deficiency Amount. |
THE INFORMATION IN THIS STRUCTURAL AND COLLATERAL TERM SHEET IS NOT COMPLETE AND MAY BE AMENDED PRIOR TO THE TIME OF SALE. THIS TERM SHEET IS NOT AN OFFER TO SELL THESE SECURITIES AND IT IS NOT A SOLICITATION OF AN OFFER TO BUY THESE SECURITIES IN ANY JURISDICTION WHERE THE OFFER OR SALE IS NOT PERMITTED.
27
| BANK 2022-BNK40 | Certain Terms and Conditions |
| | Appraisal Reduction Amounts will affect the amount of debt service advances in respect of the related mortgage loan. Additionally, Cumulative Appraisal Reduction Amounts will be taken into account in the determination of the identity of the Class whose majority constitutes the “majority controlling class certificateholder” and is entitled to appoint the directing certificateholder. Neither (i) a Payment Accommodation with respect to any mortgage loan or serviced whole loan nor (ii) any default or delinquency that would have existed but for such Payment Accommodation will constitute an appraisal reduction event, for so long as the related borrower is complying with the terms of such Payment Accommodation. Additionally, a Government-Sponsored Relief Modification will not constitute an appraisal reduction event. A “Payment Accommodation” for any mortgage loan or serviced whole loan means the entering into of any temporary forbearance agreement as a result of the COVID-19 emergency relating to payment obligations or operating covenants under the related mortgage loan documents or the use of funds on deposit in any reserve account or escrow account for any purpose other than the explicit purpose described in the related mortgage loan documents, that in each case (i) defers no greater than 3 monthly debt service payments (but no greater than 9 monthly debt service payments in the aggregate with any other Payment Accommodations) and (ii) requires full repayment of deferred payments, reserves and escrows by the date that is 24 months following the date of the first Payment Accommodation for such mortgage loan or serviced whole loan. For the avoidance of doubt, a Payment Accommodation may only be entered into by the applicable special servicer on behalf of the issuing entity. A “Government-Sponsored Relief Modification” for any mortgage loan or serviced whole loan means any modification, waiver or amendment of the related mortgage loan or serviced whole loan that is necessary to facilitate a borrower’s ability to take advantage of any government-sponsored COVID-specific relief or stimulus program applicable to the mortgage loan or serviced whole loan, related mortgaged property or related borrower; provided that (A) any such action would not constitute a “significant modification” of such mortgage loan or companion loan pursuant to Treasury Regulations Section 1.860G-2(b), and would not otherwise cause either Trust REMIC to fail to qualify as a REMIC for federal income tax purposes (as evidenced by an opinion of counsel (at the issuing entity’s expense to the extent not reimbursed or paid by the related borrower), to the extent requesting such opinion is consistent with the servicing standard), (B) agreeing to such action would be consistent with the servicing standard, and (C) agreeing to such action would not violate the terms, provisions or limitations of the Pooling and Servicing Agreement or any intercreditor agreement. For the avoidance of doubt, a Government-Sponsored Relief Modification may only be entered into by the applicable special servicer on behalf of the issuing entity. |
Clean-Up Call and Exchange Termination: | On each Distribution Date occurring after the aggregate unpaid principal balance of the pool of mortgage loans is less than 1.0% of the principal balance of the mortgage loans as of the cut-off date, certain specified persons will have the option to purchase all of the remaining mortgage loans (and the trust’s interest in all property acquired through exercise of remedies in respect of any mortgage loan) at the price specified in the Preliminary Prospectus. Exercise of the option will terminate the trust and retire the then-outstanding Certificates. If the aggregate Certificate Balances of each of the Class A-1, A-2, A-SB, D and E Certificates and the Class A-3, A-4, A-S, B and C trust components have been reduced to zero, the trust may also be terminated in connection with an exchange of all the then-outstanding Certificates (other than the Class R Certificates and the RR Interest) for the mortgage loans and REO properties then remaining in the issuing entity, subject to payment of a price specified in the Preliminary Prospectus, but all of the holders of those outstanding Classes of Certificates (other than the Class R Certificates and the RR Interest) would have to voluntarily participate in the exchange. |
| Liquidation Loan Waterfall: | Following the liquidation of any mortgage loan or mortgaged property, the net liquidation proceeds generally will be applied (after reimbursement of advances and certain trust fund expenses), first, as a recovery of accrued interest, other than delinquent interest that was not advanced as a result of Appraisal Reduction Amounts, second, as a recovery of principal until all principal has been recovered, and then as a recovery of delinquent interest that was not advanced as a result of Appraisal Reduction Amounts. Please see “Description of the Certificates—Distributions—Application Priority of Mortgage Loan Collections or Whole Loan Collections” in the Preliminary Prospectus. |
| | |
| Control Eligible Certificates: | The Class F, G, H and J Certificates. |
| | |
Directing Certificateholder/
Controlling Class: | A directing certificateholder may be appointed by the “majority controlling class certificateholder”, which will be the holder(s) of a majority of the Controlling Class. The “Controlling Class” will be, as of any time of determination, the most subordinate Class of Control Eligible Certificates then-outstanding that has an aggregate Certificate Balance (as notionally reduced by any Cumulative Appraisal Reduction Amounts allocable to such Class) at |
THE INFORMATION IN THIS STRUCTURAL AND COLLATERAL TERM SHEET IS NOT COMPLETE AND MAY BE AMENDED PRIOR TO THE TIME OF SALE. THIS TERM SHEET IS NOT AN OFFER TO SELL THESE SECURITIES AND IT IS NOT A SOLICITATION OF AN OFFER TO BUY THESE SECURITIES IN ANY JURISDICTION WHERE THE OFFER OR SALE IS NOT PERMITTED.
28
| BANK 2022-BNK40 | Certain Terms and Conditions |
| | least equal to 25% of the initial Certificate Balance of that Class; provided, however, that if at any time the Certificate Balances of the Certificates other than the Control Eligible Certificates and the RR Interest have been reduced to zero as a result of principal payments on the Mortgage Loans, then the Controlling Class will be the most subordinate Class of Control Eligible Certificates that has a Certificate Balance greater than zero without regard to any Cumulative Appraisal Reduction Amounts. The Controlling Class as of the Closing Date will be the Class J Certificates. |
| | |
Control and Consultation/
Replacement of Special
Servicer by Directing
Certificateholder: | The rights of various parties to replace the Special Servicer and approve or consult with respect to major actions of the Special Servicer will vary according to defined periods. A “Control Termination Event” will occur when the Class F Certificates have a Certificate Balance (taking into account the application of any Cumulative Appraisal Reduction Amounts to notionally reduce the Certificate Balance of such Class) of less than 25% of the initial Certificate Balance of that Class; provided, that a Control Termination Event will not be deemed continuing in the event that the Certificate Balances of the Certificates other than the Control Eligible Certificates and the RR Interest have been reduced to zero as a result of principal payments on the Mortgage Loans. A “Consultation Termination Event” will occur when there is no Class of Control Eligible Certificates that has a then-outstanding Certificate Balance at least equal to 25% of the initial Certificate Balance of that Class, in each case, without regard to the application of any Cumulative Appraisal Reduction Amounts; provided, however, that a Consultation Termination Event will not be deemed continuing in the event that the Certificate Balances of the Certificates other than the Control Eligible Certificates and the RR Interest have been reduced to zero as a result of principal payments on the Mortgage Loans. If no Control Termination Event has occurred and is continuing, except with respect to the Excluded Loans (as defined below) with respect to the directing certificateholder (i) the directing certificateholder will be entitled to grant or withhold approval of asset status reports prepared, and material servicing actions proposed, by the Special Servicer, and (ii) the directing certificateholder will be entitled to terminate and replace the Special Servicer with or without cause, and appoint itself or another person as the successor special servicer. It will be a condition to such appointment that Fitch, KBRA and S&P (and any rating agency rating any securities backed by any pari passu companion loan(s) serviced under this transaction) confirm that the appointment would not result in a qualification, downgrade or withdrawal of any of their then-current ratings of Certificates (and any certificates backed by any pari passu companion loan(s) serviced under this transaction). If a Control Termination Event has occurred and is continuing but no Consultation Termination Event has occurred and is continuing, the Special Servicer will be required to consult with the directing certificateholder (other than with respect to Excluded Loans as to such party) and the Operating Advisor in connection with asset status reports and material special servicing actions. If a Consultation Termination Event has occurred and is continuing, the Special Servicer must seek to consult with the Operating Advisor in connection with asset status reports and material special servicing actions, and, in general, no directing certificateholder will be recognized or have any right to terminate the Special Servicer or approve, direct or consult with respect to servicing matters. With respect to each serviced whole loan, the rights of the directing certificateholder described above will be subject to the consultation rights of the holders of the related pari passu companion loans. Those consultation rights will generally extend to asset status reports and material special servicing actions involving the related whole loan, will be as set forth in the related intercreditor agreement, and will be in addition to the rights of the directing certificateholder in this transaction described above. With respect to the non-serviced whole loan, the applicable servicing agreement for the related controlling pari passu companion loan(s) generally grants (or will grant) the directing certificateholder under the related securitization control rights that may include the right to approve or disapprove various material servicing actions involving the related whole loan. The directing certificateholder for this securitization (so long as no Consultation Termination Event has occurred and is occurring) generally will nonetheless have the right to be consulted on a non-binding basis with respect to such actions. For purposes of the servicing of any such whole loan contemplated by this paragraph, the occurrence and continuance of a Control Termination Event or Consultation Termination Event under this securitization will not limit the control or other rights of the directing certificateholder (or equivalent) under the securitization of the related controlling pari passu companion loan(s). The control rights and consent and consultation rights described in the preceding paragraphs are subject to various limitations, conditions and exceptions as described in the Preliminary Prospectus. |
THE INFORMATION IN THIS STRUCTURAL AND COLLATERAL TERM SHEET IS NOT COMPLETE AND MAY BE AMENDED PRIOR TO THE TIME OF SALE. THIS TERM SHEET IS NOT AN OFFER TO SELL THESE SECURITIES AND IT IS NOT A SOLICITATION OF AN OFFER TO BUY THESE SECURITIES IN ANY JURISDICTION WHERE THE OFFER OR SALE IS NOT PERMITTED.
29
| BANK 2022-BNK40 | Certain Terms and Conditions |
| | Notwithstanding any contrary description set forth above, in the event that, with respect to any mortgage loan, the majority controlling class certificateholder or the directing certificateholder is a Borrower Party, the majority controlling class certificateholder and the directing certificateholder will have no right to receive asset status reports or such other information as may be specified in the BANK 2022-BNK40 pooling and servicing agreement, to grant or withhold approval of, or consult with respect to, asset status reports prepared, and material servicing actions proposed, by the Special Servicer, with respect to such mortgage loan, and such mortgage loan will be referred to as an “Excluded Loan” as to such party. In addition, notwithstanding any contrary description set forth above, in the event that, with respect to any mortgage loan, a controlling class certificateholder is a Borrower Party, such controlling class certificateholder will have no right to receive asset status reports or such other information as may be specified in the BANK 2022-BNK40 pooling and servicing agreement with respect to such mortgage loan. “Borrower Party” means a borrower, a mortgagor or a manager of a mortgaged property, an Accelerated Mezzanine Loan Lender, or any Borrower Party Affiliate. “Accelerated Mezzanine Loan Lender” means a mezzanine lender under a mezzanine loan that has been accelerated or as to which foreclosure or enforcement proceedings have been commenced against the equity collateral pledged to secure such mezzanine loan. “Borrower Party Affiliate” means, with respect to a borrower, a mortgagor, a manager of a Mortgaged Property or an Accelerated Mezzanine Loan Lender, (x) any other person controlling or controlled by or under common control with such borrower, mortgagor, manager or Accelerated Mezzanine Loan Lender, as applicable, or (y) any other person owning, directly or indirectly, 25% or more of the beneficial interests in such borrower, mortgagor, manager or Accelerated Mezzanine Loan Lender. With respect to a mortgage loan secured by a residential cooperative property, a person will not be considered a “Borrower Party” solely by reason of such person holding one or more cooperative unit loans that are secured by direct equity interests in the related borrower or owning one or more residential cooperative units comprising the related mortgaged property as a result of any foreclosure, transfer in lieu of foreclosure or other exercise of remedies with respect to any such unit loan(s). |
Risk Retention Consultation
Party: | A risk retention consultation party may be appointed by the holder or holders of more than 50% of the RR Interest, by Certificate Balance. The majority RR Interest holder will have a continuing right to appoint, remove or replace the risk retention consultation party in its sole discretion. This right may be exercised at any time and from time to time. Except with respect to an Excluded Loan as to such party, the risk retention consultation party will be entitled to consult with each Special Servicer, upon request of the risk retention consultation party, with respect to certain material servicing actions proposed by such Special Servicer. |
| | |
Replacement of Special
Servicer by General Vote of
Certificateholders: | If a Control Termination Event has occurred and is continuing, either Special Servicer may be removed and replaced without cause upon the affirmative direction of certificate owners holding not less than 66-2/3% of a certificateholder quorum, following a proposal from certificate owners holding not less than 25% of the appraisal-reduced voting rights of all Principal Balance Certificates other than the RR Interest. The certificateholders who initiate a vote on a termination and replacement of a Special Servicer without cause must cause Fitch, KBRA and S&P to confirm the then-current ratings of the Certificates (or decline to review the matter) and cause the payment of the fees and expenses incurred in the replacement. If no Control Termination Event has occurred and is continuing, either Special Servicer may be replaced by the directing certificateholder, subject to Fitch, KBRA and S&P (and any rating agency rating any securities backed by any pari passu companion loan(s) serviced under this transaction) confirming the then-current ratings of the Certificates (and any certificates backed by any pari passu companion loans serviced under this transaction) or declining to review the matter. |
| | |
| Excluded Special Servicer: | In the event that, with respect to any mortgage loan, a Special Servicer is a Borrower Party, such Special Servicer will be required to resign as special servicer of such mortgage loan (referred to as an “excluded special servicer loan”). If no Control Termination Event has occurred and is continuing, the directing certificateholder will be entitled to appoint (and may replace with or without cause) a separate special servicer that is not a Borrower Party (referred to as an “excluded special servicer”) with respect to such excluded special servicer loan unless such excluded special servicer loan is also an excluded loan. Otherwise, upon resignation of the applicable Special Servicer with respect to an excluded special servicer loan, such resigning Special Servicer will be required to use reasonable efforts to appoint the excluded special servicer. |
| | |
| Appraisal Remedy: | If the Class of Certificates comprising the Controlling Class loses its status as Controlling Class because of the application of an Appraisal Reduction Amount or Collateral Deficiency Amount, the holders of a majority of the voting rights of such Class may require the applicable Special Servicer to order a second appraisal for any mortgage loan in respect of which an Appraisal Reduction Amount or Collateral Deficiency Amount has been applied. Such Special Servicer must thereafter determine whether, based on its assessment of such second appraisal, any |
THE INFORMATION IN THIS STRUCTURAL AND COLLATERAL TERM SHEET IS NOT COMPLETE AND MAY BE AMENDED PRIOR TO THE TIME OF SALE. THIS TERM SHEET IS NOT AN OFFER TO SELL THESE SECURITIES AND IT IS NOT A SOLICITATION OF AN OFFER TO BUY THESE SECURITIES IN ANY JURISDICTION WHERE THE OFFER OR SALE IS NOT PERMITTED.
30
| BANK 2022-BNK40 | Certain Terms and Conditions |
| | recalculation of the Appraisal Reduction Amount or Collateral Deficiency Amount is warranted, and if so warranted, the Special Servicer will recalculate such Appraisal Reduction Amount or Collateral Deficiency Amount. Such Class will not be able to exercise any direction, control, consent and/or similar rights of the Controlling Class unless and until reinstated as the Controlling Class through such determination; and pending such determination, the rights of the Controlling Class will be exercised by the Control Eligible Certificates, if any, that would be the Controlling Class taking into account the subject appraisal reduction amount. |
| | |
| Sale of Defaulted Assets: | There will be no “fair value” purchase option. Instead, the BANK 2022-BNK40 pooling and servicing agreement will authorize the Special Servicer to sell defaulted mortgage loans serviced by such Special Servicer to the highest bidder in a manner generally similar to sales of REO properties. The sale of a defaulted loan (other than a non-serviced whole loan) for less than par plus accrued interest and certain other fees and expenses owed on the loan will be subject to consent or consultation rights of the directing certificateholder and/or Operating Advisor, as described in the Preliminary Prospectus. Generally speaking, the holder of a pari passu companion loan will have consent and/or consultation rights, as described in the Preliminary Prospectus. If the subject whole loan includes one or more subordinate companion loans, those subordinate companion loans may be included in such sale as well. With respect to any serviced whole loan, if such whole loan becomes a defaulted loan under the BANK 2022-BNK40 pooling and servicing agreement, the Special Servicer will generally be required to sell both the mortgage loan and the related pari passu companion loan(s) as a single whole loan. If the subject whole loan includes one or more subordinate companion loans, those subordinate companion loans may be included in such sale as well. With respect to the non-serviced whole loan, the applicable servicing agreement governing the servicing of such whole loan generally will provide that, if the related pari passu companion loan(s) serviced under such agreement become a defaulted loan under such servicing agreement, then the related special servicer may offer to sell to any person (or may offer to purchase) for cash such whole loan during such time as such applicable pari passu companion loan(s) constitutes a defaulted loan under such servicing agreement. Generally speaking, in connection with any such sale, the related special servicer is required to sell both the mortgage loan and the related pari passu companion loan(s) as a whole loan. The directing certificateholder for this securitization generally will have consent and/or consultation rights as the holder of an interest in the related mortgage loan, as described in the Preliminary Prospectus. If the subject whole loan includes one or more subordinate companion loans, those subordinate companion loans may be included in such sale as well. The procedures for the sale of any whole loan that becomes a defaulted whole loan, and any associated consultation rights, are subject to various limitations, conditions and exceptions as described in the Preliminary Prospectus. |
| “As-Is” Appraisals: | Appraisals must be conducted on an “as-is” basis, and must be no more than 12 months old, for purposes of determining Appraisal Reduction Amounts and market value in connection with REO sales. Required appraisals may consist of updates of prior appraisals. Internal valuations by the applicable Special Servicer are permitted if the principal balance of a mortgage loan is less than $2,000,000. |
| | |
| Operating Advisor: | The Operating Advisor will perform certain review duties if a Control Termination Event has occurred and is continuing, which will generally include a limited annual review of, and the delivery of a report regarding, certain actions of each Special Servicer with respect to the resolution and/or liquidation of specially serviced loans to the Certificate Administrator. The review and report generally will be based on any asset status reports and additional information delivered to the Operating Advisor by each Special Servicer. In addition, if a Control Termination Event has occurred and is continuing, each Special Servicer must seek to consult with the Operating Advisor (in addition to the directing certificateholder if no Consultation Termination Event has occurred and is continuing) in connection with material special servicing actions with respect to specially serviced loans serviced by such Special Servicer. Furthermore, under certain circumstances, but only if a Consultation Termination Event has occurred and is continuing, the Operating Advisor may recommend the replacement of a Special Servicer, in which case the Certificate Administrator will deliver notice of such recommendation to the certificateholders, and certificateholders with specified percentages of the voting rights may direct the replacement of such Special Servicer at their expense. If a Consultation Termination Event has occurred and is continuing, the Operating Advisor may be removed and replaced without cause upon the affirmative direction of certificate owners holding at least 75% of the appraisal-reduced voting rights of all Certificates (other than the RR Interest), following a proposal from certificate owners holding not less than 25% of the appraisal- |
THE INFORMATION IN THIS STRUCTURAL AND COLLATERAL TERM SHEET IS NOT COMPLETE AND MAY BE AMENDED PRIOR TO THE TIME OF SALE. THIS TERM SHEET IS NOT AN OFFER TO SELL THESE SECURITIES AND IT IS NOT A SOLICITATION OF AN OFFER TO BUY THESE SECURITIES IN ANY JURISDICTION WHERE THE OFFER OR SALE IS NOT PERMITTED.
31
| BANK 2022-BNK40 | Certain Terms and Conditions |
| | reduced voting rights of all Certificates (other than the RR Interest). The certificateholders who initiate a vote on a termination and replacement of the Operating Advisor without cause must cause Fitch, KBRA and S&P to confirm the then-current ratings of the Certificates (or decline to review the matter) and cause the payment of the fees and expenses incurred in the replacement. The Operating Advisor generally may be discharged from its duties if and when the Class A-1, A-2, A-SB, D and E Certificates and the Class A-3, A-4, A-S, B and C trust components are retired. |
| | |
Asset Representations
Reviewer: | The Asset Representations Reviewer will be required to review certain delinquent mortgage loans after a specified delinquency threshold has been exceeded (an “Asset Review Trigger”) and the required percentage of certificateholders vote to direct a review of such delinquent loans. An Asset Review Trigger will occur when either (1) mortgage loans with an aggregate outstanding principal balance of 25.0% or more of the aggregate outstanding principal balance of all of the mortgage loans (including any REO loans (or a portion of any REO loan in the case of a whole loan)) held by the issuing entity as of the end of the applicable collection period are delinquent loans or (2)(A) prior to and including the second anniversary of the Closing Date, at least 10 mortgage loans are delinquent loans as of the end of the applicable collection period and the outstanding principal balance of such delinquent loans in the aggregate constitutes at least 15.0% of the aggregate outstanding principal balance of all of the mortgage loans (including any REO loans (or a portion of any REO loan in the case of a whole loan)) held by the issuing entity as of the end of the applicable collection period, or (B) after the second anniversary of the Closing Date, at least 15 mortgage loans are delinquent loans as of the end of the applicable collection period and the outstanding principal balance of such delinquent loans in the aggregate constitutes at least 20.0% of the aggregate outstanding principal balance of all of the mortgage loans (including any REO loans (or a portion of any REO loan in the case of a whole loan)) held by the issuing entity as of the end of the applicable collection period. See “Pooling and Servicing Agreement—The Asset Representations Reviewer—Asset Review” in the Preliminary Prospectus. The Asset Representations Reviewer may be terminated and replaced without cause. Upon (i) the written direction of certificateholders evidencing not less than 25% of the voting rights (without regard to the application of any Cumulative Appraisal Reduction Amounts) requesting a vote to terminate and replace the Asset Representations Reviewer with a proposed successor Asset Representations Reviewer that is an eligible asset representations reviewer, and (ii) payment by such holders to the certificate administrator of the reasonable fees and expenses to be incurred by the certificate administrator in connection with administering such vote, the certificate administrator will promptly provide notice to all certificateholders and the Asset Representations Reviewer of such request by posting such notice on its internet website, and by mailing such notice to all certificateholders and the Asset Representations Reviewer. Upon the written direction of certificateholders evidencing at least 75% of a certificateholder quorum (without regard to the application of any Cumulative Appraisal Reduction Amounts), the Trustee will terminate all of the rights and obligations of the Asset Representations Reviewer under the BANK 2022-BNK40 pooling and servicing agreement by written notice to the Asset Representations Reviewer, and the proposed successor Asset Representations Reviewer will be appointed. See “Pooling and Servicing Agreement—The Asset Representations Reviewer” in the Preliminary Prospectus. |
Dispute Resolution
Provisions: | The mortgage loan sellers will be subject to the dispute resolution provisions set forth in the BANK 2022-BNK40 pooling and servicing agreement to the extent those provisions are triggered with respect to any mortgage loan sold to the depositor by a mortgage loan seller and such mortgage loan seller will be obligated under the related mortgage loan purchase agreement to comply with all applicable provisions and to take part in any mediation or arbitration proceedings that may result. Generally, in the event that a Repurchase Request (as defined in the Preliminary Prospectus) is not “Resolved” (as defined below) within 180 days after the related mortgage loan seller receives such Repurchase Request, then the enforcing servicer will be required to send a notice to the “Initial Requesting Certificateholder” (if any) and the Certificate Administrator indicating the enforcing servicer’s intended course of action with respect to the Repurchase Request. If (a) the enforcing servicer’s intended course of action with respect to the Repurchase Request does not involve pursuing further action to exercise rights against the related mortgage loan seller with respect to the Repurchase Request and the Initial Requesting Certificateholder, if any, or any other certificateholder or certificate owner wishes to exercise its right to refer the matter to mediation (including non-binding arbitration) or arbitration, or (b) the enforcing servicer’s intended course of action is to pursue further action to exercise rights against the related mortgage loan seller with respect to the Repurchase Request but the Initial Requesting Certificateholder, if any, or any other certificateholder or certificate owner does not agree with the dispute resolution method selected by the enforcing servicer, then the Initial Requesting Certificateholder, if any, or such other certificateholder or certificate owner may deliver a written notice to the applicable Special Servicer indicating its intent to exercise its right to refer the matter to either mediation or arbitration. |
THE INFORMATION IN THIS STRUCTURAL AND COLLATERAL TERM SHEET IS NOT COMPLETE AND MAY BE AMENDED PRIOR TO THE TIME OF SALE. THIS TERM SHEET IS NOT AN OFFER TO SELL THESE SECURITIES AND IT IS NOT A SOLICITATION OF AN OFFER TO BUY THESE SECURITIES IN ANY JURISDICTION WHERE THE OFFER OR SALE IS NOT PERMITTED.
32
| BANK 2022-BNK40 | Certain Terms and Conditions |
| | “Resolved” means, with respect to a Repurchase Request, (i) that the related Material Defect has been cured, (ii) the related mortgage loan has been repurchased in accordance with the related mortgage loan purchase agreement, (iii) a mortgage loan has been substituted for the related mortgage loan in accordance with the related mortgage loan purchase agreement, (iv) the applicable mortgage loan seller has made a Loss of Value Payment (as defined in the Preliminary Prospectus), (v) a contractually binding agreement is entered into between the enforcing servicer, on behalf of the issuing entity, and the related mortgage loan seller that settles the related mortgage loan seller’s obligations under the related mortgage loan purchase agreement, or (vi) the related mortgage loan is no longer property of the issuing entity as a result of a sale or other disposition in accordance with the BANK 2022-BNK40 pooling and servicing agreement. See “Pooling and Servicing Agreement—Dispute Resolution Provisions” in the Preliminary Prospectus. |
| | |
| Investor Communications: | The certificate administrator is required to include on any Form 10–D any request received from a certificateholder to communicate with other certificateholders related to certificateholders exercising their rights under the terms of the BANK 2022-BNK40 pooling and servicing agreement. Any certificateholder wishing to communicate with other certificateholders regarding the exercise of its rights under the terms of the BANK 2022-BNK40 pooling and servicing agreement will be able to deliver a written request signed by an authorized representative of the requesting investor to the certificate administrator. |
| | |
| Certain Fee Offsets: | If a workout fee is earned by a Special Servicer following a loan default with respect to any mortgage loan that it services, then certain limitations will apply based on modification fees paid by the borrower. The modification fee generally must not exceed 1% of the principal balance of the loan as modified in any 12-month period. In addition, if the loan re-defaults, any subsequent workout fee on that loan must be reduced by a portion of the modification fees paid by the borrower in the previous 12 months. Likewise, liquidation fees collected in connection with a liquidation or partial liquidation of a mortgage loan must be reduced by a portion of the modification fees paid by the borrower in the previous 12 months. |
| | |
| Deal Website: | The Certificate Administrator will be required to maintain a deal website, which will include, among other items: (a) summaries of asset status reports prepared by each Special Servicer, (b) inspection reports, (c) appraisals, (d) various “special notices” described in the Preliminary Prospectus, (e) the “Investor Q&A Forum”, (f) a voluntary “Investor Registry” and (g) the “Risk Retention Special Notices” tab. Investors may access the deal website following execution of a certification and confidentiality agreement. |
| | |
Initial Majority Controlling
Class Certificateholder: | It is expected that Ellington Management Group, LLC or its affiliate will be the initial majority controlling class certificateholder. |
| | |
| Whole Loans: | Each of the mortgaged properties identified above under “V. Characteristics of the Mortgage Pool—B. Summary of the Whole Loans” secures both a mortgage loan to be included in the trust fund and one or more other mortgage loans that will not be included in the trust fund, each of which will be pari passu or subordinate in right of payment with the mortgage loan included in the trust fund. We refer to each such group of mortgage loans as a “whole loan”. Such “—Summary of the Whole Loans” section includes further information regarding the various notes in each whole loan, the holders of such notes, the lead servicing agreement for each such whole loan, and the applicable master servicer and applicable special servicer under such lead servicing agreement. |
THE INFORMATION IN THIS STRUCTURAL AND COLLATERAL TERM SHEET IS NOT COMPLETE AND MAY BE AMENDED PRIOR TO THE TIME OF SALE. THIS TERM SHEET IS NOT AN OFFER TO SELL THESE SECURITIES AND IT IS NOT A SOLICITATION OF AN OFFER TO BUY THESE SECURITIES IN ANY JURISDICTION WHERE THE OFFER OR SALE IS NOT PERMITTED.
33
| Office – CBD | Loan #1 | Cut-off Date Balance: | | $110,000,000 |
| 601 Lexington Avenue | 601 Lexington Avenue | Cut-off Date LTV: | | 42.5% |
| New York, NY 10022 | | U/W NCF DSCR: | | 4.50x |
| | | U/W NOI Debt Yield: | | 13.2% |
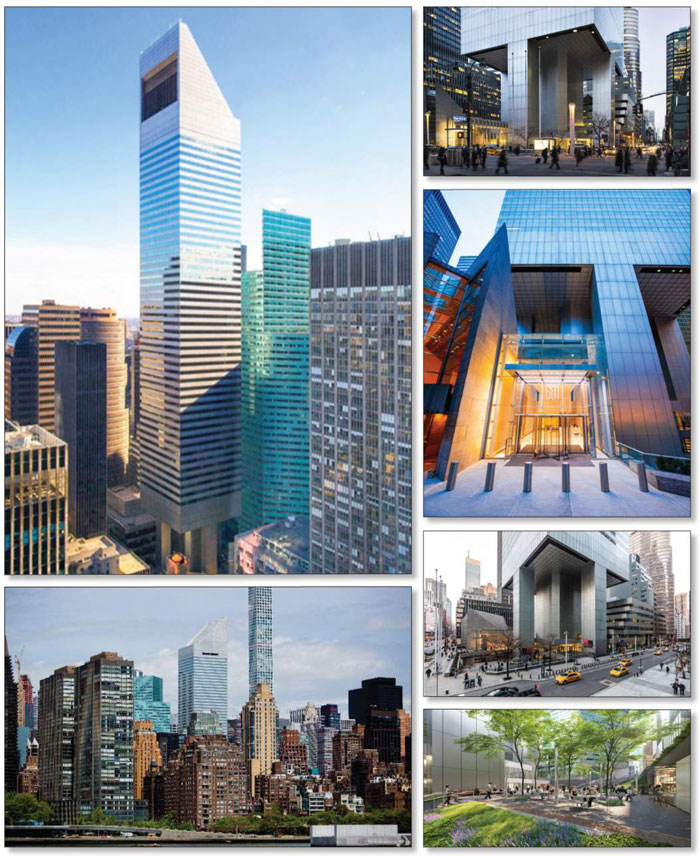
THE INFORMATION IN THIS STRUCTURAL AND COLLATERAL TERM SHEET IS NOT COMPLETE AND MAY BE AMENDED PRIOR TO THE TIME OF SALE. THIS TERM SHEET IS NOT AN OFFER TO SELL THESE SECURITIES AND IT IS NOT A SOLICITATION OF AN OFFER TO BUY THESE SECURITIES IN ANY JURISDICTION WHERE THE OFFER OR SALE IS NOT PERMITTED.
34
| Office – CBD | Loan #1 | Cut-off Date Balance: | | $110,000,000 |
| 601 Lexington Avenue | 601 Lexington Avenue | Cut-off Date LTV: | | 42.5% |
| New York, NY 10022 | | U/W NCF DSCR: | | 4.50x |
| | | U/W NOI Debt Yield: | | 13.2% |
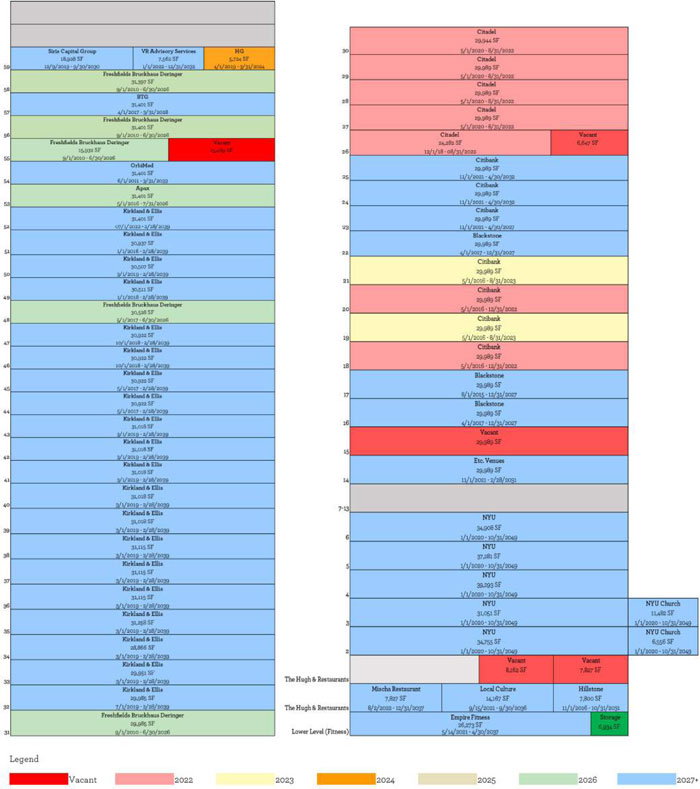
THE INFORMATION IN THIS STRUCTURAL AND COLLATERAL TERM SHEET IS NOT COMPLETE AND MAY BE AMENDED PRIOR TO THE TIME OF SALE. THIS TERM SHEET IS NOT AN OFFER TO SELL THESE SECURITIES AND IT IS NOT A SOLICITATION OF AN OFFER TO BUY THESE SECURITIES IN ANY JURISDICTION WHERE THE OFFER OR SALE IS NOT PERMITTED.
35
| Office – CBD | Loan #1 | Cut-off Date Balance: | | $110,000,000 |
| 601 Lexington Avenue | 601 Lexington Avenue | Cut-off Date LTV: | | 42.5% |
| New York, NY 10022 | | U/W NCF DSCR: | | 4.50x |
| | | U/W NOI Debt Yield: | | 13.2% |
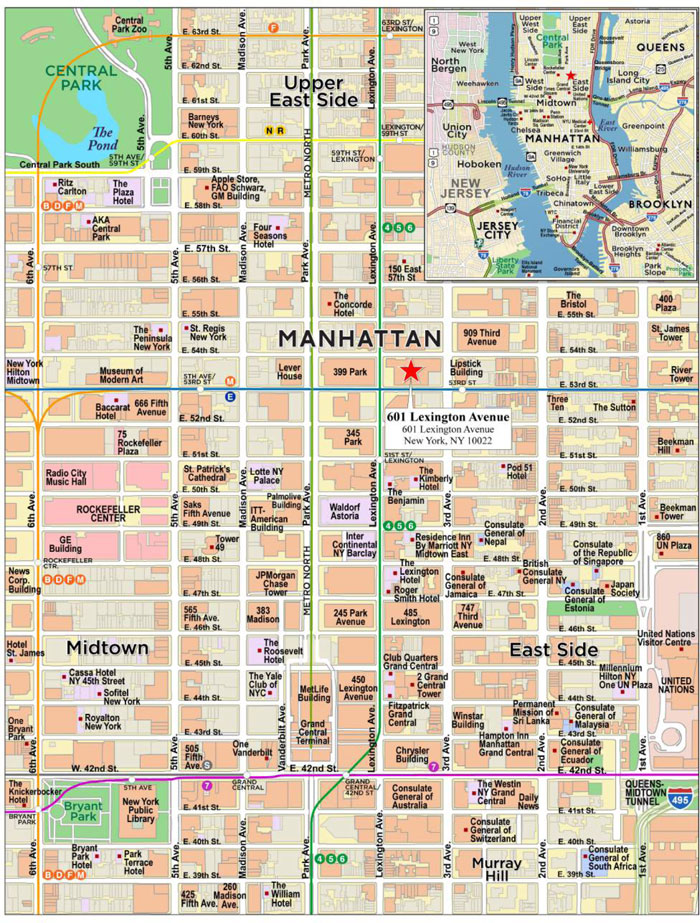
THE INFORMATION IN THIS STRUCTURAL AND COLLATERAL TERM SHEET IS NOT COMPLETE AND MAY BE AMENDED PRIOR TO THE TIME OF SALE. THIS TERM SHEET IS NOT AN OFFER TO SELL THESE SECURITIES AND IT IS NOT A SOLICITATION OF AN OFFER TO BUY THESE SECURITIES IN ANY JURISDICTION WHERE THE OFFER OR SALE IS NOT PERMITTED.
36
| No. 1 – 601 Lexington Avenue |
| |
| Mortgage Loan Information | | Mortgaged Property Information |
| Mortgage Loan Sellers: | Wells Fargo Bank, National Association and Morgan Stanley Mortgage Capital Holdings LLC | | Single Asset/Portfolio: | Single Asset |
Credit Assessment (Fitch/KBRA/S&P): | BBB-sf/BBB(sf)/NR | | Property Type – Subtype: | Office – CBD |
| Original Principal Balance(1): | $110,000,000 | | Location: | New York, NY |
| Cut-off Date Balance(1): | $110,000,000 | | Size: | 1,675,659 SF |
| % of Initial Pool Balance: | 9.4% | | Cut-off Date Balance Per SF(1): | $431.65 |
| Loan Purpose: | Refinance | | Maturity Date Balance Per SF(1): | $431.65 |
| Borrower Sponsor: | BP/CGCenter MM LLC | | Year Built/Renovated: | 1977/2021 |
| Guarantor(2): | BP/CGCenter I LLC and BP/CGCenter II LLC | | Title Vesting: | Fee/Leasehold |
| Mortgage Rate: | 2.79196% | | Property Manager: | Boston Properties Limited Partnership (an affiliate of the borrowers) |
| Note Date: | December 10, 2021 | | Current Occupancy (As of): | 96.3% (11/1/2021) |
| Seasoning: | 2 months | | 9/30/2021 TTM Occupancy: | 96.3% |
| Maturity Date: | January 9, 2032 | | YE 2020 Occupancy: | 97.6% |
| IO Period: | 120 months | | YE 2019 Occupancy: | 100.0% |
| Loan Term (Original): | 120 months | | YE 2018 Occupancy: | 99.3% |
| Amortization Term (Original): | NAP | | As-Is Appraised Value: | $1,700,000,000 |
| Loan Amortization Type: | Interest Only | | As-Is Appraised Value Per SF: | $1,014.53 |
| Call Protection(3): | L(26),D(87),O(7) | | As-Is Appraisal Valuation Date: | October 1, 2021 |
| Lockbox Type: | Hard/Springing Cash Management | | Underwriting and Financial Information(8) |
| Additional Debt: | Yes | | TTM NOI (9/30/2021): | $89,547,809 |
| Additional Debt Type (Balance)(1)(4): | Pari Passu ($613,300,000); Subordinate ($276,700,000) | | YE 2020 NOI: | $88,939,219 |
| | | | YE 2019 NOI: | $82,516,612 |
| | | YE 2018 NOI: | $87,124,160 |
| | | | U/W Revenues: | $159,706,334 |
| Escrows and Reserves(5) | | U/W Expenses: | $64,433,228 |
| | Initial | Monthly | Cap | | U/W NOI: | $95,273,106 |
| Taxes | $0 | Springing | NAP | | U/W NCF: | $92,110,483 |
| Insurance | $0 | Springing | NAP | | U/W DSCR based on NOI/NCF(1): | 4.65x / 4.50x |
| Replacement Reserve | $0 | Springing | $837,829 | | U/W Debt Yield based on NOI/NCF(1): | 13.2% / 12.7% |
| TI/LC Reserve | $0 | Springing | $10,053,948 | | U/W Debt Yield at Maturity based on NOI/NCF(1): | 13.2% / 12.7% |
| Tenant Specific TI/LC Reserve | (6) | $0 | NAP | | Cut-off Date LTV Ratio(1): | 42.5% |
| Free Rent Reserve | (7) | $0 | NAP | | LTV Ratio at Maturity(1)––: | 42.5% |
| | | | | | | | | |
| Sources and Uses |
| Sources | | | | | Uses | | | |
| Whole loan amount | $1,000,000,000 | | 100.0% | | Loan payoff | $618,492,902 | | 61.8% |
| | | | | | Return of Equity | $368,350,972 | | 36.8% |
| | | | | | Closing Costs | $13,156,127 | | 1.3% |
| | | | | | | | | |
| Total Sources | $1,000,000,000 | | 100.0% | | Total Uses | $1,000,000,000 | | 100.0% |
| (1) | The 601 Lexington Avenue Mortgage Loan (as defined below) is part of the 601 Lexington Avenue Whole Loan (as defined below) with an original aggregate principal balance of $1,000,000,000. The Cut-off Date Balance per SF, Maturity Date Balance per SF, U/W DSCR based on NOI/NCF, U/W Debt Yield based on NOI/NCF, U/W Debt Yield at Maturity based on NOI/NCF, Cut-off Date LTV Ratio and LTV Ratio at Maturity numbers presented above are based on the 601 Lexington Avenue Senior Loan (as defined below). The Cut-off Date Balance per SF, Maturity Date Balance per SF, U/W DSCR based on NOI/NCF, U/W Debt Yield based on NOI/NCF, U/W Debt Yield at Maturity based on NOI/NCF, Cut-off Date LTV Ratio and LTV Ratio at Maturity based upon the 601 Lexington Avenue Whole Loan are $597, $597, 3.37x, 3.25x, 9.5%, 9.2%, 9.5%, 9.2%, 58.8% and 58.8%, respectively. |
| (2) | BP/CGCenter I LLC and BP/CGCenter II LLC are the single purpose entity borrowers. The 601 Lexington Avenue Whole Loan is recourse to the single purpose entity borrowers for certain items. There is no separate non-recourse carveout guarantor or environmental indemnitor for the 601 Lexington Avenue Whole Loan. Boston Properties Limited Partnership, a Delaware Limited partnership (“BPLP”) has executed a guaranty of reserve funds in place of posting certain reserves. |
| (3) | Defeasance of the 601 Lexington Avenue Whole Loan is permitted at any time after the earlier to occur of (a) the end of the two-year period commencing on the closing date of the securitization of the last promissory note representing a portion of the 601 Lexington Avenue Whole Loan to be securitized and (b) December 10, 2024. The assumed defeasance lockout period of 26 payments is based on the closing date of this transaction in March 2022. |
| (4) | See “The Mortgage Loan” and “Subordinate and Mezzanine Indebtedness” below for further discussion of additional debt. |
| (5) | See “Escrows” below for further discussion of reserve requirements. |
THE INFORMATION IN THIS STRUCTURAL AND COLLATERAL TERM SHEET IS NOT COMPLETE AND MAY BE AMENDED PRIOR TO THE TIME OF SALE. THIS TERM SHEET IS NOT AN OFFER TO SELL THESE SECURITIES AND IT IS NOT A SOLICITATION OF AN OFFER TO BUY THESE SECURITIES IN ANY JURISDICTION WHERE THE OFFER OR SALE IS NOT PERMITTED.
37
| Office – CBD | Loan #1 | Cut-off Date Balance: | | $110,000,000 |
| 601 Lexington Avenue | 601 Lexington Avenue | Cut-off Date LTV: | | 42.5% |
| New York, NY 10022 | | U/W NCF DSCR: | | 4.50x |
| | | U/W NOI Debt Yield: | | 13.2% |
| (6) | BPLP provided a payment guaranty in lieu of depositing $52,315,328 at closing for approved leasing expenses outstanding at the time of origination of the 601 Lexington Avenue Whole Loan. |
| (7) | BPLP provided a payment guaranty in lieu of depositing $8,974,469 at closing for the free rent and gap rent outstanding for six tenants at the time of origination of the 601 Lexington Avenue Whole Loan. |
| (8) | The novel coronavirus pandemic is an evolving situation and could impact the 601 Lexington Avenue Whole Loan more severely than assumed in the underwriting of the 601 Lexington Avenue Whole Loan and could adversely affect the NOI, NCF and occupancy information, as well as the appraised value and the DSCR, LTV and Debt Yield metrics presented above and herein. See "Risk Factors—Risks Related to Market Conditions and Other External Factors—The Coronavirus Pandemic Has Adversely Affected the Global Economy and Will Likely Adversely Affect the Performance of the Mortgage Loans" in the prospectus. |
The Mortgage Loan. The mortgage loan (the “601 Lexington Avenue Mortgage Loan”) is part of a whole loan (the “601 Lexington Avenue Whole Loan”) that is evidenced by 23 pari passu senior promissory notes in the aggregate original principal amount of $723,300,000 (collectively, the “601 Lexington Avenue Senior Loan”) and four pari passu subordinate promissory notes in the aggregate original principal amount of $276,700,000 (collectively, the “601 Lexington Avenue Subordinate Companion Loan”). The 601 Lexington Avenue Whole Loan was co-originated on December 10, 2021, by Wells Fargo Bank, National Association (“WFB”), DBR Investments Co. Limited (“DBRI”), Morgan Stanley Bank, N.A. (“MSBNA”) and Citi Real Estate Funding Inc. (“Citi”). The 601 Lexington Avenue Whole Loan is secured by a first priority mortgage on the borrowers’ fee simple interest in three condominium units and a leasehold interest in a portion of a fourth condominium unit relating to an office building located in New York, New York (the “601 Lexington Avenue Property”). The 601 Lexington Avenue Mortgage Loan is evidenced by the $67,543,860 non-controlling promissory Note A-1-C3, being contributed by WFB, and the $42,456,140 non-controlling promissory Note A-3-C3, being contributed by MSMCH, in the aggregate original principal amount of $110,000,000. The remaining promissory notes comprising the 601 Lexington Avenue Whole Loan are summarized in the table below. The 601 Lexington Avenue Whole Loan is being serviced pursuant to the trust and servicing agreement for the BXP 2021-601L securitization trust. The 601 Lexington Avenue Senior Loan pari passu notes other than those evidencing the 601 Lexington Avenue Mortgage Loan are referred to herein as the “601 Lexington Avenue Non-Serviced Pari Passu Companion Loans”. See “Description of the Mortgage Pool—The Whole Loans— The Non-Serviced A/B Whole Loans—The 601 Lexington Avenue Pari Passu-A/B Whole Loan” and “Pooling and Servicing Agreement—Servicing of the Non-Serviced Mortgage Loans” in the prospectus.
Whole Loan Note Summary
| Notes | Original Balance | Cut-off Date Balance | Anticipated Note
Holder | Controlling Piece |
| Senior Notes |
| A-1-S1 | $52,500,000 | $52,500,000 | BXP 2021-601L | Yes |
| A-2-S1, A-3-S1, A-4-S1 | $97,500,000 | $97,500,000 | BXP 2021-601L | No |
| A-1-C2, A-3-C2 | $110,000,000 | $110,000,000 | BANK 2022-BNK39 | No |
| A-1-C3, A-3-C3 | $110,000,000 | $110,000,000 | BANK 2022-BNK40 | No |
| A-2-C2-2, A-4-C2-2 | $25,000,000 | $25,000,000 | BMARK 2022-B32 | No |
| A-2-C3-1 | $40,000,000 | $40,000,000 | BMO 2022-C1 | No |
| A-2-C1, A-2-C3-2, A-2-C4, A-4-C3 | $80,000,000 | $80,000,000 | BMARK 2022-B33(1) | No |
| A-1-C1, A-1-C4 | $65,567,280 | $65,567,280 | WFB | No |
| A-2-C2-1 | $43,479,070 | $43,479,070 | DBRI | No |
| A-3-C1, A-3-C4 | $41,213,720 | $41,213,720 | MSBNA | No |
| A-4-C1, A-4-C2-1, A-4-C4 | $58,039,930 | $58,039,930 | Citi | No |
| Total Senior Notes | $723,300,000 | $723,300,000 | | |
| |
| Subordinate Notes |
| B-1, B-2, B-3, B-4 | $276,700,000 | $276,700,000 | BXP 2021-601L | No |
| Total (Whole Loan) | $1,000,000,000 | $1,000,000,000 | | |
| (1) | It is anticipated that the specified notes will be contributed to the BMARK 2022-B33 securitization, which has not yet closed. |
The Borrowers and Borrower Sponsors. The borrowers are BP/CGCenter I LLC and BP/CGCenter II LLC, each a Delaware limited liability company and single purpose entity with two independent directors. The borrower sponsor is BP/CGCenter MM LLC, an indirectly owned subsidiary of Boston Properties Limited Partnership and of Norges Bank Investment Management (“Norges”). There is no separate environmental indemnitor or non-recourse carveout guarantor with respect to the 601 Lexington Avenue Whole Loan. Boston Properties Limited Partnership, a Delaware Limited partnership (“Boston Properties” or “BPLP”) has executed a guaranty of reserve funds in place of posting certain reserves.
Boston Properties (NYSE: BXP) is the largest publicly traded developer, owner, and manager of Class A office properties in the United States, concentrated in five markets: Boston, Los Angeles, New York, San Francisco and Washington, DC. The company was founded in 1970 and became a public company in 1997. The company is a fully integrated real estate company, organized as a real estate investment trust (REIT), that develops, manages, operates, acquires and owns a diverse portfolio of primarily Class A office space. The company’s portfolio totals 52.5 million square feet and 202 properties, including nine properties under construction or redevelopment. Boston Properties has held an ownership in interest in the 601 Lexington Avenue Property since 2001 and also controls property and leasing management.
THE INFORMATION IN THIS STRUCTURAL AND COLLATERAL TERM SHEET IS NOT COMPLETE AND MAY BE AMENDED PRIOR TO THE TIME OF SALE. THIS TERM SHEET IS NOT AN OFFER TO SELL THESE SECURITIES AND IT IS NOT A SOLICITATION OF AN OFFER TO BUY THESE SECURITIES IN ANY JURISDICTION WHERE THE OFFER OR SALE IS NOT PERMITTED.
38
| Office – CBD | Loan #1 | Cut-off Date Balance: | | $110,000,000 |
| 601 Lexington Avenue | 601 Lexington Avenue | Cut-off Date LTV: | | 42.5% |
| New York, NY 10022 | | U/W NCF DSCR: | | 4.50x |
| | | U/W NOI Debt Yield: | | 13.2% |
Norges manages the Norwegian Government Pension Fund Global, often referred to as the Norwegian oil fund. Norges manages assets worth more than 11,000 billion kroner, or about $1.3 trillion dollars. The fund is invested in international equity and fixed-income markets and in real estate.
The Property. The 601 Lexington Avenue Property is comprised of the borrowers’ fee and leasehold interests in certain condominium units within a 59-story, Class A, office tower located in Midtown Manhattan at East 53rd Street and Lexington Avenue. Situated on a 1.6-acre site, the property comprises approximately 1.7 million square feet of office and retail space, which includes a high-rise office tower as well as a six-story office and retail building totaling 227,276 square feet situated at the base (the “Low Rise Building”). The building, with a 45° angled top and a stilt-style base, was designated as a landmark by the New York City Landmarks Preservation Commission in September 2016. As of November 1, 2021, the property was 96.3% leased. Investment grade tenants and tenants included in a legal industry magazine listing of the largest global 200 law firms by gross revenue represent 83.6% of the NRA and 85.7% of underwritten gross rent. Further, the top four tenants represent 71.6% of underwritten gross rent and have a weighted average remaining lease term of 15.2 years.
Originally built in 1977, the 601 Lexington Avenue Property underwent renovations totaling approximately $283 million in 2021, which included repositioning the Low Rise Building as well as the redevelopment of the ground and lower level space into a food hall. Following the repositioning, the Low Rise Building includes 195,326 square feet of office space, 31,950 square feet of retail space and a public marketplace and a new dedicated street-level entrance and lobby for low-rise office floors. The food hall (known as The Hugh) contains a collection of 15 restaurants, bars and food retailers and is directly connected to a public plaza that provides access to the East 53rd Street subway stop. Additional amenities of the Low Rise Building include a succession of rooftop terraces on each floor as well as a fitness center. The Low Rise Building office space is fully leased to NYU, which utilizes the space to house NYU Langone Health. In addition, NYU is occupying a portion of the land owned by the adjoining St. Peter’s Church (see “Ground Lease” section below).
Condominium Regime. The 601 Lexington Avenue Property is comprised of (a) the borrowers’ fee simple interest in three condominium units within the four-unit Condominium known as 601 Lexington Avenue Condominium (the “Condominium”) and (b) the borrowers’ leasehold interest in a portion of a fourth condominium unit, commonly known as the “Church Unit”, within the Condominium. The borrower-owned units include 94.4% of the common elements, which entitles the borrowers to 94 of the 100 votes in the condominium regime (together with the right to appoint 6 of 7 board members). The loan documents provide that it is an event of default if, without the prior written consent of the lender, the borrowers vote for or otherwise consent to, any modification or amendment to any of the terms or provisions of the condominium documents in violation of the terms of the loan agreement. See “Description of the Mortgage Pool – Mortgage Pool Characteristics – Condominium and Other Shared Interests” in the prospectus.
COVID-19 Update. As of January 5, 2022, the 601 Lexington Avenue Property was open and operating. The borrower sponsor reported that the only tenant with outstanding rent relief is Hillstone (7,800 square feet, 0.5% of net rentable area, 0.9% of underwritten gross rent), which received an abatement of 50% of six months rent (approximately $168,000 from September 1, 2020 to February 28, 2021), which it is expected to repay over the course of 2022 and 2023.
Major Tenants.
Kirkland & Ellis (616,139 square feet, 36.8% net rentable area, 39.4% underwritten gross rent, February 28, 2039 expiration). Kirkland & Ellis (“K&E”) was founded in 1909 in Chicago, Illinois and is the largest law firm in the world by revenue and the fifth largest by number of attorneys. K&E is a long-term tenant at the property having been in occupancy since 1993. K&E signed an early renewal in 2014 to extend its lease through 2039 and expanded its space again in 2017. As the property’s largest tenant, K&E occupies the majority of the upper floors of the building (32-47, 49-52). For floor 32 only, K&E has a termination option on June 30, 2027 with 18 months’ notice and the payment of unamortized leasing costs. Additionally, as of February 28, 2034, K&E can terminate either its highest or lowest floor (one floor only). K&E has $4,062,504 of outstanding free rent.
Citibank (216,256 square feet, 12.9% of net rentable area; 12.3% of underwritten gross rent, various expirations). Citibank, an affiliate of Citi, one of the originators of the 601 Lexington Avenue Whole Loan, is a multinational consumer and investment bank, with core activities that include safeguarding assets, lending money, making payments and accessing the capital markets on behalf of its clients. The property was originally developed as Citicorp’s headquarters and the bank was previously an owner of the property. Citibank is on various leases expiring in December 2022 (3.6% of NRA, 3.4% of underwritten gross rent), August 2023 (3.6% of NRA, 3.4% of underwritten gross rent), April 2027 (1.8% NRA, 1.8% of underwritten gross rent), and April 2032 (4.0% NRA, 3.7% of underwritten gross rent). Citibank has four, 5-year renewal options and does not have any termination options.
NYU (195,326 square feet; 11.7% of net rentable area; 10.1% of underwritten gross rent, October 31, 2049 expiration). New York University (“NYU”) is a new tenant to the property with a lease that commenced in 2020 of the newly redeveloped atrium building. NYU will use the space to house NYU Langone Health. NYU took occupancy of the 4th floor and is expected to take occupancy of the remaining space in April to May 2022. NYU structured a leasehold condominium for a period of approximately 30 years through October 2049. The leasehold condominium is structured as a standard lease and is operated as a leasehold condominium to allow the tenant to benefit from its tax-exempt entity status. NYU has one, 10-year renewal option, one, 7-year renewal option and does not have any termination options.
Freshfields Bruckhaus Deringer (139,243 square feet; 8.3% of net rentable area; 9.8% of underwritten gross rent; June 30, 2026 expiration). Freshfields Bruckhaus Deringer (“Freshfields”) is one of the largest multinational law firms in the world, headquartered in London. Tracing its roots back to the 18th century, it is also among the world’s oldest law firms. Freshfields has been a tenant at the property since 2010, expanded in 2017, and is on a lease expiring in 2026 with two, 5-year renewal options and no termination options.
THE INFORMATION IN THIS STRUCTURAL AND COLLATERAL TERM SHEET IS NOT COMPLETE AND MAY BE AMENDED PRIOR TO THE TIME OF SALE. THIS TERM SHEET IS NOT AN OFFER TO SELL THESE SECURITIES AND IT IS NOT A SOLICITATION OF AN OFFER TO BUY THESE SECURITIES IN ANY JURISDICTION WHERE THE OFFER OR SALE IS NOT PERMITTED.
39
| Office – CBD | Loan #1 | Cut-off Date Balance: | | $110,000,000 |
| 601 Lexington Avenue | 601 Lexington Avenue | Cut-off Date LTV: | | 42.5% |
| New York, NY 10022 | | U/W NCF DSCR: | | 4.50x |
| | | U/W NOI Debt Yield: | | 13.2% |
Blackstone (89,967 square feet; 5.4% of net rentable area; 5.2% of underwritten gross rent, December 31, 2027 expiration). Blackstone is an investment firm with total assets under management of $730.7 billion as of October 21, 2021. Blackstone’s asset management businesses include investment vehicles focused on real estate, private equity, public debt and equity, growth equity, opportunistic, non-investment grade credit, real assets and secondary funds, all on a global basis. Blackstone has been a tenant at the property since 2015, expanded in 2017 and is on a lease expiring in 2027 with two, 5-year renewal options or one, 10-year renewal option and no termination options.
The following table presents certain information relating to the tenancy at the 601 Lexington Avenue Property:
Major Tenants(1)
| Tenant Name | Credit Rating (Moody’s/ Fitch/ S&P)(2) | Tenant NRSF | % of
NRSF | Annual U/W Gross Rent PSF(3)(4) | Annual
U/W Gross Rent(3)(4) | % of Total Annual U/W Gross Rent(3) | Lease
Expiration
Date | Extension Options | Termination Option (Y/N) |
| Major Tenants | | | | | | | | |
| K&E | NR/NR/NR | 616,139(5) | 36.8% | $99.37 | $61,225,450 | 39.4% | 2/28/2039 | None | Y(6) |
| Citibank | Aa3/A+/A+ | 216,256(7)(8) | 12.9% | $88.00 | $19,030,810 | 12.3% | Various(9) | 4x5 yr | N |
| NYU | Aa2/NR/AA- | 195,326 | 11.7% | $80.36 | $15,697,290 | 10.1% | 10/31/2049 | 1x10 yr and 1x7 yr | N |
| Freshfields | NR/NR/NR | 139,243(10) | 8.3% | $109.68 | $15,272,330 | 9.8% | 6/30/2026 | 2x5 yr | N |
| Citadel | Ba1/NR/BBB- | 144,193 | 8.6% | $95.51 | $13,771,418 | 8.9% | 8/31/2022(11) | None | N |
| Blackstone | NR/A+/A+ | 89,967 | 5.4% | $89.68 | $8,067,806 | 5.2% | 12/31/2027 | 2x5 yr or 1x10 yr | N |
| BTG | NR/NR/NR | 31,401 | 1.9% | $151.19 | $4,747,674 | 3.1% | 3/31/2028 | 1x5 yr | N |
| Apax | NR/NR/NR | 31,401 | 1.9% | $130.35 | $4,093,254 | 2.6% | 7/31/2026 | 1x5 yr | N |
| OrbiMed | NR/NR/NR | 31,401 | 1.9% | $112.83 | $3,543,036 | 2.3% | 3/31/2033 | 2x5 yr | N |
| Siris Capital Group | NR/NR/NR | 18,928 | 1.1% | $123.18 | $2,331,624 | 1.5% | 9/30/2030 | None | Y(12) |
| Total Major Tenants | 1,514,255 | 90.4% | $97.59 | $147,780,691 | 95.2% | | | |
Non-Major Tenants | 99,343 | 5.9% | $75.80 | $7,530,269 | 4.8% | | | |
Occupied Collateral Total | 1,613,598 | 96.3% | $96.25 | $155,310,960 | 100.0% | | | |
| | | | | | | | | |
| Vacant Space | 62,061 | 3.7% | | | | | | |
| | | | | | | | | |
| Collateral Total | 1,675,659 | 100.0% | | | | | | |
| | | | | | | | | | |
| | | | | | | | | | | | |
| (1) | Based on the underwritten rent roll. |
| (2) | Certain ratings are those of the parent company whether or not the parent guarantees the lease. |
| (3) | The Annual U/W Gross Rent PSF, Annual U/W Gross Rent and % of Total Annual U/W Gross Rent are based on the underwritten gross rent based on the underwritten rent roll. |
| (4) | The Annual U/W Gross Rent PSF and Annual U/W Gross Rent shown above include contractual rent steps through September 2022 totaling $128,513. The lender’s underwriting gives separate credit for straight-line rent averaging for an investment grade tenant (NYU) and tenants included in a legal industry magazine listing of the largest global 200 law firms by gross revenue (K&E and Freshfields) through loan maturity. The total implied underwritten rental rate for K&E, NYU, and Freshfields, inclusive of the straight-line credit, is approximately $108.46, $85.17 and $111.22 PSF, respectively. See “Underwritten Net Cash Flow” below. |
| (5) | Includes 600 SF of storage space. |
| (6) | For floor 32 only, K&E has a June 30, 2027 termination option with 18 months’ notice and the payment of unamortized leasing costs. Additionally, as of February 28, 2034, K&E can terminate either its highest or lowest floor (one floor only). |
| (7) | Includes 6,333 SF of storage space. |
| (8) | Citibank is currently subleasing Suites 1900 and 2100 totaling 59,978 SF (3.6% of NRA). |
| (9) | Floors 18 and 20 (59,978 SF) expire in December 2022, Floors 19 and 21 (59,978 SF) expire in August 2023, Floor 23 (29,989 SF) expires in April 2027 and Floors 24 and 25 (66,311 SF) expire in April 2032. Citibank is expected to vacate the space expiring in December 2022 and August 2023. |
| (10) | Freshfields is currently subleasing Suite 5510 totaling 15,932 SF (1.0% of NRA). As of the origination date, Freshfields was also publicly marketing the remainder of their leased space for sublet. |
| (11) | Citadel has provided notice it intends to vacate at its lease expiration in August 2022. |
| (12) | Siris Capital Group has the option to terminate all its space on September 30, 2027 with notice by September 30, 2026 (12 months) and the payment of unamortized leasing costs. |
THE INFORMATION IN THIS STRUCTURAL AND COLLATERAL TERM SHEET IS NOT COMPLETE AND MAY BE AMENDED PRIOR TO THE TIME OF SALE. THIS TERM SHEET IS NOT AN OFFER TO SELL THESE SECURITIES AND IT IS NOT A SOLICITATION OF AN OFFER TO BUY THESE SECURITIES IN ANY JURISDICTION WHERE THE OFFER OR SALE IS NOT PERMITTED.
40
| Office – CBD | Loan #1 | Cut-off Date Balance: | | $110,000,000 |
| 601 Lexington Avenue | 601 Lexington Avenue | Cut-off Date LTV: | | 42.5% |
| New York, NY 10022 | | U/W NCF DSCR: | | 4.50x |
| | | U/W NOI Debt Yield: | | 13.2% |
The following table presents certain information relating to the lease rollover schedule at the 601 Lexington Avenue Property:
Lease Expiration Schedule(1)(2)
Year Ending
December 31, | No. of Leases Expiring | Expiring NRSF | % of Total NRSF | Cumulative Expiring NRSF | Cumulative % of Total NRSF | Annual
U/W
Gross Rent(3) | % of Total Annual U/W Gross Rent(3) | Annual
U/W
Gross Rent
PSF(3) |
| MTM | 0 | 0 | 0.0% | 0 | 0.0% | $0 | 0.0% | $0.00 |
| 2022 | 10 | 204,171 | 12.2% | 204,171 | 12.2% | $19,035,831 | 12.3% | $93.23 |
| 2023 | 2 | 59,978 | 3.6% | 264,149 | 15.8% | $5,264,413 | 3.4% | $87.77 |
| 2024 | 1 | 5,724 | 0.3% | 269,873 | 16.1% | $658,260 | 0.4% | $115.00 |
| 2025 | 0 | 0 | 0.0% | 269,873 | 16.1% | $0 | 0.0% | $0.00 |
| 2026 | 7 | 170,645 | 10.2% | 440,518 | 26.3% | $19,365,584 | 12.5% | $113.48 |
| 2027 | 4 | 119,956 | 7.2% | 560,474 | 33.4% | $10,820,276 | 7.0% | $90.20 |
| 2028 | 1 | 31,401 | 1.9% | 591,875 | 35.3% | $4,747,674 | 3.1% | $151.19 |
| 2029 | 0 | 0 | 0.0% | 591,875 | 35.3% | $0 | 0.0% | $0.00 |
| 2030 | 4 | 18,928 | 1.1% | 610,803 | 36.5% | $2,331,624 | 1.5% | $123.18 |
| 2031 | 2 | 37,789 | 2.3% | 648,592 | 38.7% | $3,050,214 | 2.0% | $80.72 |
| 2032 | 8 | 73,873 | 4.4% | 722,465 | 43.1% | $6,528,398 | 4.2% | $88.37 |
| Thereafter | 33 | 891,133 | 53.2% | 1,613,598 | 96.3% | $83,508,684 | 53.8% | $93.71 |
| Vacant | 0 | 62,061 | 3.7% | 1,675,659 | 100.0% | $0 | 0.0% | $0.00 |
| Total/Weighted Average | 72 | 1,675,659 | 100.0% | | | $155,310,960 | 100.0% | $96.25(4) |
| (1) | Information obtained from the underwritten rent roll. |
| (2) | Certain tenants may have lease termination options that are exercisable prior to the originally stated expiration date of the subject lease and that are not considered in the Lease Rollover Schedule. |
| (3) | The Annual U/W Gross Rent,% of Total Annual U/W Gross Rent, and Annual U/W Gross Rent PSF, are based on the underwritten gross rent based on the underwritten rent roll. |
| (4) | Total/Wtd. Avg. Annual Gross UW Rent PSF excludes vacant space. |
The following table presents historical occupancy percentages at the 601 Lexington Avenue Property:
Historical Occupancy
12/31/2018(1) | 12/31/2019(1) | 12/31/2020(1) | TTM 9/30/2021(1) | 11/1/2021(2) |
| 99.3% | 100.0% | 97.6% | 96.3% | 96.3% |
| (1) | Information obtained from the borrower. |
| (2) | Information obtained from the underwritten rent roll. |
THE INFORMATION IN THIS STRUCTURAL AND COLLATERAL TERM SHEET IS NOT COMPLETE AND MAY BE AMENDED PRIOR TO THE TIME OF SALE. THIS TERM SHEET IS NOT AN OFFER TO SELL THESE SECURITIES AND IT IS NOT A SOLICITATION OF AN OFFER TO BUY THESE SECURITIES IN ANY JURISDICTION WHERE THE OFFER OR SALE IS NOT PERMITTED.
41
| Office – CBD | Loan #1 | Cut-off Date Balance: | | $110,000,000 |
| 601 Lexington Avenue | 601 Lexington Avenue | Cut-off Date LTV: | | 42.5% |
| New York, NY 10022 | | U/W NCF DSCR: | | 4.50x |
| | | U/W NOI Debt Yield: | | 13.2% |
Underwritten Net Cash Flow. The following table presents certain information relating to the underwritten net cash flow at the 601 Lexington Avenue Property:
Cash Flow Analysis(1)
| | 2018 | 2019 | 2020 | TTM 9/30/2021 | U/W | %(2) | U/W $ per SF |
| Base Rent | $133,149,752 | $135,562,062 | $ 143,558,635 | $144,061,141 | $145,905,931 | 85.8% | $87.07 |
| Contractual Rent Steps(3) | 0 | 0 | 0 | 0 | 128,513 | 0.1 | 0.08 |
| Rent Average Benefit(4) | 0 | 0 | 0 | 0 | 6,752,020 | 4.0 | 4.03 |
| Grossed Up Vacant Space | 0 | 0 | 0 | 0 | 5,489,750 | 3.2 | 3.28 |
| Gross Potential Rent | $133,149,752 | $135,562,062 | $ 143,558,635 | $144,061,141 | $158,276,214 | 93.0% | $94.46 |
| Other Income | 1,616,466 | 1,730,575 | 2,517,181 | 1,475,308 | 1,452,145 | 0.9 | 0.87 |
| Expense Reimbursements | 13,799,300 | 10,210,032 | 9,414,939 | 9,538,732 | 10,422,946 | 6.1 | 6.22 |
| Net Rental Income | $148,565,518 | $147,502,669 | $155,490,755 | $155,075,181 | $170,151,305 | 100.0% | $101.54 |
| (Vacancy & Credit Loss)(5) | 0 | 0 | 0 | 0 | (10,444,971) | (6.6) | (6.23) |
| Effective Gross Income | $148,565,518 | $147,502,669 | $155,490,755 | $155,075,181 | $159,706,334 | 93.9% | $95.31 |
| | | | | | | | |
| Real Estate Taxes | 39,670,091 | 42,193,437 | 43,060,793 | 41,588,994 | 40,950,953 | 25.6 | 24.44 |
| Insurance | 569,495 | 612,718 | 732,213 | 892,330 | 1,375,389 | 0.9 | 0.82 |
| Management Fee | 3,006,130 | 3,265,479 | 3,235,326 | 3,218,199 | 1,000,000 | 0.6 | 0.60 |
| Other Operating Expenses | 18,195,642 | 18,914,423 | 19,523,204 | 19,827,849 | 21,106,886 | 13.2 | 12.60 |
| Total Operating Expenses | $61,441,358 | $64,986,057 | $66,551,536 | $65,527,372 | $64,433,228 | 40.3% | $38.45 |
| | | | | | | | |
| Net Operating Income | $87,124,160 | $82,516,612 | $88,939,219 | $89,547,809 | $95,273,106 | 59.7% | $56.86 |
| Replacement Reserves | 0 | 0 | 0 | 0 | 418,915 | 0.3 | 0.25 |
| TI/LC | 0 | 0 | 0 | 0 | 2,743,708 | 1.7 | 1.64 |
| Net Cash Flow | $87,124,160 | $82,516,612 | $88,939,219 | $89,547,809 | $92,110,483 | 57.7% | $54.97 |
| | | | | | | | |
| NOI DSCR(6) | 4.26x | 4.03x | 4.34x | 4.37x | 4.65x | | |
| NCF DSCR(6) | 4.26x | 4.03x | 4.34x | 4.37x | 4.50x | | |
| NOI Debt Yield(6) | 12.0% | 11.4% | 12.3% | 12.4% | 13.2% | | |
| NCF Debt Yield(6) | 12.0% | 11.4% | 12.3% | 12.4% | 12.7% | | |
| (1) | For the avoidance of doubt, no COVID-19 specific adjustments have been incorporated in the lender underwriting. |
| (2) | Represents (i) percent of Net Rental Income for all revenue fields, (ii) percent of Gross Potential Rent for Vacancy & Credit Loss and (iii) percent of Effective Gross Income for all other fields. |
| (3) | Represents contractual rent steps through September 2022. |
| (4) | Represents straight-line rent averaging for an investment grade tenant (NYU) and tenants included in a legal industry magazine listing of the largest global 200 law firms by gross revenue (K&E and Freshfields). |
| (5) | The underwritten economic vacancy is 6.7%. The 601 Lexington Avenue Property was 96.3% leased as of November 1, 2021. |
| (6) | The debt service coverage ratios and debt yields are based on the 601 Lexington Avenue Senior Loan and exclude the 601 Lexington Avenue Subordinate Companion Loan. |
Appraisal. According to the appraisal, the 601 Lexington Avenue Property had an “As Is” appraised value of $1,700,000,000 as of October 1, 2021.
Environmental Matters. According to the Phase I environmental site assessment dated November 12, 2021, there was no evidence of any recognized environmental conditions at the 601 Lexington Avenue Property.
Market Overview and Competition. The 601 Lexington Avenue Property is located in Midtown Manhattan at East 53rd Street and Lexington Avenue in New York, New York. The 601 Lexington Avenue Property, which takes up the majority of a city block bounded clockwise from the west by Lexington Avenue, 54th Street, benefits from its proximity to Central Park, access to the luxury shopping corridor along Fifth and Madison Avenues, and available mass transit including the 4, 5, 6, E, M, N, R, and W subway lines. The property sits on top of a public plaza (directly connected to The Hugh food hall) that provides access to the East 53rd Street subway stop.
According to a third-party market research report, the 601 Lexington Avenue Property is situated within the Plaza District Office submarket of the New York City Office Market. The Plaza District is not only the largest office submarket in New York City, with 90 million square feet of inventory, but in the United States as well. As of October 2021, the Plaza District submarket reported a 14.4% vacancy rate (and a 17.4% availability rate) and average asking rents of $86.73 per square foot, gross. The appraisal identified 9 directly competitive buildings totaling 10.5 million square feet with a 7.0% vacancy rate and average asking rents of $102.14 per square foot. The appraisal concluded to market rents ranging from $80.00 to $115.00 per square foot, modified gross, for the various floors of office space at the 601 Lexington Avenue Property (see table below).
THE INFORMATION IN THIS STRUCTURAL AND COLLATERAL TERM SHEET IS NOT COMPLETE AND MAY BE AMENDED PRIOR TO THE TIME OF SALE. THIS TERM SHEET IS NOT AN OFFER TO SELL THESE SECURITIES AND IT IS NOT A SOLICITATION OF AN OFFER TO BUY THESE SECURITIES IN ANY JURISDICTION WHERE THE OFFER OR SALE IS NOT PERMITTED.
42
| Office – CBD | Loan #1 | Cut-off Date Balance: | | $110,000,000 |
| 601 Lexington Avenue | 601 Lexington Avenue | Cut-off Date LTV: | | 42.5% |
| New York, NY 10022 | | U/W NCF DSCR: | | 4.50x |
| | | U/W NOI Debt Yield: | | 13.2% |
The following table presents certain information relating to the appraisal’s market rent conclusion for the 601 Lexington Avenue Property:
Market Rent Summary(1)
| | Office Floors
2-22 | Office Floors
23-31 | Office Floors
32-42 | Office Floors
43-54 | East Building
55-59 |
| Market Rent (PSF) | $80.00 | $85.00 | $95.00 | $105.00 | $115.00 |
| Lease Term (Years) | 10 | 10 | 10 | 15 | 15 |
| Lease Type (Reimbursements) | Modified Gross | Modified Gross | Modified Gross | Modified Gross | Modified Gross |
| Rent Increase Projection | $10.00 PSF in year 6 | $10.00 PSF in year 6 | $10.00 PSF in year 6 | $10.00 PSF in year 6 | $10.00 PSF in year 6 |
| (1) | Information obtained from the appraisal. |
The table below presents certain information relating to comparable office sales pertaining to the 601 Lexington Avenue Property identified by the appraisal:
Comparable Sales(1)
| Property Name | Location | Year Built/Renovated | Rentable Area (SF) | Occupancy | Sale Date | Sale Price | Sale Price (PSF) |
601 Lexington Avenue Property | New York, NY | 1977/2021 | 1,675,659(2) | 96.3%(2) | | | |
Confidential Park Ave | New York, NY | 1994/2021 | 765,000 | 91.0% | Nov-2021 | $750,000,000 | $980.39 |
51 West 52nd Street | New York, NY | 1963/NAP | 872,593 | 100.0% | Nov-2021 | $960,000,000 | $1,100.17 |
1177 Avenue of the Americas | New York, NY | 1987/2013 | 1,024,733 | 81.0% | Nov-2021 | $858,500,000 | $837.78 |
550 Washington Street | New York, NY | 1934/2022 | 1,257,529 | 100.0% | Sep-2021 | $2,020,800,000 | $1,606.96 |
220 East 42nd Street | New York, NY | 1930/2015 | 1,224,755 | 93.0% | Jul-2021 | $790,100,000 | $645.11 |
One Park Avenue | New York, NY | 1926/2000 | 947,894 | 99.0% | Jul-2021 | $875,000,000 | $923.10 |
410 Tenth Avenue | New York, NY | 1927/2021 | 634,359 | 98.0% | Dec-2020 | $952,840,000 | $1,502.05 |
1633 Broadway | New York, NY | 1972/2013 | 2,561,512 | 98.0% | May-2020 | $2,400,000,000 | $936.95 |
| (1) | Information obtained from the appraisal. |
| (2) | Information obtained from the underwritten rent roll. |
THE INFORMATION IN THIS STRUCTURAL AND COLLATERAL TERM SHEET IS NOT COMPLETE AND MAY BE AMENDED PRIOR TO THE TIME OF SALE. THIS TERM SHEET IS NOT AN OFFER TO SELL THESE SECURITIES AND IT IS NOT A SOLICITATION OF AN OFFER TO BUY THESE SECURITIES IN ANY JURISDICTION WHERE THE OFFER OR SALE IS NOT PERMITTED.
43
| Office – CBD | Loan #1 | Cut-off Date Balance: | | $110,000,000 |
| 601 Lexington Avenue | 601 Lexington Avenue | Cut-off Date LTV: | | 42.5% |
| New York, NY 10022 | | U/W NCF DSCR: | | 4.50x |
| | | U/W NOI Debt Yield: | | 13.2% |
The following table presents information with respect to comparable office properties to the 601 Lexington Avenue Property:
Comparable Office Supply Summary(1)
| Property Name/Location | Office Area | Year Built/Renovated | Stories | Sublease SF
Available | % Occupied (Direct) | Average Asking Rent |
601 Lexington Avenue Property New York, NY | 1,675,659(2) | 1977/2021 | 59 | - | 96.3%(2) | $96.25(2)(3) |
599 Lexington Avenue(4) New York, NY | 1,058,805 | 1986/NAP | 50 | 0 | 100.0% | NAP |
600 Lexington Avenue New York, NY | 305,472 | 1983/NAP | 36 | 34,922 | 87.8% | $90.00 |
55 East 52nd Street New York, NY | 1,518,210 | 1981/NAP | 49 | 0 | 97.6% | $95.00 |
65 East 55th Street New York, NY | 619,631 | 1986/NAP | 38 | 23,708 | 92.9% | $155.00 |
237 Park Avenue New York, NY | 1,243,384 | 1915/NAP | 21 | 220,823 | 98.6% | $75.00 |
245 Park Avenue New York, NY | 1,787,000 | 1966/NAP | 45 | 93,108 | 89.5% | $110.00 |
875 Third Avenue New York, NY | 750,000 | 1982/NAP | 29 | 0 | 87.3% | $80.00 |
277 Park Avenue New York, NY | 1,850,000 | 1964/NAP | 51 | 23,163 | 83.2% | $110.00 |
280 Park Avenue New York NY | 1,320,211 | 1968/NAP | 43 | 27,407 | 100.0% | NAP |
| (1) | Information obtained from the appraisal. |
| (2) | Information obtained from the underwritten rent roll. |
| (3) | Represents Annual UW Gross Rent PSF. |
| (4) | Owned by the borrower sponsor. |
Escrows.
Tax Reserve - Upon the occurrence and continuance of a Cash Trap Event Period (as defined below under “Lockbox and Cash Management”), the 601 Lexington Avenue Whole Loan documents require ongoing monthly real estate tax reserves in an amount equal to 1/12 of the real estate taxes that the lender reasonably estimates will be payable during the next 12 months. In lieu of making the monthly payments, the borrowers have the right to deliver to the lender a guaranty from BPLP (as described below under “BPLP Guaranty”) so long as BPLP’s senior unsecured credit rating is at least “BBB” by S&P and “Baa3” by Moody’s (the “BPLP Guarantor Required Rating”).
Insurance Reserve - Upon the occurrence and continuance of a Cash Trap Event Period, the 601 Lexington Avenue Whole Loan documents require ongoing monthly insurance reserves in an amount equal to 1/12 of the insurance premiums that the lender estimates will be payable for the renewal of the coverage during the next 12 months; provided, however, notwithstanding any Cash Trap Event Period, the reserve will not be required if the borrowers maintain a blanket insurance policy reasonably acceptable to the lender. In lieu of making the monthly payments, the borrowers have the right to deliver to the lender a guaranty from BPLP (as described below under “BPLP Guaranty”) so long as BPLP’s senior unsecured credit rating satisfies the BPLP Guarantor Required Rating.
Replacement Reserve - Upon the occurrence and continuance of a Cash Trap Event Period, the 601 Lexington Avenue Whole Loan documents require ongoing monthly replacement reserves of $34,910, subject to a cap of $837,829. In lieu of making the monthly payments, the borrowers have the right to deliver to the lender a guaranty from BPLP (as described below under “BPLP Guaranty”) so long as BPLP’s senior unsecured credit rating satisfies the BPLP Guarantor Required Rating.
TI/LC Reserve - Upon the occurrence and continuance of a Cash Trap Event Period, the 601 Lexington Avenue Whole Loan documents require ongoing monthly TI/LC reserves of $418,915, subject to a cap of $10,053,948. In lieu of making the monthly payments, the borrowers have the right to deliver to the lender a guaranty from BPLP (as described below under “BPLP Guaranty”) so long as BPLP’s senior unsecured credit rating satisfies the BPLP Guarantor Required Rating.
Tenant Specific TI/LC Reserve – BPLP provided a payment guaranty in lieu of depositing $52,315,328 at closing for approved leasing expenses outstanding at the time of origination of the 601 Lexington Avenue Whole Loan.
Free Rent Reserve – BPLP provided a payment guaranty in lieu of depositing $8,974,469 at closing for the free rent and gap rent outstanding for six tenants at the time of origination of the 601 Lexington Avenue Whole Loan.
Lockbox and Cash Management. The 601 Lexington Avenue Whole Loan documents require that the borrowers establish and maintain a lender-controlled lockbox account, which is already in-place, and direct all tenants to pay rent directly into such lockbox account. The 601 Lexington Avenue Whole Loan documents also require that all rents received by the borrowers be deposited into the lockbox account within five business days of receipt. Prior to the occurrence of a Cash Trap Event Period, all funds on deposit in the lockbox account will be disbursed to the borrowers’ operating account. During a Cash Trap Event Period, all funds in the lockbox account are required to be swept each business day into the cash management account controlled by the lender and, on each payment date, all funds in the cash management account are required to be applied in accordance with the 601 Lexington Avenue Whole Loan
THE INFORMATION IN THIS STRUCTURAL AND COLLATERAL TERM SHEET IS NOT COMPLETE AND MAY BE AMENDED PRIOR TO THE TIME OF SALE. THIS TERM SHEET IS NOT AN OFFER TO SELL THESE SECURITIES AND IT IS NOT A SOLICITATION OF AN OFFER TO BUY THESE SECURITIES IN ANY JURISDICTION WHERE THE OFFER OR SALE IS NOT PERMITTED.
44
| Office – CBD | Loan #1 | Cut-off Date Balance: | | $110,000,000 |
| 601 Lexington Avenue | 601 Lexington Avenue | Cut-off Date LTV: | | 42.5% |
| New York, NY 10022 | | U/W NCF DSCR: | | 4.50x |
| | | U/W NOI Debt Yield: | | 13.2% |
documents to make required deposits (if any) into the real estate tax and insurance reserves, to pay debt service on the 601 Lexington Avenue Whole Loan, to make required deposits (if any) into the replacement and TI/LC reserves, and to pay operating expenses set forth in the annual budget (which is required to be approved by the lender during a Cash Trap Event Period). During a Cash Trap Event Period, any excess cash flow remaining after satisfaction of the foregoing items is required to be swept to an excess cash flow subaccount to be held by the lender as additional security for the 601 Lexington Avenue Whole Loan; provided, however, so long as no event of default exists under the 601 Lexington Avenue Whole Loan, if amounts on deposit in the TI/LC Reserve are not sufficient to pay approved leasing expenses, then upon request of the borrowers, funds in the excess cash flow subaccount are required to be disbursed for approved leasing expenses.
A “Cash Trap Event Period” will commence upon the earlier of the following:
| (i) | the occurrence and continuance of an event of default; or |
| (ii) | the net operating income debt service coverage ratio (“NOI DSCR”) for the 601 Lexington Avenue Whole Loan falling below 1.20x at the end of any calendar quarter. |
A Cash Trap Event Period will end upon the occurrence of the following:
| ● | with regard to clause (i) above, the cure of such event of default; or |
| ● | with regard to clause (ii) above: |
| (a) | the NOI DSCR for the 601 Lexington Avenue Whole Loan being greater than or equal to 1.20x for one calendar quarter; or |
| (b) | the borrowers delivering to the lender as additional collateral and security for the payment of the debt, (x) cash to be held as an additional reserve fund that, if applied as a prepayment of the outstanding principal balance of the 601 Lexington Avenue Whole Loan, would cause the NOI DSCR to be at least 1.20x (the “Cash Management Sweep Cure Amount”), (y) a letter of credit having an aggregate notional amount in the amount of the Cash Management Sweep Cure Amount, or (z) so long as BPLP’s senior unsecured credit rating satisfies the BPLP Guarantor Required Rating, a guaranty by BPLP in the amount of the Cash Management Sweep Cure Amount. |
BPLP Guaranty. The borrowers have the right to deliver to the lender a guaranty (a “BPLP Guaranty”) from BPLP (in the context of the BPLP Guaranty, the “BPLP Guarantor”), in lieu of making the payments to any of the reserve accounts and in lieu of making any cash deposits as alteration security, net proceeds deficiency with respect to the restoration after a casualty or condemnation or Cash Sweep Management Sweep Cure Amount, so long as BPLP’s senior unsecured credit rating meets the BPLP Guarantor Required Rating. Additionally, the borrowers have the right to deliver to the lender a BPLP Guaranty in lieu of deposits previously made for any such purpose (whereupon the amount so replaced would then be returned to the borrowers). The aggregate amount guaranteed under any such BPLP Guaranty (together with any cash delivered by the borrowers to the lender and/or any letter of credit delivered by the borrowers to the lender) related to any such purpose, must at all times be at least equal to the aggregate amount which the borrowers are required to have on deposit for such purpose. The aggregate amount guaranteed under any BPLP Guaranty (when aggregated with the full amount of any letter of credit and/or cash on deposit) will be reduced as the borrowers expend funds for the purposes which such funds would have otherwise been deposited in the applicable reserve account. The aggregate amount of any BPLP Guaranty (and the full amount of any letter of credit obtained by BPLP) will not at any time exceed 10.0% of the outstanding principal balance of the Whole Loan, unless the borrowers deliver a new non-consolidation opinion which takes into account such BPLP guarantees and letters of credit.
In the event of any downgrade, withdrawal or qualification of the rating of the BPLP Guarantor by any rating agency such that the BPLP Guarantor no longer satisfies the BPLP Guarantor Required Rating, within 10 business days of such downgrade, withdrawal or qualification, the borrowers are required to either (i) deposit with the lender cash in the amount of the guaranteed obligations under each BPLP Guaranty then outstanding, and/or (ii) provide the lender with a letter of credit with a face amount equal to the guaranteed obligations under each BPLP Guaranty then outstanding.
Property Management. The 601 Lexington Avenue Property is self-managed by Boston Properties Limited Partnership, an affiliate of the borrowers.
Partial Release. Not permitted.
Real Estate Substitution. Not permitted.
Subordinate and Mezzanine Indebtedness. The 601 Lexington Avenue Property also secures the 601 Lexington Avenue Non-Serviced Pari Passu Companion Loans, which have an aggregate Cut-off Date principal balance of $613,300,000 and the 601 Lexington Avenue Subordinate Companion Loan, which has an aggregate Cut-off Date principal balance of $276,700,000. The 601 Lexington Avenue Non-Serviced Pari Passu Companion Loans and the 601 Lexington Avenue Subordinate Companion Loan are coterminous with the 601 Lexington Avenue Mortgage Loan. The 601 Lexington Avenue Non-Serviced Pari Passu Companion Loans and 601 Lexington Avenue Subordinate Companion Loan accrue interest at the same rate as the 601 Lexington Avenue Mortgage Loan. The 601 Lexington Avenue Mortgage Loan and the 601 Lexington Avenue Non-Serviced Pari Passu Companion Loans are each pari passu in right of payment and together are senior in right of payment to the 601 Lexington Avenue Subordinate Companion Loan. The holders of the 601 Lexington Avenue Mortgage Loan, the 601 Lexington Avenue Non-Serviced Pari Passu Companion Loans and the 601 Lexington Avenue Subordinate Companion Loan have entered into a co-lender agreement which sets forth the allocation of collections on the 601 Lexington Avenue Whole Loan. See “Description of the Mortgage Pool—The Whole Loans— The Non-Serviced A/B Whole Loans—The 601 Lexington Avenue Pari Passu-A/B Whole Loan”.
THE INFORMATION IN THIS STRUCTURAL AND COLLATERAL TERM SHEET IS NOT COMPLETE AND MAY BE AMENDED PRIOR TO THE TIME OF SALE. THIS TERM SHEET IS NOT AN OFFER TO SELL THESE SECURITIES AND IT IS NOT A SOLICITATION OF AN OFFER TO BUY THESE SECURITIES IN ANY JURISDICTION WHERE THE OFFER OR SALE IS NOT PERMITTED.
45
| Office – CBD | Loan #1 | Cut-off Date Balance: | | $110,000,000 |
| 601 Lexington Avenue | 601 Lexington Avenue | Cut-off Date LTV: | | 42.5% |
| New York, NY 10022 | | U/W NCF DSCR: | | 4.50x |
| | | U/W NOI Debt Yield: | | 13.2% |
The following table presents certain information relating to the 601 Lexington Avenue Subordinate Loan:
| | B-Note Original
Principal
Balance | B-Note
Interest Rate | Original
Term
(mos.) | Original
Amort. Term
(mos.) | Original IO
Term (mos.) | Whole Loan
UW NCF
DSCR | Whole Loan
UW NOI DY | Whole Loan
Cutoff
Date LTV |
| 601 Lexington Avenue Subordinate Loan | $276,700,000 | 2.79196% | 120 | 0 | 120 | 3.25x | 9.5% | 58.8% |
Right of First Offer/Right of First Refusal. None.
Ground Lease. The borrowers have an approximately 18,000 square foot ground lease from the abutting St. Peter’s Lutheran Church of Manhattan (“St. Peter’s Church”), that is in turn sub-leased to NYU. The office space (floors 2-6) is 100% leased by NYU and is being used to house NYU Langone Health. NYU is occupying a portion of the “Church Unit” condominium unit owned by St. Peter’s Church. Such portion of the condominium unit is incorporated into the office building. The borrowers are required to pay ground rent ($49.96 per square foot with annual escalations of 1.5%) to St. Peter’s Church. The borrowers are required to purchase the ground leased space in 2036 for a fixed price of approximately $23.3 million.
Letter of Credit. None; however, a letter of credit may be provided to avoid or terminate a Cash Trap Event Period due to clause (ii) as described above under “Lockbox and Cash Management” or in place of any amount reserved under the loan documents provided the aggregate amount of any letters of credit (together with any BPLP Guaranties) do not at any time exceed 10.0% of the outstanding principal balance of the 601 Lexington Avenue Whole Loan, unless the borrowers deliver a new non-consolidation opinion which takes into account such BPLP Guaranties and letters of credit.
Terrorism Insurance. The 601 Lexington Avenue Whole Loan documents require that the “all risk” insurance policy required to be maintained by the borrowers, in an amount equal to the full replacement cost of the 601 Lexington Avenue Property, contain no exclusion for damage or destruction caused by acts of terrorism, as well as business interruption insurance covering a period of restoration of 24 months and a 12-month extended period of indemnity (provided that if TRIPRA or a similar statute is not in effect, the borrowers will not be obligated to pay terrorism insurance premiums in excess of two times the annual premium for the casualty and business interruption coverage (without giving effect to the cost of terrorism, flood and earthquake and business interruption components of such coverage)).
The 601 Lexington Avenue Whole Loan documents provide that required terrorism insurance may be written by a non-rated captive insurer owned by BPLP subject to certain conditions, including, among other things: (i) TRIPRA is in full force and effect; (ii) the terrorism policy issued by such captive insurer, together with any other qualified terrorism policies in-place, provide per occurrence limit in an amount not less than replacement cost and rent loss coverage as otherwise required; (iii) covered losses that are not reinsured by the federal government under TRIPRA and paid to the captive insurer are reinsured with a cut-through endorsement by an insurance company rated S&P “A”/ Moody’s “A2” or better; (iv) all reinsurance agreements between the captive insurer and other reinsurance providers are reasonably acceptable to the lender; (v) such captive insurer shall not be subject to a bankruptcy or similar insolvency proceeding; (vi) such captive insurer is licensed in the State of Vermont or other jurisdiction to the extent reasonably approved by the lender and qualified to issue the terrorism policy in accordance with applicable legal requirements; and (vii) the related policy will not contain a provision that terrorism coverage will expire or be excluded or limited in the event TRIPRA expires or is no longer in effect, so long as an insurance policy that does not contain such a provision is commercially available. See “Risk Factors—Risks Relating to the Mortgage Loans—Terrorism Insurance May Not Be Available for All Mortgaged Properties” in the prospectus.
THE INFORMATION IN THIS STRUCTURAL AND COLLATERAL TERM SHEET IS NOT COMPLETE AND MAY BE AMENDED PRIOR TO THE TIME OF SALE. THIS TERM SHEET IS NOT AN OFFER TO SELL THESE SECURITIES AND IT IS NOT A SOLICITATION OF AN OFFER TO BUY THESE SECURITIES IN ANY JURISDICTION WHERE THE OFFER OR SALE IS NOT PERMITTED.
46
(THIS PAGE INTENTIONALLY LEFT BLANK)
| Multifamily – High Rise | Loan #2 | Cut-off Date Balance: | | $110,000,000 |
| 605 Pavonia Avenue | Journal Squared Tower 2 | Cut-off Date LTV: | | 38.0% |
| Jersey City, NJ 07306 | | U/W NCF DSCR: | | 3.37x |
| | | U/W NOI Debt Yield: | | 12.0% |

THE INFORMATION IN THIS STRUCTURAL AND COLLATERAL TERM SHEET IS NOT COMPLETE AND MAY BE AMENDED PRIOR TO THE TIME OF SALE. THIS TERM SHEET IS NOT AN OFFER TO SELL THESE SECURITIES AND IT IS NOT A SOLICITATION OF AN OFFER TO BUY THESE SECURITIES IN ANY JURISDICTION WHERE THE OFFER OR SALE IS NOT PERMITTED.
48
| Multifamily – High Rise | Loan #2 | Cut-off Date Balance: | | $110,000,000 |
| 605 Pavonia Avenue | Journal Squared Tower 2 | Cut-off Date LTV: | | 38.0% |
| Jersey City, NJ 07306 | | U/W NCF DSCR: | | 3.37x |
| | | U/W NOI Debt Yield: | | 12.0% |
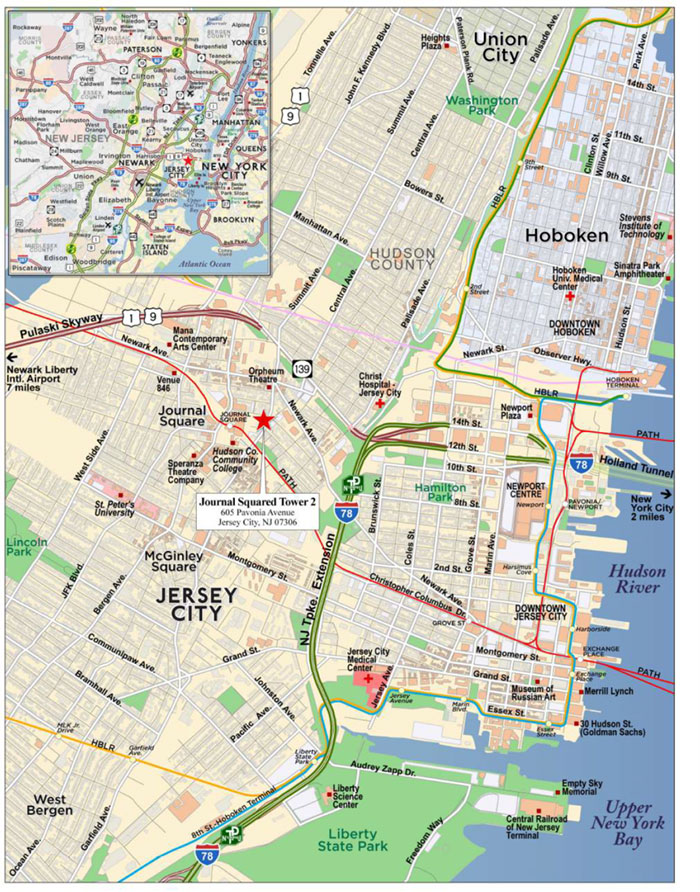
THE INFORMATION IN THIS STRUCTURAL AND COLLATERAL TERM SHEET IS NOT COMPLETE AND MAY BE AMENDED PRIOR TO THE TIME OF SALE. THIS TERM SHEET IS NOT AN OFFER TO SELL THESE SECURITIES AND IT IS NOT A SOLICITATION OF AN OFFER TO BUY THESE SECURITIES IN ANY JURISDICTION WHERE THE OFFER OR SALE IS NOT PERMITTED.
49
| No. 2 – Journal Squared Tower 2 |
| |
| Mortgage Loan Information | | Mortgaged Property Information |
| Mortgage Loan Seller: | Wells Fargo Bank, National Association | | Single Asset/Portfolio: | Single Asset |
Credit Assessment (Fitch/KBRA/S&P): | BBB-sf/A+(sf)/NR | | Property Type – Subtype: | Multifamily – High Rise |
| Original Principal Balance(1): | $110,000,000 | | Location: | Jersey City, NJ |
| Cut-off Date Balance(1): | $110,000,000 | | Size: | 704 Units |
| % of Initial Pool Balance: | 9.4% | | Cut-off Date Balance Per Unit(1): | $260,653 |
| Loan Purpose: | Refinance | | Maturity Date Balance Per Unit(1): | $260,653 |
| Borrower Sponsor: | Affiliates of the Kushner Real Estate Group and INDURE Build-to-Core Fund, LLC | | Year Built/Renovated: | 2021/NAP |
| Guarantor: | Murray Kushner | | Title Vesting: | Fee |
| Mortgage Rate: | 3.490% | | Property Manager: | KRE Property Management Company LLC |
| Note Date: | November 30, 2021 | | Current Occupancy (As of): | 98.4% (11/2/2021) |
| Seasoning: | 3 months | | YE 2020 Occupancy(6): | NAP |
| Maturity Date: | December 11, 2031 | | YE 2019 Occupancy(6): | NAP |
| IO Period: | 120 months | | YE 2018 Occupancy(6): | NAP |
| Loan Term (Original): | 120 months | | YE 2017 Occupancy(6): | NAP |
| Amortization Term (Original): | NAP | | As-Is Appraised Value: | $483,100,000 |
| Loan Amortization Type: | Interest Only | | As-Is Appraised Value Per Unit: | $686,222 |
| Call Protection(2): | L(27),D(86),O(7) | | As-Is Appraisal Valuation Date: | September 1, 2021 |
| Lockbox Type: | Springing(3) | | Underwriting and Financial Information(7) |
| Additional Debt(4): | Yes | | TTM NOI(6): | NAV |
| Additional Debt Type (Balance)(4): | Pari Passu ($73,500,000);
Subordinate ($166,500,000) | | YE 2020 NOI(6): | NAV |
| | | | YE 2019 NOI(6): | NAV |
| | | | YE 2018 NOI(6): | NAV |
| | | | U/W Revenues: | $27,620,045 |
| | | | U/W Expenses: | $5,574,050 |
| Escrows and Reserves(5) | | U/W NOI: | $22,045,994 |
| | Initial | Monthly | Cap | | U/W NCF: | $21,869,994 |
| Taxes | $148,128 | $74,062 | NAP | | U/W DSCR based on NOI/NCF(1): | 3.40x / 3.37x |
| Insurance | $35,746 | $35,742 | NAP | | U/W Debt Yield based on NOI/NCF(1): | 12.0% / 11.9% |
| Replacement Reserve | $0 | $14,667 | NAP | | U/W Debt Yield at Maturity based on NOI/NCF(1): | 12.0% / 11.9% |
| Existing TI/LC Obligations Reserve | $559,751 | $0 | NAP | | Cut-off Date LTV Ratio(1): | 38.0% |
| Rent Concession Reserve | $415,373 | $0 | NAP | | LTV Ratio at Maturity(1): | 38.0% |
| | | | | | | |
| | | | | | | |
| | | | | | | | |
| Sources and Uses |
| Sources | | | | | Uses | | | |
| Senior loan amount | $183,500,000 | | 52.4% | | Loan payoff(8) | $278,722,136 | | 79.6% |
| Subordinate loan amount | 166,500,000 | | 47.6 | | Cash investment in Tower III | 66,973,808 | | 19.1 |
| | | | | | Upfront reserves | 1,158,998 | | 0.3 |
| | | | | | Closing costs | 3,145,058 | | 0.9 |
| Total Sources | $350,000,000 | | 100.0% | | Total Uses | $350,000,000 | | 100.0% |
| (1) | The Journal Squared Tower 2 Mortgage Loan (as defined below) is part of the Journal Squared Tower 2 Whole Loan (as defined below). The Cut-off Date Balance Per Unit, Maturity Date Balance Per Unit, U/W DSCR based on NOI/NCF, U/W Debt Yield at Maturity based on NOI/NCF, U/W Debt Yield based on NOI/NCF, Cut-off Date LTV Ratio and LTV Ratio at Maturity numbers presented above are based on the Journal Squared Tower 2 Senior Loan (as defined below). See “Whole Loan Note Summary” table below. |
| (2) | Defeasance of the full $350.0 million Journal Squared Tower 2 Whole Loan is permitted after the date that is earlier of (i) two years from the closing date of the securitization that includes the last note to be securitized and (ii) January 11, 2025. |
| (3) | Upon the occurrence of a Cash Trap Event Period (as defined below in the “Lockbox and Cash Management” section) the borrower and manager will pay rents directly into the lockbox. |
| (4) | See “The Mortgage Loan”, “Subordinate and Mezzanine Indebtedness” below for further discussion of additional debt. |
| (5) | See “Escrows and Reserves” below for further discussion of reserve requirements. |
| (6) | Historical occupancies and NOI figures are not presented as the Journal Squared Tower 2 Property (as defined below) was constructed in 2021 and has been undergoing lease up. |
| (7) | While the Journal Squared Tower 2 Whole Loan was originated after the emergence of the novel coronavirus pandemic and the economic disruption resulting from measures to combat the pandemic, the pandemic is an evolving situation and could impact the Journal Squared Tower 2 Whole Loan more severely than assumed in the underwriting of the Journal Squared Tower 2 Whole Loan and could adversely affect the NOI, NCF and occupancy information, as well as the appraised value and the DSCR, LTV and Debt |
THE INFORMATION IN THIS STRUCTURAL AND COLLATERAL TERM SHEET IS NOT COMPLETE AND MAY BE AMENDED PRIOR TO THE TIME OF SALE. THIS TERM SHEET IS NOT AN OFFER TO SELL THESE SECURITIES AND IT IS NOT A SOLICITATION OF AN OFFER TO BUY THESE SECURITIES IN ANY JURISDICTION WHERE THE OFFER OR SALE IS NOT PERMITTED.
50
| Multifamily – High Rise | Loan #2 | Cut-off Date Balance: | | $110,000,000 |
| 605 Pavonia Avenue | Journal Squared Tower 2 | Cut-off Date LTV: | | 38.0% |
| Jersey City, NJ 07306 | | U/W NCF DSCR: | | 3.37x |
| | | U/W NOI Debt Yield: | | 12.0% |
Yield metrics presented above. See "Risk Factors—Risks Related to Market Conditions and Other External Factors—The Coronavirus Pandemic Has Adversely Affected the Global Economy and Will Likely Adversely Affect the Performance of the Mortgage Loans" in the Preliminary Prospectus.
| (8) | The Journal Squared Tower 2 Whole Loan was used to payoff the existing construction debt and the land loan on Tower III of the Journal Squared development. |
The Mortgage Loan. The mortgage loan (the “Journal Squared Tower 2 Mortgage Loan”) is part of a whole loan (the “Journal Squared Tower 2 Whole Loan”) comprised of 4 senior pari passu promissory notes with an aggregate original principal balance and outstanding principal balance as of the Cut-off Date of $183,500,000 (the “Journal Squared Tower 2 Senior Loan”) and 1 subordinate note with an original principal balance and outstanding principal balance as of the Cut-off Date of $166,500,000 (the “Journal Squared Tower 2 Subordinate Loan”). The Journal Squared Tower 2 Whole Loan has an aggregate outstanding principal balance as of the Cut-off Date of $350,000,000 and is secured by a first lien mortgage encumbering the borrower’s fee interest in a 71-story, 704-unit luxury resident tower in Jersey City, New Jersey (the “Journal Squared Tower 2 Property”). The Journal Squared Tower 2 Mortgage Loan (evidenced by non-controlling notes A-2 and A-3), having an aggregate outstanding principal balance as of the Cut-off Date of $110,000,000, is being contributed to this transaction.
The Journal Squared Tower 2 Whole Loan was originated by Wells Fargo Bank, National Association on November 30, 2021. The borrower sponsor utilized the proceeds of the Journal Squared Tower 2 Whole Loan to refinance existing construction and land debt, fund reserves, invest cash in Tower III (as defined below) and pay loan closing costs.
The table below summarizes the promissory notes that comprise the Journal Squared Tower 2 Whole Loan. The relationship between the holders of the Journal Squared Tower 2 Whole Loan is governed by a co-lender agreement. See “Description of the Mortgage Pool—The Whole Loans—The Journal Squared Tower 2 Pari Passu-A/B Whole Loan” and “Pooling and Servicing Agreement—Servicing of the Non-Serviced Mortgage Loans” in the Preliminary Prospectus.
Whole Loan Note Summary
| Notes | Original Balance | Cut-off Date Balance | Note Holder | Controlling Piece |
| Senior Notes |
| A-1 | $50,000,000 | $50,000,000 | WFCM 2022-JS2 | Yes |
| A-2 | $55,000,000 | $55,000,000 | BANK 2022-BNK40 | No |
| A-3 | $55,000,000 | $55,000,000 | BANK 2022-BNK40 | No |
| A-4 | $23,500,000 | $23,500,000 | WFB | No |
| Total Senior Notes | $183,500,000 | $183,500,000 | | |
| |
| Subordinate Notes |
| B | $166,500,000 | $166,500,000 | WFCM 2022-JS2 | No |
| Total (Whole Loan) | $350,000,000 | $350,000,000 | | |
The Borrower and Borrower Sponsors. The borrower is Journal Square II Urban Renewal LLC, a New Jersey limited liability company. The borrower is structured to be a single purpose bankruptcy-remote entity with two independent directors in its organizational structure. Legal counsel to the borrower delivered a non-consolidation opinion in connection with the origination of the Journal Squared Tower 2 Whole Loan. The borrower sponsor is comprised of entities controlled by the Affiliates of the Kushner Real Estate Group (the “KRE Group”) and INDURE Build-to-Core Fund, LLC and the non-recourse carveout guarantor under the Journal Squared Tower 2 Whole Loan is Murray Kushner.
The KRE Group is a New Jersey real estate development and management company founded in 1979 by Murray Kushner. The KRE Group has developed, owns, and manages over six million square feet of commercial, retail and industrial property and owns over 9,000 apartments, while employing over 300 full-time employees. In addition, the KRE Group has several thousand additional residential units in its development pipeline, more than 3,000 of which are in Jersey City alone. Murray Kushner has been a real estate investor and developer for more than 40 years and is Chairman of the KRE Group, the successor company to SK Properties.
The Property. The Journal Squared Tower 2 Property is a 71-story, luxury residential tower containing 704 units, 17,500 square feet of ground floor retail space and an in-building 351-space parking garage situated in Jersey City, New Jersey. According to the appraiser, residents have access to approximately 70,000 square feet of amenities spread across three floors at the Journal Squared Tower 2 Property, including a 68th-floor sky lounge with unobstructed views of the Manhattan skyline, two outdoor pools and sundecks with BBQ grills and fire pits, two fitness centers, yoga studio, climbing wall, library, screening room, a kids’ playroom, and multiple lounges and co-working spaces. Unit finishes include hardwood flooring, two-pipe central air conditioning and heating and in-home full-sized washer/dryers. Kitchens feature modern cabinetry and stainless-steel appliances, inclusive of GE refrigerator, range, microwave and dishwasher.
The Journal Squared Tower 2 Property is the second phase of the sponsor’s three phase Journal Squared development. Journal Squared Tower I (“Phase I” or “Tower I”) was completed in mid-March 2017 and consists of 538 units, and Journal Squared Tower III (“Phase III” or “Tower III”) will have 598 units and broke ground in the beginning of October 2021. The sponsor has completed its initial lease up and the Journal Squared Tower 2 Property, as of the November 2, 2021 rent roll, is 98.4% leased with eleven units being marketed (including three model units and one admin unit). The Journal Squared Tower 2 Property also includes 17,500 square feet of commercial space that is currently 53.6% leased to one tenant with the remaining 8,119 square feet of space currently being marketed for lease.
THE INFORMATION IN THIS STRUCTURAL AND COLLATERAL TERM SHEET IS NOT COMPLETE AND MAY BE AMENDED PRIOR TO THE TIME OF SALE. THIS TERM SHEET IS NOT AN OFFER TO SELL THESE SECURITIES AND IT IS NOT A SOLICITATION OF AN OFFER TO BUY THESE SECURITIES IN ANY JURISDICTION WHERE THE OFFER OR SALE IS NOT PERMITTED.
51
| Multifamily – High Rise | Loan #2 | Cut-off Date Balance: | | $110,000,000 |
| 605 Pavonia Avenue | Journal Squared Tower 2 | Cut-off Date LTV: | | 38.0% |
| Jersey City, NJ 07306 | | U/W NCF DSCR: | | 3.37x |
| | | U/W NOI Debt Yield: | | 12.0% |
In 2013, the City of Jersey City granted an affiliate of the sponsor three financial agreements for tax abatements and redevelopment bonds, one for each of the Journal Squared developments. The PILOT agreement with respect to Tower II (the ‘‘JS2 PILOT’’) allowed for the multi-year construction period with the first full year of service charge payments due under the JS2 PILOT beginning in 2022. Base annual service charges under the JS2 PILOT in the first 10 years are $787 per unit, or $554,048 annually. Based on the JS2 PILOT, fixed base annual service charges (‘‘Annual Service Charges’’) are on a schedule for approximately 22 years through 2043. Step-ups of Annual Service Charges are scheduled to occur in 2032 and 2037, and then are scheduled to be 10.0% of gross revenue from 2044 until the expiration of the JS2 PILOT.
In total, the Journal Squared Tower 2 Property consists of approximately 516,000 rentable residential square feet spread across 135 studios, 407 one-bedrooms, 142 two-bedrooms and 20 three-bedrooms, with 351 parking spaces (this equates to a parking ratio of 0.50 per unit).
Condominium Regime. The Journal Squared Tower 2 Property is comprised of the borrower’s fee simple interest in a condominium unit within the three-unit condominium known as Journal Squared Condominium (the “Condominium”). The borrower-owned unit includes 43.4409% of the common elements, which entitles the borrower to 43 of the 100 votes in the condominium regime (together with the right to appoint 1 of 3 board members). The loan documents provide that it is an event of default if, without the prior written consent of the lender, the borrowers vote for or otherwise consent to, any modification or amendment to any of the terms or provisions of the condominium documents in violation of the terms of the loan documents.
The following table presents certain information relating to the unit mix of Journal Squared Tower 2 Property:
Unit Mix Summary(1)
| Unit Type | Total
No. of
Units | Occupied
Units | % of
Total
Units | Occupancy | Average
Unit Size
(SF) | Average
Underwritten
Monthly Rent
per Unit |
| Studio | 135 | 134 | 19.2% | 99.3% | 496 | $2,376 |
| 1 Bedroom | 407 | 401 | 57.8% | 98.5% | 673 | $2,911 |
| 2 Bedrooms | 142 | 141 | 20.2% | 99.3% | 1,034 | $4,320 |
| 3 Bedrooms | 20 | 17 | 2.8% | 85.0% | 1,433 | $5,291 |
| Total/Weighted Average | 704 | 693 | 100.0% | 98.4% | 733 | $3,153 |
| (1) | Information obtained from the underwritten rent roll. |
The following table presents historical occupancy percentages at the Journal Squared Tower 2 Property:
Historical Occupancy
12/31/2018(1) | 12/31/2019(1) | 12/31/2020(1) | 11/2/2021(2) |
| NAP | NAP | NAP | 98.4% |
| (1) | Historical occupancies are not presented as the Journal Squared Tower 2 Property was constructed in 2021. |
| (2) | Information obtained from the underwritten rent roll. |
THE INFORMATION IN THIS STRUCTURAL AND COLLATERAL TERM SHEET IS NOT COMPLETE AND MAY BE AMENDED PRIOR TO THE TIME OF SALE. THIS TERM SHEET IS NOT AN OFFER TO SELL THESE SECURITIES AND IT IS NOT A SOLICITATION OF AN OFFER TO BUY THESE SECURITIES IN ANY JURISDICTION WHERE THE OFFER OR SALE IS NOT PERMITTED.
52
| Multifamily – High Rise | Loan #2 | Cut-off Date Balance: | | $110,000,000 |
| 605 Pavonia Avenue | Journal Squared Tower 2 | Cut-off Date LTV: | | 38.0% |
| Jersey City, NJ 07306 | | U/W NCF DSCR: | | 3.37x |
| | | U/W NOI Debt Yield: | | 12.0% |
Underwritten Net Cash Flow. The following table presents certain information relating to the underwritten net cash flow at the Journal Squared Tower 2 Property:
Cash Flow Analysis(1)
| | U/W | %(2) | U/W $
per Unit |
| Base Rent | $26,688,888 | 92.2% | $37,910 |
| Grossed Up Vacant Space | 0 | 0 | 0 |
| Gross Potential Rent | $26,688,888 | 92.2% | $37,910 |
| Other Income(3) | 2,265,601 | 7.8 | 3,218 |
| Net Rental Income | $28,954,489 | 100.0% | $41,129 |
| (Vacancy & Credit Loss) | (1,334,444) | (5.0)(4) | (1,896) |
| Effective Gross Income | $27,620,045 | 95.4% | $39,233 |
| | | | |
| Real Estate Taxes(5) | 598,021 | 2.2 | 849 |
| Insurance | 408,484 | 1.5 | 580 |
| Management Fee | 828,601 | 3.0 | 1,177 |
| Other Operating Expenses | 3,738,944 | 13.5 | 5,311 |
| Total Operating Expenses | $5,574,050 | 20.2% | $7,918 |
| | | | |
| Net Operating Income | $22,045,994 | 79.8% | $31,315 |
| Capital Expenditures | 176,000 | 0.6 | 250 |
| Net Cash Flow | $21,869,994 | 79.2% | $31,065 |
| | | | |
| NOI DSCR(6) | 3.40x | | |
| NCF DSCR(6) | 3.37x | | |
| NOI Debt Yield(6) | 12.0% | | |
| NCF Debt Yield(6) | 11.9% | | |
| (1) | For the avoidance of doubt, no COVID-19 specific adjustments have been incorporated in the lender underwriting. |
| (2) | Represents (i) percent of Net Rental Income for all revenue fields, (ii) percent of Gross Potential Rent for Vacancy & Credit Loss and (iii) percent of Effective Gross Income for all other fields. |
| (3) | Other Income includes a parking income, commercial tenant income attributed to the executed lease with Food Story, which is expected to open in 2022, amenity fees, lease application and credit fees, tenant late charges, bad check charges, lease breakage fees, tenant service charges, pet fees and storage fees. |
| (4) | The underwritten economic vacancy is 5.0%. The Journal Squared Tower 2 Property was 98.4% leased as of November 2, 2021. |
| (5) | Reflects anticipated Year 1 payment due under the JS2 PILOT (see “The Property” section above for additional information). The appraiser’s concluded unabated tax amount is $3,327,213, which results in a NOI DSCR, NCF DSCR, NOI Debt Yield and NCF Debt Yield based on the Journal Squared Tower 2 Senior Loan of 2.97x, 2.95x, 10.5% and 10.4%, respectively. |
| (6) | The NOI DSCR, NCF DSCR, NOI Debt Yield and NCF Debt Yield are based on the Journal Squared Tower 2 Senior Loan. |
Appraisal. According to the appraisal, the Journal Squared Tower 2 Property had an “As Is” appraised value of $483,100,000 as of September 1, 2021.
Environmental Matters. According to the Phase I environmental site assessment dated November 1, 2021, there was no evidence of any recognized environmental conditions at the Journal Squared Tower 2 Property.
Market Overview and Competition. The Journal Squared Tower 2 Property is located within the New York City-Jersey City-White Plains metropolitan area and is part of the Jersey City/Journal Square Multifamily submarket. The Journal Squared Tower 2 Property is situated adjacent to the Journal Square Port Authority Trans Hudson (PATH) Station, three stops away from PATH’s remodeled World Trade Center Station in Downtown Manhattan, eight stops away from PATH’s 33rd Street Station in Midtown Manhattan, and two stops from Newark Penn Station (where passengers can connect to Amtrak for national service and NJ Transit for regional service (including direct access to Newark Liberty International Airport).
The Jersey City Redevelopment Agency has announced a $72 million redevelopment project, expected to complete in 2025, to transform the historic Loew’s Theater into a 3,300-seat state-of-the-art performance venue. Additionally, France’s Centre Pompidou is opening a 58,000 square foot museum in partnership with Jersey City that is expected to open in 2024.
As of January 31, 2022, the Jersey City/Journal Square Multifamily submarket had approximately 17 buildings with approximately 2,033 units under construction with an overall vacancy rate of 8.6% and average asking rents of $2,406 per unit (per month).
THE INFORMATION IN THIS STRUCTURAL AND COLLATERAL TERM SHEET IS NOT COMPLETE AND MAY BE AMENDED PRIOR TO THE TIME OF SALE. THIS TERM SHEET IS NOT AN OFFER TO SELL THESE SECURITIES AND IT IS NOT A SOLICITATION OF AN OFFER TO BUY THESE SECURITIES IN ANY JURISDICTION WHERE THE OFFER OR SALE IS NOT PERMITTED.
53
| Multifamily – High Rise | Loan #2 | Cut-off Date Balance: | | $110,000,000 |
| 605 Pavonia Avenue | Journal Squared Tower 2 | Cut-off Date LTV: | | 38.0% |
| Jersey City, NJ 07306 | | U/W NCF DSCR: | | 3.37x |
| | | U/W NOI Debt Yield: | | 12.0% |
The appraisal identified six directly competitive multifamily comparables. Average asking rents ranged from $1,762 to $5,283 per unit and are further detailed in the table below:
Competitive Set(1)
| | Journal
Squared
Tower 2
(Subject) | The Beacon | 3 Journal
Square
Apartments | MRK | 90 Columbus | Journal
Squared
Tower I | 70 Columbus |
| Location | Jersey City, NJ | Jersey City, NJ | Jersey City, NJ | Jersey City, NJ | Jersey City, NJ | Jersey City, NJ | Jersey City, NJ |
| Distance to Subject | -- | 0.9 miles | 0.2 miles | 0.5 Miles | 1.5 miles | 0.2 Miles | 1.5 miles |
| Property Type | Multifamily/High Rise | Multifamily/High Rise | Multifamily/High Rise | Multifamily/High Rise | Multifamily/High Rise | Multifamily/High Rise | Multifamily/High Rise |
| Year Built/Renovated | 2021/NAP | 1920/2018 | 2017/NAP | 2020/NAP | 2018/NAP | 2017/NAP | 2015/NAP |
| Number of Units | 704(2) | 1,155 | 240 | 132 | 539 | 538 | 545 |
| Average Monthly Rent (per unit) | | | | | | | |
| Studio | $2,376(2) | $1,914 | $2,108 | $1,762 | $2,600 | $2,270 | $2,430 |
| 1 Bedroom | $2,911(2) | $2,515 | $2,802 | $2,692 | $2,989 | $2,633 | $2,790 |
| 2 Bedrooms | $4,320(2) | $2,953 | $3,002 | $3,021 | $4,225 | $4,261 | $4,065 |
| 3 Bedrooms | $5,291(2) | $3,995 | $4,841 | $4,000 | $5,025 | $5,283 | NAP |
| Occupancy | 98.4% | 96% | 98% | 99% | 98% | 95% | 98% |
| (1) | Information obtained from the appraisal. |
| (2) | Information obtained from the underwritten rent roll. |
Escrows.
Taxes – The loan documents require an upfront reserve of $148,128 for real estate taxes plus ongoing monthly reserves in an amount equal to 1/12 of the PILOT payments that the lender estimates will be payable during the next twelve months, initially $74,062.
Insurance – The loan documents require an upfront reserve of $35,746 for insurance premiums plus ongoing monthly reserves in an amount equal to 1/12 of the amounts that the lender estimates will be payable during the next twelve months. Ongoing monthly reserves for insurance are not required as long as (i) no event of default under the Journal Squared Tower 2 Whole Loan documents has occurred and is continuing; (ii) the Journal Squared Tower 2 Property is part of a blanket or umbrella policy approved by the lender; (iii) the borrower provides the lender with evidence of renewal of insurance policies; and (iv) the borrower provides the lender with paid receipts for insurance premiums by no later than 10 business days prior to the policy expiration dates. As of the origination date of the Journal Squared Tower 2 Whole Loan, the Journal Squared Tower 2 Property is not covered by a blanket or umbrella policy.
Replacement Reserve – The loan documents require ongoing monthly reserves in an amount equal to $14,667 ($250.00 per unit per year) for replacements.
Existing TI/LC Obligations Reserve - The loan documents require an upfront deposit of $559,751 ($31.99 per square foot of the 17,500 square foot retail space), of which $472,290 ($26.99 per square foot) represents tenant improvements and leasing commissions payable by the borrower under the ground floor grocery store lease and $87,461 ($5.00 per square foot) which represent the outstanding leasing commissions with respect to such ground floor grocery store lease at the Journal Squared Tower 2 Property.
Rent Concession Reserve – The loan documents require an upfront deposit of $415,373 ($590.02 per unit) for future rent credits, gap rent or abatements under existing leases at the Journal Squared Tower 2 Property.
Lockbox and Cash Management. Upon the occurrence of a Cash Trap Event Period (as defined below), the borrower and property managers are required to deposit all rents directly into a lender-controlled lockbox account. During a Cash Trap Event Period, funds in the lockbox accounts are required to be swept to a lender-controlled cash management account, and (A) during either (x) the occurrence and continuance of an event of default under the Journal Squared Tower 2 Whole Loan documents or (y) a Full Cash Trap Event Period (as defined below) all excess funds are required to be swept to an excess cash flow subaccount controlled by the lender or (B) during a Partial Cash Trap Event Period, 50% of excess cash flow is required to be disbursed to the borrower and 50% of the excess cash flow is required to be swept to the excess cash flow subaccount controlled by the lender.
A “Cash Trap Event Period” will commence upon the earlier of the following:
| (i) | the occurrence and continuance of an event of default under the Journal Squared Tower 2 Whole Loan documents; |
| (ii) | the net cash flow debt yield (“NCF DY”) falling below 4.25% for one calendar quarter at any time after November 30, 2022 (first anniversary of origination date) (a “Full Cash Trap Event Period”); or |
| (iii) | the NCF DY falling below 5.0% for one calendar quarter at any time after November 30, 2022 (first anniversary of origination date) (a “Partial Cash Trap Event Period”). |
THE INFORMATION IN THIS STRUCTURAL AND COLLATERAL TERM SHEET IS NOT COMPLETE AND MAY BE AMENDED PRIOR TO THE TIME OF SALE. THIS TERM SHEET IS NOT AN OFFER TO SELL THESE SECURITIES AND IT IS NOT A SOLICITATION OF AN OFFER TO BUY THESE SECURITIES IN ANY JURISDICTION WHERE THE OFFER OR SALE IS NOT PERMITTED.
54
| Multifamily – High Rise | Loan #2 | Cut-off Date Balance: | | $110,000,000 |
| 605 Pavonia Avenue | Journal Squared Tower 2 | Cut-off Date LTV: | | 38.0% |
| Jersey City, NJ 07306 | | U/W NCF DSCR: | | 3.37x |
| | | U/W NOI Debt Yield: | | 12.0% |
A Cash Trap Event Period will end upon the occurrence of the following:
| ● | with regard to clause (i) above, the cure of such event of default; or |
| ● | with regard to clauses (ii) and (iii) above, (x) the NCF DY being at least 5.0% for one calendar quarter or (y) the borrower delivering to lender a letter of credit in an amount such that, if the face amount of such letter of credit were applied to pay down the principal balance of the Journal Squared Tower 2 Whole Loan, the NCF DY would be equal to or greater than 5.0%; provided that with regard to clause (ii) above (a “Full Cash Trap Period”) if the NCF DY is at least 4.25% but less than 5.0% for one calendar quarter or (y) the borrower delivering to lender a letter of credit in an amount such that, if the face amount of such letter of credit were applied to pay down the principal balance of the Journal Squared Tower 2 Whole Loan, the NCF DY would be equal to or greater than 4.25% but less than 5.0% (an “Interim DY LOC Cure”), then only a Partial Cash Trap Period will be in effect. |
Property Management. The Journal Squared Tower 2 Property is self-managed by KRE Property Management Company LLC, an affiliate of the borrowers.
Partial Release. Not permitted.
Real Estate Substitution. Not permitted.
Subordinate and Mezzanine Indebtedness. The Journal Squared Tower 2 Property also secures the Journal Squared Tower 2 Non-Serviced Pari Passu Companion Loans, which have an aggregate Cut-off Date principal balance of $73,500,000 and the Journal Squared Tower 2 Subordinate Companion Loan, which has a Cut-off Date principal balance of $166,500,000. The Journal Squared Tower 2 Non-Serviced Pari Passu Companion Loans and the Journal Squared Tower 2 Subordinate Companion Loan are coterminous with the Journal Squared Tower 2 Mortgage Loan. The Journal Squared Tower 2 Non-Serviced Pari Passu Companion Loans and Journal Squared Tower 2 Subordinate Companion Loan accrue interest at the same rate as the Journal Squared Tower 2 Mortgage Loan. The Journal Squared Tower 2 Mortgage Loan and the Journal Squared Tower 2 Non-Serviced Pari Passu Companion Loans are each pari passu in right of payment and together are senior in right of payment to the Journal Squared Tower 2 Subordinate Companion Loan. The holders of the Journal Squared Tower 2 Mortgage Loan, the Journal Squared Tower 2 Non-Serviced Pari Passu Companion Loans and the Journal Squared Tower 2 Subordinate Companion Loan have entered into a co-lender agreement which sets forth the allocation of collections on the Journal Squared Tower 2 Whole Loan. See “Description of the Mortgage Pool—The Whole Loans— The Non-Serviced A/B Whole Loans—The Journal Squared Tower 2 AB Whole Loan”.
The following table presents certain information relating to the Journal Squared Tower 2 Subordinate Companion Loan:
| | B-Note Original
Principal
Balance | B-Note
Interest Rate | Original
Term
(mos.) | Original
Amort. Term
(mos.) | Original IO
Term (mos.) | Whole Loan
UW NCF
DSCR | Whole Loan
UW NOI DY | Whole Loan
Cutoff
Date LTV |
| Journal Squared Tower 2 Subordinate Companion Loan | $166,500,000 | 3.490% | 120 | 0 | 120 | 1.77x | 6.3% | 72.4% |
Future Mezzanine or Subordinate Indebtedness Permitted. Not permitted.
Ground Lease. None.
Letter of Credit. None; however, a letter of credit may be provided to avoid or terminate a Cash Trap Event Period due to clause (ii) or (iii) as described above under “Lockbox and Cash Management” or in place of any amount reserved under the loan documents provided the aggregate amount of any letters of credit do not at any time exceed 10.0% of the outstanding principal balance of the Journal Squared Tower 2 Whole Loan, unless the borrower delivers a new non-consolidation opinion which takes into account such letters of credit.
Terrorism Insurance. The loan documents require that the “all risk” insurance policy required to be maintained by the borrower, in an amount equal to the full replacement cost of the Journal Squared Tower 2 Property, contain no exclusion for damage or destruction caused by acts of terrorism, as well as business interruption insurance covering a period of restoration of 18 months and a 6-month extended period of indemnity (provided that if TRIPRA or a similar statute is not in effect, then the borrower’s requirement will be capped at insurance premiums equal to two times the amount of the insurance premium payable in respect of the property and business interruption/rental loss insurance required under the related loan documents).
THE INFORMATION IN THIS STRUCTURAL AND COLLATERAL TERM SHEET IS NOT COMPLETE AND MAY BE AMENDED PRIOR TO THE TIME OF SALE. THIS TERM SHEET IS NOT AN OFFER TO SELL THESE SECURITIES AND IT IS NOT A SOLICITATION OF AN OFFER TO BUY THESE SECURITIES IN ANY JURISDICTION WHERE THE OFFER OR SALE IS NOT PERMITTED.
55
| Office - Medical | Loan #3 | Cut-off Date Balance: | | $110,000,000 |
Property Addresses – Various Various, Various | Life Science Office Portfolio | Cut-off Date LTV: | | 62.3% |
| | | U/W NCF DSCR: | | 2.50x |
| | | U/W NOI Debt Yield: | | 9.2% |
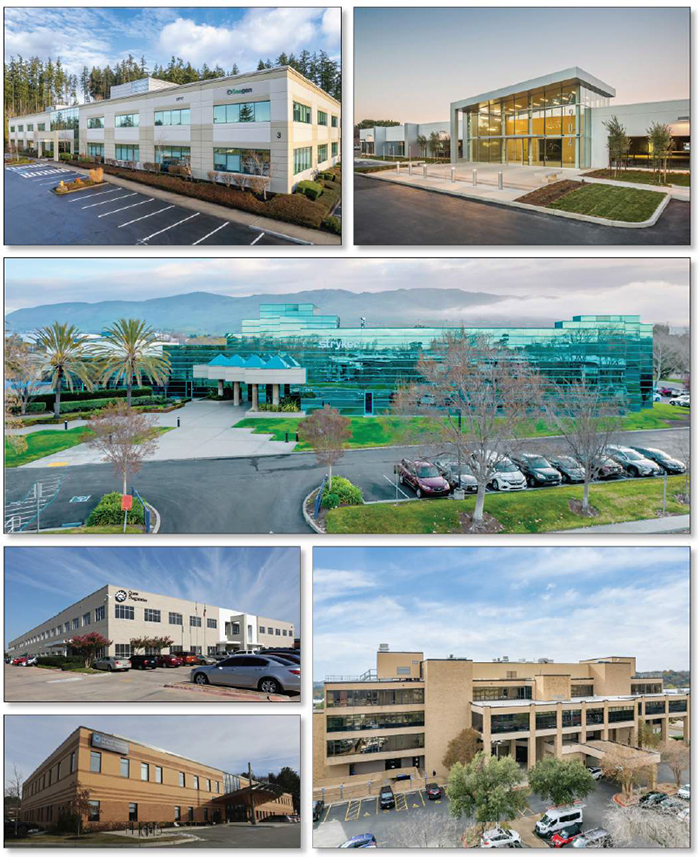
THE INFORMATION IN THIS STRUCTURAL AND COLLATERAL TERM SHEET IS NOT COMPLETE AND MAY BE AMENDED PRIOR TO THE TIME OF SALE. THIS TERM SHEET IS NOT AN OFFER TO SELL THESE SECURITIES AND IT IS NOT A SOLICITATION OF AN OFFER TO BUY THESE SECURITIES IN ANY JURISDICTION WHERE THE OFFER OR SALE IS NOT PERMITTED.
56
| Office - Medical | Loan #3 | Cut-off Date Balance: | | $110,000,000 |
Property Addresses – Various Various, Various | Life Science Office Portfolio | Cut-off Date LTV: | | 62.3% |
| | | U/W NCF DSCR: | | 2.50x |
| | | U/W NOI Debt Yield: | | 9.2% |
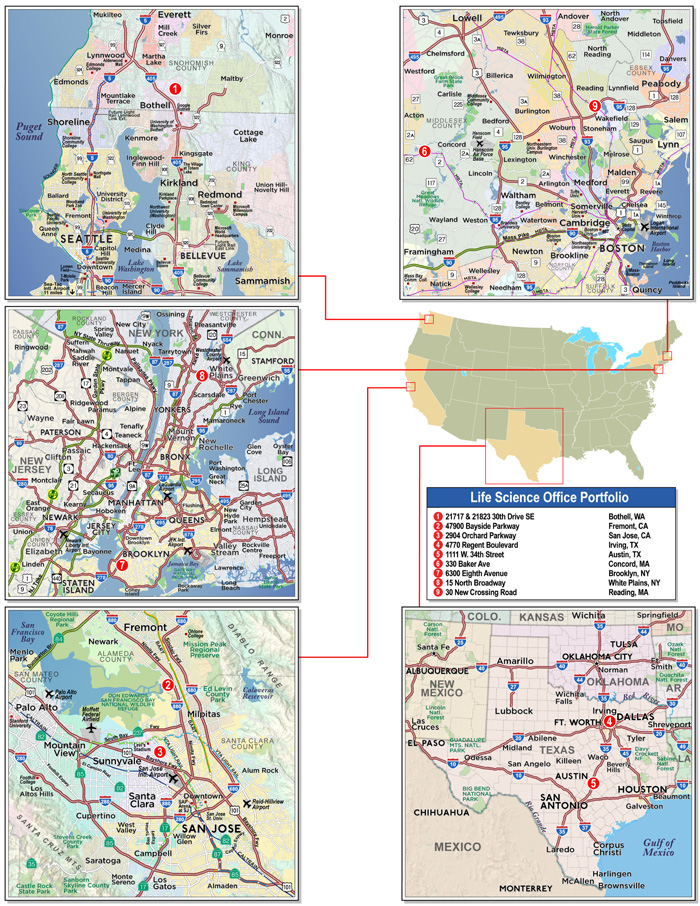
THE INFORMATION IN THIS STRUCTURAL AND COLLATERAL TERM SHEET IS NOT COMPLETE AND MAY BE AMENDED PRIOR TO THE TIME OF SALE. THIS TERM SHEET IS NOT AN OFFER TO SELL THESE SECURITIES AND IT IS NOT A SOLICITATION OF AN OFFER TO BUY THESE SECURITIES IN ANY JURISDICTION WHERE THE OFFER OR SALE IS NOT PERMITTED.
57
| No. 3 – Life Science Office Portfolio |
| |
| Mortgage Loan Information | | Mortgaged Property Information |
| Mortgage Loan Sellers: | Wells Fargo Bank, National Association and Bank of America, National Association | | Single Asset/Portfolio: | Portfolio |
Credit Assessment (Fitch/KBRA/S&P): | NR/NR/NR | | Property Type – Subtype: | Office - Medical |
| Original Principal Balance(1): | $110,000,000 | | Location: | Various |
| Cut-off Date Balance(1): | $110,000,000 | | Size: | 737,871 SF |
| % of Initial Pool Balance: | 9.4% | | Cut-off Date Balance Per SF(1): | $257.23 |
| Loan Purpose: | Recapitalization | | Maturity Date Balance Per SF(1): | $257.23 |
| Borrower Sponsor: | The LSMD Fund REIT LLC | | Year Built/Renovated: | Various/Various |
| Guarantor: | The LSMD Fund REIT LLC | | Title Vesting: | Fee |
| Mortgage Rate: | 3.4570% | | Property Manager: | The RMR Group LLC |
| Note Date: | January 28, 2022 | | Current Occupancy (As of): | 99.8% (1/20/2022) |
| Seasoning: | 1 month | | YE 2020 Occupancy: | 99.4% |
| Maturity Date: | February 11, 2032 | | YE 2019 Occupancy: | 99.7% |
| IO Period: | 120 months | | YE 2018 Occupancy: | 99.7% |
| Loan Term (Original): | 120 months | | As-Is Appraised Value(4): | $304,800,000 |
| Amortization Term (Original): | NAP | | As-Is Appraised Value Per SF(4): | $413.08 |
| Loan Amortization Type: | Interest Only | | As-Is Appraisal Valuation Date(4): | Various |
| Call Protection(2): | L(25),D(88),O(7) | | | |
| Lockbox Type: | Hard/In Place | | Underwriting and Financial Information(5) |
| Additional Debt: | Yes | | TTM NOI (10/31/2021): | $16,258,955 |
| Additional Debt Type (Balance): | Pari Passu ($79,800,000) | | YE 2020 NOI: | $16,251,911 |
| | | YE 2019 NOI: | $16,288,869 |
| | | | YE 2018 NOI: | $16,685,138 |
| | | | U/W Revenues: | $24,677,246 |
| | | | U/W Expenses: | $7,196,922 |
| Escrows and Reserves(3) | | U/W NOI: | $17,480,324 |
| | Initial | Monthly | Cap | | U/W NCF: | $16,612,710 |
| Taxes | $0 | Springing | NAP | | U/W DSCR based on NOI/NCF(1): | 2.63x / 2.50x |
| Insurance | $0 | Springing | NAP | | U/W Debt Yield based on NOI/NCF(1): | 9.2% / 8.8% |
| Replacement Reserve | $0 | Springing | NAP | | U/W Debt Yield at Maturity based on NOI/NCF(1): | 9.2% / 8.8% |
| Leasing Reserve | $0 | Springing | NAP | | Cut-off Date LTV Ratio(1): | 62.3% |
| Rent Concession Reserve | $32,725 | $0 | NAP | | LTV Ratio at Maturity(1): | 62.3% |
| Outstanding TI/LC Reserve | $918,824 | $0 | NAP | | | |
| | | | | | | |
| | | | | | | | |
| Sources and Uses |
| Sources | | | | | Uses | | | |
| Original loan amount | $189,800,000 | | 64.2% | | Recapitalization Price(6) | $292,000,000 | | 98.7% |
| Sponsor Equity | 105,994,909 | | 35.8 | | Upfront reserves | 951,549 | | 0.3 |
| | | | | | Closing costs | 2,843,360 | | 1.0 |
| Total Sources | $295,794,909 | | 100.0% | | Total Uses | $295,794,909 | | 100.0% |
| | | | | | | | | | | | |
| (1) | The Life Science Office Portfolio Mortgage Loan (as defined below) is part of the Life Science Office Portfolio Whole Loan (as defined below) with an original aggregate principal balance of $189,800,000. The Cut-off Date Balance PSF, Maturity Date Balance PSF, U/W Debt Yield based on NOI/NCF, U/W Debt Yield at Maturity Date based on NOI/NCF, U/W DSCR based on NOI/NCF, Cut-off Date LTV Ratio and LTV Ratio at Maturity numbers presented above are based on the Life Science Office Portfolio Whole Loan. |
| (2) | At any time after the earlier of (i) March 11, 2025 and (ii) two years from the closing date of the securitization that includes the last pari passu note of the Life Science Office Portfolio Whole Loan to be securitized, and prior to July 11, 2031, the borrower has the right to defease the Life Science Office Portfolio Whole Loan in part or in full. |
| (3) | See “Escrows” section. |
| (4) | Represents the aggregate “As-is” values of appraisals dated between October 13, 2021 and October 27, 2021. |
| (5) | While the Life Science Office Portfolio Mortgage Loan was originated after the emergence of the novel coronavirus pandemic and the economic disruption resulting from measures to combat the pandemic, the pandemic is an evolving situation and could impact the Life Science Office Portfolio Mortgage Loan more severely than assumed in the underwriting of the Life Science Office Portfolio Mortgage Loan. The pandemic and resulting economic disruption could also adversely affect the NOI, NCF and occupancy information, as well as the appraised value and the DSCR, LTV and Debt Yield metrics presented above. See “Risk Factors—Risks Related to Market Conditions and Other External Factors—Coronavirus Pandemic Has Adversely Affected the Global Economy and Will Likely Adversely Affect the Performance of the Mortgage Loans” in the Preliminary Prospectus. |
| (6) | The Life Science Office Portfolio was recapitalized at a price of $292,000,000. DHC (as defined below) retained a 20% interest in connection with the recapitalization. |
THE INFORMATION IN THIS STRUCTURAL AND COLLATERAL TERM SHEET IS NOT COMPLETE AND MAY BE AMENDED PRIOR TO THE TIME OF SALE. THIS TERM SHEET IS NOT AN OFFER TO SELL THESE SECURITIES AND IT IS NOT A SOLICITATION OF AN OFFER TO BUY THESE SECURITIES IN ANY JURISDICTION WHERE THE OFFER OR SALE IS NOT PERMITTED.
58
| Office - Medical | Loan #3 | Cut-off Date Balance: | | $110,000,000 |
Property Addresses – Various Various, Various | Life Science Office Portfolio | Cut-off Date LTV: | | 62.3% |
| | | U/W NCF DSCR: | | 2.50x |
| | | U/W NOI Debt Yield: | | 9.2% |
The Mortgage Loan. The mortgage loan (the “Life Science Office Portfolio Mortgage Loan”) is part of a whole loan (the “Life Science Office Portfolio Whole Loan”) that is evidenced by four pari passu promissory notes in the aggregate original principal amount of $189,800,000. The Life Science Office Portfolio Whole Loan is secured by a first priority fee mortgage encumbering nine office properties totaling 737,871 square feet, located across five states (the “Life Science Office Portfolio Properties”). The Life Science Office Portfolio Whole Loan will be serviced under the pooling and servicing agreement for the BANK 2022-BNK40 securitization trust. See “Description of the Mortgage Pool—The Whole Loans—The Serviced Pari Passu Whole Loans” and “Pooling and Servicing Agreement” in the Preliminary Prospectus.
Note Summary
| Notes | Original Balance | Cut-off Date Balance | Note Holder | Controlling Piece |
| A-1-1 | $60,500,000 | $60,500,000 | BANK 2022-BNK40 | Yes |
| A-2 | $49,500,000 | $49,500,000 | BANK 2022-BNK40 | No |
| A-1-2 | $43,890,000 | $43,890,000 | WFB | No |
| A-3 | $35,910,000 | $35,910,000 | BANA | No |
| Total | $189,800,000 | $189,800,000 | | |
The Borrowers and Borrower Sponsor. The borrowers comprise three single purpose entities: The LSMD Fund 30 Newcrossing LLC, The LSMD Fund Propco LLC and The LSMD Fund Concord LLC (collectively, the “Life Science Office Portfolio Borrower”), each a Delaware limited liability company. The Life Science Office Portfolio Borrower has two independent directors and legal counsel to the Life Science Office Portfolio Borrower delivered a non-consolidation opinion in connection with the origination of the Life Science Office Portfolio Whole Loan. The borrower sponsor and nonrecourse carve-out guarantor of the Life Science Office Portfolio Whole Loan is The LSMD Fund REIT LLC, which is 20% owned by Diversified Healthcare Trust (“DHC”) and controlled by the RMR Group LLC (“RMR”). The Guarantor’s liability with respect to bankruptcy related full recourse carveouts shall not exceed 15% of the then outstanding loan amount.
DHC (Nasdaq: DHC) is a real estate investment trust managed by RMR that is focused on owning healthcare properties located throughout the United States. As of September 30, 2021, DHC’s $8.2 billion portfolio included 392 properties in 36 states and Washington, D.C., occupied by approximately 600 tenants, and totaling approximately 10.9 million square feet of life science and medical office properties and more than 27,700 senior living units.
RMR (Nasdaq: RMR) is a U.S. alternative asset management company with a focus on commercial real estate and related businesses. RMR has over 600 real estate professionals in more than 30 offices nationwide. As of September 30, 2021, RMR had $32.7 billion in assets under management.
The Properties. The Life Science Office Portfolio Properties comprise eight single tenant and one multi-tenant medical office properties located across five states. The Life Science Office Portfolio Properties are located in California (two properties, 27.3% of net rentable area), Texas (two properties, 25.4% of net rentable area), Washington (one property, 19.6% of net rentable area), New York (two properties, 16.5% of net rentable area), and Massachusetts (two properties, 11.2% of net rentable area). Constructed from 1954 to 2013 and renovated from 2007 to 2016, the Life Science Office Portfolio Properties total 737,871 square feet and as of January 20, 2022 were 99.8% leased to 15 tenants, with investment grade tenants comprising 55.5% of net rentable area and 49.9% of underwritten base rent. The Life Science Portfolio Properties have averaged 99.8% occupancy since 2010.
The Life Science Office Portfolio Properties range in size from 33,600 square feet to 144,900 square feet and comprise ten, 1- to 4-story buildings. The Life Science Office Portfolio Properties have a weighted average parking ratio of 3.5 spaces per 1,000 square feet of rentable area with individual properties ranging from 1.4 to 5.1 spaces per 1,000 square feet of rentable area (see table below).
THE INFORMATION IN THIS STRUCTURAL AND COLLATERAL TERM SHEET IS NOT COMPLETE AND MAY BE AMENDED PRIOR TO THE TIME OF SALE. THIS TERM SHEET IS NOT AN OFFER TO SELL THESE SECURITIES AND IT IS NOT A SOLICITATION OF AN OFFER TO BUY THESE SECURITIES IN ANY JURISDICTION WHERE THE OFFER OR SALE IS NOT PERMITTED.
59
| Office - Medical | Loan #3 | Cut-off Date Balance: | | $110,000,000 |
Property Addresses – Various Various, Various | Life Science Office Portfolio | Cut-off Date LTV: | | 62.3% |
| | | U/W NCF DSCR: | | 2.50x |
| | | U/W NOI Debt Yield: | | 9.2% |
The following table presents certain information relating to the Life Science Office Portfolio Properties:
| Property Name – Location | Allocated Whole Loan Cut-off Date Balance | % of Portfolio Cut-off Date Balance | Occupancy | Year Built/ Renovated | Net Rentable Area (SF) | As-Is Appraised Value | Allocated Cut-off Date LTV | % of UW NOI | Parking Ratio (per 1,000 SF) |
| 21717 & 21823 30th Drive SE | $37,100,000 | 19.5% | 100.0% | 1998; 2000 / NAP | 144,900 | $58,300,000 | 63.6% | 19.0% | 3.6 |
| Bothell, WA |
| 47900 Bayside Parkway | $28,000,000 | 14.8% | 100.0% | 1992 / NAP | 122,092 | $44,800,000 | 62.5% | 15.2% | 3.2 |
| Fremont, CA |
| 2904 Orchard Parkway | $26,900,000 | 14.2% | 100.0% | 1982 / 2015 | 78,979 | $43,000,000 | 62.6% | 12.7% | 3.6 |
| San Jose, CA |
| 4770 Regent Boulevard | $20,700,000 | 10.9% | 100.0% | 1995 / NAP | 116,948 | $32,000,000 | 64.7% | 11.4% | 3.7 |
| Irving, TX |
1111 W. 34th Street | $17,900,000 | 9.4% | 97.4% | 1971 / NAP | 70,505 | $28,700,000 | 62.4% | 9.7% | 3.8 |
| Austin, TX |
| 330 Baker Avenue | $17,350,000 | 9.1% | 100.0% | 2013 / NAP | 49,250 | $27,400,000 | 63.3% | 9.2% | 5.1 |
| Concord, MA |
| 6300 Eighth Avenue | $15,300,000 | 8.1% | 100.0% | 1978 / NAP | 71,500 | $29,500,000 | 51.9% | 6.7% | 1.4 |
| Brooklyn, NY |
| 15 North Broadway | $14,800,000 | 7.8% | 100.0% | 1954 / 2016 | 50,097 | $23,200,000 | 63.8% | 8.5% | 3.2 |
| White Plains, NY |
| 30 New Crossing Road | $11,750,000 | 6.2% | 100.0% | 1991 / 2007 | 33,600 | $17,900,000 | 65.6% | 7.7% | 4.1 |
| Reading, MA |
| Total/Weighted Average | $189,800,000 | 100.0% | 99.8% | | 737,871 | $304,800,000 | 62.3% | 100.0% | 3.5 |
Major Tenants.
Largest Tenant: Seattle Genetics, Inc. (144,900 square feet; 19.6% of net rentable area; 19.4% of underwritten base rent; June 30, 2024 lease expiration) – Seattle Genetics (Nasdaq: SGEN), now known as “Seagen”, is a global biotechnology company that develops and commercializes transformative cancer therapies. Founded in 1998, Seagen is the largest biotech company in the Pacific Northwest with a market cap of $22.8 billion, as of February 10, 2022. Seagen occupies 100% of the 21717 & 21823 30th Drive SE property, which serves as its global headquarters. Seagen has been in occupancy since 2000, expanded in 2011 and 100% of its space is classified as office, 40% of which is lab space. Seagen has one, five-year renewal option at fair market rent with at least nine but no more than twelve months’ notice and no termination options.
2nd Largest Tenant: Stryker Corporation (122,092 square feet; 16.5% of net rentable area; 13.8% of underwritten base rent; December 31, 2030 lease expiration) – Stryker Corporation (“Stryker”; NYSE: SYK) is a medical technology company that offers products and services in orthopaedics, medical and surgical, and neurotechnology and spine that help improve patient and hospital outcomes. Founded in 1941, Stryker had 43,000 employees worldwide with 10,452 patents owned and $14.4 billion in sales as of 2020. Stryker has been a tenant at the 47900 Bayside Parkway property since 2007 where it occupies 100% of the net rentable area. Stryker has two, five-year renewal options at fair market rent, with at least twelve but no more than fifteen months’ notice and no termination options.
3rd Largest Tenant: Complete Genomics (78,979 square feet; 10.7% of net rentable area; 12.8% of underwritten base rent; December 31, 2025 lease expiration) – Complete Genomics was founded in 2006 and is technology company that specializes in whole human genome sequencing. Using its proprietary sequencing instruments, chemistry, and software, the company has sequenced more than 20,000 whole human genomes. In March 2013, Complete Genomics was acquired by BGI-Shenzhen, the world’s largest genomics services company. Complete Genomics has been a tenant at the 2904 Orchard Parkway property, which serves as its headquarters, since 2016 where occupies 100% of the net rentable area. The tenant has two, five-year renewal options at fair market rent, with at least nine but no more than twelve months’ notice and does not have any termination options.
THE INFORMATION IN THIS STRUCTURAL AND COLLATERAL TERM SHEET IS NOT COMPLETE AND MAY BE AMENDED PRIOR TO THE TIME OF SALE. THIS TERM SHEET IS NOT AN OFFER TO SELL THESE SECURITIES AND IT IS NOT A SOLICITATION OF AN OFFER TO BUY THESE SECURITIES IN ANY JURISDICTION WHERE THE OFFER OR SALE IS NOT PERMITTED.
60
| Office - Medical | Loan #3 | Cut-off Date Balance: | | $110,000,000 |
Property Addresses – Various Various, Various | Life Science Office Portfolio | Cut-off Date LTV: | | 62.3% |
| | | U/W NCF DSCR: | | 2.50x |
| | | U/W NOI Debt Yield: | | 9.2% |
The following table presents certain information relating to the tenancy at the Life Science Office Portfolio Properties:
Major Tenants
| Tenant Name (Property) | Credit Rating (Fitch/ Moody’s/
S&P)(1) | Tenant NRSF | % of
NRSF | Annual U/W Base Rent PSF(2) | Annual
U/W Base Rent(2) | % of Total Annual U/W Base Rent | Lease
Expiration
Date | Extension Options | Termination Option (Y/N) |
| Major Tenants | | | | | | | | |
| Seattle Genetics, Inc. | NR/NR/NR | 144,900 | 19.6% | $24.83 | $3,598,533 | 19.4% | 6/30/2024 | 1, 5-year | N |
| Stryker Corporation | NR/Baa1/A- | 122,092 | 16.5% | $21.01 | $2,564,643 | 13.8% | 12/31/2030 | 2, 5-year | N |
| Complete Genomics | NR/NR/NR | 78,979 | 10.7% | $30.23 | $2,387,142 | 12.8% | 12/31/2025 | 2, 5-year | N |
| Quest Diagnostics Clinical Laboratories, Inc. | BBB/Baa2/BBB+ | 116,948 | 15.8% | $18.50 | $2,163,538 | 11.6% | 12/31/2025 | 2, 5-year | N |
| Atrius Health, Inc. | NR/NR/BBB | 49,250 | 6.7% | $34.29 | $1,688,659 | 9.1% | 6/30/2030 | 3, 10-year | N |
| Total Major Tenants | 512,169 | 69.4% | $24.22 | $12,402,515 | 66.8% | | | |
| | | | | | | | | |
| Non-Major Tenant | 223,884 | 30.3% | $27.59 | $6,177,099 | 33.2% | | | |
| | | | | | | | | |
| Occupied Collateral Total | 736,053 | 99.8% | $25.24 | $18,579,614 | 100.0% | | | |
| | | | | | | | | |
| Vacant Space | 1,818 | 0.2% | | | | | | |
| | | | | | | | | |
| Collateral Total | 737,871 | 100.0% | | | | | | |
| | | | | | | | | | |
| (1) | Certain ratings are those of the parent company whether or not the parent company guarantees the lease. |
| (2) | Annual U/W Base Rent PSF and Annual U/W Base Rent include contractual rent steps through September 2022 totaling $388,227. The lender’s underwriting gives separate credit for straight-line rent averaging for an investment grade tenants through the earlier of lease or loan maturity. The total implied underwritten rental rate for Stryker, Quest Diagnostics Clinical Laboratories, Inc., and Atrius Health, Inc., inclusive of the straight-line credit, is approximately $23.37, $19.01 and $36.69 PSF, respectively. See “Underwritten Net Cash Flow” below. |
THE INFORMATION IN THIS STRUCTURAL AND COLLATERAL TERM SHEET IS NOT COMPLETE AND MAY BE AMENDED PRIOR TO THE TIME OF SALE. THIS TERM SHEET IS NOT AN OFFER TO SELL THESE SECURITIES AND IT IS NOT A SOLICITATION OF AN OFFER TO BUY THESE SECURITIES IN ANY JURISDICTION WHERE THE OFFER OR SALE IS NOT PERMITTED.
61
| Office - Medical | Loan #3 | Cut-off Date Balance: | | $110,000,000 |
Property Addresses – Various Various, Various | Life Science Office Portfolio | Cut-off Date LTV: | | 62.3% |
| | | U/W NCF DSCR: | | 2.50x |
| | | U/W NOI Debt Yield: | | 9.2% |
The following table presents certain information relating to the lease rollover schedule at the Life Science Office Portfolio Properties:
Lease Expiration Schedule(1)(2)
Year Ending
December 31, | No. of Leases Expiring | Expiring NRSF | % of Total NRSF | Cumulative Expiring NRSF | Cumulative % of Total NRSF | Annual
U/W
Base Rent | % of Total Annual U/W Base Rent | Annual
U/W
Base Rent
PSF |
| MTM | 0 | 0 | 0.0% | 0 | 0.0% | $0 | 0.0% | $0.00 |
| 2022 | 1 | 9,755 | 1.3% | 9,755 | 1.3% | $234,120 | 1.3% | $24.00 |
| 2023 | 1 | 4,332 | 0.6% | 14,087 | 1.9% | $119,563 | 0.6% | $27.60 |
| 2024 | 2 | 144,900 | 19.6% | 158,987 | 21.5% | $3,598,533 | 19.4% | $24.83 |
| 2025 | 5 | 205,719 | 27.9% | 364,706 | 49.4% | $4,818,264 | 25.9% | $23.42 |
| 2026 | 1 | 33,600 | 4.6% | 398,306 | 54.0% | $1,444,096 | 7.8% | $42.98 |
| 2027 | 0 | 0 | 0.0% | 398,306 | 54.0% | $0 | 0.0% | $0.00 |
| 2028 | 0 | 0 | 0.0% | 398,306 | 54.0% | $0 | 0.0% | $0.00 |
| 2029 | 3 | 44,808 | 6.1% | 443,114 | 60.1% | $1,229,649 | 6.6% | $27.44 |
| 2030 | 2 | 171,342 | 23.2% | 614,456 | 83.3% | $4,253,302 | 22.9% | $24.82 |
| 2031 | 0 | 0 | 0.0% | 614,456 | 83.3% | $0 | 0.0% | $0.00 |
| 2032 | 0 | 0 | 0.0% | 614,456 | 83.3% | $0 | 0.0% | $0.00 |
| Thereafter | 2 | 121,597 | 16.5% | 736,053 | 99.8% | $2,882,087 | 15.5% | $23.70 |
| Vacant | 0 | 1,818 | 0.2% | 737,871 | 100.0% | $0 | 0.0% | $0.00 |
| Total/Weighted Average | 17 | 737,871 | 100.0% | | | $18,579,614 | 100.0% | $25.24(3) |
| (1) | Information obtained from the underwritten rent roll. |
| (2) | Certain tenants may have lease termination options that are exercisable prior to the originally stated expiration date of the subject lease and that are not considered in the Lease Expiration Schedule. |
| (3) | Weight Average Annual U/W Base Rent PSF excludes vacant space. |
The following table presents historical occupancy percentages at the Life Science Office Portfolio Properties:
Historical Occupancy
12/31/2018(1) | 12/31/2019(1) | 12/31/2020(1) | 1/20/2022(2) |
| 99.7% | 99.7% | 99.4% | 99.8% |
| (1) | Information obtained from the borrower. |
| (2) | Information obtained from the underwritten rent roll. |
COVID-19 Update. As of January 19, 2022, the Life Science Office Portfolio Properties are open and operating. The first payment date for the Life Science Office Portfolio Whole Loan will be March 11, 2022. There are no outstanding rent relief requests.
THE INFORMATION IN THIS STRUCTURAL AND COLLATERAL TERM SHEET IS NOT COMPLETE AND MAY BE AMENDED PRIOR TO THE TIME OF SALE. THIS TERM SHEET IS NOT AN OFFER TO SELL THESE SECURITIES AND IT IS NOT A SOLICITATION OF AN OFFER TO BUY THESE SECURITIES IN ANY JURISDICTION WHERE THE OFFER OR SALE IS NOT PERMITTED.
62
| Office - Medical | Loan #3 | Cut-off Date Balance: | | $110,000,000 |
Property Addresses – Various Various, Various | Life Science Office Portfolio | Cut-off Date LTV: | | 62.3% |
| | | U/W NCF DSCR: | | 2.50x |
| | | U/W NOI Debt Yield: | | 9.2% |
Underwritten Net Cash Flow. The following table presents certain information relating to the underwritten net cash flow at the Life Science Office Portfolio Properties:
Cash Flow Analysis
| | 2019 | 2020 | TTM (10/31/2021) | U/W | %(1) | U/W $ per SF |
| Base Rent | $16,998,310 | $16,853,903 | $16,664,928 | $18,191,387 | 70.3% | 24.65 |
| Contractual Rent Steps | 0 | 0 | 0 | 388,227(2) | 1.5 | 0.53 |
| Rent Average Benefit | 0 | 0 | 0 | 796,796(3) | 3.1 | 1.08 |
| Grossed Up Vacant Space | 0 | 0 | 0 | 49,086 | 0.2 | 0.07 |
| Gross Potential Rent | $16,998,310 | $16,853,903 | $16,664,928 | $19,425,496 | 75.0% | $26.33 |
| Other Income | 51,036 | 25,013 | 5,581 | 0 | 0.0 | 0.0 |
| Total Recoveries | 5,442,153 | 6,186,752 | 6,164,961 | 6,463,146 | 25.0 | 8.76 |
| Net Rental Income | $22,491,499 | $23,065,668 | $22,835,470 | $25,888,642 | 100.0% | $35.09 |
| (Vacancy & Credit Loss) | 0 | 0 | 0 | (1,211,397) | (6.2) | (1.64) |
| Effective Gross Income | $22,491,499 | $23,065,668 | $22,835,470 | $24,677,246 | 95.3% | $33.44 |
| | | | | | | |
| Real Estate Taxes | 3,366,847 | 3,715,974 | 3,286,049 | 3,719,866 | 15.1 | 5.04 |
| Insurance | 205,517 | 281,201 | 308,370 | 321,040 | 1.3 | 0.44 |
| Management Fee | 674,745 | 689,577 | 687,257 | 740,317 | 3.0 | 1.00 |
| Other Operating Expenses | 1,955,521 | 2,127,004 | 2,294,839 | 2,415,698 | 9.8 | 3.27 |
| Total Operating Expenses | $6,202,630 | $6,813,757 | $6,576,515 | $7,196,922 | 29.2% | $9.75 |
| | | | | | | |
| Net Operating Income | $16,288,869 | $16,251,911 | $16,258,955 | $17,480,324 | 70.8 | 23.69 |
| Replacement Reserves | 0 | 0 | 0 | 179,841 | 0.7 | 0.24 |
| TI/LC | 0 | 0 | 0 | 687,774 | 2.8 | 0.93 |
| Net Cash Flow | $16,288,869 | $16,251,911 | $16,258,955 | $16,612,710 | 67.3% | $22.51 |
| | | | | | | |
| NOI DSCR(4) | 2.45x | 2.44x | 2.44x | 2.63x | | |
| NCF DSCR(4) | 2.45x | 2.44x | 2.44x | 2.50x | | |
| NOI Debt Yield(4) | 8.6% | 8.6% | 8.6% | 9.2% | | |
| NCF Debt Yield(4) | 8.6% | 8.6% | 8.6% | 8.8% | | |
| (1) | Represents (i) percent of Net Rental Income for all revenue fields, (ii) percent of Gross Potential Rent for Vacancy & Credit Loss and (iii) percent of Effective Gross Income for all other fields. |
| (2) | Represents contractual rent steps through September 2022. |
| (3) | Represents straight-line rent averaging for five investment grade tenants through the earlier of lease or loan maturity. |
| (4) | The NOI and NCF DSCR and NOI and NCF Debt Yield are based on the Life Science Office Portfolio Whole Loan. |
THE INFORMATION IN THIS STRUCTURAL AND COLLATERAL TERM SHEET IS NOT COMPLETE AND MAY BE AMENDED PRIOR TO THE TIME OF SALE. THIS TERM SHEET IS NOT AN OFFER TO SELL THESE SECURITIES AND IT IS NOT A SOLICITATION OF AN OFFER TO BUY THESE SECURITIES IN ANY JURISDICTION WHERE THE OFFER OR SALE IS NOT PERMITTED.
63
| Office - Medical | Loan #3 | Cut-off Date Balance: | | $110,000,000 |
Property Addresses – Various Various, Various | Life Science Office Portfolio | Cut-off Date LTV: | | 62.3% |
| | | U/W NCF DSCR: | | 2.50x |
| | | U/W NOI Debt Yield: | | 9.2% |
Appraisal. According to the appraisals dated between October 13, 2021 and October 27, 2021 the Life Science Office Portfolio Properties had an aggregate “As-is” value of $304,800,000.
Environmental Matters. According to the Phase I environmental reports dated between October 28, 2021 and November 1, 2021, there was no evidence of any recognized environmental conditions at any of the Life Science Office Portfolio Properties.
Market Overview and Competition. The Life Science Office Portfolio Properties are located within the metropolitan statistical areas of Seattle, Washington (one property, 19.5% of the allocated loan amount), New York, New York (two properties, 15.9% of the allocated loan amount), Boston, Massachusetts (two properties, 15.3% of the allocated loan amount), Oakland, California (one property, 14.8% of the allocated loan amount), San Jose, California (one property, 14.2% of the allocated loan amount), Dallas, Texas (one property. 10.9% of the allocated loan amount) and Austin, Texas (one property, 9.4% of the allocated loan amount).
The following table presents certain local demographic data related to the Life Science Office Portfolio Properties:
| Property Name – Location | 2021 Population
(within 1-mi. / 3-mi. / 5-mi. Radius) | 2021 Average Household Income |
| (within 1-mi. / 3-mi. / 5-mi. Radius) |
| 21717 & 21823 30th Drive SE - Bothell, WA | 12,505 / 101,182 / 260,310 | $166,408 / $142,066 / $137,789 |
| 47900 Bayside Parkway - Fremont, CA | 3,743 / 53,098 / 196,790 | $212,490 / $199,619 / $183,465 |
| 2904 Orchard Parkway - San Jose, CA | 18,795 / 125,041 / 491,425 | $213,153 / $172,471 / $159,618 |
| 4770 Regent Boulevard - Irving, TX | 330 / 31,260 / 154,581 | $168,105 / $141,419 / $117,830 |
1111 W. 34th Street - Austin, TX | 28,969 / 148,245 / 371,266 | $86,503 / $122,023 / $114,692 |
| 330 Baker Avenue - Concord, MA | 6,570 / 26,074 / 67,358 | $204,082 / $227,556 / $208,053 |
| 6300 Eighth Avenue - Brooklyn, NY | 186,427 / 770,748 / 1,811,958 | $81,443 / $95,953 / $105,865 |
| 15 North Broadway - White Plains, NY | 36,637 / 103,584 / 193,316 | $120,889 / $161,614 / $194,399 |
| 30 New Crossing Road - Reading, MA | 10,990 / 76,365 / 194,985 | $143,647 / $148,516 / $147,085 |
The following table presents certain information relating to the appraiser’s market rent conclusion for the Life Science Office Portfolio Properties:
Market Rent Summary(1)
| | Market Rent (PSF) | Lease Term (Years) | Concessions | Lease Type (Reim- bursements) | Rent Increase Projection | Tenant Improvements (New Tenants) (PSF) | Tenant Improvements (Renewals) (PSF) |
| 21717 & 21823 30th Drive SE - Bothell, WA | $24.50 | 5.4 | 5 mos. | NNN | 3.0% per annum | $35.00 | $10.00 |
| 47900 Bayside Parkway - Fremont, CA | $21.00 | 10 | 6 mos. (new) / 3 mos. (renew) | NNN | 3.0% per annum | $30.00 | $20.00 |
| 2904 Orchard Parkway - San Jose, CA | $30.00 | 10 | 6 mos. (new) / 3 mos. (renew) | NNN | 3.0% per annum | $40.00 | $25.00 |
| 4770 Regent Boulevard - Irving, TX | $19.20 | 10 | 3 mos. (new) / 0 mos. (renew) | NNN | 3.0% per annum | $25.00 | $15.00 |
| 1111 W. 34th Street - Austin, TX (Medical Office) | $27.00 | 5 | 1 mos. | NNN | 3.0% per annum | $30.00 | $15.00 |
| 1111 W. 34th Street - Austin, TX (Surgical Center) | $31.00 | 10 | 1 mos. | NNN | 3.0% per annum | $35.00 | $17.50 |
| 330 Baker Avenue - Concord, MA | $34.00 | 10 | 0 mos. | NNN | 2.0% per annum | $50.00 | NAV |
| 6300 Eighth Avenue - Brooklyn, NY | $35.00 | 10 | 6 mos. (new) / 2 mos. (renew) | Net | 2.0% per annum | $30.00 | $15.00 |
| 15 North Broadway - White Plains, NY | $30.00 | 10 | 6 mos. | NNN | 3.0% per annum | $50.00 | $25.00 |
| 30 New Crossing Road - Reading, MA | $35.00 | 10 | 0 mos. | NNN | 2.0% per annum | $50.00 | $10.00 |
| (1) | Information obtained from the appraisals. |
THE INFORMATION IN THIS STRUCTURAL AND COLLATERAL TERM SHEET IS NOT COMPLETE AND MAY BE AMENDED PRIOR TO THE TIME OF SALE. THIS TERM SHEET IS NOT AN OFFER TO SELL THESE SECURITIES AND IT IS NOT A SOLICITATION OF AN OFFER TO BUY THESE SECURITIES IN ANY JURISDICTION WHERE THE OFFER OR SALE IS NOT PERMITTED.
64
| Office - Medical | Loan #3 | Cut-off Date Balance: | | $110,000,000 |
Property Addresses – Various Various, Various | Life Science Office Portfolio | Cut-off Date LTV: | | 62.3% |
| | | U/W NCF DSCR: | | 2.50x |
| | | U/W NOI Debt Yield: | | 9.2% |
Escrows.
Real Estate Taxes – Upon the occurrence and continuance of a Cash Trap Event Period (as defined below under “Lockbox and Cash Management”) and provided that the Reserve Waiver Conditions (as defined below) are not being satisfied, the Life Science Office Portfolio Whole Loan documents require ongoing monthly real estate tax reserves in an amount equal to 1/12 of the real estate taxes that the lender reasonably estimates will be payable during the next 12 months.
Insurance – The Life Science Office Portfolio Whole Loan documents do not require ongoing monthly escrows for insurance premiums as long as (i) no event of default has occurred and is continuing, (ii) the Life Science Office Portfolio Borrower or borrower affiliate provides the lender with evidence that the Life Science Office Portfolio Properties’ insurance coverage is included in a blanket policy and such policy is in full force and effect and (iii) the Life Science Office Portfolio Borrower pays all applicable insurance premiums and provides the lender with evidence of payment of insurance premiums/renewals no later than ten business days prior to the expiration of the policies.
“Reserve Waiver Conditions” means, with respect to an individual property:
| (i) | No event of default has occurred and is continuing; |
| (ii) | the applicable Material Tenant lease is in full force and effect with no defaults; |
| (iii) | the applicable Material Tenant lease requires the applicable Material Tenant to pay taxes directly to the applicable governmental authority and the applicable Material Tenant continues to pay such taxes directly to the applicable governmental authority as required under the applicable Material Tenant lease; and |
| (iv) | the borrower and/or the applicable Material Tenant delivers evidence (if required under the lease) of the same to lender on or prior to the applicable due date for such taxes. |
Replacement Reserve – The Life Science Office Portfolio Whole Loan documents require ongoing monthly replacement reserves of $14,987 upon the occurrence of Cash Trap Event Period.
Leasing Reserve – The Life Science Office Portfolio Whole Loan documents require ongoing monthly general TI/LC reserves of $76,862 upon the occurrence of Cash Trap Event Period.
Rent Concession Reserve – The Life Science Office Portfolio Whole Loan documents require an upfront rent concession reserve of $32,725 related to outstanding gap rent, future rent credits and future rent abatements under existing leases. The borrower may provide a letter of credit in lieu of a cash deposit into the rent concession reserve.
Outstanding TI/LC Reserve - The Life Science Office Portfolio Whole Loan documents require an upfront TI/LC reserve of $918,824 related to outstanding TI/LCs payable by the borrower under existing leases. The borrower may provide a letter of credit in lieu of a cash deposit into the outstanding TI/LC reserve.
Lockbox and Cash Management. The Life Science Office Portfolio Whole Loan requires a hard lockbox and in-place cash management. The Life Science Office Portfolio Borrower is required to cause all rents to be deposited directly into the lockbox account, and all rents received by the Life Science Office Portfolio Borrower or property manager be deposited into the lockbox account within two business days of receipt. Funds in the deposit account will be swept periodically into a cash management account and, prior to a Cash Trap Event Period, any funds remaining in the cash management account after the cash flow waterfall will be transferred to the Life Science Office Portfolio Borrower. During a Cash Trap Event Period, any excess cash flow remaining after satisfaction of the waterfall items outlined in the Life Science Office Portfolio Whole Loan documents is required to be swept to an excess cash flow subaccount to be held as additional collateral for the Life Science Office Portfolio Whole Loan.
A “Cash Trap Event Period” will commence upon the earliest of the following:
| (i) | the occurrence and continuance of an event of default; |
| (ii) | the net operating income debt yield (“NOI DY”) being less than 6.50% for two consecutive calendar quarters; or |
| (iii) | the occurrence of a Material Tenant Trigger Period (as defined below). |
A “Material Tenant Trigger Period” means a Material Tenant (a) defaults under its lease beyond any notice and cure period, (b) vacates, abandons, or otherwise goes dark in its leased space, or gives notice of its intent to do so, within the last 24 months of its lease (c) terminates its lease (for all or any portion of its space) or gives notice to do so, provides written notice to not renew or fails to renew at least six months prior to the scheduled expiration date of its lease, or (d) files for bankruptcy or similar insolvency proceeding.
THE INFORMATION IN THIS STRUCTURAL AND COLLATERAL TERM SHEET IS NOT COMPLETE AND MAY BE AMENDED PRIOR TO THE TIME OF SALE. THIS TERM SHEET IS NOT AN OFFER TO SELL THESE SECURITIES AND IT IS NOT A SOLICITATION OF AN OFFER TO BUY THESE SECURITIES IN ANY JURISDICTION WHERE THE OFFER OR SALE IS NOT PERMITTED.
65
| Office - Medical | Loan #3 | Cut-off Date Balance: | | $110,000,000 |
Property Addresses – Various Various, Various | Life Science Office Portfolio | Cut-off Date LTV: | | 62.3% |
| | | U/W NCF DSCR: | | 2.50x |
| | | U/W NOI Debt Yield: | | 9.2% |
A “Material Tenant” means the tenants together with any guarantor of its lease, under the following leases, (i) Seattle Genetics 21823 lease (63,900 square feet; 8.7% of net rentable area; 9.7% of underwritten base rent; June 30, 2024 lease expiration), (ii) the Seattle Genetics 27171 lease (81,000 square feet; 11.0% of net rentable area; 9.7% of underwritten base rent; June 30, 2024 lease expiration) and any lease which, individually or when aggregated with all other leases at the property with the same tenant or its affiliates, accounts for 15% or more of the gross potential rent for the Life Science Office Portfolio.
A Cash Trap Event Period will end upon the occurrence of the following:
| ● | with regard to clause (i), the cure of such event of default; |
| ● | with regard to clause (ii), the NOI DY being greater than or equal to 6.50% for two consecutive calendar quarters; or |
| ● | with regard to clause (iii), a Material Tenant Trigger Event cure. |
A Material Tenant Trigger Period will end upon the occurrence of the following, as applicable:
| ● | the applicable Material Tenant is no longer insolvent or subject to any bankruptcy or insolvency proceedings; |
| ● | the applicable Material Tenant is paying full, unabated rent under the lease; |
| ● | with respect to the space which is the subject of the Material Tenant Trigger Period, (i) the borrower leasing the entirety of the applicable space for the Material Tenant’s renewal term and the tenant(s) being in physical occupancy of the space, (ii) either there are no TI/LCs due and payable in connection with such replacement lease(s) or borrower shall have deposited with lender any unpaid TI/LCs that may be incurred in connection with such lease(s), (iii) either the applicable new tenant(s) is(are) paying full, unabated rent under its applicable lease(s), or borrower shall have deposited with lender any applicable “free rent” granted pursuant to the applicable new lease(s); and (iv) such lease(s) may not contain any “outs”; or |
| ● | there are funds on deposit in the excess cash flow subaccount in an amount equal to at least $60 PSF for the applicable Material Tenant space or the borrower delivers to lender a letter of credit in an amount equal to at least $60 PSF for the applicable material tenant space. |
Property Management. The Life Science Office Portfolio Properties are managed by The RMR Group LLC.
Partial Release. Provided that no event of default is ongoing, the Life Science Office Portfolio Borrower has the right, at any time after the lockout period and prior to the open period start date, to obtain the release of any of the Life Science Office Portfolio Properties from the lien of the Life Science Office Portfolio Whole Loan in an amount up to 20% of the outstanding principal balance, provided that certain conditions are satisfied, including, but not limited to, the following:
| (i) | partial defeasance in an amount equal to at least 105% of the allocated loan amount for the property being released; |
| (ii) | the net cash flow debt service coverage ratio (“NCF DSCR”) immediately following the release being equal to or greater than the greater of (a) 2.67x and (b) the NCF DSCR immediately prior to the release; |
| (iii) | the NOI DY immediately following the release being equal to or greater than the greater of (a) 9.35% and (b) the NOI DY immediately prior to the release; |
| (iv) | compliance with all applicable REMIC requirements; and |
| (v) | rating agency confirmation that such release will not result in a downgrade, withdrawal or qualification of the respective ratings assigned to the BANK 2022-BNK40 certificates. |
Real Estate Substitution. Not permitted.
Right of First Offer/Right of First Refusal. Atrius Health, Inc. has a right of first offer (“ROFO”) to purchase the 330 Baker Avenue property if the borrower intends to offer such property for sale. The ROFO is not extinguished by foreclosure; however, the ROFO does not apply to foreclosure or deed in lieu thereof. See “Description of the Mortgage Pool—Tenant Leases—Purchase Options and Rights of First Refusal” in the Preliminary Prospectus.
Subordinate and Mezzanine Indebtedness. Not permitted.
Ground Lease. None.
Terrorism Insurance. The Life Science Office Portfolio Whole Loan documents require that the “all risk” insurance policy required to be maintained by the Life Science Office Portfolio Borrower provides coverage for terrorism in an amount equal to the full replacement cost of the Life Science Office Portfolio Properties, as well as business interruption insurance covering no less than the 18-month period following the occurrence of a casualty event, together with a six-month extended period of indemnity (provided that if TRIPRA or a similar statute is not in effect, the borrowers will not be obligated to pay terrorism insurance premiums in excess of two times the annual premium for the casualty and business interruption coverage (without giving effect to the cost of terrorism, flood and earthquake and business interruption components of such coverage)).
THE INFORMATION IN THIS STRUCTURAL AND COLLATERAL TERM SHEET IS NOT COMPLETE AND MAY BE AMENDED PRIOR TO THE TIME OF SALE. THIS TERM SHEET IS NOT AN OFFER TO SELL THESE SECURITIES AND IT IS NOT A SOLICITATION OF AN OFFER TO BUY THESE SECURITIES IN ANY JURISDICTION WHERE THE OFFER OR SALE IS NOT PERMITTED.
66
(THIS PAGE INTENTIONALLY LEFT BLANK)
| Office – Suburban | Loan #4 | Cut-off Date Balance: | | $100,000,000 |
5260, 5270, 5271, 5281, 5290, 5291,
5300 and 5301 California Avenue | UCI Research Park Phases 12 & 13 | Cut-off Date LTV: | | 50.0% |
| Irvine, CA 92617 | | U/W NCF DSCR: | | 3.66x |
| | | U/W NOI Debt Yield: | | 12.1% |
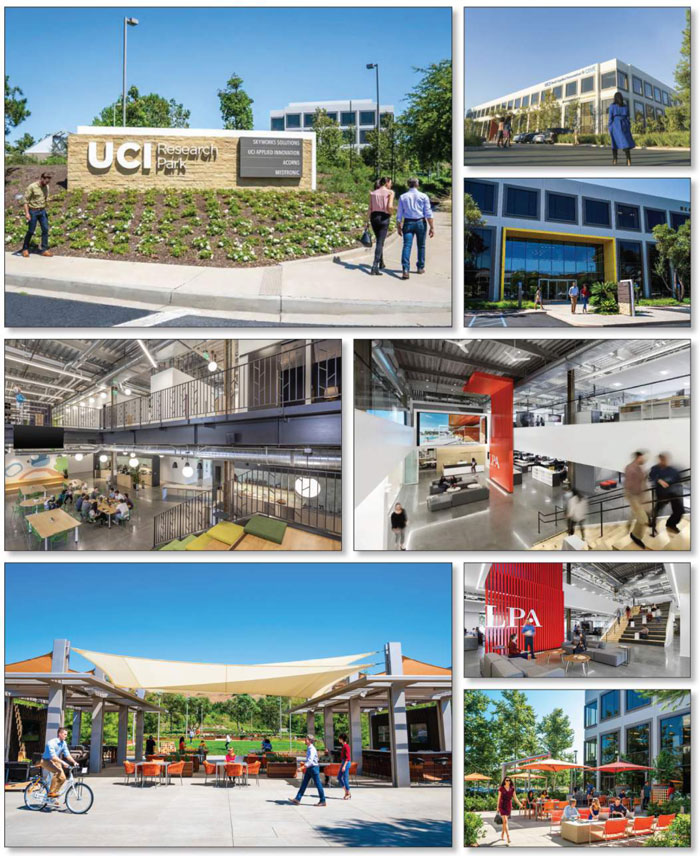
THE INFORMATION IN THIS STRUCTURAL AND COLLATERAL TERM SHEET IS NOT COMPLETE AND MAY BE AMENDED PRIOR TO THE TIME OF SALE. THIS TERM SHEET IS NOT AN OFFER TO SELL THESE SECURITIES AND IT IS NOT A SOLICITATION OF AN OFFER TO BUY THESE SECURITIES IN ANY JURISDICTION WHERE THE OFFER OR SALE IS NOT PERMITTED.
68
| Office – Suburban | Loan #4 | Cut-off Date Balance: | | $100,000,000 |
5260, 5270, 5271, 5281, 5290, 5291,
5300 and 5301 California Avenue | UCI Research Park Phases 12 & 13 | Cut-off Date LTV: | | 50.0% |
| Irvine, CA 92617 | | U/W NCF DSCR: | | 3.66x |
| | | U/W NOI Debt Yield: | | 12.1% |
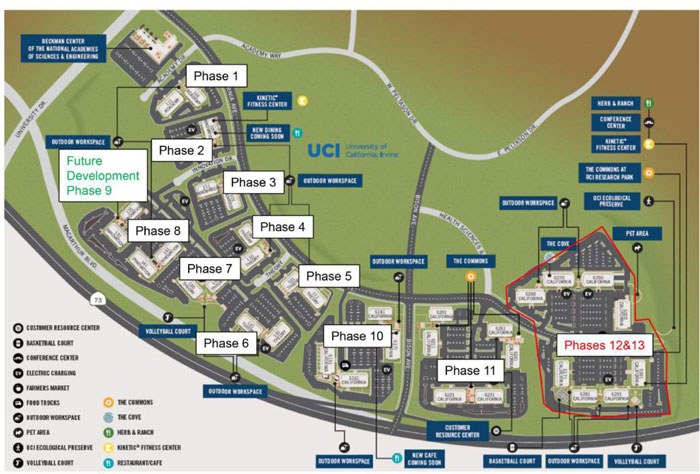
THE INFORMATION IN THIS STRUCTURAL AND COLLATERAL TERM SHEET IS NOT COMPLETE AND MAY BE AMENDED PRIOR TO THE TIME OF SALE. THIS TERM SHEET IS NOT AN OFFER TO SELL THESE SECURITIES AND IT IS NOT A SOLICITATION OF AN OFFER TO BUY THESE SECURITIES IN ANY JURISDICTION WHERE THE OFFER OR SALE IS NOT PERMITTED.
69
| Office – Suburban | Loan #4 | Cut-off Date Balance: | | $100,000,000 |
5260, 5270, 5271, 5281, 5290, 5291,
5300 and 5301 California Avenue | UCI Research Park Phases 12 & 13 | Cut-off Date LTV: | | 50.0% |
| Irvine, CA 92617 | | U/W NCF DSCR: | | 3.66x |
| | | U/W NOI Debt Yield: | | 12.1% |

THE INFORMATION IN THIS STRUCTURAL AND COLLATERAL TERM SHEET IS NOT COMPLETE AND MAY BE AMENDED PRIOR TO THE TIME OF SALE. THIS TERM SHEET IS NOT AN OFFER TO SELL THESE SECURITIES AND IT IS NOT A SOLICITATION OF AN OFFER TO BUY THESE SECURITIES IN ANY JURISDICTION WHERE THE OFFER OR SALE IS NOT PERMITTED.
70
| No. 4 – UCI Research Park Phases 12 & 13 |
| |
| Mortgage Loan Information | | Mortgaged Property Information |
| Mortgage Loan Seller: | Bank of America, National Association | | Single Asset/Portfolio: | Single Asset |
Credit Assessment (Fitch/KBRA/S&P): | NR/NR/NR | | Property Type – Subtype: | Office - Suburban |
| Original Principal Balance(1): | $100,000,000 | | Location: | Irvine, CA |
| Cut-off Date Balance(1): | $100,000,000 | | Size: | 686,276 SF |
| % of Initial Pool Balance: | 8.5% | | Cut-off Date Balance Per SF(1): | $218.57 |
| Loan Purpose: | Recapitalization | | Maturity Date Balance Per SF(1): | $218.57 |
| Borrower Sponsor: | The Irvine Company LLC | | Year Built/Renovated: | 2007/2019 |
| Guarantor: | Spectrum Office Properties LLC | | Title Vesting: | Leasehold |
| Mortgage Rate: | 3.1260% | | Property Manager: | Irvine Management Company (borrower-related) |
| Note Date: | February 4, 2022 | | Current Occupancy (As of): | 100.0% (1/26/2022) |
| Seasoning: | 0 months | | 6/30/2021 Occupancy(4): | 100.0% |
| Maturity Date: | March 1, 2032 | | 6/30/2020 Occupancy(4): | 74.0% |
| IO Period: | 120 months | | 6/30/2019 Occupancy(4): | 17.0% |
| Loan Term (Original): | 120 months | | 6/30/2018 Occupancy: | 81.0% |
| Amortization Term (Original): | NAP | | As-Is Appraised Value: | $300,000,000 |
| Loan Amortization Type: | Interest only | | As-Is Appraised Value Per SF: | $437.14 |
| Call Protection(2): | L(24),DorYM1(91),O(5) | | As-Is Appraisal Valuation Date: | January 6, 2022 |
| Lockbox Type: | Hard/Springing Cash Management | | Underwriting and Financial Information(5) |
| Additional Debt(1): | Yes | | TTM 12/31/2021 NOI: | $19,063,666 |
| Additional Debt Type (Balance)(1): | Pari Passu ($50,000,000) | | TTM 6/30/2021 NOI(4): | $16,911,432 |
| | | | TTM 6/30/2020 NOI(4): | $10,787,004 |
| | | | U/W Revenues: | $27,115,810 |
| | | | U/W Expenses: | $8,903,155 |
| | | U/W NOI: | $18,212,655 |
| Escrows and Reserves(3) | | U/W NCF: | $17,409,712 |
| | Initial | Monthly | Cap | | U/W DSCR based on NOI/NCF(1): | 3.83x / 3.66x |
| Taxes | $0 | Springing | NAP | | U/W Debt Yield based on NOI/NCF(1): | 12.1% / 11.6% |
| Insurance | $0 | Springing | NAP | | U/W Debt Yield at Maturity based on NOI/NCF(1): | 12.1% / 11.6% |
| Replacement Reserve | $0 | Springing | NAP | | Cut-off Date LTV Ratio(1): | 50.0% |
| TI/LC Reserve | $0 | Springing | $2,000,000 | | LTV Ratio at Maturity(1): | 50.0% |
| | | | | | | | | |
| Sources and Uses |
| Sources | | | | | Uses | | | |
| Whole Loan Amount(1) | $150,000,000 | | 100.0% | | Return of Equity(6) | $149,302,452 | | 99.5% |
| | | | | | Closing Costs | 697,548 | | 0.5 |
| | | | | | | | | |
| Total Sources | $150,000,000 | | 100.0% | | Total Uses | $150,000,000 | | 100.0% |
| (1) | The Cut-off Date Balance Per SF, Maturity Date Balance Per SF, U/W DSCR based on NOI/NCF, U/W Debt Yield based on NOI/NCF, U/W Debt Yield at Maturity based on NOI/NCF, Cut-off Date LTV Ratio and LTV Ratio at Maturity numbers presented above are based on the UCI Research Park Phases 12 & 13 Whole Loan (as defined below). |
| (2) | Defeasance of the UCI Research Park Phases 12 & 13 Whole Loan is permitted at any time after the earlier to occur of (a) the end of the two-year period commencing on the closing date of the securitization of the last portion of the UCI Research Park Phases 12 & 13 Whole Loan to be securitized and (b) May 1, 2025. The assumed prepayment lockout period of 24 payments is based on the closing date of this transaction in March 2022. |
| (3) | See “Escrows” section. |
| (4) | The UCI Research Park Phases 12 & 13 Property (as defined below) was originally built-to-suit for a single tenant, Broadcom Inc., who vacated in 2018 after acquiring and developing its own campus. After investing approximately $54.9 million to reposition the UCI Research Park Phases 12 & 13 Property for multi-tenant use, which improvements were completed in 2019, the borrower sponsor re-leased the UCI Research Park Phases 12 & 13 Property to 100.0% occupancy since 2019. |
| (5) | The novel coronavirus pandemic is an evolving situation and could impact the UCI Research Park Phases 12 & 13 Whole Loan more severely than assumed in the underwriting of the UCI Research Park Phases 12 & 13 Whole Loan and could adversely affect the NOI, NCF and occupancy information, as well as the appraised value and the DSCR, LTV and Debt Yield metrics presented above and herein. See "Risk Factors-—Risks Related to Market Conditions and Other External Factors—The Coronavirus Pandemic Has Adversely Affected the Global Economy and Will Likely Adversely Affect the Performance of the Mortgage Loans" in the Preliminary Prospectus. |
| (6) | The borrower sponsor developed the UCI Research Park Phases 12 & 13 Property in 2007 and maintains an estimated cost basis of $199.5 million. |
The Mortgage Loan. The mortgage loan (the “UCI Research Park Phases 12 & 13 Mortgage Loan”) is part of a whole loan that is evidenced by three pari passu promissory notes, with an aggregate original principal balance of $150,000,000 (together, the “UCI Research Park Phases 12 & 13 Whole Loan”). The UCI Research Park Phases 12 & 13 Whole Loan is secured by a first priority leasehold mortgage encumbering a 686,276 square foot office property located in Irvine, California (the “UCI Research Park Phases 12 & 13 Property”). The UCI Research Park Phases 12 & 13 Mortgage Loan is evidenced by the controlling Note A-1 and Note A-3 with an aggregate original principal balance of $100,000,000. Note A-2 is currently held by Bank of America, National Association and is expected to be contributed to one or more future transactions. The UCI Research Park Phases 12 & 13 Whole Loan will be serviced
THE INFORMATION IN THIS STRUCTURAL AND COLLATERAL TERM SHEET IS NOT COMPLETE AND MAY BE AMENDED PRIOR TO THE TIME OF SALE. THIS TERM SHEET IS NOT AN OFFER TO SELL THESE SECURITIES AND IT IS NOT A SOLICITATION OF AN OFFER TO BUY THESE SECURITIES IN ANY JURISDICTION WHERE THE OFFER OR SALE IS NOT PERMITTED.
71
| Office – Suburban | Loan #4 | Cut-off Date Balance: | | $100,000,000 |
5260, 5270, 5271, 5281, 5290, 5291,
5300 and 5301 California Avenue | UCI Research Park Phases 12 & 13 | Cut-off Date LTV: | | 50.0% |
| Irvine, CA 92617 | | U/W NCF DSCR: | | 3.66x |
| | | U/W NOI Debt Yield: | | 12.1% |
pursuant to the pooling and servicing agreement for the BANK 2022-BNK40 securitization trust. See “Description of the Mortgage Pool—The Whole Loans—Serviced Pari Passu Whole Loans” and “Pooling and Servicing Agreement” in the Preliminary Prospectus.
Note Summary
| Notes | Original Balance | Cut-off Date Balance | Note Holder | Controlling Piece |
| A-1 | $80,000,000 | $80,000,000 | BANK 2022-BNK40 | Yes |
| A-2 | $50,000,000 | $50,000,000 | BANA | No |
| A-3 | $20,000,000 | $20,000,000 | BANK 2022-BNK40 | No |
| Total | $150,000,000 | $150,000,000 | | |
The Borrower and Borrower Sponsor. The borrower is URP XII XIII LLC (the “UCI Research Park Phases 12 & 13 Borrower”), a Delaware limited liability company and single purpose entity with two independent directors.
The borrower sponsor is The Irvine Company LLC, a private real estate development, operator and investor headquartered in Newport Beach, California. The Irvine Company LLC developed the UCI Research Park Phases 12 & 13 Property in 2007 and maintains an estimated cost basis of $199.5 million. The non-recourse carveout guarantor is Spectrum Office Properties LLC, an affiliate of the borrower sponsor.
The Property. The UCI Research Park Phases 12 & 13 Property consists of eight single- and multi-tenant buildings, including two four-story buildings and six, three-story buildings for a total of 686,276 square feet, located in Irvine, California. The UCI Research Park Phases 12 & 13 Property is part of the broader 185-acre University of California Irvine Research Park ("UCIRP"), which includes 36 buildings and approximately 2.2 million rentable square feet of office and R&D facilities, which is approximately 89% leased and home to approximately 75 companies. The non-collateral buildings comprising UCIRP are also owned by the borrower sponsor. Just north of the UCI Research Park Phases 12 & 13 Property is John Wayne Airport and the Irvine Business Center.
The borrower sponsor initially developed the UCI Research Park Phases 12 & 13 Property in 2007 as a build to suit for Broadcom Inc., which occupied the project as its headquarters for over 10 years. After acquiring land in the Irvine Spectrum in 2015 and developing their own campus, Broadcom Inc. vacated the UCI Research Park Phases 12 & 13 Property in 2018. Following Broadcom Inc.’s departure, the borrower sponsor commenced a $33.5 million reinvestment project to competitively position the project for multi-tenant use. The enhancements included a new one-acre central open-air venue, a conference and presentation space, a new food hall, a premium fitness center, upgrades to existing courtyards, new building entries and lobbies, indoor/outdoor connections to customer spaces and the addition of 141 parking stalls (bringing total parking to 2,405 spaces (3.5 spaces/1,000 square feet)). The borrower sponsor invested an additional $21.4 million in operating capital to fund the balance of the project costs including code-required restrooms and stairwell upgrades, electrical room configuration, building system improvements, site landscaping, ADA improvements and exterior signage to accommodate multi-tenancy. The improvements were completed in 2019, and the entire UCI Research Park Phases 12 & 13 Property was re-leased to 100.0% occupancy since 2019. As of January 26, 2022, the UCI Research Park Phases 12 & 13 Property was 100.0% leased to a diverse roster of 25 tenants, with no tenant occupying more than 14.9% of net rentable area and 13.6% of underwritten rent.
The UCI Research Park Phases 12 & 13 Property is subject to a long-term ground lease with The Regents of the University of California. The ground lease has 54 years remaining, fully extended, and expires in April 2076. See “Ground Lease” below.
COVID-19 Update. As of February 4, 2022, the UCI Research Park Phases 12 & 13 Property is open and operating. The first payment date for the UCI Research Park Phases 12 & 13 Whole Loan will be April 1, 2022. There are no outstanding rent relief requests.
Major Tenants.
Covidien LP (102,001 square feet, 14.9% of net rentable area, 13.6% of underwritten base rent). Covidien LP operates as a manufacturer of surgical appliances and supplies and is owned by Medtronic PLC (NYSE: MDT; Moody’s: A3). Since April 2019, Covidien LP has occupied 102,001 square feet at the UCI Research Park Phases 12 & 13 Property on a lease that expires in April 2026, with one, five-year renewal option. Covidien LP does not have any early termination rights.
Acorns Grow Incorporated (91,136 square feet, 13.3% of net rentable area, 13.2% of underwritten base rent). Founded in 2012, Acorns Grow Incorporated is a financial technology company that provides basic banking services and promotes incremental and passive investing through the use of robo-advisors. Acorns Grow Incorporated allows members to invest in ETFs, fund an IRA, and provides basic banking services. Since January 2019, Acorns Grow Incorporated has occupied 91,136 square feet at the UCI Research Park Phases 12 & 13 Property on a lease that expires in January 2026, with one, five-year renewal option. Acorns Grow Incorporated has a one-time option to terminate its lease on January 21, 2024, with 12 months’ notice and payment of a termination fee equal to four months’ rent plus unamortized tenant improvements, leasing commissions, rent abatements and occupancy concessions received. Acorns Grow Incorporated currently subleases the 4th floor of its premises encompassing 22,784 square feet to Comcast Cable Communications Management, LLC, under a sublease that commenced on October 1, 2021 and is coterminous with the Acorns Grow Incorporated lease.
Skyworks Solutions, Inc. (91,136 square feet, 13.3% of net rentable area, 13.1% of underwritten base rent). Founded in 1962, Skyworks Solutions, Inc. (NASDAQ: SWKS; S&P: BBB-/Moody’s: Ba1/Fitch: BBB+) manufactures semiconductors for use in radio
THE INFORMATION IN THIS STRUCTURAL AND COLLATERAL TERM SHEET IS NOT COMPLETE AND MAY BE AMENDED PRIOR TO THE TIME OF SALE. THIS TERM SHEET IS NOT AN OFFER TO SELL THESE SECURITIES AND IT IS NOT A SOLICITATION OF AN OFFER TO BUY THESE SECURITIES IN ANY JURISDICTION WHERE THE OFFER OR SALE IS NOT PERMITTED.
72
| Office – Suburban | Loan #4 | Cut-off Date Balance: | | $100,000,000 |
5260, 5270, 5271, 5281, 5290, 5291,
5300 and 5301 California Avenue | UCI Research Park Phases 12 & 13 | Cut-off Date LTV: | | 50.0% |
| Irvine, CA 92617 | | U/W NCF DSCR: | | 3.66x |
| | | U/W NOI Debt Yield: | | 12.1% |
frequency and mobile communications systems. Since December 2019, Skyworks Solutions, Inc. has occupied 91,136 square feet at the UCI Research Park Phases 12 & 13 Property on a lease that expires in November 2029, with one, five-year renewal option. Skyworks Solutions, Inc. has a one-time termination option, effective June 30, 2026, with 12 months’ notice and payment of five months’ rent plus unamortized tenant improvements, leasing commissions, rent abatements and occupancy concessions received. Skyworks Solutions, Inc. also occupies an additional 126,880 square feet within UCIRP at non-collateral buildings 5211 California Avenue and 5221 California Avenue.
The following table presents certain information relating to the tenancy at the UCI Research Park Phases 12 & 13 Property:
Tenant Summary(1)
| Tenant Name | Credit Rating (Fitch/ Moody’s/
S&P)(2) | Tenant NRSF | % of
NRSF | Annual U/W Base Rent PSF | Annual
U/W Base Rent | % of Total Annual U/W Base Rent | Lease
Exp.
Date | Renewal Options | Termination Options |
| Covidien LP | NR/A3/NR | 102,001 | 14.9% | $29.88 | $3,047,784 | 13.6% | 4/30/2026 | 1 x 5 yr | N |
| Acorns Grow Incorporated(3) | NR/NR/NR | 91,136 | 13.3 | 32.40 | 2,952,816 | 13.2 | 1/31/2026 | 1 x 5 yr | Y(4) |
| Skyworks Solutions, Inc. | BBB+/Ba1/BBB- | 91,136 | 13.3 | 32.16 | 2,930,928 | 13.1 | 11/30/2029 | 1 x 5 yr | Y(5) |
| The Regents of the University(6) | AA/Aa2/AA | 84,896 | 12.4 | 28.20 | 2,394,060 | 10.7 | 11/30/2029 | 1 x 5 yr | Y(7) |
| LPA, Inc. | NR/NR/NR | 55,450 | 8.1 | 31.92 | 1,769,964 | 7.9 | 3/31/2026 | 2 x 3 yr | Y(8) |
| Subtotal/Wtd. Avg. | | 424,619 | 61.9% | $30.84 | $13,095,552 | 58.6% | | | |
| | | | | | | | | | |
| Other Tenants(9) | | 261,657 | 38.1% | $35.34 | $9,246,708 | 41.4% | | | |
| Vacant | | 0 | 0.0 | 0.00 | 0 | 0.0 | | | |
| Total/Wtd. Avg. | | 686,276 | 100.0% | $32.56 | $22,342,260 | 100.0% | | | |
| | | | | | | | | | |
| | | | | | | | | | |
| (1) | Information is based on the underwritten rent roll dated January 26, 2022. |
| (2) | Certain ratings are those of the parent company whether or not the parent guarantees the lease. |
| (3) | Acorns Grow Incorporated is currently subleasing the 4th floor of its premises (22,784 square feet) to Comcast Cable Communications Management, LLC, which sublease is coterminous with the Acorns Grow Incorporated lease. |
| (4) | Acorns Grow Incorporated has a one-time option to terminate its lease on January 21, 2024, with 12 months’ notice and payment of a termination fee. |
| (5) | Skyworks Solutions, Inc. has a one-time option to terminate its lease effective June 30, 2026, with 12 months’ notice and payment of a termination fee. |
| (6) | The Regents of the University is affiliated with the ground lessor. See “Ground Lease” below. |
| (7) | The Regents of the University has a one-time option to terminate its lease on November 18, 2026, with 12 months’ notice and payment of a termination fee. |
| (8) | LPA, Inc. has a one-time option to terminate its lease effective March 22, 2024, with 12 months’ notice and payment of a termination fee. |
| (9) | Other Tenants include borrower sponsor affiliated space including Herb & Ranch (4,882 square feet), fitness center (4,522 square feet) and conference center (4,156 square feet). |
THE INFORMATION IN THIS STRUCTURAL AND COLLATERAL TERM SHEET IS NOT COMPLETE AND MAY BE AMENDED PRIOR TO THE TIME OF SALE. THIS TERM SHEET IS NOT AN OFFER TO SELL THESE SECURITIES AND IT IS NOT A SOLICITATION OF AN OFFER TO BUY THESE SECURITIES IN ANY JURISDICTION WHERE THE OFFER OR SALE IS NOT PERMITTED.
73
| Office – Suburban | Loan #4 | Cut-off Date Balance: | | $100,000,000 |
5260, 5270, 5271, 5281, 5290, 5291,
5300 and 5301 California Avenue | UCI Research Park Phases 12 & 13 | Cut-off Date LTV: | | 50.0% |
| Irvine, CA 92617 | | U/W NCF DSCR: | | 3.66x |
| | | U/W NOI Debt Yield: | | 12.1% |
The following table presents certain information relating to the lease rollover schedule at the UCI Research Park Phases 12 & 13 Property:
Lease Expiration Schedule(1)(2)
Year Ending
December 31, | No. of Leases Expiring | Expiring NRSF | % of Total NRSF Expiring | Cumulative Expiring NRSF | Cumulative % of Total NRSF Expiring | Annual
U/W
Base Rent Expiring | % of Total Annual U/W Base Rent Expiring | Annual
U/W
Base Rent
PSF Expiring |
| MTM | 0 | 0 | 0.0% | 0 | 0.0% | $0 | 0.0% | $0.00 |
| 2022 | 1 | 2,437 | 0.4 | 2,437 | 0.4% | 85,980 | 0.4 | 35.28 |
| 2023(3) | 5 | 25,447 | 3.7 | 27,884 | 4.1% | 1,078,212 | 4.8 | 42.37 |
| 2024 | 2 | 7,408 | 1.1 | 35,292 | 5.1% | 258,692 | 1.2 | 34.92 |
| 2025 | 2 | 5,168 | 0.8 | 40,460 | 5.9% | 183,648 | 0.8 | 35.54 |
| 2026 | 8 | 357,393 | 52.1 | 397,853 | 58.0% | 11,409,466 | 51.1 | 31.92 |
| 2027(4) | 3 | 70,224 | 10.2 | 468,077 | 68.2% | 2,371,230 | 10.6 | 33.77 |
| 2028 | 0 | 0 | 0.0 | 468,077 | 68.2% | 0 | 0.0 | 0.00 |
| 2029 | 4 | 218,199 | 31.8 | 686,276 | 100.0% | 6,955,032 | 31.1 | 31.87 |
| 2030 | 0 | 0 | 0.0 | 686,276 | 100.0% | 0 | 0.0 | 0.00 |
| 2031 | 0 | 0 | 0.0 | 686,276 | 100.0% | 0 | 0.0 | 0.00 |
| 2032 | 0 | 0 | 0.0 | 686,276 | 100.0% | 0 | 0.0 | 0.00 |
| Thereafter | 0 | 0 | 0.0 | 686,276 | 100.0% | 0 | 0.0 | 0.00 |
| Vacant | 0 | 0 | 0.0 | 686,276 | 100.0% | 0 | 0.0 | 0.00 |
| Total/Wtd. Avg. | 25 | 686,276 | 100.0% | | | $22,342,260 | 100.0% | $32.56 |
| (1) | Information is based on the underwritten rent roll dated January 26, 2022. |
| (2) | Certain tenants may have lease termination options that are exercisable prior to the originally stated expiration date of the subject lease and that are not considered in the Lease Rollover Schedule. |
| (3) | Leases expiring include borrower sponsor affiliated space including a fitness center (4,522 square feet, underwritten rent of $46.56 per square foot) and conference center (4,156 square feet, underwritten rent of $1). |
| (4) | Leases expiring include borrower sponsor affiliated space Herb & Ranch (4,882 square feet, underwritten rent of $46.32 per square foot). |
The following table presents historical occupancy percentages at the UCI Research Park Phases 12 & 13 Property:
Historical Occupancy
2017(1) | 2018(1) | 2019(1)(2) | 2020(1)(2) | 1/26/2022(3) |
| 100.0% | 81.0% | 17.0% | 74.0% | 100.0% |
| | | | | |
| (1) | As provided by the borrower sponsor as of June 30 for each respective year. |
| (2) | The UCI Research Park Phases 12 & 13 Property was originally built-to-suit for a single tenant, Broadcom Inc., who vacated in 2018 after acquiring and developing its own campus. After investing approximately $54.9 million to reposition the UCI Research Park Phases 12 & 13 Property for multi-tenant use, which improvements were completed in 2019, the borrower sponsor re-leased the UCI Research Park Phases 12 & 13 Property to 100.0% occupancy since 2019. |
| (3) | Information obtained from the underwritten rent roll dated January 26, 2022. |
THE INFORMATION IN THIS STRUCTURAL AND COLLATERAL TERM SHEET IS NOT COMPLETE AND MAY BE AMENDED PRIOR TO THE TIME OF SALE. THIS TERM SHEET IS NOT AN OFFER TO SELL THESE SECURITIES AND IT IS NOT A SOLICITATION OF AN OFFER TO BUY THESE SECURITIES IN ANY JURISDICTION WHERE THE OFFER OR SALE IS NOT PERMITTED.
74
| Office – Suburban | Loan #4 | Cut-off Date Balance: | | $100,000,000 |
5260, 5270, 5271, 5281, 5290, 5291,
5300 and 5301 California Avenue | UCI Research Park Phases 12 & 13 | Cut-off Date LTV: | | 50.0% |
| Irvine, CA 92617 | | U/W NCF DSCR: | | 3.66x |
| | | U/W NOI Debt Yield: | | 12.1% |
Historical Performance and Underwritten Net Cash Flow. The following table presents certain information relating to the historical performance and underwritten net cash flow at the UCI Research Park Phases 12 & 13 Property:
Cash Flow Analysis
| | | 2020(1) | | 2021(1) | | TTM 12/31/2021 | | U/W | | %(2) | | U/W$ per SF | |
| Gross Potential Rent(3) | | $13,675,846 | | $19,446,986 | | $20,760,102 | | $23,047,797 | | 84.0% | | $33.58 | |
| Reimbursements | | 3,487,679 | | 3,770,679 | | 4,259,902 | | 4,391,704 | | 16.0 | | $6.40 | |
| Net Rental Income | | $17,163,525 | | $23,217,665 | | $25,020,004 | | $27,439,501 | | 100.0% | | $39.98 | |
| Other Income(4) | | 595,399 | | 1,222,982 | | 1,047,977 | | 1,048,284 | | 3.8 | | $1.53 | |
| Vacancy & Credit Loss(5) | | (49,491) | | 15,771 | | 313,534 | | (1,371,975) | | (6.0) | | (2.00) | |
| Effective Gross Income | | $17,709,433 | | $24,456,418 | | $26,381,515 | | $27,115,810 | | 98.8% | | $39.51 | |
| | | | | | | | | | | | | | |
| Real Estate Taxes | | $1,532,366 | | $1,500,204 | | $1,441,684 | | $1,539,900 | | 5.7% | | $2.24 | |
| Insurance | | 144,022 | | 144,964 | | 146,746 | | 147,221 | | 0.5 | | 0.21 | |
| Ground Rent(6) | | 2,920,180 | | 3,063,754 | | 2,920,180 | | 3,543,334 | | 13.1 | | 5.16 | |
| Other Operating Expenses | | 2,325,861 | | 2,836,064 | | 2,809,239 | | 3,672,700 | | 13.5 | | 5.35 | |
| Total Operating Expenses | | $6,922,429 | | $7,544,986 | | $7,317,849 | | $8,903,155 | | 32.8% | | $12.97 | |
| | | | | | | | | | | | | | |
| Net Operating Income | | $10,787,004 | | $16,911,432 | | $19,063,666 | | $18,212,655 | | 67.2% | | $26.54 | |
| Replacement Reserves | | 0 | | 0 | | 0 | | 116,667 | | 0.4 | | 0.17 | |
| TI/LC | | 0 | | 0 | | 0 | | 686,276 | | 2.5 | | 1.00 | |
| Net Cash Flow | | $10,787,004 | | $16,911,432 | | $19,063,666 | | $17,409,712 | | 64.2% | | $25.37 | |
| | | | | | | | | | | | | | |
| NOI DSCR(7) | | 2.27x | | 3.56x | | 4.01x | | 3.83x | | | | | |
| NCF DSCR(7) | | 2.27x | | 3.56x | | 4.01x | | 3.66x | | | | | |
| NOI Debt Yield(7) | | 7.2% | | 11.3% | | 12.7% | | 12.1% | | | | | |
| NCF Debt Yield(7) | | 7.2% | | 11.3% | | 12.7% | | 11.6% | | | | | |
| (1) | Represents trailing 12 months as of June 30 for each respective year. |
| (2) | Represents (i) percent of Net Rental Income for all revenue fields, (ii) percent of Gross Potential Rent for Vacancy & Credit Loss and (iii) percent of Effective Gross Income for all other fields. |
| (3) | U/W Gross Potential Rent includes contractual rent steps through February 1, 2023 ($545,356) and straight line averaged rent for Skyworks Solutions, Inc. ($386,539) and The Regents of the University ($318,999). |
| (4) | Other Income includes late fees, after hours HVAC, tenant coordination, charging station income and other miscellaneous income. |
| (5) | Historical Vacancy & Credit Loss represents bad debt write-offs net of recoveries. The UCI Research Park Phases 12 & 13 Property is 100.0% occupied as of January 26, 2022. |
| (6) | U/W Ground Rent is based on the average estimated ground rent during the loan term. The UCI Research Park Phases 12 & 13 Borrower provided the estimated ground rent increase for May 2022 which equates to an implied Consumer Price Index (“CPI”) of 3.00% per annum for the five years preceding the rent increase. The same CPI increase was assumed for the second ground rent increases during the loan term. The two ground rent increases occur in May 2022 and May 2027. |
| (7) | Debt service coverage ratios and debt yields are based on the UCI Research Park Phases 12 & 13 Whole Loan. |
Appraisal. The appraiser concluded to an “as-is” Appraised Value for the UCI Research Park Phases 12 & 13 Property of $300,000,000 as of January 6, 2022.
Environmental Matters. According to the Phase I environmental site assessment dated January 10, 2022, there was no evidence of any recognized environmental conditions at the UCI Research Park Phases 12 & 13 Property.
Market Overview and Competition. The UCI Research Park Phases 12 & 13 Property is located in the city of Irvine and is considered a suburban location within Orange County. Primary access to the UCI Research Park Phases 12 & 13 Property is provided by the San Diego (405) Freeway and the Santa Ana (5) Freeway which bisect the city. The 73 Toll Road is located adjacent to the UCI Research Park Phases 12 & 13 Property and runs in a north/south direction. The land use in the immediate area is primarily office and residential uses. To the north is University of California Irvine followed by the San Joaquin Marsh and multi-family housing. A mix of office and retail uses are located farther north followed by the San Diego (405) Freeway.
According to a third-party market research report dated November 15, 2021, office rents in Orange County offer tenants a discount to other Southern California markets. Rents are approximately 20% less expensive than the Los Angeles market and are slightly lower than the San Diego market. Average asking office rent in Orange County is $31.00 PSF per year, compared with the national average of $34.00 PSF per year.
According to the appraisal, the estimated 2021 population within a one-, three- and five-mile radius of the UCI Research Park Phases 12 & 13 Property was 14,712, 115,607 and 327,132, respectively, and the estimated 2021 average household income within the same radii was $177,460, $168,435 and $148,270, respectively.
THE INFORMATION IN THIS STRUCTURAL AND COLLATERAL TERM SHEET IS NOT COMPLETE AND MAY BE AMENDED PRIOR TO THE TIME OF SALE. THIS TERM SHEET IS NOT AN OFFER TO SELL THESE SECURITIES AND IT IS NOT A SOLICITATION OF AN OFFER TO BUY THESE SECURITIES IN ANY JURISDICTION WHERE THE OFFER OR SALE IS NOT PERMITTED.
75
| Office – Suburban | Loan #4 | Cut-off Date Balance: | | $100,000,000 |
5260, 5270, 5271, 5281, 5290, 5291,
5300 and 5301 California Avenue | UCI Research Park Phases 12 & 13 | Cut-off Date LTV: | | 50.0% |
| Irvine, CA 92617 | | U/W NCF DSCR: | | 3.66x |
| | | U/W NOI Debt Yield: | | 12.1% |
The following table presents certain information relating to the appraiser’s market rent conclusions for the UCI Research Park Phases 12 & 13 Property:
Market Rent Summary(1)
| | Office |
| Market Rent (PSF) | $29.40 NNN |
| Lease Term (Years) | 7 |
| Rent Increase Projection | 3.50% Annually |
The following table presents recent office leasing data at comparable properties with respect to the UCI Research Park Phases 12 & 13 Property:
Comparable Office Leases(1)
| Property | Year Built/ Renovated | Tenant | Lease Date /
Term (yrs) | Lease Size (SF) | Annual Base Rent PSF (NNN) | Annual Escalations | Free Rent | TI PSF | |
UCI Research Park XI(2)
5201-5251 California Avenue | 2001 / NAP | California Pacific Homes | Aug-21 / 3.0 | 5,171 | $27.00 | 3.50% | NAP | $26.00 | |
| |
UCI Research Park, Phase 5(2)
111 Theory | 1999 / NAP | Bridge Diagnostics | Aug-21 / 7.0 | 26,987 | $27.00 | 4.50% | NAP | $70.00 | |
| |
UCI Research Park, Phase 8(2)
131 Innovation | 2000 / NAP | Opentrons Labworks | Jun-21 / 7.0 | 8,925 | $27.60 | Fixed | 3 months | $30.00 | |
| |
Intersect (Irvine, CA)
17875 & 17877 Von Karman Avenue
17872 & 17838 Gillette Avenue | 1987 / 2018 | RPMG Management Services | Oct-21 / 10.8 | 9,957 | $43.20 | Fixed | 3 months | NAP | |
| David Son, DDS | Jun-21 / 10.7 | 2,402 | $42.00 | 4.00% | 4 months | $135.00 | |
The Boardwalk
18565 & 18575 Jamboree Road | 2017 / NAP | Velocityitek | Aug-21 / 5.3 | 6,258 | $60.00(3) | 3.00% | 3-5 months | NAP | |
Spectrum Terrace - Phase 2
17400, 17500, 17520, 17600 Laguna Canyon Road | 2020 / NAP | Fisher & Paykel Healthcare | Apr-21 / 7.0 | 29,673 | $42.00 | 3.00% | 6 months | $80.00 | |
| TGS Management | Mar-21 / 10.1 | 114,781 | $41.76 | 3.00% | 6 months | $75.00 | |
| CoStar | Feb-21 / 10.1 | 114,781 | $39.60 | 3.00% | 8 months | $60.00 | |
| (2) | Owned by the borrower sponsor. |
| (3) | Annual Base Rent PSF is Full Service. |
THE INFORMATION IN THIS STRUCTURAL AND COLLATERAL TERM SHEET IS NOT COMPLETE AND MAY BE AMENDED PRIOR TO THE TIME OF SALE. THIS TERM SHEET IS NOT AN OFFER TO SELL THESE SECURITIES AND IT IS NOT A SOLICITATION OF AN OFFER TO BUY THESE SECURITIES IN ANY JURISDICTION WHERE THE OFFER OR SALE IS NOT PERMITTED.
76
| Office – Suburban | Loan #4 | Cut-off Date Balance: | | $100,000,000 |
5260, 5270, 5271, 5281, 5290, 5291,
5300 and 5301 California Avenue | UCI Research Park Phases 12 & 13 | Cut-off Date LTV: | | 50.0% |
| Irvine, CA 92617 | | U/W NCF DSCR: | | 3.66x |
| | | U/W NOI Debt Yield: | | 12.1% |
The following table presents recent comparable office sales data with respect to the UCI Research Park 12 & 13 Property:
Comparable Office Sales(1)
Property Address | Year Built/ Renovated | Total
NRA
(SF) | Occupancy | Date of
Sale | Sale Price /
PSF | Cap
Rate | |
| 1, 3 and 5 Glen Bell Way | 2001 / 2009 | 273,180 | 100% | Aug-21 | $159,000,000
/ $582 | 5.70% | |
| |
2600 Olive
2600 West Olive Avenue | 1986 / NAP | 151,028 | 97% | Nov-21 | $90,500,000
/ $599 | 4.75% | |
| |
Glaukos Headquarters
26600, 26650 & 26700 Aliso Viejo Parkway | 1999 / NAP | 159,746 | 100% | Jun-20 | $77,000,000
/ $482 | 5.83% | |
| |
Broadcom Corporate Campus
15101 and 15191 Alton Parkway | 2018 / NAP | 660,893 | 100% | Aug-20 | $355,000,000
/ $537 | 5.25% | |
| |
Burbank Empire Center
2350-2400 West Empire Avenue | 2002 / NAP | 233,909 | 100% | Jul-21 | $106,660,000
/ $456 | 5.40% | |
| |
Escrows.
Real Estate Taxes – The UCI Research Park Phases 12 & 13 Borrower is required to deposit monthly to a real estate tax reserve 1/12 of the annual estimated real estate taxes (i) during a Cash Trap Event Period (as defined below) or (ii) upon the UCI Research Park Phases 12 & 13 Borrower’s failure to provide the lender evidence of timely payment of taxes. In lieu of monthly deposits to the real estate tax reserve, the UCI Research Park Phases 12 & 13 Borrower is permitted to provide a letter of credit or a guaranty for such amounts from a UCI Research Park Phases 12 & 13 Borrower affiliate approved by the lender.
Insurance – The UCI Research Park Phases 12 & 13 Borrower is required to deposit monthly 1/12 of the annual estimated insurance premiums to the insurance reserve (i) during a Cash Trap Event Period or (ii) upon the UCI Research Park Phases 12 & 13 Borrower’s failure to provide the lender evidence of the renewal of a blanket policy to the extent the UCI Research Park Phases 12 & 13 Borrower maintains insurance pursuant to a blanket policy. In lieu of monthly deposits to the insurance reserve, the UCI Research Park Phases 12 & 13 Borrower is permitted to provide a letter of credit or a guaranty for such amounts from a UCI Research Park Phases 12 & 13 Borrower affiliate approved by the lender.
Replacement Reserve – During a Cash Trap Event Period, the UCI Research Park Phases 12 & 13 Borrower is required to deposit monthly $14,295 to a reserve for replacements to the UCI Research Park Phases 12 & 13 Property. In lieu of monthly deposits to the replacement reserve, the UCI Research Park Phases 12 & 13 Borrower is permitted to provide a letter of credit or a guaranty for such amounts from a UCI Research Park Phases 12 & 13 Borrower affiliate approved by the lender.
TI/LC Reserve – During a DSCR Trigger Event Period, the UCI Research Park Phases 12 & 13 Borrower is required to deposit monthly $57,189 for future tenant improvements and leasing commissions, subject to a cap of $2,000,000. In lieu of monthly deposits to the TI/LC reserve, the UCI Research Park Phases 12 & 13 Borrower is permitted to provide a letter of credit or a guaranty for such amounts from a UCI Research Park Phases 12 & 13 Borrower affiliate approved by the lender.
A “DSCR Trigger Event Period” will commence upon the date, tested quarterly, that the debt service coverage ratio is less than 1.15x and will expire on the date, tested quarterly, that the debt service coverage ratio is equal to or greater than 1.15x for two consecutive calendar quarters.
Lockbox and Cash Management. The UCI Research Park Phases 12 & 13 Whole Loan is structured with a hard lockbox and springing cash management. All rents from the UCI Research Park Phases 12 & 13 Property are required to be deposited directly to the lockbox account and, so long as a Cash Trap Event Period is not continuing, funds in the lockbox account will be transferred to the UCI Research Park Phases 12 & 13 Borrower’s operating account. During a Cash Trap Event Period, the UCI Research Park Phases 12 & 13 Borrower will not have access to the funds in the lockbox account and such funds will be transferred to the lender-controlled cash management account and disbursed according to the UCI Research Park Phases 12 & 13 Whole Loan documents. During a Cash Trap Event Period all excess cash is required to be held by the lender as additional security for the UCI Research Park Phases 12 & 13 Whole Loan; provided that excess cash will be disbursed at the direction of the UCI Research Park Phases 12 & 13 Borrower in the event of shortfalls in certain monthly expense items.
A “Cash Trap Event Period” will (a) commence upon (i) the occurrence of an event of default or (ii) the date, tested quarterly, that the debt service coverage ratio is less than 1.10x and (b) terminate when (i) with respect to clause (a)(i), the lender accepts a cure of such event of default, (ii) with respect to clause (a)(ii), the debt service coverage ratio is equal to or greater than 1.10x for two consecutive calendar quarters.
Property Management. The UCI Research Park Phases 12 & 13 Property is managed by Irvine Management Company, an affiliate of the UCI Research Park Phases 12 & 13 Borrower.
THE INFORMATION IN THIS STRUCTURAL AND COLLATERAL TERM SHEET IS NOT COMPLETE AND MAY BE AMENDED PRIOR TO THE TIME OF SALE. THIS TERM SHEET IS NOT AN OFFER TO SELL THESE SECURITIES AND IT IS NOT A SOLICITATION OF AN OFFER TO BUY THESE SECURITIES IN ANY JURISDICTION WHERE THE OFFER OR SALE IS NOT PERMITTED.
77
| Office – Suburban | Loan #4 | Cut-off Date Balance: | | $100,000,000 |
5260, 5270, 5271, 5281, 5290, 5291,
5300 and 5301 California Avenue | UCI Research Park Phases 12 & 13 | Cut-off Date LTV: | | 50.0% |
| Irvine, CA 92617 | | U/W NCF DSCR: | | 3.66x |
| | | U/W NOI Debt Yield: | | 12.1% |
Partial Release. Not permitted.
Real Estate Substitution. Not permitted.
Subordinate and Mezzanine Indebtedness. None.
Ground Lease. The UCI Research Park Phases 12 & 13 Property is subject to a long-term ground lease with The Regents of the University of California. The ground lease has 54 years remaining, fully extended, and expires in April 2076. The ground lease payment is readjusted per the CPI every five years (the next adjustment is May 2022) and is based upon the change in the CPI between adjustment dates. The CPI increase is floored at 2.25% and capped at 4.25%. Every 20 years the ground lease payment is readjusted per an appraisal with the next adjustment occurring in May 2041. Per the reappraisal ground lease adjustment, ground lease payments shall be adjusted (increased or decreased) to 8% of the fair market value as determined by a written agreement of fair market value or an appraisal of the value of the land as if vacant and entitled for the uses and densities as contemplated by the development plan.
Right of First Offer / Right of First Refusal. None.
Terrorism Insurance. The UCI Research Park Phases 12 & 13 Borrower is required to obtain and maintain property insurance and business interruption insurance for 24 months plus a six-month extended period of indemnity. Such insurance is required to cover perils of terrorism and acts of terrorism; provided that the UCI Research Park Phases 12 & 13 Borrower is permitted to maintain terrorism coverage with a licensed captive insurance company that is affiliated with the borrower sponsor if certain conditions set forth in the related Whole Loan documents are satisfied, and if the Terrorism Risk Insurance Program Reauthorization Act of 2019 is not in effect, the UCI Research Park Phases 12 & 13 Borrower will only be required to pay for terrorism insurance through such captive insurance company a maximum of two times the annual insurance premiums payable for the UCI Research Park Phases 12 & 13 Property at the time with respect to the property and business interruption policies (excluding the terrorism, named storm and earthquake components of such premiums). See “Risk Factors—Risks Relating to the Mortgage Loans—Terrorism Insurance May Not Be Available for All Mortgaged Properties” in the Preliminary Prospectus.
THE INFORMATION IN THIS STRUCTURAL AND COLLATERAL TERM SHEET IS NOT COMPLETE AND MAY BE AMENDED PRIOR TO THE TIME OF SALE. THIS TERM SHEET IS NOT AN OFFER TO SELL THESE SECURITIES AND IT IS NOT A SOLICITATION OF AN OFFER TO BUY THESE SECURITIES IN ANY JURISDICTION WHERE THE OFFER OR SALE IS NOT PERMITTED.
78
(THIS PAGE INTENTIONALLY LEFT BLANK)
| Retail – Outlet Center | Loan #5 | Cut-off Date Balance: | | $65,000,000 |
| 10562 and 10746 Emerald Coast Parkway | Silver Sands Premium Outlets | Cut-off Date LTV: | | 50.7% |
| Miramar Beach, FL 32550 | | U/W NCF DSCR: | | 3.27x |
| | | U/W NOI Debt Yield: | | 13.8% |
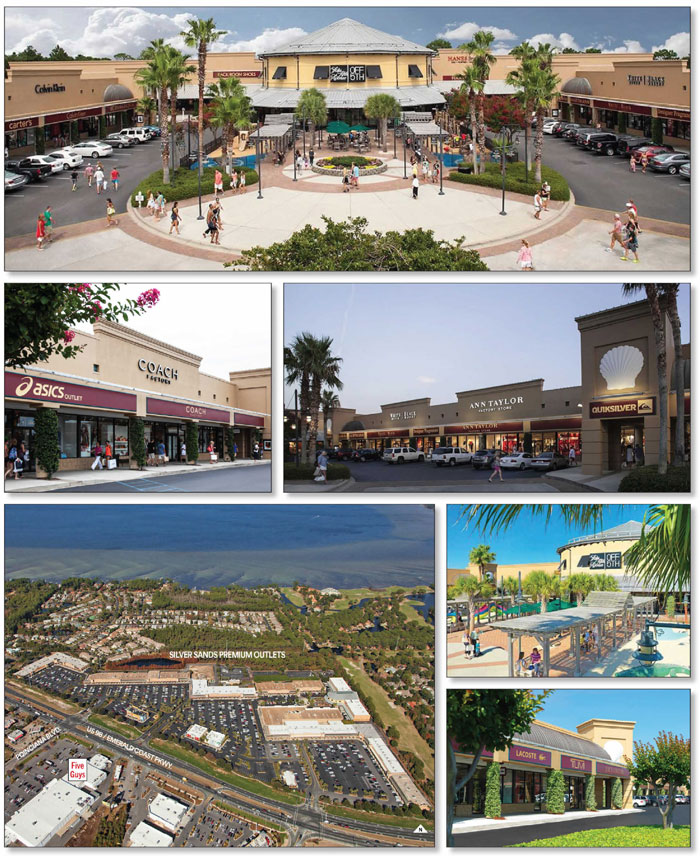
THE INFORMATION IN THIS STRUCTURAL AND COLLATERAL TERM SHEET IS NOT COMPLETE AND MAY BE AMENDED PRIOR TO THE TIME OF SALE. THIS TERM SHEET IS NOT AN OFFER TO SELL THESE SECURITIES AND IT IS NOT A SOLICITATION OF AN OFFER TO BUY THESE SECURITIES IN ANY JURISDICTION WHERE THE OFFER OR SALE IS NOT PERMITTED.
80
| Retail – Outlet Center | Loan #5 | Cut-off Date Balance: | | $65,000,000 |
| 10562 and 10746 Emerald Coast Parkway | Silver Sands Premium Outlets | Cut-off Date LTV: | | 50.7% |
| Miramar Beach, FL 32550 | | U/W NCF DSCR: | | 3.27x |
| | | U/W NOI Debt Yield: | | 13.8% |
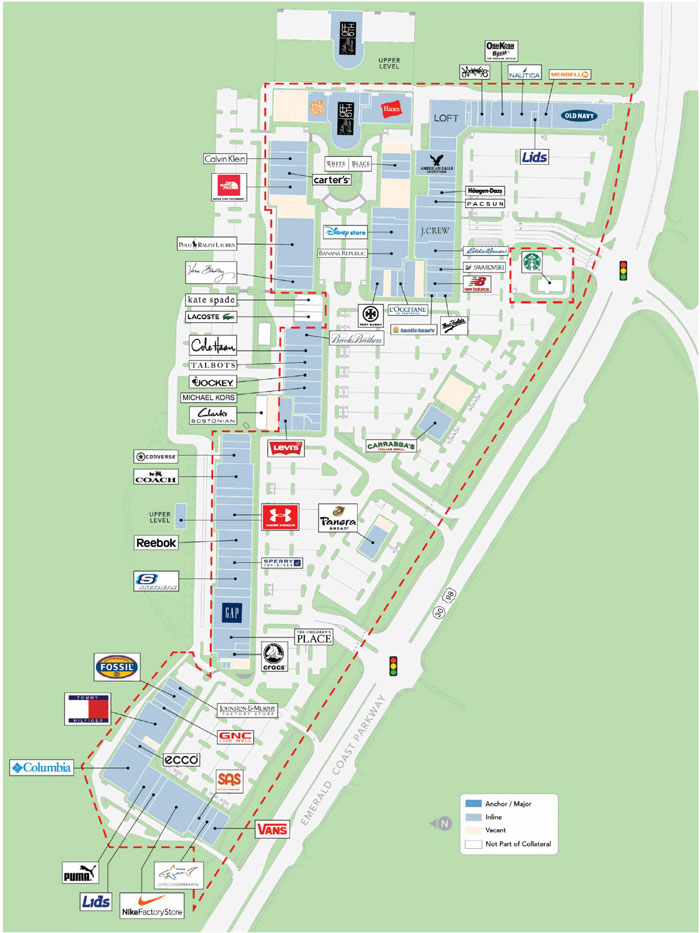
THE INFORMATION IN THIS STRUCTURAL AND COLLATERAL TERM SHEET IS NOT COMPLETE AND MAY BE AMENDED PRIOR TO THE TIME OF SALE. THIS TERM SHEET IS NOT AN OFFER TO SELL THESE SECURITIES AND IT IS NOT A SOLICITATION OF AN OFFER TO BUY THESE SECURITIES IN ANY JURISDICTION WHERE THE OFFER OR SALE IS NOT PERMITTED.
81
| Retail – Outlet Center | Loan #5 | Cut-off Date Balance: | | $65,000,000 |
| 10562 and 10746 Emerald Coast Parkway | Silver Sands Premium Outlets | Cut-off Date LTV: | | 50.7% |
| Miramar Beach, FL 32550 | | U/W NCF DSCR: | | 3.27x |
| | | U/W NOI Debt Yield: | | 13.8% |
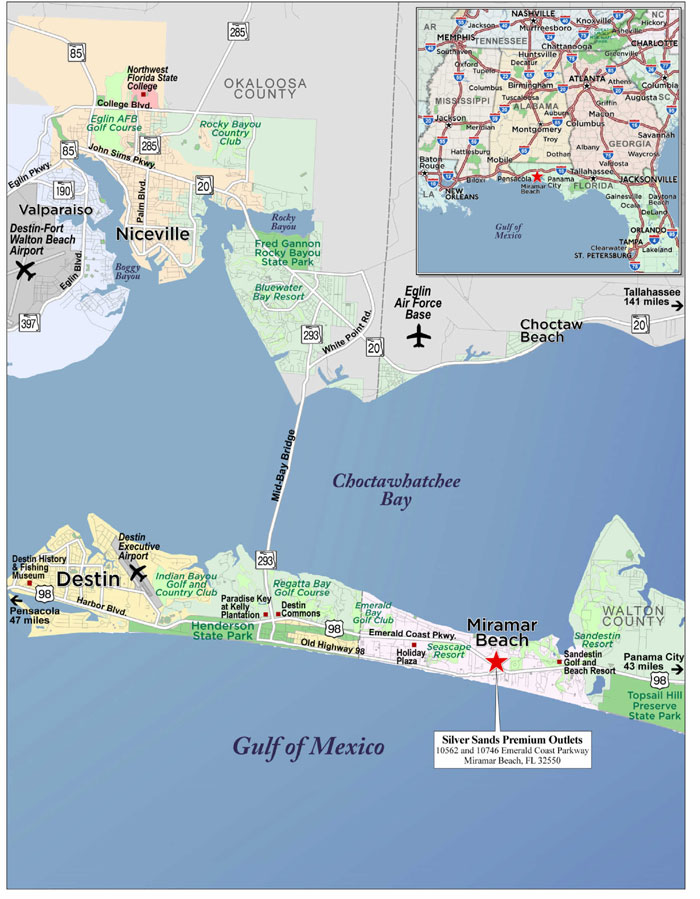
THE INFORMATION IN THIS STRUCTURAL AND COLLATERAL TERM SHEET IS NOT COMPLETE AND MAY BE AMENDED PRIOR TO THE TIME OF SALE. THIS TERM SHEET IS NOT AN OFFER TO SELL THESE SECURITIES AND IT IS NOT A SOLICITATION OF AN OFFER TO BUY THESE SECURITIES IN ANY JURISDICTION WHERE THE OFFER OR SALE IS NOT PERMITTED.
82
| No. 5 – Silver Sands Premium Outlets |
| |
| Mortgage Loan Information | | Mortgaged Property Information |
| Mortgage Loan Seller: | Bank of America, National Association | | Single Asset/Portfolio: | Single Asset |
Credit Assessment (Fitch/KBRA/S&P): | NR/NR/NR | | Property Type – Subtype: | Retail – Outlet Center |
| Original Principal Balance(1): | $65,000,000 | | Location: | Miramar Beach, FL |
| Cut-off Date Balance(1): | $65,000,000 | | Size: | 435,156 SF |
| % of Initial Pool Balance: | 5.5% | | Cut-off Date Balance Per SF(1): | $321.72 |
| Loan Purpose: | Refinance | | Maturity Date Balance Per SF(1): | $321.72 |
| Borrower Sponsors: | Simon Property Group, L.P. and The Howard Group | | Year Built/Renovated: | 1986, 1995, 1999, 2000, 2007 /NAP |
| Guarantors(2): | Silver Sands GL I, LLC and Silver Sands GL II, LLC | | Title Vesting: | Fee |
| Mortgage Rate: | 3.9590% | | Property Manager: | Simon Management Associates II, LLC (affiliate of borrowers) |
| Note Date: | February 10, 2022 | | Current Occupancy (As of)(5): | 88.5% (1/26/2022) |
| Seasoning: | 0 months | | 12/31/2021 Occupancy(5): | 91.0% |
| Maturity Date: | March 1, 2032 | | 12/31/2020 Occupancy(5): | 91.0% |
| IO Period: | 120 months | | 12/31/2019 Occupancy(5): | 95.0% |
| Loan Term (Original): | 120 months | | 12/31/2018 Occupancy(5): | 92.0% |
| Amortization Term (Original): | 0 months | | As-Is Appraised Value(6): | $276,000,000 |
| Loan Amortization Type: | Interest Only | | As-Is Appraised Value Per SF(6): | $634.26 |
| Call Protection(3): | L(24),D(90),O(6) | | As-Is Appraisal Valuation Date: | December 21, 2021 |
| Lockbox Type: | Hard/Springing Cash Management | | Underwriting and Financial Information(6) |
| Additional Debt(1): | Yes | | TTM 11/30/2021 NOI: | $18,611,978 |
| Additional Debt Type (Balance)(1): | Pari Passu ($75,000,000) | | 12/31/2020 NOI: | $17,079,139 |
| | | | 12/31/2019 NOI: | $18,788,520 |
| | | | 12/31/2018 NOI: | $17,833,642 |
| | | | U/W Revenues: | $23,797,959 |
| | | U/W Expenses: | $4,494,806 |
| | | U/W NOI: | $19,303,153 |
| Escrows and Reserves(4) | | U/W NCF: | $18,367,568 |
| | Initial | Monthly | Cap | | U/W DSCR based on NOI/NCF(1): | 3.43x / 3.27x |
| Taxes | $0 | Springing | NAP | | U/W Debt Yield based on NOI/NCF(1): | 13.8% / 13.1% |
| Insurance | $0 | Springing | NAP | | U/W Debt Yield at Maturity based on NOI/NCF(1): | 13.8% / 13.1% |
| Replacement Reserve | $0 | Springing | $174,062 | | Cut-off Date LTV Ratio(1): | 50.7% |
| TI/LC Reserve | $0 | Springing | $1,740,624 | | LTV Ratio at Maturity(1): | 50.7% |
| | | | | | | | | |
| Sources and Uses |
| Sources | | | | | Uses | | | |
| Whole Loan Amount(1) | $140,000,000 | | 100.0% | | Loan Payoff | $100,317,667 | | 71.7% |
| | | | | | Return of Equity | 38,258,449 | | 27.3 |
| | | | | | Closing Costs | 1,423,884 | | 1.0 |
| Total Sources | $140,000,000 | | 100.0% | | Total Uses | $140,000,000 | | 100.0% |
| (1) | The Cut-off Date Balance Per SF, Maturity Date Balance Per SF, U/W DSCR based on NOI/NCF, U/W Debt Yield based on NOI/NCF, U/W Debt Yield at Maturity based on NOI/NCF, Cut-off Date LTV Ratio and LTV Ratio at Maturity numbers presented above are based on the Silver Sands Premium Outlets Whole Loan (as defined below). |
| (2) | There is no non-recourse carveout guarantor and no separate environmental indemnitor for the Silver Sands Premium Outlets Whole Loan. While the Silver Sands Premium Outlets Borrowers (as defined below) are obligated under the non-recourse carveout provisions, no separate guaranty was executed by the Silver Sands Premium Outlets Borrowers. |
| (3) | Defeasance of the Silver Sands Premium Outlets Whole Loan is permitted at any time after the earlier to occur of (a) the end of the two-year period commencing on the closing date of the securitization of the last portion of the Silver Sands Premium Outlets Whole Loan to be securitized and (b) September 1, 2025. The assumed prepayment lockout period of 24 payments is based on the closing date of this transaction in March 2022. |
| (4) | See “Escrows” below for further discussion of reserve information. |
| (5) | The Silver Sands Premium Outlets Property (as defined below) was 91.2% occupied, as of January 26, 2022, including the Retail Development Program (“RDP”) tenants. These tenants have been excluded from the underwriting as RDP lease terms are for less than a year and can be terminated by the landlord at any time with 30 days’ notice. Historical occupancy is inclusive of RDP tenants. |
| (6) | The novel coronavirus pandemic is an evolving situation and could impact the Silver Sands Premium Outlets Whole Loan more severely than assumed in the underwriting of the Silver Sands Premium Outlets Whole Loan and could adversely affect the NOI, NCF and occupancy information, as well as the appraised value and the DSCR, LTV and Debt Yield metrics presented above and herein. See "Risk Factors-—Risks Related to Market Conditions and Other External Factors—The Coronavirus Pandemic Has Adversely Affected the Global Economy and Will Likely Adversely Affect the Performance of the Mortgage Loans" in the Preliminary Prospectus. |
THE INFORMATION IN THIS STRUCTURAL AND COLLATERAL TERM SHEET IS NOT COMPLETE AND MAY BE AMENDED PRIOR TO THE TIME OF SALE. THIS TERM SHEET IS NOT AN OFFER TO SELL THESE SECURITIES AND IT IS NOT A SOLICITATION OF AN OFFER TO BUY THESE SECURITIES IN ANY JURISDICTION WHERE THE OFFER OR SALE IS NOT PERMITTED.
83
| Retail – Outlet Center | Loan #5 | Cut-off Date Balance: | | $65,000,000 |
| 10562 and 10746 Emerald Coast Parkway | Silver Sands Premium Outlets | Cut-off Date LTV: | | 50.7% |
| Miramar Beach, FL 32550 | | U/W NCF DSCR: | | 3.27x |
| | | U/W NOI Debt Yield: | | 13.8% |
The Mortgage Loan. The mortgage loan (the “Silver Sands Premium Outlets Mortgage Loan”) is part of a whole loan that was co-originated by Bank of America, National Association and JPMorgan Chase Bank, National Association, and is evidenced by three pari passu promissory notes, with an aggregate original principal balance of $140,000,000 (together, the “Silver Sands Premium Outlets Whole Loan”). The Silver Sands Premium Outlets Whole Loan is secured by a first priority fee mortgage encumbering a 435,156 square foot retail outlet center located in Miramar Beach, Florida (the “Silver Sands Premium Outlets Property”). The Silver Sands Premium Outlets Mortgage Loan is evidenced by the controlling Note A-1 with an original principal balance of $65,000,000. The remaining promissory notes comprising the Silver Sands Premium Outlets Whole Loan are summarized in the table below. The Silver Sands Premium Outlets Whole Loan will be serviced pursuant to the pooling and servicing agreement for the BANK 2022-BNK40 securitization trust. See “Description of the Mortgage Pool—The Whole Loans—The Serviced Pari Passu Whole Loans” and “Pooling and Servicing Agreement” in the Preliminary Prospectus.
Note Summary
| Notes | Original Balance | Cut-off Date Balance | Anticipated Note Holder | Controlling Piece |
| A-1 | $65,000,000 | $65,000,000 | BANK 2022-BNK40 | Yes |
| A-2 | $56,000,000 | $56,000,000 | BMARK 2022-B33(1) | No |
| A-3 | $19,000,000 | $19,000,000 | BANA | No |
| Total | $140,000,000 | $140,000,000 | | |
| (1) | It is anticipated that the specified notes will be contributed to the BMARK 2022-B33 securitization, which has not yet closed. |
The Borrowers and Borrower Sponsors. The borrowers are Silver Sands GL I, LLC and Silver Sands GL II, LLC (together, the “Silver Sands Premium Outlets Borrowers”), each a Delaware limited liability company and single purpose entity with two independent directors. The borrower sponsors are a joint venture between Simon Property Group, L.P. (50%) and The Howard Group (50%).
Simon Property Group, L.P. is the operating partnership of Simon Property Group Inc. (NYSE: SPG / Moody’s: A3, S&P: A-), which is a global leader in the ownership of premier shopping, dining, entertainment and mixed-use destinations and an S&P 100 company. As of December 31, 2021, Simon owned or had an interest in 232 properties comprising 186 million square feet in North America, Asia and Europe. Simon also owns an 80% interest in The Taubman Realty Group, which owns 24 regional, super-regional, and outlet malls in the U.S. and Asia. Additionally, as of December 31, 2021, Simon had a 22.4% ownership interest in Klépierre, a publicly traded, Paris-based real estate company, which owns shopping centers in 14 European countries. As of December 2021, Simon has an equity market capitalization of over $60 billion. See “Loan Purpose; Default History, Bankruptcy Issues and Other Proceedings” in the Preliminary Prospectus.
The Howard Group is a real estate development company specializing in premier commercial developments and upscale resort residential properties located along northwest Florida’s Gulf Coast. Founded by Keith Howard in 1988, The Howard Group’s development portfolio includes the Grand Boulevard at Sandestin, 170,000 square feet of Class A office space, and over 1.3 million square feet of retail, restaurant, and hotel space.
The Property. The Silver Sands Premium Outlets Property is a 435,156 square foot retail outlet center located in Miramar Beach, Florida. The Silver Sands Premium Outlets Property was originally developed by The Howard Group in 1986 with additional buildings added in 1995, 1999, 2000 and 2007. The Silver Sands Premium Outlets Property fronts the north side of Emerald Coast Parkway (US Highway 98) in Walton County. The Emerald Coast attracts approximately 4.5 million visitors each year.
Historical occupancy at the Silver Sands Premium Outlets Property has averaged 93.6%, including RDP tenants, over the last ten years (2012-2021). As of January 26, 2022, the Silver Sands Premium Outlets Property was 88.5% occupied by a granular rent roll consisting of 80 unique tenants (91.2% occupied including five RDP tenants), with no single tenant occupying more than 6.8% of net rentable area or contributing more than 3.7% of underwritten rent. The Silver Sands Premium Outlets Property is home to many national brands including Saks Fifth Avenue Off 5th, Polo Ralph Lauren, Nike Factory Store, Old Navy Outlet, Columbia Sportswear Company and Hanesbrands, as well as restaurants Panera Bread and Carrabba’s Italian Grill. The 10 largest tenants by square footage at the Silver Sands Premium Outlets Property account for less than 25% of the underwritten rent.
As of trailing-12 months ending November 30, 2021, the Silver Sands Premium Outlets Property generated total sales of approximately $191 million which is approximately 32.8% higher than 2020 sales and 9.9% higher than 2019 sales. Over the same time period, inline tenants with less than 10,000 square feet generated sales of $528 per SF (at an occupancy cost of 13.1%). As of TTM November 2021, several tenants generated significantly higher sales figures compared to 2019 sales including Gap Outlet ($444 per SF, 18.0% increase), Old Navy Outlet ($482 per SF, 17.6% increase), Tommy Hilfiger ($314 per SF, 20.3% increase), Columbia Sportswear Company ($831 per SF, 14.5% increase), Converse ($531 per SF, 57.6% increase), Under Armour ($1,062 per SF, 30.7% increase), and Crocs ($1,416 per SF, 69.0% increase), among others.
THE INFORMATION IN THIS STRUCTURAL AND COLLATERAL TERM SHEET IS NOT COMPLETE AND MAY BE AMENDED PRIOR TO THE TIME OF SALE. THIS TERM SHEET IS NOT AN OFFER TO SELL THESE SECURITIES AND IT IS NOT A SOLICITATION OF AN OFFER TO BUY THESE SECURITIES IN ANY JURISDICTION WHERE THE OFFER OR SALE IS NOT PERMITTED.
84
| Retail – Outlet Center | Loan #5 | Cut-off Date Balance: | | $65,000,000 |
| 10562 and 10746 Emerald Coast Parkway | Silver Sands Premium Outlets | Cut-off Date LTV: | | 50.7% |
| Miramar Beach, FL 32550 | | U/W NCF DSCR: | | 3.27x |
| | | U/W NOI Debt Yield: | | 13.8% |
The following table contains tenant sales history for the Silver Sands Premium Outlets Property:
Tenant Sales
| | 2016 | 2017 | 2018 | 2019 | 2020(1) | 11/30/2021 TTM(2) |
| Gross Mall Sales | $188,475,330 | $181,819,372 | $182,705,495 | $173,745,896 | $143,705,997 | $190,904,458 |
| Sales PSF (Inline < 10,000 SF) | $479 | $471 | $484 | $471 | $411 | $528 |
| Occupancy Cost (Inline < 10,000 SF) | 12.8% | 13.7% | 13.7% | 14.3% | 16.6% | 13.1% |
| (1) | The Silver Sands Premium Outlets Property was closed between March 18 and May 3, 2020 due to COVID-19 restrictions. |
| (2) | Information is as of November 30, 2021, as provided by the borrower sponsor, and only includes tenants reporting sales. |
COVID-19 Update. As of February 10, 2022, the Silver Sands Premium Outlets Whole Loan is not subject to any forbearance, modification or debt service relief request. The first payment date of the Silver Sands Whole Loan will be April 1, 2022. As of January 26, 2022, 17 tenants, including the largest tenant, Saks Fifth Avenue Off 5th, and the fifth largest tenant, Columbia Sportswear Company, received rental relief in connection with the COVID-19 pandemic. Eleven tenants have repaid any rent relief in full and returned to their contractual rental agreements. Rent deferral for Saks Fifth Avenue Off Fifth and rent discount for Columbia Sportswear Company are scheduled to end by April 30, 2022. The remaining four outstanding tenant rental deferments or discounts are scheduled to end by September 2022.
Major Tenants.
Saks Fifth Avenue Off 5th (29,502 square feet, 6.8% of net rentable area, 2.1% of underwritten base rent). Saks Fifth Avenue Off 5th (“Saks”) (NYSE: SKS) is a retail operator in the United States offering fashion apparel, shoes, accessories, jewelry, cosmetics and gifts. Founded in 1924 and headquartered in New York City, Saks operates stores under the brand names Saks Fifth Avenue and Saks Fifth Avenue Off 5th. Saks is operating as a Saks Fifth Avenue Off 5th at the Silver Sands Premium Outlets Property under a lease expiring on May 31, 2024 with one five-year extension option remaining. Saks has been at the Silver Sands Premium Outlets Property since 2004 and has renewed its lease multiple times. Saks is currently paying 6% of sales in lieu of rent. Saks reported sales at the Silver Sands Premium Outlets Property of $207 per square foot for the trailing-12 months ended November 30, 2021. Reported sales per square foot were $137, $192 and $209 for 2020, 2019 and 2018, respectively.
Polo Ralph Lauren (15,621 square feet, 3.6% of net rentable area, 3.0% of underwritten base rent). Polo Ralph Lauren (“Polo”) is part of Ralph Lauren Corporation (NYSE: RL / Moody’s: A3, S&P: A-), a designer, marketer and distributor of premium lifestyle products in apparel, home, accessories and fragrances. Founded in 1967 and based in New York City, Ralph Lauren Corporation’s brand names include: Polo by Ralph Lauren, Ralph Lauren Collection, RLX, Rugby, Chaps and Club Monaco. Polo occupies 15,621 square feet at the Silver Sands Premium Outlets Property under a lease expiring on December 31, 2027 with one seven-year extension option remaining. Polo has been at the Silver Sands Premium Outlets Property since 1997. The lease provides for a rental rate of $33.73 per square foot, increasing to $36.73 per square foot on January 1, 2024. Polo reported sales at the Silver Sands Premium Outlets Property of $578 PSF for the trailing-12 months ended November 30, 2021. Reported sales per square foot were $483, $598 and $622 for 2020, 2019 and 2018, respectively.
Nike Factory Store (15,327 square feet, 3.5% of net rentable area, 3.0% of underwritten base rent). Nike Factory Store (“Nike”) (NYSE: NKE/ Moody’s: A1, S&P: AA-), founded in 1964 and headquartered in Beaverton, Oregon, is the largest seller of athletic footwear and athletic apparel in the world with approximately 73,300 employees as of May 31, 2021. Nike occupies 15,327 square feet at the Silver Sands Premium Outlets Property under a lease expiring on January 31, 2029. Nike has been at the Silver Sands Premium Outlets Property since 1999. The lease provides for a rental rate of $33.79 PSF with 2% annual increases each June. Nike reported sales at the Silver Sands Premium Outlets Property of $657 PSF for the trailing-12 months ended November 30, 2021. Reported sales per square foot were $560, $763 and $824 for 2020, 2019 and 2018, respectively.
Old Navy Outlet (12,934 square feet, 3.0% of net rentable area, 2.2% of underwritten base rent). Old Navy Outlet (“Old Navy”) is a family clothing store offering items under its own brand name at discounted prices. Founded in 1994, Old Navy has grown to more than 1,010 stores throughout the United States and Canada. Old Navy is owned by Gap Inc. (NYSE: GAP/ Moody’s: Ba2, S&P: BB). Old Navy occupies 12,934 square feet at the Silver Sands Premium Outlets Property under a lease expiring on January 31, 2029. Old Navy has been at the Silver Sands Premium Outlets Property since 2018. The lease provides for a rental rate of $23.35 PSF with 2% annual increases each October. In addition, Old Navy also pays percentage rent of 8% of annual sales over a $5.3 million breakpoint. Old Navy reported sales at the Silver Sands Premium Outlets Property of $482 PSF for the trailing-12 months ended November 30, 2021. Reported sales per square foot were $358, $410 and $431 for 2020, 2019 and 2018, respectively.
Columbia Sportswear Company (12,014 square feet, 2.8% of net rentable area, 3.5% of underwritten annual base rent). Columbia Sportswear Company (“Columbia”) (NASDAQ: COLM) is a retailer of global outdoor apparel, footwear, accessories and equipment. Founded in 1938 and headquartered in Portland, Oregon, Columbia designs, develops, markets and distributes products under the brands: Columbia, Sorel, Mountain Hardwear and Montrail. Columbia occupies 12,014 square feet at the Silver Sands Premium Outlets Property under a lease expiring on January 31, 2023. Columbia has been at the Silver Sands Premium Outlets Property since 2012. The lease provides for a rental rate of $27.85 PSF. In addition, the lease provides for percentage rent of 6.0% of gross sales in excess of $5.3 million. Columbia reported sales at the Silver Sands Premium Outlets Property of $831 PSF for the trailing-12 months ended November 30, 2021. Reported sales per square foot were $635, $726 and $697 for 2020, 2019 and 2018, respectively.
THE INFORMATION IN THIS STRUCTURAL AND COLLATERAL TERM SHEET IS NOT COMPLETE AND MAY BE AMENDED PRIOR TO THE TIME OF SALE. THIS TERM SHEET IS NOT AN OFFER TO SELL THESE SECURITIES AND IT IS NOT A SOLICITATION OF AN OFFER TO BUY THESE SECURITIES IN ANY JURISDICTION WHERE THE OFFER OR SALE IS NOT PERMITTED.
85
| Retail – Outlet Center | Loan #5 | Cut-off Date Balance: | | $65,000,000 |
| 10562 and 10746 Emerald Coast Parkway | Silver Sands Premium Outlets | Cut-off Date LTV: | | 50.7% |
| Miramar Beach, FL 32550 | | U/W NCF DSCR: | | 3.27x |
| | | U/W NOI Debt Yield: | | 13.8% |
The following table presents certain information relating to the tenancy at the Silver Sands Premium Outlets Property:
Tenant Summary(1)
| Tenant Name | Credit Rating (Fitch/ Moody’s/
S&P)(2) | Tenant NRSF | % of
NRSF | Annual U/W Base Rent PSF(3) | Annual
U/W Base Rent(3) | % of Total Annual U/W Base Rent | 11/30/2021 TTM Sales | Lease
Exp.
Date | Renewal Options |
| Sales $ | Sales PSF ($) | Occ Cost % |
| Saks Fifth Avenue Off 5th | NR/NR/NR | 29,502 | 6.8% | $12.41 | $366,220 | 2.1% | 6,103,670 | 207 | 6.7% | 5/31/2024 | 1 x 5 yr |
| Polo Ralph Lauren | NR/A3/A- | 15,621 | 3.6 | 33.73 | 526,896 | 3.0 | 9,021,278 | 578 | 7.5% | 12/31/2027 | 1 x 7 yr |
| Nike Factory Store | NR/A1/AA- | 15,327 | 3.5 | 34.47 | 528,322 | 3.0 | 10,076,295 | 657 | 8.2% | 1/31/2029 | None |
| Old Navy Outlet | NR/Ba2/BB | 12,934 | 3.0 | 29.59 | 382,712 | 2.2 | 6,238,844 | 482 | 10.0% | 1/31/2029 | None |
| Columbia Sportswear Company | NR/NR/NR | 12,014 | 2.8 | 51.14 | 614,369 | 3.5 | 9,985,908 | 831 | 7.7% | 1/31/2023 | None |
| Hanesbrands | NR/Ba2/BB | 11,738 | 2.7 | 22.86 | 268,331 | 1.5 | 1,808,666 | 154 | 23.9% | 12/31/2022 | None |
| Loft Outlet | NR/NR/NR | 11,701 | 2.7 | 25.00 | 292,525 | 1.7 | 2,491,078 | 213 | 17.9% | 4/30/2023 | None |
| Gap Outlet | NR/Ba2/BB | 10,285 | 2.4 | 62.46 | 642,430 | 3.6 | 4,565,512 | 444 | 17.3% | 1/31/2023 | None |
| Tommy Hilfiger | NR/Baa3/BBB- | 10,000 | 2.3 | 32.78 | 327,800 | 1.9 | 3,137,400 | 314 | 17.7% | 8/31/2024 | None |
| Subtotal/Wtd. Avg. | | 129,122 | 29.7% | $30.59 | $3,949,605 | 22.3% | | | | | |
| | | | | | | | | | | | |
| Other Tenants | | 256,016 | 58.8% | $53.71 | $13,751,630 | 77.7% | | | | | |
| Vacant | | 50,018 | 11.5 | 0.00 | 0 | 0.0 | | | | | |
| Total/Wtd. Avg. | | 435,156 | 100.0% | $45.96(4) | $17,701,235 | 100.0% | | | | | |
| | | | | | | | | | | | |
| (1) | Information is based on the underwritten rent roll dated January 26, 2022. |
| (2) | Certain ratings are those of the parent company whether or not the parent guarantees the lease. |
| (3) | Annual U/W Base Rent PSF and Annual U/W Base Rent includes overage and percent in lieu rent as of trailing twelve November 2021 sales for certain tenants. |
| (4) | Wtd. Avg. Annual U/W Base Rent PSF excludes vacant space. |
The following table presents certain information relating to the lease rollover schedule at the Silver Sands Premium Outlets Property:
Lease Expiration Schedule(1)(2)
Year Ending
December 31, | No. of Leases Expiring | Expiring
NRSF | % of
Total
NRSF Expiring | Cumulative
Expiring
NRSF | Cumulative
% of Total
NRSF
Expiring | Annual
U/W
Base Rent Expiring(3) | % of Total
Annual U/W
Base Rent
Expiring | Annual
U/W
Base Rent
PSF
Expiring(3) |
| MTM | 0 | 0 | 0.0% | 0 | 0.0% | $0 | 0.0% | $0.00 |
| 2022 | 10 | 40,755 | 9.4 | 40,755 | 9.4% | 1,690,116 | 9.5 | 41.47 |
| 2023 | 20 | 91,507 | 21.0 | 132,262 | 30.4% | 4,258,991 | 24.1 | 46.54 |
| 2024 | 16 | 98,156 | 22.6 | 230,418 | 53.0% | 4,084,083 | 23.1 | 41.61 |
| 2025 | 12 | 39,159 | 9.0 | 269,577 | 61.9% | 2,291,350 | 12.9 | 58.51 |
| 2026 | 7 | 27,480 | 6.3 | 297,057 | 68.3% | 1,639,028 | 9.3 | 59.64 |
| 2027 | 4 | 25,940 | 6.0 | 322,997 | 74.2% | 1,083,772 | 6.1 | 41.78 |
| 2028 | 0 | 0 | 0.0 | 322,997 | 74.2% | 0 | 0.0 | 0.00 |
| 2029 | 5 | 36,298 | 8.3 | 359,295 | 82.6% | 1,466,141 | 8.3 | 40.39 |
| 2030 | 5 | 19,543 | 4.5 | 378,838 | 87.1% | 1,012,931 | 5.7 | 51.83 |
| 2031 | 0 | 0 | 0.0 | 378,838 | 87.1% | 0 | 0.0 | 0.00 |
| 2032 | 1 | 6,300 | 1.4 | 385,138 | 88.5% | 174,825 | 1.0 | 27.75 |
| Thereafter | 0 | 0 | 0.0 | 385,138 | 88.5% | 0 | 0.0 | 0.00 |
| Vacant | 0 | 50,018 | 11.5 | 435,156 | 100.0% | 0 | 0.0 | 0.00 |
| Total/Wtd. Avg. | 80 | 435,156 | 100.0% | | | $17,701,235 | 100.0% | $45.96(4) |
| (1) | Information is based on the underwritten rent roll dated January 26, 2022. |
| (2) | Certain tenants may have lease termination options that are exercisable prior to the originally stated expiration date of the subject lease and that are not considered in the Lease Rollover Schedule. |
| (3) | Annual U/W Base Rent Expiring and Annual U/W Base Rent PSF Expiring includes overage and percent in lieu rent as of trailing twelve November 2021 sales for certain tenants. |
| (4) | Total/Wtd. Avg. Annual U/W Base Rent PSF Expiring excludes vacant space. |
THE INFORMATION IN THIS STRUCTURAL AND COLLATERAL TERM SHEET IS NOT COMPLETE AND MAY BE AMENDED PRIOR TO THE TIME OF SALE. THIS TERM SHEET IS NOT AN OFFER TO SELL THESE SECURITIES AND IT IS NOT A SOLICITATION OF AN OFFER TO BUY THESE SECURITIES IN ANY JURISDICTION WHERE THE OFFER OR SALE IS NOT PERMITTED.
86
| Retail – Outlet Center | Loan #5 | Cut-off Date Balance: | | $65,000,000 |
| 10562 and 10746 Emerald Coast Parkway | Silver Sands Premium Outlets | Cut-off Date LTV: | | 50.7% |
| Miramar Beach, FL 32550 | | U/W NCF DSCR: | | 3.27x |
| | | U/W NOI Debt Yield: | | 13.8% |
Historical occupancy at the Silver Sands Premium Outlets Property has averaged 93.6%, inclusive of RDP tenants, over the last ten years (2012-2021). The following table presents recent historical occupancy percentages at the Silver Sands Premium Outlets Property:
Historical Occupancy
12/31/2019(1) | 12/31/2020(1) | 12/31/2021(1) | 1/26/2022(2) |
| 95.0% | 91.0% | 91.0% | 88.5% |
| | | | |
| (1) | Information obtained from the borrower and is inclusive of RDP tenants. |
| (2) | Information obtained from the underwritten rent roll. The Silver Sands Premium Outlets Property was 91.2% occupied including RDP tenants. These tenants have been excluded from the underwriting as RDP lease terms are for less than a year and can be terminated by the landlord at any time with 30 days’ notice. |
Historical Performance and Underwritten Net Cash Flow. The following table presents certain information relating to the historical performance and underwritten net cash flow at the Silver Sands Premium Outlets Property:
Cash Flow Analysis
| | | 2018 | | 2019 | | 2020(2) | | TTM 11/30/2021 | | U/W | | %(1) | | U/W $
per SF | |
| Base Rent(3) | | $15,825,272 | | $15,790,160 | | $15,205,780 | | $14,557,603 | | $14,958,916 | | 56.4% | | $34.38 | |
| Contractual Rent Steps(4) | | 0 | | 0 | | 0 | | 0 | | 340,303 | | 1.3 | | 0.78 | |
| Income from Vacant Units | | 0 | | 0 | | 0 | | 0 | | 3,232,735 | | 12.2 | | 7.43 | |
| Overage Rent(5) | | 604,710 | | 717,979 | | 203,540 | | 1,507,332 | | 2,003,419 | | 7.6 | | 4.60 | |
| Percent In Lieu(5) | | 408,543 | | 396,960 | | 478,604 | | 404,861 | | 398,598 | | 1.5 | | 0.92 | |
| Expense Reimbursement | | 5,357,958 | | 5,759,017 | | 5,613,944 | | 6,121,594 | | 5,585,286 | | 21.1 | | 12.84 | |
| Net Rental Income | | $22,196,483 | | $22,664,116 | | $21,501,868 | | $22,591,390 | | $26,519,256 | | 100.0% | | $60.94 | |
| Temp / Specialty Leasing Income | | 200,659 | | 295,345 | | 359,711 | | 399,652 | | 346,207 | | 1.3% | | 0.80 | |
| Other Income(6) | | 217,474 | | 262,293 | | 178,004 | | 238,654 | | 232,119 | | 0.9 | | 0.53 | |
| (Vacancy & Concessions)(7) | | (18,530) | | 3,713 | | (1,676,895) | | (55,181) | | (3,299,623) | | (12.4) | | (7.58) | |
| Effective Gross Income | | $22,596,086 | | $23,225,467 | | $20,362,688 | | $23,174,515 | | $23,797,959 | | 89.7% | | $54.69 | |
| | | | | | | | | | | | | | | | |
| Real Estate Taxes | | $216,625 | | $218,244 | | $216,383 | | $231,741 | | $279,350 | | 1.2% | | $0.64 | |
| Insurance | | 578,631 | | 614,096 | | 718,437 | | 809,419 | | 673,615 | | 2.8 | | 1.55 | |
| Other Operating Expenses | | 3,967,188 | | 3,604,607 | | 2,348,729 | | 3,521,377 | | 3,541,841 | | 14.9 | | 8.14 | |
| Total Operating Expenses | | $4,762,444 | | $4,436,947 | | $3,283,549 | | $4,562,537 | | $4,494,806 | | 18.9% | | $10.33 | |
| | | | | | | | | | | | | | | | |
| Net Operating Income | | $17,833,642 | | $18,788,520 | | $17,079,139 | | $18,611,978 | | $19,303,153 | | 81.1% | | $44.36 | |
| Replacement Reserves | | 0 | | 0 | | 0 | | 0 | | 65,273 | | 0.3 | | 0.15 | |
| TI/LC | | 0 | | 0 | | 0 | | 0 | | 870,312 | | 3.7 | | 2.00 | |
| Net Cash Flow | | $17,833,642 | | $18,788,520 | | $17,079,139 | | $18,611,978 | | $18,367,568 | | 77.2% | | $42.21 | |
| | | | | | | | | | | | | | | | |
| NOI DSCR(8) | | 3.17x | | 3.34x | | 3.04x | | 3.31x | | 3.43x | | | | | |
| NCF DSCR(8) | | 3.17x | | 3.34x | | 3.04x | | 3.31x | | 3.27x | | | | | |
| NOI Debt Yield(8) | | 12.7% | | 13.4% | | 12.2% | | 13.3% | | 13.8% | | | | | |
| NCF Debt Yield(8) | | 12.7% | | 13.4% | | 12.2% | | 13.3% | | 13.1% | | | | | |
| (1) | Represents (i) percent of Net Rental Income for all revenue fields and (ii) percent of Effective Gross Income for all other fields. |
| (2) | The Silver Sands Premium Outlets Property was closed between March 18 and May 3, 2020 due to COVID-19 restrictions. |
| (3) | UW Base Rent is based on the underwritten rent roll dated January 26, 2022, with adjustments made for executed leases and tenants that have given notice to vacate. |
| (4) | UW Contractual Rent Steps were taken through April 2023. |
| (5) | UW Overage Rent and UW Percent In Lieu are based on the terms of applicable leases using TTM November 2021 sales figures. |
| (6) | UW Other Income includes income from local/miscellaneous media, ad panels and other miscellaneous income. |
| (7) | Historical Vacancy & Concessions represents bad debt write-offs net of recoveries. |
| (8) | Debt service coverage ratios and debt yields are based on the Silver Sands Premium Outlets Whole Loan. |
Appraisal. The appraiser concluded to an “as-is” Appraised Value for the Silver Sands Premium Outlets Property of $276,000,000 as of December 21, 2021.
Environmental Matters. According to the Phase I environmental site assessment dated December 20, 2021, there was no evidence of any recognized environmental conditions at the Silver Sands Premium Outlets Property.
Market Overview and Competition. The Silver Sands Premium Outlets Property is located in Miramar Beach, Walton County, Florida, in the Crestview-Fort Walton Beach-Destin CBSA. The Crestview-Fort Walton Beach-Destin CBSA is located in northwest Florida along
THE INFORMATION IN THIS STRUCTURAL AND COLLATERAL TERM SHEET IS NOT COMPLETE AND MAY BE AMENDED PRIOR TO THE TIME OF SALE. THIS TERM SHEET IS NOT AN OFFER TO SELL THESE SECURITIES AND IT IS NOT A SOLICITATION OF AN OFFER TO BUY THESE SECURITIES IN ANY JURISDICTION WHERE THE OFFER OR SALE IS NOT PERMITTED.
87
| Retail – Outlet Center | Loan #5 | Cut-off Date Balance: | | $65,000,000 |
| 10562 and 10746 Emerald Coast Parkway | Silver Sands Premium Outlets | Cut-off Date LTV: | | 50.7% |
| Miramar Beach, FL 32550 | | U/W NCF DSCR: | | 3.27x |
| | | U/W NOI Debt Yield: | | 13.8% |
the Gulf Coast of the Florida Panhandle, roughly 45 miles east of Pensacola and 55 miles west of Panama City. Destin is part of the Emerald Coast, the unofficial name of the 100-mile stretch along the Gulf Coast that runs through Escambia, Santa Rosas, Okaloosa, Walton and Bay Counties (from Pensacola to Panama City). The region is situated on a peninsula, separating the Gulf of Mexico and Choctawhatchee Bay. The Destin CBSA has a population of approximately 289,500, according to 2020 estimates by the U.S. Census, increasing 1.4% year-over-year. The Emerald Coast hosts approximately 4.5 million visitors per year, 80% of which visit Destin. Destin is one of the nation’s top vacation destinations because of its proximity to many major cities – two hours from Mobile, Alabama and three hours from Montgomery, Alabama.
The Crestview-Fort Walton Beach- Destin CBSA is among the most rapidly growing CBSAs in the nation, with the population growing by 18.1% over the last eight years – well above Florida at 13% and the nation at 5.8%. The primary reason for growth was positive net migration. According to the appraisal, the 2021 population within a one-, three- and five-mile radius of the Silver Sands Premium Outlets Property was 2,181, 7,797 and 15,337, respectively. The 2021 average household income within the same radii was $121,793, $127,749 and $130,150, respectively. Employment in the Crestview-Fort Walton Beach-Destin CBSA is concentrated in government, leisure and hospitality services, professional and business services, retail trade and education and health services representing 18.1%, 17.7%, 16.0%, 14.2%, and 10.5%, respectively. Fort Walton Beach Medical Center (1,429 employees), Walmart (1,400 employees), Publix (972 employees), Lockheed Martin (875 employees) and Northwest Florida State College (734 employees) are the five largest employers in the Crestview-Fort Walton Beach-Destin CBSA. The region is also home to the largest air force base in the United States Elgin Air Force Base, with approximately 17,000 military and civilian employees, and six other military installations within a one-hour drive.
The Silver Sands Premium Outlets Property’s primary trade area spans an area encompassing approximately 30 miles around the center. The secondary trade area extends up to 45 miles from the Silver Sands Premium Outlets Property given its regional accessibility and location of competitive properties. The nearest outlet center is Tanger Outlets in Foley, Alabama (556,673 square feet), approximately 80 miles west of the Silver Sands Premium Outlets Property.
The following table presents information regarding certain competitive properties to the Silver Sands Premium Outlets Property:
Competitive Property Summary(1)
| Property Address | Property Subtype | Year Built / Renovated | Size (SF) | Occupancy | Major Tenants | Distance From Subject |
Silver Sands Premium Outlets
10562 and 10746 Emerald Coast Parkway
Miramar Beach, FL | Outlet Center | 1986, 1995, 1999, 2000 and 2007 / NAP | 435,156(2) | 88.5%(2) | Saks Fifth Avenue Off 5th, Polo Ralph Lauren, Nike Factory Store, Old Navy Outlet, Columbia
Sportswear Company, Hanesbrands, Loft Outlet, Gap Outlet and Tommy Hilfiger | - |
Destin Commons
4300 and 4251 Legendary Drive
Destin, FL | Lifestyle Center | 2003 / 2014 | 602,397 | 87.0% | Belk, AMC Cinemas, Bass Pro, Books-A-Million, H&M,
Uncle Buck and Forever 21 | 4.4 mi |
Grand Boulevard
495 Grand Boulevard
Miramar Beach, FL | Lifestyle Center | 2004 / 2007 | 331,410 | 94.0% | Publix | 2.1 mi |
| (1) | Source: Appraisal, unless otherwise indicated. |
| (2) | Based on the underwritten rent roll dated January 26, 2022. The Silver Sands Premium Outlets Property was 91.2% occupied including RDP tenants. |
THE INFORMATION IN THIS STRUCTURAL AND COLLATERAL TERM SHEET IS NOT COMPLETE AND MAY BE AMENDED PRIOR TO THE TIME OF SALE. THIS TERM SHEET IS NOT AN OFFER TO SELL THESE SECURITIES AND IT IS NOT A SOLICITATION OF AN OFFER TO BUY THESE SECURITIES IN ANY JURISDICTION WHERE THE OFFER OR SALE IS NOT PERMITTED.
88
| Retail – Outlet Center | Loan #5 | Cut-off Date Balance: | | $65,000,000 |
| 10562 and 10746 Emerald Coast Parkway | Silver Sands Premium Outlets | Cut-off Date LTV: | | 50.7% |
| Miramar Beach, FL 32550 | | U/W NCF DSCR: | | 3.27x |
| | | U/W NOI Debt Yield: | | 13.8% |
The following table presents certain information relating to the appraiser’s market rent conclusions for the Silver Sands Premium Outlets Property:
Market Rent Summary
| Tenant Type | Market Rent (PSF) | Lease Term (Yrs) | Rent Increase
Projection |
| Anchor | $8.00 | 10 | 10.0% in Year 6 |
| Major | $32.50 | 10 | 10.0% in Year 6 |
| Over 5,000 SF | $40.00 | 5 | 2.0% per annum |
| 2,500-5,000 SF | $47.50 | 5 | 2.0% per annum |
| 1,000-2,500 SF | $55.00 | 5 | 2.0% per annum |
| Less than 1,000 SF | $95.00 | 5 | 2.0% per annum |
| Jewelry | $175.00 | 5 | 2.0% per annum |
| Outparcel | $25.00 | 10 | 10.0% in Year 6 |
Escrows.
Real Estate Taxes – The Silver Sands Premium Outlets Borrower is required to deposit monthly to a real estate tax reserve 1/12 of the annual estimated real estate taxes (i) during a Control Event (as defined below), (ii) during a Reserve Trigger Period (as defined below), or (iii) upon the Silver Sands Premium Outlets Borrower’s failure to provide the lender evidence of timely payment of taxes. In lieu of monthly deposits to the real estate tax reserve, the Silver Sands Premium Outlets Borrower is permitted to provide a letter of credit or a guaranty for such amounts from a Silver Sands Premium Outlets Borrower affiliate approved by the lender.
Insurance – The Silver Sands Premium Outlets Borrower is required to deposit monthly 1/12 of the annual estimated insurance premiums to the insurance reserve (i) during a Control Event, (ii) during a Reserve Trigger Period, or (iii) upon the Silver Sands Premium Outlets Borrower’s failure to provide the lender evidence of the renewal of a blanket policy to the extent the Silver Sands Premium Outlets Borrower maintains insurance pursuant to a blanket policy. In lieu of monthly deposits to the insurance reserve, the Silver Sands Premium Outlets Borrower is permitted to provide a letter of credit or a guaranty for such amounts from a Silver Sands Premium Outlets Borrower affiliate approved by the lender.
Replacement Reserve – During either a Control Event or a Reserve Trigger Period, the Silver Sands Premium Outlets Borrower is required to deposit monthly approximately $7,253 to a reserve for replacements to the Silver Sands Premium Outlets Property, subject to a cap of approximately $174,062. In lieu of monthly deposits to the replacement reserve, the Silver Sands Premium Outlets Borrower is permitted to provide a letter of credit or a guaranty for such amounts from a Silver Sands Premium Outlets Borrower affiliate approved by the lender.
TI/LC Reserve – During either a Control Event or a Reserve Trigger Period, the Silver Sands Premium Outlets Borrower is required to deposit monthly $72,526 for future tenant improvements and leasing commissions, subject to a cap of $1,740,624. In lieu of monthly deposits to the TI/LC reserve, the Silver Sands Premium Outlets Borrower is permitted to provide a letter of credit or a guaranty for such amounts from a Silver Sands Premium Outlets Borrower affiliate approved by the lender.
A “Control Event” shall mean if one or more of Simon Property Group, L.P. and Simon Property Group, Inc. does not own at least 50% of the direct or indirect interests in the Silver Sands Premium Outlets Borrower or does not control the Silver Sands Premium Outlets Borrower.
A “Reserve Trigger Period” will commence upon the date that the debt yield based on the trailing four calendar quarter period is less than 10.5% for two consecutive quarters and will expire on the date that the debt yield is 10.5% or greater for two consecutive calendar quarters.
Lockbox and Cash Management. The Silver Sands Premium Outlets Whole Loan is structured with a hard lockbox and springing cash management. All rents from the Silver Sands Premium Outlets Property are required to be deposited directly to the lockbox account and, so long as a Debt Yield Trigger Event is not continuing, funds in the lockbox account will be transferred to the Silver Sands Premium Outlets Borrower’s operating account. During a Debt Yield Trigger Event, the Silver Sands Premium Outlets Borrower will not have access to the funds in the lockbox account and such funds will be transferred to the lender-controlled cash management account and disbursed according to the Silver Sands Premium Outlets Whole Loan documents. During a Debt Yield Trigger Event, all excess cash is required to be held by the lender as additional security for the Silver Sands Premium Outlets Whole Loan; provided that excess cash will be disbursed at the direction of the Silver Sands Premium Outlets Borrower in the event of shortfalls in certain monthly expense items.
A “Debt Yield Trigger Event” will commence upon the date that the debt yield based on the trailing four calendar quarter period is less than 9.0% for two consecutive quarters and will expire on the date that the debt yield is 9.0% or greater for two consecutive calendar quarters.
THE INFORMATION IN THIS STRUCTURAL AND COLLATERAL TERM SHEET IS NOT COMPLETE AND MAY BE AMENDED PRIOR TO THE TIME OF SALE. THIS TERM SHEET IS NOT AN OFFER TO SELL THESE SECURITIES AND IT IS NOT A SOLICITATION OF AN OFFER TO BUY THESE SECURITIES IN ANY JURISDICTION WHERE THE OFFER OR SALE IS NOT PERMITTED.
89
| Retail – Outlet Center | Loan #5 | Cut-off Date Balance: | | $65,000,000 |
| 10562 and 10746 Emerald Coast Parkway | Silver Sands Premium Outlets | Cut-off Date LTV: | | 50.7% |
| Miramar Beach, FL 32550 | | U/W NCF DSCR: | | 3.27x |
| | | U/W NOI Debt Yield: | | 13.8% |
Property Management. The Silver Sands Premium Outlets Property is managed by Simon Management Associates II, LLC, an affiliate of the Silver Sands Premium Outlets Borrower.
Partial Release. Not permitted.
Real Estate Substitution. Not permitted.
Subordinate and Mezzanine Indebtedness. None.
Ground Lease. None.
Right of First Offer / Right of First Refusal. None.
Terrorism Insurance. The Silver Sands Premium Outlets Borrower is required to obtain and maintain property insurance and business interruption insurance for 18 months plus a 180-day extended period of indemnity. Such insurance is required to cover perils of terrorism and acts of terrorism; provided that the Silver Sands Premium Outlets Borrower is permitted to maintain terrorism coverage with a licensed captive insurance company that is affiliated with the borrower sponsor if certain conditions set forth in the related Whole Loan documents are satisfied, and if the Terrorism Risk Insurance Program Reauthorization Act of 2015 is not in effect, the Silver Sands Premium Outlets Borrower will only be required to pay for terrorism insurance through such captive insurance company a maximum of two times the annual insurance premiums payable for the Silver Sands Premium Outlets Property at the time with respect to the property and business income or rental income insurance interruption policies (excluding the terrorism and earthquake components of such premiums). See “Risk Factors—Risks Relating to the Mortgage Loans—Terrorism Insurance May Not Be Available for All Mortgaged Properties” in the Preliminary Prospectus.
THE INFORMATION IN THIS STRUCTURAL AND COLLATERAL TERM SHEET IS NOT COMPLETE AND MAY BE AMENDED PRIOR TO THE TIME OF SALE. THIS TERM SHEET IS NOT AN OFFER TO SELL THESE SECURITIES AND IT IS NOT A SOLICITATION OF AN OFFER TO BUY THESE SECURITIES IN ANY JURISDICTION WHERE THE OFFER OR SALE IS NOT PERMITTED.
90
(THIS PAGE INTENTIONALLY LEFT BLANK)
| Multifamily – High Rise | Loan #6 | Cut-off Date Balance: | | $50,000,000 |
| 333 River Street | 333 River Street | Cut-off Date LTV: | | 34.5% |
| Hoboken, NJ 07030 | | UW NCF DSCR: | | 5.22x |
| | | UW NOI Debt Yield: | | 12.4% |
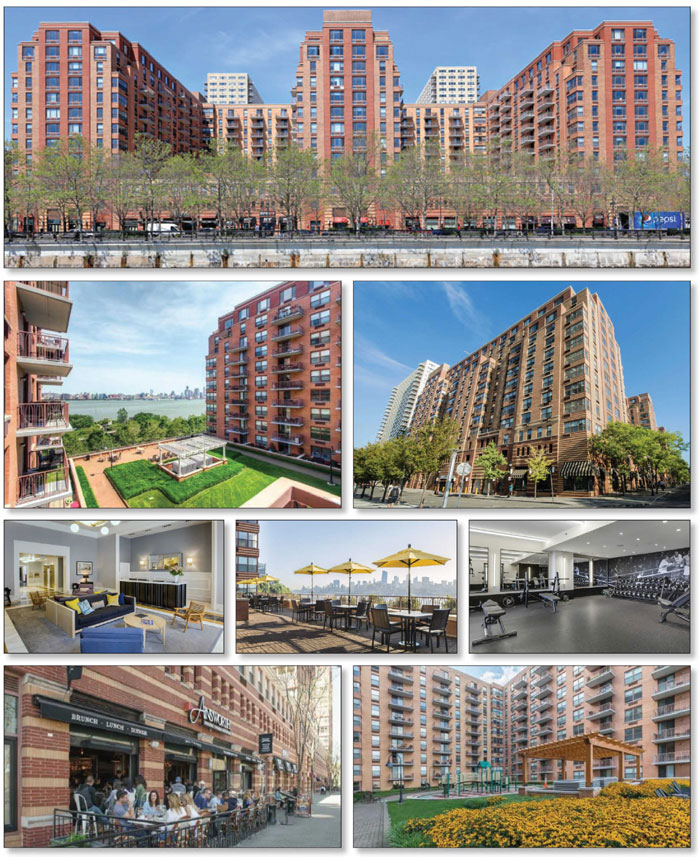
THE INFORMATION IN THIS STRUCTURAL AND COLLATERAL TERM SHEET IS NOT COMPLETE AND MAY BE AMENDED PRIOR TO THE TIME OF SALE. THIS TERM SHEET IS NOT AN OFFER TO SELL THESE SECURITIES AND IT IS NOT A SOLICITATION OF AN OFFER TO BUY THESE SECURITIES IN ANY JURISDICTION WHERE THE OFFER OR SALE IS NOT PERMITTED.
92
| Multifamily – High Rise | Loan #6 | Cut-off Date Balance: | | $50,000,000 |
| 333 River Street | 333 River Street | Cut-off Date LTV: | | 34.5% |
| Hoboken, NJ 07030 | | UW NCF DSCR: | | 5.22x |
| | | UW NOI Debt Yield: | | 12.4% |
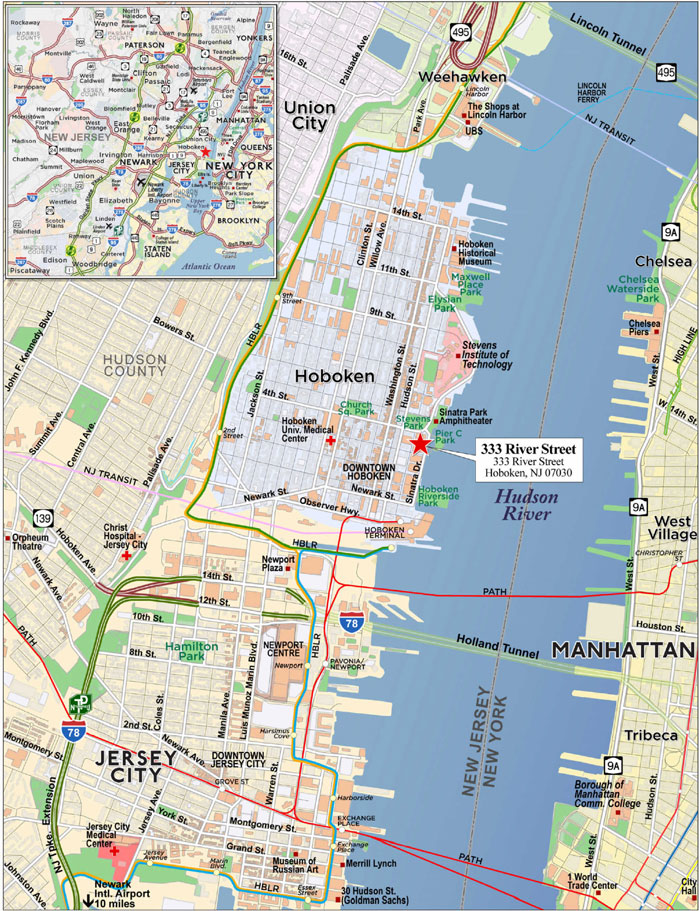
THE INFORMATION IN THIS STRUCTURAL AND COLLATERAL TERM SHEET IS NOT COMPLETE AND MAY BE AMENDED PRIOR TO THE TIME OF SALE. THIS TERM SHEET IS NOT AN OFFER TO SELL THESE SECURITIES AND IT IS NOT A SOLICITATION OF AN OFFER TO BUY THESE SECURITIES IN ANY JURISDICTION WHERE THE OFFER OR SALE IS NOT PERMITTED.
93
| No. 6 – 333 River Street |
| |
| Mortgage Loan Information | | Mortgaged Property Information |
| Mortgage Loan Seller: | Morgan Stanley Mortgage Capital Holdings LLC | | Single Asset/Portfolio: | Single Asset |
| Credit Assessment (Fitch/KBRA/S&P): | BBBsf/A(sf)/NR | | Property Type – Subtype: | Multifamily – High Rise |
| Original Principal Balance(1): | $50,000,000 | | Location: | Hoboken, NJ |
| Cut-off Date Balance(1): | $50,000,000 | | Size: | 526 Units |
| % of Initial Pool Balance: | 4.3% | | Cut-off Date Balance Per Unit(1): | $237,643 |
| Loan Purpose: | Refinance | | Maturity Date Balance Per Unit(1): | $237,643 |
| Borrower Sponsor: | Ironstate Holdings LLC | | Year Built/Renovated: | 2002/NAP |
| Guarantor(2): | NAP | | Title Vesting: | Leasehold |
| Mortgage Rate: | 2.3150% | | Property Manager: | Ironstate Properties LLC |
| Note Date: | December 30, 2021 | | Current Occupancy (As of): | 99.6% (12/1/2021) |
| Seasoning: | 2 months | | YE 2020 Occupancy: | 76.3% |
| Maturity Date: | January 1, 2032 | | YE 2019 Occupancy: | 97.4% |
| IO Period: | 120 months | | YE 2018 Occupancy: | 94.0% |
| Loan Term (Original): | 120 months | | YE 2017 Occupancy: | NAV |
| Amortization Term (Original): | NAP | | As-Is Appraised Value: | $362,000,000 |
| Loan Amortization Type: | Interest Only | | As-Is Appraised Value Per Unit: | $688,213 |
| Call Protection: | L(26),D(87),O(7) | | As-Is Appraisal Valuation Date: | October 28, 2021 |
| Lockbox Type: | Springing | | Underwriting and Financial Information(5) |
| Additional Debt(1)(3): | Yes | | TTM NOI (10/31/2021): | $12,690,258 |
| Additional Debt Type (Balance)(1)(3): | Pari Passu ($75,000,000) | | YE 2020 NOI: | $15,578,296 |
| | | | YE 2019 NOI: | $17,611,758 |
| | | | YE 2018 NOI: | $16,890,959 |
| | | | U/W Revenues: | $25,761,661 |
| | | | U/W Expenses: | $10,314,528 |
| | | | U/W NOI(6): | $15,447,134 |
| Escrows and Reserves(4) | | U/W NCF(6): | $15,315,634 |
| | Initial | Monthly | Cap | | U/W DSCR based on NOI/NCF(1): | 5.26x / 5.22x |
| Taxes: | $0 | Springing | NAP | | U/W Debt Yield based on NOI/NCF(1): | 12.4% / 12.3% |
| Insurance: | $0 | Springing | NAP | | U/W Debt Yield at Maturity based on NOI/NCF(1): | 12.4% / 12.3% |
| Cap Ex: | $0 | Springing | NAP | | Cut-off Date LTV Ratio(1): | 34.5% |
| | | | | | LTV Ratio at Maturity(1): | 34.5% |
| | | | | | | | |
| Sources and Uses |
| Sources | | | | | Uses | | | |
| Whole Loan Amount | $125,000,000 | | 98.8% | | Loan Payoff | $125,372,601 | | 99.0% |
| Borrower Equity | 1,575,640 | | 1.2 | | Closing Costs | 1,203,039 | | 1.0 |
| Total Sources | $126,575,640 | | 100.0% | | Total Uses | $126,575,640 | | 100.0% |
| | | | | | | | | |
| (1) | The 333 River Street Mortgage Loan (as defined below) is a part of the 333 River Street Whole Loan (as defined below) with an original aggregate principal balance of $125,000,000. The Cut-off Date Balance Per Unit, Maturity Date Balance Per Unit, U/W DSCR based on NOI/NCF, U/W Debt Yield based on NOI/NCF, U/W Debt Yield at Maturity based on NOI/NCF, Cut-off Date LTV Ratio and LTV Ratio at Maturity numbers presented above are based on the aggregate principal balance of the promissory notes comprising the 333 River Street Whole Loan. |
| (2) | There is no non-recourse carveout guarantor or separate environmental indemnitor for the 333 River Street Whole Loan. |
| (3) | See “The Mortgage Loan.” |
| (4) | See “Escrows” below for further discussion of reserve requirements. |
| (5) | The novel coronavirus pandemic is an evolving situation and could impact the 333 River Street Whole Loan more severely than assumed in the underwriting of the 333 River Street Whole Loan and could adversely affect the NOI, NCF and occupancy information, as well as the appraised value and the DSCR, LTV and Debt Yield metrics presented above and herein. See "Risk Factors—Risks Related to Market Conditions and Other External Factors—The Coronavirus Pandemic Has Adversely Affected the Global Economy and Will Likely Adversely Affect the Performance of the Mortgage Loans" in the prospectus. |
| (6) | The decrease between YE 2019 NOI to YE 2020 NOI and YE 2020 NOI to TTM NOI (10/31/2021) is a result of elevated economic vacancy rates due to the coronavirus pandemic. Additionally, during the earlier months of the pandemic, the borrower was offering a 1-month concession on 13-month leases, a 2-month concession on 14-month leases and a 3-month concession on 15-month leases. The increase between TTM NOI (10/31/2021) and UW NOI is primarily due to the burn off of discounts and concessions. Remaining concessions are expected to burn off in 2022. The underwriting assumes that no concessions remain outstanding. |
The Mortgage Loan. The mortgage loan (the “333 River Street Mortgage Loan”) is part of a whole loan (the “333 River Street Whole Loan”) evidenced by two pari passu promissory notes in the aggregate original principal amount of $125,000,000 and secured by a first priority leasehold mortgage encumbering a multifamily property located in Hoboken, New Jersey (the “333 River Street Property”). The non-controlling Note A-2, in the original principal amount of $50,000,000, represents the 333 River Street Mortgage Loan and will be included in the BANK 2022-BNK40 securitization trust. The controlling Note A-1, in the original principal amount of $75,000,000, was contributed to the BANK 2022-BNK39 securitization trust. The 333 River Street Whole Loan will be serviced pursuant to the pooling and servicing agreement for the BANK 2022-BNK39 securitization trust. See “Description of the Mortgage Pool—The Whole Loans—The Non-Serviced Pari Passu Whole Loans” and “Pooling and Servicing Agreement—Servicing of the Non-Serviced Mortgage Loans” in the prospectus.
THE INFORMATION IN THIS STRUCTURAL AND COLLATERAL TERM SHEET IS NOT COMPLETE AND MAY BE AMENDED PRIOR TO THE TIME OF SALE. THIS TERM SHEET IS NOT AN OFFER TO SELL THESE SECURITIES AND IT IS NOT A SOLICITATION OF AN OFFER TO BUY THESE SECURITIES IN ANY JURISDICTION WHERE THE OFFER OR SALE IS NOT PERMITTED.
94
| Multifamily – High Rise | Loan #6 | Cut-off Date Balance: | | $50,000,000 |
| 333 River Street | 333 River Street | Cut-off Date LTV: | | 34.5% |
| Hoboken, NJ 07030 | | UW NCF DSCR: | | 5.22x |
| | | UW NOI Debt Yield: | | 12.4% |
Note Summary
| Notes | Original Balance | Cut-off Date Balance | Note Holder | Controlling Piece |
| A-1 | $75,000,000 | $75,000,000 | BANK 2022-BNK39 | Yes |
| A-2 | $50,000,000 | $50,000,000 | BANK 2022-BNK40 | No |
| Total | $125,000,000 | $125,000,000 | | |
The Borrower and the Borrower Sponsor. The borrower is Hoboken South Waterfront Associates, L.P., a single-purpose New Jersey limited partnership with one independent director in its organizational structure. The borrower sponsor is Ironstate Holdings LLC, which is owned by Michael Barry and David Barry. There is no non-recourse carveout guarantor or separate environmental indemnitor with respect to the 333 River Street Whole Loan. Ironstate Development (“Ironstate”) is a Hoboken-based real estate development company that has a history of developing properties in established urban centers. Ironstate owns residential properties along the Hudson waterfront in New Jersey in developments that include The Shipyard and Jersey City Urby among others.
The Property. The 333 River Street Property is comprised of the borrower’s leasehold interest in a multifamily property comprised of 526 market rate apartments within a 13-story luxury residential tower, which also includes 56,462 square feet of retail space on the ground floor, and a below grade parking garage with 584 spaces (of which 250 are reserved for residents). The 333 River Street Property offers its residents a comprehensive amenity package including a 24-hour doorman, full-service concierge, health club, private landscaped courtyards, on-site parking, and expansive views of Manhattan. Unit amenities include stainless steel gas range/ovens, microwaves, washer/dryer, dishwashers, and balconies. The 333 River Street Property was originally developed in 2002. During the 7-year period between 2015 and 2021, the borrower spent an additional approximately $13.47 million in upgrades, including roof and HVAC replacement, the upgrading of individual units with plank flooring, installation of cabinets for Verizon FIOS adaption, the removal of popcorn ceilings and the remodeling of the children’s playroom and the aerobics room. The apartment unit mix is comprised of studio, one-, two- and three-bedroom units ranging in average size from 714 – 1,428 square feet with an average of 923 square feet. As of December 1, 2021, the 333 River Street Property is 99.6% occupied at an average contract rent of $3,695 per unit per month. Of the 526 units, 33 units representing 6.3% of the units are exclusively marketed as corporate furnished units and three units are model units with no income associated.
The 333 River Street Property includes 56,462 square feet of retail space located along Sinatra Drive and River Street. The retail space serves as an amenity for the residents and ferry commuters as its tenants include two educational institutions (Steven’s Institute and Bright Horizon Child), two restaurants (The Ainsworth and Union Hall), and a wine store. The retail space is 47.3% leased to 6 tenants. Historically, the retail space has been occupied with an average occupancy of 94.9% during the four-year period between 2017 and 2020. However, the occupancy of the retail space decreased in December 2020 due to the loss of King’s Super Market, a former tenant which leased 14,863 square feet at the 333 River Street Property since January 2002. The residential units generate approximately 95.5% of the base rent at the 333 River Street Property while the retail tenants generate approximately 4.5% of the base rent at the 333 River Street Property.
The borrower sponsor was selected by the City of Hoboken (the “City”) and the Port Authority of New York & New Jersey (the “Port Authority”) to lead the development of the 333 River Street Property as part of their program to develop and economically revitalize the Hoboken waterfront. The Port Authority leased the land to the City pursuant to a prime ground lease (the “Prime Ground Lease”) and owns the air space above the land. Pursuant to the Ground Lease and Development Agreement dated December 17, 1999 (the “Ground Lease”), the City subleased the land to the borrower and the Port Authority leased the air space above the land to the borrower for a term of 99 years whereby the borrower would ground lease the site and construct the 333 River Street Property. Pursuant to the terms of the Ground Lease, the borrower is obligated to pay (i) fixed ground rent, (ii) payments in lieu of taxes, (iii) percentage rent, and (iv) development association dues for operating and maintenance expenses associated with the sidewalks adjacent to the site and the subsurface structures of Piers A and C. See “Ground Lease” below.
The table below shows the residential apartment unit mix at the 333 River Street Property:
Unit Mix(1)
| Unit Mix / Type | Total Units | Leased Units | % Leased | Average square
feet per Unit | Monthly Average
Rent per Unit | Monthly Average
Rent per square
foot |
| Studio | 38 | 37 | 97.4% | 714 | $2,745 | $3.87 |
| One Bedroom | 265 | 265 | 100.0% | 733 | $3,157 | $4.31 |
| Two Bedroom | 177 | 176 | 99.4% | 1,120 | $4,192 | $3.74 |
| Three Bedroom | 46 | 46 | 100.0% | 1,428 | $5,658 | $3.96 |
| Total/Wtd. Avg. | 526 | 524 | 99.6% | 923 | $3,695 | $4.05 |
| (1) | Information based on the borrower rent roll dated December 1, 2021. |
THE INFORMATION IN THIS STRUCTURAL AND COLLATERAL TERM SHEET IS NOT COMPLETE AND MAY BE AMENDED PRIOR TO THE TIME OF SALE. THIS TERM SHEET IS NOT AN OFFER TO SELL THESE SECURITIES AND IT IS NOT A SOLICITATION OF AN OFFER TO BUY THESE SECURITIES IN ANY JURISDICTION WHERE THE OFFER OR SALE IS NOT PERMITTED.
95
| Multifamily – High Rise | Loan #6 | Cut-off Date Balance: | | $50,000,000 |
| 333 River Street | 333 River Street | Cut-off Date LTV: | | 34.5% |
| Hoboken, NJ 07030 | | UW NCF DSCR: | | 5.22x |
| | | UW NOI Debt Yield: | | 12.4% |
The following table presents historical occupancy percentages at the 333 River Street Property:
Historical Occupancy
12/31/2017(1) | 12/31/2018(1) | 12/31/2019(1) | 12/31/2020(1) | 12/1/2021(2) |
| NAV | 94.0% | 97.4% | 76.3% | 99.6% |
| (1) | Information obtained from the borrower sponsor. |
| (2) | Information based on the borrower rent roll dated December 1, 2021. |
Operating History and Underwritten Net Cash Flow. The following table presents certain information relating to the historical operating performance and underwritten net cash flow at the 333 River Street Property:
Cash Flow Analysis
| | | 2018 | | 2019 | | 2020 | | 10/31/2021 TTM | | U/W | | %(1) | | U/W $ per
unit | |
| Gross Potential Rent(2) | | $22,860,013 | | $23,339,718 | | $23,888,996 | | $23,650,193 | | $23,452,020 | | 86.7% | | $44,585.59 | |
| Other Income(3) | | $3,999,942 | | $4,094,147 | | $3,906,568 | | $4,003,066 | | $3,303,458 | | 12.2% | | $6,280.34 | |
| Reimbursements | | $514,355 | | $533,047 | | $543,524 | | $399,643 | | $291,576 | | 1.1% | | $554.33 | |
| Discounts Concessions | | $0 | | $0 | | ($558,913) | | ($2,038,694) | | $0 | | 0.0% | | $0.00 | |
| Net Rental Income | | $27,374,310 | | $27,966,912 | | $27,780,175 | | $26,014,208 | | $27,047,054 | | 100.0% | | | |
| Less Vacancy & Credit Loss | | ($917,822) | | ($667,694) | | ($2,188,574) | | ($3,000,092) | | ($1,285,393) | | -5.5% | | ($2,443.71) | |
| Effective Gross Income | | $26,456,488 | | $27,299,219 | | $25,591,601 | | $23,014,116 | | $25,761,661 | | 95.2% | | $48,976.54 | |
| | | | | | | | | | | | | | | | |
| Real Estate Taxes(4) | | $2,085,557 | | $2,168,979 | | $2,327,544 | | $2,403,185 | | $2,251,251 | | 8.7% | | $4,279.94 | |
| Insurance | | $264,024 | | $262,999 | | $275,166 | | $297,245 | | $322,355 | | 1.3% | | $612.84 | |
| Ground Lease(5) | | $2,069,173 | | $2,077,229 | | $2,060,476 | | $2,034,605 | | $2,324,981 | | 9.0% | | $4,420.12 | |
| Other Expenses | | $5,146,775 | | $5,178,253 | | $5,350,119 | | $5,588,823 | | $5,415,941 | | 21.0% | | $10,296.47 | |
| Total Operating Expenses | | $9,565,529 | | $9,687,460 | | $10,013,305 | | $10,323,858 | | $10,314,528 | | 40.0% | | $19,609.37 | |
| | | | | | | | | | | | | | | | |
| Net Operating Income(6) | | $16,890,959 | | $17,611,758 | | $15,578,296 | | $12,690,258 | | $15,447,134 | | 60.0% | | $29,367.17 | |
| Capital Expenditures | | $0 | | $0 | | $0 | | $0 | | $131,500 | | 0.5% | | $250.00 | |
| Net Cash Flow | | $16,890,959 | | $17,611,758 | | $15,578,296 | | $12,690,258 | | $15,315,634 | | 59.5% | | $29,117.17 | |
| | | | | | | | | | | | | | | | |
| NOI DSCR(7) | | 5.76x | | 6.00x | | 5.31x | | 4.33x | | 5.26x | | | | | |
| NCF DSCR(7) | | 5.76x | | 6.00x | | 5.31x | | 4.33x | | 5.22x | | | | | |
| NOI Debt Yield(7) | | 13.5% | | 14.1% | | 12.5% | | 10.2% | | 12.4% | | | | | |
| NCF Debt Yield(7) | | 13.5% | | 14.1% | | 12.5% | | 10.2% | | 12.3% | | | | | |
| (1) | Represents (i) percent of Net Rental Income for all revenue fields, (ii) percent of Gross Potential Rent for Vacancy & Credit Loss and (iii) percent of Effective Gross Income for all other fields. |
| (2) | UW Gross Potential Rent is based on the borrower rent roll dated December 1, 2021. |
| (3) | Other Income is comprised of (i) base rent paid by the retail tenants, (ii) parking income, (iii) storage income, and (iv) other income. |
| (4) | The borrower is required to make payments in lieu of real estate taxes as described below under “Ground Lease”. Real estate taxes have been underwritten based on the appraiser’s estimate of the payment in lieu of real estate taxes for the 2021/2022 tax year. |
| (5) | Ground Lease is comprised of (i) fixed ground rent and (ii) percentage rent. The fixed ground rent has been underwritten in the amount of $2,071,031 based on the average fixed ground rent due over the loan term. The percentage rent has been underwritten to 1.0% of the underwritten Effective Gross Income. |
| (6) | The decrease in Net Operating Income from 2019 to 2020 and 2020 to 10/31/2021 TTM is a result of elevated economic vacancy rates due to the coronavirus pandemic. Additionally, during the earlier months of the pandemic, the borrower was offering a 1-month concession on 13-month leases, a 2-month concession on 14-month leases and a 3-month concession on 15-month leases. The increase in Net Operating Income between 10/31/2021 TTM and UW is primarily due to the burn off of discounts and concessions. Remaining concessions are expected to burn off in 2022. The underwriting assumes that no concessions remain outstanding. |
| (7) | Debt service coverage ratios and debt yields are based on the 333 River Street Whole Loan. |
Appraisal. The appraisal concluded to an “as-is” appraised value as of October 28, 2021 of $362,000,000.
Environmental Matters. According to the Phase I environmental report dated November 5, 2021, there was no evidence of any recognized environmental conditions at the 333 River Street Property. The environmental report identified a controlled recognized environmental condition relating to the historical use of the 333 River Street Property for industrial purposes and the existence of engineering controls and use restrictions. See “Description of the Mortgage Pool—Environmental Considerations” in the prospectus.
Market Overview and Competition. The 333 River Street Property is located in Hoboken, New Jersey in the Hoboken multifamily submarket in the New York multifamily market. Hoboken is part of the New York metropolitan area and is the site of Hoboken Terminal, a major transportation center for the region. NJ Transit’s Main Line, Bergen County Line, Pascack Valley Line, Montclair-Boonton Line, Morris and Essex Lines and Meadowlands Rail Line terminate at the Hoboken Terminal. The Hudson-Bergen Light Rail has three stations in Hoboken: Hoboken Terminal, 2nd Street and 9th Street-Congress Street. PATH is a 24-hour subway system that operates from Hoboken Terminal to 33rd Street Manhattan, World Trade Center, Journal Square and Newark Penn Station. Hoboken also offers its residents two piers that provide various ferry services to Manhattan. According to the appraisal, as of the second quarter of 2021, the
THE INFORMATION IN THIS STRUCTURAL AND COLLATERAL TERM SHEET IS NOT COMPLETE AND MAY BE AMENDED PRIOR TO THE TIME OF SALE. THIS TERM SHEET IS NOT AN OFFER TO SELL THESE SECURITIES AND IT IS NOT A SOLICITATION OF AN OFFER TO BUY THESE SECURITIES IN ANY JURISDICTION WHERE THE OFFER OR SALE IS NOT PERMITTED.
96
| Multifamily – High Rise | Loan #6 | Cut-off Date Balance: | | $50,000,000 |
| 333 River Street | 333 River Street | Cut-off Date LTV: | | 34.5% |
| Hoboken, NJ 07030 | | UW NCF DSCR: | | 5.22x |
| | | UW NOI Debt Yield: | | 12.4% |
vacancy rate in the Hoboken multifamily submarket was approximately 7.4%, with average asking rents of $3,499 per unit and inventory of approximately 9,761 units. According to the appraisal, as of the second quarter of 2021, the vacancy rate in the New York multifamily market was approximately 3.3%, with average asking rents of $2,787 per unit and inventory of approximately 1.43 million units.
The following table presents certain information relating to the appraisal’s market rent conclusion for the 333 River Street Property:
Market Rent Summary
| Market Rent Summary |
| Unit Mix / Type | Units(1) | Average Unit Size
(square feet)(1) | Avg. Monthly
Rent per Unit(1) | Avg. Monthly
Rent PSF (1) | Avg. Monthly
Market Rent per
Unit(2) | Avg. Monthly
Market Rent
PSF(2) |
| Studio | 38 | 714 | $2,745 | $3.87 | $3,045 | $4.27 |
| One Bedroom | 265 | 733 | $3,157 | $4.31 | $3,545 | $4.84 |
| Two Bedroom | 177 | 1,120 | $4,192 | $3.74 | $4,713 | $4.21 |
| Three Bedroom | 46 | 1,428 | $5,658 | $3.96 | $6,050 | $4.24 |
| (1) | Based on the borrower rent roll dated December 1, 2021. |
| (2) | Based on the appraisal. |
The following table presents certain information relating to comparable multifamily rental properties to the 333 River Street Property:
Comparable Rental Properties(1)
| Property | Year Built | #
Units | Unit Mix | Average SF per Unit | Average Monthly Rent
per Unit | Average Monthly Rent
PSF |
333 River Street Property(2)
Hoboken, NJ | 2002 | 526 | Studio
1BR
2BR
3BR | 714
733
1,120
1,428 | $2,745
$3,157
$4,192
$5,658 | $3.87
$4.31
$3.74
$3.96 |
2 Twelfth Street
Hoboken, NJ | 2003 | 150 | Studio
1BR
2BR
3BR | 579
822
1,219
1,495 | $2,430
$3,010
$4,390
$6,133 | $4.20
$3.66
$3.60
$4.10 |
1 14th Street
Hoboken, NJ | 1999 | 138 | Studio
1BR
2BR
3BR | 508
739
1,541
1,068 | $2,375
$2,889
$4,152
$5,592 | $4.68
$3.91
$2.69
$5.24 |
770 Jackson Street
Hoboken, NJ | 2019 | 424 | Studio
1BR
2BR
3BR | 478
754
1,071
1,408 | $2,388
$3,524
$4,680
$6,074 | $5.00
$4.67
$4.37
$4.31 |
300 Adams Street
Hoboken, NJ | 1976 | 196 | Studio
1BR
2BR
3BR
4BR | 450
650
800
900
1,050 | $1,884
$2,031
$2,653
$2,842
$3,148 | $4.19
$3.12
$3.32
$3.16
$3.00 |
77 Park Avenue
Hoboken, NJ | 2000 | 301 | Studio
1BR
2BR
3BR | 659
789
1,233
1,486 | $2,777
$3,079
$4,175
$5,521 | $4.21
$3.90
$3.38
$3.72 |
1330-1350 Willow Avenue
Hoboken, NJ | 2016 | 140 | Studio
1BR
2BR
3BR | 555
768
1,134
1,450 | $2,622
$3,312
$4,253
$5,549 | $4.72
$4.31
$3.75
$3.83 |
51 Garden Street
Hoboken, NJ | 1989 | 115 | 1BR
2BR
3BR | 608
812
1,078 | $3,022
$3,267
$4,517 | $4.97
$4.02
$4.19 |
300-320 Grand Street
Hoboken, NJ | 1896 | 99 | Studio
1BR
2BR
3BR
4BR | 500
780
770
1,658
1,800 | $1,985
$2,394
$2,995
$4,308
$4,569 | $3.97
$3.07
$3.89
$2.60
$2.54 |
1 Walter Barry Independence Court
Hoboken, NJ | 2007 | 185 | Studio
1BR
2BR
3BR | 508
808
1,193
1,762 | $2,538
$3,241
$4,236
$6,066 | $5.00
$4.01
$3.55
$3.44 |
| (1) | Based on the appraisal. |
| (2) | Based on the borrower rent roll dated December 1, 2021. |
THE INFORMATION IN THIS STRUCTURAL AND COLLATERAL TERM SHEET IS NOT COMPLETE AND MAY BE AMENDED PRIOR TO THE TIME OF SALE. THIS TERM SHEET IS NOT AN OFFER TO SELL THESE SECURITIES AND IT IS NOT A SOLICITATION OF AN OFFER TO BUY THESE SECURITIES IN ANY JURISDICTION WHERE THE OFFER OR SALE IS NOT PERMITTED.
97
| Multifamily – High Rise | Loan #6 | Cut-off Date Balance: | | $50,000,000 |
| 333 River Street | 333 River Street | Cut-off Date LTV: | | 34.5% |
| Hoboken, NJ 07030 | | UW NCF DSCR: | | 5.22x |
| | | UW NOI Debt Yield: | | 12.4% |
Escrows.
Real Estate Taxes – The 333 River Street Whole Loan documents provide that the borrower is not required to reserve for real estate taxes, provided that (i) no event of default is continuing under the 333 River Street Whole Loan and (ii) the borrower provides the lender reasonably acceptable evidence that all real estate taxes then due and payable with respect to the 333 River Street Property have been paid in full prior to the date such taxes would (if not paid) be delinquent and subject to the imposition of penalties (the “Delinquency Date”), which evidence must be provided to the lender prior to the Delinquency Date. If at any time such conditions are not satisfied, the borrower is required during such time to make ongoing monthly deposits into a reserve for real estate taxes in an amount equal to 1/12 of the real estate taxes that the lender estimates will be payable during the next twelve months for the 333 River Street Property.
Insurance –The 333 River Street Whole Loan documents provide that the borrower is not required to reserve for insurance premiums, provided that (i) no event of default is continuing under the 333 River Street Whole Loan, (ii) the liability and casualty insurance coverage for the 333 River Street Property is included in a blanket policy approved by the lender in its reasonable discretion, and (iii) the borrower provides the lender with paid receipts for payment of the insurance premiums and provides evidence of renewals of the insurance policies, no later than ten days prior to the expiration of the current policy. If at any time such conditions are not satisfied, the borrower is required during such time to make ongoing monthly deposits into a reserve for insurance premiums in an amount equal to 1/12 of the insurance premiums that the lender estimates will be payable for the renewal of coverage upon the expiration of the insurance policies.
Replacement Reserve –The 333 River Street Whole Loan documents provide that the borrower is not required to reserve for capital expenditures, provided that no event of default is continuing under the 333 River Street Whole Loan. If at any time such condition is not satisfied, the borrower is required during such time to make ongoing monthly deposits of approximately $10,958 into a capital expenditure reserve.
Lockbox and Cash Management. The 333 River Street Whole Loan is structured with a springing lockbox and springing cash management. Upon the first occurrence of a Cash Sweep Event Period (as defined below), the borrower is required to establish and maintain a lockbox account for the benefit of the lender, and the borrower and property manager are required, during the continuance of the Cash Sweep Event Period, to direct all tenants to deposit all rents directly into the lockbox account, and to deposit all rents received by the borrower or property manager, despite such direction, into the lockbox account within one business day of receipt. Upon the first occurrence of a Cash Sweep Event Period, the lender is required to establish, and the borrower is required to cooperate with the cash management bank to establish, a lender-controlled cash management account, into which all funds in the lockbox account will be required to be deposited, so long as the Cash Sweep Event Period is continuing and applied as provided in the 333 River Street Whole Loan documents.
“Cash Sweep Event Period” means a period commencing upon an event of default under the 333 River Street Whole Loan documents and ending upon the cure, if applicable, of such event of default.
Property Management. The 333 River Street Property is managed by Ironstate Properties LLC, an affiliate of the borrower.
Partial Release. Not permitted.
Real Estate Substitution. Not permitted.
Subordinate and Mezzanine Indebtedness. Not permitted.
Letter of Credit. None.
Right of First Offer / Right of First Refusal. None.
Ground Lease. Pursuant to the Prime Ground Lease, the Port Authority ground leased the land underlying the 333 River Street Property to the City and pursuant to the Ground Lease, the City subleased the land underlying the 333 River Street Property to the borrower and the Port Authority leased the air space above the land to the borrower, each for a term of 99 years expiring December 16, 2098. Pursuant to the terms of the Ground Lease, the borrower is obligated to pay (i) fixed ground rent, (ii) percentage rent, (iii) payments in lieu of taxes and (iv) development association dues for operating and maintenance expenses associated with the sidewalks adjacent to the site and the subsurface structures of Piers A and C (the “O&M Area”), as described in more detail below.
| ● | Fixed Ground Rent. The Ground Lease provides for fixed annual ground rent, payable to the Port Authority, in monthly installments. Annual ground rent through December 16, 2022 is $1,800,896, from December 17, 2022 through December 16, 2027 is $1,980,986, from December 17, 2027 through December 16, 2032 is $2,179,084, from December 17, 2032 through December 16, 2037 is $2,396,993, and from December 17, 2037 through December 16, 2042 is $2,684,632, and continues to increase every five-year interval thereafter, such that it is $8,893,506 at the expiration of the ground lease. |
THE INFORMATION IN THIS STRUCTURAL AND COLLATERAL TERM SHEET IS NOT COMPLETE AND MAY BE AMENDED PRIOR TO THE TIME OF SALE. THIS TERM SHEET IS NOT AN OFFER TO SELL THESE SECURITIES AND IT IS NOT A SOLICITATION OF AN OFFER TO BUY THESE SECURITIES IN ANY JURISDICTION WHERE THE OFFER OR SALE IS NOT PERMITTED.
98
| Multifamily – High Rise | Loan #6 | Cut-off Date Balance: | | $50,000,000 |
| 333 River Street | 333 River Street | Cut-off Date LTV: | | 34.5% |
| Hoboken, NJ 07030 | | UW NCF DSCR: | | 5.22x |
| | | UW NOI Debt Yield: | | 12.4% |
| ● | Percentage Ground Rent. The ground lessee is required to pay the Port Authority a percentage rent in an amount equal to 1.0% of all gross revenues, payable semi-annually. The percentage rent has been underwritten to 1.0% of the underwritten effective gross income. |
| ● | PILOT Rental. The 333 River Street Property is not subject to the imposition of the payment of real estate taxes, and instead the property owner is responsible to make a payment in lieu of taxes ("PILOT Rental") to the City for the remainder of the term of the Ground Lease. The annual PILOT Rental is due and payable in four quarterly installments, each equal to one-quarter of the annual obligation. The quarterly payments are due on February 1, May 1, August 1 and November 1. The PILOT Rental commenced on the 25th month of the Ground Lease with an initial payment of $2.00 per development square footage. The PILOT Rental increases each year by a rate equal to the greater of 2.0% or the percentage increase in the tax rate in effect on January 1 of such calendar year compared to the tax rate in effect on January 1 of the immediately preceding calendar year, but in no event will the percentage increase exceed 4.0%. |
| ● | Development Association Dues. The ground lessee is required to pay to the O&M Board (a board that administers the operation and maintenance of the O&M Area) an amount equal to the product of (i) the applicable O&M rate (currently estimated at $0.50 and increased annually by consumer price index increases) and (ii) the greater of (x) 599,000 square feet and (y) the actual number of development square feet contained in the 333 River Street Property. |
Terrorism Insurance. The borrower is required to obtain and maintain an “all risk” or “special form” property insurance policy that covers acts of terrorism in an amount equal to the “full replacement cost” of the 333 River Street Property, together with business income insurance covering the 18-month period commencing at the time of loss. Notwithstanding the foregoing, for so long as the Terrorism Risk Insurance Act of 2002, as extended and modified by the Terrorism Risk Insurance Program Reauthorization Act of 2015 (“TRIPRA”), is in effect (including any extensions thereof or if another federal governmental program is in effect relating to “acts of terrorism” which provides substantially similar protections as TRIPRA), the lender is required to accept terrorism insurance which covers against “covered acts” as defined by TRIPRA (or such other program) but only in the event that TRIPRA (or such other program) continues to cover both domestic and foreign acts of terrorism. See “Risk Factors—Risks Relating to the Mortgage Loans—Terrorism Insurance May Not Be Available for All Mortgaged Properties” in the prospectus.
THE INFORMATION IN THIS STRUCTURAL AND COLLATERAL TERM SHEET IS NOT COMPLETE AND MAY BE AMENDED PRIOR TO THE TIME OF SALE. THIS TERM SHEET IS NOT AN OFFER TO SELL THESE SECURITIES AND IT IS NOT A SOLICITATION OF AN OFFER TO BUY THESE SECURITIES IN ANY JURISDICTION WHERE THE OFFER OR SALE IS NOT PERMITTED.
99
| Retail – Anchored | Loan #7 | Cut-off Date Balance: | | $50,000,000 |
| 1237 Coolidge Highway | Midtown Square | Cut-off Date LTV: | | 62.9% |
| Troy, MI 48084 | | UW NCF DSCR: | | 1.55x |
| | | UW NOI Debt Yield: | | 9.3% |
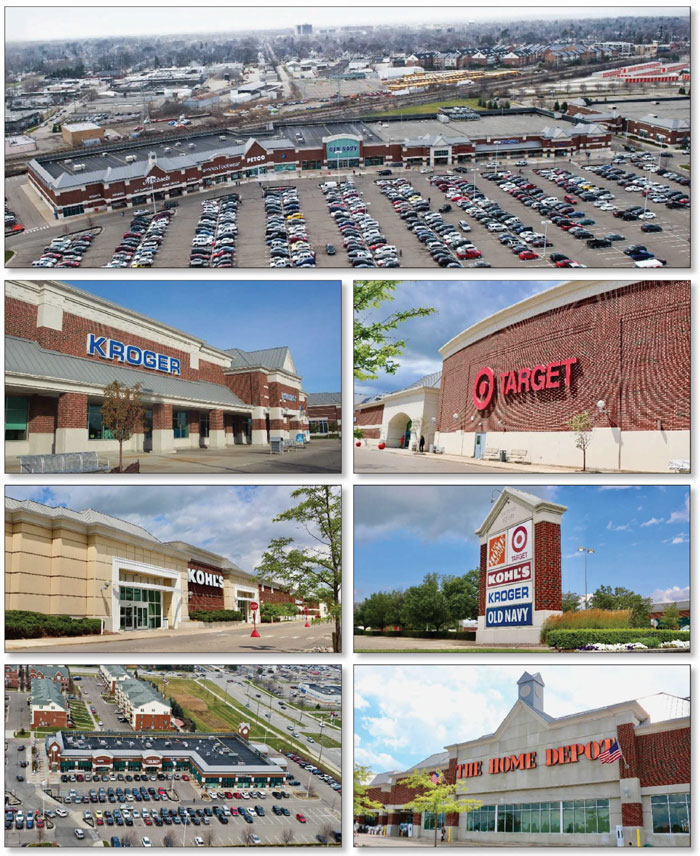
THE INFORMATION IN THIS STRUCTURAL AND COLLATERAL TERM SHEET IS NOT COMPLETE AND MAY BE AMENDED PRIOR TO THE TIME OF SALE. THIS TERM SHEET IS NOT AN OFFER TO SELL THESE SECURITIES AND IT IS NOT A SOLICITATION OF AN OFFER TO BUY THESE SECURITIES IN ANY JURISDICTION WHERE THE OFFER OR SALE IS NOT PERMITTED.
100
| Retail – Anchored | Loan #7 | Cut-off Date Balance: | | $50,000,000 |
| 1237 Coolidge Highway | Midtown Square | Cut-off Date LTV: | | 62.9% |
| Troy, MI 48084 | | UW NCF DSCR: | | 1.55x |
| | | UW NOI Debt Yield: | | 9.3% |
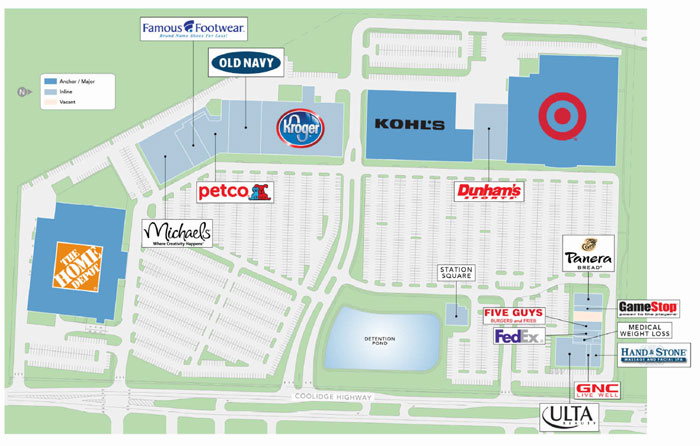
THE INFORMATION IN THIS STRUCTURAL AND COLLATERAL TERM SHEET IS NOT COMPLETE AND MAY BE AMENDED PRIOR TO THE TIME OF SALE. THIS TERM SHEET IS NOT AN OFFER TO SELL THESE SECURITIES AND IT IS NOT A SOLICITATION OF AN OFFER TO BUY THESE SECURITIES IN ANY JURISDICTION WHERE THE OFFER OR SALE IS NOT PERMITTED.
101
| Retail – Anchored | Loan #7 | Cut-off Date Balance: | | $50,000,000 |
| 1237 Coolidge Highway | Midtown Square | Cut-off Date LTV: | | 62.9% |
| Troy, MI 48084 | | UW NCF DSCR: | | 1.55x |
| | | UW NOI Debt Yield: | | 9.3% |

THE INFORMATION IN THIS STRUCTURAL AND COLLATERAL TERM SHEET IS NOT COMPLETE AND MAY BE AMENDED PRIOR TO THE TIME OF SALE. THIS TERM SHEET IS NOT AN OFFER TO SELL THESE SECURITIES AND IT IS NOT A SOLICITATION OF AN OFFER TO BUY THESE SECURITIES IN ANY JURISDICTION WHERE THE OFFER OR SALE IS NOT PERMITTED.
102
| No. 7 – Midtown Square |
| |
| Mortgage Loan Information | | Mortgaged Property Information |
| Mortgage Loan Seller: | Morgan Stanley Mortgage Capital Holdings LLC | | Single Asset/Portfolio: | Single Asset |
| Credit Assessment (Fitch/KBRA/S&P): | NR/NR/NR | | Property Type – Subtype: | Retail – Anchored |
| Original Principal Balance(1): | $50,000,000 | | Location: | Troy, MI |
| Cut-off Date Balance(1): | $50,000,000 | | Size(4): | 580,251 SF |
| % of Initial Pool Balance: | 4.3% | | Cut-off Date Balance Per SF(1)(4): | $138.61 |
| Loan Purpose: | Refinance | | Maturity Date Balance Per SF(1)(4): | $117.06 |
| Borrower Sponsor: | Grand Sakwa Properties L.L.C. | | Year Built/Renovated: | 2000/NAP |
| Guarantor: | NAP(2) | | Title Vesting: | Fee |
| Mortgage Rate: | 4.0000% | | Property Manager: | Grand/Sakwa Management, LLC |
| Note Date: | February 14, 2022 | | Current Occupancy (As of): | 99.4% (1/28/2022) |
| Seasoning: | 0 months | | YE 2021 Occupancy: | 99.4% |
| Maturity Date: | March 1, 2032 | | YE 2020 Occupancy: | 99.4% |
| IO Period: | 24 months | | YE 2019 Occupancy: | 100.0% |
| Loan Term (Original): | 120 months | | YE 2018 Occupancy: | 98.3% |
| Amortization Term (Original): | 360 months | | As-Is Appraised Value(5): | $127,800,000 |
| Loan Amortization Type: | Interest Only, Amortizing Balloon | | As-Is Appraised Value Per SF(5): | $220 |
| Call Protection: | L(24),D(91),O(5) | | As-Is Appraisal Valuation Date: | December 2, 2021 |
| Lockbox Type: | Springing | | |
| Additional Debt(1): | Yes | | |
| Additional Debt Type (Balance)(1): | Pari Passu ($30,430,000) | | Underwriting and Financial Information(5) |
| | | | YE 2021 NOI: | $8,420,989 |
| | | | YE 2020 NOI: | $7,252,892 |
| | | | YE 2019 NOI: | $7,661,257 |
| | | | YE 2018 NOI: | $7,418,158 |
| | | | U/W Revenues: | $9,871,834 |
| Escrows and Reserves(3) | | U/W Expenses: | $2,401,539 |
| | Initial | Monthly | Cap | | U/W NOI: | $7,470,294 |
| Taxes: | $88,352 | $22,088 | NAP | | U/W NCF: | $7,136,984 |
| Insurance: | $0 | Springing | NAP | | U/W DSCR based on NOI/NCF(1): | 1.62x / 1.55x |
| Replacement Reserve: | $0 | $2,568 | NAP | | U/W Debt Yield based on NOI/NCF(1): | 9.3% / 8.9% |
| TI/LC: | $500,000 | $21,136 | $1,250,000 | | U/W Debt Yield at Maturity based on NOI/NCF(1): | 11.0% / 10.5% |
| Guarantor Reserve: | $19,335,811 | $0 | NAP | | Cut-off Date LTV Ratio(1): | 62.9% |
| Dunham’s Litigation Escrow: | $71,500 | $0 | NAP | | LTV Ratio at Maturity(1): | 53.1% |
| | | | | | | | |
| Sources and Uses |
| Sources | | | | | Uses | | | |
| Whole Loan Amount(1) | $80,430,000 | | 100.0% | | Loan Payoff | $59,654,968 | | 74.2% |
| | | | | | Closing Costs | $779,369 | | 1.0 |
| | | | | | Reserves | $19,995,663 | | 24.9 |
| | | | | | | | | |
| Total Sources | $80,430,000 | | 100.0% | | Total Uses | $80,430,000 | | 100.0% |
| | | | | | | | | |
| (1) | The Midtown Square Mortgage Loan (as defined below) is part of the Midtown Square Whole Loan (as defined below), with an aggregate original principal amount of $80,430,000. The Cut-off Date Balance Per SF, Maturity Date Balance Per SF, U/W DSCR based on NOI/NCF, U/W Debt Yield based on NOI/NCF, U/W Debt Yield at Maturity based on NOI/NCF, Cut-off Date LTV Ratio and LTV Ratio at Maturity numbers presented above are based on the Midtown Square Whole Loan. |
| (2) | There is no non-recourse carveout guarantor or separate environmental indemnitor with respect to the Midtown Square Whole Loan. See “Escrows—Guarantor Reserve” below. |
| (3) | See “Escrows” below for further discussion of reserve requirements. |
| (4) | Size includes square feet of improvements on parcels ground leased to Home Depot, Target, and Kohl’s, which own their improvements during the term of the ground lease. The net rentable area of the Midtown Square Property excluding such tenants is 193,310 square feet. |
| (5) | The novel coronavirus pandemic is an evolving situation and could impact the Midtown Square Mortgage Loan more severely than assumed in the underwriting of the Midtown Square Mortgage Loan and could adversely affect the NOI, NCF and occupancy information, as well as the appraised value and the DSCR, LTV and Debt Yield metrics presented above and herein. See “Risk Factors—Risks Related to Market Conditions and Other External Factors—The Coronavirus Pandemic Has Adversely Affected the Global Economy and Will Likely Adversely Affect the Performance of the Mortgage Loans” in the prospectus. |
The Mortgage Loan. The mortgage loan (the “Midtown Square Mortgage Loan”) is part of a whole loan (the “Midtown Square Whole Loan”) evidenced by two pari passu promissory notes with an aggregate original principal amount of $80,430,000. The Midtown Square Whole loan is secured by a first priority fee mortgage encumbering a 580,251 square foot retail property located in Troy, Michigan (the “Midtown Square Property”). The Midtown Square Mortgage Loan is evidenced by the controlling Note A-1 with an aggregate original principal amount of $50,000,000. The non-controlling Note A-2 in the original principal amount of $30,430,000 is currently held by Morgan Stanley Bank, N.A. and is expected to be contributed to one or more future securitization transactions. The Midtown Square
THE INFORMATION IN THIS STRUCTURAL AND COLLATERAL TERM SHEET IS NOT COMPLETE AND MAY BE AMENDED PRIOR TO THE TIME OF SALE. THIS TERM SHEET IS NOT AN OFFER TO SELL THESE SECURITIES AND IT IS NOT A SOLICITATION OF AN OFFER TO BUY THESE SECURITIES IN ANY JURISDICTION WHERE THE OFFER OR SALE IS NOT PERMITTED.
103
| Retail – Anchored | Loan #7 | Cut-off Date Balance: | | $50,000,000 |
| 1237 Coolidge Highway | Midtown Square | Cut-off Date LTV: | | 62.9% |
| Troy, MI 48084 | | UW NCF DSCR: | | 1.55x |
| | | UW NOI Debt Yield: | | 9.3% |
Whole Loan will be serviced pursuant to the pooling and servicing agreement for the BANK 2022-BNK40 securitization trust. See “Description of the Mortgage Pool-The Whole Loans-The Serviced Pari Passu Whole Loans” and “Pooling and Servicing Agreement” in the prospectus.
Note Summary
| Notes | Original Balance | Cut-off Date Balance | Note Holder | Controlling Piece |
| A-1 | $50,000,000 | $50,000,000 | BANK 2022-BNK40 | Y |
| A-2 | $30,430,000 | $30,430,000 | Morgan Stanley Bank, N.A. | N |
| Total | $80,430,000 | $80,430,000 | | |
The Borrower and the Borrower Sponsors. The borrower is Grand/Sakwa New Holland Shopping Center, L.L.C., a single-purpose Delaware limited liability company with one independent director in its organizational structure. There is no non-recourse carveout guarantor or separate environmental indemnitor with respect to the Midtown Square Whole Loan. See “Escrows—Guarantor Reserve” below. The borrower sponsor is Grand Sakwa Properties LLC, which has developed millions of square feet of retail, mixed-use and residential properties. Grand Sakwa Properties LLC is one of the largest private real estate developers in the Midwest. Grand Sakwa Properties LLC is 60.5% owned by Stephen Grand Trust under Agreement dated September 15, 1988, 29.3% owned by Gary Sakwa, and 10.3% owned by Ted Simon, Gary Cooper, Sakwa Legacy, LLC, and Bro. Investments, LLC. Gary Sakwa is the co-founder and managing partner of Grand Sakwa Properties LLC and has over 35 years of experience in the residential and commercial real estate industry. Gary Sakwa has developed over 10,000 residential lots and through joint ventures has constructed over 3,000 homes, along with developing and/or acquiring over five million square feet of commercial property. The borrower is an affiliate of the borrower under the mortgage loan identified on Annex A-1 to the prospectus as Heritage Village Shopping Center. See “Description of the Mortgage Pool–Loan Purpose; Default History, Bankruptcy Issues and Other Proceedings” in the preliminary prospectus.
The Property. The Midtown Square Property is an anchored retail center property totaling 580,251 square feet located in Troy, Michigan. The Midtown Square Property was built in 2000 on a 57.45-acre site. The Midtown Square Property is anchored by Home Depot, Target, Kohl’s, and Kroger, and is shadow anchored by Whole Foods Market and LA Fitness. The Home Depot, Target and Kohl’s stores are ground lease tenants which own their improvements. The net rentable area of the Midtown Square Property excluding such tenants is 193,310 square feet. The Midtown Square Property is 99.4% leased to 17 tenants, with a diverse tenant mix including Michaels, Old Navy, Famous Footwear, Panera Bread, Five Guys, and Petco. The Midtown Square Property offers 3,250 parking spaces, resulting in a parking ratio of 5.6 spaces per 1,000 square feet of net rentable area.
COVID-19 Update. As of February 14, 2022, the Midtown Square Property is open and operating. Three tenants (Michaels, Old Navy, and Dunham’s) each received 2 months of rent relief due to the COVID-19 pandemic. The tenants have made all rent payments as of January 2022, and there are no ongoing rental deferments.
Major Tenants.
Home Depot (149,088 square feet, 25.7% of net rentable area, 28.4% of underwritten rent). Home Depot is a large home improvement retailer in the Unites States, supplying tools, construction products, appliances, and services, operating mostly as big box stores. Founded in 1978, Home Depot operates over 2,300 stores across North America employing approximately 500,000 employees. The Home Depot lease is a ground lease and Home Depot owns its improvements during the term of the lease. Home Depot has anchored the Midtown Square Property since 2001, has a lease expiration date of January 31, 2026, and has three, ten-year extension options remaining.
Target (148,200 square feet, 25.5% of net rentable area, 12.1% of underwritten rent). Target is a big box department store chain, with stores in all 50 states and the District of Columbia. Employing over 350,000 employees, Target operates 1,926 stores in the United States. The Target lease is a ground lease and Target owns its improvements during the term of the lease. Target has anchored the Midtown Square Property since 2001, has a lease expiration date of January 31, 2026, and has five, ten-year extension options remaining.
Kohl’s (89,653 square feet, 15.5% of net rentable area, 7.9% of underwritten rent). Kohl’s is a retail chain of family-oriented department stores. Kohl’s stores feature apparel, footwear accessories, and soft home products. Kohl’s operates more than 1,100 stores in 49 states, while also offering online shopping. The Kohl’s lease is a ground lease and Kohl’s owns its improvements during the term of the lease. Kohl’s has anchored the Midtown Square Property since 2001, has a lease expiration date of January 30, 2027 and has five, five-year extension options remaining.
Kroger (58,505 square feet, 10.1% of net rentable area, 13.8% of underwritten rent). The Kroger Co. (NYSE: KR), operates a combination of food and drug stores, multi-department stores, marketplace stores, and price impact warehouses. Through 17 subsidiaries, The Kroger Co. operates over 2,700 retail food stores in 35 states and the District of Columbia, as well as an online retail store. Kroger has anchored the Midtown Square Property since 2007, has a lease expiration date of September 30, 2031, and has four, five-year extension options remaining.
THE INFORMATION IN THIS STRUCTURAL AND COLLATERAL TERM SHEET IS NOT COMPLETE AND MAY BE AMENDED PRIOR TO THE TIME OF SALE. THIS TERM SHEET IS NOT AN OFFER TO SELL THESE SECURITIES AND IT IS NOT A SOLICITATION OF AN OFFER TO BUY THESE SECURITIES IN ANY JURISDICTION WHERE THE OFFER OR SALE IS NOT PERMITTED.
104
| Retail – Anchored | Loan #7 | Cut-off Date Balance: | | $50,000,000 |
| 1237 Coolidge Highway | Midtown Square | Cut-off Date LTV: | | 62.9% |
| Troy, MI 48084 | | UW NCF DSCR: | | 1.55x |
| | | UW NOI Debt Yield: | | 9.3% |
Dunham’s Sports (24,026 square feet, 4.1% of net rentable area, 5.9% of underwritten rent). Dunham’s Sports is a regional sporting goods chain, with stores located in the Midwest and Southeast United States. The chain of stores specializes in athletic equipment, clothing, guns, and other sports-related items. Founded in 1937, Dunham’s Sports operates 235 stores across 23 states. Dunham’s Sports has occupied the Midtown Square Property since 2001 and has a lease expiration date of January 31, 2027.
The following table presents certain information relating to the major tenants at the Midtown Square Property:
Major Tenants(1)
| Tenant Name | Credit Rating (Fitch/ Moody’s/S&P)(2) | Tenant NRSF(3) | % of
NRSF(3) | Annual U/W Base Rent PSF | Annual
U/W Base Rent | % of Total Annual U/W Base Rent | Lease
Expiration
Date | Extension Options | Term. Option (Y/N) |
| Major Tenants | | | | | | | | |
| Home Depot | A/A2/A | 149,088 | 25.7% | $15.58 | $2,323,296 | 28.4% | 1/31/2026 | Y(4) | N |
| Target | A/A2/A | 148,200 | 25.5% | $6.68 | $990,000 | 12.1% | 1/31/2026 | Y(5) | N |
| Kohl’s | BBB-/Baa2/BBB- | 89,653 | 15.5% | $7.23 | $648,588 | 7.9% | 1/30/2027 | Y(6) | N |
| Kroger | NR/Baa1/BBB | 58,505 | 10.1% | $19.23 | $1,125,048 | 13.8% | 9/30/2031 | Y(7) | N |
| Dunham’s Sports | NR/NR/NR | 24,026 | 4.1% | $20.00 | $480,520 | 5.9% | 1/31/2027 | N | N |
| Total Major Tenants | 469,472 | 80.9% | $11.86 | $5,567,452 | 68.1% | | | |
| | | | | | | | | |
| Non-Major Tenants | 107,063 | 18.5% | $24.34 | $2,606,296 | 31.9% | | | |
| | | | | | | | | |
| Occupied Collateral Total | 576,535 | 99.4% | $14.18 | $8,173,748 | 100.0% | | | |
| | | | | | | | | |
| Vacant Space | 3,716 | 0.6% | | | | | | |
| | | | | | | | | |
| Collateral Total | | 580,251 | 100.0% | | | | | | |
| | | | | | | | | | |
| | | | | | | | | | | |
| (1) | Information is based on the underwritten rent roll. |
| (2) | Certain ratings are those of the parent company whether or not the parent company guarantees the lease. |
| (3) | NRSF includes square feet of improvements on parcels ground leased to Home Depot, Target and Kohls. |
| (4) | Home Depot may elect to renew its lease for three, ten-year periods. |
| (5) | Target may elect to renew its lease for five, ten-year periods. |
| (6) | Kohl’s may elect to renew its lease for five, five-year periods. |
| (7) | Kroger may elect to renew its lease for four, five-year periods. |
The following table presents certain information relating to the lease rollover schedule at the Midtown Square Property:
Lease Expiration Schedule(1)
Year Ending
December 31, | No. of Leases Expiring | Expiring NRSF(2) | % of Total NRSF(2) | Cumulative Expiring NRSF(2) | Cumulative % of Total NRSF(2) | Annual
U/W
Base Rent | % of Total Annual U/W Base Rent | Annual
U/W
Base Rent
PSF(3) |
| MTM | 0 | 0 | 0.0% | 0 | 0.0% | $0 | 0.0% | $0.00 |
| 2022 | 1 | 5,259 | 0.9% | 5,259 | 0.9% | $174,651 | 2.1% | $33.21 |
| 2023 | 1 | 2,251 | 0.4% | 7,510 | 1.3% | $65,279 | 0.8% | $29.00 |
| 2024 | 1 | 3,299 | 0.6% | 10,809 | 1.9% | $105,564 | 1.3% | $32.00 |
| 2025 | 0 | 0 | 0.0% | 10,809 | 1.9% | $0 | 0.0% | $0.00 |
| 2026 | 5 | 311,545 | 53.7% | 322,354 | 55.6% | $3,629,165 | 44.4% | $11.65 |
| 2027 | 5 | 175,017 | 30.2% | 497,371 | 85.7% | $2,486,592 | 30.4% | $14.21 |
| 2028 | 1 | 7,000 | 1.2% | 504,371 | 86.9% | $198,000 | 2.4% | $28.29 |
| 2029 | 1 | 10,163 | 1.8% | 514,534 | 88.7% | $284,568 | 3.5% | $28.00 |
| 2030 | 1 | 3,496 | 0.6% | 518,030 | 89.3% | $104,880 | 1.3% | $30.00 |
| 2031 | 1 | 58,505 | 10.1% | 576,535 | 99.4% | $1,125,048 | 13.8% | $19.23 |
| 2032 | 0 | 0 | 0.0% | 576,535 | 99.4% | $0 | 0.0% | $0.00 |
| Thereafter | 0 | 0 | 0.0% | 576,535 | 99.4% | $0 | 0.0% | $0.00 |
| Vacant | 0 | 3,716 | 0.6% | 580,251 | 100.0% | $0 | 0.0% | $0.00 |
| Total/Wtd. Avg. | 17 | 580,251 | 100.0% | | | $8,173,748 | 100.0% | $14.18 |
| (1) | Information is based on the underwritten rent roll. Certain tenants may have lease termination options that are exercisable prior to the stated expiration date of the subject lease or leases that are not considered in the lease expiration schedule. |
| (2) | NRSF includes square feet of improvements on parcels ground leased to Home Depot, Target and Kohls. |
| (3) | Total Annual U/W Base Rent per square foot excludes vacant space. |
THE INFORMATION IN THIS STRUCTURAL AND COLLATERAL TERM SHEET IS NOT COMPLETE AND MAY BE AMENDED PRIOR TO THE TIME OF SALE. THIS TERM SHEET IS NOT AN OFFER TO SELL THESE SECURITIES AND IT IS NOT A SOLICITATION OF AN OFFER TO BUY THESE SECURITIES IN ANY JURISDICTION WHERE THE OFFER OR SALE IS NOT PERMITTED.
105
| Retail – Anchored | Loan #7 | Cut-off Date Balance: | | $50,000,000 |
| 1237 Coolidge Highway | Midtown Square | Cut-off Date LTV: | | 62.9% |
| Troy, MI 48084 | | UW NCF DSCR: | | 1.55x |
| | | UW NOI Debt Yield: | | 9.3% |
The following table presents historical occupancy percentages at the Midtown Square Property:
Historical Occupancy
12/31/2018(1) | 12/31/2019(1) | 12/31/2020(1) | 12/31/2021(1) | 1/28/2022(2) |
| 98.3% | 100.0% | 99.4% | 99.4% | 99.4% |
| (1) | Information obtained from the borrower sponsor. |
| (2) | Information based on the underwritten rent roll dated January 28, 2022. |
Operating History and Underwritten Net Cash Flow. The following table presents certain information relating to the historical operating performance and underwritten net cash flow at the Midtown Square Property:
Cash Flow Analysis
| | 2018 | 2019 | 2020 | 2021 | U/W | %(1) | U/W $ per SF(2) |
| Gross Potential Rent | $7,608,131 | $7,773,763 | $7,397,803 | $8,329,886 | $8,296,376 | 79.8% | $14.30 |
| Reimbursements | 2,071,481 | 2,074,129 | 2,080,771 | 2,388,540 | 2,095,028 | 20.2 | 3.61 |
| Net Rental Income | $9,679,612 | $9,847,892 | $9,478,574 | $10,718,426 | $10,391,404 | 100.0% | $17.91 |
| Less Vacancy & Credit Loss | 0 | 0 | $0 | 0 | (519,570) | (6.3) | -0.90 |
| Effective Gross Income | $9,679,612 | $9,847,892 | $9,478,574 | $10,718,426 | $9,871,834 | 95.0% | $17.01 |
| | | | | | | | |
| Real Estate Taxes | 259,703 | 268,101 | 269,988 | 256,176 | 309,205 | 3.1 | 0.53 |
| Insurance | 31,550 | 30,816 | 37,955 | 42,127 | 42,127 | 0.4 | 0.07 |
| Other Operating Expenses | 1,970,201 | 1,887,718 | 1,917,739 | 1,999,134 | 2,050,207 | 20.8 | 3.53 |
| Total Operating Expenses | $2,261,454 | $2,186,635 | $2,225,682 | $2,297,437 | $2,401,539 | 24.3% | $4.14 |
| | | | | | | | |
| Net Operating Income | $7,418,158 | $7,661,257 | $7,252,892 | $8,420,989 | $7,470,294 | 75.7% | $12.87 |
| Replacement Reserves | 0 | 0 | 0 | 0 | 30,819 | 0.3 | 0.05 |
| TI/LC | 0 | 0 | 0 | 0 | 302,491 | 3.1 | 0.52 |
| Net Cash Flow | $7,418,158 | $7,661,257 | $7,252,892 | $8,420,989 | $7,136,984 | 72.3% | $12.30 |
| | | | | | | | |
| NOI DSCR(3) | 1.61x | 1.66x | 1.57x | 1.83x | 1.62x | | |
| NCF DSCR(3) | 1.61x | 1.66x | 1.57x | 1.83x | 1.55x | | |
| NOI Debt Yield(3) | 9.2% | 9.5% | 9.0% | 10.5% | 9.3% | | |
| NCF Debt Yield(3) | 9.2% | 9.5% | 9.0% | 10.5% | 8.9% | | |
| (1) | Represents (i) percent of Net Rental Income for all revenue fields, (ii) percent of Gross Potential Rent for Vacancy & Credit Loss and (iii) percent of Effective Gross Income for all other fields. |
| (2) | Includes square feet of improvements on parcels ground leased to Home Depot, Target, and Kohl’s. |
| (3) | The NOI and NCF DSCR and NOI and NCF Debt Yield are based on the Midtown Square Whole Loan. |
Appraisal. The appraisal concluded to an “as-is” value as of December 2, 2021 of $127,800,000, which includes separate values of $38,700,000 for the Home Depot ground lease, $16,500,000 for the Target ground lease, $10,800,000 for the Kohl’s ground lease and $61,800,000 for the remainder of the Midtown Square Property.
Environmental Matters. According to the Phase I environmental report dated December 13, 2021, there was no evidence of any recognized environmental conditions at the Midtown Square Property. The Phase I identified a controlled recognized environmental condition related to prior leaking underground storage tank incidents, an operations and maintenance plan for engineering controls and a restrictive covenant activity use limitation recorded for the groundwater at the Midtown Square Property. See “Description of the Mortgage Pool—Environmental Considerations” in the preliminary prospectus.
Market Overview and Competition. The Midtown Square Property is located in Troy, Michigan, within the Birmingham Retail submarket of the Detroit Retail market. The Midtown Square Property is located at the northwest corner of Coolidge Highway and Doyle Drive, approximately 19 miles northwest of the Detroit CBD. Troy has a population of 87,294 according to the 2020 census, making it the 11th largest city in Michigan. Primary access to the neighborhood is provided by Interstates 75 and 696, and State Route 59. According to the appraisal, as of the third quarter of 2021, the vacancy rate in the Birmingham Retail submarket was approximately 1.9%, with average asking rents of $30.38 per square foot and inventory of approximately 3.2 million square feet. According to the appraisal, as of the third quarter of 2021, the vacancy rate in the Detroit Retail market was approximately 5.3%, with average asking rents of $14.15 per square foot and inventory of approximately 314.4 million square feet. According to the appraisal, the 2021 population within a one-, three- and five-mile radius of the Midtown Square Property was 12,263, 102,681 and 250,268, respectively. The 2021 average household income within the same one-, three- and five- mile radius was $112,065, $127,580 and $124,566, respectively.
THE INFORMATION IN THIS STRUCTURAL AND COLLATERAL TERM SHEET IS NOT COMPLETE AND MAY BE AMENDED PRIOR TO THE TIME OF SALE. THIS TERM SHEET IS NOT AN OFFER TO SELL THESE SECURITIES AND IT IS NOT A SOLICITATION OF AN OFFER TO BUY THESE SECURITIES IN ANY JURISDICTION WHERE THE OFFER OR SALE IS NOT PERMITTED.
106
| Retail – Anchored | Loan #7 | Cut-off Date Balance: | | $50,000,000 |
| 1237 Coolidge Highway | Midtown Square | Cut-off Date LTV: | | 62.9% |
| Troy, MI 48084 | | UW NCF DSCR: | | 1.55x |
| | | UW NOI Debt Yield: | | 9.3% |
The following table presents certain information relating to the appraisal’s market rent conclusion for the Midtown Square Property:
Market Rent Summary
| Category | Anchor | Junior Anchor | In-Line Retail | Restaurant |
| Market Rent (PSF) | $7.50 | $19.00 | $33.00 | $30.00 |
| Lease Term (Years) | 10 | 7 | 5 | 7 |
| Lease Type (Reimbursements) | NNN | NNN + 7.5% | NNN + 7.5% | NNN + 10.0% |
| Rent Escalations | 2.0% per annum | 2.5% per annum | 2.5% per annum | 2.5% per annum |
Source: Appraisal.
The following table presents comparable anchor leases with respect to the Midtown Square Property:
Comparable Anchor Lease Summary
| Property/Location | Year Built | SF | Tenant Name | Tenant
Size (SF) | Lease
Date | Rent
PSF | Lease Type |
Midtown Square (subject)(1) Troy, MI | 2000 | 580,251 | Home Depot | 149,088(2) | Feb. 2001 | $15.58 | NNN |
2400 Miamisburg Centerville Road Dayton, OH | 1974 | 126,402 | Big Sandy Superstore | 57,500 | March 2021 | $11.00 | NNN |
Freestanding Retail Hartland, MI | 2009 | 176,311 | Noble Appliance | 76,000 | Feb. 2019 | $8.50 | NNN |
Valley Center Saginaw, MI | 1995 | 409,000 | Dicks Sporting Goods | 60,000 | May 2021 | $8.00 | NNN |
Airport Square Toledo, OH | 1986 | 187,252 | Urban Air Adventure Park | 66,258 | Oct. 2020 | $7.45 | NNN |
Walmart Howell, MI | 2001 | 214,172 | Walmart | 214,172 | Jan. 2020 | $6.39 | NNN |
Source: Appraisal.
| (1) | Information based on the underwritten rent roll. |
| (2) | Represents square feet of improvements on parcel ground leased to Home Depot. |
The following table presents comparable junior anchor leases with respect to the Midtown Square Property:
Comparable Junior Anchor Lease Summary
| Property/Location | Year Built | SF | Tenant Name | Tenant
Size (SF) | Lease
Date | Rent PSF | Lease Type |
Midtown Square (subject)(1) Troy, MI | 2000 | 580,251 | Kroger | 58,505 | Oct. 2021 | $19.23 | NNN |
Canton Center Crossing Canton, MI | 2003 | 49,981 | Listing | 15,861 | April 2021 | $15.00 | NNN |
Millennium Park Livonia, MI | 2000 | 273,029 | Bob’s Discount Furniture | 35,040 | May 2019 | $13.50 | Absolute Net |
Tractor Supply Company Canton, MI | 2019 | 19,560 | Tractor Supply Company | 19,560 | May 2019 | $17.42 | NNN |
ABC Appliance Bloomfield Hills, MI | 2004 | 46,388 | ABC Appliance | 46,388 | Oct. 2020 | $12.54 | NNN |
Planet Fitness Taylor, MI | 1960 | 136,903 | Planet Fitness | 33,000 | July 2021 | $16.00 | NNN |
Source: Appraisal.
| (1) | Information based on the underwritten rent roll. |
THE INFORMATION IN THIS STRUCTURAL AND COLLATERAL TERM SHEET IS NOT COMPLETE AND MAY BE AMENDED PRIOR TO THE TIME OF SALE. THIS TERM SHEET IS NOT AN OFFER TO SELL THESE SECURITIES AND IT IS NOT A SOLICITATION OF AN OFFER TO BUY THESE SECURITIES IN ANY JURISDICTION WHERE THE OFFER OR SALE IS NOT PERMITTED.
107
| Retail – Anchored | Loan #7 | Cut-off Date Balance: | | $50,000,000 |
| 1237 Coolidge Highway | Midtown Square | Cut-off Date LTV: | | 62.9% |
| Troy, MI 48084 | | UW NCF DSCR: | | 1.55x |
| | | UW NOI Debt Yield: | | 9.3% |
The following table presents comparable in-line retail leases with respect to the Midtown Square Property:
Comparable In-Line Retail Lease Summary
| Property/Location | Year Built | SF | Tenant Name | Tenant
Size (SF) | Lease
Date | Rent
PSF | Lease Type |
Midtown Square (subject)(1) Troy, MI | 2000 | 580,251 | Ulta Salon | 10,163 | July 2019 | $28.00 | NNN |
BofA Plaza Southfield, MI | 2017 | 9,439 | Bank of America | 2,500 | March 2019 | $32.00 | NNN |
Storefront Retail Birmingham, MI | 1900/1984 | 7,400 | State & Liberty Clothing | 1,700 | Oct. 2021 | $40.00 | NNN |
Strip Center West Bloomfield, MI | 2016 | 14,740 | T-Mobile | 3,025 | May 2021 | $35.00 | NNN |
Henry Ford Center Bloomfield Hills, MI | 2020 | 79,884 | Beyond Juice | 1,304 | May 2021 | $35.00 | NNN |
West Bloomfield Plaza West Bloomfield, MI | 2019 | 79,354 | American Gift Baskets | 4,971 | Jan. 2020 | $26.50 | NNN |
Source: Appraisal.
| (1) | Information based on the underwritten rent roll. |
The following table presents information relating to sales of comparable properties to the Midtown Square Property identified by the appraisal:
Comparable Sales(1)
| Property Name | Rentable Area | Year Built/ Renovated | Occupancy | Sale Date | Sale Price | Sale Price per square foot |
Midtown Square(2) 1237 Coolidge Highway Troy, MI | 580,251(2) | 2000/NAP | 99.4%(2) | NAV | $127,800,000(3) | $220(3) |
Naperville Plaza Shopping Center 8-192 West Gartner Road Naperville, IL | 115,147 | 1961/1989 | 96.6% | Dec-2020 | $36,500,000 | $317 |
Baederwood Shopping Center 1537-1639 The Fairway Valley Jenkintown, PA | 117,560 | 1961/2013 | 94.0% | Dec-2019 | $43,500,000 | $370 |
Market at Stelzer 2900 Stelzer Road Columbus, OH | 116,707 | 2008/NAP | 100.0% | Dec-2021 | $26,515,568 | $227 |
West Point Marketplace 1711 West Market Street Akron, OH | 50,026 | 2017/NAP | 92.4% | Nov-2020 | $18,075,000 | $361 |
Village at Pittsburgh Mills 1000-1040 Village Center Drive Tarentum, PA | 110,908 | 2007/NAP | 93.0% | Dec-2021 | $29,350,000 | $265 |
Pick ‘n Save N77W14435 West Appleton Avenue Menomonee Falls, WI | 103,611 | 2011/NAP | 100.0% | May-2020 | $28,428,268 | $274 |
| (1) | Information obtained from appraisal |
| (2) | Information obtained from Rent Roll dated January 28, 2022. |
| (3) | Sale Price represents appraised value. |
Escrows.
Real Estate Taxes – At origination, the borrower was required to deposit $88,352 into an upfront reserve for real estate taxes, and the borrower is required to make ongoing monthly deposits into a reserve for real estate taxes in an amount equal to 1/12 of the real estate taxes that the lender estimates will be payable during the next twelve months for the Midtown Square Property (currently, $22,088). Notwithstanding the foregoing, the borrower will not be required to make monthly deposits into the real estate tax reserve for any taxes which are being paid directly to the applicable taxing authority by tenants so long as (i) such tenants remain obligated under their leases to pay such taxes directly to the applicable taxing authority, (ii) such tenants timely pay all such taxes, (iii) the borrower provides the lender with reasonably satisfactory evidence that such taxes have been so paid before they become delinquent, and (iv) no event of default is continuing under the Midtown Square Whole Loan.
Insurance –The borrower is required to make ongoing monthly deposits into a reserve for insurance premiums in an amount equal to 1/12 of the insurance premiums that the lender estimates will be payable for the renewal of coverage upon the expiration of the insurance policies. Notwithstanding the foregoing, the borrower is not required to reserve for insurance premiums, provided that (i) no event of default is continuing under the Midtown Square Whole Loan, (ii) the liability and casualty insurance coverage for the Midtown Square Property is included in a blanket policy approved by the lender in its reasonable discretion, and (iii) the borrower provides the lender with paid receipts for payment of the insurance premiums and provides evidence of renewals of the insurance policies, no later than ten days prior to the expiration of the current policy.
Replacement Reserve –The borrower is required to make ongoing monthly deposits of approximately $2,568 into a capital expenditure reserve.
THE INFORMATION IN THIS STRUCTURAL AND COLLATERAL TERM SHEET IS NOT COMPLETE AND MAY BE AMENDED PRIOR TO THE TIME OF SALE. THIS TERM SHEET IS NOT AN OFFER TO SELL THESE SECURITIES AND IT IS NOT A SOLICITATION OF AN OFFER TO BUY THESE SECURITIES IN ANY JURISDICTION WHERE THE OFFER OR SALE IS NOT PERMITTED.
108
| Retail – Anchored | Loan #7 | Cut-off Date Balance: | | $50,000,000 |
| 1237 Coolidge Highway | Midtown Square | Cut-off Date LTV: | | 62.9% |
| Troy, MI 48084 | | UW NCF DSCR: | | 1.55x |
| | | UW NOI Debt Yield: | | 9.3% |
TI/LC Reserve— The borrower (i) was required to deposit with the lender on the origination date the sum of $500,000 and (ii) is required on each monthly payment date to deposit approximately $21,136, in each case into a reserve for tenant improvements and leasing commissions (the “TI/LC Reserve”); provided that, except as described below, the borrower will not be required to make such monthly deposits at any time that the amount of funds then on deposit in the TI/LC Reserve (after deduction of any pending disbursement requests) equals or exceeds $1,250,000 (the “Rollover Cap”). Notwithstanding the foregoing, during the continuance of a Rollover Bump Trigger (as defined below), the required monthly deposits into the TI/LC Reserve will increase to $275,000 and the Rollover Cap will be removed. Upon the cessation of a Rollover Bump Trigger with respect to each applicable Rollover Bump Lease (as defined below), the required monthly deposit into the TI/LC Reserve will be restored to approximately $21,136 and the Rollover Cap will be restored, with any funds on deposit in the TI/LC Reserve in excess of the Rollover Cap required to be promptly returned to the borrower, provided no event of default is then continuing.
“Rollover Bump Lease” means individually or collectively as the context may require, (i) the Home Depot lease, (ii) the Target lease, and/or (iii) any Qualified Lease (as defined below) that is a replacement lease pursuant to clause (B) in the definition of Qualified Lease with respect to any space at the Midtown Square Property demised pursuant to the leases identified in subclauses (i), (ii) or (iii) above.
A “Rollover Bump Trigger” means a period:
| (i) | Commencing upon a default under a Rollover Bump Lease by the tenant that continues beyond any applicable notice and/or cure periods and ending upon either (x) the tenant curing all defaults under such lease or (y) the entirety of the Rollover Bump Lease space is leased pursuant to one or more Qualified Leases and all Occupancy Conditions (as defined below) with respect thereto have been satisfied (a “Reletting Cure”); |
| (ii) | Commencing upon any tenant under a Rollover Bump Lease reducing or vacating its leased premises, and/or going dark in its space (or any substantial portion thereof) and ending upon either (x) the tenant being in actual physical possession of its space, open for business, and no longer dark in all or any material portion of its space, and paying full unabated rent or (y) a Reletting Cure; |
| (iii) | Commencing upon the date that a Rollover Bump Lease is surrendered, cancelled or terminated prior to its then current expiration date or the receipt by the borrower or its agents of written notice from any tenant under a Rollover Bump Lease of its intent to do so or to vacate its premises and ending upon either (x) the tenant having irrevocably revoked or rescinded all vacating, termination or cancellation notices, paying full unabated rent and being open for business or (y) a Reletting Cure; |
| (iv) | Commencing upon any voluntary or involuntary insolvency or bankruptcy action of any tenant or its guarantor under a Rollover Bump Lease and ending upon either (x) the tenant no longer being insolvent or subject to any bankruptcy or insolvency proceedings and the applicable Rollover Bump Lease having been affirmed pursuant to a final, non-appealable order of a court of competent jurisdiction or such bankruptcy or insolvency proceedings having been dismissed or withdrawn or (y) a Reletting Cure; or |
| (v) | Commencing upon the date that is 12 months prior to the earliest stated expiration date set forth in the Rollover Bump Lease (it being acknowledged that the earliest stated expiration date set forth in the Home Depot lease and the Target lease, in each case, as of the origination date, is January 31, 2026) and ending upon either (x) the date the tenant under the applicable Rollover Bump Lease has renewed or extended such lease and all Occupancy Conditions are satisfied or (y) a Reletting Cure. |
“Qualified Lease” means either (A) the original Rollover Bump Lease as extended pursuant to the express renewal option in such lease or a modification of such lease reasonably approved by the lender or (B) a replacement lease that is reasonably acceptable to the lender, that has an initial term of at least ten years, and has market terms.
“Occupancy Conditions” means the delivery by the borrower to the lender of reasonably satisfactory evidence (which for clauses (B), (C) and (E) below, may consist of a tenant estoppel) that (A) the Rollover Bump Lease space is tenanted under one or more Qualified Leases and there are no defaults thereunder, (B) the applicable tenant has taken occupancy of the entire Rollover Bump Lease space demised to such tenant, (C) the applicable lease is in full force and effect, (D) all leasing commissions payable in connection with any such lease have been paid and all tenant improvement obligations or other landlord obligations of an inducement nature have been completed and paid in full or, alternatively, sufficient funds will be deposited by borrower in the TI/LC Reserve for such purposes, and (E) all such tenants have begun to pay full contractual rent under their respective Rollover Bump Leases and all rent abatements or free rent periods have expired.
Dunham’s Litigation Reserve—At origination the borrower was required to deposit into a Dunham’s Litigation Reserve the amount of $71,500, which is equal to 110% of estimated attorneys’ fees that the tenant Dunham’s alleged in its estoppel certificate that it incurred in connection with certain litigation filed by the borrower against the tenant (the “Dunham’s Litigation”). See “Description of the Mortgage Pool—Litigation and Other Considerations” in the prospectus. Provided no event of default exists, the lender is required to disburse such funds to the borrower on the earliest of (i) the borrower’s provision to the lender of reasonably satisfactory evidence that the borrower has paid all amounts required to be paid by it pursuant to any final judgement in favor of Dunham’s or settlement with Dunham’s, (ii) the borrower provides the lender with reasonably satisfactory evidence that Dunham’s is not entitled to recoupment of attorneys’ fees in connection with the Dunham’s Litigation and (iii) December 6, 2027.
Guarantor Reserve—At origination, the borrower deposited approximately $19,335,811, representing the remaining proceeds of the Midtown Square Whole Loan after refinancing costs, closing costs and other required reserves, into a guarantor reserve fund. The lender is required to disburse the funds in such reserve to the borrower (in whole only) upon the occurrence of an Acceptable Initial
THE INFORMATION IN THIS STRUCTURAL AND COLLATERAL TERM SHEET IS NOT COMPLETE AND MAY BE AMENDED PRIOR TO THE TIME OF SALE. THIS TERM SHEET IS NOT AN OFFER TO SELL THESE SECURITIES AND IT IS NOT A SOLICITATION OF AN OFFER TO BUY THESE SECURITIES IN ANY JURISDICTION WHERE THE OFFER OR SALE IS NOT PERMITTED.
109
| Retail – Anchored | Loan #7 | Cut-off Date Balance: | | $50,000,000 |
| 1237 Coolidge Highway | Midtown Square | Cut-off Date LTV: | | 62.9% |
| Troy, MI 48084 | | UW NCF DSCR: | | 1.55x |
| | | UW NOI Debt Yield: | | 9.3% |
Guarantor Implementation Event (as defined below). Until such time as the funds are disbursed to the borrower, the lender may apply such funds to pay certain recourse obligations of the single purpose entity borrower under the loan documents.
An “Acceptable Initial Guarantor Implementation Event” means that either (a) Gary Sakwa, or (b) an Acceptable Initial Guarantor (as defined below), executes a non-recourse carveout guaranty and environmental indemnity for the Midtown Square Whole Loan in the form specified in the loan documents, in accordance with the requirements of the loan documents. Such requirements include receipt by the lender of such information, searches, documentation and opinions as are reasonably required by it; provided that if Gary Sakwa is installed as guarantor and indemnitor on or prior to February 14, 2023, a statement that he meets the Minimum Financial Criteria (as defined below) may be provided in lieu of the foregoing items, other than searches and opinions reasonably required by the lender, and if Gary Sakwa is installed on or prior to August 11, 2022, no such requirements will apply. An “Acceptable Initial Guarantor” means either (a) a person or entity that (i) satisfies a net worth of not less than $30.0 million and a liquidity of not less than $3.0 million (the “Minimum Financial Criteria”), (ii) is reasonably acceptable to the lender, provided that such approval may include (pursuant to the Prudent Lender Standard (as defined below)) a rating agency confirmation, (iii) is, if permitted by REMIC requirements, reasonably acceptable to the lender and if lender discretion is not permitted by REMIC requirements, would be acceptable to a prudent lender of securitized commercial mortgage loans (in either case, the “Prudent Lender Standard”), and (iv) is an affiliate of the borrower, or (b) on or after February 15, 2023, Gary Sakwa, provided that Gary Sakwa satisfies the requirements set forth in clauses (a)(i) through (iv) above. The borrower is not required to effect an Acceptable Initial Guarantor Implementation Event.
Lockbox and Cash Management. The Midtown Square Mortgage Loan is structured with a springing lockbox and springing cash management. Upon the first occurrence of a Cash Sweep Event Period (as defined below), the borrower is required to enter into a lockbox agreement with Wells Fargo Bank, National Association, or another bank that is an eligible institution and reasonably acceptable to the lender, and establish and maintain a lockbox account for the benefit of the lender, and the borrower and the property manager are required to deposit all rents received by them into the lockbox account within two business days of receipt. In addition, the borrower is required to cause each commercial or retail tenant to deposit rents directly into the lockbox account (and in connection therewith, was required to deliver to the lender, on the origination date and upon the execution of each new lease, partially completed tenant direction letters, together with authorization to the lender to complete and deliver such letters upon the first occurrence of a Cash Sweep Event Period). Upon the first occurrence of a Cash Sweep Event Period, the lender is required to establish, and the borrower is required to cooperate with the cash management bank to establish, a lender-controlled cash management account, into which all funds in the lockbox account will be required to be deposited, so long as the Cash Sweep Event Period is continuing, and applied on each monthly payment date, provided no event of default is continuing: (i) to make the monthly deposits into the real estate tax and insurance reserves, if any, as described above under “Escrows,” (ii) to pay debt service on the Midtown Square Whole Loan, (iii) to make the monthly deposit into the replacement reserve and TI/LC Reserve as described above under “Escrows,” (iv) to pay operating expenses set forth in the lender-approved annual budget and lender-approved extraordinary expenses and (v) to transfer any remainder into an excess cash flow reserve to be held as additional security for the Midtown Square Whole Loan during the continuance of such Cash Sweep Event Period.
A “Cash Sweep Event Period” means a period (i) commencing upon an event of default under the Midtown Square Whole Loan documents and ending upon the cure, if applicable, of such event of default or (ii) commencing upon the debt service coverage ratio (assuming a 30 year amortization schedule) for the Midtown Square Whole Loan being less than 1.20x at the end of any calendar quarter and ending upon the debt service coverage ratio (assuming a 30 year amortization schedule) being at least 1.20x for the immediately preceding two consecutive calendar quarters.
Property Management. The Midtown Square Property is managed by Grand/Sakwa Management, LLC, an affiliated property manager.
Partial Release. Not permitted.
Real Estate Substitution. Not permitted.
Subordinate and Mezzanine Indebtedness. Not permitted.
Letter of Credit. None.
Right of First Offer / Right of First Refusal. None.
Ground Lease. None
Terrorism Insurance. The borrower is required to obtain and maintain an “all risk” property insurance policy that covers acts of terrorism in an amount equal to the “full replacement cost” of the Midtown Square Property, together with business income insurance covering the 18-month period commencing at the time of loss. Notwithstanding the foregoing, for so long as the Terrorism Risk Insurance Act of 2002, as extended and modified by the Terrorism Risk Insurance Program Reauthorization Act of 2015 (“TRIPRA”), is in effect (including any extensions thereof or if another federal governmental program is in effect relating to “acts of terrorism” which provides substantially similar protections as TRIPRA), the lender is required to accept terrorism insurance which covers against “covered acts” as defined by TRIPRA (or such other program) but only in the event that TRIPRA (or such other program) continues to cover both domestic and foreign acts of terrorism. See “Risk Factors—Risks Relating to the Mortgage Loans—Terrorism Insurance May Not Be Available for All Mortgaged Properties” in the prospectus.
THE INFORMATION IN THIS STRUCTURAL AND COLLATERAL TERM SHEET IS NOT COMPLETE AND MAY BE AMENDED PRIOR TO THE TIME OF SALE. THIS TERM SHEET IS NOT AN OFFER TO SELL THESE SECURITIES AND IT IS NOT A SOLICITATION OF AN OFFER TO BUY THESE SECURITIES IN ANY JURISDICTION WHERE THE OFFER OR SALE IS NOT PERMITTED.
110
(THIS PAGE INTENTIONALLY LEFT BLANK)
| Office - Suburban | Loan #8 | Cut-off Date Balance: | | $49,800,000 |
| 10980 Grantchester Way | One Merriweather | Cut-off Date LTV: | | 58.5% |
| Columbia, MD 21044 | | UW NCF DSCR: | | 2.62x |
| | | UW NOI Debt Yield: | | 10.1% |
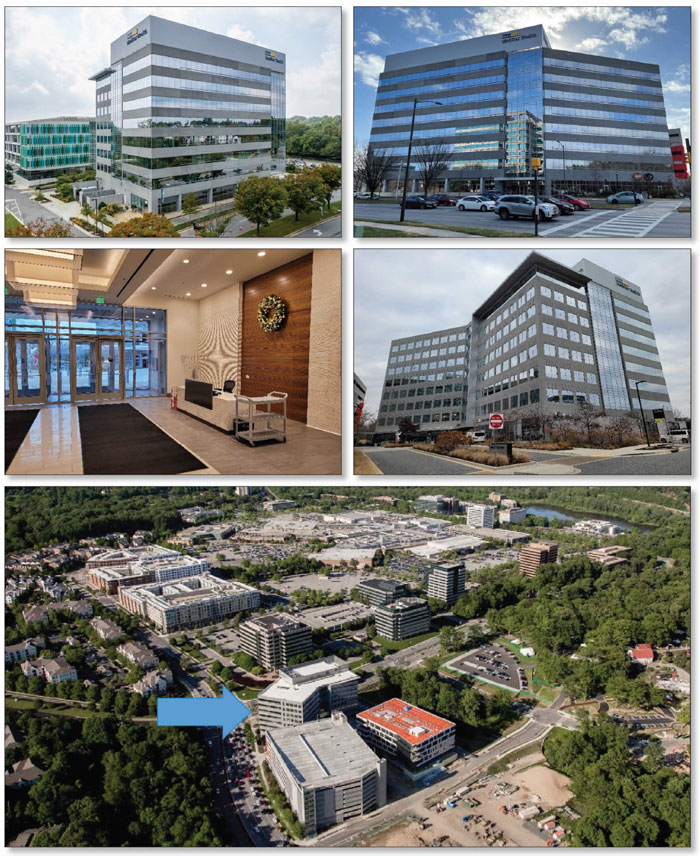
THE INFORMATION IN THIS STRUCTURAL AND COLLATERAL TERM SHEET IS NOT COMPLETE AND MAY BE AMENDED PRIOR TO THE TIME OF SALE. THIS TERM SHEET IS NOT AN OFFER TO SELL THESE SECURITIES AND IT IS NOT A SOLICITATION OF AN OFFER TO BUY THESE SECURITIES IN ANY JURISDICTION WHERE THE OFFER OR SALE IS NOT PERMITTED.
112
| Office - Suburban | Loan #8 | Cut-off Date Balance: | | $49,800,000 |
| 10980 Grantchester Way | One Merriweather | Cut-off Date LTV: | | 58.5% |
| Columbia, MD 21044 | | UW NCF DSCR: | | 2.62x |
| | | UW NOI Debt Yield: | | 10.1% |
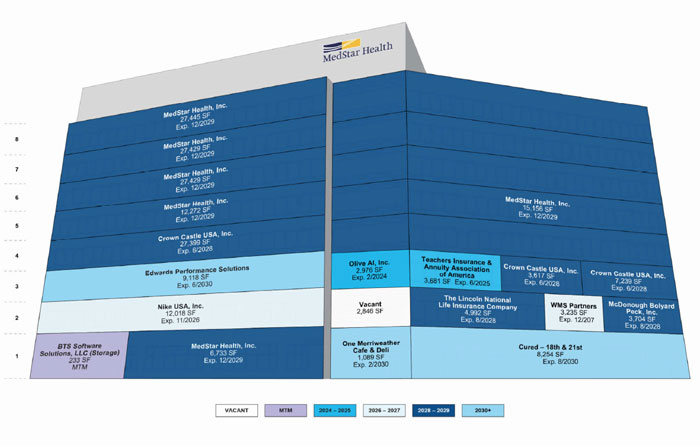
THE INFORMATION IN THIS STRUCTURAL AND COLLATERAL TERM SHEET IS NOT COMPLETE AND MAY BE AMENDED PRIOR TO THE TIME OF SALE. THIS TERM SHEET IS NOT AN OFFER TO SELL THESE SECURITIES AND IT IS NOT A SOLICITATION OF AN OFFER TO BUY THESE SECURITIES IN ANY JURISDICTION WHERE THE OFFER OR SALE IS NOT PERMITTED.
113
| Office - Suburban | Loan #8 | Cut-off Date Balance: | | $49,800,000 |
| 10980 Grantchester Way | One Merriweather | Cut-off Date LTV: | | 58.5% |
| Columbia, MD 21044 | | UW NCF DSCR: | | 2.62x |
| | | UW NOI Debt Yield: | | 10.1% |
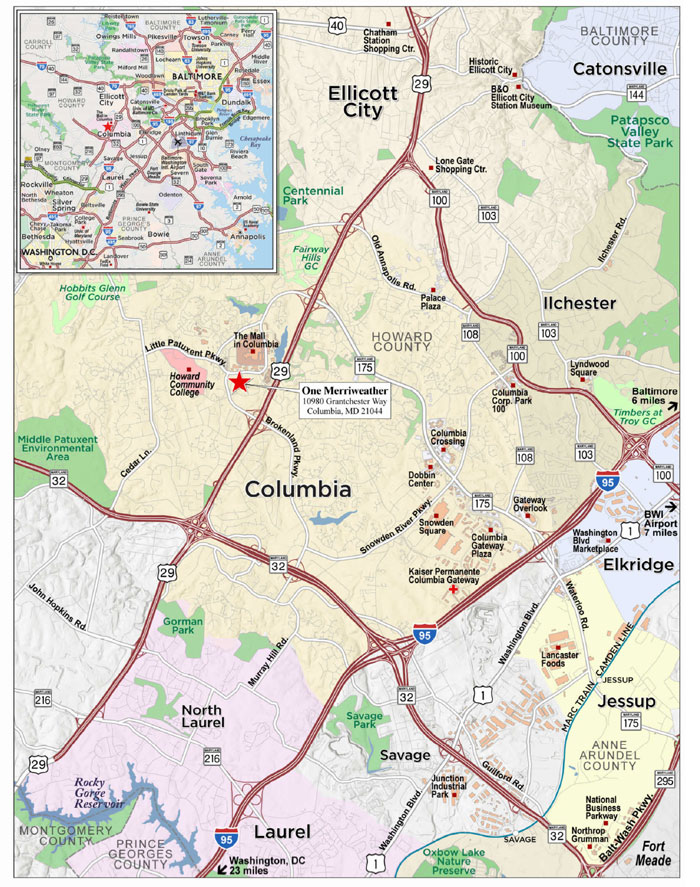
THE INFORMATION IN THIS STRUCTURAL AND COLLATERAL TERM SHEET IS NOT COMPLETE AND MAY BE AMENDED PRIOR TO THE TIME OF SALE. THIS TERM SHEET IS NOT AN OFFER TO SELL THESE SECURITIES AND IT IS NOT A SOLICITATION OF AN OFFER TO BUY THESE SECURITIES IN ANY JURISDICTION WHERE THE OFFER OR SALE IS NOT PERMITTED.
114
| No. 8 – One Merriweather |
| |
| Mortgage Loan Information | | Mortgaged Property Information |
| Mortgage Loan Seller: | Wells Fargo Bank, National Association | | Single Asset/Portfolio: | Single Asset |
Credit Assessment (Fitch/KBRA/S&P): | NR/NR/NR | | Property Type – Subtype: | Office - Suburban |
| Original Principal Balance: | $49,800,000 | | Location: | Columbia, MD |
| Cut-off Date Balance: | $49,800,000 | | Size: | 206,865 SF |
| % of Initial Pool Balance: | 4.2% | | Cut-off Date Balance Per SF: | $240.74 |
| Loan Purpose: | Refinance | | Maturity Date Balance Per SF: | $240.74 |
| Borrower Sponsor: | The Howard Hughes Corporation | | Year Built/Renovated: | 2017/NAP |
| Guarantor: | The Howard Hughes Corporation | | Title Vesting: | Fee |
| Mortgage Rate: | 3.5250% | | Property Manager: | Howard Hughes Management Services Company, LLC (borrower affiliate) |
| Note Date: | January 26, 2022 | | Current Occupancy (As of): | 98.6% (11/30/2021) |
| Seasoning: | 1 month | | YE 2020 Occupancy: | 98.6% |
| Maturity Date: | February 11, 2032 | | YE 2019 Occupancy: | 92.8% |
| IO Period: | 120 months | | YE 2018 Occupancy(2): | 84.8% |
| Loan Term (Original): | 120 months | | YE 2017 Occupancy(2): | 61.8% |
| Amortization Term (Original): | NAP | | As-Is Appraised Value: | $85,100,000 |
| Loan Amortization Type: | Interest Only | | As-Is Appraised Value Per SF: | $411.38 |
| Call Protection: | L(24),YM1(89),O(7) | | As-Is Appraisal Valuation Date: | December 10, 2021 |
| Lockbox Type: | Soft/Springing Cash Management | | Underwriting and Financial Information(3) |
| Additional Debt: | None | | TTM NOI (9/30/2021): | $4,920,754 |
| Additional Debt Type (Balance): | NAP | | YE 2020 NOI(4): | $4,970,797 |
| | | | YE 2019 NOI(4): | $3,546,183 |
| | | | YE 2018 NOI: | $2,268,297 |
| | | | U/W Revenues: | $7,953,088 |
| | | | U/W Expenses: | $2,946,837 |
| Escrows and Reserves(1) | | U/W NOI: | $5,006,251 |
| | Initial | Monthly | Cap | | U/W NCF: | $4,654,580 |
| Taxes | $459,086 | $76,515 | NAP | | U/W DSCR based on NOI/NCF: | 2.81x / 2.62x |
| Insurance | $0 | Springing | NAP | | U/W Debt Yield based on NOI/NCF: | 10.1% / 9.3% |
| Replacement Reserves | $0 | $3,448 | $200,000 | | U/W Debt Yield at Maturity based on NOI/NCF: | 10.1% / 9.3% |
| TI/LC | $0 | $25,858 | $1,000,000 | | Cut-off Date LTV Ratio: | 58.5% |
| | | | | | LTV Ratio at Maturity: | 58.5% |
| | | | | | | |
| | | | | | | | |
| Sources and Uses |
| Sources | | | | | Uses | | | |
| Original Mortgage Loan amount | $49,800,000 | | 100.0% | | Loan payoff | $46,131,683 | | 92.6% |
| | | | | | Upfront Reserves | 459,086 | | 0.9 |
| | | | | | Closing costs | 608,730 | | 1.2 |
| | | | | | Return of Equity | 2,600,501 | | 5.2 |
| Total Sources | $49,800,000 | | 100.0% | | Total Uses | $49,800,000 | | 100.0% |
| (1) | See “Escrows” section. |
| (2) | Information obtained from a third-party research report and it represents the occupancy as of the fourth quarter of 2017 and 2018. |
| (3) | While the One Merriweather Mortgage Loan (defined below) was originated after the emergence of the novel coronavirus pandemic and the economic disruption resulting from measures to combat the pandemic, the pandemic is an evolving situation and could impact the One Merriweather Mortgage Loan more severely than assumed in the underwriting and could adversely affect the NOI, NCF and occupancy information, as well as the appraised value and the DSCR, LTV and Debt Yield metrics presented above. See “Risk Factors— Risks Related to Market Conditions and Other External Factors—Coronavirus Pandemic Has Adversely Affected the Global Economy and Will Likely Adversely Affect the Performance of the Mortgage Loans” in the Preliminary Prospectus. |
| (4) | The One Merriweather Property (defined below) was completed in 2017, with tenants beginning to take occupancy in 2017. The increase in NOI from years 2018 to 2019 and 2019 to 2020 is due to the lease up of the building from 84.8% occupancy in 2018, to 92.8% in 2019, and then reaching stabilization in 2020 at 98.6% (see “Operating History and Underwritten Net Cash Flow”). |
THE INFORMATION IN THIS STRUCTURAL AND COLLATERAL TERM SHEET IS NOT COMPLETE AND MAY BE AMENDED PRIOR TO THE TIME OF SALE. THIS TERM SHEET IS NOT AN OFFER TO SELL THESE SECURITIES AND IT IS NOT A SOLICITATION OF AN OFFER TO BUY THESE SECURITIES IN ANY JURISDICTION WHERE THE OFFER OR SALE IS NOT PERMITTED.
115
| Office - Suburban | Loan #8 | Cut-off Date Balance: | | $49,800,000 |
| 10980 Grantchester Way | One Merriweather | Cut-off Date LTV: | | 58.5% |
| Columbia, MD 21044 | | UW NCF DSCR: | | 2.62x |
| | | UW NOI Debt Yield: | | 10.1% |
The Mortgage Loan. The mortgage loan (the “One Merriweather Mortgage Loan”) is evidenced by the first priority fee interest encumbering a multi-tenant office property totaling 206,865 square feet located in Columbia, Maryland (the “One Merriweather Property”).
The Borrowers and Borrower Sponsor. The borrowers are Crescent Area 1-A Holdings, LLC and Crescent Area 1 Parking Deck 1, LLC, each a Delaware limited liability company and single purpose entity with two independent directors. Legal counsel to the borrowers delivered a non-consolidation opinion in connection with the origination of the One Merriweather Mortgage Loan. The borrower sponsor and nonrecourse carveout guarantor is The Howard Hughes Corporation.
The borrower sponsor is The Howard Hughes Corporation. Founded in 2010, the company owns, manages, and develops commercial, residential and mixed-use real estate throughout the United States. The company’s holdings include a portfolio of master planned communities including Seaport in New York City, Downtown Columbia, Maryland, The Woodlands and Bridgeland in greater Houston, Texas, Summerlin, Las Vegas, Ward Village, Honolulu, Hawai’i, and Douglas Ranch in Phoenix, Arizona.
The Howard Hughes Corporation is also the sponsor of the Two Merriweather mortgage loan and the Oxy Warehouse mortgage loan. For more information See “Risk Factors—Risks Relating to the Mortgage Loans—Concentrations Based on Property Type, Geography, Related Borrowers and Other Factors May Disproportionately Increase Losses”.
The Property. The One Merriweather Property consists of an eight-story, 206,865 square foot, LEED Silver, multi-tenant office building, located in Columbia, Maryland. Built in 2017 and situated on a 1.33-acre site, the One Merriweather Property includes a courtyard, fitness center, a restaurant and deli, a conference room, and an outdoor seating area. A nine-level above grade parking garage is situated adjacent to the property containing 1,127 spaces. The garage is shared between One Merriweather and an adjacent office building also owned by an affiliate of the sponsor, Two Merriweather, via a parking easement agreement. One Merriweather is allocated 669 spaces, resulting in a parking ratio of 3.23 spaces per 1,000 square feet. As of November 30, 2021, the One Merriweather Property is 98.6% occupied by nine tenants.
Major Tenants.
Largest Tenant by UW Base Rent: MedStar Health, Inc. (NR/A2/A: F/M/S&P; 116,464 square feet; 56.3% of net rentable area; 56.5% of underwritten base rent; 12/31/2029 lease expiration) – MedStar Health, Inc. (“MedStar”) is a not-for-profit, regional healthcare system based in Columbia, Maryland. MedStar is the largest healthcare provider in the Maryland and Washington, D.C. region with more than 300 care locations including 10 hospitals, 33 urgent care clinics, ambulatory care centers and primary and specialty care providers. The company generated $5.8 billion of net operating revenue in 2020 and employs more than 31,000 physicians, nurses, and other clinical and non-clinical associates. MedStar has been a tenant at the One Merriweather Property since 2017 and has two, five-year renewal options provided that the tenant remains in at least three full floors of space.
2nd Largest Tenant by UW Base Rent: Crown Castle USA, Inc. (38,255 square feet; 18.5% of net rentable area; 18.8% of underwritten base rent; 6/30/2028 lease expiration) – Crown Castle USA, Inc. (“Crown Castle”) is a subsidiary of Crown Castle International Corp., which was founded in 1994 and became a real estate investment trust in 2014. The company specializes in wireless infrastructure needs and owns a combination of cell towers, small cells, and fiber, with a team of approximately 5,000 employees across nearly 100 offices nationwide. Crown Castle has been a tenant since 2018.
3rd Largest Tenant by UW Base Rent: Nike USA, Inc. (12,018 square feet; 5.8% of net rentable area; 5.7% of underwritten base rent; 11/30/2026 lease expiration) – Nike USA, Inc. (“Nike”) has been a tenant since 2018. The tenant has one, five-year renewal option following its 2026 lease expiration. Additionally, Nike has a one-time option to terminate its lease on the last day of the 60th month of the lease (11/28/2023) with seven months written notice to the landlord, and the payment of a termination fee equal to three times the then-current base rent and operating costs.
COVID-19 Update. As of February 11, 2022, the One Merriweather Property is open and operating. The tenants have made all rent payments as of February 2022, and there are no ongoing rental deferments.
THE INFORMATION IN THIS STRUCTURAL AND COLLATERAL TERM SHEET IS NOT COMPLETE AND MAY BE AMENDED PRIOR TO THE TIME OF SALE. THIS TERM SHEET IS NOT AN OFFER TO SELL THESE SECURITIES AND IT IS NOT A SOLICITATION OF AN OFFER TO BUY THESE SECURITIES IN ANY JURISDICTION WHERE THE OFFER OR SALE IS NOT PERMITTED.
116
| Office - Suburban | Loan #8 | Cut-off Date Balance: | | $49,800,000 |
| 10980 Grantchester Way | One Merriweather | Cut-off Date LTV: | | 58.5% |
| Columbia, MD 21044 | | UW NCF DSCR: | | 2.62x |
| | | UW NOI Debt Yield: | | 10.1% |
The following table presents certain information relating to the tenancy at the One Merriweather Property:
Major Tenants
| Tenant Name | Credit Rating
(Fitch/ Moody’s/
S&P)(1) | Tenant
NRSF | % of
NRSF | Annual
U/W Base
Rent PSF(2) | Annual
U/W Base
Rent(2) | % of Total Annual
U/W Base
Rent | Lease
Expiration
Date | Ext.
Options | Term. Option (Y/N) |
| Major Tenants | | | | | | | | |
| MedStar | NR/A2/A | 116,464 | 56.3% | $41.01 | $4,776,189 | 56.5% | 12/31/2029 | 2, 5-year | N |
| Crown Castle | NR/NR/NR | 38,255 | 18.5% | $41.64 | $1,592,938 | 18.8% | 6/30/2028 | N | N |
| Nike | NR/NR/NR | 12,018 | 5.8% | $39.84 | $478,797 | 5.7% | 11/30/2026 | 1, 5-year | Y(3) |
| | 166,737 | 80.6% | $41.07 | $6,847,924 | 81.0% | | | |
| | | | | | | | | |
| Non-Major Tenants | 37,282 | 18.0% | $43.13 | $1,608,032 | 19.0% | | | |
| | | | | | | | | |
| Occupied Collateral Total | 204,019 | 98.6% | $41.45 | $8,455,956 | 100.0% | | | |
| | | | | | | | | |
| Vacant Space | 2,846 | 1.4% | | | | | | |
| | | | | | | | | |
| Collateral Total | 206,865 | 100.0% | | | | | | |
| | | | | | | | | | |
| (1) | Certain ratings are those of the parent company whether or not the parent company guarantees the lease. |
| (2) | Annual U/W Base Rent PSF and Annual U/W Base Rent include contractual rent steps through January 2023 totaling $145,154, as well as straight-line rent averaging credit over the remaining lease term for MedStar due to the investment grade nature of the tenant. The current contractual rental rate for MedStar is $36.23 per square foot. |
| (3) | Nike has a one-time option to terminate its lease on the last day of the 60th month of the lease (11/28/2023) with seven months written notice to the landlord, and the payment of a termination fee equal to three times the then-current base rent and operating costs. |
The following table presents certain information relating to the lease rollover schedule at the One Merriweather Property:
Lease Expiration Schedule(1)
Year Ending
December 31, | No. of
Leases
Expiring | Expiring
NRSF | % of Total NRSF | Cumulative
Expiring
NRSF | Cumulative
% of Total
NRSF | Annual
U/W
Base Rent(2) | % of Total
Annual U/W
Base Rent | Annual
U/W
Base Rent
PSF(2) |
| MTM | 0 | 0 | 0.0% | 0 | 0.0% | $0 | 0.0% | $0.00 |
| 2022 | 0 | 0 | 0.0% | 0 | 0.0% | $0 | 0.0% | $0.00 |
| 2023 | 2 | 15,699 | 7.6% | 15,699 | 7.6% | $629,146 | 7.4% | $40.08 |
| 2024 | 3 | 11,203 | 5.4% | 26,902 | 13.0% | $450,512 | 5.3% | $40.21 |
| 2025 | 1 | 3,704 | 1.8% | 30,606 | 14.8% | $149,271 | 1.8% | $40.30 |
| 2026 | 1 | 9,118 | 4.4% | 39,724 | 19.2% | $353,414 | 4.2% | $38.76 |
| 2027 | 0 | 0 | 0.0% | 39,724 | 19.2% | $0 | 0.0% | $0.00 |
| 2028 | 3 | 38,255 | 18.5% | 77,979 | 37.7% | $1,592,938 | 18.8% | $41.64 |
| 2029 | 6 | 116,464 | 56.3% | 194,443 | 94.0% | $4,776,189 | 56.5% | $41.01 |
| 2030 | 2 | 9,343 | 4.5% | 203,786 | 98.5% | $504,486 | 6.0% | $54.00 |
| 2031 | 0 | 0 | 0.0% | 203,786 | 98.5% | $0 | 0.0% | $0.00 |
| 2032 | 0 | 0 | 0.0% | 203,786 | 98.5% | $0 | 0.0% | $0.00 |
| Thereafter(3) | 1 | 233 | 0.1% | 204,019 | 98.6% | $0 | 0.0% | $0.00 |
| Vacant | 0 | 2,846 | 1.4% | 206,865 | 100.0% | $0 | 0.0% | $0.00 |
| Total/Weighted Average | 19 | 206,865 | 100.0% | | | $8,455,956 | 100.0% | $41.45 |
| (1) | Information obtained from the underwritten rent roll. |
| (2) | Annual U/W Base Rent and Annual U/W Base Rent PSF does not include vacant space. |
| (3) | Includes 233 SF of storage space with no income. |
THE INFORMATION IN THIS STRUCTURAL AND COLLATERAL TERM SHEET IS NOT COMPLETE AND MAY BE AMENDED PRIOR TO THE TIME OF SALE. THIS TERM SHEET IS NOT AN OFFER TO SELL THESE SECURITIES AND IT IS NOT A SOLICITATION OF AN OFFER TO BUY THESE SECURITIES IN ANY JURISDICTION WHERE THE OFFER OR SALE IS NOT PERMITTED.
117
| Office - Suburban | Loan #8 | Cut-off Date Balance: | | $49,800,000 |
| 10980 Grantchester Way | One Merriweather | Cut-off Date LTV: | | 58.5% |
| Columbia, MD 21044 | | UW NCF DSCR: | | 2.62x |
| | | UW NOI Debt Yield: | | 10.1% |
The following table presents historical occupancy percentages at the One Merriweather Property:
Historical Occupancy
12/31/2017(1) | 12/31/2018(1) | 12/31/2019(2) | 12/31/2020(2) | 11/30/2021(3) |
| 61.8% | 84.8% | 92.8% | 98.6% | 98.6% |
| (1) | Information obtained from a third-party research provider as of the fourth quarter of 2017 and 2018. |
| (2) | Information obtained from the borrowers. |
| (3) | Information obtained from the underwritten rent roll. |
Operating History and Underwritten Net Cash Flow. The following table presents certain information relating to the historical operating performance and underwritten net cash flow at the One Merriweather Property:
Cash Flow Analysis
| | 2018 | 2019 | 2020 | TTM
9/30/2021 | U/W | %(1) | U/W $
per SF |
| Base Rent | $5,319,223 | $6,587,424 | $7,234,786 | $7,166,625 | $8,455,956(2) | 96.0% | $40.88(2) |
| Grossed Up Vacant Space | 0 | 0 | 0 | 0 | 112,417 | 1.3 | 0.54 |
| Gross Potential Rent | $5,319,223 | $6,587,424 | $7,234,786 | $7,166,625 | $8,568,373 | 97.3% | $41.42 |
| Other Income | 1 | 419 | 6,000 | 6,000 | 6,000 | 0.1 | 0.03 |
| Percentage Rent | 38,360 | 30,541 | 61,385 | 200,199 | 0 | 0.0 | 0.00 |
| Less: Free Rent Adjustment | (413,594) | (351,720) | (83,299) | (9,796) | 0 | 0.0 | 0.00 |
| Total Recoveries | 44,774 | 143,666 | 45,844 | 65,904 | 235,552 | 2.7 | 1.14 |
| Net Rental Income | $4,988,764 | $6,410,330 | $7,264,717 | $7,428,932 | $8,809,925 | 100.0% | $42.59 |
| (Vacancy & Credit Loss) | 0 | 0 | 0 | 0 | (856,837)(3) | 10.0 | (4.14) |
| Effective Gross Income | $4,988,764 | $6,410,330 | $7,264,717 | $7,428,932 | $7,953,088 | 90.3% | $38.45 |
| | | | | | | | |
| Real Estate Taxes | 1,178,498 | 1,233,461 | 674,156 | 881,708 | 963,992 | 12.1% | 4.66 |
| Insurance | 39,587 | 44,109 | 43,319 | 44,898 | 59,002 | 0.7 | 0.29 |
| Management Fee | 191,311 | 240,434 | 243,996 | 228,107 | 238,593 | 3.0 | 1.15 |
| Other Operating Expenses | 1,311,071 | 1,346,143 | 1,332,448 | 1,353,464 | 1,685,250 | 21.2 | 8.15 |
| Total Operating Expenses | $2,720,467 | $2,864,147 | $2,293,919 | $2,508,178 | $2,946,837 | 37.1% | $14.25 |
| | | | | | | | |
| Net Operating Income(4) | $2,268,297 | $3,546,183 | $4,970,797 | $4,920,754 | $5,006,251 | 62.9% | $24.20 |
| Replacement Reserves | 0 | 0 | 0 | 0 | 41,373 | 0.5 | 0.20 |
| TI/LC | 0 | 0 | 0 | 0 | 310,298 | 3.9 | 1.50 |
| Net Cash Flow | $2,268,297 | $3,546,183 | $4,970,797 | $4,920,754 | $4,654,580 | 58.5% | $22.50 |
| | | | | | | | |
| NOI DSCR | 1.27x | 1.99x | 2.79x | 2.76x | 2.81x | | |
| NCF DSCR | 1.27x | 1.99x | 2.79x | 2.76x | 2.62x | | |
| NOI Debt Yield | 4.6% | 7.1% | 10.0% | 9.9% | 10.1% | | |
| NCF Debt Yield | 4.6% | 7.1% | 10.0% | 9.9% | 9.3% | | |
| (1) | Represents (i) percent of Net Rental Income for all revenue fields, (ii) percent of Gross Potential Rent for Vacancy & Credit Loss and (iii) percent of Effective Gross Income for all other fields. |
| (2) | U/W Base Rent PSF and U/W Base Rent include contractual rent steps through January 2023 totaling $145,154, as well as straight-line rent averaging credit over the remaining lease term for MedStar due to the investment grade nature of the tenant. The current contractual rental rate for MedStar is $36.23 per square foot. |
| (3) | The underwritten economic vacancy is 10.0%. The One Merriweather Property was 98.6% physically occupied as of November 30, 2021. |
| (4) | The One Merriweather Property was completed in 2017, with tenants beginning to take occupancy in 2017. The increase in Net Operating Income from years 2018 to 2019 and 2019 to 2020 is due to the lease up of the building from 84.8% occupancy in 2018, to 92.8% in 2019, and then reaching stabilization in 2020 at 98.6%. |
Appraisal. The appraiser concluded to an “as-is” Appraised Value for the One Merriweather Property of $85,100,000 as of December 10, 2021.
Environmental Matters. According to the Phase I environmental site assessment dated November 30, 2021, there was no evidence of any recognized environmental conditions at the One Merriweather Property.
Market Overview and Competition. The One Merriweather Property is located in Columbia, Maryland. Columbia is centrally located in the region, approximately 21.6 miles southwest of Baltimore, Maryland and 24.9 miles north of Washington D.C. Columbia is a 14,000-acre master planned community with approximately 100,000 residents. Columbia has 5,300 acres of open space, three lakes, 19 ponds and more than 83 miles of pathways for walking, biking and jogging. The area contains nine residential communities surrounding a central town center anchored by The Mall in Columbia, which is located approximately 0.5 miles north of the One Merriweather Property. A 30-year master plan, approved in 2010, allows for up to 13 million square feet in the town center area. One Merriweather is located in The Crescent area of the plan, located 0.2 miles to the Merriweather Post Pavilion, a 19,300-seat
THE INFORMATION IN THIS STRUCTURAL AND COLLATERAL TERM SHEET IS NOT COMPLETE AND MAY BE AMENDED PRIOR TO THE TIME OF SALE. THIS TERM SHEET IS NOT AN OFFER TO SELL THESE SECURITIES AND IT IS NOT A SOLICITATION OF AN OFFER TO BUY THESE SECURITIES IN ANY JURISDICTION WHERE THE OFFER OR SALE IS NOT PERMITTED.
118
| Office - Suburban | Loan #8 | Cut-off Date Balance: | | $49,800,000 |
| 10980 Grantchester Way | One Merriweather | Cut-off Date LTV: | | 58.5% |
| Columbia, MD 21044 | | UW NCF DSCR: | | 2.62x |
| | | UW NOI Debt Yield: | | 10.1% |
amphitheater, and planned as an urban, high-density, mixed-use development. The Howard Hughes Company controls The Crescent and most of the remaining land components in downtown Columbia. According to the appraisal, within a 1-, 3- and 5- mile radius of the One Merriweather Property, the estimated 2021 population is 14,131, 85,981, and 184,749, respectively, and the 2021 average household income is $131,768, $148,173, and $165,686, respectively.
According to a third-party market research report, the property is situated within the Downtown Columbia office submarket of the greater Baltimore regional office market. As of February 1, 2022, the submarket reported total inventory of approximately 3.3 million square feet with a 16.3% vacancy rate and average market rents of $29.14 per square foot. There is currently nothing under construction in the submarket. The appraiser identified five lease comparables with rents ranging from $35.00 to $44.00 per square foot, and concluded to a market rent of $39.50 per square foot. The appraiser concluded to a market rent of $51.50 per square foot for the retail space, which makes up approximately 4.5% of the net rentable area in the One Merriweather Property.
The following table presents certain information relating to the appraiser’s market rent conclusions for the One Merriweather Property:
Market Rent Summary(1)
| | Office | Retail |
| Market Rent (PSF) | $39.50 | $51.50 |
| Lease Term (Years) | 10 | 10 |
| Lease Type | Modified Gross | Net |
| Rent Increase Projection | 2.5%/Year | 2.5%/Year |
| TI (New/Renewal) | $35.00 / $15.00 | $25.00 / $0.00 |
| LC (New/Renewal) | 6.0% / 3.0% | 6.0% / 3.0% |
| Free Rent (New/Renewal) | 5 mths / 0 mths | 3 mths / 0 mths |
| (1) | Information obtained from the appraisal. |
The table below presents certain information relating to comparable sales pertaining to the One Merriweather Property identified by the appraiser:
Comparable Sales(1)
| Property Name | Location | Year
Built/Renovated | Rentable
Area (SF) | Sale Date | Sale Price | Sale Price
(PSF) |
Shirlington Tower 2900 South Quincy Street | Arlington, VA | 2001/NAP | 233,446 | Oct-2020 | $76,000,000 | $326 |
Patriots Park I, II & III 12290, 12300 & 12310 Sunrise Valley Drive | Reston, VA | 1986/2013 | 705,905 | Sep-2020 | $325,000,000 | $460 |
Monument I 12975 Worldgate Drive | Herndon, VA | 1998/NAP | 167,285 | Sep-2020 | $49,800,000 | $298 |
Prince Street Plaza 1421 Prince Street | Alexandria, VA | 1987/NAP | 55,321 | Jun-2020 | $20,100,000 | $363 |
| (1) | Information obtained from the appraisal. |
THE INFORMATION IN THIS STRUCTURAL AND COLLATERAL TERM SHEET IS NOT COMPLETE AND MAY BE AMENDED PRIOR TO THE TIME OF SALE. THIS TERM SHEET IS NOT AN OFFER TO SELL THESE SECURITIES AND IT IS NOT A SOLICITATION OF AN OFFER TO BUY THESE SECURITIES IN ANY JURISDICTION WHERE THE OFFER OR SALE IS NOT PERMITTED.
119
| Office - Suburban | Loan #8 | Cut-off Date Balance: | | $49,800,000 |
| 10980 Grantchester Way | One Merriweather | Cut-off Date LTV: | | 58.5% |
| Columbia, MD 21044 | | UW NCF DSCR: | | 2.62x |
| | | UW NOI Debt Yield: | | 10.1% |
The following table presents certain information relating to the appraiser’s market rent conclusions for the One Merriweather Property:
Comparable Office Leases(1)
| Property Name/Location | Year Built/ Renovated | Total GLA
(SF) | Tenant | Tenant
Size (SF) | Lease
Start
Date | Lease Term | Annual
Base Rent
PSF | Lease Type |
One Merriweather(Subject) 10980 Grantchester Way Columbia, MD | 2017/NAP(2) | 206,865(2) | | | | | | |
Maple Lawn Office VIII 8115 Maple Lawn Boulevard Fulton, MD | 2016/NAP | 123,658 | Lawrence & Bundy | 2,935 | Jul-2021 | 5.3 Yrs. | $35.75 | Modified |
Two Merriweather 10960 Grantchester Way Columbia, MD | 2017/NAP | 128,000 | Medisolv | 4,689 | Nov-2020 | 5.0 Yrs. | $37.90 | Modified |
Maple Lawn Office III 8161 Maple Lawn Boulevard Fulton, MD | 2006/NAP | 110,046 | Creston Electronics | 7,999 | Nov-2021 | 2.0 Yrs. | $36.13 | Modified |
Maple Lawn Office Building III 8171 Maple Lawn Boulevard Fulton, MD | 2005/NAP | 84,727 | SAS Institute, Inc. | 4,831 | Jun-2021 | 5.0 Yrs. | $35.00 | Modified |
Two Merriweather 10960 Grantchester Way Columbia, MD | 2017/NAP | 128,000 | JLL | 2,787 | Dec-2019 | 3.3 Yrs. | $44.00 | Modified |
| (1) | Information obtained from the appraisal. |
| (2) | Information obtained from the underwritten rent roll. |
Escrows.
Real Estate Taxes – The One Merriweather Mortgage Loan documents require an upfront deposit of $459,086 and ongoing monthly real estate tax reserves in an amount equal to 1/12th of the real estate taxes that the lender estimates will be payable during the next 12 months, initially estimated at $76,515.
Insurance – The One Merriweather Mortgage Loan documents require ongoing monthly insurance reserves in an amount equal to 1/12th of the insurance premiums that the lender estimates will be payable for the renewal of the coverage afforded by the policies upon the expiration thereof.
Notwithstanding the above, the borrowers’ obligation to make insurance reserve payments will be waived so long as (i) no event of default is continuing, (ii) the insurance policies maintained by the borrowers are part of a blanket or umbrella policy approved by the lender in its reasonable discretion, and (iii) the lender is provided with paid receipts for the payment of the insurance premiums no later than ten business days prior to the expiration dates of said policies.
Replacement Reserve – The One Merriweather Mortgage Loan documents require an ongoing monthly replacement reserve deposit of $3,448, capped at $200,000.
Leasing Reserve – The One Merriweather Mortgage Loan documents require an ongoing monthly leasing reserve deposit of $25,858, capped at $1,000,000.
Lockbox and Cash Management. The One Merriweather Mortgage Loan is structured with a soft lockbox and springing cash management. The borrowers and property manager are required to deposit all rent into an established deposit account each business day. Upon the occurrence of a Cash Trap Event Period (defined below), all amounts available in the deposit account will be transferred to a cash management account controlled by the lender on each business day, and applied in accordance with the cash flow waterfall in the cash management agreement. During the continuance of a Cash Trap Event Period, all excess cash flow will be held by the lender as additional collateral.
THE INFORMATION IN THIS STRUCTURAL AND COLLATERAL TERM SHEET IS NOT COMPLETE AND MAY BE AMENDED PRIOR TO THE TIME OF SALE. THIS TERM SHEET IS NOT AN OFFER TO SELL THESE SECURITIES AND IT IS NOT A SOLICITATION OF AN OFFER TO BUY THESE SECURITIES IN ANY JURISDICTION WHERE THE OFFER OR SALE IS NOT PERMITTED.
120
| Office - Suburban | Loan #8 | Cut-off Date Balance: | | $49,800,000 |
| 10980 Grantchester Way | One Merriweather | Cut-off Date LTV: | | 58.5% |
| Columbia, MD 21044 | | UW NCF DSCR: | | 2.62x |
| | | UW NOI Debt Yield: | | 10.1% |
A “Cash Trap Event Period” will commence upon the earlier of the following:
| (i) | the occurrence of an event of default; |
| (ii) | the net cash flow debt yield falling below 7.5%; or |
| (iii) | the occurrence of a Material Tenant Event (as defined below). |
A Cash Trap Event Period will end upon the occurrence of the following:
| ● | with regard to clause (i), the cure of such event of default; |
| ● | with regard to clause (ii), the net cash flow debt yield being equal to or greater than 7.75% for two consecutive calendar quarters or the borrowers deliver cash or a letter of credit in an amount which, if applied to the then principal balance of the One Merriweather Mortgage Loan, would result in the net cash flow debt yield of 7.75%; or |
| ● | with regard to clause (iii), a Material Tenant Event Cure (defined below). |
A “Material Tenant Event” means the earliest to occur of the following:
| (i) | MedStar defaulting on its lease beyond any notice and cure period; |
| (ii) | MedStar becomes a debtor in a bankruptcy, insolvency or similar proceeding or action; |
| (iii) | MedStar goes dark or otherwise fails to occupy more than 50% of its space; |
| (iv) | MedStar has not renewed its lease for a minimum of a five year term on then-current market terms reasonably approved by the lender on the earlier of the tenants notice period (between 12-18 months prior to lease expiration) or February 11, 2031; or |
| (v) | MedStar terminates, surrenders, or cancels its lease. |
A “Material Tenant Cure” means:
| ● | with regard to clause (i), the cure of such event of default or the borrowers entering into one or more leases for either the entirety of the space leased to MedStar or a portion of the space, if such leases include aggregate base rent that is at least 90% of the base rent otherwise payable under the MedStar lease (“Eligible Replacement Leases”); |
| ● | with regard to clause (ii), either (a) the bankruptcy action has been dismissed or discharged, (b) MedStar has assumed the lease in full in such proceeding and the bankruptcy trustee has approved the assumption, or (c) the borrowers have entered into Eligible Replacement Leases; |
| ● | with regard to clause (iii), MedStar has been continuously operating in more than 50% of its space for more than 90 days; |
| ● | with regard to clause (iv), a binding and enforceable renewal of the MedStar lease has been executed; or |
| ● | with regard to clause (v), the borrowers have entered into Eligible Replacement Leases. |
Provided that any cure of a Material Tenant Event above is subject to (x) no event of default continuing, (y) no other event causing an Excess Cash Trap Event continuing, and (z) borrowers paying all the lender’s reasonable expenses incurred in connection with the cure.
Property Management. The One Merriweather Property is managed by Howard Hughes Management Services Company, LLC, an affiliate of the borrowers.
Partial Release. Not permitted.
Real Estate Substitution. Not permitted.
Subordinate and Mezzanine Indebtedness. None.
Ground Lease. None.
Terrorism Insurance. The loan documents require that the “all risk” insurance policy required to be maintained by the borrowers provides coverage for terrorism in an amount equal to the full replacement cost of the One Merriweather Property, as well as business interruption insurance covering no less than the 18-month period following the occurrence of a casualty event, together with a 6-month extended period of indemnity (provided that if TRIPRA or a similar statute is not in effect, the borrowers will not be obligated to pay terrorism insurance premiums in excess of two times the premium for the casualty and business interruption coverage on a stand-alone basis).
THE INFORMATION IN THIS STRUCTURAL AND COLLATERAL TERM SHEET IS NOT COMPLETE AND MAY BE AMENDED PRIOR TO THE TIME OF SALE. THIS TERM SHEET IS NOT AN OFFER TO SELL THESE SECURITIES AND IT IS NOT A SOLICITATION OF AN OFFER TO BUY THESE SECURITIES IN ANY JURISDICTION WHERE THE OFFER OR SALE IS NOT PERMITTED.
121
| Industrial – Various | Loan #9 | Cut-off Date Balance: | | $40,000,000 |
| Property Addresses - Various | GS Foods Portfolio | Cut-off Date LTV: | | 67.2% |
| Various, Various | | U/W NCF DSCR: | | 1.45x |
| | | U/W NOI Debt Yield: | | 8.6% |
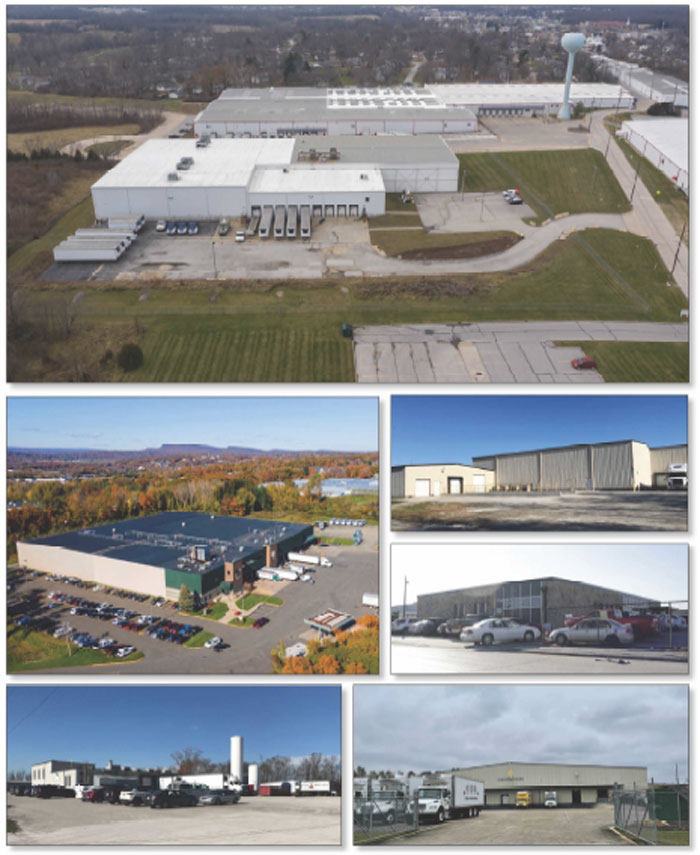
THE INFORMATION IN THIS STRUCTURAL AND COLLATERAL TERM SHEET IS NOT COMPLETE AND MAY BE AMENDED PRIOR TO THE TIME OF SALE. THIS TERM SHEET IS NOT AN OFFER TO SELL THESE SECURITIES AND IT IS NOT A SOLICITATION OF AN OFFER TO BUY THESE SECURITIES IN ANY JURISDICTION WHERE THE OFFER OR SALE IS NOT PERMITTED.
122
| Industrial – Various | Loan #9 | Cut-off Date Balance: | | $40,000,000 |
| Property Addresses - Various | GS Foods Portfolio | Cut-off Date LTV: | | 67.2% |
| Various, Various | | U/W NCF DSCR: | | 1.45x |
| | | U/W NOI Debt Yield: | | 8.6% |
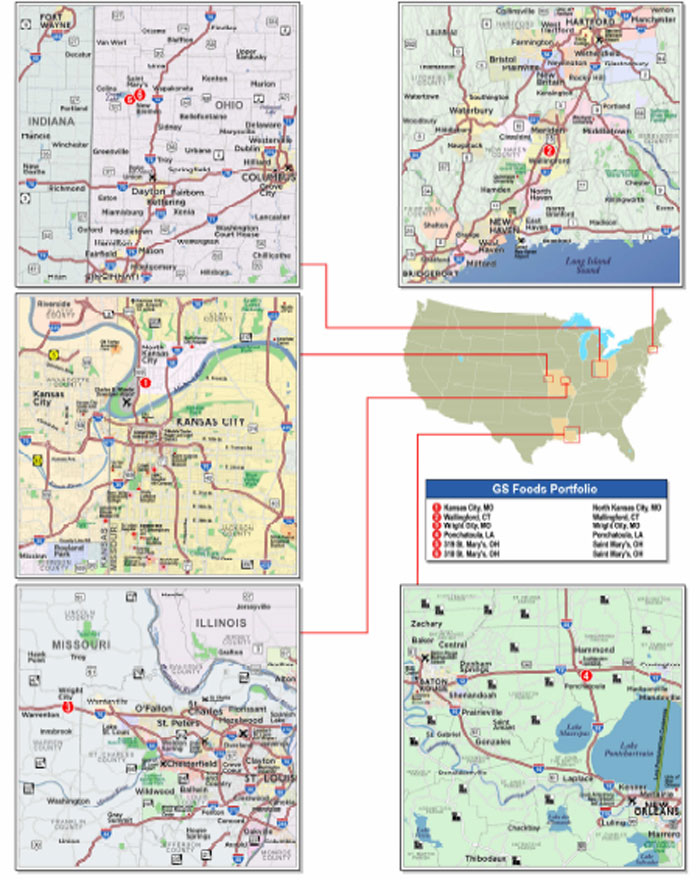
THE INFORMATION IN THIS STRUCTURAL AND COLLATERAL TERM SHEET IS NOT COMPLETE AND MAY BE AMENDED PRIOR TO THE TIME OF SALE. THIS TERM SHEET IS NOT AN OFFER TO SELL THESE SECURITIES AND IT IS NOT A SOLICITATION OF AN OFFER TO BUY THESE SECURITIES IN ANY JURISDICTION WHERE THE OFFER OR SALE IS NOT PERMITTED.
123
| No. 9 – GS Foods Portfolio |
| |
| Mortgage Loan Information | | Mortgaged Property Information |
| Mortgage Loan Seller: | Wells Fargo Bank, National Association | | Single Asset/Portfolio: | Portfolio |
Credit Assessment (Fitch/KBRA/S&P): | NR/NR/NR | | Property Type – Subtype: | Industrial – Various |
| Original Principal Balance(1): | $40,000,000 | | Location: | Various – See Table |
| Cut-off Date Balance(1): | $40,000,000 | | Size: | 516,288 SF |
| % of Initial Pool Balance: | 3.4% | | Cut-off Date Balance Per SF(1): | $111.41 |
| Loan Purpose: | Acquisition | | Maturity Date Balance Per SF(1): | $100.93 |
| Borrower Sponsor: | Angelo, Gordon & Co., LP | | Year Built/Renovated: | Various – See Table |
| Guarantors: | AG Net Lease IV Corp., AG Net Lease IV (Q) Corp. and AG Net Lease Realty Fund IV Investments (H-1), L.P. | | Title Vesting: | Fee |
| Mortgage Rate: | 3.7900% | | Property Manager: | Tenant-managed |
| Note Date: | December 22, 2021 | | Current Occupancy (As of)(4): | 100.0% (12/27/2021) |
| Seasoning: | 2 months | | YE 2020 Occupancy(5): | NAV |
| Maturity Date: | January 11, 2032 | | YE 2019 Occupancy(5): | NAV |
| IO Period: | 60 months | | YE 2018 Occupancy(5): | NAV |
| Loan Term (Original): | 120 months | | YE 2017 Occupancy(5): | NAV |
| Amortization Term (Original): | 360 months | | Appraised Value(4): | $85,540,000 |
| Loan Amortization Type: | Interest Only, Amortizing Balloon | | Appraised Value Per SF(4): | $165.68 |
| Call Protection(2): | L(26), DorYM1(87),O(7) | | Appraisal Valuation Date(6): | Various |
| Lockbox Type: | Hard/Springing Cash Management | | | |
| Additional Debt(1): | Yes | | Underwriting and Financial Information(4) |
| Additional Debt Type (Balance)(1): | Pari Passu (17,520,000) | | TTM NOI(5): | NAV |
| | | | YE 2020 NOI(5): | NAV |
| | | | YE 2019 NOI(5): | NAV |
| | | | YE 2018 NOI(5): | NAV |
| | | | U/W Revenues: | $5,070,669 |
| | | | U/W Expenses: | $152,120 |
| Escrows and Reserves(3) | | U/W NOI: | $4,918,549 |
| | Initial | Monthly | Cap | | U/W NCF: | $4,667,023 |
| Taxes | $0 | Springing | NAP | | U/W DSCR based on NOI/NCF(1): | 1.53x / 1.45x |
| Insurance | $0 | Springing | NAP | | U/W Debt Yield based on NOI/NCF(1): | 8.6% / 8.1% |
| Replacement Reserve | $0 | Springing | NAP | | U/W Debt Yield at Maturity based on NOI/NCF(1): | 9.4% / 9.0% |
| | | | | | Cut-off Date LTV Ratio(1): | 67.2% |
| | | | | | LTV Ratio at Maturity(1): | 60.9% |
| | | | | | | |
| | | | | | | |
| Sources and Uses |
| Sources | | | | Uses | | |
| Loan Amount | $57,520,000 | 65.0% | | Purchase Price | $87,737,727 | 99.1% |
| Sponsor Equity | $31,021,505 | 35.0 | | Closing Costs | 803,778 | 0.9 |
| Total Sources | $88,541,505 | 100.0% | | Total Uses | $88,541,505 | 100.0% |
| (1) | The GS Foods Portfolio Mortgage Loan (as defined below) is part of the GS Foods Portfolio Whole Loan (as defined below) with an original aggregate principal balance of $57,520,000. The Cut-off Date Balance per square foot, Maturity Date Balance per square foot, U/W Debt Yield based on NOI/NCF, U/W Debt Yield at Maturity Date based on NOI/NCF, U/W DSCR based on NOI/NCF, Cut-off Date LTV Ratio and LTV Ratio at Maturity numbers presented above are based on the GS Foods Portfolio Whole Loan. |
| (2) | At any time after the earlier of (i) December 22, 2024 and (ii) two years from the closing date of the securitization that includes the last pari passu note of the GS Foods Portfolio Whole Loan to be securitized, the borrower has the right to defease or payoff the GS Foods Portfolio Whole Loan with a yield maintenance premium. Additionally, the borrower may prepay the GS Foods Portfolio Whole Loan with 30 days’ notice on or after July 11, 2031. |
| (3) | See “Escrow and Reserves” section. |
| (4) | The novel coronavirus pandemic is an evolving situation and could impact the GS Foods Portfolio Whole Loan more severely than assumed in the underwriting of the GS Foods Portfolio Whole Loan and could adversely affect the NOI, NCF and occupancy information, as well as the appraised value and the DSCR, LTV and Debt Yield metrics presented above and herein. See "Risk Factors—Risks Related to Market Conditions and Other External Factors—The Coronavirus Pandemic Has Adversely Affected the Global Economy and Will Likely Adversely Affect the Performance of the Mortgage Loans" in the Preliminary Prospectus. |
| (5) | Historical occupancy and historical operating history are not available, as the borrower sponsor recently acquired the GS Foods Portfolio Properties (as defined below) in a sale-leaseback transaction, and leases were not previously in-place. |
| (6) | The appraisal valuation dates range from November 1, 2021 to November 22, 2021. |
The Mortgage Loan. The mortgage loan (the “GS Foods Portfolio Mortgage Loan”) is part of a whole loan (the “GS Foods Portfolio Whole Loan”) secured by first priority fee interests in six industrial properties totaling 516,288 square feet and located in Missouri, Connecticut, Louisiana, and Ohio (the “GS Foods Portfolio Properties”). The GS Foods Portfolio Whole Loan has an original aggregate principal balance of $57,520,000 and is comprised of two pari passu notes (A-1 $40,000,000; A-2 $17,520,000). The GS Foods Portfolio Whole Loan will be serviced under the pooling and servicing agreement for the BANK 2022-BNK40 securitization trust. See “Description
THE INFORMATION IN THIS STRUCTURAL AND COLLATERAL TERM SHEET IS NOT COMPLETE AND MAY BE AMENDED PRIOR TO THE TIME OF SALE. THIS TERM SHEET IS NOT AN OFFER TO SELL THESE SECURITIES AND IT IS NOT A SOLICITATION OF AN OFFER TO BUY THESE SECURITIES IN ANY JURISDICTION WHERE THE OFFER OR SALE IS NOT PERMITTED.
124
| Industrial – Various | Loan #9 | Cut-off Date Balance: | | $40,000,000 |
| Property Addresses - Various | GS Foods Portfolio | Cut-off Date LTV: | | 67.2% |
| Various, Various | | U/W NCF DSCR: | | 1.45x |
| | | U/W NOI Debt Yield: | | 8.6% |
of the Mortgage Pool—The Whole Loans—The Serviced Pari Passu Whole Loans” and “Pooling and Servicing Agreement” in the Preliminary Prospectus.
Note Summary
| Notes | Original Balance | Cut-off Date Balance | Note Holder | Controlling Piece |
| A-1 | $40,000,000 | $40,000,000 | BANK 2022-BNK40 | Yes |
| A-2 | $17,520,000 | $17,520,000 | WFB | No |
| Total | $57,520,000 | $57,520,000 | | |
The Borrower and Borrower Sponsors. The borrower is AGNL PB&J, L.L.C. (the “GS Foods Portfolio Borrower”), a Delaware limited liability company with one independent director. Legal counsel to the borrower delivered a non-consolidation opinion in connection with the origination of the GS Foods Portfolio Whole Loan. The non-recourse carveout guarantor is AG Net Lease IV Corp., AG Net Lease IV (Q) Corp. and AG Net Lease Realty Fund IV Investments (H-1), L.P. (collectively the “GS Foods Portfolio Guarantor”).
The borrower sponsor is Angelo, Gordon & Co., LP, a privately held investment firm that is the parent company to the GS Foods Portfolio Guarantor. Angelo, Gordon & Co. manages approximately $48 billion across a range of asset classes. Angelo Gordon began investing in real estate within the United States in 1993 and has acquired approximately $35 billion of properties in the country.
The Properties. The GS Foods Portfolio Properties consist of six one- and two-story, single-tenant, industrial buildings located in Missouri (two properties, 52.4% of net rentable area), Connecticut (one property, 25.5% of net rentable area), Louisiana (one property, 12.8% of net rentable area), and Ohio (two properties, 9.3% of net rentable area). Built between 1954 and 1998, the properties range in size from 19,947 square feet to 197,571 square feet. Four properties were renovated between 1988 and 2018. Each of the GS Foods Portfolio Properties contains 10 to 106 surface parking spaces with parking ratios ranging from 0.4 to 3.5 spaces per 1,000 square feet of rentable area. As of December 27, 2021, the GS Foods Portfolio Properties were 100.0% leased to five entities, each of which is a subsidiary of GS Foods, Inc (“GS Foods”). All six leases run through December 31, 2041 with 2, 10-year renewal options and no termination options.
Kansas City, MO
The Kansas City, MO property is a 197,571 square foot, single-story cold storage property located in North Kansas City, Missouri. Built in 1954 and most recently renovated in 2018, the property is situated on 8.0 acres of land and contains 101 surface parking spaces, resulting in a parking ratio of 0.5 spaces per 1,000 square feet of rentable area. The building contains 20-foot ceiling heights and 32 dock high doors. The property contains approximately 130,000 square feet of cold storage space. The building is 100.0% leased and occupied by C&C Produce, LLC, a subsidiary of GS Foods that specializes in the distribution of produce products.
Wallingford, CT
The Wallingford, CT property is a 131,671 square foot, two-story warehouse/cold storage distribution property located north of New Haven, Connecticut. Built in 1990, the property is situated on 25.8 acres of land and includes 30-foot ceiling heights and 14 dock high doors. The property is comprised of 53% dry storage, 37% cold storage, and 8.9% office space. The building is 100.0% leased and occupied by Thurston Foods, a subsidiary of GS Foods that operates as a full-service food distributor based in Wallingford, Connecticut.
Wright City, MO
The Wright City, MO property is a 73,000 square foot, single-story cold storage warehouse property built in 1984 and renovated in 2007. The property is situated on 12.7 acres of land and contains 32 parking spaces, resulting in a parking ratio of 0.4 spaces per 1,000 square feet of rentable area. The building contains 30-foot ceiling heights and 9 dock high doors. The property contains 65,700 square feet of cold storage space. The building is 100.0% leased and occupied by Gold Star Foods.
Ponchatoula, LA
The Ponchatoula, LA property is a 65,989 square foot, single-story cold storage/warehouse/distribution property located near New Orleans, Louisiana. Built in 1998, the property is situated on 7.6 acres of land and contains 40 parking spaces, resulting in a parking ratio of 0.6 spaces per 1,000 square feet of rentable area. The property also includes 20-foot clear ceiling heights, 8 dock high doors, and contains 55% refrigerator/freezer space. The building is 100.0% leased to Pon Food Corp, a subsidiary of GS Foods that serves as a frozen food retail distributor.
319 St. Mary’s, OH
The 319 St. Mary’s, OH property is a single-story, 28,110 square foot cold storage warehouse facility built in 1985 and renovated in 1988 and located outside of Columbus, Ohio. The property is situated on 2.1 acres of land and contains 10 parking spaces, resulting in a parking ratio of 0.4 spaces per 1,000 square feet of rentable area. The building includes 28,060 square feet of cold storage space and 3,000 SF of office space. The building also contains 24-foot ceiling heights and three dock high doors. The property is 100.0% leased to Classic Delight, a subsidiary of GS Foods that provides a range of handheld food items.
THE INFORMATION IN THIS STRUCTURAL AND COLLATERAL TERM SHEET IS NOT COMPLETE AND MAY BE AMENDED PRIOR TO THE TIME OF SALE. THIS TERM SHEET IS NOT AN OFFER TO SELL THESE SECURITIES AND IT IS NOT A SOLICITATION OF AN OFFER TO BUY THESE SECURITIES IN ANY JURISDICTION WHERE THE OFFER OR SALE IS NOT PERMITTED.
125
| Industrial – Various | Loan #9 | Cut-off Date Balance: | | $40,000,000 |
| Property Addresses - Various | GS Foods Portfolio | Cut-off Date LTV: | | 67.2% |
| Various, Various | | U/W NCF DSCR: | | 1.45x |
| | | U/W NOI Debt Yield: | | 8.6% |
310 St. Mary’s, OH
The 310 St. Mary’s, OH property is a two-story, 19,947 square foot cold storage, manufacturing and warehouse facility built in 1972 and renovated in 1993 and located outside of Columbus, Ohio. The property is situated on 3.5 acres of land and contains 70 parking spaces, resulting in a parking ratio of 3.5 spaces per 1,000 square feet of rentable area. The property includes 16,540 square feet of production, warehouse, and cold storage space, as well as 3,600 square feet of office space. The building also contains 22-foot ceiling heights and five dock high doors. The property is 100.0% leased to Classic Delight, a subsidiary of GS Foods.
Major Tenant
GS Foods Group is a specialized food distribution company that services educational facilities, correction centers, non-profit organizations, and business and healthcare industries. GS Foods Group is the parent company under the lease for each property within the GS Foods Portfolio. GS Foods’ independent subsidiaries collectively serve more than 8,000 customers nationwide. The parent company was founded in 1966 and is headquartered in Ontario, California.
The following table presents certain information relating to the GS Foods Portfolio Properties:
Tenant Name City, State | Year Built /
Renovated | Square Feet | Cut-off Date Balance(1) | Cut-off Date Balance PSF(1) | % of Total Balance | Appraised Value | U/W NCF |
C&C Produce Kansas City, MO | 1954 / 2018 | 197,571 | $24,678,326 | $124.91 | 42.9% | $36,700,000 | $2,082,155 |
Thurston Foods Wallingford, CT | 1990 / NAP | 131,671 | $14,591,817 | $110.82 | 25.4% | $21,700,000 | $1,162,924 |
Gold Star Foods Wright City, MO | 1984 / 2007 | 73,000 | $9,346,832 | $128.04 | 16.2% | $13,900,000 | $698,490 |
Pon Food Corp Ponchatoula, LA | 1998 / NAP | 65,989 | $4,908,768 | $74.39 | 8.5% | $7,300,000 | $399,593 |
Classic Delight 319 St. Mary’s, OH | 1985 / 1988 | 28,110 | $2,346,794 | $83.49 | 4.1% | $3,490,000 | $192,591 |
Classic Delight 310 St. Mary’s, OH | 1972 / 1993 | 19,947 | $1,647,463 | $82.59 | 2.9% | $2,450,000 | $131,270 |
| Total/Weighted Average | | 516,288 | $57,520,000 | $111.41 | 100.0% | $85,540,000 | $4,667,023 |
| (1) | The balances shown are related to the Cut-off Date Balance and Cut-off Date Balance PSF of the GS Foods Portfolio Whole Loan. |
Major Tenants
| Tenant Name | Credit Rating (Fitch/KBRA/S&P) | Tenant NRSF | % of NRSF | Annual U/W Base Rent PSF | Annual U/W Base Rent | % of Total Annual U/W Base Rent | Lease Expiration Date | Ext. Options | Term. Option (Y/N) |
| | | | | | | | | | |
| Major Tenants | | | | | | | | | |
| C&C Produce, LLC | NR/NR/NR | 197,571 | 38.3% | $11.49 | $2,270,520 | 43.8% | 12/31/2041 | 2, 10-yr | N |
| Thurston Foods | NR/NR/NR | 131,671 | 25.5% | $10.07 | $1,326,016 | 25.6% | 12/31/2041 | 2, 10-yr | N |
| Gold Star Foods | NR/NR/NR | 73,000 | 14.1% | $10.71 | $781,830 | 15.1% | 12/31/2041 | 2, 10-yr | N |
| Pon Food Corp | NR/NR/NR | 65,989 | 12.8% | $6.72 | $443,700 | 8.6% | 12/31/2041 | 2, 10-yr | N |
| Classic Delight(1) | NR/NR/NR | 48,057 | 9.3% | $7.56 | $363,360 | 7.0% | 12/31/2041 | 2, 10-yr | N |
| | | | | | | | | | |
| Collateral Total | | 516,288 | 100.0% | $10.04 | $5,185,426 | 100.0% | | | |
| | | | | | | | | | |
| (1) | Classic Delight occupies two spaces: 28,110 square feet at the 319 St. Mary’s, OH property with an annual underwritten base rent of $7.60 per square foot and 19,947 square feet at the 310 St. Mary’s, OH property with an annual underwritten base rent of $7.50 per square foot. Both leases expire December 31, 2041 with 2, 10-year extension options and no termination options. |
THE INFORMATION IN THIS STRUCTURAL AND COLLATERAL TERM SHEET IS NOT COMPLETE AND MAY BE AMENDED PRIOR TO THE TIME OF SALE. THIS TERM SHEET IS NOT AN OFFER TO SELL THESE SECURITIES AND IT IS NOT A SOLICITATION OF AN OFFER TO BUY THESE SECURITIES IN ANY JURISDICTION WHERE THE OFFER OR SALE IS NOT PERMITTED.
126
| Industrial – Various | Loan #9 | Cut-off Date Balance: | | $40,000,000 |
| Property Addresses - Various | GS Foods Portfolio | Cut-off Date LTV: | | 67.2% |
| Various, Various | | U/W NCF DSCR: | | 1.45x |
| | | U/W NOI Debt Yield: | | 8.6% |
The following table presents certain information relating to the lease rollover schedule at the GS Foods Portfolio Properties:
Lease Expiration Schedule(1)
Year Ending
December 31, | No. of Leases Expiring | Expiring NRSF | % of Total NRSF | Cumulative Expiring NRSF | Cumulative % of Total NRSF | Annual
U/W
Base Rent | % of Total Annual U/W Base Rent | Annual
U/W
Base Rent
PSF |
| MTM | 0 | 0 | 0.0% | 0 | 0.0% | $0 | 0.0% | $0.00 |
| 2022 | 0 | 0 | 0.0% | 0 | 0.0% | $0 | 0.0% | $0.00 |
| 2023 | 0 | 0 | 0.0% | 0 | 0.0% | $0 | 0.0% | $0.00 |
| 2024 | 0 | 0 | 0.0% | 0 | 0.0% | $0 | 0.0% | $0.00 |
| 2025 | 0 | 0 | 0.0% | 0 | 0.0% | $0 | 0.0% | $0.00 |
| 2026 | 0 | 0 | 0.0% | 0 | 0.0% | $0 | 0.0% | $0.00 |
| 2027 | 0 | 0 | 0.0% | 0 | 0.0% | $0 | 0.0% | $0.00 |
| 2028 | 0 | 0 | 0.0% | 0 | 0.0% | $0 | 0.0% | $0.00 |
| 2029 | 0 | 0 | 0.0% | 0 | 0.0% | $0 | 0.0% | $0.00 |
| 2030 | 0 | 0 | 0.0% | 0 | 0.0% | $0 | 0.0% | $0.00 |
| 2031 | 0 | 0 | 0.0% | 0 | 0.0% | $0 | 0.0% | $0.00 |
| 2032 | 0 | 0 | 0.0% | 0 | 0.0% | $0 | 0.0% | $0.00 |
| Thereafter | 6 | 516,288 | 100.0% | 516,288 | 100.0% | $5,185,426 | 100.0% | $10.04 |
| Vacant | 0 | 0 | 0.0% | 516,288 | 100.0% | $0 | 0.0% | $0.00 |
| Total/Weighted Average | 6 | 516,288 | 100.0% | | | $5,185,426 | 100.0% | $10.04 |
| (1) | Information obtained from underwritten rent roll. |
The following table presents historical occupancy percentages at the GS Foods Portfolio Properties:
Historical Occupancy
12/31/2017(1) | 12/31/2018(1) | 12/31/2019(1) | 12/31/2020(1) | 12/27/2021(2) |
| NAV | NAV | NAV | NAV | 100.0% |
| (1) | Historical occupancy and historical operating history are not available, as the borrower sponsor recently acquired the GS Foods Portfolio Properties in a sale-leaseback transaction, and leases were not previously in-place. |
| (2) | Information obtained from the underwritten rent roll. |
COVID-19 Update. As of December 27, 2021 the GS Foods Portfolio Properties were open and operating with no outstanding tenant rent relief agreements.
THE INFORMATION IN THIS STRUCTURAL AND COLLATERAL TERM SHEET IS NOT COMPLETE AND MAY BE AMENDED PRIOR TO THE TIME OF SALE. THIS TERM SHEET IS NOT AN OFFER TO SELL THESE SECURITIES AND IT IS NOT A SOLICITATION OF AN OFFER TO BUY THESE SECURITIES IN ANY JURISDICTION WHERE THE OFFER OR SALE IS NOT PERMITTED.
127
| Industrial – Various | Loan #9 | Cut-off Date Balance: | | $40,000,000 |
| Property Addresses - Various | GS Foods Portfolio | Cut-off Date LTV: | | 67.2% |
| Various, Various | | U/W NCF DSCR: | | 1.45x |
| | | U/W NOI Debt Yield: | | 8.6% |
Operating History and Underwritten Net Cash Flow. The following table presents certain information relating to the underwritten net cash flow of the GS Foods Properties:
Cash Flow Analysis(1)
| | U/W | %(2) | U/W $ per SF |
| Base Rent | $5,185,426 | 97.3% | $10.04 |
| Grossed Up Vacant Space | 0 | 0.0 | 0.00 |
| Gross Potential Rent | $5,185,426 | 97.3% | $10.04 |
| Total Recoveries | 144,514 | 2.7 | 0.28 |
| Net Rental Income | $5,329,940 | 100.0% | $10.32 |
| (Vacancy & Credit Loss) | (259,271)(3) | 5.0 | (0.50) |
| Effective Gross Income | $5,070,669 | 95.1% | $9.82 |
| | | | |
| Management Fee | 152,120 | 3.0 | 0.29 |
| Total Operating Expenses | $152,120 | 3.0% | $0.29 |
| | | | |
| Net Operating Income | $4,918,549 | 97.0% | $9.53 |
| Replacement Reserves | 125,801 | 2.5 | 0.24 |
| TI/LC | 125,725 | 2.5 | 0.24 |
| Net Cash Flow | $4,667,023 | 92.0% | $9.04 |
| | | | |
| NOI DSCR(4) | 1.53x | | |
| NCF DSCR(4) | 1.45x | | |
| NOI Debt Yield(4) | 8.6% | | |
| NCF Debt Yield(4) | 8.1% | | |
| | | | |
| | | | |
| | | | |
| (1) | Historical operating history is not available, as the borrower sponsor recently acquired the properties in a sale-leaseback transaction, and leases were not previously in-place. |
| (2) | Represents (i) percent of Net Rental Income for all revenue fields, (ii) percent of Base Rent for Vacancy & Credit Loss and (iii) percent of Effective Gross Income for all other fields. |
| (3) | The underwritten economic vacancy is 5.0%. The GS Foods Portfolio Properties were 100.0% leased as of December 27, 2021. |
| (4) | The NOI DSCR, NCF DSCR, NOI Debt Yield and NCF Debt Yield shown are based on the GS Foods Portfolio Whole Loan, which has an aggregate original principal balance of $57,520,000. |
Appraisal. The aggregate of the appraiser’s “as-is” Appraised Values for the GS Foods Portfolio Properties is $85,540,000. The valuation dates range from November 1, 2021 to November 22, 2021.
Environmental Matters. According to the Phase I environmental site assessments of each individual property, with dates ranging from July 2, 2021 to November 29, 2021, there are two recognized environmental conditions at the Wallingford, CT property. The Phase I environmental site assessment states that (i) two 500-gallon containers of diesel exhaust fluid located in a storage shed were observed to indicate spillage, staining and stressed vegetation; and (ii) there are ongoing sampling and monitoring requirements associated with removal of approximately 40 tons of impacted soil following a 2019 leaking underground storage tank/ spill incident at the related property. The tenant is responsible under its lease for the required ongoing sampling and monitoring activities, and the loan documents include covenants requiring the borrower to use commercially reasonable efforts to satisfy its lease obligations.
The consultant provided a worst-case estimate with a statistical 90% confidence interval that the total cost for potential remediation had an upper-end range of $75,000. In lieu of a Phase II report, the Lender obtained a $375,000 environmental insurance policy with a $375,000 limit per claim on a 13-year term, which includes a $25,000 deductible per claim.
Market Overview and Competition. The GS Foods Portfolio Properties are located within metropolitan statistical areas of Kansas City, MO-KS (one property, 42.9% of the allocated loan amount), New Haven-Milford (one property, 25.4% of the allocated loan amount), St. Louis, MO - IL (one property, 16.2% of the allocated loan amount), Hammond (one property, 8.5% of the allocated loan amount), and Lima, OH (two properties, 6.9% of the allocated loan amount).
THE INFORMATION IN THIS STRUCTURAL AND COLLATERAL TERM SHEET IS NOT COMPLETE AND MAY BE AMENDED PRIOR TO THE TIME OF SALE. THIS TERM SHEET IS NOT AN OFFER TO SELL THESE SECURITIES AND IT IS NOT A SOLICITATION OF AN OFFER TO BUY THESE SECURITIES IN ANY JURISDICTION WHERE THE OFFER OR SALE IS NOT PERMITTED.
128
| Industrial – Various | Loan #9 | Cut-off Date Balance: | | $40,000,000 |
| Property Addresses - Various | GS Foods Portfolio | Cut-off Date LTV: | | 67.2% |
| Various, Various | | U/W NCF DSCR: | | 1.45x |
| | | U/W NOI Debt Yield: | | 8.6% |
The following table presents certain local demographic data related to the GS Foods Portfolio Properties:
| Property Name – Location | 2021 Population
(within 1-mi. / 3-mi. / 5-mi. Radius) | 2021 Average Household Income
(within 1-mi. / 3-mi. / 5-mi. Radius) |
| Kansas City, MO – 1100 Atlantic Street | 118 / 57,986 / 201,204 | $57,367 / $60,833 / $56,667 |
| Wallingford, CT – 30 Thurston Drive | 1,966 / 44,252 / 106,670 | $128,365 / $96,199 / $90,812 |
| Wright City, MO – 401 East South 1st Street | 1,163 / 6,110 / 11,865 | $70,213 / $97,783 / $98,011 |
| Ponchatoula, LA – 101 Industrial Park Boulevard | 3,364 / 15,009 / 35,231 | $62,758 / $68,926 / $71,883 |
| 319 St. Mary’s, OH – 319 South Park Drive(1) | 1,346 / 10,725 / 14,865 | $58,919 / $70,194 / $75,042 |
| 310 St. Mary’s, OH – 310 South Park Drive(1) | 1,346 / 10,725 / 14,865 | $58,919 / $70,194 / $75,042 |
| (1) | The population and household income statistics presented are as-of 2018, which is the latest information available for the respective submarkets. |
The following table presents certain information relating to the appraiser’s market rent conclusion for the GS Foods Portfolio Properties:
Market Rent Summary(1)
| | Market Rent (PSF) | Lease Term (Years) | Concessions | Lease Type (Reim- bursements) | Rent Increase Projection | Tenant Improvements (New Tenants) (PSF) | Tenant Improvements (Renewals) (PSF) |
| Kansas City, MO – 1100 Atlantic Street | $7.00 | 10.2 | 2 mos. | NNN | 2.0% per annum | $2.00 | $0.50 |
| | | | | | | | |
| Wallingford, CT – 30 Thurston Drive | $9.50 | 10 | 0 mos. | NNN | 2.0% per annum | $1.00 | $0.25 |
| | | | | | | | |
| Wright City, MO – 401 East South 1st Street | $9.25 | 10 | 2 mos. | NNN | 2.0% per annum | $2.00 | $0.50 |
| | | | | | | | |
| Ponchatoula, LA – 101 Industrial Park Boulevard | $6.75 | 10 | 0 mos. | Absolute Net | 2.0% each two years | $1.00 | $0.50 |
| | | | | | | | |
| 319 St. Mary’s, OH – 319 South Park Drive | $6.75 | 10 | 0 mos. | NNN | 2.0% per annum | $1.00 | $0.25 |
| 310 St. Mary’s, OH – 310 South Park Drive | $7.25 | 10 | 0 mos. | NNN | 2.0% per annum | $1.00 | $0.25 |
| (1) | Information obtained from the appraisals. |
Escrows.
Real Estate Taxes – Ongoing monthly reserves for real estate taxes are not required as long as (A)(i) no event of default has occurred and is continuing; (ii) the current leases are in full force and effect, (iii) GS foods pays all applicable taxes required under leases, and (iv) GS Foods delivers evidence of tax payments, or (B)(i) no event of default shall has occurred and is continuing; (ii) the GS Foods Portfolio Borrower pays all taxes to appropriate governmental authority and provided evidence to lender thereof.
Insurance – Ongoing monthly reserves for insurance are not required as long as (A)(i) no event of default has occurred and is continuing; (ii) the policies maintained by the GS Foods Portfolio Borrower are part of a blanket or umbrella policy approved by the lender in its reasonable discretion, including, without limitation, approval of the schedule of locations and values and (iii) the GS Foods Portfolio Borrower provides the lender with paid receipts for the payment of the insurance premiums by no later than 10 business days prior to the expiration dates; or (B)(1) the major tenant lease is in full force and effect; (2) no event of default has occurred and is continuing; (3) tenants maintain all policies in full force and effect; and (4) the lender receives evidence reasonably satisfactory that all insurance premiums have been timely paid together with the evidence of renewals of such policies.
Replacement Reserves – Ongoing monthly reserves for replacements are not required as long as (A) no Cash Trap Event Period exists and the major tenant is required under its lease to pay and perform the obligations and liabilities for which the replacement reserve subaccount was established, or (B) a Cash Trap Event Period exists and the GS Foods Portfolio Borrower is maintaining the property in accordance with the terms and provisions of the major tenant lease.
THE INFORMATION IN THIS STRUCTURAL AND COLLATERAL TERM SHEET IS NOT COMPLETE AND MAY BE AMENDED PRIOR TO THE TIME OF SALE. THIS TERM SHEET IS NOT AN OFFER TO SELL THESE SECURITIES AND IT IS NOT A SOLICITATION OF AN OFFER TO BUY THESE SECURITIES IN ANY JURISDICTION WHERE THE OFFER OR SALE IS NOT PERMITTED.
129
| Industrial – Various | Loan #9 | Cut-off Date Balance: | | $40,000,000 |
| Property Addresses - Various | GS Foods Portfolio | Cut-off Date LTV: | | 67.2% |
| Various, Various | | U/W NCF DSCR: | | 1.45x |
| | | U/W NOI Debt Yield: | | 8.6% |
Lockbox and Cash Management. The GS Foods Portfolio Whole Loan is structured with a hard lockbox and springing cash management. The GS Foods Portfolio Borrower is required to direct the tenant to pay rent directly into a deposit account, and to deposit any rents otherwise received in such account within two business day after receipt. If no Cash Trap Event Period exists, all excess cash flow will be disbursed to, or at the written direction, of the GS Foods Portfolio Borrower. During
the continuance of a Cash Trap Event Period, all funds in the cash management account will be applied according to the cash management agreement, and excess cash flow will be held by the lender as additional collateral.
A “Cash Trap Event Period” will commence upon the earliest of the following:
| (i) | the occurrence of an event of default under the loan documents; |
| (ii) | the major tenant vacates, fails to occupy or ceases normal business operations at the property; |
| (iii) | the major tenant becomes a debtor in a bankruptcy, insolvency or similar proceeding or action; |
| (iv) | the major tenant lease is terminated as a result of default beyond any applicable notice and cure period; and |
| (v) | the debt service coverage ratio being less than 1.20x (tested quarterly). |
A Cash Trap Event Period will end upon the occurrence of the following:
| ● | with regard to clause (i), the cure of such event of default; |
| ● | with regard to clause (ii), either (a) the major tenant recommences operations at the property, (b) balance of funds in the excess cash flow account is equal to two years of base rent and recoveries for the property (“Major Tenant Cash Trap Cure”), or (c) the GS Foods Portfolio Borrower deposits a letter of credit equal to the Major Tenant Cash Trap Cure; |
| ● | with regard to clause (iii), either (a) the bankruptcy action has been dismissed or discharged, (b) the major tenant has assumed the lease in full in such proceeding and the bankruptcy trustee has approved the assumption, or (c) the GS Foods Portfolio Borrower has entered into eligible replacement leases; |
| ● | with regard to clause (iv), either (a) the major tenant has cured such event of default and the GS Foods Portfolio Borrower has rescinded the termination or (b) the GS Foods Portfolio Borrower has entered into eligible replacement leases; and |
| ● | with regard to clause (v), upon the date that the debt service coverage ratio is at least 1.25x for one calendar quarter. |
Partial Release. Provided no event of default has occurred or is continuing, the GS Foods Portfolio Borrower has the right, at any time after the lockout release date, to sell one or more of the GS Foods Portfolio Properties, provided that certain conditions are satisfied, including, but not limited to, the following:
| (i) | Payment of a release price in an amount equal to 110% of the allocated loan amount of the property being released; |
| (ii) | the loan-to-value of the remaining properties is no greater than lesser of (a) the loan to value as of December 22, 2021 (67.2%) and (b) the loan-to-value immediately prior to the release; |
| (iii) | the net cash flow debt service coverage ratio immediately following the release is at least equal to the greater of (a) the net cash flow debt service coverage ratio as of December 27, 2021 (1.45x) and (b) the net cash flow debt service coverage ratio immediately prior to the release; and |
| (iv) | the net cash flow debt yield immediately following the release is no less than the greater of (a) the net cash flow debt yield as of December 27, 2021 (8.1%) and (b) the net cash flow debt yield immediately prior to the release. |
Property Management. The GS Foods Portfolio Properties are self-managed by the tenants.
Real Estate Substitution. Not permitted.
Subordinate and Mezzanine Indebtedness. Provided no event of default, the GS Foods Portfolio Borrower may obtain future mezzanine debt upon satisfaction of certain conditions defined in the loan agreement, including, but not limited to: (i) the LTV including the future mezzanine loan is not greater than 65.01%; (ii) the adjusted net cash flow DSCR, inclusive of the future mezzanine loan is no less than 1.25x, and; (iii) the adjusted net cash flow debt yield, inclusive of the future mezzanine loan is not less than 8.0%.
Ground Lease. None.
Terrorism Insurance. The GS Foods Portfolio Whole Loan documents require that the “all risk” insurance policy required to be maintained by the GS Foods Portfolio Borrower provides coverage for terrorism in an amount equal to the full replacement cost of the GS Foods Portfolio Properties, as well as business interruption insurance covering no less than the 18-month period following the occurrence of a casualty event (or a 12-month period for an individual property), together with a 6-month extended period of indemnity (provided that if TRIPRA or a similar statute is not in effect, the borrowers will not be obligated to pay terrorism insurance premiums in excess of two times the annual premium for the casualty and business interruption coverage (without giving effect to the cost of terrorism, flood and earthquake and business interruption components of such coverage)).
THE INFORMATION IN THIS STRUCTURAL AND COLLATERAL TERM SHEET IS NOT COMPLETE AND MAY BE AMENDED PRIOR TO THE TIME OF SALE. THIS TERM SHEET IS NOT AN OFFER TO SELL THESE SECURITIES AND IT IS NOT A SOLICITATION OF AN OFFER TO BUY THESE SECURITIES IN ANY JURISDICTION WHERE THE OFFER OR SALE IS NOT PERMITTED.
130
(THIS PAGE INTENTIONALLY LEFT BLANK)
| Multifamily – Mid Rise | Loan #10 | Cut-off Date Balance: | | $28,500,000 |
| 2 Ash Street | The Ashton | Cut-off Date LTV: | | 59.0% |
| Jersey City, NJ 07304 | | UW NCF DSCR: | | 1.54x |
| | | UW NOI Debt Yield: | | 6.2% |
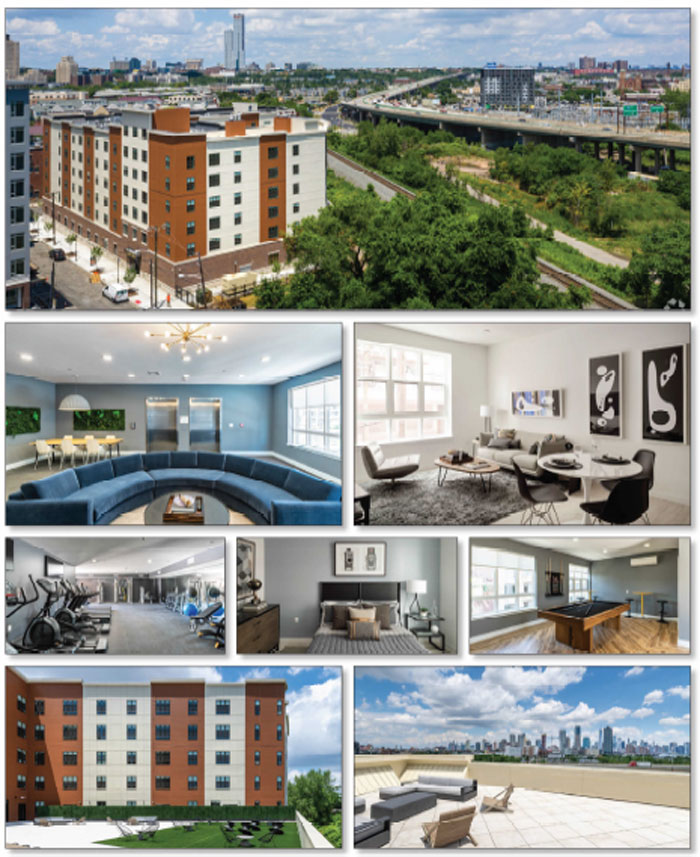
THE INFORMATION IN THIS STRUCTURAL AND COLLATERAL TERM SHEET IS NOT COMPLETE AND MAY BE AMENDED PRIOR TO THE TIME OF SALE. THIS TERM SHEET IS NOT AN OFFER TO SELL THESE SECURITIES AND IT IS NOT A SOLICITATION OF AN OFFER TO BUY THESE SECURITIES IN ANY JURISDICTION WHERE THE OFFER OR SALE IS NOT PERMITTED.
132
| Multifamily – Mid Rise | Loan #10 | Cut-off Date Balance: | | $28,500,000 |
| 2 Ash Street | The Ashton | Cut-off Date LTV: | | 59.0% |
| Jersey City, NJ 07304 | | UW NCF DSCR: | | 1.54x |
| | | UW NOI Debt Yield: | | 6.2% |
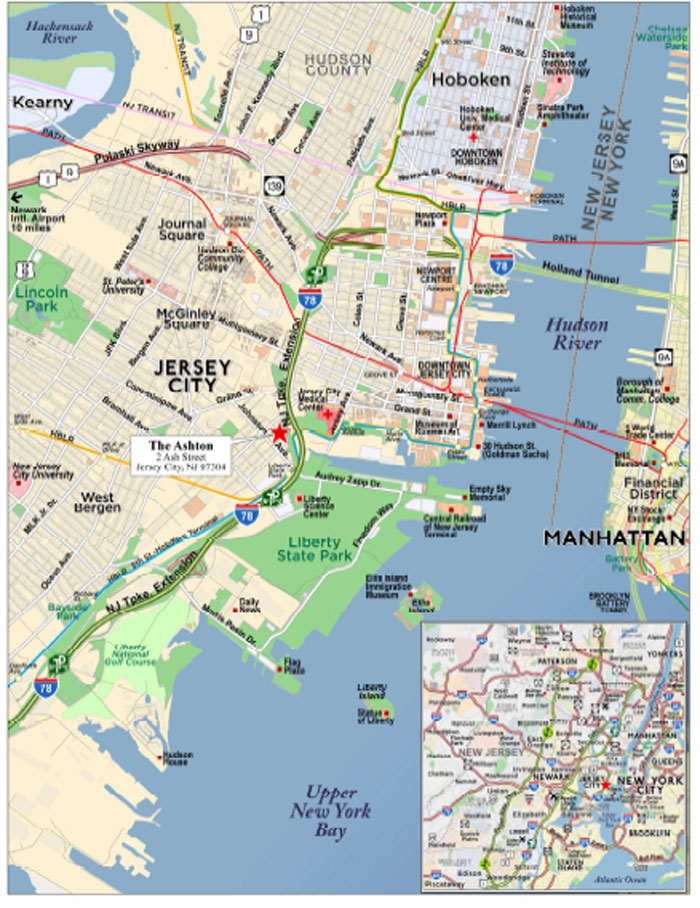
THE INFORMATION IN THIS STRUCTURAL AND COLLATERAL TERM SHEET IS NOT COMPLETE AND MAY BE AMENDED PRIOR TO THE TIME OF SALE. THIS TERM SHEET IS NOT AN OFFER TO SELL THESE SECURITIES AND IT IS NOT A SOLICITATION OF AN OFFER TO BUY THESE SECURITIES IN ANY JURISDICTION WHERE THE OFFER OR SALE IS NOT PERMITTED.
133
| No. 10 – The Ashton |
| |
| Mortgage Loan Information | | Mortgaged Property Information(2) |
| Mortgage Loan Seller: | Morgan Stanley Mortgage Capital Holdings LLC | | Single Asset/Portfolio: | Single Asset |
| Credit Assessment (Fitch/KBRA/S&P): | NR/NR/NR | | Property Type – Subtype: | Multifamily – Mid Rise |
| Original Principal Balance: | $28,500,000 | | Location: | Jersey City, NJ |
| Cut-off Date Balance: | $28,500,000 | | Size: | 93 Units |
| % of Initial Pool Balance: | 2.4% | | Cut-off Date Balance Per Unit: | $306,452 |
| Loan Purpose: | Refinance | | Maturity Date Balance Per Unit: | $306,452 |
| Borrower Sponsor: | Normandy Opportunity Zone | | Year Built/Renovated: | 2020/NAP |
| | Fund, LP | | Title Vesting: | Fee Simple |
| Guarantor: | Normandy Opportunity Zone | | Property Manager: | Skylight Real Estate |
| | Fund, LP | | | Partners LLC |
| Mortgage Rate: | 3.9300% | | Current Occupancy (As of): | 95.7% (1/19/2022) |
| Note Date: | February 7, 2022 | | YE 2020 Occupancy: | 66.1% |
| Seasoning: | 0 months | | YE 2019 Occupancy(2): | NAP |
| Maturity Date: | March 1, 2032 | | YE 2018 Occupancy(2): | NAP |
| IO Period: | 120 months | | YE 2017 Occupancy(2): | NAP |
| Loan Term (Original): | 120 months | | As-Is Appraised Value: | $48,300,000 |
| Amortization Term (Original): | NAP | | As-Is Appraised Value Per Unit: | $519,355 |
| Loan Amortization Type: | Interest Only | | As-Is Appraisal Valuation Date: | October 14, 2021 |
| Call Protection: | L(24),D(91),O(5) | | Underwriting and Financial Information(2) |
| Lockbox Type: | Soft/Springing Cash Management | | YE 2021 NOI: | $1,532,487 |
| Additional Debt: | None | | YE 2020 NOI(2): | NAP |
| Additional Debt Type (Balance): | NAP | | YE 2019 NOI(2): | NAP |
| | | | YE 2018 NOI(2): | NAP |
| | | | U/W Revenues: | $2,756,294 |
| | | | U/W Expenses: | $982,573 |
| Escrows and Reserves(1) | | U/W NOI: | $1,773,721 |
| | Initial | Monthly | Cap | | U/W NCF: | $1,750,471 |
| Taxes: | $0 | $33,438 | NAP | | U/W DSCR based on NOI/NCF: | 1.56x / 1.54x |
| Insurance: | $1,218 | $203 | NAP | | U/W Debt Yield based on NOI/NCF: | 6.2% / 6.1% |
| Cap Ex: | $0 | $1,938 | $116,250 | | U/W Debt Yield at Maturity based on NOI/NCF: | 6.2% / 6.1% |
| | | | | | Cut-off Date LTV Ratio: | 59.0% |
| | | | | | LTV Ratio at Maturity: | 59.0% |
| | | | | | | |
| Sources and Uses |
| Sources | | | | Uses | | |
| Loan Amount | $28,500,000 | 100.0% | | Loan Payoff | $26,604,700 | 93.3% |
| | | | | Return of Equity | 1,145,327 | 4.0 |
| | | | | Closing Costs | 748,755 | 2.6 |
| | | | | Reserves | 1,218 | 0.0 |
| Total Sources | $28,500,000 | 100.0% | | Total Uses | $28,500,000 | 100.0% |
| (1) | See “Escrows” below for further discussion of reserve requirements. |
| (2) | Occupancy information prior to YE 2020 and historical financial information prior to YE 2021 is not available as The Ashton Property (as defined below) was constructed in 2020. |
| (3) | The novel coronavirus pandemic is an evolving situation and could impact The Ashton Mortgage Loan (as defined below) more severely than assumed in the underwriting of The Ashton Mortgage Loan and could adversely affect the NOI, NCF and occupancy information, as well as the appraised value and the DSCR, LTV and Debt Yield metrics presented above and herein. See "Risk Factors—Risks Related to Market Conditions and Other External Factors—The Coronavirus Pandemic Has Adversely Affected the Global Economy and Will Likely Adversely Affect the Performance of the Mortgage Loans" in the prospectus. |
The Mortgage Loan. The mortgage loan (“The Ashton Mortgage Loan”) is evidenced by a promissory note in the original principal amount of $28,500,000. The Ashton Mortgage Loan is secured by a first priority fee mortgage encumbering a multifamily property located in Jersey City, New Jersey (“The Ashton Property”).
The Borrower and the Borrower Sponsor. The borrower is Ash Urban Renewal Development, LLC, a single-purpose New Jersey limited liability company with one independent director in its organizational structure. The borrower sponsor and non-recourse carveout guarantor is Normandy Opportunity Zone Fund, LP. The borrower is indirectly owned by Normandy Opportunity Zone Fund, LP (99%) and Normandy Opportunity Zone Fund GP, LLC (1%), and ultimately owned by Columbia Property Trust, Inc. (2%) and individual investors (98%). As of December 31, 2020, Columbia Property Trust, Inc. ("Columbia") owned 15 operating properties and 4 properties under development or redevelopment totaling 6.2 million square feet with an aggregate occupancy of 95.6%. Columbia also provides asset and property management services for 8 million square feet of office space located primarily in its core markets of New York, San Francisco, Washington D.C., and Boston. Columbia acquired Normandy Real Estate Management, LLC, a developer, operator and
THE INFORMATION IN THIS STRUCTURAL AND COLLATERAL TERM SHEET IS NOT COMPLETE AND MAY BE AMENDED PRIOR TO THE TIME OF SALE. THIS TERM SHEET IS NOT AN OFFER TO SELL THESE SECURITIES AND IT IS NOT A SOLICITATION OF AN OFFER TO BUY THESE SECURITIES IN ANY JURISDICTION WHERE THE OFFER OR SALE IS NOT PERMITTED.
134
| Multifamily – Mid Rise | Loan #10 | Cut-off Date Balance: | | $28,500,000 |
| 2 Ash Street | The Ashton | Cut-off Date LTV: | | 59.0% |
| Jersey City, NJ 07304 | | UW NCF DSCR: | | 1.54x |
| | | UW NOI Debt Yield: | | 6.2% |
investment manager of office and mixed-use assets in New York, Boston, and Washington, D.C. in 2020. See “Description of the Mortgage Pool–Loan Purpose; Default History, Bankruptcy Issues and Other Proceedings” in the preliminary prospectus.
The Property. The Ashton Property is comprised of the borrower’s fee simple interest in a multifamily property comprised of 93 market rate apartments within a 6-story luxury residential tower. The Ashton Property offers its residents an amenity package including an 8,000 square foot deck with fire pits and lounge seating, a 3,000 square foot rooftop terrace with views of Manhattan, a rooftop billiard room, a fitness center, bike storage, and a resident lounge with co-working space. The Ashton Property also includes 64 covered parking spaces located in a concrete parking garage on the ground floor of the building. The Ashton Property was developed in 2020 and as of January 19, 2022 is 95.7% occupied. The occupied units at The Ashton Property have an average contract rent of $2,688 per unit per month. The apartment unit mix is comprised of one- and two-bedroom units ranging in average size from 712 – 994 square feet with an average of 893 square feet.
The Ashton Property was developed pursuant to a financial agreement between the original developer and Jersey City New Jersey, (the “Ashton PILOT Agreement”) pursuant to which the original developer agreed to remediate the site and construct The Ashton Property, and in exchange The Ashton Property received a payment in lieu of taxes (“PILOT”) tax exemption. The borrower sponsor acquired The Ashton Property pursuant to a transfer of equity interests in the borrower from the original developer in December 2019 prior to the issuance of the temporary certificate of occupancy, for a purchase price of $36,500,000.
PILOT. The Ashton Property benefits from a 20-year PILOT program in place through May 2040. Pursuant to such program, the borrower is required to pay, in lieu of taxes on the improvements, an annual service charge equal to the greater of (i) 13.0% of revenues generated by The Ashton Property and (ii) a percentage of market real estate taxes. The percentage of market taxes is 0% for the first 6 years of the exemption (which commenced in June 2020), 20% for years 7 to 9, 40% for years 10 to 12, 60% for years 13 to 16, and 80% for the remaining years of the exemption. In addition, the borrower is required to pay land tax equal to the amount of taxes assessed on the value of the land on which The Ashton Property is located as determined by the tax assessor and the tax collector; however, the borrower is entitled to a credit for such land tax paid in the last four preceding quarterly installments against the annual service charge. In addition, there is a 2.0% administrative fee on the annual service charge. The annual service charge and the land tax are required to be paid in quarterly installments on those dates when real estate tax payments would be due. The administrative fee is due on or before December 31st of each year. Based on the underwritten gross potential rent, total PILOT payments for 2022 are estimated at $365,485. Pursuant to the Ashton PILOT Agreement, such agreement, and the PILOT tax exemption, terminate upon a transfer of The Ashton Property, unless a municipal ordinance approving the transfer is enacted. Accordingly, if the lender were to take title to The Ashton Property, it would lose the benefit of the tax exemption, unless it were able to obtain the enactment of such an ordinance. Further, the lender would need to form an urban renewal company as required by New Jersey law in order to take title to The Ashton Property.
The table below shows the residential apartment unit mix at The Ashton Property:
Unit Mix(1)
| Unit Mix / Type | Total Units | Leased Units | % Leased | Average square feet per Unit | Monthly Average Rent per Unit | Monthly Average Rent per square foot |
| One Bedroom | 33 | 32 | 97.0% | 712 | $2,312 | $3.25 |
| One Bedroom with den | 4 | 4 | 100.0% | 976 | $2,828 | $2.90 |
| Two Bedroom | 56 | 53 | 94.6% | 994 | $2,905 | $2.92 |
| Total/Wtd. Avg. | 93 | 89 | 95.7% | 893 | $2,688 | $3.01 |
| (1) | Information based on the borrower rent roll dated January 19, 2022. |
THE INFORMATION IN THIS STRUCTURAL AND COLLATERAL TERM SHEET IS NOT COMPLETE AND MAY BE AMENDED PRIOR TO THE TIME OF SALE. THIS TERM SHEET IS NOT AN OFFER TO SELL THESE SECURITIES AND IT IS NOT A SOLICITATION OF AN OFFER TO BUY THESE SECURITIES IN ANY JURISDICTION WHERE THE OFFER OR SALE IS NOT PERMITTED.
135
| Multifamily – Mid Rise | Loan #10 | Cut-off Date Balance: | | $28,500,000 |
| 2 Ash Street | The Ashton | Cut-off Date LTV: | | 59.0% |
| Jersey City, NJ 07304 | | UW NCF DSCR: | | 1.54x |
| | | UW NOI Debt Yield: | | 6.2% |
Operating History and Underwritten Net Cash Flow. The following table presents certain information relating to the historical operating performance and underwritten net cash flow at The Ashton Property:
Cash Flow Analysis
| | | 2021(1) | | U/W | | %(2) | | U/W $ per unit |
| Gross Potential Rent(3) | | $2,993,480 | | $3,005,721 | | 95.1% | | $32,319.58 |
| Other Income(4) | | 159,529 | | 153,700 | | 4.9 | | 1,652.69 |
| Net Rental Income | | $3,153,009 | | $3,159,421 | | 100.0% | | $33,972.27 |
| Concessions | | -266,053 | | -297,927 | | -9.4 | | -3,203.52 |
| Less Vacancy & Credit Loss | | -344,097 | | -105,200 | | -3.5 | | -1,131.19 |
| Effective Gross Income | | $2,542,859 | | $2,756,294 | | 87.2% | | $29,637.57 |
| | | | | | | | | |
| Real Estate Taxes(5) | | 282,759 | | 365,485 | | 13.3 | | 3,929.94 |
| Insurance | | 98,342 | | 88,000 | | 3.2 | | 946.24 |
| Management Fee | | 75,175 | | 82,689 | | 3.0 | | 889.13 |
| Other Expenses | | 554,095 | | 446,399 | | 16.2 | | 4,799.99 |
| Total Operating Expenses | | $1,010,372 | | $982,573 | | 35.6% | | $10,565.30 |
| | | | | | | | | |
| Net Operating Income(6) | | $1,532,487 | | $1,773,721 | | 64.4% | | $19,072.27 |
| Capital Expenditures | | 0 | | 23,250 | | 0.8 | | 250.00 |
| Net Cash Flow | | $1,532,487 | | $1,750,471 | | 63.5% | | $18,822.27 |
| | | | | | | | | |
| NOI DSCR | | 1.35x | | 1.56x | | | | |
| NCF DSCR | | 1.35x | | 1.54x | | | | |
| NOI Debt Yield | | 5.4% | | 6.2% | | | | |
| NCF Debt Yield | | 5.4% | | 6.1% | | | | |
| (1) | Historical financial information prior to 2021 is not available as The Ashton Property was constructed in 2020. |
| (2) | Represents (i) percent of Net Rental Income for all revenue fields, (ii) percent of Gross Potential Rent for Vacancy & Credit Loss and (iii) percent of Effective Gross Income for all other fields. |
| (3) | UW Gross Potential Rent is based on the borrower rent roll dated January 19, 2022. |
| (4) | Other Income is primarily comprised of garage/carport fees, but also includes pet premiums, amenity fees, application fees, late fees, lease cancellation fees and other miscellaneous income. |
| (5) | The borrower is required to make payments in lieu of real estate taxes as described above under “PILOT”. The Ashton Mortgage Loan was underwritten based on the PILOT payments during the first year of the loan term. |
| (6) | The increase in Net Operating Income from 2021 to U/W is a result of the initial lease up of The Ashton Property since being built in 2020. During the initial lease-up of The Ashton Property, the borrower was offering concessions ranging from 2 to 3 months of free rent depending on the lease term. The Ashton Mortgage Loan was underwritten based on the free rent concessions during the trailing three month period ended December 31, 2021, annualized, which equates to 10.8% of effective gross income. |
Appraisal. The appraisal concluded to an “as-is” appraised value as of October 14, 2021 of $48,300,000.
Environmental Matters. The Phase I environmental report dated November 9, 2021 identified one recognized environmental condition relating to the historical use of The Ashton Property for industrial purposes and the existence of soil and groundwater contamination and one controlled recognized environmental condition relating to historic fill contamination in groundwater beneath The Ashton Property. See “Description of the Mortgage Pool—Environmental Considerations” in the prospectus.
Market Overview and Competition. The Ashton Property is located in Jersey City, New Jersey in the Greater Hudson County multifamily submarket in the New York multifamily market. The Ashton Property lies in the eastern corner of the Bergen-Lafayette section of Jersey City, one block north of the Liberty State Park Light Rail Station. Jersey City is bounded on the east by the Hudson River and Upper New York Bay and on the west by the Hackensack River and Newark Bay. A port of entry, with 11 miles of waterfront and significant rail connections, the city is an important transportation terminus and distribution and manufacturing center for the Port of New York and New Jersey. Financial and service industries as well as direct rapid transit access to Manhattan in New York City have played a role in the redevelopment of the Jersey City waterfront. Major employers in the area include the United States Postal Service, UBS Financial Services, John Wiley & Sons Inc, and Goldman Sachs. According to the appraisal, as of the second quarter of 2021, the vacancy rate in the Greater Hudson County multifamily submarket was approximately 10.0%, with average asking rents of $2,061 per unit and inventory of approximately 27,566 units. According to the appraisal, as of the second quarter of 2021, the vacancy rate in the New York multifamily market was approximately 3.3%, with average asking rents of $2,787 per unit and inventory of approximately 1.43 million units.
THE INFORMATION IN THIS STRUCTURAL AND COLLATERAL TERM SHEET IS NOT COMPLETE AND MAY BE AMENDED PRIOR TO THE TIME OF SALE. THIS TERM SHEET IS NOT AN OFFER TO SELL THESE SECURITIES AND IT IS NOT A SOLICITATION OF AN OFFER TO BUY THESE SECURITIES IN ANY JURISDICTION WHERE THE OFFER OR SALE IS NOT PERMITTED.
136
| Multifamily – Mid Rise | Loan #10 | Cut-off Date Balance: | | $28,500,000 |
| 2 Ash Street | The Ashton | Cut-off Date LTV: | | 59.0% |
| Jersey City, NJ 07304 | | UW NCF DSCR: | | 1.54x |
| | | UW NOI Debt Yield: | | 6.2% |
The following table presents certain information relating to the appraisal’s market rent conclusion for The Ashton Property:
Market Rent Summary
| Market Rent Summary |
| Unit Mix / Type | Units(1) | Average Unit Size
(square feet) (1) | Avg. Monthly
Rent per Unit(1) | Avg. Monthly
Rent per square feet(1) | Avg. Monthly
Market Rent per Unit(2) | Avg. Monthly
Market Rent per
square feet(2) |
| One Bedroom | 33 | 712 | $2,312 | $3.25 | $2,430 | $3.41 |
| One Bedroom with den | 4 | 976 | $2,828 | $2.90 | $2,800 | $2.87 |
| Two Bedroom | 56 | 994 | $2,905 | $2.92 | $2,925 | $2.94 |
| (1) | Based on the borrower rent roll dated January 19, 2022. |
| (2) | Based on the appraisal. |
The following table presents certain information relating to comparable multifamily rental properties to The Ashton Property:
Comparable Rental Properties
| Property | Year Built | #
Units | Unit Mix | Average square feet
per Unit | Average Monthly Rent
per Unit | Average Monthly Rent
per square feet |
The Ashton Property(1) Jersey City, NJ | 2020 | 93 | 1BR 1BR w/den 2BR | 712 976 994 | $2,312 $2,828 $2,905 | $3.25 $2.90 $2.92 |
Bela 74 Maple Street Jersey City, NJ | 2020 | 99 | 1BR 2BR | 900 1,200 | $2,562 $3,484 | $2.85 $2.90 |
295J 295 Johnston Avenue Jersey City, NJ | 2020 | 309 | Studio 1BR 2BR 3BR | 423 644 969 1,068 | $2,076 $2,366 $3,254 $3,910 | $4.91 $3.67 $3.36 $3.66 |
Solaris Lofts 65 Maple Street Jersey City, NJ | 2019 | 72 | Studio 1BR 2BR 3BR | 579 697 1,008 1,158 | $2,070 $2,231 $2,919 $3,773 | $3.58 $3.20 $2.90 $3.26 |
The Regent 30 Regent Street Jersey City, NJ | 2015 | 100 | Studio 1BR 2BR | 573 721 1,123 | $2,470 $2,964 $3,982 | $4.31 $4.11 $3.55 |
The Zenith 9 Regent Street Jersey City, NJ | 2008 | 128 | Studio 1BR 2BR 3BR | 449 736 844 1,163 | $2,185 $2,789 $3,429 $4,386 | $4.87 $3.79 $4.06 $3.77 |
| (1) | Based on the borrower rent roll dated January 19, 2022. |
Escrows.
Real Estate Taxes – The borrower is required to make ongoing monthly deposits into a reserve for real estate taxes in an amount equal to 1/12 of the real estate taxes that the lender estimates will be payable during the next twelve months for The Ashton Property (currently, $33,438).
Insurance –The borrower deposited $1,218 on the origination date into a reserve for insurance premiums, and the borrower is required to make ongoing monthly deposits into a reserve for insurance premiums in an amount equal to 1/12 of the insurance premiums that the lender estimates will be payable for the renewal of coverage upon the expiration of the insurance policies (currently, $203). Notwithstanding the foregoing, the borrower is not required to reserve for insurance premiums, provided that (i) no event of default is continuing under The Ashton Mortgage Loan, (ii) the liability and casualty insurance coverage for The Ashton Property is included in a blanket policy approved by the lender in its reasonable discretion, and (iii) the borrower provides the lender with paid receipts for payment of the insurance premiums and provides evidence of renewals of the insurance policies, no later than ten days prior to the expiration of the current policy.
Replacement Reserve –The borrower is required to make ongoing monthly deposits of approximately $1,938 into a capital expenditure reserve; provided that the borrower is not required to make any portion of such deposits which would cause the amount then on deposit in such reserve to exceed $116,250.
Lockbox and Cash Management. The Ashton Mortgage Loan is structured with a soft lockbox and springing cash management. The borrower is required to establish and maintain a lockbox account for the benefit of the lender, and the borrower and the property manager are required to deposit all rents received by them into the lockbox account within three business days of receipt. If no Cash Sweep Event Period (as defined below) exists, all funds in the lockbox account are required to be disbursed to the borrower’s operating account. Upon the first occurrence of a Cash Sweep Event Period, the lender is required to establish, and the borrower is required to cooperate with the cash management bank to establish, a lender-controlled cash management account, into which all funds in the
THE INFORMATION IN THIS STRUCTURAL AND COLLATERAL TERM SHEET IS NOT COMPLETE AND MAY BE AMENDED PRIOR TO THE TIME OF SALE. THIS TERM SHEET IS NOT AN OFFER TO SELL THESE SECURITIES AND IT IS NOT A SOLICITATION OF AN OFFER TO BUY THESE SECURITIES IN ANY JURISDICTION WHERE THE OFFER OR SALE IS NOT PERMITTED.
137
| Multifamily – Mid Rise | Loan #10 | Cut-off Date Balance: | | $28,500,000 |
| 2 Ash Street | The Ashton | Cut-off Date LTV: | | 59.0% |
| Jersey City, NJ 07304 | | UW NCF DSCR: | | 1.54x |
| | | UW NOI Debt Yield: | | 6.2% |
lockbox account will be required to be deposited, so long as the Cash Sweep Event Period is continuing, and applied on each monthly payment date, provided no event of default is continuing: (i) to make the monthly deposits into the real estate tax and insurance reserves, if any, as described above under “Escrows,” (ii) to pay debt service on The Ashton Mortgage Loan, (iii) to make the monthly deposit into the replacement reserve as described above under “Escrows,” (iv) to pay operating expenses set forth in the lender-approved annual budget and lender-approved extraordinary expenses and (v) to transfer any remainder into an excess cash flow reserve to be held as additional security for The Ashton Mortgage Loan during the continuance of such Cash Sweep Event Period.
“Cash Sweep Event Period” means a period (i) commencing upon an event of default under The Ashton Mortgage Loan documents and ending upon the cure, if applicable, of such event of default or (ii) commencing upon the debt service coverage ratio (assuming a 30 year amortization schedule) for The Ashton Mortgage Loan being less than 1.05x at the end of any calendar quarter and ending upon the debt service coverage ratio (assuming a 30 year amortization schedule) being at least 1.05x for the immediately preceding two consecutive calendar quarters.
Property Management. The Ashton Property is managed by Skylight Real Estate Partners LLC, a third-party property manager.
Partial Release. Not permitted.
Real Estate Substitution. Not permitted.
Subordinate and Mezzanine Indebtedness. Not permitted.
Letter of Credit. None.
Right of First Offer / Right of First Refusal. None.
Ground Lease. None
Terrorism Insurance. The borrower is required to obtain and maintain an “all risk” or “special form” property insurance policy that covers acts of terrorism in an amount equal to the “full replacement cost” of The Ashton Property, together with business income insurance covering the 18-month period commencing at the time of loss. Notwithstanding the foregoing, for so long as the Terrorism Risk Insurance Act of 2002, as extended and modified by the Terrorism Risk Insurance Program Reauthorization Act of 2015 (“TRIPRA”), is in effect (including any extensions thereof or if another federal governmental program is in effect relating to “acts of terrorism” which provides substantially similar protections as TRIPRA), the lender is required to accept terrorism insurance which covers against “covered acts” as defined by TRIPRA (or such other program) but only in the event that TRIPRA (or such other program) continues to cover both domestic and foreign acts of terrorism. See “Risk Factors—Risks Relating to the Mortgage Loans—Terrorism Insurance May Not Be Available for All Mortgaged Properties” in the prospectus.
THE INFORMATION IN THIS STRUCTURAL AND COLLATERAL TERM SHEET IS NOT COMPLETE AND MAY BE AMENDED PRIOR TO THE TIME OF SALE. THIS TERM SHEET IS NOT AN OFFER TO SELL THESE SECURITIES AND IT IS NOT A SOLICITATION OF AN OFFER TO BUY THESE SECURITIES IN ANY JURISDICTION WHERE THE OFFER OR SALE IS NOT PERMITTED.
138
(THIS PAGE INTENTIONALLY LEFT BLANK)
| No. 11 – Budget Store and Lock Self Storage Portfolio |
| |
| Mortgage Loan Information | | Mortgaged Property Information |
| Mortgage Loan Seller: | Bank of America, National Association | | Single Asset/Portfolio: | Portfolio |
Credit Assessment (Fitch/KBRA/S&P): | NR/NR/NR | | Property Type – Subtype: | Self Storage – Self Storage |
| Original Principal Balance: | $26,000,000 | | Location: | Various, PA |
| Cut-off Date Balance: | $26,000,000 | | Size: | 222,226 SF |
| % of Initial Pool Balance: | 2.2% | | Cut-off Date Balance Per SF: | $117.00 |
| Loan Purpose: | Refinance | | Maturity Date Balance Per SF: | $117.00 |
| Borrower Sponsors: | Michael R. Moyer and Joseph P. Mooney | | Year Built/Renovated: | Various / NAP |
| Guarantors: | Michael R. Moyer and Joseph P. Mooney | | Title Vesting: | Fee |
| Mortgage Rate: | 3.7170% | | Property Manager: | Self-managed |
| Note Date: | February 9, 2022 | | Current Occupancy (As of)(2): | 94.0% (1/31/2022) |
| Seasoning: | 0 months | | YE 2021 Occupancy(2): | 95.5% |
| Maturity Date: | March 1, 2032 | | YE 2020 Occupancy(2): | 81.1% |
| IO Period: | 120 months | | YE 2019 Occupancy(2): | 75.4% |
| Loan Term (Original): | 120 months | | YE 2018 Occupancy(2): | NAV |
| Amortization Term (Original): | NAP | | As-Is Appraised Value(3)(4): | $46,570,000 |
| Loan Amortization Type: | Interest Only | | As-Is Appraised Value Per SF(3): | $209.56 |
| Call Protection: | L(24),D(92),O(4) | | As-Is Appraisal Valuation Date: | December 28, 2021 |
| Lockbox Type: | Springing | | Underwriting and Financial Information(4) |
| Additional Debt: | None | | TTM NOI (1/31/2022): | $2,246,457 |
| Additional Debt Type (Balance): | NAP | | YE 2021 NOI: | $2,214,413 |
| | | | YE 2020 NOI: | $1,617,875 |
| | | | YE 2019 NOI: | $1,459,880 |
| | | | U/W Revenues: | $2,909,060 |
| | | U/W Expenses: | $639,991 |
| | | | | | U/W NOI: | $2,269,069 |
| Escrows and Reserves | | U/W NCF: | $2,235,735 |
| | Initial | Monthly | Cap | | U/W DSCR based on NOI/NCF: | 2.32x / 2.28x |
| Taxes | $167,773 | $22,073 | NAP | | U/W Debt Yield based on NOI/NCF: | 8.7% / 8.6% |
| Insurance | $6,652 | $3,326 | NAP | | U/W Debt Yield at Maturity based on NOI/NCF: | 8.7% / 8.6% |
| Replacement Reserves | $225,000 | $2,778 | $275,000 | | Cut-off Date LTV Ratio(3): | 55.8% |
| Environmental Reserve(1) | $8,000 | $0 | NAP | | LTV Ratio at Maturity(3): | 55.8% |
| | | | | | | | |
| Sources and Uses |
| Sources | | | | | Uses | | | |
| Loan Amount | $26,000,000 | | 100.0% | | Loan Payoff | $11,761,071 | | 45.2% |
| | | | | | Return of Equity | 13,015,532 | | 50.1 |
| | | | | | Closing costs | 815,972 | | 3.1 |
| | | | | | Upfront reserves | 407,425 | | 1.6 |
| Total Sources | $26,000,000 | | 100.0% | | Total Uses | $26,000,000 | | 100.0% |
| | | | | | | | | | |
| (1) | The Phase I recommended baseline testing of the water quality at the BS&L Schantz Road Property (as defined below) to determine if engineering controls (filtration, chlorination) are needed. The worst-case cost to test and provide engineering controls, if necessary, is $5,000. The Phase I also recommended radon testing to determine if radon levels exceed the regulatory agency action level. The worst-case cost to complete radon testing and to mitigate radon, if necessary, is $3,000. A total of $8,000 was reserved at closing for the water and radon testing and any potential mitigation |
| (2) | See “Historical Occupancy” section below for property-level occupancy statistics. The BS&L Oakview 2 Property (as defined below) was developed by the sponsor in June 2019 and the BS&L Glover Road Property (as defined below) was acquired by the sponsor in April 2019. |
| (3) | The Appraised Value shown reflects a “Bulk Portfolio Value” of $46,570,000. The Cut-off Date LTV Ratio and LTV Ratio at Maturity Date assuming the aggregate as-is values of the individual properties of $42,130,000 are 61.7% and 61.7% respectively. The As-Is Appraised Value Per SF assuming the aggregate as-is values is $189.58 PSF. |
| (4) | The novel coronavirus pandemic is an evolving situation and could impact the Budget Store and Lock Self Storage Portfolio Mortgage Loan (defined below) more severely than assumed in the underwriting of the Budget Store and Lock Self Storage Portfolio Mortgage Loan and could adversely affect the NOI, NCF and occupancy information, as well as the appraised value and the DSCR, LTV and Debt Yield metrics presented above. See “Risk Factors—Risks Related to Market Conditions and Other External Factors—Coronavirus Pandemic Has Adversely Affected the Global Economy and Will Likely Adversely Affect the Performance of the Mortgage Loans” in the Preliminary Prospectus. |
The Mortgage Loan. The mortgage loan (the “Budget Store and Lock Self Storage Portfolio Mortgage Loan”) is evidenced by a single promissory note secured by the fee interests in four self storage properties located in Bethlehem, Allentown, and Easton, Pennsylvania (the “Budget Store and Lock Self Storage Portfolio Properties”).
The Properties. The Budget Store and Lock Self Storage Portfolio Properties comprise four self storage properties built between 1982 and 2019. The Budget Store and Lock Self Storage Portfolio Properties are located within 40-miles of each other. As of January 31, 2022 the Budget Store and Lock Self Storage Portfolio Properties were 94.0% occupied with individual property occupancy rates ranging
THE INFORMATION IN THIS STRUCTURAL AND COLLATERAL TERM SHEET IS NOT COMPLETE AND MAY BE AMENDED PRIOR TO THE TIME OF SALE. THIS TERM SHEET IS NOT AN OFFER TO SELL THESE SECURITIES AND IT IS NOT A SOLICITATION OF AN OFFER TO BUY THESE SECURITIES IN ANY JURISDICTION WHERE THE OFFER OR SALE IS NOT PERMITTED.
140
| Self Storage – Self Storage | Loan #11 | Cut-off Date Balance: | | $26,000,000 |
| Property Addresses – Various | Budget Store and Lock Self Storage Portfolio | Cut-off Date LTV: | | 55.8% |
| Various, PA | | U/W NCF DSCR: | | 2.28x |
| | | U/W NOI Debt Yield: | | 8.7% |
from 91.3% to 95.5%. The Budget Store and Lock Self Storage Portfolio Properties comprise 222,226 square feet of rentable area, consisting of 1,873 rentable units, with an overall unit mix comprised of: (i) 1,469 non-climate-controlled self storage units (78.4% of total), (ii) 225 climate-controlled self storage units (12.0% of total), (iii) 170 uncovered parking spaces (9.1% of total), and 9 office suites (0.5% of total). The Budget Store and Lock Self Storage Portfolio Mortgage Loan documents do no permit property releases.
BS&L Industrial Drive
The BS&L Industrial Drive property (the “BS&L Industrial Drive Property”) is a 726-unit, 70,961 square-foot self storage facility located in Bethlehem, Pennsylvania. Constructed in 1982, 1983 and 1987, the improvements comprise 14 single-story buildings with a mix of interior climate-controlled units, exterior non-climate-controlled units, office suites, uncovered RV parking, an apartment unit and a leasing office. Amenities include surveillance cameras and on-site management. The borrower sponsors acquired the BS&L Industrial Drive Property in April 2010 and have invested approximately $261,000 in capital expenditures since acquisition. As of January 31, 2022, the BS&L Industrial Drive Property was 94.2% leased.
BS&L Schantz Road
The BS&L Schantz Road property (the “BS&L Schantz Road Property”) is a 651-unit, 60,900 square-foot self storage facility located in Allentown, Pennsylvania. Constructed in 1986, the improvements comprise seven single-story buildings with a mix of non-climate-controlled, drive-up units, uncovered RV parking, a leasing office and a two-bedroom apartment unit which is currently leased by a third-party tenant. Amenities include surveillance cameras, keypad entry, and on-site management. The borrower sponsors acquired the BS&L Schantz Road Property in April 2010 and have invested $209,000 in capital expenditures since acquisition. As of January 31, 2022, the BS&L Schantz Road Property was 95.5% leased.
BS&L Oakview 2
The BS&L Oakview 2 property (the “BS&L Oakview 2 Property”) is a 235-unit, 36,375 square-foot self storage facility located in Allentown, Pennsylvania. Constructed in 2019 by the borrower sponsors, the improvements comprise six single-story buildings with a mix of interior climate-controlled units, drive-up climate-controlled units, drive-up non-climate-controlled units, and uncovered RV spaces. Amenities include surveillance cameras and keypad entry. The borrower sponsors acquired the land in June 2018 and opened the BS&L Oakview 2 Property in June 2019. As of January 31, 2022, the BS&L Oakview 2 Property was 91.3% leased.
BS&L Glover Road
The BS&L Glover Road property (the “BS&L Glover Road Property”) is a 261-unit, 53,990 square-foot self storage facility located in Easton, Pennsylvania. Constructed in 2007, the improvements comprise three, single-story buildings and one, two-story building with a mix of non-climate controlled drive-up units, interior climate-controlled units, uncovered RV parking, a leasing office, and a two-bedroom apartment unit, which is currently leased to a third-party tenant. Amenities include surveillance cameras, keypad entry, and on-site management. The borrower sponsors acquired the BS&L Glover Road Property in April 2019 and rebranded to a ‘Budget Store & Lock’ branded facility. As of January 31, 2022, the BS&L Glover Road Property was 93.7% leased.
THE INFORMATION IN THIS STRUCTURAL AND COLLATERAL TERM SHEET IS NOT COMPLETE AND MAY BE AMENDED PRIOR TO THE TIME OF SALE. THIS TERM SHEET IS NOT AN OFFER TO SELL THESE SECURITIES AND IT IS NOT A SOLICITATION OF AN OFFER TO BUY THESE SECURITIES IN ANY JURISDICTION WHERE THE OFFER OR SALE IS NOT PERMITTED.
141
| Self Storage – Self Storage | Loan #11 | Cut-off Date Balance: | | $26,000,000 |
| Property Addresses – Various | Budget Store and Lock Self Storage Portfolio | Cut-off Date LTV: | | 55.8% |
| Various, PA | | U/W NCF DSCR: | | 2.28x |
| | | U/W NOI Debt Yield: | | 8.7% |
The following table presents certain information relating to the Budget Store and Lock Self Storage Portfolio Properties:
Property Information
| Property Name / Address | Appraised Value | % of Appraised Value(1) | U/W NCF | % Total U/W NCF |
BS&L Industrial Drive 2178 Industrial Drive Bethlehem, PA | $14,650,000 | 31.5% | $767,501 | 34.3% |
BS&L Schantz Road 299 Schantz Road Allentown, PA | 13,440,000 | 28.9 | 718,292 | 32.1 |
BS&L Oakview 2 5500 Oakview Drive Allentown, PA | 7,140,000 | 15.3 | 389,550 | 17.4 |
BS&L Glover Road 3515 Glover Road Easton, PA | 6,900,000 | 14.8 | 360,392 | 16.1 |
| Total/Weighted Average | $46,570,000(2) | 100.0% | $2,235,735 | 100.0% |
| (1) | % of Appraised Value is a percent of the Bulk Portfolio Value. |
| (2) | The Total Appraised Value shown is the “Bulk Portfolio Value” of $46,570,000. The aggregate as-is values is the individual properties of $42,130,000. |
The following table presents information with respect to the unit mix of the Budget Store and Lock Self Storage Portfolio Properties:
Unit Mix
| Property Name – Location | Year Built/ Renovated | Net Rentable Area (SF) | % NRA | Total # of Units | Climate Controlled Units | Non-Climate Controlled Units | Uncovered Parking Spaces | Current Occupancy (1/31/2022) |
| BS&L Industrial Drive - Bethlehem, PA | 1982, 1983 and 1987 / NAP | 70,961 | 31.9% | 726 | 40 | 657 | 20 | 94.2% |
| BS&L Schantz Road - Allentown, PA | 1986 / NAP | 60,900 | 27.4 | 651 | 0 | 614 | 37 | 95.5 |
| BS&L Oakview 2 - Allentown, PA | 2019 / NAP | 36,375 | 16.4 | 235 | 64 | 131 | 40 | 91.3 |
| BS&L Glover Road - Easton, PA | 2007 / NAP | 53,990 | 24.3 | 261 | 121 | 67 | 73 | 93.7 |
| Total/Weighted Average | | 222,226 | 100.0% | 1,873 | 225 | 1,469 | 170 | 94.0% |
The following table presents historical occupancy percentages at the Budget Store and Lock Self Storage Portfolio Properties:
Historical Occupancy
| Property | 2019(1)(2) | 2020(1)(2) | 2021(1)(2) | 1/31/2022(3) |
| BS&L Industrial Drive | 86.4% | 87.8% | 94.4% | 94.2% |
| BS&L Schantz Road | 86.0% | 90.7% | 96.1% | 95.5% |
| BS&L Oakview 2 | 29.2%(4) | 69.7% | 96.2% | 91.3% |
| BS&L Glover Road | 80.6%(5) | 69.1%(5) | 95.8% | 93.7% |
| (1) | Information obtained from the borrower. |
| (2) | Represents the occupancy as of year-end. |
| (3) | Information obtained from the borrower rent rolls as of 1/31/2022. |
| (4) | The borrower sponsors completed the development of the BS&L Oakview 2 Property in June 2019. |
| (5) | The borrower sponsors acquired the BS&L Glover Property in April 2019 and rebranded to a ‘Budget Store & Lock’ branded facility. |
Market Overview and Competition. The Budget Store and Lock Self Storage Portfolio Properties are located within the Allentown-Bethlehem-Easton, PA-NJ MSA. The MSA comprises the region known as the Lehigh Valley, and is comprised of four counties: Carbon, Lehigh, and Northampton in eastern Pennsylvania, and Warren County in western New Jersey. The largest city in Lehigh Valley is Allentown. As of December 2021, the unemployment rate for the MSA was 4.0%, compared to the unemployment rate for Pennsylvania of 5.4%. Principal employers are spread throughout diverse sectors, including healthcare/social assistance and wholesale/retail trade.
THE INFORMATION IN THIS STRUCTURAL AND COLLATERAL TERM SHEET IS NOT COMPLETE AND MAY BE AMENDED PRIOR TO THE TIME OF SALE. THIS TERM SHEET IS NOT AN OFFER TO SELL THESE SECURITIES AND IT IS NOT A SOLICITATION OF AN OFFER TO BUY THESE SECURITIES IN ANY JURISDICTION WHERE THE OFFER OR SALE IS NOT PERMITTED.
142
| Self Storage – Self Storage | Loan #11 | Cut-off Date Balance: | | $26,000,000 |
| Property Addresses – Various | Budget Store and Lock Self Storage Portfolio | Cut-off Date LTV: | | 55.8% |
| Various, PA | | U/W NCF DSCR: | | 2.28x |
| | | U/W NOI Debt Yield: | | 8.7% |
The following table presents certain local demographic data provided in the appraisals related to the Budget Store and Lock Self Storage Portfolio Properties:
Demographics
| Property Name – Location | 2021 Population
(within 1-mi. / 3-mi. / 5-mi.
Radius) | 2021 Average Household Income (within 1-mi. / 3-mi. / 5-mi. Radius) |
| BS&L Industrial Drive – Bethlehem, PA | 7,438 / 74,576 / 249,319 | $77,929 / $84,419 / $75,438 |
| BS&L Schantz Road – Allentown, PA | 5,945 / 58,791 / 191,001 | $121,313 / $128,923 / $96,025 |
| BS&L Oakview 2 – Allentown, PA | 7,329 / 38,110 / 105,702 | $144,980 / $131,762 / $121,565 |
| BS&L Glover Road – Easton, PA | 1,848 / 24,901 / 103,380 | $150,883 / $128,799 / $95,832 |
The following table presents the market rent conclusions provided in the appraisals for the Budget Store and Lock Self Storage Portfolio Properties:
Market rent
| Property Name – Location | Current
Occupancy
(1/31/2022)(1) | Competitive
Set
Average
Occupancy
Rate | Monthly
Underwritten
Rent/Unit | Appraiser’s
Monthly
Market
Rent/Unit |
| BS&L Industrial Drive – Bethlehem, PA | 94.2% | 93.2% | $126 | $129 |
| BS&L Schantz Road – Allentown, PA | 95.5% | 92.0% | $117 | $124 |
| BS&L Oakview 2 – Allentown, PA | 91.3% | 92.0% | $172 | $191 |
| BS&L Glover Road – Easton, PA | 93.7% | 94.6% | $144 | $172 |
| (1) | Information obtained from the borrower rent rolls as of 1/31/2022. |
The following table presents certain information relating to comparable self storage properties for the BS&L Industrial Drive Property:
Competitive Set(1)
(BS&L Industrial Drive Property)
| | BS&L Industrial
Drive | Jetport Self
Storage | CubeSmart -
2001 | U-Haul -
Allentown | East Penn Self
Storage | Budget Mickley
Self -Storage |
Address
City, State | 2178 Industrial Drive
Bethlehem, PA | 3322 Airport Road
Bethlehem, PA | 2001 Union Blvd
Allentown, PA | 1428 East Livingston Street
Allentown, PA | 383 West Washington Street
Allentown, PA | 184 Mickey Road
Whitehall, PA |
| Year Built | 1982, 1983 and 1987 | 1990 | 1930 | 1921/1992 | 1950 | 1998 |
| Units | 726(2) | 290 | 450 | 940 | 300 | 356 |
| NRA | 70,961 SF(2) | 29,000 SF | 43,400 SF | 123,657 SF | 32280 SF | 44,800 SF |
| Occupancy | 94.2%(2) | 90.0% | 90.0% | 95.0% | 96.0% | 95.0% |
| Avg SF/Unit | 98(2) | 100 | 96 | 132 | 108 | 126 |
| Distance from Subject | - | 0.6 mi | 1.6 mi | 1.7 mi | 3.5 mi | 3.8 mi |
| (1) | Information obtained from the appraisal. |
| (2) | Information obtained from the borrower rent rolls as of 1/31/2022. |
THE INFORMATION IN THIS STRUCTURAL AND COLLATERAL TERM SHEET IS NOT COMPLETE AND MAY BE AMENDED PRIOR TO THE TIME OF SALE. THIS TERM SHEET IS NOT AN OFFER TO SELL THESE SECURITIES AND IT IS NOT A SOLICITATION OF AN OFFER TO BUY THESE SECURITIES IN ANY JURISDICTION WHERE THE OFFER OR SALE IS NOT PERMITTED.
143
| Self Storage – Self Storage | Loan #11 | Cut-off Date Balance: | | $26,000,000 |
| Property Addresses – Various | Budget Store and Lock Self Storage Portfolio | Cut-off Date LTV: | | 55.8% |
| Various, PA | | U/W NCF DSCR: | | 2.28x |
| | | U/W NOI Debt Yield: | | 8.7% |
The following table presents certain information relating to comparable self storage properties for the BS&L Schantz Road Property and the BS&L Oakview 2 Property:
Competitive Set(1)
(BS&L Schantz Road Property and BS&L Oakview 2 Property)
| | BS&L
Schantz
Road | BS&L
Oakview 2 | Budget Store
& Lock | Iron Run
Storage -
6749 | Simply Self
Storage –
1925 | East Penn Self
Storage | East Penn
Storage –
3801(3) | Trexlertown
Self Storage(4) |
Address
City, State | 299 Schantz Road
Allentown, PA | 5500 Oakview Drive
Allentown, PA | 832 Werley Road Allentown, PA | 6749 Ruppsville Road Allentown, PA | 1925 Route 309 Allentown, PA | 8235 Schantz Road Breinigsville, PA | 3801 Allen Street Emmaus, PA | 1455 Trexlertown Rd, Macungie, PA |
| Year Built | 1986 | 2019 | 2002 | 2005 | 1997 | 2007 | 1989 | 2003 |
| Units | 651(2) | 235(2) | 326 | 170 | 641 | 362 | 503 | 450 |
| NRA | 60,900 SF(2) | 36,375 SF(2) | 32,600 SF | 17,950 SF | 66,700 SF | 42,945 SF | 50,300 SF | 135,000 SF |
| Occupancy | 95.5%(2) | 91.3%(2) | 95.0% | 90.0% | 90.0% | 95.0% | 90.0% | 90.0% |
| Avg SF/Unit | 94(2) | 155(2) | 100 | 106 | 104 | 119 | 100 | 300 |
| Distance from BS&L Schantz Road Property | 1.5 mi | 2.6 mi | 2.9 mi | 4.1 mi | 3.9 mi | |
| Distance from BS&L Oakview 2 Property | 0.6 mi | 1.0 mi | 1.8 mi | 2.7 mi | | 3.4 mi |
| (1) | Information obtained from the appraisal. |
| (2) | Information obtained from the borrower rent rolls as of 1/31/2022. |
| (3) | Only identified as a comparable to the BS&L Schantz Road Property. |
| (4) | Only identified as a comparable to the BS&L Oakview 2 Property. |
The appraiser noted that U-Haul has approvals from Lower Macungie Township for a new 100,000 square-foot facility located about 5-miles from the BS&L Schantz Road Property and BS&L Oakview 2 Property. No other new self-storage facilities are currently known to be planned, proposed or under construction within the immediate market area.
The following table presents certain information relating to comparable self storage properties for the BS&L Glover Road Property:
Competitive Set(1)
(BS&L Glover Road Property)
| | BS&L Glover Road | A to Z Self
Storage | Stowaway Self Storage | U-Haul – Easton | Route 33 Self
Storage | Storage Sense |
Address
City, State | 3515 Glover Road
Easton, PA | 1340 Tatamy Easton, PA | 2279 Corriere Road Palmer, PA | 2413 Nazareth Road, Easton, PA | 3813 Hecktown Road Easton, PA | 270 Cedarville Road Easton, PA |
| Year Built | 2007 | 2005 | 1999 | 1975/2001 | 1990 | 2006 |
| Units | 261(2) | 96 | 360 | 385 | 935 | 561 |
| NRA | 53,990 SF(2) | 12,800 SF | 67,500 SF | 41,140 SF | 106,256 SF | 67,320 SF |
| Occupancy | 93.7%(2) | 98.0% | 90.0% | 95.0% | 95.0% | 95.0% |
| Avg SF/Unit | 207(2) | 133 | 188 | 107 | 114 | 120 |
| Distance from Subject | - | 2.5 mi | 3.0 mi | 4.3 mi | 4.9 mi | 5.0 mi |
| (1) | Information obtained from the appraisal. |
| (2) | Information obtained from the borrower rent roll as of 1/31/2022. |
THE INFORMATION IN THIS STRUCTURAL AND COLLATERAL TERM SHEET IS NOT COMPLETE AND MAY BE AMENDED PRIOR TO THE TIME OF SALE. THIS TERM SHEET IS NOT AN OFFER TO SELL THESE SECURITIES AND IT IS NOT A SOLICITATION OF AN OFFER TO BUY THESE SECURITIES IN ANY JURISDICTION WHERE THE OFFER OR SALE IS NOT PERMITTED.
144
| Self Storage – Self Storage | Loan #11 | Cut-off Date Balance: | | $26,000,000 |
| Property Addresses – Various | Budget Store and Lock Self Storage Portfolio | Cut-off Date LTV: | | 55.8% |
| Various, PA | | U/W NCF DSCR: | | 2.28x |
| | | U/W NOI Debt Yield: | | 8.7% |
Operating History and Underwritten Net Cash Flow. The following table presents certain information relating to the historical operating performance and underwritten net cash flow at the Budget Store and Lock Self Storage Portfolio Properties:
Cash Flow Analysis
| | 2019 | 2020 | 2021 | TTM 1/31/2022 | U/W | %(1) | U/W $ per SF |
| Gross Potential Rent | $1,763,255 | $1,968,891 | $2,579,959 | $2,618,444 | $2,952,408 | 92.9% | $13.29 |
| Other Income(2) | 191,077 | 180,549 | 222,302 | 224,095 | 224,095 | 7.1% | $1.01 |
| Net Rental Income | $1,954,332 | $2,149,440 | $2,802,261 | $2,842,539 | $3,176,503 | 100.0% | $14.29 |
| (Vacancy)(3) | 0 | 0 | 0 | 0 | (267,443) | (9.1) | (1.20) |
| Effective Gross Income | $1,954,332 | $2,149,440 | $2,802,261 | $2,842,539 | $2,909,060 | 91.6% | $13.09 |
| | | | | | | | |
| Real Estate Taxes | 216,165 | 244,308 | 246,756 | 246,188 | 259,952 | 8.9% | $1.17 |
| Insurance | 11,367 | 12,756 | 12,876 | 12,876 | 36,286 | 1.2 | 0.16 |
| Management Fee(4) | 58,630 | 64,483 | 84,068 | 85,277 | 87,272 | 3.0 | 0.39 |
| Other Operating Expenses | 208,290 | 210,018 | 244,148 | 251,741 | 256,481 | 8.8 | 1.15 |
| Total Operating Expenses | $494,452 | $531,565 | $587,848 | $596,082 | $639,991 | 22.0% | $2.88 |
| | | | | | | | |
| Net Operating Income | $1,459,880 | $1,617,875 | $2,214,413 | $2,246,457 | $2,269,069 | 78.0% | $10.21 |
| Replacement Reserves | 0 | 0 | 0 | 0 | 33,334 | 1.1 | 0.15 |
| Net Cash Flow | $1,459,880 | $1,617,875 | $2,214,413 | $2,246,457 | $2,235,735 | 76.9% | $10.06 |
| | | | | | | | |
| NOI DSCR | 1.49x | 1.65x | 2.26x | 2.29x | 2.32x | | |
| NCF DSCR | 1.49x | 1.65x | 2.26x | 2.29x | 2.28x | | |
| NOI Debt Yield | 5.6% | 6.2% | 8.5% | 8.6% | 8.7% | | |
| NCF Debt Yield | 5.6% | 6.2% | 8.5% | 8.6% | 8.6% | | |
| (1) | Represents (i) percent of Net Rental Income for all revenue fields, (ii) percent of Gross Potential Rent for Vacancy and (iii) percent of Effective Gross Income for all other fields. |
| (2) | Other income includes borrower sponsors’ administrative fees (charged upon each move in), late fees, lien fees, lock cut fees, clean out fees, retail sales, etc. |
| (3) | The underwritten economic vacancy is 9.1%. The Budget Store and Lock Self Storage Portfolio Properties were 94.0% physically occupied as of January 31, 2022. |
| (4) | The Budget Store and Lock Self Storage Portfolio Properties are self-managed by the borrower sponsors. |
THE INFORMATION IN THIS STRUCTURAL AND COLLATERAL TERM SHEET IS NOT COMPLETE AND MAY BE AMENDED PRIOR TO THE TIME OF SALE. THIS TERM SHEET IS NOT AN OFFER TO SELL THESE SECURITIES AND IT IS NOT A SOLICITATION OF AN OFFER TO BUY THESE SECURITIES IN ANY JURISDICTION WHERE THE OFFER OR SALE IS NOT PERMITTED.
145
| No. 12 – RML Emerald Twenty Four |
| |
| Mortgage Loan Information | | Mortgaged Property Information |
| Mortgage Loan Seller: | Morgan Stanley Mortgage Capital Holdings LLC | | Single Asset/Portfolio: | Single Asset |
| Credit Assessment (Fitch/KBRA/S&P): | NR/NR/NR | | Property Type – Subtype: | Multifamily – Garden |
| Original Principal Balance: | $25,600,000 | | Location: | Lexington, KY |
| Cut-off Date Balance: | $25,600,000 | | Size: | 335 Units |
| % of Initial Pool Balance: | 2.2% | | Cut-off Date Balance Per Unit: | $76,418 |
| Loan Purpose: | Refinance | | Maturity Date Balance Per Unit: | $76,418 |
| Borrower Sponsor: | RML Construction, LLP | | Year Built/Renovated: | 2016/NAP |
| Guarantor: | RML Construction, LLP | | Title Vesting: | Fee |
| Mortgage Rate: | 2.6150% | | Property Manager: | Self-managed |
| Note Date: | December 21, 2021 | | Current Occupancy (As of): | 98.2% (12/31/2021) |
| Seasoning: | 2 months | | YE 2020 Occupancy: | 94.0% |
| Maturity Date: | January 1, 2032 | | YE 2019 Occupancy: | 98.0% |
| IO Period: | 120 months | | YE 2018 Occupancy: | 94.0% |
| Loan Term (Original): | 120 months | | Appraised Value(3): | $56,900,000 |
| Amortization Term (Original): | NAP | | Appraised Value Per Unit: | $169,851 |
| Loan Amortization Type: | Interest Only | | Appraisal Valuation Date: | October 14, 2021 |
| Call Protection: | L(26),D(90),O(4) | | Underwriting and Financial Information(4) |
| Lockbox Type: | Springing | | TTM NOI (9/30/2021): | $3,217,539 |
| Additional Debt: | None | | YE 2020 NOI: | $3,101,213 |
| Additional Debt Type (Balance): | NAP | | YE 2019 NOI: | $3,036,560 |
| | | | YE 2018 NOI: | $2,084,854 |
| Escrows and Reserves | | U/W Revenues: | $4,477,279 |
| | Initial | Monthly | Cap | | U/W Expenses: | $1,386,918 |
| Taxes: | $91,083 | $30,361 | NAP | | U/W NOI: | $3,090,362 |
| Insurance(1): | $0 | Springing | NAP | | U/W NCF: | $3,006,612 |
| Replacement Reserve: | $0 | $6,979 | NAP | | U/W DSCR based on NOI/NCF: | 4.55x / 4.43x |
| Environmental Reserve(2): | $6,000 | $0 | NAP | | U/W Debt Yield based on NOI/NCF: | 12.1% / 11.7% |
| | | | | | U/W Debt Yield at Maturity based on NOI/NCF: | 12.1% / 11.7% |
| | | | | | Cut-off Date LTV Ratio: | 45.0% |
| | | | | | LTV Ratio at Maturity: | 45.0% |
| | | | | | | | |
| Sources and Uses |
| Sources | | | | | Uses | | | |
| Loan Amount | $25,600,000 | | 100.0% | | Loan Payoff | $23,925,082 | | 93.5% |
| | | | | | Return of Equity | 463,373 | | 1.8 |
| | | | | | Closing Costs | 1,114,461 | | 4.4 |
| | | | | | Reserves | 97,083 | | 0.4 |
| Total Sources | $25,600,000 | | 100.0% | | Total Uses | $25,600,000 | | 100.0% |
| (1) | The RML Emerald Twenty Four Mortgage Loan (as defined below) documents do not require ongoing monthly escrows for insurance premiums as long as (i) no event of default has occurred and is continuing, (ii) the borrower provides the lender with written evidence that all required insurance coverages are being maintained in full force and effect, and (iii) the borrower provides the lender with paid receipts for the payment of the insurance premiums at least 20 days prior to the expiration of the policy. |
| (2) | For radon mitigation systems. |
| (3) | The Appraised Value includes $1,075,000 associated with furniture, fixtures and/or equipment. |
| (4) | The novel coronavirus pandemic is an evolving situation and could impact the RML Emerald Twenty Four Mortgage Loan more severely than assumed in the underwriting of the RML Emerald Twenty Four Mortgage Loan and could adversely affect the NOI, NCF and occupancy information, as well as the appraised value and the DSCR, LTV and Debt Yield metrics presented above and herein. See "Risk Factors—Risks Related to Market Conditions and Other External Factors—The Coronavirus Pandemic Has Adversely Affected the Global Economy and Will Likely Adversely Affect the Performance of the Mortgage Loans" in the prospectus. |
The Mortgage Loan. The mortgage loan (the “RML Emerald Twenty Four Mortgage Loan”) is evidenced by a promissory note in the original principal amount of $25,600,000. The RML Emerald Twenty Four Mortgage Loan is secured by a first priority fee mortgage encumbering a multifamily property located in Lexington, Kentucky (the “RML Emerald Twenty Four Property”).
The Borrower and the Borrower Sponsor. The borrower is Chesapeake Equine Partners LLC, a single-purpose Kentucky limited liability company with one independent director in its organizational structure. The borrower sponsor and non-recourse carveout guarantor is RML Construction, LLP. The borrower is 100.0% owned by RML Construction, LLP. Founded in 1991, RML Construction, LLP is a limited liability partnership that is involved in the construction and rental of duplexes, triplexes, townhomes, and apartments in the Lexington, Kentucky and Knoxville, Tennessee areas. The company currently owns and operates a portfolio of commercial real estate consisting of 13 multifamily properties.
THE INFORMATION IN THIS STRUCTURAL AND COLLATERAL TERM SHEET IS NOT COMPLETE AND MAY BE AMENDED PRIOR TO THE TIME OF SALE. THIS TERM SHEET IS NOT AN OFFER TO SELL THESE SECURITIES AND IT IS NOT A SOLICITATION OF AN OFFER TO BUY THESE SECURITIES IN ANY JURISDICTION WHERE THE OFFER OR SALE IS NOT PERMITTED.
146
| Multifamily – Garden | Loan #12 | Cut-off Date Balance: | | $25,600,000 |
| 1024 Greendale Road | RML Emerald Twenty Four | Cut-off Date LTV: | | 45.0% |
| Lexington, KY 40511 | | UW NCF DSCR: | | 4.43x |
| | | UW NOI Debt Yield: | | 12.1% |
The borrower is an affiliate of the borrowers under the mortgage loans identified in Annex A-1 to the prospectus as RML The Blvd at Hays, RML Lexington, RML Savannah Oaks Townhomes, RML Townhomes of Chilesburg Park, RML Glasford Square Townhomes, and RML Artisan Townhomes, all of which are secured by properties located in Lexington, Kentucky.
The Property. The RML Emerald Twenty Four Property is a 335-unit garden multifamily apartment complex totaling 389,796 SF situated on a 27.3-acre site and includes 19 two and three-story apartment buildings and 652 parking spaces (1.95 per unit). The RML Emerald Twenty Four Property was built in 2016. Since 2016, the borrower sponsor has invested $282,070 on capital expenditures, including clubhouse renovations, landscaping improvements and pool upgrades. The apartment unit mix is comprised of studio, one-, two- and three-bedroom units ranging in size from 594 – 1,516 SF with an average of 1,164 SF. As of December 31, 2021, the RML Emerald Twenty Four Property is 98.2% occupied at an average contract rent of $1,090 per unit per month. Each unit generally features full kitchens with stainless steel appliances, granite countertops, ceramic tile backsplashes, walk-in closets, patio/balcony, central air-conditioning, 9’ ceilings, crown molding, ceiling fan, and washer/dryer hookups. Select units have an in-unit washer/dryer and privately accessible attached garages. Building amenities include a clubhouse, leasing office, coffee bar, fitness center, business center, two swimming pools, and grilling area.
The table below shows the residential apartment unit mix at the RML Emerald Twenty Four Property:
Apartment Unit Mix(1)
Unit Mix /
Type | Total Units | Occupied Units | % Occupied | Average SF per
Unit | Monthly Average
Rent per Unit | Monthly Average
Rent PSF |
| Studio | 9 | 9 | 100.0% | 594 | $844 | $1.42 |
| One Bedroom | 66 | 65 | 98.5% | 723 | $904 | $1.25 |
| Two Bedroom | 182 | 178 | 97.8% | 1,238 | $1,081 | $0.87 |
| Three Bedroom | 78 | 77 | 98.7% | 1,428 | $1,297 | $0.91 |
| Total/Average | 335 | 329 | 98.2% | 1,164 | $1,090 | $0.94 |
| (1) | Borrower rent roll dated December 31, 2021. |
THE INFORMATION IN THIS STRUCTURAL AND COLLATERAL TERM SHEET IS NOT COMPLETE AND MAY BE AMENDED PRIOR TO THE TIME OF SALE. THIS TERM SHEET IS NOT AN OFFER TO SELL THESE SECURITIES AND IT IS NOT A SOLICITATION OF AN OFFER TO BUY THESE SECURITIES IN ANY JURISDICTION WHERE THE OFFER OR SALE IS NOT PERMITTED.
147
| Multifamily – Garden | Loan #12 | Cut-off Date Balance: | | $25,600,000 |
| 1024 Greendale Road | RML Emerald Twenty Four | Cut-off Date LTV: | | 45.0% |
| Lexington, KY 40511 | | UW NCF DSCR: | | 4.43x |
| | | UW NOI Debt Yield: | | 12.1% |
Operating History and Underwritten Net Cash Flow. The following table presents certain information relating to the historical operating performance and Underwritten Net Cash Flow at the RML Emerald Twenty Four Property:
Cash Flow Analysis
| | 2018 | 2019 | 2020 | 9/30/2021 TTM | UW | %(1) | UW per Unit |
| Gross Potential Rent(2) | $2,810,068 | $3,885,295 | $3,943,873 | $4,100,595 | $4,356,441 | 92.8% | $13,004.30 |
| Other Income(3) | 282,397 | 336,614 | 363,852 | 338,660 | 338,660 | 7.2 | 1,010.93 |
| Discounts Concessions | 0 | 0 | 0 | 0 | 0 | 0.0 | 0.00 |
| Net Rental Income | $3,092,465 | $4,221,909 | $4,307,725 | $4,439,255 | $4,695,101 | 100.0% | $14,015.23 |
| Less Vacancy & Credit Loss | 0 | 0 | 0 | 0 | (217,822) | (5.0) | (650.22) |
| Effective Gross Income | $3,092,465 | $4,221,909 | $4,307,725 | $4,439,256 | $4,477,279 | 95.4% | $13,365.01 |
| | | | | | | | |
| Real Estate Taxes | 254,288 | 340,648 | 340,415 | 340,415 | 371,412 | 8.3 | 1,108.69 |
| Insurance | 89,857 | 116,024 | 124,146 | 129,314 | 129,200 | 2.9 | 385.67 |
| Other Expenses | 663,466 | 728,678 | 741,951 | 751,987 | 886,306 | 19.8 | 2,645.69 |
| Total Expenses | $1,007,611 | $1,185,349 | $1,206,512 | $1,221,716 | $1,386,918 | 31.0% | $4,140.05 |
| | | | | | | | |
| Net Operating Income | $2,084,854 | $3,036,560 | $3,101,213 | $3,217,539 | $3,090,362 | 69.0% | $9,224.96 |
| Capital Expenditures | 0 | 0 | 0 | 0 | 83,750 | 1.9 | 250.00 |
| Net Cash Flow | $2,084,854 | $3,036,560 | $3,101,213 | $3,217,539 | $3,006,612 | 67.2% | $8,974.96 |
| | | | | | | | |
| Occupancy % | 94.0% | 98.0% | 94.0% | 98.2%(4) | 95.0%(5) | | |
| NOI DSCR | 3.07x | 4.47x | 4.57x | 4.74x | 4.55x | | |
| NCF DSCR | 3.07x | 4.47x | 4.57x | 4.74x | 4.43x | | |
| NOI Debt Yield | 8.1% | 11.9% | 12.1% | 12.6% | 12.1% | | |
| NCF Debt Yield | 8.1% | 11.9% | 12.1% | 12.6% | 11.7% | | |
| (1) | Represents (i) percent of Net Rental Income for all revenue fields, (ii) percent of Gross Potential Rent for Vacancy & Credit Loss and (iii) percent of Effective Gross Income for all other fields. |
| (2) | UW Gross Potential Rent is based on the borrower rent roll dated December 31, 2021. |
| (3) | Other Income is comprised of pet rent, security deposits, late fees and washer/dryer rentals. |
| (4) | Based on borrower rent roll dated December 31, 2021. |
| (5) | The underwritten economic vacancy is 5.0%. The RML Emerald Twenty Four Property was 98.2% occupied as of December 31, 2021. |
The Market. The RML Emerald Twenty Four Property is located in Lexington, Kentucky in the West Fayette County multifamily submarket in the Lexington region multifamily market. Regional access to the RML Emerald Twenty Four Property is provided by Interstate 75 and Interstate 64 which are within two miles. The RML Emerald Twenty Four Property is located approximately 5.1 miles northeast of downtown Lexington. The Lexington MSA has a population of approximately 520,391, which accounts for approximately 11.5% of the total Kentucky population. The Lexington MSA is driven by the services, retail trade, and manufacturing industries. The largest employer in the Lexington area, The University of Kentucky (16,743 employees), is the largest university in Kentucky with an enrollment totaling more than 30,000 students. The region is home to several Fortune 500 companies, including UPS, Lockheed Martin, Lexmark International Inc., Valvoline, and Pepsi-Cola Bottling Co. According to the appraisal, as of the second quarter of 2021, the vacancy rate in the West Fayette County multifamily submarket was approximately 5.8%, with average asking rents of $902 per unit and inventory of approximately 10,728 units. According to the appraisal, as of the second quarter of 2021, the vacancy rate in the Lexington region multifamily market was approximately 5.0%, with average asking rents of $867 per unit and inventory of approximately 23,663 units. According to the appraisal, the estimated 2021 population within a one-, three- and five-mile radius of the RML Emerald Twenty Four Property was 6,998, 41,835 and 124,477, respectively. The estimated 2021 average household income within the same radii was $87,784, $67,261 and $60,114, respectively.
THE INFORMATION IN THIS STRUCTURAL AND COLLATERAL TERM SHEET IS NOT COMPLETE AND MAY BE AMENDED PRIOR TO THE TIME OF SALE. THIS TERM SHEET IS NOT AN OFFER TO SELL THESE SECURITIES AND IT IS NOT A SOLICITATION OF AN OFFER TO BUY THESE SECURITIES IN ANY JURISDICTION WHERE THE OFFER OR SALE IS NOT PERMITTED.
148
| Multifamily – Garden | Loan #12 | Cut-off Date Balance: | | $25,600,000 |
| 1024 Greendale Road | RML Emerald Twenty Four | Cut-off Date LTV: | | 45.0% |
| Lexington, KY 40511 | | UW NCF DSCR: | | 4.43x |
| | | UW NOI Debt Yield: | | 12.1% |
The following table presents certain information relating to comparable multifamily rental properties to the RML Emerald Twenty Four Property:
Comparable Multifamily Rental Properties
| Property | Year Built | # Units | Unit Mix | Average SF per Unit | Average Monthly Rent per Unit | Average Monthly Rent PSF |
RML Emerald Twenty
Four(1) Lexington, KY (subject property) | 2016 | 335 | Studio 1BR 2BR 3BR | 594 723 1,238 1,428 | $844 $904 $1,081 $1,297 | $1.42 $1.25 $0.87 $0.91 |
Ashton Park Lexington, KY | 2019 | 144 | 1BR 2BR | 806 1,042 | $926 $1,152 | $1.15 $1.11 |
The Retreat at Hamburg
Place Lexington, KY | 2013 | 150 | 1BR 2BR 3BR | 780 1,181 1,434 | $1,255 $1,462 $1,606 | $1.61 $1.24 $1.12 |
Waterstone at Hamburg Lexington, KY | 2017 | 264 | 1BR 2BR 3BR | 801 1,182 1,401 | $1,480 $1,852 $1,804 | $1.85 $1.57 $1.29 |
1809 at Winchester Lexington, KY | 2014 | 252 | Studio 1BR 2BR 3BR | 574 748 1,128 1,382 | $866 $1,169 $1,386 $1,841 | $1.51 $1.56 $1.23 $1.33 |
Source: Appraisal, unless otherwise indicated.
| (1) | Based on the borrower rent roll dated December 31, 2021. |
The following table presents certain information relating to the appraisal’s market rent conclusion for the RML Emerald Twenty Four Property:
Market Rent Summary
| Building | Units(1) | Average Size (SF) (1) | Avg. Monthly
Rent per Unit(1) | Avg. Monthly
Rent PSF(1) | Avg. Monthly
Market Rent per
Unit(2) | Avg. Monthly
Market Rent
PSF(2) |
| Studio | 9 | 594 | $844 | $1.42 | $878 | $1.48 |
| One Bedroom | 66 | 723 | $904 | $1.25 | $930 | $1.29 |
| Two Bedroom | 182 | 1,238 | $1,081 | $0.87 | $1,130 | $0.91 |
| Three Bedroom | 78 | 1,428 | $1,297 | $0.91 | $1,351 | $0.95 |
| (1) | Based on the borrower rent roll dated December 31, 2021. |
| (2) | Based on the appraisal. |
THE INFORMATION IN THIS STRUCTURAL AND COLLATERAL TERM SHEET IS NOT COMPLETE AND MAY BE AMENDED PRIOR TO THE TIME OF SALE. THIS TERM SHEET IS NOT AN OFFER TO SELL THESE SECURITIES AND IT IS NOT A SOLICITATION OF AN OFFER TO BUY THESE SECURITIES IN ANY JURISDICTION WHERE THE OFFER OR SALE IS NOT PERMITTED.
149
| No. 13 – Two Merriweather |
| |
| Mortgage Loan Information | | Mortgaged Property Information |
| Mortgage Loan Seller: | Wells Fargo Bank, National Association | | Single Asset/Portfolio: | Single Asset |
Credit Assessment (Fitch/KBRA/S&P): | NR/NR/NR | | Property Type – Subtype: | Office - Suburban |
| Original Principal Balance: | $25,600,000 | | Location: | Columbia, MD |
| Cut-off Date Balance: | $25,600,000 | | Size: | 124,016 SF |
| % of Initial Pool Balance: | 2.2% | | Cut-off Date Balance Per SF: | $206.42 |
| Loan Purpose: | Recapitalization | | Maturity Date Balance Per SF: | $206.42 |
| Borrower Sponsor: | The Howard Hughes Corporation | | Year Built/Renovated: | 2017/NAP |
| Guarantor: | The Howard Hughes Corporation | | Title Vesting: | Fee |
| Mortgage Rate: | 3.8250% | | Property Manager: | Howard Hughes Management Services Company, LLC (borrower affiliate) |
| Note Date: | January 26, 2022 | | Current Occupancy (As of): | 93.3% (11/30/2021) |
| Seasoning: | 1 month | | YE 2020 Occupancy: | 90.8% |
| Maturity Date: | February 11, 2032 | | YE 2019 Occupancy: | 78.1% |
| IO Period: | 120 months | | YE 2018 Occupancy(2): | 59.7% |
| Loan Term (Original): | 120 months | | YE 2017 Occupancy(2): | 59.2% |
| Amortization Term (Original): | NAP | | As-Is Appraised Value: | $48,600,000 |
| Loan Amortization Type: | Interest Only | | As-Is Appraised Value Per SF: | $391.88 |
| Call Protection: | L(24),YM1(89),O(7) | | As-Is Appraisal Valuation Date: | December 10, 2021 |
| Lockbox Type: | Soft/Springing Cash Management | | Underwriting and Financial Information(3) |
| Additional Debt: | None | | TTM NOI (9/30/2021): | $2,867,072 |
| Additional Debt Type (Balance): | NAP | | YE 2020 NOI(4): | $2,617,331 |
| | | | YE 2019 NOI(4): | $1,339,022 |
| | | | YE 2018 NOI(4): | NAV |
| | | | U/W Revenues: | $4,850,474 |
| | | | U/W Expenses: | $1,793,300 |
| Escrows and Reserves | | U/W NOI: | $3,057,174 |
| | Initial | Monthly | Cap | | U/W NCF: | $2,846,347 |
| Taxes | $262,534 | $43,755 | NAP | | U/W DSCR based on NOI/NCF: | 3.08x / 2.87x |
| Insurance(1) | $0 | Springing | NAP | | U/W Debt Yield based on NOI/NCF: | 11.9% / 11.1% |
| Replacement Reserves | $0 | $2,067 | $125,000 | | U/W Debt Yield at Maturity based on NOI/NCF: | 11.9% / 11.1% |
| TI/LC | $0 | $15,502 | NAP | | Cut-off Date LTV Ratio: | 52.7% |
| Rent Concession | $17,941 | $0 | NAP | | LTV Ratio at Maturity: | 52.7% |
| | | | | | | |
| | | | | | | | |
| Sources and Uses |
| Sources | | | | | Uses | | | |
| Original Mortgage Loan amount | $25,600,000 | | 100.0% | | Upfront Reserves | $280,475 | | 1.1% |
| | | | | | Closing costs | 653,880 | | 2.6 |
| | | | | | Return of Equity(5) | 24,665,645 | | 96.4 |
| Total Sources | $25,600,000 | | 100.0% | | Total Uses | $25,600,000 | | 100.0% |
| (1) | Ongoing monthly insurance reserve deposits in an amount equal to one-twelfth of the insurance premiums that the lender estimates will be payable for the renewal of the required coverages will not be required as long as (a) no event of default is continuing (b) the policy maintained by the borrower is under one or more blanket policies reasonably acceptable to the lender, and (c) the lender has received evidence of the renewal of such policies no later than 10 business days prior to the expiration of the policies. |
| (2) | Information obtained from a third-party research report and it represents the occupancy as of the fourth quarter of 2017 and 2018. |
| (3) | While the Two Merriweather Mortgage Loan (defined below) was originated after the emergence of the novel coronavirus pandemic and the economic disruption resulting from measures to combat the pandemic, the pandemic is an evolving situation and could impact the Two Merriweather Mortgage Loan more severely than assumed in the underwriting and could adversely affect the NOI, NCF and occupancy information, as well as the appraised value and the DSCR, LTV and Debt Yield metrics presented above. See “Risk Factors— Risks Related to Market Conditions and Other External Factors—Coronavirus Pandemic Has Adversely Affected the Global Economy and Will Likely Adversely Affect the Performance of the Mortgage Loans” in the Preliminary Prospectus. |
| (4) | The Two Merriweather Property (defined below) was completed in 2017 and was 59.7% occupied in 2018, thus the borrower did not provide financials for that year. Additionally, the increase in Net Operating Income from 2019 to 2020 is due to the lease up of the building from 78.1% occupancy in 2019 to 90.8% in 2020 (see “Operating History and Underwritten Net Cash Flow”). |
| (5) | The Two Merriweather Property was built in 2017 by The Howard Hughes Corporation and was unencumbered at the time of loan closing. |
THE INFORMATION IN THIS STRUCTURAL AND COLLATERAL TERM SHEET IS NOT COMPLETE AND MAY BE AMENDED PRIOR TO THE TIME OF SALE. THIS TERM SHEET IS NOT AN OFFER TO SELL THESE SECURITIES AND IT IS NOT A SOLICITATION OF AN OFFER TO BUY THESE SECURITIES IN ANY JURISDICTION WHERE THE OFFER OR SALE IS NOT PERMITTED.
150
| Office - Suburban | Loan #13 | Cut-off Date Balance: | | $25,600,000 |
10960 Grantchester Way
Columbia, MD 21044
| Two Merriweather | Cut-off Date LTV:
U/W NCF DSCR:
U/W NOI Debt Yield: | | 52.7%
2.87x
11.9% |
The Mortgage Loan. The mortgage loan (the “Two Merriweather Mortgage Loan”) is evidenced by the first priority fee interest encumbering a multi-tenant office property totaling 124,016 square feet located in Columbia, Maryland (the “Two Merriweather Property”).
The Borrower and Borrower Sponsor. The borrower is Crescent Area 1-B Holdings, LLC a Delaware limited liability company and single purpose entity with two independent directors. Legal counsel to the borrower delivered a non-consolidation opinion in connection with the origination of the Two Merriweather Mortgage Loan. The borrower sponsor and nonrecourse carveout guarantor is The Howard Hughes Corporation.
Founded in 2010, The Howard Hughes Corporation owns, manages, and develops commercial, residential and mixed-use real estate throughout the United States. The company’s holdings include a portfolio of master planned communities including Seaport in New York City, Downtown Columbia, Maryland, The Woodlands and Bridgeland in greater Houston, Texas, Summerlin, Las Vegas, Ward Village, Honolulu, Hawai’i, and Douglas Ranch in Phoenix, Arizona.
The Howard Hughes Corporation is also the sponsor of the One Merriweather mortgage loan and the Oxy Warehouse mortgage loan. For more information See “Risk Factors—Risks Relating to the Mortgage Loans—Concentrations Based on Property Type, Geography, Related Borrowers and Other Factors May Disproportionately Increase Losses”.
The Property. The Two Merriweather Property consists of a 5-story, 124,016 square foot, LEED Silver, multi-tenant office building, located in Columbia, Maryland. Built in 2017 and situated on a 1.17-acre site, the Two Merriweather Property includes a marketing center, a boardwalk over a bio-retention pond, and outdoor spaces. A 9-level above grade parking garage is situated adjacent to the property containing 1,127 spaces. The garage is shared between Two Merriweather and an adjacent office building also owned by an affiliate of the sponsor, One Merriweather, via a parking easement agreement. Two Merriweather is allocated 458 spaces, resulting in a parking ratio of 3.69 spaces per 1,000 square feet. As of November 30, 2021, the Two Merriweather Property is 93.3% occupied by eight tenants.
Major Tenants.
Largest Tenant by UW Base Rent: Connections Education LLC (BBB-/Baa3/NR: F/M/S&P; 72,523 square feet; 58.5% of net rentable area; 61.3% of underwritten base rent; 11/30/2028 lease expiration) – Founded in 2001, Connections Education LLC (“Connections”) is a subsidiary of Pearson plc, the rated entity parent company which guarantees the lease. Connections is a for-profit corporate provider of online school products and services to virtual schools for grades K-12. The Two Merriweather Property serves as the tenant’s corporate headquarters and it leases floors 2-4. Connections has been a tenant at the Two Merriweather Property since 2017 and has two, 5-year renewal options.
Connections is currently subleasing the second floor at a rate of $31.00 per square foot, through October 2028. Additionally, Connections is marketing the remainder of its space for sublease.
2nd Largest Tenant by UW Base Rent: Howard Hughes Management Co., LLC (19,618 square feet; 15.8% of net rentable area; 19.5% of underwritten base rent; 3/31/2033 lease expiration) – Founded in 2010, the company owns, manages, and develops commercial, residential and mixed-use real estate throughout the United States. The company’s holdings include a portfolio of master planned communities including Seaport in New York City, Downtown Columbia, Maryland, The Woodlands and Bridgeland in greater Houston, Texas, Summerlin, Las Vegas, Ward Village, Honolulu, Hawai’i, and Douglas Ranch in Phoenix, Arizona. Howard Hughes Management Co., LLC has been a tenant since 2019.
3rd Largest Tenant by UW Base Rent: Medisolv, Inc. (4,689 square feet; 3.8% of net rentable area; 3.7% of underwritten base rent; 12/31/2025 lease expiration) – Medisolv, Inc. (“Medisolv”) was founded twenty years ago and offers reporting and management software that assists hospitals and medical professionals address their electronic needs. It focuses on developing software applications that provide the tools to measure and improve care, with products including data management and aggregation, analytics and benchmarking. Medislov has been a tenant since 2020 and has one, 5-year renewal option. Additionally, Medisolv has a one-time option to terminate its lease on the last day of the 37th month of the lease (12/31/2023) with nine months written notice to the landlord, and the payment of a termination fee equal to all rent due under the lease and all unamortized leasing costs incurred by the landlord on a straight-line basis, without interest.
COVID-19 Update. As of February 11, 2022, the Two Merriweather Property is open and operating. The tenants have made all required rent payments as of February 2022. One tenant, representing 2.1% of the net rentable area and 2.0% of the underwritten rent, is paying reduced rent from March 1, 2021 to April 30, 2022. They will repay the deferred rent in monthly installments from January 1, 2025 to December 31, 2029.
THE INFORMATION IN THIS STRUCTURAL AND COLLATERAL TERM SHEET IS NOT COMPLETE AND MAY BE AMENDED PRIOR TO THE TIME OF SALE. THIS TERM SHEET IS NOT AN OFFER TO SELL THESE SECURITIES AND IT IS NOT A SOLICITATION OF AN OFFER TO BUY THESE SECURITIES IN ANY JURISDICTION WHERE THE OFFER OR SALE IS NOT PERMITTED.
151
| Office - Suburban | Loan #13 | Cut-off Date Balance: | | $25,600,000 |
10960 Grantchester Way
Columbia, MD 21044
| Two Merriweather | Cut-off Date LTV:
U/W NCF DSCR:
U/W NOI Debt Yield: | | 52.7%
2.87x
11.9% |
The following table presents certain information relating to the tenancy at the Two Merriweather Property:
Major Tenants
| Tenant Name | Credit Rating
(Fitch/
Moody’s/
S&P)(1) | Tenant
NRSF | % of
NRSF | Annual
U/W Base Rent PSF(2) | Annual
U/W Base
Rent(2) | % of Total Annual
U/W Base
Rent | Lease
Expiration
Date | Ext. Options | Term. Option (Y/N) |
| Major Tenants | | | | | | | | |
| Connections | BBB-/Baa3/NR | 72,523 | 58.5% | $41.86 | $3,036,116 | 61.3% | 11/30/2028 | 2, 5-year | N |
| Howard Hughes Management Co., LLC | NR/NR/NR | 19,618 | 15.8% | $49.17 | $964,670 | 19.5% | 3/31/2033 | N | N |
| Medisolv | NR/NR/NR | 4,689 | 3.8% | $39.04 | $183,059 | 3.7% | 12/31/2025 | 1, 5-year | Y(3) |
| | 96,830 | 78.1% | $43.21 | $4,183,845 | 84.5% | | | |
| | | | | | | | | |
| Non-Major Tenants | 18,901 | 15.2% | $40.66 | $768,558 | 15.5% | | | |
| | | | | | | | | |
| Occupied Collateral Total | 115,731 | 93.3% | $42.79 | $4,952,403 | 100.0% | | | |
| | | | | | | | | |
| Vacant Space | 8,285 | 6.7% | | | | | | |
| | | | | | | | | |
| Collateral Total | 124,016 | 100.0% | | | | | | |
| | | | | | | | | | |
| (1) | Certain ratings are those of the parent company whether or not the parent company guarantees the lease. |
| (2) | Annual U/W Base Rent PSF and Annual U/W Base Rent include contractual rent steps through July 2022 totaling $50,054 as well as straight-line rent averaging credit over the remaining lease term for Connections due to the investment grade nature of the tenant. The current contractual rental rate for Connections is $38.45 per square foot. |
| (3) | Medisolv has a one-time option to terminate its lease on the last day of the 37th month of the lease (12/31/2023) with nine months written notice to the landlord, and the payment of a termination fee equal to all rent due under the lease and all unamortized leasing costs incurred by the landlord on a straight-line basis, without interest. |
The following table presents certain information relating to the lease rollover schedule at the Two Merriweather Property:
Lease Expiration Schedule(1)
Year Ending
December 31, | No. of Leases Expiring | Expiring NRSF | % of Total NRSF | Cumulative Expiring NRSF | Cumulative % of Total NRSF | Annual
U/W
Base Rent | % of Total Annual U/W Base Rent(2) | Annual
U/W
Base Rent
PSF(2) |
| MTM | 0 | 0 | 0.0% | 0 | 0.0% | $0 | 0.0% | $0.00 |
| 2022 | 0 | 0 | 0.0% | 0 | 0.0% | $0 | 0.0% | $0.00 |
| 2023 | 3 | 12,089 | 9.7% | 12,089 | 9.7% | $494,216 | 10.0% | $40.88 |
| 2024(3) | 0 | 0 | 0.0% | 12,089 | 9.7% | $0 | 0.0% | $0.00 |
| 2025 | 1 | 4,608 | 3.7% | 16,697 | 13.5% | $180,864 | 3.7% | $39.25 |
| 2026 | 0 | 0 | 0.0% | 16,697 | 13.5% | $0 | 0.0% | $0.00 |
| 2027 | 0 | 0 | 0.0% | 16,697 | 13.5% | $0 | 0.0% | $0.00 |
| 2028 | 5 | 72,523 | 58.5% | 89,220 | 71.9% | $3,036,116 | 61.3% | $41.86 |
| 2029 | 0 | 0 | 0.0% | 89,220 | 71.9% | $0 | 0.0% | $0.00 |
| 2030 | 1 | 2,600 | 2.1% | 91,820 | 74.0% | $104,817 | 2.1% | $40.31 |
| 2031 | 1 | 4,293 | 3.5% | 96,113 | 77.5% | $171,720 | 3.5% | $40.00 |
| 2032 | 0 | 0 | 0.0% | 96,113 | 77.5% | $0 | 0.0% | $0.00 |
| Thereafter | 1 | 19,618 | 15.8% | 115,731 | 93.3% | $964,670 | 19.5% | $49.17 |
| Vacant | 0 | 8,285 | 6.7% | 124,016 | 100.0% | $0 | 0.0% | $0.00 |
| Total/Weighted Average | 12 | 124,016 | 100.0% | | | $4,952,403 | 100.0% | $42.79 |
| (1) | Information obtained from the underwritten rent roll. |
| (2) | The Annual U/W Base Rent and Annual U/W Base Rent PSF excludes vacant space. |
| (3) | Assumes that Medisolv has exercised its early termination option. |
The following table presents historical occupancy percentages at the Two Merriweather Property:
Historical Occupancy
12/31/2017(1) | 12/31/2018(1) | 12/31/2019(2) | 12/31/2020(2) | 11/30/2021(3) |
| 59.2% | 59.7% | 78.1% | 90.8% | 93.3% |
| (1) | Information obtained from a third-party research provider as of the fourth quarter of 2017 and 2018. |
| (2) | Information obtained from the borrower. |
| (3) | Information obtained from the underwritten rent roll. |
THE INFORMATION IN THIS STRUCTURAL AND COLLATERAL TERM SHEET IS NOT COMPLETE AND MAY BE AMENDED PRIOR TO THE TIME OF SALE. THIS TERM SHEET IS NOT AN OFFER TO SELL THESE SECURITIES AND IT IS NOT A SOLICITATION OF AN OFFER TO BUY THESE SECURITIES IN ANY JURISDICTION WHERE THE OFFER OR SALE IS NOT PERMITTED.
152
| Office - Suburban | Loan #13 | Cut-off Date Balance: | | $25,600,000 |
10960 Grantchester Way
Columbia, MD 21044
| Two Merriweather | Cut-off Date LTV:
U/W NCF DSCR:
U/W NOI Debt Yield: | | 52.7%
2.87x
11.9% |
Market Overview and Competition. The Two Merriweather Property is located in Columbia, Maryland. Columbia is centrally located in the region, approximately 21.6 miles southwest of Baltimore, Maryland and 24.9 miles north of Washington D.C. Columbia is a 14,000-acre master planned community with approximately 100,000 residents. Columbia has 5,300 acres of open space, three lakes, 19 ponds and more than 83 miles of pathways for walking, biking and jogging. The area contains nine residential communities surrounding a central town center anchored by The Mall in Columbia, which is located approximately 0.5 miles north of the Two Merriweather Property. A 30-year master plan, approved in 2010, allows for up to 13 million square feet in the town center area. Two Merriweather is located in The Crescent area of the plan, located 0.2 miles to the Merriweather Post Pavilion, a 19,300-seat amphitheater, and planned as an urban, high-density, mixed-use development. The Howard Hughes Company controls The Crescent and most of the remaining land components in downtown Columbia. According to the appraisal, within a 1-, 3- and 5- mile radius of the Two Merriweather Property, the estimated 2021 population is 14,131, 85,981, and 184,749, respectively, and the 2021 average household income is $131,768, $148,173, and $165,686, respectively.
According to a third-party market research report, the property is situated within the Downtown Columbia office submarket of the greater Baltimore regional office market. As of February 3, 2022, the submarket reported total inventory of approximately 3.3 million square feet with a 16.3% vacancy rate and average market rents of $29.14 per square foot. There is currently nothing under construction in the submarket. The appraiser identified five lease comparables with rents ranging from $29.86 to $39.50 per square foot and concluded to a market rent of $39.50 per square foot. The appraiser concluded to a market rent of $41.50 per square foot for the retail space, which makes up approximately 5.6% of the net rentable area in the Two Merriweather Property.
The following table presents certain information relating to the appraiser’s market rent conclusions for the Two Merriweather Property:
Market Rent Summary(1)
| | Office | Retail |
| Market Rent (PSF) | $39.50 | $41.50 |
| Lease Term (Years) | 10 | 10 |
| Lease Type | Modified Gross | Net |
| Rent Increase Projection | 2.5%/Year | 2.5%/Year |
| TI (New/Renewal) | $35.00 / $15.00 | $25.00 / $0.00 |
| LC (New/Renewal) | 6.0% / 3.0% | 6.0% / 3.0% |
| Free Rent (New/Renewal) | 5 mths / 0 mths | 3 mths / 0 mths |
| (1) | Information obtained from the appraisal. |
The table below presents certain information relating to comparable sales pertaining to the Two Merriweather Property identified by the appraiser:
Comparable Sales(1)
| Property Name | Location | Year
Built/Renovated | Rentable
Area (SF) | Sale Date | Sale Price | Sale Price
(PSF) |
Shirlington Tower 2900 South Quincy Street | Arlington, VA | 2001/NAP | 233,446 | Oct-2020 | $76,000,000 | $326 |
Patriots Park I, II & III 12290, 12300 & 12310 Sunrise Valley Drive | Reston, VA | 1986/2013 | 705,905 | Sep-2020 | $325,000,000 | $460 |
Monument I 12975 Worldgate Drive | Herndon, VA | 1998/NAP | 167,285 | Sep-2020 | $49,800,000 | $298 |
Prince Street Plaza 1421 Prince Street | Alexandria, VA | 1987/NAP | 55,321 | Jun-2020 | $20,100,000 | $363 |
| (1) | Information obtained from the appraisal. |
THE INFORMATION IN THIS STRUCTURAL AND COLLATERAL TERM SHEET IS NOT COMPLETE AND MAY BE AMENDED PRIOR TO THE TIME OF SALE. THIS TERM SHEET IS NOT AN OFFER TO SELL THESE SECURITIES AND IT IS NOT A SOLICITATION OF AN OFFER TO BUY THESE SECURITIES IN ANY JURISDICTION WHERE THE OFFER OR SALE IS NOT PERMITTED.
153
| Office - Suburban | Loan #13 | Cut-off Date Balance: | | $25,600,000 |
10960 Grantchester Way
Columbia, MD 21044
| Two Merriweather | Cut-off Date LTV:
U/W NCF DSCR:
U/W NOI Debt Yield: | | 52.7%
2.87x
11.9% |
The following table presents certain information relating to the appraiser’s market rent conclusions for the Two Merriweather Property:
Comparable Office Leases(1)
| Property Name/Location | Year Built/ Renovated | Total GLA
(SF) | Tenant | Tenant
Size (SF) | Lease
Start
Date | Lease Term | Annual
Base Rent
PSF | Lease Type |
Two Merriweather(Subject)
10960 Grantchester Way
Columbia, MD | 2017/NAP | 124,016(2) | | | | | | |
Maple Lawn Office VIII
8115 Maple Lawn Boulevard
Fulton, MD | 2016/NAP | 123,658 | Lawrence & Bundy | 2,935 | Jul-2021 | 5.3 Yrs. | $35.75 |
Modified
|
Maple Lawn Office VIII
8115 Maple Lawn Boulevard
Fulton, MD | 2016/NAP | 123,658 | Lewicky, O’Connor, Hnt & Meiser | 4,916 | May-2021 | 5.3 Yrs. | $29.86 |
Modified
|
Maple Lawn Office III
8161 Maple Lawn Boulevard
Fulton, MD
| 2006/NAP | 110,046 | Creston Electronics | 7,999 | Nov-2021 | 2.0 Yrs. | $36.13 | Modified |
One Merriweather
10980 Grantchester Way
Columbia, MD
| 2017/NAP | 206,632 | Olive AI | 2,976 | Feb-2021 | 3.0 Yrs. | $39.50 | Modified |
One Merriweather
10980 Grantchester Way
Columbia, MD
| 2017/NAP | 206,632 | TIA | 3,681 | Apr-2020 | 5.0 Yrs. | $37.00 | Modified |
| (1) | Information obtained from the appraisal. |
| (2) | Information obtained from the underwritten rent roll. |
THE INFORMATION IN THIS STRUCTURAL AND COLLATERAL TERM SHEET IS NOT COMPLETE AND MAY BE AMENDED PRIOR TO THE TIME OF SALE. THIS TERM SHEET IS NOT AN OFFER TO SELL THESE SECURITIES AND IT IS NOT A SOLICITATION OF AN OFFER TO BUY THESE SECURITIES IN ANY JURISDICTION WHERE THE OFFER OR SALE IS NOT PERMITTED.
154
| Office - Suburban | Loan #13 | Cut-off Date Balance: | | $25,600,000 |
10960 Grantchester Way
Columbia, MD 21044
| Two Merriweather | Cut-off Date LTV:
U/W NCF DSCR:
U/W NOI Debt Yield: | | 52.7%
2.87x
11.9% |
Operating History and Underwritten Net Cash Flow. The following table presents certain information relating to the historical operating performance and underwritten net cash flow at the Two Merriweather Property:
Cash Flow Analysis
| | | 2019 | | 2020 | | TTM
9/30/2021 | | U/W | | %(1) | | U/W $
per SF | |
| Base Rent | | $3,141,459 | | $4,081,241 | | $4,499,806 | | $4,952,403(2) | | 92.1% | | $39.93 | |
| Grossed Up Vacant Space | | 0 | | 0 | | 0 | | 327,258 | | 6.1% | | 2.64 | |
| Gross Potential Rent | | $3,141,459 | | $4,081,241 | | $4,499,806 | | $5,279,661 | | 98.2% | | $42.57 | |
| Other Income | | 0 | | 17,679 | | 5,425 | | 5,000 | | 0.1 | | 0.04 | |
| Less: Free Rent Adjustment and collection loss | | (20,487) | | (166,152) | | (143,955) | | 0 | | 0.0 | | 0.00 | |
| Total Recoveries | | 6,057 | | 17,409 | | 31,348 | | 93,779 | | 1.7 | | 0.76 | |
| Net Rental Income | | $3,127,029 | | $3,950,177 | | $4,392,624 | | $5,378,440 | | 100.0% | | $43.37 | |
| (Vacancy & Credit Loss) | | 0 | | 0 | | 0 | | (527,966)(3) | | (10.0) | | (4.26) | |
| Effective Gross Income | | $3,127,029 | | $3,950,177 | | $4,392,624 | | $4,850,474 | | 90.2% | | $39.11 | |
| | | | | | | | | | | | | | |
| Real Estate Taxes | | 773,247 | | 319,597 | | 511,272 | | 500,061 | | 10.3 | | 4.03 | |
| Insurance | | 31,507 | | 30,638 | | 31,730 | | 41,187 | | 0.8 | | 0.33 | |
| Management Fee | | 107,727 | | 108,782 | | 110,974 | | 145,514 | | 3.0 | | 1.17 | |
| Other Operating Expenses | | 875,526 | | 873,829 | | 871,576 | | 1,106,538 | | 22.8 | | 8.92 | |
| Total Operating Expenses | | $1,788,007 | | $1,332,846 | | $1,525,552 | | $1,793,300 | | 37.0% | | $14.46 | |
| | | | | | | | | | | | | | |
| Net Operating Income(4) | | $1,339,022 | | $2,617,331 | | $2,867,072 | | $3,057,174 | | 63.0% | | $24.65 | |
| Replacement Reserves | | 0 | | 0 | | 0 | | 24,803 | | 0.5 | | 0.20 | |
| TI/LC | | 0 | | 0 | | 0 | | 186,024 | | 3.8 | | 1.50 | |
| Net Cash Flow | | $1,339,022 | | $2,617,331 | | $2,867,072 | | $2,846,347 | | 58.7% | | $22.95 | |
| | | | | | | | | | | | | | |
| NOI DSCR | | 1.35x | | 2.64x | | 2.89x | | 3.08x | | | | | |
| NCF DSCR | | 1.35x | | 2.64x | | 2.89x | | 2.87x | | | | | |
| NOI Debt Yield | | 5.2% | | 10.2% | | 11.2% | | 11.9% | | | | | |
| NCF Debt Yield | | 5.2% | | 10.2% | | 11.2% | | 11.1% | | | | | |
| (1) | Represents (i) percent of Net Rental Income for all revenue fields, (ii) percent of Gross Potential Rent for Vacancy & Credit Loss and (iii) percent of Effective Gross Income for all other fields. |
| (2) | The U/W Base Rent PSF and U/W Base Rent include contractual rent steps through July 2022 totaling $50,054 as well as straight-line rent averaging credit over the remaining lease term for Connections due to the investment grade nature of the tenant. The current contractual rental rate for Connections is $38.45 per square foot. |
| (3) | The underwritten economic vacancy is 10.0%. The Two Merriweather Property was 93.3% physically occupied as of November 30, 2021. |
| (4) | The Two Merriweather Property was completed in 2017 and was 59.7% occupied in 2018, thus the borrower did not provide financials for that year. Additionally, the increase in Net Operating Income from 2019 to 2020 is due to the lease up of the building from 78.1% occupancy in 2019 to 90.8% in 2020 (see “Operating History and Underwritten Net Cash Flow”). |
THE INFORMATION IN THIS STRUCTURAL AND COLLATERAL TERM SHEET IS NOT COMPLETE AND MAY BE AMENDED PRIOR TO THE TIME OF SALE. THIS TERM SHEET IS NOT AN OFFER TO SELL THESE SECURITIES AND IT IS NOT A SOLICITATION OF AN OFFER TO BUY THESE SECURITIES IN ANY JURISDICTION WHERE THE OFFER OR SALE IS NOT PERMITTED.
155
| No. 14 – RML The Blvd at Hays |
| |
| Mortgage Loan Information | | Mortgaged Property Information |
| Mortgage Loan Seller: | Morgan Stanley Mortgage Capital Holdings LLC | | Single Asset/Portfolio: | Single Asset |
| Credit Assessment (Fitch/KBRA/S&P): | NR/NR/NR | | Property Type – Subtype: | Multifamily – Garden |
| Original Principal Balance: | $24,200,000 | | Location: | Lexington, KY |
| Cut-off Date Balance: | $24,200,000 | | Size: | 308 Units |
| % of Initial Pool Balance: | 2.1% | | Cut-off Date Balance Per Unit: | $78,571 |
| Loan Purpose: | Refinance | | Maturity Date Balance Per Unit: | $78,571 |
| Borrower Sponsor: | RML Construction, LLP | | Year Built/Renovated: | 2015/NAP |
| Guarantor: | RML Construction, LLP | | Title Vesting: | Fee |
| Mortgage Rate: | 2.6150% | | Property Manager: | Self-managed |
| Note Date: | December 21, 2021 | | Current Occupancy (As of): | 99.0% (12/31/2021) |
| Seasoning: | 2 months | | YE 2020 Occupancy: | 99.0% |
| Maturity Date: | January 1, 2032 | | YE 2019 Occupancy: | 94.0% |
| IO Period: | 120 months | | YE 2018 Occupancy: | 97.0% |
| Loan Term (Original): | 120 months | | As-Is Appraised Value(2): | $56,200,000 |
| Amortization Term (Original): | NAP | | As-Is Appraised Value Per Unit: | $182,468 |
| Loan Amortization Type: | Interest Only | | As-Is Appraisal Valuation Date: | October 15, 2021 |
| Call Protection: | L(26),D(90),O(4) | | Underwriting and Financial Information(3) |
| Lockbox Type: | Springing | | TTM NOI (9/30/2021): | $3,258,145 |
| Additional Debt: | None | | YE 2020 NOI: | $3,078,886 |
| Additional Debt Type (Balance): | NAP | | YE 2019 NOI: | $3,035,146 |
| | | | YE 2018 NOI: | $2,802,456 |
| Escrows and Reserves | | U/W Revenues: | $4,405,867 |
| | Initial | Monthly | Cap | | U/W Expenses: | $1,320,213 |
| Taxes: | $60,834 | $20,278 | NAP | | U/W NOI: | $3,085,654 |
| Insurance(1): | $0 | Springing | NAP | | U/W NCF: | $3,008,654 |
| Replacement Reserve: | $0 | $6,417 | NAP | | U/W DSCR based on NOI/NCF: | 4.81x / 4.69x |
| Deferred Maintenance: | $21,406 | $0 | NAP | | U/W Debt Yield based on NOI/NCF: | 12.8% / 12.4% |
| | | | | | U/W Debt Yield at Maturity based on NOI/NCF: | 12.8% / 12.4% |
| | | | | | Cut-off Date LTV Ratio: | 43.1% |
| | | | | | LTV Ratio at Maturity: | 43.1% |
| | | | | | | | |
| Sources and Uses |
| Sources | | | | | Uses | | | |
| Loan Amount | $24,200,000 | | 100.0% | | Loan Payoff | $23,423,133 | | 96.8% |
| | | | | | Return of Equity | 412,485 | | 1.7 |
| | | | | | Closing Costs | 282,142 | | 1.2 |
| | | | | | Reserves | 82,240 | | 0.3 |
| Total Sources | $24,200,000 | | 100.0% | | Total Uses | $24,200,000 | | 100.0% |
| (1) | The RML The Blvd at Hays Mortgage Loan (as defined below) documents do not require ongoing monthly escrows for insurance premiums as long as (i) no event of default has occurred and is continuing, (ii) the borrower provides the lender with written evidence that all required insurance coverages are being maintained in full force and effect, and (iii) the borrower provides the lender with paid receipts for the payment of the insurance premiums at least 20 days prior to the expiration of the policy. |
| (2) | The Appraised Value includes $1,000,000 associated with furniture, fixtures and/or equipment. |
| (3) | The novel coronavirus pandemic is an evolving situation and could impact the RML The Blvd at Hays Mortgage Loan more severely than assumed in the underwriting of the RML The Blvd at Hays Mortgage Loan and could adversely affect the NOI, NCF and occupancy information, as well as the appraised value and the DSCR, LTV and Debt Yield metrics presented above and herein. See "Risk Factors—Risks Related to Market Conditions and Other External Factors—The Coronavirus Pandemic Has Adversely Affected the Global Economy and Will Likely Adversely Affect the Performance of the Mortgage Loans" in the prospectus. |
The Mortgage Loan. The mortgage loan (the “RML The Blvd at Hays Mortgage Loan”) is evidenced by a promissory note in the original principal amount of $24,200,000. The RML The Blvd at Hays Mortgage Loan is secured by a first priority fee mortgage encumbering a multifamily property located in Lexington, Kentucky (the “RML The Blvd at Hays Property”).
The Borrower and the Borrower Sponsor. The borrower is 840 Hays Blvd Partners, LLC, a single-purpose Kentucky limited liability company with one independent director in its organizational structure. The borrower sponsor and non-recourse carveout guarantor is RML Construction, LLP. The borrower is 100.0% owned by RML Construction, LLP. Founded in 1991, RML Construction, LLP is a limited liability partnership that is involved in the construction and rental of duplexes, triplexes, townhomes, and apartments in the Lexington, Kentucky and Knoxville, Tennessee areas. The company currently owns and operates a portfolio of commercial real estate consisting of 13 multifamily properties.
THE INFORMATION IN THIS STRUCTURAL AND COLLATERAL TERM SHEET IS NOT COMPLETE AND MAY BE AMENDED PRIOR TO THE TIME OF SALE. THIS TERM SHEET IS NOT AN OFFER TO SELL THESE SECURITIES AND IT IS NOT A SOLICITATION OF AN OFFER TO BUY THESE SECURITIES IN ANY JURISDICTION WHERE THE OFFER OR SALE IS NOT PERMITTED.
156
| Multifamily – Garden | Loan #14 | Cut-off Date Balance: | | $24,200,000 |
840 Hays Boulevard
Lexington, KY 40509
| RML The Blvd at Hays | Cut-off Date LTV:
U/W NCF DSCR:
U/W NOI Debt Yield: | | 43.1%
4.69x
12.8% |
The borrower is an affiliate of the borrowers under the mortgage loans identified in Annex A-1 to the prospectus as RML Emerald Twenty Four, RML Lexington, RML Savannah Oaks Townhomes, RML Townhomes of Chilesburg Park, RML Glasford Square Townhomes, and RML Artisan Townhomes, all of which are secured by properties located in Lexington, Kentucky.
The Property. The RML The Blvd at Hays Property is a 308-unit garden multifamily apartment complex totaling 337,568 SF situated on an 18.8-acre site that includes 11 three-story apartment buildings and 659 parking spaces (2.14 per unit). The RML The Blvd at Hays Property was built in 2015. Since 2015, the borrower sponsor has invested $762,375 on capital expenditures, including clubhouse renovations, landscaping improvements and pool upgrades. The apartment unit mix is comprised of one-, two- and three-bedroom units ranging in size from 786 to 1,649 SF with an average of 1,096 SF. As of December 31, 2021, the RML The Blvd at Hays Property was 99.0% occupied at an average contract rent of $1,195 per unit per month. Each unit generally features full kitchens with stainless steel appliances, granite countertops, ceramic tile backsplashes, walk-in closets, patio/balcony, central air-conditioning, 9’ ceilings, crown molding, ceiling fan, and washer/dryer hookups. Select units have an in-unit washer/dryer and privately accessible attached garages. Building amenities include a clubhouse, leasing office, coffee bar, fitness center, business center, two swimming pools, and grilling area.
The table below shows the residential apartment unit mix at the RML The Blvd at Hays Property:
Apartment Unit Mix(1)
Unit Mix /
Type | Total Units | Occupied Units | % Occupied | Average SF per
Unit | Monthly Average
Rent per Unit | Monthly Average
Rent PSF |
| One Bedroom | 120 | 118 | 98.3% | 819 | $1,014 | $1.24 |
| Two Bedroom | 144 | 143 | 99.3% | 1,160 | $1,221 | $1.05 |
| Three Bedroom | 44 | 44 | 100.0% | 1,642 | $1,594 | $0.97 |
| Total/Average | 308 | 305 | 99.0% | 1,096 | $1,195 | $1.09 |
| (1) | Borrower rent roll dated December 31, 2021. |
Operating History and Underwritten Net Cash Flow. The following table presents certain information relating to the historical operating performance and Underwritten Net Cash Flow at the RML The Blvd at Hays Property:
Cash Flow Analysis
| | | 2018 | | 2019 | | 2020 | | 9/30/2021 TTM | | UW | | %(1) | | UW per Unit | |
| Gross Potential Rent(2) | | $3,661,302 | | $3,905,196 | | $3,957,075 | | $4,184,468 | | $4,380,574 | | 94.7% | | $14,222.64 | |
| Other Income(3) | | 246,146 | | 228,470 | | 263,413 | | 244,321 | | 244,321 | | 5.3 | | 793.25 | |
| Discounts Concessions | | 0 | | 0 | | 0 | | 0 | | 0 | | 0.0 | | 0.00 | |
| Net Rental Income | | $3,907,448 | | $4,133,665 | | $4,220,488 | | $4,428,789 | | $4,624,896 | | 100.0% | | $15,015.90 | |
| Less Vacancy & Credit Loss | | 0 | | 0 | | 0 | | 0 | | (219,029) | | (5.0) | | (711.13) | |
| Effective Gross Income | | $3,907,448 | | $4,133,665 | | $4,220,488 | | $4,428,789 | | $4,405,867 | | 95.3% | | $14,304.76 | |
| | | | | | | | | | | | | | | | |
| Real Estate Taxes | | 387,234 | | 387,077 | | 388,593 | | 389,912 | | 402,633 | | 9.1 | | 1,307.25 | |
| Insurance | | 90,324 | | 93,275 | | 99,553 | | 106,205 | | 110,876 | | 2.5 | | 359.99 | |
| Other Expenses | | 627,434 | | 618,167 | | 653,456 | | 674,528 | | 806,704 | | 18.3 | | 2,619.17 | |
| Total Expenses | | $1,104,992 | | $1,098,519 | | $1,141,602 | | $1,170,644 | | $1,320,213 | | 30.0% | | $4,286.41 | |
| | | | | | | | | | | | | | | | |
| Net Operating Income | | $2,802,456 | | $3,035,146 | | $3,078,886 | | $3,258,145 | | $3,085,654 | | 70.0% | | $10,018.36 | |
| Capital Expenditures | | 0 | | 0 | | 0 | | 0 | | 77,000 | | 1.7 | | 250.00 | |
| Net Cash Flow | | $2,802,456 | | $3,035,146 | | $3,078,886 | | $3,258,145 | | $3,008,654 | | 68.3% | | $9,768.36 | |
| | | | | | | | | | | | | | | | |
| Occupancy % | | 97.0% | | 94.0% | | 99.0% | | 99.0% | | 95.0%(4) | | | | | |
| NOI DSCR | | 4.37x | | 4.73x | | 4.80x | | 5.08x | | 4.81x | | | | | |
| NCF DSCR | | 4.37x | | 4.73x | | 4.80x | | 5.08x | | 4.69x | | | | | |
| NOI Debt Yield | | 11.6% | | 12.5% | | 12.7% | | 13.5% | | 12.8% | | | | | |
| NCF Debt Yield | | 11.6% | | 12.5% | | 12.7% | | 13.5% | | 12.4% | | | | | |
| (1) | Represents (i) percent of Net Rental Income for all revenue fields, (ii) percent of Gross Potential Rent for Vacancy & Credit Loss and (iii) percent of Effective Gross Income for all other fields. |
| (2) | UW Gross Potential Rent is based on the borrower rent roll dated December 31, 2021. |
| (3) | Other Income is comprised of pet rent, security deposits, late fees and washer/dryer rentals. |
| (4) | The underwritten economic vacancy is 5.0%. The RML The Blvd at Hays Property was 99.0% occupied as of December 31, 2021. |
THE INFORMATION IN THIS STRUCTURAL AND COLLATERAL TERM SHEET IS NOT COMPLETE AND MAY BE AMENDED PRIOR TO THE TIME OF SALE. THIS TERM SHEET IS NOT AN OFFER TO SELL THESE SECURITIES AND IT IS NOT A SOLICITATION OF AN OFFER TO BUY THESE SECURITIES IN ANY JURISDICTION WHERE THE OFFER OR SALE IS NOT PERMITTED.
157
| Multifamily – Garden | Loan #14 | Cut-off Date Balance: | | $24,200,000 |
840 Hays Boulevard
Lexington, KY 40509
| RML The Blvd at Hays | Cut-off Date LTV:
U/W NCF DSCR:
U/W NOI Debt Yield: | | 43.1%
4.69x
12.8% |
The Market. The RML The Blvd at Hays Property is located in Lexington, Kentucky in the East Fayette County multifamily submarket in the Lexington region multifamily market. Regional access to the RML The Blvd at Hays Property is provided by Interstate 75, which is within a mile, and Interstate 64 which is within 5 miles. The RML The Blvd at Hays Property is located approximately 8 miles southeast of downtown Lexington. The Lexington MSA has a population of approximately 520,391, which accounts for approximately 11.5% of the total Kentucky population. The Lexington MSA is driven by the services, retail trade, and manufacturing industries. The largest employer in the Lexington area, The University of Kentucky (16,743 employees), is the largest university in Kentucky with an enrollment totaling more than 30,000 students. The region is home to several Fortune 500 companies, including UPS, Lockheed Martin, Lexmark International Inc., Valvoline, and Pepsi-Cola Bottling Co. According to the appraisal, as of the second quarter of 2021, the vacancy rate in the East Fayette County multifamily submarket was approximately 4.4%, with average asking rents of $881 per unit and inventory of approximately 5,706 units. According to the appraisal, as of the second quarter of 2021, the vacancy rate in the Lexington region multifamily market was approximately 5.0%, with average asking rents of $867 per unit and inventory of approximately 23,663 units. According to the appraisal, the estimated 2021 population within a one-, three- and five-mile radius of the RML The Blvd at Hays Property was 10,237, 39,262 and 99,534 respectively. The estimated 2021 average household income within the same radii was $140,784, $104,839 and $91,563, respectively.
The following table presents certain information relating to comparable multifamily rental properties to the RML The Blvd at Hays Property:
Comparable Multifamily Rental Properties
| Property | Year Built | # Units | Unit Mix | Average SF per Unit | Average Monthly Rent
per Unit | Average Monthly Rent
PSF |
RML The Blvd at Hays(1)
Lexington, KY
(subject property) | 2015 | 308 | 1BR
2BR
3BR | 819
1,160
1,642 | $1,014
$1,221
$1,594 | $1.24
$1.05
$0.97 |
The Retreat at Hamburg Place
Lexington, KY | 2013 | 150 | 1BR
2BR
3BR | 780
1,181
1,434 | $1,255
$1,462
$1,606 | $1.61
$1.24
$1.12 |
Waterstone at Hamburg
Lexington, KY | 2017 | 264 | 1BR
2BR
3BR | 789
1,182
1,401 | $1,468
$1,852
$1,804 | $1.86
$1.57
$1.29 |
The Reserve at Hamburg
Lexington, KY | 1996 | 318 | 1BR
2BR
3BR | 602
1,050
1,200 | $1,032
$1,080
$1,296 | $1.71
$1.03
$1.08 |
Hamburg Farms
Lexington, KY | 2005 | 221 | 1BR
2BR | 1,008
1,401 | $1,338
$1,201 | $1.33
$0.86 |
Source: Appraisal, unless otherwise indicated.
| (1) | Based on the borrower rent roll dated December 31, 2021. |
The following table presents certain information relating to the appraisal’s market rent conclusion for the RML The Blvd at Hays Property:
Market Rent Summary
| Building | Units(1) | Average Size (SF) (1) | Avg. Monthly
Rent per Unit(1) | Avg. Monthly
Rent PSF(1) | Avg. Monthly
Market Rent per
Unit(2) | Avg. Monthly
Market Rent
PSF(2) |
| One Bedroom | 120 | 819 | $1,014 | $1.24 | $1,064 | $1.30 |
| Two Bedroom | 144 | 1,160 | $1,221 | $1.05 | $1,283 | $1.11 |
| Three Bedroom | 44 | 1,642 | $1,594 | $0.97 | $1,670 | $1.02 |
| (1) | Based on the borrower rent roll dated December 31, 2021. |
| (2) | Based on the appraisal. |
THE INFORMATION IN THIS STRUCTURAL AND COLLATERAL TERM SHEET IS NOT COMPLETE AND MAY BE AMENDED PRIOR TO THE TIME OF SALE. THIS TERM SHEET IS NOT AN OFFER TO SELL THESE SECURITIES AND IT IS NOT A SOLICITATION OF AN OFFER TO BUY THESE SECURITIES IN ANY JURISDICTION WHERE THE OFFER OR SALE IS NOT PERMITTED.
158
(THIS PAGE INTENTIONALLY LEFT BLANK)
| No. 15 – One Smithfield Street |
| |
| Mortgage Loan Information | | Mortgaged Property Information |
| Mortgage Loan Seller: | Wells Fargo Bank, National Association | | Single Asset/Portfolio: | Single Asset |
Credit Assessment (Fitch/KBRA/S&P): | NR/NR/NR | | Property Type – Subtype: | Office – CBD |
| Original Principal Balance: | $21,670,000 | | Location: | Pittsburgh, PA |
| Cut-off Date Balance: | $21,670,000 | | Size: | 132,500 SF |
| % of Initial Pool Balance: | 1.8% | | Cut-off Date Balance Per SF: | $163.55 |
| Loan Purpose: | Refinance | | Maturity Date Balance Per SF: | $163.55 |
| Borrower Sponsor: | James D. Scalo | | Year Built/Renovated: | 1962/1987; 2021-2022 |
| Guarantor: | James D. Scalo, John F. Scalo, Susan Mosites Bicket and Steven Mosites, Jr. | | Title Vesting: | Fee |
| Mortgage Rate: | 3.6180% | | Property Manager: | Burns Scalo Management, LLC |
| Note Date: | December 2, 2021 | | Current Occupancy (As of)(5): | 100.0% (3/1/2022) |
| Seasoning: | 3 months | | YE 2021 Occupancy: | 100.0% |
| Maturity Date: | December 11, 2031 | | YE 2020 Occupancy: | 100.0% |
| IO Period: | 120 months | | YE 2019 Occupancy: | 100.0% |
| Loan Term (Original): | 120 months | | YE 2018 Occupancy: | 100.0% |
| Amortization Term (Original): | NAP | | Appraised Value(4)(5): | $32,800,000 |
| Loan Amortization Type: | Interest Only | | Appraised Value Per SF(4)(5): | $247.55 |
| Call Protection: | L(27),D(89),O(4) | | Appraisal Valuation Date(4)(5): | December 1, 2022 |
| Lockbox Type: | Soft/Springing Cash Management | | | |
| Additional Debt: | None | | Underwriting and Financial Information(5) |
| Additional Debt Type (Balance): | NAP | | TTM NOI (9/30/2021): | $1,416,583 |
| | | | YE 2020 NOI: | $1,274,402 |
| | | | YE 2019 NOI: | $1,252,764 |
| | | | YE 2018 NOI: | $1,188,524 |
| | | | U/W Revenues: | $3,060,524 |
| | | | U/W Expenses: | $1,453,615 |
| Escrows and Reserves | | U/W NOI: | $1,606,910 |
| | Initial | Monthly | Cap | | U/W NCF: | $1,579,412 |
| Taxes | $161,110 | $18,418 | NAP | | U/W DSCR based on NOI/NCF: | 2.02x / 1.99x |
| Insurance(1) | $0 | Springing | NAP | | U/W Debt Yield based on NOI/NCF: | 7.4 % / 7.3% |
| Replacement Reserve | $0 | $2,292 | NAP | | U/W Debt Yield at Maturity based on NOI/NCF: | 7.4 % / 7.3% |
| Existing TI/LC Reserve(2) | $3,869,869 | $0 | NAP | | Cut-off Date LTV Ratio(4): | 66.1% |
| Capital Improvements Reserve(3) | $100,788 | $0 | NAP | | LTV Ratio at Maturity(4): | 66.1% |
| | | | | | | |
| | | | | | | | |
| Sources and Uses |
| Sources | | | | | Uses | | | |
| Loan Amount | $21,670,000 | | 100.0% | | Loan Payoff | $10,018,880 | | 46.2% |
| | | | | | Reserves | 4,131,767 | | 19.1 |
| | | | | | Closing Costs | 277,170 | | 1.3 |
| | | | | | Return of Equity | 7,242,183 | | 33.4 |
| Total Sources | $21,670,000 | | 100.0% | | Total Uses | $21,670,000 | | 100.0% |
| (1) | Ongoing monthly insurance reserve deposits in an amount equal to one-twelfth of the insurance premiums that the lender estimates will be payable for the renewal of the required coverages will not be required as long as (a) no event of default is continuing (b) the policies maintained by the borrower is under one or more blanket policies reasonably acceptable to the lender, and (c) the lender has received evidence of the renewal of such policies no later than 10 business days prior to the expiration of the policies. |
| (2) | The Existing TI/LC Reserve represents the amount of outstanding tenant improvement and leasing commissions payable by the borrower under the Allegheny County lease. |
| (3) | The Capital Improvement Reserve represents the amount estimated for substantial completion, as defined in the Allegheny County lease, of lessor’s work. |
| (4) | Represents the Prospective Market Value Upon Completion, which assumes all tenant improvements and capital improvements have been paid. The appraiser concluded to an “as-is” appraised value as of November 3, 2021 of $28,400,000 ($214.34 per square foot), which equates to a cut-off date LTV ratio and LTV ratio at maturity of 76.3% |
| (5) | While the One Smithfield Mortgage Loan (as defined below) was originated after the emergence of the novel coronavirus pandemic and the economic disruption resulting from measures to combat the pandemic, the pandemic is an evolving situation and could impact the One Smithfield Mortgage Loan more severely than assumed in the underwriting of the One Smithfield Mortgage Loan. The pandemic and resulting economic disruption could also adversely affect the NOI, NCF and occupancy information, as well as the appraised value and the DSCR, LTV and Debt Yield metrics presented above. See “Risk Factors—Risks Related to Market Conditions and Other External Factors—Coronavirus Pandemic Has Adversely Affected the Global Economy and Will Likely Adversely Affect the Performance of the Mortgage Loans” in the Preliminary Prospectus. |
THE INFORMATION IN THIS STRUCTURAL AND COLLATERAL TERM SHEET IS NOT COMPLETE AND MAY BE AMENDED PRIOR TO THE TIME OF SALE. THIS TERM SHEET IS NOT AN OFFER TO SELL THESE SECURITIES AND IT IS NOT A SOLICITATION OF AN OFFER TO BUY THESE SECURITIES IN ANY JURISDICTION WHERE THE OFFER OR SALE IS NOT PERMITTED.
160
| Office – CBD | Loan #15 | Cut-off Date Balance: | | $21,670,000 |
| 1 Smithfield Street | One Smithfield Street | Cut-off Date LTV: | | 66.1% |
| Pittsburgh, PA 15222 | | U/W NCF DSCR: | | 1.99x |
| | | U/W NOI Debt Yield: | | 7.4% |
The Mortgage Loan. The mortgage loan (the “One Smithfield Street Mortgage Loan”) is secured by a first priority fee mortgage encumbering a CBD office building totaling 132,500 square feet located in Pittsburgh, Pennsylvania (the “One Smithfield Street Property”).
The Property. The One Smithfield Street Property is a 5-story, office building comprising 132,500 rentable square feet situated on 0.67 acres of land. The property was built in 1962 and is undergoing renovations, which are expected to be completed in December 2022 for a total cost of approximately $4.7 million ($35.47 PSF). Upgrades, which were part of Allegheny County’s lease extension, include $3.9 million of tenant improvements and $830K for additional capital expenditures, which include upgrades to interiors, flooring, electrical, windows, amongst other things. As of March 1, 2022, the One Smithfield Street Property is 100.0% leased to Allegheny County.
The One Smithfield Street Property does not include any parking; however, the property is served by 90 parking spaces at an adjacent surface lot to the west, which is owned by an affiliate of the Borrower and is not part of the loan collateral. This lot is exclusively for the tenant’s and its visitors. The affiliate provides parking via a ground lease between that affiliate and the County of Allegheny, and the ground lease is non-cancellable and co-terminus with the office lease, expiring November 30, 2041.
Major Tenant.
Allegheny County (NR/Aa3/AA-: F/M/S&P; 132,500 square feet, 100.0% of net rentable area; 100.0% of underwritten base rent; November 30, 2041 lease expiration) Allegheny County has been a tenant at the One Smithfield Street Property, which houses the Department of Human Services, for over 18 years. The tenant recently renewed in September 2021 for 20 years through November 2041. The current base rent is $16.94 per square foot and will increase to $19.37 per square foot (14%) on December 1, 2022 with 1.0% annual rent increases thereafter. There are no termination or renewal options.
The following table presents certain information relating to the tenancy at the One Smithfield Street Property:
Major Tenant
| Tenant Name | Credit Rating
(Fitch/Moody’s/
S&P)(1) | Tenant NRSF | % of
NRSF | Annual
U/W Base
Rent
PSF(2) | Annual
U/W Base
Rent(2) | % of Total Annual
U/W Base
Rent | Lease
Expiration
Date | Extension
Options | Termination Option (Y/N) |
| Allegheny County (2) | NR/Aa3/AA- | 132,500 | 100.0% | $19.84 | $2,629,065 | 100.0% | 11/30/2041 | None | N |
| Occupied Collateral Total | 132,500 | 100.0% | $19.84 | $2,629,065 | 100.0% | | | |
Vacant Space | 0 | 0.0% | | | | | | |
| | | | | | | | | |
| Collateral Total | 132,500 | 100.0% | | | | | | |
| | | | | | | | | | |
| (1) | The credit rating represents the rating of the most recent municipal bond offering. |
| (2) | The Annual U/W Base Rent and Annual U/W Base Rent PSF include credit for straight-line rent averaging through loan maturity totaling $384,515. Allegheny County’s current base rent is $16.94 per square foot. |
THE INFORMATION IN THIS STRUCTURAL AND COLLATERAL TERM SHEET IS NOT COMPLETE AND MAY BE AMENDED PRIOR TO THE TIME OF SALE. THIS TERM SHEET IS NOT AN OFFER TO SELL THESE SECURITIES AND IT IS NOT A SOLICITATION OF AN OFFER TO BUY THESE SECURITIES IN ANY JURISDICTION WHERE THE OFFER OR SALE IS NOT PERMITTED.
161
| Office – CBD | Loan #15 | Cut-off Date Balance: | | $21,670,000 |
| 1 Smithfield Street | One Smithfield Street | Cut-off Date LTV: | | 66.1% |
| Pittsburgh, PA 15222 | | U/W NCF DSCR: | | 1.99x |
| | | U/W NOI Debt Yield: | | 7.4% |
The following table presents certain information relating to the lease rollover schedule at the One Smithfield Street Property:
Lease Expiration Schedule(1)
Year Ending
December 31, | No. of Leases Expiring | Expiring NRSF | % of Total NRSF | Cumulative Expiring NRSF | Cumulative % of Total
NRSF | Annual
U/W
Base Rent | % of Total Annual U/W Base Rent | Annual
U/W
Base Rent
PSF |
| MTM | 0 | 0 | 0.0% | 0 | 0.0% | $0 | 0.0% | $0.00 |
| 2021 | 0 | 0 | 0.0% | 0 | 0.0% | $0 | 0.0% | $0.00 |
| 2022 | 0 | 0 | 0.0% | 0 | 0.0% | $0 | 0.0% | $0.00 |
| 2023 | 0 | 0 | 0.0% | 0 | 0.0% | $0 | 0.0% | $0.00 |
| 2024 | 0 | 0 | 0.0% | 0 | 0.0% | $0 | 0.0% | $0.00 |
| 2025 | 0 | 0 | 0.0% | 0 | 0.0% | $0 | 0.0% | $0.00 |
| 2026 | 0 | 0 | 0.0% | 0 | 0.0% | $0 | 0.0% | $0.00 |
| 2027 | 0 | 0 | 0.0% | 0 | 0.0% | $0 | 0.0% | $0.00 |
| 2028 | 0 | 0 | 0.0% | 0 | 0.0% | $0 | 0.0% | $0.00 |
| 2029 | 0 | 0 | 0.0% | 0 | 0.0% | $0 | 0.0% | $0.00 |
| 2030 | 0 | 0 | 0.0% | 0 | 0.0% | $0 | 0.0% | $0.00 |
| 2031 | 0 | 0 | 0.0% | 0 | 0.0% | $0 | 0.0% | $0.00 |
| Thereafter | 1 | 132,500 | 100.0% | 132,500 | 100.0% | $2,629,065 | 100.0% | $19.84 |
| Vacant | 0 | 0 | 0.0% | 0 | 0.0% | $0 | 0.0% | $0.00 |
| Total/Weighted Average | 1 | 132,500 | 100.0% | | | $2,629,065 | 100.0% | $19.84 |
| (1) | Information obtained from the underwritten rent roll. |
The following table presents historical occupancy percentages at the One Smithfield Street Property:
Historical Occupancy
12/31/2017(1) | 12/31/2018(1) | 12/31/2019(1) | 12/31/2020(1) | 3/1/2022(2) |
| 100.0% | 100.0% | 100.0% | 100.0% | 100.0% |
| (1) | Information obtained from the borrower. |
| (2) | Information obtained from the underwritten rent roll. |
COVID-19 Update. As of February 16, 2022 the One Smithfield Street Property is open and operating. There were no rent relief requests requested or granted. The borrower is current on debt service payments through February 2022.
Market Overview and Competition. The One Smithfield Street Property is located in the Pittsburgh, PA Metropolitan Statistical Area. The Property is located at the northwest corner of Smithfield Street and Fort Pitt Boulevard, with access to I-376 and I-279 approximately 0.5-miles northwest. The nearest bus/train station is located within a 5-minute walk of the property. Major employers in the MSA include UPMC Health System, Highmark Inc., University of Pittsburgh, and the PNC Financial Services Group Inc.
According to the appraisal, the estimated 2021 population within a one-, three- and five-mile radius of the One Smithfield Street Property was approximately 21,123, 148,771, and 388,483, respectively; and the estimated 2021 median household income within the same radii was approximately $69,378, $46,667, and $56,240, respectively.
According to a third-party market research report, the property is located in the CBD submarket of the Pittsburgh office market. As of the February 9, 2022, the submarket contained approximately 34.3 million SF of office space, with an overall vacancy rate of 14.2% and average asking rent of $26.09 PSF. The appraiser identified four lease comparables with rents ranging from $16.95 net to $24.50 PSF, gross and concluded to market rent for the office space at the One Smithfield Street Property of $22.00 PSF (see table below).
THE INFORMATION IN THIS STRUCTURAL AND COLLATERAL TERM SHEET IS NOT COMPLETE AND MAY BE AMENDED PRIOR TO THE TIME OF SALE. THIS TERM SHEET IS NOT AN OFFER TO SELL THESE SECURITIES AND IT IS NOT A SOLICITATION OF AN OFFER TO BUY THESE SECURITIES IN ANY JURISDICTION WHERE THE OFFER OR SALE IS NOT PERMITTED.
162
| Office – CBD | Loan #15 | Cut-off Date Balance: | | $21,670,000 |
| 1 Smithfield Street | One Smithfield Street | Cut-off Date LTV: | | 66.1% |
| Pittsburgh, PA 15222 | | U/W NCF DSCR: | | 1.99x |
| | | U/W NOI Debt Yield: | | 7.4% |
The following table presents certain information relating to the appraisal’s market rent conclusion for the One Smithfield Street Property:
Market Rent Summary(1)
| | Office |
| Market Rent (PSF) | $22.00 |
| Lease Term (Years) | 10 |
| Lease Type (Reimbursements) | FSG with expense stop |
| Rent Increase Projection | 2% per annum |
| Concessions | NAV |
| Tenant Improvements (New Tenants) (PSF) | $20.00 |
| Tenant Improvements (Renewals) (PSF) | $5.00 |
| (1) | Information obtained from the appraisal. |
The table below presents certain information relating to comparable sales pertaining to the One Smithfield Street Property identified by the appraiser:
Comparable Sales(1)
| Property Name | Location | Year
Built/Renovated | Occupancy | Rentable Area
(SF) | Sale Date | Sale Price | Sale Price (PSF) |
| One Smithfield Street (Subject) | Pittsburgh, PA | 1962/1987; 2021-2022 | 100%(2) | 132,500(2) | NAP | NAP | NAP |
Bridgeside Point I
100 Technology Drive | Pittsburgh, PA | 2001/NAP | 95% | 153,110 | Jun-2021 | $48,600,000 | $317 |
SAP Center
271 North Shore Drive | Pittsburgh, PA | 2019/NAP | 83% | 170,434 | Jun-2021 | $48,750,000 | $286 |
Resource Building
225 North Shore Drive | Pittsburgh, PA | 2005/NAP | 100% | 178,049 | Jun-2019 | $40,000,000 | $225 |
Stealth 2 Technology Center
501 Technology Drive | Canonsburg, PA | 2000/NAP | 100% | 98,314 | May-2019 | $22,315,669 | $227 |
Park Lane Office Park
3000 Park LAne | Pittsburgh, PA | 1989/2009 | 100% | 105,315 | May-2019 | $23,800,000 | $226 |
PA Department of Labor Industry
144 North Main Street | Greensburg, PA | 2007/NAP | 100% | 81,639 | Apr-2019 | $15,450,000 | $189 |
| (1) | Information obtained from the appraisal. |
| (2) | Information obtained from the underwritten rent roll. |
THE INFORMATION IN THIS STRUCTURAL AND COLLATERAL TERM SHEET IS NOT COMPLETE AND MAY BE AMENDED PRIOR TO THE TIME OF SALE. THIS TERM SHEET IS NOT AN OFFER TO SELL THESE SECURITIES AND IT IS NOT A SOLICITATION OF AN OFFER TO BUY THESE SECURITIES IN ANY JURISDICTION WHERE THE OFFER OR SALE IS NOT PERMITTED.
163
| Office – CBD | Loan #15 | Cut-off Date Balance: | | $21,670,000 |
| 1 Smithfield Street | One Smithfield Street | Cut-off Date LTV: | | 66.1% |
| Pittsburgh, PA 15222 | | U/W NCF DSCR: | | 1.99x |
| | | U/W NOI Debt Yield: | | 7.4% |
The following table presents certain information relating to comparable office leases related to One Smithfield Street Property:
Comparable Office Leases(1)
| Property Name/Location | Year Built/ Renovated | Total GLA (SF) | Occupancy | Tenant | Tenant
Size (SF) | Lease
Start
Date | Lease
Term | Annual
Base Rent
PSF | Lease Type |
One Smithfield Street (Subject)
1 Smithfield Street
Pittsburgh, PA | 1962/1987; 2021-2022 | 132,500(2) | 100.0%(2) | Allegheny County(2) | 132,500(2) | Sept-2021(2) | 20.3 Yrs. (2) | $19.84(2) | NNN(2) |
Penn Center East V
500 Penn Center Boulevard
Pittsburgh, PA | 1976/NAP | 119,500 | NAV | Ibex | 68,661 | Feb-2022 | 7.6 Yrs. | $19.00 | Modified gross |
100 South Commons
100 South Commons
Pittsburgh, PA
| 1968/2017 | 840,000 | NAV | Gecko Robotics | 67,897 | Oct-2021 | 10.0 Yrs. | $24.22 | Gross |
Park Lane Office Park
3000 Park Lane
Pittsburgh, PA
| 1989/2009 | 105,315 | 100.0% | Cigna | 105,315 | Aug-2019 | 10.0 Yrs. | $16.95 | Absolute Net |
135 Jamison Lane
135 Jamison Lane
Monroeville, PA
| 1983/2018 | 269,000 | 100.0% | Bechtel Plant Machinery | 269,000 | Feb-2019 | 10.0 Yrs. | $24.50 | Gross |
| (1) | Information obtained from the appraisal. |
| (2) | Information obtained from the underwritten rent roll. |
THE INFORMATION IN THIS STRUCTURAL AND COLLATERAL TERM SHEET IS NOT COMPLETE AND MAY BE AMENDED PRIOR TO THE TIME OF SALE. THIS TERM SHEET IS NOT AN OFFER TO SELL THESE SECURITIES AND IT IS NOT A SOLICITATION OF AN OFFER TO BUY THESE SECURITIES IN ANY JURISDICTION WHERE THE OFFER OR SALE IS NOT PERMITTED.
164
| Office – CBD | Loan #15 | Cut-off Date Balance: | | $21,670,000 |
| 1 Smithfield Street | One Smithfield Street | Cut-off Date LTV: | | 66.1% |
| Pittsburgh, PA 15222 | | U/W NCF DSCR: | | 1.99x |
| | | U/W NOI Debt Yield: | | 7.4% |
Operating History and Underwritten Net Cash Flow. The following table presents certain information relating to the historical operating performance and underwritten net cash flow at the One Smithfield Street Property:
Cash Flow Analysis
| | | 2018 | | 2019 | | 2020 | | TTM
9/30/2021 | | U/W | | %(1) | | U/W $
per SF | |
| Base Rent | | $2,116,025 | | $2,173,110 | | $2,178,300 | | $2,178,300 | | $2,629,065(2) | | 83.7% | | $19.84 | |
| Grossed Up Vacant Space | | 0 | | 0 | | 0 | | 0 | | 0 | | 0.0 | | 0.00 | |
| Gross Potential Rent | | $2,116,025 | | $2,173,110 | | $2,178,300 | | $2,178,300 | | $2,629,065 | | 83.7% | | $19.84 | |
| Total Recoveries | | 448,324 | | 464,640 | | 477,960 | | 497,183 | | 510,331 | | 16.3 | | 3.85 | |
| Net Rental Income | | $2,564,349 | | $2,637,750 | | $2,656,260 | | $2,675,483 | | $3,139,396 | | 100.0% | | $23.69 | |
| (Vacancy & Credit Loss) | | 0 | | 0 | | 0 | | 0 | | (78,872)(3) | | (3.0)(3) | | (0.60) | |
| Effective Gross Income | | $2,564,349 | | $2,637,750 | | $2,656,260 | | $2,675,483 | | $3,060,524 | | 97.5% | | $23.10 | |
| | | | | | | | | | | | | | | | |
| Real Estate Taxes | | 196,270 | | 196,270 | | 197,224 | | 197,224 | | 207,886 | | 6.8 | | 1.57 | |
| Insurance | | 26,471 | | 27,112 | | 25,556 | | 22,822 | | 17,920 | | 0.6 | | 0.14 | |
| Management Fee | | 76,928 | | 79,461 | | 79,782 | | 80,358 | | 91,816 | | 3.0 | | 0.69 | |
| Other Operating Expenses | | 1,076,156 | | 1,082,143 | | 1,079,297 | | 958,496 | | 1,135,993 | | 37.1 | | 8.57 | |
| Total Operating Expenses | | $1,375,824 | | $1,384,986 | | $1,381,858 | | $1,258,901 | | $1,453,615 | | 47.5% | | $10.97 | |
| | | | | | | | | | | | | | | | |
| Net Operating Income | | $1,188,524 | | $1,252,764 | | $1,274,402 | | $1,416,583 | | $1,606,910 | | 52.5% | | $12.13 | |
| Replacement Reserves | | 0 | | 0 | | 0 | | 0 | | 27,498 | | 0.9 | | 0.21 | |
| TI/LC | | 0 | | 0 | | 0 | | 0 | | 0 | | 0.0 | | 0.00 | |
| Net Cash Flow | | $1,188,524 | | $1,252,764 | | $1,274,402 | | $1,416,583 | | $1,579,412 | | 51.6% | | $11.92 | |
| | | | | | | | | | | | | | | | |
| NOI DSCR | | 1.50x | | 1.58x | | 1.60x | | 1.78x | | 2.02x | | | | | |
| NCF DSCR | | 1.50x | | 1.58x | | 1.60x | | 1.78x | | 1.99x | | | | | |
| NOI Debt Yield | | 5.5% | | 5.8% | | 5.9% | | 6.5% | | 7.4% | | | | | |
| NCF Debt Yield | | 5.5% | | 5.8% | | 5.9% | | 6.5% | | 7.3% | | | | | |
| (1) | Represents (i) percent of Net Rental Income for all revenue fields, (ii) percent of Gross Potential Rent for Vacancy & Credit Loss and (iii) percent of Effective Gross Income for all other fields. |
| (2) | Includes credit for straight-line rent averaging through loan maturity totaling $384,515. |
| (3) | The underwritten economic vacancy is 3.0%. The One Smithfield Street Property was 100.0% leased as of March 1, 2022. |
THE INFORMATION IN THIS STRUCTURAL AND COLLATERAL TERM SHEET IS NOT COMPLETE AND MAY BE AMENDED PRIOR TO THE TIME OF SALE. THIS TERM SHEET IS NOT AN OFFER TO SELL THESE SECURITIES AND IT IS NOT A SOLICITATION OF AN OFFER TO BUY THESE SECURITIES IN ANY JURISDICTION WHERE THE OFFER OR SALE IS NOT PERMITTED.
165
| BANK 2022-BNK40 | Transaction Contact Information |
VI. Transaction Contact Information
Questions regarding this Structural and Collateral Term Sheet may be directed to any of the following individuals:
| Wells Fargo Securities, LLC | |
| | |
| Brigid Mattingly | Tel. (312) 269-3062 |
| | |
| A.J. Sfarra | Tel. (212) 214-5613 |
| | |
| Sean Duffy | Tel. (312) 827-1518 |
| BofA Securities, Inc. | |
| | |
| Leland F. Bunch, III | Tel. (646) 855-3953 |
| | |
| Danielle Caldwell | Tel. (646) 855-3421 |
| Morgan Stanley & Co. | |
| | |
| Nishant Kapur | Tel. (212) 761-1483 |
| | |
| Jane Lam | Tel. (212) 761-3507 |
| | |
| Brandon Atkins | Tel. (212) 761-4846 |
THE INFORMATION IN THIS STRUCTURAL AND COLLATERAL TERM SHEET IS NOT COMPLETE AND MAY BE AMENDED PRIOR TO THE TIME OF SALE. THIS TERM SHEET IS NOT AN OFFER TO SELL THESE SECURITIES AND IT IS NOT A SOLICITATION OF AN OFFER TO BUY THESE SECURITIES IN ANY JURISDICTION WHERE THE OFFER OR SALE IS NOT PERMITTED.
166