| | | FREE WRITING PROSPECTUS |
| | | FILED PURSUANT TO RULE 433 |
| | | REGISTRATION FILE NO.: 333-257991-04 |
| | | |
Free Writing Prospectus
Structural and Collateral Term Sheet
$531,901,217
(Approximate Initial Pool Balance)
Wells Fargo Commercial Mortgage Trust 2022-C62
as Issuing Entity
Wells Fargo Commercial Mortgage Securities, Inc.
as Depositor
LMF Commercial, LLC
Argentic Real Estate Finance LLC
BSPRT CMBS Finance, LLC
UBS AG
Wells Fargo Bank, National Association
as Sponsors and Mortgage Loan Sellers
Commercial Mortgage Pass-Through Certificates
Series 2022-C62
March 23, 2022
WELLS FARGO
SECURITIES Co-Lead Manager and Joint Bookrunner | | UBS SECURITIES LLC Co-Lead Manager and Joint Bookrunner |
| | | |
Academy Securities Co-Manager | Drexel Hamilton Co-Manager | Siebert Williams Shank Co-Manager |
STATEMENT REGARDING THIS FREE WRITING PROSPECTUS
The depositor has filed a registration statement (including a prospectus) with the Securities and Exchange Commission (“SEC”) (SEC File No. 333-257991) for the offering to which this communication relates. Before you invest, you should read the prospectus in the registration statement and other documents the depositor has filed with the SEC for more complete information about the depositor, the issuing entity and this offering. You may get these documents for free by visiting EDGAR on the SEC Web site at www.sec.gov. Alternatively, the depositor, any underwriter, or any dealer participating in the offering will arrange to send you the prospectus after filing if you request it by calling toll free 1-800-745-2063 (8 a.m. – 5 p.m. EST) or by emailing wfs.cmbs@wellsfargo.com.
Nothing in this document constitutes an offer of securities for sale in any jurisdiction where the offer or sale is not permitted. The information contained herein is preliminary as of the date hereof, supersedes any such information previously delivered to you and will be superseded by any such information subsequently delivered and ultimately by the final prospectus relating to the securities. These materials are subject to change, completion, supplement or amendment from time to time.
This free writing prospectus has been prepared by the underwriters for information purposes only and does not constitute, in whole or in part, a prospectus for the purposes of (i) Regulation (EU) 2017/1129 (as amended), (ii) such Regulation as it forms part of UK domestic law, or (iii) Part VI of the UK Financial Services and Markets Act 2000, as amended; and does not constitute an offering document for any other purpose.
STATEMENT REGARDING ASSUMPTIONS AS TO SECURITIES, PRICING ESTIMATES AND OTHER INFORMATION
The attached information contains certain tables and other statistical analyses (the “Computational Materials”) which have been prepared in reliance upon information furnished by the Mortgage Loan Sellers. Numerous assumptions were used in preparing the Computational Materials, which may or may not be reflected herein. As such, no assurance can be given as to the Computational Materials’ accuracy, appropriateness or completeness in any particular context; or as to whether the Computational Materials and/or the assumptions upon which they are based reflect present market conditions or future market performance. The Computational Materials should not be construed as either projections or predictions or as legal, tax, financial or accounting advice. You should consult your own counsel, accountant and other advisors as to the legal, tax, business, financial and related aspects of a purchase of these securities. Any weighted average lives, yields and principal payment periods shown in the Computational Materials are based on prepayment and/or loss assumptions, and changes in such prepayment and/or loss assumptions may dramatically affect such weighted average lives, yields and principal payment periods. In addition, it is possible that prepayments or losses on the underlying assets will occur at rates higher or lower than the rates shown in the attached Computational Materials. The specific characteristics of the securities may differ from those shown in the Computational Materials due to differences between the final underlying assets and the preliminary underlying assets used in preparing the Computational Materials. The principal amount and designation of any security described in the Computational Materials are subject to change prior to issuance. None of Wells Fargo Securities, LLC, UBS Securities, LLC, Academy Securities, Inc., Drexel Hamilton, LLC, Siebert Williams Shank & Co., LLC or any of their respective affiliates, make any representation or warranty as to the actual rate or timing of payments or losses on any of the underlying assets or the payments or yield on the securities. The information in this presentation is based upon management forecasts and reflects prevailing conditions and management’s views as of this date, all of which are subject to change. In preparing this presentation, we have relied upon and assumed, without independent verification, the accuracy and completeness of all information available from public sources or which was provided to us by or on behalf of the Mortgage Loan Sellers or which was otherwise reviewed by us.
This free writing prospectus contains certain forward-looking statements. If and when included in this free writing prospectus, the words “expects”, “intends”, “anticipates”, “estimates” and analogous expressions and all statements that are not historical facts, including statements about our beliefs or expectations, are intended to identify forward-looking statements. Any forward-looking statements are made subject to risks and uncertainties which could cause actual results to differ materially from those stated. Those risks and uncertainties include, among other things, declines in general economic and business conditions, increased competition, changes in demographics, changes in political and social conditions, regulatory initiatives and changes in customer preferences, many of which are beyond our control and the control of any other person or entity related to this offering. The forward-looking statements made in this free writing prospectus are made as of the date stated on the cover. We have no obligation to update or revise any forward-looking statement.
Wells Fargo Securities is the trade name for the capital markets and investment banking services of Wells Fargo & Company and its subsidiaries, including but not limited to Wells Fargo Securities, LLC, a member of NYSE, FINRA, NFA and SIPC, Wells Fargo Prime Services, LLC, a member of FINRA, NFA and SIPC, and Wells Fargo Bank, N.A. Wells Fargo Securities, LLC and Wells Fargo Prime Services, LLC are distinct entities from affiliated banks and thrifts.
IMPORTANT NOTICE REGARDING THE OFFERED CERTIFICATES
The information herein is preliminary and may be supplemented or amended prior to the time of sale. In addition, the Offered Certificates referred to in these materials and the asset pool backing them are subject to modification or revision (including the possibility that one or more classes of certificates may be split, combined or eliminated at any time prior to issuance or availability of a final prospectus) and are offered on a “when, as and if issued” basis.
The underwriters described in these materials may from time to time perform investment banking services for, or solicit investment banking business from, any company named in these materials. The underwriters and/or their affiliates or respective employees may from time to time have a long or short position in any security or contract discussed in these materials.
The information contained herein supersedes any previous such information delivered to any prospective investor and will be superseded by information delivered to such prospective investor prior to the time of sale.
IMPORTANT NOTICE RELATING TO AUTOMATICALLY-GENERATED EMAIL DISCLAIMERS
Any legends, disclaimers or other notices that may appear at the bottom of any email communication to which this free writing prospectus is attached relating to (1) these materials not constituting an offer (or a solicitation of an offer), (2) any representation that these materials are accurate or complete and may not be updated or (3) these materials possibly being confidential, are not applicable to these materials and should be disregarded. Such legends, disclaimers or other notices have been automatically generated as a result of these materials having been sent via Bloomberg or another system.
THE INFORMATION IN THIS COLLATERAL TERM SHEET IS NOT COMPLETE AND MAY BE AMENDED PRIOR TO THE TIME OF SALE. THIS TERM SHEET IS NOT AN OFFER TO SELL THESE SECURITIES AND IT IS NOT A SOLICITATION OF AN OFFER TO BUY THESE SECURITIES IN ANY JURISDICTION WHERE THE OFFER OR SALE IS NOT PERMITTED.
2
| Wells Fargo Commercial Mortgage Trust 2022-C62 | | Transaction Highlights |
Mortgage Loan Sellers:
| Mortgage Loan Seller | | Number of
Mortgage Loans | | Number of
Mortgaged
Properties | | Aggregate Cut-off Date Balance | | % of Initial Pool
Balance |
| LMF Commercial, LLC | | 16 | | | 19 | | | $145,385,000 | | | 27.3 | % |
| Argentic Real Estate Finance LLC | | 11 | | | 14 | | | 140,378,871 | | | 26.4 | |
| BSPRT CMBS Finance, LLC | | 7 | | | 7 | | | 85,299,134 | | | 16.0 | |
| UBS AG | | 7 | | | 32 | | | 84,175,000 | | | 15.8 | |
| Wells Fargo Bank, National Association | | 5 | | | 10 | | | 76,663,212 | | | 14.4 | |
| Total | | 46 | | | 82 | | | $531,901,217 | | | 100.0 | % |
Loan Pool:
| Initial Pool Balance: | $531,901,217 |
| Number of Mortgage Loans: | 46 |
| Average Cut-off Date Balance per Mortgage Loan: | $11,563,070 |
| Number of Mortgaged Properties: | 82 |
| Average Cut-off Date Balance per Mortgaged Property(1): | $6,486,600 |
| Weighted Average Mortgage Interest Rate: | 4.3758% |
| Ten Largest Mortgage Loans as % of Initial Pool Balance: | 48.6% |
| Weighted Average Original Term to Maturity or ARD (months): | 116 |
| Weighted Average Remaining Term to Maturity or ARD (months): | 114 |
| Weighted Average Original Amortization Term (months)(2): | 360 |
| Weighted Average Remaining Amortization Term (months)(2): | 359 |
| Weighted Average Seasoning (months): | 1 |
| (1) | Information regarding mortgage loans secured by multiple properties is based on an allocation according to relative appraised values or the allocated loan amounts or property-specific release prices set forth in the related loan documents or such other allocation as the related mortgage loan seller deemed appropriate. |
| (2) | Excludes any mortgage loan that does not amortize. |
Credit Statistics:
| Weighted Average U/W Net Cash Flow DSCR(1)(2): | 2.23x |
| Weighted Average U/W Net Operating Income Debt Yield(1)(2): | 11.1% |
| Weighted Average Cut-off Date Loan-to-Value Ratio(1)(2): | 58.2% |
| Weighted Average Balloon or ARD Loan-to-Value Ratio(1)(2): | 56.1% |
| % of Mortgage Loans with Additional Subordinate Debt(3): | 2.8% |
| % of Mortgage Loans with Single Tenants(4): | 6.2% |
| (1) | With respect to any mortgage loan that is part of a whole loan, loan-to-value ratio, debt service coverage ratio and debt yield calculations include the related pari passu companion loan(s) but exclude any related subordinate companion loan(s) (unless otherwise stated). The debt service coverage ratio, debt yield and loan-to-value ratio information do not take into account any subordinate debt (whether or not secured by the related mortgaged property), that currently exists or is allowed under the terms of any mortgage loan. See “Description of the Mortgage Pool—Mortgage Pool Characteristics” in the Preliminary Prospectus and Annex A-1 to the Preliminary Prospectus. |
| (2) | For certain of the mortgage loans, underwritten net cash flow, underwritten net operating income and appraised values of the related mortgaged properties were determined, or were calculated based on information as of a date, prior to the emergence of the novel coronavirus pandemic and the economic disruption resulting from measures to combat the pandemic, and the loan-to-value, debt service coverage and debt yield metrics presented in this term sheet may not reflect current market conditions. |
| (3) | The percentage figure expressed as “% of Mortgage Loans with Additional Subordinate Debt” is determined as a percentage of the initial pool balance and does not take into account any future subordinate debt (whether or not secured by the mortgaged property), if any, that may be permitted under the terms of any mortgage loan or the pooling and servicing agreement. See “Description of the Mortgage Pool—Additional Indebtedness” in the Preliminary Prospectus. |
| (4) | Excludes mortgage loans that are secured by multiple single tenant properties. |
THE INFORMATION IN THIS COLLATERAL TERM SHEET IS NOT COMPLETE AND MAY BE AMENDED PRIOR TO THE TIME OF SALE. THIS TERM SHEET IS NOT AN OFFER TO SELL THESE SECURITIES AND IT IS NOT A SOLICITATION OF AN OFFER TO BUY THESE SECURITIES IN ANY JURISDICTION WHERE THE OFFER OR SALE IS NOT PERMITTED.
3
| Wells Fargo Commercial Mortgage Trust 2022-C62 | | Characteristics of the Mortgage Pool |
| II. | Summary of the Whole Loans |
| No. | Loan Name | Mortgage Loan Seller in WFCM 2022-C62 | Trust Cut-off Date Balance | Aggregate Pari Passu Companion Loan Cut-off Date Balance(1) | Controlling Pooling/Trust & Servicing Agreement | Master Servicer | Special Servicer | Related Pari Passu Companion Loan(s) Securitizations | Related Pari Passu Companion Loan(s) Original Balance |
| 1 | Pacific Castle Portfolio | AREF | $44,700,000 | $64,700,000 | WFCM 2022-C62 | Wells Fargo Bank, National Association | Argentic Services Company, LP | Future Securitizations | $20,000,000 |
| 9 | GS Foods Portfolio | WFB | $17,520,000 | $57,520,000 | BANK 2022-BNK40 | Wells Fargo Bank, National Association | CWCapital Asset Management LLC | BANK 2022-BNK40 | $40,000,000 |
| 13 | ILPT Logistics Portfolio | UBS AG | $15,000,000 | $341,140,000 | ILPT 2022-LPFX | Berkadia Commercial Mortgage, LLC | Situs Holdings, LLC | ILPT 2022-LPFX | $326,140,000 |
| 17 | The Hallmark | BSPRT | $12,175,118 | $34,040,636 | BBCMS 2022-C14 | Midland Loan Services, a Division of PNC Bank National Association | Midland Loan Services, a Division of PNC Bank National Association | BBCMS 2022-C14 | $21,865,518 |
| (1) | The Aggregate Pari Passu Companion Loan Cut-off Date Balance excludes any related Subordinate Companion Loans. |
THE INFORMATION IN THIS COLLATERAL TERM SHEET IS NOT COMPLETE AND MAY BE AMENDED PRIOR TO THE TIME OF SALE. THIS TERM SHEET IS NOT AN OFFER TO SELL THESE SECURITIES AND IT IS NOT A SOLICITATION OF AN OFFER TO BUY THESE SECURITIES IN ANY JURISDICTION WHERE THE OFFER OR SALE IS NOT PERMITTED.
4
| Wells Fargo Commercial Mortgage Trust 2022-C62 | | Characteristics of the Mortgage Pool |
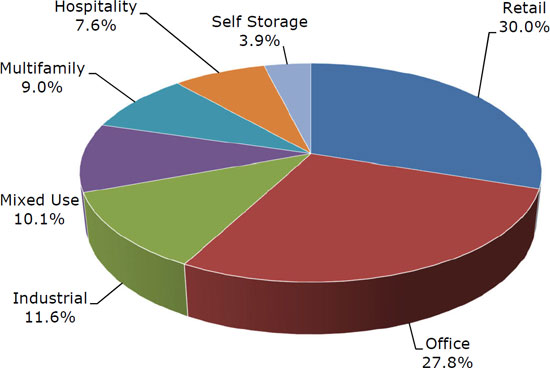
| III. | Property Type Distribution(1) |
| Property Type | | Number of
Mortgaged
Properties | | Aggregate
Cut-off Date
Balance ($) | | % of Initial
Pool
Balance
(%) | | Weighted
Average
Cut-off Date
LTV Ratio
(%) | | Weighted
Average
Balloon
LTV
Ratio (%) | | Weighted
Average
U/W NCF
DSCR (x) | | Weighted
Average
U/W NOI
Debt Yield (%) | | Weighted
Average
U/W NCF
Debt Yield
(%) | | Weighted
Average
Mortgage
Rate (%) |
| Retail | | 20 | | | $159,653,064 | | | 30.0 | % | | 62.5 | % | | 61.2 | % | | 2.16 | x | | 10.1 | % | | 9.5 | % | | 4.2741 | % |
| Anchored | | 8 | | | 118,488,064 | | | 22.3 | | | 63.4 | | | 61.6 | | | 2.23 | | | 10.5 | | | 9.8 | | | 4.2280 | |
| Single Tenant | | 12 | | | 41,165,000 | | | 7.7 | | | 59.8 | | | 59.8 | | | 1.96 | | | 8.9 | | | 8.7 | | | 4.4067 | |
| Office | | 8 | | | 147,725,118 | | | 27.8 | | | 56.0 | | | 54.1 | | | 2.34 | | | 12.0 | | | 11.2 | | | 4.5587 | |
| Suburban | | 5 | | | 82,425,118 | | | 15.5 | | | 58.1 | | | 54.6 | | | 2.16 | | | 11.4 | | | 10.6 | | | 4.4002 | |
| CBD | | 2 | | | 55,500,000 | | | 10.4 | | | 51.8 | | | 51.8 | | | 2.76 | | | 13.5 | | | 12.6 | | | 4.6333 | |
| Medical | | 1 | | | 9,800,000 | | | 1.8 | | | 62.9 | | | 62.9 | | | 1.49 | | | 8.3 | | | 8.2 | | | 5.4700 | |
| Industrial | | 26 | | | 61,870,000 | | | 11.6 | | | 49.8 | | | 48.0 | | | 2.25 | | | 10.5 | | | 9.8 | | | 3.9717 | |
| Flex | | 3 | | | 29,350,000 | | | 5.5 | | | 50.1 | | | 50.1 | | | 2.28 | | | 10.3 | | | 9.6 | | | 4.1350 | |
| Warehouse/Distribution | | 14 | | | 13,984,071 | | | 2.6 | | | 29.0 | | | 29.0 | | | 3.12 | | | 13.2 | | | 12.2 | | | 3.8647 | |
| Cold Storage | | 2 | | | 10,363,713 | | | 1.9 | | | 67.2 | | | 60.9 | | | 1.45 | | | 8.6 | | | 8.1 | | | 3.7900 | |
| Warehouse/Cold Storage | | 2 | | | 5,159,327 | | | 1.0 | | | 67.2 | | | 60.9 | | | 1.45 | | | 8.6 | | | 8.1 | | | 3.7900 | |
| Cold Storage/Warehouse/Distribution | | 1 | | | 1,495,160 | | | 0.3 | | | 67.2 | | | 60.9 | | | 1.45 | | | 8.6 | | | 8.1 | | | 3.7900 | |
| Manufacturing/Warehouse | | 3 | | | 1,015,929 | | | 0.2 | | | 29.0 | | | 29.0 | | | 3.12 | | | 13.2 | | | 12.2 | | | 3.8647 | |
| Manufacturing/Cold Storage/Warehouse | | 1 | | | 501,800 | | | 0.1 | | | 67.2 | | | 60.9 | | | 1.45 | | | 8.6 | | | 8.1 | | | 3.7900 | |
| Mixed Use | | 10 | | | 53,745,000 | | | 10.1 | | | 63.1 | | | 62.6 | | | 1.94 | | | 9.2 | | | 8.9 | | | 4.5762 | |
| Multifamily/Retail | | 5 | | | 31,895,000 | | | 6.0 | | | 67.1 | | | 67.1 | | | 1.75 | | | 8.1 | | | 8.0 | | | 4.6656 | |
| Multifamily/Office/Retail | | 1 | | | 6,200,000 | | | 1.2 | | | 57.9 | | | 57.9 | | | 2.51 | | | 11.6 | | | 10.7 | | | 4.2250 | |
| Self Storage/Industrial | | 1 | | | 6,150,000 | | | 1.2 | | | 56.6 | | | 56.6 | | | 2.28 | | | 9.4 | | | 9.2 | | | 3.9710 | |
| Retail/Multifamily | | 1 | | | 4,750,000 | | | 0.9 | | | 64.2 | | | 64.2 | | | 1.71 | | | 8.4 | | | 8.2 | | | 4.7500 | |
| Self Storage/Recreational Vehicle Community | | 1 | | | 2,750,000 | | | 0.5 | | | 51.9 | | | 43.4 | | | 1.99 | | | 13.7 | | | 13.4 | | | 5.4400 | |
| Office/Retail | | 1 | | | 2,000,000 | | | 0.4 | | | 47.6 | | | 47.6 | | | 2.74 | | | 13.7 | | | 12.5 | | | 4.5000 | |
| Multifamily | | 6 | | | 47,692,442 | | | 9.0 | | | 59.9 | | | 57.0 | | | 1.89 | | | 9.8 | | | 9.4 | | | 4.2746 | |
| Mid Rise | | 2 | | | 19,500,000 | | | 3.7 | | | 65.6 | | | 65.6 | | | 1.97 | | | 9.3 | | | 9.0 | | | 4.5336 | |
| Garden | | 2 | | | 18,850,000 | | | 3.5 | | | 56.6 | | | 52.6 | | | 1.85 | | | 9.7 | | | 9.4 | | | 3.8420 | |
| Student Housing | | 1 | | | 6,492,442 | | | 1.2 | | | 50.7 | | | 41.3 | | | 1.92 | | | 12.3 | | | 11.8 | | | 4.6100 | |
| Low Rise | | 1 | | | 2,850,000 | | | 0.5 | | | 63.6 | | | 63.6 | | | 1.62 | | | 7.7 | | | 7.6 | | | 4.6000 | |
| Hospitality | | 5 | | | 40,615,593 | | | 7.6 | | | 54.4 | | | 45.7 | | | 2.96 | | | 18.4 | | | 16.8 | | | 4.4557 | |
| Limited Service | | 3 | | | 18,926,656 | | | 3.6 | | | 56.7 | | | 50.0 | | | 2.93 | | | 18.7 | | | 16.9 | | | 5.0191 | |
| Extended Stay | | 1 | | | 12,936,722 | | | 2.4 | | | 43.9 | | | 34.2 | | | 3.68 | | | 21.1 | | | 19.5 | | | 3.3410 | |
| Full Service | | 1 | | | 8,752,214 | | | 1.6 | | | 64.8 | | | 53.3 | | | 1.97 | | | 13.8 | | | 12.6 | | | 4.8850 | |
| Self Storage | | 7 | | | 20,600,000 | | | 3.9 | | | 57.2 | | | 57.2 | | | 1.98 | | | 9.4 | | | 9.2 | | | 4.6197 | |
| Self Storage | | 7 | | | 20,600,000 | | | 3.9 | | | 57.2 | | | 57.2 | | | 1.98 | | | 9.4 | | | 9.2 | | | 4.6197 | |
| Total | | 82 | | | $531,901,217 | | | 100.0 | % | | 58.2 | % | | 56.1 | % | | 2.23 | x | | 11.1 | % | | 10.5 | % | | 4.3758 | % |
| (1) | Because this table presents information relating to the mortgaged properties and not the mortgage loans, the information for mortgage loans secured by more than one mortgaged property is based on allocated loan amounts (allocating the principal balance of the mortgage loan to each of those properties according to the relative appraised values of the mortgaged properties or the allocated loan amounts or property-specific release prices set forth in the related mortgage loan documents or such other allocation as the related mortgage loan seller deemed appropriate). With respect to any mortgage loan that is part of a whole loan, the loan-to-value ratio, debt service coverage ratio and debt yield calculations include the related pari passu companion loan(s) but exclude any related subordinate secured loan(s) (unless otherwise stated). With respect to each mortgage loan, debt service coverage ratio, debt yield and loan-to-value ratio information do not take into account any subordinate debt (whether or not secured by the related mortgaged property) that currently exists or is allowed under the terms of such mortgage loan. See Annex A-1 to the Preliminary Prospectus. |
THE INFORMATION IN THIS COLLATERAL TERM SHEET IS NOT COMPLETE AND MAY BE AMENDED PRIOR TO THE TIME OF SALE. THIS TERM SHEET IS NOT AN OFFER TO SELL THESE SECURITIES AND IT IS NOT A SOLICITATION OF AN OFFER TO BUY THESE SECURITIES IN ANY JURISDICTION WHERE THE OFFER OR SALE IS NOT PERMITTED.
5
| Retail – Anchored | Loan #1 | Cut-off Date Balance: | | $44,700,000 |
| Property Addresses - Various | Pacific Castle Portfolio | Cut-off Date LTV: | | 60.0% |
| | | U/W NCF DSCR: | | 2.43x |
| | | U/W NOI Debt Yield: | | 10.2% |
THE INFORMATION IN THIS COLLATERAL TERM SHEET IS NOT COMPLETE AND MAY BE AMENDED PRIOR TO THE TIME OF SALE. THIS TERM SHEET IS NOT AN OFFER TO SELL THESE SECURITIES AND IT IS NOT A SOLICITATION OF AN OFFER TO BUY THESE SECURITIES IN ANY JURISDICTION WHERE THE OFFER OR SALE IS NOT PERMITTED.
6
| No. 1 – Pacific Castle Portfolio |
| |
| Mortgage Loan Information | | Mortgaged Property Information |
| Mortgage Loan Seller: | AREF | | Single Asset/Portfolio: | Portfolio |
Credit Assessment (Fitch/KBRA/Moody’s): | NR/NR/NR | | Property Type – Subtype: | Retail - Anchored |
| Original Principal Balance(1): | $44,700,000 | | Location: | Various |
| Cut-off Date Balance(1): | $44,700,000 | | Size: | 465,115 SF |
| % of Initial Pool Balance: | 8.4% | | Cut-off Date Balance Per SF(1): | $139.11 |
| Loan Purpose(2): | Acquisition/Refinance | | Maturity Date Balance Per SF(1): | $139.11 |
| Borrower Sponsors: | Wayne Cheng and Cheng Family Trust, dated December 21, 2001 | | Year Built/Renovated: | Various/Various |
| Guarantors: | Wayne Cheng and Cheng Family Trust, dated December 21, 2001 | | Title Vesting: | Fee |
| Mortgage Rate: | 3.8850% | | Property Manager: | Pacific Castle Management, Inc. |
| Note Date: | February 2, 2022 | | Current Occupancy (As of): | 92.0% (1/1/2022) |
| Seasoning: | 2 months | | YE 2020 Occupancy: | 86.0% |
| Maturity Date: | February 6, 2032 | | YE 2019 Occupancy(4): | 91.4% |
| IO Period: | 120 months | | YE 2018 Occupancy(4): | 90.7% |
| Loan Term (Original): | 120 months | | As-Is Appraised Value(5): | $107,800,000 |
| Amortization Term (Original): | NAP | | As-Is Appraised Value Per SF(5): | $231.77 |
| Loan Amortization Type: | Interest Only | | As-Is Appraisal Valuation Date(5): | December 28, 2021 |
| Call Protection: | L(26),D(89),O(5) | | | |
| Lockbox Type: | Hard/Springing Cash Management | | Underwriting and Financial Information(6) |
| Additional Debt(1): | Yes | | TTM NOI (9/30/2021)(7): | $5,675,258 |
| Additional Debt Type (Balance)(1): | Pari Passu ($20,000,000) | | YE 2020 NOI: | $5,089,684 |
| | | | YE 2019 NOI(8): | $5,607,506 |
| | | YE 2018 NOI: | $5,234,513 |
| | | | | | U/W Revenues: | $9,182,898 |
| | | | | | U/W Expenses: | $2,601,302 |
| Escrows and Reserves(3) | | U/W NOI(7): | $6,581,596 |
| | Initial | Monthly | Cap | | U/W NCF: | $6,192,992 |
| Taxes | $373,548 | $74,710 | NAP | | U/W DSCR based on NOI/NCF(1): | 2.58x / 2.43x |
| Insurance | $106,062 | $11,785 | NAP | | U/W Debt Yield based on NOI/NCF(1): | 10.2% / 9.6% |
| Replacement Reserve | $0 | $5,814 | $348,836 | | U/W Debt Yield at Maturity based on NOI/NCF(1): | 10.2% / 9.6% |
| TI/LC Reserve | $300,000 | $29,070 | $1,046,509 | | Cut-off Date LTV Ratio(1)(5): | 60.0% |
| Immediate Repairs | $40,063 | $0 | NAP | | LTV Ratio at Maturity(1)(5): | 60.0% |
| Sources and Uses |
| Sources | | | | | Uses | | |
| Original whole loan amount | $64,700,000 | | 83.6% | | Purchase price(2) | $50,847,934 | 65.7% |
| Equity contribution | 12,719,130 | | 16.4 | | Loan payoff(2) | 24,582,758 | 31.8 |
| | | | | | Closing costs | 1,168,766 | 1.5 |
| | | | | | Reserves | 819,673 | 1.1 |
| Total Sources | $77,419,130 | | 100.0% | | Total Uses | $77,419,130 | 100.0% |
| (1) | The Pacific Castle Portfolio Mortgage Loan (as defined below) is part of the Pacific Castle Portfolio Whole Loan (as defined below) with an original aggregate principal balance of $64,700,000. The Cut-off Date Balance Per SF, Maturity Date Balance Per SF, U/W DSCR based on NOI/NCF, U/W Debt Yield based on NOI/NCF, U/W Debt Yield at Maturity based on NOI/NCF, Cut-off Date LTV Ratio and LTV Ratio at Maturity numbers presented above are based on the Pacific Castle Portfolio Whole Loan. |
| (2) | The Pacific Castle Portfolio Whole Loan facilitated the acquisition of the Sandstone Village Property (as defined below) for approximately $18.3 million and the Rancho Cordova Town Center Property (as defined below) for $32.5 million, and the refinance of the Prune Tree Center Property (as defined below) and Rimrock Plaza Property (as defined below). |
| (3) | See “Escrows” section below. |
| (4) | The Rimrock Plaza Property was acquired in 2020 and the prior owner did not provide historical occupancy statistics. The occupancy figures used in the calculation were obtained from the appraisal. |
| (5) | The As-Is Appraised Value represents the portfolio market value of the Pacific Castle Portfolio Properties (as defined below) as of December 28, 2021, if the entire property portfolio is marketed to a single purchaser. Based on the sum of the appraised values of the individual properties which equals $101,350,000, the As-Is Appraised Value Per SF, Cut-off Date LTV Ratio and LTV Ratio at Maturity are $217.90, 63.8% and 63.8%, respectively. |
| (6) | While the Pacific Castle Portfolio Mortgage Loan was originated after the emergence of the novel coronavirus pandemic and the economic disruption resulting from measures to combat the pandemic, the pandemic is an evolving situation and could impact the Pacific Castle Portfolio Mortgage Loan more severely than assumed in the underwriting and could adversely affect the NOI, NCF and occupancy information, as well as the appraised value and the DSCR, LTV and Debt Yield metrics presented above. See “Risk Factors—Risks Related to Market Conditions and Other External Factors— |
THE INFORMATION IN THIS COLLATERAL TERM SHEET IS NOT COMPLETE AND MAY BE AMENDED PRIOR TO THE TIME OF SALE. THIS TERM SHEET IS NOT AN OFFER TO SELL THESE SECURITIES AND IT IS NOT A SOLICITATION OF AN OFFER TO BUY THESE SECURITIES IN ANY JURISDICTION WHERE THE OFFER OR SALE IS NOT PERMITTED.
7
| Retail – Anchored | Loan #1 | Cut-off Date Balance: | | $44,700,000 |
| Property Addresses - Various | Pacific Castle Portfolio | Cut-off Date LTV: | | 60.0% |
| | | U/W NCF DSCR: | | 2.43x |
| | | U/W NOI Debt Yield: | | 10.2% |
Coronavirus Pandemic Has Adversely Affected the Global Economy and Will Likely Adversely Affect the Performance of the Mortgage Loans” in the Preliminary Prospectus.
| (7) | The difference between UW NOI and TTM NOI is primarily attributed to (i) $124,146 of rent steps, (ii) an increase in recoveries, and (iii) recent leasing resulting in an increase in occupancy from 87.2% as of September 30, 2021 to 92.0% as of January 1, 2022. |
| (8) | Represents 2019 NOI for the Sandstone Village Property, Rancho Cordova Town Center Property, and Prune Tree Center Property. Represents the 6/30/2019 T6 annualized NOI for the Rimrock Plaza Property. The Rimrock Plaza Property was acquired in 2020 and the prior owner did not provide full year 2019 operating statements. |
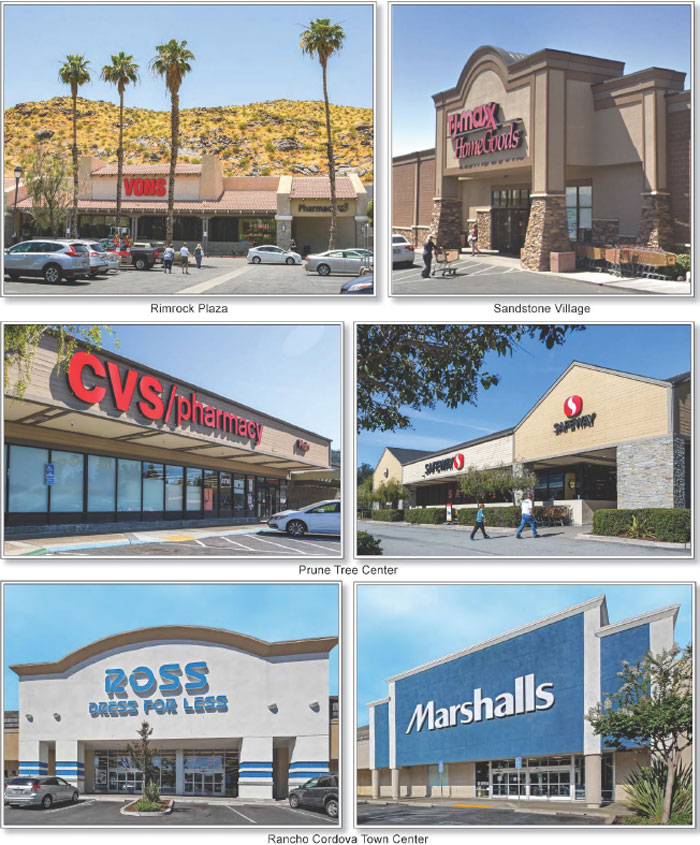
The Mortgage Loan. The mortgage loan (the “Pacific Castle Portfolio Mortgage Loan”) is part of a whole loan (the “Pacific Castle Portfolio Whole Loan”) that is evidenced by four promissory notes secured by a first priority fee mortgage encumbering a 465,115 square foot portfolio of four anchored retail properties located in California and Utah (the “Rancho Cordova Town Center Property”, “Prune Tree Center Property”, “Rimrock Plaza Property”, and “Sandstone Village Property”, and collectively, the “Pacific Castle Portfolio Properties”). Proceeds from the Pacific Castle Portfolio Whole Loan were used to facilitate the refinance and acquisition of the Pacific Castle Portfolio Properties, fund reserve accounts, and pay closing costs.
Note Summary
| Notes | Original Principal Balance | Cut-off Date Balance | Note Holder | Controlling Interest |
| A-1 | $30,000,000 | $30,000,000 | WFCM 2022-C62 | Yes |
| A-2 | $20,000,000 | $20,000,000 | MSC 2022-L8 | No |
| A-3 | $10,000,000 | $10,000,000 | WFCM 2022-C62 | No |
| A-4 | $4,700,000 | $4,700,000 | WFCM 2022-C62 | No |
| Total | $64,700,000 | $64,700,000 | | |
The Borrowers and Borrower Sponsors. The borrowers are PC Prunetree, LLC, Pacific Castle Rimrock, LLC, Pacific Castle Sandstone, LLC, and Pacific Castle Rancho, LLC, each a Delaware limited liability company and single purpose entity with one independent director. Each borrower owns one individual Pacific Castle Portfolio Property. Legal counsel to the borrowers delivered a non-consolidation opinion in connection with the origination of the Pacific Castle Portfolio Whole Loan.
The borrower sponsors and non-recourse carveout guarantors of the Pacific Castle Portfolio Whole Loan are Wayne Cheng and the Cheng Family Trust, dated December 21, 2001. Wayne Cheng is the founder and CEO of Pacific Castle, a real estate investment company founded in 1993 that has executed over $1.0 billion in transactions since its founding. Affiliates of Pacific Castle currently own and/or manage a portfolio of shopping centers in the western United States. The total portfolio is comprised of nearly 2.0 million square feet.
The Properties. The Pacific Castle Portfolio Whole Loan is secured by four anchored retail properties totaling 465,115 square feet located in California (81.0% of NRA) and Utah (19.0% of NRA). The Pacific Castle Portfolio Properties were 92.0% occupied by 85 tenants as of January 1, 2022. Ten tenants occupying approximately 31.3% of the NRA are investment grade tenants. Thirty-nine tenants occupying approximately 61.6% of the NRA have renewed their respective leases one or more times.
The following table presents certain information relating to the Pacific Castle Portfolio Properties:
Portfolio Summary
| Property Name | City, State(1) | Net Rentable Area (SF)(2) | Year Built/ Renovated(1) | Occupancy %(2) | Allocated Cut-off Date Balance(3) | % of ALA | “As-Is” Appraised Value(1) | U/W NCF |
| Rancho Cordova Town Center | Rancho Cordova, CA | 148,656 | 1988/NAP | 94.2% | $21,704,983 | 33.5% | $34,000,000 | $2,592,361 |
| Prune Tree Center | Prunedale, CA | 131,655 | 1989/2016 | 93.7% | $17,906,611 | 27.7% | $28,050,000 | $1,637,749 |
| Rimrock Plaza | Palm Springs, CA | 96,348 | 1982/NAP | 81.0% | $13,086,828 | 20.2% | $20,500,000 | $934,939 |
| Sandstone Village | St. George, UT | 88,456 | 2004-2005/NAP | 97.7% | $12,001,579 | 18.5% | $18,800,000 | $1,027,943 |
| Total/Wtd. Avg. | 465,115 | | 92.0% | $64,700,000 | 100.0% | $107,800,000(4) | $6,192,992 |
| (1) | Information obtained from the appraisals. |
| (2) | Information obtained from the underwritten rent roll as of January 1, 2022. |
| (3) | Based on the Pacific Castle Portfolio Whole Loan. |
| (4) | The Total As-Is Appraised Value represents the portfolio market value of the Pacific Castle Portfolio Properties as of December 28, 2021, if the entire property portfolio is marketed to a single purchaser. The sum of the appraised values of the individual properties equals $101,350,000. |
THE INFORMATION IN THIS COLLATERAL TERM SHEET IS NOT COMPLETE AND MAY BE AMENDED PRIOR TO THE TIME OF SALE. THIS TERM SHEET IS NOT AN OFFER TO SELL THESE SECURITIES AND IT IS NOT A SOLICITATION OF AN OFFER TO BUY THESE SECURITIES IN ANY JURISDICTION WHERE THE OFFER OR SALE IS NOT PERMITTED.
8
| Retail – Anchored | Loan #1 | Cut-off Date Balance: | | $44,700,000 |
| Property Addresses - Various | Pacific Castle Portfolio | Cut-off Date LTV: | | 60.0% |
| | | U/W NCF DSCR: | | 2.43x |
| | | U/W NOI Debt Yield: | | 10.2% |
Rancho Cordova Town Center Property (32.0% of NRA; 33.5% of Allocated Loan Amount (“ALA”)): The Rancho Cordova Town Center Property is a 148,656 square foot anchored retail shopping center located in a commercial hub in Rancho Cordova, California, north of Highway 50. The improvements were constructed in 1988 and are situated on an approximately 12.2-acre site. The Rancho Cordova Town Center Property is anchored by Ross, Marshall’s, and Michael’s Stores, Inc. Both Ross and Marshall’s have been in occupancy since 2012 and have a lease expiration in January 2027 with three, five-year renewals remaining and August 2027 with three, five-year renewals remaining, respectively. Marshall’s recently executed a five-year extension in February 2022. Michael’s Stores, Inc has been in occupancy since 1988 and has a lease expiration in June 2024. The Rancho Cordova Town Center Property is also shadow anchored by a Super Target store which is not part of the collateral for the Pacific Castle Portfolio Whole Loan. As of January 1, 2022, the Rancho Cordova Town Center Property was 94.2% occupied by 30 tenants. The Rancho Cordova Town Center Property features 690 surface parking spaces (4.6 per 1,000 SF).
Prune Tree Center Property (28.3% of NRA; 27.7% of ALA): The Prune Tree Center Property is a 131,655 square foot anchored retail shopping center located in Prunedale, California, approximately five miles north of Salinas and approximately 21 miles northeast of Monterey. The improvements consist of five retail buildings situated on an 18.85-acre site and were constructed in 1989 and most recently renovated in 2016. The Prune Tree Center Property contains 121,849 square feet of retail space and 9,806 square feet of office space (on the second floor of one of the five buildings). The Prune Tree Center Property also features 561 surface parking spaces (4.3 per 1,000 SF). The Prune Tree Center Property is anchored by Safeway and CVS. Safeway has been in occupancy since 1989 and has a lease expiration in May 2024 with six, five-year renewal options remaining. CVS has been in occupancy since 1989 and has a lease expiration in June 2024 with five, five-year renewal options remaining. Safeway and CVS have in place rents that are 14.9% and 29.8% below market rents concluded in the appraisal. Three of the five buildings are pad buildings that are currently ground leased to McDonald’s, Starbucks, and Taco Bell. As of January 1, 2022, the Prune Tree Center Property was 93.7% occupied by 30 tenants.
Rimrock Plaza Property (20.7% of NRA; 20.2% of ALA): The Rimrock Plaza Property is a 96,348 square foot anchored retail shopping center located in Palm Springs, California, on the southeast corner of East Palm Canyon Drive and Matthew Drive. The improvements consist of four buildings that were constructed in 1982. The Rimrock Plaza Property is situated on an approximately 9.4-acre site with 437 surface parking spaces (4.5 per 1,000 SF). The Rimrock Plaza Property is anchored by Vons supermarket. Vons has been in occupancy since 1981 and has a lease expiration in May 2026 with one, five-year renewal option remaining. Furthermore, Vons’ current rent is approximately 48.7% below the market rents concluded in the appraisal. According to the appraisal, the Rimrock Plaza Property reached 100% occupancy in late 2013 and remained fully occupied from 2014 to 2019. The borrower sponsor acquired the Rimrock Plaza Property in 2020 and began converting leases from modified gross to triple net as leases expired causing the occupancy to gradually decreased in first quarter of 2020 and dropping below 80% in 2021. Occupancy has increased to 81.0% as of January 1, 2022 across 18 tenants and the borrower sponsor currently has several letters of intent under negotiation. The appraisal concluded to a stabilized occupancy of 92.5% for the Rimrock Plaza Property.
Sandstone Village Property (19.0% of NRA; 18.5% of ALA): The Sandstone Village Property is an 88,456 square foot anchored retail shopping center located in St. George, Utah, at the southeast quadrant of the St. George Boulevard exit on Interstate 15. The improvements consist of three buildings that were constructed in 2004-2005. The Sandstone Village Property is situated on a 6.8-acre site with 365 surface parking spaces (4.1 per 1,000 SF and is anchored by TJ Maxx. TJ Maxx has been a tenant at the Sandstone Village Property since 2004 and has a lease expiration in May 2024 with two, five-year renewal options remaining. As of January 1, 2022, the Sandstone Village Property was 97.7% occupied by nine tenants.
Major Tenants.
Largest Tenant: TJ Maxx (48,067 square feet; 10.3% of net rentable area; 8.3% of underwritten base rent; May 31, 2024 lease expiration; Sandstone Village Property) – TJ Maxx is a leading off-price retailer founded in 1977, with more than 1,200 stores spanning 49 states and Puerto Rico. The lease is signed by The TJX Companies, Inc. (NYSE: TJX, rated A2/A by Moody’s/S&P), the parent company of TJ Maxx. TJX operates more than 4,500 stores in nine countries across three continents, as well as four e-commerce businesses. TJ Maxx has been a tenant at the Sandstone Village Property since 2004 when it commenced a ten-year lease. The tenant has renewed its lease on two separate occasions, most recently for five years commencing in June 2019. TJ Maxx has two, five-year renewal options remaining. TJ Maxx has the right to terminate its lease if occupancy (excluding the TJ Maxx space) at Sandstone Village Property remains below 22,000 SF for 180 consecutive days. TJ Maxx reported sales of $409 PSF and $331 PSF for 2019 and 2020, respectively.
Second Largest Tenant: Vons (41,330 square feet; 8.9% of net rentable area; 4.6% of underwritten base rent; May 31, 2026 lease expiration; Rimrock Plaza Property) – Vons is a Southern California and Southern Nevada supermarket chain owned by Albertsons (NYSE: ACI, rated Ba3/BB by Moody’s/S&P). Vons is headquartered in Fullerton, California and operates stores under the Vons and Pavilions banners. Vons stores offer a bakery, deli, seafood counter, liquor store, floral department, pharmacy and various other services. Vons has been a tenant at the Rimrock Plaza Property for over 40 years and has exercised four renewal options since the original lease expired. Vons has one, five-year renewal option remaining and no termination options. Vons reported sales of $596 PSF, $703 PSF and $701 PSF for 2019, 2020 and 2021, respectively.
Third Largest Tenant: Safeway (35,722 square feet; 7.7% of net rentable area; 4.7% of underwritten base rent; May 31, 2024 lease expiration; Prune Tree Center Property) – Safeway (rated Ba3/BB by Moody’s/S&P) is an American supermarket chain founded in 1915 in American Falls, Idaho. The chain provides grocery items, food and general merchandise and features a variety of specialty departments, such as bakery, delicatessen, floral department and pharmacy, as well as coffee shops and fuel centers. It has been a
THE INFORMATION IN THIS COLLATERAL TERM SHEET IS NOT COMPLETE AND MAY BE AMENDED PRIOR TO THE TIME OF SALE. THIS TERM SHEET IS NOT AN OFFER TO SELL THESE SECURITIES AND IT IS NOT A SOLICITATION OF AN OFFER TO BUY THESE SECURITIES IN ANY JURISDICTION WHERE THE OFFER OR SALE IS NOT PERMITTED.
9
| Retail – Anchored | Loan #1 | Cut-off Date Balance: | | $44,700,000 |
| Property Addresses - Various | Pacific Castle Portfolio | Cut-off Date LTV: | | 60.0% |
| | | U/W NCF DSCR: | | 2.43x |
| | | U/W NOI Debt Yield: | | 10.2% |
subsidiary of Albertsons since January 2015 after being acquired by private equity investors led by Cerberus Capital Management. Safeway is headquartered in Pleasanton, California, with its parent company, Albertsons, headquartered in Boise, Idaho. Safeway has been a tenant at the Prune Tree Center Property since June 1989 when it commenced a 25-year lease. The tenant has exercised two, five-year renewal options since the original lease term expired. The most recent renewal commenced in June 2019 and expires in May 2024. Safeway has six, five-year renewal options remaining that will be automatically exercised unless the tenant gives landlord notice to terminate the lease at least 180 days prior to expiration. Safeway has no termination options. Safeway reported sales of $801 PSF, $906 PSF, and $827 PSF for 2019, 2020, and 2021, respectively.
The following table presents certain information relating to the tenancy at the Pacific Castle Portfolio Properties:
Major Tenants
| Tenant Name | Credit Rating (Fitch/
Moody’s/
S&P)(1) | Property Name | Tenant
NRSF | % of
NRSF | Annual U/W Base Rent PSF(2) | Annual
U/W Base Rent(2) | % of Total Annual U/W Base Rent | Lease Expiration | Extension Options | Term. Option (Y/N) |
| TJ Maxx | NR/A2/A | Sandstone Village | 48,067 | 10.3% | $12.00 | $576,804 | 8.3% | 5/31/2024 | 2, 5-year | N(3) |
| Vons | NR/Ba3/BB | Rimrock Plaza | 41,330 | 8.9% | $7.70 | $318,260 | 4.6% | 5/31/2026 | 1, 5-year | N |
| Safeway | NR/Ba3/BB | Prune Tree Center | 35,722 | 7.7% | $9.19 | $328,296 | 4.7% | 5/31/2024 | 6, 5-year | N |
| CVS | NR/Baa2/BBB | Prune Tree Center | 31,472 | 6.8% | $7.58 | $238,558 | 3.4% | 6/30/2024 | 5, 5-year | N |
| Ross | NR/A2/BBB+ | Rancho Cordova Town Center | 26,968 | 5.8% | $11.28 | $304,202 | 4.4% | 1/31/2027 | 3, 5-year | N(4) |
| Marshall's | NR/A2/A | Rancho Cordova Town Center | 25,252 | 5.4% | $10.50 | $265,146 | 3.8% | 8/31/2027 | 3, 5-year | N(5) |
| Michael's Stores, Inc | NR/NR/NR | Rancho Cordova Town Center | 20,800 | 4.5% | $16.20 | $336,960 | 4.8% | 6/30/2024 | None | N |
| Eisenhower Medical Center | NR/NR/NR | Rimrock Plaza | 14,895 | 3.2% | $19.84 | $295,538 | 4.3% | Various(6) | None | N |
| Hive | NR/NR/NR | Sandstone Village | 13,488 | 2.9% | $10.76 | $145,075 | 2.1% | 10/31/2025 | 1, 5-year | N |
| Minky Couture | NR/NR/NR | Sandstone Village | 9,250 | 2.0% | $15.50 | $143,375 | 2.1% | 6/30/2027 | 3, 5-year | N |
| Total Major Tenants | | | 267,244 | 57.5% | $11.05 | $2,952,213 | 42.5% | | | |
| Other Tenants | | | 160,747 | 34.6% | $24.86 | $3,996,262 | 57.5% | | | |
| Occupied Space | | | 427,991 | 92.0% | $16.24 | $6,948,475 | 100.0% | | | |
| Vacant Space | | | 37,124 | 8.0% | | | | | | |
| Collateral Total | | | 465,115 | 100.0% | | | | | | |
| | | | | | | | | | | |
| | | | | | | | | | | |
| | | | | | | | | | | |
| | | | | | | | | | | |
| (1) | Certain ratings are those of the parent company, regardless of whether or not the parent guarantees the lease. |
| (2) | Based on the underwritten rent roll, including rent increases occurring through November 2022. |
| (3) | No unilateral termination options; however, TJ Maxx has the right to terminate its lease if occupancy at the other retail spaces at the Sandstone Village Property stays below 22,000 SF for 180 consecutive days. |
| (4) | No unilateral termination options; however, Ross has the right to terminate its lease if, for 12 consecutive months, (a)(i) the required co-tenants (defined as Target, Michael’s Stores, Inc and (ii) one anchor tenant (greater than or equal to 20,000 SF) or, (b) two soft goods anchor tenants (greater than 20,000 SF)) are not open and operating for business, or (c) the retail tenants, including the required co-tenants, are not open and operating in at least 70% of the leasable floor area of the Rancho Cordova Town Center Property. |
| (5) | No unilateral termination options; however, Marshall’s has the right to terminate its lease if, for any period of more than 745 consecutive days, (i) either of the inducement tenants (Target and a retail store of at least 25,000 SF that is part of a national chain of not less than 75 store locations, or a regional chain of not less than 50 store locations) are not open for business or (ii) less than 50% of the gross leasable area in the shopping center is occupied. |
| (6) | Eisenhower Medical Center has 9,790 SF expiring on October 31, 2025 and 5,105 SF expiring on December 31, 2025. |
THE INFORMATION IN THIS COLLATERAL TERM SHEET IS NOT COMPLETE AND MAY BE AMENDED PRIOR TO THE TIME OF SALE. THIS TERM SHEET IS NOT AN OFFER TO SELL THESE SECURITIES AND IT IS NOT A SOLICITATION OF AN OFFER TO BUY THESE SECURITIES IN ANY JURISDICTION WHERE THE OFFER OR SALE IS NOT PERMITTED.
10
| Retail – Anchored | Loan #1 | Cut-off Date Balance: | | $44,700,000 |
| Property Addresses - Various | Pacific Castle Portfolio | Cut-off Date LTV: | | 60.0% |
| | | U/W NCF DSCR: | | 2.43x |
| | | U/W NOI Debt Yield: | | 10.2% |
Major Tenants Sales(1)
| Tenant Name | Property Name | Tenant
NRSF | 2019 Sales PSF | 2020 Sales PSF | 2021 Sales PSF | Occupancy Cost(2) |
| TJ Maxx | Sandstone Village | 48,067 | $409 | $331 | N/A | 4.2% |
| Vons | Rimrock Plaza | 41,330 | $596 | $703 | $701 | 1.9% |
| Safeway | Prune Tree Center | 35,722 | $801 | $906 | $827 | 1.4% |
| CVS | Prune Tree Center | 31,472 | $254 | $283 | $277 | 3.3% |
| Ross | Rancho Cordova Town Center | 26,968 | N/A | N/A | $337(3) | 4.2% |
| Marshall's | Rancho Cordova Town Center | 25,252 | N/A | N/A | $309(3) | 4.3% |
| Michael's Stores, Inc | Rancho Cordova Town Center | 20,800 | $143 | $136 | $147(4) | 15.9% |
| Target (Non-owned) | Rancho Cordova Town Center | NAP | N/A | N/A | $444(3) | 0.2% |
| (1) | Information obtained from the underwritten rent roll. |
| (2) | Represents the occupancy cost of latest available sales figures to underwritten gross rents which include any applicable rent increases occurring through November 2022. |
| (3) | Represent estimated sales as per third party market reports. |
| (4) | Represents trailing twelve months ending September 2021 sales for Michael’s Stores, Inc. |
The following table presents certain information relating to the lease rollover schedule at the Pacific Castle Portfolio Properties:
Lease Expiration Schedule(1)(2)
| Year Ending December 31, | No.
of Leases
Expiring | Expiring NRSF | % of
Total NRSF | Cumulative Expiring NRSF | Cumulative % of Total NRSF | Annual
U/W
Base Rent | % of Total Annual U/W Base Rent | Annual U/W Base Rent PSF |
| MTM | 2 | 4,060 | 0.9% | 4,060 | 0.9% | $93,734 | 1.3% | $23.09 |
| 2022 | 11 | 16,183 | 3.5% | 20,243 | 4.4% | $323,246 | 4.7% | $19.97 |
| 2023 | 10 | 15,217 | 3.3% | 35,460 | 7.6% | $402,244 | 5.8% | $26.43 |
| 2024 | 20 | 165,404 | 35.6% | 200,864 | 43.2% | $2,220,309 | 32.0% | $13.42 |
| 2025 | 12 | 48,223 | 10.4% | 249,087 | 53.6% | $1,003,519 | 14.4% | $20.81 |
| 2026 | 10 | 55,951 | 12.0% | 305,038 | 65.6% | $694,632 | 10.0% | $12.42 |
| 2027 | 9 | 77,081 | 16.6% | 382,119 | 82.2% | $1,066,444 | 15.3% | $13.84 |
| 2028 | 4 | 8,118 | 1.7% | 390,237 | 83.9% | $221,164 | 3.2% | $27.24 |
| 2029 | 3 | 7,700 | 1.7% | 397,937 | 85.6% | $176,760 | 2.5% | $22.96 |
| 2030 | 1 | 2,044 | 0.4% | 399,981 | 86.0% | $44,212 | 0.6% | $21.63 |
| 2031 | 3 | 16,744 | 3.6% | 416,725 | 89.6% | $351,225 | 5.1% | $20.98 |
| 2032 | 0 | 0 | 0.0% | 416,725 | 89.6% | $0 | 0.0% | $0.00 |
| Thereafter | 4 | 11,266 | 2.4% | 427,991 | 92.0% | $350,986 | 5.1% | $31.15 |
| Vacant | 0 | 37,124 | 8.0% | 465,115 | 100.0% | $0 | 0.0% | $0.00 |
| Total/Wtd. Avg. | 89 | 465,115 | 100.0% | | | $6,948,475 | 100.0% | $16.24(3) |
| (1) | Based on the underwritten rent roll, including rent increases occurring through November 2022. |
| (2) | Certain tenants may have lease termination options that are exercisable prior to the originally stated expiration date that are not reflected in the Lease Expiration Schedule. |
| (3) | Excludes NRA of underwritten vacant space. |
The following table presents historical occupancy percentages at the Pacific Castle Portfolio Properties:
Historical Occupancy
| Property Name | 12/31/2018(1) | 12/31/2019(1) | 12/31/2020(1) | 1/1/2022(3) |
| Rancho Cordova Town Center | 82.1% | 85.5% | 83.0% | 94.2% |
| Prune Tree Center | 87.5% | 89.9% | 90.0% | 93.7% |
| Rimrock Plaza | 100.0%(2) | 100.0%(2) | 83.4% | 81.0% |
| Sandstone Village | 100.0% | 93.9% | 88.1% | 97.7% |
| Wtd. Avg. Occupancy | 90.7% | 91.4% | 86.0% | 92.0% |
| (1) | Occupancy figures were calculated using leases and historical rent rolls. |
| (2) | The Rimrock Plaza Property was acquired in 2020 and the prior owner did not provide historical occupancy statistics. The figures shown were obtained from the appraisal. |
| (3) | Information obtained from the underwritten rent roll dated January 1, 2022. |
THE INFORMATION IN THIS COLLATERAL TERM SHEET IS NOT COMPLETE AND MAY BE AMENDED PRIOR TO THE TIME OF SALE. THIS TERM SHEET IS NOT AN OFFER TO SELL THESE SECURITIES AND IT IS NOT A SOLICITATION OF AN OFFER TO BUY THESE SECURITIES IN ANY JURISDICTION WHERE THE OFFER OR SALE IS NOT PERMITTED.
11
| Retail – Anchored | Loan #1 | Cut-off Date Balance: | | $44,700,000 |
| Property Addresses - Various | Pacific Castle Portfolio | Cut-off Date LTV: | | 60.0% |
| | | U/W NCF DSCR: | | 2.43x |
| | | U/W NOI Debt Yield: | | 10.2% |
COVID-19 Update. As of March 9, 2022, the Pacific Castle Portfolio Properties were open and operating. The borrower sponsors reported that 11 tenants representing 29.3% of the total NRA across the Pacific Castle Portfolio Properties received rent relief as a result of the pandemic. The rent relief provided came in the form of partial rent abatements and rent deferrals. All deferred rents have since been paid back. Based on an account receivables report dated March 9, 2022, approximately $46,129 consisting primarily of CAM reimbursements were over 30 days delinquent and $8,526 of accounts receivables were over 60 days delinquent, representing a collection rate (over underwritten in-place gross rents) of 93.9% and 98.9% for February and January 2022, respectively. As of March 9, 2022, the Pacific Castle Portfolio Whole Loan is current on its debt service payment and is not subject to any modification or forbearance request.
Operating History and Underwritten Net Cash Flow. The following table presents certain information relating to the historical operating performance and underwritten net cash flow at the Pacific Castle Portfolio Properties:
Cash Flow Analysis
| | | 2018 | | 2019(1) | | 2020 | | TTM 9/30/2021 | | U/W | | %(2) | | U/W $ per SF |
| Base Rent | | $6,021,406 | | $6,265,442 | | $5,642,871 | | $6,346,990 | | $6,824,329 | | 67.7% | | $14.67 |
| Contractual Rent Steps(3) | | 0 | | 0 | | 0 | | 0 | | 124,146 | | 1.2 | | 0.27 |
| Grossed Up Vacant Space | | 0 | | 0 | | 0 | | 0 | | 870,959 | | 8.6 | | 1.87 |
| Gross Potential Rent | | $6,021,406 | | $6,265,442 | | $5,642,871 | | $6,346,990 | | $7,819,434 | | 77.5% | | $16.81 |
| Other Income(4) | | 3,366 | | 146,132 | | 86,967 | | 39,436 | | 39,436 | | 0.4 | | 0.08 |
| Total Recoveries | | 1,667,462 | | 1,787,126 | | 1,703,113 | | 1,771,598 | | 2,227,293 | | 22.1 | | 4.79 |
| Net Rental Income | | $7,692,234 | | $8,198,699 | | $7,432,951 | | $8,158,024 | | $10,086,163 | | 100.0% | | $21.69 |
| (Vacancy & Credit Loss) | | 0 | | 0 | | 0 | | 0 | | (903,265)(5) | | (11.6) | | (1.94) |
| Effective Gross Income | | $7,692,234 | | $8,198,699 | | $7,432,951 | | $8,158,024 | | $9,182,898 | | 91.0% | | $19.74 |
| | | | | | | | | | | | | | | |
| Real Estate Taxes | | 693,199 | | 708,787 | | 792,827 | | 809,338 | | 870,735 | | 9.5 | | 1.87 |
| Insurance | | 124,260 | | 135,393 | | 116,776 | | 127,203 | | 141,417 | | 1.5 | | 0.30 |
| Management Fee | | 438,456 | | 445,980 | | 277,442 | | 323,822 | | 366,747 | | 4.0 | | 0.79 |
| Other Operating Expenses | | 1,201,806 | | 1,301,034 | | 1,156,224 | | 1,222,403 | | 1,222,403 | | 13.3 | | 2.63 |
| Total Operating Expenses | | $2,457,721 | | $2,591,194 | | $2,343,268 | | $2,482,766 | | $2,601,302 | | 28.3% | | $5.59 |
| | | | | | | | | | | | | | | |
| Net Operating Income(6) | | $5,234,513 | | $5,607,506 | | $5,089,684 | | $5,675,258 | | $6,581,596 | | 71.7% | | $14.15 |
| Capital Expenditures | | 0 | | 0 | | 0 | | 12,863 | | 69,767 | | 0.8 | | 0.15 |
| TI/LC | | 0 | | 0 | | 0 | | 0 | | 318,836 | | 3.5 | | 0.69 |
| Net Cash Flow | | $5,234,513 | | $5,607,506 | | $5,089,684 | | $5,662,394 | | $6,192,992 | | 67.4% | | $13.31 |
| | | | | | | | | | | | | | | |
| NOI DSCR(7) | | 2.05x | | 2.20x | | 2.00x | | 2.23x | | 2.58x | | | | |
| NCF DSCR(7) | | 2.05x | | 2.20x | | 2.00x | | 2.22x | | 2.43x | | | | |
| NOI Debt Yield(7) | | 8.1% | | 8.7% | | 7.9% | | 8.8% | | 10.2% | | | | |
| NCF Debt Yield(7) | | 8.1% | | 8.7% | | 7.9% | | 8.8% | | 9.6% | | | | |
| (1) | Based on the full year 2019 operating statements for the Sandstone Village Property, Rancho Cordova Town Center Property, and Prune Tree Center Property. Based on the 6/30/2019 T6 annualized financials for the Rimrock Plaza Property. The Rimrock Plaza Property was acquired in 2020 and the prior owner did not provide full year 2019 operating statements. |
| (2) | Represents (i) percent of Net Rental Income for all revenue fields, (ii) percent of Gross Potential Rent for Vacancy & Credit Loss and (iii) percent of Effective Gross Income for all other fields. |
| (3) | Contractual Rent Steps are through November 2022. |
| (4) | Other Income consists of miscellaneous charges such as lease termination fees. |
| (5) | The underwritten economic vacancy is 9.0%. The Pacific Castle Portfolio Properties were 92.0% leased as of January 1, 2022. |
| (6) | The increase in U/W Net Operating Income from TTM 9/30/2021 Net Operating Income is primarily attributed to (i) $124,146 of rent steps, (ii) an increase in recoveries, and (iii) recent leasing resulting in an increase in occupancy from 87.2% as of September 30, 2021 to 92.0% as of January 1, 2022. |
| (7) | Debt service coverage ratios and debt yields are based on the Pacific Castle Portfolio Whole Loan. |
Appraisals. According to the appraisal, the Pacific Castle Portfolio Properties had an “as-is” appraised value of $107,800,000 as of December 28, 2021. The as-is appraised value represents the portfolio market value of the Pacific Castle Portfolio Properties as if the entire property portfolio is marketed to a single purchaser. The sum of the appraised values of the individual properties is $101,350,000 when excluding the portfolio premium.
Environmental Matters. According to the Phase I environmental reports dated September 24, 2021 through December 8, 2021, there are no recognized environmental conditions or recommendations for further action at the Pacific Castle Portfolio Properties. However, the environmental reports indicated that there is a controlled recognized environmental condition (“CREC”) related to
THE INFORMATION IN THIS COLLATERAL TERM SHEET IS NOT COMPLETE AND MAY BE AMENDED PRIOR TO THE TIME OF SALE. THIS TERM SHEET IS NOT AN OFFER TO SELL THESE SECURITIES AND IT IS NOT A SOLICITATION OF AN OFFER TO BUY THESE SECURITIES IN ANY JURISDICTION WHERE THE OFFER OR SALE IS NOT PERMITTED.
12
| Retail – Anchored | Loan #1 | Cut-off Date Balance: | | $44,700,000 |
| Property Addresses - Various | Pacific Castle Portfolio | Cut-off Date LTV: | | 60.0% |
| | | U/W NCF DSCR: | | 2.43x |
| | | U/W NOI Debt Yield: | | 10.2% |
elevated concentrations of perchloroethylene in soil vapor and indoor air at the Rimrock Plaza Property. See “Description of the Mortgage Pool—Environmental Considerations” in the Preliminary Prospectus.
Market Overview and Competition. The Pacific Castle Portfolio Properties are located in California (81.5% of ALA) and Utah (18.5% of ALA).
The table below presents certain market information with respect to the Pacific Castle Portfolio Properties:
Market Overview(1)
| Property Name | City, State | Estimated 2021 Population (5-mile Radius) | Estimated 2021 Average Household Income (5-mile Radius) | Submarket Inventory (SF) | Submarket Vacancy | Appraisal Concluded Vacancy | Appraisal Market Rent PSF - Anchor | Appraisal Market Rent PSF – Inline |
| Rancho Cordova Town Center | Rancho Cordova, CA | 220,273 | $106,692 | 5,638,213 | 9.7% | 10.0% | $11.40 | $27.00 |
| Prune Tree Center | Prunedale, CA | 135,187 | $82,874 | 3,692,087 | 2.9% | 7.0% | $10.80 | $12.00 - $21.00 |
| Rimrock Plaza | Palm Springs, CA | 105,259 | $94,358 | 26,927,952 | 9.2% | 7.5% | $15.00 | $12.00 - $30.00 |
| Sandstone Village | St. George, UT | 116,424 | $85,132 | 8,927,867 | 2.6% | 5.0% | $12.00 | $18.00 |
| Weighted Average(2) | | 152,614 | $93,295 | | 6.3% | 7.7% | | |
| (1) | Information obtained from the appraisals. |
| (2) | Information as of third quarter 2021 for the Rancho Cordova Town Center Property and Prune Tree Center Property and as of second quarter 2021 for the Rimrock Plaza Property and Sandstone Village Property. |
| (3) | Weighted Averages are based on NRA. |
Rancho Cordova Town Center (32.0% of NRA; 33.5% of ALA): The Rancho Cordova Town Center Property is located approximately 13.7 miles east of downtown Sacramento, California. Primary access to the area is provided by US Highway 50 and Folsom Boulevard, which are both approximately 0.5 miles from the Rancho Cordova Town Center Property. According to the appraisal, the Rancho Cordova Town Center Property is located in the Highway 50 Corridor Retail submarket within the Sacramento Metropolitan Statistical Area (“MSA”). The Sacramento MSA is representative of a typical state capital economy with high levels of government employment and healthcare workers. The top three employers in the Sacramento MSA are the University of California Davis Health System, Sutter/California Health Services, and Dignity/Mercy Healthcare. As of the third quarter of 2021, the Highway 50 Corridor Retail submarket had approximately 5.6 million square feet of inventory and a vacancy rate of 9.7% with an average asking rent of $16.08 PSF. The appraisal concluded to market rents of $11.40 PSF, $27.00 PSF, $33.00 PSF, $21.00 PSF and $24.00 PSF for the anchor, inline retail, pad, junior anchor, and large inline retail on a triple-net basis, respectively.
The following tables present certain information relating to retail rental and sales comparables to the Rancho Cordova Town Center Property:
Rancho Cordova Town Center – Comparable Leases Summary(1)
| Property Name | Location | Market Rent (PSF/Yr) | Square Footage | Lease Term (Yrs) | Lease Type | Rent Increase Projection | Tenant Name | Type of Space |
| Zinfandel Place | Rancho Cordova, CA | $28.20 | 3,685 | 9 | NNN | 3.0% per annum | CDC Dental Management Co, LLC | Inline |
| Manzanita Plaza | Carmichael, CA | $29.88 | 1,166 | 5 | NNN | 3.0% per annum | Halal Pizza | Inline |
| Commercial Retail Property | Elk Grove, CA | $34.80 | 1,636 | 7 | NNN | 3.0% per annum | Nash and Proper | Inline |
| Antique Plaza | Rancho Cordova, CA | $10.20 | 20,088 | 5 | NNN | 3.0% per annum | Cali Quilt Co | Anchor |
| Florin Square | Sacramento, CA | $10.32 | 12,329 | 7 | NNN | 2.0% per annum | Bargain World | Anchor |
| Walerga Plaza | Antelope, CA | $11.40 | 54,502 | 15 | NNN | 2.0% per annum | California Family Fitness | Anchor |
| (1) | Information obtained from the appraisal. |
THE INFORMATION IN THIS COLLATERAL TERM SHEET IS NOT COMPLETE AND MAY BE AMENDED PRIOR TO THE TIME OF SALE. THIS TERM SHEET IS NOT AN OFFER TO SELL THESE SECURITIES AND IT IS NOT A SOLICITATION OF AN OFFER TO BUY THESE SECURITIES IN ANY JURISDICTION WHERE THE OFFER OR SALE IS NOT PERMITTED.
13
| Retail – Anchored | Loan #1 | Cut-off Date Balance: | | $44,700,000 |
| Property Addresses - Various | Pacific Castle Portfolio | Cut-off Date LTV: | | 60.0% |
| | | U/W NCF DSCR: | | 2.43x |
| | | U/W NOI Debt Yield: | | 10.2% |
Rancho Cordova Town Center – Comparable Sales Summary(1)
| Property Name | Location | Rentable Area (SF) | Sale Date | Sale Price | Sales Price (PSF) | Cap Rate |
| Town & Country Village | Sacramento, CA | 216,320 | Nov-21 | $62,150,000 | $287.31 | 6.3% |
| Mitchell Plaza | Ceres, CA | 43,200 | Apr-21 | $9,650,000 | $223.38 | 6.9% |
| Promenade at Sacramento Gateway | Sacramento, CA | 283,341 | Oct-19 | $56,042,000 | $197.79 | 7.3% |
| Nut Tree Plaza | Vacaville, CA | 241,452 | Nov-21 | $69,116,000 | $286.25 | 6.7% |
| Summerhill Plaza | Citrus Heights, CA | 108,081 | Dec-21 | $18,750,000 | $173.48 | 5.8% |
| Rio Linda Plaza | Rio Linda, CA | 77,080 | Jun-20 | $15,515,000 | $201.28 | 7.4% |
| (1) | Information obtained from the appraisal. |
Prune Tree Center (28.3% of NRA; 27.7% of ALA): The Prune Tree Center Property is located in northeast Monterey County, California, approximately five miles north of Salinas. Primary access to the area is provided by US Highway 101, a major north-south route connecting San Francisco with Los Angeles. The surrounding neighborhood consists primarily of residential properties, with commercial uses located near Highway 101. According to the appraisal, the Prune Tree Center property is located in the North Monterey County retail submarket within the Salinas MSA. The top three industries within the area are Agric/Forestry/Fishing/Hunting, Health Care/Social Assistance and Retail Trade, which represent a combined total of 39% of the population. As of the third quarter of 2021, the North Monterey County retail submarket had approximately 3.7 million square feet of inventory and a vacancy rate of 2.9%, with an average asking rent of $20.37 PSF. The appraisal concluded to market rents of $10.80 PSF, $21.00 PSF, $18.00 PSF, $33.00 PSF, and $12.00 PSF for anchor, high end retail, low end retail, ground lease pad, and office space, respectively.
The following tables present certain information relating to retail rental and sales comparables to the Prune Tree Center Property:
Prune Tree Center – Comparable Leases Summary(1)
| Property Name | Location | Market Rent (PSF/Yr) | Square Footage | Lease Term (Yrs) | Lease Type | Rent Increase Projection | Tenant Name | Type of Space |
| Westgate Shopping Center | Woodland, CA | $7.56 | 60,115 | 10 | NNN | None | Raley's | Anchor |
| Pacific Town Center | Stockton, CA | $12.00 | 30,037 | 10 | NNN | 10% / Yr. 5 | Smart & Final | Anchor |
| 99 Cents Only and Smart & Final Extra Stores | Hanford, CA | $11.04 | 23,154 | 9 | NNN | 10% / Yr. 6 | 99 Cents Only Stores | Anchor |
| Cypress Plaza | Marina, CA | $21.00 | 1,500 | 2 | NNN | 3.0% per annum | Doctor (Family Practice) | Inline |
| Pajaro Hills Retail Center | Watsonville, CA | $23.40 | 6,559 | 10 | NNN | 3.0% per annum | Confidential | Inline |
| Mountain Valley Center | Salinas, CA | $24.00 | 1,500 | 5 | NNN | None | Piara Pizza | Inline |
| (1) | Information obtained from the appraisal. |
Prune Tree Center – Comparable Sales Summary(1)
| Property Name | Location | Rentable Area (SF) | Sale Date | Sale Price | Sales Price (PSF) | Cap Rate |
| Rio Linda Plaza | Rio Linda, CA | 77,080 | Jun-20 | $15,515,000 | $201.28 | 8.2% |
| Pacheco Pass Center | Gilroy, CA | 78,215 | Nov-19 | $22,000,000 | $281.28 | 5.5% |
| Antioch Crossings | Antioch, CA | 120,667 | Sep-19 | $25,983,207 | $215.33 | 6.6% |
| Morada Ranch | Stockton, CA | 101,842 | Apr-19 | $30,000,000 | $294.57 | 6.8% |
| The Dunes at Monterey Bay | Marina, CA | 233,892 | Sep-18 | $45,000,000 | $192.40 | 7.1% |
| (1) | Information obtained from the appraisal. |
Rimrock Plaza (20.7% of NRA; 20.2% of ALA): The Rimrock Plaza Property is located in the Coachella Valley region of Riverside County, California, approximately 61 miles east of San Bernardino. Primary access to the area is provided by the 10 Freeway, which is located approximately five miles north of the Rimrock Plaza Property. The surrounding neighborhood consists primarily of resort residential developments and country club/golf course facilities. The Coachella Valley’s largest industry is tourism, which generates approximately $1 billion in revenue annually. There are over 100 golf courses in the Coachella Valley, with several major tournaments being hosted
THE INFORMATION IN THIS COLLATERAL TERM SHEET IS NOT COMPLETE AND MAY BE AMENDED PRIOR TO THE TIME OF SALE. THIS TERM SHEET IS NOT AN OFFER TO SELL THESE SECURITIES AND IT IS NOT A SOLICITATION OF AN OFFER TO BUY THESE SECURITIES IN ANY JURISDICTION WHERE THE OFFER OR SALE IS NOT PERMITTED.
14
| Retail – Anchored | Loan #1 | Cut-off Date Balance: | | $44,700,000 |
| Property Addresses - Various | Pacific Castle Portfolio | Cut-off Date LTV: | | 60.0% |
| | | U/W NCF DSCR: | | 2.43x |
| | | U/W NOI Debt Yield: | | 10.2% |
at these courses each year. According to the appraisal, the Rimrock Plaza Property is located in the Coachella Valley Retail Submarket within the broader Inland Empire Market. The Coachella Valley Retail Submarket had approximately 26.9 million square feet of inventory and a vacancy rate of 9.2% as of the second quarter of 2021, with an average asking rent of $23.04 PSF annually. The appraisal concluded to market rents of $15.00 PSF and $12.00 PSF to $30.00 PSF for grocery and shop spaces, respectively.
The following tables present certain information relating to retail rental and sales comparables to the Rimrock Plaza Property:
Rimrock Plaza – Comparable Leases Summary(1)
| Property Name | Location | Market Rent (PSF/Yr) | Square Footage | Lease Term (Yrs) | Lease Type | Tenant Name | Type of Space |
| Smoke Tree Village | Palm Springs, CA | $17.40 | 906 | 3 | NNN | Palm Springs Holistic | Inline |
| Gene Autry Plaza | Palm Springs, CA | $36.00 | 1,508 | 5 | NNN | Retail Tenant | Inline |
| Sun Center | Palm Springs, CA | $9.96 | 6,000 | 5 | NNN | Desert Rose Playhouse | Inline |
| Crossley Plaza | Palm Springs, CA | $12.00 | 1,458 | 5 | NNN | Retail Tenant | Inline |
| Shops at Palm Springs Marketplace | Palm Springs, CA | $10.80 | 2,070 | 5 | NNN | Bones N Scones | Inline |
| The Springs | Palm Springs, CA | $32.40 | 3,360 | 10 | NNN | America's Best Eyeglasses | Inline |
| (1) | Information obtained from the appraisal. |
Rimrock Plaza – Comparable Sales Summary(1)
| Property Name | Location | Rentable Area (SF) | Sale Date | Sale Price | Sales Price (PSF) | Cap Rate |
| Magnolia Tyler Center | Riverside, CA | 182,653 | Apr-21 | $39,400,000 | $215.71 | 6.5% |
| Gene Autry Plaza | Palm Springs, CA | 69,652 | Mar-21 | $23,400,000 | $335.96 | 6.8% |
| Arlington Plaza | Riverside, CA | 126,067 | Jan-20 | $27,100,000 | $214.97 | 6.5% |
| Menifee Town Center | Menifee, CA | 124,431 | Jul-19 | $25,350,000 | $203.73 | 7.4% |
| Palms to Pines West | Palm Desert, CA | 82,180 | May-19 | $10,606,500 | $129.06 | 7.5% |
| Heritage Plaza | Riverside, CA | 124,550 | Sep-18 | $26,250,000 | $210.76 | 7.6% |
| (1) | Information obtained from the appraisal. |
Sandstone Village (19.0% of NRA; 18.5% of ALA): The Sandstone Village Property is located in Washington County, Utah, approximately 120 miles northeast of Las Vegas. Primary access to the area is provided by Interstate 15 via the St. George Boulevard exit. The immediate area surrounding the Sandstone Village Property consists primarily of commercial development centered around Interstate 15. According to the appraisal, the Sandstone Village Property’s neighborhood is heavily influenced by tourism due to its proximity to Zion National Park, Grand Canyon National Park, Bryce Canyon National Park, and Lake Powell National Recreation Area. As of the second quarter of 2021, the St. George retail market had approximately 8.9 million square feet of inventory and a vacancy rate of 2.6% with an average asking rent of $16.62 PSF. The appraisal concluded to market rents of $12.00 PSF, $18.00 PSF, and $36.00 PSF for anchor, inline shops, and pad shop spaces, respectively.
THE INFORMATION IN THIS COLLATERAL TERM SHEET IS NOT COMPLETE AND MAY BE AMENDED PRIOR TO THE TIME OF SALE. THIS TERM SHEET IS NOT AN OFFER TO SELL THESE SECURITIES AND IT IS NOT A SOLICITATION OF AN OFFER TO BUY THESE SECURITIES IN ANY JURISDICTION WHERE THE OFFER OR SALE IS NOT PERMITTED.
15
| Retail – Anchored | Loan #1 | Cut-off Date Balance: | | $44,700,000 |
| Property Addresses - Various | Pacific Castle Portfolio | Cut-off Date LTV: | | 60.0% |
| | | U/W NCF DSCR: | | 2.43x |
| | | U/W NOI Debt Yield: | | 10.2% |
The following tables present certain information relating to retail rental and sales comparables to the Sandstone Village Property:
Sandstone Village – Comparable Leases Summary(1)
| Property Name | Location | Market Rent (PSF/Yr) | Square Footage | Lease Term (Yrs) | Lease Type | Rent Increase Projection | Tenant Name | Type of Space |
| Dinosaur Crossing | St. George, UT | $33.50 | 1,500 | 7 | NNN | NAV | Swig | Inline |
| Lin's Anchored Retail | St. George, UT | $29.64 | 1,466 | 5 | NNN | NAV | Fortify Physical Therapy | Inline |
| Green Springs Shopping Center | Washington, UT | $14.00 | 2,500 | 6 | NNN | NAV | Desert Haven Spa | Inline |
| Pineview Plaza | St. George, UT | $14.00 | 2,208 | 2 | NNN | NAV | Photo Pop | Inline |
| Cotton Mill Center | Washington, UT | $28.00 | 2,666 | 5 | NNN | NAV | Red Rock Hot Tubs | Inline |
| Retail Center | Washington, UT | $19.08 | 1,400 | 5 | NNN | NAV | The Crepe Station | Inline |
| (1) | Information obtained from the appraisal. |
Sandstone Village – Comparable Sales Summary(1)
| Property Name | Location | Rentable Area (SF) | Sale Date | Sale Price | Sales Price (PSF) | Cap Rate |
| Foothill Village | Salt Lake City, UT | 271,823 | Aug-21 | $51,000,000 | $187.62 | 5.5% |
| Parkway Village | Provo, UT | 102,298 | Jun-21 | $26,200,000 | $256.11 | 5.0% |
| The Center @ Dinosaur Crossing | St. George, UT | 21,403 | Mar-20 | $4,600,000 | $214.92 | 6.8% |
| Jordan Square | West Jordan, UT | 108,627 | Mar-20 | $17,000,000 | $156.50 | 7.2% |
| Interpointe Shopping Center | South Salt Lake, UT | 99,809 | Feb-20 | $20,660,000 | $207.00 | 6.9% |
| Promenade at Red Cliffs | St. George, UT | 95,304 | Jan-19 | $22,750,000 | $238.71 | 7.5% |
| (1) | Information obtained from the appraisal |
Escrows.
Real Estate Taxes – The Pacific Castle Portfolio Whole Loan documents require an upfront real estate tax reserve of approximately $373,548 and ongoing monthly tax reserves in an amount equal to one-twelfth of the real estate taxes that the lender estimates will be payable during the next 12 months (initially $74,710).
Insurance – The Pacific Castle Portfolio Whole Loan documents require an upfront insurance reserve of approximately $106,062 and ongoing monthly insurance reserves in an amount equal to one-twelfth of the insurance premiums that the lender estimates will be payable for the renewal of the coverage during the next 12 months (initially $11,785).
Replacement Reserve – The Pacific Castle Portfolio Whole Loan documents require ongoing monthly replacement reserves of approximately $5,814, subject to a cap of $348,836.
TI/LC Reserve – The Pacific Castle Portfolio Whole Loan documents require an upfront TI/LC reserve of approximately $300,000 and monthly deposits of $29,070, subject to a cap of $1,046,509.
Immediate Repairs – The Pacific Castle Portfolio Whole Loan documents require an upfront immediate repairs reserve of approximately $40,063.
Lockbox and Cash Management. The Pacific Castle Portfolio Whole Loan is structured with a hard lockbox and springing cash management upon the occurrence and continuance of a Cash Management Period (as defined below). Revenues from the Pacific Castle Portfolio Properties are required to be deposited directly into the lockbox account or, if received by the borrowers or the property manager, deposited into the lockbox account within three business days of receipt. During the continuance of a Cash Management Period, all funds in the lockbox account are required to be swept each business day to a lender-controlled cash management account and disbursed in accordance with the Pacific Castle Portfolio Whole Loan documents, and all excess funds on deposit in the cash management account (after payment of required monthly reserve deposits, debt service payment on the Pacific Castle Portfolio Whole Loan, and operating expenses) are required to be held as additional collateral for the Pacific Castle Portfolio Whole Loan.
THE INFORMATION IN THIS COLLATERAL TERM SHEET IS NOT COMPLETE AND MAY BE AMENDED PRIOR TO THE TIME OF SALE. THIS TERM SHEET IS NOT AN OFFER TO SELL THESE SECURITIES AND IT IS NOT A SOLICITATION OF AN OFFER TO BUY THESE SECURITIES IN ANY JURISDICTION WHERE THE OFFER OR SALE IS NOT PERMITTED.
16
| Retail – Anchored | Loan #1 | Cut-off Date Balance: | | $44,700,000 |
| Property Addresses - Various | Pacific Castle Portfolio | Cut-off Date LTV: | | 60.0% |
| | | U/W NCF DSCR: | | 2.43x |
| | | U/W NOI Debt Yield: | | 10.2% |
A “Cash Management Period” will commence upon the earliest of the following:
| (i) | The maturity date has occurred; |
| (ii) | a default or an event of default; |
| (iii) | the trailing 12-month period debt service coverage ratio falling below 1.30x as of the last day of any calendar quarter; or |
| (iv) | the commencement of a Lease Sweep Period (as defined below). |
A Cash Management Period will end upon the occurrence of the following:
| • | if (1) the Pacific Castle Portfolio Whole Loan and all other obligations under the Pacific Castle Portfolio Whole Loan documents have been repaid in full or (2) the maturity date has not occurred and |
| • | with regard to clause (ii) above, the cure of such default or event of default and no other default or event of default has occurred and is continuing; |
| • | with regard to clause (iii) above, the trailing 12-month debt service coverage ratio for the Pacific Castle Portfolio Properties in the aggregate being at least 1.35x for two consecutive calendar quarters; or |
| • | with regard to clause (iv) above, the Lease Sweep Period being cured as set forth in the definition of such term below. |
A “Lease Sweep Period” will commence upon the occurrence of:
| (i) | the earlier of (a) the date that is nine months prior to the end of the term of the Lease Sweep Lease (as defined below) (including any renewal terms) (or six months with respect to Vons), or (b) the date the applicable tenant under a Lease Sweep Lease actually gives such written notice of its intention not to renew or extend; |
| (ii) | the date required under a Lease Sweep Lease by which the applicable tenant is required to give notice of its exercise of a renewal option (and such renewal has not been exercised) or the date that any tenant under a Lease Sweep Lease gives written notice of its intention not to renew or extend; |
| (iii) | any Lease Sweep Lease (or any material portion thereof) is surrendered, cancelled or terminated prior to its then current expiration date or any tenant under a Lease Sweep Lease gives written notice of its intention to terminate, surrender or cancel its Lease Sweep Lease (or any material portion thereof); |
| (iv) | any tenant under a Lease Sweep Lease discontinues its business in any material portion of its premises (i.e., “goes dark”) or gives written notice that it intends to do the same; |
| (v) | the occurrence and continuance (beyond any applicable notice and cure periods) of a monetary or non-monetary default under any Lease Sweep Lease by the applicable tenant; or |
| (vi) | any tenant under a Lease Sweep Lease becomes subject to an insolvency proceeding. |
A Lease Sweep Period will end upon the earlier to occur of (a) the date on which the amount in the special rollover reserve account is equal to $25.00 per square foot for each Lease Sweep Lease space that gave rise to the Lease Sweep Period, or (b) the occurrence of any of the following:
| • | with respect to a Lease Sweep Period caused by a matter described in clauses (i), (ii), (iii) or (iv) above, upon the earlier to occur of (A) the date on which the tenant under the Lease Sweep Lease irrevocably exercises its renewal or extension option with respect to all of the space demised under its Lease Sweep Lease, and in the lender’s reasonable judgment, sufficient funds have been accumulated in the special rollover reserve to pay for all anticipated leasing expenses for such Lease Sweep Lease and any other anticipated expenses in connection with such renewal or extension, or (B) the date on which all of the space demised under the subject Lease Sweep Lease that gave rise to the subject Lease Sweep Period has been fully leased pursuant to a replacement lease or replacement leases approved by the lender, and entered into in accordance with the Pacific Castle Portfolio Whole Loan documents, and all approved leasing expenses for such Lease Sweep Lease (and any other expenses in connection with the re-tenanting of such space) have been paid in full; |
| • | with regard to clause (v) above, the default under the Lease Sweep Lease has been cured and no other default under a Lease Sweep Lease has occurred for a period of three consecutive months following such cure; |
| • | with regard to clause (vi) above, the applicable insolvency proceeding has terminated and the applicable Lease Sweep Lease has been affirmed, assumed or assigned in a manner reasonably satisfactory to the lender. |
A “Lease Sweep Lease” means Safeway, CVS, Michael’s, TJ Maxx, Vons, and any other lease (leased by such tenant and/or its affiliates) that covers 27,000 or more rentable square feet at an individual Pacific Castle Portfolio Property.
Property Management. The Pacific Castle Portfolio Properties are currently managed by Pacific Castle Management, Inc., an affiliate of the borrowers.
Partial Release. At any time after the earlier to occur of (x) February 2, 2025 and (y) the date that is two years from the closing date of the securitization of the last promissory note comprising the Pacific Castle Portfolio Whole Loan, the borrowers may obtain a release of an individual property from the lien of the mortgage, subject to satisfaction of certain conditions including, but not limited to (i) a partial defeasance of the principal of the Pacific Castle Portfolio Whole Loan by an amount equal to the greater of (x) 95% of the net proceeds from such sale, and (y) 125% of the allocated loan amount of the applicable property, (ii) satisfaction of all REMIC requirements, and (iii) a requirement that after giving effect to such release, the debt yield is not less than the greater of (A) the debt yield immediately prior to such release and (B) 9.08%.
THE INFORMATION IN THIS COLLATERAL TERM SHEET IS NOT COMPLETE AND MAY BE AMENDED PRIOR TO THE TIME OF SALE. THIS TERM SHEET IS NOT AN OFFER TO SELL THESE SECURITIES AND IT IS NOT A SOLICITATION OF AN OFFER TO BUY THESE SECURITIES IN ANY JURISDICTION WHERE THE OFFER OR SALE IS NOT PERMITTED.
17
| Retail – Anchored | Loan #1 | Cut-off Date Balance: | | $44,700,000 |
| Property Addresses - Various | Pacific Castle Portfolio | Cut-off Date LTV: | | 60.0% |
| | | U/W NCF DSCR: | | 2.43x |
| | | U/W NOI Debt Yield: | | 10.2% |
Real Estate Substitution. Not permitted.
Subordinate and Mezzanine Indebtedness. None.
Ground Lease. None.
Terrorism Insurance. The Pacific Castle Portfolio Whole Loan documents require that the “all risk” insurance policy required to be maintained by the borrowers provides coverage for terrorism in an amount equal to the full replacement cost of the Pacific Castle Portfolio Properties, as well as business interruption insurance covering no less than the 12-month period following the occurrence of the casualty event.
THE INFORMATION IN THIS COLLATERAL TERM SHEET IS NOT COMPLETE AND MAY BE AMENDED PRIOR TO THE TIME OF SALE. THIS TERM SHEET IS NOT AN OFFER TO SELL THESE SECURITIES AND IT IS NOT A SOLICITATION OF AN OFFER TO BUY THESE SECURITIES IN ANY JURISDICTION WHERE THE OFFER OR SALE IS NOT PERMITTED.
18
| Retail – Anchored | Loan #2 Whizin Market Square | Cut-off Date Balance: | $40,250,000 |
28854, 28912, 29000, 28750 & 28752 Roadside Drive, 28851-28857 Agoura Road,
5050 Cornell Road Agoura Hills, CA 91301 | Cut-off Date LTV: | 62.9% |
| U/W NCF DSCR: | 1.83x |
| U/W NOI Debt Yield: | 9.2% |
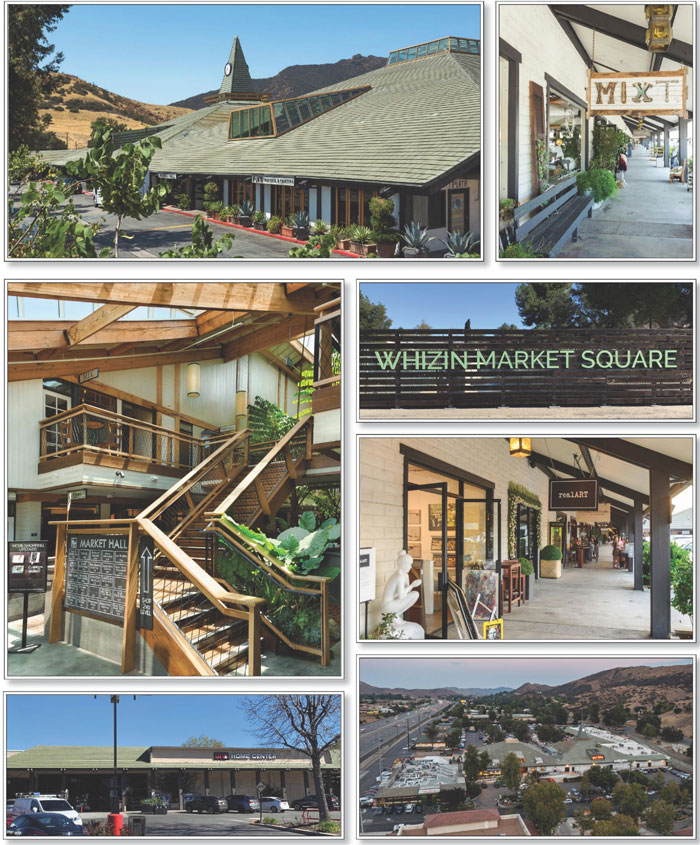
THE INFORMATION IN THIS COLLATERAL TERM SHEET IS NOT COMPLETE AND MAY BE AMENDED PRIOR TO THE TIME OF SALE. THIS TERM SHEET IS NOT AN OFFER TO SELL THESE SECURITIES AND IT IS NOT A SOLICITATION OF AN OFFER TO BUY THESE SECURITIES IN ANY JURISDICTION WHERE THE OFFER OR SALE IS NOT PERMITTED.
19
| No. 2 – Whizin Market Square |
| |
| Mortgage Loan Information | | Mortgaged Property Information |
| Mortgage Loan Seller: | BSPRT CMBS Finance, LLC | | Single Asset/Portfolio: | Single Asset |
Credit Assessment (Fitch/KBRA/Moody’s): | NR/NR/NR | | Property Type – Subtype: | Retail – Anchored |
| Original Principal Balance: | $40,250,000 | | Location: | Agoura Hills, CA |
| Cut-off Date Balance: | $40,250,000 | | Size: | 136,746 SF |
| % of Initial Pool Balance: | 7.6% | | Cut-off Date Balance Per SF: | $294.34 |
| Loan Purpose: | Refinance/Acquisition | | Maturity Date Balance Per SF: | $294.34 |
| Borrower Sponsors: | Various(1) | | Year Built/Renovated: | 1968/2014; 2017 |
| Guarantors: | Various(1) | | Title Vesting: | Fee |
| Mortgage Rate: | 4.7600% | | Property Manager(3): | Kennedy-Wilson Properties Ltd. |
| Note Date: | March 14, 2022 | | Current Occupancy (As of)(4): | 95.7% (2/24/2022) |
| Seasoning: | 0 months | | YE 2021 Occupancy : | 90.9% |
| Maturity Date: | April 6, 2032 | | YE 2020 Occupancy: | 92.3% |
| IO Period: | 120 months | | YE 2019 Occupancy: | 90.9% |
| Loan Term (Original): | 120 months | | YE 2018 Occupancy: | 88.7% |
| Amortization Term (Original): | NAP | | Appraised Value: | $64,000,000 |
| Loan Amortization Type: | Interest Only | | Appraised Value Per SF: | $468.02 |
| Call Protection: | YM1(116),O(4) | | Appraisal Valuation Date: | December 26, 2021 |
| | | | | |
| Lockbox Type: | Springing | | Underwriting and Financial Information (5) |
| Additional Debt: | None | | YE 2021 NOI (6)(7): | $2,245,518 |
| Additional Debt Type (Balance): | NAP | | YE 2020 NOI(6): | $1,541,593 |
| | | | YE 2019 NOI(6): | $2,000,325 |
| | | | YE 2018 NOI(6): | $2,088,151 |
| Escrows and Reserves(2) | | U/W Revenues: | $5,098,914 |
| | Initial | Monthly | Cap | | U/W Expenses: | $1,379,925 |
| Taxes | $61,226 | $30,613 | NAP | | U/W NOI(7): | $3,718,989 |
| Insurance | $188,125 | $18,813 | NAP | | U/W NCF: | $3,552,159 |
| Replacement Reserve | $0 | $2,507 | NAP | | U/W DSCR based on NOI/NCF: | 1.91x / 1.83x |
| TI/LC Reserve | $0 | $11,396 | $685,000 | | U/W Debt Yield based on NOI/NCF: | 9.2% / 8.8% |
| Deferred Maintenance | $20,040 | $0 | NAP | | U/W Debt Yield at Maturity based on NOI/NCF: | 9.2% / 8.8% |
| Unfunded Obligations Reserve | $331,503 | $0 | NAP | | Cut-off Date LTV Ratio: | 62.9% |
| Free Rent Reserve | $73,669 | $0 | NAP | | LTV Ratio at Maturity: | 62.9% |
| Wood Ranch Security Deposit Reserve | $9,310 | $0 | NAP | | | |
| | | | | | | | |
| Sources and Uses |
| Sources | | | | Uses | | |
| Original loan amount | $40,250,000 | 89.6 | % | | Loan Payoff(8) | $28,364,156 | 63.1 | % |
| Borrower Equity | 4,679,820 | 10.4 | | | Purchase Price(9) | 15,187,500 | 33.8 | |
| | | | | | Upfront reserves | 683,873 | 1.5 | |
| | | | | | Closing costs | 694,290 | 1.5 | |
| Total Sources | $44,929,820 | 100.0 | % | | Total Uses | $44,929,820 | 100.0 | % |
| (1) | The Borrower Sponsors and Guarantors are William P. Tucker and William Paul Tucker as Trustee of the Survivor's Trust created under restatement in its entirety of the William P. and Rise S. Tucker Living Trust dated September 23, 1998, amended and restated in its entirety as of February 16, 1999. |
| (2) | See “Escrows” below for a full description of the Escrows and Reserves. |
| (3) | The Whizin Market Parcel (as defined below) of the Whizin Market Square Property (as defined below) is managed by Kennedy-Wilson Properties Ltd. The Roadside Parcel (as defined below) of the Whizin Market Square Property is self-managed. |
| (4) | Occupancy figure includes four tenants totalling 8,542 square feet of space that are in various stages of buildout and not yet in occupancy. |
| (5) | While the Whizin Market Square Mortgage Loan (as defined below) was originated after the emergence of the novel coronavirus pandemic and the economic disruption resulting from measures to combat the pandemic, the pandemic is an evolving situation and could impact the Whizin Market Square Mortgage Loan more severely than assumed in the underwriting and could adversely affect the NOI, NCF and occupancy information, as well as the appraised value and the DSCR, LTV and Debt Yield metrics presented above. See “Risk Factors—Risks Related to Market Conditions and Other External Factors— The Coronavirus Pandemic Has Adversely Affected the Global Economy and Will Likely Adversely Affect the Performance of the Mortgage Loans” in the Preliminary Prospectus. |
| (6) | Historical financials do not include financials for the Roadside Parcel which corresponds to the parcel occupied by DIY Home Center. That parcel was acquired in conjunction with the origination of the Whizin Market Square Mortgage Loan. |
| (7) | The increase in U/W Net Operating Income from YE 2021 Net Operating Income is primarily attributable to the acquisition of the Roadside Parcel, the burn off of free rent associated with The Canyon Club as part of their new lease executed in March 2020 and approximately 7% occupancy increase since mid-year 2020. |
THE INFORMATION IN THIS COLLATERAL TERM SHEET IS NOT COMPLETE AND MAY BE AMENDED PRIOR TO THE TIME OF SALE. THIS TERM SHEET IS NOT AN OFFER TO SELL THESE SECURITIES AND IT IS NOT A SOLICITATION OF AN OFFER TO BUY THESE SECURITIES IN ANY JURISDICTION WHERE THE OFFER OR SALE IS NOT PERMITTED.
20
| Retail – Anchored | Loan #2 Whizin Market Square | Cut-off Date Balance: | $40,250,000 |
28854, 28912, 29000, 28750 & 28752 Roadside Drive, 28851-28857 Agoura Road,
5050 Cornell Road Agoura Hills, CA 91301 | Cut-off Date LTV: | 62.9% |
| U/W NCF DSCR: | 1.83x |
| U/W NOI Debt Yield: | 9.2% |
| (8) | Previous debt was originated by Benefit Street Partners Operating Partnership, L.P and was securitized in the BSPRT 2018-FL4 transaction. |
| (9) | Purchase price reflects acquisition of the Roadside Parcel. |
The Mortgage Loan. The mortgage loan (the “Whizin Market Square Mortgage Loan”) is evidenced by a single promissory note secured by a first mortgage encumbering the borrower’s fee interest in a 136,746 square foot anchored retail property located in Agoura Hills, California (the “Whizin Market Square Property”).
The Borrower and Borrower Sponsors. The borrowers are Whizin Market, LLC and Whizin Roadside, LLC (individually and collectively, the “Whizin Market Square Borrower”), each a Delaware limited liability company and single purpose entity with two independent directors. Legal counsel to the Whizin Market Square Borrower delivered a non-consolidation opinion in connection with the origination of the Whizin Market Square Mortgage Loan. The non-recourse carveout guarantors and the borrower sponsors of the Whizin Market Square Mortgage Loan are William P. Tucker and William Paul Tucker as Trustee of the Survivor's Trust created under restatement in its entirety of the William P. and Rise S. Tucker Living Trust dated September 23, 1998, amended and restated in its entirety as of February 16, 1999 (collectively, the “Borrower Sponsors” or the “Guarantors”). Mr. Tucker is the founder and president of Tucker Investment Group, LLC (“TIG”). TIG mainly focuses on improving properties in partnership with cities and urban redevelopment agencies in Southern California. TIG has multiple investments in Long Beach, Santa Monica, Burbank, Sacramento and Oxnard, California, and has a history of working with local governments to establish business improvement districts. As president of TIG, Mr. Tucker has been involved in the development, investment, and management of 25 revitalization projects in Southern California.
The Property. The Whizin Market Square Property is an anchored retail shopping center, containing 136,746 square feet of net rentable area located in Agoura Hills, California. The Whizin Market Square Property was developed from 1954 through 1980, and partially renovated in 2014 and 2017. The Whizin Market Square Property features a 96,246 square foot, five-building, retail shopping center (the “Whizin Market Parcel”) and a contiguous 40,500 square foot retail building (the “Roadside Parcel”) that is occupied by DIY Home Center. The Whizin Market Square Property is spread across six separate buildings that share a common parking lot containing 550 spaces, resulting in a parking ratio of 4.02 spaces per 1,000 square feet of net rentable area. The Whizin Market Square Property is situated on 12.8 acres of land adjacent to U.S. Highway 101, which traverses through the area in an east/west direction in the southern portion of the city. As of March 3, 2022, the Whizin Market Square Property was 95.7% occupied by 51 tenants that range across a broad spectrum of industries.
Major Tenants. Largest Tenant: DIY Home Center (40,500 square feet; 29.6% of NRA; 15.4% of U/W base rent; 12/31/2026 lease expiration)-
Founded in 1948, DIY Home Center (“DIY”) is a home improvement retailer that is based in Chatsworth, California and has over 600 employees. DIY offers a range of products for maintenance, repair, remodeling and home decorating. DIY provides home improvement products under the categories of appliances, lawn and landscape, electrical lumber, building materials, paint, home fashion, plumbing, flooring, tools, seasonal living, millwork, hardware, fashion plumbing, nursery, and more. There are currently nine store locations throughout California. DIY has been a tenant at the Whizin Market Square Property since 1987. DIY recently extended its lease under a lease that commenced on January 1, 2022 and expires on December 31, 2026, with one, five-year renewal option remaining and no termination options.
Second Largest Tenant: The Canyon Club (16,000 square feet; 11.7% of NRA; 13.4% of U/W base rent; 3/6/2030 lease expiration)- The Canyon Club was founded in 2001 and operates as a restaurant and music venue. The venue has a capacity of 1,000 and hosts various concerts and events per year including legacy acts such as Kenny Rogers, Willie Nelson, Foo Fighters, and various tribute/cover bands. The Canyon Club has been a tenant at the Whizin Market Square Property since 2001 and has two, five-year renewal options remaining. The Canyon Club has the right to terminate its lease with 12 months’ written notice.
Third Largest Tenant: Agoura Antique Mart (9,034 square feet; 6.6% of NRA; 7.3% of U/W base rent; 1/31/2023 lease expiration)- Agoura Antique Mart is a collection of 50 antique dealers whose wares include a mix of vintage and antique furniture, lighting, textiles, signage and garden décor. Agoura Antique Mart has been a tenant at the Whizin Market Square Property since 2017. The tenant has no renewal options and no termination options.
THE INFORMATION IN THIS COLLATERAL TERM SHEET IS NOT COMPLETE AND MAY BE AMENDED PRIOR TO THE TIME OF SALE. THIS TERM SHEET IS NOT AN OFFER TO SELL THESE SECURITIES AND IT IS NOT A SOLICITATION OF AN OFFER TO BUY THESE SECURITIES IN ANY JURISDICTION WHERE THE OFFER OR SALE IS NOT PERMITTED.
21
| Retail – Anchored | Loan #2 Whizin Market Square | Cut-off Date Balance: | $40,250,000 |
28854, 28912, 29000, 28750 & 28752 Roadside Drive, 28851-28857 Agoura Road,
5050 Cornell Road Agoura Hills, CA 91301 | Cut-off Date LTV: | 62.9% |
| U/W NCF DSCR: | 1.83x |
| U/W NOI Debt Yield: | 9.2% |
The following table presents certain information relating to the tenancy at the Whizin Market Square Property:
Major Tenants
| Tenant Name | Credit Rating (Fitch/Moody’s/
S&P)(1) | Tenant NRSF | % of
NRSF | Annual U/W Base Rent PSF(1) | Annual
U/W Base Rent(1) | % of Total Annual U/W Base Rent | Lease
Expiration
Date | Extension Options | Termination Option (Y/N) |
| Major Tenants | | | | | | | | | |
| | | | | | | | | | |
| DIY Home Center | NR/NR/NR | 40,500 | 29.6% | $15.00 | $607,500 | 15.4% | 12/31/2026 | 1, 5-year | N |
| | | | | | | | | | |
| The Canyon Club | NR/NR/NR | 16,000 | 11.7% | $33.00 | $528,000 | 13.4% | 3/6/2030 | 2, 5-year | Y(2) |
| Agoura Antique Mart | NR/NR/NR | 9,034 | 6.6% | $31.79 | $287,194 | 7.3% | 1/31/2023 | N | N |
| Wood Ranch Agoura Hills | NR/NR/NR | 8,269 | 6.0% | $43.16 | $356,887 | 9.0% | 12/31/2026 | N | Y(3) |
| Cleo's Salon (4) | NR/NR/NR | 5,500 | 4.0% | $40.20 | $221,100 | 5.6% | 1/31/2032 | 1, 5-year | N |
| | | | | | | | | | |
| Total Major Tenants | | 79,303 | 58.0% | $25.23 | $2,000,681 | 50.7% | | | |
Non-Major Tenant | | 51,538 | 37.7% | $37.72 | $1,944,023 | 49.3% | | | |
| | | | | | | | | | |
| Occupied Collateral | | 130,841 | 95.7% | $30.15 | $3,944,704 | 100.0% | | | |
| | | | | | | | | | |
| Vacant | | 5,905 | 4.3% | | | | | | |
| | | | | | | | | | |
| Collateral Total | | 136,746 | 100.0% | | | | | | |
| | | | | | | | | | |
| | | | | | | | | | | |
| (1) | The Annual U/W Base Rent PSF and Annual U/W Base Rent shown above include rent steps through October 2022 totaling $39,788. |
| (2) | The Canyon Club has the right to terminate its lease with 12 months’ written notice. |
| (3) | Wood Ranch Agoura Hills has the right to terminate its lease with 90 days’ written notice as long as the tenant does not relocate within a five-mile radius of the Whizin Market Square Property. |
| (4) | Cleo’s Salon signed a lease but has yet to take occupancy as their space is currently being built out. A total of $18,425 of the Free Rent Reserve is associated with Cleo’s Salon which will be disbursed in May 2022. |
The following table presents certain information relating to the lease rollover schedule at the Whizin Market Square Property:
Lease Expiration Schedule (1) (2)
Year Ending
December 31, | No. of Leases Expiring | Expiring NRSF | % of Total NRSF | Cumulative Expiring NRSF | Cumulative % of Total NRSF | Annual
U/W
Base Rent | % of Total Annual U/W Base Rent | Annual
U/W
Base Rent
PSF |
| MTM | 8 | 2,960 | 2.2% | 2,960 | 2.2% | $93,612 | 2.4% | $31.63 |
| 2022 | 7 | 9,934 | 7.3% | 12,894 | 9.4% | $313,900 | 8.0% | $31.60 |
| 2023 | 10 | 19,377 | 14.2% | 32,271 | 23.6% | $718,632 | 18.2% | $37.09 |
| 2024 | 9 | 10,169 | 7.4% | 42,440 | 31.0% | $326,679 | 8.3% | $32.12 |
| 2025 | 4 | 2,741 | 2.0% | 45,181 | 33.0% | $117,917 | 3.0% | $43.02 |
| 2026 | 8 | 54,115 | 39.6% | 99,296 | 72.6% | $1,212,235 | 30.7% | $22.40 |
| 2027 | 2 | 2,197 | 1.6% | 101,493 | 74.2% | $105,456 | 2.7% | $48.00 |
| 2028 | 0 | 0 | 0.0% | 101,493 | 74.2% | $0 | 0.0% | $0.00 |
| 2029 | 2 | 7,603 | 5.6% | 109,096 | 79.8% | $307,174 | 7.8% | $40.40 |
| 2030 | 1 | 16,000 | 11.7% | 125,096 | 91.5% | $528,000 | 13.4% | $33.00 |
| 2031 | 0 | 0 | 0.0% | 125,096 | 91.5% | $0 | 0.0% | $0.00 |
| 2032 | 1 | 5,500 | 4.0% | 130,596 | 95.5% | $221,100 | 5.6% | $40.20 |
| Thereafter(3) | 1 | 245 | 0.2% | 130,841 | 95.7% | $0 | 0.0% | $0.00 |
| Vacant | 0 | 5,905 | 4.3% | 136,746 | 100.0% | $0 | 0.0% | $0.00 |
| Total/Weighted Average | 53 | 136,746 | 100.0% | | | $3,944,704 | 100.0% | $30.15 (4) |
| (1) | Information obtained from the underwritten rent roll. |
| (2) | Certain tenants may have lease termination options that are exercisable prior to the originally stated expiration date of the subject lease that are not considered in the Lease Expiration Schedule. |
| (3) | Represents non-revenue space of 245 square feet attributable to the Whizin Market Square manager office. |
| (4) | Total/Weighted Average Annual U/W Base Rent PSF excludes vacant space. |
THE INFORMATION IN THIS COLLATERAL TERM SHEET IS NOT COMPLETE AND MAY BE AMENDED PRIOR TO THE TIME OF SALE. THIS TERM SHEET IS NOT AN OFFER TO SELL THESE SECURITIES AND IT IS NOT A SOLICITATION OF AN OFFER TO BUY THESE SECURITIES IN ANY JURISDICTION WHERE THE OFFER OR SALE IS NOT PERMITTED.
22
| Retail – Anchored | Loan #2 Whizin Market Square | Cut-off Date Balance: | $40,250,000 |
28854, 28912, 29000, 28750 & 28752 Roadside Drive, 28851-28857 Agoura Road,
5050 Cornell Road Agoura Hills, CA 91301 | Cut-off Date LTV: | 62.9% |
| U/W NCF DSCR: | 1.83x |
| U/W NOI Debt Yield: | 9.2% |
The following table presents historical occupancy percentages at the Whizin Market Square Property:
Historical Occupancy
| 12/31/2019(1) | | 12/31/2020(1) | | 12/31/2021(1) | | 2/24/2022(2) |
| 90.9% | | 92.3% | | 90.9% | | 95.7% |
| | | | | | | |
| (1) | Information obtained from the Whizin Market Square Borrower. |
| (2) | Information obtained from the underwritten rent roll. |
COVID-19 Update. As of March 16, 2022, the Whizin Market Square Property is open and operating. The Whizin Market Square Mortgage Loan is not subject to any modification or forbearance request. The first debt service payment of the Whizin Market Square Mortgage Loan is due May 6, 2022.
Operating History and Underwritten Net Cash Flow. The following table presents certain information relating to the underwritten net cash flow at the Whizin Market Square Property:
Cash Flow Analysis
| | | 2018(1) | | 2019(1) | | 2020(1) | | 2021(1) | | U/W | | %(2) | | U/W $ per SF | |
| Base Rent | | $2,315,974 | | $2,235,760 | | $1,976,717 | | $2,534,325 | | $4,156,459(3) | | 77.4% | | $30.40 | |
| Grossed Up Vacant Space | | 0 | | 0 | | 0 | | 0 | | 0 | | 0.0 | | 0.00 | |
| Gross Potential Rent | | $2,315,974 | | $2,235,760 | | $1,976,717 | | $2,534,325 | | $4,156,459 | | 77.4% | | $30.40 | |
| Percentage Rent | | 48,209 | | 72,269 | | 98,964 | | 230,705 | | 279,402 | | 5.2 | | 2.04 | |
| Other Income | | 39,484 | | 49,901 | | 17,364 | | 28,030 | | 28,030 | | 0.5 | | 0.20 | |
| Total Recoveries | | 700,800 | | 658,721 | | 423,622 | | 497,179 | | 908,286 | | 16.9 | | 6.64 | |
| Net Rental Income | | $3,104,467 | | $3,016,651 | | $2,516,667 | | $3,290,238 | | $5,372,177 | | 100.0% | | $39.29 | |
| (Vacancy & Credit Loss) | | 0 | | 0 | | 0 | | 0 | | (273,263) | | (5.1) (4) | | (2.00) | |
| Effective Gross Income | | $3,104,467 | | $3,016,651 | | $2,516,667 | | $3,290,238 | | $5,098,914 | | 94.9% | | $37.29 | |
| | | | | | | | | | | | | | | | |
| Real Estate Taxes | | 328,011 | | 333,177 | | 341,950 | | 348,160 | | 527,833 | | 10.4 | | 3.86 | |
| Insurance | | 105,101 | | 111,652 | | 174,841 | | 194,056 | | 214,563 | | 4.2 | | 1.57 | |
| Management Fee | | 130,776 | | 131,609 | | 111,808 | | 129,318 | | 152,967 | | 3.0 | | 1.12 | |
| Other Operating Expenses | | 452,428 | | 439,888 | | 346,474 | | 373,187 | | 484,562 | | 9.5 | | 3.54 | |
| Total Operating Expenses | | $1,016,316 | | $1,016,326 | | $975,074 | | $1,044,721 | | $1,379,925 | | 27.1% | | $10.09 | |
| | | | | | | | | | | | | | | | |
| Net Operating Income (5) | | $2,088,151 | | $2,000,325 | | $1,541,593 | | $2,245,518 | | $3,718,989 | | 72.9% | | $27.20 | |
| Replacement Reserves | | 0 | | 0 | | 0 | | 0 | | 30,084 | | 0.6 | | 0.22 | |
| TI/LC | | 0 | | 0 | | 0 | | 0 | | 136,746 | | 2.7 | | 1.00 | |
| Net Cash Flow | | $2,088,151 | | $2,000,325 | | $1,541,593 | | $2,245,518 | | $3,552,159 | | 69.7% | | $25.98 | |
| | | | | | | | | | | | | | | | |
| NOI DSCR | | 1.07x | | 1.03x | | 0.79x | | 1.16x | | 1.91x | | | | | |
| NCF DSCR | | 1.07x | | 1.03x | | 0.79x | | 1.16x | | 1.83x | | | | | |
| NOI Debt Yield | | 5.2% | | 5.0% | | 3.8% | | 5.6% | | 9.2% | | | | | |
| NCF Debt Yield | | 5.2% | | 5.0% | | 3.8% | | 5.6% | | 8.8% | | | | | |
| (1) | Historical financials do not include financials for the Roadside Parcel as that parcel was acquired in conjunction with the Whizin Mortgage Loan origination. |
| (2) | Represents (i) percent of Net Rental Income for all revenue fields, (ii) percent of Base Rent for Vacancy & Credit Loss and (iii) percent of Effective Gross Income for all other fields. |
| (3) | Underwritten Gross Potential Rent includes rent steps of $39,788 through October 2022. |
| (4) | The underwritten economic vacancy is 5.1%. The Whizin Market Square Property was 95.7% leased as of February 24, 2022. |
| (5) | The increase in U/W Net Operating Income from 12/31/2021 Net Operating Income is primarily attributable to the acquisition of the Roadside Parcel, the burn off of free rent associated with The Canyon Club as part of its new lease executed in March 2020 and an approximately 7% occupancy increase since mid-year 2020. |
Appraisal. The appraiser concluded to an “as-is” appraised value of $64,000,000 as of December 26, 2021.
Environmental Matters. According to a Phase I environmental site assessment dated January 18, 2022, there was no evidence of any recognized environmental conditions at the Whizin Market Square Property.
Market Overview and Competition. The Whizin Market Square Property is located in Agoura Hills, Los Angeles County, California. The Property is situated within the Conejo Valley, an inland valley located approximately 10 miles north of the Malibu coastline. The
THE INFORMATION IN THIS COLLATERAL TERM SHEET IS NOT COMPLETE AND MAY BE AMENDED PRIOR TO THE TIME OF SALE. THIS TERM SHEET IS NOT AN OFFER TO SELL THESE SECURITIES AND IT IS NOT A SOLICITATION OF AN OFFER TO BUY THESE SECURITIES IN ANY JURISDICTION WHERE THE OFFER OR SALE IS NOT PERMITTED.
23
| Retail – Anchored | Loan #2 Whizin Market Square | Cut-off Date Balance: | $40,250,000 |
28854, 28912, 29000, 28750 & 28752 Roadside Drive, 28851-28857 Agoura Road,
5050 Cornell Road Agoura Hills, CA 91301 | Cut-off Date LTV: | 62.9% |
| U/W NCF DSCR: | 1.83x |
| U/W NOI Debt Yield: | 9.2% |
Conejo Valley includes the incorporated cities of Agoura, Calabasas, Agoura Hills, Westlake Village and Thousand Oaks, and the unincorporated communities of Lake Sherwood and Hidden Valley. The Conejo Valley has a relatively diverse economic base. The existing tenant base primarily consists of companies who migrated from the Greater Los Angeles in search of a lower cost of business, access to a highly educated labor pool and a cleaner environment. Main employers include Dole, Amgen, Wellpoint, Verizon and Blue Cross. Additionally, the Conejo Valley has become a technology and biotechnology hub. A number of new biotech and tech start-ups, along with the continued expansions by Amgen, Inphi, Baxter Pharmaceutical and Skyworks Solutions, have earned the region the nickname “Biotech Valley”. Due to the quality of its residential and commercial base, as well as to the emergence of major sources of employment in the area, the Conejo Valley is perceived as a distinct geographic area in the region with a major economic and employment base of its own. Regional access is provided by the Ventura Freeway (U.S. Highway 101), which traverses through the area in an east/west direction in the southern portion of the city. This freeway provides direct access to the San Fernando Valley to the east and Thousand Oaks to the west.
According to the appraisal, the 2021 population within a one-, three- and five-mile radius of the Whizin Market Square Property was 6,009, 34,941 and 69,630, respectively; and the 2021 average household income within the same radii was $151,751, $180,878 and $183,551, respectively.
Submarket Information - According to a third-party market report, the Whizin Market Square Property is located in the San Fernando Valley-West submarket within the Los Angeles retail market. As of the fourth quarter of 2021, the San Fernando Valley-West retail submarket reported a total inventory of approximately 5.6 million SF, with a 8.4% vacancy rate and average asking rents of $36.46 per SF.
The following table presents certain information relating to the appraiser’s market rent conclusion for the Whizin Market Square Property:
Market Rent Summary(1)
| | Retail Shop $3.25 PSF | Retail Shop $4.00 PSF | Large Retail Shop | Atrium Office | Anchor Retail | Canyon Club | Restaurant |
| Market Rent (PSF) | $3.25 | $4.00 | $2.75 | $3.00 | $1.75 | $2.75 | $3.25 |
| Lease Term (Years) | 5 | 5 | 5 | 4 | 10 | 10 | 5 |
| Lease Type (Reimbursements) | NNN | NNN | NNN | None | NNN | NNN | NNN |
| Rent Increase Projection | 3.0%/year | 3.0%/year | 3.0%/year | 3.0%/year | None | None | 3.0%/year |
| (1) | Information obtained from the appraisal. |
The table below presents certain information relating to comparable sales pertaining to the Whizin Market Square Property identified by the appraiser:
Comparable Sales(1)
| Property Name | Location | Rentable Area (SF) | Sale Date | Sale Price | Sale Price (PSF) |
| Conejo Gateway | Newbury Park, CA | 47,254 | Jul-19 | $18,000,000 | $381 |
| Gelson's Village At Calabasas | Calabasas, CA | 63,789 | Jul-19 | $39,500,000 | $619 |
| El Paseo Simi Shopping Center | Simi Valley, CA | 108,734 | Jun-19 | $38,900,000 | $358 |
| Shops at Oak Creek | Agoura Hills, CA | 21,186 | May-19 | $16,395,000 | $774 |
| Sand Canyon Plaza | Santa Clarita, CA | 78,425 | Mar-19 | $43,850,000 | $559 |
| Office Depot Plaza | Thousand Oaks, CA | 33,708 | Feb-19 | $14,335,000 | $425 |
| North Ranch Gateway | Thousand Oaks, CA | 86,427 | Aug-18 | $35,000,000 | $405 |
| (1) | Information obtained from the appraisal. |
THE INFORMATION IN THIS COLLATERAL TERM SHEET IS NOT COMPLETE AND MAY BE AMENDED PRIOR TO THE TIME OF SALE. THIS TERM SHEET IS NOT AN OFFER TO SELL THESE SECURITIES AND IT IS NOT A SOLICITATION OF AN OFFER TO BUY THESE SECURITIES IN ANY JURISDICTION WHERE THE OFFER OR SALE IS NOT PERMITTED.
24
| Retail – Anchored | Loan #2 Whizin Market Square | Cut-off Date Balance: | $40,250,000 |
28854, 28912, 29000, 28750 & 28752 Roadside Drive, 28851-28857 Agoura Road,
5050 Cornell Road Agoura Hills, CA 91301 | Cut-off Date LTV: | 62.9% |
| U/W NCF DSCR: | 1.83x |
| U/W NOI Debt Yield: | 9.2% |
The following table presents certain information relating to comparable leases to those at the Whizin Market Square Property:
Comparable Leases(1)
| Property Name/Location | Year Built/ Renovated | Total GLA (SF) | Distance from Subject | Tenant | Tenant Size (SF) | Lease Term | Annual Base Rent PSF | Lease Type |
Northgate Plaza Retail 101 South Westlake Boulevard Thousand Oaks, CA 91362 | 1996/NAP | 93,181 | 4.9 miles | Wild Fork Foods Exer Urgent Care | 4,500 5,000 | 10.0 Yrs 10.0 Yrs | $68.00 $61.44 | NNN NNN |
Kanan Village Shopping Center Retail Building 29281 Agoura Road Agoura Hills, CA 91301 | 1990/NAP | 4,362 | 0.6 miles | Ladyface Alehouse Brasserie Abby's Millstone Baking Company | 4,360 2,400 | 10.0 Yrs 5.0 Yrs | $45.00 $33.00 | NNN NNN |
North Ranch Gateway 30805-30895 E. Thousand Oaks Boulevard Westlake Village, CA 91362 | 1987/NAP | 86,582 | 3.2 miles | Jersey Mike’s Subs Baja Fresh | 1,011 2,612 | 10.0 Yrs 10.0 Yrs | $54.24 $51.00 | NNN NNN |
Agoura Hills City Mall 5839-5915 Kanan Road Agoura Hills, CA 91301 | 1970/NAP | 75,281 | 1.4 miles | Confidential Confidential | 1,099 2,014 | 3.0 Yrs 3.0 Yrs | $27.00 $30.00 | NNN NNN |
Paseo Marketplace 3637-3755 East Thousand Oaks Boulevard Thousand Oaks, CA 91362 | 1979/1996 | 132,612 | 5.6 miles | Block Advisors Westlake Skin Spa Your CBD Store Love At Second Sight, Inc | 1,100 1,260 1,235 1,540 | 3.0 Yrs 5.0 Yrs 5.0 Yrs 1.0 Yrs | $33.00 $30.00 $27.00 $33.00 | NNN NNN NNN NNN |
County Line Shopping Center 4601-4711 Lakeview Canyon Road Westlake Village, CA 91361 | 1978/NAP | 35,565 | 4.2 miles | Asking Confidential | 1,000 1,000 | 3.0 Yrs 5.0 Yrs | $30.00 $35.40 | NNN NNN |
Summit at Calabasas 26767-26787 Agoura Road Calabasas, CA 91301 | 2010/NAP | 66,185 | 3.0 miles | Asking Chipotle | 1,100 2,128 | 5.0 Yrs 10.0 Yrs | $38.00 $30.40 | NNN NNN |
Conejo Valley Plaza 1412 Moorpark Road Thousand Oaks, CA 91360 | 1972/2005 | 272,91 | 9.2 miles | Asking Dr. Anne Savko | 2,400 1,120 | 5.0 Yrs 5.0 Yrs | $42.00 $33.12 | NNN NNN |
| (1) | Information obtained from the appraisal. |
Escrows.
Real Estate Taxes – The Whizin Market Square Mortgage Loan documents require an upfront real estate tax reserve of $61,226 and ongoing monthly real estate tax reserves in an amount equal to one-twelfth of the real estate taxes that the lender estimates will be payable during the next twelve months (initially estimated at $30,613).
Deposits for real estate tax reserves do not include real estate taxes for the Roadside Parcel as such deposits have been conditionally waived so long as (i) no Event of Default has occurred and is continuing, (ii) the Roadside Parcel is its own separate tax lot and not a portion of any other tax lot, (iii) the entire Roadside Parcel is demised to DIY, (iv) DIY’s lease is in full force and effect and such tenant is obligated pursuant to the terms of its lease to pay all real estate taxes and other charges directly to the applicable governmental authority in full, (v) no Specified Tenant Sweep Event (defined below) has occurred and remains outstanding with respect to DIY, and (vi) such tenant is actually performing its obligations under its lease to timely pay all such real estate taxes and other charges and the Whizin Market Square Borrower provides Lender with evidence of the same in a timely manner.
Insurance – The Whizin Market Square Mortgage Loan documents require an upfront insurance reserve of $188,125 and ongoing monthly insurance reserves in an amount equal to one-twelfth of the insurance premiums that the lender estimates will be payable during the next twelve months (initially estimated at $18,813).
THE INFORMATION IN THIS COLLATERAL TERM SHEET IS NOT COMPLETE AND MAY BE AMENDED PRIOR TO THE TIME OF SALE. THIS TERM SHEET IS NOT AN OFFER TO SELL THESE SECURITIES AND IT IS NOT A SOLICITATION OF AN OFFER TO BUY THESE SECURITIES IN ANY JURISDICTION WHERE THE OFFER OR SALE IS NOT PERMITTED.
25
| Retail – Anchored | Loan #2 Whizin Market Square | Cut-off Date Balance: | $40,250,000 |
28854, 28912, 29000, 28750 & 28752 Roadside Drive, 28851-28857 Agoura Road,
5050 Cornell Road Agoura Hills, CA 91301 | Cut-off Date LTV: | 62.9% |
| U/W NCF DSCR: | 1.83x |
| U/W NOI Debt Yield: | 9.2% |
Replacement Reserves – The Whizin Market Square Mortgage Loan documents require ongoing monthly replacement reserves of approximately $2,507.
TI/LC Reserve – The Whizin Market Square Mortgage Loan documents require ongoing monthly TI/LC reserves of approximately $11,195, capped at $685,000.
Unfunded Obligations Reserve – The Whizin Market Square Mortgage Loan documents require an upfront unfunded obligations reserve of approximately $331,503 associated with four tenants that total 8,542 square feet.
Free Rent Reserve – The Whizin Market Square Mortgage Loan documents require an upfront free rent reserve of approximately $73,669 associated with four tenants that total 8,542 square feet.
Wood Ranch Security Deposit Reserve – The Whizin Market Square Mortgage Loan documents require an upfront security deposit reserve of approximately $9,310 associated with the fourth largest tenant, Wood Ranch Agoura Hills.
Lockbox and Cash Management. The Whizin Market Square Mortgage Loan is structured with a springing lockbox and springing cash management. Within ten business days following the occurrence of a Clearing Account Trigger Event (as defined below), the Whizin Market Square Borrower will be required to establish a lender-controlled lockbox account and direct tenants and property manager to deposit all rents directly into the clearing account. If no Cash Sweep Period (as defined below) is continuing, funds on deposit in the lockbox account will be transferred at the direction of the Whizin Market Square Borrower. After the occurrence and during the continuance of a Cash Sweep Period, all funds are required to be swept each business day into the cash management account controlled by the lender and all funds on deposit in the cash management account after payment of debt service, required reserves and budgeted operating expenses are required to be reserved with the lender as additional security for the Whizin Market Square Mortgage Loan.
A “Clearing Account Trigger Event” will commence upon the earliest of:
| (i) | the debt yield being less than 6.75%; or |
| (ii) | the occurrence of a Cash Sweep Period. |
A “Cash Sweep Period” will commence upon the occurrence of the following:
| (ii) | the debt yield being less than 6.25%; or |
| (iii) | the occurrence of a Specified Tenant Sweep Event (as defined below). |
A Cash Sweep Period will end upon the occurrence of:
| • | with regard to clause (i) above, the cure of such event of default; |
| • | with regard to clause (ii) above, the debt yield being greater than or equal to 7.0% for two consecutive calendar quarters; and |
| • | with regard to clause (iii) above, the cure of such Specified Tenant Sweep Event. |
A “Specified Tenant” means, individually and collectively, DIY and The Canyon Club (and any parent company of the foregoing and any guarantor of any such tenant’s lease, as applicable), and any replacement tenant occupying all or portion of the space currently occupied by such tenants at the Whizin Market Square Property.
A “Specified Tenant Sweep Event” will commence upon the occurrence of the following:
| (i) | a default by such Specified Tenant under its lease beyond all applicable notice and/or periods; |
| (ii) | a Specified Tenant going dark, vacating or otherwise failing to occupy 50% or more of its space or giving notice of its intent to do any of the foregoing; |
| (iii) | any bankruptcy or insolvency of a Specified Tenant; |
| (iv) | a Specified Tenant terminating, cancelling or surrendering its lease, or giving notice of its intent to do any of the foregoing; |
| (v) | the earlier of (a) the date that is 12 months prior to the scheduled expiration date of such Specified Tenant’s lease or (b) the date under such Specified Tenant’s lease by which such Specified Tenant is required to give notice of its exercise of a renewal option; or |
| (vi) | if a Specified Tenant has long term senior unsecured debt that is rated, such Specified Tenant’s rating being downgraded two or more “notches” by any applicable rating agency. |
A Specified Tenant Sweep Event will end upon the occurrence of:
| • | with regard to clause (i) above, the occurrence of (x) a Specified Tenant Re-Tenanting Event (as defined below) or (y) the cure of such event of default has been accepted by the borrower; |
| • | with regard to clause (ii) above, the occurrence of (x) a Specified Tenant Re-Tenanting Event or (y) (a) the Specified Tenant has resumed occupancy and normal business operations at all of the space leased under such Specified Tenant’s lease and (b) the Specified Tenant delivers to the lender an acceptable tenant estoppel certificate; |
THE INFORMATION IN THIS COLLATERAL TERM SHEET IS NOT COMPLETE AND MAY BE AMENDED PRIOR TO THE TIME OF SALE. THIS TERM SHEET IS NOT AN OFFER TO SELL THESE SECURITIES AND IT IS NOT A SOLICITATION OF AN OFFER TO BUY THESE SECURITIES IN ANY JURISDICTION WHERE THE OFFER OR SALE IS NOT PERMITTED.
26
| Retail – Anchored | Loan #2 Whizin Market Square | Cut-off Date Balance: | $40,250,000 |
28854, 28912, 29000, 28750 & 28752 Roadside Drive, 28851-28857 Agoura Road,
5050 Cornell Road Agoura Hills, CA 91301 | Cut-off Date LTV: | 62.9% |
| U/W NCF DSCR: | 1.83x |
| U/W NOI Debt Yield: | 9.2% |
| • | with regard to clause (iii) above, the occurrence of (x) a Specified Tenant Re-Tenanting Event or (y) the bankruptcy proceedings having been terminated in a manner reasonably satisfactory to the lender, the Specified Tenant’s lease being affirmed and the terms of such lease being reasonably satisfactory to the lender; |
| • | with regard to clause (iv) above, the occurrence of (x) a Specified Tenant Re-Tenanting Event or (y) (a) the Specified Tenant revokes any termination, cancellation or surrender notification, as applicable and (b) the Specified Tenant delivers to the lender an acceptable tenant estoppel certificate; |
| • | with regard to clause (v) above, the occurrence of (x) a Specified Tenant Re-Tenanting Event or (y) the lender receiving (a) acceptable evidence that such Specified Tenant has given notice of renewal under terms of its lease, and all landlord obligations (including the payment of any leasing commissions) have been satisfied in full (or sufficient funds have been reserved for such purposes and to cover any operating shortfalls relating to the delay in the commencement of full rent payments) and (b) an acceptable tenant estoppel certificate; and |
| • | with regard to clause (vi) above, the occurrence of (x) a Specified Tenant Re-Tenanting Event or (y) the lender receiving acceptable evidence that the applicable Specified Tenant’s credit rating is equivalent to or better than the credit rating such Specified Tenant had as of the origination date (or if the applicable lease is entered into following the origination date, on the date such lease is entered into) and maintaining such rating for two consecutive quarters. |
A “Specified Tenant Re-Tenanting Event” will occur when the Whizin Market Square Borrower has delivered to the lender: (i) evidence reasonably satisfactory to the lender that the entire space leased to the Specified Tenant has been leased to one or more replacement tenants acceptable to lender and (ii) tenant estoppel(s) reasonably satisfactory to the lender with respect to all such replacement tenant(s).
Additionally, any Specified Tenant Sweep Event will end if all of the following conditions are satisfied and maintained (a) the Whizin Market Square Borrower deposits into the Lease Sweep Reserve Account an amount equal to $1,250,000 in the form of cash or letter of credit, (b) to the extent that the amount of the TI/LC Reserve on deposit is less than $685,000, the Whizin Market Square Borrower deposits into the TI/LC Reserve an amount equal to the difference between $685,000 and the TI/LC Reserve funds on deposit, and (c) the debt yield (excluding all gross rents attributable to all Specified Tenants) is equal to or greater than 7.25%.
Property Management. The Whizin Market Parcel is managed by Kennedy-Wilson Properties Ltd., an Illinois corporation. The Roadside Parcel is self-managed.
Partial Release. On or after March 14, 2024, the Whizin Market Square Borrower may obtain the release of the Roadside Parcel from the collateral in connection with a transfer of the Roadside Parcel to an affiliate of the borrower or the borrower sponsor or in connection with a third-party, arms-length sale of the Roadside Parcel, provided that the following requirements among others are satisfied, (i) no event of default has occurred and is continuing or will occur as a result of the release, (ii) the LTV for the remaining Whizin Market Square Property is no greater than the lesser of (x) 62.9% and (y) the LTV immediately prior to such permitted release, (iii) the debt yield of the remaining Whizin Market Square Property is equal to or greater than the greater of (x) 8.8% and (y) the debt yield immediately prior to such permitted release, (iv) the DSCR of the remaining Whizin Market Square Property is equal to or greater than the greater of (x) 1.85x and (y) the DSCR immediately prior to such permitted release, and (v) payment of an amount equal to the sum of (x) a release price equal to 130% of the allocated loan amount for the Roadside Parcel, (y) the applicable interest shortfall due in connection with such prepayment and (z) the yield maintenance premium due in respect of the principal amount prepaid. In addition, the Whizin Market Square Borrower has the right to obtain one or more releases of all or a portion of certain vacant land and parking spaces adjacent to the Roadside Parcel (such parcel, the “Free Release Parcel”) from the collateral at any time in connection with a transfer of all or a portion of the Free Release Parcel to an affiliate of the borrower or the borrower sponsor or in connection with a third-party, arms-length sale of all or a portion of the Free Release Parcel, provided that (a) the conditions in (i) – (iv) are satisfied and (b) the Whizin Market Square Borrower records a deed restriction in the official records restricting the use of the Free Release Parcel to multifamily apartment units or hotel, in each case, with ground floor retail permitted, provided that such ground floor retail is not greater than 15% of the total square footage of the aggregate developed buildings constructed on the Free Release Parcel.
Real Estate Substitution. Not permitted.
Subordinate and Mezzanine Indebtedness. None.
Ground Lease. None
Terrorism Insurance. The Whizin Market Square Mortgage Loan documents require that the “all risk” insurance policy required to be maintained by the Whizin Market Square Borrower (or standalone terrorism insurance policy) provides coverage for terrorism in an amount equal to the full replacement cost of the Whizin Market Square Property, as well as business interruption insurance covering no less than the 18-month period following the occurrence of a casualty event, together with a 12-month extended period of indemnity.
THE INFORMATION IN THIS COLLATERAL TERM SHEET IS NOT COMPLETE AND MAY BE AMENDED PRIOR TO THE TIME OF SALE. THIS TERM SHEET IS NOT AN OFFER TO SELL THESE SECURITIES AND IT IS NOT A SOLICITATION OF AN OFFER TO BUY THESE SECURITIES IN ANY JURISDICTION WHERE THE OFFER OR SALE IS NOT PERMITTED.
27
| Office - CBD | Loan #3 | Cut-off Date Balance: | | $36,000,000 |
| 2100 Travis Street | Midtown Central Square | Cut-off Date LTV: | | 59.8% |
| Houston, TX 77002 | | U/W NCF DSCR: | | 2.31x |
| | | U/W NOI Debt Yield: | | 12.8% |
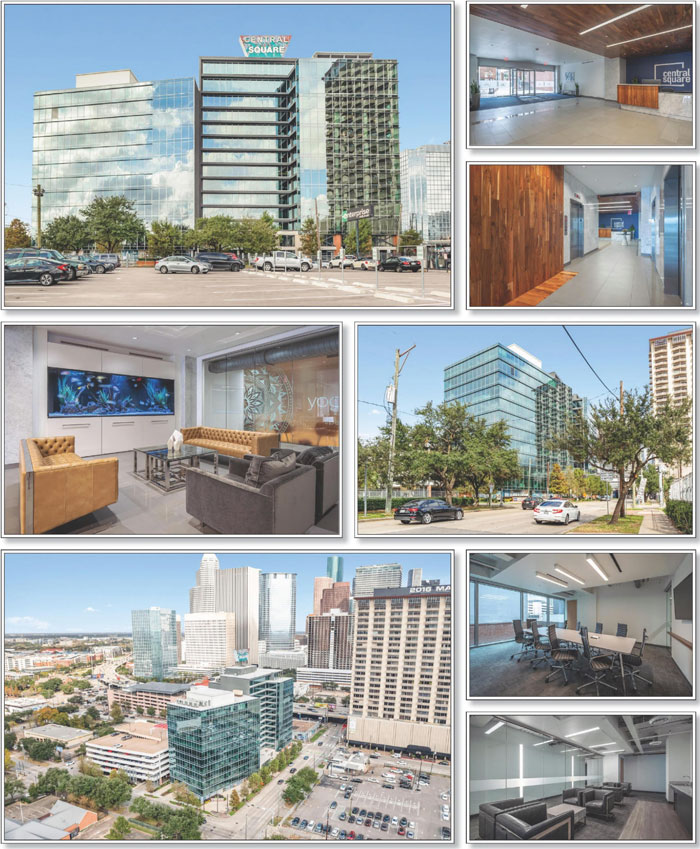
THE INFORMATION IN THIS COLLATERAL TERM SHEET IS NOT COMPLETE AND MAY BE AMENDED PRIOR TO THE TIME OF SALE. THIS TERM SHEET IS NOT AN OFFER TO SELL THESE SECURITIES AND IT IS NOT A SOLICITATION OF AN OFFER TO BUY THESE SECURITIES IN ANY JURISDICTION WHERE THE OFFER OR SALE IS NOT PERMITTED.
28
| No. 3 – Midtown Central Square |
| |
| Mortgage Loan Information | | Mortgaged Property Information |
| Mortgage Loan Seller: | LMF Commercial, LLC | | Single Asset/Portfolio: | Single Asset |
Credit Assessment (Fitch/KBRA/Moody’s): | NR/NR/NR | | Property Type – Subtype: | Office – CBD |
| Original Principal Balance: | $36,000,000 | | Location: | Houston, TX |
| Cut-off Date Balance: | $36,000,000 | | Size: | 269,800 SF |
| % of Initial Pool Balance: | 6.8% | | Cut-off Date Balance Per SF: | $133.43 |
| Loan Purpose: | Recapitalization | | Maturity Date Balance Per SF: | $133.43 |
| Borrower Sponsor: | Keeley Megarity | | Year Built/Renovated: | 1961/2015 |
| Guarantor: | Keeley Megarity | | Title Vesting: | Fee |
| Mortgage Rate: | 5.0800% | | Property Manager: | Claremont Property Co. (borrower-related) |
| Note Date: | March 10, 2022 | | Current Occupancy (As of): | 85.0% (11/30/2021) |
| Seasoning: | 1 month | | YE 2020 Occupancy: | 60.1% |
| Maturity Date: | March 6, 2032 | | YE 2019 Occupancy: | 57.9% |
| IO Period: | 120 months | | YE 2018 Occupancy: | 29.2% |
| Loan Term (Original): | 120 months | | As-Is Appraised Value: | $60,200,000 |
| Amortization Term (Original): | NAP | | As-Is Appraised Value Per SF: | $223.13 |
| Loan Amortization Type: | Interest Only | | As-Is Appraisal Valuation Date: | December 1, 2021 |
| Call Protection: | L(25),D(91),O(4) | | | |
| Lockbox Type: | Springing | | Underwriting and Financial Information(4) |
| Additional Debt(1): | Yes | | TTM NOI (12/31/2021)(5): | $3,064,759 |
| Additional Debt Type (Balance)(1): | Future Mezzanine | | YE 2020 NOI: | $1,812,790 |
| | | | YE 2019 NOI: | $955,937 |
| | | | YE 2018 NOI: | ($346,886) |
| | | | U/W Revenues: | $6,576,529 |
| | | | U/W Expenses: | $1,983,220 |
| Escrows and Reserves(2) | | U/W NOI(5): | $4,593,309 |
| | Initial | Monthly | Cap | | U/W NCF: | $4,283,039 |
| Taxes | $144,762 | $45,956 | NAP | | U/W DSCR based on NOI/NCF: | 2.48x / 2.31x |
| Insurance | $142,078 | $16,914 | NAP | | U/W Debt Yield based on NOI/NCF: | 12.8% / 11.9% |
| Replacement Reserve | $0 | $3,373 | NAP | | U/W Debt Yield at Maturity based on NOI/NCF: | 12.8% / 11.9% |
| TI/LC Reserve | $1,000,000 | $22,483 | $1,200,000 | | Cut-off Date LTV Ratio: | 59.8% |
| Rent Abatement Reserve | $800,587 | $0 | NAP | | LTV Ratio at Maturity: | 59.8% |
| Holdback Reserve(3) | $2,500,000 | $0 | NAP | | | |
| New Tenant Improvement Reserve | $1,378,752 | $0 | NAP | | | |
| | | | | | | | |
| Sources and Uses |
| Sources | | | | | Uses | | | |
| Original loan amount | $36,000,000 | | 100.0% | | Partner Buy-out | $29,372,043 | | 81.6% |
| | | | | | Upfront Reserves | 5,966,179 | | 16.6 |
| | | | | | Closing Costs | 543,104 | | 1.5 |
| | | | | | Return of Equity | 118,674 | | 0.3 |
| Total Sources | $36,000,000 | | 100.0% | | Total Uses | $36,000,000 | | 100.0% |
| (1) | See “Subordinate and Mezzanine Indebtedness” section for a full description of Additional Debt. |
| (2) | See “Escrows” section for a full description of Escrows and Reserves. |
| (3) | The Holdback Reserve will be released to the Midtown Central Square Borrower (as defined below) if the Midtown Central Square Property (as defined below) achieves a debt yield of 11.5% based on the in-place rent roll and trailing twelve-month expenses. In the event the debt yield test is not satisfied within 24 months of loan origination, the holdback reserve will be retained as cash collateral for the balance of the term of the Midtown Central Square Mortgage Loan (as defined below). The Midtown Central Square Mortgage Loan is 10% recourse to the borrower sponsor from loan origination until the satisfaction of the holdback release provision. |
| (4) | While the Midtown Central Square Mortgage Loan (defined below) was originated after the emergence of the novel coronavirus pandemic and the economic disruption resulting from measures to combat the pandemic, the pandemic is an evolving situation and could impact the Midtown Central Square Mortgage Loan more severely than assumed in the underwriting and could adversely affect the NOI, NCF and occupancy information, as well as the appraised value and the DSCR, LTV and Debt Yield metrics presented above. See “Risk Factors—Risks Related to Market Conditions and Other External Factors—Coronavirus Pandemic Has Adversely Affected the Global Economy and Will Likely Adversely Affect the Performance of the Mortgage Loans” in the Preliminary Prospectus. |
| (5) | U/W NOI increased compared to TTM NOI (12/31/2021) is due to the fact that six leases, including the third largest tenant - Feldman Law Group, started in 2022 totalling 43,634 square feet with total in-place rents of $1,150,004. |
THE INFORMATION IN THIS COLLATERAL TERM SHEET IS NOT COMPLETE AND MAY BE AMENDED PRIOR TO THE TIME OF SALE. THIS TERM SHEET IS NOT AN OFFER TO SELL THESE SECURITIES AND IT IS NOT A SOLICITATION OF AN OFFER TO BUY THESE SECURITIES IN ANY JURISDICTION WHERE THE OFFER OR SALE IS NOT PERMITTED.
29
| Office - CBD | Loan #3 | Cut-off Date Balance: | | $36,000,000 |
| 2100 Travis Street | Midtown Central Square | Cut-off Date LTV: | | 59.8% |
| Houston, TX 77002 | | U/W NCF DSCR: | | 2.31x |
| | | U/W NOI Debt Yield: | | 12.8% |
The Mortgage Loan. The mortgage loan (the “Midtown Central Square Mortgage Loan”) is evidenced by a single promissory note secured by a first mortgage encumbering the fee interest in a 269,800 square foot office property located in Houston, Texas (the “Midtown Central Square Property”).
The Borrower and Borrower Sponsor. The borrower is Midtown 2100, L.L.C. (the “Midtown Central Square Borrower”), a Delaware limited liability company and single purpose entity with one independent director. Legal counsel to the Midtown Central Square Borrower delivered a non-consolidation opinion in connection with the origination of the Midtown Central Square Mortgage Loan. The nonrecourse carve-out guarantor and borrower sponsor of the Midtown Central Square Mortgage Loan is Keeley Megarity.
Keeley Megarity is the founder and president of Claremont Property Company (“CPC”). Founded in 1995, CPC is a real estate development company specializing in new construction, acquisition/sale, refurbishment, property management, disaster solutions, roofing and coworking spaces. Mr. Megarity has built over 1,500 apartment units, purchased and sold over 5,000 units and renovated over 1,000,000 square feet of office space. Mr. Megarity is involved in current and prior foreclosure litigation and defaults. See “Description of the Mortgage Pool—Litigation and Other Considerations” and “—Loan Purpose; Default History, Bankruptcy Issues and Other Proceedings” in the Preliminary Prospectus.
The Property. The Midtown Central Square Property consists of one, fifteen-story, multi-tenant office building situated on a 1.4-acre site located in Houston, Texas. Built in 1961 and renovated in 2015, the Midtown Central Square Property consists of 269,800 rentable square feet, of which 253,596 square feet of office, 15,574 square feet of first-floor retail and 630 square feet of storage. The Midtown Central Square Property features a tenant-only conference facility, dedicated on-site management and state-of-the-art building and energy management system evidenced by a LEED-Gold certification. Since the acquisition of the Midtown Central Square in 2013, the borrower sponsor has invested approximately $43.5 million in renovations and building improvements which included a new glass facade, tenant improvements, soft costs and miscellaneous items. Parking is provided via an 8-story parking garage that provides 448 parking spaces, resulting in a parking ratio of 1.60 spaces per 1,000 square feet of net rentable area. As of November 30, 2021, the Midtown Central Square Property was 85.0% occupied by 33 international, national, regional and local tenants.
Major Tenants.
Largest Tenant: City of Houston (65,772 square feet, 24.4% of net rentable area; 31.9% of underwritten base rent; 2/28/2024 lease expiration for 21,924 square feet and 12/29/2028 lease expiration for 43,848 square feet; Fitch/Moody’s/S&P: AA/Aa3/AA) – The City of Houston utilizes the premises for its Housing and Community Development Departments (the “HHCDD”). Established in 1989, the HHCDD’s mission is to make investments that serve the citizens of Houston’s housing needs and build an equitable city by creating safe, resilient homes and vibrant, healthy communities. As of June 2021, the HHCDD had total expenditures of approximately $71 million. The City of Houston has been a tenant at the Midtown Central Square Property since 2019 and currently occupies three suites in the Midtown Central Square Property and has two, five-year renewal options remaining. Suite 400 (21,924 square feet) has a lease expiration date of February 28, 2024. The suites relating to Suite 900 (21,924 square feet) and Suite 1000 (21,924 square feet) each have a lease expiration date of December 29, 2028. The City of Houston has the right to terminate its lease at any time after January 1, 2022 by providing at least six-month’s written notice and payment of a termination fee equal to the unamortized portion of the broker commissions. Additionally, the City of Houston has the right to terminate its lease for lack of appropriations in the event allocated funds are exhausted (in which case, the Midtown Central Square Borrower will have no right to damages of any kind except for the recoupment of unpaid rent then due and owing).
2nd Largest Tenant: IQor (34,674 square feet, 12.9% of net rentable area; 10.0% of underwritten base rent; 4/29/2026 lease expiration) – IQor was founded in 1998 and is one of the largest business process outsourcing providers in the world. The company offers customer care, revenue recovery services, customer retention and technical support to a variety of industries which include communications, banking, insurance, travel and hospitality, retail and e-commerce, energy and utilities and healthcare. IQor employs approximately 35,000 employees throughout nine countries and has over 50 call centers. IQor has been a tenant at the Midtown Central Square Property since 2018, currently occupies two suites within the Midtown Central Square Property and has two, five-year renewal options remaining. IQor has the right to terminate its lease at any time from April 1, 2023 through July 31, 2023 by providing at least six-months written notice and payment of a termination fee equal to the unamortized portions of leasing costs (commissions and tenant improvements) assuming an interest rate of 4.0% annually. Additionally, IQor has the right to go dark so long as it continues to pay all rent due under its lease.
3rd Largest Tenant: Feldman Law Group (20,169 square feet; 7.5% of net rentable area; 11.4% of underwritten base rent; 1/31/2027 lease expiration) – Founded in 1992, Feldman Law Group provides corporate and tax planning for closely held businesses. Feldman Law Group has been a tenant at the Midtown Central Square Property since 2022 and currently occupies two suites within the Midtown Central Square Property with no termination options.
COVID-19 Update. As of March 22, 2022, the Midtown Central Square Property is open and operating. As of March 22, 2022, the Midtown Central Square Mortgage Loan is not subject to any modification or forbearance agreement, and the Midtown Central Square Borrower has not requested any modification or forbearance to the Midtown Central Square Mortgage Loan terms.
THE INFORMATION IN THIS COLLATERAL TERM SHEET IS NOT COMPLETE AND MAY BE AMENDED PRIOR TO THE TIME OF SALE. THIS TERM SHEET IS NOT AN OFFER TO SELL THESE SECURITIES AND IT IS NOT A SOLICITATION OF AN OFFER TO BUY THESE SECURITIES IN ANY JURISDICTION WHERE THE OFFER OR SALE IS NOT PERMITTED.
30
| Office - CBD | Loan #3 | Cut-off Date Balance: | | $36,000,000 |
| 2100 Travis Street | Midtown Central Square | Cut-off Date LTV: | | 59.8% |
| Houston, TX 77002 | | U/W NCF DSCR: | | 2.31x |
| | | U/W NOI Debt Yield: | | 12.8% |
The following table presents certain information relating to the tenancy at the Midtown Central Square Property:
Major Tenants
| Tenant Name | Credit Rating (Fitch/Moody’s/
S&P)(1) | Tenant NRSF | % of
NRSF | Annual U/W Base Rent PSF(2) | Annual
U/W Base Rent(2) | % of Total Annual U/W Base Rent | Lease
Expiration
Date | Extension Options | Termination Option (Y/N) |
| Major Tenants | | | | | | | | | |
| City of Houston | AA/Aa3/AA | 65,772 | 24.4% | $24.00 | $1,578,528 | 31.9% | Various | 1, 2 or 5-year | Y(3) |
| IQor | NR/NR/NR | 34,674 | 12.9% | $14.25 | $494,105 | 10.0% | 4/29/2026 | 2, 5-year | Y(4) |
| Feldman Law Group(5) | NR/NR/NR | 20,169 | 7.5% | $28.00 | $564,732 | 11.4% | 1/31/2027 | 1, 5-year | N |
| Summit Industrial Construction | NR/NR/NR | 11,915 | 4.4% | $17.00 | $202,555 | 4.1% | 6/29/2024 | 1, 5-year | N |
| Powers Brown | NR/NR/NR | 11,637 | 4.3% | $25.50 | $296,744 | 6.0% | 10/31/2026 | 1, 5-year | Y(6) |
| Total Major Tenants | 144,167 | 53.4% | $21.76 | $3,136,663 | 63.4% | | | |
| | | | | | | | | | |
| Non-Major Tenants | 85,159 | 31.6% | $21.29 | $1,812,651 | 36.6% | | | |
| | | | | | | | | |
| Occupied Collateral Total | 229,326 | 85.0% | $21.58 | $4,949,314 | 100.0% | | | |
| | | | | | | | | |
| Vacant Space | 40,474 | 15.0% | | | | | | |
| | | | | | | | | |
| Collateral Total | 269,800 | 100.0% | | | | | | |
| | | | | | | | | | |
| (1) | Certain ratings are those of the parent company whether or not the parent company guarantees the lease. |
| (2) | Annual U/W Base Rent PSF and Annual U/W Base Rent include contractual rent steps through September 2022 totaling $56,858. |
| (3) | The City of Houston currently occupies three suites within the Midtown Central Square Property. Suite 400 (21,924 square feet) has a lease expiration date of February 28, 2024. The suites related to Suite 900 (21,924 square feet) and Suite 1000 (21,924 square feet) each have a lease expiration date of December 29, 2028. The City of Houston has the right to terminate its lease at any time after January 1, 2022 by providing at least a six-month written notice and payment of a termination fee equal to the unamortized portion of the broker commissions. Additionally, the City of Houston has the right to terminate its lease for lack of appropriations in the event the allocated funds are exhausted (in which case, the Midtown Central Square Borrower will have no right to damages of any kind except for the recoupment of unpaid rent then due and owing). |
| (4) | IQor has the right to terminate its lease at any time from April 1, 2023 through July 31, 2023 by providing at least six-month’s written notice and payment of a termination fee equal to the unamortized portions of leasing costs (commissions and tenant improvements) assuming an interest rate of 4.0% annually. Additionally, IQor has the right to go dark so long as it continues to pay all rent due under its lease. |
| (5) | The Feldman Law Group lease commenced but the tenant is not yet in occupancy. According to the borrower sponsor, the Feldman Law Group is expected take occupancy and commence paying rent on April 1, 2022. At origination, the Midtown Central Square Borrower deposited $1,378,752 into a new tenant improvement funds, of which $543,000 for Feldman Law Group, and $800,587 into a rent abatement reserve, of which $376,488 for Feldman Law Group. |
| (6) | Powers Brown may terminate its lease on June 1, 2023 by providing at least a 12-month written notice and payment of a termination fee equal to (i) all unamortized commissions, tenant improvements, and seven months of abated rent assuming an interest rate of 8% annually plus (ii) three months of base rent and additional rent. |
THE INFORMATION IN THIS COLLATERAL TERM SHEET IS NOT COMPLETE AND MAY BE AMENDED PRIOR TO THE TIME OF SALE. THIS TERM SHEET IS NOT AN OFFER TO SELL THESE SECURITIES AND IT IS NOT A SOLICITATION OF AN OFFER TO BUY THESE SECURITIES IN ANY JURISDICTION WHERE THE OFFER OR SALE IS NOT PERMITTED.
31
| Office - CBD | Loan #3 | Cut-off Date Balance: | | $36,000,000 |
| 2100 Travis Street | Midtown Central Square | Cut-off Date LTV: | | 59.8% |
| Houston, TX 77002 | | U/W NCF DSCR: | | 2.31x |
| | | U/W NOI Debt Yield: | | 12.8% |
The following table presents certain information relating to the lease rollover schedule at the Midtown Central Square Property:
Lease Expiration Schedule(1)(2)
Year Ending
December 31, | No. of Leases Expiring | Expiring NRSF | % of Total NRSF | Cumulative Expiring NRSF | Cumulative % of Total NRSF | Annual
U/W
Base Rent | % of Total Annual U/W Base Rent | Annual
U/W
Base Rent
PSF |
| MTM | 0 | 0 | 0.0% | 0 | 0.0% | $0.00 | 0.0% | $0.00 |
| 2022 | 1 | 5,139 | 1.9% | 5,139 | 1.9% | $84,794 | 1.7% | $16.50 |
| 2023 | 6 | 7,789 | 2.9% | 12,928 | 4.8% | $116,240 | 2.3% | $14.92 |
| 2024 | 7 | 38,906 | 14.4% | 51,834 | 19.2% | $846,888 | 17.1% | $21.77 |
| 2025 | 2 | 7,198 | 2.7% | 59,032 | 21.9% | $178,996 | 3.6% | $24.87 |
| 2026 | 11 | 78,440 | 29.1% | 137,472 | 51.0% | $1,447,640 | 29.2% | $18.46 |
| 2027 | 5 | 34,419 | 12.8% | 171,891 | 63.7% | $910,648 | 18.4% | $26.46 |
| 2028 | 2 | 43,848 | 16.3% | 215,739 | 80.0% | $1,008,504 | 20.4% | $23.00 |
| 2029 | 0 | 0 | 0.0% | 215,739 | 80.0% | $0.00 | 0.0% | $0.00 |
| 2030 | 1 | 8,794 | 3.3% | 224,533 | 83.2% | $233,041 | 4.7% | $26.50 |
| 2031 | 2 | 4,793 | 1.8% | 229,326 | 85.0% | $122,564 | 2.5% | $25.57 |
| 2032 | 0 | 0 | 0.0% | 229,326 | 85.0% | $0.00 | 0.0% | $0.00 |
| Thereafter | 0 | 0 | 0.0% | 229,326 | 85.0% | $0.00 | 0.0% | $0.00 |
| Vacant | 0 | 40,474 | 15.0% | 269,800 | 100.0% | $0.00 | 0.0% | $0.00 |
| Total/Weighted Average | 37 | 269,800 | 100.0% | | | $4,949,314 | 100.0% | $21.58 |
| (1) | Information obtained from the underwritten rent roll. |
| (2) | Certain tenants may have lease termination options that are exercisable prior to the originally stated expiration date of the subject lease and that are not considered in the Lease Expiration Schedule. |
The following table presents historical occupancy percentages at the Midtown Central Square Property:
Historical Occupancy(1)
12/31/2018 | 12/31/2019 | 12/31/2020 | 11/30/2021 |
| 29.2% | 57.9% | 60.1% | 85.0% |
| | | | |
| (1) | Information obtained from the underwritten rent roll dated November 30, 2021. |
THE INFORMATION IN THIS COLLATERAL TERM SHEET IS NOT COMPLETE AND MAY BE AMENDED PRIOR TO THE TIME OF SALE. THIS TERM SHEET IS NOT AN OFFER TO SELL THESE SECURITIES AND IT IS NOT A SOLICITATION OF AN OFFER TO BUY THESE SECURITIES IN ANY JURISDICTION WHERE THE OFFER OR SALE IS NOT PERMITTED.
32
| Office - CBD | Loan #3 | Cut-off Date Balance: | | $36,000,000 |
| 2100 Travis Street | Midtown Central Square | Cut-off Date LTV: | | 59.8% |
| Houston, TX 77002 | | U/W NCF DSCR: | | 2.31x |
| | | U/W NOI Debt Yield: | | 12.8% |
Operating History and Underwritten Net Cash Flow. The following table presents certain information relating to the underwritten net cash flow at the Midtown Central Square Property:
Cash Flow Analysis
| | 2018 | 2019 | 2020 | TTM 12/31/2021 | U/W | %(1) | U/W $ per SF |
| Rents in Place | $1,075,427 | $2,433,696 | $3,123,077 | $3,676,097 | $4,892,457 | 63.2% | $18.13 |
| Contractual Rent Steps(2) | 0 | 0 | 0 | 0 | 56,858 | 0.7 | 0.21 |
| Grossed Up Vacant Space | 0 | 0 | 0 | 0 | 861,423 | 11.1 | 3.19 |
| Gross Potential Rent | $1,075,427 | $2,433,696 | $3,123,077 | $3,676,097 | $5,810,737 | 75.1% | $21.54 |
| Other Income | 92,622 | 192,058 | 195,575 | 382,170 | 382,170 | 4.9 | 1.42 |
| Total Recoveries | 179,693 | 626,473 | 628,241 | 799,289 | 1,542,558 | 19.9 | 5.72 |
| Net Rental Income | $1,347,742 | $3,252,226 | $3,946,894 | $4,857,557 | $7,735,465 | 100.0% | $28.67 |
| (Vacancy & Credit Loss) | (243,533) | (424,835) | (399,115) | (0) | (1,158,935)(3) | (19.9) | (4.30) |
| Effective Gross Income | $1,104,209 | $2,827,391 | $3,547,778 | $4,857,557 | $6,576,529 | 85.0% | $24.38 |
| | | | | | | | |
| Real Estate Taxes | 451,429 | 515,590 | 504,577 | 504,577 | 551,594 | 8.4 | 2.04 |
| Insurance | 72,304 | 105,482 | 121,406 | 147,056 | 202,968 | 3.1 | 0.75 |
| Management Fee | 39,001 | 98,917 | 111,915 | 109,803 | 197,296 | 3.0 | 0.73 |
| Other Operating Expenses | 888,360 | 1,151,466 | 997,091 | 1,031,362 | 1,031,362 | 15.7 | 3.82 |
| Total Operating Expenses | $1,451,095 | $1,871,454 | $1,734,989 | $1,792,798 | $1,983,220 | 30.2% | $7.35 |
| | | | | | | | |
| Net Operating Income(4) | ($346,886) | $955,937 | $1,812,790 | $3,064,759 | $4,593,309 | 69.8% | $17.02 |
| Replacement Reserves | 0 | 0 | 0 | 0 | 40,470 | 0.6 | 0.15 |
| TI/LC | 0 | 0 | 0 | 0 | 269,800 | 4.1 | 1.00 |
| Net Cash Flow | ($346,886) | $955,937 | $1,812,790 | $3,064,759 | $4,283,039 | 65.1% | $15.87 |
| | | | | | | | |
| NOI DSCR | (0.19x) | 0.52x | 0.98x | 1.65x | 2.48x | | |
| NCF DSCR | (0.19x) | 0.52x | 0.98x | 1.65x | 2.31x | | |
| NOI Debt Yield | (1.0%) | 2.7% | 5.0% | 8.5% | 12.8% | | |
| NCF Debt Yield | (1.0%) | 2.7% | 5.0% | 8.5% | 11.9% | | |
| (1) | Represents (i) percent of Net Rental Income for all revenue fields, (ii) percent of Gross Potential Rent for Vacancy & Credit Loss and (iii) percent of Effective Gross Income for all other fields. |
| (2) | Represents contractual rent steps through September 2022. |
| (3) | The underwritten economic vacancy is 15.7%. The Midtown Central Square Property was 85.0% leased as of November 30, 2021. |
| (4) | U/W Net Operating Income increased compared to TTM 12/31/2021 Net Operating Income is due to the fact that 6 leases, including the third largest tenant - Feldman Law Group, started in 2022 totaling 43,634 square feet with total in-place rents of $1,150,004. |
Appraisal. As of the appraisal valuation date of December 1, 2021, the Midtown Central Square Property had an “as-is” appraised value of $60,200,000.
Environmental Matters. According to a Phase I environmental site assessment dated December 15, 2021, there was no evidence of any recognized environmental conditions at the Midtown Central Square Property.
Market Overview and Competition. The Midtown Central Square Property is located in Harris County, Texas within the Houston-Woodlands-Sugar Land metropolitan statistical area. Major employers within the Houston-Woodlands-Sugar Land MSA include ConocoPhillips, Exxon Mobil Corp., Shell Oil Co., Halliburton, Dow Chemical Co., Memorial Hermann Health System and University of Texas MD Anderson Cancer Center. Primary access to the Midtown Central Square Property is provided via Interstate 45 and Interstate 10. Interstate 45 is a ten-lane highway running north/south through Texas. The Midtown Central Square Property is located within the Houston central business district. During the past year approximately 2,299,530 square feet of office space has been delivered in Houston, Texas. The area surrounding the Midtown Central Square Property is characterized by office, retail and multifamily properties. The Midtown Central Square Property is in downtown Houston, which is home to several parks, professional sports venues and retail developments. According to the appraisal, the 2021 population within a one, three, and five-mile radius of the Midtown Central Square Property was 28,494, 206,632 and 474,179. The average household income within the same radii was $112,331, $123,142 and $118,542, respectively.
Submarket Information (Office) – According to the appraisal, the Midtown Central Square Property is situated within the Midtown office submarket, which contained 10.9 million square feet of office space as of third quarter 2021. The Midtown office submarket reported a vacancy rate of 12.9% and an average quoted rental rate of $33.82 per square foot. The Midtown office submarket reported no new construction, deliveries of 301,400 square feet and positive absorption of 53,072 square feet.
THE INFORMATION IN THIS COLLATERAL TERM SHEET IS NOT COMPLETE AND MAY BE AMENDED PRIOR TO THE TIME OF SALE. THIS TERM SHEET IS NOT AN OFFER TO SELL THESE SECURITIES AND IT IS NOT A SOLICITATION OF AN OFFER TO BUY THESE SECURITIES IN ANY JURISDICTION WHERE THE OFFER OR SALE IS NOT PERMITTED.
33
| Office - CBD | Loan #3 | Cut-off Date Balance: | | $36,000,000 |
| 2100 Travis Street | Midtown Central Square | Cut-off Date LTV: | | 59.8% |
| Houston, TX 77002 | | U/W NCF DSCR: | | 2.31x |
| | | U/W NOI Debt Yield: | | 12.8% |
Appraiser’s Comp Set – The appraiser identified four competitive properties for the Midtown Central Square Property totaling approximately 886,273 square feet, which reported an average occupancy rate of approximately 76.6%. The appraiser concluded to market rents of $19.00 per square foot for office tenants, $32.00 per square foot for retail tenants and $10.00 per square foot for storage space tenants.
The following table presents certain information relating to the appraiser’s market rent conclusion for the Midtown Central Square Property:
Market Rent Summary(1)
| | Office Space | Retail Space | Storage Space |
| Market Rent (PSF) | $19.00 | $32.00 | $10.00 |
| Lease Term (Years) | 5.4 | 5.4 | 1 |
| Lease Type (Reimbursements) | NNN | NNN | Gross |
| Rent Increase Projection | $0.50/year | $0.50/year | None |
| Free Rent (Months) | 5 | 5 | 0 |
| (1) | Information obtained from the appraisal. |
Comparable Sales(1)
The table below presents certain information relating to comparable sales for the Midtown Central Square Property identified by the appraiser:
| Property Name | Location | Rentable Area (SF) | Sale Date | Sale Price | Sale Price (PSF) |
| Five Post Oak Park | Houston, TX | 566,616 | Jul-21 | $127,000,000 | $224.14 |
| 2900 Weslayan Street | Houston, TX | 136,698 | Jan-20 | $25,988,300 | $190.11 |
| Kirby Grove | Houston, TX | 248,275 | Jan-20 | $115,000,000 | $463.20 |
| River Oaks Bank Building | Houston, TX | 170,233 | Dec-19 | $56,500,000 | $331.90 |
| (1) | Information obtained from the appraisal. |
The table below presents certain information relating to four comparable properties to the Midtown Central Square Property identified by the appraiser:
Competitive Set(1)
| Property Name / Location | Year Built/ Renovated | Total GLA (SF) | Occupancy | Distance to Subject | Major Tenants |
Midtown Central Square (Subject) Houston, TX | 1961/2015 | 269,800 | 85.0% | - | City of Houston, IQor, Feldman Law Group |
3100 Main Street – HCC Building 3100 Main Street Houston, Texas | 1965/2000 | 531,000 | 82.7% | 0.7 miles | NAV |
Emancipation Center 3131 Emancipation Avenue Houston, Texas | 2020/NAP | 59,333 | 23.8% | 1.7 miles | NAV |
Amegy Bank of Texas 1801 Main Street Houston, Texas | 1957/2000 | 219,054 | 100.0% | 0.7 miles | NAV |
Houston Technology Center/Houston Exponential 410 Pierce Street Houston, Texas | 1960/2002 | 56,886 | 100% | 0.5 miles | NAV |
| (1) | Information obtained from the appraisal. |
THE INFORMATION IN THIS COLLATERAL TERM SHEET IS NOT COMPLETE AND MAY BE AMENDED PRIOR TO THE TIME OF SALE. THIS TERM SHEET IS NOT AN OFFER TO SELL THESE SECURITIES AND IT IS NOT A SOLICITATION OF AN OFFER TO BUY THESE SECURITIES IN ANY JURISDICTION WHERE THE OFFER OR SALE IS NOT PERMITTED.
34
| Office - CBD | Loan #3 | Cut-off Date Balance: | | $36,000,000 |
| 2100 Travis Street | Midtown Central Square | Cut-off Date LTV: | | 59.8% |
| Houston, TX 77002 | | U/W NCF DSCR: | | 2.31x |
| | | U/W NOI Debt Yield: | | 12.8% |
The following table presents certain information relating to comparable leases to those at the Midtown Central Square Property:
Comparable Leases(1)
| Property Name/Location | Year Built/ Renovated | Total GLA (SF) | Occupancy | Tenant | Lease Term | Tenant Size (SF) | Annual Base Rent PSF | Lease Type |
| Office | | | | | | | | |
Chase Tower 600 Travis Street Houston, TX | 1982/2012 | 1,660,689 | NAV | Undisclosed | 10 Yrs | 22,768 | $27.00 | NNN |
2119 Union Street 2119 Union Street Houston, TX | 1970/2019 | 3,440 | NAV | Confidential | 5.0 Yrs | 3,440 | $24.00 | NNN |
Wells Fargo Plaza 1000 Louisiana Street Houston, TX | 1983/NAP | 1,721,242 | NAV | DLR Group | 5.0 Yrs | 9,014 | $28.00 | NNN |
500 Lovett Boulevard 500 Lovett Boulevard Houston, TX | 1959/NAP | 15,676 | NAV | Regent Law Firm | 3.0 Yrs | 1,224 | $24.50 | NNN |
3501 Allen Parkway 3501 Allen Parkway Houston, TX | 1940/2010 | 4,100 | NAV | Confidential | 5.0 Yrs | 4,100 | $19.00 | NNN |
| Retail | | | | | | | | |
East Village 1201 Saint Emanuel Street Houston, TX | 2018/NAP | 30,000 | NAV | Confidential | 10.0 Yrs | 9,500 | $35.00 | NNN |
2600 Travis Street 2600 Travis Street Houston, TX | 1960/2007 | 32,374 | NAV | Confidential | 10.0 Yrs | 9,743 | $29.00 | NNN |
Washington – Center Project 1818 Washington Avenue Houston, TX | 2020/NAP | 124,000 | NAV | Sola Salon | 10.0 Yrs | 6,190 | $32.50 | NNN |
Hawthorne Square 3407 Montrose Boulevard Houston, TX | 1997/NAP | 14,336 | NAV | Confidential | 5.0 Yrs | 2,200 | $40.00 | NNN |
| | | | | | | | | | |
| (1) | Information obtained from the appraisal. |
Escrows.
Real Estate Taxes – The Midtown Central Square Mortgage Loan documents require an upfront real estate tax reserve of $144,762 and ongoing monthly real estate tax reserves in an amount equal to one-twelfth of the real estate taxes that the lender estimates will be necessary to pay taxes over the then succeeding twelve months (initially $45,956).
Insurance – The Midtown Central Square Mortgage Loan documents require an upfront insurance reserve of $142,078 and ongoing monthly insurance reserves are required in an amount equal to one-twelfth of the insurance premiums that the lender estimates will be payable for the renewal of the coverage afforded by the policies upon the expiration thereof (initially $16,914).
Replacement Reserves – The Midtown Central Square Mortgage Loan documents require ongoing monthly replacement reserves of approximately $3,373.
TI/LC Reserve – The Midtown Central Square Mortgage Loan documents requires upfront tenant improvement and leasing commission reserves of $1,000,000 and ongoing monthly tenant improvement and leasing commission reserves of $22,483, subject to a cap of $1,200,000 (the “Rollover Cap”). In addition to the monthly tenant improvement and leasing commission reserve, the Midtown Central Square Borrower is required to deposit into the TI/LC reserve any amounts paid to the Midtown Central Square Borrower in connection with a termination, cancellation, sale or other disposition of any lease or any portion thereof, other than amounts paid for rent and other charges in respect of periods prior to the date of such termination, cancellation, surrender, modification, sale or disposition.
Rent Abatement Reserve – The Midtown Central Square Mortgage Loan documents requires a free rent reserve of approximately $800,587.
New Tenant Improvement Reserve - The Midtown Central Square Mortgage Loan documents require an upfront new tenant improvement reserve of approximately $1,378,752 for tenant improvements related to the Feldman Law Group ($543,000), Therapies & Therapies ($100,720), Kitsos Investments ($356,900) and Creative Workspace, L.L.C. ($378,132) tenant spaces, respectively.
THE INFORMATION IN THIS COLLATERAL TERM SHEET IS NOT COMPLETE AND MAY BE AMENDED PRIOR TO THE TIME OF SALE. THIS TERM SHEET IS NOT AN OFFER TO SELL THESE SECURITIES AND IT IS NOT A SOLICITATION OF AN OFFER TO BUY THESE SECURITIES IN ANY JURISDICTION WHERE THE OFFER OR SALE IS NOT PERMITTED.
35
| Office - CBD | Loan #3 | Cut-off Date Balance: | | $36,000,000 |
| 2100 Travis Street | Midtown Central Square | Cut-off Date LTV: | | 59.8% |
| Houston, TX 77002 | | U/W NCF DSCR: | | 2.31x |
| | | U/W NOI Debt Yield: | | 12.8% |
Holdback Reserve – The Midtown Central Square Mortgage Loan documents require a $2,500,000 upfront holdback reserve as additional security for the payment of the Midtown Central Square Mortgage Loan, which amount will be disbursed to the Midtown Central Square Borrower if, after the May 6, 2022 payment date and prior to the March 10, 2024, the Midtown Central Square Borrower has satisfied the Holdback Reserve Funds Release Condition (as defined below) provided that if a Cash Management Trigger Event Period (as defined below) then exists, the lender will disburse the same into the lockbox account to be applied pursuant to the Midtown Central Square Mortgage Loan documents. In the event the Midtown Central Square Borrower has not qualified for disbursement of all of the holdback reserve funds on or prior to March 10, 2024, then the lender will have the right to hold the holdback reserve funds thereafter as additional collateral for the Midtown Central Square Mortgage Loan.
The “Holdback Debt Yield” means, as of any calculation date, a ratio conveyed as a percentage in which, (i) the numerator is the net operating income less the applicable fees as defined within the Midtown Central Square Loan documents and (ii) the denominator is the then original principal balance of the Midtown Central Square Mortgage Loan.
The “Holdback Reserve Funds Release Conditions” means, as of the date the lender calculates the Holdback Debt Yield, (i) no event of default has occurred and is continuing and (ii) the lender has received evidence, in form and substance reasonably satisfactory to the lender, that the Holdback Debt Yield equals or exceeds 11.5%.
Lockbox and Cash Management. The Midtown Central Square Mortgage Loan documents require a springing lockbox and springing cash management. Upon the occurrence and continuance of a Cash Management Trigger Event (as defined below) the Midtown Central Square Borrower is required to establish a lender-controlled lockbox account. Within five business days after the occurrence of a Cash Management Trigger Event, the Midtown Central Square Borrower or the property manager is required to deliver tenant instruction letters to each tenant in place and any new tenants instructing such tenants to deposit all rents payable under each lease directly into such lockbox account. The Midtown Central Square Mortgage Loan documents also require that all revenues received by the Midtown Central Square Borrower or the property manager is required to be deposited into the lockbox account within one business day of receipt. Pursuant to the Midtown Central Square Mortgage Loan documents, all excess funds on deposit are required to be applied as follows (a) if a Cash Sweep Event (as defined below) is not in effect, to the Midtown Central Square Borrower; and (b) if a Cash Sweep Event is in effect due to the existence of a Critical Tenant Trigger Event (as defined below) to the Critical Tenant TI/LC account until the applicable Critical Tenant Trigger Event cure has occurred. If a Cash Sweep Event is in effect but a Critical Tenant Trigger Event is not effect, then funds will be applied to the excess cash flow account.
A “Cash Management Trigger Event” will commence upon the occurrence of the following:
| (ii) | the Midtown Central Square Borrower’s second late debt service payment within a 12-month period; |
| (iii) | a bankruptcy action of the Midtown Central Square Borrower, the guarantor or the property manager; |
| (iv) | a Cash Management DSCR Trigger Event (as defined below); |
| (v) | a Critical Tenant Trigger Event; or |
| (vi) | the closing of a subordinate mezzanine loan. |
A Cash Management Trigger Event will end upon the occurrence of:
| ● | with regard to clause (i) above, the cure of such event of default has been accepted or waived by the lender; |
| ● | with regard to clause (ii) above, when the debt service payments have been paid on time for 12 consecutive months; |
| ● | with regard to clause (iii) above, when such bankruptcy action petition has been discharged, stayed, or dismissed within 90 days of such filing among other conditions for the Midtown Central Square Borrower or the guarantor and within 120 days for the property manager, and, with respect to the property manager, the Midtown Central Square Borrower has replaced the property manager with a qualified property manager acceptable to the lender; |
| ● | with regard to clause (iv) above, the date the debt service coverage ratio based on the trailing 12-month period immediately preceding the date of such determination is greater than 1.25x for two consecutive quarters; |
| ● | with regard to clause (v) above, the date the Critical Tenant Trigger Event has been cured; and |
| ● | with regard to clause (vi) above, the repayment of the subordinate mezzanine loan and satisfactions of all obligations thereunder. |
A “Cash Management DSCR Trigger Event” will occur on any date the debt service coverage ratio, based on the trailing 12-month period immediately preceding the date of determination, is less than 1.20x.
A “Cash Sweep Event” will commence upon the occurrence of the following:
| (ii) | a bankruptcy action of the Midtown Central Square Borrower, guarantor or property manager; |
| (iii) | a Cash Sweep DSCR Trigger Event (as defined below); or |
| (iv) | a Critical Tenant Trigger Event. |
THE INFORMATION IN THIS COLLATERAL TERM SHEET IS NOT COMPLETE AND MAY BE AMENDED PRIOR TO THE TIME OF SALE. THIS TERM SHEET IS NOT AN OFFER TO SELL THESE SECURITIES AND IT IS NOT A SOLICITATION OF AN OFFER TO BUY THESE SECURITIES IN ANY JURISDICTION WHERE THE OFFER OR SALE IS NOT PERMITTED.
36
| Office - CBD | Loan #3 | Cut-off Date Balance: | | $36,000,000 |
| 2100 Travis Street | Midtown Central Square | Cut-off Date LTV: | | 59.8% |
| Houston, TX 77002 | | U/W NCF DSCR: | | 2.31x |
| | | U/W NOI Debt Yield: | | 12.8% |
A Cash Sweep Event will end upon the occurrence of:
| ● | with regard to clause (i) above, the cure of such event of default has been accepted or waived by lender; |
| ● | with regard to clause (ii) above, when such bankruptcy action petition has been discharged, stayed, or dismissed within 90 days of such filing among other conditions for the Midtown Central Square Borrower or guarantor and within 120 days for the property manager, with respect to the property manager, the Midtown Central Square Borrower replacing the property manager with a qualified property manager acceptable to the lender; |
| ● | with regard to clause (iii) above, the date the debt service coverage ratio based on the trailing 12-month period immediately preceding the date of such determination is greater than 1.20x for two consecutive quarters; and |
| ● | with regard to clause (iv) above, the date the Critical Tenant Trigger Event has been cured. |
A “Cash Sweep DSCR Trigger Event” will occur on any date the debt service coverage ratio, based on the trailing 12-month period immediately preceding the date of determination, is less than 1.15x.
A “Critical Tenant Trigger Event” will occur if:
| (i) | the City of Houston, IQor and Feldman Law Group or any other tenant occupying the space currently occupied by such tenant (each, a “Critical Tenant” and each related lease, a “Critical Tenant Lease”) gives notice of its intention to not extend or renew its lease or to terminate its lease or the applicable Critical Tenant Lease is otherwise terminated; |
| (ii) | on the date that is 12 months prior to the related lease expiration date or termination date under Critical Tenant Lease, if the Critical Tenant has failed to give notice of its election to renew its lease; |
| (iii) | on or prior to the date on which the Critical Tenant is required under its lease to notify the borrower of its election to renew its lease, the Critical Tenant fails to give such notice; |
| (iv) | an event of default under the Critical Tenant Lease occurs or is continuing; |
| (v) | a bankruptcy action with respect to the Critical Tenant or the guarantor of any Critical Tenant occurs; |
| (vi) | the Critical Tenant elects to pay reduced rent (including, without limitation, percentage rent in lieu of fixed rent) pursuant to any right or remedy contained in the applicable Critical Tenant Lease; |
| (vii) | if the Critical Tenant discontinues its normal business operations (other than a temporary cessation of business operations for permitted renovations or necessary repairs); provided, that, with respect to Feldman Law, the foregoing will only constitute a Critical Tenant Trigger Event after Feldman Law takes occupancy of its demised premises; |
| (viii) | the related Critical Tenant is downgraded below “BBB-” or the equivalent by a credit reporting agency; or |
| (ix) | the City of Houston fails to appropriate funds sufficient to allow such tenant to pay the Midtown Central Square Borrower all rents and other charges due and payable for such period under the City of Houston lease. |
A “Critical Tenant Trigger Event Cure” will occur upon:
| ● | with regard to clause (i), (ii) or (iii) above, the date that (1) the Critical Tenant Lease extension is executed and delivered to lender by the Midtown Central Square Borrower and the related tenant improvement costs, leasing commissions and other material costs and expenses have been deposited into the Critical Tenant TI/LC account; or (2) a Critical Tenant Space Re-Tenanting Event (as defined below) has occurred; |
| ● | with regard to clause (iv) above, after a cure of the applicable default; |
| ● | with regard to clause (v) above, after an affirmation of the Critical Tenant lease in the applicable bankruptcy proceeding and confirmation that the Critical Tenant is actually paying all rents and other amounts under the lease; |
| ● | with regard to clause (vi) above, the Critical Tenant re-commences the payment of full unabated rent; |
| ● | with regard to clause (vii) above, the Critical Tenant re-commences its normal business operations or a Critical Tenant Space Re-Tenanting Event has occurred; |
| ● | with regard to clause (viii) above, the date the credit rating of the related Critical Tenant is no longer less than a “BBB-” or the equivalent by a credit reporting agency; or |
| ● | with regard to clause (ix) above, the City of Houston appropriates an amount sufficient to allow it to pay the Midtown Central Square Borrower all rents and other charges due and payable for such period under the City of Houston lease. |
A “Critical Tenant Space Re-tenanting Event” will occur on the date each of the following conditions has been satisfied: (i) the related Critical Tenant space is leased to one or more replacement tenants for a term of at least five years and on terms that are acceptable to the lender; (ii) all tenant improvement costs, leasing commissions and other material costs and expenses relating to the re-letting of the related Critical Tenant Space have been paid in full; and (iii) the replacement tenant(s) are conducting normal business operations at the related Critical Tenant space.
Property Management. The Midtown Central Square Property is managed by Claremont Property Co., an affiliate of the Midtown Central Square Borrower.
Partial Release. Not permitted.
Real Estate Substitution. Not permitted.
Subordinate and Mezzanine Indebtedness. Provided no event of default has occurred and is continuing, the Midtown Central Square Loan documents permit an affiliate the Midtown Central Square Borrower to incur future mezzanine debt subject to certain conditions, including (i) the execution of an intercreditor agreement in form and substance acceptable to the lender and each of the
THE INFORMATION IN THIS COLLATERAL TERM SHEET IS NOT COMPLETE AND MAY BE AMENDED PRIOR TO THE TIME OF SALE. THIS TERM SHEET IS NOT AN OFFER TO SELL THESE SECURITIES AND IT IS NOT A SOLICITATION OF AN OFFER TO BUY THESE SECURITIES IN ANY JURISDICTION WHERE THE OFFER OR SALE IS NOT PERMITTED.
37
| Office - CBD | Loan #3 | Cut-off Date Balance: | | $36,000,000 |
| 2100 Travis Street | Midtown Central Square | Cut-off Date LTV: | | 59.8% |
| Houston, TX 77002 | | U/W NCF DSCR: | | 2.31x |
| | | U/W NOI Debt Yield: | | 12.8% |
applicable rating agencies; (ii) based on the Midtown Central Square Mortgage Loan and the mezzanine loan, (a) the loan-to-value ratio is not greater than 59.8%; (b) the debt service coverage ratio is not less than 1.84x; and (iii) receipt of rating agency confirmations from each of the applicable rating agencies that the mezzanine financing will not result in a downgrade, withdrawal or qualification of the respective ratings assigned to the Series 2022-C62 Certificates.
Ground Lease. None.
Terrorism Insurance. The Midtown Central Square Mortgage Loan documents require that the “all risk” insurance policy required to be maintained by the Midtown Central Square Borrower provides coverage for terrorism in an amount equal to the full replacement cost of the Midtown Central Square Property, as well as business interruption insurance covering no less than the 18-month period following the occurrence of a casualty event, together with a 12-month extended period of indemnity.
THE INFORMATION IN THIS COLLATERAL TERM SHEET IS NOT COMPLETE AND MAY BE AMENDED PRIOR TO THE TIME OF SALE. THIS TERM SHEET IS NOT AN OFFER TO SELL THESE SECURITIES AND IT IS NOT A SOLICITATION OF AN OFFER TO BUY THESE SECURITIES IN ANY JURISDICTION WHERE THE OFFER OR SALE IS NOT PERMITTED.
38
| Office - Flex | Loan #4 | Cut-off Date Balance: | | $23,750,000 |
| 2744 East 11th Street | Artthaus Studios | Cut-off Date LTV: | | 50.4% |
| Oakland, CA 94601 | | UW NCF DSCR: | | 2.34x |
| | | UW NOI Debt Yield: | | 9.5% |
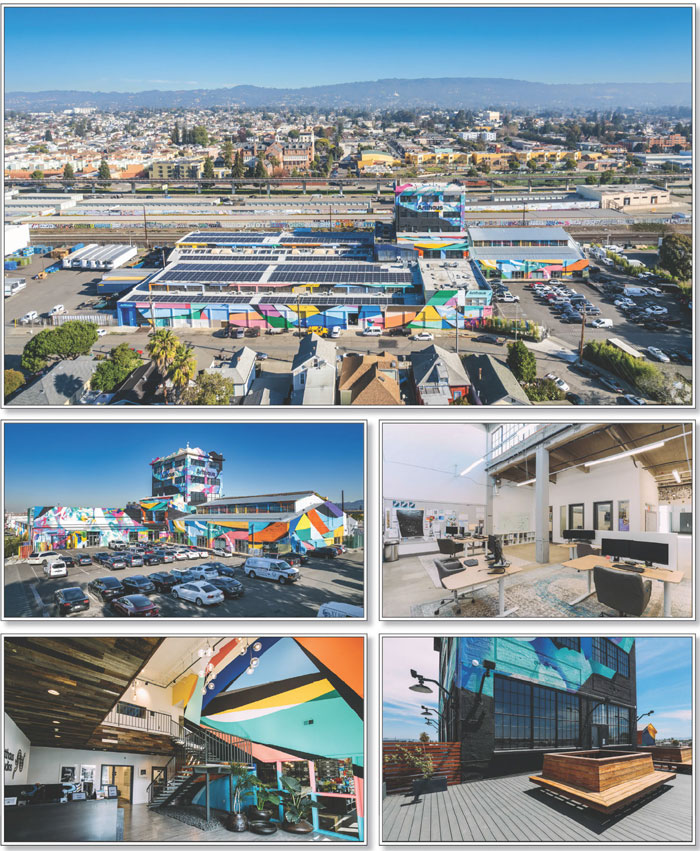
THE INFORMATION IN THIS COLLATERAL TERM SHEET IS NOT COMPLETE AND MAY BE AMENDED PRIOR TO THE TIME OF SALE. THIS TERM SHEET IS NOT AN OFFER TO SELL THESE SECURITIES AND IT IS NOT A SOLICITATION OF AN OFFER TO BUY THESE SECURITIES IN ANY JURISDICTION WHERE THE OFFER OR SALE IS NOT PERMITTED.
39
| No. 4 – Artthaus Studios |
| |
| Mortgage Loan Information | | Mortgaged Property Information |
| Mortgage Loan Seller: | Wells Fargo Bank, National Association | | Single Asset/Portfolio: | Single Asset |
Credit Assessment (Fitch/KBRA/Moody’s): | NR/NR/NR | | Property Type – Subtype: | Office - Flex |
| Original Principal Balance: | $23,750,000 | | Location: | Oakland, CA |
| Cut-off Date Balance: | $23,750,000 | | Size: | 104,802 SF |
| % of Initial Pool Balance: | 4.5% | | Cut-off Date Balance Per SF: | $226.62 |
| Loan Purpose: | Refinance | | Maturity Date Balance Per SF: | $226.62 |
| Borrower Sponsor: | Alexander Riaz Taplin (AKA Riaz Taplin) | | Year Built/Renovated: | 1917/2018-2020 |
| Guarantor: | Alexander Riaz Taplin (AKA Riaz Taplin) | | Title Vesting: | Fee |
| Mortgage Rate: | 3.8590% | | Property Manager: | Best Bay Apartments, Inc. (borrower affiliate) |
| Note Date: | February 2, 2022 | | Current Occupancy (As of): | 86.9% (1/25/2022) |
| Seasoning: | 2 months | | TTM Occupancy (11/30/2021)(3): | NAP |
| Maturity Date: | February 11, 2032 | | YE 2020 Occupancy(3): | NAP |
| IO Period: | 120 months | | YE 2019 Occupancy(3): | NAP |
| Loan Term (Original): | 120 months | | YE 2018 Occupancy(3): | NAP |
| Amortization Term (Original): | NAP | | As-Is Appraised Value(4): | $47,100,000 |
| Loan Amortization Type: | Interest Only | | As-Is Appraised Value Per SF(4): | $449.42 |
| Call Protection: | L(26),D(90),O(4) | | As-Is Appraisal Valuation Date: | December 10, 2021 |
| | | | | |
| Lockbox Type: | Soft/Springing Cash Management | | Underwriting and Financial Information(4) |
| Additional Debt(1): | Yes | | TTM NOI (11/30/2021)(5): | $1,582,374 |
| Additional Debt Type (Balance) (1): | Future Mezzanine | | YE 2020 NOI(5): | $1,248,605 |
| | | | YE 2019 NOI(5): | $542,730 |
| | | | YE 2018 NOI(5): | NAP |
| | | | U/W Revenues: | $3,490,404 |
| | | | U/W Expenses: | $1,235,607 |
| Escrows and Reserves(2) | | U/W NOI(5): | $2,254,797 |
| | Initial | Monthly | Cap | | U/W NCF: | $2,179,035 |
| Taxes | $49,925 | $9,985 | NAP | | U/W DSCR based on NOI/NCF: | 2.43x / 2.34x |
| Insurance | $20,580 | $5,145 | NAP | | U/W Debt Yield based on NOI/NCF: | 9.5% / 9.2% |
| Replacement Reserves | $0 | $1,747 | $70,000 | | U/W Debt Yield at Maturity based on NOI/NCF: | 9.5% / 9.2% |
| TI/LC | $500,000 | Springing | $430,000 | | Cut-off Date LTV Ratio: | 50.4% |
| Rent Concession Reserve | $522,540 | $0 | NAP | | LTV Ratio at Maturity: | 50.4% |
| | | | | | | |
| | | | | | | | |
| Sources and Uses |
| Sources | | | | | Uses | | | |
| Original Mortgage Loan Amount | $23,750,000 | | 100.0% | | Loan Payoff | $15,705,288 | | 66.1% |
| | | | | | Upfront Reserves | 1,093,045 | | 4.6 |
| | | | | | Closing Costs | 669,882 | | 2.8 |
| | | | | | Return of Equity | 6,281,786 | | 26.4 |
| Total Sources | $23,750,000 | | 100.0% | | Total Uses | $23,750,000 | | 100.0% |
| (1) | See “Subordinate and Mezzanine Indebtedness” section below. |
| (2) | See “Escrows” section. |
| (3) | Historical occupancy information is not available or applicable because the Artthaus Studios Property was repositioned and extensively renovated between 2018 and 2020, with Phase I delivered in June 2018, Phase II delivered in February 2020 and Phase III delivered in May 2020. |
| (4) | While the Artthaus Studios Mortgage Loan (defined below) was originated after the emergence of the novel coronavirus pandemic and the economic disruption resulting from measures to combat the pandemic, the pandemic is an evolving situation and could impact the Artthaus Studios Mortgage Loan more severely than assumed in the underwriting and could adversely affect the NOI, NCF and occupancy information, as well as the appraised value and the DSCR, LTV and Debt Yield metrics presented above. See “Risk Factors— Risks Related to Market Conditions and Other External Factors—Coronavirus Pandemic Has Adversely Affected the Global Economy and Will Likely Adversely Affect the Performance of the Mortgage Loans” in the Preliminary Prospectus. |
| (5) | The Artthaus Studios Property was repositioned and extensively renovated between 2018 and 2020, with Phase I delivered in June 2018, Phase II delivered in February 2020 and Phase III delivered in May 2020. |
The Mortgage Loan. The mortgage loan (the “Artthaus Studios Mortgage Loan”) is evidenced by the first priority fee interest encumbering a 104,802 square foot, multi-tenant office property located in Oakland, California (the “Artthaus Studios Property”).
The Borrower and Borrower Sponsor. The borrower is Lucasey Lofts LP, a California Limited Partnership and single purpose entity with one independent director. Legal counsel to the borrower delivered a non-consolidation opinion in connection with the origination
THE INFORMATION IN THIS COLLATERAL TERM SHEET IS NOT COMPLETE AND MAY BE AMENDED PRIOR TO THE TIME OF SALE. THIS TERM SHEET IS NOT AN OFFER TO SELL THESE SECURITIES AND IT IS NOT A SOLICITATION OF AN OFFER TO BUY THESE SECURITIES IN ANY JURISDICTION WHERE THE OFFER OR SALE IS NOT PERMITTED.
40
| Office - Flex | Loan #4 | Cut-off Date Balance: | | $23,750,000 |
| 2744 East 11th Street | Artthaus Studios | Cut-off Date LTV: | | 50.4% |
| Oakland, CA 94601 | | UW NCF DSCR: | | 2.34x |
| | | UW NOI Debt Yield: | | 9.5% |
of the Artthaus Studios Mortgage Loan. The borrower sponsor and nonrecourse carveout guarantor is Alexander Riaz Taplin (“Riaz Taplin”).
Riaz Taplin is the founder and principal of Riaz Capital, a vertically integrated workforce housing developer with over 20 years of development experience in the Bay Area. Currently, Riaz Capital’s portfolio includes over 1,500 units, with 1,700 units in development, and real estate assets valued at approximately $500 million.
The Property. The Artthaus Studios Property consists of a five-story, 104,802 square foot, multi-tenant flex office building, located in Oakland, California. Built in 1917, the property, which is situated on a 2.39-acre site, was extensively renovated between 2018 and 2020 for approximately $18.9 million. The property was repositioned from its prior manufacturing use to industrial flex creative office in three phases, with Phase I being delivered in June 2018, Phase II being delivered in February 2020, and Phase III being delivered in May 2020. As part of the redevelopment, the borrower completed seismic structural upgrades, mechanical upgrades, and electrical and plumbing upgrades. Additional renovations included new HVAC units and LED lighting, the addition of 15 restrooms, new elevator, fire alarm and sprinkler systems, access control and security systems, as well as newly developed meeting areas, lounge, kitchen area, and rooftop deck. Tenants currently lease between 81 square feet and 4,937 square feet of space. Artthaus Studios has 90 on-site parking spaces, resulting in a parking ratio of 0.86 spaces per 1,000 square feet. Three tenants totaling 8.2% of net rentable area and 11.7% of underwritten base rent are affiliated with the borrower sponsor. As of January 25, 2022, the Artthaus Studios Property was 86.9% occupied by 80 tenants.
Major Tenants.
Largest Tenant: Brighter Beginnings (8,177 square feet; 7.8% of net rentable area; 10.0% of underwritten base rent; 8/31/2027 lease expiration) – Founded in 1984, Brighter Beginnings is a nonprofit organization that supports child development by partnering with parents and helping to build strong communities with the ultimate goal of helping parents with limited financial support or medical resources become self-sufficient. Brighter Beginnings serves the Bay Area and has partnered with other companies to give their clients access to services such as healthcare, childcare, housing, education, job training and temporary public benefits. Brighter Beginnings does not have any termination options and has one, five-year renewal option.
2nd Largest Tenant: XIA (6,725 square feet; 6.4% of net rentable area; 7.8% of underwritten base rent; 7/31/2031 lease expiration) Founded in 1994, XIA, which is headquartered at the Artthaus Studios Property, invents, develops, and markets advanced digital data acquisition and processing systems for x-ray, gamma-ray, and other radiation detector applications in university research, national laboratories and industry. XIA may terminate its lease effective 72 months after the lease commencement with at least 9 months’, and no more than 18 months’, written notice to the landlord. No termination fee is required. XIA has one, 10-year renewal option.
3rd Largest Tenant: Riaz Capital (4,430 square feet; 4.2% of net rentable area; 6.4% of underwritten base rent; various lease expirations) – Riaz Capital, which is an affiliate of the borrower, is headquartered at the Artthaus Studios Property. The tenant has two leases, expiring on 3/31/2023 (1,201 square feet; 1.1% of net rentable area; 1.9% of underwritten base rent) and 6/30/2027 (3,229 square feet; 3.1% of net rentable area; 4.5% of underwritten base rent). Riaz Capital has no termination or renewal options.
COVID-19 Update. As of March 2, 2022, the Artthaus Studios Property is open and operating and there are no outstanding rent relief requests.
THE INFORMATION IN THIS COLLATERAL TERM SHEET IS NOT COMPLETE AND MAY BE AMENDED PRIOR TO THE TIME OF SALE. THIS TERM SHEET IS NOT AN OFFER TO SELL THESE SECURITIES AND IT IS NOT A SOLICITATION OF AN OFFER TO BUY THESE SECURITIES IN ANY JURISDICTION WHERE THE OFFER OR SALE IS NOT PERMITTED.
41
| Office - Flex | Loan #4 | Cut-off Date Balance: | | $23,750,000 |
| 2744 East 11th Street | Artthaus Studios | Cut-off Date LTV: | | 50.4% |
| Oakland, CA 94601 | | UW NCF DSCR: | | 2.34x |
| | | UW NOI Debt Yield: | | 9.5% |
The following table presents certain information relating to the tenancy at the Artthaus Studios Property:
Major Tenants
| Tenant Name | Credit Rating (Fitch/ Moody’s/
S&P) | Tenant NRSF | % of
NRSF | Annual U/W Base Rent PSF(1) | Annual
U/W Base Rent(1) | % of Total Annual U/W Base Rent | Lease
Expiration
Date | Ext. Options | Term. Option (Y/N) |
| | | | | | | | | |
| Major Tenants | | | | | | | | |
| Brighter Beginnings | NR/NR/NR | 8,177 | 7.8% | $35.23 | $288,043 | 10.0% | 8/31/2027 | 1, 5-year | N |
| XIA | NR/NR/NR | 6,725 | 6.4% | $33.39 | $224,523 | 7.8% | 7/31/2031 | 1, 10-year | Y(2) |
| Riaz Capital(3) | NR/NR/NR | 4,430 | 4.2% | $41.74 | $184,909 | 6.4% | Various | N | N |
| Best Bay Apartments(3) | NR/NR/NR | 3,210 | 3.1% | $38.19 | $122,598 | 4.3% | 6/30/2024 | N | N |
| Be The Change Consulting | NR/NR/NR | 3,745 | 3.6% | $31.97 | $119,712 | 4.2% | 5/31/2023 | 1, 2-year | N |
| | 26,287 | 25.1% | $35.75 | $939,785 | 32.7% | | | |
| | | | | | | | | |
| Non-Major Tenants | 64,750 | 61.8% | $29.88 | $1,935,004 | 67.3% | | | |
| | | | | | | | | |
| Occupied Collateral Total | 91,037 | 86.9% | $31.58 | $2,874,788 | 100.00% | | | |
| | | | | | | | | |
| Vacant Space | 13,765 | 13.1% | | | | | | |
| | | | | | | | | |
| Collateral Total | 104,802(4) | 100.0% | | | | | | |
| | | | | | | | | | |
| (1) | Annual U/W Base Rent PSF and Annual U/W Base Rent include contractual rent steps through January 2023 totaling $51,783 |
| (2) | XIA may terminate its lease effective 72 months after the lease commencement with at least 9 months’, and no more than 18 months’, written notice to the landlord. No termination fee is required. |
| (3) | Riaz Capital and Best Bay Apartments are affiliates of the borrower sponsor. |
| (4) | The Collateral Total Tenant NRSF includes 1,590 square feet of event space. There is no underwritten rent or lease expiration date associated with the event space. |
(1)
The following table presents certain information relating to the lease rollover schedule at the Artthaus Studios Property:
Lease Expiration Schedule(1)
Year Ending
December 31, | No. of Leases Expiring | Expiring NRSF | % of Total NRSF | Cumulative Expiring NRSF | Cumulative % of Total NRSF | Annual
U/W
Base Rent(2) | % of Total Annual U/W Base Rent | Annual
U/W
Base Rent
PSF(2) |
| MTM(3) | 12 | 6,919 | 6.6% | 6,919 | 6.6% | $162,215 | 5.6% | $23.44 |
| 2022 | 26 | 20,124 | 19.2% | 27,043 | 25.8% | $622,164 | 21.6% | $30.92 |
| 2023 | 34 | 27,512 | 26.3% | 54,555 | 52.1% | $854,638 | 29.7% | $31.06 |
| 2024 | 11 | 12,352 | 11.8% | 66,907 | 63.8% | $408,167 | 14.2% | $33.04 |
| 2025 | 1 | 1,508 | 1.4% | 68,415 | 65.3% | $36,466 | 1.3% | $24.18 |
| 2026 | 2 | 3,487 | 3.3% | 71,902 | 68.6% | $118,334 | 4.1% | $33.94 |
| 2027 | 5 | 12,410 | 11.8% | 84,312 | 80.4% | $448,280 | 15.6% | $36.12 |
| 2028 | 0 | 0 | 0.0% | 84,312 | 80.4% | $0 | 0.0% | $0.00 |
| 2029 | 0 | 0 | 0.0% | 84,312 | 80.4% | $0 | 0.0% | $0.00 |
| 2030 | 0 | 0 | 0.0% | 84,312 | 80.4% | $0 | 0.0% | $0.00 |
| 2031 | 3 | 6,725 | 6.4% | 91,037 | 86.9% | $224,523 | 7.8% | $33.39 |
| 2032 | 0 | 0 | 0.0% | 91,037 | 86.9% | $0 | 0.0% | $0.00 |
| Thereafter | 0 | 0 | 0.0% | 91,037 | 86.9% | $0 | 0.0% | $0.00 |
| Vacant | 0 | 13,765 | 13.1% | 104,802 | 100.0% | $0 | 0.0% | $0.00 |
| Total/Weighted Average | 94 | 104,802 | 100.0% | | | $2,874,788 | 100.0% | $31.58 |
| (1) | Information obtained from the underwritten rent roll dated as of January 25, 2022. |
| (2) | Annual U/W Base Rent and Annual U/W Base Rent PSF does not include vacant space. |
| (3) | MTM Expiring NRSF, % of Total NRSF, Cumulative Expiring NRSF, and Cumulative % of Total NRSF includes 1,590 square feet of event space. There is no underwritten rent or lease expiration date associated with the event space. |
THE INFORMATION IN THIS COLLATERAL TERM SHEET IS NOT COMPLETE AND MAY BE AMENDED PRIOR TO THE TIME OF SALE. THIS TERM SHEET IS NOT AN OFFER TO SELL THESE SECURITIES AND IT IS NOT A SOLICITATION OF AN OFFER TO BUY THESE SECURITIES IN ANY JURISDICTION WHERE THE OFFER OR SALE IS NOT PERMITTED.
42
| Office - Flex | Loan #4 | Cut-off Date Balance: | | $23,750,000 |
| 2744 East 11th Street | Artthaus Studios | Cut-off Date LTV: | | 50.4% |
| Oakland, CA 94601 | | UW NCF DSCR: | | 2.34x |
| | | UW NOI Debt Yield: | | 9.5% |
The following table presents historical occupancy percentages at the Artthaus Studios Property:
Historical Occupancy
12/31/2017(1) | 12/31/2018(1) | 12/31/2019(1) | 12/31/2020(1) | 1/25/2022(2) |
| NAP | NAP | NAP | NAP | 86.9% |
| (1) | Historical occupancy information is not available because the Artthaus Studios Property was repositioned and extensively renovated between 2018 and 2020, with Phase I delivered in June 2018, Phase II delivered in February 2020 and Phase III delivered in May 2020. |
| (2) | Information obtained from the underwritten rent roll. |
Operating History and Underwritten Net Cash Flow. The following table presents certain information relating to the historical operating performance and underwritten net cash flow at the Artthaus Studios Property:
Cash Flow Analysis
| | 2019 | 2020 | TTM
11/30/2021 | U/W | %(1) | U/W $
per SF |
| Base Rent | $1,369,622 | $1,717,630 | $2,387,602 | $2,874,788(2) | 73.1% | $27.43(2) |
| Grossed Up Vacant Space | 0 | 0 | 0 | 444,823 | 11.3 | 4.24 |
| Gross Potential Rent | $1,369,622 | $1,717,630 | $2,387,602 | $3,319,612 | 84.4% | $31.68 |
| Other Income | 240,029 | 262,200 | 177,031 | 218,200 | 5.5 | 2.08 |
| Less: Free Rent Adjustment | (170,613) | (120,660) | (357,846) | 0 | 0.0 | 0.00 |
| Total Recoveries | 77,874 | 137,050 | 307,939 | 397,416 | 10.1 | 3.79 |
| Net Rental Income | $1,516,913 | $1,996,220 | $2,514,726 | $3,935,228 | 100.0% | $37.55 |
| (Vacancy & Credit Loss) | 0 | 0 | 0 | (444,823)(3) | (13.4) | (4.24) |
| Effective Gross Income | $1,516,913 | $1,996,220 | $2,514,726 | $3,490,404 | 88.7% | $33.30 |
| | | | | | | |
| Real Estate Taxes | 107,453 | 111,771 | 114,471 | 334,089 | 9.6% | 3.19 |
| Insurance | 22,985 | 87,557 | 72,454 | 58,797 | 1.7 | 0.56 |
| Management Fee | 64,203 | 25,030 | 91,843 | 139,616 | 4.0 | 1.33 |
| Other Operating Expenses | 779,541 | 523,257 | 653,584 | 703,105 | 20.1 | 6.71 |
| Total Operating Expenses | $974,183 | $747,615 | $932,352 | $1,235,607 | 35.4% | $11.79 |
| | | | | | | |
| Net Operating Income(4) | $542,730 | $1,248,605 | $1,582,374 | $2,254,797 | 64.6% | $21.51 |
| Replacement Reserves | 0 | 0 | 0 | 20,960 | 0.6 | 0.20 |
| TI/LC | 0 | 0 | 0 | 54,802 | 1.6 | 0.52 |
| Net Cash Flow | $542,730 | $1,248,605 | $1,582,374 | $2,179,035 | 62.4% | $20.79 |
| | | | | | | |
| NOI DSCR | 0.58x | 1.34x | 1.70x | 2.43x | | |
| NCF DSCR | 0.58x | 1.34x | 1.70x | 2.34x | | |
| NOI Debt Yield | 2.3% | 5.3% | 6.7% | 9.5% | | |
| NCF Debt Yield | 2.3% | 5.3% | 6.7% | 9.2% | | |
| (1) | Represents (i) percent of Net Rental Income for all revenue fields, (ii) percent of Gross Potential Rent for Vacancy & Credit Loss and (iii) percent of Effective Gross Income for all other fields. |
| (2) | U/W Base Rent PSF and U/W Base Rent contractual rent steps through January 2023 totaling $51,783 |
| (3) | The underwritten economic vacancy is 13.4%. The Artthaus Studios Property was 86.9% physically occupied as of January 25, 2022. |
| (4) | The Artthaus Studios Property was repositioned and extensively renovated between 2018 and 2020, with Phase I delivered in June 2018, Phase II delivered in February 2020 and Phase III delivered in May 2020. |
Appraisal. The appraiser concluded to an “as-is” Appraised Value for the Artthaus Studios Property of $47,100,000 as of December 10, 2021.
Environmental Matters. The Phase I environmental site assessment dated December 22, 2021, identified a recognized environmental condition (“REC”) and a controlled recognized environmental condition (“CREC”) at the Artthaus Studios Property.
With regard to the REC, in 2015, the borrower sponsor contemplated redeveloping the property into a residential use and, as such, entered into a Voluntary Remedial Action Agreement with the Alameda County Department of Environmental Health (“ACDEH”) that identified benzene and PCE above residential action levels for indoor air. An additional Spills, Leaks, Investigations and Cleanup (“SLIC”) was opened. While both contaminants were determined to be attributable to off-site sources, and redevelopment was changed to be commercial, the ACDEH requested an Environmental Risk Management Plan (“ERMP”). To address potential vapor intrusion, a vapor
THE INFORMATION IN THIS COLLATERAL TERM SHEET IS NOT COMPLETE AND MAY BE AMENDED PRIOR TO THE TIME OF SALE. THIS TERM SHEET IS NOT AN OFFER TO SELL THESE SECURITIES AND IT IS NOT A SOLICITATION OF AN OFFER TO BUY THESE SECURITIES IN ANY JURISDICTION WHERE THE OFFER OR SALE IS NOT PERMITTED.
43
| Office - Flex | Loan #4 | Cut-off Date Balance: | | $23,750,000 |
| 2744 East 11th Street | Artthaus Studios | Cut-off Date LTV: | | 50.4% |
| Oakland, CA 94601 | | UW NCF DSCR: | | 2.34x |
| | | UW NOI Debt Yield: | | 9.5% |
intrusion barrier system was voluntarily installed. The ERMP requires that tenants, contractors and workers be made aware of subsurface conditions and mitigation measures at the property, and that mitigation measures continue to be monitored. Because the SLIC is listed as open, this constitutes an REC. The consultant provided a worst-case estimate with a statistical 90% confidence interval that the total cost for potential remediation had an upper-end range of $870,000. In lieu of an environmental reserve, the lender obtained a $5,000,000 environmental insurance policy with a $5,000,000 limit per claim on a 13-year term, which includes a $25,000 deductible per claim. See “Description of the Mortgage Pool—Environmental Considerations” in the prospectus.
Market Overview and Competition. The Artthaus Studios Property is located in Oakland, California, approximately 4 miles from the central business district and 15 miles east of San Francisco. The property is located in the Jingletown neighborhood, which was historically a light industrial area for the past 30 years; however, in the early 1970s the area began to be rezoned to residential and many of the historic industrial buildings have been redeveloped into offices or lofts. The property is located approximately 6.0 miles north of the Oakland International Airport with access to I-880, a major north-south thoroughfare in the area, approximately 0.7 miles away. According to a third-party market research report, within a 1-, 3- and 5- mile radius of the Artthaus Studios Property, the estimated 2021 population is 41,400, 290,937, and 496,849, respectively, and the 2021 median household income is $52,780, $79,229, and $82,276, respectively.
According to a third-party market research report, the property is situated within the Oakland-South/Airport submarket of the greater East Bay/Oakland office market. As of March 1, 2022, the submarket reported total inventory of approximately 5.1 million square feet with a 6.7% vacancy rate and average market rents of $30.04 per square foot. There are currently no office properties under construction in the submarket. The appraiser identified six lease comparables with rents ranging from $24.60 to $46.00 per square foot, and concluded to average market rent of $32.61 per square foot.
The following table presents certain information relating to the appraiser’s market rent conclusions for the Artthaus Studios Property:
Market Rent Summary(1)
| | 2,000-5,000 SF | 850-1,999 SF | 320-849 SF |
| Market Rent (PSF) | $33.60 | $32.40 | $31.80 |
| Lease Term (Years) | 3 | 2 | 1 |
| Lease Type | Modified | Modified | Modified |
| Rent Increase Projection | 3.0%/Year | 3.0%/Year | 3.0%/Year |
| TI (New/Renewal) | $0.00 / $0.00 | $0.00 / $0.00 | $0.00 / $0.00 |
| LC (New/Renewal) | $0.00 / $0.00 | $0.00 / $0.00 | $0.00 / $0.00 |
| Free Rent (New/Renewal) | 3 mths / 0 mths | 2 mths / 0 mths | 0 mths / 0 mths |
| (1) | Information obtained from the appraisal. |
THE INFORMATION IN THIS COLLATERAL TERM SHEET IS NOT COMPLETE AND MAY BE AMENDED PRIOR TO THE TIME OF SALE. THIS TERM SHEET IS NOT AN OFFER TO SELL THESE SECURITIES AND IT IS NOT A SOLICITATION OF AN OFFER TO BUY THESE SECURITIES IN ANY JURISDICTION WHERE THE OFFER OR SALE IS NOT PERMITTED.
44
| Office - Flex | Loan #4 | Cut-off Date Balance: | | $23,750,000 |
| 2744 East 11th Street | Artthaus Studios | Cut-off Date LTV: | | 50.4% |
| Oakland, CA 94601 | | UW NCF DSCR: | | 2.34x |
| | | UW NOI Debt Yield: | | 9.5% |
The table below presents certain information relating to comparable sales pertaining to the Artthaus Studios Property identified by the appraiser:
Comparable Sales(1)
Property Name Property Address | Location | Year Built/Renovated | Rentable Area (SF) | Sale Date | Sale Price | Sale Price
(PSF) |
Fremont Research Center 47513-47533 Westinghouse Drive | Fremont, CA | 1983/1997 | 215,733 | Jun-2021 | $59,250,000 | $275 |
| | | | | | | |
111 Broadway 111 Broadway | Oakland, CA | 1966/NAP | 10,489 | Mar-2020 | $3,600,000 | $343 |
| | | | | | | |
The Wakefield Building 426 17th Street | Oakland, CA | 1924/2001 | 56,678 | Feb-2020 | $29,900,000 | $528 |
| | | | | | | |
EmeryTech Centre 1400 65th Street | Emeryville, CA | 1940/2010 | 227,367 | Oct-2019 | $126,500,000 | $556 |
| | | | | | | |
1714-1720 Franklin Street 1714-1720 Franklin Street | Oakland, CA | 1926/1991 | 30,253 | Mar-2019 | $11,000,000 | $364 |
| (1) | Information obtained from the appraisal. |
The following table presents certain information relating to the appraiser’s market rent conclusions for the Artthaus Studios Property:
Comparable Office Leases(1)
| Property Name/Location | Year Built/
Renovated | Total GLA
(SF) | Tenant | Tenant
Size (SF) | Lease
Start
Date | Lease
Term | Annual
Base Rent
PSF | Lease
Type |
Artthaus Studios (Subject) 2744 East 11th Street Oakland, CA | 1917/2018-2020 | 104,802(2) | | | | | | |
330 Franklin Street Oakland, CA | 1926/NAP | 29,000 | Resource Development Associates | 3,832 | Nov-2021 | 5.0 Yrs. | $46.00 | Modified |
829 27th Avenue Oakland, CA | 1950/NAP | 15,611 | Confidential | 340 | Q2-2021 | 1.0 Yrs. | $29.80 | Modified |
106 Linden Street Oakland, CA | 1921/NAP | 125,078 | Studio Bondy Architecture | 4,011 | Mar-2021 | 5.0 Yrs. | $29.80 | Modified |
337 17th Street Oakland, CA | 1926/NAP | 24,100 | Noll and Tam | 419 | Mar-2021 | 3.0 Yrs. | $35.20 | Modified |
7303 Edgewater Drive Oakland, CA | 1973/NAP | 200,557 | Pureturgent | 6,254 | Mar-2021 | 3.0 Yrs. | $24.60 | Modified |
1154 57th Avenue Oakland, CA | 1967/NAP | 24,568 | VeoRide Inc. | 3,323 | Dec-2020 | 2.0 Yrs. | $29.40 | Modified |
| (1) | Information obtained from the appraisal. |
| (2) | Information obtained from the underwritten rent roll. |
Escrows.
Real Estate Taxes – The Artthaus Studios Mortgage Loan documents require an upfront deposit of $49,925 and ongoing monthly real estate tax reserves in an amount equal to one-twelfth of the real estate taxes that the lender estimates will be payable during the next twelve months, initially estimated at $9,985.
THE INFORMATION IN THIS COLLATERAL TERM SHEET IS NOT COMPLETE AND MAY BE AMENDED PRIOR TO THE TIME OF SALE. THIS TERM SHEET IS NOT AN OFFER TO SELL THESE SECURITIES AND IT IS NOT A SOLICITATION OF AN OFFER TO BUY THESE SECURITIES IN ANY JURISDICTION WHERE THE OFFER OR SALE IS NOT PERMITTED.
45
| Office - Flex | Loan #4 | Cut-off Date Balance: | | $23,750,000 |
| 2744 East 11th Street | Artthaus Studios | Cut-off Date LTV: | | 50.4% |
| Oakland, CA 94601 | | UW NCF DSCR: | | 2.34x |
| | | UW NOI Debt Yield: | | 9.5% |
Insurance – The Artthaus Studios Mortgage Loan documents require an upfront deposit of $20,580 and ongoing monthly insurance reserves in an amount equal to one-twelfth of the insurance premiums that the lender estimates will be payable for the renewal of the coverage afforded by the policies upon the expiration, initially estimated at $5,145.
Replacement Reserve – The Artthaus Studios Mortgage Loan documents require an ongoing monthly replacement reserve deposit of $1,747, capped at $70,000.
Leasing Reserve – The Artthaus Studios Mortgage Loan documents require an upfront deposit of $500,000 and springing ongoing monthly leasing reserve deposits of $8,734 upon the balance falling below the $430,000 cap.
Rent Concession Reserve – The Artthaus Studios Mortgage Loan documents require an upfront reserve of $522,540 for outstanding rent abatements related to 22 tenants.
Lockbox and Cash Management. The Artthaus Studios Mortgage Loan is structured with a soft lockbox and springing cash management. The borrower and property manager are required to deposit all rent into an established deposit account each business day. Upon the occurrence of a Cash Trap Event Period (defined below), all amounts available in the deposit account will be transferred to a cash management account controlled by the lender on each business day, and applied in accordance with the cash flow waterfall in the cash management agreement. During the continuance of a Cash Trap Event Period, all excess cash flow will be held by the lender as additional collateral.
A “Cash Trap Event Period” will commence upon the earlier of the following:
| (i) | the occurrence of an event of default; or |
| (ii) | the net cash flow debt yield falling below 7.0%. |
A Cash Trap Event Period will end upon the occurrence of the following:
| ● | with regard to clause (i), the cure of such event of default; or |
| ● | with regard to clause (ii), the net cash flow debt yield being equal to or greater than 7.25% for two consecutive calendar quarters. |
Property Management. The Artthaus Studios Property is managed by Best Bay Apartments, Inc., an affiliate of the borrowers.
Partial Release. Not permitted.
Real Estate Substitution. Not permitted.
Subordinate and Mezzanine Indebtedness. In connection with a bona fide sale of the Artthaus Studios Property, certain direct or indirect owners of the borrower may obtain future mezzanine debt upon satisfaction of certain conditions defined in the loan agreement, including, but not limited to: (i) the LTV including the future mezzanine loan is not greater than 60.0%; (ii) the adjusted net cash flow DSCR, inclusive of the future mezzanine loan is no less than 1.45x; (iii) the adjusted net cash flow debt yield, inclusive of the future mezzanine loan is not less than 8.75%; (iv) the mezzanine lender shall be an institutional lender acceptable to lender; (v) an intercreditor agreement in form and substance acceptable to lender and any applicable rating agency; (vi) a rating agency confirmation with respect to the proposed mezzanine financing; and (vii) borrower shall thereafter be subject to hard cash management pursuant to the related cash management provisions of the loan documents.
Ground Lease. None.
Terrorism Insurance. The loan documents require that the “all risk” insurance policy required to be maintained by the borrowers provides coverage for terrorism in an amount equal to the full replacement cost of the Artthaus Studios Property, as well as business interruption insurance covering no less than the 12-month period following the occurrence of a casualty event, together with a 6-month extended period of indemnity.
THE INFORMATION IN THIS COLLATERAL TERM SHEET IS NOT COMPLETE AND MAY BE AMENDED PRIOR TO THE TIME OF SALE. THIS TERM SHEET IS NOT AN OFFER TO SELL THESE SECURITIES AND IT IS NOT A SOLICITATION OF AN OFFER TO BUY THESE SECURITIES IN ANY JURISDICTION WHERE THE OFFER OR SALE IS NOT PERMITTED.
46
| Office – Suburban | Loan #5 | Cut-off Date Balance: | | $21,000,000 |
| 1301 West Long Lake Road | Long Lake Crossing | Cut-off Date LTV: | | 58.0% |
| Troy, MI 48098 | | U/W NCF DSCR: | | 1.68x |
| | | U/W NOI Debt Yield: | | 11.1% |
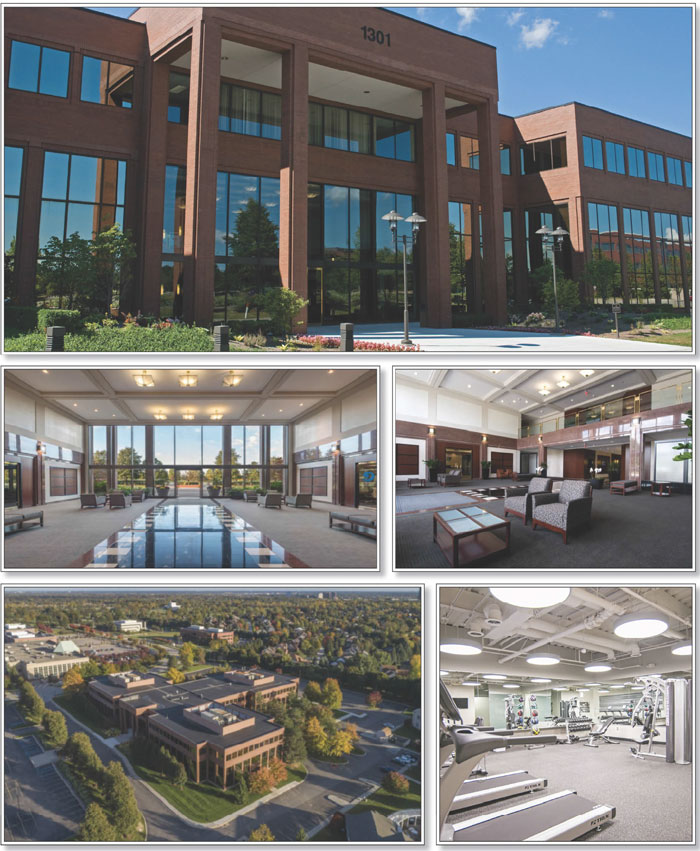
THE INFORMATION IN THIS COLLATERAL TERM SHEET IS NOT COMPLETE AND MAY BE AMENDED PRIOR TO THE TIME OF SALE. THIS TERM SHEET IS NOT AN OFFER TO SELL THESE SECURITIES AND IT IS NOT A SOLICITATION OF AN OFFER TO BUY THESE SECURITIES IN ANY JURISDICTION WHERE THE OFFER OR SALE IS NOT PERMITTED.
47
| No. 5 – Long Lake Crossing |
| |
| Mortgage Loan Information | | Mortgaged Property Information |
| Mortgage Loan Seller: | AREF | | Single Asset/Portfolio: | Single Asset |
Credit Assessment
(Fitch/KBRA/Moody’s): | NR/NR/NR | | Property Type – Subtype: | Office – Suburban |
| Original Principal Balance: | $21,000,000 | | Location: | Troy, MI |
| Cut-off Date Balance: | $21,000,000 | | Size: | 171,994 SF |
| % of Initial Pool Balance: | 3.9% | | Cut-off Date Balance Per SF: | $122.10 |
| Loan Purpose: | Acquisition | | Maturity Date Balance Per SF: | $122.10 |
| Borrower Sponsor: | Moshe Rothman | | Year Built/Renovated: | 1987/NAP |
| Guarantor: | Moshe Rothman | | Title Vesting: | Fee |
| Mortgage Rate: | 6.1100% | | Property Manager: | Transwestern Property Company Michigan, L.L.C. |
| Note Date: | February 17, 2022 | | Current Occupancy (As of): | 82.7% (2/7/2022) |
| Seasoning: | 1 month | | YE 2021 Occupancy: | 85.0% |
| Maturity Date: | March 6, 2027 | | YE 2020 Occupancy: | 88.0% |
| IO Period: | 60 months | | YE 2019 Occupancy: | 90.0% |
| Loan Term (Original): | 60 months | | As-Is Appraised Value: | $36,200,000 |
| Amortization Term (Original): | NAP | | As-Is Appraised Value Per SF: | $210.47 |
| Loan Amortization Type: | Interest Only | | As-Is Appraisal Valuation Date: | December 9, 2021 |
| Call Protection: | L(25),D(28),O(7) | | | |
| Lockbox Type(1): | Hard/In Place Cash Management | | | |
| Additional Debt: | None | | | |
| Additional Debt Type (Balance): | NAP | | Underwriting and Financial Information(3) |
| | | | TTM NOI (10/31/2021): | $2,327,716 |
| | | | YE 2020 NOI: | $2,427,973 |
| | | | YE 2019 NOI: | $2,405,546 |
| | | | U/W Revenues: | $3,515,383 |
| | | | U/W Expenses: | $1,178,584 |
| Escrows and Reserves(2) | | U/W NOI: | $2,336,798 |
| | Initial | Monthly | Cap | | U/W NCF: | $2,180,405 |
| Taxes | $157,068 | $31,414 | NAP | | U/W DSCR based on NOI/NCF: | 1.80x / 1.68x |
| Insurance | $8,968 | $2,989 | NAP | | U/W Debt Yield based on NOI/NCF: | 11.1% / 10.4% |
| TI/LC Reserve | $500,000 | $14,333 | NAP | | U/W Debt Yield at Maturity based on NOI/NCF: | 11.1% / 10.4% |
| Replacement Reserve | $0 | $2,867 | NAP | | Cut-off Date LTV Ratio: | 58.0% |
| Outstanding TI/LC | $77,723 | $0 | NAP | | LTV Ratio at Maturity: | 58.0% |
| Rent Abatement Reserve | $14,138 | $0 | NAP | | | |
| | | | | | | | |
| Sources and Uses |
| Sources | | | | | Uses | | | |
| Original loan amount | $21,000,000 | | 56.7% | | Purchase Price | $35,200,000 | | 95.1% |
| Equity contribution | 16,017,804 | | 43.3 | | Closing costs | 1,059,908 | | 2.9 |
| | | | | | Upfront reserves | 757,896 | | 2.0 |
| Total Sources | $37,017,804 | | 100.0% | | Total Uses | $37,017,804 | | 100.0% |
| (1) | As of the origination date, the Long Lake Crossing Mortgage Loan (as defined below) was in a Cash Management Period (as defined below). The initial Cash Management Period will cease when the debt yield is at least 10.0% for two consecutive calendar quarters, the Long Lake Crossing Property (as defined below) has achieved a physical occupancy of 83% in accordance with the Long Lake Crossing Mortgage Loan documents for two consecutive calendar quarters, Hearst Business Publishing, Inc. has extended its lease for a period of at least five years in accordance with the Long Lake Crossing Mortgage Loan documents, and no event of default has occurred. See “Lockbox and Cash Management” section below. |
| (2) | See “Escrows” section below. |
| (3) | While the Long Lake Crossing Mortgage Loan was originated after the emergence of the novel coronavirus pandemic and the economic disruption resulting from measures to combat the pandemic, the pandemic is an evolving situation and could impact the Long Lake Crossing Mortgage Loan more severely than assumed in the underwriting and could adversely affect the NOI, NCF and occupancy information, as well as the appraised value and the DSCR, LTV and Debt Yield metrics presented above. See “Risk Factors—Risks Related to Market Conditions and Other External Factors—Coronavirus Pandemic Has Adversely Affected the Global Economy and Will Likely Adversely Affect the Performance of the Mortgage Loans” in the Preliminary Prospectus. |
The Mortgage Loan. The mortgage loan (the “Long Lake Crossing Mortgage Loan”) is evidenced by a first mortgage encumbering the fee interest in a 171,994 square foot suburban office building located in Troy, Michigan (the “Long Lake Crossing Property”). Proceeds from the Long Lake Crossing Mortgage Loan were used to facilitate the acquisition of the Long Lake Crossing Property, fund reserve accounts, and pay closing costs.
THE INFORMATION IN THIS COLLATERAL TERM SHEET IS NOT COMPLETE AND MAY BE AMENDED PRIOR TO THE TIME OF SALE. THIS TERM SHEET IS NOT AN OFFER TO SELL THESE SECURITIES AND IT IS NOT A SOLICITATION OF AN OFFER TO BUY THESE SECURITIES IN ANY JURISDICTION WHERE THE OFFER OR SALE IS NOT PERMITTED.
48
| Office – Suburban | Loan #5 | Cut-off Date Balance: | | $21,000,000 |
| 1301 West Long Lake Road | Long Lake Crossing | Cut-off Date LTV: | | 58.0% |
| Troy, MI 48098 | | U/W NCF DSCR: | | 1.68x |
| | | U/W NOI Debt Yield: | | 11.1% |
The Borrower and Borrower Sponsor. The borrowing entity for the Long Lake Crossing Mortgage Loan is AEVRI Long Lake LLC (the “Long Lake Crossing Borrower”), a single-purpose Delaware limited liability company. Legal counsel to the borrowers delivered a non-consolidation opinion in connection with the origination of the Long Lake Crossing Mortgage Loan.
The borrower sponsor and non-recourse carve-out guarantor is Moshe Rothman who provided a partial payment guaranty in the amount of $2,500,000 for the Long Lake Crossing Mortgage Loan. Moshe Rothman is a New York based owner, operator and investor that has been active in commercial real estate since 2017. Moshe Rothman’s portfolio is valued at approximately $490 million and consists of multifamily and office assets located throughout New York, New Jersey, Connecticut, Ohio, Michigan, Illinois, Texas, Mississippi, Tennessee, Alabama, Louisiana, Minnesota and Wisconsin. Moshe Rothman owns seven office buildings totaling approximately 1.5 million square feet. Moshe Rothman currently owns one single tenant, approximately 130,000 SF office property that was acquired in 2020, approximately 20 miles southeast of the subject in Warren, Michigan.
The Property. The Long Lake Crossing Property is an office building totaling 171,994 rentable square feet located in Troy, Michigan, approximately 23.5 miles north of downtown Detroit. Situated on a 11.5-acre lot, the Long Lake Crossing Property is a LEED certified, three-story building with a basement level and was built in 1987. The Long Lake Crossing Property features on-site amenities consisting of a café, fitness center, and conference room. The previous owner invested approximately $2.1 million in capital expenditures including $685,000 in common areas and amenities during their ownership period. There are a total of 655 surface parking spaces and 48 garage spaces at the Long Lake Crossing Property, resulting in a parking ratio of 4.1 spaces per 1,000 square feet.
Current in-place tenants at the Long Lake Crossing Property have an average tenure of over ten years, with the top five largest tenants having an average tenure of over 17 years. Approximately 57% of current tenants are headquartered at the Long Lake Crossing Property. Since the beginning of 2020, nine new, expansion, or renewal leases have been executed occupying 42,245 SF (24.6% of NRA). Average occupancy at the Long Lake Crossing Property since 2012 is 89.5%. as of February 7, 2022, the Long Lake Crossing Property was 82.7% occupied by 24 tenants.
Major Tenants.
Largest Tenant: Hearst Business Publishing, Inc. (36,132 square feet, 21.0% of net rentable area, 23.2% of underwritten base rent; 3/31/2024 lease expiration) – The space is occupied by the Motor Information Systems Division of Hearst Business Publishing, Inc. Hearst Business Publishing, Inc. is one of the business lines for Hearst, a global, diversified media, information and services company with more than 360 businesses. Motor Information Systems is the premier supplier of automotive repair data in the U.S. and Canada. Founded in 1903, Motor Information Systems provides unique data points, covering vehicles Class 1 through Class 8, with many delivery options. Vehicle data sourcing and integration solutions are standardized and designed to reduce channel partners’ costs and improve efficiencies. Hearst’s Motor Information Systems Division has been headquartered at the Long Lake Crossing Property since November 2008. Hearst Business Publishing, Inc. has two, five-year renewal options remaining which requires written notice at least 12 months and not more than 15 months prior to the expiration of the then current term of the lease.
2nd Largest Tenant: Gordon Advisors (16,434 square feet, 9.6% of net rentable area, 13.2% of underwritten base rent; 9/30/2024 lease expiration) – Gordon Advisors is one of Southeast Michigan’s leading public accounting and business consulting firms. For over 60 years, Gordon Advisors has offered a full complement of services to clients such as business, financial, and tax consulting as well as accounting and auditing. Gordon Advisors has been headquartered at the Long Lake Crossing Property since September 1990 when it commenced a 10-year lease for 8,169 square feet. Gordon Advisors subsequently expanded its premise to 16,434 square feet via multiple expansion leases. The most recent renewal and expansion lease commenced July 2016 and expires in September 2024. Gordon Advisors has two, five-year renewal options remaining which requires written notice not less than 270 days prior to the expiration date or last day of the first renewal term.
3rd Largest Tenant: The Ayco Company (10,363 square feet, 6.0% of net rentable area, 7.5% of underwritten base rent; 2/28/2027 lease expiration) – The Ayco Company provides services to employers to help them create company-sponsored financial planning benefits. The Ayco Company has been in business for over 50 years and was acquired by The Goldman Sachs Group, Inc. in 2003. The Ayco Company has been a tenant at the Long Lake Crossing Property since July 2011 when it commenced a 98-month lease. The most recent renewal commenced in November 2021 and expires in February 2027. The Ayco Company has two, five-year renewal options remaining. At any time on or prior to February 29, 2024, The Ayco Company may elect to terminate its lease effective as of February 28, 2025, by providing written notice to landlord and a termination fee consisting of three months of then current base rent and expense recoveries plus unamortized landlord costs.
THE INFORMATION IN THIS COLLATERAL TERM SHEET IS NOT COMPLETE AND MAY BE AMENDED PRIOR TO THE TIME OF SALE. THIS TERM SHEET IS NOT AN OFFER TO SELL THESE SECURITIES AND IT IS NOT A SOLICITATION OF AN OFFER TO BUY THESE SECURITIES IN ANY JURISDICTION WHERE THE OFFER OR SALE IS NOT PERMITTED.
49
| Office – Suburban | Loan #5 | Cut-off Date Balance: | | $21,000,000 |
| 1301 West Long Lake Road | Long Lake Crossing | Cut-off Date LTV: | | 58.0% |
| Troy, MI 48098 | | U/W NCF DSCR: | | 1.68x |
| | | U/W NOI Debt Yield: | | 11.1% |
The following table presents certain information relating to the tenancy at the Long Lake Crossing Property:
Major Tenants
| Tenant Name | Credit Rating (Fitch/
Moody’s/
S&P)(1) | Tenant
NRSF | % of
NRSF | Annual
U/W Base
Rent PSF(2) | Annual
U/W Base
Rent(3) | % of
Total
Annual
U/W
Base
Rent | Lease
Expiration | Extension
Options | Term.
Option
(Y/N) |
| Hearst Business Publishing, Inc. | NR / NR / NR | 36,132 | 21.0% | $20.08 | $725,688 | 23.2% | 3/31/2024 | 2, 5-year | N |
| Gordon Advisors | NR / NR / NR | 16,434 | 9.6% | $25.00 | $410,850 | 13.2% | 9/30/2024 | 2, 5-year | N |
| The Ayco Company(4) | A / A2 / BBB+ | 10,363 | 6.0% | $22.50 | $233,168 | 7.5% | 2/28/2027 | 2, 5-year | Y |
| Frasco Caponigro Wineman | NR / NR / NR | 8,647 | 5.0% | $23.75 | $205,366 | 6.6% | 10/31/2025 | 1, 5-year | N |
| Barron, Rosenberg, Mayoras | NR / NR / NR | 8,010 | 4.7% | $21.00 | $168,210 | 5.4% | 10/31/2028 | 1, 5-year | N |
| Brazen, Kennelly, Cooper & Mat | NR / NR / NR | 7,719 | 4.5% | $23.50 | $181,397 | 5.8% | 9/30/2024 | None | N |
| Information Builders | NR / NR / NR | 6,076 | 3.5% | $23.50 | $142,786 | 4.6% | 2/28/2025 | None | N |
| AP Plassman | NR / NR / NR | 4,553 | 2.6% | $24.50 | $111,549 | 3.6% | 7/31/2023 | 1, 5-year | N |
| William Mack & Associates | NR / NR / NR | 4,396 | 2.6% | $23.50 | $103,306 | 3.3% | 12/31/2028 | 1, 5-year | N |
| Standard Insurance Company | NR / NR / NR | 4,217 | 2.5% | $23.50 | $99,100 | 3.2% | 9/30/2024 | None | N |
| Total Major Tenant | | 106,547 | 61.9% | $22.35 | $2,381,418 | 76.2% | | | |
| Other Tenants | | 35,766 | 20.8% | $20.76 | $742,337 | 23.8% | | | |
| Vacant Space | | 29,681 | 17.3% | $0.00 | $0 | 0.0% | | | |
| Collateral Total | | 171,994 | 100.0% | $21.95 | $3,123,756 | 100.0% | | | |
| | | | | | | | | | |
| (1) | Certain ratings are those of the parent company, regardless of whether or not the parent guarantees the lease. |
| (2) | Collateral Total Annual U/W Base Rent PSF excludes SF of vacant space. |
| (3) | Based on the underwritten rent roll dated February 7, 2022, including rent steps occurring through December 2022. |
| (4) | At any time on or prior to February 29, 2024, The Ayco Company may elect to terminate its lease effective as of February 28, 2025, by providing written notice to landlord and a termination fee consisting of three months of then current base rent and expense recoveries plus unamortized landlord costs. |
The following table presents certain information relating to the lease rollover schedule at the Long Lake Crossing Property:
Lease Expiration Schedule(1)(2)(3)
Year Ending
December 31, | No.
of Leases
Expiring | Expiring
NRSF | % of
Total
NRSF | Cumulative
Expiring
NRSF | Cumulative
% of Total
NRSF | Annual
U/W
Base Rent(4) | % of Total
Annual U/W
Base Rent(4) | Annual U/W
Base Rent
PSF(4)(5) |
| MTM(6) | 5 | 7,072 | 4.1% | 7,072 | 4.1% | $52,279 | 1.7% | $7.39 |
| 2022 | 2 | 3,411 | 2.0% | 10,483 | 6.1% | $92,368 | 3.0% | $27.08 |
| 2023 | 4 | 10,424 | 6.1% | 20,907 | 12.2% | $257,698 | 8.2% | $24.72 |
| 2024 | 7 | 71,717 | 41.7% | 92,624 | 53.9% | $1,589,129 | 50.9% | $22.16 |
| 2025 | 5 | 22,436 | 13.0% | 115,060 | 66.9% | $529,408 | 16.9% | $23.60 |
| 2026 | 1 | 1,791 | 1.0% | 116,851 | 67.9% | $42,984 | 1.4% | $24.00 |
| 2027 | 1 | 10,363 | 6.0% | 127,214 | 74.0% | $233,168 | 7.5% | $22.50 |
| 2028 | 2 | 12,406 | 7.2% | 139,620 | 81.2% | $271,516 | 8.7% | $21.89 |
| 2029 | 1 | 2,693 | 1.6% | 142,313 | 82.7% | $55,207 | 1.8% | $20.50 |
| 2030 | 0 | 0 | 0.0% | 142,313 | 82.7% | $0 | 0.0% | $0.00 |
| 2031 | 0 | 0 | 0.0% | 142,313 | 82.7% | $0 | 0.0% | $0.00 |
| 2032 | 0 | 0 | 0.0% | 142,313 | 82.7% | $0 | 0.0% | $0.00 |
| Thereafter | 0 | 0 | 0.0% | 142,313 | 82.7% | $0 | 0.0% | $0.00 |
| Vacant | 0 | 29,681 | 17.3% | 171,994 | 100.0% | $0 | 0.0% | $0.00 |
| Total/Weighted Average | 28 | 171,994 | 100.0% | | | $3,123,756 | 100.0% | $21.95 |
| (1) | Based on the underwritten rent roll dated February 7, 2022. |
| (2) | Certain tenants may have lease termination options that are exercisable prior to the originally stated expiration date that are not reflected in the Lease Expiration Schedule. |
| (3) | The Long Lake Crossing Mortgage Loan has a maturity date of March 6, 2027. |
| (4) | Includes rent steps occurring through December 2022. |
| (5) | Total/Weighted Average Annual U/W Base Rent PSF excludes vacant space. |
| (6) | Includes 4,571 square feet of amenity space consisting of a café, conference room, and fitness center, one 228 square foot storage space, and one 2,273 square feet tenant which is on a month-to-month lease. |
THE INFORMATION IN THIS COLLATERAL TERM SHEET IS NOT COMPLETE AND MAY BE AMENDED PRIOR TO THE TIME OF SALE. THIS TERM SHEET IS NOT AN OFFER TO SELL THESE SECURITIES AND IT IS NOT A SOLICITATION OF AN OFFER TO BUY THESE SECURITIES IN ANY JURISDICTION WHERE THE OFFER OR SALE IS NOT PERMITTED.
50
| Office – Suburban | Loan #5 | Cut-off Date Balance: | | $21,000,000 |
| 1301 West Long Lake Road | Long Lake Crossing | Cut-off Date LTV: | | 58.0% |
| Troy, MI 48098 | | U/W NCF DSCR: | | 1.68x |
| | | U/W NOI Debt Yield: | | 11.1% |
The following table presents historical occupancy percentages at the Long Lake Crossing Property:
Historical Occupancy
12/31/2019(1) | 12/31/2020(1) | 12/31/2021(1) | 2/7/2022(2) |
| 90.0% | 88.0% | 85.0% | 82.7% |
| (1) | Information obtained from the Long Lake Crossing Borrower. |
| (2) | Information obtained from the underwritten rent roll. |
COVID-19 Update. As of March 9, 2022, the Long Lake Crossing Property was open and operating. Based on an account receivables report provided by the borrower sponsor dated January 31, 2022, approximately $2,632 consisting primarily of CAM reimbursements were over 30 days delinquent and $4,304 was over 60 days delinquent, representing a collection rate of 99.1% and 98.6% of underwritten gross rent for December 2021 and January 2022, respectively. The Long Lake Crossing Mortgage Loan has a first payment date of April 6, 2022 and is not subject to any modification or forbearance request as of March 9, 2022.
Operating History and Underwritten Net Cash Flow. The following table presents certain information relating to the operating history and underwritten net cash flow at the Long Lake Crossing Property:
Cash Flow Analysis
| | 2019 | 2020 | TTM
10/31/2021 | U/W | %(1) | U/W $ PSF |
| Base Rent | $3,133,098 | $3,075,978 | $3,035,833 | $3,069,471 | 72.3% | $17.85 |
| Contractual Rent Steps(2) | 0 | 0 | 0 | 54,285 | 1.3 | 0.32 |
| Grossed Up Vacant Space | 0 | 0 | 0 | 730,696 | 17.2 | 4.25 |
| Total Recoveries | 328,944 | 342,629 | 330,557 | 298,476 | 7.0 | 1.74 |
| Gross Potential Rent | $3,462,042 | $3,418,607 | $3,366,390 | $4,152,928 | 97.8% | $24.15 |
| Other Income(3) | 90,548 | 106,134 | 93,151 | 93,151 | 2.2 | 0.54 |
| Net Rental Income | $3,552,590 | $3,524,741 | $3,459,541 | $4,246,079 | 100.0% | $24.69 |
| (Vacancy & Credit Loss)(4) | 0 | 0 | 0 | (730,696) | (17.6) | (4.25) |
| Effective Gross Income | $3,552,590 | $3,524,741 | $3,459,541 | $3,515,383 | 82.8% | $20.44 |
| | | | | | | |
| Real Estate Taxes | 366,650 | 372,136 | 375,696 | 377,717 | 10.7 | 2.20 |
| Insurance | 48,171 | 43,556 | 44,700 | 35,871 | 1.0 | 0.21 |
| Management Fee | 53,289 | 52,871 | 51,894 | 105,461 | 3.0 | 0.61 |
| Other Operating Expenses | 678,934 | 628,205 | 659,535 | 659,535 | 18.8 | 3.83 |
| Total Operating Expenses | $1,147,044 | $1,096,768 | $1,131,825 | $1,178,584 | 33.5% | $6.85 |
| | | | | | | |
| Net Operating Income | $2,405,546 | $2,427,973 | $2,327,716 | $2,336,798 | 66.5% | $13.59 |
| Replacement Reserves | 0 | 0 | 0 | 34,399 | 1.0 | 0.20 |
| TI/LC(5) | 0 | 0 | 0 | 121,994 | 3.5 | 0.71 |
| Net Cash Flow | $2,405,546 | $2,427,973 | $2,327,716 | $2,180,405 | 62.0% | $12.68 |
| | | | | | | |
| NOI DSCR | 1.85x | 1.87x | 1.79x | 1.80x | | |
| NCF DSCR | 1.85x | 1.87x | 1.79x | 1.68x | | |
| NOI Debt Yield | 11.5% | 11.6% | 11.1% | 11.1% | | |
| NCF Debt Yield | 11.5% | 11.6% | 11.1% | 10.4% | | |
| (1) | Represents (i) percent of Net Rental Income for all revenue fields, (ii) percent of Gross Potential Rent for Vacancy & Credit Loss and (iii) percent of Effective Gross Income for all other fields. |
| (2) | Annual U/W Base Rent includes contractual rent increases occurring through December 2022. |
| (3) | Other Income includes revenue from parking, storage, and other miscellaneous income. |
| (4) | Underwritten economic occupancy is 82.4%. The Long Lake Crossing Property was 82.7% leased as of February 7, 2022. |
| (5) | UW TI/LC including a $50,000 credit to account for the upfront TI/LC reserve of $500,000. |
Appraisal. The appraiser concluded to an “As-Is” value of $36,200,000 as of December 9, 2021.
Environmental Matters. According to the Phase I environmental site assessment dated December 21, 2021, there are no Recognized, Controlled Recognized, or Historical Recognized Environmental Conditions at the Long Lake Crossing Property.
Market Overview and Competition. The Long Lake Crossing Property is located in the city of Troy, within Oakland County, Michigan and is part of the Detroit Metropolitan Statistical Area (“MSA”). Primary access to the Long Lake Crossing Property is provided by Interstate 75, a multiple lane highway which is located less than one mile from the Long Lake Crossing Property. The neighborhood has an established transportation network that provides access to major highways. The neighborhood surrounding the Long Lake
THE INFORMATION IN THIS COLLATERAL TERM SHEET IS NOT COMPLETE AND MAY BE AMENDED PRIOR TO THE TIME OF SALE. THIS TERM SHEET IS NOT AN OFFER TO SELL THESE SECURITIES AND IT IS NOT A SOLICITATION OF AN OFFER TO BUY THESE SECURITIES IN ANY JURISDICTION WHERE THE OFFER OR SALE IS NOT PERMITTED.
51
| Office – Suburban | Loan #5 | Cut-off Date Balance: | | $21,000,000 |
| 1301 West Long Lake Road | Long Lake Crossing | Cut-off Date LTV: | | 58.0% |
| Troy, MI 48098 | | U/W NCF DSCR: | | 1.68x |
| | | U/W NOI Debt Yield: | | 11.1% |
Crossing Property is primarily made up of office and single-family residential uses, with a limited supply of land available for future development. Top five employers in the Detroit MSA include Ford Motor Company, FCA US, LLC, University of Michigan General Motors, and Beaumont Health System. The estimated 2021 population within a half-, one-, and two-mile radius of the Long Lake Crossing Property was 1,493, 6,473, and 26,817, respectively. The estimated 2021 median household income within a half-, one-, and two-mile radius of the Long Lake Crossing Property was $143,147, $128,631, and $127,897, respectively.
According to the appraisal, the Long Lake Crossing Property’s primary office market, a three-mile radius surrounding the Long Lake Crossing Property, had a vacancy rate of 20.2% (which includes both leased and owner-occupied properties) as of 2021, with average rents of $20.23 PSF. Total inventory in the primary market was 15,482,863 as of 2021, with no new inventory having been built since 2018. The appraiser concluded to a market rent of $22.50 PSF modified gross and a vacancy rate of 18.0% for the Long Lake Crossing Property.
The table below presents certain information relating to comparable sales pertaining to the Long Lake Crossing Property identified by the appraiser:
Comparable Sales(1)
| Property Name | Location | Rentable Area (SF) | Year Built (Renovated) | Sale Date | Actual Sale Price | Sale Price (PSF) | Cap Rate |
| 5440 Corporate | Troy, MI | 90,759 | 2000 | Jul-21 | $10,900,000 | $120 | 7.8% |
| Stoneridge II | Bloomfield Hills, MI | 110,544 | 1984 | Oct-17 | $16,500,000 | $149 | NAV |
| Franklin Pointe | Southfield, MI | 85,200 | 1985 | May-18 | $16,200,000 | $190 | 7.9% |
| Troy Technology | Troy, MI | 83,822 | 1985 | Sep-20 | $14,667,104 | $175 | 6.0% |
| (1) | Information obtained from the appraisal. |
The following tables present certain information relating to comparable office leases for the Long Lake Crossing Property:
Comparable Office Leases(1)
| Property Name/Location | Year Built | Lease Size (SF) | Lease Start Date | Annual Base Rent PSF | Lease Term (Yrs) | Lease Type |
| 1441 W. Long Lake | 2000 | 1,490 | Aug-18 | $22.50 | 5.0 | Modified Gross |
| Troy, MI |
| 1441 W. Long Lake | 2000 | 24,562 | Jul-18 | $22.03 | 5.0 | Modified Gross |
| Troy, MI |
| 1050 Wilshire Drive | 1986 | 5,641 | Sep-19 | $21.50 | 3.0 | Modified Gross |
| Troy, MI |
| 5435 Corporate Drive | 1989 | 34,287 | Jul-20 | $21.00 | 10.0 | Modified Gross |
| Troy, MI |
| 1450 W. Long Lake | 1990 | 13,285 | Mar-20 | $20.50 | 10.6 | Modified Gross |
| Troy, MI |
| (1) | Information obtained from the appraisal. |
Escrows.
Real Estate Taxes - The loan documents require an upfront real estate tax reserve of $157,068 and ongoing monthly real estate tax reserves in an amount equal to one-twelfth of the real estate taxes that the lender estimates will be payable during the next 12 months (initially $31,414).
Insurance - The loan documents require an upfront insurance reserve of $8,968 and ongoing monthly insurance reserves in an amount equal to one-twelfth of the insurance premiums that the lender estimates will be payable for the renewal of the coverage afforded by the policies upon the expiration thereof (initially $2,989).
Replacement Reserve - The loan documents require ongoing monthly replacement reserves of $2,867.
TI/LC Reserve - The loan documents require an upfront general TI/LC reserve of $500,000 and ongoing monthly TI/LC reserves of $14,333.
Outstanding TI/LC Reserve – The loan documents require an upfront reserve of $77,723 for the cost of tenant improvements owed to The Ayco Company per the renewal lease dated February 2021.
THE INFORMATION IN THIS COLLATERAL TERM SHEET IS NOT COMPLETE AND MAY BE AMENDED PRIOR TO THE TIME OF SALE. THIS TERM SHEET IS NOT AN OFFER TO SELL THESE SECURITIES AND IT IS NOT A SOLICITATION OF AN OFFER TO BUY THESE SECURITIES IN ANY JURISDICTION WHERE THE OFFER OR SALE IS NOT PERMITTED.
52
| Office – Suburban | Loan #5 | Cut-off Date Balance: | | $21,000,000 |
| 1301 West Long Lake Road | Long Lake Crossing | Cut-off Date LTV: | | 58.0% |
| Troy, MI 48098 | | U/W NCF DSCR: | | 1.68x |
| | | U/W NOI Debt Yield: | | 11.1% |
Rent Abatement Reserve – The loan documents require an upfront reserve of $14,138 for the free rent owed to Financial Services Group of Michigan in January, February, and March 2023.
Lockbox and Cash Management. The Long Lake Crossing Mortgage Loan is structured with a hard lockbox and in-place cash management. The Long Lake Crossing Borrower and property manager are required to direct the tenants to pay rent directly into such lockbox account, and to deposit any rents otherwise received in such account within one business day after receipt. If a Cash Management Period is continuing, the lender will establish a cash management account into which all funds in the lockbox account will be swept on a daily basis (provided, that if the cash management account is not open on the date that the first Cash Management Period commences, then such funds will, at the election of the lender, be swept into an account as directed by the lender or retained in the lockbox account, in either case, until such time that the cash management account is opened). During any Cash Management Period, all amounts deposited into the cash management account during the immediately preceding interest period will be applied on each monthly payment date in accordance with the cash management waterfall, with any excess funds disbursed in the following order: (A) until such time, if any, that the initial Cash Management Period has been cured in accordance with the Long Lake Crossing Mortgage Loan documents, as determined by the lender in its sole discretion, into the rollover reserve subaccount; (B) during the continuance of a Cash Management Period continuing solely as a result of a Trigger Lease Sweep Period (as defined below), into the special rollover reserve subaccount in accordance with the Long Lake Crossing Mortgage Loan documents; or (C) otherwise, into the cash collateral subaccount in accordance with the Long Lake Crossing Mortgage Loan documents, to be controlled by the lender and held as additional security for the Long Lake Crossing Mortgage Loan. As of the origination date, the Long Lake Crossing Mortgage Loan was in a Cash Management Period and the cash management account was not yet opened.
A “Cash Management Period” will commence upon the earlier of the following:
| (i) | the origination date of the Long Lake Crossing Mortgage Loan; |
| (ii) | the stated maturity date; |
| (iii) | a default or event of default; |
| (iv) | the DSCR is below 1.30x at the end of any calendar quarter; |
| (v) | the debt yield is below 9.0% at the end of any calendar quarter; or |
| (vi) | the commencement of a Trigger Lease Sweep Period. |
A Cash Management Period will end upon the occurrence of the following:
| ● | with respect to clause (i) above, the debt yield is at least 10.0% for two consecutive calendar quarters, at least 83% of the rentable square footage of the Long Lake Crossing Property is tenanted pursuant to executed leases with tenants that are in occupancy, open for business and paying full unabated rent under their respective leases for two consecutive calendar quarters, Hearst Business Publishing, Inc. has extended its lease for a period of at least five years in accordance with the Long Lake Crossing Mortgage Loan documents, and no event of default has occurred. |
| ● | with respect to clause (iii) above, such default or event of default has been cured and no other default or event of default has occurred; |
| ● | with respect to clause (iv) above, the Long Lake Crossing Property has achieved a DSCR of at least 1.40x for two consecutive calendar quarters; |
| ● | with respect to clause (v) above, the Long Lake Crossing Property has achieved a debt yield of at least 10.0% for two consecutive calendar quarters; |
| ● | with respect to clause (vi) above, such Trigger Lease Sweep Period has ended. |
A “Trigger Lease Sweep Period” will commence upon the occurrence of:
| (i) | the earlier of (a) the date that is twelve months prior to the end of the term of any Trigger Lease (as defined below) (including any renewal terms), or (b) the date the applicable tenant under a Trigger Lease actually gives notice of its intention not to renew or extend; |
| (ii) | the date required under a Trigger Lease by which the applicable tenant is required to give notice of its exercise of a renewal option (and such renewal has not been exercised) or the date that any tenant under a Trigger Lease gives notice of its intention not to renew or extend; |
| (iii) | any Trigger Lease (or any material portion thereof) is surrendered, cancelled or terminated prior to its then current expiration date or any tenant under a Trigger Lease gives notice of its intention to terminate, surrender or cancel its Trigger Lease (or any material portion thereof); |
| (iv) | any tenant under a Trigger Lease discontinues its business in any material portion of its premises (i.e., “goes dark”) or gives notice that it intends to do the same; |
| (v) | the occurrence and continuance (beyond any applicable notice and cure periods) of a default under any Trigger Lease by the applicable tenant; or |
| (vi) | any tenant under a Trigger Lease becomes subject to an insolvency proceeding. |
THE INFORMATION IN THIS COLLATERAL TERM SHEET IS NOT COMPLETE AND MAY BE AMENDED PRIOR TO THE TIME OF SALE. THIS TERM SHEET IS NOT AN OFFER TO SELL THESE SECURITIES AND IT IS NOT A SOLICITATION OF AN OFFER TO BUY THESE SECURITIES IN ANY JURISDICTION WHERE THE OFFER OR SALE IS NOT PERMITTED.
53
| Office – Suburban | Loan #5 | Cut-off Date Balance: | | $21,000,000 |
| 1301 West Long Lake Road | Long Lake Crossing | Cut-off Date LTV: | | 58.0% |
| Troy, MI 48098 | | U/W NCF DSCR: | | 1.68x |
| | | U/W NOI Debt Yield: | | 11.1% |
A Trigger Lease Sweep Period will end upon the earlier to occur of (a) the date on which the amount in the special rollover reserve account is sufficient to pay for all anticipated expenses in connection with re-leasing the Trigger Lease space that gave rise to the Trigger Lease Sweep Period, or (b) the occurrence of any of the following:
| ● | with respect to a Trigger Lease Sweep Period caused by a matter described in clauses (i), (ii), (iii) or (iv) above, upon the earlier to occur of (A) the date on which the tenant under the Trigger Lease irrevocably exercises its renewal or extension option with respect to all of the space demised under its Trigger Lease, and in the lender’s judgment, sufficient funds have been accumulated in the special rollover reserve (during the continuance of the subject Trigger Lease Sweep Period) to pay for all approved leasing expenses for such Trigger Lease and any other anticipated expenses in connection with such renewal or extension, or (B) the date on which all of the space demised under the subject Trigger Lease (or portion thereof) that gave rise to the subject Trigger Lease Sweep Period has been fully leased pursuant to a replacement lease or replacement leases approved by the lender, and entered into in accordance with the Long Lake Crossing Mortgage Loan documents, and all approved leasing expenses for such Trigger Lease (and any other expenses in connection with the re-tenanting of such space) have been paid in full; |
| ● | with regard to clause (v) above, the default under the Trigger Lease has been cured and no other default under a Trigger Lease has occurred for a period of six consecutive months following such cure; or |
| ● | with regard to clause (vi) above, the applicable insolvency proceeding has terminated and the applicable Trigger Lease has been affirmed, assumed or assigned in a manner satisfactory to the lender. |
A “Trigger Lease” means the Hearst Business Publishing, Inc. lease, the Gordon Advisors lease, and any other lease (leased by such tenant and/or its affiliates) that covers 10% or more of the rentable square feet at the Long Lake Crossing Property, or has a gross annual rent of 10% or more of the total annual rents at the Long Lake Crossing Property.
Property Management. The Long Lake Crossing Property is managed by Transwestern Property Company Michigan, L.L.C.
Partial Release. Not permitted.
Real Estate Substitution. Not permitted.
Subordinate and Mezzanine Indebtedness. Not permitted.
Ground Lease. None.
Terrorism Insurance. The loan documents require that the “all risk” insurance policy required to be maintained by the borrower provides coverage for terrorism in an amount equal to the full replacement cost of the Long Lake Crossing Property, as well as business interruption insurance covering no less than the 18-month period following the occurrence of a casualty event, together with a 6-month extended period of indemnity.
THE INFORMATION IN THIS COLLATERAL TERM SHEET IS NOT COMPLETE AND MAY BE AMENDED PRIOR TO THE TIME OF SALE. THIS TERM SHEET IS NOT AN OFFER TO SELL THESE SECURITIES AND IT IS NOT A SOLICITATION OF AN OFFER TO BUY THESE SECURITIES IN ANY JURISDICTION WHERE THE OFFER OR SALE IS NOT PERMITTED.
54
| Office - Suburban | Loan #6 | Cut-off Date Balance: | | $20,500,000 |
1655 and 1665 Palm Beach
Lakes Boulevard West Palm Beach, FL 33401 | Forum Office West Palm Beach | Cut-off Date LTV: | | 68.6% |
| | U/W NCF DSCR: | | 1.89x |
| | U/W NOI Debt Yield: | | 11.6% |
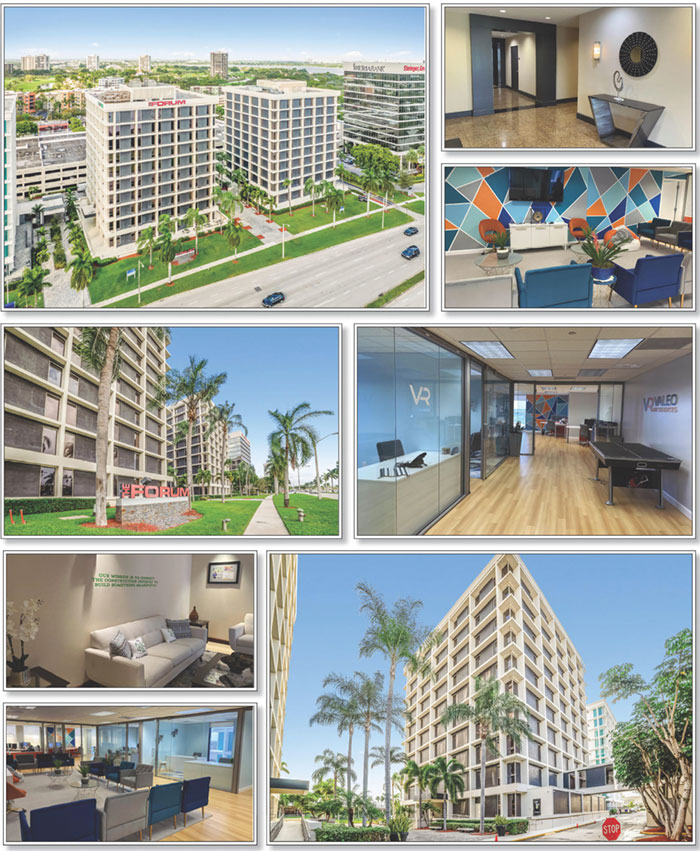
THE INFORMATION IN THIS COLLATERAL TERM SHEET IS NOT COMPLETE AND MAY BE AMENDED PRIOR TO THE TIME OF SALE. THIS TERM SHEET IS NOT AN OFFER TO SELL THESE SECURITIES AND IT IS NOT A SOLICITATION OF AN OFFER TO BUY THESE SECURITIES IN ANY JURISDICTION WHERE THE OFFER OR SALE IS NOT PERMITTED.
55
| No. 6 – Forum Office West Palm Beach |
| |
| Mortgage Loan Information | | Mortgaged Property Information |
| Mortgage Loan Seller: | LMF Commercial, LLC | | Single Asset/Portfolio: | Single Asset |
Credit Assessment (Fitch/KBRA/Moody’s): | NR/NR/NR | | Property Type – Subtype: | Office – Suburban |
| Original Principal Balance: | $20,500,000 | | Location: | West Palm Beach, FL |
| Cut-off Date Balance: | $20,500,000 | | Size: | 185,771 SF |
| % of Initial Pool Balance: | 3.9% | | Cut-off Date Balance Per SF: | $110.42 |
| Loan Purpose: | Acquisition | | Maturity Date Balance Per SF: | $100.36 |
| Borrower Sponsor: | Alfred N. Marulli Jr. | | Year Built/Renovated: | 1975/NAP |
| Guarantor: | Alfred N. Marulli Jr. | | Title Vesting: | Fee |
| Mortgage Rate: | 3.9800% | | Property Manager: | Amco Property Management, LLC d/b/a The David Associates (borrower-related) |
| Note Date: | January 28, 2022 | | Current Occupancy (As of): | 95.2% (3/8/2022) |
| Seasoning: | 2 months | | YE 2020 Occupancy: | 80.0% |
| Maturity Date: | February 6, 2032 | | YE 2019 Occupancy: | 84.0% |
| IO Period: | 60 months | | As-Is Appraised Value: | $29,900,000 |
| Loan Term (Original): | 120 months | | As-Is Appraised Value Per SF: | $161.06 |
| Amortization Term (Original): | 360 months | | As-Is Appraisal Valuation Date: | January 1, 2022 |
| Loan Amortization Type: | Interest Only, Amortizing Balloon | | | |
| Call Protection: | L(26),D(90),O(4) | | Underwriting and Financial Information(4) |
| Lockbox Type: | Springing | | TTM NOI (10/31/2021)(5): | $1,476,218 |
| Additional Debt: | No | | YE 2020 NOI: | $1,654,817 |
| Additional Debt Type (Balance): | NAP | | YE 2019 NOI: | $1,664,334 |
| | | | U/W Revenues: | $4,556,269 |
| | | | U/W Expenses: | $2,169,599 |
| Escrows and Reserves(1) | | U/W NOI(5): | $2,386,670 |
| | Initial | Monthly | Cap | | U/W NCF: | $2,215,398 |
| Taxes | $202,916 | $48,313 | NAP | | U/W DSCR based on NOI/NCF: | 2.04x / 1.89x |
| Insurance | $0 | Springing | NAP | | U/W Debt Yield based on NOI/NCF: | 11.6% / 10.8% |
| Replacement Reserve(2) | $0 | $3,094 | $74,260 | | U/W Debt Yield at Maturity based on NOI/NCF: | 12.8% / 11.9% |
| TI/LC Reserve(2) | $0 | $20,886 | $2,500,000 | | Cut-off Date LTV Ratio: | 68.6% |
| Free Rent Reserve(3) | $90,497 | $0 | NAP | | LTV Ratio at Maturity: | 62.3% |
| Debt Service Reserve | $160,557 | $0 | NAP | | | |
| | | | | | | | |
| Sources and Uses |
| Sources | | | | | Uses | | | |
| Original loan amount | $20,500,000 | | 67.1% | | Purchase Price | $29,250,000 | | 95.8% |
| Sponsor’s new loan contribution(2) | 10,030,501 | | 32.9 | | Closing Costs | 826,531 | | 2.7 |
| | | | | | Upfront Reserves | 453,970 | | 1.5 |
| Total Sources | $30,530,501 | | 100.0% | | Total Uses | $30,530,501 | | 100.0% |
| (1) | See “Escrows” section for a full description of Escrows and Reserves. |
| (2) | In lieu of upfront replacement reserves and TI/LC reserves, the Forum Office West Palm Beach Borrower (as defined below) posted a letter of credit in the amount of $2,574,260 allocated as follows: replacement reserves ($74,260) and TI/LC reserves ($2,500,000). |
| (3) | The free rent reserve relates to the following tenants: Mass Inbound, Alliance Law Firm, Ackerman Rodgers, Siegfried Rivera, Gen Media Partners, AMCO Management, and Pickett, Marshall O’Donnell, Naccarato. |
| (4) | While the Forum Office West Palm Beach Mortgage Loan (defined below) was originated after the emergence of the novel coronavirus pandemic and the economic disruption resulting from measures to combat the pandemic, the pandemic is an evolving situation and could impact the Forum Office West Palm Beach Mortgage Loan more severely than assumed in the underwriting and could adversely affect the NOI, NCF and occupancy information, as well as the appraised value and the DSCR, LTV and Debt Yield metrics presented above. See "Risk Factors-Risks Related to Market Conditions and Other External Factors-Coronavirus Pandemic Has Adversely Affected the Global Economy and Will Likely Adversely Affect the Performance of the Mortgage Loans" in the Preliminary Prospectus. |
| (5) | U/W NOI increased compared to TTM NOI (10/31/2021) is due to the fact that 16 tenants, including the largest tenant – Palm Beach County Sheriff’s Office, started their leases from July 2021 through April 2022 with total in-place base rents of approximately $1.6 million. |
The Mortgage Loan. The mortgage loan (the “Forum Office West Palm Beach Mortgage Loan”) is evidenced by a single promissory note secured by a first mortgage encumbering the fee interest in a 185,771 square foot office property located in West Palm Beach, Florida (the “Forum Office West Palm Beach Property”).
The Borrower and Borrower Sponsor. The borrower is comprised of four tenants-in-common: David Associates 101, LLC, David Associates 111, LLC, David Associates 125, LLC and David Associates 480-570, LLC (collectively, the “Forum Office West Palm Beach Borrower”), each a Delaware limited liability company and single purpose entity with one independent director. Legal counsel to the
THE INFORMATION IN THIS COLLATERAL TERM SHEET IS NOT COMPLETE AND MAY BE AMENDED PRIOR TO THE TIME OF SALE. THIS TERM SHEET IS NOT AN OFFER TO SELL THESE SECURITIES AND IT IS NOT A SOLICITATION OF AN OFFER TO BUY THESE SECURITIES IN ANY JURISDICTION WHERE THE OFFER OR SALE IS NOT PERMITTED.
56
| Office - Suburban | Loan #6 | Cut-off Date Balance: | | $20,500,000 |
1655 and 1665 Palm Beach
Lakes Boulevard West Palm Beach, FL 33401 | Forum Office West Palm Beach | Cut-off Date LTV: | | 68.6% |
| | U/W NCF DSCR: | | 1.89x |
| | U/W NOI Debt Yield: | | 11.6% |
Forum Office West Palm Beach Borrower delivered a non-consolidation opinion in connection with the origination of the Forum Office West Palm Beach Mortgage Loan. The nonrecourse carve-out guarantor and borrower sponsor of the Forum Office West Palm Beach Mortgage Loan is Alfred N. Marulli Jr.
Alfred N. Marulli Jr. is the chairman and chief executive officer of The David Associates (“TDA”). Founded in 1983, TDA is a real estate development firm with experience in leasing, property management, acquisitions, investment, development and construction. TDA has developed and acquired approximately 2.0 million square feet of office, retail and residential property in South Florida, the Carolinas and Connecticut. An affiliate of the borrower sponsor was a party to a prior foreclosure action. See “Description of the Mortgage Pool–Loan Purpose; Default History, Bankruptcy Issues and Other Proceedings” in the Preliminary Prospectus.
The Property. The Forum Office West Palm Beach Property consists of two, ten-story, multi-tenant office buildings (each a condominium unit) situated on a 3.6-acre site located in West Palm Beach, Florida. Built in 1975, the Forum Office West Palm Beach Property consists of 185,771 rentable square feet and, as of 2017, is part of a land condominium that includes the Forum Office West Palm Beach Property, a hotel condominium unit (non-collateral) and the common parking garage. The Forum Office West Palm Beach Borrower has access to 739 parking spaces in the common parking garage, resulting in a parking ratio of 3.98 per 1,000 square feet of net rentable area. As of March 8, 2022, the Forum Office West Palm Beach Property was 95.2% occupied by 46 regional and local tenants. Prior to 2017, the Forum Office West Palm Beach Property was comprised of three office towers and a four-story office garage. The land condominium was created in 2017, when Tower A (not part of the collateral) was sold and converted into a hotel. As part of the sale, each tower became one land condominium unit, and the parking garage became the limited common element. The Forum Office West Palm Beach Property is comprised of unit #2 and unit #3, which are Building B and Building C, respectively. The non-collateral hotel unit is unit #1 (building A). Each unit of the condominium has one vote.
Major Tenants.
Largest Tenant: Palm Beach County Sheriff’s Office (33,287 square feet, 17.9% of net rentable area; 17.9% of underwritten base rent; 8/31/2024 lease expiration for 24,648 square feet, and 9/30/2024 lease expiration for 8,639 square feet; Fitch/Moody’s/S&P: AAA/Aaa/AAA) – Established in 1909, the Palm Beach County Sheriff’s Office (“PBSO”) provides law enforcement, civil, and corrections services to Palm Beach County, the 3rd largest county in the State of Florida. As of fiscal year 2022, PBSO had an annual budget of approximately $788 million. PBSO has been a tenant at the Forum Office West Palm Beach Property since 2021 and currently occupies six suites under one lease within the Forum Office West Palm Beach Property and has two, five-year renewal options remaining. PBSO may terminate its lease in the event that funds are not appropriated or budgeted by the Palm Beach County Board of County Commissioners to PBSO in any fiscal year to pay rent and operating expenses associated with PBSO continuing obligations under its lease upon prompt written notice to the Forum Office West Palm Beach Borrower. The termination will be effective upon the expiration of the period of time for which funds were appropriated.
2nd Largest Tenant: Kane Financial Services (18,926 square feet, 10.2% of net rentable area; 10.2% of underwritten base rent; 2/28/2027 lease expiration) – Kane Financial Services is a finance broker based in Comber, North Ireland with over 35 years’ experience in providing tailor-made financial solutions. The firm specializes in providing financing to small businesses for company cars and private vehicles, commercial vehicles, industrial machinery, agricultural equipment, and plant equipment. In addition to asset financing, the firm also offers hire purchase agreements, asset lease agreements, and small business loans. Kane Financial Services was founded in 2009 as Airamid Health Services. Kane Financial Services has been a tenant at the Forum Office West Palm Beach Property since 2020 and currently occupies two suites within the Forum Office West Palm Beach Property under one lease and has one, five-year renewal option remaining and no termination options.
3rd Largest Tenant: PlanHub (18,651 square feet; 10.0% of net rentable area; 10.0% of underwritten base rent; 3/31/2027 lease expiration for 13,639 square feet, and 3/9/2027 lease expiration for 5,012 square feet) – Founded in 2009, PlanHub is a pre-construction bidding platform that allows general contractors, subcontractors and suppliers to collaborate on construction projects across the United States. PlanHub has been a tenant at the Forum Office West Palm Beach Property since 2013 and currently occupies three suites within the Forum Office West Palm Beach Property under one lease and has one, five-year renewal option remaining with no termination options. Provided no event of default has occurred, PlanHub has a right of first offer (“ROFO”) to lease any contiguous space in Building B, which encompasses any premises on the floors above the third and below the ninth floors based on the same terms and conditions at the then fair market value. PlanHub will have five business days to respond to the ROFO after receipt of the Forum Office West Palm Beach Borrower’s written notice.
COVID-19 Update. As of March 11, 2022, the Forum Office West Palm Beach Property is open and operating. As of March 11, 2022, the Forum Office West Palm Beach Mortgage Loan is not subject to any modification or forbearance agreement, and the Forum Office West Palm Beach Borrower has not requested any modification or forbearance to the Forum Office West Palm Beach Mortgage Loan terms.
THE INFORMATION IN THIS COLLATERAL TERM SHEET IS NOT COMPLETE AND MAY BE AMENDED PRIOR TO THE TIME OF SALE. THIS TERM SHEET IS NOT AN OFFER TO SELL THESE SECURITIES AND IT IS NOT A SOLICITATION OF AN OFFER TO BUY THESE SECURITIES IN ANY JURISDICTION WHERE THE OFFER OR SALE IS NOT PERMITTED.
57
| Office - Suburban | Loan #6 | Cut-off Date Balance: | | $20,500,000 |
1655 and 1665 Palm Beach
Lakes Boulevard West Palm Beach, FL 33401 | Forum Office West Palm Beach | Cut-off Date LTV: | | 68.6% |
| | U/W NCF DSCR: | | 1.89x |
| | U/W NOI Debt Yield: | | 11.6% |
The following table presents certain information relating to the tenancy at the Forum Office West Palm Beach Property:
Major Tenants
| Tenant Name | Credit Rating (Fitch/Moody’s/
S&P)(1) | Tenant NRSF | % of
NRSF | Annual U/W Base Rent PSF(2) | Annual
U/W Base Rent(2) | % of Total Annual U/W Base Rent | Lease
Expiration
Date | Extension Options | Termination Option (Y/N) |
| Major Tenants | | | | | | | | | |
| Palm Beach County Sheriff’s Office | AAA/Aaa/AAA | 33,287 | 17.9% | $24.75 | $823,853 | 18.1% | Various(3) | 2, 1-year | Y(4) |
| Kane Financial Services | NR/NR/NR | 18,926 | 10.2% | $23.00 | $435,298 | 4.8% | 2/28/2027 | 1, 5-year | N |
| PlanHub | NR/NR/NR | 18,651 | 10.0% | $24.52 | $457,323 | 10.0% | Various(5) | 1, 5-year | N |
| Father Flanagan’s Boys Town Florida | NR/NR/NR | 14,711 | 7.9% | $26.57 | $390,871 | 8.6% | 6/30/2027 | 1, 5-year | N |
| Gen Media Partners(4) | NR/NR/NR | 7,032 | 3.8% | $23.69 | $166,588 | 3.7% | 2/28/2027 | None | N |
| Total Major Tenants | 92,607 | 49.9% | $24.55 | $2,273,933 | 45.1% | | | |
| | | | | | | | | | |
| Non-Major Tenants | 84,219 | 45.3% | $26.91 | $2,290,094 | 54.9% | | | |
| | | | | | | | | |
| Occupied Collateral Total | 176,826 | 95.2% | $25.65 | $4,564,027 | 100.0% | | | |
| | | | | | | | | |
| Vacant Space | 8,945 | 4.8% | | | | | | |
| | | | | | | | | |
| Collateral Total | 185,771 | 100.0% | | | | | | |
| | | | | | | | | | |
| (1) | Certain ratings are those of the parent company whether or not the parent company guarantees the lease. |
| (2) | Annual U/W Base Rent PSF and Annual U/W Base Rent include contractual rent steps through April 2023 totaling $214,345. |
| (3) | PBSO has 24,648 square feet expiring on 8/31/2024 and 8,639 square feet expiring on 24,648 square feet. |
| (4) | PBSO may terminate its lease in the event that funds are not appropriated or budgeted by the Palm Beach County Board of County Commissioners to PBSO in any fiscal year to pay rent and operating expenses associated with PBSO continuing obligations under its lease upon prompt written notice to the landlord. The termination will be effective upon the expiration of the period of time for which funds were appropriated. |
| (4) | The tenant was in a free rent period from January 2022 through March 2022. |
| (5) | PlanHub has 5,012 square feet expiring on 3/9/2027 and 13,639 square feet expiring on 3/31/2027. |
The following table presents certain information relating to the lease rollover schedule at the Forum Office West Palm Beach Property:
Lease Expiration Schedule(1)(2)
Year Ending
December 31, | No. of Leases Expiring | Expiring NRSF | % of Total NRSF | Cumulative Expiring NRSF | Cumulative % of Total NRSF | Annual
U/W
Base Rent | % of Total Annual U/W Base Rent | Annual
U/W
Base Rent
PSF |
| MTM | 0 | 0 | 0.0% | 0 | 0.0% | $0.00 | 0.0% | $0.00 |
| 2022 | 7 | 13,795 | 7.4% | 13,795 | 7.4% | $390,262 | 8.6% | $28.29 |
| 2023 | 5 | 7,929 | 4.3% | 21,724 | 11.7% | $211,621 | 4.6% | $26.69 |
| 2024 | 18 | 53,866 | 29.0% | 75,590 | 40.7% | $1,361,083 | 29.8% | $25.27 |
| 2025 | 6 | 9,511 | 5.1% | 85,101 | 45.8% | $267,320 | 5.9% | $28.11 |
| 2026 | 5 | 15,076 | 8.1% | 100,177 | 53.9% | $393,998 | 8.6% | $26.13 |
| 2027 | 16 | 73,805 | 39.7% | 173,982 | 93.7% | $1,856,699 | 40.7% | $25.16 |
| 2028 | 0 | 0 | 0.0% | 173,982 | 93.7% | $0.00 | 0.0% | $0.00 |
| 2029 | 2 | 2,844 | 1.5% | 176,826 | 95.2% | $83,045 | 1.8% | $29.20 |
| 2030 | 0 | 0 | 0.0% | 176,826 | 95.2% | $0.00 | 0.0% | $0.00 |
| 2031 | 0 | 0 | 0.0% | 176,826 | 95.2% | $0.00 | 0.0% | $0.00 |
| 2032 | 0 | 0 | 0.0% | 176,826 | 95.2% | $0.00 | 0.0% | $0.00 |
| Thereafter | 0 | 0 | 0.0% | 176,826 | 95.2% | $0.00 | 0.0% | $0.00 |
| Vacant | 0 | 8,945 | 4.8% | 185,771 | 100.0% | $0.00 | 0.0% | $0.00 |
| Total/Weighted Average(3) | 59 | 185,771 | 100.0% | | | $4,564,027 | 100.0% | $25.81 |
| (1) | Information obtained from the underwritten rent roll. |
| (2) | Certain tenants may have lease termination options that are exercisable prior to the originally stated expiration date of the subject lease and that are not considered in the Lease Expiration Schedule. |
| (3) | Total Annual U/W Base Rent PSF excludes vacant space. |
THE INFORMATION IN THIS COLLATERAL TERM SHEET IS NOT COMPLETE AND MAY BE AMENDED PRIOR TO THE TIME OF SALE. THIS TERM SHEET IS NOT AN OFFER TO SELL THESE SECURITIES AND IT IS NOT A SOLICITATION OF AN OFFER TO BUY THESE SECURITIES IN ANY JURISDICTION WHERE THE OFFER OR SALE IS NOT PERMITTED.
58
| Office - Suburban | Loan #6 | Cut-off Date Balance: | | $20,500,000 |
1655 and 1665 Palm Beach
Lakes Boulevard West Palm Beach, FL 33401 | Forum Office West Palm Beach | Cut-off Date LTV: | | 68.6% |
| | U/W NCF DSCR: | | 1.89x |
| | U/W NOI Debt Yield: | | 11.6% |
The following table presents historical occupancy percentages at the Forum Office West Palm Beach Property:
Historical Occupancy
12/31/2019(1) | 12/31/2020(1) | 3/8/2022(2) |
| 84.0% | 80.0% | 95.2% |
| (1) | Information obtained from the Forum Office West Palm Beach Borrower. |
| (2) | Information obtained from the underwritten rent roll dated December 1, 2021. |
Operating History and Underwritten Net Cash Flow. The following table presents certain information relating to the underwritten net cash flow at the Forum Office West Palm Beach Property:
Cash Flow Analysis
| | 2019 | 2020 | TTM 10/31/2021 | U/W | %(1) | U/W $ per SF |
| Rents in Place | $3,583,594 | $3,452,398 | $3,197,063 | $4,349,682 | 86.6% | $23.43 |
| Contractual Rent Steps(2) | 0 | 0 | 0 | 214,345 | 4.3 | 1.15 |
| Grossed Up Vacant Space | 0 | 0 | 0 | 232,570 | 4.6 | 1.25 |
| Gross Potential Rent | $3,583,594 | $3,452,398 | $3,197,063 | $4,796,597 | 95.5% | $25.84 |
| Other Income | 8,580 | 6,275 | 4,075 | 4,075 | 0.1 | 0.02 |
| Total Recoveries | 161,650 | 273,930 | 217,811 | 222,360 | 4.4 | 1.20 |
| Net Rental Income | $3,753,824 | $3,732,603 | $3,418,949 | $5,023,032 | 100.0% | $27.06 |
| (Vacancy & Credit Loss) | 0 | 0 | 0 | (466,763)(3) | (9.7) | (2.51) |
| Effective Gross Income | $3,753,824 | $3,732,603 | $3,418,949 | $4,556,269 | 90.7% | $24.54 |
| | | | | | | |
| Real Estate Taxes | 593,420 | 505,433 | 525,648 | 579,760 | 12.7 | 3.12 |
| Insurance | 65,559 | 101,824 | 126,748 | 175,320 | 3.8 | 0.94 |
| Management Fee | 112,615 | 111,978 | 102,568 | 136,688 | 3.0 | 0.74 |
| Other Operating Expenses | 1,317,896 | 1,358,550 | 1,187,766 | 1,277,831 | 28.0 | 6.88 |
| Total Operating Expenses | $2,089,490 | $2,077,786 | $1,942,731 | $2,169,599 | 47.6% | $11.69 |
| | | | | | | |
| Net Operating Income(4) | $1,664,334 | $1,654,817 | $1,476,218 | $2,386,670 | 52.4% | $12.86 |
| Replacement Reserves | 0 | 0 | 0 | 27,866 | 0.6 | 0.15 |
| TI/LC | 0 | 0 | 0 | 143,407 | 3.1 | 0.77 |
| Net Cash Flow | $1,664,334 | $1,654,817 | $1,476,218 | $2,215,398 | 48.6% | $11.93 |
| | | | | | | |
| NOI DSCR | 1.42x | 1.41x | 1.26x | 2.04x | | |
| NCF DSCR | 1.42x | 1.41x | 1.26x | 1.89x | | |
| NOI Debt Yield | 8.1% | 8.1% | 7.2% | 11.6% | | |
| NCF Debt Yield | 8.1% | 8.1% | 7.2% | 10.8% | | |
| (1) | Represents (i) percent of Net Rental Income for all revenue fields, (ii) percent of Gross Potential Rent for Vacancy & Credit Loss and (iii) percent of Effective Gross Income for all other fields. |
| (2) | Represents contractual rent steps through April 2023. |
| (3) | The underwritten economic vacancy is 9.3%. The Forum Office West Palm Beach Property was 95.2% leased as of March 8, 2022. |
| (4) | The U/W Net Operating Income increased compared to the TTM 10/31/2021 Net Operating Income is due to the fact that 16 tenants, including the largest tenant, Palm Beach County Sheriff's Office, started their leases from July 2021 through April 2021 with total in-place base rents of approximately $1.6 million. |
Appraisal. As of the appraisal valuation date of January 1, 2022, the Forum Office West Palm Beach Property had an “as-is” appraised value of $29,900,000.
Environmental Matters. According to a Phase I environmental site assessment dated December 20, 2021, there was no evidence of any recognized environmental conditions at the Forum Office West Palm Beach Property.
Market Overview and Competition. The Forum Office West Palm Beach Property is located in Palm Beach County, Florida within the West Palm Beach metropolitan statistical area (the “West Palm Beach MSA”). Major employers within the West Palm Beach MSA include Tenet Healthcare Corp., NextEra Energy/Florida Power & Light Co., Florida Atlantic University, Hospital Corp. of America and Boca Raton Regional Hospital.
THE INFORMATION IN THIS COLLATERAL TERM SHEET IS NOT COMPLETE AND MAY BE AMENDED PRIOR TO THE TIME OF SALE. THIS TERM SHEET IS NOT AN OFFER TO SELL THESE SECURITIES AND IT IS NOT A SOLICITATION OF AN OFFER TO BUY THESE SECURITIES IN ANY JURISDICTION WHERE THE OFFER OR SALE IS NOT PERMITTED.
59
| Office - Suburban | Loan #6 | Cut-off Date Balance: | | $20,500,000 |
1655 and 1665 Palm Beach
Lakes Boulevard West Palm Beach, FL 33401 | Forum Office West Palm Beach | Cut-off Date LTV: | | 68.6% |
| | U/W NCF DSCR: | | 1.89x |
| | U/W NOI Debt Yield: | | 11.6% |
Primary access to the Forum Office West Palm Beach Property is provided via Interstate 95 (“I-95”) and State Route 704. I-95 is a major north/south expressway that provides access throughout eastern Palm Beach County as well as Broward County. The West Palm Beach central business district is located approximately 5-10 minutes northwest of The Forum Office West Palm Beach Property. According to the appraisal, the area surrounding the Forum Office West Palm Beach Property is experiencing a growth pattern. During the past two years approximately 282,400 square feet of office space has been delivered, with approximately 96,122 square feet proposed to be delivered over the next eight quarters. Additionally, a 300,000 square foot Class A office building located in downtown West Palm Beach was completed in late 2021 and is almost fully leased. The area surrounding the Forum Office West Palm Beach Property is characterized by industrial, retail, hospitality and office properties. The Forum Office West Palm Beach Property is located approximately 3.1 miles southwest of downtown West Palm Beach, which is home to many major museums, parks, banks, and theaters. The Forum Office West Palm Beach Property is located adjacent to the Palm Beach Outlet Mall which features Whole Foods, Steve Madden, Nike, Under Armour, Kate Spade, and Nordstrom Rack among others. According to a third-party market research report, the 2021 population within a one, three, and five-mile radius of the Forum Office West Palm Beach Property was 12,181, 111,236 and 223,651. The average household income within the same radii was $69,457, $72,469 and $74,500, respectively.
Submarket Information – According to a third-party market research report, the Forum Office West Palm Beach Property is situated within the West Palm Beach office submarket, which contained approximately 8.5 million square feet of office space as of third quarter 2021. As of Q4 2021, the West Palm Beach office submarket reported a vacancy rate of 10.7% and an average quoted rental rate of $29.28 per square feet. The West Palm Beach office submarket reported no new construction, with no new deliveries and negative absorption of 27,431.
Appraiser’s Comp Set – The appraiser identified five competitive properties for the Forum Office West Palm Beach Property totaling approximately 466,095 square feet, which reported an average occupancy rate of approximately 78.0%. The appraiser concluded to market rents of $27.00 per square foot for Building B and Building C tenant spaces less than 9,500 square feet.
The following table presents certain information relating to the appraiser’s market rent conclusion for the Forum Office West Palm Beach Property:
Market Rent Summary(1)
| | <9,500 SF – Building B Space | <9,500 SF – Building C Space |
| Market Rent (PSF) | $27.00 | $27.00 |
| Lease Term (Months) | 63 | 63 |
| Lease Type (Reimbursements) | Base Year | Base Year |
| Rent Increase Projection (per year) | 3.00% | 3.00% |
| Free Rent (Months) | 3 | 3 |
| (1) | Information obtained from the appraisal. |
The table below presents certain information relating to comparable sales for the Forum Office West Palm Beach Property identified by the appraiser:
Comparable Sales(1)
| Property Name | Location | Rentable Area (SF) | Sale Date | Sale Price | Sale Price (PSF) |
| Hillsboro Center | Deerfield Beach, FL | 216,114 | Mar-19 | $32,500,000 | $150.38 |
| Centurion Tower | West Palm Beach, FL | 143,966 | Oct-19 | $32,500,000 | $225.75 |
| Bankers Healthcare Headquarters | Hollywood, FL | 132,092 | Mar-20 | $29,000,000 | $219.54 |
| Cypress Financial Center | Fort Lauderdale, FL | 202,131 | Jan-21 | $44,200,000 | $218.67 |
| Pinnacle Corporate Park | Fort Lauderdale, FL | 259,458 | Jun-21 | $58,875,000 | $226.92 |
| Broward Trade Center | Fort Lauderdale, FL | 100,104 | Dec-21 | $16,000,000 | $159.83 |
| (1) | Information obtained from the appraisal. |
THE INFORMATION IN THIS COLLATERAL TERM SHEET IS NOT COMPLETE AND MAY BE AMENDED PRIOR TO THE TIME OF SALE. THIS TERM SHEET IS NOT AN OFFER TO SELL THESE SECURITIES AND IT IS NOT A SOLICITATION OF AN OFFER TO BUY THESE SECURITIES IN ANY JURISDICTION WHERE THE OFFER OR SALE IS NOT PERMITTED.
60
| Office - Suburban | Loan #6 | Cut-off Date Balance: | | $20,500,000 |
1655 and 1665 Palm Beach
Lakes Boulevard West Palm Beach, FL 33401 | Forum Office West Palm Beach | Cut-off Date LTV: | | 68.6% |
| | U/W NCF DSCR: | | 1.89x |
| | U/W NOI Debt Yield: | | 11.6% |
The following table presents certain information relating to comparable leases to those at the Forum Office West Palm Beach Property:
Comparable Leases(1)
| Property Name/Location | Year Built/ Renovated | Total GLA (SF) | Occupancy | Tenant | Lease Term | Tenant Size (SF) | Annual Base Rent PSF | Lease Type |
Forum Office West Palm Beach (subject) 1655 and 1665 Palm Beach Lakes Boulevard West Palm Beach, FL | 1975/NAP | 185,771(2) | 95.2%(2) | Various(2) | Various(2) | Various(2) | $25.81(2) | Various(2) |
EcoPlex at Centrepark West 1641 Worthington Road West Palm Beach, FL | 2008/NAP | 100,525 | 66.0% | Confidential | 5.0 Yrs. | 6,209 SF | $24.00 | NNN |
Palm Beach International Towers 1601 Belvedere Road West Palm Beach, FL | 1983/NAP | 104,069 | 56.0% | RetroFitness | 5.4 Yrs. | 11,197 SF | $32.51 | FS |
Commerce Pointe Gold 1800 South Australian Avenue West Palm Beach, FL | 1987/NAP | 43,336 | 100.0% | Lincoln Harris CSG | 3.0 Yrs. | 1,601 SF | $27.00 | MG |
Concourse Towers – West Tower 2090 Palm Beach Lakes Boulevard West Palm Beach, FL | 1981/1998 | 74,199 | 78.0% | Saylor Physical Therapy | 0 Yrs. | 3,071 SF | $29.50 | FS |
Centurion Tower 1601 Forum Place West Palm Beach, FL | 1988/1998 | 143,966 | 90.0% | Scott-Roberts
and Associates | 3.0 Yrs. | 1,827 SF | $22.00 | NNN |
| (1) | Information obtained from the appraisal. |
| (2) | Information obtained from the underwritten rent roll. |
Recent Leases at the Forum Office West Palm Beach Property (1)
| Recent Leases | Rentable Area (SF) | Lease Start | Remaining Term (Months) | Months Free | TI/SF | Contract (Base Rent) - Year 1 | Contract (Base Rent) – Term Average |
| MLA: < 9,500 SF – Building B | | | | | | | |
| Rossin & Burr | 1,946 | Oct-21 | 47 | 0 | $0.00 | $26.07 | $27.22 |
| PBSO | 21,268 | Oct-21 | 32 | 0 | $0.00 | $24.75 | $24.75 |
| Kelley & Fulton P.A. | 3,551 | Apr-21 | 54 | 0 | $0.00 | $25.38 | $26.72 |
| Pure Debt Solutions | 3,941 | Sep-21 | 32 | 0 | $0.00 | $26.26 | $26.89 |
| Mass Inbound | 2,158 | Jul-21 | 33 | 0 | $0.00 | $24.36 | $25.00 |
| Valeo Resources | 3,372 | Jul-21 | 33 | 0 | $0.00 | $26.20 | $26.86 |
| The Arc of Palm Beach County | 4,004 | Oct-21 | 9 | 0 | $0.00 | $28.34 | $29.12 |
| MLA: < 9,500 SF – Building C | | | | | | | |
| VSTARR | 4,562 | Sep-21 | 60 | 0 | $0.00 | $24.00 | $25.48 |
| PBSO | 12,019 | Sep-21 | 32 | 0 | $0.00 | $24.75 | $24.75 |
| Gen Media Partners | 7,032 | Nov-21 | 62 | 0 | $0.00 | $23.12 | $24.56 |
| | | | | | | | |
Best Buddies | 1,118 | Sep-21 | 32 | 0 | $0.00 | $27.59 | $28.25 |
M2E Engineers | 2,844 | Sep-21 | 88 | 0 | $0.00 | $28.92 | $31.80 |
Knoerr & Emanuel PA | 1,682 | Apr-21 | 29 | 0 | $0.00 | $25.44 | $25.94 |
| Pickett, Marshall, Rozenson | 3,987 | Oct-21 | 61 | 0 | $0.00 | $26.50 | $28.11 |
| (1) | Information obtained from the appraisal. |
Escrows.
Real Estate Taxes – The Forum Office West Palm Beach Mortgage Loan documents require an upfront real estate tax reserve of $202,916 and ongoing monthly real estate tax reserves in an amount equal to one-twelfth of the real estate taxes that the lender estimates will be necessary to pay taxes over the then succeeding twelve months (initially $48,313).
THE INFORMATION IN THIS COLLATERAL TERM SHEET IS NOT COMPLETE AND MAY BE AMENDED PRIOR TO THE TIME OF SALE. THIS TERM SHEET IS NOT AN OFFER TO SELL THESE SECURITIES AND IT IS NOT A SOLICITATION OF AN OFFER TO BUY THESE SECURITIES IN ANY JURISDICTION WHERE THE OFFER OR SALE IS NOT PERMITTED.
61
| Office - Suburban | Loan #6 | Cut-off Date Balance: | | $20,500,000 |
1655 and 1665 Palm Beach
Lakes Boulevard West Palm Beach, FL 33401 | Forum Office West Palm Beach | Cut-off Date LTV: | | 68.6% |
| | U/W NCF DSCR: | | 1.89x |
| | U/W NOI Debt Yield: | | 11.6% |
Insurance – The Forum Office West Palm Beach Mortgage Loan documents did not require an upfront insurance reserve. If the Forum Office West Palm Beach Borrower does not maintain an acceptable blanket policy, the Forum Office West Palm Beach Borrower is required to deposit monthly insurance reserves in an amount equal to one-twelfth of the insurance premiums due for the renewal of insurance coverage (initially $14,610). The Forum Office West Palm Beach Borrower is currently maintaining an acceptable blanket policy.
Replacement Reserves – The Forum Office West Palm Beach Mortgage Loan documents require ongoing monthly replacement reserves of approximately $3,094, subject to a cap of $74,260 (the “Capital Expenditures Cap”). As long as no event of default exists, the Forum Office West Palm Beach Borrower may deliver a letter of credit in an amount equal to the Capital Expenditures Cap, in lieu of maintaining the capital expenditure subaccount in cash. At origination, the Forum Office West Palm Beach Borrower delivered a letter of credit, $74,260 of which is for replacement reserves.
TI/LC Reserve – The Forum Office West Palm Beach Mortgage Loan documents require ongoing monthly tenant improvement and leasing commission reserves of approximately $20,886, subject to a cap of $2,500,000 (the “Rollover Cap”). As long as no event of default exists, the Forum Office West Palm Beach Borrower may deliver a letter of credit in an amount equal to the Rollover Cap, in lieu of maintaining the rollover subaccount in cash. At origination, the Forum Office West Palm Beach Borrower delivered a letter of credit, $2,500,000 of which is for TI/LC reserves.
Debt Service Reserve – The Forum Office West Palm Beach Mortgage Loan documents require an upfront debt reserve of approximately $160,557.
Free Rent Reserve – The Forum Office West Palm Beach Mortgage Loan documents require an upfront free rent reserve of approximately $90,497.
Lockbox and Cash Management. The Forum Office West Palm Beach Mortgage Loan documents require a springing lockbox and a springing cash management. Upon the occurrence and continuance of a Cash Management Trigger Event (as defined below) the Forum Office West Palm Beach Borrower is required to establish a lender-controlled lockbox account. Within five business days after the occurrence of a Cash Management Trigger Event, the Forum Office West Palm Beach Borrower or the property manager are required to deliver tenant instruction letters to each tenant in place and any new tenants in the future instructing such tenants to deposit all rents payable under each lease directly into such lockbox account. The Forum Office West Palm Beach Mortgage Loan documents also require that all revenues received by the Forum Office West Palm Beach Borrower or the property manager be deposited into the lockbox account within two business days of receipt. Pursuant to the Forum Office West Palm Beach Mortgage Loan documents, all excess funds on deposit are required to be applied as follows (a) if a Cash Sweep Event (as defined below) is not in effect, to the Forum Office West Palm Beach Borrower; and (b) if a Cash Sweep Event is in effect, in accordance with the Forum Office West Palm Beach Mortgage Loan documents with any excess cash flow to be transferred to an excess cash flow account controlled by the lender and held by the lender as additional security for the Forum Office West Palm Beach Mortgage Loan.
A “Cash Management Trigger Event” will commence upon the occurrence of the following:
| (ii) | the Forum Office West Palm Beach Borrower’s second late debt service payment within a 12-month period; |
| (iii) | a bankruptcy action of the Forum Office West Palm Beach Borrower, guarantor or property manager; or |
| (iv) | a Cash Management DSCR Trigger Event (as defined below). |
A Cash Management Trigger Event will end upon the occurrence of:
| ● | with regard to clause (i) above, the cure of such event of default has been accepted or waived by the lender; |
| ● | with regard to clause (ii) above, when the debt service payments have been paid on time for 12 consecutive months; |
| ● | with regard to clause (iii) above, (a) when such bankruptcy action petition has been discharged, stayed, or dismissed within 30 days of such filing among other conditions for the Forum Office West Palm Beach Borrower or guarantor and (b) with respect to the property manager (1) when such bankruptcy action petition has been discharged, stayed, or dismissed within 120 days, or (2) after the Forum Office West Palm Beach Borrower replaces the property manager with a qualified property manager acceptable to the lender; and |
| ● | with regard to clause (iv) above, the date the debt service coverage ratio based on the trailing 12-month period immediately preceding the date of such determination is greater than 1.15x for two consecutive quarters. |
A “Cash Management DSCR Trigger Event” will occur on any date the debt service coverage ratio, based on the trailing 12-month period immediately preceding the date of determination, is less than 1.15x.
A “Cash Sweep Event” will commence upon the occurrence of the following:
| (ii) | a bankruptcy action of the Forum Office West Palm Beach Borrower, guarantor or property manager; or |
| (iii) | a Cash Sweep DSCR Trigger Event (as defined below). |
THE INFORMATION IN THIS COLLATERAL TERM SHEET IS NOT COMPLETE AND MAY BE AMENDED PRIOR TO THE TIME OF SALE. THIS TERM SHEET IS NOT AN OFFER TO SELL THESE SECURITIES AND IT IS NOT A SOLICITATION OF AN OFFER TO BUY THESE SECURITIES IN ANY JURISDICTION WHERE THE OFFER OR SALE IS NOT PERMITTED.
62
| Office - Suburban | Loan #6 | Cut-off Date Balance: | | $20,500,000 |
1655 and 1665 Palm Beach
Lakes Boulevard West Palm Beach, FL 33401 | Forum Office West Palm Beach | Cut-off Date LTV: | | 68.6% |
| | U/W NCF DSCR: | | 1.89x |
| | U/W NOI Debt Yield: | | 11.6% |
A Cash Sweep Event will end upon the occurrence of:
| ● | with regard to clause (i) above, the cure of such event of default has been accepted or waived by the lender; |
| ● | with regard to clause (ii) above, (a) when such bankruptcy action petition has been discharged, stayed, or dismissed within 60 days of such filing among other conditions for the Forum Office West Palm Beach Borrower or guarantor and (b) with respect to the property manager (1) when such bankruptcy action petition has been discharged, stayed or dismissed within 120 days, or (2) after the Forum Office West Palm Beach Borrower replaces the property manager with a qualified property manager acceptable to the lender; and |
| ● | with regard to clause (iii) above, the date the debt service coverage ratio based on the trailing 12-month period immediately preceding the date of such determination is greater than 1.10x for two consecutive quarters. |
A “Cash Sweep DSCR Trigger Event” will occur on any date the debt service coverage ratio, based on the trailing 12-month period immediately preceding the date of determination, is less than 1.10x.
Property Management. The Forum Office West Palm Beach Property is managed by Amco Property Management, LLC d/b/a The David Associates, an affiliate of the Forum Office West Palm Beach Borrower.
Partial Release. Not permitted.
Real Estate Substitution. Not permitted.
Subordinate and Mezzanine Indebtedness. Not permitted.
Ground Lease. None.
Terrorism Insurance. The Forum Office West Palm Beach Mortgage Loan documents require that the “all risk” insurance policy required to be maintained by the Forum Office West Palm Beach Borrower provides coverage for terrorism in an amount equal to the full replacement cost of the Forum Office West Palm Beach Property, as well as business interruption insurance covering no less than the 12-month period following the occurrence of a casualty event, together with a 6-month extended period of indemnity.
THE INFORMATION IN THIS COLLATERAL TERM SHEET IS NOT COMPLETE AND MAY BE AMENDED PRIOR TO THE TIME OF SALE. THIS TERM SHEET IS NOT AN OFFER TO SELL THESE SECURITIES AND IT IS NOT A SOLICITATION OF AN OFFER TO BUY THESE SECURITIES IN ANY JURISDICTION WHERE THE OFFER OR SALE IS NOT PERMITTED.
63
| Office – CBD | Loan #7 | Cut-off Date Balance: | | $19,500,000 |
| 530 Bush Street | 530 Bush Street | Cut-off Date LTV: | | 36.9% |
| San Francisco, CA 94108 | | U/W NCF DSCR: | | 3.58x |
| | | U/W NOI Debt Yield: | | 14.8% |
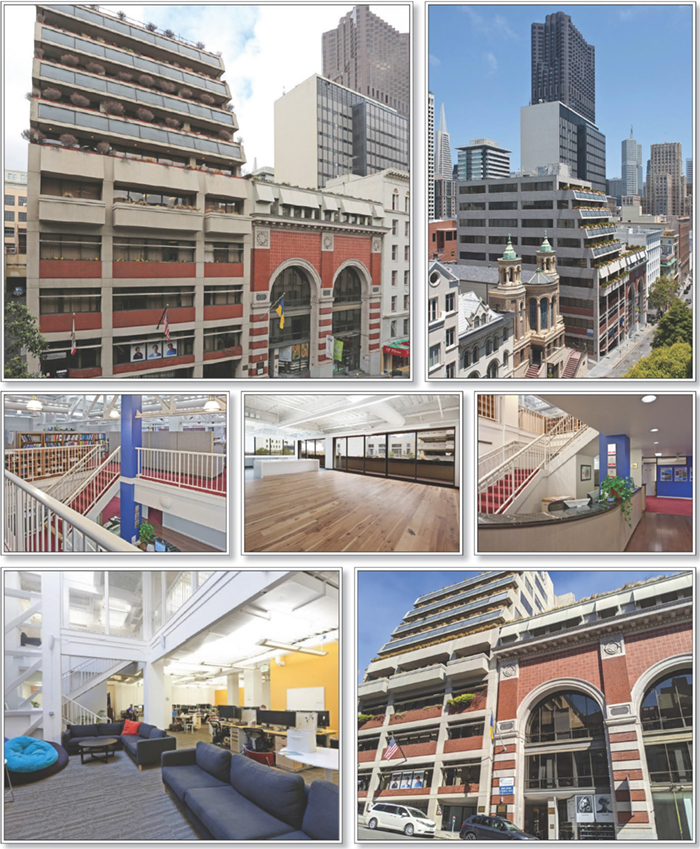
THE INFORMATION IN THIS COLLATERAL TERM SHEET IS NOT COMPLETE AND MAY BE AMENDED PRIOR TO THE TIME OF SALE. THIS TERM SHEET IS NOT AN OFFER TO SELL THESE SECURITIES AND IT IS NOT A SOLICITATION OF AN OFFER TO BUY THESE SECURITIES IN ANY JURISDICTION WHERE THE OFFER OR SALE IS NOT PERMITTED.
64
| No. 7 – 530 Bush Street |
| |
| Mortgage Loan Information | | Mortgaged Property Information(2) |
| Mortgage Loan Seller: | UBS AG | | Single Asset/Portfolio: | Single Asset |
Credit Assessment (Fitch/KBRA/Moody’s): | NR/NR/NR | | Property Type – Subtype: | Office – CBD |
| Original Principal Balance: | $19,500,000 | | Location: | San Francisco, CA |
| Cut-off Date Balance: | $19,500,000 | | Size: | 104,737 SF |
| % of Initial Pool Balance: | 3.7% | | Cut-off Date Balance Per SF: | $186.18 |
| Loan Purpose: | Refinance | | Maturity Date Balance Per SF: | $186.18 |
| Borrower Sponsor: | VY Bush Street Investors LLC | | Year Built/Renovated: | 1916, 1982/1974 |
| Guarantor: | NAP | | Title Vesting: | Fee |
| Mortgage Rate: | 3.8087% | | Property Manager: | CBRE, Inc. |
| Note Date: | February 11, 2022 | | Current Occupancy (As of)(3): | 84.1% (12/31/2021) |
| Seasoning: | 2 months | | YE 2020 Occupancy: | 90.3% |
| Maturity Date: | February 6, 2032 | | YE 2019 Occupancy: | 92.8% |
| IO Period: | 120 months | | YE 2018 Occupancy: | 77.0% |
| Loan Term (Original): | 120 months | | YE 2017 Occupancy: | 87.0% |
| Amortization Term (Original): | NAP | | As-Is Appraised Value: | $52,800,000 |
| Loan Amortization Type: | Interest Only | | As-Is Appraised Value Per SF: | $504.12 |
| Call Protection: | L(24),YM1(92),O(4) | | As-Is Appraisal Valuation Date: | September 7, 2021 |
| Lockbox Type: | Hard/Springing Cash Management | | |
| Additional Debt: | None | | Underwriting and Financial Information(2) |
| Additional Debt Type (Balance): | NAP | | YE 2021 NOI: | $2,797,577 |
| | | | YE 2020 NOI: | $2,947,329 |
| | | | YE 2019 NOI: | $2,530,182 |
| | | | YE 2018 NOI: | $1,406,807 |
| | | | U/W Revenues: | $5,145,120 |
| | | | U/W Expenses: | $2,260,936 |
| Escrows and Reserves(1) | | U/W NOI: | $2,884,184 |
| | Initial | Monthly | Cap | | U/W NCF: | $2,698,150 |
| RE Taxes | $181,023 | $32,325 | NAP | | U/W DSCR based on NOI/NCF(3): | 3.83x / 3.58x |
| Insurance | $38,430 | $5,057 | NAP | | U/W Debt Yield based on NOI/NCF(3): | 14.8% / 13.8% |
| Replacement Reserve | $0 | $1,746 | $83,790 | | U/W Debt Yield at Maturity based on NOI/NCF: | 14.8% / 13.8% |
| TI/LC Reserve | $2,000,000 | Springing | $1,000,000 | | Cut-off Date LTV Ratio: | 36.9% |
| Unfunded Obligations | $101,474 | $0 | NAP | | LTV Ratio at Maturity: | 36.9% |
| | | | | | | |
| | | | | | | | | | |
| Sources and Uses |
| Sources | | | | Uses | | |
| Original loan amount | $19,500,000 | 89.3% | | Loan payoff | $19,131,294 | 87.6% |
| Sponsors equity | 2,345,352 | 10.7 | | Upfront reserves | 2,320,927 | 10.6 |
| | | | | Closing costs | 393,131 | 1.8 |
| Total Sources | $21,845,352 | 100.0% | | Total Uses | $21,845,352 | 100.0% |
| (1) | See “Escrows” section below. |
| (2) | While the 530 Bush Street Mortgage Loan was originated after the emergence of the novel coronavirus pandemic and the economic disruption resulting from measures to combat the pandemic, the pandemic is an evolving situation and could impact the 530 Bush Street Mortgage Loan more severely than assumed in the underwriting of the 530 Bush Street Mortgage Loan. The pandemic and resulting economic disruption could also adversely affect the NOI, NCF and occupancy information, as well as the appraised value and the DSCR, LTV and Debt Yield metrics presented above. See “Risk Factors—Risks Related to Market Conditions and Other External Factors—Coronavirus Pandemic Has Adversely Affected the Global Economy and Will Likely Adversely Affect the Performance of the Mortgage Loans” in the Preliminary Prospectus. |
| (3) | Includes the Consulate General of Ukraine, which leases 3,488 square feet on a month-to-month basis and has been included in the underwritten occupancy and rent. If the tenant were underwritten as vacant, Current Occupancy, U/W DSCR based on NOI/NCF and U/W Debt Yield based on NOI/NCF would be 80.8%, 3.63x / 3.40x and 14.0% / 13.1%, respectively. |
The Mortgage Loan. The mortgage loan (the “530 Bush Street Mortgage Loan”) is evidenced by a single promissory note secured by a first priority fee mortgage encumbering a 104,737 square foot office building with ground floor retail located in San Francisco, California (the “530 Bush Street Property”).
The Borrower and Borrower Sponsor. The borrower is VY Bush Street Investors (Delaware) LLC (the “530 Bush Street Borrower”), a Delaware limited liability company with one independent director. The borrower sponsor is VY Bush Street Investors LLC. The borrower sponsor is indirectly majority owned by the estate of M.T. Geoffrey Yeh. The indirect manager of the 530 Bush Street Borrower, VYTC Investors, LLC, is 50% owned by Troy Crosby and 50% owned by G&H Real Estate LLC, and is managed by its directors, Troy Crosby, V-Nee Yeh and Yvette Yeh Fung. There is no non-recourse carveout guarantor or separate environmental indemnitor with respect to
THE INFORMATION IN THIS COLLATERAL TERM SHEET IS NOT COMPLETE AND MAY BE AMENDED PRIOR TO THE TIME OF SALE. THIS TERM SHEET IS NOT AN OFFER TO SELL THESE SECURITIES AND IT IS NOT A SOLICITATION OF AN OFFER TO BUY THESE SECURITIES IN ANY JURISDICTION WHERE THE OFFER OR SALE IS NOT PERMITTED.
65
| Office – CBD | Loan #7 | Cut-off Date Balance: | | $19,500,000 |
| 530 Bush Street | 530 Bush Street | Cut-off Date LTV: | | 36.9% |
| San Francisco, CA 94108 | | U/W NCF DSCR: | | 3.58x |
| | | U/W NOI Debt Yield: | | 14.8% |
the 530 Bush Street Mortgage Loan. The 530 Bush Street Borrower obtained a premises environmental liability insurance policy from Great American E&S Insurance Company with respect to the 530 Bush Street Property in the amount of $2,000,000 per incident and in the aggregate, with a $50,000 self-insured retention, with the 530 Bush Street Borrower as first named insured and the lender and its successors and assigns as additional named insured, and an expiration date of February 11, 2032 with respect to the 530 Bush Street Borrower and February 11, 2035 with respect to the lender.
The Property. The 530 Bush Street Property is a 104,737 square foot office building with ground floor retail (3.4% of underwritten base rent) located at the intersection of the Union Square District and Financial District neighborhoods of San Francisco, California. The 530 Bush Street Property was originally constructed in two phases. The five-story portion of the building was developed in 1916 and renovated in 1974. A ten-story conjoined addition was then developed in 1982. The 530 Bush Street Property is situated on a 0.31-acre site with parking available for nine spaces (0.1 per 1,000 SF). Amenities include 24-hour access, a three-elevator lobby, tiered terraces on floors 2-6, an on-site property manager and a community rooftop deck. As of December 31, 2021, the 530 Bush Street Property was 84.1% leased by 14 office tenants and one retail tenant on the ground floor. Since 2011, occupancy at the 530 Bush Street Property has ranged from 77.0% to 99.7%, with an average occupancy of 89.2%.
The borrower sponsor purchased the 530 Bush Street Property in February 2011 for approximately $23.1 million. Since acquiring the 530 Bush Street Property, the borrower sponsor has invested approximately $10.2 million in capital improvements including approximately $2.8 million on HVAC modernization, approximately $0.9 million on elevator modernization and approximately $5.3 million on tenant improvements.
Major Tenants.
Largest Tenant: Tutor Perini Corp. (B3: Moody’s; 20,292 square feet; 19.4% of net rentable area; 22.1% of underwritten base rent; December 31, 2022 leases expiration) - Tutor Perini Corp. (NYSE: TPC) is a civil, building and specialty construction company offering diversified general contracting and design-build services to private customers and public agencies throughout the world. Tutor Perini Corp. has provided construction services since 1894 and currently offers general contracting, pre-construction planning and project management services, including planning and scheduling of manpower, equipment, materials and subcontractors required for a project. Tutor Perini Corp. has been at the 530 Bush Street Property since 2013 with a lease expiration date of December 31, 2022 and expanded into an additional 4,303 square feet of space in 2019 with a lease expiration date of April 20, 2022. Tutor Perini Corp. has no renewal options remaining.
2nd Largest Tenant: Super Free Games (10,849 square feet; 10.4% of net rentable area; 14.2% of underwritten base rent; October 20, 2022 lease expiration) - Founded in 2011 and headquartered at the 530 Bush Street Property, Super Free Games is a developer of casual and mash-up games. Super Free Games has a team of approximately 80 mobile game experts, including developers, designers and monetization managers based in multiple countries across the world. Super Free Games has been at the 530 Bush Street Property since 2018 and has one, four-year renewal option remaining.
3rd Largest Tenant: Bay Area Medical Academy (9,303 square feet; 8.9% of net rentable area; 12.3% of underwritten base rent; January 31, 2024 lease expiration) - Bay Area Medical Academy provides healthcare career training created in partnership with employers. Bay Area Medical Academy prepares individuals from different socio-economic, cultural and educational backgrounds for careers working in the healthcare industry. Bay Area Medical Academy has been at the 530 Bush Street Property since 2014 and has no renewal options remaining.
THE INFORMATION IN THIS COLLATERAL TERM SHEET IS NOT COMPLETE AND MAY BE AMENDED PRIOR TO THE TIME OF SALE. THIS TERM SHEET IS NOT AN OFFER TO SELL THESE SECURITIES AND IT IS NOT A SOLICITATION OF AN OFFER TO BUY THESE SECURITIES IN ANY JURISDICTION WHERE THE OFFER OR SALE IS NOT PERMITTED.
66
| Office – CBD | Loan #7 | Cut-off Date Balance: | | $19,500,000 |
| 530 Bush Street | 530 Bush Street | Cut-off Date LTV: | | 36.9% |
| San Francisco, CA 94108 | | U/W NCF DSCR: | | 3.58x |
| | | U/W NOI Debt Yield: | | 14.8% |
The following table presents certain information relating to the tenancy at the 530 Bush Street Property:
Major Tenants
| Tenant Name | Credit Rating (Fitch/ Moody’s/
S&P) | Tenant
NRSF | % of
NRSF | Annual U/W
Base Rent
PSF(1) | Annual
U/W Base
Rent(1) | % of Total
Annual
U/W Base
Rent | Lease
Expiration
Date | Extension
Options | Termination
Option
(Y/N) |
| Major Tenants | | | | | | | | |
| Tutor Perini Corp.(2) | NR/B3/NR | 20,292 | 19.4% | $52.73 | $1,069,902 | 22.1% | Various | None | N |
| Super Free Games | NR/NR/NR | 10,849 | 10.4% | $63.38 | $687,653 | 14.2% | 10/20/2022 | 1, 4-year | N |
| Bay Area Medical Academy | NR/NR/NR | 9,303 | 8.9% | $64.00 | $595,392 | 12.3% | 1/31/2024 | None | N |
| Nicolay Consulting Group | NR/NR/NR | 7,173 | 6.8% | $37.00 | $265,401 | 5.5% | 6/30/2022 | 1, 5-year | N |
| SWA Group | NR/NR/NR | 6,313 | 6.0% | $67.75 | $427,700 | 8.8% | 5/31/2026 | 1, 5-year | N |
| Total Major Tenants | 53,930 | 51.5% | $56.48 | $3,046,048 | 63.0% | | | |
| | | | | | | | | |
| Non-Major Tenants(3) | 34,136 | 32.6% | $52.47 | $1,791,001 | 37.0% | | | |
| | | | | | | | | |
| Occupied Collateral Total | 88,066 | 84.1% | $54.93 | $4,837,049 | 100.0% | | | |
| | | | | | | | | |
| Vacant Space | 16,671 | 15.9% | | | | | | |
| | | | | | | | | |
| Collateral Total | 104,737 | 100.0% | | | | | | |
| | | | | | | �� | | | |
| (1) | Annual U/W Base Rent PSF and Annual U/W Base Rent include rent steps through March 2023. |
| (2) | Tutor Perini Corp. occupies two suites at the 530 Bush Street Property. Suite 302-0400 (15,989 square feet) has a lease expiration date of December 31, 2022 and Suite 200 (4,303 square feet) has a lease expiration date of April 20, 2022. |
| (3) | Non-Major Tenants includes the Consulate General of Ukraine, which leases 3,488 square feet on a month-to-month basis and has been included in the underwritten occupancy and rent. If the tenant were underwritten as vacant, occupancy would be 80.8%, U/W DSCR based on NOI/NCF would be 3.63x and 3.40x, respectively, and underwritten debt yield based on NOI/NCF would be 14.0% and 13.1%, respectively. |
The following table presents certain information relating to the lease rollover schedule at the 530 Bush Street Property:
Lease Expiration Schedule(1)(2)
Year Ending
December 31, | No. of
Leases
Expiring | Expiring
NRSF | % of
Total
NRSF | Cumulative
Expiring
NRSF | Cumulative
% of Total
NRSF | Annual
U/W
Base Rent | % of Total
Annual
U/W Base
Rent | Annual
U/W
Base Rent
PSF |
| MTM(3) | 1 | 3,488 | 3.3% | 3,488 | 3.3% | $146,496 | 3.0% | $42.00 |
| 2022 | 7 | 44,161 | 42.2% | 47,649 | 45.5% | $2,333,062 | 48.2% | $52.83 |
| 2023 | 2 | 10,430 | 10.0% | 58,079 | 55.5% | $581,848 | 12.0% | $55.79 |
| 2024 | 3 | 17,385 | 16.6% | 75,464 | 72.1% | $1,033,306 | 21.4% | $59.44 |
| 2025 | 1 | 2,424 | 2.3% | 77,888 | 74.4% | $126,048 | 2.6% | $52.00 |
| 2026 | 2 | 9,578 | 9.1% | 87,466 | 83.5% | $590,689 | 12.2% | $61.67 |
| 2027 | 0 | 0 | 0.0% | 87,466 | 83.5% | $0 | 0.0% | $0.00 |
| 2028 | 0 | 0 | 0.0% | 87,466 | 83.5% | $0 | 0.0% | $0.00 |
| 2029 | 0 | 0 | 0.0% | 87,466 | 83.5% | $0 | 0.0% | $0.00 |
| 2030 | 0 | 0 | 0.0% | 87,466 | 83.5% | $0 | 0.0% | $0.00 |
| 2031 | 0 | 0 | 0.0% | 87,466 | 83.5% | $0 | 0.0% | $0.00 |
| 2032 | 0 | 0 | 0.0% | 87,466 | 83.5% | $0 | 0.0% | $0.00 |
| Thereafter(4) | 2 | 600 | 0.6% | 88,066 | 84.1% | $25,600 | 0.5% | $42.67 |
| Vacant | 0 | 16,671 | 15.9% | 104,737 | 100.0% | $0 | 0.0% | $0.00 |
| Total/Weighted Average | 18 | 104,737 | 100.0% | | | $4,837,049 | 100.0% | $54.93 |
| (1) | Information obtained from the underwritten rent roll and includes rent steps through March 2023. |
| (2) | Certain tenants may have lease termination options that are exercisable prior to the originally stated expiration date of the subject lease and that are not considered in the Lease Expiration Schedule. |
| (3) | MTM includes the Consulate General of Ukraine, which leases 3,488 square feet on a month-to-month basis and has been included in the underwritten occupancy and rent. If the tenant were underwritten as vacant, occupancy would be 80.8%, U/W DSCR based on NOI/NCF would be 3.63x and 3.40x, respectively, and underwritten debt yield based on NOI/NCF would be 14.0% and 13.1%, respectively. |
| (4) | Includes storage area (400 square feet) and an engineer office (200 square feet). |
THE INFORMATION IN THIS COLLATERAL TERM SHEET IS NOT COMPLETE AND MAY BE AMENDED PRIOR TO THE TIME OF SALE. THIS TERM SHEET IS NOT AN OFFER TO SELL THESE SECURITIES AND IT IS NOT A SOLICITATION OF AN OFFER TO BUY THESE SECURITIES IN ANY JURISDICTION WHERE THE OFFER OR SALE IS NOT PERMITTED.
67
| Office – CBD | Loan #7 | Cut-off Date Balance: | | $19,500,000 |
| 530 Bush Street | 530 Bush Street | Cut-off Date LTV: | | 36.9% |
| San Francisco, CA 94108 | | U/W NCF DSCR: | | 3.58x |
| | | U/W NOI Debt Yield: | | 14.8% |
The following table presents historical occupancy percentages at the 530 Bush Street Property:
Historical Occupancy
2011(1) | 2012(1) | 2013(1) | 2014(1) | 2015(1) | 2016(1) | 2017(1) | 2018(1) | 2019(1) | 2020(1) | 12/31/2021(2) |
| 89.4% | 85.3% | 83.4% | 97.2% | 94.9% | 99.7% | 87.0% | 77.0% | 92.8% | 90.3% | 84.1% |
| (1) | Information obtained from the borrower sponsor. |
| (2) | Information obtained from the underwritten rent roll. Includes the Consulate General of Ukraine, which leases 3,488 square feet on a month-to-month basis and has been included in the underwritten occupancy. If the tenant were underwritten as vacant, occupancy would be 80.8%. |
COVID-19 Update. As of February 16, 2022, the 530 Bush Street Property is open and operating. Approximately 96.8%, 96.7%, 96.8%, 97.3%, 97.1% and 94.8% of rent has been collected for the months of July 2021, August 2021, September 2021, October 2021, November 2021 and December 2021, respectively. The average rent collection from July 2021 through December 2021 was 96.6%. Bay Area Medical Academy (8.9% of net rentable area; 12.3% of underwritten base rent) has been making partial rent payments and has requested rent relief. The 530 Bush Street Borrower is contemplating a lease amendment. As of February 16, 2022, the 530 Bush Street Mortgage Loan is not subject to any modification or forbearance request.
Historical Operating Performance and Underwritten Net Cash Flow. The following table presents certain information relating to the historical operating performance and underwritten net cash flow at the 530 Bush Street Property:
Cash Flow Analysis
| | 2018 | 2019 | 2020 | 2021 | U/W | %(1) | U/W $
per SF |
| Base Rent | $3,104,167 | $4,373,402 | $4,850,229 | $4,727,679 | $4,837,049(2) | 80.5% | $46.18 |
| Grossed Up Vacant Space | 0 | 0 | 0 | 0 | 866,834 | 14.4 | 8.28 |
| Gross Potential Rent | $3,104,167 | $4,373,402 | $4,850,229 | $4,727,679 | $5,703,883 | 94.9% | $54.46 |
| Other Income | 104,839 | 65,815 | 83,155 | 69,293 | 69,293 | 1.2 | 0.66 |
| Total Recoveries | 126,624 | 289,115 | 256,881 | 244,659 | 238,778 | 4.0 | 2.28 |
| Net Rental Income | $3,335,630 | $4,728,332 | $5,190,265 | $5,041,631 | $6,011,954 | 100.0% | $57.40 |
| (Vacancy & Credit Loss) | 0 | 0 | 0 | 0 | (866,834) | (15.2) | (8.28) |
| Effective Gross Income | $3,335,630 | $4,728,332 | $5,190,265 | $5,041,631 | $5,145,120 | 85.6% | $49.12 |
| | | | | | | | |
| Real Estate Taxes | 300,030 | 307,295 | 351,095 | 388,731 | 387,905 | 7.5 | 3.70 |
| Insurance | 53,875 | 51,458 | 48,281 | 56,492 | 60,680 | 1.2 | 0.58 |
| Management Fee | 99,616 | 141,873 | 149,969 | 148,709 | 154,354 | 3.0 | 1.47 |
| Other Operating Expenses | 1,475,302 | 1,697,524 | 1,693,590 | 1,650,121 | 1,657,997 | 32.2 | 15.83 |
| Total Operating Expenses | $1,928,824 | $2,198,149 | $2,242,935 | $2,244,054 | $2,260,936 | 43.9% | $21.59 |
| | | | | | | | |
| Net Operating Income | $1,406,807 | $2,530,182 | $2,947,330 | $2,797,577 | $2,884,184 | 56.1% | $27.54 |
| Replacement Reserves | 0 | 0 | 0 | 0 | 20,947 | 0.4 | 0.20 |
| TI/LC | 0 | 0 | 0 | 0 | 165,086 | 3.2 | 1.58 |
| Net Cash Flow | $1,406,807 | $2,530,182 | $2,947,330 | $2,797,577 | $2,698,150 | 52.4% | $25.76 |
| | | | | | | | |
| NOI DSCR | 1.87x | 3.36x | 3.91x | 3.72x | 3.83x | | |
| NCF DSCR | 1.87x | 3.36x | 3.91x | 3.72x | 3.58x | | |
| NOI Debt Yield | 7.2% | 13.0% | 15.1% | 14.3% | 14.8% | | |
| NCF Debt Yield | 7.2% | 13.0% | 15.1% | 14.3% | 13.8% | | |
| (1) | Represents (i) percent of Net Rental Income for all revenue fields, (ii) percent of Gross Potential Rent for Vacancy & Credit Loss and (iii) percent of Effective Gross Income for all other fields. |
| (2) | The U/W Base Rent includes ($2,115) in rent steps through March 2023, which takes into account a $116,000 rent reduction for ALLTrails’ space, which took effect in February 2022. U/W Base Rent also includes rent from the Consulate General of Ukraine, which leases 3,488 square feet on a month-to-month basis. If the tenant were underwritten as vacant, U/W DSCR based on NOI/NCF would be 3.63x and 3.40x, respectively, and U/W debt yield based on NOI/NCF would be 14.0% and 13.1%, respectively. |
Appraisal. The appraisal concluded an “as-is” appraised value of $52,800,000 as of September 7, 2021. In addition, the appraisal concluded an “as stabilized” appraised value of $58,500,000 as of September 7, 2023.
Environmental Matters. According to the Phase I environmental site assessment dated October 5, 2021, there are no recognized environmental conditions and no recommendations other than the implementation of an asbestos operations and maintenance program.
THE INFORMATION IN THIS COLLATERAL TERM SHEET IS NOT COMPLETE AND MAY BE AMENDED PRIOR TO THE TIME OF SALE. THIS TERM SHEET IS NOT AN OFFER TO SELL THESE SECURITIES AND IT IS NOT A SOLICITATION OF AN OFFER TO BUY THESE SECURITIES IN ANY JURISDICTION WHERE THE OFFER OR SALE IS NOT PERMITTED.
68
| Office – CBD | Loan #7 | Cut-off Date Balance: | | $19,500,000 |
| 530 Bush Street | 530 Bush Street | Cut-off Date LTV: | | 36.9% |
| San Francisco, CA 94108 | | U/W NCF DSCR: | | 3.58x |
| | | U/W NOI Debt Yield: | | 14.8% |
Market Overview and Competition. The 530 Bush Street Property is located at the intersection of San Francisco’s Union Square District and Financial District on the corner of Bush Street and Grant Avenue, near the Dragon Gate entrance to the Chinatown neighborhood and four blocks from Market Street. The 530 Bush Street Property is approximately 0.2 miles northeast of Union Square, which features major international retailers such as Nike, Apple, Gucci, Cartier, Saks Fifth Avenue, Macy’s and Louis Vuitton and approximately 0.2 miles from the popular dining corridor known as Belden Place. In addition, the 530 Bush Street Property is within walking distance to the Montgomery BART station (0.3 miles), MUNI light rail, bus system stops and the Transbay Terminal development.
According to a third party market research report, the estimated 2021 population within a one-, three- and five-mile radius was approximately 139,193, 423,418 and 693,455, respectively and the estimated 2021 average household income within the same radii was approximately $149,191, $194,908 and $195,422, respectively.
According to a third party market research report, the 530 Bush Street Property is situated within the Union Square office submarket within the greater San Francisco office market. As of the fourth quarter of 2021, the submarket reported a total inventory of approximately 5.8 million square feet with a 20.2% vacancy rate and an average asking rent of $55.98 per square foot. The appraisal identified five directly competitive office rent comparables with rents ranging from $55.00 to $61.00 per square foot (full service leases). The appraisal concluded an office market rent of $59.00 per square foot (full service leases) and a lower level office market rent of $40.00 per square foot (full service leases).
The following table presents certain information relating to the appraisal’s market rent conclusion for the 530 Bush Street Property:
Market Rent Summary(1)
| | Office | Office LL |
| Market Rent (PSF) | $59.00 | $40.00 |
| Lease Term (Years) | 5.0 | 5.0 |
| Lease Type (Reimbursements) | Full Service BY | Full Service BY |
| Rent Increase Projection | 3.0% | 3.0% |
| (1) | Information obtained from the appraisal. |
The table below presents certain information relating to comparable sales pertaining to the 530 Bush Street Property identified by the appraisal:
Comparable Sales(1)
| Property Name | Location | Year Built | Rentable Area (SF) | Sale Date | Sale Price | Sale Price (PSF) |
Low-Rise Office 2001 Van Ness Avenue | San Francisco, CA | 1920 | 27,281 | Apr-2021 | $12,250,000 | $449 |
The Reserve 301 Battery Street | San Francisco, CA | 1924 | 185,850 | Feb-2020 | $143,000,000 | $769 |
222 Kearny & 180 Sutter 222 Kearny Street | San Francisco, CA | 1910, 1986 | 146,452 | Aug-2019 | $74,500,000 | $509 |
Low-Rise Office/Retail 735 Montgomery Street | San Francisco, CA | 1924 | 35,461 | Apr-2019 | $24,500,000 | $691 |
Orient Building 332 Pine Street | San Francisco, CA | 1912 | 51,522 | Jul-2018 | $36,480,000 | $708 |
| (1) | Information obtained from the appraisal. |
THE INFORMATION IN THIS COLLATERAL TERM SHEET IS NOT COMPLETE AND MAY BE AMENDED PRIOR TO THE TIME OF SALE. THIS TERM SHEET IS NOT AN OFFER TO SELL THESE SECURITIES AND IT IS NOT A SOLICITATION OF AN OFFER TO BUY THESE SECURITIES IN ANY JURISDICTION WHERE THE OFFER OR SALE IS NOT PERMITTED.
69
| Office – CBD | Loan #7 | Cut-off Date Balance: | | $19,500,000 |
| 530 Bush Street | 530 Bush Street | Cut-off Date LTV: | | 36.9% |
| San Francisco, CA 94108 | | U/W NCF DSCR: | | 3.58x |
| | | U/W NOI Debt Yield: | | 14.8% |
The following table presents certain information relating to comparable leases with respect to the 530 Bush Street Property:
Comparable Leases(1)
| Property Name/Location | Year Built | Total GLA (SF) | Occupancy | Tenant | Tenant Size (SF) | Lease Start Date | Lease Term | Annual Base Rent PSF | Lease Type |
530 Bush Street (Subject) San Francisco, CA | 1916, 1982 | 104,737(2) | 84.1%(2) | | | | | | |
222 Kearny Street San Francisco, CA | 1986 | 120,809 | 89% | Montgomery Technologies | 5,727 | Nov-21 | 7 Yrs. | $61.00 | FS |
250 Sutter Street San Francisco, CA | 1909 | 55,359 | 67% | Barrett SF | 7,980 | Sept-21 | 5.3 Yrs. | $60.89 | FS |
291 Geary Street San Francisco, CA | 1907 | 41,385 | 100% | RALLY | 3,223 | Jul-21 | 4.8 Yrs. | $56.00 | FS |
240 Stockton Street San Francisco, CA | 1908 | 40,442 | 100% | Hugo Parker | 3,692 | Apr-21 | 3 Yrs. | $55.00 | FS |
615 Grant Avenue San Francisco, CA | 1907 | 16,000 | 16% | Vacant | 4,313 | NAP | NAP | $55.00(3) | MG |
| (1) | Information obtained from the appraisal. |
| (2) | Information obtained from the underwritten rent roll. Includes the Consulate General of Ukraine, which leases 3,488 square feet on a month-to-month basis and has been included in the underwritten occupancy. If the tenant were underwritten as vacant, occupancy would be 80.8% as of December 31, 2021. |
| (3) | Asking annual base rent PSF. |
Escrows.
Real Estate Taxes – The 530 Bush Street Mortgage Loan documents require an upfront real estate tax reserve of approximately $181,023 and ongoing monthly real estate tax reserves in an amount equal to one-twelfth of the real estate taxes that the lender estimates will be necessary to pay taxes over the then succeeding twelve months (initially approximately $32,325).
Insurance – The 530 Bush Street Mortgage Loan documents require an upfront insurance reserve of approximately $38,430 and ongoing monthly insurance reserves in an amount equal to one-twelfth of the insurance premiums that the lender estimates will be payable for the renewal of the coverage afforded by the policies upon the expiration thereof (initially approximately $5,057).
Replacement Reserve – The 530 Bush Street Mortgage Loan documents require ongoing monthly replacement reserves of approximately $1,746, subject to a cap of $83,790.
TI/LC Reserve – The 530 Bush Street Mortgage Loan documents require an upfront TI/LC reserve of $2,000,000 and ongoing monthly TI/LC reserves of approximately $13,092 once the TI/LC reserve amount falls below $500,000 (the “Monthly Rollover Deposit Trigger”). Following the Monthly Rollover Deposit Trigger, the TI/LC reserve is capped at $1,000,000.
Unfunded Obligations Reserve – The 530 Bush Street Mortgage Loan documents require an upfront unfunded obligations reserve of $101,474 for tenant allowance, tenant improvements and leasing commissions associated with Colton Commercial & Partners ($13,370), SWA Group ($47,291) and Total Vision ($40,813).
Lockbox and Cash Management. The 530 Bush Street Mortgage Loan is structured with a hard lockbox and springing cash management upon the occurrence and continuance of a Cash Management Trigger Event (as defined below). The 530 Bush Street Borrower and property manager are required to direct the tenants to pay rent directly into the lockbox account, and to deposit any rents otherwise received in such account within two business days after receipt. During the continuance of a Cash Management Trigger Event, all funds in the lockbox account are required to be swept each business day to a lender-controlled cash management account and disbursed in accordance with the 530 Bush Street Mortgage Loan documents, and all excess funds on deposit in the cash management account (after payment of required monthly reserve deposits, the debt service payment on the 530 Bush Street Mortgage Loan, operating expenses and cash management bank fees) is required to be applied as follows: (a) if a Material Tenant Trigger Event (as defined below) has occurred and is continuing, to a material tenant rollover account, (b) if a Cash Sweep Trigger Event (as defined below) has occurred and is continuing, to the lender-controlled excess cash flow account (subject to a cap of $4,000,000; provided that such cap will not apply at any time (i) from and after the monthly payment date in February 2030 and/or (ii) the debt service coverage ratio is less than 2.55x) or (c) if no Material Tenant Trigger Event or Cash Sweep Trigger Event has occurred and is continuing, or if any excess remains after the preceding application, to the 530 Bush Street Borrower.
THE INFORMATION IN THIS COLLATERAL TERM SHEET IS NOT COMPLETE AND MAY BE AMENDED PRIOR TO THE TIME OF SALE. THIS TERM SHEET IS NOT AN OFFER TO SELL THESE SECURITIES AND IT IS NOT A SOLICITATION OF AN OFFER TO BUY THESE SECURITIES IN ANY JURISDICTION WHERE THE OFFER OR SALE IS NOT PERMITTED.
70
| Office – CBD | Loan #7 | Cut-off Date Balance: | | $19,500,000 |
| 530 Bush Street | 530 Bush Street | Cut-off Date LTV: | | 36.9% |
| San Francisco, CA 94108 | | U/W NCF DSCR: | | 3.58x |
| | | U/W NOI Debt Yield: | | 14.8% |
A “Cash Management Trigger Event” will commence upon the earlier of the following:
| (i) | the occurrence of an event of default; |
| (ii) | any bankruptcy action involving the 530 Bush Street Borrower, the key principal (collectively, Yvette Yeh Fung and Troy Crosby) or the property manager; |
| (iii) | the trailing 12-month period debt service coverage ratio falling below 2.50x; |
| (iv) | the indictment for fraud or misappropriation of funds of the 530 Bush Street Borrower, the key principal or an affiliated or third party property manager (provided that, in the case of the third party property manager, such fraud or misappropriation is related to the 530 Bush Street Property), or any director or officer of the aforementioned; or |
| (v) | a Material Tenant Trigger Event. |
A Cash Management Trigger Event will end upon the occurrence of the following:
| ● | with regard to clause (i) above, the cure of such event of default; |
| ● | with regard to clause (ii) above, the filing being discharged or dismissed within 45 days for the 530 Bush Street Borrower or the key principal, or within 120 days for the property manager, and the lender’s determination that such filing does not materially increase the 530 Bush Street Borrower’s or the key principal’s monetary obligations, or materially and adversely affect the key principal’s or the property manager’s ability to carry out their obligations under the 530 Bush Street Mortgage Loan documents, as applicable, or, in the case of the property manager, the replacement of the property manager with a third party property manager that constitutes a qualified property manager under the 530 Bush Street Mortgage Loan documents; |
| ● | with regard to clause (iii) above, the trailing 12-month debt service coverage ratio being at least 2.55x for two consecutive calendar quarters; |
| ● | with regard to clause (iv) above, the dismissal of the applicable indictment with prejudice or acquittal of the applicable person, or the replacement of the property manager with a third party property manager that constitutes a qualified property manager under the 530 Bush Street Mortgage Loan documents; or |
| ● | with regard to clause (v) above, a Material Tenant Trigger Event Cure (as defined below). |
A “Cash Sweep Trigger Event” will commence upon the earlier of the following:
| (i) | the occurrence of an event of default; |
| (ii) | any bankruptcy action involving the 530 Bush Street Borrower, the key principal or an affiliated property manager; or |
| (iii) | the trailing 12-month period debt service coverage ratio falling below 2.35x. |
A Cash Sweep Trigger Event will end upon the occurrence of the following:
| ● | with regard to clause (i) above, the cure of such event of default; |
| ● | with regard to clause (ii) above, the filing being discharged or dismissed within 45 days for the 530 Bush Street Borrower or the key principal, or within 120 days for the property manager, and the lender’s determination that such filing does not materially increase the 530 Bush Street Borrower’s or the key principal’s monetary obligations, or materially and adversely affect the key principal’s or the property manager’s ability to carry out their obligations under the 530 Bush Street Mortgage Loan documents, as applicable, or, in the case of the property manager, the replacement of the property manager with a third party property manager that constitutes a qualified property manager under the 530 Bush Street Mortgage Loan documents; or |
| ● | with regard to clause (iii) above, the trailing 12-month debt service coverage ratio being at least 2.40x for two consecutive calendar quarters. |
A “Material Tenant Trigger Event” will commence upon the occurrence of any of the following:
| (i) | a Material Tenant (as defined below) giving notice of its intention to terminate, cancel or not to extend or renew its lease; |
| (ii) | on or prior to the date that is 12 months prior to the then applicable expiration date under the applicable Material Tenant lease, if the Material Tenant does not extend or renew such Material Tenant lease; |
| (iii) | on or prior to the date a Material Tenant is required under its Material Tenant lease to notify the borrower of its election to extend or renew its lease, if such Material Tenant does not give notice; |
| (iv) | an event of default under a Material Tenant lease occurring and continuing beyond any applicable notice and/or cure period; |
| (v) | a bankruptcy action of a Material Tenant or guarantor of any Material Tenant lease occurring; |
| (vi) | a Material Tenant lease being terminated or no longer being in full force and effect; or |
| (vii) | a Material Tenant “going dark”, vacating, ceasing to occupy or ceasing to conduct business in the ordinary course at the 530 Bush Street Property or a portion thereof. |
A “Material Tenant Trigger Event Cure” will commence upon the occurrence of any of the following:
| ● | with regard to clause (i) above, the date that (x) the applicable Material Tenant revokes or rescinds all termination or cancellation notices, (y) the applicable Material Tenant lease is extended on terms satisfying the requirements of the 530 Bush Street Mortgage Loan documents or (z) all or substantially all of the applicable Material Tenant space is leased to a replacement tenant; |
| ● | with regard to clause (ii) above, the date that (x) the applicable Material Tenant lease is extended on terms satisfying the requirements of the 530 Bush Street Mortgage Loan documents or (y) all or substantially all of the applicable Material Tenant space is leased to a replacement tenant; |
THE INFORMATION IN THIS COLLATERAL TERM SHEET IS NOT COMPLETE AND MAY BE AMENDED PRIOR TO THE TIME OF SALE. THIS TERM SHEET IS NOT AN OFFER TO SELL THESE SECURITIES AND IT IS NOT A SOLICITATION OF AN OFFER TO BUY THESE SECURITIES IN ANY JURISDICTION WHERE THE OFFER OR SALE IS NOT PERMITTED.
71
| Office – CBD | Loan #7 | Cut-off Date Balance: | | $19,500,000 |
| 530 Bush Street | 530 Bush Street | Cut-off Date LTV: | | 36.9% |
| San Francisco, CA 94108 | | U/W NCF DSCR: | | 3.58x |
| | | U/W NOI Debt Yield: | | 14.8% |
| ● | with regard to clause (iii) above, the date that (x) the applicable Material Tenant lease is extended on terms satisfying the requirements of the 530 Bush Street Mortgage Loan documents or (y) all or substantially all of the applicable Material Tenant space is leased to a replacement tenant; |
| ● | with regard to clause (iv) above, a cure of the applicable event of default; |
| ● | with regard to clause (v) above, the affirmation of the Material Tenant lease in the applicable bankruptcy proceeding and confirmation that the Material Tenant is actually paying all rents and other amounts under its lease (or, if applicable, the discharge or dismissal of the applicable Material Tenant lease guarantor from the applicable bankruptcy proceeding; provided that such bankruptcy (after dismissal or discharge) does not have an adverse effect on such Material Tenant lease guarantor’s ability to perform its obligations under its lease guaranty); |
| ● | with regard to clause (vi) above, all or substantially all of the applicable Material Tenant space (or in connection with a partial termination, the applicable portion of the Major Tenant space) being leased to a replacement tenant; or |
| ● | with regard to clause (vii) above, the Material Tenant re-commencing its normal business operations at the 530 Bush Street Property. |
A “Material Tenant” means any tenant at the 530 Bush Street Property that, together with its affiliates, either (a) leases no less than 25% of the total rentable square footage of the 530 Bush Street Property or (b) accounts for (or would account for) no less than 25% of the total in-place base rent at the 530 Bush Street Property.
Property Management. The 530 Bush Street Property is managed by CBRE, Inc., a third-party property manager.
Real Estate Substitution. Not permitted.
Subordinate and Mezzanine Indebtedness. Not permitted.
Ground Lease. None.
Terrorism Insurance. The 530 Bush Street Mortgage Loan documents require that the “all risk” insurance policy required to be maintained by the 530 Bush Street Borrower provides coverage for terrorism in an amount equal to the full replacement cost of the 530 Bush Street Property, as well as business interruption insurance covering no less than the 12-month period following the occurrence of a casualty event, together with a 6-month extended period of indemnity.
THE INFORMATION IN THIS COLLATERAL TERM SHEET IS NOT COMPLETE AND MAY BE AMENDED PRIOR TO THE TIME OF SALE. THIS TERM SHEET IS NOT AN OFFER TO SELL THESE SECURITIES AND IT IS NOT A SOLICITATION OF AN OFFER TO BUY THESE SECURITIES IN ANY JURISDICTION WHERE THE OFFER OR SALE IS NOT PERMITTED.
72
| Retail – Single Tenant | Loan #8 | Cut-off Date Balance: | | $18,000,000 |
| Property Addresses – Various | KNP Portfolio | Cut-off Date LTV: | | 60.0% |
| | | U/W NCF DSCR: | | 2.12x |
| | | U/W NOI Debt Yield: | | 8.9% |
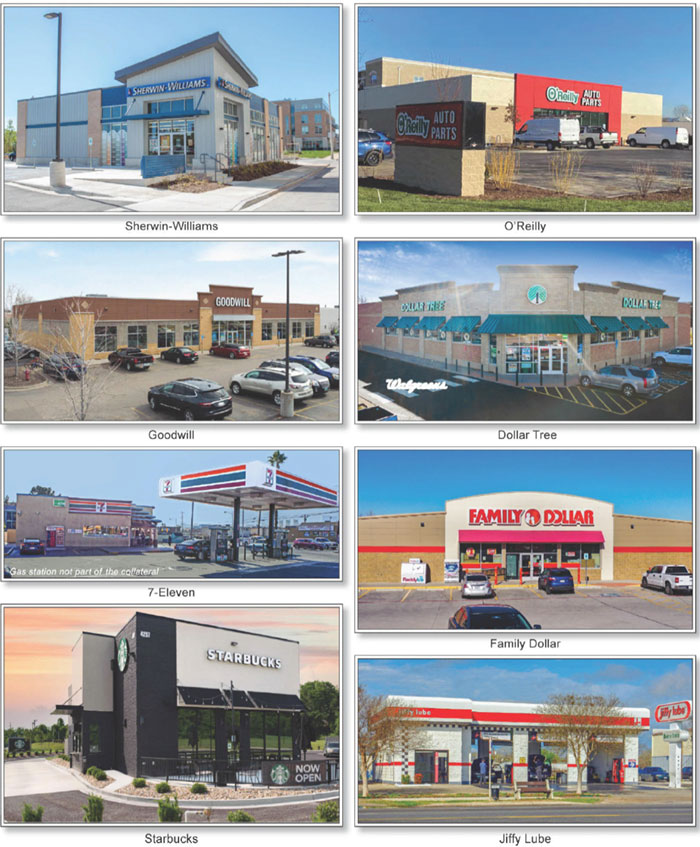
THE INFORMATION IN THIS COLLATERAL TERM SHEET IS NOT COMPLETE AND MAY BE AMENDED PRIOR TO THE TIME OF SALE. THIS TERM SHEET IS NOT AN OFFER TO SELL THESE SECURITIES AND IT IS NOT A SOLICITATION OF AN OFFER TO BUY THESE SECURITIES IN ANY JURISDICTION WHERE THE OFFER OR SALE IS NOT PERMITTED.
73
| Mortgage Loan Information | | Mortgaged Property Information(2) |
| Mortgage Loan Seller: | UBS AG | | Single Asset/Portfolio: | Portfolio |
Credit Assessment (Fitch/KBRA/Moody’s): | NR/NR/NR | | Property Type – Subtype: | Retail – Single Tenant |
| Original Principal Balance: | $18,000,000 | | Location: | Various – See Table |
| Cut-off Date Balance: | $18,000,000 | | Size: | 62,675 SF |
| % of Initial Pool Balance: | 3.4% | | Cut-off Date Balance Per SF: | $287.20 |
| Loan Purpose: | Acquisition | | Maturity Date Balance Per SF: | $287.20 |
| Borrower Sponsor: | Keystone National Properties, LLC | | Year Built/Renovated: | Various – See Table |
| Guarantor: | Michael Packman | | Title Vesting: | Fee |
| Mortgage Rate: | 4.0000% | | Property Manager: | REIS Associates LLC |
| Note Date: | February 3, 2022 | | Current Occupancy (As of): | 100.0% (1/1/2022) |
| Seasoning: | 2 months | | YE 2021 Occupancy(3): | NAV |
| Maturity Date: | February 6, 2032 | | YE 2020 Occupancy(3): | NAV |
| IO Period: | 120 months | | YE 2019 Occupancy(3): | NAV |
| Loan Term (Original): | 120 months | | YE 2018 Occupancy(3): | NAV |
| Amortization Term (Original): | NAP | | As-Is Appraised Value: | $30,025,000 |
| Loan Amortization Type: | Interest Only | | As-Is Appraised Value Per SF: | $479.06 |
| Call Protection: | L(26),D(90),O(4) | | As-Is Appraisal Valuation Date: | Various |
| Lockbox Type: | Hard/Springing Cash Management | | |
| Additional Debt: | None | | Underwriting and Financial Information(2) |
| Additional Debt Type (Balance): | NAP | | YE 2021 NOI(3): | NAV |
| | | | YE 2020 NOI(3): | NAV |
| | | | YE 2019 NOI(3): | NAV |
| | | | YE 2018 NOI(3): | NAV |
| | | | U/W Revenues: | $1,655,408 |
| | | | U/W Expenses: | $49,662 |
| Escrows and Reserves(1) | | U/W NOI: | $1,605,746 |
| | Initial | Monthly | Cap | | U/W NCF: | $1,545,242 |
| RE Taxes | $8,503 | $3,270 | NAP | | U/W DSCR based on NOI/NCF: | 2.20x / 2.12x |
| Insurance | $6,732 | $4,208 | NAP | | U/W Debt Yield based on NOI/NCF: | 8.9% / 8.6% |
| Replacement Reserve | $0 | $1,149 | $55,154 | | U/W Debt Yield at Maturity based on NOI/NCF: | 8.9% / 8.6% |
| TI/LC Reserve | $0 | $0 | NAP | | Cut-off Date LTV Ratio: | 60.0% |
| | | | | | LTV Ratio at Maturity: | 60.0% |
| | | | | | | | |
| Sources and Uses |
| Sources | | | | | Uses | | | |
| Original loan amount | $18,000,000 | | 54.8 | % | | Purchase price | $31,350,000 | | 95.5 | % |
| Sponsor equity | 14,823,402 | | 45.2 | | | Closing costs | 1,458,167 | | 4.4 | |
| | | | | | | Upfront reserves | 15,235 | | 0.0 | |
| Total Sources | $32,823,402 | | 100.0 | % | | Total Uses | $32,823,402 | | 100.0 | % |
| (1) | See “Escrows” section below. |
| (2) | While the KNP Portfolio Mortgage Loan (as defined below) was originated after the emergence of the novel coronavirus pandemic and the economic disruption resulting from measures to combat the pandemic, the pandemic is an evolving situation and could impact the KNP Portfolio Mortgage Loan more severely than assumed in the underwriting of the KNP Portfolio Mortgage Loan. The pandemic and resulting economic disruption could also adversely affect the NOI, NCF and occupancy information, as well as the appraised value and the DSCR, LTV and Debt Yield metrics presented above. See “Risk Factors—Risks Related to Market Conditions and Other External Factors—Coronavirus Pandemic Has Adversely Affected the Global Economy and Will Likely Adversely Affect the Performance of the Mortgage Loans” in the Preliminary Prospectus. |
| (3) | The KNP Portfolio Borrower (as defined below) acquired the KNP Portfolio (as defined below) in 2022. As such, historical occupancy and NOI are unavailable. |
The Mortgage Loan. The mortgage loan (the “KNP Portfolio Mortgage Loan”) is evidenced by a single promissory note secured by a first priority fee mortgage encumbering eight single tenant retail properties totaling 62,675 square feet located across seven states (collectively, the “KNP Portfolio” or the “KNP Portfolio Properties”).
The Borrower and Borrower Sponsor. The borrower is Keystone 1031 Net Leased Portfolio II, DST (the “KNP Portfolio Borrower”), a Delaware statutory trust with at least one independent director. The non-recourse carveout guarantor is Michael Packman. Michael Packman is the founder and Chief Executive Officer of Keystone National Properties, LLC, the borrower sponsor of the KNP Portfolio Mortgage Loan. Keystone National Properties, LLC is a real estate and private equity firm founded in 2016. The KNP Portfolio Borrower is permitted to have up to 100 owners of its beneficial interests. The guarantor is not required to maintain any interest in the KNP
THE INFORMATION IN THIS COLLATERAL TERM SHEET IS NOT COMPLETE AND MAY BE AMENDED PRIOR TO THE TIME OF SALE. THIS TERM SHEET IS NOT AN OFFER TO SELL THESE SECURITIES AND IT IS NOT A SOLICITATION OF AN OFFER TO BUY THESE SECURITIES IN ANY JURISDICTION WHERE THE OFFER OR SALE IS NOT PERMITTED.
74
| Retail – Single Tenant | Loan #8 | Cut-off Date Balance: | | $18,000,000 |
| Property Addresses – Various | KNP Portfolio | Cut-off Date LTV: | | 60.0% |
| | | U/W NCF DSCR: | | 2.12x |
| | | U/W NOI Debt Yield: | | 8.9% |
Portfolio Borrower, but is obligated to at all times maintain control of the KNP Portfolio Borrower. The KNP Portfolio Borrower is required under the KNP Portfolio Mortgage Loan documents to convert into a Delaware limited liability company upon the occurrence of any of the following (1) any event that causes its signatory trustee to cease to be the signatory trustee of KNP Portfolio Borrower, (2) any event relating to (or resulting in) the dissolution of KNP Portfolio Borrower, (3) an event of default (or if an event of default is imminent) under the KNP Portfolio Mortgage Loan, or (4) KNP Portfolio Borrower being unable to make any material decision or take any material actions without jeopardizing the tax treatment of the beneficial interests therein.
The KNP Portfolio Borrower has master leased the KNP Portfolio Properties to Keystone 1031 Net Leased Portfolio II Master Tenant, LLC (the “Master Tenant”) owned by Keystone National Properties, LLC, which is in turn owned by the guarantor. The Master Tenant is a Delaware limited liability company structured to be bankruptcy-remote, with one independent director. The master lease is subordinate to the KNP Portfolio Mortgage Loan. The Master Tenant is obligated under the master lease to pay the KNP Portfolio Borrower the rent provided for therein. As collateral for the Master Tenant’s obligation to pay rent under the master lease to the KNP Portfolio Borrower, the Master Tenant has assigned to the KNP Portfolio Borrower all of the Master Tenant’s right, title and interest, in and to the rents paid by the tenants of the KNP Portfolio Properties. The KNP Portfolio Borrower has pledged as collateral for the KNP Portfolio Mortgage Loan all of its assets, which would include its right to the assignment of rents paid by the tenants of the KNP Portfolio Properties. In addition, the Master Tenant has agreed under the KNP Portfolio Mortgage Loan documents to cause all tenants at the KNP Portfolio Properties to deposit their rents directly into a clearing account established for the benefit of the lender.
The Properties. The KNP Portfolio is comprised of eight single tenant retail properties totaling 62,675 square feet located across seven states. The KNP Portfolio Properties are located in Minnesota (one property, 32.9% of net rentable area), Colorado (one property, 23.6% of net rentable area), Texas (two properties, 17.9% of net rentable area), Illinois (one property, 11.9% of net rentable area), Wisconsin (one property, 5.6% of net rentable area), Nevada (one property, 4.7% of net rentable area) and Indiana (one property, 3.5% of net rentable area). Built between 1987 and 2021, the KNP Portfolio Properties range in size from 2,200 square feet to 20,600 square feet. As of January 1, 2022, the KNP Portfolio Properties were 100.0% occupied.
The KNP Portfolio Properties are leased to eight nationally recognized tenants, four of which (37.4% of net rentable area, 53.3% of underwritten base rent) are investment grade entities or subsidiaries of investment grade-rated entities. Five of the KNP Portfolio Properties, representing 86.2% of net rentable area and 74.3% of underwritten base rent, have leases expiring after the stated maturity date of the KNP Portfolio Mortgage Loan.
The following table presents certain information regarding the KNP Portfolio Properties:
KNP Portfolio Summary
| Property Name | City, State | Allocated Cut-off Date Balance | % of Cut-off Date Balance | Occupancy(1) | Year Built/ Renovated | Net Rentable Area (SF)(1) | Appraised Value | UW NOI | % of UW NOI |
| Dollar Tree | Thornton, CO | $5,000,000 | 27.8% | 100.0% | 2009/NAP | 14,820 | $8,270,000 | $445,624 | 27.8% |
| Goodwill | Forest Lake, MN | $2,900,000 | 16.1% | 100.0% | 2012/NAP | 20,600 | $4,900,000 | $289,970 | 18.1% |
| Jiffy Lube | San Antonio, TX | $2,200,000 | 12.2% | 100.0% | 1995/NAP | 2,889 | $3,640,000 | $189,707 | 11.8% |
| 7-Eleven | Las Vegas, NV | $2,200,000 | 12.2% | 100.0% | 1987/NAP | 2,919 | $3,650,000 | $187,948 | 11.7% |
| O'Reilly | Bensenville, IL | $1,800,000 | 10.0% | 100.0% | 2020/NAP | 7,427 | $3,075,000 | $153,304 | 9.5% |
| Sherwin Williams | Milwaukee, WI | $1,400,000 | 7.8% | 100.0% | 2018/NAP | 3,500 | $2,410,000 | $126,921 | 7.9% |
| Starbucks | Bloomington, IN | $1,400,000 | 7.8% | 100.0% | 2021/NAP | 2,200 | $2,290,000 | $114,378 | 7.1% |
| Family Dollar | Fort Worth, TX | $1,100,000 | 6.1% | 100.0% | 2017/NAP | 8,320 | $1,790,000 | $97,893 | 6.1% |
| Total/Weighted Average | $18,000,000 | 100.0% | 100.0% | | 62,675 | $30,025,000 | $1,605,746 | 100.0% |
| (1) | Information obtained from the underwritten rent roll. |
Major Tenants.
Largest Tenant: Goodwill (20,600 square feet; 32.9% of net rentable area; 18.5% of underwritten base rent; May 31, 2032 lease expiration) - Goodwill Industries International, Inc. (“GII”) was established in 1902 and was later incorporated in 1910 in the Commonwealth of Massachusetts. GII functions as a member association comprised of a network of independent community-based Goodwill organizations in the United States and Canada and international affiliates. GII works to enhance the dignity and quality of life of individuals and families by strengthening communities, eliminating barriers to opportunity, and helping people in need reach their full potential through learning and the power of work. Each local Goodwill organization is an autonomous member of GII that operates as a nonprofit corporation. Goodwill currently operates 156 local Goodwill organizations across the United States, Canada and 12 other countries. Goodwill organizations assist people through a variety of employment placement services, job training programs and other community-based services. In 2020, approximately 126,938 people were placed into jobs in the United States with help from their local Goodwill. Goodwill has been at the Forest Lake, MN premises since June 2012 and exercised its two, five-year renewal options in March 2021 with a current lease expiration date of May 31, 2032. Goodwill has no early termination options and no renewal options remaining.
THE INFORMATION IN THIS COLLATERAL TERM SHEET IS NOT COMPLETE AND MAY BE AMENDED PRIOR TO THE TIME OF SALE. THIS TERM SHEET IS NOT AN OFFER TO SELL THESE SECURITIES AND IT IS NOT A SOLICITATION OF AN OFFER TO BUY THESE SECURITIES IN ANY JURISDICTION WHERE THE OFFER OR SALE IS NOT PERMITTED.
75
| Retail – Single Tenant | Loan #8 | Cut-off Date Balance: | | $18,000,000 |
| Property Addresses – Various | KNP Portfolio | Cut-off Date LTV: | | 60.0% |
| | | U/W NCF DSCR: | | 2.12x |
| | | U/W NOI Debt Yield: | | 8.9% |
2nd Largest Tenant: Dollar Tree (Baa2/BBB: Moody’s/S&P; 14,820 square feet; 23.6% of net rentable area; 27.6% of underwritten base rent; December 31, 2034 lease expiration) - Dollar Tree, Inc., a Fortune 200 company, is an operator of discount variety stores that has served North America for more than thirty years. Dollar Tree, Inc. is headquartered in Chesapeake, Virginia and operates over 15,500 stores across the 48 contiguous states and five Canadian provinces, supported by a coast-to-coast logistics network and more than 193,000 associates. Stores operate under the brands of Dollar Tree, Family Dollar, and Dollar Tree Canada. Dollar Tree subleases the 14,820 square foot premises in Thornton, CO from Walgreen Co. (BBB-/Baa2/BBB by Fitch/Moody's/S&P), a subsidiary of Walgreens Boots Alliance, Inc. (NASDAQ: WBA). Dollar Tree has a 10-year sublease that commenced in September 2020 and expires in September 2030 with one extension option to October 2034, which coincides with Walgreen’s first termination right. Dollar Tree’s sublease rent is $10.05 per square foot, while the prime lease rent is $30.70 per square foot. The KNP Portfolio Mortgage Loan was underwritten based on the Walgreen Co. prime lease rent. Rent is paid directly by Walgreen Co. Dollar Tree does not have its own right of first refusal and does not have the right to cause Walgreen Co. to exercise its right of first refusal. Walgreen Co. remains responsible for all tenant obligations under the lease. The 75-year Walgreen Co. lease commenced in October 2009 and expires in October 2084 with an ongoing monthly termination right beginning in November 2034, upon 12 months' notice. Walgreen Co. subleased the premises in Thornton, CO to Dollar Tree in September 2020.
3rd Largest Tenant: Family Dollar (Baa2/BBB: Moody’s/S&P; 8,320 square feet; 13.3% of net rentable area; 6.3% of underwritten base rent; March 31, 2033 lease expiration) - Family Dollar is a business segment of Dollar Tree. Family Dollar operates general merchandise retail discount stores providing customers with a selection of competitively-priced merchandise in neighborhood stores. Family Dollar operates 7,880 Family Dollar stores ranging in size from 6,000 - 8,000 selling square feet as of January 30, 2021. Family Dollar sells merchandise at prices that generally range from $1.00 to $10.00. The Family Dollar segment consists of store operations under the Family Dollar brand and 11 distribution centers. Family Dollar has a lease commencement date of April 2018 with a current lease expiration date of March 2033. Family Dollar has no early termination options and six, five-year renewal options remaining.
The following table presents certain information relating to the tenancy at the KNP Portfolio Properties:
Major Tenants
| Tenant Name | Credit Rating (Fitch/ Moody’s/
S&P)(1) | Tenant NRSF | % of
NRSF | Annual U/W Base Rent PSF(2) | Annual
U/W Base Rent(2) | % of Total Annual U/W Base Rent | Lease
Expiration
Date | Extension Options | Termination Option (Y/N) |
| Major Tenants | | | | | | | | |
| Goodwill | NR/NR/NR | 20,600 | 32.9% | $14.84 | $305,704 | 18.5% | 5/31/2032 | None | N |
| Dollar Tree(3) | NR/Baa2/BBB | 14,820 | 23.6% | $30.70 | $455,000 | 27.6% | 10/31/2034(3) | 50, 1-year | Y(3) |
| Family Dollar | NR/Baa2/BBB | 8,320 | 13.3% | $12.40 | $103,205 | 6.3% | 3/31/2033 | 6, 5-year | N |
| O'Reilly | NR/Baa1/BBB | 7,427 | 11.9% | $21.76 | $161,622 | 9.8% | 1/1/2036 | 4, 5-year | N |
| Sherwin Williams | BBB/Baa2/BBB | 3,500 | 5.6% | $35.50 | $124,250 | 7.5% | 8/31/2028 | 3, 5-year | N |
| 7-Eleven | NR/Baa2/A | 2,919 | 4.7% | $63.37 | $184,988 | 11.2% | 1/4/2029 | 3, 5-year | N |
| Jiffy Lube | AAA/Aa3/NR | 2,889 | 4.6% | $69.23 | $200,000 | 12.1% | 7/31/2036 | 4, 5-year | N |
| Starbucks | BBB/Baa1/BBB+ | 2,200 | 3.5% | $52.00 | $114,400 | 6.9% | 5/31/2031 | 4, 5-year | N |
| Total Major Tenants | 62,675 | 100.0% | $26.31 | $1,649,169 | 100.0% | | | |
| | | | | | | | | |
| Vacant Space | 0 | 0.0% | | | | | | |
| | | | | | | | | |
| Collateral Total | 62,675 | 100.0% | | | | | | |
| | | | | | | | | |
| (1) | Certain ratings are those of the parent company whether or not the parent company guarantees the lease. |
| (2) | Annual U/W Base Rent PSF and Annual U/W Base Rent include rent steps through March 2023. |
| (3) | Dollar Tree subleases the 14,820 square foot premises in Thornton, CO from Walgreen Co. (BBB-/Baa2/BBB by Fitch/Moody's/S&P), a subsidiary of Walgreens Boots Alliance, Inc. (NASDAQ: WBA). The lease information in the table above is reflective of the Walgreen Co. lease. Dollar Tree has a 10-year sublease that commenced in September 2020 and expires in September 2030 with one extension option to October 2034, which coincides with Walgreen’s first termination right. Dollar Tree’s sublease rent is $10.05 per square foot. Rent is paid directly by Walgreen Co. Walgreen Co. remains responsible for all tenant obligations under the lease. The 75-year Walgreen Co. lease commenced in October 2009 and expires in October 2084 with an ongoing monthly termination right beginning in November 2034, upon 12 months' notice. The 10/31/2034 expiration date set forth above assumes that the lease is terminated effective as of the first termination option date. |
THE INFORMATION IN THIS COLLATERAL TERM SHEET IS NOT COMPLETE AND MAY BE AMENDED PRIOR TO THE TIME OF SALE. THIS TERM SHEET IS NOT AN OFFER TO SELL THESE SECURITIES AND IT IS NOT A SOLICITATION OF AN OFFER TO BUY THESE SECURITIES IN ANY JURISDICTION WHERE THE OFFER OR SALE IS NOT PERMITTED.
76
| Retail – Single Tenant | Loan #8 | Cut-off Date Balance: | | $18,000,000 |
| Property Addresses – Various | KNP Portfolio | Cut-off Date LTV: | | 60.0% |
| | | U/W NCF DSCR: | | 2.12x |
| | | U/W NOI Debt Yield: | | 8.9% |
The following table presents certain information relating to the lease rollover schedule at the KNP Portfolio Properties:
Lease Expiration Schedule(1)(2)
Year Ending
December 31, | No. of Leases Expiring | Expiring NRSF | % of Total NRSF | Cumulative Expiring NRSF | Cumulative % of Total NRSF | Annual
U/W
Base Rent | % of Total Annual U/W Base Rent | Annual
U/W
Base Rent
PSF |
| MTM | 0 | 0 | 0.0% | 0 | 0.0% | $0 | 0.0% | $0.00 |
| 2022 | 0 | 0 | 0.0% | 0 | 0.0% | $0 | 0.0% | $0.00 |
| 2023 | 0 | 0 | 0.0% | 0 | 0.0% | $0 | 0.0% | $0.00 |
| 2024 | 0 | 0 | 0.0% | 0 | 0.0% | $0 | 0.0% | $0.00 |
| 2025 | 0 | 0 | 0.0% | 0 | 0.0% | $0 | 0.0% | $0.00 |
| 2026 | 0 | 0 | 0.0% | 0 | 0.0% | $0 | 0.0% | $0.00 |
| 2027 | 0 | 0 | 0.0% | 0 | 0.0% | $0 | 0.0% | $0.00 |
| 2028 | 1 | 3,500 | 5.6% | 3500 | 5.6% | $124,250 | 7.5% | $35.50 |
| 2029 | 1 | 2,919 | 4.7% | 6419 | 10.2% | $184,988 | 11.2% | $63.37 |
| 2030 | 0 | 0 | 0.0% | 6419 | 10.2% | $0 | 0.0% | $0.00 |
| 2031 | 1 | 2,200 | 3.5% | 8619 | 13.8% | $114,400 | 6.9% | $52.00 |
| 2032 | 1 | 20,600 | 32.9% | 29219 | 46.6% | $305,704 | 18.5% | $14.84 |
| Thereafter | 4 | 33,456 | 53.4% | 62,675 | 100.0% | $919,827 | 55.8% | $27.49 |
| Vacant | 0 | 0 | 0.0% | 62,675 | 100.0% | $0 | 0.0% | $0.00 |
| Total/Weighted Average | 8 | 62,675 | 100.0% | | | $1,649,169 | 100.0% | $26.31 |
| (1) | Information obtained from the underwritten rent roll and includes rent steps through March 2023. |
| (2) | Certain tenants may have lease termination options that are exercisable prior to the originally stated expiration date of the subject lease and that are not considered in the Lease Expiration Schedule. |
The following table presents historical occupancy percentages at the KNP Portfolio Properties:
Historical Occupancy
2018(1) | | 2019(1) | | 2020(1) | | 2021(1) | | 1/1/2022(2) |
| NAV | | NAV | | NAV | | NAV | | 100.0% |
| (1) | The KNP Portfolio Borrower acquired the KNP Portfolio in 2022. As such, historical occupancy is unavailable. |
| (2) | Information obtained from the underwritten rent roll. |
COVID-19 Update. As of February 22, 2022, the KNP Portfolio Properties are open and operating. Approximately 100.0% of rent has been collected since April 2021. Goodwill (32.9% of net rentable area; 18.5% of underwritten base rent) requested rent relief and its lease terms were restructured in March 2021. Goodwill has paid rent in full and on time since the restructured lease agreement was executed. As of February 22, 2022, the KNP Portfolio Mortgage Loan is not subject to any modification or forbearance request.
THE INFORMATION IN THIS COLLATERAL TERM SHEET IS NOT COMPLETE AND MAY BE AMENDED PRIOR TO THE TIME OF SALE. THIS TERM SHEET IS NOT AN OFFER TO SELL THESE SECURITIES AND IT IS NOT A SOLICITATION OF AN OFFER TO BUY THESE SECURITIES IN ANY JURISDICTION WHERE THE OFFER OR SALE IS NOT PERMITTED.
77
| Retail – Single Tenant | Loan #8 | Cut-off Date Balance: | | $18,000,000 |
| Property Addresses – Various | KNP Portfolio | Cut-off Date LTV: | | 60.0% |
| | | U/W NCF DSCR: | | 2.12x |
| | | U/W NOI Debt Yield: | | 8.9% |
Underwritten Net Cash Flow. The following table presents certain information relating to the underwritten net cash flow at the KNP Portfolio Properties:
Cash Flow Analysis(1)
| | | U/W | | %(2) | | U/W $ per SF | |
| Base Rent | | $1,649,169(3) | | 95.5% | | $26.31 | |
| Straight Line Rent | | 28,900 | | 1.7 | | 0.46 | |
| Grossed Up Vacant Space | | 0 | | 0.0 | | 0.00 | |
| Gross Potential Rent | | $1,678,069 | | 97.1% | | $26.77 | |
| Other Income | | 0 | | 0.0 | | 0.00 | |
| Total Recoveries | | 49,662 | | 2.9 | | 0.79 | |
| Net Rental Income | | $1,727,731 | | 100.0% | | $27.57 | |
| (Vacancy & Credit Loss) | | (72,323)(4) | | (4.3) | | (1.15) | |
| Effective Gross Income | | $1,655,408 | | 95.8% | | $26.41 | |
| | | | | | | | |
| Real Estate Taxes | | 0 | | 0.0 | | 0.00 | |
| Insurance | | 0 | | 0.0 | | 0.00 | |
| Management Fee | | 49,662 | | 3.0 | | 0.79 | |
| Other Operating Expenses | | 0 | | 0.0 | | 0.00 | |
| Total Operating Expenses | | $49,662 | | 3.0% | | $0.79 | |
| | | | | | | | |
| Net Operating Income | | $1,605,746 | | 97.0% | | $25.62 | |
| Replacement Reserves | | 13,521 | | 0.8 | | 0.22 | |
| TI/LC | | 46,983 | | 2.8 | | 0.75 | |
| Net Cash Flow | | $1,545,242 | | 93.3% | | $24.65 | |
| | | | | | | | |
| NOI DSCR | | 2.20x | | | | | |
| NCF DSCR | | 2.12x | | | | | |
| NOI Debt Yield | | 8.9% | | | | | |
| NCF Debt Yield | | 8.6% | | | | | |
| (1) | The borrower sponsor recently acquired the KNP Portfolio Properties in February 2022. As such, historical cash flows are not available. |
| (2) | Represents (i) percent of Net Rental Income for all revenue fields, (ii) percent of Gross Potential Rent for Vacancy & Credit Loss and (iii) percent of Effective Gross Income for all other fields. |
| (3) | The U/W Base Rent includes $30,432 in rent steps through March 2023. |
| (4) | The KNP Portfolio Properties were 100.0% occupied as of January 1, 2022. |
Appraisals. According to the appraisals dated between October 26, 2021 and November 13, 2021, the KNP Portfolio Properties had an aggregate “as-is” appraised value of $30,025,000.
Environmental Matters. According to the Phase I environmental site assessments dated between June 15, 2021 and November 24, 2021, there was no evidence of any recognized environmental conditions at the KNP Portfolio Properties. Two controlled recognized environmental conditions were identified at the Sherwin Williams property relating to contamination from historical uses as a filling station, machine shops and an iron scrap yard, and to contamination at certain adjoining sites, and a business environmental risk was identified at the 7-Eleven property relating to its use as a gas station and operation of underground storage tanks. See “Description of the Mortgage Pool—Environmental Considerations” in the Preliminary Prospectus.
Market Overview and Competition. The KNP Portfolio Properties are located throughout seven states consisting of Minnesota (32.9% of net rentable area; 18.5% of underwritten base rent), Colorado (23.6% of net rentable area; 27.6% of underwritten base rent), Texas (17.9% of net rentable area; 18.4% of underwritten base rent), Illinois (11.9% of net rentable area; 9.8% of underwritten base rent), Wisconsin (5.6% of net rentable area; 7.5% of underwritten base rent), Nevada (4.7% of net rentable area; 11.2% of underwritten base rent) and Indiana (3.5% of net rentable area; 6.9% of underwritten base rent). The KNP Portfolio Properties are located in submarkets with vacancy rates ranging from 1.7% to 8.9% as of the fourth quarter of 2021, with a weighted average vacancy rate of 4.0%.
THE INFORMATION IN THIS COLLATERAL TERM SHEET IS NOT COMPLETE AND MAY BE AMENDED PRIOR TO THE TIME OF SALE. THIS TERM SHEET IS NOT AN OFFER TO SELL THESE SECURITIES AND IT IS NOT A SOLICITATION OF AN OFFER TO BUY THESE SECURITIES IN ANY JURISDICTION WHERE THE OFFER OR SALE IS NOT PERMITTED.
78
| Retail – Single Tenant | Loan #8 | Cut-off Date Balance: | | $18,000,000 |
| Property Addresses – Various | KNP Portfolio | Cut-off Date LTV: | | 60.0% |
| | | U/W NCF DSCR: | | 2.12x |
| | | U/W NOI Debt Yield: | | 8.9% |
The table below presents certain market information with respect to the KNP Portfolio Properties:
Market Overview
| Property | City, State | Net Rentable Area (SF)(1) | Submarket(2) | Submarket Vacancy(2) | Submarket Inventory (SF)(2) | Submarket NNN Rent PSF(2) | UW Base Rent PSF(1) | Appraisal Market Rent PSF |
| Dollar Tree | Thornton, CO | 14,820 | Northeast | 4.5% | 15,394,048 | $21.36 | $30.70 | $31.00 |
| Goodwill | Forest Lake, MN | 20,600 | Rosedale | 2.5% | 17,056,848 | $16.51 | $14.84 | $15.00 |
| Jiffy Lube | San Antonio, TX | 2,889 | North Central | 4.9% | 22,044,206 | $20.68 | $69.23 | $69.23 |
| 7-Eleven | Las Vegas, NV | 2,919 | Central East Las Vegas | 8.9% | 15,835,227 | $22.67 | $63.37 | $65.00 |
| O'Reilly | Bensenville, IL | 7,427 | O’Hare | 5.4% | 12,972,537 | $18.77 | $21.76 | $22.00 |
| Sherwin Williams | Milwaukee, WI | 3,500 | Third Ward/Walkers Pt | 3.1% | 1,910,210 | $14.69 | $35.50 | $35.50 |
| Starbucks(3) | Bloomington, IN | 2,200 | Bloomington | 1.7% | 8,774,560 | $15.54 | $52.00 | $52.00 |
| Family Dollar | Fort Worth, TX | 8,320 | East Fort Worth | 4.8% | 4,424,424 | $14.70 | $12.40 | $12.50 |
| Total/Weighted Average | 62,675 | | 4.0% | 13,539,172 | $18.03 | $26.31 | $26.55 |
| (1) | Information obtained from the underwritten rent roll. |
| (2) | Information obtained from third party market research reports as of the fourth quarter of 2021. |
| (3) | No submarket data for the Starbucks property was available. Market information is presented in the table above. |
The following table presents certain demographic information with respect to the KNP Portfolio Properties:
Demographics Overview
| Property Name | Net Rentable Area (SF)(1) | Allocated Cut-off Date Balance | % of Cut-off Date Balance | Estimated 2021 Population (3-mile Radius)(2) | Estimated 2021 Average Household Income (3-mile Radius)(2) | Estimated 2021 Population (5-mile Radius)(2) | Estimated 2021 Average Household Income (5-mile Radius)(2) |
| Dollar Tree | 14,820 | $5,000,000 | 27.8% | 169,852 | $84,327 | 349,407 | $96,559 |
| Goodwill | 20,600 | $2,900,000 | 16.1% | 19,653 | $105,349 | 30,612 | $111,348 |
| Jiffy Lube | 2,889 | $2,200,000 | 12.2% | 131,038 | $77,617 | 350,939 | $68,281 |
| 7-Eleven | 2,919 | $2,200,000 | 12.2% | 156,641 | $59,308 | 451,334 | $59,130 |
| O'Reilly | 7,427 | $1,800,000 | 10.0% | 45,550 | $101,354 | 213,487 | $101,674 |
| Sherwin Williams | 3,500 | $1,400,000 | 7.8% | 191,491 | $61,702 | 421,836 | $64,047 |
| Starbucks | 2,200 | $1,400,000 | 7.8% | 16,669 | $77,252 | 51,451 | $57,584 |
| Family Dollar | 8,320 | $1,100,000 | 6.1% | 74,128 | $64,806 | 219,400 | $74,840 |
| Total/Weighted Average | 62,675 | $18,000,000 | 100.0% | 86,475 | $87,676 | 209,664 | $92,912 |
| (1) | Information obtained from the underwritten rent roll. |
| (2) | Information obtained from third party market research reports. |
Escrows.
Real Estate Taxes – The KNP Portfolio Mortgage Loan documents require an upfront real estate tax reserve of approximately $8,503 and ongoing monthly real estate tax reserves in an amount equal to one-twelfth of the real estate taxes that the lender estimates will be necessary to pay taxes over the then succeeding twelve months (initially approximately $3,270). The tenants at the Dollar Tree property, the Goodwill property, the Jiffy Lube property, the 7-Eleven property, the O’Reilly property and the Family Dollar property are obligated to pay real estate taxes direct to the applicable governmental authority and the lender has agreed to waive the real estate tax escrow with respect to such properties so long as all of the foregoing are true with respect to such property: (i) no event of default under the KNP Portfolio Mortgage Loan has occurred and is continuing, (ii) such property is its own separate tax lot and is not a portion of any other tax lot, (iii) the entire property is demised to one tenant, (iv) the lease is in full force and effect, (v) to the extent the tenant is a Material Tenant (as defined below) no Material Tenant Trigger Event (as defined below) has occurred and remains outstanding, (vi) the tenant is obligated pursuant to its lease to pay all real estate taxes directly to the applicable governmental authority, and (vii) the tenant is actually performing such obligation and the KNP Portfolio Borrower provides the lender with evidence of such performance in a timely manner. If any of the foregoing are not true with respect to a property, the KNP Portfolio Borrower will again be required to reserve real estate tax escrows with respect to such property.
Insurance – The KNP Portfolio Mortgage Loan documents require an upfront insurance reserve of approximately $6,732 and ongoing monthly insurance reserves in an amount equal to one-twelfth of the insurance premiums that the lender estimates will be payable for the renewal of the coverage afforded by the policies upon the expiration thereof (initially approximately $4,208).
THE INFORMATION IN THIS COLLATERAL TERM SHEET IS NOT COMPLETE AND MAY BE AMENDED PRIOR TO THE TIME OF SALE. THIS TERM SHEET IS NOT AN OFFER TO SELL THESE SECURITIES AND IT IS NOT A SOLICITATION OF AN OFFER TO BUY THESE SECURITIES IN ANY JURISDICTION WHERE THE OFFER OR SALE IS NOT PERMITTED.
79
| Retail – Single Tenant | Loan #8 | Cut-off Date Balance: | | $18,000,000 |
| Property Addresses – Various | KNP Portfolio | Cut-off Date LTV: | | 60.0% |
| | | U/W NCF DSCR: | | 2.12x |
| | | U/W NOI Debt Yield: | | 8.9% |
Replacement Reserve – The KNP Portfolio Mortgage Loan documents require ongoing monthly replacement reserves of approximately $1,149, subject to a cap of $55,154.
Lockbox and Cash Management. The KNP Portfolio Mortgage Loan is structured with a hard lockbox and springing cash management, which springs into place upon the occurrence and continuance of a Cash Management Trigger Event (as defined below). The KNP Portfolio Borrower, Master Tenant and property manager are required to direct the tenants to pay rent directly into the lockbox account, and to deposit any rents otherwise received in such account within one business day after receipt. During the continuance of a Cash Management Trigger Event, all funds in the lockbox account are required to be swept each business day to a lender-controlled cash management account and disbursed in accordance with the KNP Portfolio Mortgage Loan documents, and all excess funds on deposit in the cash management account (after payment of required monthly reserve deposits, the debt service payment on the KNP Portfolio Mortgage Loan, operating expenses and cash management bank fees) is required to be applied as follows: (a) if a Material Tenant Trigger Event has occurred and is continuing, to a material tenant rollover account, (b) if a Cash Sweep Trigger Event (as defined below) has occurred and is continuing, to the lender-controlled excess cash flow account or (c) if no Material Tenant Trigger Event or Cash Sweep Trigger Event has occurred and is continuing, to the KNP Portfolio Borrower.
A “Cash Management Trigger Event” will commence upon the earlier of the following:
| (i) | the occurrence of an event of default; |
| (ii) | any bankruptcy action involving the KNP Portfolio Borrower, the guarantor, the sponsor, the key principal (Michael Packman), the Master Tenant or the property manager; |
| (iii) | the trailing 12-month period debt service coverage ratio falling below 1.65x; |
| (iv) | the indictment for fraud or misappropriation of funds of the KNP Portfolio Borrower, the guarantor, the sponsor, the key principal, any SPC Party (as defined below), the Master Tenant or an affiliated or third party property manager (provided that, in the case of the third party property manager, such fraud or misappropriation is related to the KNP Portfolio Properties), or any director or officer of the aforementioned; |
| (v) | a Material Tenant Trigger Event; or |
| (vi) | a Cash Sweep O’Reilly Restoration Trigger Event (as defined below). |
An “SPC Party” means each of the KNP Portfolio Borrower’s signatory trustees (including, as of the origination date, Keystone 1031 Net Leased Portfolio II ST, LLC), general partners or managing members, as applicable.
A Cash Management Trigger Event will end upon the occurrence of the following:
| ● | with regard to clause (i) above, the cure of such event of default; |
| ● | with regard to clause (ii) above, the filing being discharged or dismissed within 90 days for the KNP Portfolio Borrower, the guarantor, the sponsor, the key principal or the Master Tenant, or within 120 days for the property manager, and the lender’s determination that such filing does not materially increase the KNP Portfolio Borrower’s, the guarantor’s, the sponsor’s, the key principal’s or the Master Tenant’s monetary obligations, or materially and adversely affect the guarantor’s, the sponsor’s, the key principal’s, the Master Tenant’s or the property manager’s ability to carry out their obligations under the KNP Portfolio Mortgage Loan documents, as applicable, or, in the case of the property manager, the replacement of the property manager with a third party property manager that constitutes a qualified property manager under the KNP Portfolio Mortgage Loan documents; |
| ● | with regard to clause (iii) above, the trailing 12-month debt service coverage ratio being at least 1.77x for two consecutive calendar quarters; |
| ● | with regard to clause (iv) above, the dismissal of the applicable indictment with prejudice or acquittal of the applicable person, or the replacement of the property manager with a third party property manager that constitutes a qualified property manager under the KNP Portfolio Mortgage Loan documents; |
| ● | with regard to clause (v) above, a Material Tenant Trigger Event Cure (as defined below); or |
| ● | with regard to clause (vi) above, once a complete restoration of the O’Reilly property has occurred. |
A “Cash Sweep Trigger Event” will commence upon the earlier of the following:
| (i) | the occurrence of an event of default; |
| (ii) | any bankruptcy action involving the KNP Portfolio Borrower, the guarantor, the sponsor, the key principal, the Master Tenant or an affiliated property manager; |
| (iii) | the trailing 12-month period debt service coverage ratio falling below 1.65x; or |
| (iv) | a Cash Sweep O’Reilly Restoration Trigger Event. |
THE INFORMATION IN THIS COLLATERAL TERM SHEET IS NOT COMPLETE AND MAY BE AMENDED PRIOR TO THE TIME OF SALE. THIS TERM SHEET IS NOT AN OFFER TO SELL THESE SECURITIES AND IT IS NOT A SOLICITATION OF AN OFFER TO BUY THESE SECURITIES IN ANY JURISDICTION WHERE THE OFFER OR SALE IS NOT PERMITTED.
80
| Retail – Single Tenant | Loan #8 | Cut-off Date Balance: | | $18,000,000 |
| Property Addresses – Various | KNP Portfolio | Cut-off Date LTV: | | 60.0% |
| | | U/W NCF DSCR: | | 2.12x |
| | | U/W NOI Debt Yield: | | 8.9% |
A Cash Sweep Trigger Event will end upon the occurrence of the following:
| ● | with regard to clause (i) above, the cure of such event of default; |
| ● | with regard to clause (ii) above, the filing being discharged or dismissed within 90 days for the KNP Portfolio Borrower, the guarantor, the sponsor, the key principal or the Master Tenant, or within 120 days for the property manager, and the lender’s determination that such filing does not materially increase the KNP Portfolio Borrower’s, the guarantor’s, the sponsor’s, the key principal’s or the Master Tenant’s monetary obligations, or materially and adversely affect the guarantor’s, the sponsor’s the key principal’s, the Master Tenant’s or the property manager’s ability to carry out their obligations under the KNP Portfolio Mortgage Loan documents, as applicable, or, in the case of the property manager, the replacement of the property manager with a third party property manager that constitutes a qualified property manager under the KNP Portfolio Mortgage Loan documents; |
| ● | with regard to clause (iii) above, the trailing 12-month debt service coverage ratio being at least 1.77x for two consecutive calendar quarters; or |
| ● | with regard to clause (iv) above, once a complete restoration of the O’Reilly property has occurred. |
A “Material Tenant Trigger Event” will commence upon the occurrence of any of the following:
| (i) | a Material Tenant giving notice of its intention to terminate, cancel or not to extend or renew its lease, or if a Material Tenant has more than one lease, any of the foregoing with respect to any of its leases; |
| (ii) | on or prior to the date that is six months prior to the then applicable expiration date under the applicable Material Tenant lease, or if such Material Tenant has more than one Material Tenant lease, under any of its leases, if the Material Tenant does not extend or renew any such Material Tenant lease; |
| (iii) | on or prior to the date a Material Tenant is required under its Material Tenant lease, or if such Material Tenant has more than one Material Tenant lease, under any of its leases, to notify the borrower of its election to extend or renew its lease, if such Material Tenant does not give notice under any such lease; |
| (iv) | an event of default under a Material Tenant lease occurring and continuing beyond any applicable notice and/or cure period; |
| (v) | a bankruptcy action of a Material Tenant or guarantor of any Material Tenant lease occurring; |
| (vi) | a Material Tenant lease being terminated or no longer being in full force and effect provided that, with respect to a partial lease termination or series of partial lease terminations, such Material Tenant terminates (or has terminated) or is no longer in full force and effect with respect to 20% or more of such Material Tenant's initial leased square footage at the applicable property; |
| (vii) | a Material Tenant “going dark”, vacating, ceasing to occupy or ceasing to conduct business in the ordinary course at any of the KNP Portfolio Properties or a portion thereof constituting 20% or more of the total net rentable square footage at the respective property (other than temporary cessation of operations in connection with remodeling, renovation or restoration of its leased premises); provided, however, so long as the Dollar Tree sublease is in effect, for purposes of this clause (vii), (x) Walgreen Co. not being in occupancy or conducting business in its Material Tenant space will not be a breach of this clause (vii), and (y) Dollar Tree will be the Material Tenant for purposes of this clause (vii); or |
| (viii) | if the senior unsecured debt rating or the long term rating of Dollar Tree or any lease guarantor with respect to Dollar Tree fails to satisfy a senior unsecured debt rating of at least “Baa3” by Moody’s and a long term rating of at least “BBB-” by S&P and Fitch (or their equivalents by any other rating agencies rating the Certificates) (the “Required Ratings”). |
A “Material Tenant Trigger Event Cure” will commence upon the occurrence of any of the following:
| ● | with regard to clause (i) above, the date that (x) the applicable Material Tenant revokes or rescinds all termination or cancellation notices, (y) the applicable Material Tenant lease is extended on terms satisfying the requirements of the KNP Portfolio Mortgage Loan documents or (z) all or substantially all of the applicable Material Tenant space is leased to a replacement tenant on terms satisfying the requirements of the KNP Portfolio Mortgage Loan documents; |
| ● | with regard to clause (ii) above, the date that (x) the applicable Material Tenant lease is extended on terms satisfying the requirements of the KNP Portfolio Mortgage Loan documents or (y) all or substantially all of the applicable Material Tenant space is leased to a replacement tenant on terms satisfying the requirements of the KNP Portfolio Mortgage Loan documents; |
| ● | with regard to clause (iii) above, the date that (x) the applicable Material Tenant lease is extended on terms satisfying the requirements of the KNP Portfolio Mortgage Loan documents or (y) all or substantially all of the applicable Material Tenant space is leased to a replacement tenant on terms satisfying the requirements of the KNP Portfolio Mortgage Loan documents; |
| ● | with regard to clause (iv) above, a cure of the applicable event of default; |
| ● | with regard to clause (v) above, the affirmation of the Material Tenant lease in the applicable bankruptcy proceeding and confirmation that the Material Tenant is actually paying all rents and other amounts under its lease (or, if applicable, the discharge or dismissal of the applicable Material Tenant lease guarantor from the applicable bankruptcy proceeding; provided that such bankruptcy (after dismissal or discharge) does not have an adverse effect on such Material Tenant lease guarantor’s ability to perform its obligations under its lease guaranty) or solely in connection with a bankruptcy proceeding of a lease guarantor, a substitute guarantor acceptable to lender in its sole discretion shall have assumed the lease guarantor’s obligations under the applicable Master Lease, the insolvent guarantor is release as a guarantor, and the substitute guarantor assumes all liability under the applicable Master Lease on a past, present and future basis; |
| ● | with regard to clause (vi) above, all or substantially all (or in connection with a partial termination, the applicable portion) of the applicable Material Tenant space being leased to a replacement tenant on terms satisfying the requirements of the KNP Portfolio Mortgage Loan documents; |
| ● | with regard to clause (vii) above, the Material Tenant re-commencing its normal business operations at its Material Tenant space; or |
THE INFORMATION IN THIS COLLATERAL TERM SHEET IS NOT COMPLETE AND MAY BE AMENDED PRIOR TO THE TIME OF SALE. THIS TERM SHEET IS NOT AN OFFER TO SELL THESE SECURITIES AND IT IS NOT A SOLICITATION OF AN OFFER TO BUY THESE SECURITIES IN ANY JURISDICTION WHERE THE OFFER OR SALE IS NOT PERMITTED.
81
| Retail – Single Tenant | Loan #8 | Cut-off Date Balance: | | $18,000,000 |
| Property Addresses – Various | KNP Portfolio | Cut-off Date LTV: | | 60.0% |
| | | U/W NCF DSCR: | | 2.12x |
| | | U/W NOI Debt Yield: | | 8.9% |
| ● | with regard to clause (viii) above, the senior unsecured debt rating or the long term rating of the applicable Material Tenant or the applicable lease guarantor is subsequently raised or otherwise modified such that it satisfies the Required Ratings. |
A “Material Tenant” means (i) Goodwill, (ii) Walgreens (so long as the Dollar Tree sublease is in effect, Dollar Tree) or (iii) any tenant at the KNP Portfolio Properties that, together with its affiliates, either (a) leases no less than 20% of the total rentable square footage of the aggregate of the KNP Portfolio Properties or (b) accounts for (or would account for) no less than 20% of the total in-place base rent at the aggregate of the KNP Portfolio Properties.
A “Cash Sweep O’Reilly Restoration Trigger Event” means in the event of a casualty or condemnation with respect to the O’Reily property, O’Reilly fails to (1) cause the restoration of the O’Reilly property within the time frames provided in its lease, or (2) terminate the O’Reilly lease and pay over to the KNP Portfolio Borrower all of the insurance proceeds payable to O’Reilly under its lease (or an amount equal to the insurance proceeds that would have been available to O’Reilly to the extent O’Reilly maintained the coverage required under its lease); provided, that, upon payment of such insurance proceeds to the KNP Portfolio Borrower, such proceeds will be deemed to be net proceeds and will be deposited with the lender.
Property Management. The KNP Portfolio Properties are managed by REIS Associates LLC, a third-party property manager.
Real Estate Substitution. Not permitted.
Subordinate and Mezzanine Indebtedness. Not permitted.
Ground Lease. None.
Rights of First Refusal. The sole tenant at each of the Dollar Tree property, the Goodwill property, and the O’Reilly property has a right of first refusal to purchase the related property. Pursuant to subordination, non-disturbance and attornment agreements, such rights have been waived in connection with a foreclosure or deed-in-lieu of foreclosure (and in the case of the Goodwill property, the first sale by the lender after such an event), but will apply to subsequent transfers.
Terrorism Insurance. The KNP Portfolio Mortgage Loan documents require that the “all risk” insurance policy required to be maintained by the KNP Portfolio Borrower provides coverage for terrorism in an amount equal to the full replacement cost of the KNP Portfolio Properties, as well as business interruption insurance covering no less than the 12-month period following the occurrence of a casualty event, together with a 6-month extended period of indemnity.
THE INFORMATION IN THIS COLLATERAL TERM SHEET IS NOT COMPLETE AND MAY BE AMENDED PRIOR TO THE TIME OF SALE. THIS TERM SHEET IS NOT AN OFFER TO SELL THESE SECURITIES AND IT IS NOT A SOLICITATION OF AN OFFER TO BUY THESE SECURITIES IN ANY JURISDICTION WHERE THE OFFER OR SALE IS NOT PERMITTED.
82
| Industrial - Various | Loan #9 | Cut-off Date Balance: | | $17,520,000 |
Property Addresses - Various Various, Various | GS Foods Portfolio | Cut-off Date LTV: U/W NCF DSCR: U/W NOI Debt Yield: | | 67.2% 1.45x 8.6% |
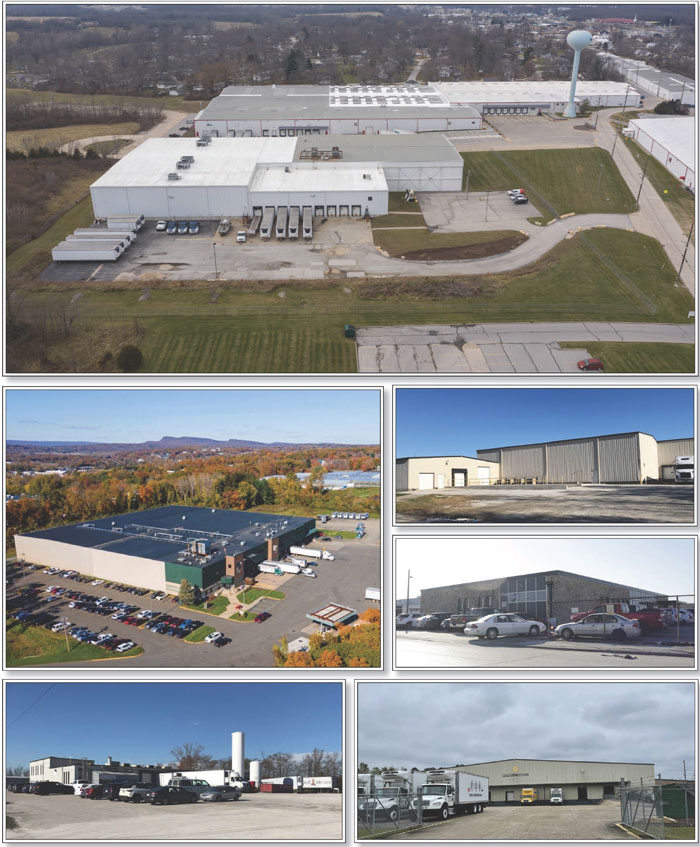
THE INFORMATION IN THIS COLLATERAL TERM SHEET IS NOT COMPLETE AND MAY BE AMENDED PRIOR TO THE TIME OF SALE. THIS TERM SHEET IS NOT AN OFFER TO SELL THESE SECURITIES AND IT IS NOT A SOLICITATION OF AN OFFER TO BUY THESE SECURITIES IN ANY JURISDICTION WHERE THE OFFER OR SALE IS NOT PERMITTED.
83
| Industrial - Various | Loan #9 | Cut-off Date Balance: | | $17,520,000 |
Property Addresses - Various Various, Various | GS Foods Portfolio | Cut-off Date LTV: U/W NCF DSCR: U/W NOI Debt Yield: | | 67.2% 1.45x 8.6% |
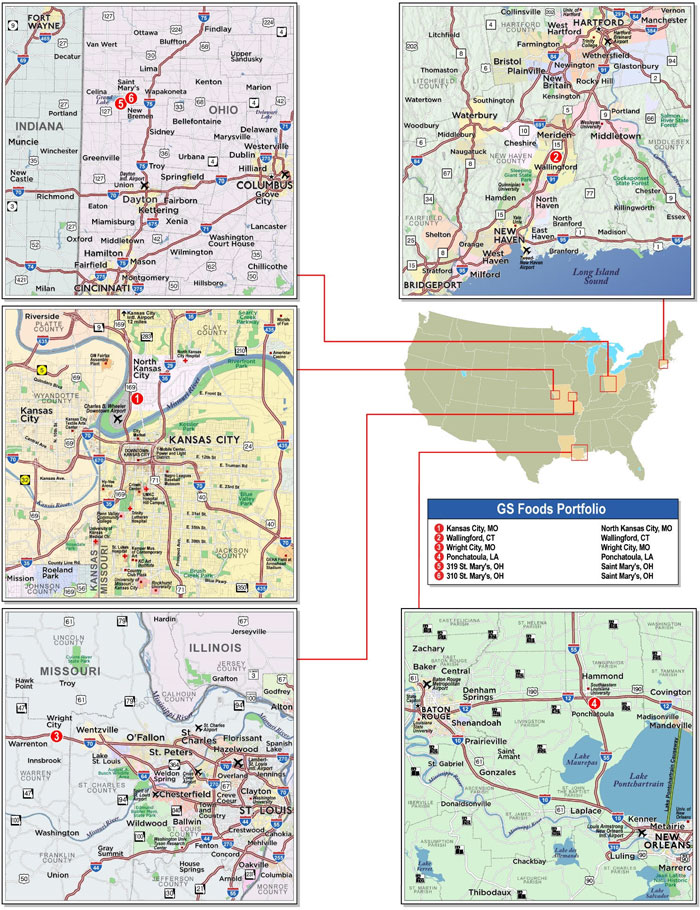
THE INFORMATION IN THIS COLLATERAL TERM SHEET IS NOT COMPLETE AND MAY BE AMENDED PRIOR TO THE TIME OF SALE. THIS TERM SHEET IS NOT AN OFFER TO SELL THESE SECURITIES AND IT IS NOT A SOLICITATION OF AN OFFER TO BUY THESE SECURITIES IN ANY JURISDICTION WHERE THE OFFER OR SALE IS NOT PERMITTED.
84
| No. 9 – GS Foods Portfolio |
| |
| Mortgage Loan Information | | Mortgaged Property Information |
| Mortgage Loan Seller: | Wells Fargo Bank, National Association | | Single Asset/Portfolio: | Portfolio |
Credit Assessment (Fitch/KBRA/Moody’s): | NR/NR/NR | | Property Type – Subtype: | Industrial – Various |
| Original Principal Balance(1): | $17,520,000 | | Location: | Various – See Table |
| Cut-off Date Balance(1): | $17,520,000 | | Size: | 516,288 SF |
| % of Initial Pool Balance: | 3.3% | | Cut-off Date Balance Per SF(1): | $111.41 |
| Loan Purpose: | Acquisition | | Maturity Date Balance Per SF(1): | $100.93 |
| Borrower Sponsor: | Angelo, Gordon & Co., LP | | Year Built/Renovated: | Various – See Table |
| Guarantors: | AG Net Lease IV Corp., AG Net Lease IV (Q) Corp. and AG Net Lease Realty Fund IV Investments (H-1), L.P. | | Title Vesting: | Fee |
| Mortgage Rate: | 3.7900% | | Property Manager: | Tenant-managed |
| Note Date: | December 22, 2021 | | Current Occupancy (As of)(4): | 100.0% (12/27/2021) |
| Seasoning: | 3 months | | YE 2020 Occupancy(5): | NAV |
| Maturity Date: | January 11, 2032 | | YE 2019 Occupancy(5): | NAV |
| IO Period: | 60 months | | YE 2018 Occupancy(5): | NAV |
| Loan Term (Original): | 120 months | | YE 2017 Occupancy(5): | NAV |
| Amortization Term (Original): | 360 months | | As-Is Appraised Value(4): | $85,540,000 |
| Loan Amortization Type: | Interest Only, Amortizing Balloon | | As-Is Appraised Value Per SF(4): | $165.68 |
| Call Protection(2): | L(27),DorYM1(86),O(7) | | As-Is Appraisal Valuation Date(6): | Various |
| Lockbox Type: | Hard/Springing Cash Management | | | |
| | | | | |
| Additional Debt(1): | Yes | | Underwriting and Financial Information(4) |
| Additional Debt Type (Balance)(1): | Pari Passu ($40,000,000) | | TTM NOI(5): | NAV |
| | | | YE 2020 NOI(5): | NAV |
| | | | YE 2019 NOI(5): | NAV |
| | | | YE 2018 NOI(5): | NAV |
| | | | U/W Revenues: | $5,070,669 |
| | | | U/W Expenses: | $152,120 |
| Escrows and Reserves(3) | | U/W NOI: | $4,918,549 |
| | Initial | Monthly | Cap | | U/W NCF: | $4,667,023 |
| Taxes | $0 | Springing | NAP | | U/W DSCR based on NOI/NCF(1): | 1.53x / 1.45x |
| Insurance | $0 | Springing | NAP | | U/W Debt Yield based on NOI/NCF(1): | 8.6% / 8.1% |
| Replacement Reserve | $0 | Springing | NAP | | U/W Debt Yield at Maturity based on NOI/NCF(1): | 9.4% / 9.0% |
| | | | | | Cut-off Date LTV Ratio(1): | 67.2% |
| | | | | | LTV Ratio at Maturity(1): | 60.9% |
| | | | | | | |
| | | | | | | | |
| Sources and Uses |
| Sources | | | | | Uses | | | |
| Loan Amount | $57,520,000 | | 65.0% | | Purchase Price | $87,737,727 | | 99.1% |
| Sponsor Equity | 31,021,505 | | 35.0 | | Closing Costs | 803,778 | | 0.9 |
| Total Sources | $88,541,505 | | 100.0% | | Total Uses | $88,541,505 | | 100.0% |
| (1) | The GS Foods Portfolio Mortgage Loan (as defined below) is part of the GS Foods Portfolio Whole Loan (as defined below) which is comprised of two pari passu promissory notes with an original aggregate principal balance of $57,520,000. The Cut-off Date Balance per square foot, Maturity Date Balance per square foot, U/W Debt Yield based on NOI/NCF, U/W Debt Yield at Maturity Date based on NOI/NCF, U/W DSCR based on NOI/NCF, Cut-off Date LTV Ratio and LTV Ratio at Maturity numbers presented above are based on the GS Foods Portfolio Whole Loan. |
| (2) | At any time after the earlier of (i) December 22, 2024 and (ii) two years from the closing date of the securitization that includes the last pari passu note of the GS Foods Portfolio Whole Loan to be securitized, the borrower has the right to defease or pay off the GS Foods Portfolio Whole Loan with a yield maintenance premium. Additionally, the borrower may prepay the GS Foods Portfolio Whole Loan with 30 days’ notice on or after July 11, 2031. |
| (3) | See “Escrow and Reserves” section. |
| (4) | The novel coronavirus pandemic is an evolving situation and could impact the GS Foods Portfolio Whole Loan more severely than assumed in the underwriting of the GS Foods Portfolio Whole Loan and could adversely affect the NOI, NCF and occupancy information, as well as the appraised value and the DSCR, LTV and Debt Yield metrics presented above and herein. See "Risk Factors—Risks Related to Market Conditions and Other External Factors—The Coronavirus Pandemic Has Adversely Affected the Global Economy and Will Likely Adversely Affect the Performance of the Mortgage Loans" in the Preliminary Prospectus. |
| (5) | Historical occupancy and historical operating history are not available, as the borrower sponsor recently acquired the GS Foods Portfolio Properties (as defined below) in a sale-leaseback transaction, and leases were not previously in-place. |
| (6) | The appraisal valuation dates range from November 1, 2021 to November 22, 2021. |
THE INFORMATION IN THIS COLLATERAL TERM SHEET IS NOT COMPLETE AND MAY BE AMENDED PRIOR TO THE TIME OF SALE. THIS TERM SHEET IS NOT AN OFFER TO SELL THESE SECURITIES AND IT IS NOT A SOLICITATION OF AN OFFER TO BUY THESE SECURITIES IN ANY JURISDICTION WHERE THE OFFER OR SALE IS NOT PERMITTED.
85
| Industrial - Various | Loan #9 | Cut-off Date Balance: | | $17,520,000 |
Property Addresses - Various Various, Various | GS Foods Portfolio | Cut-off Date LTV: U/W NCF DSCR: U/W NOI Debt Yield: | | 67.2% 1.45x 8.6% |
The Mortgage Loan. The mortgage loan (the “GS Foods Portfolio Mortgage Loan”) is part of a whole loan (the “GS Foods Portfolio Whole Loan”) secured by first priority fee interests in six industrial properties totaling 516,288 square feet and located in Missouri, Connecticut, Louisiana, and Ohio (the “GS Foods Portfolio Properties”). The GS Foods Portfolio Whole Loan has an original aggregate principal balance of $57,520,000 and is comprised of two pari passu notes (A-1 $40,000,000; A-2 $17,520,000). The GS Foods Portfolio Whole Loan will be serviced under the pooling and servicing agreement for the BANK 2022-BNK40 securitization trust. See “Description of the Mortgage Pool—The Whole Loans—The Non-Serviced Pari Passu Whole Loans” and “Pooling and Servicing Agreement” in the Preliminary Prospectus.
Note Summary
| Notes | Original
Balance | Cut-off Date Balance | Note Holder | Controlling Piece |
| A-1 | $40,000,000 | $40,000,000 | BANK 2022-BNK40 | Yes |
| A-2 | $17,520,000 | $17,520,000 | WFCM 2022-C62 | No |
| Total | $57,520,000 | $57,520,000 | | |
The Borrower and Borrower Sponsors. The borrower is AGNL PB&J, L.L.C. (the “GS Foods Portfolio Borrower”), a Delaware limited liability company with one independent director. Legal counsel to the borrower delivered a non-consolidation opinion in connection with the origination of the GS Foods Portfolio Whole Loan. The non-recourse carveout guarantor is AG Net Lease IV Corp., AG Net Lease IV (Q) Corp. and AG Net Lease Realty Fund IV Investments (H-1), L.P. (collectively the “GS Foods Portfolio Guarantor”).
The borrower sponsor is Angelo, Gordon & Co., LP (“Angelo, Gordon & Co.”), a privately-held investment firm that is the parent company to the GS Foods Portfolio Guarantor. Angelo, Gordon & Co. manages approximately $48 billion across a range of asset classes. Angelo, Gordon & Co. began investing in real estate within the United States in 1993 and has acquired approximately $35 billion of properties in the country.
The Properties. The GS Foods Portfolio Properties consist of six one- and two-story, single-tenant, industrial buildings located in Missouri (two properties, 52.4% of net rentable area), Connecticut (one property, 25.5% of net rentable area), Louisiana (one property, 12.8% of net rentable area), and Ohio (two properties, 9.3% of net rentable area). Built between 1954 and 1998, the properties range in size from 19,947 square feet to 197,571 square feet. Four properties were renovated between 1988 and 2018. Each of the GS Foods Portfolio Properties contains 10 to 106 surface parking spaces with parking ratios ranging from 0.4 to 3.5 spaces per 1,000 square feet of rentable area. As of December 27, 2021, the GS Foods Portfolio Properties were 100.0% leased to five entities, each of which is a subsidiary of GS Foods, Inc (“GS Foods”). All six leases run through December 31, 2041 with two, 10-year renewal options and no termination options.
Kansas City, MO
The Kansas City, MO property is a 197,571 square foot, single-story cold storage property located in North Kansas City, Missouri. Built in 1954 and most recently renovated in 2018, the property is situated on 8.0 acres of land and contains 101 surface parking spaces, resulting in a parking ratio of 0.5 spaces per 1,000 square feet of rentable area. The building contains 20-foot ceiling heights and 32 dock high doors. The property contains approximately 130,000 square feet of cold storage space. The building is 100.0% leased and occupied by C&C Produce, LLC, a subsidiary of GS Foods that specializes in the distribution of produce products.
Wallingford, CT
The Wallingford, CT property is a 131,671 square foot, two-story warehouse/cold storage distribution property located north of New Haven, Connecticut. Built in 1990, the property is situated on 25.8 acres of land and includes 30-foot ceiling heights and 14 dock high doors. The property is comprised of 53% dry storage, 37% cold storage, and 8.9% office space. The building is 100.0% leased and occupied by Thurston Foods, a subsidiary of GS Foods that operates as a full-service food distributor based in Wallingford, Connecticut.
Wright City, MO
The Wright City, MO property is a 73,000 square foot, single-story cold storage warehouse property built in 1984 and renovated in 2007. The property is situated on 12.7 acres of land and contains 32 parking spaces, resulting in a parking ratio of 0.4 spaces per 1,000 square feet of rentable area. The building contains 30-foot ceiling heights and 9 dock high doors. The property contains 65,700 square feet of cold storage space. The building is 100.0% leased and occupied by Gold Star Foods.
Ponchatoula, LA
The Ponchatoula, LA property is a 65,989 square foot, single-story cold storage/warehouse/distribution property located near New Orleans, Louisiana. Built in 1998, the property is situated on 7.6 acres of land and contains 40 parking spaces, resulting in a parking ratio of 0.6 spaces per 1,000 square feet of rentable area. The property also includes 20-foot clear ceiling heights, 8 dock high doors, and contains 55% refrigerator/freezer space. The building is 100.0% leased to Pon Food Corp, a subsidiary of GS Foods that serves as a frozen food retail distributor.
THE INFORMATION IN THIS COLLATERAL TERM SHEET IS NOT COMPLETE AND MAY BE AMENDED PRIOR TO THE TIME OF SALE. THIS TERM SHEET IS NOT AN OFFER TO SELL THESE SECURITIES AND IT IS NOT A SOLICITATION OF AN OFFER TO BUY THESE SECURITIES IN ANY JURISDICTION WHERE THE OFFER OR SALE IS NOT PERMITTED.
86
| Industrial - Various | Loan #9 | Cut-off Date Balance: | | $17,520,000 |
Property Addresses - Various Various, Various | GS Foods Portfolio | Cut-off Date LTV: U/W NCF DSCR: U/W NOI Debt Yield: | | 67.2% 1.45x 8.6% |
319 St. Mary’s, OH
The 319 St. Mary’s, OH property is a single-story, 28,110 square foot cold storage warehouse facility built in 1985 and renovated in 1988 and located outside of Columbus, Ohio. The property is situated on 2.1 acres of land and contains 10 parking spaces, resulting in a parking ratio of 0.4 spaces per 1,000 square feet of rentable area. The building includes 28,060 square feet of cold storage space and 3,000 SF of office space. The building also contains 24-foot ceiling heights and three dock high doors. The property is 100.0% leased to Classic Delight, a subsidiary of GS Foods that provides a range of handheld food items.
310 St. Mary’s, OH
The 310 St. Mary’s, OH property is a two-story, 19,947 square foot cold storage/manufacturing/warehouse facility built in 1972 and renovated in 1993 and located outside of Columbus, Ohio. The property is situated on 3.5 acres of land and contains 70 parking spaces, resulting in a parking ratio of 3.5 spaces per 1,000 square feet of rentable area. The property includes 16,540 square feet of production, warehouse, and cold storage space, as well as 3,600 square feet of office space. The building also contains 22-foot ceiling heights and five dock high doors. The property is 100.0% leased to Classic Delight, a subsidiary of GS Foods.
Major Tenant
GS Foods Group is a specialized food distribution company that services educational facilities, correction centers, non-profit organizations, and business and healthcare industries. GS Foods Group is the parent company under the lease for each property within the GS Foods Portfolio. GS Foods’ independent subsidiaries collectively serve more than 8,000 customers nationwide. The parent company was founded in 1966 and is headquartered in Ontario, California.
The following table presents certain information relating to the GS Foods Portfolio Properties:
Tenant Name Property Name | Year Built / Renovated | Square Feet | Cut-off Date Balance(1) | Cut-off Date Balance PSF(1) | % of Total Balance | Appraised Value | U/W NCF |
C&C Produce Kansas City, MO | 1954 / 2018 | 197,571 | $24,678,326 | $124.91 | 42.9% | $36,700,000 | $2,082,155 |
Thurston Foods Wallingford, CT | 1990 / NAP | 131,671 | $14,591,817 | $110.82 | 25.4% | $21,700,000 | $1,162,924 |
Gold Star Foods Wright City, MO | 1984 / 2007 | 73,000 | $9,346,832 | $128.04 | 16.2% | $13,900,000 | $698,490 |
Pon Food Corp Ponchatoula, LA | 1998 / NAP | 65,989 | $4,908,768 | $74.39 | 8.5% | $7,300,000 | $399,593 |
Classic Delight 319 St. Mary’s, OH | 1985 / 1988 | 28,110 | $2,346,794 | $83.49 | 4.1% | $3,490,000 | $192,591 |
Classic Delight 310 St. Mary’s, OH | 1972 / 1993 | 19,947 | $1,647,463 | $82.59 | 2.9% | $2,450,000 | $131,270 |
| Total/Weighted Average | | 516,288 | $57,520,000 | $111.41 | 100.0% | $85,540,000 | $4,667,023 |
| (1) | The balances shown are related to the Cut-off Date Balance and Cut-off Date Balance PSF of the GS Foods Portfolio Whole Loan. |
Major Tenants
| Tenant Name | Credit Rating (Fitch/KBRA/S&P) | Tenant NRSF | % of NRSF | Annual U/W Base Rent PSF | Annual U/W Base Rent | % of Total Annual U/W Base Rent | Lease Expiration Date | Ext. Options | Term. Option (Y/N) |
| | | | | | | | | | |
| Major Tenants | | | | | | | | | |
| C&C Produce, LLC | NR/NR/NR | 197,571 | 38.3% | $11.49 | $2,270,520 | 43.8% | 12/31/2041 | 2, 10-yr | N |
| Thurston Foods | NR/NR/NR | 131,671 | 25.5% | $10.07 | $1,326,016 | 25.6% | 12/31/2041 | 2, 10-yr | N |
| Gold Star Foods | NR/NR/NR | 73,000 | 14.1% | $10.71 | $781,830 | 15.1% | 12/31/2041 | 2, 10-yr | N |
| Pon Food Corp | NR/NR/NR | 65,989 | 12.8% | $6.72 | $443,700 | 8.6% | 12/31/2041 | 2, 10-yr | N |
| Classic Delight(1) | NR/NR/NR | 48,057 | 9.3% | $7.56 | $363,360 | 7.0% | 12/31/2041 | 2, 10-yr | N |
| | | | | | | | | | |
| Collateral Total | | 516,288 | 100.0% | $10.04 | $5,185,426 | 100.0% | | | |
| | | | | | | | | | |
| (1) | Classic Delight occupies two spaces: 28,110 square feet at the 319 St. Mary’s, OH property with an annual underwritten base rent of $7.60 per square foot and 19,947 square feet at the 310 St. Mary’s, OH property with an annual underwritten base rent of $7.50 per square foot. Both leases expire December 31, 2041 with two, 10-year extension options and no termination options. |
THE INFORMATION IN THIS COLLATERAL TERM SHEET IS NOT COMPLETE AND MAY BE AMENDED PRIOR TO THE TIME OF SALE. THIS TERM SHEET IS NOT AN OFFER TO SELL THESE SECURITIES AND IT IS NOT A SOLICITATION OF AN OFFER TO BUY THESE SECURITIES IN ANY JURISDICTION WHERE THE OFFER OR SALE IS NOT PERMITTED.
87
| Industrial - Various | Loan #9 | Cut-off Date Balance: | | $17,520,000 |
Property Addresses - Various Various, Various | GS Foods Portfolio | Cut-off Date LTV: U/W NCF DSCR: U/W NOI Debt Yield: | | 67.2% 1.45x 8.6% |
The following table presents certain information relating to the lease rollover schedule at the GS Foods Portfolio Properties:
Lease Expiration Schedule(1)
Year Ending
December 31, | No. of
Leases
Expiring | Expiring
NRSF | % of
Total
NRSF | Cumulative
Expiring
NRSF | Cumulative
% of Total
NRSF | Annual
U/W
Base Rent | % of Total
Annual
U/W Base
Rent | Annual
U/W
Base Rent
PSF |
| MTM | 0 | 0 | 0.0% | 0 | 0.0% | $0 | 0.0% | $0.00 |
| 2022 | 0 | 0 | 0.0% | 0 | 0.0% | $0 | 0.0% | $0.00 |
| 2023 | 0 | 0 | 0.0% | 0 | 0.0% | $0 | 0.0% | $0.00 |
| 2024 | 0 | 0 | 0.0% | 0 | 0.0% | $0 | 0.0% | $0.00 |
| 2025 | 0 | 0 | 0.0% | 0 | 0.0% | $0 | 0.0% | $0.00 |
| 2026 | 0 | 0 | 0.0% | 0 | 0.0% | $0 | 0.0% | $0.00 |
| 2027 | 0 | 0 | 0.0% | 0 | 0.0% | $0 | 0.0% | $0.00 |
| 2028 | 0 | 0 | 0.0% | 0 | 0.0% | $0 | 0.0% | $0.00 |
| 2029 | 0 | 0 | 0.0% | 0 | 0.0% | $0 | 0.0% | $0.00 |
| 2030 | 0 | 0 | 0.0% | 0 | 0.0% | $0 | 0.0% | $0.00 |
| 2031 | 0 | 0 | 0.0% | 0 | 0.0% | $0 | 0.0% | $0.00 |
| 2032 | 0 | 0 | 0.0% | 0 | 0.0% | $0 | 0.0% | $0.00 |
| Thereafter | 6 | 516,288 | 100.0% | 516,288 | 100.0% | $5,185,426 | 100.0% | $10.04 |
| Vacant | 0 | 0 | 0.0% | 516,288 | 100.0% | $0 | 0.0% | $0.00 |
| Total/Weighted Average | 6 | 516,288 | 100.0% | | | $5,185,426 | 100.0% | $10.04 |
| (1) | Information obtained from underwritten rent roll as of December 27, 2021 |
The following table presents historical occupancy percentages at the GS Foods Portfolio Properties:
Historical Occupancy
12/31/2017(1) | 12/31/2018(1) | 12/31/2019(1) | 12/31/2020(1) | 12/27/2021(2) |
| NAV | NAV | NAV | NAV | 100.0% |
| (1) | Historical occupancy and historical operating history are not available, as the borrower sponsor recently acquired the GS Foods Portfolio Properties in a sale-leaseback transaction, and leases were not previously in-place. |
| (2) | Information obtained from the underwritten rent roll. |
COVID-19 Update. As of December 27, 2021 the GS Foods Portfolio Properties were open and operating with no outstanding tenant rent relief agreements.
THE INFORMATION IN THIS COLLATERAL TERM SHEET IS NOT COMPLETE AND MAY BE AMENDED PRIOR TO THE TIME OF SALE. THIS TERM SHEET IS NOT AN OFFER TO SELL THESE SECURITIES AND IT IS NOT A SOLICITATION OF AN OFFER TO BUY THESE SECURITIES IN ANY JURISDICTION WHERE THE OFFER OR SALE IS NOT PERMITTED.
88
| Industrial - Various | Loan #9 | Cut-off Date Balance: | | $17,520,000 |
Property Addresses - Various Various, Various | GS Foods Portfolio | Cut-off Date LTV: U/W NCF DSCR: U/W NOI Debt Yield: | | 67.2% 1.45x 8.6% |
Operating History and Underwritten Net Cash Flow. The following table presents certain information relating to the underwritten net cash flow of the GS Foods Properties:
Cash Flow Analysis(1)
| | U/W | %(2) | U/W $
per SF |
| Base Rent | $5,185,426 | 97.3% | $10.04 |
| Grossed Up Vacant Space | 0 | 0.0 | 0.00 |
| Gross Potential Rent | $5,185,426 | 97.3% | $10.04 |
| Total Recoveries | 144,514 | 2.7 | 0.28 |
| Net Rental Income | $5,329,940 | 100.0% | $10.32 |
| (Vacancy & Credit Loss) | (259,271)(3) | 5.0 | (0.50) |
| Effective Gross Income | $5,070,669 | 95.1% | $9.82 |
| | | | |
| Management Fee | 152,120 | 3.0 | 0.29 |
| Total Operating Expenses | $152,120 | 3.0% | $0.29 |
| | | | |
| Net Operating Income | $4,918,549 | 97.0% | $9.53 |
| Replacement Reserves | 125,801 | 2.5 | 0.24 |
| TI/LC | 125,725 | 2.5 | 0.24 |
| Net Cash Flow | $4,667,023 | 92.0% | $9.04 |
| | | | |
| NOI DSCR(4) | 1.53x | | |
| NCF DSCR(4) | 1.45x | | |
| NOI Debt Yield(4) | 8.6% | | |
| NCF Debt Yield(4) | 8.1% | | |
| | | | |
| | | | |
| | | | |
| (1) | Historical operating history is not available, as the borrower sponsor recently acquired the properties in a sale-leaseback transaction, and leases were not previously in-place. |
| (2) | Represents (i) percent of Net Rental Income for all revenue fields, (ii) percent of Base Rent for Vacancy & Credit Loss and (iii) percent of Effective Gross Income for all other fields. |
| (3) | The underwritten economic vacancy is 5.0%. The GS Foods Portfolio Properties were 100.0% leased as of December 27, 2021. |
| (4) | The NOI DSCR, NCF DSCR, NOI Debt Yield and NCF Debt Yield shown are based on the GS Foods Portfolio Whole Loan, which has an aggregate cut-off date balance of $57,520,000. |
Appraisal. The aggregate of the appraiser’s “as-is” Appraised Values for the GS Foods Portfolio Properties is $85,540,000. The valuation dates range from November 1, 2021 to November 22, 2021.
Environmental Matters. According to the Phase I environmental site assessments of each individual property, with dates ranging from July 2, 2021 to November 29, 2021, there are two recognized environmental conditions at the Wallingford, CT property. The Phase I environmental site assessment states that (i) two 500-gallon containers of diesel exhaust fluid located in a storage shed were observed to indicate spillage, staining and stressed vegetation; and (ii) there are ongoing sampling and monitoring requirements associated with removal of approximately 40 tons of impacted soil following a 2019 leaking underground storage tank/ spill incident at the related property. The tenant is responsible under its lease for the required ongoing sampling and monitoring activities, and the loan documents include covenants requiring the borrower to use commercially reasonable efforts to satisfy its lease obligations.
The consultant provided a worst-case estimate with a statistical 90% confidence interval that the total cost for potential remediation had an upper-end range of $75,000. In lieu of a Phase II report, the borrower obtained a $375,000 environmental insurance policy with a $375,000 limit per claim on a 13-year term, which includes a $25,000 deductible per claim.
Market Overview and Competition. The GS Foods Portfolio Properties are located within metropolitan statistical areas of Kansas City, MO-KS (one property, 42.9% of the allocated loan amount), New Haven-Milford, CT (one property, 25.4% of the allocated loan amount), St. Louis, MO - IL (one property, 16.2% of the allocated loan amount), Hammond, LA (one property, 8.5% of the allocated loan amount), and Lima, OH (two properties, 6.9% of the allocated loan amount).
THE INFORMATION IN THIS COLLATERAL TERM SHEET IS NOT COMPLETE AND MAY BE AMENDED PRIOR TO THE TIME OF SALE. THIS TERM SHEET IS NOT AN OFFER TO SELL THESE SECURITIES AND IT IS NOT A SOLICITATION OF AN OFFER TO BUY THESE SECURITIES IN ANY JURISDICTION WHERE THE OFFER OR SALE IS NOT PERMITTED.
89
| Industrial - Various | Loan #9 | Cut-off Date Balance: | | $17,520,000 |
Property Addresses - Various Various, Various | GS Foods Portfolio | Cut-off Date LTV: U/W NCF DSCR: U/W NOI Debt Yield: | | 67.2% 1.45x 8.6% |
The following table presents certain local demographic data related to the GS Foods Portfolio Properties:
| Property Name – Location | 2021 Population
(within 1-mi. / 3-mi. / 5-mi. Radius) | 2021 Average Household Income
(within 1-mi. / 3-mi. / 5-mi. Radius) |
| Kansas City, MO – 1100 Atlantic Street | 118 / 57,986 / 201,204 | $57,367 / $60,833 / $56,667 |
| Wallingford, CT – 30 Thurston Drive | 1,966 / 44,252 / 106,670 | $128,365 / $96,199 / $90,812 |
| Wright City, MO – 401 East South 1st Street | 1,163 / 6,110 / 11,865 | $70,213 / $97,783 / $98,011 |
| Ponchatoula, LA – 101 Industrial Park Boulevard | 3,364 / 15,009 / 35,231 | $62,758 / $68,926 / $71,883 |
| 319 St. Mary’s, OH – 319 South Park Drive(1) | 1,346 / 10,725 / 14,865 | $58,919 / $70,194 / $75,042 |
| 310 St. Mary’s, OH – 310 South Park Drive(1) | 1,346 / 10,725 / 14,865 | $58,919 / $70,194 / $75,042 |
| (1) | The population and household income statistics presented are as-of 2018, which is the latest information available for the respective submarkets. |
The following table presents certain information relating to the appraiser’s market rent conclusion for the GS Foods Portfolio Properties:
Market Rent Summary(1)
| Property Name - Location | Market
Rent
(PSF) | Lease
Term
(Years) | Concessions | Lease Type
(Reim- bursements) | Rent
Increase
Projection | Tenant
Improvements
(New Tenants)
(PSF) | Tenant
Improvements
(Renewals)
(PSF) |
| Kansas City, MO – 1100 Atlantic Street | $7.00 | 10.2 | 2 mos. | NNN | 2.0% per annum | $2.00 | $0.50 |
| Wallingford, CT – 30 Thurston Drive | $9.50 | 10 | 0 mos. | NNN | 2.0% per annum | $1.00 | $0.25 |
| Wright City, MO – 401 East South 1st Street | $9.25 | 10 | 2 mos. | NNN | 2.0% per annum | $2.00 | $0.50 |
| Ponchatoula, LA – 101 Industrial Park Boulevard | $6.75 | 10 | 0 mos. | Absolute Net | 2.0% each two years | $1.00 | $0.50 |
| 319 St. Mary’s, OH – 319 South Park Drive | $6.75 | 10 | 0 mos. | NNN | 2.0% per annum | $1.00 | $0.25 |
| 310 St. Mary’s, OH – 310 South Park Drive | $7.25 | 10 | 0 mos. | NNN | 2.0% per annum | $1.00 | $0.25 |
| (1) | Information obtained from the appraisals. |
Escrows.
Real Estate Taxes – Ongoing monthly reserves for real estate taxes are not required as long as (A)(i) no event of default has occurred and is continuing; (ii) the current leases are in full force and effect, (iii) GS foods pays all applicable taxes required under leases, and (iv) GS Foods delivers evidence of tax payments, or (B)(i) no event of default shall has occurred and is continuing; and (ii) the GS Foods Portfolio Borrower pays all taxes to appropriate governmental authority and provided evidence to lender thereof.
Insurance – Ongoing monthly reserves for insurance are not required as long as (A)(i) no event of default has occurred and is continuing; (ii) the policies maintained by the GS Foods Portfolio Borrower are part of a blanket or umbrella policy approved by the lender in its reasonable discretion, including, without limitation, approval of the schedule of locations and values and (iii) the GS Foods Portfolio Borrower provides the lender with paid receipts for the payment of the insurance premiums by no later than 10 business days prior to the expiration dates; or (B)(1) the major tenant lease is in full force and effect; (2) no event of default has occurred and is continuing; (3) tenants maintain all policies in full force and effect; and (4) the lender receives evidence reasonably satisfactory that all insurance premiums have been timely paid together with the evidence of renewals of such policies.
Replacement Reserves – Ongoing monthly reserves for replacements are not required as long as (A) no Cash Trap Event Period exists and the major tenant is required under its lease to pay and perform the obligations and liabilities for which the replacement reserve subaccount was established, or (B) a Cash Trap Event Period exists and the GS Foods Portfolio Borrower is maintaining the property in accordance with the terms and provisions of the major tenant lease.
THE INFORMATION IN THIS COLLATERAL TERM SHEET IS NOT COMPLETE AND MAY BE AMENDED PRIOR TO THE TIME OF SALE. THIS TERM SHEET IS NOT AN OFFER TO SELL THESE SECURITIES AND IT IS NOT A SOLICITATION OF AN OFFER TO BUY THESE SECURITIES IN ANY JURISDICTION WHERE THE OFFER OR SALE IS NOT PERMITTED.
90
| Industrial - Various | Loan #9 | Cut-off Date Balance: | | $17,520,000 |
Property Addresses - Various Various, Various | GS Foods Portfolio | Cut-off Date LTV: U/W NCF DSCR: U/W NOI Debt Yield: | | 67.2% 1.45x 8.6% |
Lockbox and Cash Management. The GS Foods Portfolio Whole Loan is structured with a hard lockbox and springing cash management. The GS Foods Portfolio Borrower is required to direct the tenant to pay rent directly into a deposit account, and to deposit any rents otherwise received in such account within two business day after receipt. If no Cash Trap Event Period exists, all excess cash flow will be disbursed to, or at the written direction, of the GS Foods Portfolio Borrower. During the continuance of a Cash Trap Event Period, all funds in the cash management account will be applied according to the cash management agreement, and excess cash flow will be held by the lender as additional collateral.
A “Cash Trap Event Period” will commence upon the earliest of the following:
| (i) | the occurrence of an event of default under the loan documents; |
| (ii) | the major tenant vacates, fails to occupy or ceases normal business operations at the property; |
| (iii) | the major tenant becomes a debtor in a bankruptcy, insolvency or similar proceeding or action; |
| (iv) | the major tenant lease is terminated as a result of default beyond any applicable notice and cure period; and |
| (v) | the debt service coverage ratio being less than 1.20x (tested quarterly). |
A Cash Trap Event Period will end upon the occurrence of the following:
| ● | with regard to clause (i), the cure of such event of default; |
| ● | with regard to clause (ii), either (a) the major tenant recommences operations at the property, (b) balance of funds in the excess cash flow account is equal to two years of base rent and recoveries for the property (“Major Tenant Cash Trap Cure”), or (c) the GS Foods Portfolio Borrower deposits a letter of credit equal to the Major Tenant Cash Trap Cure; |
| ● | with regard to clause (iii), either (a) the bankruptcy action has been dismissed or discharged, (b) the major tenant has assumed the lease in full in such proceeding and the bankruptcy trustee has approved the assumption, or (c) the GS Foods Portfolio Borrower has entered into eligible replacement leases; |
| ● | with regard to clause (iv), either (a) the major tenant has cured such event of default and the GS Foods Portfolio Borrower has rescinded the termination or (b) the GS Foods Portfolio Borrower has entered into eligible replacement leases; and |
| ● | with regard to clause (v), upon the date that the debt service coverage ratio is at least 1.25x for one calendar quarter. |
Partial Release. Provided no event of default has occurred or is continuing, the GS Foods Portfolio Borrower has the right, at any time after the lockout release date, to sell one or more of the GS Foods Portfolio Properties, provided that certain conditions are satisfied, including, but not limited to, the following:
| (i) | Payment of a release price in an amount equal to 110% of the allocated loan amount of the property being released; |
| (ii) | the loan-to-value of the remaining properties is no greater than lesser of (a) the loan to value as of December 22, 2021 (67.2%) and (b) the loan-to-value immediately prior to the release; |
| (iii) | the net cash flow debt service coverage ratio immediately following the release is at least equal to the greater of (a) the net cash flow debt service coverage ratio as of December 27, 2021 (1.45x) and (b) the net cash flow debt service coverage ratio immediately prior to the release; and |
| (iv) | the net cash flow debt yield immediately following the release is no less than the greater of (a) the net cash flow debt yield as of December 27, 2021 (8.1%) and (b) the net cash flow debt yield immediately prior to the release. |
Property Management. The GS Foods Portfolio Properties are self-managed by the tenants.
Real Estate Substitution. Not permitted.
Subordinate and Mezzanine Indebtedness. Provided no event of default, the GS Foods Portfolio Borrower may obtain future mezzanine debt upon satisfaction of certain conditions defined in the loan agreement, including, but not limited to: (i) the LTV including the future mezzanine loan is not greater than 65.01%; (ii) the adjusted net cash flow DSCR, inclusive of the future mezzanine loan is no less than 1.25x, and; (iii) the adjusted net cash flow debt yield, inclusive of the future mezzanine loan is not less than 8.0%.
Ground Lease. None.
Terrorism Insurance. The GS Foods Portfolio Whole Loan documents require that the “all risk” insurance policy required to be maintained by the GS Foods Portfolio Borrower provides coverage for terrorism in an amount equal to the full replacement cost of the GS Foods Portfolio Properties, as well as business interruption insurance covering no less than the 18-month period following the occurrence of a casualty event (or a 12-month period for an individual property), together with a 6-month extended period of indemnity (provided that if TRIPRA or a similar statute is not in effect, the borrowers will not be obligated to pay terrorism insurance premiums in excess of two times the annual premium for the casualty and business interruption coverage (without giving effect to the cost of terrorism, flood and earthquake and business interruption components of such coverage)).
THE INFORMATION IN THIS COLLATERAL TERM SHEET IS NOT COMPLETE AND MAY BE AMENDED PRIOR TO THE TIME OF SALE. THIS TERM SHEET IS NOT AN OFFER TO SELL THESE SECURITIES AND IT IS NOT A SOLICITATION OF AN OFFER TO BUY THESE SECURITIES IN ANY JURISDICTION WHERE THE OFFER OR SALE IS NOT PERMITTED.
91
| Retail – Anchored | Loan #10 | Cut-off Date Balance: | | $17,500,000 |
1360 and 1380 Dogwood Drive Conyers, GA 30013 | Conyers Plaza | Cut-off Date LTV: U/W NCF DSCR: U/W NOI Debt Yield: | | 69.2% 3.02x 13.0% |
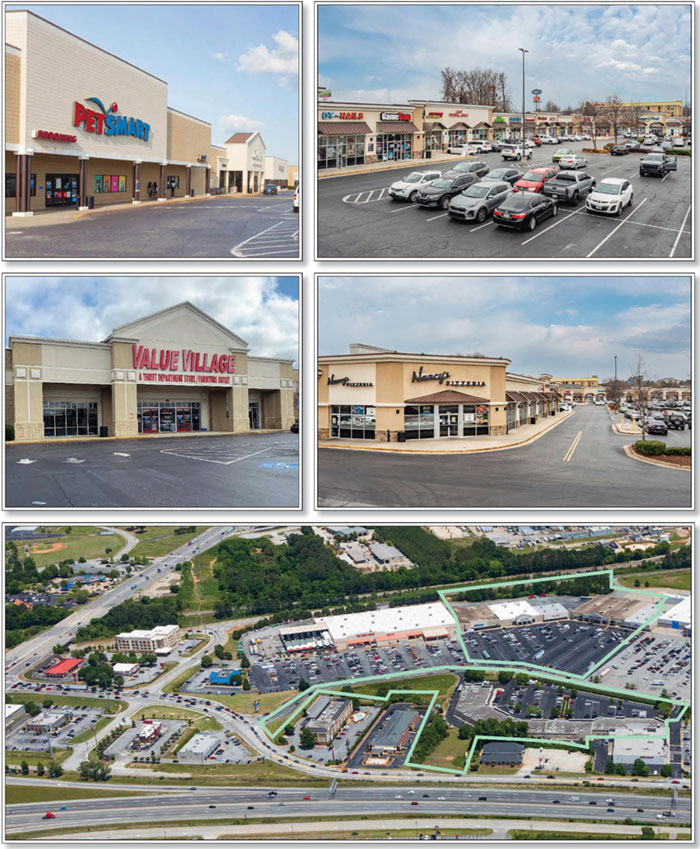
THE INFORMATION IN THIS COLLATERAL TERM SHEET IS NOT COMPLETE AND MAY BE AMENDED PRIOR TO THE TIME OF SALE. THIS TERM SHEET IS NOT AN OFFER TO SELL THESE SECURITIES AND IT IS NOT A SOLICITATION OF AN OFFER TO BUY THESE SECURITIES IN ANY JURISDICTION WHERE THE OFFER OR SALE IS NOT PERMITTED.
92
| Retail – Anchored | Loan #10 | Cut-off Date Balance: | | $17,500,000 |
1360 and 1380 Dogwood Drive Conyers, GA 30013 | Conyers Plaza | Cut-off Date LTV: U/W NCF DSCR: U/W NOI Debt Yield: | | 69.2% 3.02x 13.0% |
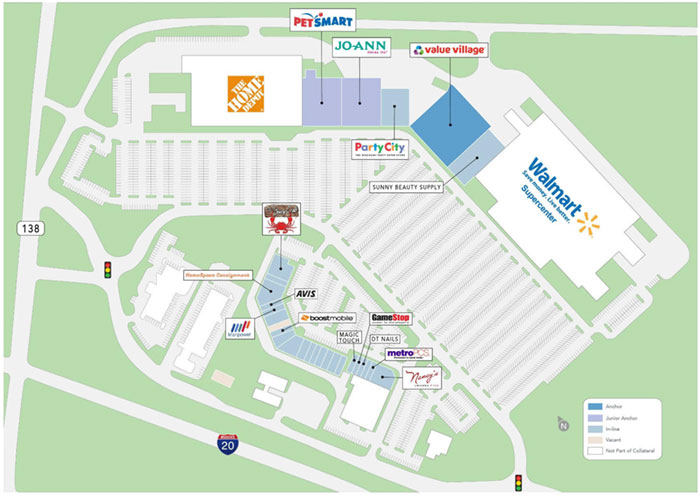
THE INFORMATION IN THIS COLLATERAL TERM SHEET IS NOT COMPLETE AND MAY BE AMENDED PRIOR TO THE TIME OF SALE. THIS TERM SHEET IS NOT AN OFFER TO SELL THESE SECURITIES AND IT IS NOT A SOLICITATION OF AN OFFER TO BUY THESE SECURITIES IN ANY JURISDICTION WHERE THE OFFER OR SALE IS NOT PERMITTED.
93
| No. 10 – Conyers Plaza |
| |
| Mortgage Loan Information | | Mortgaged Property Information |
| Mortgage Loan Seller: | Wells Fargo Bank, National Association | | Single Asset/Portfolio: | Single Asset |
Credit Assessment (Fitch/KBRA/Moody’s): | NR/NR/NR | | Property Type – Subtype: | Retail – Anchored |
| Original Principal Balance: | $17,500,000 | | Location: | Conyers, GA |
| Cut-off Date Balance: | $17,500,000 | | Size: | 171,374 SF |
| % of Initial Pool Balance: | 3.3% | | Cut-off Date Balance Per SF: | $102.12 |
| Loan Purpose: | Acquisition | | Maturity Date Balance Per SF: | $102.12 |
| Borrower Sponsor: | Alto Fund III | | Year Built/Renovated: | 1997/2005 |
| Guarantor: | Alto Fund III Holding, LP | | Title Vesting: | Fee |
| Mortgage Rate: | 3.8650% | | Property Manager: | Crawford Square Real Estate Advisors, LLC |
| Note Date: | February 1, 2022 | | Current Occupancy (As of): | 95.9% (12/1/2021) |
| Seasoning: | 2 months | | YE 2020 Occupancy(3): | 98.1% |
| Maturity Date: | February 11, 2027 | | YE 2019 Occupancy(3): | 100.0% |
| IO Period: | 60 months | | YE 2018 Occupancy(3): | 98.1% |
| Loan Term (Original): | 60 months | | YE 2017 Occupancy(3): | NAV |
| Amortization Term (Original): | NAP | | As-Is Appraised Value(4)(5): | $25,275,000 |
| Loan Amortization Type: | Interest Only | | As-Is Appraised Value Per SF: | $147.48 |
| Call Protection: | L(26),D(30),O(4) | | As-Is Appraisal Valuation Date: | November 22, 2021 |
| Lockbox Type: | Springing | | Underwriting and Financial Information(4) |
| Additional Debt: | None | | TTM NOI (12/31/2021)(6): | $2,499,830 |
| Additional Debt Type (Balance): | NAP | | YE 2020 NOI: | $2,021,099 |
| | | | YE 2019 NOI(6): | $2,184,227 |
| | | | YE 2018 NOI: | $1,893,504 |
| | | | U/W Revenues: | $3,030,426 |
| | | | U/W Expenses: | $757,527 |
| Escrows and Reserves | | U/W NOI: | $2,272,899 |
| | Initial | Monthly | Cap | | U/W NCF: | $2,070,001 |
| Taxes | $124,945 | $24,989 | NAP | | U/W DSCR based on NOI/NCF: | 3.31x / 3.02x |
| Insurance | $25,858 | $12,929 | NAP | | U/W Debt Yield based on NOI/NCF: | 13.0% / 11.8% |
| Replacement Reserves | $0 | $3,028 | NAP | | U/W Debt Yield at Maturity based on NOI/NCF: | 13.0% / 11.8% |
| TI/LC(1) | $0 | $13,975 | $600,000 | | Cut-off Date LTV Ratio: | 69.2% |
| Immediate Repairs(2) | $307,297 | $0 | NAP | | LTV Ratio at Maturity: | 69.2% |
| Existing TI/LC | $64,000 | $0 | NAP | | | |
| | | | | | | |
| | | | | | | | |
| Sources and Uses |
| Sources | | | | | Uses | | | |
| Original Mortgage Loan Amount | $17,500,000 | | 65.6% | | Purchase Price | $25,550,000 | | 95.8% |
| Borrower Equity | 9,166,771 | | 34.4 | | Closing Costs | 594,671 | | 2.2 |
| | | | | | Upfront Reserves | 522,100 | | 2.0 |
| | | | | | | | | |
| Total Sources | $26,666,771 | | 100.0% | | Total Uses | $26,666,771 | | 100.0% |
| (1) | As long as no event of default has occurred, the TI/LC reserve is capped at $600,000. Additionally, until the payment date in March 2023, the TI/LC funds may only be used for leasing expenses related to the premises currently demised to Value Village, PetSmart, JoAnn Fabrics & Crafts and Sunny Beauty Supply. |
| (2) | The Immediate Repairs reserve will be disbursed according to the loan agreement and primarily includes a roof system replacement for PetSmart, Party City, Sunny Beauty Supply and Value Village, as well as minor repairs for pavement, roof flashing, and masonry. |
| (3) | The transaction is an acquisition and the borrower did not provide occupancy information for 2017. Occupancy information for years 2018, 2019 and 2020 was provided by the borrower and represents the occupancy as of December of each year. |
| (4) | While the Conyers Plaza Mortgage Loan (defined below) was originated after the emergence of the novel coronavirus pandemic and the economic disruption resulting from measures to combat the pandemic, the pandemic is an evolving situation and could impact the Conyers Plaza Mortgage Loan more severely than assumed in the underwriting and could adversely affect the NOI, NCF and occupancy information, as well as the appraised value and the DSCR, LTV and Debt Yield metrics presented above. See “Risk Factors—Risks Related to Market Conditions and Other External Factors—Coronavirus Pandemic Has Adversely Affected the Global Economy and Will Likely Adversely Affect the Performance of the Mortgage Loans” in the Preliminary Prospectus. |
| (5) | The As-Is appraised value excludes the value of an approximately 0.50-acre unimproved portion of the collateral that is eligible for free release. |
| (6) | The increase in Net Operating Income from 2018 to 2019 was primarily driven by two new leases that commenced in December 2018 and four new leases which commenced in 2019 representing 16.2% of the underwritten rent. The increase in Net Operating Income from 2020 to 2021 was primarily driven by the reduction of collection loss in 2020. |
THE INFORMATION IN THIS COLLATERAL TERM SHEET IS NOT COMPLETE AND MAY BE AMENDED PRIOR TO THE TIME OF SALE. THIS TERM SHEET IS NOT AN OFFER TO SELL THESE SECURITIES AND IT IS NOT A SOLICITATION OF AN OFFER TO BUY THESE SECURITIES IN ANY JURISDICTION WHERE THE OFFER OR SALE IS NOT PERMITTED.
94
| Retail – Anchored | Loan #10 | Cut-off Date Balance: | | $17,500,000 |
1360 and 1380 Dogwood Drive Conyers, GA 30013 | Conyers Plaza | Cut-off Date LTV: U/W NCF DSCR: U/W NOI Debt Yield: | | 69.2% 3.02x 13.0% |
The Mortgage Loan. The tenth largest mortgage loan (the “Conyers Plaza Mortgage Loan”) is evidenced by the first priority fee interest encumbering an anchored retail property totaling 171,374 square feet located in Conyers, Georgia (the “Conyers Plaza Property”).
The Borrower and Borrower Sponsors. The borrower is ALTO Conyers Plaza, LP a Delaware limited partnership and single purpose entity. The borrower sponsor is ALTO Fund III and the nonrecourse carveout guarantor is ALTO Fund III Holding, LP.
ALTO Fund III is the third fund of ALTO Real Estate Funds. The company has been in operation for 12 years, with 13 million square feet under management with an asset value of approximately $1.3 billion.
Based on the structure of ALTO Fund III Holding, LP, the guarantor’s liability under the guaranty and environmental indemnity is capped at $19,162,500.
The Property. The Conyers Plaza Property consists of an anchored retail center totaling 171,374 square feet, located in Conyers, Georgia. Built in 1997 and renovated in 2005, the property is located on a 17.79-acre site, includes three buildings and a total of 671 parking spaces resulting in a parking ratio of 3.92 spaces per 1,000 square feet. The Conyers Plaza Property is anchored by Value Village, PetSmart, JoAnn Fabrics & Crafts, Sunny Beauty Supply and Party City, which collectively make up 69.8% of the net rentable area. Additionally, it is shadow anchored by a separately owned Walmart and Home Depot. As of December 1, 2021, the Conyers Plaza Property was 95.9% leased to 25 tenants.
Major Tenants.
Largest Tenant by UW Base Rent: JoAnn Fabrics & Crafts (NR/NR/B: F/M/S&P; 24,920 square feet; 14.5% of net rentable area; 15.8% of underwritten base rent; 1/31/2024 lease expiration) – JoAnn Fabrics & Crafts (“JoAnn Fabrics”) is a fabric and craft specialty retailer. The company was founded in 1943 and currently operates approximately 850 stores in 49 states. JoAnn Fabrics has been a tenant since 2013 and has two, five year renewal options remaining.
2nd Largest Tenant by UW Base Rent: Sunny Beauty Supply (15,060 square feet; 8.8% of net rentable area; 12.3% of underwritten base rent; 12/31/2025 lease expiration) – Sunny Beauty Supply offers beauty supplies, salon supply and cosmetics and perfumes. The company has been a tenant since 2010, most recently renewing its lease in 2016, and has no remaining renewal options.
3rd Largest Tenant by UW Base Rent: PetSmart (NR/B2/B: F/M/S&P; 26,115 square feet; 15.2% of net rentable area; 12.1% of underwritten base rent; 1/31/2023 lease expiration) – PetSmart is a specialty pet retailer which operates approximately 1,650 stores in the United States, Canada and Puerto Rico, as well as more than 200 in-store dog and cat boarding facilities. PetSmart has been a tenant since 1997 and most recently renewed its lease in 2018. The tenant has three, five-year renewal options remaining.
COVID-19 Update. As of March 11, 2022, the Conyers Plaza Property is open and operating. One tenant, representing 3.1% of the net rentable area and 5.8% of the underwritten rent, is paying reduced rent through July 2022.
THE INFORMATION IN THIS COLLATERAL TERM SHEET IS NOT COMPLETE AND MAY BE AMENDED PRIOR TO THE TIME OF SALE. THIS TERM SHEET IS NOT AN OFFER TO SELL THESE SECURITIES AND IT IS NOT A SOLICITATION OF AN OFFER TO BUY THESE SECURITIES IN ANY JURISDICTION WHERE THE OFFER OR SALE IS NOT PERMITTED.
95
| Retail – Anchored | Loan #10 | Cut-off Date Balance: | | $17,500,000 |
1360 and 1380 Dogwood Drive Conyers, GA 30013 | Conyers Plaza | Cut-off Date LTV: U/W NCF DSCR: U/W NOI Debt Yield: | | 69.2% 3.02x 13.0% |
The following table presents certain information relating to the tenancy at the Conyers Plaza Property:
Major Tenants
| Tenant Name | Credit Rating (Fitch/ Moody’s/
S&P) | Tenant NRSF | % of
NRSF | Annual U/W Base Rent PSF(1) | Annual
U/W Base Rent(1) | % of Total Annual U/W Base Rent | Lease
Expiration
Date | Ext. Options | Term. Option (Y/N) |
| Major Tenants | | | | | | | | |
| JoAnn Fabrics | NR/NR/B | 24,920 | 14.5% | $14.50 | $361,340 | 15.8% | 1/31/2024 | 2, 5-year | N |
| Sunny Beauty Supply | NR/NR/NR | 15,060 | 8.8% | $18.70 | $281,622 | 12.3% | 12/31/2025 | N | N |
| PetSmart | NR/B2/B | 26,115 | 15.2% | $10.59 | $276,558 | 12.1% | 1/31/2023 | 3, 5-year | N |
| Value Village | NR/NR/NR | 42,600 | 24.9% | $4.86 | $207,036 | 9.1% | 3/31/2026 | 1, 5-year | N |
| Party City | NR/NR/NR | 11,000 | 6.4% | $15.85 | $174,350 | 7.6% | 9/30/2029 | N | N |
| | 119,695 | 69.8% | $10.87 | $1,300,906 | 57.0% | | | |
| | | | | | | | | |
| Non-Major Tenants(5) | 44,672 | 26.1% | $21.98 | $981,716 | 43.0% | | | |
| | | | | | | | | |
| Occupied Collateral Total | 164,367 | 95.9% | $13.89 | $2,282,621 | 100.0% | | | |
| | | | | | | | | |
| Vacant Space(2) | 7,007 | 4.1% | | | | | | |
| | | | | | | | | |
| Collateral Total | 171,374 | 100.0% | | | | | | |
| | | | | | | | | | |
| (1) | Annual U/W Base Rent PSF and Annual U/W Base Rent include contractual rent steps through January 2023 totalling $41,130. |
| (2) | Vacant space includes two tenants who are currently in-place as month to month tenants, representing 1.5% of net rentable area. |
The following table presents certain information relating to the lease rollover schedule at the Conyers Plaza Property:
Lease Expiration Schedule(1)
Year Ending
December 31, | No. of Leases Expiring | Expiring NRSF | % of Total NRSF | Cumulative Expiring NRSF | Cumulative % of Total NRSF | Annual
U/W
Base Rent | % of Total Annual U/W Base Rent(2) | Annual
U/W
Base Rent
PSF(2) |
| MTM | 0 | 0 | 0.0% | 0 | 0.0% | $0 | 0.0% | $0.00 |
| 2022 | 7 | 14,352 | 8.4% | 14,352 | 8.4% | $300,260 | 13.2% | $20.92 |
| 2023 | 2 | 27,715 | 16.2% | 42,067 | 24.5% | $321,022 | 14.1% | $11.58 |
| 2024 | 5 | 31,400 | 18.3% | 73,467 | 42.9% | $489,694 | 21.5% | $15.60 |
| 2025 | 3 | 18,060 | 10.5% | 91,527 | 53.4% | $355,654 | 15.6% | $19.69 |
| 2026 | 1 | 42,600 | 24.9% | 134,127 | 78.3% | $207,036 | 9.1% | $4.86 |
| 2027 | 3 | 9,303 | 5.4% | 143,430 | 83.7% | $208,520 | 9.1% | $22.41 |
| Thereafter | 4 | 20,937 | 12.2% | 164,367 | 95.9% | $400,435 | 17.5% | $19.13 |
| Vacant(3) | 0 | 7,007 | 4.1% | 171,374 | 100.0% | $0 | 0.0% | $0.00 |
| Total/Weighted Average | 25 | 171,374 | 100.0% | | | $2,282,621 | 100.0% | $13.89 |
| (1) | Information obtained from the underwritten rent roll. |
| (2) | The Annual U/W Base Rent and Annual U/W Base Rent PSF excludes vacant space. |
| (3) | Vacant space includes two tenants who are currently in-place as month to month tenants, representing 1.5% of net rentable area. |
The following table presents historical occupancy percentages at the Conyers Plaza Property:
Historical Occupancy
12/31/2017(1) | 12/31/2018(2) | 12/31/2019(2) | 12/31/2020(2) | 12/1/2021(3) |
| NAV | 98.1% | 100.0% | 98.1% | 95.9% |
| (1) | The transaction is an acquisition and the borrower did not provide occupancy information for 2017. |
| (2) | Occupancy information for years 2018, 2019 and 2020 was provided by the borrower and represents the occupancy as of December of each year. |
| (3) | Information obtained from the underwritten rent roll. |
THE INFORMATION IN THIS COLLATERAL TERM SHEET IS NOT COMPLETE AND MAY BE AMENDED PRIOR TO THE TIME OF SALE. THIS TERM SHEET IS NOT AN OFFER TO SELL THESE SECURITIES AND IT IS NOT A SOLICITATION OF AN OFFER TO BUY THESE SECURITIES IN ANY JURISDICTION WHERE THE OFFER OR SALE IS NOT PERMITTED.
96
| Retail – Anchored | Loan #10 | Cut-off Date Balance: | | $17,500,000 |
1360 and 1380 Dogwood Drive Conyers, GA 30013 | Conyers Plaza | Cut-off Date LTV: U/W NCF DSCR: U/W NOI Debt Yield: | | 69.2% 3.02x 13.0% |
Underwritten Net Cash Flow. The following table presents certain information relating to the historical operating results and the underwritten net cash flow at the Conyers Plaza Property:
Cash Flow Analysis
| | 2018 | 2019 | 2020 | 2021 | U/W | %(1) | U/W $ per SF |
| Base Rent | $1,988,883 | $2,294,636 | $2,326,409 | $2,271,008 | $2,282,621(2) | 72.2% | $13.32 |
| Grossed Up Vacant Space | 0 | 0 | 0 | 0 | 130,421 | 4.1% | 0.76 |
| Gross Potential Rent | $1,988,883 | $2,294,636 | $2,326,409 | $2,271,008 | $2,413,042 | 76.3% | $14.08 |
| Other Income(3) | 88,502 | 111,680 | 109,589 | 60,643 | 53,373 | 1.7 | 0.31 |
| Total Recoveries | 467,763 | 558,171 | 542,786 | 546,452 | 694,432 | 22.0 | 4.05 |
| Net Rental Income | $2,545,148 | $2,964,487 | $2,978,784 | $2,878,103 | $3,160,847 | 100.0% | $18.44 |
| (Vacancy & Credit Loss) | 0 | 0 | 0 | 0 | (130,421) | (5.4) | (0.76) |
| Collection Loss | (23,288) | (162,163) | (361,949) | 204,052 | 0 | 0.0 | (0.00) |
| Effective Gross Income | $2,521,860 | $2,802,324 | $2,616,835 | $3,082,155 | $3,030,426 | 95.9% | $17.68 |
| | | | | | | | |
| Real Estate Taxes | $302,461 | $303,503 | $291,512 | $273,909 | $348,240 | 11.5% | $2.03 |
| Insurance | 36,143 | 36,868 | 40,424 | 45,617 | 147,764 | 4.9 | 0.86 |
| Management Fee | 89,080 | 103,760 | 104,263 | 92,188 | 90,913 | 3.0 | 0.53 |
| Other Operating Expenses | 200,672 | 173,966 | 159,537 | 170,611 | 170,611 | 5.6 | 1.00 |
| Total Operating Expenses | $628,356 | $618,097 | $595,736 | $582,325 | $757,527 | 25.0% | $4.42 |
| | | | | | | | |
| Net Operating Income | $1,893,504 | $2,184,227(4) | $2,021,099 | $2,499,830(5) | $2,272,899 | 75.0% | $13.26 |
| Replacement Reserves | 0 | 0 | 0 | 0 | 36,340 | 1.2 | 0.21 |
| TI/LC | 0 | 0 | 0 | 0 | 166,557 | 5.5 | 0.97 |
| Net Cash Flow | $1,893,504 | $2,184,227 | $2,021,099 | $2,499,830 | $2,070,001 | 68.3% | $12.08 |
| | | | | | | | |
| NOI DSCR | 2.76x | 3.19x | 2.95x | 3.65x | 3.31x | | |
| NCF DSCR | 2.76x | 3.19x | 2.95x | 3.65x | 3.02x | | |
| NOI Debt Yield | 10.8% | 12.5% | 11.5% | 14.3% | 13.0% | | |
| NCF Debt Yield | 10.8% | 12.5% | 11.5% | 14.3% | 11.8% | | |
| (1) | Represents (i) percent of Net Rental Income for all revenue fields, (ii) percent of Gross Potential Rent for Vacancy & Credit Loss and (iii) percent of Effective Gross Income for all other fields. |
| (2) | The U/W Base Rent PSF and U/W Base Rent include contractual rent steps through January 2023 totaling $41,130. |
| (3) | Other Income consists primarily of ATM rents and ancillary income associated with pylon signage and promotional events. |
| (4) | The increase in Net Operating Income from 2018 to 2019 was primarily driven by two new leases that commenced in December 2018 and four new leases which commenced in 2019 representing 16.2% of the underwritten rent. |
| (5) | The increase in Net Operating Income from 2020 to 2021 was primarily driven by the burn off of collection loss in 2020. |
Appraisal. The As-Is appraised value is $25,275,000, which excludes the $275,000 value of an approximately 0.50-acre unimproved portion of the collateral that is eligible for a conditional free release. The appraised value is as of November 22, 2021.
Environmental Matters. According to the Phase I environmental site assessments dated November 4, 2021, no environmental conditions were identified at the Conyers Plaza Property.
The loan documents provide that so long as the borrower maintains environmental insurance (lender-approved at origination), the guarantor’s liability under the related guaranty, including out-of-pocket expenses and reasonable attorneys’ fees, is capped at $19,162,500. The lender obtained a $1,000,000 premises environmental liability – commercial lender’s-type environmental insurance policy at loan origination with a $1,000,000 sublimit per claim from Great American Insurance Group, with a eight-year term (three years past the loan term) and having a $25,000 deductible per claim.
Market Overview and Competition. The Conyers Plaza Property is located in Conyers, Georgia, approximately 25.7 miles east of Atlanta. The property is located approximately 1.9 miles from downtown Conyers at the intersection of I-20 and Highway 138, which is an established commercial area. The surrounding area includes numerous convenience and strip neighborhood centers as well as community shopping centers. The area is estimated to be 90% built out and other retailers in the vicinity include Five Below, T.J. Maxx, Kohl’s, Hobby Lobby, and Burlington. According to the appraisal, within a 1-, 3- and 5- mile radius of the Conyers Plaza Property, the estimated 2021 population is 3,541, 37,739, and 88,404, respectively, and the 2021 average household income is $55,757, $74,961, and $76,603, respectively.
According to the appraisal, the property is situated within the Lithonia/Conyers retail submarket of the greater Atlanta retail market. The submarket reports a total inventory of approximately 14.0 million square feet with a 5.8% vacancy rate and average market rents
THE INFORMATION IN THIS COLLATERAL TERM SHEET IS NOT COMPLETE AND MAY BE AMENDED PRIOR TO THE TIME OF SALE. THIS TERM SHEET IS NOT AN OFFER TO SELL THESE SECURITIES AND IT IS NOT A SOLICITATION OF AN OFFER TO BUY THESE SECURITIES IN ANY JURISDICTION WHERE THE OFFER OR SALE IS NOT PERMITTED.
97
| Retail – Anchored | Loan #10 | Cut-off Date Balance: | | $17,500,000 |
1360 and 1380 Dogwood Drive Conyers, GA 30013 | Conyers Plaza | Cut-off Date LTV: U/W NCF DSCR: U/W NOI Debt Yield: | | 69.2% 3.02x 13.0% |
of $15.64 per square foot. There is currently 301,000 square feet under construction in the submarket. The appraiser identified six lease comparables for Anchor/Major leases with rents ranging from $4.63 to $11.85 per square foot.
The following table presents certain information relating to the appraiser’s market rent conclusions for the Conyers Plaza Property:
Market Rent Summary(1)
| | Anchor | Jr. Anchor | Major | Restaurant | Inline >2,500 SF | Inline <2,500 SF |
| Market Rent (PSF) | $6.50 | $12.50 | $15.00 | $25.00 | $15.00 | $22.50 |
| Lease Term (Years) | 10 | 10 | 10 | 5 | 5 | 5 |
| Lease Type | Net | Net | Net | Net | Net | Net |
| Rent Increase Projection | 10.0% in Yr. 6 | 10.0% in Yr. 6 | 10.0% in Yr. 6 | 10.0% in Yr. 6 | 3.0%/Year | 3.0%/Year |
| (1) | Information obtained from the appraisal. |
The table below presents certain information relating to comparable sales pertaining to the Conyers Plaza Property identified by the appraiser:
Comparable Sales(1)
| Property Name | Location | Year Built/Renovated | Rentable
Area (SF) | Occupancy | Sale Date | Sale Price | Sale Price (PSF) |
Conyers Plaza (Subject) 1360 and 1380 Dogwood Drive | Conyers, GA | 1997 / 2005 | 171,374 | 95.9% | Feb-2022 | $25,550,000 | $149 |
| | | | | | | | |
Woodstock Square 120 Woodstock Square Avenue | Woodstock, GA | 2001 / NAP | 218,859 | 98.0% | Jul-2021 | $37,670,000 | $172 |
| | | | | | | | |
Stonebridge Square 614 West Crossville Road | Roswell, GA | 2001 / NAP | 152,447 | 95.0% | Jul-2021 | $17,400,000 | $114 |
| | | | | | | | |
Stonebridge Village 5813-5899 Sprout Springs Road | Flowery Branch, GA | 2004 / NAP | 157,002 | 99.0% | Aug-2021 | $34,000,000 | $217 |
| | | | | | | | |
Arbor Square 9478 Georgia 5 | Douglasville, GA | 1977 / NAP | 122,763 | 97.0% | Sep-2021 | $18,350,000 | $149 |
| | | | | | | | |
Turner Hill Marketplace - Listing 2918 Turner Hill Road | Lithonia, GA | 2001 / NAP | 124,294 | 100.0% | Nov-2021 | $17,690,000 | $142 |
| | | | | | | | |
| (1) | Information obtained from the appraisal. |
THE INFORMATION IN THIS COLLATERAL TERM SHEET IS NOT COMPLETE AND MAY BE AMENDED PRIOR TO THE TIME OF SALE. THIS TERM SHEET IS NOT AN OFFER TO SELL THESE SECURITIES AND IT IS NOT A SOLICITATION OF AN OFFER TO BUY THESE SECURITIES IN ANY JURISDICTION WHERE THE OFFER OR SALE IS NOT PERMITTED.
98
| Retail – Anchored | Loan #10 | Cut-off Date Balance: | | $17,500,000 |
1360 and 1380 Dogwood Drive Conyers, GA 30013 | Conyers Plaza | Cut-off Date LTV: U/W NCF DSCR: U/W NOI Debt Yield: | | 69.2% 3.02x 13.0% |
The following table presents certain information relating comparable Anchor/Major leases for the Conyers Plaza Property:
Comparable Anchor/Major Leases(1)
| Property Name/Location | Year Built/ Renovated | Total GLA (SF) | Tenant | Tenant Size (SF) | Lease Start Date | Lease Term | Annual Base Rent PSF | Lease Type |
Conyers Plaza (Subject) 1360 and 1380 Dogwood Drive Conyers, GA | 1997 / 2005 | 171,374(2) | | | | | | |
Southlake Pavilion 1956 Mount Zion Road Morrow, GA | 1993 / NAP | 218,038 | Roses | 40,000 | Jun-2019 | 10.0 Yrs. | $4.63 | MG |
Southlake Pavilion 1956 Mount Zion Road Morrow, GA | 1993 / NAP | 218,038 | BioLife Plasma Services | 18,500 | Nov-2019 | 10.0 Yrs. | $9.10 | Net |
Southlake Pavilion 1956 Mount Zion Road Morrow, GA | 1993 / NAP | 218,038 | Planet Fitness | 17,000 | Apr-2019 | 10.0 Yrs. | $7.50 | MG |
Old National Town Center 6175 Old National Highway Atlanta, GA | 2007 / NAP | 98,965 | Goodwill | 30,187 | Dec-2018 | 10.0 Yrs. | $9.25 | Gross |
Old National Marketplace 6385 Old National Highway Atlanta, GA | 2012 / NAP | 235,155 | Ace Hardware | 12,600 | Jan-2020 | 10.0 Yrs. | $10.50 | Net |
Old National Town Center 6175 Old National Highway Atlanta, GA | 2007 / NAP | 98,965 | Goodwill | 10,400 | Jul-2019 | 10.0 Yrs. | $11.85 | Gross |
| (1) | Information obtained from the appraisal. |
| (2) | Information obtained from the underwritten rent roll. |
Escrows.
Real Estate Taxes – The loan documents require an upfront deposit of $124,945 for real estate taxes and ongoing monthly deposits of $24,989.
Insurance – The loan documents require an upfront deposit of $25,858 for insurance and ongoing monthly deposits of $12,929.
Immediate Repairs – The loan documents require an upfront deposit of $307,297 to address immediate repairs including a roof system replacement for PetSmart, Party City, Sunny Beauty Supply and Value Village, as well as minor repairs for pavement, roof flashing, and masonry.
Replacement Reserves – The loan documents require ongoing monthly deposits of $3,028.
Leasing Reserves – The loan documents require an ongoing monthly deposit of $13,975 for tenant improvements and leasing costs. As long as no event of default is continuing, the reserve is capped at $600,000.
Existing TI/LC Reserve – The loan documents require an upfront deposit of $64,000 related to tenant improvements and leasing commissions payable by the borrower under existing leases.
Lockbox and Cash Management. The Conyers Plaza Mortgage Loan is structured with a springing lockbox and springing cash management. Within 30 days of written notice from the lender that a Cash Trap Event Period (defined below) has commenced, the borrower will open a deposit account controlled by the lender and the borrower will cause all rents to deposited directly into the account. If no Cash Trap Event Period exists, all funds on deposit will be transferred to an account designated by the borrower. During the continuance of a Cash Trap Event Period, all funds in the cash account will be applied according to the cash management agreement, and excess cash flow will be held by the lender as additional collateral.
THE INFORMATION IN THIS COLLATERAL TERM SHEET IS NOT COMPLETE AND MAY BE AMENDED PRIOR TO THE TIME OF SALE. THIS TERM SHEET IS NOT AN OFFER TO SELL THESE SECURITIES AND IT IS NOT A SOLICITATION OF AN OFFER TO BUY THESE SECURITIES IN ANY JURISDICTION WHERE THE OFFER OR SALE IS NOT PERMITTED.
99
| Retail – Anchored | Loan #10 | Cut-off Date Balance: | | $17,500,000 |
1360 and 1380 Dogwood Drive Conyers, GA 30013 | Conyers Plaza | Cut-off Date LTV: U/W NCF DSCR: U/W NOI Debt Yield: | | 69.2% 3.02x 13.0% |
A “Cash Trap Event Period” will commence upon the earliest of the following:
| (i) | the occurrence of an event of default under the loan documents; and |
| (ii) | the net cash flow debt yield being less than 7.0%, tested quarterly; |
A Cash Trap Event Period will end upon the occurrence of the following:
| ● | with regard to clause (i), the cure of such event of default; and |
| ● | with regard to clause (ii), the net cash flow debt yield being at least 7.5% for two consecutive quarters. |
Partial Release. Provided no event of default has occurred or is continuing, and, among other things, a rating agency confirmation has been obtained, the loan documents allow for the free release of an approximately 0.50-acre, unimproved area of the collateral, the value of which has been excluded from the appraised value.
Property Management. The Conyers Plaza Property is managed by Crawford Square Real Estate Advisors, LLC.
Real Estate Substitution. Not permitted.
Subordinate and Mezzanine Indebtedness. None.
Ground Lease. None.
Terrorism Insurance. The loan documents require that the “all risk” insurance policy required to be maintained by the borrower provides coverage for terrorism in an amount equal to the full replacement cost of the Conyers Plaza Property, as well as business interruption insurance covering no less than the 12-month period following the occurrence of a casualty event (or a 12-month period for an individual property), together with a 6-month extended period of indemnity.
THE INFORMATION IN THIS COLLATERAL TERM SHEET IS NOT COMPLETE AND MAY BE AMENDED PRIOR TO THE TIME OF SALE. THIS TERM SHEET IS NOT AN OFFER TO SELL THESE SECURITIES AND IT IS NOT A SOLICITATION OF AN OFFER TO BUY THESE SECURITIES IN ANY JURISDICTION WHERE THE OFFER OR SALE IS NOT PERMITTED.
100
| Wells Fargo Commercial Mortgage Trust 2022-C62 | Transaction Contact Information |
IV. Transaction Contact Information
Questions regarding this Structural and Collateral Term Sheet may be directed to any of the following individuals:
| Wells Fargo Securities, LLC | |
| | |
| Brigid Mattingly | Tel. (312) 269-3062 |
| | |
| A.J. Sfarra | Tel. (212) 214-5613 |
| | |
| Sean Duffy | Tel. (312) 837-1518 |
| | |
| | |
| UBS Securities, LLC | |
| | |
| Nicholas Galeone | Tel. (212) 713-8832 |
| | |
| Siho Ham | Tel. (212) 713-1278 |
THE INFORMATION IN THIS COLLATERAL TERM SHEET IS NOT COMPLETE AND MAY BE AMENDED PRIOR TO THE TIME OF SALE. THIS TERM SHEET IS NOT AN OFFER TO SELL THESE SECURITIES AND IT IS NOT A SOLICITATION OF AN OFFER TO BUY THESE SECURITIES IN ANY JURISDICTION WHERE THE OFFER OR SALE IS NOT PERMITTED.
101