| | | FREE WRITING PROSPECTUS |
| | | FILED PURSUANT TO RULE 433 |
| | | REGISTRATION FILE NO.: 333-257991-12 |
| | | |
Free Writing Prospectus
Structural and Collateral Term Sheet
$713,960,139
(Approximate Initial Pool Balance)
$652,381,000
(Approximate Aggregate Certificate Balance of Offered Certificates)
Wells Fargo Commercial Mortgage Trust 2024-C63
as Issuing Entity
Wells Fargo Commercial Mortgage Securities, Inc.
as Depositor
Wells Fargo Bank, National Association
Argentic Real Estate Finance 2 LLC
JPMorgan Chase Bank, National Association
National Cooperative Bank, N.A.
Goldman Sachs Mortgage Company
Societe Generale Financial Corporation
as Sponsors and Mortgage Loan Sellers
Commercial Mortgage Pass-Through Certificates
Series 2024-C63
August 12, 2024
WELLS FARGO
SECURITIES | GOLDMAN SACHS &
CO. LLC | J.P MORGAN | SOCIÉTÉ
GÉNÉRALE |
Co-Lead Manager and Joint Bookrunner | Co-Lead Manager and
Joint Bookrunner | Co-Lead Manager and
Joint Bookrunner | Co-Lead Manager and Joint Bookrunner |
Academy Securities Co-Manager | Drexel Hamilton Co-Manager | Siebert Williams Shank Co-Manager |
STATEMENT REGARDING THIS FREE WRITING PROSPECTUS
The depositor has filed a registration statement (including a prospectus) with the Securities and Exchange Commission (“SEC”) (SEC File No. 333-257991) for the offering to which this communication relates. Before you invest, you should read the prospectus in the registration statement and other documents the depositor has filed with the SEC for more complete information about the depositor, the issuing entity and this offering. You may get these documents for free by visiting EDGAR on the SEC Web site at www.sec.gov. Alternatively, the depositor, any underwriter, or any dealer participating in the offering will arrange to send you the prospectus after filing if you request it by calling toll free 1-800-745-2063 (8 a.m. – 5 p.m. Eastern Time) or by emailing wfs.cmbs@wellsfargo.com.
Nothing in this document constitutes an offer of securities for sale in any jurisdiction where the offer or sale is not permitted. The information contained herein is preliminary as of the date hereof, supersedes any such information previously delivered to you and will be superseded by any such information subsequently delivered and ultimately by the final prospectus relating to the securities. These materials are subject to change, completion, supplement or amendment from time to time.
This free writing prospectus has been prepared by the underwriters for information purposes only and does not constitute, in whole or in part, a prospectus for the purposes of (i) Regulation (EU) 2017/1129 (as amended), (ii) such Regulation as it forms part of UK domestic law, or (iii) Part VI of the UK Financial Services and Markets Act 2000, as amended; and does not constitute an offering document for any other purpose.
STATEMENT REGARDING ASSUMPTIONS AS TO SECURITIES, PRICING ESTIMATES AND OTHER INFORMATION
The attached information contains certain tables and other statistical analyses (the “Computational Materials”) which have been prepared in reliance upon information furnished by the Mortgage Loan Sellers. Numerous assumptions were used in preparing the Computational Materials, which may or may not be reflected herein. As such, no assurance can be given as to the Computational Materials’ accuracy, appropriateness or completeness in any particular context; or as to whether the Computational Materials and/or the assumptions upon which they are based reflect present market conditions or future market performance. The Computational Materials should not be construed as either projections or predictions or as legal, tax, financial or accounting advice. You should consult your own counsel, accountant and other advisors as to the legal, tax, business, financial and related aspects of a purchase of these securities. Any weighted average lives, yields and principal payment periods shown in the Computational Materials are based on prepayment and/or loss assumptions, and changes in such prepayment and/or loss assumptions may dramatically affect such weighted average lives, yields and principal payment periods. In addition, it is possible that prepayments or losses on the underlying assets will occur at rates higher or lower than the rates shown in the attached Computational Materials. The specific characteristics of the securities may differ from those shown in the Computational Materials due to differences between the final underlying assets and the preliminary underlying assets used in preparing the Computational Materials. The principal amount and designation of any security described in the Computational Materials are subject to change prior to issuance. None of Wells Fargo Securities, LLC, Goldman Sachs & Co. LLC, J.P. Morgan Securities LLC, SG Americas Securities LLC, Academy Securities, Inc., Drexel Hamilton, LLC, Siebert Williams Shank & Co., LLC or any of their respective affiliates, make any representation or warranty as to the actual rate or timing of payments or losses on any of the underlying assets or the payments or yield on the securities. The information in this presentation is based upon management forecasts and reflects prevailing conditions and management’s views as of this date, all of which are subject to change. In preparing this presentation, we have relied upon and assumed, without independent verification, the accuracy and completeness of all information available from public sources or which was provided to us by or on behalf of the Mortgage Loan Sellers or which was otherwise reviewed by us.
This free writing prospectus contains certain forward-looking statements. If and when included in this free writing prospectus, the words “expects”, “intends”, “anticipates”, “estimates” and analogous expressions and all statements that are not historical facts, including statements about our beliefs or expectations, are intended to identify forward-looking statements. Any forward-looking statements are made subject to risks and uncertainties which could cause actual results to differ materially from those stated. Those risks and uncertainties include, among other things, declines in general economic and business conditions, increased competition, changes in demographics, changes in political and social conditions, regulatory initiatives and changes in customer preferences, many of which are beyond our control and the control of any other person or entity related to this offering. The forward-looking statements made in this free writing prospectus are made as of the date stated on the cover. We have no obligation to update or revise any forward-looking statement.
Wells Fargo Securities is the trade name for the capital markets and investment banking services of Wells Fargo & Company and its subsidiaries, including but not limited to Wells Fargo Securities, LLC, a member of NYSE, FINRA, NFA and SIPC, Wells Fargo Prime Services, LLC, a member of FINRA, NFA and SIPC, and Wells Fargo Bank, N.A. Wells Fargo Securities, LLC and Wells Fargo Prime Services, LLC are distinct entities from affiliated banks and thrifts.
J.P. Morgan is the marketing name for the investment banking businesses of JPMorgan Chase & Co. and its subsidiaries worldwide. Securities, syndicated loan arranging, financial advisory and other investment banking activities are performed by JPMS and its securities affiliates, and lending, derivatives and other commercial banking activities are performed by JPMorgan Chase Bank, National Association and its banking affiliates. JPMS is a member of SIPC and the NYSE.
Société Générale is the marketing name for SG Americas Securities, LLC.
IMPORTANT NOTICE REGARDING THE OFFERED CERTIFICATES
The information herein is preliminary and may be supplemented or amended prior to the time of sale. In addition, the Offered Certificates referred to in these materials and the asset pool backing them are subject to modification or revision (including the possibility that one or more classes of certificates may be split, combined or eliminated at any time prior to issuance or availability of a final prospectus) and are offered on a “when, as and if issued” basis.
The underwriters described in these materials may from time to time perform investment banking services for, or solicit investment banking business from, any company named in these materials. The underwriters and/or their affiliates or respective employees may from time to time have a long or short position in any security or contract discussed in these materials.
The information contained herein supersedes any previous such information delivered to any prospective investor and will be superseded by information delivered to such prospective investor prior to the time of sale.
IMPORTANT NOTICE RELATING TO AUTOMATICALLY-GENERATED EMAIL DISCLAIMERS
Any legends, disclaimers or other notices that may appear at the bottom of any email communication to which this free writing prospectus is attached relating to (1) these materials not constituting an offer (or a solicitation of an offer), (2) any representation that these materials are accurate or complete and may not be updated or (3) these materials possibly being confidential, are not applicable to these materials and should be disregarded. Such legends, disclaimers or other notices have been automatically generated as a result of these materials having been sent via Bloomberg or another system.
| THE INFORMATION IN THIS STRUCTURAL AND COLLATERAL TERM SHEET IS NOT COMPLETE AND MAY BE AMENDED PRIOR TO THE TIME OF SALE. THIS TERM SHEET IS NOT AN OFFER TO SELL THESE SECURITIES AND IT IS NOT A SOLICITATION OF AN OFFER TO BUY THESE SECURITIES IN ANY JURISDICTION WHERE THE OFFER OR SALE IS NOT PERMITTED. |
| | 2 | |
| Wells Fargo Commercial Mortgage Trust 2024-C63 | Certificate Structure |
| Class | Expected Ratings
(Fitch/Moody’s /
KBRA)(1) | Approximate Initial Certificate Balance or Notional Amount(2) | Approximate Initial Available Certificate Balance or Notional Amount(2) | Approximate Initial Retained Certificate Balance or Notional Amount(2)(3) | Approx. Initial Credit Support(4) | Pass-Through Rate Description | Weighted Average Life (Years)(5) | Expected
Principal
Window(5) | Certificate Principal to Value Ratio(6) | Certificate Principal U/W NOI Debt Yield(7) |
| Offered Certificates | | | | |
| A-1 | AAAsf/Aaa(sf)/AAA(sf) | $9,518,000 | $9,171,000 | $347,000 | 30.000% | (8) | 2.68 | 09/24 - 08/29 | 32.0% | 24.9% |
| A-3 | AAAsf/Aaa(sf)/AAA(sf) | $65,000,000 | $62,627,000 | $2,373,000 | 30.000% | (8) | 6.88 | 07/31 - 07/31 | 32.0% | 24.9% |
| A-SB | AAAsf/Aaa(sf)/AAA(sf) | $15,597,000 | $15,028,000 | $569,000 | 30.000% | (8) | 7.51 | 08/29 - 06/34 | 32.0% | 24.9% |
| A-4 | AAAsf/Aaa(sf)/AAA(sf) | (9) | (9) | (9) | 30.000% | (8) | (9) | (9) | 32.0% | 24.9% |
| A-5 | AAAsf/Aaa(sf)/AAA(sf) | (9) | (9) | (9) | 30.000% | (8) | (9) | (9) | 32.0% | 24.9% |
| X-A | AAAsf/Aaa(sf)/AAA(sf) | $499,772,000(10) | $481,530,000(10) | $18,242,000(10) | N/A | Variable(11) | N/A | N/A | N/A | N/A |
| X-B | A-sf/NR/AAA(sf) | $152,609,000(12) | $147,039,000(12) | $5,570,000(12) | N/A | Variable(13) | N/A | N/A | N/A | N/A |
| A-S | AAAsf/Aa1(sf)/AAA(sf) | $101,739,000 | $98,026,000 | $3,713,000 | 15.750% | (8) | 9.96 | 08/34 - 08/34 | 38.5% | 20.7% |
| B | AA-sf/NR/AA-(sf) | $32,128,000 | $30,955,000 | $1,173,000 | 11.250% | (8) | 9.96 | 08/34 - 08/34 | 40.6% | 19.6% |
| C | A-sf/NR/A-(sf) | $18,742,000 | $18,058,000 | $684,000 | 8.625% | (8) | 9.96 | 08/34 - 08/34 | 41.8% | 19.1% |
| Non-Offered Certificates | | | | | | | | |
| X-D | BBB-sf/NR/BBB-(sf) | $18,741,000(14) | $18,057,000(14) | $684,000(14) | N/A | Variable(15) | N/A | N/A | N/A | N/A |
| X-F | BB-sf/NR/BB-(sf) | $13,387,000(16) | $12,898,000(16) | $489,000(16) | N/A | Variable(17) | N/A | N/A | N/A | N/A |
| D | BBBsf/NR/BBB(sf) | $11,601,000 | $11,178,000 | $423,000 | 7.000% | (8) | 9.96 | 08/34 - 08/34 | 42.5% | 18.8% |
| E | BBB-sf/NR/BBB-(sf) | $7,140,000 | $6,879,000 | $261,000 | 6.000% | (8) | 9.96 | 08/34 - 08/34 | 43.0% | 18.6% |
| F | BB-sf/NR/BB-(sf) | $13,387,000 | $12,898,000 | $489,000 | 4.125% | (8) | 9.96 | 08/34 - 08/34 | 43.8% | 18.2% |
| G-RR | B-sf/NR/B-(sf) | $8,924,000 | $8,598,000 | $326,000 | 2.875% | (8) | 9.96 | 08/34 - 08/34 | 44.4% | 18.0% |
| J-RR | NR/NR/NR | $20,527,138 | $19,778,138 | $749,000 | 0.000% | (8) | 9.96 | 08/34 - 08/34 | 45.7% | 17.4% |
Notes:
| (1) | The expected ratings presented are those of Fitch Ratings, Inc. (“Fitch”), Moody’s Investors Service, Inc. (“Moody’s”) and Kroll Bond Rating Agency, LLC (“KBRA”), which the depositor hired to rate the Offered Certificates. One or more other nationally recognized statistical rating organizations that were not hired by the depositor may use information they receive pursuant to Rule 17g-5 under the Securities Exchange Act of 1934, as amended (the “Exchange Act”) or otherwise, to rate or provide market reports and/or published commentary related to the Offered Certificates. We cannot assure you as to what ratings a non-hired nationally recognized statistical rating organization would assign or that its reports will not express differing, possibly negative, views of the mortgage loans and/or the Offered Certificates. The ratings of each Class of Offered Certificates address the likelihood of the timely distribution of interest and, except in the case of the Class X-A and X-B Certificates, the ultimate distribution of principal due on those Classes on or before the Rated Final Distribution Date. See “Risk Factors—Other Risks Relating to the Certificates—Nationally Recognized Statistical Rating Organizations May Assign Different Ratings to the Certificates; Ratings of the Certificates Reflect Only the Views of the Applicable Rating Agencies as of the Dates Such Ratings Were Issued; Ratings May Affect ERISA Eligibility; Ratings May Be Downgraded” and “Ratings” in the Preliminary Prospectus, expected to be dated August 12, 2024 (the “Preliminary Prospectus”). Fitch, KBRA and Moody’s have informed us that the “sf” designation in their ratings represents an identifier for structured finance product ratings. |
| (2) | The Initial Certificate Balances and Notional Amounts set forth in the table are approximate. The actual initial Certificate Balances and Notional Amounts may be larger or smaller in connection with any variation in the Certificate Balance of the VRR Interest and/or the Horizontal Risk Retention Certificates following the calculation of the actual fair value of all of the ABS interests (as such term is defined in the Credit Risk Retention Rules) issued by the issuing entity, as described under “Credit Risk Retention” in the Preliminary Prospectus. The actual initial Certificate Balances and Notional Amounts also depend on the initial pool balance of the mortgage loans definitively included in the pool of mortgage loans, which aggregate cut-off date balance may be as much as 5% larger or smaller than the amount presented in the Preliminary Prospectus. In addition, the Notional Amounts of the Class X-A, X-B, X-D and X-F Certificates may vary depending upon the final pricing of the Classes of Principal Balance Certificates (as defined below) and, if, as a result of such pricing, the pass-through rate of any of the Class X-A, X-B, X-D and X-F Certificates, as applicable, would be equal to zero at all times, such Class of Certificates may not be issued on the closing date of this securitization. |
| (3) | On the closing date, the Certificates with the initial Certificate Balances or Notional Amounts, as applicable, set forth in the table above under “Approximate Initial Retained Certificate Balance or Notional Amount” (such Certificates, collectively the “VRR Interest”) are expected to be purchased for cash from the underwriters by a majority-owned affiliate of Argentic Real Estate Finance 2 LLC (a sponsor and affiliate of the special servicer), as the “retaining sponsor” (as such term is defined in the Credit Risk Retention Rules), as further described in “Credit Risk Retention” in the Preliminary Prospectus. |
| (4) | The approximate initial credit support with respect to the Class A-1, A-3, A-SB, A-4 and A-5 Certificates represents the approximate credit enhancement for the Class A-1, A-3, A-SB, A-4 and A-5 Certificates in the aggregate. |
| (5) | Weighted Average Lives and Expected Principal Windows are calculated based on an assumed prepayment rate of 0% CPR and the “Structuring Assumptions” described under “Yield and Maturity Considerations—Weighted Average Life” in the Preliminary Prospectus. |
| (6) | The Certificate Principal to Value Ratio for each Class of Certificates (other than the Class A-1, A-3, A-SB, A-4 and A-5 Certificates) is calculated as the product of (a) the weighted average Cut-off Date LTV Ratio for the mortgage loans and (b) a fraction, the numerator of which is the total initial Certificate Balance of such Class of Certificates and all Classes of Principal Balance Certificates senior to such Class of Certificates and the denominator of which is the total initial Certificate Balance of all of the Classes of Principal Balance Certificates. The Certificate Principal to Value Ratio for each of the Class A-1, A-3, A-SB, A-4 and A-5 Certificates is calculated in the aggregate for those Classes as if they were a single Class and is calculated as the product of (a) the weighted average Cut-off Date LTV Ratio for the mortgage loans and (b) a fraction, the numerator of which is the total initial Certificate Balance of such Classes of Certificates and the denominator of which is the total initial Certificate Balance of all of the Classes of Principal Balance Certificates. In any event, however, excess mortgaged property value associated with a mortgage loan will not be available to offset losses on any other mortgage loan. |
| (7) | The Certificate Principal U/W NOI Debt Yield for each Class of Certificates (other than the Class A-1, A-3, A-SB, A-4 and A-5 Certificates) is calculated as the product of (a) the weighted average U/W NOI Debt Yield for the mortgage loans and (b) a fraction, the numerator of which is the total initial Certificate Balance of all of the Classes of Principal Balance Certificates and the denominator of which is the total initial Certificate Balance of such Class of Certificates and all Classes of Principal Balance Certificates senior to such Class of Certificates. The Certificate Principal U/W NOI Debt Yield for each of the Class A-1, A-3, A-SB, A-4 and A-5 Certificates is calculated in the aggregate for those Classes as if they were a single Class and is calculated as the product of (a) the weighted average U/W NOI Debt Yield for the mortgage loans and (b) a fraction, the numerator of which is the total initial Certificate Balance of all of the Classes of Principal Balance Certificates and the denominator of which is the |
| THE INFORMATION IN THIS STRUCTURAL AND COLLATERAL TERM SHEET IS NOT COMPLETE AND MAY BE AMENDED PRIOR TO THE TIME OF SALE. THIS TERM SHEET IS NOT AN OFFER TO SELL THESE SECURITIES AND IT IS NOT A SOLICITATION OF AN OFFER TO BUY THESE SECURITIES IN ANY JURISDICTION WHERE THE OFFER OR SALE IS NOT PERMITTED. |
| | 3 | |
| Wells Fargo Commercial Mortgage Trust 2024-C63 | Certificate Structure |
| | total initial Certificate Balance of such Classes of Certificates. In any event, however, cash flow from each mortgaged property supports only the related mortgage loan and will not be available to support any other mortgage loan. |
| (8) | The pass-through rates for the Class A-1, A-3, A-SB, A-4, A-5, A-S, B, C, D, E, F, G-RR and J-RR Certificates (collectively, the “Principal Balance Certificates”) for any distribution date, in each case, will be one of the following: (i) a fixed rate per annum, (ii) a variable rate per annum equal to the weighted average of the net mortgage interest rates on the mortgage loans for the related distribution date, (iii) a variable rate per annum equal to the lesser of (a) a fixed rate and (b) the weighted average of the net mortgage interest rates on the mortgage loans for the related distribution date or (iv) a variable rate per annum equal to the weighted average of the net mortgage interest rates on the mortgage loans for the related distribution date minus a specified percentage. For purposes of the calculation of the weighted average of the net mortgage interest rates on the mortgage loans for each distribution date, the mortgage interest rates will be adjusted as necessary to a 30/360 basis. |
| (9) | The exact initial Certificate Balances of the Class A-4 and A-5 Certificates are unknown and will be determined based on the final pricing of the Certificates. However, the initial Certificate Balances, weighted average lives and principal windows of the Class A-4 and A-5 Certificates are expected to be within the applicable ranges reflected in the following chart. The aggregate initial Certificate Balance of the Class A-4 and A-5 Certificates is expected to be approximately $409,657,000, subject to a variance of plus or minus 5%. In the event that the Class A-5 Certificates are issued with the maximum certificate balance (i.e., with an initial certificate balance of $409,657,000), the Class A-4 Certificates will not be issued. |
| | Class of Certificates | | Expected Range of Approximate Initial Certificate Balance | | Expected Range of Weighted Average Life (Years) | | Expected Range of Principal Window |
| | Class A-4 | | $0 – $200,000,000 | | N/A – 9.83 | | N/A / 06/34 - 07/34 |
| | Class A-5 | | $209,657,000 – $409,657,000 | | 9.85 – 9.88 | | 06/34 - 08/34 / 07/34 - 08/34 |
| (10) | The Class X-A Certificates are notional amount certificates. The Notional Amount of the Class X-A Certificates will be equal to the aggregate Certificate Balance of the Class A-1, A-3, A-SB, A-4 and A-5 Certificates outstanding from time to time. The Class X-A Certificates will not be entitled to distributions of principal. |
| (11) | The pass-through rate for the Class X-A Certificates for any distribution date will be a per annum rate equal to the excess, if any, of (a) the weighted average of the net mortgage interest rates on the mortgage loans for the related distribution date, over (b) the weighted average of the pass-through rates on the Class A-1, A-3, A-SB, A-4 and A-5 Certificates for the related distribution date, weighted on the basis of their respective Certificate Balances outstanding immediately prior to that distribution date. For purposes of the calculation of the weighted average of the net mortgage interest rates on the mortgage loans for each distribution date, the mortgage interest rates will be adjusted as necessary to a 30/360 basis. |
| (12) | The Class X-B Certificates are notional amount certificates. The Notional Amount of the Class X-B Certificates will be equal to the aggregate Certificate Balance of the Class A-S, B and C Certificates outstanding from time to time. The Class X-B Certificates will not be entitled to distributions of principal. |
| (13) | The pass-through rate for the Class X-B Certificates for any distribution date will be a per annum rate equal to the excess, if any, of (a) the weighted average of the net mortgage interest rates on the mortgage loans for the related distribution date, over (b) the weighted average of the pass-through rates on the Class A-S, B and C Certificates for the related distribution date, weighted on the basis of their respective Certificate Balances outstanding immediately prior to that distribution date. For purposes of the calculation of the weighted average of the net mortgage interest rates on the mortgage loans for each distribution date, the mortgage interest rates will be adjusted as necessary to a 30/360 basis. |
| (14) | The Class X-D Certificates are notional amount certificates. The Notional Amount of the Class X-D Certificates will be equal to the aggregate Certificate Balance of the Class D and E Certificates outstanding from time to time. The Class X-D Certificates will not be entitled to distributions of principal. |
| (15) | The pass-through rate for the Class X-D Certificates for any distribution date will be a per annum rate equal to the excess, if any, of (a) the weighted average of the net mortgage interest rates on the mortgage loans for the related distribution date, over (b) the weighted average of the pass-through rates on the Class D and E Certificates for the related distribution date, weighted on the basis of their respective Certificate Balances outstanding immediately prior to that distribution date. For purposes of the calculation of the weighted average of the net mortgage interest rates on the mortgage loans for each distribution date, the mortgage interest rates will be adjusted as necessary to a 30/360 basis. |
| (16) | The Class X-F Certificates are notional amount certificates. The Notional Amount of the Class X-F Certificates will be equal to the Certificate Balance of the Class F Certificates outstanding from time to time. The Class X-F Certificates will not be entitled to distributions of principal. |
| (17) | The pass-through rate for the Class X-F Certificates for any distribution date will be a per annum rate equal to the excess, if any, of (a) the weighted average of the net mortgage interest rates on the mortgage loans for the related distribution date, over (b) the pass-through rate on the Class F Certificates for the related distribution date. For purposes of the calculation of the weighted average of the net mortgage interest rates on the mortgage loans for each distribution date, the mortgage interest rates will be adjusted as necessary to a 30/360 basis. |
| THE INFORMATION IN THIS STRUCTURAL AND COLLATERAL TERM SHEET IS NOT COMPLETE AND MAY BE AMENDED PRIOR TO THE TIME OF SALE. THIS TERM SHEET IS NOT AN OFFER TO SELL THESE SECURITIES AND IT IS NOT A SOLICITATION OF AN OFFER TO BUY THESE SECURITIES IN ANY JURISDICTION WHERE THE OFFER OR SALE IS NOT PERMITTED. |
| | 4 | |
| Wells Fargo Commercial Mortgage Trust 2024-C63 | Transaction Highlights |
| II. | Transaction Highlights |
Mortgage Loan Sellers:
Mortgage Loan Seller | Number of
Mortgage Loans | Number of
Mortgaged
Properties | Aggregate Cut-off Date Balance | % of Initial Pool
Balance |
| Wells Fargo Bank, National Association / JPMorgan Chase Bank, National Association | 3 | 3 | $174,952,149 | 24.5 | % |
| Wells Fargo Bank, National Association | 4 | 4 | 144,150,000 | 20.2 | |
| Argentic Real Estate Finance 2 LLC | 7 | 7 | 137,550,000 | 19.3 | |
| National Cooperative Bank, N.A. | 9 | 9 | 85,252,990 | 11.9 | |
| JPMorgan Chase Bank, National Association | 2 | 2 | 70,000,000 | 9.8 | |
| Goldman Sachs Mortgage Company | 2 | 2 | 42,000,000 | 5.9 | |
| Wells Fargo Bank, National Association / Goldman Sachs Mortgage Company | 1 | 1 | 38,000,000 | 5.3 | |
| Societe Generale Financial Corporation | 2 | 2 | 22,055,000 | 3.1 | |
Total | 30 | 30 | $713,960,139 | 100.0% | |
Loan Pool:
| Initial Pool Balance: | $713,960,139 |
| Number of Mortgage Loans: | 30 |
| Average Cut-off Date Balance per Mortgage Loan: | $23,798,671 |
| Number of Mortgaged Properties: | 30 |
| Average Cut-off Date Balance per Mortgaged Property(1): | $23,798,671 |
| Weighted Average Mortgage Interest Rate: | 6.3267% |
| Ten Largest Mortgage Loans as % of Initial Pool Balance: | 68.8% |
| Weighted Average Original Term to Maturity (months): | 117 |
| Weighted Average Remaining Term to Maturity (months): | 116 |
| Weighted Average Original Amortization Term (months)(2): | 360 |
| Weighted Average Remaining Amortization Term (months)(2): | 360 |
| Weighted Average Seasoning (months): | 1 |
| (1) | Information regarding mortgage loans secured by multiple properties is based on an allocation according to relative appraised values or the allocated loan amounts or property-specific release prices set forth in the related loan documents or such other allocation as the related mortgage loan seller deemed appropriate. |
| (2) | Excludes any mortgage loan that does not amortize. |
Credit Statistics:
| Weighted Average U/W Net Cash Flow DSCR(1): | 2.52x |
| Weighted Average U/W Net Operating Income Debt Yield(1): | 17.4% |
| Weighted Average Cut-off Date Loan-to-Value Ratio(1): | 45.7% |
| Weighted Average Balloon Loan-to-Value Ratio(1): | 43.9% |
| % of Mortgage Loans with Additional Subordinate Debt(2): | 21.2% |
| % of Mortgage Loans with Single Tenants(3): | 0.0% |
| (1) | With respect to any mortgage loan that is part of a whole loan, loan-to-value ratio, debt service coverage ratio and debt yield calculations include the related pari passu companion loan(s) but exclude any related subordinate companion loan(s) (unless otherwise stated). For mortgaged properties securing residential cooperative mortgage loans, the debt service coverage ratio and debt yield for each such mortgaged property are calculated using U/W Net Operating Income or U/W Net Cash Flow, as applicable, for the related residential cooperative property which is the projected net operating income or net cash flow, as applicable, reflected in the most recent appraisal obtained by or otherwise in the possession of the related mortgage loan seller as of the cut-off date, and the loan-to-value ratio is calculated based upon the appraised value of the residential cooperative property determined as if such residential cooperative property is operated as a residential cooperative, inclusive of the amount of the underlying debt encumbering such residential cooperative property. The debt service coverage ratio, debt yield and loan-to-value ratio information do not take into account any subordinate debt (whether or not secured by the related mortgaged property), that currently exists or is allowed under the terms of any mortgage loan. See “Description of the Mortgage Pool—Mortgage Pool Characteristics” in the Preliminary Prospectus and Annex A-1 to the Preliminary Prospectus. |
| (2) | Seven (7) of the mortgage loans, each of which is secured by a residential cooperative property and is being sold to the depositor by National Cooperative Bank, N.A., currently have in place either (i) subordinate secured lines of credit to the related mortgage borrowers that permit future advances (such loans, collectively, the “Subordinate Coop LOCs”) or (ii) subordinate wraparound mortgages to the related mortgage borrowers that are currently held by the cooperative sponsors (such loans, collectively, the “Subordinate Wrap Mortgages”). The percentage figure expressed as “% of Mortgage Loans with Additional Subordinate Debt” is determined as a percentage of the initial pool balance and does not take into account any future subordinate debt (whether or not secured by the mortgaged property), if any, that may be permitted under the terms of any mortgage loan or the pooling and servicing agreement. See “Description of the Mortgage Pool—Additional Indebtedness—Other Unsecured Indebtedness” and “Description of the Mortgage Pool—Additional Indebtedness—Other Unsecured Indebtedness—Additional Debt Financing for Mortgage Loans Secured by Residential Cooperatives Sold to the Depositor by National Cooperative Bank, N.A.” in the Preliminary Prospectus. |
| (3) | Excludes mortgage loans that are secured by multiple single tenant properties. |
| THE INFORMATION IN THIS STRUCTURAL AND COLLATERAL TERM SHEET IS NOT COMPLETE AND MAY BE AMENDED PRIOR TO THE TIME OF SALE. THIS TERM SHEET IS NOT AN OFFER TO SELL THESE SECURITIES AND IT IS NOT A SOLICITATION OF AN OFFER TO BUY THESE SECURITIES IN ANY JURISDICTION WHERE THE OFFER OR SALE IS NOT PERMITTED. |
| | 5 | |
| Wells Fargo Commercial Mortgage Trust 2024-C63 | Transaction Highlights |
Loan Structural Features:
Amortization: Based on the Initial Pool Balance, 31.6% of the mortgage pool (12 mortgage loans) has scheduled amortization, as follows:
9.2% (2 mortgage loans) provide for an interest-only period followed by an amortization period; and
22.4% (10 mortgage loans) require amortization during the entire loan term.
Interest-Only: Based on the Initial Pool Balance, 68.4% of the mortgage pool (18 mortgage loans) provide for interest-only payments during the entire loan term through maturity or anticipated repayment date. The Weighted Average Cut-off Date Loan-to-Value Ratio and Weighted Average U/W Net Cash Flow DSCR for those mortgage loans are 43.0% and 2.63x, respectively.
Hard Lockboxes: Based on the Initial Pool Balance, 78.6% of the mortgage pool (15 mortgage loans) have hard lockboxes in place.
Reserves: The mortgage loans require amounts to be escrowed monthly as follows (excluding any mortgage loans with springing provisions):
| Real Estate Taxes: | 57.7% of the pool |
| Insurance: | 14.8% of the pool |
| Capital Replacements: | 53.3% of the pool |
| TI/LC: | 49.6% of the pool(1) |
| | (1) | The percentage of Initial Pool Balance for mortgage loans with TI/LC reserves is based on the aggregate principal balance allocable to loans that include office, retail, mixed use and industrial properties. |
Call Protection/Defeasance: Based on the Initial Pool Balance, the mortgage pool has the following call protection and defeasance features:
75.2% of the mortgage pool (17 mortgage loans) feature a lockout period, then defeasance only until an open period;
11.9% of the mortgage pool (9 mortgage loans) feature the greater of a prepayment premium (1%) or yield maintenance, a prepayment premium (1%) until an open period;
7.7% of the mortgage pool (1 mortgage loan) feature a lockout period, then the greater of a prepayment premium (1%) or yield maintenance, then the greater of a prepayment premium (1%) or yield maintenance or defeasance until an open period;
5.2% of the mortgage pool (3 mortgage loans) feature a lockout period, then the greater of a prepayment premium (1%) or yield maintenance until an open period;
Prepayment restrictions for each mortgage loan reflect the entire life of the mortgage loan. Please refer to Annex A-1 to the Preliminary Prospectus and the footnotes related thereto for further information regarding individual loan call protection.
| THE INFORMATION IN THIS STRUCTURAL AND COLLATERAL TERM SHEET IS NOT COMPLETE AND MAY BE AMENDED PRIOR TO THE TIME OF SALE. THIS TERM SHEET IS NOT AN OFFER TO SELL THESE SECURITIES AND IT IS NOT A SOLICITATION OF AN OFFER TO BUY THESE SECURITIES IN ANY JURISDICTION WHERE THE OFFER OR SALE IS NOT PERMITTED. |
| | 6 | |
| Wells Fargo Commercial Mortgage Trust 2024-C63 | Issue Characteristics |
| III. | Issue Characteristics |
| Securities Offered: | $652,381,000 approximate monthly pay, multi-class, commercial mortgage REMIC pass-through certificates consisting of ten classes (Classes A-1, A-3, A-SB, A-4, A-5, A-S, B, C, X-A and X-B), which are offered pursuant to a registration statement filed with the SEC (such classes of certificates, the “Offered Certificates”). |
| Mortgage Loan Sellers: | Wells Fargo Bank, National Association (“WFB”), Argentic Real Estate Finance 2 LLC (“AREF2”), JPMorgan Chase Bank, National Association (“JPMCB”), National Cooperative Bank, N.A. (“NCB”), Goldman Sachs Mortgage Company (“Goldman”) and Societe Generale Financial Corporation (“SGFC”) |
| Joint Bookrunners and Co-Lead Managers: | Wells Fargo Securities, LLC, Goldman Sachs & Co. LLC, J.P. Morgan Securities LLC and SG Americas Securities, LLC |
| Co-Managers: | Academy Securities, Inc., Drexel Hamilton, LLC and Siebert Williams Shank & Co., LLC |
| Rating Agencies: | Fitch Ratings, Inc., Kroll Bond Rating Agency, LLC and Moody’s Investors Service, Inc. |
| Master Servicers: | Wells Fargo Bank, National Association and National Cooperative Bank, N.A. |
| Special Servicers: | Argentic Services Company LP and National Cooperative Bank, N.A. |
| Certificate Administrator: | Computershare Trust Company, N.A. |
| Trustee: | Computershare Trust Company, N.A. |
| Operating Advisor: | Park Bridge Lender Services LLC |
| Asset Representations Reviewer: | Park Bridge Lender Services LLC |
| NCB Back-up Advancing Agent: | Deutsche Bank National Trust Company |
| Initial Majority Controlling Class Certificateholder: | Argentic Securities Holdings 2 Cayman Limited, an affiliate of Argentic Real Estate Finance 2 LLC and Argentic Services Company LP |
| U.S. Credit Risk Retention: | For a discussion on the manner in which the U.S. credit risk retention requirements will be satisfied by Argentic Real Estate Finance 2 LLC, as the retaining sponsor, see “Credit Risk Retention” in the Preliminary Prospectus. Argentic Real Estate Finance 2 LLC, the retaining sponsor, intends to cause Argentic Securities Holdings 2 Cayman Limited, a majority-owned affiliate, to retain (i) an “eligible horizontal residual interest”, in the form of certificates representing approximately 1.40% of the fair value of all of the ABS interests issued, which will be comprised of the Class G-RR and J-RR certificates (other than the portion that comprises the VRR Interest) and (ii) an “eligible vertical interest”, in the form of certificates representing approximately 3.65% of the certificate balance, notional amount or percentage interest of each class of certificates (other than the Class R certificates) in a manner that satisfies the U.S. credit risk retention requirements. Under the U.S. credit risk retention rules, Argentic Real Estate Finance 2 LLC or the applicable majority-owned affiliate will be permitted to transfer the horizontal risk retention certificates to a subsequent third-party purchaser. For additional information, see “Credit Risk Retention” in the Preliminary Prospectus. |
| EU/UK Credit Risk Retention | None of the sponsors, the depositor, the underwriters, or their respective affiliates, or any other party to the transaction intends to retain a material net economic interest in the securitization constituted by the issue of the Certificates, or take any other action in respect of such securitization, in a manner prescribed or contemplated by (i) Regulation (EU) 2017/2402, or (ii) such Regulation as it forms part of UK domestic law. In particular, no such person undertakes to take any action which may be required by any investor for the purposes of its compliance with any applicable requirement under either such Regulation. Furthermore, the arrangements described under “Credit Risk Retention” in the Preliminary Prospectus have not been structured with the objective of ensuring compliance by any person with any requirements of either such Regulation. See “Risk Factors—Other Risks Relating to the Certificates—EU Securitization Regulation and UK Securitization Regulation Due Diligence Requirements” in the Preliminary Prospectus. |
| Cut-off Date: | The Cut-off Date with respect to each mortgage loan is the payment due date for the monthly debt service payment that is due in August 2024 (or, in the case of any mortgage loan that has its first payment due date in September 2024, the date that would have been its payment due date in August 2024 under the terms of that mortgage loan if a monthly debt service payment were scheduled to be due in that month). |
| THE INFORMATION IN THIS STRUCTURAL AND COLLATERAL TERM SHEET IS NOT COMPLETE AND MAY BE AMENDED PRIOR TO THE TIME OF SALE. THIS TERM SHEET IS NOT AN OFFER TO SELL THESE SECURITIES AND IT IS NOT A SOLICITATION OF AN OFFER TO BUY THESE SECURITIES IN ANY JURISDICTION WHERE THE OFFER OR SALE IS NOT PERMITTED. |
| | 7 | |
| Wells Fargo Commercial Mortgage Trust 2024-C63 | Issue Characteristics |
| Expected Closing Date: | On or about August 29, 2024. |
| Determination Dates: | The 11th day of each month (or if that day is not a business day, the next succeeding business day), commencing in September 2024. |
| Distribution Dates: | The 4th business day following the Determination Date in each month, commencing in September 2024. |
| Rated Final Distribution Date: | The Distribution Date in August 2057. |
| Interest Accrual Period: | With respect to any Distribution Date, the calendar month immediately preceding the month in which such Distribution Date occurs. |
| Day Count: | The Offered Certificates will accrue interest on a 30/360 basis. |
| Minimum Denominations: | $10,000 for each Class of Offered Certificates (other than the Class X-A and X-B Certificates) and $1,000,000 for the Class X-A and X-B Certificates. Investments may also be made in any whole dollar denomination in excess of the applicable minimum denomination. |
| Clean-up Call: | 1.0% |
| Delivery: | DTC, Euroclear and Clearstream Banking |
| ERISA/SMMEA Status: | Each Class of Offered Certificates is expected to be eligible for exemptive relief under ERISA. No Class of Offered Certificates will be SMMEA eligible. |
| Risk Factors: | THE CERTIFICATES INVOLVE CERTAIN RISKS AND MAY NOT BE SUITABLE FOR ALL INVESTORS. SEE THE “RISK FACTORS” SECTION OF THE PRELIMINARY PROSPECTUS. |
| Bond Analytics Information: | The Certificate Administrator will be authorized to make distribution date statements, CREFC® reports and certain supplemental reports (other than confidential information) available to certain financial modeling and data provision services, including Bloomberg, L.P., CRED iQ, Trepp, LLC, Intex Solutions, Inc., Interactive Data Corp., Markit Group Limited, BlackRock Financial Management, Inc., CMBS.com, Inc., Moody’s Analytics, Inc., Morningstar Credit Information & Analytics, LLC, KBRA Analytics, LLC, MBS Data, LLC, Thomson Reuters Corporation, DealView Technologies Ltd. and RealINSIGHT. |
| Tax Treatment | For U.S. federal income tax purposes, the issuing entity will consist of one or more REMICs arranged in a tiered structure. The Offered Certificates will represent REMIC regular interests. |
| THE INFORMATION IN THIS STRUCTURAL AND COLLATERAL TERM SHEET IS NOT COMPLETE AND MAY BE AMENDED PRIOR TO THE TIME OF SALE. THIS TERM SHEET IS NOT AN OFFER TO SELL THESE SECURITIES AND IT IS NOT A SOLICITATION OF AN OFFER TO BUY THESE SECURITIES IN ANY JURISDICTION WHERE THE OFFER OR SALE IS NOT PERMITTED. |
| | 8 | |
| Wells Fargo Commercial Mortgage Trust 2024-C63 | Characteristics of the Mortgage Pool |
| IV. | Characteristics of the Mortgage Pool(1) |
| A. | Ten Largest Mortgage Loans |
Mortgage
Loan
Seller | Mortgage Loan Name | City | State | Number of Mortgage Loans / Mortgaged Properties | Mortgage Loan Cut-off Date Balance ($) | % of Initial Pool Balance(%) | Property
Type | Number
of
SF/Units/
Rooms | Cut-off Date Balance
Per SF/Unit/Room ($) | Cut-off Date LTV Ratio (%) | Balloon LTV Ratio (%) | U/W
NCF
DSCR
(x) | U/W NOI Debt
Yield (%) |
| WFB | Bridge Point Rancho Cucamonga | Rancho Cucamonga | CA | 1 / 1 | $65,000,000 | 9.1 | % | Industrial | 2,168,119 | $123 | 34.5 | % | 34.5 | % | 2.73 | x | 16.2 | % |
| WFB, JPMCB | Grapevine Mills | Grapevine | TX | 1 / 1 | 60,000,000 | 8.4 | | Retail | 1,628,140 | 154 | 45.6 | | 45.6 | | 2.68 | | 18.0 | |
| WFB, JPMCB | Marriott Myrtle Beach Grande Dunes Resort | Myrtle Beach | SC | 1 / 1 | 59,952,149 | 8.4 | | Hospitality | 405 | 246,717 | 44.8 | | 38.3 | | 2.69 | | 21.4 | |
| WFB, JPMCB | 610 Newport Center | Newport Beach | CA | 1 / 1 | 55,000,000 | 7.7 | | Office | 285,638 | 298 | 44.5 | | 44.5 | | 2.92 | | 17.2 | |
| WFB | Holiday Inn & Suites Ocean City | Ocean City | MD | 1 / 1 | 53,000,000 | 7.4 | | Hospitality | 210 | 252,381 | 59.8 | | 56.6 | | 1.55 | | 13.6 | |
| JPMCB | St. Johns Town Center | Jacksonville | FL | 1 / 1 | 46,000,000 | 6.4 | | Retail | 1,022,042 | 352 | 47.8 | | 47.8 | | 2.09 | | 13.3 | |
| NCB | Mercer Square Owners Corp. | New York | NY | 1 / 1 | 43,000,000 | 6.0 | | Multifamily | 258 | 166,667 | 12.6 | | 12.6 | | 4.00 | | 24.6 | |
| AREF2 | 680 Madison Avenue | New York | NY | 1 / 1 | 40,000,000 | 5.6 | | Retail | 34,298 | 3,499 | 64.9 | | 64.9 | | 1.84 | | 12.6 | |
| WFB, GSMC | Arizona Grand Resort and Spa | Phoenix | AZ | 1 / 1 | 38,000,000 | 5.3 | | Hospitality | 744 | 168,011 | 39.2 | | 39.2 | | 3.76 | | 24.2 | |
| AREF2 | 57 Willoughby | Brooklyn | NY | 1 / 1 | 31,200,000 | 4.4 | | Office | 124,670 | 250 | 56.6 | | 49.6 | | 1.43 | | 12.2 | |
| Top Three Total/Weighted Average | | 3 / 3 | $184,952,149 | 25.9 | % | | | | 41.4 | % | 39.3 | % | 2.70 | x | 18.5 | % |
| Top Five Total/Weighted Average | | 5 / 5 | $292,952,149 | 41.0 | % | | | | 45.3 | % | 43.4 | % | 2.53 | x | 17.4 | % |
| Top Ten Total/Weighted Average | | 10 / 10 | $491,152,149 | 68.8 | % | | | | 44.5 | % | 43.0 | % | 2.59 | x | 17.4 | % |
| Non-Top Ten Total/Weighted Average | | 20 / 20 | $222,807,990 | 31.2 | % | | | | 48.3 | % | 46.1 | % | 2.36 | x | 17.5 | % |
| (1) | With respect to any mortgage loan that is part of a whole loan, Cut-off Date Balance Per SF/Unit/Room, loan-to-value ratio, debt service coverage ratio and debt yield calculations include the related pari passu companion loan(s) but exclude any related subordinate companion loan(s) (unless otherwise stated). For mortgaged properties securing residential cooperative mortgage loans, the debt service coverage ratio and debt yield for each such mortgaged property is calculated using U/W Net Operating Income or U/W Net Cash Flow, as applicable, for the related residential cooperative property, which is the projected net operating income or net cash flow, as applicable, reflected in the most recent appraisal obtained by or otherwise in the possession of the related mortgage loan seller as of the cut-off date, and the loan-to-value ratio, is calculated based upon the appraised value of the residential cooperative property determined as if such residential cooperative property is operated as a residential cooperative. With respect to each mortgage loan, debt service coverage ratio, debt yield and loan-to-value ratio information do not take into account subordinate debt (whether or not secured by the related mortgaged property), if any, that currently exists or is allowed under the terms of such mortgage loan. |
| THE INFORMATION IN THIS STRUCTURAL AND COLLATERAL TERM SHEET IS NOT COMPLETE AND MAY BE AMENDED PRIOR TO THE TIME OF SALE. THIS TERM SHEET IS NOT AN OFFER TO SELL THESE SECURITIES AND IT IS NOT A SOLICITATION OF AN OFFER TO BUY THESE SECURITIES IN ANY JURISDICTION WHERE THE OFFER OR SALE IS NOT PERMITTED. |
| | 9 | |
| Wells Fargo Commercial Mortgage Trust 2024-C63 | Characteristics of the Mortgage Pool |
| B. | Summary of the Whole Loans |
| No. | Property Name | Mortgage Loan Seller in WFCM 2024-C63 | Mortgage Loan Cut-off Date Balance | Aggregate Pari-Passu Companion Loan Cut-off Date Balance(1) | Combined Cut-off Date Balance | Controlling Pooling / Trust and Servicing Agreement | Master Servicer | Special Servicer | Related Pari Passu Companion Loan(s) Securitizations | Combined UW NCF DSCR(2) | Combined UW NOI Debt Yield(2) | Combined Cut-off Date LTV(2) |
| 1 | Bridge Point Rancho Cucamonga | WFB | $65,000,000 | $202,610,000 | $267,610,000 | WFCM 2024-BPRC(3) | Wells Fargo Bank, National Association | Argentic Services Company LP | WFCM 2024-BPRC, BBCMS 2024-C28 | 2.73x | 16.2% | 34.5% |
| 2 | Grapevine Mills | WFB, JPMCB | $60,000,000 | $190,000,000 | $250,000,000 | WFCM 2024-C63 | Wells Fargo Bank, National Association | Argentic Services Company LP | BMO 2024-C9 | 2.68x | 18.0% | 45.6% |
| 3 | Marriott Myrtle Beach Grande Dunes Resort | WFB, JPMCB | $59,952,149 | $39,968,099 | $99,920,248 | WFCM 2024-C63 | Wells Fargo Bank, National Association | Argentic Services Company LP | Future Securitization | 2.69x | 21.4% | 44.8% |
| 4 | 610 Newport Center | WFB, JPMCB | $55,000,000 | $30,000,000 | $85,000,000 | WFCM 2024-C63 | Wells Fargo Bank, National Association | Argentic Services Company LP | Future Securitization | 2.92x | 17.2% | 44.5% |
| 6 | St. Johns Town Center | JPMCB | $46,000,000 | $314,000,000 | $360,000,000 | BBCMS 2024-C28(4) | Wells Fargo Bank, National Association | LNR Partners, LLC | BANK 2024-BNK47, BMO 2024-C9, BBCMS 2024-C28 | 2.09x | 13.3% | 47.8% |
| 8 | 680 Madison Avenue | AREF2 | $40,000,000 | $80,000,000 | $120,000,000 | BMO 2024-C9 | Midland Loan Services | Argentic Services Company LP | BMO 2024-C9 | 1.84x | 12.6% | 64.9% |
| 9 | Arizona Grand Resort and Spa | WFB, GSMC | $38,000,000 | $87,000,000 | $125,000,000 | BBCMS 2024-C28(4) | Wells Fargo Bank, National Association | LNR Partners, LLC | BBCMS 2024-C28 | 3.76x | 24.2% | 39.2% |
| 13 | Dallas Market Center | GSMC | $22,000,000 | $215,000,000 | $237,000,000 | BANK 2024-BNK47 | Wells Fargo Bank, National Association | Rialto Capital Advisors, LLC | BMO 2024-C9, BBCMS 2024-C28 | 2.46x | 17.0% | 37.2% |
| 15 | 900 North Michigan | GSMC | $20,000,000 | $160,000,000 | $180,000,000 | BBCMS 2024-C28(4) | Wells Fargo Bank, National Association | LNR Partners, LLC | BBCMS 2024-C28 | 1.77x | 12.6% | 57.1% |
| (1) | The Aggregate Pari Passu Companion Loan Cut-off Date Balance excludes any related Subordinate Companion Loans. |
| (2) | DSCR, Debt Yield and LTV calculations include any related pari passu companion loans and exclude any subordinate companion loans and/or mezzanine loans, as applicable. |
| (3) | Control rights are currently exercised by the holder of the related Subordinate Companion Loan until the occurrence and during the continuance of a control appraisal period for the related Whole Loan, as described under “Description of the Mortgage Pool—The Whole Loans—The Non-Serviced AB Whole Loan—The Bridge Point Ranch Cucamonga Pari Passu AB Whole Loan” in the Preliminary Prospectus. |
| (4) | The BBCMS 2024-C28 securitization transaction is expected to close on or about August 29, 2024. |
| THE INFORMATION IN THIS STRUCTURAL AND COLLATERAL TERM SHEET IS NOT COMPLETE AND MAY BE AMENDED PRIOR TO THE TIME OF SALE. THIS TERM SHEET IS NOT AN OFFER TO SELL THESE SECURITIES AND IT IS NOT A SOLICITATION OF AN OFFER TO BUY THESE SECURITIES IN ANY JURISDICTION WHERE THE OFFER OR SALE IS NOT PERMITTED. |
| | 10 | |
| Wells Fargo Commercial Mortgage Trust 2024-C63 | Characteristics of the Mortgage Pool |
| C. | Mortgage Loans with Additional Secured and Mezzanine Financing(1) |
| Loan No. | Mortgage Loan Seller | Mortgage Loan Name | Mortgage
Loan
Cut-off Date Balance ($) | % of Initial Pool Balance (%) | Sub Debt Cut-off Date Balance ($) | Mezzanine Debt Cut-off Date Balance ($) | Total Debt Interest Rate (%)(2) | Mortgage Loan U/W NCF DSCR (x)(3) | Total Debt U/W NCF DSCR (x) | Mortgage Loan Cut-off Date U/W NOI Debt Yield (%)(3) | Total Debt Cut-off Date U/W NOI Debt Yield (%) | Mortgage Loan Cut-off Date LTV Ratio (%)(3) | Total Debt Cut-off Date LTV Ratio (%) |
| 1 | WFB | Bridge Point Rancho Cucamonga | $65,000,000 | 9.1 | % | $162,390,000 | NAP | 6.1530 | % | 2.73 | x | 1.61 | x | 16.2 | % | 10.1 | % | 34.5 | % | 55.4 | % |
| 19 | AREF2 | Drum Hill | 12,750,000 | 1.8 | | 665,049 | NAP | 6.8341 | | 1.61 | | 1.57 | | 13.2 | | 12.6 | | 55.2 | | 58.1 | |
| Total/Weighted Average | $77,750,000 | 10.9 | % | $163,055,049 | | 6.2647 | % | 2.55 | x | 1.60 | x | 15.7 | % | 10.5 | % | 37.9 | % | 55.8 | % |
| (1) | In addition, seven (7) of the mortgage loans, each of which is secured by a residential cooperative property and is being sold to the depositor by National Cooperative Bank, N.A, currently have in place Subordinate Coop LOCs. See “Description of the Mortgage Pool—Additional Indebtedness—Other Unsecured Indebtedness” and “Description of the Mortgage Pool—Additional Indebtedness—Other Secured Indebtedness—Additional Debt Financing for Mortgage Loans Secured by Residential Cooperatives Sold to the Depositor by National Cooperative Bank, N.A.” in the Preliminary Prospectus. |
| (2) | Total Debt Interest Rate for any specified mortgage loan reflects the weighted average of the interest rates on the respective components of the total debt. |
| (3) | With respect to any mortgage loan that is part of a whole loan, the loan-to-value ratio, debt service coverage ratio and debt yield calculations include the related pari passu companion loan(s) but excludes any related subordinate companion loan. |
| THE INFORMATION IN THIS STRUCTURAL AND COLLATERAL TERM SHEET IS NOT COMPLETE AND MAY BE AMENDED PRIOR TO THE TIME OF SALE. THIS TERM SHEET IS NOT AN OFFER TO SELL THESE SECURITIES AND IT IS NOT A SOLICITATION OF AN OFFER TO BUY THESE SECURITIES IN ANY JURISDICTION WHERE THE OFFER OR SALE IS NOT PERMITTED. |
| | 11 | |
| Wells Fargo Commercial Mortgage Trust 2024-C63 | Characteristics of the Mortgage Pool |
| D. | Previous Securitization History |
| Loan No. | Mortgage Loan Seller | Mortgage
Loan or Mortgaged
Property Name | City | State | Property Type | Mortgage Loan
or Mortgaged Property Cut-off Date Balance ($) | % of Cut-off Date Pool Balance (%) | Previous
Securitization |
| 2.00 | WFB, JPMCB | Grapevine Mills | Grapevine | TX | Retail | $60,000,000 | 8.4 | % | JPMBB 2014-C23,
JPMBB 2014-C24,
JPMBB 2014-C25 |
| 3.00 | WFB, JPMCB | Marriott Myrtle Beach Grande Dunes Resort | Myrtle Beach | SC | Hospitality | 59,952,149 | 8.4 | | COMM 2014-LC17,
COMM 2014-UBS6,
COMM 2014-CR20 |
| 5.00 | WFB | Holiday Inn & Suites Ocean City | Ocean City | MD | Hospitality | 53,000,000 | 7.4 | | COMM 2014-UBS4 |
| 6.00 | JPMCB | St. Johns Town Center | Jacksonville | FL | Retail | 46,000,000 | 6.4 | | WFRBS 2014-C24,
WFRBS 2014-C25 |
| 8.00 | AREF2 | 680 Madison Avenue | New York | NY | Retail | 40,000,000 | 5.6 | | MSC 2015-XLF1 |
| 9.00 | WFB, GSMC | Arizona Grand Resort and Spa | Phoenix | AZ | Hospitality | 38,000,000 | 5.3 | | CSAIL 2015-C3,
CSAIL 2015-C4 |
| 10.00 | AREF2 | 57 Willoughby | Brooklyn | NY | Office | 31,200,000 | 4.4 | | FORT 2022-FL3 |
| 13.00 | GSMC | Dallas Market Center | Dallas | TX | Mixed Use | 22,000,000 | 3.1 | | GSMS 2015-GC30,
CGCMT 2015-GC31,
GSMS 2015-GC32 |
| 15.00 | GSMC | 900 North Michigan | Chicago | IL | Mixed Use | 20,000,000 | 2.8 | | LBUBS 2005-C3 |
| 18.00 | AREF2 | Gila Valley Shopping Center | Thatcher | AZ | Retail | 13,600,000 | 1.9 | | CSAIL 2015-C4 |
| 21.00 | NCB | Warminster Heights Home Ownership Association, Inc. | Warminster | PA | Multifamily | 9,992,248 | 1.4 | | WFRBS 2014-C21 |
| 22.00 | AREF2 | Crossroads Plaza | Adrian | MI | Retail | 8,400,000 | 1.2 | | CSAIL 2015-C3 |
| 24.00 | AREF2 | 13140 Coit Road | Dallas | TX | Office | 6,400,000 | 0.9 | | WFCM 2014-LC16 |
| 26.00 | NCB | Sted Tenant Owners Corp. | Brooklyn | NY | Multifamily | 1,998,553 | 0.3 | | WFRBS 2014-C22 |
| 28.00 | NCB | 3215 Owners, Ltd. | Bronx | NY | Multifamily | 1,430,000 | 0.2 | | WFRBS 2014-C22 |
| 29.00 | NCB | 406 West 46th Street Corp. | New York | NY | Multifamily | 1,099,257 | 0.2 | | WFRBS 2014-C22 |
| | Total | | | | | $413,072,207 | 57.9 | % | |
The table above represents the most recent securitization with respect to the mortgaged property securing the related mortgage loan, based on information provided by the related borrower or obtained through searches of a third-party database. While loans secured by the above mortgaged properties may have been securitized multiple times in prior transactions, mortgage loans in this securitization are only listed in the above chart if the mortgage loan paid off a loan in another securitization. The information has not otherwise been confirmed by the mortgage loan sellers.
| THE INFORMATION IN THIS STRUCTURAL AND COLLATERAL TERM SHEET IS NOT COMPLETE AND MAY BE AMENDED PRIOR TO THE TIME OF SALE. THIS TERM SHEET IS NOT AN OFFER TO SELL THESE SECURITIES AND IT IS NOT A SOLICITATION OF AN OFFER TO BUY THESE SECURITIES IN ANY JURISDICTION WHERE THE OFFER OR SALE IS NOT PERMITTED. |
| | 12 | |
| Wells Fargo Commercial Mortgage Trust 2024-C63 | Characteristics of the Mortgage Pool |
| E. | Mortgage Loans with Scheduled Balloon Payments and Related Classes(1) |
| Class A-3 |
| Loan No. | Mortgage Loan Seller | Mortgage Loan Name | State | Property Type | Mortgage Loan Cut-off Date Balance ($) | % of Initial Pool
Balance (%) | Mortgage
Loan Balance at Maturity or ARD($) | % of Class A-3 Certificate Principal
Balance (%)(2) | SF/Rooms | Loan per
SF/Room ($)(3) | U/W NCF DSCR
(x)(3) | U/W NOI Debt Yield (%)(3) | Cut-off Date LTV Ratio (%)(3) | Balloon or ARD
LTV Ratio (%)(3) | Rem. IO Period (mos.) | Rem. Term to Maturity or ARD (mos.) |
| 1 | WFB | Bridge Point Rancho Cucamonga | CA | Industrial | $65,000,000 | 9.1% | $65,000,000 | 100.0% | 2,168,119 | 123 | 2.73x | 16.2% | 34.5% | 34.5% | 83 | 83 |
| Total/Weighted Average | | | $65,000,000 | 9.1% | 65,000,000 | 100.0% | | | 2.73x | 16.2% | 34.5% | 34.5% | 83 | 83 |
| (1) | The table above presents the mortgage loan(s) whose balloon payments would be applied to pay down the principal balance of the Class A-3 Certificates, assuming a 0% CPR and applying the “Structuring Assumptions” described in the Preliminary Prospectus, including the assumptions that (i) none of the mortgage loans in the pool experience prepayments prior to maturity, defaults or losses; (ii) there are no extensions of maturity dates of any mortgage loans in the pool; and (iii) each mortgage loan in the pool is paid in full on its stated maturity date. Each Class of Certificates evidences undivided ownership interests in the entire pool of mortgage loans. Debt service coverage ratio, debt yield and loan-to-value ratio information do not take into account subordinate debt (whether or not secured by the related mortgaged property), if any, that currently exists or is allowed under the terms of any mortgage loan. See Annex A-1 to the Preliminary Prospectus. |
| (2) | Reflects the percentage equal to the Mortgage Loan Balance at Maturity or ARD divided by the initial Class A-3 Certificate Balance. |
| (3) | With respect to any mortgage loan that is part of a whole loan, the loan-to-value ratio, debt service coverage ratio and debt yield calculations include the related pari passu companion loan(s) but excludes any related subordinate companion loan(s). |
| THE INFORMATION IN THIS STRUCTURAL AND COLLATERAL TERM SHEET IS NOT COMPLETE AND MAY BE AMENDED PRIOR TO THE TIME OF SALE. THIS TERM SHEET IS NOT AN OFFER TO SELL THESE SECURITIES AND IT IS NOT A SOLICITATION OF AN OFFER TO BUY THESE SECURITIES IN ANY JURISDICTION WHERE THE OFFER OR SALE IS NOT PERMITTED. |
| | 13 | |
| Wells Fargo Commercial Mortgage Trust 2024-C63 | Characteristics of the Mortgage Pool |
| F. | Property Type Distribution(1) |

| Property Type | Number of Mortgaged Properties | Aggregate
Cut-off Date
Balance ($) | % of Initial
Pool
Balance (%) | Weighted Average Cut-off Date LTV Ratio (%) | Weighted Average Balloon LTV
Ratio (%) | Weighted Average
U/W NCF DSCR (x) | Weighted Average U/W NOI Debt Yield (%) | Weighted Average U/W NCF Debt Yield (%) | Weighted Average Mortgage Rate (%) |
| Retail | 6 | $192,000,000 | 26.9 | % | 52.5 | % | 52.5 | % | 2.07 | x | 13.9 | % | 13.3 | % | 6.3598 | % |
| Super Regional Mall | 2 | 106,000,000 | 14.8 | | 46.6 | | 46.6 | | 2.42 | | 16.0 | | 15.1 | | 6.1269 | |
| Anchored | 4 | 86,000,000 | 12.0 | | 59.9 | | 59.9 | | 1.63 | | 11.3 | | 11.0 | | 6.6470 | |
| Hospitality | 4 | 165,952,149 | 23.2 | | 49.7 | | 46.4 | | 2.51 | | 19.0 | | 17.1 | | 6.2824 | |
| Full Service | 3 | 150,952,149 | 21.1 | | 48.7 | | 45.0 | | 2.56 | | 19.4 | | 17.4 | | 6.2410 | |
| Limited Service | 1 | 15,000,000 | 2.1 | | 60.5 | | 60.5 | | 2.04 | | 15.4 | | 13.8 | | 6.6990 | |
| Multifamily | 12 | 120,057,990 | 16.8 | | 27.5 | | 25.5 | | 3.78 | | 26.4 | | 25.8 | | 6.4460 | |
| Cooperative | 9 | 85,252,990 | 11.9 | | 15.8 | | 15.6 | | 4.75 | | 32.5 | | 31.8 | | 6.2325 | |
| Garden | 2 | 22,055,000 | 3.1 | | 56.7 | | 49.4 | | 1.27 | | 10.2 | | 10.0 | | 6.8935 | |
| Independent Living | 1 | 12,750,000 | 1.8 | | 55.2 | | 51.0 | | 1.61 | | 13.2 | | 13.0 | | 7.1000 | |
| Office | 4 | 117,800,000 | 16.5 | | 52.0 | | 48.0 | | 2.11 | | 14.4 | | 13.8 | | 6.3408 | |
| Suburban | 2 | 61,400,000 | 8.6 | | 46.3 | | 45.5 | | 2.78 | | 16.8 | | 16.3 | | 5.8030 | |
| CBD | 2 | 56,400,000 | 7.9 | | 58.2 | | 50.7 | | 1.39 | | 11.8 | | 11.0 | | 6.9262 | |
| Industrial | 1 | 65,000,000 | 9.1 | | 34.5 | | 34.5 | | 2.73 | | 16.2 | | 16.2 | | 5.8331 | |
| Warehouse/Distribution | 1 | 65,000,000 | 9.1 | | 34.5 | | 34.5 | | 2.73 | | 16.2 | | 16.2 | | 5.8331 | |
| Mixed Use | 2 | 42,000,000 | 5.9 | | 46.7 | | 46.7 | | 2.13 | | 14.9 | | 14.3 | | 6.6691 | |
| Merchandise Mart/Retail | 1 | 22,000,000 | 3.1 | | 37.2 | | 37.2 | | 2.46 | | 17.0 | | 16.2 | | 6.5020 | |
| Retail/Office | 1 | 20,000,000 | 2.8 | | 57.1 | | 57.1 | | 1.77 | | 12.6 | | 12.3 | | 6.8530 | |
| Self Storage | 1 | 11,150,000 | 1.6 | | 59.0 | | 59.0 | | 1.29 | | 8.7 | | 8.6 | | 6.5700 | |
| Self Storage | 1 | 11,150,000 | 1.6 | | 59.0 | | 59.0 | | 1.29 | | 8.7 | | 8.6 | | 6.5700 | |
| Total/Weighted Average | 30 | $713,960,139 | 100.0 | % | 45.7 | % | 43.9 | % | 2.52 | x | 17.4 | % | 16.6 | % | 6.3267 | % |
| (1) | Because this table presents information relating to the mortgaged properties and not the mortgage loans, the information for mortgage loans secured by more than one mortgaged property is based on allocated loan amounts (allocating the principal balance of the mortgage loan to each of those properties according to the relative appraised values of the mortgaged properties or the allocated loan amounts or property-specific release prices set forth in the related mortgage loan documents or such other allocation as the related mortgage loan seller deemed appropriate). For mortgaged properties securing residential cooperative mortgage loans, the debt service coverage ratio and debt yield for each such mortgaged property is calculated using U/W Net Operating Income or U/W Net Cash Flow, as applicable, for the related residential cooperative property which is the projected net operating income or net cash flow, as applicable, reflected in the most recent appraisal obtained by or otherwise in the possession of the related mortgage loan seller as of the cut-off date and the loan-to-value ratio, is calculated based upon the appraised value of the residential cooperative property determined as if such residential cooperative property is operated as a residential cooperative, inclusive of the amount of the underlying debt encumbering such residential cooperative property. With respect to any mortgage loan that is part of a whole loan, the loan-to-value ratio, debt service coverage ratio and debt yield calculations include the related pari passu companion loan(s) but exclude any related subordinate secured loan(s) (unless otherwise stated). With respect to each mortgage loan, debt service coverage ratio, debt yield and loan-to-value ratio information do not take into account any subordinate debt (whether or not secured by the related mortgaged property) that currently exists or is allowed under the terms of such mortgage loan. See Annex A-1 to the Preliminary Prospectus. |
| THE INFORMATION IN THIS STRUCTURAL AND COLLATERAL TERM SHEET IS NOT COMPLETE AND MAY BE AMENDED PRIOR TO THE TIME OF SALE. THIS TERM SHEET IS NOT AN OFFER TO SELL THESE SECURITIES AND IT IS NOT A SOLICITATION OF AN OFFER TO BUY THESE SECURITIES IN ANY JURISDICTION WHERE THE OFFER OR SALE IS NOT PERMITTED. |
| | 14 | |
| Wells Fargo Commercial Mortgage Trust 2024-C63 | Characteristics of the Mortgage Pool |
| G. | Geographic Distribution(1)(2) |
| Location | Number of Mortgaged Properties | Aggregate Cut-off Date Balance ($) | % of Initial Pool
Balance (%) | Weighted Average Cut-off Date LTV Ratio (%) | Weighted Average Balloon or ARD LTV Ratio (%) | Weighted Average U/W NCF DSCR (x) | Weighted Average U/W NOI Debt Yield (%) | Weighted Average U/W NCF Debt Yield (%) | Weighted Average Mortgage Rate (%) |
| New York | 13 | $208,410,742 | 29.2 | % | 43.2 | % | 40.9 | % | 2.56 | x | 17.9 | % | 17.5 | % | 6.5991 | % |
| California | 2 | 120,000,000 | 16.8 | | 39.1 | | 39.1 | | 2.82 | | 16.7 | | 16.5 | | 5.7565 | |
| Southern California | 2 | 120,000,000 | 16.8 | | 39.1 | | 39.1 | | 2.82 | | 16.7 | | 16.5 | | 5.7565 | |
| Texas | 3 | 88,400,000 | 12.4 | | 44.7 | | 44.1 | | 2.54 | | 17.4 | | 16.5 | | 6.3751 | |
| Arizona | 3 | 62,750,000 | 8.8 | | 48.3 | | 48.3 | | 2.82 | | 18.4 | | 16.4 | | 5.9371 | |
| South Carolina | 1 | 59,952,149 | 8.4 | | 44.8 | | 38.3 | | 2.69 | | 21.4 | | 19.7 | | 6.1450 | |
| Maryland | 1 | 53,000,000 | 7.4 | | 59.8 | | 56.6 | | 1.55 | | 13.6 | | 12.2 | | 6.8450 | |
| Florida | 1 | 46,000,000 | 6.4 | | 47.8 | | 47.8 | | 2.09 | | 13.3 | | 12.6 | | 5.9480 | |
| Other(3) | 6 | 75,447,248 | 10.6 | | 51.7 | | 49.4 | | 2.44 | | 18.7 | | 17.7 | | 6.7596 | |
| Total/Weighted Average | 30 | $713,960,139 | 100.0 | % | 45.7 | % | 43.9 | % | 2.52 | x | 17.4 | % | 16.6 | % | 6.3267 | % |
| (1) | The mortgaged properties are located in 12 states |
| (2) | Because this table presents information relating to the mortgaged properties and not the mortgage loans, the information for mortgage loans secured by more than one mortgaged property is based on allocated loan amounts (allocating the principal balance of the mortgage loan to each of those properties according to the relative appraised values of the mortgaged properties or the allocated loan amounts or property-specific release prices set forth in the related mortgage loan documents or such other allocation as the related mortgage loan seller deemed appropriate). For mortgaged properties securing residential cooperative mortgage loans, the debt service coverage ratio and debt yield for each such mortgaged property is calculated using U/W Net Operating Income or U/W Net Cash Flow, as applicable, for the related residential cooperative property which is the projected net operating income or net cash flow, as applicable, reflected in the most recent appraisal obtained by or otherwise in the possession of the related mortgage loan seller as of the cut-off date and the loan-to-value ratio, is calculated based upon the appraised value of the residential cooperative property determined as if such residential cooperative property is operated as a residential cooperative, inclusive of the amount of the underlying debt encumbering such residential cooperative property. With respect to any mortgage loan that is part of a whole loan, the loan-to-value ratio, debt service coverage ratio and debt yield calculations include the related pari passu companion loan(s) but exclude any related subordinate secured loan(s) (unless otherwise stated). With respect to each mortgage loan, debt service coverage ratio, debt yield and loan-to-value ratio information do not take into account any subordinate debt (whether or not secured by the related mortgaged property) that currently exists or is allowed under the terms of such mortgage loan. See Annex A-1 to the Preliminary Prospectus. |
| (3) | Includes 5 other states. |
| THE INFORMATION IN THIS STRUCTURAL AND COLLATERAL TERM SHEET IS NOT COMPLETE AND MAY BE AMENDED PRIOR TO THE TIME OF SALE. THIS TERM SHEET IS NOT AN OFFER TO SELL THESE SECURITIES AND IT IS NOT A SOLICITATION OF AN OFFER TO BUY THESE SECURITIES IN ANY JURISDICTION WHERE THE OFFER OR SALE IS NOT PERMITTED. |
| | 15 | |
| Wells Fargo Commercial Mortgage Trust 2024-C63 | Characteristics of the Mortgage Pool |
| H. | Characteristics of the Mortgage Pool(1) |
| CUT-OFF DATE BALANCE |
Range of Cut-off Date
Balances ($) | Number of
Mortgage
Loans | Aggregate
Cut-off Date Balance ($) | Percent by
Aggregate
Cut-off Date
Pool Balance (%) |
| 1,000,000 - 5,000,000 | 6 | $11,860,742 | 1.7 | % |
| 5,000,001 - 15,000,000 | 9 | 99,347,248 | 13.9 | |
| 15,000,001 - 30,000,000 | 5 | 111,600,000 | 15.6 | |
| 30,000,001 - 50,000,000 | 5 | 198,200,000 | 27.8 | |
| 50,000,001 - 65,000,000 | 5 | 292,952,149 | 41.0 | |
| Total: | 30 | $713,960,139 | 100.0 | % |
| Average: | $23,798,671 | | |
| UNDERWRITTEN NOI DEBT SERVICE COVERAGE RATIO |
Range of U/W NOI
DSCRs (x) | Number of
Mortgage
Loans | Aggregate
Cut-off Date Balance ($) | Percent by
Aggregate
Cut-off Date
Pool Balance (%) |
| 1.30 - 1.50 | 5 | 82,405,000 | 11.5 | % |
| 1.51 - 2.00 | 8 | 185,350,000 | 26.0 | |
| 2.01 - 2.50 | 2 | 61,000,000 | 8.5 | |
| 2.51 - 3.00 | 5 | 261,952,149 | 36.7 | |
| 3.01 - 3.50 | 3 | 25,999,257 | 3.6 | |
| 3.51 - 8.00 | 4 | 83,998,553 | 11.8 | |
| 8.01 - 12.00 | 2 | 11,422,248 | 1.6 | |
| 12.01 - 21.78 | 1 | 1,832,932 | 0.3 | |
| Total: | 30 | $713,960,139 | 100.0 | % |
| Weighted Average: | 2.64x | | |
| UNDERWRITTEN NOI DEBT YIELD |
Range of U/W NOI
Debt Yields (%) | Number of
Mortgage
Loans | Aggregate
Cut-off Date Balance ($) | Percent by
Aggregate
Cut-off Date
Pool Balance (%) |
| 8.7 - 12.0 | 7 | $104,405,000 | 14.6 | % |
| 12.1 - 16.0 | 8 | 224,350,000 | 31.4 | |
| 16.1 - 20.0 | 4 | 202,000,000 | 28.3 | |
| 20.1 - 168.1 | 11 | 183,205,139 | 25.7 | |
| Total: | 30 | $713,960,139 | 100.0 | % |
| Weighted Average: | 17.4% | | |
| LOAN PURPOSE |
| Loan Purpose | Number of
Mortgage
Loans | Aggregate
Cut-off Date Balance ($) | Percent by
Aggregate
Cut-off Date
Pool Balance (%) |
| Refinance | 25 | $570,927,207 | 80.0 | % |
| Recapitalization | 3 | 71,832,932 | 10.1 | |
| Acquisition | 2 | 71,200,000 | 10.0 | |
| Total: | 30 | $713,960,139 | 100.0 | % |
| MORTGAGE RATE |
Range of Mortgage
Rates (%) | Number of
Mortgage
Loans | Aggregate
Cut-off Date Balance ($) | Percent by
Aggregate
Cut-off Date
Pool Balance (%) |
| 5.5500 - 5.7500 | 2 | $93,000,000 | 13.0 | % |
| 5.7501 - 6.0000 | 2 | 111,000,000 | 15.5 | |
| 6.0001 - 6.2500 | 3 | 112,944,397 | 15.8 | |
| 6.2501 - 6.5000 | 4 | 95,998,553 | 13.4 | |
| 6.5001 - 6.7500 | 10 | 145,782,189 | 20.4 | |
| 6.7501 - 7.0000 | 7 | 111,285,000 | 15.6 | |
| 7.0001 - 7.1000 | 2 | 43,950,000 | 6.2 | |
| Total: | 30 | $713,960,139 | 100.0 | % |
| Weighted Average: | 6.3267% | | |
| UNDERWRITTEN NCF DEBT SERVICE COVERAGE RATIO |
Range of U/W NCF
DSCRs (x) | Number of
Mortgage
Loans | Aggregate
Cut-off Date Balance ($) | Percent by
Aggregate
Cut-off Date
Pool Balance (%) |
| 1.27 - 1.50 | 7 | $127,205,000 | 17.8 | % |
| 1.51 - 2.00 | 6 | 140,550,000 | 19.7 | |
| 2.01 - 2.50 | 3 | 83,000,000 | 11.6 | |
| 2.51 - 3.00 | 4 | 239,952,149 | 33.6 | |
| 3.01 - 3.50 | 3 | 25,999,257 | 3.6 | |
| 3.51 - 4.00 | 2 | 81,000,000 | 11.3 | |
| 4.01 - 14.00 | 4 | 14,420,801 | 2.0 | |
| 14.01 - 21.45 | 1 | 1,832,932 | 0.3 | |
| Total: | 30 | $713,960,139 | 100.0 | % |
| Weighted Average: | 2.52x | | |
| UNDERWRITTEN NCF DEBT YIELD |
Range of U/W NCF
Debt Yields (%) | Number of
Mortgage
Loans | Aggregate
Cut-off Date Balance ($) | Percent by
Aggregate
Cut-off Date
Pool Balance (%) |
| 8.6 - 12.0 | 8 | $135,605,000 | 19.0 | % |
| 12.1 - 16.0 | 7 | 193,150,000 | 27.1 | |
| 16.1 - 20.0 | 5 | 261,952,149 | 36.7 | |
| 20.1 - 165.5 | 10 | 123,252,990 | 17.3 | |
| Total: | 30 | $713,960,139 | 100.0 | % |
| Weighted Average: | 16.6% | | |
| (1) | For mortgaged properties securing residential cooperative mortgage loans, the debt service coverage ratio and debt yield for each such mortgaged property is calculated using U/W Net Operating Income or U/W Net Cash Flow, as applicable, for the related residential cooperative property which is the projected net operating income or net cash flow, as applicable, reflected in the most recent appraisal obtained by or otherwise in the possession of the related mortgage loan seller as of the cut-off date and the loan-to-value ratio, is calculated based upon the appraised value of the residential cooperative property determined as if such residential cooperative property is operated as a residential cooperative, inclusive of the amount of the underlying debt encumbering such residential cooperative property. With respect to any mortgage loan that is part of a whole loan, the loan-to-value ratio, debt service coverage ratio and debt yield calculations include the related pari passu companion loan(s) but exclude any related subordinate companion loan(s) (unless otherwise stated). With respect to each mortgage loan, debt service coverage ratio, debt yield and loan-to-value ratio information do not take into account any subordinate debt (whether or not secured by the related mortgaged property) that currently exists or is allowed under the terms of such mortgage loan. See Annex A-1 to the Preliminary Prospectus. Prepayment provisions for each mortgage loan reflects the entire life of the loan (from origination to maturity) and may be currently prepayable. |
| THE INFORMATION IN THIS STRUCTURAL AND COLLATERAL TERM SHEET IS NOT COMPLETE AND MAY BE AMENDED PRIOR TO THE TIME OF SALE. THIS TERM SHEET IS NOT AN OFFER TO SELL THESE SECURITIES AND IT IS NOT A SOLICITATION OF AN OFFER TO BUY THESE SECURITIES IN ANY JURISDICTION WHERE THE OFFER OR SALE IS NOT PERMITTED. |
| | 16 | |
| Wells Fargo Commercial Mortgage Trust 2024-C63 | Characteristics of the Mortgage Pool |
| ORIGINAL TERM TO MATURITY |
Original Terms to
Maturity (months) | Number of
Mortgage
Loans | Aggregate Cut-
off Date Balance | Percent by
Aggregate
Cut-off Date
Pool Balance (%) |
| 84 | 1 | $65,000,000 | 9.1 | % |
| 120 | 29 | 648,960,139 | 90.9 | |
| Total: | 30 | $713,960,139 | 100.0 | % |
| Weighted Average: | 117 months | | |
| REMAINING TERM TO MATURITY |
Range of Remaining
Terms to Maturity (months) | Number of
Mortgage
Loans | Aggregate Cut-
off Date Balance | Percent by
Aggregate
Cut-off Date
Pool Balance (%) |
| 83 | 1 | $65,000,000 | 9.1 | % |
| 118 - 120 | 29 | 648,960,139 | 90.9 | |
| Total: | 30 | $713,960,139 | 100.0 | % |
| Weighted Average: | 116 months | | |
| ORIGINAL AMORTIZATION TERM(1) |
Original
Amortization Terms
(months) | Number of
Mortgage
Loans | Aggregate Cut-
off Date Balance | Percent by
Aggregate
Cut-off Date
Pool Balance (%) |
| Non-Amortizing | 18 | $488,480,000 | 68.4 | % |
| 360 | 12 | 225,480,139 | 31.6 | |
| Total: | 30 | $713,960,139 | 100.0 | % |
| Weighted Average(3): | 360 months | | |
| REMAINING AMORTIZATION TERM(2) |
Range of Remaining Amortization Terms
(months) | Number of
Mortgage
Loans | Aggregate Cut-
off Date Balance | Percent by
Aggregate
Cut-off Date
Pool Balance (%) |
| Non-Amortizing | 18 | $488,480,000 | 68.4 | % |
| 359 - 360 | 12 | 225,480,139 | 31.6 | |
| Total: | 30 | $713,960,139 | 100.0 | % |
| Weighted Average(3): | 360 months | | |
| LOCKBOXES |
| Type of Lockbox | Number of
Mortgage
Loans | Aggregate Cut-
off Date Balance | Percent by
Aggregate
Cut-off Date
Pool Balance (%) |
| Hard / Springing Cash Management | 14 | $539,352,149 | 75.5 | % |
| None | 9 | 85,252,990 | 11.9 | |
| Springing | 6 | 67,355,000 | 9.4 | |
| Hard / In Place Cash Management | 1 | 22,000,000 | 3.1 | |
| Total: | 30 | $713,960,139 | 100.0 | % |
| PREPAYMENT PROVISION SUMMARY |
| Prepayment Provision | Number of
Mortgage
Loans | Aggregate Cut-
off Date Balance | Percent by
Aggregate
Cut-off Date
Pool Balance (%) |
| Lockout / Defeasance / Open | 17 | $536,652,149 | 75.2 | % |
| GRTR 1% or YM / 1% / Open | 9 | 85,252,990 | 11.9 | |
| Lockout / GRTR 1% or YM / GRTR 1% or YM or Defeasance / Open | 1 | 55,000,000 | 7.7 | |
| Lockout / GRTR 1% or YM / Open | 3 | 37,055,000 | 5.2 | |
| Total: | 30 | $713,960,139 | 100.0 | % |
| CUT-OFF DATE LOAN-TO-VALUE RATIO |
Range of Cut-off
Date LTV Ratios (%) | Number of
Mortgage
Loans | Aggregate Cut-
off Date Balance | Percent by
Aggregate
Cut-off Date
Pool Balance (%) |
| 4.6 - 20.0 | 8 | $64,852,990 | 9.1 | % |
| 20.1 - 30.0 | 1 | 20,400,000 | 2.9 | |
| 30.1 - 40.0 | 3 | 125,000,000 | 17.5 | |
| 40.1 - 50.0 | 5 | 244,952,149 | 34.3 | |
| 50.1 - 60.0 | 8 | 158,555,000 | 22.2 | |
| 60.1 - 64.9 | 5 | 100,200,000 | 14.0 | |
| Total: | 30 | $713,960,139 | 100.0 | % |
| Weighted Average: | 45.7% | | |
| BALLOON LOAN-TO-VALUE RATIO |
| Range of Balloon LTV Ratios (%) | Number of
Mortgage
Loans | Aggregate Cut-
off Date Balance | Percent by
Aggregate
Cut-off Date
Pool Balance (%) |
| 4.0 - 20.0 | 8 | $64,852,990 | 9.1 | % |
| 20.1 - 30.0 | 1 | 20,400,000 | 2.9 | |
| 30.1 - 40.0 | 4 | 184,952,149 | 25.9 | |
| 40.1 - 50.0 | 7 | 238,255,000 | 33.4 | |
| 50.1 - 60.0 | 7 | 136,900,000 | 19.2 | |
| 60.1 - 64.9 | 3 | 68,600,000 | 9.6 | |
| Total: | 30 | $713,960,139 | 100.0 | % |
| Weighted Average: | 43.9% | | |
| AMORTIZATION TYPE |
| Amortization Type | Number of
Mortgage
Loans | Aggregate Cut-
off Date Balance | Percent by
Aggregate
Cut-off Date
Pool Balance (%) |
| Interest Only | 18 | $488,480,000 | 68.4 | % |
| Amortizing Balloon | 10 | 159,730,139 | 22.4 | |
| Interest Only, Amortizing Balloon | 2 | 65,750,000 | 9.2 | |
| Total: | 30 | $713,960,139 | 100.0 | % |
| ORIGINAL TERM OF INTEREST-ONLY PERIOD FOR PARTIAL IO LOANS |
| IO Terms (months) | Number of
Mortgage
Loans | Aggregate Cut-
off Date Balance | Percent by
Aggregate
Cut-off Date
Pool Balance (%) |
| 36 | 1 | $12,750,000 | 1.8 | % |
| 60 | 1 | 53,000,000 | 7.4 | |
| Total: | 2 | $65,750,000 | 9.2 | % |
| Weighted Average: | 55 months | | |
| SEASONING |
| Seasoning (months) | Number of
Mortgage
Loans | Aggregate Cut-
off Date Balance | Percent by
Aggregate
Cut-off Date
Pool Balance (%) |
| 0 | 11 | $231,855,000 | 32.5 | % |
| 1 | 13 | 356,675,139 | 50.0 | |
| 2 | 6 | 125,430,000 | 17.6 | |
| Total: | 30 | $713,960,139 | 100.0 | % |
| Weighted Average: | 1 month | | |
| (1) | The original amortization term shown for any mortgage loan that is interest only for part of its term does not include the number of months in its interest only period and reflects only the number of months as of the commencement of amortization remaining from the end of such interest-only period. |
| (2) | The remaining amortization term shown for any mortgage loan that is interest only for part of its term does not include the number of months in its interest only period and reflects only the number of months as of the commencement of amortization remaining from the end of such interest-only period. |
| (3) | Excludes the non-amortizing mortgage loans. |
| THE INFORMATION IN THIS STRUCTURAL AND COLLATERAL TERM SHEET IS NOT COMPLETE AND MAY BE AMENDED PRIOR TO THE TIME OF SALE. THIS TERM SHEET IS NOT AN OFFER TO SELL THESE SECURITIES AND IT IS NOT A SOLICITATION OF AN OFFER TO BUY THESE SECURITIES IN ANY JURISDICTION WHERE THE OFFER OR SALE IS NOT PERMITTED. |
| | 17 | |
| Wells Fargo Commercial Mortgage Trust 2024-C63 | Certain Terms and Conditions |
| V. | Certain Terms and Conditions |
| Interest Entitlements: | The interest entitlement of each Class of Certificates on each Distribution Date generally will be the interest accrued during the related Interest Accrual Period on the related Certificate Balance or Notional Amount at the related pass-through rate, net of any prepayment interest shortfalls allocated to that Class for such Distribution Date as described below. If prepayment interest shortfalls arise from voluntary prepayments (without the applicable Master Servicer’s consent) on particular non-specially serviced loans during any collection period, the applicable Master Servicer is required to make a compensating interest payment to offset those shortfalls, generally up to an amount equal to the portion of its master servicing fees that accrue at 0.25 basis points per annum. The remaining amount of prepayment interest shortfalls will be allocated to reduce the interest entitlement on all Classes of Certificates that are entitled to interest, on a pro rata basis, based on their respective amounts of accrued interest for the related Distribution Date. If a Class receives less than the entirety of its interest entitlement on any Distribution Date, then the shortfall (excluding any shortfall due to prepayment interest shortfalls), together with interest thereon, will be added to its interest entitlement for the next succeeding Distribution Date. |
Principal Distribution
Amount: | The Principal Distribution Amount for each Distribution Date generally will be the aggregate amount of principal received or advanced in respect of the mortgage loans, net of any non-recoverable advances and interest thereon and workout-delayed reimbursement amounts that are reimbursed to a Master Servicer, a Special Servicer, the Trustee or the NCB Back-up Advancing Agent during the related collection period. Non-recoverable advances and interest thereon are reimbursable from principal collections and advances before reimbursement from other amounts. Workout-delayed reimbursement amounts are reimbursable from principal collections. |
Subordination, Allocation of
Losses and Certain
Expenses | The chart below describes the manner in which the payment rights of certain Classes of Certificates will be senior or subordinate, as the case may be, to the payment rights of other Classes of Certificates. The chart also shows the corresponding entitlement to receive principal and/or interest of certain Classes of Certificates on any distribution date in descending order. It also shows the manner in which losses are allocated to certain Classes of Certificates in ascending order (beginning with the Non-Offered Certificates, other than the Class X-D, X-F and Class R Certificates) to reduce the Certificate Balance of each such Class to zero; provided that no principal payments or mortgage loan losses will be allocated to the Class X-A, X-B, X-D, X-F or R Certificates, although principal payments and losses may reduce the Notional Amounts of the Class X-A, X-B, X-D and X-F Certificates and, therefore, the amount of interest they accrue. |
| |  |
| | | (1) | The Class X-A, X-B, X-D and X-F Certificates are interest-only certificates. |
| | | (2) | Non-Offered Certificates. |
| | | (3) | Other than the Class X-D, X-F and R Certificates |
| Distributions: | On each Distribution Date, funds available for distribution from the mortgage loans, net of specified trust fees, expenses and reimbursements will generally be distributed in the following amounts and order of priority (in each case to the extent of remaining available funds): |
| THE INFORMATION IN THIS STRUCTURAL AND COLLATERAL TERM SHEET IS NOT COMPLETE AND MAY BE AMENDED PRIOR TO THE TIME OF SALE. THIS TERM SHEET IS NOT AN OFFER TO SELL THESE SECURITIES AND IT IS NOT A SOLICITATION OF AN OFFER TO BUY THESE SECURITIES IN ANY JURISDICTION WHERE THE OFFER OR SALE IS NOT PERMITTED. |
| | 18 | |
| Wells Fargo Commercial Mortgage Trust 2024-C63 | Certain Terms and Conditions |
| | 1. Class A-1, A-3, A-SB, A-4, A-5, X-A, X-B, X-D and X-F Certificates: To interest on the Class A-1, A-3, A-SB, A-4, A-5, X-A, X-B, X-D and X-F Certificates, pro rata, according to their respective interest entitlements. |
| | 2. Class A-1, A-3, A-SB, A-4 and A-5 Certificates: To principal on the Class A-1, A-3, A-SB, A-4 and A-5 Certificates in the following amounts and order of priority: (i) first, to principal on the Class A-SB Certificates, in an amount up to the Principal Distribution Amount for such Distribution Date until their Certificate Balance is reduced to the Class A-SB Planned Principal Balance for such Distribution Date; (ii) second, to principal on the Class A-1 Certificates until their Certificate Balance is reduced to zero, up to the remainder of the Principal Distribution Amount for such Distribution Date; (iii) third, to principal on the Class A-3 Certificates until their Certificate Balance is reduced to zero, up to the remainder of the Principal Distribution Amount for such Distribution Date; (iv) fourth, to principal on the Class A-4 Certificates until their Certificate Balance is reduced to zero, up to the remainder of the Principal Distribution Amount for such Distribution Date; (v) fifth, to principal on the Class A-5 Certificates until their Certificate Balance is reduced to zero, up to the remainder of the Principal Distribution Amount for such Distribution Date; and (vi) sixth, to principal on the Class A-SB Certificates until their Certificate Balance is reduced to zero, up to the remainder of the Principal Distribution Amount for such Distribution Date. However, if the Certificate Balance of each and every Class of Principal Balance Certificates, other than the Class A-1, A-3, A-SB, A-4 and A-5 Certificates, has been reduced to zero as a result of the allocation of Mortgage Loan losses and expenses and any of the Class A-1, A-3, A-SB, A-4 and A-5 Certificates remains outstanding, then the Principal Distribution Amount will be distributed to the Class A-1, A-3, A-SB, A-4 and A-5 Certificates, pro rata, based on their respective outstanding Certificate Balances, until their Certificate Balances have been reduced to zero. |
| | 3. Class A-1, A-3, A-SB, A-4 and A-5 Certificates: To reimburse the holders of the A-1, A-3, A-SB, A-4 and A-5 Certificates, pro rata, on the basis of previously allocated unreimbursed losses, for any previously unreimbursed losses (plus interest thereon) on the mortgage loans that were previously allocated in reduction of the Certificate Balances of such Classes. |
| | 4. Class A-S Certificates: To make distributions on the Class A-S Certificates as follows: (a) first, to interest on the Class A-S Certificates in the amount of the interest entitlement for that Class; (b) next, to the extent of the portion of the Principal Distribution Amount remaining after distributions in respect of principal to each Class with a higher distribution priority (in this case, the Class A-1, A-3, A-SB, A-4 and A-5 Certificates), to principal on the Class A-S Certificates until their Certificate Balance is reduced to zero; and (c) next, to reimburse the holders of the Class A-S Certificates for any previously unreimbursed losses (plus interest thereon) on the mortgage loans that were previously allocated to that Class in reduction of their Certificate Balance. 5. Class B Certificates: To make distributions on the Class B Certificates as follows: (a) first, to interest on the Class B Certificates in the amount of the interest entitlement for that Class; (b) next, to the extent of the portion of the Principal Distribution Amount remaining after distributions in respect of principal to each Class with a higher distribution priority (in this case, the Class A-1, A-3, A-SB, A-4, A-5 and A-S Certificates), to principal on the Class B Certificates until their Certificate Balance is reduced to zero; and (c) next, to reimburse the holders of the Class B Certificates for any previously unreimbursed losses (plus interest thereon) on the mortgage loans that were previously allocated to that Class in reduction of their Certificate Balance. 6. Class C Certificates: To make distributions on the Class C Certificates as follows: (a) first, to interest on the Class C Certificates in the amount of the interest entitlement for that Class; (b) next, to the extent of the portion of the Principal Distribution Amount remaining after distributions in respect of principal to each Class with a higher distribution priority (in this case, the Class A-1, A-3, A-SB, A-4, A-5, A-S and B Certificates), to principal on the Class C Certificates until their Certificate Balance is reduced to zero; and (c) next, to reimburse the holders of the Class C Certificates for any previously unreimbursed losses (plus interest thereon) on the mortgage loans that were previously allocated to that Class in reduction of their Certificate Balance. 7. After the Class A-1, A-3, A-SB, A-4, A-5, A-S, B and C Certificates are paid all amounts to which they are entitled, the remaining funds available for distribution will be used to pay interest, principal and loss reimbursement amounts on the Class D, E, F, G-RR and J-RR Certificates sequentially in that order in a manner analogous to the Class C Certificates. |
| THE INFORMATION IN THIS STRUCTURAL AND COLLATERAL TERM SHEET IS NOT COMPLETE AND MAY BE AMENDED PRIOR TO THE TIME OF SALE. THIS TERM SHEET IS NOT AN OFFER TO SELL THESE SECURITIES AND IT IS NOT A SOLICITATION OF AN OFFER TO BUY THESE SECURITIES IN ANY JURISDICTION WHERE THE OFFER OR SALE IS NOT PERMITTED. |
| | 19 | |
| Wells Fargo Commercial Mortgage Trust 2024-C63 | Certain Terms and Conditions |
Allocation of Yield
Maintenance Charges and
Prepayment Premiums: | If any Yield Maintenance Charge or Prepayment Premium is collected during any particular collection period with respect to any mortgage loan, then on the Distribution Date corresponding to that collection period, the certificate administrator will pay that Yield Maintenance Charge or Prepayment Premium (net of liquidation fees payable therefrom) in the following manner: (1) to each class of the Class A-1, A-3, A-SB, A-4, A-5, A-S, B, C, D and E Certificates, the product of (a) such Yield Maintenance Charge or Prepayment Premium, (b) the related Base Interest Fraction for such class and the applicable principal prepayment, and (c) a fraction, the numerator of which is equal to the amount of principal distributed to such class for that Distribution Date, and the denominator of which is the total amount of principal distributed to the Class A-1, A-3, A-SB, A-4, A-5, A-S, B, C, D, E, F, G-RR and J-RR Certificates for that Distribution Date, (2) to the Class X-A Certificates, the excess, if any, of (a) the product of (i) such Yield Maintenance Charge or Prepayment Premium and (ii) a fraction, the numerator of which is equal to the total amount of principal distributed to the Class A-1, A-3, A-SB, A-4 and A-5 Certificates for that Distribution Date, and the denominator of which is the total amount of principal distributed to the Class A-1, A-3, A-SB, A-4, A-5, A-S, B, C, D, E, F, G-RR and J-RR Certificates for that Distribution Date, over (b) the total amount of such Yield Maintenance Charge or Prepayment Premium distributed to the Class A-1, A-3, A-SB, A-4 and A-5 Certificates as described above, (3) to the holders of the Class X-B Certificates, the excess, if any, of (a) the product of (i) such Yield Maintenance Charge or Prepayment Premium and (ii) a fraction, the numerator of which is equal to the total amount of principal distributed to the Class A-S, B and C Certificates for that Distribution Date, and the denominator of which is the total amount of principal distributed to the Class A-1, A-3, A-SB, A-4, A-5, A-S, B, C, D, E, F, G-RR and J-RR Certificates for that Distribution Date, over (b) the total amount of such Yield Maintenance Charge or Prepayment Premium distributed to the Class A-S, Class B and Class C Certificates as described above, and (4) to the Class X-D Certificates, any remaining portion of such Yield Maintenance Charge or Prepayment Premium not distributed as described above; provided, however, that after the Certificate Balances of the Class A-1, A-3, A-SB, A-4, A-5, A-S, B, C, D and E Certificates have been reduced to zero, all prepayment premiums and yield maintenance charges with respect to the mortgage loans will be allocated among the holders of the Class F, G-RR and J-RR Certificates as provided in the WFCM 2024-C63 pooling and servicing agreement. No Prepayment Premiums or Yield Maintenance Charges will be distributed to the holders of the Class X-F or R Certificates. For a description of when Prepayment Premiums and Yield Maintenance Charges are generally required on the mortgage loans, see Annex A-1 to the Preliminary Prospectus. See also “Risk Factors—Risks Relating to the Mortgage Loans—Risks Relating to Enforceability of Yield Maintenance Charges, Prepayment Premiums or Defeasance Provisions” and “Risk Factors—Other Risks Relating to the Certificates—Your Yield May Be Affected by Defaults, Prepayments and Other Factors” in the Preliminary Prospectus. Prepayment Premiums and Yield Maintenance Charges will be distributed on each Distribution Date only to the extent they are actually received on the mortgage loans as of the related Determination Date. |
| Realized Losses: | The Certificate Balances of the Class A-1, A-3, A-SB, A-4, A-5, A-S, B, C, D, E, F, G-RR and J-RR Certificates will be reduced without distribution on any Distribution Date as a write-off to the extent of any losses realized on the mortgage loans allocated to such Class on such Distribution Date. Such losses will be applied in the following order, in each case until the related Certificate Balance is reduced to zero: first, to the Class J-RR Certificates; second, to the Class G-RR Certificates; third, to the Class F Certificates; fourth, to the Class E Certificates; fifth, to the Class D Certificates; sixth, to the Class C Certificates; seventh, to the Class B Certificates; eighth, to the Class A-S Certificates; and, finally, pro rata, to the Class A-1, A-3, A-SB, A-4 and A-5 Certificates based on their outstanding Certificate Balances. The Notional Amount of the Class X-A Certificates will be reduced by the amount of all losses that are allocated to the Class A-1, A-3, A-SB, A-4 and A-5 Certificates as write-offs in reduction of their Certificate Balances. The Notional Amount of the Class X-B Certificates will be reduced by the amount of all losses that are allocated to the Class A-S, B and C Certificates as write-offs in reduction of their Certificate Balances. |
| THE INFORMATION IN THIS STRUCTURAL AND COLLATERAL TERM SHEET IS NOT COMPLETE AND MAY BE AMENDED PRIOR TO THE TIME OF SALE. THIS TERM SHEET IS NOT AN OFFER TO SELL THESE SECURITIES AND IT IS NOT A SOLICITATION OF AN OFFER TO BUY THESE SECURITIES IN ANY JURISDICTION WHERE THE OFFER OR SALE IS NOT PERMITTED. |
| | 20 | |
| Wells Fargo Commercial Mortgage Trust 2024-C63 | Certain Terms and Conditions |
| P&I Advances: | Each Master Servicer (or, (i) if the General Master Servicer fails to do so, the Trustee and (ii) if the NCB Master Servicer fails to do so, the NCB Back-up Advancing Agent, and if the NCB Back-up Advancing Agent fails to do so, the Trustee), will be obligated to advance delinquent debt service payments with respect to the mortgage loans it services (other than balloon payments and default interest) and assumed debt service payments on mortgage loans with delinquent balloon payments (excluding any related companion loan), except to the extent any such advance is deemed non-recoverable from collections on the related mortgage loan. In addition, if an Appraisal Reduction Amount exists for a given mortgage loan, the interest portion of any P&I advance for such mortgage loan will be reduced, which will have the effect of reducing the amount of interest available for distribution to the Certificates in reverse alphabetical order of their Class designations (except that interest payments on the Class A-1, A-3, A-SB, A-4, A-5, X-A, X-B, X-D and X-F Certificates would be affected on a pari passu basis). |
| Servicing Advances: | Each Master Servicer (or, (i) if the General Master Servicer fails to do so, the Trustee and (ii) if the NCB Master Servicer fails to do so, the NCB Back-up Advancing Agent, and if the NCB Back-up Advancing Agent fails to do so, the Trustee), will be obligated to make servicing advances, including the payment of delinquent property taxes, insurance premiums and ground rent, except to the extent that those advances are deemed non-recoverable from collections on the related mortgage loan. The related Master Servicer, the Trustee or the NCB Back-up Advancing Agent, as applicable, will have the primary obligation to make any required servicing advances with respect to any serviced whole loan. With respect to any non-serviced whole loan, the master servicer or trustee, as applicable, under the related lead securitization servicing agreement will have the primary obligation to make any required servicing advances with respect to such non-serviced whole loan. |
Appraisal Reduction
Amounts and Collateral
Deficiency Amounts: | An “Appraisal Reduction Amount” generally will be created in the amount, if any, by which the principal balance of a required appraisal loan (which is a mortgage loan (other than a non-serviced mortgage loan) with respect to which certain defaults, modifications or insolvency events have occurred as further described in the Preliminary Prospectus) plus other amounts overdue or advanced in connection with such mortgage loan exceeds 90% of the appraised value of the related mortgaged property plus certain escrows and reserves (including letters of credit) held with respect to the mortgage loan. With respect to any serviced whole loan, any Appraisal Reduction Amount will be allocated first to the related subordinate companion loan(s), if any, and then, pro rata, to the related mortgage loan and the related pari passu companion loan(s). With respect to any non-serviced mortgage loan, appraisal reduction amounts are expected to be calculated in a similar manner under the related non-serviced pooling and servicing agreement. A mortgage loan will cease to be a required appraisal loan when the same has ceased to be a specially serviced loan (if applicable), has been brought current for at least three consecutive months and no other circumstances exist that would cause such mortgage loan to be a required appraisal loan. A “Collateral Deficiency Amount” will exist with respect to any mortgage loan that is modified into an AB loan structure and remains a corrected mortgage loan and will generally equal the excess of (i) the stated principal balance of such AB modified loan (taking into account the related junior note(s) and any pari passu notes included therein), over (ii) the sum of (in the case of a whole loan, solely to the extent allocable to the subject mortgage loan) (x) the most recent appraised value of the related mortgaged property plus (y) solely to the extent not reflected or taken into account in such appraised value and to the extent on deposit with, or otherwise under the control of, the lender as of the date of such determination, any capital or additional collateral contributed by the related borrower at the time the mortgage loan (and as part of the modification thereto) became an AB modified loan plus (z) any other escrows or reserves (in addition to any amounts set forth in the immediately preceding clause (y) and solely to the extent not reflected or taken into account in the calculation of any related Appraisal Reduction Amount) held by the lender with respect to the mortgage loan as of the date of such determination. A “Cumulative Appraisal Reduction Amount” with respect to any mortgage loan will be the sum of any Appraisal Reduction Amount and any Collateral Deficiency Amount. Appraisal Reduction Amounts will affect the amount of debt service advances in respect of the related mortgage loan. Additionally, Cumulative Appraisal Reduction Amounts will be taken into account in the determination of the identity of the Class whose majority constitutes the “majority controlling class certificateholder” and is entitled to appoint the directing certificateholder. |
Clean-Up Call and Exchange
Termination: | On each Distribution Date occurring after the aggregate unpaid principal balance of the pool of mortgage loans is less than 1.0% of the principal balance of the mortgage loans as of the cut-off date, certain specified persons will have the option to purchase all of the remaining mortgage loans (and the trust’s interest in all property acquired through exercise of remedies in respect of any mortgage loan) at the price specified in the Preliminary Prospectus. Exercise of the option will terminate the trust and retire the then-outstanding Certificates. |
| THE INFORMATION IN THIS STRUCTURAL AND COLLATERAL TERM SHEET IS NOT COMPLETE AND MAY BE AMENDED PRIOR TO THE TIME OF SALE. THIS TERM SHEET IS NOT AN OFFER TO SELL THESE SECURITIES AND IT IS NOT A SOLICITATION OF AN OFFER TO BUY THESE SECURITIES IN ANY JURISDICTION WHERE THE OFFER OR SALE IS NOT PERMITTED. |
| | 21 | |
| Wells Fargo Commercial Mortgage Trust 2024-C63 | Certain Terms and Conditions |
| If the aggregate Certificate Balances of each of the Class A-1, A-3, A-SB, A-4, A-5, A-S, B, C, D and E Certificates have been reduced to zero, the trust may also be terminated in connection with an exchange of all the then-outstanding Certificates (other than the Class R Certificates) for the mortgage loans and REO properties then remaining in the issuing entity, subject to payment of a price specified in the Preliminary Prospectus, but all of the holders of those outstanding Classes of Certificates (other than the Class R Certificates) would have to voluntarily participate in the exchange. |
| Liquidation Loan Waterfall: | Following the liquidation of any mortgage loan or mortgaged property, the net liquidation proceeds generally will be applied (after reimbursement of advances and certain trust fund expenses), first, as a recovery of accrued interest, other than delinquent interest that was not advanced as a result of Appraisal Reduction Amounts, second, as a recovery of principal until all principal has been recovered, and then as a recovery of delinquent interest that was not advanced as a result of Appraisal Reduction Amounts. Please see “Description of the Certificates—Distributions—Application Priority of Mortgage Loan Collections or Whole Loan Collections” in the Preliminary Prospectus. |
| Control Eligible Certificates: | The Class G-RR and J-RR Certificates. |
Directing Certificateholder/
Controlling Class: | A directing certificateholder may be appointed by the “majority controlling class certificateholder”, which will be the holder(s) of a majority of the Controlling Class. The “Controlling Class” will be, as of any time of determination, the most subordinate Class of Control Eligible Certificates then outstanding that has an aggregate Certificate Balance (as notionally reduced by any Cumulative Appraisal Reduction Amounts allocable to such Class(es)) at least equal to 25% of the initial Certificate Balance of that Class; provided, however, that if at any time the Certificate Balances of the Certificates other than the Control Eligible Certificates have been reduced to zero as a result of principal payments on the Mortgage Loans, then the Controlling Class will be the most subordinate Class of Control Eligible Certificates that has a Certificate Balance greater than zero without regard to any Cumulative Appraisal Reduction Amounts. The Controlling Class as of the closing date will be the Class J-RR Certificates. |
| Control and Consultation: | The rights of various parties to replace the applicable Special Servicer and approve or consult with respect to major actions of such Special Servicer will vary according to defined periods. A “Control Termination Event” will occur when (i) the Class G-RR Certificates have a Certificate Balance (taking into account the application of any Cumulative Appraisal Reduction Amounts to notionally reduce the Certificate Balance of such Class) of less than 25% of the initial Certificate Balance of that Class or (ii) a holder of the Class G-RR Certificates is the majority Controlling Class Certificateholder and has irrevocably waived its right, in writing, to exercise any of the rights of the Controlling Class Certificateholder and such rights have not been reinstated to a successor controlling class certificateholder as described below; provided that a Control Termination Event will not be deemed continuing in the event that the Certificate Balances of the Certificates other than the Control Eligible Certificates have been reduced to zero as a result of principal payments on the mortgage loans. A “Consultation Termination Event” will occur when (i) there is no Class of Control Eligible Certificates that has a then-outstanding Certificate Balance at least equal to 25% of the initial Certificate Balance of that Class, in each case, without regard to the application of any Cumulative Appraisal Reduction Amounts; or (ii) a holder of the Class G-RR certificates is the majority Controlling Class Certificateholder and has irrevocably waived its right, in writing, to exercise any of the rights of the Controlling Class Certificateholder and such rights have not been reinstated to a successor controlling class certificateholder pursuant to the terms of the WFCM 2024-C63 pooling and servicing agreement; provided that no Consultation Termination Event resulting solely from the operation of clause (ii) will be deemed to have existed or be in continuance with respect to a successor holder of the Class G-RR certificates that has not irrevocably waived its right to exercise any of the rights of the Controlling Class Certificateholder; provided, further, that a Consultation Termination Event will not be deemed continuing in the event that the Certificate Balances of the Certificates other than the Control Eligible Certificates have been reduced to zero as a result of principal payments on the mortgage loans. If no Control Termination Event has occurred and is continuing, except with respect to the Excluded Loans (as defined below) (i) the directing certificateholder will be entitled to grant or withhold approval of asset status reports prepared, and material servicing actions proposed, by the applicable Special Servicer, and (ii) the directing certificateholder will be entitled to terminate and replace such Special Servicer with or without cause, and appoint itself or another person as the successor special servicer. It will be a condition to such appointment that Fitch, KBRA and Moody’s (and any rating agency rating any securities backed by any pari passu companion loan(s) serviced under this transaction) confirm that the appointment would not result in a qualification, downgrade or withdrawal of any of their then-current ratings of Certificates (and any certificates backed by any pari passu companion loan(s) serviced under this transaction). |
| THE INFORMATION IN THIS STRUCTURAL AND COLLATERAL TERM SHEET IS NOT COMPLETE AND MAY BE AMENDED PRIOR TO THE TIME OF SALE. THIS TERM SHEET IS NOT AN OFFER TO SELL THESE SECURITIES AND IT IS NOT A SOLICITATION OF AN OFFER TO BUY THESE SECURITIES IN ANY JURISDICTION WHERE THE OFFER OR SALE IS NOT PERMITTED. |
| | 22 | |
| Wells Fargo Commercial Mortgage Trust 2024-C63 | Certain Terms and Conditions |
| If a Control Termination Event has occurred and is continuing but no Consultation Termination Event has occurred and is continuing, the applicable Special Servicer will be required to consult with the directing certificateholder (other than with respect to Excluded Loans as to such party) in connection with asset status reports and material special servicing actions. If a Consultation Termination Event has occurred and is continuing, no directing certificateholder will be recognized or have any right to terminate the applicable Special Servicer or approve, direct or consult with respect to servicing matters. With respect to each serviced whole loan, the rights of the directing certificateholder described above will be subject to the consultation rights of the holders of the related pari passu companion loans. Those consultation rights will generally extend to asset status reports and material special servicing actions involving the related whole loan, will be as set forth in the related intercreditor agreement, and will be in addition to the rights of the directing certificateholder in this transaction described above. With respect to each non-serviced whole loan, the applicable servicing agreement for the related controlling pari passu companion loan(s) generally grants (or will grant) the directing certificateholder under the related securitization control rights that may include the right to approve or disapprove various material servicing actions involving the related whole loan. The directing certificateholder for this securitization (so long as no Consultation Termination Event has occurred and is occurring) generally will nonetheless have the right to be consulted on a non-binding basis with respect to such actions. For purposes of the servicing of any such whole loan contemplated by this paragraph, the occurrence and continuance of a Control Termination Event or Consultation Termination Event under this securitization will not limit the control or other rights of the directing certificateholder (or equivalent) under the securitization of the related controlling pari passu companion loan(s). The control rights and consent and consultation rights described in the preceding paragraphs are subject to various limitations, conditions and exceptions as described in the Preliminary Prospectus. Notwithstanding any contrary description set forth above, in the event that, with respect to any mortgage loan, the majority controlling class certificateholder or the directing certificateholder is a Borrower Party, the majority controlling class certificateholder and the directing certificateholder will have no right to receive asset status reports or such other information as may be specified in the WFCM 2024-C63 pooling and servicing agreement, to grant or withhold approval of, or consult with respect to, asset status reports prepared, and material servicing actions proposed, by a Special Servicer, with respect to such mortgage loan, and such mortgage loan will be referred to as an “Excluded Loan” as to such party. In addition, notwithstanding any contrary description set forth above, in the event that, with respect to any mortgage loan, a controlling class certificateholder is a Borrower Party, such controlling class certificateholder will have no right to receive asset status reports or such other information as may be specified in the WFCM 2024-C63 pooling and servicing agreement with respect to such mortgage loan. “Borrower Party” means a borrower, a mortgagor or a manager of a mortgaged property, an Accelerated Mezzanine Loan Lender, or any Borrower Party Affiliate. “Accelerated Mezzanine Loan Lender” means a mezzanine lender under a mezzanine loan that has been accelerated or as to which foreclosure or enforcement proceedings have been commenced against the equity collateral pledged to secure such mezzanine loan. “Borrower Party Affiliate” means, with respect to a borrower, a mortgagor, a manager of a mortgaged property or an Accelerated Mezzanine Loan Lender, (x) any other person controlling or controlled by or under common control with such borrower, mortgagor, manager or Accelerated Mezzanine Loan Lender, as applicable, or (y) any other person owning, directly or indirectly, 25% or more of the beneficial interests in such borrower, mortgagor, manager or Accelerated Mezzanine Loan Lender. With respect to a mortgage loan secured by a residential cooperative property, a person will not be considered a “Borrower Party” solely by reason of such person holding one or more cooperative unit loans that are secured by direct equity interests in the related borrower or owning one or more residential cooperative units comprising the related mortgaged property as a result of any foreclosure, transfer in lieu of foreclosure or other exercise of remedies with respect to any such unit loan(s). |
Risk Retention Consultation
Party: | A risk retention consultation party may be appointed by the holder or holders of more than 50% of the VRR Interest, by Certificate Balance. The holder of the majority of the VRR Interest will have a continuing right to appoint, remove or replace the risk retention consultation party in its sole discretion. This right may be exercised at any time and from time to time. There is expected to be no initial risk retention consultation party as of the closing date. Notwithstanding any contrary description set forth above, in the event that, with respect to any mortgage loan, the holder of the majority of the VRR Interest or the risk retention consultation |
| THE INFORMATION IN THIS STRUCTURAL AND COLLATERAL TERM SHEET IS NOT COMPLETE AND MAY BE AMENDED PRIOR TO THE TIME OF SALE. THIS TERM SHEET IS NOT AN OFFER TO SELL THESE SECURITIES AND IT IS NOT A SOLICITATION OF AN OFFER TO BUY THESE SECURITIES IN ANY JURISDICTION WHERE THE OFFER OR SALE IS NOT PERMITTED. |
| | 23 | |
| Wells Fargo Commercial Mortgage Trust 2024-C63 | Certain Terms and Conditions |
| party is a Borrower Party, such mortgage loan will be referred to as an “Excluded Loan” as to such party. Except with respect to an Excluded Loan as to such party, the risk retention consultation party will be entitled to consult with the Special Servicer, upon request of the risk retention consultation party, with respect to certain material servicing actions proposed by the Special Servicer. |
Replacement of a Special
Servicer: | If a Control Termination Event has occurred and is continuing, any Special Servicer may be removed and replaced without cause upon the affirmative direction of certificate owners holding not less than 66-2/3% of a certificateholder quorum, following a proposal from certificate owners holding not less than 25% of the appraisal-reduced voting rights of all Principal Balance Certificates. The certificateholders who initiate a vote on a termination and replacement of the applicable Special Servicer without cause must cause Fitch, KBRA and Moody’s to confirm the then-current ratings of the Certificates (or decline to review the matter) and cause the payment of the fees and expenses incurred in the replacement. If no Control Termination Event has occurred and is continuing, the applicable Special Servicer may be replaced by the directing certificateholder, subject to Fitch, KBRA and Moody’s (and any Rating Agency rating any securities backed by any pari passu companion loan(s) serviced under this transaction) confirming the then-current ratings of the Certificates (and any certificates backed by any pari passu companion loans serviced under this transaction) or declining to review the matter. In addition, if at any time the Operating Advisor determines, in its sole discretion exercised in good faith, that (i) the applicable Special Servicer is not performing its duties as required under the pooling and servicing agreement in accordance with the Servicing Standard and (ii) the replacement of the applicable Special Servicer would be in the best interest of the certificateholders as a collective whole, then the Operating Advisor will have the right to recommend the replacement of such Special Servicer and will submit its formal recommendation to the Trustee and the Certificate Administrator (along with its rationale, its proposed replacement special servicer and other relevant information justifying its recommendation). The Operating Advisor’s recommendation to replace the applicable Special Servicer must be confirmed by an affirmative vote of holders of Certificates representing a majority of the aggregate outstanding Certificate Balance of all Principal Balance Certificates whose holders voted on the matter, provided that the holders of Principal Balance Certificates that so voted on the matter (i) hold Principal Balance Certificates representing at least 20% of the outstanding Certificate Balance of all Principal Balance Certificates on an aggregate basis and (ii) consist of at least three certificateholders or certificate owners that are not “risk retention affiliated” with each other. In the event the holders of Principal Balance Certificates evidencing at least a majority of a quorum of certificateholders elect to remove and replace a Special Servicer (which requisite affirmative votes must be received within 180 days of the posting of the notice of the Operating Advisor’s recommendation to replace such Special Servicer to the Certificate Administrator’s website), the Certificate Administrator will be required to receive a Rating Agency Confirmation from each of the Rating Agencies at that time. |
| Excluded Special Servicer: | In the event that, with respect to any mortgage loan, the applicable Special Servicer is a Borrower Party, the applicable Special Servicer will be required to resign as special servicer of such mortgage loan (referred to as an “excluded special servicer loan”). If no Control Termination Event has occurred and is continuing, the directing certificateholder will be entitled to appoint (and may replace with or without cause) a separate special servicer that is not a Borrower Party (referred to as an “excluded special servicer”) with respect to such excluded special servicer loan unless such excluded special servicer loan is also an excluded loan. Otherwise, upon resignation of such Special Servicer with respect to an excluded special servicer loan, the resigning Special Servicer will be required to use commercially reasonable efforts to appoint the excluded special servicer. |
| Appraisal Remedy: | If the Class of Certificates comprising the Controlling Class loses its status as Controlling Class because of the application of an Appraisal Reduction Amount or Collateral Deficiency Amount, the holders of a majority of the voting rights of such Class may require the applicable Special Servicer to order a second appraisal for any mortgage loan in respect of which an Appraisal Reduction Amount or Collateral Deficiency Amount has been applied. The applicable Special Servicer must thereafter determine whether, based on its assessment of such second appraisal, any recalculation of the Appraisal Reduction Amount or Collateral Deficiency Amount is warranted and, if so warranted, such Special Servicer will recalculate such Appraisal Reduction Amount or Collateral Deficiency Amount. Such Class will not be able to exercise any direction, control, consent and/or similar rights of the Controlling Class unless and until reinstated as the Controlling Class through such determination; and pending such determination, the rights of the Controlling Class will be exercised by the Control Eligible Certificates, if any, that would be the Controlling Class taking into account the subject appraisal reduction amount. |
| Sale of Defaulted Assets: | There will be no “fair value” purchase option. Instead, the WFCM 2024-C63 pooling and servicing agreement will authorize the applicable Special Servicer to sell defaulted mortgage loans serviced |
| THE INFORMATION IN THIS STRUCTURAL AND COLLATERAL TERM SHEET IS NOT COMPLETE AND MAY BE AMENDED PRIOR TO THE TIME OF SALE. THIS TERM SHEET IS NOT AN OFFER TO SELL THESE SECURITIES AND IT IS NOT A SOLICITATION OF AN OFFER TO BUY THESE SECURITIES IN ANY JURISDICTION WHERE THE OFFER OR SALE IS NOT PERMITTED. |
| | 24 | |
| Wells Fargo Commercial Mortgage Trust 2024-C63 | Certain Terms and Conditions |
| by such Special Servicer to the highest bidder in a manner generally similar to sales of REO properties. The sale of a defaulted loan (other than a non-serviced whole loan) for less than par plus accrued interest and certain other fees and expenses owed on the loan will be subject to consent or consultation rights of the directing certificateholder, Operating Advisor and/or Risk Retention Consultation Party, as described in the Preliminary Prospectus. Generally speaking, the holder of a pari passu companion loan will have consent and/or consultation rights, as described in the Preliminary Prospectus. If the subject whole loan includes one or more subordinate companion loans, those subordinate companion loans may be included in such sale as well. With respect to any serviced whole loan, if such whole loan becomes a defaulted loan under the WFCM 2024-C63 pooling and servicing agreement, the applicable Special Servicer will generally be required to sell both the mortgage loan and the related pari passu companion loan(s) as a single whole loan. With respect to each non-serviced whole loan, the applicable servicing agreement governing the servicing of such whole loan generally provides (or is expected to provide) that, if the related pari passu companion loan(s) serviced under such agreement become a defaulted loan under such servicing agreement, then the related special servicer may offer to sell to any person (or may offer to purchase) for cash such whole loan during such time as such applicable pari passu companion loan(s) constitutes a defaulted loan under such servicing agreement. Generally speaking, in connection with any such sale, the related special servicer is required to sell both the mortgage loan and the related pari passu companion loan(s) (and, in some cases, any related subordinate companion loan) as a whole loan. The directing certificateholder for this securitization generally will have consultation rights as the holder of an interest in the related mortgage loan, as described in the Preliminary Prospectus. The procedures for the sale of any whole loan that becomes a defaulted whole loan, and any associated consultation rights, are subject to various limitations, conditions and exceptions as described in the Preliminary Prospectus. |
| “As-Is” Appraisals: | Appraisals must be conducted on an “as-is” basis, and must be no more than 12 months old, for purposes of determining Appraisal Reduction Amounts and market value in connection with REO sales. Required appraisals may consist of updates of prior appraisals. Internal valuations by the applicable Special Servicer are permitted if the principal balance of a mortgage loan is less than $2,000,000. |
| Operating Advisor: | The Operating Advisor will have certain review and consultation rights relating to the performance of each applicable Special Servicer and with respect to its actions taken in connection with the resolution and/or liquidation of Specially Serviced Loans. With respect to each mortgage loan (other than a Non-Serviced Mortgage Loan) or serviced whole loan, the Operating Advisor will be responsible for: ● reviewing the actions of the applicable Special Servicer with respect to any Specially Serviced Loan; ● reviewing (i) all reports by the applicable Special Servicer made available to Privileged Persons on the Certificate Administrator’s website that are relevant to the Operating Advisor’s obligations under the pooling and servicing agreement and (ii) each Asset Status Report (as defined in the Preliminary Prospectus) (after the occurrence and during the continuance of an Operating Advisor Consultation Event (as defined below)) and Final Asset Status Report (as defined in the Preliminary Prospectus); ● reviewing for accuracy and consistency with the WFCM 2024-C63 pooling and servicing agreement the mathematical calculations by the applicable special servicer and the corresponding application of the non-discretionary portion of the applicable formulas required to be utilized in connection with Appraisal Reduction Amounts, Collateral Deficiency Amounts and net present value calculations used in the applicable Special Servicer’s determination of what course of action to take in connection with the workout or liquidation of a Specially Serviced Loan; and ● preparing an annual report (if any mortgage loan (other than any Non-Serviced Mortgage Loan) or serviced whole loan was a Specially Serviced Loan at any time during the prior calendar year or an Operating Advisor Consultation Event (as defined below) occurred during the prior calendar year) that sets forth whether the Operating Advisor believes, in its sole discretion exercised in good faith, that the applicable Special Servicer is operating in compliance with the Servicing Standard with respect to its performance of its duties under the pooling and servicing agreement with respect to Specially Serviced Loans (and, after the occurrence and during the continuance of an Operating Advisor Consultation Event (as defined below), with respect to major decisions on non- |
| THE INFORMATION IN THIS STRUCTURAL AND COLLATERAL TERM SHEET IS NOT COMPLETE AND MAY BE AMENDED PRIOR TO THE TIME OF SALE. THIS TERM SHEET IS NOT AN OFFER TO SELL THESE SECURITIES AND IT IS NOT A SOLICITATION OF AN OFFER TO BUY THESE SECURITIES IN ANY JURISDICTION WHERE THE OFFER OR SALE IS NOT PERMITTED. |
| | 25 | |
| Wells Fargo Commercial Mortgage Trust 2024-C63 | Certain Terms and Conditions |
| Specially Serviced Loans) during the prior calendar year on an “asset-level basis”. The Operating Advisor will identify (1) which, if any, standards the Operating Advisor believes, in its sole discretion exercised in good faith, the applicable Special Servicer has failed to comply with and (2) any material deviations from the applicable Special Servicer’s obligations under the pooling and servicing agreement with respect to the resolution or liquidation of any Specially Serviced Loan or REO Property (other than with respect to any REO Property related to any Non-Serviced Mortgage Loan). In preparing any Operating Advisor Annual Report (as defined in the Preliminary Prospectus), the Operating Advisor will not be required to report on instances of non-compliance with, or deviations from, the Servicing Standard or the applicable Special Servicer’s obligations under the pooling and servicing agreement that the Operating Advisor determines, in its sole discretion exercised in good faith, to be immaterial. With respect to each mortgage loan (other than any Non-Serviced Mortgage Loan) or serviced whole loan, after the Operating Advisor has received notice that an Operating Advisor Consultation Event (as defined below) has occurred and is continuing, in addition to the duties described above, the Operating Advisor will be required to perform the following additional duties: ● to consult (on a non-binding basis) with the applicable Special Servicer in respect of asset status reports and ● to consult (on a non-binding basis) with the applicable Special Servicer with respect to “major decisions” processed by such Special Servicer. An “Operating Advisor Consultation Event” will occur when the Certificate Balance of the Class G-RR and Class J-RR Certificates in the aggregate (taking into account the application of any Cumulative Appraisal Reduction Amounts to notionally reduce the Certificate Balances of such Classes) is 25% or less of the initial Certificate Balances of such Classes in the aggregate. |
Asset Representations
Reviewer: | The Asset Representations Reviewer will be required to review certain delinquent mortgage loans after a specified delinquency threshold has been exceeded (an “Asset Review Trigger”) and the required percentage of certificateholders vote to direct a review of such delinquent loans. An Asset Review Trigger will occur when either (1) mortgage loans with an aggregate outstanding principal balance of 25.0% or more of the aggregate outstanding principal balance of all of the mortgage loans (including any REO loans (or a portion of any REO loan in the case of a whole loan)) held by the issuing entity as of the end of the applicable collection period are delinquent loans or (2) at least 15 mortgage loans are delinquent loans as of the end of the applicable collection period and the outstanding principal balance of such delinquent loans in the aggregate constitutes at least 20.0% of the aggregate outstanding principal balance of all of the mortgage loans (including any REO loans (or a portion of any REO loan in the case of a whole loan)) held by the issuing entity as of the end of the applicable collection period. See “Pooling and Servicing Agreement—The Asset Representations Reviewer—Asset Review” in the Preliminary Prospectus. The Asset Representations Reviewer may be terminated and replaced without cause. Upon (i) the written direction of certificateholders evidencing not less than 25% of the voting rights (without regard to the application of any Cumulative Appraisal Reduction Amounts) requesting a vote to terminate and replace the Asset Representations Reviewer with a proposed successor Asset Representations Reviewer that is an eligible asset representations reviewer, and (ii) payment by such holders to the certificate administrator of the reasonable fees and expenses to be incurred by the certificate administrator in connection with administering such vote, the certificate administrator will promptly provide notice to all certificateholders and the Asset Representations Reviewer of such request by posting such notice on its internet website, and by mailing such notice to all certificateholders and the Asset Representations Reviewer. Upon the written direction of certificateholders evidencing at least 75% of a certificateholder quorum (without regard to the application of any Cumulative Appraisal Reduction Amounts), the Trustee will terminate all of the rights and obligations of the Asset Representations Reviewer under the WFCM 2024-C63 pooling and servicing agreement by written notice to the Asset Representations Reviewer, and the proposed successor Asset Representations Reviewer will be appointed. See “Pooling and Servicing Agreement—The Asset Representations Reviewer” in the Preliminary Prospectus. |
Dispute Resolution
Provisions: | The mortgage loan sellers will be subject to the dispute resolution provisions set forth in the WFCM 2024-C63 pooling and servicing agreement to the extent those provisions are triggered with respect to any mortgage loan sold to the depositor by a mortgage loan seller and such mortgage loan seller will be obligated under the related mortgage loan purchase agreement to comply with all applicable provisions and to take part in any mediation or arbitration proceedings that may result. Generally, in the event that a Repurchase Request (as defined in the Preliminary Prospectus) is not “Resolved” (as defined below) within 180 days after the related mortgage loan seller receives |
| THE INFORMATION IN THIS STRUCTURAL AND COLLATERAL TERM SHEET IS NOT COMPLETE AND MAY BE AMENDED PRIOR TO THE TIME OF SALE. THIS TERM SHEET IS NOT AN OFFER TO SELL THESE SECURITIES AND IT IS NOT A SOLICITATION OF AN OFFER TO BUY THESE SECURITIES IN ANY JURISDICTION WHERE THE OFFER OR SALE IS NOT PERMITTED. |
| | 26 | |
| Wells Fargo Commercial Mortgage Trust 2024-C63 | Certain Terms and Conditions |
| such Repurchase Request, then the enforcing servicer will be required to send a notice to the “Initial Requesting Certificateholder” (if any) and the Certificate Administrator indicating the enforcing servicer’s intended course of action with respect to the Repurchase Request. If (a) the enforcing servicer’s intended course of action with respect to the Repurchase Request does not involve pursuing further action to exercise rights against the related mortgage loan seller with respect to the Repurchase Request and the Initial Requesting Certificateholder, if any, or any other certificateholder or certificate owner wishes to exercise its right to refer the matter to mediation (including non-binding arbitration) or arbitration, or (b) the enforcing servicer’s intended course of action is to pursue further action to exercise rights against the related mortgage loan seller with respect to the Repurchase Request but the Initial Requesting Certificateholder, if any, or any other certificateholder or certificate owner does not agree with the dispute resolution method selected by the enforcing servicer, then the Initial Requesting Certificateholder, if any, or such other certificateholder or certificate owner may deliver a written notice to the applicable Special Servicer indicating its intent to exercise its right to refer the matter to either mediation or arbitration. “Resolved” means, with respect to a Repurchase Request, (i) that the related Material Defect has been cured, (ii) the related mortgage loan has been repurchased in accordance with the related mortgage loan purchase agreement, (iii) a mortgage loan has been substituted for the related mortgage loan in accordance with the related mortgage loan purchase agreement, (iv) the applicable mortgage loan seller has made a Loss of Value Payment (as defined in the Preliminary Prospectus), (v) a contractually binding agreement is entered into between the enforcing servicer, on behalf of the issuing entity, and the related mortgage loan seller that settles the related mortgage loan seller’s obligations under the related mortgage loan purchase agreement or (vi) the related mortgage loan is no longer property of the issuing entity as a result of a sale or other disposition in accordance with the WFCM 2024-C63 pooling and servicing agreement. See “Pooling and Servicing Agreement—Dispute Resolution Provisions” in the Preliminary Prospectus. |
| Investor Communications: | The certificate administrator is required to include on any Form 10–D any request received from a certificateholder to communicate with other certificateholders related to certificateholders exercising their rights under the terms of the WFCM 2024-C63 pooling and servicing agreement. Any certificateholder wishing to communicate with other certificateholders regarding the exercise of its rights under the terms of the WFCM 2024-C63 pooling and servicing agreement will be able to deliver a written request signed by an authorized representative of the requesting investor to the certificate administrator. |
| Certain Fee Offsets: | If a workout fee is earned by the applicable Special Servicer following a loan default with respect to any mortgage loan that it services, then certain limitations will apply based on modification fees paid by the borrower. The modification fee generally must not exceed 1% of the principal balance of the loan as modified in any 12-month period. In addition, if the loan re-defaults, any subsequent workout fee on that loan must be reduced by a portion of the modification fees paid by the borrower in the previous 12-months. Likewise, liquidation fees collected in connection with a liquidation or partial liquidation of a mortgage loan must be reduced by a portion of the modification fees paid by the borrower in the previous 12 months. |
| Deal Website: | The Certificate Administrator will be required to maintain a deal website, which will include, among other items: (a) summaries of asset status reports prepared by the applicable Special Servicer, (b) inspection reports, (c) appraisals, (d) various “special notices” described in the Preliminary Prospectus, (e) the “Investor Q&A Forum”, (f) a voluntary “Investor Registry” and (g) the “Risk Retention Special Notices” tab. Investors may access the deal website following execution of a certification and confidentiality agreement. |
Initial Majority Controlling
Class Certificateholder: | It is expected that Argentic Securities Holdings 2 Cayman Limited, an affiliate of Argentic Real Estate Finance 2 LLC and Argentic Services Company LP or an affiliate will be the initial majority controlling class certificateholder. |
| Whole Loans: | Each of the mortgaged properties identified above under “IV. Characteristics of the Mortgage Pool—B. Summary of the Whole Loans” secures both a mortgage loan to be included in the trust fund and one or more other mortgage loans that will not be included in the trust fund, each of which will be pari passu or subordinate in right of payment with the mortgage loan included in the trust fund. We refer to each such group of mortgage loans as a “whole loan”. Such “—Summary of the Whole Loans” section includes further information regarding the various notes in each whole loan, the holders of such notes, the lead servicing agreement for each such whole loan, and the applicable master servicer and applicable special servicer under such lead servicing agreement. |
| THE INFORMATION IN THIS STRUCTURAL AND COLLATERAL TERM SHEET IS NOT COMPLETE AND MAY BE AMENDED PRIOR TO THE TIME OF SALE. THIS TERM SHEET IS NOT AN OFFER TO SELL THESE SECURITIES AND IT IS NOT A SOLICITATION OF AN OFFER TO BUY THESE SECURITIES IN ANY JURISDICTION WHERE THE OFFER OR SALE IS NOT PERMITTED. |
| | 27 | |
| Industrial – Warehouse/Distribution | Loan #1 | Cut-off Date Balance: | | $65,000,000 |
| 12430 4th Street and 12415 6th Street | Bridge Point Rancho Cucamonga | Cut-off Date LTV: | | 34.5% |
| Rancho Cucamonga, CA 91730 | | U/W NCF DSCR: | | 2.73x |
| | | U/W NOI Debt Yield: | | 16.2% |

| THE INFORMATION IN THIS STRUCTURAL AND COLLATERAL TERM SHEET IS NOT COMPLETE AND MAY BE AMENDED PRIOR TO THE TIME OF SALE. THIS TERM SHEET IS NOT AN OFFER TO SELL THESE SECURITIES AND IT IS NOT A SOLICITATION OF AN OFFER TO BUY THESE SECURITIES IN ANY JURISDICTION WHERE THE OFFER OR SALE IS NOT PERMITTED. |
| | 28 | |
| Industrial – Warehouse/Distribution | Loan #1 | Cut-off Date Balance: | | $65,000,000 |
| 12430 4th Street and 12415 6th Street | Bridge Point Rancho Cucamonga | Cut-off Date LTV: | | 34.5% |
| Rancho Cucamonga, CA 91730 | | U/W NCF DSCR: | | 2.73x |
| | | U/W NOI Debt Yield: | | 16.2% |
| THE INFORMATION IN THIS STRUCTURAL AND COLLATERAL TERM SHEET IS NOT COMPLETE AND MAY BE AMENDED PRIOR TO THE TIME OF SALE. THIS TERM SHEET IS NOT AN OFFER TO SELL THESE SECURITIES AND IT IS NOT A SOLICITATION OF AN OFFER TO BUY THESE SECURITIES IN ANY JURISDICTION WHERE THE OFFER OR SALE IS NOT PERMITTED. |
| | 29 | |
| No. 1 – Bridge Point Rancho Cucamonga |
| Mortgage Loan Information | | Mortgaged Property Information |
| Mortgage Loan Seller: | Wells Fargo Bank, National Association | | Single Asset/Portfolio: | Single Asset |
| Credit Assessment | BBB+sf/AA-(sf)/Aaa(sf) | | Property Type – Subtype: | Industrial – |
| (Fitch/KBRA/Moody’s): | | | Warehouse/Distribution |
| Original Principal Balance(1): | $65,000,000 | | Location: | Rancho Cucamonga, CA |
| Cut-off Date Balance(1): | $65,000,000 | | Size: | 2,168,119 SF |
| % of Initial Pool Balance: | 9.1% | | Cut-off Date Balance Per SF(4): | $123.43 |
| Loan Purpose: | Refinance | | Maturity Date Balance Per SF(4): | $123.43 |
| Borrower Sponsor: | BDP Realty Holdings, L.P. | | Year Built/Renovated: | 2024 / NAP |
| Guarantor: | NAP | | Title Vesting: | Fee |
| Mortgage Rate: | 5.8331% | | Property Manager: | BDP Services, LLC |
| Note Date: | June 28, 2024 | | Current Occupancy (As of): | 100.0% (6/24/2024) |
| Seasoning: | 1 month | | YE 2023 Occupancy(5): | NAV |
| Maturity Date: | July 11, 2031 | | YE 2022 Occupancy(5): | NAV |
| IO Period: | 84 months | | YE 2021 Occupancy(5): | NAV |
| Loan Term (Original): | 84 months | | As-Is Appraised Value: | $775,900,000 |
| Amortization Term (Original): | NAP | | As-Is Appraised Value Per SF: | $357.87 |
| Loan Amortization Type: | Interest Only | | As-Is Appraisal Valuation Date: | May 6, 2024 |
| Call Protection(2): | L(25),D(52),O(7) | | | |
| Lockbox Type: | Hard / Springing | | Underwriting and Financial Information |
| Additional Debt: | Yes | | TTM NOI(5): | NAV |
| Additional Debt Type (Balance): | Pari Passu / Subordinate Debt | | YE 2023 NOI(5): | NAV |
| | ($202,610,000 / $162,390,000) | | YE 2022 NOI(5): | NAV |
| | | | YE 2021 NOI(5): | NAV |
| | | | U/W Revenues: | $51,204,198 |
| | | | U/W Expenses: | $7,913,376 |
| Escrows and Reserves(3) | | U/W NOI: | $43,290,822 |
| | Initial | Monthly | Cap | | U/W NCF: | $43,269,141 |
| Taxes: | $0 | Springing | NAP | | U/W DSCR based on NOI/NCF(4): | 2.74x/2.73x |
| Insurance: | $0 | Springing | NAP | | U/W Debt Yield based on NOI/NCF(4): | 16.2%/16.2% |
| Existing TI/LC: | $380,631 | $0 | NAP | | U/W Debt Yield at Maturity based on NOI/NCF(4): | 16.2%/16.2% |
| TI/LC Reserve: | $0 | Springing | NAP | | Cut-off Date LTV Ratio(4): | 34.5% |
| | | | | | LTV Ratio at Maturity(4): | 34.5% |
| | | | | | | | |
| Sources and Uses |
| Sources | | | | | Uses | | | |
| Senior Loan(1) | $267,610,000 | | 62.2% | | Loan Payoff | $310,430,271 | | 72.2% |
| Subordinate Companion Loan(1) | 162,390,000 | | 37.8 | | Return of Equity | 113,710,228 | | 26.4 |
| | | | | | Closing Costs | 5,478,870 | | 1.3 |
| | | | | | Upfront Reserves | 380,631 | | 0.1 |
| Total Sources | $430,000,000 | | 100.0% | | Total Uses | $430,000,000 | | 100.0% |
| (1) | The Bridge Point Rancho Cucamonga Mortgage Loan (as defined below) is part of a whole loan evidenced by eight pari passu senior promissory notes and one subordinate companion loan in the aggregate original principal balance of $430,000,000 (the “Bridge Point Rancho Cucamonga Whole Loan”). For additional information, see the “Whole Loan Summary” chart below. |
| (2) | Defeasance of the Bridge Point Rancho Cucamonga Whole Loan is permitted at any time after the date that is the earlier to occur of (i) two years after the closing date of the securitization that includes the last note to be securitized and (ii) August 11, 2027. The assumed defeasance lockout period of 25 payments is based on the anticipated closing date of the WFCM 2024-C63 transaction in August 2024. The actual defeasance lockout period may be longer. |
| (3) | For a full description of Escrows and Reserves, please refer to “Escrows” below. |
| (4) | The Bridge Point Rancho Cucamonga Senior Loan (as defined below) is part of the Bridge Point Rancho Cucamonga Whole Loan with an original aggregate principal balance of $430,000,000. The Cut-off Date Balance Per SF, Maturity Date Balance Per SF, Cut-off Date LTV Ratio, LTV Ratio at Maturity, U/W DSCR based on NOI/NCF, U/W Debt Yield based on NOI/NCF and U/W Debt Yield at Maturity based on NOI/NCF figures presented above are based on the Bridge Point Rancho Cucamonga Senior Loan. The Cut-off Date Balance per SF, Maturity Date Balance per SF, Cut-off Date LTV Ratio, LTV Ratio at Maturity, U/W DSCR based on NOI/NCF, U/W Debt Yield based on NOI/NCF and U/W Debt Yield at Maturity based on NOI/NCF figures based upon the Bridge Point Rancho Cucamonga Whole Loan are $198.33, $198.33, 55.4%, 55.4%, 1.61x / 1.61x and 10.1% / 10.1%, respectively. |
| (5) | Historical financial information is not available because the Bridge Point Rancho Cucamonga Property (as defined below) was built in 2024. |
The Mortgage Loan. The largest mortgage loan (the “Bridge Point Rancho Cucamonga Mortgage Loan”) is part of a whole loan (the “Bridge Point Rancho Cucamonga Whole Loan”) that is evidenced by eight pari passu senior promissory notes in the aggregate original principal balance of $267,610,000 (collectively, the “Bridge Point Rancho Cucamonga Senior Loan”), and one subordinate companion loan in the original principal balance of $162,390,000 (the “Bridge Point Rancho Cucamonga Subordinate Companion Loan”). The Bridge Point Rancho Cucamonga Whole Loan was originated on June 28, 2024, by Wells Fargo Bank, National Association (“WFB”). The
| THE INFORMATION IN THIS STRUCTURAL AND COLLATERAL TERM SHEET IS NOT COMPLETE AND MAY BE AMENDED PRIOR TO THE TIME OF SALE. THIS TERM SHEET IS NOT AN OFFER TO SELL THESE SECURITIES AND IT IS NOT A SOLICITATION OF AN OFFER TO BUY THESE SECURITIES IN ANY JURISDICTION WHERE THE OFFER OR SALE IS NOT PERMITTED. |
| | 30 | |
| Industrial – Warehouse/Distribution | Loan #1 | Cut-off Date Balance: | | $65,000,000 |
| 12430 4th Street and 12415 6th Street | Bridge Point Rancho Cucamonga | Cut-off Date LTV: | | 34.5% |
| Rancho Cucamonga, CA 91730 | | U/W NCF DSCR: | | 2.73x |
| | | U/W NOI Debt Yield: | | 16.2% |
Bridge Point Rancho Cucamonga Whole Loan is secured by the borrower’s fee interest in two industrial warehouse/distribution facilities in Rancho Cucamonga, California totaling 2,168,119 square feet (the “Bridge Point Rancho Cucamonga Property”). The non-controlling Note A-2-1 with a balance of $65,000,000, will be included in the WFCM 2024-C63 securitization trust. The Bridge Point Rancho Cucamonga Whole Loan will be serviced pursuant to the trust and servicing agreement for the WFCM 2024-BPRC securitization trust. See “Description of the Mortgage Pool—The Whole Loans—The Non-Serviced AB Whole Loan” and “Pooling and Servicing Agreement—Servicing of the Non-Serviced Mortgage Loans” in the Preliminary Prospectus.
Whole Loan Summary
| Notes | Original Balance | Cut-off Date Balance | Note Holder | Controlling Piece |
| A-1 | $1,000,000 | $1,000,000 | WFCM 2024-BPRC | No |
| A-2-1 | 65,000,000 | 65,000,000 | WFCM 2024-C63 | No |
| A-2-2(1) | 10,000,000 | 10,000,000 | Wells Fargo Bank, National Association | No |
| A-3 | 50,000,000 | 50,000,000 | BBCMS 2024-C28(2) | No |
| A-4(1) | 50,000,000 | 50,000,000 | Wells Fargo Bank, National Association | No |
| A-5(1) | 40,000,000 | 40,000,000 | Wells Fargo Bank, National Association | No |
| A-6 | 30,000,000 | 30,000,000 | BBCMS 2024-C28(2) | No |
| A-7(1) | 21,610,000 | 21,610,000 | Wells Fargo Bank, National Association | No |
| Total Senior Notes | $267,610,000 | $267,610,000 | | |
| B-1 | 162,390,000 | 162,390,000 | WFCM 2024-BPRC | Yes |
| Total Whole Loan | $430,000,000 | $430,000,000 | | |
| (1) | Expected to be contributed to one or more future securitization trust(s). |
| (2) | The BBCMS 2024-C28 securitization is expected to close on or about August 29, 2024. |
The Borrower and Borrower Sponsor. The borrowing entity for the Bridge Point Rancho Cucamonga Whole Loan is Bridge Point Rancho Cucamonga, a Delaware limited liability company, a single purpose entity with two independent directors. Legal counsel to the borrower delivered a non-consolidation opinion in connection with the origination of the Bridge Point Rancho Cucamonga Whole Loan. The Bridge Point Rancho Cucamonga Whole Loan documents provide that only the single purpose borrower is liable for the enumerated losses carve-out and springing recourse events (there is no separate carve-out guarantor).
The borrower sponsor is BDP Realty Holdings, L.P., a Delaware limited partnership, which is the owner of affiliates of Bridge Industrial, Teacher Retirement System of Texas and Banner Oak Capital Partners.
Bridge Industrial (“Bridge”) is a privately owned, vertically integrated real estate operating company and investment manager firm founded in 2000. Bridge’s strategic focus is on the development of Class A industrial properties for long-term ownership and cash flow, as well as on acquiring existing infill industrial properties to create value through leasing, redevelopment, and capital improvements. Bridge focuses on supply-constrained core infill industrial markets in the U.S. and U.K. Since inception, Bridge has successfully acquired and developed approximately 74 million square feet of industrial buildings/projects valued at approximately $15.8 billion. In California, Bridge has collectively developed more than 9.5 million square feet since 2015.
Teacher Retirement System of Texas (“TRS”) is a public pension plan of the State of Texas. Established in 1937, TRS provides retirement and related benefits for those employed by the public schools, colleges, and universities supported by the State of Texas and manages a $186.6 billion trust fund, as of August 31, 2023, established to finance member benefits. Two million public education and higher education employees and retirees participate in the system. TRS is the largest public retirement system in Texas in both membership and assets.
Banner Oak Capital Partners (“BOCP”) is a real estate investment manager focused on creating value through long-term relationships with skilled and experienced operating partners. BOCP partners with early to mid-stage real estate companies to facilitate the formation or growth of the platform through growth capital for operations, GP co-investment and LP co-investment capital for real assets. BOCP targets experienced entrepreneurial investment teams with a clear strategy who are focused on a specific property type in targeted markets. BOCP has a strong track-record of supporting the growth of its partner's platforms having invested over $1 billion of equity to capitalize investment opportunities alongside its partners.
The Property. The Bridge Point Rancho Cucamonga Property is a recently constructed Class A industrial warehouse/distribution facility containing 2,168,119 square feet of space located in Rancho Cucamonga, San Bernardino County, California. Situated on 85.04 acres, the Bridge Point Rancho Cucamonga Property features two single-story buildings constructed in 2024 with 754 parking spaces (resulting in a ratio of approximately 0.35 spaces per 1,000 square feet of net rentable area). The Bridge Point Rancho Cucamonga Property has two NNN leases to Chedraui USA and CEVA Logistics, each with 4.0% annual contractual rent increases and lease expirations in January 2044 and April 2034, respectively.
Building 1 consists of 1,422,524 square feet and is 100.0% leased to Chedraui USA. The building has 40’ clear heights, 18,783 square feet (1.3%) of office build-out, 184 dock high doors and 480 parking spaces with an overall ratio of 0.34 spaces per 1,000 square feet. Chedraui USA has substantially built out its space, inclusive of approximately 544,000 square feet of cold storage comprising 38% of the net rentable area.
Building 2 consists of 745,595 square feet and is 100.0% leased to CEVA Logistics. Building 2 has 40’ clear heights, 17,110 square feet (2.3%) of office build-out, 91 dock high doors and 274 parking spaces with an overall ratio of 0.37 spaces per 1,000 square feet.
| THE INFORMATION IN THIS STRUCTURAL AND COLLATERAL TERM SHEET IS NOT COMPLETE AND MAY BE AMENDED PRIOR TO THE TIME OF SALE. THIS TERM SHEET IS NOT AN OFFER TO SELL THESE SECURITIES AND IT IS NOT A SOLICITATION OF AN OFFER TO BUY THESE SECURITIES IN ANY JURISDICTION WHERE THE OFFER OR SALE IS NOT PERMITTED. |
| | 31 | |
| Industrial – Warehouse/Distribution | Loan #1 | Cut-off Date Balance: | | $65,000,000 |
| 12430 4th Street and 12415 6th Street | Bridge Point Rancho Cucamonga | Cut-off Date LTV: | | 34.5% |
| Rancho Cucamonga, CA 91730 | | U/W NCF DSCR: | | 2.73x |
| | | U/W NOI Debt Yield: | | 16.2% |
The Bridge Point Rancho Cucamonga Property opened in 2024. Redevelopment was approved subject to the terms of a development agreement with the City of Rancho Cucamonga, CA that, among other things, required the Bridge Point Rancho Cucamonga Property to be operated as a “non-sort” (or primarily automation-reliant) fulfillment center.
Major Tenants. Chedraui USA (1,422,524 square feet; 65.6% of NRA; 63.7% of underwritten base rent): Chedraui USA is a subsidiary of Grupo Comercial Chedraui, a publicly traded company and one of Mexico’s leading retail operators. Chedraui USA is a grocery retailer with 378 stores across California, Arizona, Nevada, New Mexico and Texas. Chedraui USA banners include El Super, Fiesta Mart and Smart & Final. Chedraui USA employs more than 24,000 associates and support their stores through seven distribution centers. As of Q4 2023, nearly 60% of consolidated revenues for Grupo Comercial Chedraui come from United States operations, with the remainder from operations in Mexico. Chedraui USA executed a 20-year lease at the Bridge Point Rancho Cucamonga Property in February 2024 with an expiration date of January 31, 2044. The lease is structured as triple net with a current base rent of $17.52 per square foot and 4.0% annual rent increases. Chedraui USA has two, five-year renewal options remaining and no termination options.
CEVA Logistics (745,595 square feet; 34.4% of NRA; 36.3% of underwritten base rent): CEVA Logistics is a global logistics and supply chain company headquartered in Marseille, France. With operations spanning across more than 170 countries, CEVA Logistics provides end-to-end logistics services to industries such as automotive, consumer and retail, healthcare and e-commerce. The company reported revenue of $74.5 billion in 2022. CEVA Logistics is ultimately fully-owned by CMA CGM, a global shipping group that is one of the largest shipping/freight providers in the world. CMA CGM acquired CEVA Logistics in 2019. CEVA Logistics executed a 10.3-year lease at the Bridge Point Rancho Cucamonga Property in January 2024 with an expiration date of April 30, 2034. The lease is structured as triple net with a current base rent of $19.08 per square foot and 4.0% annual rent increases. CEVA Logistics has two, five-year renewal options remaining and a one-time termination option on April 30, 2029 with a 12-15 month notice period. If such option is exercised, CEVA Logistics is subject to a termination fee equal to the sum of 12 months of base rent, 12 months of estimated operating expenses, certain restoration costs and unamortized costs related to TI/LC and free rent, all of which would be collected by the lender.
The following table presents certain information relating to the tenancy at the Bridge Point Rancho Cucamonga Property:
Major Tenants(1)
| Tenant Name (Property) | Credit Rating (Fitch/ Moody’s/
S&P) | Tenant NRSF | % of
NRSF | Annual U/W Base Rent PSF | Annual
U/W Base Rent | % of Total Annual U/W Base Rent | Lease
Expiration
Date | Extension Options | Termination Option (Y/N) |
| Major Tenants | | | | | | | | |
| Chedraui USA | NR/NR/NR | 1,422,524 | 65.6% | $18.22 | $25,919,520 | 63.7% | 1/31/2044 | 2, 5-year | N |
| CEVA Logistics(2) | NR/NR/NR | 745,595 | 34.4% | $19.84 | $14,794,992 | 36.3% | 4/30/2034 | 2, 5-year | Y |
| Occupied Collateral Total | 2,168,119 | 100.0% | $18.78 | $40,714,512 | 100.0% | | | |
| | | | | | | | | |
| Vacant Space | 0 | 0.0% | | | | | | |
| | | | | | | | | |
| Collateral Total | 2,168,119 | 100.0% | | | | | | |
| | | | | | | | | | |
| (1) | Based on the underwritten rent roll dated June 24, 2024 inclusive of rent steps through June 2025. |
| (2) | CEVA Logistics has a one-time termination option on April 30, 2029 with a 12-15 month notice period. If such option is exercised, the tenant will be subject to a termination fee equal to the sum of 12 months of base rent, 12 months of operating expenses, certain restoration costs and unamortized costs related to TI/LC and free rent, all of which would be collected by the lender. |
| THE INFORMATION IN THIS STRUCTURAL AND COLLATERAL TERM SHEET IS NOT COMPLETE AND MAY BE AMENDED PRIOR TO THE TIME OF SALE. THIS TERM SHEET IS NOT AN OFFER TO SELL THESE SECURITIES AND IT IS NOT A SOLICITATION OF AN OFFER TO BUY THESE SECURITIES IN ANY JURISDICTION WHERE THE OFFER OR SALE IS NOT PERMITTED. |
| | 32 | |
| Industrial – Warehouse/Distribution | Loan #1 | Cut-off Date Balance: | | $65,000,000 |
| 12430 4th Street and 12415 6th Street | Bridge Point Rancho Cucamonga | Cut-off Date LTV: | | 34.5% |
| Rancho Cucamonga, CA 91730 | | U/W NCF DSCR: | | 2.73x |
| | | U/W NOI Debt Yield: | | 16.2% |
The following table presents certain information relating to the lease rollover schedule at the Bridge Point Rancho Cucamonga Property:
Lease Expiration Schedule(1)(2)
Year Ending
December 31, | No. of Leases Expiring | Expiring NRSF | % of Total NRSF | Cumulative Expiring NRSF | Cumulative % of Total NRSF | Annual
U/W
Base Rent | % of Total Annual U/W Base Rent | Annual
U/W
Base Rent
PSF |
| MTM | 0 | 0 | 0.0% | 0 | 0.0% | $0 | 0.0% | $0.00 |
| 2024 | 0 | 0 | 0.0% | 0 | 0.0% | $0 | 0.0% | $0.00 |
| 2025 | 0 | 0 | 0.0% | 0 | 0.0% | $0 | 0.0% | $0.00 |
| 2026 | 0 | 0 | 0.0% | 0 | 0.0% | $0 | 0.0% | $0.00 |
| 2027 | 0 | 0 | 0.0% | 0 | 0.0% | $0 | 0.0% | $0.00 |
| 2028 | 0 | 0 | 0.0% | 0 | 0.0% | $0 | 0.0% | $0.00 |
| 2029 | 0 | 0 | 0.0% | 0 | 0.0% | $0 | 0.0% | $0.00 |
| 2030 | 0 | 0 | 0.0% | 0 | 0.0% | $0 | 0.0% | $0.00 |
| 2031 | 0 | 0 | 0.0% | 0 | 0.0% | $0 | 0.0% | $0.00 |
| 2032 | 0 | 0 | 0.0% | 0 | 0.0% | $0 | 0.0% | $0.00 |
| 2033 | 0 | 0 | 0.0% | 0 | 0.0% | $0 | 0.0% | $0.00 |
| 2034 | 1 | 745,595 | 34.4% | 745,595 | 34.4% | $14,794,992 | 36.3% | $19.84 |
| Thereafter | 1 | 1,422,524 | 65.6% | 2,168,119 | 100.0% | $25,919,520 | 63.7% | $18.22 |
| Vacant | 0 | 0 | 0.0% | 2,168,119 | 100.0% | $0 | 0.0% | $0.00 |
| Total/Weighted Average | 2 | 2,168,119 | 100.0% | | | $40,714,512 | 100.0% | $18.78 |
| (1) | Based on the underwritten rent roll dated June 24, 2024 inclusive of rent steps through June 2025. |
| (2) | Certain tenants may have termination or contraction options (which may become exercisable prior to the originally stated expiration date of the tenant lease) that are not considered in the above Lease Rollover Schedule. |
The following table presents historical occupancy percentages at the Bridge Point Rancho Cucamonga Property:
Historical Occupancy
12/31/2021(1) | 12/31/2022(1) | 12/31/2023(1) | 6/24/2024(2) |
| NAV | NAV | NAV | 100.0% |
| (1) | Historical occupancy is not available as the borrower sponsor constructed the Bridge Point Rancho Cucamonga Property in 2024. |
| (2) | Current Occupancy is based on the underwritten rent roll dated June 24, 2024. |
| THE INFORMATION IN THIS STRUCTURAL AND COLLATERAL TERM SHEET IS NOT COMPLETE AND MAY BE AMENDED PRIOR TO THE TIME OF SALE. THIS TERM SHEET IS NOT AN OFFER TO SELL THESE SECURITIES AND IT IS NOT A SOLICITATION OF AN OFFER TO BUY THESE SECURITIES IN ANY JURISDICTION WHERE THE OFFER OR SALE IS NOT PERMITTED. |
| | 33 | |
| Industrial – Warehouse/Distribution | Loan #1 | Cut-off Date Balance: | | $65,000,000 |
| 12430 4th Street and 12415 6th Street | Bridge Point Rancho Cucamonga | Cut-off Date LTV: | | 34.5% |
| Rancho Cucamonga, CA 91730 | | U/W NCF DSCR: | | 2.73x |
| | | U/W NOI Debt Yield: | | 16.2% |
Underwritten Net Cash Flow. The following table presents certain information relating to the underwritten net cash flow at the Bridge Point Rancho Cucamonga Property:
Cash Flow Analysis(1)
| | U/W | %(2) | U/W $ per SF |
| Rents in Place | $39,148,573 | 76.5% | $18.06 |
| Rent Steps(3) | 1,565,939 | 3.1 | 0.72 |
| Rent Average Benefit(4) | 2,576,310 | 5.0 | 1.19 |
| Gross Potential Rent | $43,290,822 | 84.5% | $19.97 |
| Total Reimbursements | 7,913,376 | 15.5 | 3.65 |
| Other Income | 0 | 0.0 | 0.00 |
| Net Rental Income | $51,204,198 | 100.0% | $23.62 |
| (Vacancy & Credit Loss) | 0 | 0.0 | 0 |
| Effective Gross Income | $51,204,198 | 100.0% | $23.62 |
| | | | |
| Total Operating Expenses(5) | $7,913,376 | 15.5% | $3.65 |
| | | | |
| Net Operating Income | $43,290,822 | 84.5% | $19.97 |
| Replacement Reserves | 21,681 | 0.0 | 0.01 |
| Net Cash Flow | $43,269,141 | 84.5% | $19.96 |
| | | | |
| NOI DSCR Senior/Whole Loan | 2.74x/1.61x | | |
| NCF DSCR Senior/Whole Loan | 2.73x/1.61x | | |
| NOI Debt Yield Senior/Whole Loan | 16.2%/10.1% | | |
| NCF Debt Yield Senior/Whole Loan | 16.2%/10.1% | | |
| (1) | Historical cash flow is not available as the borrower sponsor constructed the Bridge Point Rancho Cucamonga Property in 2024. |
| (2) | % column represents percent of Net Rental Income for all revenue lines and represents percent of Effective Gross Income for the remainder of fields. |
| (3) | Rent steps were taken through June 2025. |
| (4) | Straight-line average rent credit was taken for Chedraui USA through the loan term as the parent (Grupo Comercial Chedraui) has a Fitch long term credit rating in Mexico of AA+. |
| (5) | In connection with the obtaining the approvals required for redevelopment of the Bridge Point Rancho Cucamonga Property, the borrower entered into a development agreement with the City of Rancho Cucamonga, CA that, among other things, requires payment of various impact-related fees, as follows: (i) $1,500,000 in total on April 3, 2027, and (ii) $3,500,000 in total on April 3, 2029. These fees are contractual in nature, and, unlike property taxes, would not have lien priority over a prior recorded mortgage for any unpaid amounts. These fees were excluded from loan underwriting. |
Appraisal. The appraiser concluded to an “As-is” value for the Bridge Point Rancho Cucamonga Property of $775,900,000 as of May 6, 2024.
Environmental Matters. The Phase I environmental site assessments dated May 28, 2024, there was no evidence of any recognized environmental conditions at the Bridge Point Rancho Cucamonga Property.
Market Overview and Competition. The Bridge Point Rancho Cucamonga Property is located within Rancho Cucamonga in San Bernardino County, California and forms part of the Riverside-San Bernardino-Ontario metro area (the “Riverside MSA”). Major employers in the Riverside MSA include Stater Brothers Markets, Arrowhead Regional Medical Center, U.S. Marine Corps. Air Ground Combat Center, Fort Irwin and Walmart Inc. San Bernardino County is part of the Riverside MSA, in a region known as the Inland Empire. The Inland Empire stands as a critical logistics and industrial hub in the region. Its proximity to the major ports of Los Angeles and Long Beach, coupled with extensive transportation infrastructure, including freeways, rail systems and airports, makes it a strategic base for warehousing and distribution operations.
The Bridge Point Rancho Cucamonga Property has local and regional access as it is one-half mile east of the 15 Freeway. The Bridge Point Rancho Cucamonga Property is also less than one mile north of the 10 Freeway. According to appraisal report, the estimated 2023 population within a one and one half, three- and five-mile radius of the Bridge Point Rancho Cucamonga Property was 4,118, 66,757 and 274,707, respectively. Additionally, for the same period, the average household income within the same radii was $88,946, $117,383 and $116,639, respectively.
According to the appraisal, the Bridge Point Rancho Cucamonga Property is located in the Inland Empire Industrial market within the Airport Area industrial submarket. According to the appraisal, the Airport Area industrial submarket has an inventory of approximately 242.1 million square feet and a vacancy rate of 6.6% as of the first quarter of 2024. The overall rental rate in the submarket for
| THE INFORMATION IN THIS STRUCTURAL AND COLLATERAL TERM SHEET IS NOT COMPLETE AND MAY BE AMENDED PRIOR TO THE TIME OF SALE. THIS TERM SHEET IS NOT AN OFFER TO SELL THESE SECURITIES AND IT IS NOT A SOLICITATION OF AN OFFER TO BUY THESE SECURITIES IN ANY JURISDICTION WHERE THE OFFER OR SALE IS NOT PERMITTED. |
| | 34 | |
| Industrial – Warehouse/Distribution | Loan #1 | Cut-off Date Balance: | | $65,000,000 |
| 12430 4th Street and 12415 6th Street | Bridge Point Rancho Cucamonga | Cut-off Date LTV: | | 34.5% |
| Rancho Cucamonga, CA 91730 | | U/W NCF DSCR: | | 2.73x |
| | | U/W NOI Debt Yield: | | 16.2% |
industrial space is $16.78 per square foot. The appraiser concluded a market rent of $17.52 and $19.08 per square foot for warehouse space at the Bridge Point Rancho Cucamonga Property.
The following table presents certain information relating to comparable industrial leases related to the Bridge Point Rancho Cucamonga Property (Market Rent for Building 1):
Comparable Industrial Leases(1)
| Property Name/Location | Year Built/ Renovated | Total GLA (SF) | Occupancy | Tenant | Clear Height | Tenant Size (SF) | Lease Start Date | Lease Term | Annual Base Rent PSF |
Bridge Point Rancho
Cucamonga
Rancho Cucamonga, CA | 2024/NAP | 2,168,119(2) | 100.0%(2) | Chedraui USA | 40' | 1,422,524(2) | Feb-24(2) | 20.0 Yrs. (2) | $17.52(2) |
Sierra Business Park Fontana, CA | 2006/NAP | 1,101,840 | 100.0% | Francisco Street, LP | 32' | 1,101,840 | Jan-23 | 2.0 Yrs. | $16.56 |
Link - Space Center Jurupa Valley, CA | 2023/NAP | 1,379,287 | 100.0% | Constellation Brands | 40' | 1,379,287 | Dec-23 | 10.1 Yrs. | $16.44 |
Agua Mansa Commerce Park Jurupa Valley, CA | 2023/NAP | 1,025,132 | 100.0% | Amazon | 40' | 1,025,132 | Mar-24 | 10.0 Yrs. | $16.20 |
Citrus Commerce Center Fontana, CA | 2017/NAP | 1,003,592 | 100.0% | YQK/Elogistek/eFullfill Inc | 36' | 1,003,592 | Feb-24 | 7.3 Yrs. | $15.84 |
4121 Coyote Canyon Fontana, CA | 2024/NAP | 1,171,788 | 100.0% | Amazon | 40' | 1,171,788 | May-24 | 10.0 Yrs. | $15.60 |
| (1) | Information obtained from the appraisal unless otherwise indicated. |
| (2) | Based on the underwritten rent roll dated June 24, 2024. |
The following table presents certain information relating to comparable industrial leases related to the Bridge Point Rancho Cucamonga Property (Market Rent for Building 2):
Comparable Industrial Leases(1)
| Property Name/Location | Year Built/ Renovated | Total GLA (SF) | Occupancy | Tenant | Clear Height | Tenant Size (SF) | Lease Start Date | Lease Term | Annual Base Rent PSF |
Bridge Point Rancho
Cucamonga
Rancho Cucamonga, CA | 2024/NAP | 2,168,119(2) | 100.0%(2) | CEVA Logistics | 40' | 745,595(2) | Jan-24(2) | 10.3 Yrs. (2) | $19.08(2) |
AMB Galleano Distribution
Center Jurupa Valley, CA | 2007/NAP | 645,311 | 100.0% | Maersk Warehousing & Distribution Services USA LLC | 32' | 645,311 | Jun-23 | 5.0 Yrs. | $19.80 |
| 17335 Glen Helen Parkway San Bernardino, CA | 2012/NAP | 604,029 | 100.0% | Hautelook | 32' | 604,029 | Jan-23 | 5.0 Yrs. | $17.88 |
Empire Gateway Chino, CA | 2014/NAP | 779,052 | 100.0% | SharkNinja | 32' | 779,052 | Jan-24 | 7.4 Yrs. | $17.40 |
Prologis Moreno Valley
Logistics Center Moreno
Valley, CA | 2017/NAP | 601,810 | 100.0% | Harbor Freight Tools | 36' | 601,810 | Sep-23 | 5.0 Yrs. | $16.20 |
Nandina Distribution
Center Moreno Valley, CA | 2018/NAP | 739,903 | 100.0% | DMSI | 36' | 739,903 | Nov-23 | 5.0 Yrs. | $14.16 |
| (1) | Information obtained from the appraisal unless otherwise indicated. |
| (2) | Based on the underwritten rent roll dated June 24, 2024. |
| THE INFORMATION IN THIS STRUCTURAL AND COLLATERAL TERM SHEET IS NOT COMPLETE AND MAY BE AMENDED PRIOR TO THE TIME OF SALE. THIS TERM SHEET IS NOT AN OFFER TO SELL THESE SECURITIES AND IT IS NOT A SOLICITATION OF AN OFFER TO BUY THESE SECURITIES IN ANY JURISDICTION WHERE THE OFFER OR SALE IS NOT PERMITTED. |
| | 35 | |
| Industrial – Warehouse/Distribution | Loan #1 | Cut-off Date Balance: | | $65,000,000 |
| 12430 4th Street and 12415 6th Street | Bridge Point Rancho Cucamonga | Cut-off Date LTV: | | 34.5% |
| Rancho Cucamonga, CA 91730 | | U/W NCF DSCR: | | 2.73x |
| | | U/W NOI Debt Yield: | | 16.2% |
The table below presents certain information relating to comparable sales, which pertain to all of the Bridge Point Rancho Cucamonga Property identified by the appraiser:
Comparable Sales(1)
| Property Name | Location | Rentable Area (SF) | Year Built/ Renovated | Occupancy | Sale Date | Sale Price | Sale Price (PSF) | Cap Rate |
Bridge Point Rancho
Cucamonga | Rancho
Cucamonga, CA | 2,168,119(2) | 2024 / NAP | 100.0%(2) | | | | |
| Sierra Business Park | Fontana, CA | 1,101,840 | 2006 / NAP | 100.0% | Jan-23 | $365,000,000 | $331.26 | 5.00% |
| QVC Fulfillment Center | Ontario, CA | 1,061,735 | 2016 / NAP | 100.0% | Jun-22 | $334,000,000 | $314.58 | N/A |
| 3100 Milliken Avenue | Eastvale, CA | 760,829 | 2001 / 2021 | 100.0% | Nov-22 | $220,000,000 | $289.16 | N/A |
| SRG Perris Logistics Center | Perris, CA | 579,708 | 2014 / NAP | 100.0% | Aug-22 | $158,000,000 | $272.55 | 2.24% |
| 400 East Ellis Avenue | Perris, CA | 799,522 | 2024 / NAP | 100.0% | Dec-23 | $183,866,500 | $229.97 | 5.10% |
| Beaumont Logistics Center | Beaumont, CA | 600,000 | 2013 / NAP | 100.0% | May-22 | $131,000,000 | $218.33 | 3.85% |
| (1) | Information obtained from the appraisal unless otherwise indicated. |
| (2) | Based on the underwritten rent roll dated June 24, 2024. |
Escrows.
Real Estate Taxes – On a monthly basis, during a Cash Trap Event Period (as defined below), the borrower is required to escrow 1/12th of the property taxes that the lender estimates will be payable over the next-ensuing 12-month period (initially estimated to be approximately $345,782). If at any time during the continuance of a Cash Trap Event Period, the lender reasonably determines that the tax reserve funds will not be sufficient to pay the taxes, the lender will notify the borrower of such determination and the monthly deposits for taxes will be increased by the amount that the lender reasonably estimates is sufficient to make up the deficiency at least 10 days prior to the delinquency date for taxes.
Insurance – On a monthly basis, during a Cash Trap Event Period, the borrower is required to deposit into an insurance reserve, 1/12th of the amount that will be sufficient to pay the insurance premiums due for the renewal of coverage afforded by such policies (initially estimated to be approximately $178,992). Monthly payments are only waived so long as no event of default has occurred and a blanket policy is in place.
Leasing Reserve – On a monthly basis, during a Cash Trap Event Period, the borrower is required to escrow $90,338 for tenant improvements and leasing commissions.
Existing TI/LC – At origination, the borrower deposited $380,631 into escrow for existing TI/LC.
Lockbox and Cash Management. The Bridge Point Rancho Cucamonga Whole Loan is structured with a hard lockbox and springing cash management upon the occurrence and continuance of a Cash Trap Event Period. Revenues from the Bridge Point Rancho Cucamonga Property are required to be deposited directly into the lockbox account or, if received by the borrower or the property manager, as applicable, deposited within two business days of receipt. During the continuance of a Cash Trap Event Period, all funds in the lockbox account are required to be swept each business day to a lender-controlled cash management account and disbursed in accordance with the Bridge Point Rancho Cucamonga Whole Loan documents, and all excess funds on deposit in the cash management account (after payment of required monthly reserve deposits, debt service payment on the Bridge Point Rancho Cucamonga Whole Loan, operating expenses and cash management bank fees) will be applied as follows, so long as no event of default has occurred and is continuing, (i) first, for the tax escrow deposit, (ii) second, for the insurance escrow deposit, (iii) third, for payment the monthly fees of the cash management bank, (iv) fourth, to pay the approved operating expenses and extraordinary expenses, (v) fifth, to pay the debt service, and any other amounts due under the Bridge Point Rancho Cucamonga Whole Loan documents, (vi) sixth, for the leasing reserve deposit, (vii) seventh, to pay any interest accruing at the default rate and late payment charges, and (viii) eighth, all amounts remaining in the cash management account after deposits for items (i) through (vii) above (“Excess Cash Flow”) are required to be deposited into the excess cash flow subaccount (the “Excess Cash Flow Subaccount”) to be disbursed to the lender and held as collateral in the excess cash flow reserve. To the extent no event of default has occurred and is continuing, upon the written request of the borrower, the lender must, or must cause the servicer to, disburse to the borrower, Excess Cash Flow from the Excess Cash Flow Subaccount no more than once per month, to the extent available, for the payment of (i) debt service, to the extent not paid in accordance with the Bridge Point Rancho Cucamonga Whole Loan documents, (ii) emergency repairs and/or life safety issues, including any capital expenditures related to the same, at the Bridge Point Rancho Cucamonga Property, (iii) required REIT distributions, not to exceed $250,000 in any calendar year, (iv) payment of shortfalls in the required deposits into the reserve funds, (v) payment of tenant improvement costs, tenant allowances, tenant relocation costs, tenant reimbursements, tenant inducement payments and leasing commission obligations or other expenditures required under leases, (vi) shortfalls in actual operating expenses that were not in the annual budget, but which have been reasonably approved by the lender and not paid in accordance with the operating expenses paid pursuant to the cash management agreement, and (vii) such other items as reasonably approved by the lender.
A “Cash Trap Event Period” means a period commencing upon the earlier of (i) the occurrence of an event of default, (ii) the debt service coverage ratio (the “DSCR”) for one calendar quarter being less than 1.15x (IO) or (iii) the occurrence of a Material Tenant Trigger Event (as defined below), which such Cash Trap Event Period will expire with regard to any Cash Trap Event Period commenced in connection with (x) clause (i) above, upon the cure of such event of default, (y) clause (ii) above, upon the earlier to occur of (A)
| THE INFORMATION IN THIS STRUCTURAL AND COLLATERAL TERM SHEET IS NOT COMPLETE AND MAY BE AMENDED PRIOR TO THE TIME OF SALE. THIS TERM SHEET IS NOT AN OFFER TO SELL THESE SECURITIES AND IT IS NOT A SOLICITATION OF AN OFFER TO BUY THESE SECURITIES IN ANY JURISDICTION WHERE THE OFFER OR SALE IS NOT PERMITTED. |
| | 36 | |
| Industrial – Warehouse/Distribution | Loan #1 | Cut-off Date Balance: | | $65,000,000 |
| 12430 4th Street and 12415 6th Street | Bridge Point Rancho Cucamonga | Cut-off Date LTV: | | 34.5% |
| Rancho Cucamonga, CA 91730 | | U/W NCF DSCR: | | 2.73x |
| | | U/W NOI Debt Yield: | | 16.2% |
the DSCR being equal to or greater than 1.15x (IO) for one calendar quarter or (B) the borrower has deposited cash collateral with the lender or delivered to the lender a letter of credit in an amount which, if, applied to reduce the principal balance of the Bridge Point Rancho Cucamonga Whole Loan, would result in a DSCR equal to or greater than 1.15x (IO), or (z) clause (iii) above, upon the occurrence of a Material Tenant Trigger Cure (as defined below).
A “Material Tenant Trigger Event” means the occurrence of (a) a monetary or material non-monetary default beyond any notice and cure period by either Chedraui USA or CEVA Logistics (each, a “Material Tenant”) under its respective lease that continues for more than 15 days, (b) any Material Tenant providing written notice of its intent to terminate its lease, (c) any Material Tenant has vacated or has ceased operating its business in all or substantially all of its respective space other than temporarily vacating or not operating due to any government mandates or due to damage, alterations or renovations, in accordance with its lease, or (d) the occurrence of certain bankruptcy actions related to any Material Tenant.
A “Material Tenant Trigger Cure” means with respect to the Material Tenant Trigger Event the earlier of (a)(i) clause (b) above, the Material Tenant has revoked or rescinded all termination or cancellation notices with respect to its lease and has re-affirmed its lease in writing, (ii) clause (c) above, the Material Tenant is in actual, physical possession of all or substantially all of the space under its lease, actively using the premises for business purposes and is no longer “dark”, (iii) clause (d) above, the Material Tenant has assumed its lease in the bankruptcy proceeding and such assumption has been approved pursuant to a final, non-appealable order of the court, or (b)(i) the borrower has leased all or substantially all of the space to a replacement tenant among other conditions in accordance to the Bridge Point Rancho Cucamonga Whole Loan documents.
Property Management. The Bridge Point Rancho Cucamonga Property is managed by BDP Services, LLC, an affiliate of the borrower sponsor.
Permitted Future Mezzanine Debt. Not Permitted.
Partial Release. Not Permitted.
Real Estate Substitution. Not permitted.
Subordinate and Mezzanine Indebtedness. The Bridge Point Rancho Cucamonga Property secures the Bridge Point Rancho Cucamonga Senior Loan, which has an aggregate Cut-off Date principal balance of $267,610,000 and the Bridge Point Rancho Cucamonga Subordinate Companion Loan, which has a Cut-off Date principal balance of $162,390,000. The Bridge Point Rancho Cucamonga Senior Loan and the Bridge Point Rancho Cucamonga Subordinate Companion Loan are coterminous. The Bridge Point Rancho Cucamonga Subordinate Companion Loan is componentized and accrues interest at the weighted average rate of the components. The Bridge Point Rancho Cucamonga Senior Loan is senior in right of payment to the Bridge Point Rancho Cucamonga Subordinate Companion Loan. The holders of the Bridge Point Rancho Cucamonga Senior Loan and the Bridge Point Rancho Cucamonga Subordinate Companion Loan have entered into a co-lender agreement that sets forth the allocation of collections on the Bridge Point Rancho Cucamonga Whole Loan. See “Description of the Mortgage Pool—The Whole Loans—The Non-Serviced AB Whole Loan—The Bridge Point Rancho Cucamonga Pari Passu AB Whole Loan” in the Preliminary Prospectus.
Ground Lease. None.
Terrorism Insurance. The loan documents require that the “all risk” insurance policy required to be maintained by the borrower provides coverage for terrorism in an amount equal to the full replacement cost of the property, as well as business interruption insurance covering no less than the 24-month period following the occurrence of a casualty event, together with a 365 day extended period of indemnity (provided that if TRIPRA or a similar statute is not in effect, the borrower will not be obligated to pay terrorism insurance premiums in excess of two times the annual premium for the property and business interruption/rental loss insurance coverage). See “Risk Factors—Risks Relating to the Mortgage Loans—Terrorism Insurance May Not Be Available for All Mortgaged Properties” in the prospectus.
| THE INFORMATION IN THIS STRUCTURAL AND COLLATERAL TERM SHEET IS NOT COMPLETE AND MAY BE AMENDED PRIOR TO THE TIME OF SALE. THIS TERM SHEET IS NOT AN OFFER TO SELL THESE SECURITIES AND IT IS NOT A SOLICITATION OF AN OFFER TO BUY THESE SECURITIES IN ANY JURISDICTION WHERE THE OFFER OR SALE IS NOT PERMITTED. |
| | 37 | |
| Retail – Super Regional Mall | Loan #2 | Cut-off Date Balance: | | $60,000,000 |
| 3000 Grapevine Mills Parkway | Grapevine Mills | Cut-off Date LTV: | | 45.6% |
| and 2501 Bass Pro Drive | | U/W NCF DSCR: | | 2.68x |
| Grapevine, TX 76051 | | U/W NOI Debt Yield: | | 18.0% |
| THE INFORMATION IN THIS STRUCTURAL AND COLLATERAL TERM SHEET IS NOT COMPLETE AND MAY BE AMENDED PRIOR TO THE TIME OF SALE. THIS TERM SHEET IS NOT AN OFFER TO SELL THESE SECURITIES AND IT IS NOT A SOLICITATION OF AN OFFER TO BUY THESE SECURITIES IN ANY JURISDICTION WHERE THE OFFER OR SALE IS NOT PERMITTED. |
| | 38 | |
| Retail – Super Regional Mall | Loan #2 | Cut-off Date Balance: | | $60,000,000 |
| 3000 Grapevine Mills Parkway | Grapevine Mills | Cut-off Date LTV: | | 45.6% |
| and 2501 Bass Pro Drive | | U/W NCF DSCR: | | 2.68x |
| Grapevine, TX 76051 | | U/W NOI Debt Yield: | | 18.0% |

| THE INFORMATION IN THIS STRUCTURAL AND COLLATERAL TERM SHEET IS NOT COMPLETE AND MAY BE AMENDED PRIOR TO THE TIME OF SALE. THIS TERM SHEET IS NOT AN OFFER TO SELL THESE SECURITIES AND IT IS NOT A SOLICITATION OF AN OFFER TO BUY THESE SECURITIES IN ANY JURISDICTION WHERE THE OFFER OR SALE IS NOT PERMITTED. |
| | 39 | |
| Retail – Super Regional Mall | Loan #2 | Cut-off Date Balance: | | $60,000,000 |
| 3000 Grapevine Mills Parkway | Grapevine Mills | Cut-off Date LTV: | | 45.6% |
| and 2501 Bass Pro Drive | | U/W NCF DSCR: | | 2.68x |
| Grapevine, TX 76051 | | U/W NOI Debt Yield: | | 18.0% |
| THE INFORMATION IN THIS STRUCTURAL AND COLLATERAL TERM SHEET IS NOT COMPLETE AND MAY BE AMENDED PRIOR TO THE TIME OF SALE. THIS TERM SHEET IS NOT AN OFFER TO SELL THESE SECURITIES AND IT IS NOT A SOLICITATION OF AN OFFER TO BUY THESE SECURITIES IN ANY JURISDICTION WHERE THE OFFER OR SALE IS NOT PERMITTED. |
| | 40 | |
| Mortgage Loan Information | | Mortgaged Property Information |
| Mortgage Loan Seller: | Wells Fargo Bank, National Association, JPMorgan Chase Bank, National Association | | Single Asset/Portfolio: | Single Asset |
Credit Assessment (Fitch/KBRA/Moody’s): | NR/BBB(sf)/Aa3(sf) | | Property Type – Subtype: | Retail – Super Regional Mall |
| Original Principal Balance(1): | $60,000,000 | | Location: | Grapevine, TX |
| Cut-off Date Balance(1): | $60,000,000 | | Size(7): | 1,628,140 SF |
| % of Initial Pool Balance: | 8.4% | | Cut-off Date Balance Per SF(1)(7): | $153.55 |
| Loan Purpose: | Refinance | | Maturity Date Balance Per SF(1)(7): | $153.55 |
| Borrower Sponsor(2): | Simon Property Group, L.P. | | Year Built/Renovated: | 1997/2015 |
| Guarantor: | Simon Property Group, L.P. | | Title Vesting: | Fee |
| Mortgage Rate: | 6.2640% | | Property Manager: | Simon Management Associates II, LLC (borrower related) |
| Note Date: | June 17, 2024 | | Current Occupancy (As of)(8): | 96.2% (5/9/2024) |
| Seasoning: | 1 month | | YE 2023 Occupancy(8): | 97.4% |
| Maturity Date: | July 1, 2034 | | YE 2022 Occupancy(8): | 95.0% |
| IO Period: | 120 months | | YE 2021 Occupancy: | 94.1% |
| Loan Term (Original): | 120 months | | YE 2020 Occupancy: | 93.1% |
| Amortization Term (Original): | NAP | | As-Is Appraised Value: | $548,000,000 |
| Loan Amortization Type: | Interest Only | | As-Is Appraised Value Per SF(7): | $336.58 |
| Call Protection(3): | L(25),D(88),O(7) | | As-Is Appraisal Valuation Date: | May 13, 2024 |
| Lockbox Type: | Hard/Springing Cash Management | | Underwriting and Financial Information(1) |
| Additional Debt(1)(4): | Yes | | TTM NOI (3/31/2024): | $43,737,436 |
| Additional Debt Type (Balance)(1)(4)(5): | Pari Passu ($190,000,000) | | YE 2023 NOI: | $41,069,241 |
| | | | YE 2022 NOI: | $40,644,772 |
| | | YE 2021 NOI: | $38,542,814 |
| Escrows and Reserves(6) | | U/W Revenues: | $58,524,018 |
| | Initial | Monthly | Cap | | U/W Expenses: | $13,633,655 |
| Taxes: | $0 | Springing | NAP | | U/W NOI: | $44,890,363 |
| Insurance: | $0 | Springing | NAP | | U/W NCF: | $42,552,379 |
| Replacement Reserve: | $0 | Springing | NAP | | U/W DSCR based on NOI/NCF(1): | 2.83x / 2.68x |
| TI/LC Reserve: | $0 | $241,846 | $5,804,300 | | U/W Debt Yield based on NOI/NCF(1): | 18.0% /17.0% |
| | | | | | U/W Debt Yield at Maturity based on NOI/NCF(1): | 18.0% /17.0% |
| | | | | | Cut-off Date LTV Ratio(1): | 45.6% |
| | | | | | LTV Ratio at Maturity(1): | 45.6% |
| | | | | | | | |
| Sources and Uses |
| Sources | | | | | Uses | | | |
| Whole Loan Amount(1) | $250,000,000 | | 92.2% | | Loan Payoff | $268,857,947 | | 99.1 | % |
| Borrower Sponsor Equity | 21,252,453 | | 7.8 | | Closing costs | 2,394,506 | | 0.9 | |
| | | | | | | | | |
| Total Sources | $271,252,453 | | 100.0% | | Total Uses | $271,252,453 | | 100.0 | % |
| (1) | The Grapevine Mills Mortgage Loan (as defined below) is part of a whole loan evidenced by 12 pari passu promissory notes with an aggregate original principal balance of $250,000,000 (the “Grapevine Mills Whole Loan”). The financial information presented in the chart above is based on the Grapevine Mills Whole Loan. |
| (2) | The borrower sponsor is also a borrower sponsor for the St. Johns Town Center Mortgage Loan in the WFCM 2024-C63 Trust. |
| (3) | Prepayment of the Grapevine Mills Whole Loan is permitted at any time after the earlier to occur of (a) the end of the two-year period commencing on the closing date of the securitization of the last promissory note representing a portion of the Grapevine Mills Whole Loan to be securitized (“REMIC Prohibition Period”), and (b) July 1, 2027 (“Permitted Prepayment Date”). If the Permitted Prepayment Date has occurred but the REMIC Prohibition Period has not occurred, (a) the borrower must prepay with yield maintenance, and (b) and provided no event of default exists, the Grapevine Mills Whole Loan may be prepaid in whole (but not in part) prior to the REMIC Prohibition Period with yield maintenance. Any portion of the Grapevine Mills Whole Loan that has been securitized, as of such prepayment date, for a period of more than two years from the “startup day” within the meaning of Section 860G(a)(9) of the Internal Revenue Code for the REMIC Trust which holds such securitized portion of the Grapevine Mills Whole Loan must be contemporaneously defeased. |
| (4) | See “The Mortgage Loan” section below for further discussion of additional mortgage debt. |
| (5) | The Grapevine Mills Whole Loan documents permit the borrower to enter into a property-assessed clean energy (“PACE”) loan for an amount not to exceed $5,000,000, subject to the related mortgagee’s approval and delivery of a rating agency confirmation. |
| (6) | See “Escrows” below for further discussion of reserve requirements. |
| (7) | The Grapevine Mills Property (as defined below) includes 1,451,077 square feet of borrower owned improvements and 177,063 square feet of leased fee improvements. The Cut-off Date Balance Per SF, Maturity Date Balance Per SF, and As-Is Appraised Value Per SF are based on the total square feet of 1,628,140. The Cut-off Date Balance Per SF, Maturity Date Balance Per SF, and As-Is Appraised Value Per SF based on the Owned SF (as defined below) of 1,451,077 is $172.29, $172.29, and $377.65, respectively. |
| (8) | Occupancy represents the occupancy excluding square footage from the leased fee space, whereby the tenant owns its improvements, Bass Pro (as defined below), and temporary tenants and is based on the Owned SF totaling 1,451,077. Occupancy including Bass Pro (and excluding temporary tenants) is 96.6% and occupancy including Bass Pro and temporary tenants is 98.4%. |
| THE INFORMATION IN THIS STRUCTURAL AND COLLATERAL TERM SHEET IS NOT COMPLETE AND MAY BE AMENDED PRIOR TO THE TIME OF SALE. THIS TERM SHEET IS NOT AN OFFER TO SELL THESE SECURITIES AND IT IS NOT A SOLICITATION OF AN OFFER TO BUY THESE SECURITIES IN ANY JURISDICTION WHERE THE OFFER OR SALE IS NOT PERMITTED. |
| | 41 | |
| Retail – Super Regional Mall | Loan #2 | Cut-off Date Balance: | | $60,000,000 |
| 3000 Grapevine Mills Parkway | Grapevine Mills | Cut-off Date LTV: | | 45.6% |
| and 2501 Bass Pro Drive | | U/W NCF DSCR: | | 2.68x |
| Grapevine, TX 76051 | | U/W NOI Debt Yield: | | 18.0% |
The Mortgage Loan. The second largest mortgage loan (the “Grapevine Mills Mortgage Loan”) is part of a fixed rate whole loan evidenced by 11 pari passu promissory notes with an aggregate outstanding principal balance as of the Cut-off Date of $250,000,000. The Grapevine Mills Whole Loan is secured by the borrower’s fee interest in a 1,628,140 square foot super regional mall located in Grapevine, Texas (the “Grapevine Mills Property”). The Grapevine Mills Mortgage Loan is evidenced by the controlling note A-1-1 and the non-controlling note A-2-2, with an aggregate outstanding principal balance as of the Cut-off Date of $60,000,000. The Grapevine Mills Whole Loan was co-originated by Wells Fargo Bank, National Association (“WFB”), JPMorgan Chase Bank, National Association (“JPM”), and Bank of Montreal (“BMO”) on June 17, 2024. The Grapevine Mills Whole Loan will be serviced pursuant to the pooling and servicing agreement for the WFCM 2024-C63 securitization trust. The relationship between the holders of the Grapevine Mills Whole Loan is governed by a co-lender agreement as described under “Description of the Mortgage Pool—The Whole Loans—The Serviced Pari Passu Whole Loans” and “The Pooling and Servicing Agreement” in the Preliminary Prospectus.
Whole Loan Note Summary
| Note | Original Balance | Cut-off Date Balance | Note Holder | Controlling Piece |
| A-1-1 | $40,000,000 | $40,000,000 | WFCM 2024-C63 | Yes |
| A-1-1-1 | $10,000,000 | $10,000,000 | WFB | No |
| A-1-2 | $40,000,000 | $40,000,000 | BMO 2024-C9 | No |
| A-1-3(1) | $11,000,000 | $11,000,000 | WFB | No |
| A-1-4(1) | $10,000,000 | $10,000,000 | WFB | No |
| A-2-1(1) | $35,000,000 | $35,000,000 | JPM | No |
| A-2-2 | $20,000,000 | $20,000,000 | WFCM 2024-C63 | No |
| A-2-3(1) | $9,500,000 | $9,500,000 | JPM | No |
| A-2-4(1) | $5,000,000 | $5,000,000 | JPM | No |
| A-3-1 | $54,000,000 | $54,000,000 | BMO 2024-C9 | No |
| A-3-2 | $6,000,000 | $6,000,000 | BMO | No |
| A-3-3 | $9,500,000 | $9,500,000 | BMO | No |
| Total | $250,000,000 | $250,000,000 | | |
| (1) | Expected to be contributed to one or more future securitization(s). |
The Borrower and Borrower Sponsor. The borrower is Grapevine Mills Mall Limited Partnership, a Delaware limited partnership with two independent directors. The borrower is a joint venture between Simon Property Group, L.P. (65.6%) and Kan Am Group (34.4%). Legal counsel to the borrower delivered a non-consolidation opinion in connection with the origination of the Grapevine Mills Whole Loan.
The borrower sponsor and non-recourse carveout guarantor of the Grapevine Mills Whole Loan is Simon Property Group, L.P. (“Simon”). Simon Property Group, Inc. (NYSE: SPG) is a real estate investment trust engaged in the ownership of shopping, dining, entertainment and mixed-use destinations. Simon has approximately 400 retail centers across 24 countries. Pursuant to the Grapevine Mills Whole Loan documents, so long as one or more of Simon Property Group, Inc. or Simon (collectively, “Simon Key Principal”) or an affiliate of Simon Key Principal is the non-recourse carveout guarantor, the non-recourse carveout guarantor’s liability under the guaranty for specified carveout events is limited to 20.0% of the then outstanding principal balance of the Grapevine Mills Whole Loan (i.e., $50,000,000 subject to reduction by subsequent principal payments) in the aggregate, plus all of the reasonable out-of-pocket costs and expenses (including court costs and reasonable attorneys’ fees) incurred by the lender in the enforcement of the related guaranty or the preservation of the lender’s rights under such guaranty.
The Property. The Grapevine Mills Property, a 1,628,140 square foot super regional mall, which includes 1,451,077 of owned square feet (“Owned SF”) and 177,063 of leased fee square feet, whereby Bass Pro Shops Outdoor World (“Bass Pro”) ground leases the land from the borrower and owns its improvements. The Grapevine Mills Property is anchored by AMC Theatres (“AMC”), Bass Pro, which owns its improvements and ground leases the underlying land from the borrower, Burlington and Fieldhouse USA. Other major tenants include Saks Fifth Avenue Off Fifth, Macy’s Backstage, Arhaus Loft, Nike Factory Store, and Round 1 Bowling and Amusement (“Round 1”). Built in 1997 and renovated in 2015, the Grapevine Mills Property is situated on a 158.76-acre parcel and contains 8,900 parking spaces, which results in a parking ratio of 5.47 per 1,000 SF. As of May 9, 2024, the Grapevine Mills Property was 96.2% leased based on Owned SF (excluding temporary tenants) and 96.6% leased based on total square feet (excluding temporary tenants) by 182 unique tenants. The trailing 12-month in-line sales per square foot as of March 31, 2024 is $530 per square foot, representing a 28.9% increase over 2019.
| Sales for Inline Tenants(1) |
| | 2019 Sales
PSF | 2020 Sales
PSF | 2021 Sales
PSF | 2022 Sales
PSF | 2023 Sales
PSF | TTM 3/31/2024
Sales PSF |
| Inline Sales (< 10,000 SF) | $412 | $312 | $488 | $521 | $523 | $530 |
| Occupancy Cost | 14.2% | 18.5% | 12.8% | 12.4% | 13.2% | 13.2% |
| (1) | Information obtained from the borrower. |
| THE INFORMATION IN THIS STRUCTURAL AND COLLATERAL TERM SHEET IS NOT COMPLETE AND MAY BE AMENDED PRIOR TO THE TIME OF SALE. THIS TERM SHEET IS NOT AN OFFER TO SELL THESE SECURITIES AND IT IS NOT A SOLICITATION OF AN OFFER TO BUY THESE SECURITIES IN ANY JURISDICTION WHERE THE OFFER OR SALE IS NOT PERMITTED. |
| | 42 | |
| Retail – Super Regional Mall | Loan #2 | Cut-off Date Balance: | | $60,000,000 |
| 3000 Grapevine Mills Parkway | Grapevine Mills | Cut-off Date LTV: | | 45.6% |
| and 2501 Bass Pro Drive | | U/W NCF DSCR: | | 2.68x |
| Grapevine, TX 76051 | | U/W NOI Debt Yield: | | 18.0% |
Major Tenants.
Bass Pro Shops Outdoor World (Fitch/Moody’s/S&P: NR/NR/NR; 177,063 square feet; 10.9% of net rentable area; 4.5% of underwritten base rent; 3/24/2029 lease expiration). Founded in 1972 and headquartered in Springfield, Missouri, Bass Pro is an American sporting goods retailer that offers hunting, fishing, camping, and other related outdoor recreation equipment. Bass Pro has been a tenant at the Grapevine Mills Property since 1999. Bass Pro is a leased fee tenant, which owns its improvements and ground leases the underlying land from the borrower pursuant to a ground lease expiring March 24, 2029 with four, 5-year renewal options and no termination options.
AMC Theatres (Fitch/Moody’s/S&P: NR/Caa2/CCC+; 108,733 square feet; 6.7% of net rentable area; 3.7% of underwritten base rent; 12/31/2024 lease expiration). Founded in 1920, AMC is headquartered in Leawood, Kansas. AMC has 24 screens at the Grapevine Mills Property, where it has been a tenant since December 1997. AMC is on a lease expiring December 31, 2024 with three, 5-year renewal options. The lease provides the tenant must exercise its first 5-year renewal option on or before June 30, 2024. The borrower has indicated that it is discussing renewal terms with the tenant. AMC’s base rent was underwritten based on 15% of gross receipts for the year ending in 2023. We cannot assure you that renewal terms will be agreed upon, or, if an agreement is reached, whether the leased space or rental rate will be reduced.
Round 1 Bowling and Amusement (Fitch/Moody’s/S&P: NR/NR/NR; 80,649 square feet; 5.0% of net rentable area; 3.6% of underwritten base rent; 1/31/2027 lease expiration). Round 1 is a multi-entertainment facility offering bowling, arcade games, billiards, karaoke, ping pong, and darts. Today, the company has over 50 locations across the United States. Round 1 has been a tenant at the Grapevine Mills Property since 2016 and has a lease expiration on January 31, 2027 with two, 5-year renewal options and no termination options.
The following table presents a summary regarding the major tenants at the Grapevine Mills Property:
Major Tenants(1)
| Tenant Name | Credit Rating (Fitch/Moody’s/ S&P)(2) | Tenant NRSF | % of NRSF | Annual U/W Rent(3)(4) | % of Total Annual U/W Rent | Annual U/W Rent PSF(3)(4) | Lease Expiration Date | Ext. Options | Term. Option (Y/N) |
Anchor
Tenants(leased fee)(5) | | | | | | | | | |
| Bass Pro | NR/NR/NR | 177,063 | 10.9% | $1,500,000 | 4.5% | $8.47 | 3/24/2029 | 4, 5-year | N |
| Total/Wtd. Avg. | | 177,063 | 10.9% | $1,500,000 | 4.5% | $8.47 | | | |
| | | | | | | | | | |
| Major Tenants | | | | | | | | | |
| AMC Theatres | NR/Caa2/CCC+ | 108,733 | 6.7% | $1,242,798 | 3.7% | $11.43 | 12/31/2024 | 3, 5-year | N |
| Round 1 | NR/NR/NR | 80,649 | 5.0% | $1,200,000 | 3.6% | $14.88 | 1/31/2027 | 2, 5-year | N |
| Last Call Neiman Marcus | NR/NR/NR | 44,752 | 2.7% | $1,024,723 | 3.1% | $22.90 | 4/30/2028 | None | N |
| The Children's Place/Gymboree | NR/NR/NR | 20,106 | 1.2% | $1,014,348 | 3.0% | $50.45 | 1/31/2026 | None | N |
| Sun & Ski Sports | NR/NR/NR | 30,127 | 1.9% | $759,200 | 2.3% | $25.20 | 3/31/2026 | 1, 5-year | N |
| Off Broadway Shoes | NR/NR/NR | 20,130 | 1.2% | $728,505 | 2.2% | $36.19 | 1/31/2030 | None | N |
| Meow Wolf | NR/NR/NR | 40,340 | 2.5% | $665,000 | 2.0% | $16.48 | 12/31/2033 | 2, 5-year | N |
| H&M | NR/NR/BBB | 23,967 | 1.5% | $657,078(6) | 2.0% | $27.42(6) | 1/31/2028 | None | N |
| Rainforest Cafe | NR/NR/NR | 22,602 | 1.4% | $655,464 | 2.0% | $29.00 | 12/31/2024 | None | N |
| Burlington | NR/NR/BB+ | 100,102 | 6.1% | $625,638 | 1.9% | $6.25 | 1/31/2028 | 1, 5-year | N |
| Total/Wtd. Avg. | | 491,508 | 30.2% | $8,572,754 | 25.7% | $17.44 | | | |
| | | | | | | | | | |
| Non-Major Tenants(7)(8) | | 933,198 | 57.3% | $23,268,164 | 69.8% | $24.93 | | | |
| | | | | | | | | | |
Occupied Collateral
Total | | 1,601,769 | 98.4%(9) | $33,340,918 | 100.0% | $22.35(10) | | | |
| Vacant Space | | 26,371 | 1.6% | | | | | | |
| Total/Wtd. Avg. | | 1,628,140 | 100.0% | | | | | | |
| (1) | Based on the underwritten rent roll dated as of May 9, 2024. |
| (2) | Certain ratings are those of the parent company whether or not the parent guarantees the lease. |
| (3) | Annual U/W Base Rent PSF and Annual U/W Base Rent includes percentage in-lieu of rents totaling $1,342,357. |
| (4) | Annual U/W Base Rent and Annual U/W Base Rent PSF includes $1,051,786 of rent steps through June 2025. |
| (5) | Bass Pro owns its own improvements and ground leases the land from the borrower. |
| (6) | H&M Annual U/W Base Rent PSF and Annual U/W Base Rent represents percentage in-lieu of rent based on the tenants’ TTM 3/31/2024 sales. |
| (7) | Non-Major Tenants includes 2 tenants, totaling 6,720 square feet (0.4% of NRA and 0.5% of UW Base Rent), with lease start dates commencing July 2024. |
| (8) | Non-Major Tenants include 16 tenants totaling 74,953 square feet (4.6% of NRA and 8.4% of UW Base Rent) whereby the borrower has submitted lease execution and renewal documentation for execution following discussion of deal terms, but the renewal documentation has not yet been executed by the related tenants. The loan has been underwritten |
| THE INFORMATION IN THIS STRUCTURAL AND COLLATERAL TERM SHEET IS NOT COMPLETE AND MAY BE AMENDED PRIOR TO THE TIME OF SALE. THIS TERM SHEET IS NOT AN OFFER TO SELL THESE SECURITIES AND IT IS NOT A SOLICITATION OF AN OFFER TO BUY THESE SECURITIES IN ANY JURISDICTION WHERE THE OFFER OR SALE IS NOT PERMITTED. |
| | 43 | |
| Retail – Super Regional Mall | Loan #2 | Cut-off Date Balance: | | $60,000,000 |
| 3000 Grapevine Mills Parkway | Grapevine Mills | Cut-off Date LTV: | | 45.6% |
| and 2501 Bass Pro Drive | | U/W NCF DSCR: | | 2.68x |
| Grapevine, TX 76051 | | U/W NOI Debt Yield: | | 18.0% |
| | on the basis that all such renewal documentation is executed as submitted by the borrower. |
| (9) | Occupancy represents the occupancy including Bass Pro and temporary tenants. Occupancy excluding the square footage from the leased fee space, whereby the tenant owns its improvements, Bass Pro, and temporary tenants is 96.2%. |
| (10) | Occupied Collateral Annual U/W Base Rent PSF is based on the Owned SF and excludes Net Rentable Area (SF) and Annual U/W Base Rent from the leased fee tenant, Bass Pro. |
The following table presents a summary of sales for certain tenants at the Grapevine Mills Property:
Sales Summary(1)
| | |
| | 2019 Sales
(PSF) | 2020 Sales
(PSF) | 2021 Sales
(PSF) | 2022 Sales
(PSF) | 2023 Sales
(PSF) | TTM 3/31/2024
Sales (PSF) |
| Bass Pro Shops Outdoor World | NAV | NAV | NAV | NAV | NAV | NAV |
| AMC Theatres(2) | $423,334 | $89,116 | $164,277 | $384,779 | $342,006 | $346,390 |
| Round 1 | $98.18 | $47.20 | $98.03 | $131.90 | $157.04 | $161.13 |
| Last Call Neiman Marcus | $276.44 | $172.86 | $257.54 | $290.20 | $421.93 | $443.12 |
| The Children's Place/Gymboree | $261.53 | $202.40 | $271.51 | $246.41 | $209.50 | $201.78 |
| Sun & Ski Sports | $207.64 | $193.73 | $246.49 | $272.61 | $257.94 | $254.47 |
| Off Broadway Shoes | $171.70 | $127.87 | $218.74 | $249.59 | $198.62 | $201.71 |
| Meow Wolf | NAV | NAV | NAV | NAV | NAV | $537.36 |
| H&M | $242.50 | $159.94 | $276.05 | $282.93 | $303.77 | $304.62 |
| Rainforest Cafe | $322.65 | $177.05 | $304.93 | $319.40 | $369.49 | $384.23 |
| Burlington | $170.48 | $115.69 | $183.62 | $164.02 | $165.60 | $167.85 |
| (1) | Information obtained from the underwritten rent roll dated May 9, 2024. |
| (2) | Calculated based on a sales per screen (with 24 screens). |
The following table presents certain information relating to the lease rollover schedule at the Grapevine Mills Property:
Lease Expiration Schedule(1)(2)(3)
Year Ending
December 31, | No. of
Leases
Expiring | Expiring
NRSF | % of
Total
NRSF | Cumulative
Expiring
NRSF | Cumulative
% of Total
NRSF | Annual
U/W
Base Rent | % of Total
Annual U/W
Base Rent | Annual
U/W
Base Rent
PSF |
| MTM & 2024 | 33 | 212,808 | | | 13.1 | % | 212,808 | | 13.1 | % | $3,882,322 | | 11.6% | $18.24 | |
| 2025 | 29 | 103,400 | | | 6.4 | % | 316,208 | | 19.4 | % | $3,619,699 | | 10.9% | $35.01 | |
| 2026 | 32 | 240,844 | | | 14.8 | % | 557,052 | | 34.2 | % | $5,994,449 | | 18.0% | $24.89 | |
| 2027 | 33 | 397,023 | | | 24.4 | % | 954,075 | | 58.6 | % | $6,828,606 | | 20.5% | $17.20 | |
| 2028 | 19 | 213,581 | | | 13.1 | % | 1,167,656 | | 71.7 | % | $4,187,064 | | 12.6% | $19.60 | |
| 2029 | 14 | 233,233 | | | 14.3 | % | 1,400,889 | | 86.0 | % | $3,724,303 | | 11.2% | $15.97 | |
| 2030 | 6 | 38,307 | | | 2.4 | % | 1,439,196 | | 88.4 | % | $1,217,456 | | 3.7% | $31.78 | |
| 2031 | 4 | 26,233 | | | 1.6 | % | 1,465,429 | | 90.0 | % | $770,525 | | 2.3% | $29.37 | |
| 2032 | 3 | 2,436 | | | 0.1 | % | 1,467,865 | | 90.2 | % | $273,967 | | 0.8% | $112.47 | |
| 2033 | 5 | 109,462 | | | 6.7 | % | 1,577,327 | | 96.9 | % | $2,046,864 | | 6.1% | $18.70 | |
| 2034 | 7 | 24,442 | | | 1.5 | % | 1,601,769 | | 98.4 | % | $795,662 | | 2.4% | $32.55 | |
| 2035 & Thereafter | 0 | 0 | | | 0.0 | % | 1,601,769 | | 98.4 | % | $0 | | 0.0% | $0.00 | |
| Vacant | 0 | 26,371 | | | 1.6 | % | 1,628,140 | | 100.0 | % | $0 | | 0.0% | $0.00 | |
| Total/Weighted Average | 185 | 1,628,140 | | | 100.0 | % | | | $33,340,918 | | 100.0% | $22.35 | |
| (1) | Based on the underwritten rent roll dated May 9, 2024. |
| (2) | Certain tenants may have termination options that are exercisable prior to the originally stated expiration date of the subject lease and that are not considered in the Lease Rollover Schedule. |
| (3) | Annual U/W Base Rent, % of Total Annual U/W Base Rent, and Annual U/W Base Rent PSF include percentage in-lieu of rent totaling $1,342,357 and rent steps totaling $1,051,786 of rent steps through June 2025. |
The following table presents historical occupancy percentages at the Grapevine Mills Property:
Historical Occupancy(1)(2)
12/31/2020 | 12/31/2021 | 12/31/2022 | 12/31/2023 | 5/9/2024(3) |
| 93.1% | 94.1% | 95.0% | 94.7% | 96.2% |
| (1) | Historical Information obtained from the borrower. |
| (2) | Historical and current occupancy figures exclude square footage from the leased fee tenant, Bass Pro, and temporary tenants at the Grapevine Mills Property. |
| (3) | Current occupancy is based on the underwritten rent roll dated as of May 9, 2024. |
| THE INFORMATION IN THIS STRUCTURAL AND COLLATERAL TERM SHEET IS NOT COMPLETE AND MAY BE AMENDED PRIOR TO THE TIME OF SALE. THIS TERM SHEET IS NOT AN OFFER TO SELL THESE SECURITIES AND IT IS NOT A SOLICITATION OF AN OFFER TO BUY THESE SECURITIES IN ANY JURISDICTION WHERE THE OFFER OR SALE IS NOT PERMITTED. |
| | 44 | |
| Retail – Super Regional Mall | Loan #2 | Cut-off Date Balance: | | $60,000,000 |
| 3000 Grapevine Mills Parkway | Grapevine Mills | Cut-off Date LTV: | | 45.6% |
| and 2501 Bass Pro Drive | | U/W NCF DSCR: | | 2.68x |
| Grapevine, TX 76051 | | U/W NOI Debt Yield: | | 18.0% |
Operating History and Underwritten Net Cash Flow. The following table presents certain information relating to the historical operating performance and underwritten net cash flow at the Grapevine Mills Property:
Cash Flow Analysis
| | 2020 | 2021 | 2022 | 2023 | TTM 3/31/2024(1) | U/W | %(2) | U/W $
per SF |
| In Place Rent | $28,883,487 | $28,174,656 | $28,277,280 | $29,320,064 | $30,013,063 | $30,946,775 | 52.1% | $19.01 |
| Contractual Rent Steps(3) | 0 | 0 | 0 | 0 | 0 | 1,051,786 | 1.8 | 0.65 |
| Rent Averaging(4) | 0 | 0 | 0 | 0 | 0 | 66,533 | 0.1 | 0.04 |
| Potential Income from Vacant Space | 0 | 0 | 0 | 0 | 0 | 866,032 | 1.5 | 0.53 |
| Percentage in Lieu(5) | 1,277,755 | 2,307,057 | 2,420,811 | 1,935,683 | 1,875,542 | 1,342,357 | 2.3 | 0.82 |
| Gross Potential Rent | $30,161,242 | $30,481,713 | $30,698,091 | $31,255,747 | $31,888,605 | $34,273,482 | 57.7% | $21.05 |
| Percentage Rent(6) | 333,649 | 2,594,669 | 3,611,319 | 2,963,705 | 2,928,390 | 2,603,660 | 4.4 | 1.60 |
| Temp Tenant Income | 2,420,726 | 3,277,724 | 3,930,353 | 4,043,498 | 4,043,742 | 4,029,860 | 6.8 | 2.48 |
| Reimbursement Revenue | 16,482,905 | 15,362,400 | 15,368,277 | 15,678,174 | 16,087,908 | 17,424,464 | 29.3 | 10.70 |
| Other Revenue(7) | 142,264 | 297,646 | 324,806 | 390,587 | 392,797 | 396,298 | 0.7 | 0.24 |
| Miscellaneous Income(8) | 462,651 | 640,766 | 697,883 | 648,208 | 2,038,051 | 662,286 | 1.1 | 0.41 |
| Net Rental Income | $50,003,437 | $52,654,918 | $54,630,729 | $54,979,919 | $57,379,493 | $ 59,390,050 | 100.0% | $36.48 |
| Less Bad Debt / Collection Loss | (5,365,360) | (532,998) | 544,802 | (293,592) | (113,835) | 0 | 0.0 | 0.00 |
| Less Vacancy | 0 | 0 | 0 | 0 | 0 | (866,032) | (2.5)(9) | (0.53) |
| Effective Gross Income | $44,638,077 | $52,121,920 | $55,175,531 | $54,686,327 | $57,265,658 | $ 58,524,018 | 98.5% | $35.95 |
| | | | | | | | | |
| Real Estate Taxes | 6,118,607 | 4,819,131 | 5,126,481 | 4,150,064 | 3,856,844 | 4,481,166 | 7.7 | $2.75 |
| Insurance | 431,958 | 478,243 | 543,050 | 612,584 | 631,722 | 756,996 | 1.3 | 0.46 |
| Management Fee(10) | 1,880,087 | 2,116,338 | 2,268,057 | 2,173,530 | 2,187,668 | 1,000,000 | 1.7 | 0.61 |
| Other Expenses | 5,342,281 | 6,165,394 | 6,593,171 | 6,680,908 | 6,851,988 | 7,395,493 | 12.6 | 4.54 |
| Total Expenses | $13,772,933 | $13,579,106 | $14,530,759 | $13,617,086 | $13,528,222 | $13,633,655 | 23.3% | $8.37 |
| | | | | | | | | |
| Net Operating Income | $30,865,144 | $38,542,814 | $40,644,772 | $41,069,241 | $43,737,436 | $44,890,363 | 76.7% | $27.57 |
| TI/LC | 0 | 0 | 0 | 0 | 0 | 2,047,768 | 3.5 | 1.26 |
| Capital Expenditures | 0 | 0 | 0 | 0 | 0 | 290,215 | 0.5 | 0.18 |
| Net Cash Flow | $30,865,144 | $38,542,814 | $40,644,772 | $41,069,241 | $43,737,436 | $42,552,379 | 72.7% | $26.14 |
| | | | | | | | | |
| NOI DSCR(11) | 1.94x | 2.43x | 2.56x | 2.59x | 2.75x | 2.83x | | |
| NCF DSCR(11) | 1.94x | 2.43x | 2.56x | 2.59x | 2.75x | 2.68x | | |
| NOI Debt Yield(11) | 12.3% | 15.4% | 16.3% | 16.4% | 17.5% | 18.0% | | |
| NCF Debt Yield(11) | 12.3% | 15.4% | 16.3% | 16.4% | 17.5% | 17.0% | | |
| (1) | TTM March 2024 reflects the trailing 12-month period ending March 31, 2024. |
| (2) | Represents (i) percent of Net Rental Income for all revenue fields, (ii) percent of Gross Potential Rent for Vacancy and Bad Debt / Collection Loss and (iii) percent of Effective Gross Income for all other fields. |
| (3) | Represents rent steps through June 2025. |
| (4) | Represents straight-line rent averaging for nine investment grade tenants through the earlier of loan or lease maturity. |
| (5) | Percentage in Lieu rents are underwritten based on the tenants’ TTM 3/31/2024 sales. |
| (6) | Underwritten percentage rent is based on tenants’ TTM 3/31/2024 sales and is attributable to 49 tenants. |
| (7) | Other Revenue includes revenue from ATM, beverage case rentals and SmarteCarte stroller program revenue. |
| (8) | Miscellaneous Income includes telecom, local media, advertisements, storage and tenant services. |
| (9) | Represents the underwritten economic vacancy %. The Grapevine Mills Property was 96.2% occupied based on the Owned SF as of May 9, 2024. |
| (10) | Management Fee is capped at $1,000,000. The property is managed by Simon Management Associates II, LLC, an affiliate of the borrower. |
| (11) | DSCR and Debt Yields are based on the Grapevine Mills Whole Loan. |
| THE INFORMATION IN THIS STRUCTURAL AND COLLATERAL TERM SHEET IS NOT COMPLETE AND MAY BE AMENDED PRIOR TO THE TIME OF SALE. THIS TERM SHEET IS NOT AN OFFER TO SELL THESE SECURITIES AND IT IS NOT A SOLICITATION OF AN OFFER TO BUY THESE SECURITIES IN ANY JURISDICTION WHERE THE OFFER OR SALE IS NOT PERMITTED. |
| | 45 | |
| Retail – Super Regional Mall | Loan #2 | Cut-off Date Balance: | | $60,000,000 |
| 3000 Grapevine Mills Parkway | Grapevine Mills | Cut-off Date LTV: | | 45.6% |
| and 2501 Bass Pro Drive | | U/W NCF DSCR: | | 2.68x |
| Grapevine, TX 76051 | | U/W NOI Debt Yield: | | 18.0% |
Appraisal. The appraiser concluded to an “As-is” value for the Grapevine Mills Property of $548,000,000 as of May 13, 2024.
Environmental Matters. According to the Phase I environmental site assessment dated May 21, 2024, there was no evidence of any recognized environmental conditions at the Grapevine Mills Property.
Market Overview and Competition. The Grapevine Mills Property is located in Grapevine, Texas, approximately 23.0 miles southeast of the Dallas Central Business District and 3.0 miles northwest of Dallas Fort Worth International Airport. According to the appraisal, the neighborhood is primarily comprised of industrial, retail and hospitality uses with the Grapevine Mills Property anchoring a dominant commercial corridor. Primary access to the area is provided by State Route 121, which is adjacent to the Grapevine Mills Property. According to the appraisal, the top five employers in the surrounding area are Walmart Inc., American Airlines, Baylor Scott & White Health, Lockheed Martin and UT Southwestern Medical Center.
Within a one-, three- and five-mile radius of the Grapevine Mills Property, the 2023 average household income was approximately $97,385, $145,059 and $141,101, respectively; and within the same radii, the 2023 estimated population was 4,338, 39,827 and 172,858, respectively.
According to the appraisal, the Grapevine Mills Property is situated within the Grapevine/Colleyville retail submarket of the Dallas-Ft Worth retail market. As of the first quarter of 2024, the submarket reported total inventory of approximately 8.7 million square feet with a 5.5% vacancy rate and average rents of $21.81 per square foot.
The following table presents certain information relating to the appraiser’s market rent conclusions for the Grapevine Mills Property:
Market Rent Summary(1)
| | Market Rent (PSF) | Lease Term (Yrs.) | Rent Increase Projections | New Tenant Improvements PSF |
| 0 to 1,500 SF Space | $65.00 | 5 | 3.0% annually | $40.00 |
| 1,501-2,500 SF Space | $60.00 | 5 | 3.0% annually | $40.00 |
| 2,501-4,000 SF Space | $50.00 | 5 | 3.0% annually | $40.00 |
| 4,001-6,500 SF Space | $50.00 | 5 | 3.0% annually | $40.00 |
| 6,501-10,000 SF Space | $40.00 | 5 | 3.0% annually | $40.00 |
| Jewelry Space | $60.00 | 5 | 3.0% annually | $40.00 |
| Restaurant Space | $35.00 | 5 | 3.0% annually | $30.00 |
| Snack Bars Space | $80.00 | 5 | 3.0% annually | $60.00 |
| Food Court Space | $135.00 | 5 | 3.0% annually | $60.00 |
| Kiosk Space | $365.00 | 5 | 3.0% annually | $10.00 |
| 10,000-20,000 SF Space | $25.00 | 10 | 10.0% Mid-Term | $20.00 |
| Cinema Space | $15.00 | 10 | 10.0% Mid-Term | $20.00 |
| Anchor Space | $5.00 | 10 | 10.0% Mid-Term | $5.00 |
| Large Tenants Over 20,000 SF Space | $20.00 | 10 | 10.0% Mid-Term | $15.00 |
| (1) | Information obtained from the appraisal. |
| THE INFORMATION IN THIS STRUCTURAL AND COLLATERAL TERM SHEET IS NOT COMPLETE AND MAY BE AMENDED PRIOR TO THE TIME OF SALE. THIS TERM SHEET IS NOT AN OFFER TO SELL THESE SECURITIES AND IT IS NOT A SOLICITATION OF AN OFFER TO BUY THESE SECURITIES IN ANY JURISDICTION WHERE THE OFFER OR SALE IS NOT PERMITTED. |
| | 46 | |
| Retail – Super Regional Mall | Loan #2 | Cut-off Date Balance: | | $60,000,000 |
| 3000 Grapevine Mills Parkway | Grapevine Mills | Cut-off Date LTV: | | 45.6% |
| and 2501 Bass Pro Drive | | U/W NCF DSCR: | | 2.68x |
| Grapevine, TX 76051 | | U/W NOI Debt Yield: | | 18.0% |
The table below presents certain information relating to comparable retail centers pertaining to the Grapevine Mills Property identified by the appraiser:
Competitive Set(1)
Property Name | Year Built/Renovated | Total NRA | Total Occupancy | Anchor / Major Tenants | Distance to Grapevine Mills Property |
| Grapevine Mills | 1997/2015 | 1,628,140 | 96.2%(2) | Burlington, Fieldhouse USA, Round 1 Bowling and Amusement, Bass Pro | NAP |
| The Shops at Willow Bend | 2001/NAP | 1,262,000 | 86.0% | Dillard's, Macy's, Neiman Marcus | 10 miles |
| Galleria Dallas | 1982/NAP | 1,398,400 | 95.0% | Macy's, Nordstrom | 10 miles |
| Stonebriar Centre | 2000/NAP | 1,094,942 | 94.0% | Dillard's, Macy's, Nordstrom, JCPenney | 15 miles |
| Weighted Average | | | 93.0% | | |
| (1) | Information obtained from the appraisal, unless otherwise specified. |
| (2) | Based on the Owned SF of the underwritten rent roll as of May 9, 2024. Total Occupancy based on total square feet is 96.6%. |
Escrows.
Real Estate Taxes – After the occurrence of a Control Event (as defined below) or during a Lockbox Event Period (as defined below), or at any time (x) any property taxes are not paid by the borrower prior to the assessment of a penalty, or (y) upon request of the lender, the borrower fails to promptly provide evidence that property taxes have been paid prior to the assessment of a penalty, the Grapevine Mills Whole Loan documents require the borrower to make monthly payments into the real estate tax reserve in an amount equal to 1/12th of the property taxes that the lender reasonably estimates will be payable during the ensuing 12 months.
Insurance – After the occurrence of a Control Event or during a Lockbox Event Period, if the borrower has not provided satisfactory evidence to the lender that the Grapevine Mills Property is covered by policies that are being maintained as part of a reasonably acceptable blanket insurance policy, the Grapevine Mills Whole Loan documents require the borrower to make ongoing monthly deposits in an amount equal to 1/12th of the insurance premiums that the lender reasonably estimates will be payable for the renewal of the coverage afforded by the policies in order to accumulate sufficient funds to pay the premiums at least 30 days prior to expiration.
Replacement Reserve – After the occurrence of a Control Event or during the Lockbox Event Period, the Grapevine Mills Whole Loan documents require springing ongoing monthly deposits of $41,114 for replacement reserves.
TI/LC Reserve – The Grapevine Mills Whole Loan documents require ongoing monthly deposits of $241,846 for tenant improvements and leasing commissions reserves, subject to a cap of $5,804,300, provided that no such cap will apply during a Lockbox Event Period.
A “Control Event” will occur upon Simon Key Principal not owning at least 50% of the direct or indirect interests in the borrower or not controlling the borrower.
Lockbox and Cash Management. The Grapevine Mills Whole Loan is structured with a hard lockbox and springing cash management. The borrower is required to deposit all rents into a lender-controlled lockbox account within two business days of receipt, and to direct all tenants to make direct rent deposits into the lockbox account. As long as a Lockbox Event Period is not in effect, all funds in the lockbox account are required to be distributed to the borrower each Wednesday (or more frequently if required by the borrower in accordance with the lockbox agreement). During the continuance of a Lockbox Event Period, all funds in the lockbox will be transferred weekly to a lender-controlled cash management account to be disbursed in accordance with the Grapevine Mills Whole Loan documents, with any excess funds required to be held as additional security in an excess cash flow subaccount controlled by the lender for so long as the Lockbox Event Period continues.
A “Lockbox Event Period” will commence upon the earlier of the following (each of the items in clauses (i) through (iv), a “Lockbox Event”):
| (i) | the occurrence of an event of default; |
| (ii) | any bankruptcy action of the borrower; |
| (iii) | a bankruptcy action of the manager if the manager is an affiliate of the borrower, and provided the manager is not replaced within 60 days with a qualified manager; or |
| (iv) | the net operating income debt yield (“NOI DY”), based on the trailing four calendar quarter period, is below 13.75%, for two consecutive calendar quarters. |
A Lockbox Event Period will end upon the occurrence of the following:
| ● | with regard to clause (i), the cure of such event of default; |
| ● | with regard to clause (iii), the borrower replaces the manager with a qualified manager under a replacement management |
| THE INFORMATION IN THIS STRUCTURAL AND COLLATERAL TERM SHEET IS NOT COMPLETE AND MAY BE AMENDED PRIOR TO THE TIME OF SALE. THIS TERM SHEET IS NOT AN OFFER TO SELL THESE SECURITIES AND IT IS NOT A SOLICITATION OF AN OFFER TO BUY THESE SECURITIES IN ANY JURISDICTION WHERE THE OFFER OR SALE IS NOT PERMITTED. |
| | 47 | |
| Retail – Super Regional Mall | Loan #2 | Cut-off Date Balance: | | $60,000,000 |
| 3000 Grapevine Mills Parkway | Grapevine Mills | Cut-off Date LTV: | | 45.6% |
| and 2501 Bass Pro Drive | | U/W NCF DSCR: | | 2.68x |
| Grapevine, TX 76051 | | U/W NOI Debt Yield: | | 18.0% |
agreement within 60 days, or the bankruptcy action is discharged or dismissed within 90 days without any adverse consequences to the property or loan; or
| ● | with regard to clause (iv), (a) the NOI DY being at least 13.75% or greater for two consecutive calendar quarters or (b) the borrower has either (x) partially prepaid the Grapevine Mills Whole Loan (with payment of a yield maintenance if partial prepayment occurs prior to July 1, 2027), (y) delivered cash to the lender or (z) delivered a letter of credit to the lender, in each case in an amount that if subtracted from the outstanding principal balance of the Grapevine Mills Whole Loan would cause the debt yield to equal or exceed 13.75% for two consecutive calendar quarters. |
Real Estate Substitution. Not permitted.
Property Management. The Grapevine Mills Property is managed by Simon Management Associates II, LLC, an affiliate of the borrower.
Subordinate and Mezzanine Indebtedness. None.
PACE Loan. The Grapevine Mills Whole Loan documents permit the borrowers to enter into a property assessed clean energy loan for an amount not to exceed $5,000,000, subject to the consent of the lender and delivery of a rating agency confirmation.
Partial Release. Not permitted.
Ground Lease. None.
Rights of First Offer / Rights of First Refusal. None.
Letter of Credit. None.
Terrorism Insurance. The Grapevine Mills Whole Loan documents require that the “all risk” insurance policy required to be maintained by the borrower provides coverage for terrorism in an amount equal to the full replacement cost of the property, as well as business interruption insurance covering no less than the 24-month period following the occurrence of a casualty event, together with a 365 day extended period of indemnity (provided that if TRIPRA or a similar statute is not in effect, the borrower will not be obligated to pay terrorism insurance premiums in excess of two times the annual premium for the property and business interruption/rental loss insurance coverage). See “Risk Factors—Risks Relating to the Mortgage Loans—Terrorism Insurance May Not Be Available for All Mortgaged Properties” in the prospectus.
| THE INFORMATION IN THIS STRUCTURAL AND COLLATERAL TERM SHEET IS NOT COMPLETE AND MAY BE AMENDED PRIOR TO THE TIME OF SALE. THIS TERM SHEET IS NOT AN OFFER TO SELL THESE SECURITIES AND IT IS NOT A SOLICITATION OF AN OFFER TO BUY THESE SECURITIES IN ANY JURISDICTION WHERE THE OFFER OR SALE IS NOT PERMITTED. |
| | 48 | |
| Hospitality – Full Service | Loan #3 | Cut-off Date Balance: | | $59,952,149 |
8400 Costa Verde Drive Myrtle Beach, SC 29572 | Marriott Myrtle Beach Grande Dunes Resort | Cut-off Date LTV: U/W NCF DSCR: U/W NOI Debt Yield: | | 44.8% 2.69x 21.4% |

| THE INFORMATION IN THIS STRUCTURAL AND COLLATERAL TERM SHEET IS NOT COMPLETE AND MAY BE AMENDED PRIOR TO THE TIME OF SALE. THIS TERM SHEET IS NOT AN OFFER TO SELL THESE SECURITIES AND IT IS NOT A SOLICITATION OF AN OFFER TO BUY THESE SECURITIES IN ANY JURISDICTION WHERE THE OFFER OR SALE IS NOT PERMITTED. |
| | 49 | |
| Hospitality – Full Service | Loan #3 | Cut-off Date Balance: | | $59,952,149 |
8400 Costa Verde Drive Myrtle Beach, SC 29572 | Marriott Myrtle Beach Grande Dunes Resort | Cut-off Date LTV: U/W NCF DSCR: U/W NOI Debt Yield: | | 44.8% 2.69x 21.4% |
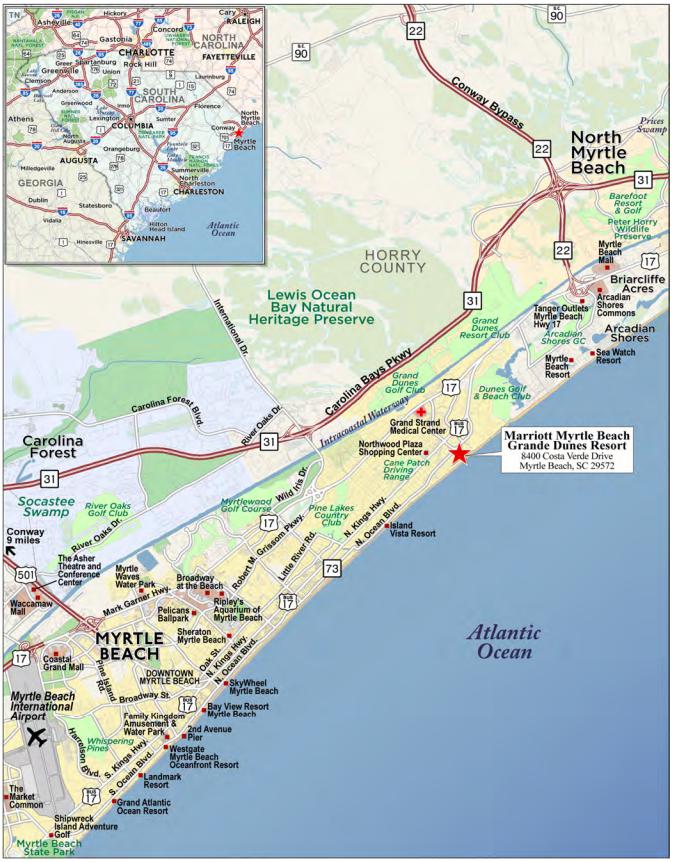
| THE INFORMATION IN THIS STRUCTURAL AND COLLATERAL TERM SHEET IS NOT COMPLETE AND MAY BE AMENDED PRIOR TO THE TIME OF SALE. THIS TERM SHEET IS NOT AN OFFER TO SELL THESE SECURITIES AND IT IS NOT A SOLICITATION OF AN OFFER TO BUY THESE SECURITIES IN ANY JURISDICTION WHERE THE OFFER OR SALE IS NOT PERMITTED. |
| | 50 | |
| No. 3 – Marriott Myrtle Beach Grande Dunes Resort |
| Mortgage Loan Information | | Mortgaged Property Information |
| Mortgage Loan Seller: | Wells Fargo Bank, National Association, JPMorgan Chase Bank, National Association | | Single Asset/Portfolio: | Single Asset |
Credit Assessment (Fitch/KBRA/Moody’s): | BBBsf/BBB+(sf)/Baa1(sf) | | Property Type – Subtype: | Hospitality – Full Service |
| Original Principal Balance(1): | $60,000,000 | | Location: | Myrtle Beach, SC |
| Cut-off Date Balance(1): | $59,952,149 | | Size: | 405 Rooms |
| % of Initial Pool Balance: | 8.4% | | Cut-off Date Balance Per Room(1): | $246,717 |
| Loan Purpose: | Refinance | | Maturity Date Balance Per Room(1): | $210,714 |
| Borrower Sponsors: | William J. Yung III, Martha Yung, William J. Yung IV, Joseph A. Yung, Julie A. Haught, Judith A. Yung, Jennifer A. Yung, Michelle M. Christensen and Scott A. Yung | | Year Built/Renovated: | 2003/2017 |
| Guarantor: | CSC Holdings, LLC | | Title Vesting: | Fee |
| Mortgage Rate: | 6.1450% | | Property Manager: | Crestview Management, LLC (borrower affiliate) |
| Note Date: | July 2, 2024 | | Current Occupancy (As of): | 70.1% (5/31/2024) |
| Seasoning: | 1 month | | YE 2023 Occupancy: | 69.8% |
| Maturity Date: | July 11, 2034 | | YE 2022 Occupancy: | 70.3% |
| IO Period: | 0 months | | YE 2021 Occupancy: | 68.9% |
| Loan Term (Original): | 120 months | | YE 2020 Occupancy: | 43.7% |
| Amortization Term (Original): | 360 months | | As-Complete Appraised Value(4): | $223,000,000 |
| Loan Amortization Type: | Amortizing Balloon | | As-Complete Appraised Value Per Room(4): | $550,617 |
| Call Protection(2): | L(25),D(88),O(7) | | As-Complete Appraisal Valuation Date(4): | April 25, 2025 |
| Lockbox Type: | Hard/Springing Cash Management | | Underwriting and Financial Information |
| Additional Debt(1): | Yes | | TTM NOI (5/31/2024): | $21,303,274 |
| Additional Debt Type (Balance) (1): | Pari Passu ($39,968,099) | | YE 2023 NOI: | $20,377,776 |
| | | | YE 2022 NOI : | $20,508,347 |
| | | | YE 2021 NOI: | $17,490,093 |
| | | | U/W Revenues: | $43,678,921 |
| Escrows and Reserves(3) | | U/W Expenses: | $22,286,435 |
| | Initial | Monthly | Cap | | U/W NOI: | $21,392,485 |
| Taxes | $471,205 | $67,315 | NAP | | U/W NCF: | $19,645,328 |
| Insurance | $0 | Springing | NAP | | U/W DSCR based on NOI/NCF(1): | 2.93x / 2.69x |
| Immediate Repairs | $282,257 | $0 | NAP | | U/W Debt Yield based on NOI/NCF(1): | 21.4% / 19.7% |
| FF&E Reserve | $0 | $142,701 | NAP | | U/W Debt Yield at Maturity based on NOI/NCF(1): | 25.1% / 23.0% |
| PIP Reserve | $5,266,281 | Springing | NAP | | Cut-off Date LTV Ratio(4): | 44.8% |
| Seasonality Reserve | $825,000 | $275,000 | $1,650,000 | | LTV Ratio at Maturity(4): | 38.3% |
| Replacement Comfort Letter Reserve Funds | $2,500 | $0 | NAP | | | |
| | | | | | | | |
| Sources and Uses |
| Sources | | | | | Uses | | | |
| Loan Amount | $100,000,000 | | 97.7 | % | | Loan Payoff | $95,070,064 | | 92.8% |
| Borrower Equity Contribution | 2,395,813 | | 2.3 | | | Upfront Reserves | 6,847,243 | | 6.7 |
| | | | | | Closing Costs | 478,506 | | 0.5 |
| | | | | | | | | |
| Total Sources | $102,395,813 | | 100.0 | % | | Total Uses | $102,395,813 | | 100.0% |
| (1) | The Marriott Myrtle Beach Grande Dunes Resort Mortgage Loan (as defined below) is part of a whole loan evidenced by four pari passu promissory notes with an aggregate original principal balance of $100,000,000 (the “Marriott Myrtle Beach Grande Dunes Resort Whole Loan”). The financial information presented in the chart above is based on the Marriott Myrtle Beach Grande Dunes Resort Whole Loan. |
| (2) | Prepayment of the Marriott Myrtle Beach Grande Dunes Resort Whole Loan is permitted at any time after the earlier to occur of (a) the end of the two-year period commencing on the closing date of the securitization of the last promissory note representing a portion of the Marriott Myrtle Beach Grande Dunes Resort Whole Loan to be securitized and (b) July 1, 2027. |
| (3) | See “Escrows” section. |
| (4) | The Appraised Value represents the As-Complete Value, which assumes the PIP (as defined below) has been completed. The Marriott Myrtle Beach Grande Dunes Resort Whole Loan documents required an upfront PIP Reserve equal to 112% of the estimated cost to complete the PIP work. The As-Is Value of $209,000,000 equates to an Appraised Value Per Room of $516,049, a Cut-off Date LTV Ratio of 47.8% and a Maturity Date LTV Ratio of 40.8%. |
| THE INFORMATION IN THIS STRUCTURAL AND COLLATERAL TERM SHEET IS NOT COMPLETE AND MAY BE AMENDED PRIOR TO THE TIME OF SALE. THIS TERM SHEET IS NOT AN OFFER TO SELL THESE SECURITIES AND IT IS NOT A SOLICITATION OF AN OFFER TO BUY THESE SECURITIES IN ANY JURISDICTION WHERE THE OFFER OR SALE IS NOT PERMITTED. |
| | 51 | |
| Hospitality – Full Service | Loan #3 | Cut-off Date Balance: | | $59,952,149 |
8400 Costa Verde Drive Myrtle Beach, SC 29572 | Marriott Myrtle Beach Grande Dunes Resort | Cut-off Date LTV: U/W NCF DSCR: U/W NOI Debt Yield: | | 44.8% 2.69x 21.4% |
The Mortgage Loan. The third largest mortgage loan (the “Marriott Myrtle Beach Grande Dunes Resort Mortgage Loan”) is part of a fixed rate whole loan evidenced by four pari passu promissory notes with an aggregate outstanding principal balance as of the Cut-off Date of $100,000,000. The Marriott Myrtle Beach Grande Dunes Resort Whole Loan is secured by the borrower’s first priority fee interest in a 405 room full-service hotel located in Myrtle Beach, South Carolina (the “Marriott Myrtle Beach Grande Dunes Resort Property”). The Marriott Myrtle Beach Grande Dunes Resort Whole Loan was co-originated by Wells Fargo Bank, National Association (“WFB”) and JPMorgan Chase Bank, National Association (“JPMCB”) and has an original aggregate principal balance of $100,000,000. The Marriott Myrtle Beach Grande Dunes Resort Mortgage Loan is comprised of controlling note A-1 and the non-controlling Note A-2 with an aggregate principal balance of $60,000,000. The Marriott Myrtle Beach Grande Dunes Resort Mortgage Loan will be serviced under the pooling and servicing agreement for the WFCM 2024-C63 securitization trust. See “Description of the Mortgage Pool—The Whole Loans—The Serviced Pari Passu Whole Loans” and “Pooling and Servicing Agreement” in the prospectus.
Whole Loan Note Summary
| Note | Original Balance | Cut-off Date Balance | Note Holder | Controlling Piece |
| A-1 | $45,000,000 | $44,964,112 | WFCM 2024-C63 | Yes |
| A-2 | $15,000,000 | $14,988,037 | WFCM 2024-C63 | No |
| A-3(1) | $30,000,000 | $29,976,074 | WFB | No |
| A-4(1) | $10,000,000 | $9,992,025 | JPM | No |
| Total | $100,000,000 | $99,920,248 | | |
| (1) | Expected to be contributed to one or more future securitization(s). |
The Borrower and Borrower Sponsors. The borrower is Columbia Properties Myrtle Beach, LLC, a single-purpose, Delaware limited liability company with two independent directors. Legal counsel to the borrower delivered a non-consolidation opinion in connection with the origination of the Marriott Myrtle Beach Grande Dunes Resort Whole Loan.
The borrower sponsors are William J. Yung III, Martha Yung, William J. Yung IV, Joseph A. Yung, Julie A. Haught, Judith A. Yung, Jennifer A. Yung, Michelle M. Christensen and Scott A. Yung. The non-recourse carveout guarantor is CSC Holdings, LLC, an affiliate of Columbia Sussex Corporation (“CSC”). Founded in 1972, CSC is a privately owned hospitality company headquartered in Crestview Hills, Kentucky. CSC currently owns 42 hotels across 18 states with major hospitality brands including Marriott, Hilton, and Hyatt.
CSC has had numerous foreclosures and deeds in lieu since 2010. For additional information please see “Description of the Mortgage Pool l—Loan Purpose; Default History, Bankruptcy Issues and Other Proceedings”.
The Property. The Marriott Myrtle Beach Grande Dunes Resort Property is a 405-room, full-service, beachfront hotel located in Myrtle Beach, South Carolina. The borrower sponsor developed the property in 2003 and has invested approximately $14.6 million ($36,049/room) in capital improvements over the past 10 years. If the franchise agreement is terminated, the borrower is obligated to pay the unamortized portion of Key Money. Amenities include approximately 24,162 square feet of meeting space, multiple food and beverage outlets, indoor and outdoor swimming pools, a beachfront setting, a fitness center, a business center, the Hibiscus Spa, guest laundry, a sundries shop, kids activities, a game room, and complimentary Wi-Fi. The Marriott Myrtle Beach Grande Dunes Resort Property guestroom configuration consists of 255 queen/queen rooms, 142 king rooms and 8 mixed rooms. The guestrooms feature marble bathrooms, flat-screen televisions, telephones, desks, dressers, nightstands, lamps, and lounge chair. Situated on a 10.9-acre site, the property includes surface and garage parking totaling 432 parking spaces (parking ratio of 1.1/room). The Marriott Myrtle Beach Grande Dunes Resort Property operates under a Marriott International, Inc. franchise agreement which expires in 2044.
Between 2024 and 2025, the property will undergo a relicensing Property Improvement Plan (“PIP”) for an estimated cost of $4.7 million. Within 30 days following the franchisor’s confirmation that the PIP work has been completed, the franchisor must pay $2,500,000 to the borrower (“Key Money”).
As of May 31, 2024, the Marriott Myrtle Beach Grande Dunes Resort Property had a trailing 12-month occupancy of 70.1%, ADR of $259.85 and RevPAR of $182.19. Total revenue at the Marriott Myrtle Beach Grande Dunes Resort Property is comprised of three components: rooms (61.7% of underwritten revenue), food and beverage (29.4% of underwritten revenue) and other operated departments (8.9% of underwritten revenue). According to the appraisal, the demand segmentation in 2023 for the Marriott Myrtle Beach Grande Dunes Resort Property was 70% leisure and 30% group.
| THE INFORMATION IN THIS STRUCTURAL AND COLLATERAL TERM SHEET IS NOT COMPLETE AND MAY BE AMENDED PRIOR TO THE TIME OF SALE. THIS TERM SHEET IS NOT AN OFFER TO SELL THESE SECURITIES AND IT IS NOT A SOLICITATION OF AN OFFER TO BUY THESE SECURITIES IN ANY JURISDICTION WHERE THE OFFER OR SALE IS NOT PERMITTED. |
| | 52 | |
| Hospitality – Full Service | Loan #3 | Cut-off Date Balance: | | $59,952,149 |
8400 Costa Verde Drive Myrtle Beach, SC 29572 | Marriott Myrtle Beach Grande Dunes Resort | Cut-off Date LTV: U/W NCF DSCR: U/W NOI Debt Yield: | | 44.8% 2.69x 21.4% |
The following table presents historical occupancy, ADR, and RevPAR penetration rates of the Marriott Myrtle Beach Grande Dunes Resort Property:
| Historical Occupancy, ADR, RevPAR(1)(2) |
| | | Competitive Set | | Marriott Myrtle Beach Grande Dunes Resort Property(3) | | Penetration Factor |
| Year | | Occupancy | ADR | RevPAR | | Occupancy | ADR | RevPAR | | Occupancy | ADR | RevPAR |
| 12/31/2022 TTM | | 62.9% | $177.03 | $111.27 | | 72.0% | $247.39 | $178.06 | | 114.5% | 139.7% | 160.0% |
| 12/31/2023 TTM | | 66.5% | $176.50 | $117.30 | | 69.8% | $254.38 | $177.53 | | 105.0% | 144.1% | 151.4% |
| 3/31/2024 TTM | | 65.8% | $190.41 | $125.28 | | 69.9% | $258.22 | $180.38 | | 106.2% | 135.6% | 144.0% |
| | | | | | | | | | | | | | | | | | | |
| (1) | Information obtained from a third-party research report. |
| (2) | According to a third-party research report, the competitive set includes Embassy Suites by Hilton Myrtle Beach Oceanfront Resort, Hilton Myrtle Beach Resort, Sheraton Hotel Myrtle Beach, The Breakers Resort and Marina Inn at Grande Dunes. |
| (3) | The variances between the underwriting, the appraisal and industry report data with respect to occupancy, ADR and RevPAR at the Marriott Myrtle Beach Grande Dunes Resort Property are attributable to variances in reporting methodology and/or timing differences. |
The following table presents historical occupancy percentages at Marriott Myrtle Beach Grande Dunes Resort Property:
Historical Occupancy(1)
12/31/2020 | 12/31/2021 | 12/31/2022 | 12/31/2023 | 5/31/2024 |
| 43.7% | 68.9% | 70.3% | 69.8% | 70.1% |
| (1) | Information obtained from the historical operating statements. |
| THE INFORMATION IN THIS STRUCTURAL AND COLLATERAL TERM SHEET IS NOT COMPLETE AND MAY BE AMENDED PRIOR TO THE TIME OF SALE. THIS TERM SHEET IS NOT AN OFFER TO SELL THESE SECURITIES AND IT IS NOT A SOLICITATION OF AN OFFER TO BUY THESE SECURITIES IN ANY JURISDICTION WHERE THE OFFER OR SALE IS NOT PERMITTED. |
| | 53 | |
| Hospitality – Full Service | Loan #3 | Cut-off Date Balance: | | $59,952,149 |
8400 Costa Verde Drive Myrtle Beach, SC 29572 | Marriott Myrtle Beach Grande Dunes Resort | Cut-off Date LTV: U/W NCF DSCR: U/W NOI Debt Yield: | | 44.8% 2.69x 21.4% |
Operating History and Underwritten Net Cash Flow. The following table presents certain information relating to the historical operating performance and underwritten net cash flow at the Marriott Myrtle Beach Grande Dunes Resort Property:
Cash Flow Analysis
| | 2021 | 2022 | 2023 | TTM 5/31/2024 | U/W | % of U/W Total Revenue(1) | U/W $ per Room |
| Occupancy | 68.9% | 70.3% | 69.8% | 70.1% | 70.1% | | |
| ADR | $227.88 | $248.29 | $258.13 | $259.85 | $259.85 | | |
| RevPAR | $157.09 | $174.45 | $180.23 | $182.19 | $182.19 | | |
| | | | | | | | |
| Room Revenue | $23,222,557 | $25,788,124 | $26,642,174 | $27,006,556 | $26,932,768 | 61.7% | $66,501 |
| Food & Beverage Revenue | 8,450,102 | 11,296,408 | 11,766,240 | 12,852,163 | 12,852,163 | 29.4 | 31,734 |
| Other Revenue(2) | 3,350,442 | 3,830,026 | 3,959,240 | 3,893,990 | 3,893,990 | 8.9 | 9,615 |
| Total Revenue | $35,023,101 | $40,914,558 | $42,367,654 | $43,752,709 | $43,678,921 | 100.0% | $107,849 |
| | | | | | | | |
| Room Expense | 3,821,683 | 4,262,086 | 4,341,614 | 4,348,115 | 4,336,235 | 16.1 | 10,707 |
| Food & Beverage Expense | 3,496,066 | 4,170,768 | 4,389,877 | 4,617,428 | 4,617,428 | 35.9 | 11,401 |
| Other Department Expense | 738,817 | 971,226 | 1,052,534 | 1,034,334 | 1,034,334 | 26.6 | 2,554 |
| Total Department Expenses | $8,056,566 | $9,404,079 | $9,784,025 | $9,999,877 | $9,987,997 | 22.9% | $24,662 |
| Gross Operating Income | $26,966,536 | $31,510,479 | $32,583,630 | $33,752,832 | $33,690,924 | 77.1% | $83,187 |
| | | | | | | | |
| Total Undistributed Expenses | 7,948,451 | 9,287,630 | 10,081,923 | 10,251,551 | 10,292,719 | 23.6 | 25,414 |
| Gross Operating Profit | $19,018,085 | $22,222,849 | $22,501,707 | $23,501,281 | $23,398,204 | 53.6% | $57,773 |
| | | | | | | | |
| Property Taxes | 759,191 | 788,552 | 797,080 | 742,637 | 797,080 | 1.8 | 1,968 |
| Insurance | 768,800 | 925,949 | 1,326,851 | 1,455,370 | 1,208,639 | 2.8 | 2,984 |
| Total Operating Expenses | $17,533,008 | $20,406,211 | $21,989,878 | $22,449,435 | $22,286,435 | 51.0% | $55,028 |
| | | | | | | | |
| Net Operating Income | $17,490,093(3) | $20,508,347(3) | $20,377,776 | $21,303,274 | $21,392,485 | 49.0% | $52,821 |
| FF&E | 0 | 0 | 0 | 0 | 1,747,157 | 4.0 | 4,314 |
| Net Cash Flow | $17,490,093 | $20,508,347 | $20,377,776 | $21,303,274 | $19,645,328 | 45.0% | $48,507 |
| | | | | | | | |
| NOI DSCR | 2.39x | 2.81x | 2.79x | 2.92x | 2.93x | | |
| NCF DSCR | 2.39x | 2.81x | 2.79x | 2.92x | 2.69x | | |
| NOI DY | 17.5% | 20.5% | 20.4% | 21.3% | 21.4% | | |
| NCF DY | 17.5% | 20.5% | 20.4% | 21.3% | 19.7% | | |
| (1) | % of U/W Total Revenue for Room Expense, Food & Beverage Expense, and Other Department Expenses are based on their corresponding revenue line items. All other line items represent percent of Total Revenue. |
| (2) | Other revenue consists primarily of spa revenue, gift shop sales, parking, resort fees, and other miscellaneous income. |
| (3) | The increase in NOI from 2021 to 2022 was primarily due to the effect of the novel coronavirus on the hospitality industry in 2020 and 2021, and the subsequent recovery in 2021 and 2022, as well as an increase in ADR from $228 in 2021 to $248 in 2022 and increased Food & Beverage. |
Appraisal. The appraised value represents the As-Complete Value as of April 25, 2025 of $223,000,000, which assumes the PIP has been completed. The loan documents required an upfront PIP Reserve equal to 112% of the estimated cost to complete the PIP work. The As-Is Value of $209,000,000 equates to an appraised value per room of $516,049, a Cut-off Date LTV Ratio of 47.8% and a Maturity Date LTV Ratio of 40.8%.
Environmental Matters. According to the Phase I environmental site assessment dated May 1, 2024, there was no evidence of any recognized environmental conditions at the Marriott Myrtle Beach Grande Dunes Resort Property.
Market Overview and Competition. The Marriott Myrtle Beach Grande Dunes Resort Property is a beachfront hotel located along North Ocean Boulevard with frontage on the coast of Myrtle Beach, South Carolina. The property is approximately 6.7 miles northeast of the US 501 and US 17 interchange and 8.1 miles northeast of the Myrtle Beach International Airport. Additionally, the property is approximately 4.5 miles northeast of the Broadway at the Beach entertainment and shopping complex and 3.2 miles southwest of the SC 22 and Kings Highway interchange which is home to the Tanger Outlets Mall, Myrtle Beach Mall, and Arcadian Shores Commons retail center. Myrtle Beach is a coastal, beach town located roughly 23 miles south of the North Carolina state line and approximately 85-miles north of Charleston. Myrtle Beach sits at the center of what is known as “The Grand Strand”, a 60-mile arc-shaped stretch of coastline in northeastern South Carolina.
According to the appraisal, the 2023 population within a one, three- and five-mile radius of the property was 3,642, 20,633 and 41,811, respectively and the 2023 average household income within the radii was $107,332, $95,503 and $87,586, respectively.
The appraisal did not identify any new hotels under construction or planned for near term development that are expected to directly compete with the Marriott Myrtle Beach Grande Dunes Resort Property.
| THE INFORMATION IN THIS STRUCTURAL AND COLLATERAL TERM SHEET IS NOT COMPLETE AND MAY BE AMENDED PRIOR TO THE TIME OF SALE. THIS TERM SHEET IS NOT AN OFFER TO SELL THESE SECURITIES AND IT IS NOT A SOLICITATION OF AN OFFER TO BUY THESE SECURITIES IN ANY JURISDICTION WHERE THE OFFER OR SALE IS NOT PERMITTED. |
| | 54 | |
| Hospitality – Full Service | Loan #3 | Cut-off Date Balance: | | $59,952,149 |
8400 Costa Verde Drive Myrtle Beach, SC 29572 | Marriott Myrtle Beach Grande Dunes Resort | Cut-off Date LTV: U/W NCF DSCR: U/W NOI Debt Yield: | | 44.8% 2.69x 21.4% |
The table below presents certain information relating to comparable sales pertaining to the Marriott Myrtle Beach Grande Dunes Resort Property identified by the appraisal:
| Comparable Sales Summary |
Property Name | Location | Year Built | Rooms | Sale Date | Sale Price / Room |
| Sirata Beach & Conference Center | 5300 Gulf Boulevard St. Pete Beach, FL | 1962 | 382 | 11/2022 | $541,885 |
| DoubleTree Resort by Hilton | 3200 South Ocean Boulevard Myrtle Beach, SC | 1992 | 491 | 9/2022 | $185,336 |
| Confidante Miami Beach | 4041 Collins Avenue Miami Beach, FL | 1957 | 339 | 5/2022 | $684,366 |
| DoubleTree by Hilton North Redington Beach | 17120 Gulf Boulevard North Redington Beach, FL | 1987 | 125 | 5/2022 | $658,400 |
| Postcard Inn | 6300 Gulf Boulevard St. Pete Beach, FL | 1957 | 196 | 2/2022 | $423,469 |
| Holiday Inn Resort | 701 North Beachview Drive Jekyll Island, GA | 1986 | 157 | 1/2022 | $261,146 |
| Henderson Beach Resort | 200 Henderson Resort Way Destin, FL | 2016 | 170 | 12/2021 | $661,765 |
| Jekyll Island Club Resort | 371 Riverview Drive Jekyll Island, GA | 1888 and 2017 | 200 | 7/2021 | $470,000 |
Source: Appraisal
Escrows.
Real Estate Taxes – The loan documents require an upfront deposit of $471,205 and ongoing monthly deposits of $67,315 for real estate taxes.
Insurance – The loan documents require ongoing monthly insurance reserve in an amount equal to 1/12 of the insurance premiums that the lender reasonably estimates will be payable during the next ensuing 12 months. Notwithstanding the above, the borrower’s obligation to make insurance reserve payments will be waived so long as (i) no event of default is continuing, (ii) the insurance policies maintained by the borrower are part of a blanket or umbrella policy approved by the lender in its reasonable discretion, (iii) borrower provides lender with evidence of renewal of such policies and (iv) the lender is provided with paid receipts for the payment of the insurance premiums no later than 30 days after to the expiration dates of said policies.
Immediate Repairs - The loan documents require an upfront deposit of $282,257 for immediate repairs at the property.
FF&E Reserve - The loan documents require ongoing monthly deposits in an amount equal to the greater of (i) the then-existing FF&E reserve monthly deposit or (ii) 1/12th of 4% of the underwritten revenue for the preceding fiscal year, initially estimated at $142,701.
Seasonality Reserve – The loan documents require an upfront deposit of $825,000, which may be used for disbursements for the payment of any part of the monthly debt service payments occurring in December, January, February and/or March, to the extent that there is insufficient cash flow from Marriott Myrtle Beach Grande Dunes Resort Property to make the monthly debt service payment.
On each monthly payment date occurring in May, June, July, August, September and October, the borrower is required to deposit with lender amount equal to $275,000 (the “Seasonality Reserve Deposit Amount”), capped at $1,650,000 (the “Seasonality Reserve Required Annual Balance”).
Upon receipt of the annual operating statements for the property, lender may adjust the Seasonality Reserve Required Annual Balance (and thus the Seasonality Reserve Deposit Amount), upon notice to borrower, to an amount equal to the shortfall in revenue from the property to cover debt service at a DSCR of 1.30x.
PIP Reserve - The loan documents require an upfront deposit of $5,266,281, if at any time, PIP work is required under the franchise agreement, the borrower is required to deposit, within 15 days after receipt of notice from the franchisor, an amount equal to 110% of the estimated cost to complete the PIP work.
Replacement Comfort Letter Reserve - The loan documents require an upfront deposit of $2,500 to obtain a replacement or reissued franchisor comfort letter in connection with any secondary market transaction.
Lockbox and Cash Management. The Marriott Myrtle Beach Grande Dunes Resort Whole Loan is structured with a hard lockbox and springing cash management. The borrower is required to deliver direction letters to each of the credit card companies with which borrower has entered into a merchant’s or other credit card agreement directing them to pay to the lender-controlled lockbox account all payments which would otherwise be paid to borrower under the applicable credit card processing agreement. The borrower and
| THE INFORMATION IN THIS STRUCTURAL AND COLLATERAL TERM SHEET IS NOT COMPLETE AND MAY BE AMENDED PRIOR TO THE TIME OF SALE. THIS TERM SHEET IS NOT AN OFFER TO SELL THESE SECURITIES AND IT IS NOT A SOLICITATION OF AN OFFER TO BUY THESE SECURITIES IN ANY JURISDICTION WHERE THE OFFER OR SALE IS NOT PERMITTED. |
| | 55 | |
| Hospitality – Full Service | Loan #3 | Cut-off Date Balance: | | $59,952,149 |
8400 Costa Verde Drive Myrtle Beach, SC 29572 | Marriott Myrtle Beach Grande Dunes Resort | Cut-off Date LTV: U/W NCF DSCR: U/W NOI Debt Yield: | | 44.8% 2.69x 21.4% |
property manager are required to deposit all revenue generated by the Marriott Myrtle Beach Grande Dunes Resort Property into the lender-controlled lockbox account within three business days of receipt. All funds deposited into the lockbox are required to be transferred on each business day to or at the direction of the borrower unless a Cash Trap Event Period (as defined below) exists. Upon the occurrence and during the continuance of a Cash Trap Event Period, all funds in the lockbox account are required to be swept on each business day to a cash management account under the control of the lender to be applied and disbursed in accordance with the Marriott Myrtle Beach Grande Dunes Resort documents, and all excess cash flow funds remaining in the cash management account after the application of such funds in accordance with the Marriott Myrtle Beach Grande Dunes Resort documents may be held by the lender in an excess cash flow reserve account as additional collateral for the Marriott Myrtle Beach Grande Dunes Resort Whole Loan.
A “Cash Trap Event Period” will commence upon the earlier of the following:
| (i) | an event of default; or |
| (ii) | the net cash flow debt service coverage ratio (“NCF DSCR”) falling below 1.20x, tested quarterly. |
A Cash Trap Event Period will end upon the occurrence of the following:
| ● | with regard to clause (i), the cure of such event of default; or |
| ● | with regard to clause (ii), upon the NCF DSCR is equal to or greater than 1.20x for one calendar quarter. |
Property Management. The Marriott Myrtle Beach Grande Dunes Resort Property is managed by Crestview Management, LLC, an affiliate of the borrower.
Partial Release. Not permitted.
Real Estate Substitution. Not permitted.
Subordinate and Mezzanine Indebtedness. None.
Ground Lease. None.
Right of First Offer/Right of First Refusal. Marriott International, Inc., as franchisor, has a conditional Right of First Refusal (“ROFR”) to acquire the Marriott Myrtle Beach Grande Dunes Resort Property if there is a transfer of the hotel or controlling direct or indirect interest in the Borrower to a competitor (generally, any person that exclusively develops, operates or franchises through or with a competitor of franchisor comprising at least 10 luxury hotels, 20 full-service hotels or 50 limited-service hotels). The ROFR is not extinguished by foreclosure or deed-in-lieu thereof, and if there is a transfer to a competitor by foreclosure, or if franchisee or its affiliates become a competitor, franchisor has right to purchase hotel upon notice to franchisee. The franchisor comfort letter provides that, if lender exercises remedies against franchisee, lender may appoint a lender affiliate to acquire the property and enter into a management or franchise agreement if it is not competitor or competitor affiliate; provided, however, that a lender affiliate will not be deemed a competitor simply due to its ownership of multiple or competing hotels or having engaged managers to manage such other hotels.
Terrorism Insurance. The Marriott Myrtle Beach Grande Dunes Resort Whole Loan documents require an “all risk” insurance policy on a replacement cost basis, together with (i) business interruption insurance covering no less than the 18-month period following the occurrence of a casualty event, together with a 12-month extended period of indemnity, (ii) windstorm and /or named storm coverage with a deductible up to 5% of the total insurable value, and (iii) terrorism coverage as defined by TRIPRA. See “Risk Factors—Risks Relating to the Mortgage Loans—Terrorism Insurance May Not Be Available for All Mortgaged Properties” in the prospectus.
| THE INFORMATION IN THIS STRUCTURAL AND COLLATERAL TERM SHEET IS NOT COMPLETE AND MAY BE AMENDED PRIOR TO THE TIME OF SALE. THIS TERM SHEET IS NOT AN OFFER TO SELL THESE SECURITIES AND IT IS NOT A SOLICITATION OF AN OFFER TO BUY THESE SECURITIES IN ANY JURISDICTION WHERE THE OFFER OR SALE IS NOT PERMITTED. |
| | 56 | |
| Office - Suburban | Loan #4 | Cut-off Date Balance: | | $55,000,000 |
| 610 Newport Center Drive | 610 Newport Center | Cut-off Date LTV: | | 44.5% |
| Newport Beach, CA 92660 | | UW NCF DSCR: | | 2.92x |
| | | UW NOI Debt Yield: | | 17.2% |
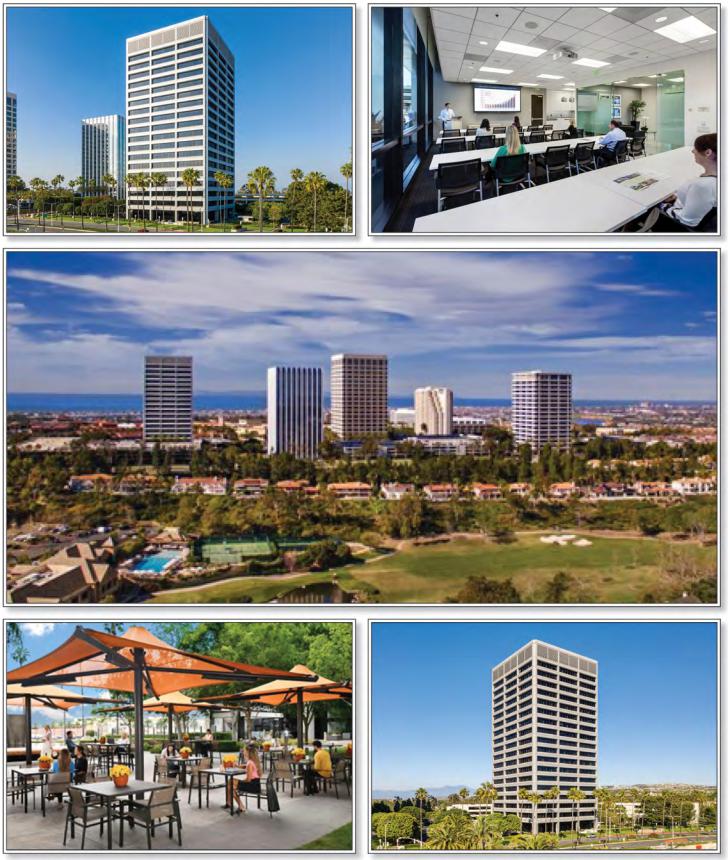
| THE INFORMATION IN THIS STRUCTURAL AND COLLATERAL TERM SHEET IS NOT COMPLETE AND MAY BE AMENDED PRIOR TO THE TIME OF SALE. THIS TERM SHEET IS NOT AN OFFER TO SELL THESE SECURITIES AND IT IS NOT A SOLICITATION OF AN OFFER TO BUY THESE SECURITIES IN ANY JURISDICTION WHERE THE OFFER OR SALE IS NOT PERMITTED. |
| | 57 | |
| Office - Suburban | Loan #4 | Cut-off Date Balance: | | $55,000,000 |
| 610 Newport Center Drive | 610 Newport Center | Cut-off Date LTV: | | 44.5% |
| Newport Beach, CA 92660 | | UW NCF DSCR: | | 2.92x |
| | | UW NOI Debt Yield: | | 17.2% |

| THE INFORMATION IN THIS STRUCTURAL AND COLLATERAL TERM SHEET IS NOT COMPLETE AND MAY BE AMENDED PRIOR TO THE TIME OF SALE. THIS TERM SHEET IS NOT AN OFFER TO SELL THESE SECURITIES AND IT IS NOT A SOLICITATION OF AN OFFER TO BUY THESE SECURITIES IN ANY JURISDICTION WHERE THE OFFER OR SALE IS NOT PERMITTED. |
| | 58 | |
| Office - Suburban | Loan #4 | Cut-off Date Balance: | | $55,000,000 |
| 610 Newport Center Drive | 610 Newport Center | Cut-off Date LTV: | | 44.5% |
| Newport Beach, CA 92660 | | UW NCF DSCR: | | 2.92x |
| | | UW NOI Debt Yield: | | 17.2% |
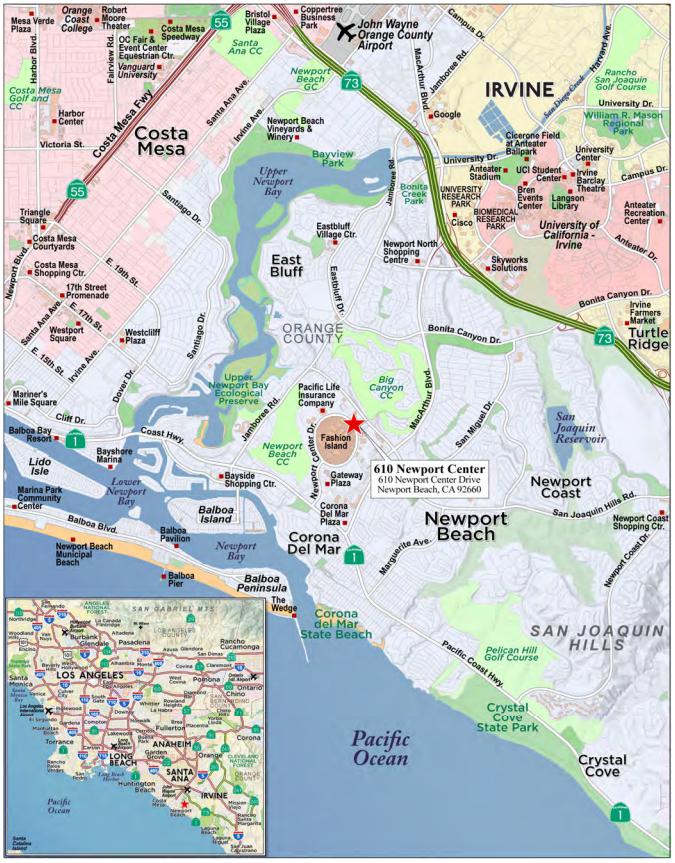
| THE INFORMATION IN THIS STRUCTURAL AND COLLATERAL TERM SHEET IS NOT COMPLETE AND MAY BE AMENDED PRIOR TO THE TIME OF SALE. THIS TERM SHEET IS NOT AN OFFER TO SELL THESE SECURITIES AND IT IS NOT A SOLICITATION OF AN OFFER TO BUY THESE SECURITIES IN ANY JURISDICTION WHERE THE OFFER OR SALE IS NOT PERMITTED. |
| | 59 | |
| No. 4 – 610 Newport Center |
| Mortgage Loan Information | | Mortgaged Property Information |
| Mortgage Loan Seller: | Wells Fargo Bank, National Association & JPMorgan Chase Bank, National Association | | Single Asset/Portfolio: | Single Asset |
Credit Assessment (Fitch/KBRA/Moody’s): | A-sf/BBB(sf)/Baa2(sf) | | Property Type – Subtype: | Office - Suburban |
| Original Principal Balance(1): | $55,000,000 | | Location: | Newport Beach, CA |
| Cut-off Date Balance(1): | $55,000,000 | | Size: | 285,638 SF |
| % of Initial Pool Balance: | 7.7% | | Cut-off Date Balance Per SF(1): | $297.58 |
| Loan Purpose: | Recapitalization | | Maturity Date Balance Per SF(1): | $297.58 |
| Borrower Sponsor: | The Irvine Company LLC | | Year Built/Renovated: | 1972/2022 |
| Guarantor: | Irvine Core Office LLC | | Title Vesting: | Fee |
| Mortgage Rate: | 5.6660% | | Property Manager: | Irvine Management Company (borrower-related) |
| Note Date: | July 9, 2024 | | Current Occupancy (As of): | 92.4% (06/25/2024) |
| Seasoning: | 1 month | | YE 2023 Occupancy: | 93.0% |
| Maturity Date: | July 11, 2034 | | YE 2022 Occupancy: | 95.0% |
| IO Period: | 120 months | | YE 2021 Occupancy: | 94.0% |
| Loan Term (Original): | 120 months | | YE 2020 Occupancy: | 92.0% |
| Amortization Term (Original): | NAP | | As-Is Appraised Value: | $191,000,000 |
| Loan Amortization Type: | Interest Only | | As-Is Appraised Value Per SF: | $668.68 |
| Call Protection(2): | L(24),YM1(1),DorYM1(90),O(5) | | As-Is Appraisal Valuation Date: | May 29, 2024 |
| Lockbox Type: | Hard/Springing Cash Management | | Underwriting and Financial Information |
| Additional Debt(1): | Yes | | TTM NOI (5/31/2024): | $13,285,054 |
| Additional Debt Type (Balance)(1): | Pari Passu ($30,000,000) | | YE 2023 NOI: | $12,293,869 |
| | | | YE 2022 NOI: | $12,015,927 |
| | | | YE 2021 NOI: | $12,165,887 |
| | | | U/W Revenues: | $19,862,232 |
| | | | U/W Expenses: | $5,254,142 |
| Escrows and Reserves(3) | | U/W NOI: | $14,608,090 |
| | Initial | Monthly | Cap | | U/W NCF: | $14,245,278 |
| Taxes | $0 | Springing | NAP | | U/W DSCR based on NOI/NCF(1): | 2.99x/2.92x |
| Insurance | $0 | Springing | NAP | | U/W Debt Yield based on NOI/NCF(1): | 17.2%/16.8% |
| Replacement Reserve | $0 | Springing | NAP | | U/W Debt Yield at Maturity based on NOI/NCF(1): | 17.2%/16.8% |
| TI/LC Reserve | $0 | Springing | NAP | | Cut-off Date LTV Ratio(1): | 44.5% |
| Existing TI/LC Reserve | $1,536,900 | $0 | NAP | | LTV Ratio at Maturity(1): | 44.5% |
| Rent Concession Reserve | $1,046,249 | $0 | NAP | | | |
| | | | | | | |
| | | | | | | | |
| Sources and Uses |
| Sources | | | | | Uses | | | |
| Original Mortgage Loan amount | $85,000,000 | | 100.0% | | Upfront Reserves | $2,583,149 | | 3.0% |
| | | | | | Closing costs | 307,838 | | 0.4% |
| | | | | | Return of Equity(4) | 82,109,013 | | 96.6% |
| | | | | | | | | |
| Total Sources | $85,000,000 | | 100.0% | | Total Uses | $85,000,000 | | 100.0% |
| (1) | The 610 Newport Center Mortgage Loan (as defined below) is part of a whole loan evidenced by six pari passu promissory notes with an aggregate original principal balance of $85,000,000 (the “610 Newport Center Whole Loan”). The financial information presented in the chart above is based on the 610 Newport Center Whole Loan. |
| (2) | The defeasance lockout period will be at least 24 payment dates beginning with and including the first payment date on August 11, 2024. Defeasance of the 610 Newport Center Whole Loan in full is permitted at any time after the earlier to occur of (i) the date that is two years from the closing date of the securitization that includes the last pari passu note of the 610 Newport Center Whole Loan to be securitized and (ii) August 11, 2027. The assumed lockout period of 24 payment dates is based on the expected WFCM 2024-C63 securitization closing date in August 2024. The actual lockout period may be longer. |
| (3) | See “Escrows” section. |
| (4) | The 610 Newport Center Property (as defined below) was previously unencumbered. |
| THE INFORMATION IN THIS STRUCTURAL AND COLLATERAL TERM SHEET IS NOT COMPLETE AND MAY BE AMENDED PRIOR TO THE TIME OF SALE. THIS TERM SHEET IS NOT AN OFFER TO SELL THESE SECURITIES AND IT IS NOT A SOLICITATION OF AN OFFER TO BUY THESE SECURITIES IN ANY JURISDICTION WHERE THE OFFER OR SALE IS NOT PERMITTED. |
| | 60 | |
| Office - Suburban | Loan #4 | Cut-off Date Balance: | | $55,000,000 |
| 610 Newport Center Drive | 610 Newport Center | Cut-off Date LTV: | | 44.5% |
| Newport Beach, CA 92660 | | UW NCF DSCR: | | 2.92x |
| | | UW NOI Debt Yield: | | 17.2% |
The Mortgage Loan. The fourth largest mortgage loan (the “610 Newport Center Mortgage Loan”) is part of a fixed rate whole loan evidenced by six pari passu promissory notes with an aggregate outstanding principal balance as of the Cut-off Date of $85,000,000. The 610 Newport Center Whole Loan is secured by the borrower’s first priority fee interest in a multi-tenant class A office property totaling 285,638 square feet located in Newport Beach, California (the “610 Newport Center Property”). The 610 Newport Center Mortgage Loan is evidenced by the controlling note A-1 and the non-controlling notes A-2-2, A-3 and A-4-2, with an aggregate outstanding principal balance as of the Cut-off Date of $55,000,000. The 610 Newport Center Whole Loan was co-originated by Wells Fargo Bank, National Association (“WFB”), and JPMorgan Chase Bank, National Association (“JPM”) on July 9, 2024. The 610 Newport Center Whole Loan will be serviced pursuant to the pooling and servicing agreement for the WFCM 2024-C63 securitization trust. The relationship between the holders of the 610 Newport Center Whole Loan is governed by a co-lender agreement as described under “Description of the Mortgage Pool—The Whole Loans—The Serviced Pari Passu Whole Loans” and “Pooling and Servicing Agreement” in the Preliminary Prospectus.
Whole Loan Note Summary
| Note | Original Balance | Cut-off Date Balance | Note Holder | Controlling Piece |
| A-1 | $30,000,000 | $30,000,000 | WFCM 2024-C63 | Yes |
| A-2-1(1) | $18,000,000 | $18,000,000 | WFB | No |
| A-2-2 | $3,000,000 | $3,000,000 | WFCM 2024-C63 | No |
| A-3 | $20,000,000 | $20,000,000 | WFCM 2024-C63 | No |
| A-4-1(1) | $12,000,000 | $12,000,000 | JPM | No |
| A-4-2 | $2,000,000 | $2,000,000 | WFCM 2024-C63 | No |
| Total | $85,000,000 | $85,000,000 | | |
| (1) | Expected to be contributed to one or more future securitization(s). |
The Borrower and Borrower Sponsor. The borrower is 610 Newport Center LLC, a special purpose, bankruptcy-remote entity and a Delaware limited liability company with two independent directors. Legal counsel to the borrower delivered a non-consolidation opinion in connection with the origination of the 610 Newport Center Whole Loan.
The borrower sponsor of the 610 Newport Center Whole Loan is The Irvine Company LLC (“The Irvine Company”) and the non-recourse carveout guarantor is Irvine Core Office LLC. The Irvine Company is a private real estate investment company headquartered in Newport Beach, California and headed by Donald Bren. The Irvine Company focuses on long-term ownership of a high-quality real estate portfolio encompassing apartment communities, new home villages, office buildings, retail, dining and entertainment and resorts. The Irvine Company’s holdings consist of 129 million square feet and includes more than 590 office buildings, 125 apartment communities with 65,000 units, 40 retail centers, one coastal resort, three golf courses and five marinas. The Irvine Company's collection of office properties are located in Orange County, California, Los Angeles, San Diego, Silicon Valley, Chicago and New York. The borrower sponsor owns 11 Class A office buildings (including the 610 Newport Center Property) in the Newport Center submarket totaling 2.3 million square feet with an average occupancy of 95.5% as of January 1, 2024. See “Description of the Mortgage Pool —Competition from Certain Nearby Properties” in the Preliminary Prospectus.
The Property. The 610 Newport Center Property consists of an 18-story, 285,638 square feet, multi-tenant class A office building located in Newport Beach, California. The 610 Newport Property was built by the borrower sponsor in 1972 and most recently renovated in 2022. The 610 Newport Center Property amenities include a car washing service, a Kinetic fitness center and access to an adjacent 4-level parking structure (non-collateral) that provides 705 parking spaces (2.45 spaces per 1,000 square feet). As of June 25, 2024, the 610 Newport Center Property was 92.4% occupied by 33 tenants and has an average 10-year occupancy of 91.1%.
Major Tenants.
Largest Tenant by UW Base Rent: Chipotle. (95,278 square feet; 33.4% of net rentable area; 37.4% of underwritten base rent; 10/31/2029 lease expiration) – Chipotle Mexican Grill, Inc. (“Chipotle”) is an international chain of fast casual Mexican restaurants. In May 2018, Chipotle announced the relocation of their corporate headquarters to the 610 Newport Center Property. Chipotle is publicly traded on the NYSE (CMG) with a market capitalization of $71.6 billion as of July 30, 2024. Chipotle has one, five-year extension option and no termination options.
2nd Largest Tenant by UW Base Rent: O'Melveny and Myers LLP. (45,156 square feet; 15.8% of net rentable area; 19.3% of underwritten base rent; 6/30/2032 lease expiration) – O'Melveny & Myers LLP. (“O'Melveny & Myers”) is an American multinational law firm founded in Los Angeles, California in 1885. O'Melveny & Myers employs 800 lawyers and has offices in California, Texas, Washington, D.C., New York City, Beijing, Brussels, Hong Kong, London, Seoul, Shanghai, Singapore, and Tokyo. O'Melveny & Myers has been a tenant at the 610 Newport Center Property since 1980 and has one, five-year extension option. The tenant has a one-time option to terminate its lease with respect to either suite 1600 (15,052 square feet) or suite 1800 (15,052 square feet) effective June 30, 2030 with 12 months’ notice and the payment of a termination fee.
3rd Largest Tenant by UW Base Rent: Canterbury Consulting Inc (15,887 square feet; 5.6% of net rentable area; 5.4% of underwritten base rent; 5/31/2028 lease expiration) – Canterbury Consulting Inc. (“Canterbury Consulting”) is an independent investment advisory firm based in Newport Beach, California and headquartered at the 610 Newport Center Property. Canterbury Consulting was founded in 1988 and has been a tenant at the 610 Newport Center Property since 2018. Canterbury Consulting has no extension options remaining and no termination options.
| THE INFORMATION IN THIS STRUCTURAL AND COLLATERAL TERM SHEET IS NOT COMPLETE AND MAY BE AMENDED PRIOR TO THE TIME OF SALE. THIS TERM SHEET IS NOT AN OFFER TO SELL THESE SECURITIES AND IT IS NOT A SOLICITATION OF AN OFFER TO BUY THESE SECURITIES IN ANY JURISDICTION WHERE THE OFFER OR SALE IS NOT PERMITTED. |
| | 61 | |
| Office - Suburban | Loan #4 | Cut-off Date Balance: | | $55,000,000 |
| 610 Newport Center Drive | 610 Newport Center | Cut-off Date LTV: | | 44.5% |
| Newport Beach, CA 92660 | | UW NCF DSCR: | | 2.92x |
| | | UW NOI Debt Yield: | | 17.2% |
The following table presents certain information relating to the tenancy at the 610 Newport Center Property:
Major Tenants(1)
| Tenant Name | Credit Rating (Fitch/ Moody’s/
S&P) | Tenant NRSF | % of
NRSF | Annual U/W Base Rent PSF | Annual
U/W Base Rent | % of Total Annual U/W Base Rent | Lease
Expiration
Date | Ext. Options | Term. Option (Y/N) |
| Major Tenants | | | | | | | | |
| Chipotle(2) | NR/NR/NR | 95,278 | 33.4% | $68.94 | $6,568,491 | 37.4% | 10/31/2029 | 1, 5-year | N |
| O'Melveny and Myers LLP(3) | NR/NR/NR | 45,156 | 15.8% | $74.88 | $3,381,281 | 19.3% | 6/30/2032 | 1, 5-year | Y |
| Canterbury Consulting Inc | NR/NR/NR | 15,887 | 5.6% | $59.28 | $941,784 | 5.4% | 5/31/2028 | N | N |
| Call and Jensen APC | NR/NR/NR | 11,806 | 4.1% | $64.92 | $766,446 | 4.4% | 8/31/2029 | N | N |
| RBC Capital Markets, LLC | NR/NR/NR | 11,227 | 3.9% | $65.16 | $731,551 | 4.2% | 3/31/2029 | N | N |
| | 179,354 | 62.8% | $69.08 | $12,389,553 | 70.6% | | | |
| | | | | | | | | |
| Non-Major Tenants | 84,507 | 29.6% | $60.96 | $5,151,471 | 29.4% | | | |
| | | | | | | | | |
| Occupied Collateral Total | 263,861 | 92.4% | $66.48 | $17,541,023 | 100.0% | | | |
| | | | | | | | | |
| Vacant Space(4) | 21,777 | 7.6% | | | | | | |
| | | | | | | | | |
| Collateral Total | 285,638 | 100.0% | | | | | | |
| | | | | | | | | | |
| (1) | Based on the underwritten rent roll dated June 25, 2024. |
| (2) | Chipotle is marketing suite 600 (15,876 square feet) for sublease. The space is currently dark but was included in Annual U/W Base Rent. The tenant is looking to sublease the space short-term and intends to retain the space in the long-term for future growth. |
| (3) | O’Melveny and Myers LLP has one, 5-year extension option. O’Melveny and Myers LLP a one-time option to terminate its lease with respect to either suite 1600 (15,052 square feet) or suite 1800 (15,052 square feet) effective June 30, 2030 with 12 months’ notice and the payment of a termination fee in an amount equal to (i) three times the then-current monthly rent, plus (ii) the unamortized costs of the tenant improvement and construction allowances, all broker commissions, rental abatement, and reasonable attorneys’ fees, amortized at a discount factor of 8% per year over a 7 year period. |
| (4) | Vacant Space includes one tenant totalling 4,002 square feet that has gone dark, continues to pay rent but was underwritten as vacant. |
The following table presents certain information relating to the lease rollover schedule at the 610 Newport Center Property:
Lease Expiration Schedule(1)
Year Ending
December 31 | No. of Leases Expiring(3) | Expiring NRSF | % of Total NRSF | Cumulative Expiring NRSF | Cumulative % of Total NRSF | Annual
U/W
Base Rent(2) | % of Total Annual U/W Base Rent | Annual
U/W
Base Rent
PSF(2) |
| MTM | 0 | 0 | 0.0% | 0 | 0.0% | $0 | 0.0% | $0.00 |
| 2024 | 2 | 3,254 | 1.1% | 3,254 | 1.1% | $69,841 | 0.4% | $21.46 |
| 2025 | 5 | 11,145 | 3.9% | 14,399 | 5.0% | $605,318 | 3.5% | $54.31 |
| 2026 | 8 | 24,409 | 8.5% | 38,808 | 13.6% | $1,519,950 | 8.7% | $62.27 |
| 2027 | 4 | 12,369 | 4.3% | 51,177 | 17.9% | $826,946 | 4.7% | $66.86 |
| 2028 | 5 | 26,278 | 9.2% | 77,455 | 27.1% | $1,575,412 | 9.0% | $59.95 |
| 2029 | 5 | 125,380 | 43.9% | 202,835 | 71.0% | $8,498,944 | 48.5% | $67.79 |
| 2030 | 2 | 10,053 | 3.5% | 212,888 | 74.5% | $622,169 | 3.5% | $61.89 |
| 2031 | 0 | 0 | 0.0% | 212,888 | 74.5% | $0 | 0.0% | $0.00 |
| 2032 | 1 | 45,156 | 15.8% | 258,044 | 90.3% | $3,381,281 | 19.3% | $74.88 |
| 2033 | 0 | 0 | 0.0% | 258,044 | 90.3% | $0 | 0.0% | $0.00 |
| 2034 | 1 | 5,817 | 2.0% | 263,861 | 92.4% | $441,161 | 2.5% | $75.84 |
| Thereafter | 0 | 0 | 0.0% | 263,861 | 92.4% | $0 | 0.0% | $0.00 |
| Vacant(4) | 0 | 21,777 | 7.6% | 285,638 | 100.0% | $0 | 0.0% | $0.00 |
| Total/Weighted Average | 33 | 285,638 | 100.0% | | | $17,541,023 | 100.0% | $66.48 |
| (1) | Based on the underwritten rent roll dated June 25, 2024. |
| (2) | Annual U/W Base Rent and Annual U/W Base Rent PSF does not include vacant space. |
| (3) | Certain tenants may have lease termination options that are exercisable prior to the stated expiration date of the subject lease or leases which are not considered in the Lease Rollover Schedule. |
| (4) | Vacant Space includes one tenant totaling 4,002 square feet that has gone dark, continues to pay rent but was underwritten as vacant. |
| THE INFORMATION IN THIS STRUCTURAL AND COLLATERAL TERM SHEET IS NOT COMPLETE AND MAY BE AMENDED PRIOR TO THE TIME OF SALE. THIS TERM SHEET IS NOT AN OFFER TO SELL THESE SECURITIES AND IT IS NOT A SOLICITATION OF AN OFFER TO BUY THESE SECURITIES IN ANY JURISDICTION WHERE THE OFFER OR SALE IS NOT PERMITTED. |
| | 62 | |
| Office - Suburban | Loan #4 | Cut-off Date Balance: | | $55,000,000 |
| 610 Newport Center Drive | 610 Newport Center | Cut-off Date LTV: | | 44.5% |
| Newport Beach, CA 92660 | | UW NCF DSCR: | | 2.92x |
| | | UW NOI Debt Yield: | | 17.2% |
The following table presents historical occupancy percentages at the 610 Newport Center Property:
Historical Occupancy
12/31/2020 | 12/31/20221 | 12/31/2022 | 12/31/2023 | Current(1) |
| 92.0% | 94.0% | 95.0% | 93.0% | 92.4% |
| (1) | Current occupancy is based on the underwritten rent roll dated as of June 25, 2024. |
Operating History and Underwritten Net Cash Flow. The following table presents certain information relating to the historical operating performance and underwritten net cash flow at the 610 Newport Center Property:
Cash Flow Analysis
| | 2021 | 2022 | 2023 | TTM 05/30/2024 | U/W | %(1) | U/W $ per SF |
| Base Rent | $15,289,847 | $15,284,487 | $15,509,231 | $16,149,675 | $17,541,024 | 84.3% | $61.41 |
| Grossed Up Vacant Space | 0 | 0 | 0 | 0 | 957,548 | 4.6% | 3.35 |
| Gross Potential Rent | $15,289,847 | $15,284,487 | $15,509,231 | $16,149,675 | $18,498,573 | 88.9% | $64.76 |
| Percent Rent | 6 | 146 | 179 | 167 | 0 | 0.0 | 0.0 |
| Other Income | 283,357 | 342,592 | 317,880 | 316,384 | 316,384 | 1.5 | 1.11 |
| Parking/Garage/Other | 540,106 | 796,095 | 988,209 | 974,862 | 974,862 | 4.7 | 3.41 |
| Total Recoveries | 321,141 | 482,174 | 924,579 | 1,029,962 | 1,029,962 | 4.9 | 3.61 |
| Net Rental Income | $16,434,457 | $16,905,494 | $17,740,078 | $18,471,050 | $20,819,781 | 100.0% | $72.89 |
| (Vacancy & Credit Loss) | 0 | 0 | 0 | 0 | ($957,548) | (5.2) | (3.35) |
| Effective Gross Income | $16,434,457 | $16,905,494 | $17,740,078 | $18,471,050 | $19,862,232 | 95.4% | $69.54 |
| | | | | | | | |
| Real Estate Taxes | 748,759 | 780,350 | 810,186 | 813,733 | 925,310 | 4.7 | 3.24 |
| Insurance | 127,661 | 136,713 | 198,167 | 227,279 | 110,813 | 0.6 | 0.39 |
| Management Fee | 634,485 | 687,596 | 686,542 | 721,454 | 794,489 | 4.0 | 2.78 |
| Other Operating Expense | 2,757,665 | 3,284,908 | 3,751,314 | 3,423,530 | 3,423,530 | 17.2 | 11.99 |
| Total Operating Expenses | $4,268,570 | $4,889,567 | $5,446,209 | $5,185,996 | $5,254,142 | 26.5% | $18.39 |
| | | | | | | | |
| Net Operating Income | $12,165,887 | $12,015,927 | $12,293,869 | $13,285,054 | $14,608,090 | 73.5% | $51.14 |
| Replacement Reserves | 0 | 0 | 0 | 0 | 77,668 | 0.4 | 0.27 |
| TI/LC | 0 | 0 | 0 | 0 | 285,144 | 1.4 | 1.00 |
| Net Cash Flow | $12,165,887 | $12,015,927 | $12,293,869 | $13,285,054 | $14,245,278 | 71.7% | $49.87 |
| | | | | | | | |
| NOI DSCR | 2.49x | 2.46x | 2.52x | 2.72x | 2.99x | | |
| NCF DSCR | 2.49x | 2.46x | 2.52x | 2.72x | 2.92x | | |
| NOI Debt Yield | 14.3% | 14.1% | 14.5% | 15.6% | 17.2% | | |
| NCF Debt Yield | 14.3% | 14.1% | 14.5% | 15.6% | 16.8% | | |
| (1) | Represents (i) percent of Net Rental Income for all revenue fields, (ii) percent of Gross Potential Rent for Vacancy & Credit Loss and (iii) percent of Effective Gross Income for all other fields. |
Appraisal. The appraiser concluded to an “as-is” Appraised Value for the 610 Newport Center Property of $191,000,000 as of May 29, 2024.
Environmental Matters. According to the Phase I environmental site assessment dated May 28, 2024, there was no evidence of any recognized environmental conditions at the 610 Newport Center Property.
Market Overview and Competition. The 610 Newport Center Property is located in Newport Beach, California, approximately 4.5 miles south of the John Wayne Airport. The 610 Newport Center Property is located 0.1 miles from Fashion Island, a high-fashion shopping mall that is GreenStreet rated A++ and was developed by the borrower sponsor in 1967. Newport Center Drive forms a ring around Fashion Island and has been developed with a series of low to mid-rise professional and medical office buildings. According to the appraisal, the estimated 2023 population within a one, three and five-mile radius was approximately 12,226, 102,830 and 264,938, respectively and the estimated 2023 average household income within the same radii was approximately $201,571, $214,422, and $172,926 respectively.
According to the appraisal, the 610 Newport Center Property is situated within in the Newport Center submarket within the City of Newport Beach office market. As of the first quarter of 2024, the submarket reported a total inventory of approximately 3.5 million square feet with a 4.1% vacancy rate and an average asking rent of $52.80 per square foot, net. The appraiser identified five
| THE INFORMATION IN THIS STRUCTURAL AND COLLATERAL TERM SHEET IS NOT COMPLETE AND MAY BE AMENDED PRIOR TO THE TIME OF SALE. THIS TERM SHEET IS NOT AN OFFER TO SELL THESE SECURITIES AND IT IS NOT A SOLICITATION OF AN OFFER TO BUY THESE SECURITIES IN ANY JURISDICTION WHERE THE OFFER OR SALE IS NOT PERMITTED. |
| | 63 | |
| Office - Suburban | Loan #4 | Cut-off Date Balance: | | $55,000,000 |
| 610 Newport Center Drive | 610 Newport Center | Cut-off Date LTV: | | 44.5% |
| Newport Beach, CA 92660 | | UW NCF DSCR: | | 2.92x |
| | | UW NOI Debt Yield: | | 17.2% |
comparable buildings located within Newport Beach with rents ranging from $51.60 to $75.60 per square foot, net. The appraiser concluded a market rent for the 610 Newport Center Property of $52.20 to $74.40 per square foot, net.
The following table presents certain information relating to the appraiser’s market rent conclusions for the 610 Newport Center Property:
Market Rent Summary(1)
| | Lower 4 Floors | Middle Floors | Upper 4 Floors |
| Market Rent (PSF) | $52.20 | $62.40 | $74.40 |
| Lease Term (Years) | 5 | 5 | 7 |
| Lease Type | FSG | FSG | FSG |
| Rent Increase Projection | 3.5%/Year | 3.5%/Year | 3.5%/Year |
| TI (New/Renewal) | $40.00 / $20.00 | $40.00 / $20.00 | $60.00 / $30.00 |
| LC (New/Renewal) | 6.0% / 2.0% | 6.0% / 2.0% | 6.0% / 2.0% |
| Free Rent (New/Renewal) | 2 months / 2 months | 2 months / 2 months | 3 months / 3 months |
| (1) | Information obtained from the appraisal. |
The table below presents certain information relating to comparable sales pertaining to the 610 Newport Center Property identified by the appraiser:
Comparable Sales(1)
| Property Name | Location | Year Built/Renovated | Rentable Area (SF) | Sale Date | Sale Price | Sale Price (PSF) |
One Culver,
10000 West Washington | Culver City, CA | 1986/NAP | 395,272 | Mar-22 | $510,000,000 | $1,290 |
Intersect,
17877 and 17875 Von Karman Avenue; 17838 and 17872 Gillette Avenue | Irvine, CA | 1989/2019 | 446,782 | Jun-22 | $235,250,000 | $527 |
555 Aviation,
555 Aviation Boulevard | El Segundo, CA | 1966/2017 | 259,754 | Jun-22 | $205,500,000 | $791 |
Cubic Campus,
9223 and 9233 Balboa Avenue | San Diego, CA | 2021/NAP | 248,579 | Mar-23 | $148,250,000 | $596 |
Calibre Bldg.,
11119 North Torrey Pines Road | San Diego, CA | 1990/2012 | 72,419 | May-23 | $86,000,000 | $1,188 |
Pen Factory,
2701 Olympic Boulevard | Santa Monica, CA | 1957/2017 | 222,000 | Aug-23 | $165,000,000 | $743 |
Single-Tenant Office Building,
3401 Exposition Boulevard | Santa Monica, CA | 1961/2013 | 63,376 | Aug-23 | $40,000,000 | $631 |
| (1) | Information obtained from the appraisal. |
| THE INFORMATION IN THIS STRUCTURAL AND COLLATERAL TERM SHEET IS NOT COMPLETE AND MAY BE AMENDED PRIOR TO THE TIME OF SALE. THIS TERM SHEET IS NOT AN OFFER TO SELL THESE SECURITIES AND IT IS NOT A SOLICITATION OF AN OFFER TO BUY THESE SECURITIES IN ANY JURISDICTION WHERE THE OFFER OR SALE IS NOT PERMITTED. |
| | 64 | |
| Office - Suburban | Loan #4 | Cut-off Date Balance: | | $55,000,000 |
| 610 Newport Center Drive | 610 Newport Center | Cut-off Date LTV: | | 44.5% |
| Newport Beach, CA 92660 | | UW NCF DSCR: | | 2.92x |
| | | UW NOI Debt Yield: | | 17.2% |
The following table presents certain information relating to the appraiser’s market rent conclusions for the 610 Newport Center Property:
Comparable Office Leases(1)
| Property Name/Location | Year Built/ Renovated | Total GLA (SF) | Tenant | Tenant Size (SF) | Lease Start Date | Lease Term | Annual Base Rent PSF | Lease Type |
610 Newport Center, Newport Beach, CA | 1972/2022 | 285,638(2) | | | | | | |
500 Newport Center Drive,
Newport Beach, CA | 1968/NAP | 155,631 | Bridge Loan Financial | 2,743 | Aug-23 | 3.1 Yrs. | $56.40 | Full Service |
520 Newport Center Drive,
Newport Beach, CA | 2014/NAP | 326,065 | JH Real Estate Partners | 4,140 | Sep-23 | 2.0 Yrs. | $75.60 | Full Service |
620 Newport Center Drive,
Newport Beach, CA | 1971/1987 | 237,000 | LPL Holdings | 3,894 | Jun-24 | 8.0 Yrs. | $51.60 | Full Service |
660 Newport Center Drive,
Newport Beach, CA | 1974/1987 | 259,932 | Harcourts Auctions | 2,405 | Nov-23 | 3.0 Yrs. | $52.80 | Full Service |
450 Newport Center Drive,
Newport Beach, CA | 1974/NAP | 77,248 | Transdigm Inc. | 5,769 | Jul-24 | 5.0 Yrs. | $58.80 | Full Service |
| (1) | Information obtained from the appraisal. |
| (2) | Information obtained from the underwritten rent roll. |
Escrows.
Real Estate Taxes – Upon the occurrence of a Cash Trap Event Period (as defined below) or a Leasing Event Period (as defined below), the borrower is required to escrow monthly payments equal to 1/12th of the annual estimated tax payments.
Insurance – Upon the occurrence of a Cash Trap Event Period or a Leasing Event Period, and if there is no blanket policy in place or the borrower fails to provide evidence of a policy renewal, the borrower is required to escrow monthly payments equal to 1/12th of the annual estimated insurance payments.
Replacement Reserve – Upon the occurrence of a Cash Trap Event Period or a Leasing Event Period, the borrower is required to deposit monthly replacement reserves equal to approximately $6,472.
TI/LC Reserve – Upon the occurrence of a Cash Trap Event Period or a Leasing Event Period, borrower is required to deposit monthly TI/LC reserves equal to $23,762 ($1.00 per square foot per year).
Rent Concession Reserve – At origination, the borrower deposited $1,046,249 for outstanding free rent and gap rent obligations.
Existing TI/LC Reserve – At origination, the borrower deposited $1,536,900 for unfunded tenant improvement and leasing commission-related landlord obligations to existing tenants.
Leasing Event Period Springing Reserve – Upon the occurrence of a Leasing Event Period, the borrower is required to, at its option, either to (i) deposit an amount equal to the Chipotle Funds Amount (defined below), (ii) deposit with the lender on each monthly payment date for the next 12 monthly payment dates 1/12th of Chipotle Funds Amount, (iii) deliver to the lender one or more letters of credit (50% of the required amount upon the occurrence of a Leasing Event Period and the remaining 50% 6 months later), or (iv) deliver to the lender a reserve guaranty from an affiliate of the borrower that maintains an investment grade rating or has been reasonably approved by the lender and affirmed by the rating agencies.
“Chipotle Funds Amount” means an amount equal to (i) $50 PSF for the space currently demised under the Chipotle lease, a Chipotle replacement lease of at least 75,000 square feet, or a new replacement lease of at least 75,000 square feet.
“Cash Trap Event Period” means the period either commencing (i) upon an event of default, or (ii) upon the date (tested quarterly) when the debt service coverage ratio is less than 1.15x (based on a 30-year amortizing monthly payment). A Cash Trap Event Period will end, with regard to clause (i), upon the cure of such event of default, and, with regard to clause (ii), upon the date (tested quarterly) that the debt service coverage ratio (based on a 30-year amortizing monthly payment) is equal to or greater than 1.20x for two consecutive calendar quarters.
“Leasing Event Period” means either (i) a Chipotle Leasing Event Period (as defined below) or (ii) a Major Replacement Leasing Event Period (as defined below).
| THE INFORMATION IN THIS STRUCTURAL AND COLLATERAL TERM SHEET IS NOT COMPLETE AND MAY BE AMENDED PRIOR TO THE TIME OF SALE. THIS TERM SHEET IS NOT AN OFFER TO SELL THESE SECURITIES AND IT IS NOT A SOLICITATION OF AN OFFER TO BUY THESE SECURITIES IN ANY JURISDICTION WHERE THE OFFER OR SALE IS NOT PERMITTED. |
| | 65 | |
| Office - Suburban | Loan #4 | Cut-off Date Balance: | | $55,000,000 |
| 610 Newport Center Drive | 610 Newport Center | Cut-off Date LTV: | | 44.5% |
| Newport Beach, CA 92660 | | UW NCF DSCR: | | 2.92x |
| | | UW NOI Debt Yield: | | 17.2% |
“Chipotle Leasing Event Period” means the occurrence of any of the following: (i) the date the Chipotle lease is terminated prior to its then current expiration date, (ii) tenant or any lease guarantor’s material default beyond any applicable notice and cure period in excess of 45 days, (iii) a bankruptcy or similar filing by the Chipotle tenant or any lease guarantor, or (iv) the earlier of tenant’s non-renewal of its lease by the monthly payment date 12 months prior the lease expiration or tenant’s notice of non-renewal.
The Chipotle Leasing Event Period will end upon the first to occur of the following: (a) with respect to clauses (i)-(iv), all, or substantially all, of the Chipotle space has been leased to one or more acceptable replacement leases for a minimum five year term at a net effective rent of not less than 95% of the then effective fair market rent, all leasing costs have been paid, reserved or guaranteed, and the tenant is paying unabated rent or such free rent has been reserved, (b) with respect to clause (ii), the default has been cured, (c) with respect to clause (iii), the lease has been assumed or affirmed without any negative material change in economics, scope or duration and (d) with respect to clause (iv), the tenant has entered into an extension for all or substantially all of its space for a minimum five year term at a net effective rent of not less than 95% of the then effective fair market rent.
“Major Replacement Leasing Event Period” means the occurrence of any of the following: (i) the date that a major Chipotle space replacement lease or a major new replacement lease (each for at least 75,000 SF) lease is terminated prior to its then current expiration date, (ii) major Chipotle space replacement tenant or any related lease guarantor’s material lease default beyond any applicable notice and cure period in excess of 45 days; (iii) a bankruptcy or similar filing by a major Chipotle space replacement tenant or any related lease guarantor; and (iv) for any major Chipotle space replacement lease or major new replacement lease that has an initial term that expires prior to the date that is 12 months after the 610 Newport Center Whole Loan maturity, such tenant’s non-renewal of its lease on the earlier of the payment date that is 12 months’ prior to lease expiration or tenant’s notice of non-renewal.
A Major Replacement Leasing Event Period will end on the first to occur of the following: (a) with respect to clauses (i)-(iv), all, or substantially all, of the Chipotle space has been leased to one or more acceptable replacement leases for a minimum five year term at a net effective rent of not less than 95% of the then effective fair market rent, all leasing costs have been paid, reserved or guaranteed, and the tenant is paying unabated rent or such free rent has been reserved, (b) with respect to clause (ii), the default has been cured, (c) with respect to clause (iii), the lease has been assumed or affirmed without any negative material change in economics, scope or duration and (d) with respect to clause (iv), the tenant has entered into an extension for all or substantially all of its space on terms provided in such lease for renewal, or if no such terms are provided, then for a term that expires no earlier than the date that is 12 months following the 610 Newport Center Whole Loan maturity date at a net effective rent of not less than 95% of the then effective fair market rent.
Lockbox and Cash Management. The 610 Newport Center Whole Loan is structured with a hard lockbox and springing cash management. The borrowers and property manager are required to deposit all rent into an established deposit account each business day. Upon the occurrence of a Cash Trap Event Period, all amounts available in the deposit account will be transferred to a cash management account controlled by the lender on each business day and applied in accordance with the cash flow waterfall in the cash management agreement. During the continuance of a Cash Trap Event Period, all excess cash flow will be held by the lender as additional collateral.
Property Management. The 610 Newport Center Property is managed by Irvine Management Company, an affiliate of the borrower.
Partial Release. Not permitted.
Real Estate Substitution. Not permitted.
Subordinate and Mezzanine Indebtedness. None.
Ground Lease. None.
Property/Terrorism Insurance. The 610 Newport Center Whole Loan documents require an “all risk” insurance policy on a replacement cost basis, including (i) business interruption insurance covering no less than the 18-month period following the occurrence of a casualty event, together with a 12-month extended period of indemnity, , and (ii) terrorism coverage as defined by TRIPRA. See “Risk Factors—Risks Relating to the Mortgage Loans—Terrorism Insurance May Not Be Available for All Mortgaged Properties” in the prospectus.
| THE INFORMATION IN THIS STRUCTURAL AND COLLATERAL TERM SHEET IS NOT COMPLETE AND MAY BE AMENDED PRIOR TO THE TIME OF SALE. THIS TERM SHEET IS NOT AN OFFER TO SELL THESE SECURITIES AND IT IS NOT A SOLICITATION OF AN OFFER TO BUY THESE SECURITIES IN ANY JURISDICTION WHERE THE OFFER OR SALE IS NOT PERMITTED. |
| | 66 | |
| Hospitality – Full Service | Loan #5 | Cut-off Date Balance: | | $53,000,000 |
1701 Atlantic Avenue Ocean City, MD 21842 | Holiday Inn & Suites Ocean City | Cut-off Date LTV: U/W NCF DSCR: U/W NOI Debt Yield: | | 59.8% 1.55x 13.6% |
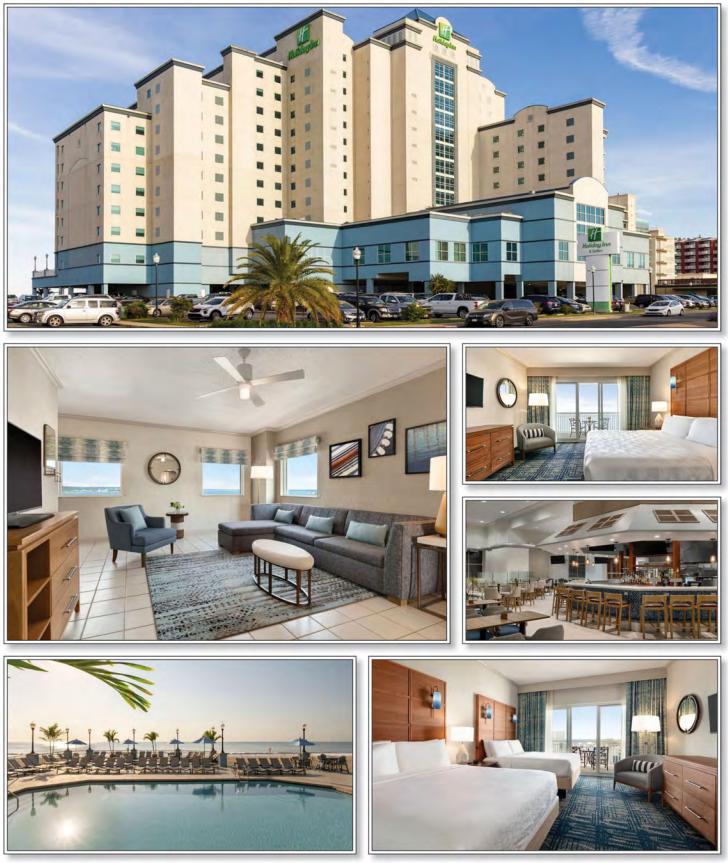
| THE INFORMATION IN THIS STRUCTURAL AND COLLATERAL TERM SHEET IS NOT COMPLETE AND MAY BE AMENDED PRIOR TO THE TIME OF SALE. THIS TERM SHEET IS NOT AN OFFER TO SELL THESE SECURITIES AND IT IS NOT A SOLICITATION OF AN OFFER TO BUY THESE SECURITIES IN ANY JURISDICTION WHERE THE OFFER OR SALE IS NOT PERMITTED. |
| | 67 | |
| Hospitality – Full Service | Loan #5 | Cut-off Date Balance: | | $53,000,000 |
1701 Atlantic Avenue Ocean City, MD 21842 | Holiday Inn & Suites Ocean City | Cut-off Date LTV: U/W NCF DSCR: U/W NOI Debt Yield: | | 59.8% 1.55x 13.6% |

| THE INFORMATION IN THIS STRUCTURAL AND COLLATERAL TERM SHEET IS NOT COMPLETE AND MAY BE AMENDED PRIOR TO THE TIME OF SALE. THIS TERM SHEET IS NOT AN OFFER TO SELL THESE SECURITIES AND IT IS NOT A SOLICITATION OF AN OFFER TO BUY THESE SECURITIES IN ANY JURISDICTION WHERE THE OFFER OR SALE IS NOT PERMITTED. |
| | 68 | |
| No. 5 – Holiday Inn & Suites Ocean City |
| |
| Mortgage Loan Information | | Mortgaged Property Information |
| Mortgage Loan Seller: | Wells Fargo Bank, National Association | | Single Asset/Portfolio: | Single Asset |
Credit Assessment (Fitch/KBRA/Moody’s): | NR/NR/NR | | Property Type – Subtype: | Hospitality – Full Service |
| Original Principal Balance: | $53,000,000 | | Location: | Ocean City, MD |
| Cut-off Date Balance: | $53,000,000 | | Size: | 210 Rooms |
| % of Initial Pool Balance: | 7.4% | | Cut-off Date Balance Per Room: | $252,381 |
| Loan Purpose: | Refinance | | Maturity Date Balance Per Room: | $238,925 |
| Borrower Sponsors: | John H. Harrison, Hale Harrison Irrevocable Trust and Harrison Group Hotels | | Year Built/Renovated: | 2001/2021 |
| Guarantors: | John H. Harrison and Hale Harrison Irrevocable Trust | | Title Vesting: | Fee |
| Mortgage Rate: | 6.8450% | | Property Manager: | Harrison Group General, LLC (borrower affiliate) |
| Note Date: | June 18, 2024 | | Current Occupancy (As of): | 69.6% (5/31/2024) |
| Seasoning: | 1 month | | YE 2023 Occupancy: | 71.8% |
| Maturity Date: | July 11, 2034 | | YE 2022 Occupancy: | 70.7% |
| IO Period: | 60 months | | YE 2021 Occupancy: | 76.6% |
| Loan Term (Original): | 120 months | | YE 2020 Occupancy: | 52.9% |
| Amortization Term (Original): | 360 months | | As-Is Appraised Value: | $88,700,000 |
| Loan Amortization Type: | Interest Only, Amortizing Ballon | | As-Is Appraised Value Per Room: | $422,381 |
| Call Protection: | L(25),D(91),O(4) | | As-Is Appraisal Valuation Date: | May 6, 2024 |
| | | | | |
| Lockbox Type: | Hard/Springing Cash Management | | Underwriting and Financial Information |
| Additional Debt: | None | | TTM NOI (5/31/2024): | $7,061,618 |
| Additional Debt Type (Balance): | NAP | | YE 2023 NOI: | $7,470,344 |
| | | | YE 2022 NOI: | $7,416,798 |
| | | | YE 2021 NOI: | $5,208,199 |
| | | | U/W Revenues: | $19,134,895 |
| | | | U/W Expenses: | $11,924,981 |
| | | U/W NOI: | $7,209,914 |
| Escrows and Reserves(1) | | U/W NCF: | $6,444,519 |
| | Initial | Monthly | Cap | | U/W DSCR based on NOI/NCF: | 1.73x / 1.55x |
| Taxes | $596,395 | $59,639 | NAP | | U/W Debt Yield based on NOI/NCF: | 13.6% / 12.2% |
| Insurance | $0 | Springing | NAP | | U/W Debt Yield at Maturity based on NOI/NCF: | 14.4% / 12.8% |
| FF&E Reserve | $0 | $64,799(2) | NAP | | Cut-off Date LTV Ratio: | 59.8% |
| Seasonality Reserve | $950,000 | Various(3) | NAP | | LTV Ratio at Maturity: | 56.6% |
| New PIP Deposit Reserve | $0 | Springing | NAP | | | |
| | | | | | | | |
| Sources and Uses |
| Sources | | | | Uses | | |
| Mortgage Loan Amount | $53,000,000 | 100.0% | | Loan Payoff | $35,459,959 | 66.9% |
| | | | | Upfront Reserves | $1,546,395 | 2.9% |
| | | | | Closing Costs | $714,017 | 1.3% |
| | | | | Return of Equity | $15,279,629 | 28.8% |
| Total Sources | $53,000,000 | 100.0% | | Total Uses | $53,000,000 | 100.0% |
| (1) | See “Escrows” section. |
| (2) | The monthly FF&E Reserve is calculated annually, based on the prior year’s operating revenue. See “Escrows” section for further detail. |
| (3) | On each monthly payment date occurring in each month of June, $200,000, on each monthly payment date in each month of July, $750,000, on each monthly payment date in each month of August, $1,500,000, on each monthly payment date in each month of September, $1,250,000. |
The Mortgage Loan. The fifth largest mortgage loan (“Holiday Inn & Suites Ocean City Mortgage Loan”) is evidenced by a single promissory note in the original principal amount of $53,000,000 and secured by the fee interest in a 210-room full-service hotel located in Ocean City, Maryland (“Holiday Inn & Suites Ocean City Property”).
The Borrower and Borrower Sponsors. The co-borrowers are Harrison HI 18 LLC and Harrison Inn Ocean View SPE, LLC, each a single-purpose, Maryland limited liability company with one independent director (collectively, as the context requires, the “borrower”). Harrison HI 18 LLC, the operating co-borrower, owns two parcels that comprise about one-half of the total building area and parking, and leases two parcels that comprise the remaining building area and parking from Harrison Inn Ocean View SPE, LLC at an annual rent of $240,000, payable out of excess cash flow only (the “inter-party lease”). Legal counsel to the borrower delivered a non-consolidation opinion in connection with the origination of The Holiday Inn & Suites Ocean City Mortgage Loan. The borrower sponsors
| THE INFORMATION IN THIS STRUCTURAL AND COLLATERAL TERM SHEET IS NOT COMPLETE AND MAY BE AMENDED PRIOR TO THE TIME OF SALE. THIS TERM SHEET IS NOT AN OFFER TO SELL THESE SECURITIES AND IT IS NOT A SOLICITATION OF AN OFFER TO BUY THESE SECURITIES IN ANY JURISDICTION WHERE THE OFFER OR SALE IS NOT PERMITTED. |
| | 69 | |
| Hospitality – Full Service | Loan #5 | Cut-off Date Balance: | | $53,000,000 |
1701 Atlantic Avenue Ocean City, MD 21842 | Holiday Inn & Suites Ocean City | Cut-off Date LTV: U/W NCF DSCR: U/W NOI Debt Yield: | | 59.8% 1.55x 13.6% |
are Harrison Group Hotels, John H. Harrison, and Hale Harrison Irrevocable Trust. The non-recourse carveout guarantors are John H. Harrison and Hale Harrison Irrevocable Trust.
The Holiday Inn & Suites Ocean City Property is managed by Harrison Group General, LLC, an affiliate of the borrower sponsor. Founded in 1952, Harrison Group Hotels is a third-generation hospitality company based in Ocean City, Maryland. Harrison Group has over 50 years of experience in the hospitality industry and has a portfolio consisting of 19 hotels totaling over 2,200 keys. Harrison Group manages properties in partnership with brands including Marriott and Hilton.
The Property. The Holiday Inn & Suites Ocean City Property is a 210-room, full-service hotel located in Ocean City, Maryland. Built in 2001 and renovated in 2021, amenities include 1,388 square feet of meeting space, an indoor swimming pool, a fitness center, a business center, two oceanfront pools, a guest laundry room, a sundries shop and vending and ice machines. The Holiday Inn & Suites Ocean City Property operates under a franchise agreement with Holiday Hospitality Franchising, LLC, a Delaware limited liability company, which expires in June 2041. Among other things, the franchise agreement requires periodic soft goods replacements every 5-6 years and case goods replacements every 10-12 years.
The Holiday Inn & Suites Ocean City Property guestroom configuration consists of 47 king guestrooms, 162 double queen guestrooms, and one two-bedroom suite for a total of 210 rooms across 249,043 SF.
The owner originally acquired the property through the purchase of the existing Sandhill Motel in 1980 and Ocean Park Motel in 1981, which they operated for approximately 19 years. In 1999, the owner demolished both structures to build the Holiday Inn & Suites Ocean City Property and have owned and operated the hotel since 2001. The Holiday Inn & Suites Ocean City Property underwent a $10.7 million ($50,952 per room) renovation in 2021, which included upgrades to guestrooms and public areas.
The following table presents historical occupancy, ADR, and RevPAR penetration rates of Holiday Inn & Suites Ocean City Property:
| Historical Occupancy, ADR, RevPAR(1)(2) |
| | | Competitive Set | | Holiday Inn & Suites Ocean City Property | | Penetration Factor |
| Year | | Occupancy | ADR | RevPAR | | Occupancy | ADR | RevPAR | | Occupancy | ADR | RevPAR |
| 12/31/2022 TTM | | 61.0% | $238.81 | $145.65 | | 73.5% | $262.21 | $192.75 | | 120.5% | 109.8% | 132.3% |
| 12/31/2023 TTM | | 59.9% | $246.25 | $147.44 | | 71.4% | $304.60 | $217.63 | | 119.3% | 123.7% | 147.6% |
| 4/30/2024 TTM | | 56.3% | $246.38 | $138.74 | | 69.0% | $318.50 | $219.92 | | 122.6% | 129.3% | 158.5% |
| (1) | Information obtained from a third-party research report. |
| (2) | According to a third-party research report, the competitive set includes Holiday Inn Ocean City, Ashore Resort & Beach Club, Quality Inn Boardwalk Ocean City, Carousel Oceanfront Hotel & Condos, DoubleTree by Hilton Ocean City Oceanfront, Hilton Suites Ocean City Oceanfront and Courtyard Ocean City Oceanfront. |
The following table presents historical occupancy percentages at the Holiday Inn & Suites Ocean City Property:
Historical Occupancy(1)
12/31/2020(2) | 12/31/2021(2) | 12/31/2022(2) | 12/31/2023(2) | 5/31/2024 |
| 52.9% | 76.6% | 70.7% | 71.8% | 69.6% |
| (1) | Information obtained from the borrower. |
| (2) | The increase in occupancy from 2020 to 2021 was primarily due to the effect of the novel coronavirus on the hospitality industry in 2020, and the recovery in 2021. Additionally, the Holiday Inn & Suites Ocean City Property underwent an approximately $10.7 million renovation ($50,952/room) in 2021. |
| THE INFORMATION IN THIS STRUCTURAL AND COLLATERAL TERM SHEET IS NOT COMPLETE AND MAY BE AMENDED PRIOR TO THE TIME OF SALE. THIS TERM SHEET IS NOT AN OFFER TO SELL THESE SECURITIES AND IT IS NOT A SOLICITATION OF AN OFFER TO BUY THESE SECURITIES IN ANY JURISDICTION WHERE THE OFFER OR SALE IS NOT PERMITTED. |
| | 70 | |
| Hospitality – Full Service | Loan #5 | Cut-off Date Balance: | | $53,000,000 |
1701 Atlantic Avenue Ocean City, MD 21842 | Holiday Inn & Suites Ocean City | Cut-off Date LTV: U/W NCF DSCR: U/W NOI Debt Yield: | | 59.8% 1.55x 13.6% |
Operating History and Underwritten Net Cash Flow. The following table presents certain information relating to the historical operating performance and underwritten net cash flow at the Holiday Inn & Suites Ocean City Property:
Cash Flow Analysis
| | 2021 | 2022 | 2023 | TTM 5/31/2024 | U/W | % of U/W Total Revenue(1) | U/W $ per Room |
| Occupancy | 76.6% | 70.7% | 71.8% | 69.6% | 69.6% | | |
| ADR | $281.52 | $304.89 | $311.92 | $315.68 | $315.68 | | |
| RevPAR | $215.68 | $215.64 | $224.09 | $219.88 | $219.88 | | |
| | | | | | | | |
| Room Revenue | $13,864,398 | $16,528,720 | $17,176,684 | $16,899,909 | $16,843,680 | 88.0% | 80,208 |
| Food & Beverage Revenue | 1,541,668 | 1,852,803 | 1,857,063 | 1,779,276 | 1,779,276 | 9.3 | 8,473 |
| Other Revenue | 339,828 | 406,469 | 406,016 | 511,939 | 511,939 | 2.7 | 2,438 |
| Total Revenue | $15,745,894 | $18,787,992 | $19,439,763 | $19,191,124 | $19,134,895 | 100.0% | $91,119 |
| | | | | | | | |
| Room Expense | 2,633,646 | 2,998,836 | 3,525,388 | 3,649,233 | 3,637,091 | 21.6% | 17,319 |
| Food & Beverage Expense | 1,510,798 | 1,717,098 | 1,489,974 | 1,501,476 | 1,501,476 | 84.4 | 7,150 |
| Other Department Expense | 13,687 | 15,325 | 50,059 | 52,272 | 52,272 | 10.2 | 249 |
| Total Department Expenses | $4,158,131 | $4,731,259 | $5,065,421 | $5,202,981 | $5,190,839 | 27.1% | $24,718 |
| Gross Operating Income | $11,587,763 | $14,056,733 | $14,374,342 | $13,988,143 | $13,944,056 | 72.9% | $66,400 |
| | | | | | | | |
| Total Undistributed Expenses | 5,321,218 | 5,553,550 | 5,444,048 | 5,513,225 | 5,508,587 | 28.8 | 26,231 |
| Gross Operating Profit | $6,266,545 | $8,503,183 | $8,930,294 | $8,474,918 | $8,435,469 | 44.1% | $40,169 |
| | | | | | | | |
| Property Taxes | 722,980 | 643,968 | 716,828 | 703,200 | 703,200 | 3.7 | 3,349 |
| Insurance | 335,366 | 442,417 | 743,122 | 710,100 | 522,355 | 2.7 | 2,487 |
| Total Operating Expenses | $10,537,695 | $11,371,194 | $11,969,419 | $12,129,506 | $11,924,981(3) | 62.3% | $56,786 |
| | | | | | | | |
| Net Operating Income | $5,208,199(2) | $7,416,798(2) | $7,470,344 | $7,061,618 | $7,209,914 | 37.7% | $34,333 |
| FF&E | 0 | 0 | 0 | 0 | 765,396 | 4.0 | 3,645 |
| Net Cash Flow | $5,208,199 | $7,416,798 | $7,470,344 | $7,061,618 | $6,444,519 | 33.7% | $30,688 |
| | | | | | | | |
| NOI DSCR | 1.25x | 1.78x | 1.79x | 1.70x | 1.73x | | |
| NCF DSCR | 1.25x | 1.78x | 1.79x | 1.70x | 1.55x | | |
| NOI Debt Yield | 9.8% | 14.0% | 14.1% | 13.3% | 13.6% | | |
| NCF Debt Yield | 9.8% | 14.0% | 14.1% | 13.3% | 12.2% | | |
| (1) | % of U/W Total Revenue for Room Expense, Food & Beverage Expense and Other Department Expenses are based on their corresponding revenue line items. All other line items represent percent of Total Revenue. |
| (2) | The increase in Net Operating Income from 2021 to 2022 was primarily due to the effect of the novel coronavirus on the hospitality industry in 2020, and the recovery in 2021. Additionally, the Holiday Inn & Suites Ocean City Property underwent an approximately $10.7 million renovation ($50,952/room) in 2021. |
| (3) | Excludes $240,000 annual rent payable out of excess cash flow pursuant to inter-party lease. See “The Borrower and Borrower Sponsors”, above. |
Appraisal. The appraised value of $88,700,000 is as of May 6, 2024 and represents the as-is value of the Holiday Inn & Suites Ocean City Property. The appraisal also provided a Prospective Market Value upon Stabilization of $94,700,000 as of May 6, 2025, representing a 56.0% Cut-Off Date LTV Ratio.
Environmental Matters. According to the Phase I environmental site assessment dated May 14, 2024, there was no evidence of any recognized environmental conditions at the Holiday Inn & Suites Ocean City Property.
Market Overview and Competition. The Holiday Inn & Suites Ocean City Property is located in Ocean City, Maryland. The hotel is located near major access streets, such as Baltimore Avenue and Coastal Highway, providing easy entry and exit for guests. The Holiday Inn & Suites Ocean City Property has three primary highway access routes to Ocean City which are U.S. Route 50 to the south, MD Route 90 near mid-town at 62nd Street, and DE Route 54 to the north, just across the state line in Fenwick Island, Delaware. The main north/south route in Ocean City is Coastal Highway.
The Salisbury-Ocean City Wicomico Regional Airport is located about 28 miles from Ocean City. The Salisbury CBD, the economic center of the region, is approximately 31 miles from Ocean City. Regional shopping areas include the Ocean City Factory Outlets in West Ocean City, and the Rehoboth Beach Outlets in Delaware.
According to the appraisal, the 2023 estimated population within a two-, five-mile and ten-mile radius of the Holiday Inn & Suites Ocean City Property was 3,567, 19,893 and 51,360 respectively. The 2023 estimated average household income within the same two-mile, five-mile and ten-mile radius was $83,125, $103,791 and $97,456 respectively.
According to a third-party research report, the Holiday Inn & Suites Ocean City Property is located in the Ocean City, MD submarket. The appraisal did not identify any new hotels under construction or planned for near term development that are expected to directly compete with the Holiday Inn & Suites Ocean City Property.
| THE INFORMATION IN THIS STRUCTURAL AND COLLATERAL TERM SHEET IS NOT COMPLETE AND MAY BE AMENDED PRIOR TO THE TIME OF SALE. THIS TERM SHEET IS NOT AN OFFER TO SELL THESE SECURITIES AND IT IS NOT A SOLICITATION OF AN OFFER TO BUY THESE SECURITIES IN ANY JURISDICTION WHERE THE OFFER OR SALE IS NOT PERMITTED. |
| | 71 | |
| Hospitality – Full Service | Loan #5 | Cut-off Date Balance: | | $53,000,000 |
1701 Atlantic Avenue Ocean City, MD 21842 | Holiday Inn & Suites Ocean City | Cut-off Date LTV: U/W NCF DSCR: U/W NOI Debt Yield: | | 59.8% 1.55x 13.6% |
The table below presents certain information relating to comparable sales pertaining to the Holiday Inn & Suites Ocean City Property identified by the appraisal:
| Comparable Sales Summary |
Property Name | Location | Year Built/Renovated | Rooms | Sale Date | Sale Price / Room |
Four Points by Sheraton
Jacksonville | 11 1st Street North Jacksonville Beach, FL | 2001/NAV | 80 | 11/2023 | $459,375 |
Delta Hotels Virginia Beach
Bay front Suites | 2800 Shore Drive Virginia Beach, VA | 1986/NAV | 295 | 6/2022 | $277,966 |
Courtyard Ocean City
Oceanfront | 2 15th Street Ocean City, MD | 2009/NAV | 91 | 5/2022 | $415,385 |
| Park Place Hotel | 208 North Baltimore Avenue Ocean City, MD | 2000/NAV | 90 | 12/2021 | $311,111 |
Hampton Inn Virginia
Beach-Oceanfront South | 1011 Atlantic Avenue Virginia Beach, VA | 2009/NAV | 141 | 9/2021 | $257,092 |
| The Bellmoor Inn & Spa | 6 Christian Street Rehoboth Beach, DE | 1932/NAV | 78 | 2/2020 | $387,821 |
Escrows.
Real Estate Taxes – The Holiday Inn & Suites Mortgage Loan documents require an upfront reserve of $596,395 and ongoing monthly real estate tax reserves in an amount equal to 1/12th of the real estate taxes that the lender estimates will be payable during the next 12 months, initially $59,639.
Insurance – The Holiday Inn & Suites Mortgage Loan documents require an ongoing monthly insurance reserve in an amount equal to 1/12 of the insurance premiums that the lender reasonably estimates. Notwithstanding the above, the borrower’s obligation to make insurance reserve payments will be provided so long as (i) no event of default is continuing, (ii) the insurance policies maintained by the borrower are part of a blanket or umbrella policy approved by the lender in its reasonable discretion, and (iii) the lender is provided with paid receipts for the payment of the insurance premiums no later than 10 days after to the expiration dates of said policies.
FF&E Reserve - The Holiday Inn & Suites Mortgage Loan documents require ongoing monthly deposits in an amount equal to 1/12th of 4% of the gross revenue for the preceding calendar year reserved under the franchise agreement for FF&E, initially estimated at $64,799.
Seasonality Reserve – The Holiday Inn & Suites Mortgage Loan documents require an upfront deposit of $950,000. On each monthly payment date occurring in June, an amount equal to $200,000, each monthly payment date occurring in July, an amount equal to $750,000, each monthly payment date occurring in August, an amount equal to $1,500,000 and each monthly payment date occurring in September, an amount equal to $1,250,000 (“the Seasonality Reserve Monthly Deposit”).
New PIP Deposit Springing Reserve - The Holiday Inn & Suites Mortgage Loan documents require a springing reserve in an amount equal to 115% of the estimated cost of any new property improvement plan required by franchisor under the franchise agreement, including any replacement franchise agreement.
Lockbox and Cash Management. The Holiday Inn & Suites Ocean City Mortgage Loan is structured with a hard lockbox and springing cash management. The borrower and manager are required to direct all credit card companies to deposit all amounts due directly into the lockbox account, which will be transferred to the borrower’s operating account on a daily basis when there is no Cash Trap Event Period (as defined below) in place. During a Cash Trap Event Period, any excess cash flow remaining after satisfaction of the payment priorities outlined in Holiday Inn & Suites Ocean City Mortgage Loan documents is required to be swept to an excess cash flow subaccount to be held as additional collateral for Holiday Inn & Suites Ocean City Mortgage Loan.
A “Cash Trap Event Period” will commence upon the earlier of the following:
| (i) | an event of default; or |
| (ii) | the expiration, termination or cancellation of franchise agreement |
| (iii) | subject to the borrower’s payment of a DSCR trigger avoidance payment, the debt service coverage ratio (based on interest-only payments) falling below 1.35x. A “DSCR trigger avoidance payment” means prepayment of the loan in an amount sufficient to satisfy the 1.35x DSCR threshold, together with applicable yield maintenance and interest shortfall amounts due. |
A Cash Trap Event Period will end upon the occurrence of the following:
| ● | with regard to clause (i), the cure of such event of default; or |
| ● | with regard to clause (ii), above, upon the date that (a) Harrison HI 18 LLC 1 has entered into a replacement franchise agreement, (b) Harrison HI 18 LLC 1 is in possession of a replacement franchise agreement, and (c) Harrison HI 18 LLC 1 are not in default under such replacement franchise agreement. |
| ● | with regard to clause (iii), upon the amortizing NCF DSCR being equal to or greater than 1.40x for two consecutive quarters. |
| THE INFORMATION IN THIS STRUCTURAL AND COLLATERAL TERM SHEET IS NOT COMPLETE AND MAY BE AMENDED PRIOR TO THE TIME OF SALE. THIS TERM SHEET IS NOT AN OFFER TO SELL THESE SECURITIES AND IT IS NOT A SOLICITATION OF AN OFFER TO BUY THESE SECURITIES IN ANY JURISDICTION WHERE THE OFFER OR SALE IS NOT PERMITTED. |
| | 72 | |
| Hospitality – Full Service | Loan #5 | Cut-off Date Balance: | | $53,000,000 |
1701 Atlantic Avenue Ocean City, MD 21842 | Holiday Inn & Suites Ocean City | Cut-off Date LTV: U/W NCF DSCR: U/W NOI Debt Yield: | | 59.8% 1.55x 13.6% |
Property Management. The Holiday Inn & Suites Ocean City Property is managed by Harrison Group General, LLC, an affiliate of the borrower.
Partial Release. Not permitted.
Real Estate Substitution. Not permitted.
Subordinate and Mezzanine Indebtedness. Not permitted.
Ground Lease. None.
Property/Terrorism Insurance. The Holiday Inn & Suites Mortgage Loan documents require an “all risk” insurance policy on a replacement cost basis, together with (i) business interruption insurance covering no less than the 18-month period following the occurrence of a casualty event, together with a 6-month extended period of indemnity, (ii) windstorm and /or named storm coverage with a deductible up to 5% of the total insurable value, and (iii) terrorism coverage as defined by TRIPRA. See “Risk Factors—Risks Relating to the Mortgage Loans—Terrorism Insurance May Not Be Available for All Mortgaged Properties” in the prospectus.
| THE INFORMATION IN THIS STRUCTURAL AND COLLATERAL TERM SHEET IS NOT COMPLETE AND MAY BE AMENDED PRIOR TO THE TIME OF SALE. THIS TERM SHEET IS NOT AN OFFER TO SELL THESE SECURITIES AND IT IS NOT A SOLICITATION OF AN OFFER TO BUY THESE SECURITIES IN ANY JURISDICTION WHERE THE OFFER OR SALE IS NOT PERMITTED. |
| | 73 | |
| Retail – Super Regional Mall | Loan #6 | Cut-off Date Balance: | | $46,000,000 |
| 4663 River City Drive | St. Johns Town Center | Cut-off Date LTV: | | 47.8% |
| Jacksonville, FL 32246 | | U/W NCF DSCR: | | 2.09x |
| | | U/W NOI Debt Yield: | | 13.3% |
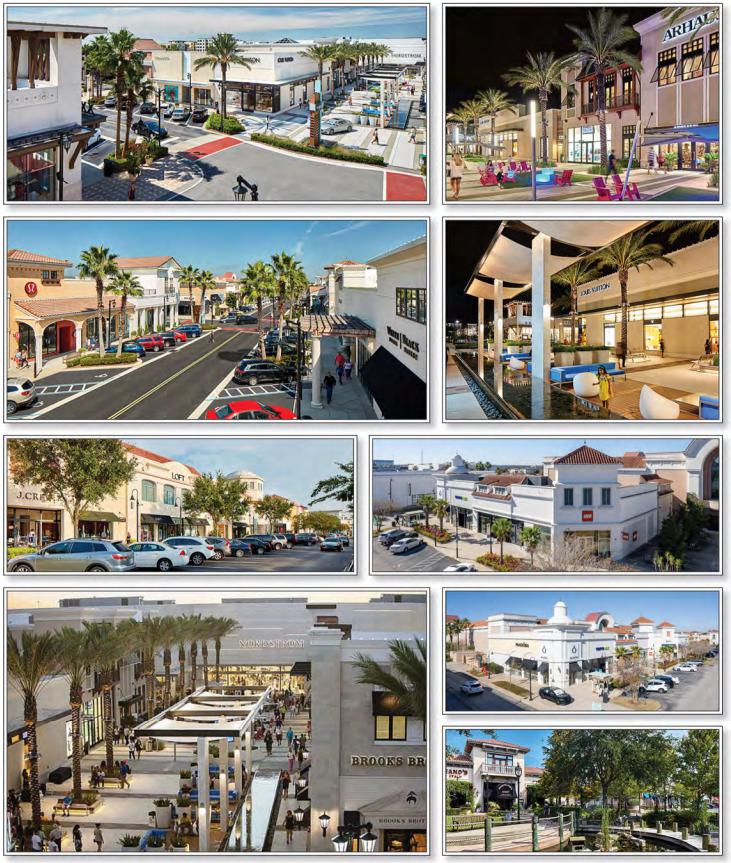
| THE INFORMATION IN THIS STRUCTURAL AND COLLATERAL TERM SHEET IS NOT COMPLETE AND MAY BE AMENDED PRIOR TO THE TIME OF SALE. THIS TERM SHEET IS NOT AN OFFER TO SELL THESE SECURITIES AND IT IS NOT A SOLICITATION OF AN OFFER TO BUY THESE SECURITIES IN ANY JURISDICTION WHERE THE OFFER OR SALE IS NOT PERMITTED. |
| | 74 | |
| Retail – Super Regional Mall | Loan #6 | Cut-off Date Balance: | | $46,000,000 |
| 4663 River City Drive | St. Johns Town Center | Cut-off Date LTV: | | 47.8% |
| Jacksonville, FL 32246 | | U/W NCF DSCR: | | 2.09x |
| | | U/W NOI Debt Yield: | | 13.3% |
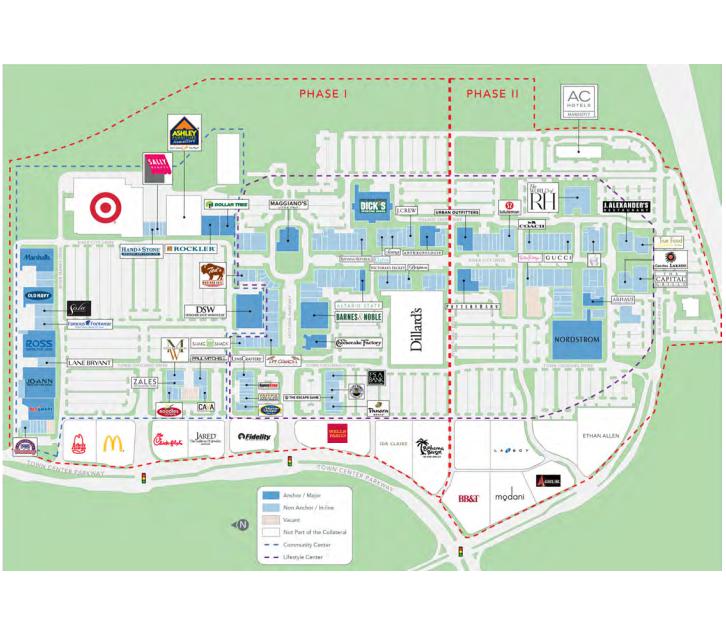
| THE INFORMATION IN THIS STRUCTURAL AND COLLATERAL TERM SHEET IS NOT COMPLETE AND MAY BE AMENDED PRIOR TO THE TIME OF SALE. THIS TERM SHEET IS NOT AN OFFER TO SELL THESE SECURITIES AND IT IS NOT A SOLICITATION OF AN OFFER TO BUY THESE SECURITIES IN ANY JURISDICTION WHERE THE OFFER OR SALE IS NOT PERMITTED. |
| | 75 | |
| Retail – Super Regional Mall | Loan #6 | Cut-off Date Balance: | | $46,000,000 |
| 4663 River City Drive | St. Johns Town Center | Cut-off Date LTV: | | 47.8% |
| Jacksonville, FL 32246 | | U/W NCF DSCR: | | 2.09x |
| | | U/W NOI Debt Yield: | | 13.3% |
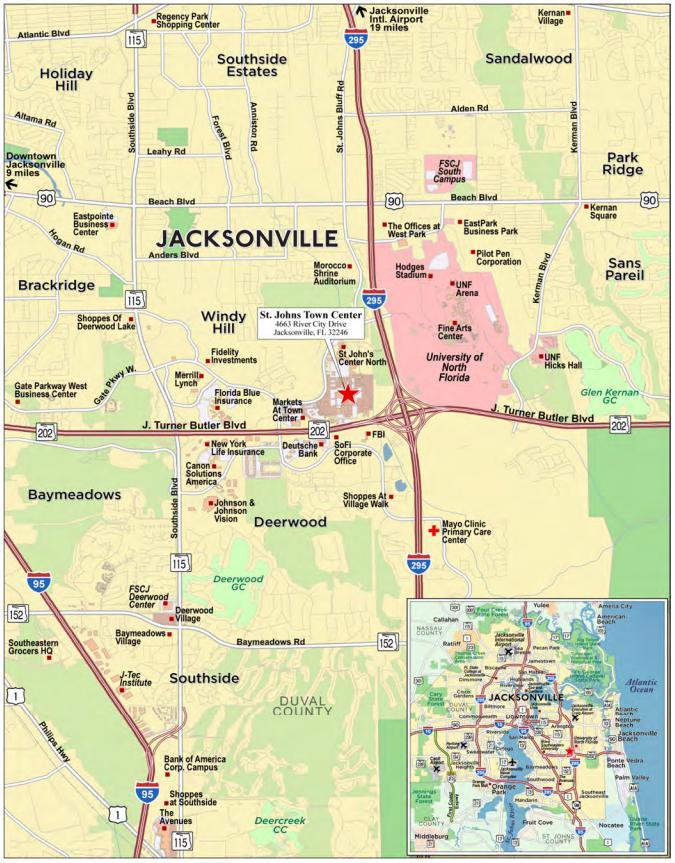
| THE INFORMATION IN THIS STRUCTURAL AND COLLATERAL TERM SHEET IS NOT COMPLETE AND MAY BE AMENDED PRIOR TO THE TIME OF SALE. THIS TERM SHEET IS NOT AN OFFER TO SELL THESE SECURITIES AND IT IS NOT A SOLICITATION OF AN OFFER TO BUY THESE SECURITIES IN ANY JURISDICTION WHERE THE OFFER OR SALE IS NOT PERMITTED. |
| | 76 | |
| No. 6 – St. Johns Town Center |
| |
| Mortgage Loan Information | | Mortgaged Property Information |
| Mortgage Loan Sellers: | JPMorgan Chase Bank, National Association | | Single Asset/Portfolio: | Single Asset |
| Credit Assessment (Fitch/KBRA/Moody’s): | Asf/BBB+(sf)/Aa3(sf) | | Property Type – Subtype: | Retail – Super Regional Mall |
| Original Principal Balance(1): | $46,000,000 | | Location: | Jacksonville, FL |
| Cut-off Date Balance(1): | $46,000,000 | | Size(5): | 1,022,042 SF |
| % of Initial Pool Balance: | 6.4% | | Cut-off Date Balance Per SF(1)(5): | $352.24 |
| Loan Purpose: | Refinance | | Maturity Date Balance Per SF(1)(5): | $352.24 |
| Borrower Sponsor: | Simon Property Group, L.P. | | Year Built/Renovated: | 2005, 2008, 2014 / NAP |
| Guarantor: | Simon Property Group, L.P. | | Title Vesting: | Fee |
| Mortgage Rate: | 5.9480% | | Property Manager: | Simon Management Associates, LLC (borrower-related) |
| Note Date: | May 10, 2024 | | Current Occupancy (As of): | 93.9% (6/1/2024) |
| Seasoning: | 2 months | | YE 2023 Occupancy(6): | 97.0% |
| Maturity Date: | June 1, 2034 | | YE 2022 Occupancy(6): | 95.0% |
| IO Period: | 120 months | | YE 2021 Occupancy(6): | 95.0% |
| Loan Term (Original): | 120 months | | As-Is Appraised Value: | $753,700,000 |
| Amortization Term (Original): | NAP | | As-Is Appraised Value Per SF(5): | $737.45 |
| Loan Amortization Type: | Interest Only | | As-Is Appraisal Valuation Date: | March 21, 2024 |
| Call Protection(2): | L(26),D(88),O(6) | | |
| Lockbox Type: | Hard/Springing Cash Management | | Underwriting and Financial Information |
| Additional Debt(1)(3): | Yes | | YE 2023 NOI(7): | $41,732,761 |
| Additional Debt Type (Balance)(1)(3): | Pari Passu ($314,000,000) | | YE 2022 NOI: | $39,266,904 |
| | | | YE 2021 NOI: | $35,954,705 |
| | | | YE 2020 NOI: | $31,506,200 |
| | | | U/W Revenues: | $63,759,318 |
| Escrows and Reserves(4) | | U/W Expenses: | $15,996,884 |
| | Initial | Monthly | Cap | | U/W NOI(7): | $47,762,434 |
| Taxes: | $0 | Springing | NAP | | U/W NCF: | $45,410,434 |
| Insurance: | $0 | Springing | NAP | | U/W DSCR based on NOI/NCF(1): | 2.20x / 2.09x |
| Replacement Reserves: | $0 | Springing | NAP | | U/W Debt Yield based on NOI/NCF(1): | 13.3% / 12.6% |
| TI/LC Reserve: | $0 | Springing | NAP | | U/W Debt Yield at Maturity based on NOI/NCF(1): | 13.3% / 12.6% |
| Gap Rent Reserve: | $1,394,586 | $0 | NAP | | Cut-off Date LTV Ratio(1): | 47.8% |
| Outstanding TI/LC: | $8,393,631 | $0 | NAP | | LTV Ratio at Maturity(1): | 47.8% |
| | | | | | | | |
| Sources and Uses |
| Sources | | | | Uses | | |
| Whole Loan Amount | $360,000,000 | 98.5 | % | | Loan Payoff | $351,117,405 | 96.0 | % |
| Sponsor Equity | 5,611,283 | 01.5 | | | Reserves | 9,788,217 | 2.7 | |
| | | | | Closing Costs | 4,705,660 | 1.3 | |
| Total Sources | $365,611,283 | 100.0 | % | | Total Uses | $365,611,283 | 100.0 | % |
| (1) | The St. Johns Town Center Mortgage Loan (as defined below) is part of the St. Johns Town Center Whole Loan (as defined below), which is comprised of 72 pari passu promissory notes with an aggregate original principal balance of $360,000,000. The Cut-off Date Balance Per SF, Maturity Date Balance Per SF, U/W DSCR based on NOI/NCF, U/W Debt Yield based on NOI/NCF, U/W Debt Yield at Maturity based on NOI/NCF, Cut-off Date LTV Ratio and LTV Ratio at Maturity presented above are based on the aggregate Cut-off Date principal balance of the St. Johns Town Center Whole Loan. |
| (2) | The St. Johns Town Center Whole Loan may be (a) defeased after the date that is the earlier of (i) two years from the closing date of the securitization that includes the last note to be securitized (the “REMIC Prohibition Period”) and (ii) June 1, 2027 (the “Permitted Release Date”), or (b) prepaid in whole (but not in part) with the payment of an amount equal to the yield maintenance premium if the Permitted Release Date has occurred but the REMIC Prohibition Period has not occurred, provided that any portion of the St. Johns Town Center Whole Loan that has been securitized, as of such projected prepayment date, for a period of more than two years from the closing date of the REMIC trust which holds such securitized portion of the St. Johns Town Center Whole Loan is contemporaneously defeased. The assumed lockout period is based on the expected WFCM 2024-C63 closing date in August 2024. The actual lockout period may be longer. |
| (3) | See “The Mortgage Loan” section below for further discussion of additional mortgage debt. |
| (4) | See “Escrows” section below for further discussion of reserve requirements. |
| (5) | The St. Johns Town Center Property (as defined below) is part of a larger retail development consisting of 1,433,086 square feet (“SF”), including non-collateral tenants such as Dillard’s (242,309 SF), Target (123,735 SF) and Ashley Furniture (45,000 SF). |
| (6) | Includes temporary tenants. |
| (7) | The increase from Most Recent NOI to UW NOI is driven by new leasing. Since the second half of 2023, there have been 13 new leases, totaling $3.8 million of gross rent, executed at the St. Johns Town Center Property. Of such new leasing, 11,953 SF and approximately $1.5 million of gross rent is attributed to tenants who are not yet in occupancy. |
| THE INFORMATION IN THIS STRUCTURAL AND COLLATERAL TERM SHEET IS NOT COMPLETE AND MAY BE AMENDED PRIOR TO THE TIME OF SALE. THIS TERM SHEET IS NOT AN OFFER TO SELL THESE SECURITIES AND IT IS NOT A SOLICITATION OF AN OFFER TO BUY THESE SECURITIES IN ANY JURISDICTION WHERE THE OFFER OR SALE IS NOT PERMITTED. |
| | 77 | |
| Retail – Super Regional Mall | Loan #6 | Cut-off Date Balance: | | $46,000,000 |
| 4663 River City Drive | St. Johns Town Center | Cut-off Date LTV: | | 47.8% |
| Jacksonville, FL 32246 | | U/W NCF DSCR: | | 2.09x |
| | | U/W NOI Debt Yield: | | 13.3% |
The Mortgage Loan. The sixth largest mortgage loan (the “St. Johns Town Center Mortgage Loan”) is part of a whole loan (the “St. Johns Town Center Whole Loan”) evidenced by 72 pari passu promissory notes in the aggregate original principal amount of $360,000,000. The St. Johns Town Center Whole Loan is secured by first priority fee interest in a super-regional mall on a 119.82-acre plot of land in the St. Johns submarket of Jacksonville, Florida (the “St. Johns Town Center Property”). The St. Johns Town Center Whole Loan was co-originated on May 10, 2024 by Barclays Capital Real Estate Inc. (“Barclays”), Goldman Sachs Bank USA (“GSBI”), JPMorgan Chase Bank, National Association (“JPMCB”) and Societe Generale Financial Corporation (“SGFC”). The St. Johns Town Center Mortgage Loan is evidenced by the non-controlling notes A-7-A-1, A-7-B-1, A-7-C-1, A-7-D-1, A-8-A, A-8-B, A-8-C, A-8-D, A-9-A, A-9-B, A-9-C and A-9-D with an aggregate outstanding principal balance as of the Cut-off Date of $46,000,000. The remaining promissory notes comprising the St. Johns Town Center Whole Loan are summarized in the below table. The St. Johns Town Center Whole Loan is expected to be serviced pursuant to the pooling and servicing agreement for the BBCMS 2024-C28 securitization. See “Description of the Mortgage Pool—The Whole Loans—The Non-Serviced Pari Passu Whole Loans” and “Pooling and Servicing Agreement—Servicing of the Non-Serviced Mortgage Loans” in the Preliminary Prospectus.
Whole Loan Note Summary
| Notes | Original Balance | Cut-off Date Balance | Note Holder | Controlling Piece |
| A-1-A | $19,859,697 | $19,859,697 | BBCMS 2024-C28(2) | Yes |
| A-1-B, A-1-C, A-1-D | $25,140,303 | $25,140,303 | BBCMS 2024-C28(2) | No |
| A-2-A, A-2-B, A-2-C, A-2-D(1) | $30,000,000 | $30,000,000 | Barclays | No |
| A-3-A, A-3-B, A-3-C, A-3-D(1) | $25,000,000 | $25,000,000 | Barclays | No |
| A-4-A, A-4-B, A-4-C, A-4-D | $12,500,000 | $12,500,000 | BBCMS 2024-C28(2) | No |
| A-5-A, A-5-B, A-5-C, A-5-D | $7,500,000 | $7,500,000 | BBCMS 2024-C28(2) | No |
| A-6-A, A-6-B, A-6-C, A-6-D | $35,000,000 | $35,000,000 | BANK 2024-BNK47 | No |
| A-7-A-1, A-7-B-1, A-7-C-1, A-7-D-1 | $10,000,000 | $10,000,000 | WFCM 2024-C63 | No |
| A-7-A-2, A-7-B-2, A-7-C-2, A-7-D-2 | $10,000,000 | $10,000,000 | BANK 2024-BNK47 | No |
| A-8-A, A-8-B, A-8-C, A-8-D | $20,000,000 | $20,000,000 | WFCM 2024-C63 | No |
| A-9-A, A-9-B, A-9-C, A-9-D | $16,000,000 | $16,000,000 | WFCM 2024-C63 | No |
| A-10-A, A-10-B, A-10-C, A-10-D | $5,000,000 | $5,000,000 | BANK 2024-BNK47 | No |
| A-11-A, A-11-B, A-11-C, A-11-D | $25,000,000 | $25,000,000 | BANK 2024-BNK47 | No |
| A-12-A, A-12-B, A-12-C, A-12-D | $25,000,000 | $25,000,000 | BANK 2024-BNK47 | No |
| A-13-A, A-13-B, A-13-C, A-13-D | $25,000,000 | $25,000,000 | BMO 2024-C9 | No |
| A-14-A, A-14-B, A-14-C, A-14-D | $21,000,000 | $21,000,000 | BMO 2024-C9 | No |
| A-15-A, A-15-B, A-15-C, A-15-D | $20,000,000 | $20,000,000 | BMO 2024-C9 | No |
| A-16-A, A-16-B, A-16-C, A-16-D | $15,000,000 | $15,000,000 | BMO 2024-C9 | No |
| A-17-A, A-17-B, A-17-C, A-17-D | $13,000,000 | $13,000,000 | BBCMS 2024-C28(2) | No |
| Total | $360,000,000 | $360,000,000 | | |
| (1) | The notes held by the lenders are expected to be contributed to one or more future securitization transactions or may otherwise be transferred at any time. |
| (2) | The BBCMS 2024-C28 securitization transaction is expected to close on or about August 29, 2024. |
The Borrowers and the Borrower Sponsor. The borrowing entities for the St. Johns Town Center Whole Loan are Shops at St. Johns, LLC and STJTC II, LLC, each a Delaware limited liability company and single purpose entity with two independent directors. The borrower sponsor and non-recourse carveout guarantor is Simon Property Group, L.P. (“Simon”). So long as the non-recourse carveout guarantor is either Simon, Simon Property Group, Inc. (“Simon Inc.”), RREEF America II Lower REIT LLC, a Delaware limited liability company, or an affiliate of Simon or Simon Inc., the liability under the guaranty is limited to 20% ($72,000,000) of the original principal amount of the St. Johns Town Center Whole Loan, plus all reasonable out-of-pocket costs and expenses incurred in the enforcement of the guaranty or preservation of the lender’s rights under the guaranty. There is no separate environmental indemnity for the St. Johns Town Center Whole Loan; however, the non-recourse carveout guaranty covers breaches of representations, warranties and indemnification provisions in the loan agreement concerning environmental laws and hazardous materials (subject to the aforementioned 20% cap).
Simon is the operating partnership of Simon Property Group Inc. (NYSE: SPG / S&P: A-), an S&P 100 company and owner of shopping, dining, entertainment and mixed-use destinations. As of March 31, 2024, Simon owned or held an interest in 195 income-producing properties in the United States, including 93 malls, 69 premium outlets, 14 Mills-branded shopping centers, six lifestyle centers and 13 other retail properties. Simon also owns an 84% non-controlling interest in The Taubman Realty Group, LLC, or TRG, which has an interest in 23 regional, super-regional and outlet malls in the U.S. and Asia. Additionally, Simon has a 22.4% ownership interest in Klépierre SA, a publicly traded, Paris-based real estate company, which owns shopping centers in 14 European countries. As of May 13, 2024, Simon had an equity market capitalization of approximately $47.9 billion. Simon is also a borrower sponsor on the Grapevine Mills Whole Loan, which is included in this pool.
| THE INFORMATION IN THIS STRUCTURAL AND COLLATERAL TERM SHEET IS NOT COMPLETE AND MAY BE AMENDED PRIOR TO THE TIME OF SALE. THIS TERM SHEET IS NOT AN OFFER TO SELL THESE SECURITIES AND IT IS NOT A SOLICITATION OF AN OFFER TO BUY THESE SECURITIES IN ANY JURISDICTION WHERE THE OFFER OR SALE IS NOT PERMITTED. |
| | 78 | |
| Retail – Super Regional Mall | Loan #6 | Cut-off Date Balance: | | $46,000,000 |
| 4663 River City Drive | St. Johns Town Center | Cut-off Date LTV: | | 47.8% |
| Jacksonville, FL 32246 | | U/W NCF DSCR: | | 2.09x |
| | | U/W NOI Debt Yield: | | 13.3% |
The Property. The St. Johns Town Center Property is a Class A, open-air, super-regional mall on a 119.82-acre plot of land in the St. Johns submarket of Jacksonville, Florida. The St. Johns Town Center Property consists of a 1,022,042 square foot portion of a larger retail development consisting of 1,433,086 total square feet. The St. Johns Town Center Property benefits from four anchor tenants: Dick’s Clothing & Sporting Goods (“Dick’s”), Dillard’s (non-collateral), Nordstrom and Target (non-collateral). Dillard’s and Target are not part of the collateral and have no attributable underwritten base rent or reimbursements. The St. Johns Town Center Property was constructed in two phases: an initial phase that was built in 2005 (“Phase I”) and a subsequent phase that was constructed in 2008 and 2014 (“Phase II”). Together, Phase I and Phase II comprise a community center (the “Community Center”) and lifestyle center, as outlined in the layout shown on a previous page. The Community Center component is generally L-shaped and extends along the northern border and east side of the St. Johns Town Center Property. The Community Center component also includes three smaller strip centers located along the western border of the St. Johns Town Center Property. The lifestyle component of the St. Johns Town Center Property is comprised of a series of freestanding multi-tenant buildings which line either side of River City Drive and Midtown Parkway. Nordstrom and Dillard’s are located along the west side of the center with secondary roads extending to both. Dick’s and Restoration Hardware are situated along the east side of the St. Johns Town Center Property. A cluster of four freestanding restaurants anchor the south side of the St. Johns Town Center Property. The St. Johns Town Center Property provides parking via 6,149 surface parking spaces (approximately 4.25 spaces per 1,000 square feet).
The St. Johns Town Center Property benefits from having the highest mall grade among the appraiser’s identified competitive properties. The St. Johns Town Center Property has an A+ grade, with competitive properties largely of inferior quality, as determined by a third party market data provider.
As of June 1, 2024, the St. Johns Town Center Property was 93.9% leased to 170 unique tenants (excluding temp tenants), with no tenant accounting for greater than 12.0% of net rentable area and 2.9% of underwritten base rent. In 2023, the tenants at the St. Johns Town Center Property generated approximately $673.0 million in total sales, with comp inline sales (less than 10,000 square feet excluding Apple and Tesla) of $921 per square foot. Inline tenants benefit from high-performing anchor tenancy at the St. Johns Town Center Property, with the Dillard’s location netting the highest sales in the Southeast region and the Dick’s location netting higher sales than any other Dick’s store in the trade area. Inline tenants include both luxury and nationally-recognized brands, such as Apple, Louis Vuitton, Gucci, Chanel, Coach, Tiffany & Co., Mayors, Alo Yoga and Lululemon. The St. Johns Town Center Property has a wide variety of food and beverage options, including The Cheesecake Factory, RH Rooftop Restaurant, The Capital Grille and Cantina Laredo, with food and beverage outlets accounting for over $90.0 million of 2023 sales, in aggregate.
The St. Johns Town Center Property has benefitted from positive leasing momentum, with 52,612 square feet of recently executed leases commencing between 2023 and 2025. Notable brands with recently executed leases include Chanel, Gucci, Aritzia, Breitling, Omega and J. Crew. In addition, luxury tenants including Louis Vuitton, Lovesac, Mayors Jewelers and Lululemon recently expanded into larger spaces.
Simon has invested approximately $44.7 million in capital expenditures since 2019, including approximately $18.0 million allocated to the addition of an RH Gallery in 2021 and approximately $6.0 million to Gucci and Altar’d State tenant allowances. Capital expenditures were also allocated towards building improvements, exterior improvements, roofing, paving and signage.
The following table presents certain information relating to the tenant sales at the St. Johns Town Center Property:
Tenant Sales(1)(2)
| Sales History |
| | 2019 | 2021 | 2022 | 2023 |
| Gross Mall Sales(3) | $590,274,000 | $549,525,000 | $669,225,000 | $672,995,001 |
| Nordstrom | $17,943,000 | $13,321,000 | $20,091,000 | $19,768,260 |
| Dick's(4) | $17,500,000 | $20,100,000 | $20,100,000 | $20,100,000 |
| Comp Sales PSF (Inline < 10,000 SF) (4)(5) | $1,064 | $935 | $1,097 | $1,109 |
| Comp Sales PSF (Inline < 10,000 SF excluding Apple & Tesla)(5) | $627 | $826 | $911 | $921 |
| Occupancy Cost (Inline < 10,000 SF) (4)(5) | 11.0% | 10.6% | 10.4% | 11.0% |
| (1) | Includes the borrower sponsor’s provided estimates for non-reporting anchor tenants and/or non-collateral tenants. Dillard’s, Dick’s, Ross Dress for Less, Target, Ashley Furniture and Marshall’s do not report sales. Dillard’s, Target and Ashley Furniture are non-collateral. |
| (2) | 2020 excluded due to the adverse impact of the COVID-19 pandemic. |
| (3) | Gross Mall Sales includes the Community Center, which is included as collateral. |
| (4) | The Apple lease commenced on February 1, 2023. The Tesla lease expired on January 31, 2022. |
| (5) | Based on estimates provided by the borrower sponsor. |
| THE INFORMATION IN THIS STRUCTURAL AND COLLATERAL TERM SHEET IS NOT COMPLETE AND MAY BE AMENDED PRIOR TO THE TIME OF SALE. THIS TERM SHEET IS NOT AN OFFER TO SELL THESE SECURITIES AND IT IS NOT A SOLICITATION OF AN OFFER TO BUY THESE SECURITIES IN ANY JURISDICTION WHERE THE OFFER OR SALE IS NOT PERMITTED. |
| | 79 | |
| Retail – Super Regional Mall | Loan #6 | Cut-off Date Balance: | | $46,000,000 |
| 4663 River City Drive | St. Johns Town Center | Cut-off Date LTV: | | 47.8% |
| Jacksonville, FL 32246 | | U/W NCF DSCR: | | 2.09x |
| | | U/W NOI Debt Yield: | | 13.3% |
Major Tenants.
Nordstrom (123,000 square feet, 12.0% of NRA, 1.1% of underwritten base rent): Nordstrom (Fitch/Moody’s/S&P: BB/Ba2/BB+) was founded in 1901 as a retail shoe business in Seattle, Washington. Nordstrom is a leading fashion designer offering compelling clothing, shoes and accessories for men, women and kids. Nordstrom has more than 350 Nordstrom, Nordstrom Local and Nordstrom Rack locations. Nordstrom executed its ground lease at the St. Johns Town Center Property on April 23, 2013, and its initial lease expiration date is February 28, 2030. Nordstrom has eight, 10-year extension options. Nordstrom reported 2023 sales of approximately $19.8 million and occupancy cost of 2.8% at the St. Johns Town Center Property.
Dick's Clothing & Sporting Goods (66,000 square feet, 6.5% of NRA, 2.9% of underwritten base rent): Dick’s (Fitch/Moody's/S&P: NR/Baa3/BBB) was founded in 1948 as a bait-and-tackle shop in Binghamton, New York, and has since grown to become an omnichannel sporting goods retailer, with a primary focus on sports equipment, apparel, footwear and accessories. Headquartered in Coraopolis, Pennsylvania, Dick’s offers a wide range of products through its main and specialty concept stores, including Dick’s Sporting Goods, Public Lands, Moosejaw and Going Going Gone!. Dick’s is an original tenant at the St. Johns Town Center Property, having executed the lease for its space on October 17, 2003, and subsequently extending its lease term through January 2026. Dick’s has two remaining five-year extension options. The borrower sponsor estimates that Dick’s achieved 2023 sales of $20.1 million and occupancy cost of 7.0% at the St. Johns Town Center Property.
Restoration Hardware (48,697 square feet, 4.8% of NRA, 2.5% of underwritten base rent): Founded in 1980 and headquartered in Corte Madera, California, Restoration Hardware (Fitch/Moody's/S&P: NR/B1/NR) is a retailing company that offers home furnishing products, including fabric and leather seating, bedding accessories, tables, faucets, mirrors, lighting, rugs, etc. Restoration Hardware sells its products through its stores, websites and catalogs, and owns and operates a network of retail outlets across the US, Canada and the UK. Restoration Hardware executed its ground lease at the St. Johns Town Center Property in January 2020, and has an initial lease expiration date in January 2037. Restoration Hardware has three, five-year renewal options remaining. Restoration Hardware reported 2023 sales of approximately $25.7 million and occupancy cost of 6.8% at the St. Johns Town Center Property.
| THE INFORMATION IN THIS STRUCTURAL AND COLLATERAL TERM SHEET IS NOT COMPLETE AND MAY BE AMENDED PRIOR TO THE TIME OF SALE. THIS TERM SHEET IS NOT AN OFFER TO SELL THESE SECURITIES AND IT IS NOT A SOLICITATION OF AN OFFER TO BUY THESE SECURITIES IN ANY JURISDICTION WHERE THE OFFER OR SALE IS NOT PERMITTED. |
| | 80 | |
| Retail – Super Regional Mall | Loan #6 | Cut-off Date Balance: | | $46,000,000 |
| 4663 River City Drive | St. Johns Town Center | Cut-off Date LTV: | | 47.8% |
| Jacksonville, FL 32246 | | U/W NCF DSCR: | | 2.09x |
| | | U/W NOI Debt Yield: | | 13.3% |
The following table presents certain information relating to the major tenant sales at the St. Johns Town Center Property:
Major/Select In-Line Tenant Sales(1)(2)
| Tenant Name | SF | 2019 | 2021 | 2022 | 2023 | 2023 Sales PSF | Occupancy Cost |
| Anchor Tenants | | | | | | | |
| Nordstrom | 123,000 | $17,943,000 | $13,321,000 | $20,091,000 | $19,768,260 | $161 | 2.8% |
| Dick’s(3) | 66,000 | $17,500,000 | $20,100,000 | $20,100,000 | $20,100,000 | $305 | 7.0% |
| Major Tenants (Top 10 by SF) | | | | | | | |
| Restoration Hardware | 48,697 | N/A | N/A | $26,440,000 | $25,685,817 | $527 | 6.8% |
| Jo-Ann Fabrics | 35,000 | $4,680,000 | $4,374,000 | $4,223,000 | $3,966,282 | $113 | 15.4% |
| Ross Dress For Less | 30,187 | $7,000,000 | $9,700,000 | $9,800,000 | $9,800,000 | $325 | 5.3% |
| DSW Shoe Warehouse | 30,000 | $8,784,000 | $9,562,000 | $10,326,000 | $9,855,965 | $329 | 6.7% |
| Barnes & Noble | 25,153 | $5,877,000 | $4,871,000 | $7,896,000 | $7,556,930 | $300 | 10.6% |
| Marshalls | 23,636 | N/A | N/A | $6,300,000 | $6,300,000 | $267 | 8.6% |
| PetSmart | 19,107 | $6,410,000 | $7,854,000 | $8,231,000 | $8,510,546 | $445 | 4.8% |
| Old Navy | 16,953 | $7,989,000 | $8,069,000 | $7,458,000 | $7,336,126 | $433 | 11.3% |
| Arhaus Furniture | 16,000 | $6,110,000 | $7,717,000 | $11,451,000 | $12,253,281 | $766 | 9.3% |
| Altar'd State | 14,882 | $2,159,000 | $3,012,000 | $3,110,000 | $6,807,947 | $457 | 19.3% |
| Signature Tenants | | | | | | | |
| Anthropologie | 10,736 | $1,721,000 | $1,804,000 | $4,321,000 | $4,500,327 | $419 | 15.0% |
| Apple | 8,181 | $72,614,000 | $35,554,000 | $46,580,000 | $50,899,583 | $6,222 | 1.9% |
| Lululemon | 7,500 | $6,332,000 | $7,493,000 | $11,501,000 | $15,340,209 | $2,045 | 6.9% |
| Louis Vuitton | 6,053 | $21,103,000 | $42,595,000 | $45,692,000 | $37,478,447 | $6,192 | 5.7% |
| Sephora | 4,802 | $8,119,000 | $8,808,000 | $11,908,000 | $16,367,961 | $3,409 | 6.9% |
| Gucci(4) | 4,492 | N/A | N/A | N/A | $9,426,829 | $2,099 | 11.6% |
| Mayor's Jewelers | 4,147 | $3,282,000 | $8,639,000 | $10,562,000 | $4,386,394 | $1,058 | 19.5% |
| Alo Yoga(4) | 3,697 | N/A | N/A | N/A | $1,439,782 | $389 | 36.4% |
| Tiffany & Co. | 3,538 | $5,524,000 | $9,155,000 | $9,745,000 | $8,603,561 | $2,432 | 5.0% |
| (1) | All sales information presented herein with respect to the St. Johns Town Center Property is based upon information provided by Simon. In certain instances, sales figures represent estimates because the tenants are not required to report, or otherwise may not have reported sales information on a timely basis. Further, because sales are self-reported, such information is not independently verified by the borrower sponsor. |
| (2) | 2020 excluded due to the adverse impact of the COVID-19 pandemic on the St. Johns Town Center Property. |
| (3) | Based on estimates provided by the borrower sponsor. |
| (4) | Gucci and Alo Yoga opened in March 2023 and July 2023, respectively. 2023 sales do not reflect a full year of operations. |
| THE INFORMATION IN THIS STRUCTURAL AND COLLATERAL TERM SHEET IS NOT COMPLETE AND MAY BE AMENDED PRIOR TO THE TIME OF SALE. THIS TERM SHEET IS NOT AN OFFER TO SELL THESE SECURITIES AND IT IS NOT A SOLICITATION OF AN OFFER TO BUY THESE SECURITIES IN ANY JURISDICTION WHERE THE OFFER OR SALE IS NOT PERMITTED. |
| | 81 | |
| Retail – Super Regional Mall | Loan #6 | Cut-off Date Balance: | | $46,000,000 |
| 4663 River City Drive | St. Johns Town Center | Cut-off Date LTV: | | 47.8% |
| Jacksonville, FL 32246 | | U/W NCF DSCR: | | 2.09x |
| | | U/W NOI Debt Yield: | | 13.3% |
The following table presents certain information relating to the major tenants at the St. Johns Town Center Property:
Tenant Summary(1)
| Tenant Name | Credit Rating (Fitch/Moody's /S&P)(2) | Tenant NRSF | % of NRSF | Annual U/W Rent | % of Total Annual U/W Rent | Annual U/W Rent PSF | | Ext. Options |
| Term. Option (Y/N) | Lease Expiration Date |
| Anchor Tenants | | | | | | | | | |
| Nordstrom(3) | BB/Ba2/BB+ | 123,000 | 12.0% | $420,677 | 1.1% | $3.42 | N | 2/28/2030 | 8 x 10Yr |
| Dick's | NR/Baa3/BBB | 66,000 | 6.5% | $1,056,000 | 2.9% | $16.00 | Y(4) | 1/31/2026 | 2 x 5 Yr |
| Total / Wtd. Avg. | | 189,000 | 18.5% | $1,476,677 | 4.0% | $7.81 | | | |
| | | | | | | | | | |
| Major Tenants (Top 10 by SF) | | | | | | | | |
| Restoration Hardware(3) | NR/B1/NR | 48,697 | 4.8% | $923,328 | 2.5% | $18.96 | N | 1/31/2037 | 3 x 5Yr |
| Jo-Ann Fabrics | NR/B3/NR | 35,000 | 3.4% | $385,000 | 1.0% | $11.00 | Y(5) | 1/31/2026 | 2 x 5 Yr |
| Ross Dress For Less | NR/A2/BBB+ | 30,187 | 3.0% | $362,244 | 1.0% | $12.00 | Y(6) | 1/31/2026 | 2 x 5 Yr |
| DSW Shoe Warehouse | NR/NR/NR | 30,000 | 2.9% | $570,000 | 1.5% | $19.00 | Y(7) | 1/31/2029 | 2 x 5 Yr |
| Barnes & Noble | NR/NR/NR | 25,153 | 2.5% | $646,323 | 1.8% | $25.70 | Y(8) | 5/31/2030 | None |
| Marshalls | NR/A2/A | 23,636 | 2.3% | $366,358 | 1.0% | $15.50 | N | 5/31/2032 | 4 x 5 Yr |
| PetSmart | NR/B1/B+ | 19,107 | 1.9% | $296,159 | 0.8% | $15.50 | Y(9) | 5/31/2025 | 3 x 5 Yr |
| Old Navy | NR/Ba3/BB | 16,953 | 1.7% | $599,069 | 1.6% | $35.34 | Y(10) | 1/31/2026 | None |
| Arhaus Furniture | NR/NR/NR | 16,000 | 1.6% | $540,000 | 1.5% | $33.75 | Y(11) | 1/31/2025 | 1 x 5 Yr |
| Altar'd State | NR/NR/NR | 14,882 | 1.5% | $1,056,176 | 2.9% | $70.97 | Y(12) | 1/31/2038 | None |
| Total/Wtd. Avg. | | 259,615 | 25.4% | $5,744,656 | 15.6% | $22.13 | | | |
| | | | | | | | | | |
| Remaining Occupied | | 511,060 | 50.0% | $29,684,658 | 80.4% | $58.08 | | | |
| | | | | | | | | | |
| Occupied Total | | 959,675 | 93.9% | $36,905,992 | 100.0% | $38.46 | | | |
| Vacant Space | | 62,367 | 6.1% | | | | | | |
| Total/Wtd. Avg. | | 1,022,042 | 100.0% | | | | | | |
| (1) | Based on the underwritten rent roll dated June 1, 2024, inclusive of rent steps through May 2025. |
| (2) | In certain instances, ratings provided are those of the parent company of the entity shown, whether or not the parent company guarantees the lease. |
| (3) | Nordstrom and Restoration Hardware are subject to ground leases. Additionally, Nordstrom is responsible for CAM charges and Restoration Hardware is responsible for real estate taxes and utilities. |
| (4) | Dick’s has the right to terminate its lease if less than 700,000 square feet of NRA is open for business to the public. Additionally, Dick’s may terminate its lease if Simon enters into a lease for greater than 10,000 square feet with a tenant that utilizes its space for (i) health, fitness and/or exercise equipment, (ii) sporting goods, (iii) sporting equipment, and/or (iv) athletic footwear. |
| (5) | Jo-Ann Fabrics has the right to terminate its lease if (i) Target or Dillard’s and four major tenants are not open for business to the public or (ii) Target, Dillard’s and three major tenants are not open for business to the public. |
| (6) | Ross Dress for Less has the right to terminate its lease if less than 900,000 square feet of NRA is open for business to the public. |
| (7) | DSW Shoe Warehouse has the right to terminate its lease if (i) Dillard’s, Target or a replacement anchor tenant vacates or (ii) occupancy, inclusive of the Community Center, falls below 65% of gross leasable area. |
| (8) | Barnes & Noble has the right to terminate its lease if parking spaces falls below the greater of (i) 4.5 parking spaces per one thousand square feet of NRA and (ii) the number of parking spaces imposed by any local code requirements. Additionally, Barnes & Noble may terminate its lease if less than 50% of NRA is actively occupied and open for business. |
| (9) | PetSmart has the right to terminate its lease if either of the following tenant groupings are not open for business to the public: (i) Target and three national or regional retailers that occupy greater than 20,000 square feet or (ii) Dillard’s and four national or regional retailers that occupy greater than 20,000 square feet. |
| (10) | Old Navy has the right to terminate its lease if (i) fewer than three major tenants are open for business or (ii) less than 75% of NRA, excluding Old Navy’s space, outparcels and major tenants spaces, is open for business to the public. |
| (11) | Arhaus Furniture has the right to terminate its lease if (i) Nordstrom, or its replacement, permanently closes of business, or (ii) less than 70% of NRA is open for business to the public. |
| (12) | Altar’d State has the right to terminate its lease if (i) less than three major tenants are open and operating or (ii) less than 75% of NRA, excluding space designed to be occupied by major tenants, is open and operating. |
| THE INFORMATION IN THIS STRUCTURAL AND COLLATERAL TERM SHEET IS NOT COMPLETE AND MAY BE AMENDED PRIOR TO THE TIME OF SALE. THIS TERM SHEET IS NOT AN OFFER TO SELL THESE SECURITIES AND IT IS NOT A SOLICITATION OF AN OFFER TO BUY THESE SECURITIES IN ANY JURISDICTION WHERE THE OFFER OR SALE IS NOT PERMITTED. |
| | 82 | |
| Retail – Super Regional Mall | Loan #6 | Cut-off Date Balance: | | $46,000,000 |
| 4663 River City Drive | St. Johns Town Center | Cut-off Date LTV: | | 47.8% |
| Jacksonville, FL 32246 | | U/W NCF DSCR: | | 2.09x |
| | | U/W NOI Debt Yield: | | 13.3% |
The following table presents certain information relating to the lease rollover schedule at the St. Johns Town Center Property:
Lease Expiration Schedule(1)(2)
Year Ending
December 31 | No. of Leases Expiring | Expiring NRSF | % of Total NRSF | Cumulative Expiring NRSF | Cumulative % of Total NRSF | Annual
U/W
Base Rent(3) | % of Total Annual U/W Base Rent | Annual
U/W
Base Rent
PSF |
| 2024 & MTM | 13 | 32,253 | 3.2% | 32,253 | 3.2% | $1,169,960 | 3.2% | $36.27 |
| 2025 | 16 | 90,984 | 8.9% | 123,237 | 12.1% | $3,318,463 | 9.0% | $36.47 |
| 2026 | 26 | 224,609 | 22.0% | 347,846 | 34.0% | $6,765,993 | 18.3% | $30.12 |
| 2027 | 17 | 78,454 | 7.7% | 426,300 | 41.7% | $4,242,870 | 11.5% | $54.08 |
| 2028 | 17 | 73,588 | 7.2% | 499,888 | 48.9% | $4,736,057 | 12.8% | $64.36 |
| 2029 | 12 | 64,936 | 6.4% | 564,824 | 55.3% | $2,607,932 | 7.1% | $40.16 |
| 2030 | 12 | 181,205 | 17.7% | 746,029 | 73.0% | $3,276,318 | 8.9% | $18.08 |
| 2031 | 5 | 18,292 | 1.8% | 764,321 | 74.8% | $786,170 | 2.1% | $42.98 |
| 2032 | 10 | 63,943 | 6.3% | 828,264 | 81.0% | $2,163,571 | 5.9% | $33.84 |
| 2033 | 6 | 18,317 | 1.8% | 846,581 | 82.8% | $1,317,720 | 3.6% | $71.94 |
| 2034 | 14 | 47,014 | 4.6% | 893,595 | 87.4% | $4,180,792 | 11.3% | $88.93 |
| 2035 & Beyond | 24 | 66,080 | 6.5% | 959,675 | 93.9% | $2,340,147 | 6.3% | $35.41 |
| Vacant | 0 | 62,367 | 6.1% | 1,022,042 | 100.0% | $0 | 0.0% | $0.00 |
| Total/Wtd. Avg. | 172 | 1,022,042 | 100.0% | | | $36,905,992 | 100.0% | $38.46(3) |
| (1) | Based on the underwritten rent roll dated June 1, 2024 inclusive of rent steps through May 2025. |
| (2) | Certain tenants may have lease termination options that are exercisable prior to the stated expiration date of the subject lease or leases that are not considered in the Lease Expiration Schedule. |
| (3) | Total/Wtd. Avg. Annual U/W Base Rent PSF excludes vacant space. |
The following table presents historical occupancy percentages at the St. Johns Town Center Property:
Historical Occupancy
| | 12/31/2019(1) | 12/31/2020(1) | 12/31/2021(1) | 12/31/2022(1) | 12/31/2023(1) | 6/1/2024(2) |
| Incl. Temp Tenants | 98.0% | 93.0% | 95.0% | 95.0% | 97.0% | N/A |
| Excl. Temp Tenants | 94.0% | 85.0% | 86.0% | 92.0% | 94.0% | 93.9% |
| (1) | Historical occupancies are as of December 31 for each respective year. |
| (2) | Based on the June 1, 2024 rent roll. |
| THE INFORMATION IN THIS STRUCTURAL AND COLLATERAL TERM SHEET IS NOT COMPLETE AND MAY BE AMENDED PRIOR TO THE TIME OF SALE. THIS TERM SHEET IS NOT AN OFFER TO SELL THESE SECURITIES AND IT IS NOT A SOLICITATION OF AN OFFER TO BUY THESE SECURITIES IN ANY JURISDICTION WHERE THE OFFER OR SALE IS NOT PERMITTED. |
| | 83 | |
| Retail – Super Regional Mall | Loan #6 | Cut-off Date Balance: | | $46,000,000 |
| 4663 River City Drive | St. Johns Town Center | Cut-off Date LTV: | | 47.8% |
| Jacksonville, FL 32246 | | U/W NCF DSCR: | | 2.09x |
| | | U/W NOI Debt Yield: | | 13.3% |
Operating History and Underwritten Net Cash Flow. The following table presents certain information relating to the historical operating performance and underwritten net cash flow at the St. Johns Town Center Property:
Cash Flow Analysis(1)
| | 2020 | 2021 | 2022 | 2023 | U/W | %(2) | U/W $
per SF |
| In-Place Base Rent(3) | $29,043,233 | $27,975,913 | $29,632,722 | $32,197,323 | $36,245,458 | 52.8% | $35.46 |
| Rent Steps(4) | 0 | 0 | 0 | 0 | 660,534 | 1.0 | $0.65 |
| Credit Tenant Rent Steps | 0 | 0 | 0 | 0 | 48,492 | 0.1 | $0.05 |
| Temporary Tenant Rent | 831,372 | 1,309,932 | 1,139,618 | 881,055 | 686,000 | 1.0 | $0.67 |
| PIL Rent(5) | 107,710 | 313,991 | 399,527 | 465,637 | 221,032 | 0.3 | $0.22 |
| Overage Rent(6) | 1,115,714 | 3,870,832 | 5,702,397 | 5,842,555 | 5,407,603 | 7.9 | $5.29 |
| Other Rental Income | 53,023 | 54,037 | 53,844 | 50,571 | 61,000 | 0.1 | $0.06 |
| Gross-Up Vacant Rent | 0 | 0 | 0 | 0 | 3,683,196 | 5.4 | $3.60 |
| Total Rental Income | $31,151,052 | $33,524,705 | $36,928,108 | $39,437,141 | $47,013,315 | 68.4% | $46.00 |
| Total Recoveries | 16,757,264 | 15,585,660 | 16,157,119 | 17,723,862 | 21,684,361 | 31.6% | $21.22 |
| Gross Potential Income | $47,908,316 | $49,110,365 | $53,085,227 | $57,161,003 | $68,697,676 | 100.0% | $67.22 |
| Vacancy & Bad Debt | (3,832,965) | (124,095) | (76,314) | (100,950) | (5,458,658) | (7.9) | ($5.34) |
| Other Income | 346,031 | 496,311 | 928,544 | 481,443 | 520,300 | 0.8 | $0.51 |
| Effective Gross Income | $44,421,382 | $49,482,581 | $53,937,457 | $57,541,496 | $63,759,318 | 92.8% | $62.38 |
| | | | | | | | |
| Real Estate Taxes | $6,443,428 | $6,200,481 | $6,194,896 | $6,764,959 | $6,853,350 | 10.7% | $6.71 |
| Insurance | 1,061,740 | 1,161,715 | 1,304,133 | 1,582,047 | 2,001,357 | 3.1 | $1.96 |
| Management Fee | 1,227,408 | 1,455,325 | 1,644,610 | 1,535,262 | 1,000,000 | 1.6 | $0.98 |
| Other Operating Expenses | 4,182,606 | 4,710,355 | 5,526,914 | 5,926,467 | 6,142,177 | 9.6 | $6.01 |
| Total Operating Expenses | $12,915,182 | $13,527,876 | $14,670,553 | $15,808,735 | $15,996,884 | 25.1% | $15.65 |
| | | | | | | | |
| Net Operating Income(7) | $31,506,200 | $35,954,705 | $39,266,904 | $41,732,761 | $47,762,434 | 74.9% | $46.73 |
| Replacement Reserves | 0 | 0 | 0 | 0 | 264,000 | 0.4 | $0.26 |
| TI/LC | 0 | 0 | 0 | 0 | 2,088,000 | 3.3 | $2.04 |
| Net Cash Flow | $31,506,200 | $35,954,705 | $39,266,904 | $41,732,761 | $45,410,434 | 71.2% | $44.43 |
| | | | | | | | |
| NOI DSCR(8) | 1.45x | 1.66x | 1.81x | 1.92x | 2.20x | | |
| NCF DSCR(8) | 1.45x | 1.66x | 1.81x | 1.92x | 2.09x | | |
| NOI Debt Yield(8) | 8.8% | 10.0% | 10.9% | 11.6% | 13.3% | | |
| NCF Debt Yield(8) | 8.8% | 10.0% | 10.9% | 11.6% | 12.6% | | |
| (1) | Based on the underwritten rent roll dated June 1, 2024. |
| (2) | Represents (i) percent of Gross Potential Income for all revenue fields and (ii) percent of Effective Gross Income for all other fields. |
| (3) | Based on the underwritten rent roll dated June 1, 2024, with adjustments made for executed leases, pending renewals and tenants that have given notice to vacate. |
| (4) | Contractual Rent Steps were taken through May 2025. |
| (5) | U/W PIL Rent is based on the terms of applicable leases using 2023 sales figures. |
| (6) | U/W Overage Rent is based on breakpoint amounts closest to, but not after, May 31, 2025, and 2023 sales. |
| (7) | The increase from 2023 Net Operating Income to Underwritten Net Operating Income is driven by new leasing. Since the second half of 2023, there have been 13 new leases, totalling approximately $3.8 million of gross rent, executed at the St. Johns Town Center Property. |
| (8) | Debt service coverage ratios and debt yields are based on the St. Johns Town Center Whole Loan. |
Appraisal. The appraiser concluded to an “As-is” value for the St. Johns Town Center Property of $753,700,000 as of March 21, 2024.
Environmental Matters. According to the Phase I environmental site assessment dated April 4, 2024, there was no evidence of any recognized environmental conditions at the St. Johns Town Center Property.
Market Overview and Competition. The St. Johns Town Center Property is located in the St. Johns submarket of the broader Jacksonville, Florida CBSA, approximately 11.8 miles northwest of the Downtown Jacksonville central business district. The St. Johns Town Center Property lies approximately one mile northeast of Deerwood South Office Park and one mile southwest of the University of North Florida. This area contains Jacksonville’s prime retail, suburban office, and multifamily residential submarkets, as reflected by the submarket’s dominant performance across these sectors.
According the appraiser, following its initial opening in 2005, the St. Johns Town Center Property quickly became the prominent retail destination in Northeast Florida and was the catalyst for a variety of ancillary commercial developments in the area, including the Markets at Town Center, The Strand, TopGolf and numerous full-service and fast food restaurants. The immediate area also includes a number of luxury apartment complexes, supplementing demand at the St. Johns Town Center Property.
| THE INFORMATION IN THIS STRUCTURAL AND COLLATERAL TERM SHEET IS NOT COMPLETE AND MAY BE AMENDED PRIOR TO THE TIME OF SALE. THIS TERM SHEET IS NOT AN OFFER TO SELL THESE SECURITIES AND IT IS NOT A SOLICITATION OF AN OFFER TO BUY THESE SECURITIES IN ANY JURISDICTION WHERE THE OFFER OR SALE IS NOT PERMITTED. |
| | 84 | |
| Retail – Super Regional Mall | Loan #6 | Cut-off Date Balance: | | $46,000,000 |
| 4663 River City Drive | St. Johns Town Center | Cut-off Date LTV: | | 47.8% |
| Jacksonville, FL 32246 | | U/W NCF DSCR: | | 2.09x |
| | | U/W NOI Debt Yield: | | 13.3% |
According to the appraiser, additional proposed mixed-use and retail developments within the southeast corridor of the Butler Boulevard and Interstate 295 interchange are projected to further solidify the viability of this corridor as the dominant retail, office and residential submarkets.
The following table presents certain information relating to the appraiser’s market rent conclusions for the St. Johns Town Center Property:
Market Rent Summary(1)
| | Market
Rent (PSF) | Lease Term
(Yrs.) | Rent
Increase
Projections | New Tenant
Improvements |
| 0 – 1,500 SF | $115.00 | 7 | 1.5% | $50.00 |
| 1,501 – 2,500 SF | $72.00 | 7 | 1.5% | $50.00 |
| 2,501 – 2,500 SF | $70.00 | 7 | 1.5% | $50.00 |
| 5,000 – 10,000 SF | $65.00 | 7 | 1.5% | $50.00 |
| 10,000 SF + | $50.00 | 7 | 1.5% | $50.00 |
| Restaurants | $45.00 | 7 | 1.5% | $75.00 |
| Jewelers | $130.00 | 7 | 1.5% | $50.00 |
| Power Center 0 – 2,500 SF | $55.00 | 5 | 1.0% | $20.00 |
| Power Center 2,501 – 5,000 SF | $35.00 | 5 | 1.0% | $20.00 |
| Power Center 5,001 – 10,000 SF | $30.00 | 5 | 1.0% | $20.00 |
| Power Center 10,000 SF+ | $18.00 | 5 | 1.0% | $20.00 |
| Major – Lifestyle | $30.00 | 10 | 10% in YR 6 | $30.00 |
| Major – Power Center | $20.00 | 10 | 10% in YR 6 | $30.00 |
| Anchor | $16.00 | 10 | 10% in YR 6 | $30.00 |
| (1) | Information obtained from the appraisal. |
The table below presents certain information relating to comparable retail centers pertaining to the St. Johns Town Center Property identified by the appraiser:
Competitive Set(1)
Property Name | Distance to St.
Johns Town
Center Property | Grade(2) | Year Built /
Renovated | Total NRA | Total
Occupancy | Anchor / Major Tenants |
| St. Johns Town Center | | A+ | 2005, 2008,
2014 /NAP | 1,022,042(3)(4) | 93.9%(3)(4) | Dick’s, Dillard’s, Nordstrom and Target |
| Regency Square Mall | 5.0 miles | D | 1967 / 2001 | 1,390,000 | 70% | AMC, Dillard’s, Impact Church, Modern Furniture |
| The Avenues | 5.0 miles | C+ | 1990 / 2005 | 1,111,812 | 63% | Belk, Dillard’s, Forever 21, Furniture Source, JC Penney |
| Orange Park Mall | 13.4 miles | B- | 1975 / 2006 | 959,405 | 86% | Belk, Dick’s, Dillard’s, JC Penney |
| River City Marketplace | 16.5 miles | A- | 2006 / NAP | 905,499 | 99% | Best Buy, BJ’s Wholesale Club, Lowe’s, Walmart Supercenter |
| Oakleaf Town Center | 18.5 miles | N/A | 2007 / NAP | 730,501 | 98% | Hobby Lobby, HomeGoods, Kohl’s, PetSmart, The Home Depot |
| Weighted Average | | | | | 80.6%(5) | |
| (1) | Information obtained from the appraisal, unless otherwise specified. |
| (2) | According to a third party market data provider. |
| (3) | Based on the underwritten rent roll as of June 1, 2024. |
| (4) | Total NRA and Total Occupancy excludes non-collateral tenants (Dillard’s, Target and Ashley Furniture). |
| (5) | Excludes the St. Johns Town Center Property. |
Escrows. At origination, the borrowers were required to deposit into escrow (i) $8,393,631 for outstanding tenant improvement allowances and leasing commissions associated with 18 tenants and (ii) $1,394,586 for outstanding gap rent associated with 11 tenants.
Real Estate Taxes – On a monthly basis during the continuance of a Lockbox Event Period (as defined below) or at any time taxes are not paid by the borrowers prior to the assessment of any penalty, the borrowers are required to escrow 1/12th of the annual estimated tax payments payable during the next ensuing 12 months.
| THE INFORMATION IN THIS STRUCTURAL AND COLLATERAL TERM SHEET IS NOT COMPLETE AND MAY BE AMENDED PRIOR TO THE TIME OF SALE. THIS TERM SHEET IS NOT AN OFFER TO SELL THESE SECURITIES AND IT IS NOT A SOLICITATION OF AN OFFER TO BUY THESE SECURITIES IN ANY JURISDICTION WHERE THE OFFER OR SALE IS NOT PERMITTED. |
| | 85 | |
| Retail – Super Regional Mall | Loan #6 | Cut-off Date Balance: | | $46,000,000 |
| 4663 River City Drive | St. Johns Town Center | Cut-off Date LTV: | | 47.8% |
| Jacksonville, FL 32246 | | U/W NCF DSCR: | | 2.09x |
| | | U/W NOI Debt Yield: | | 13.3% |
Insurance – During the continuance of a Lockbox Event Period, except if the St. Johns Town Center Property is insured under an acceptable blanket policy, the borrowers are required to escrow 1/12th of the annual estimated insurance payments on a monthly basis.
Replacement Reserve – During the continuance of a Lockbox Event Period, the borrowers are required to escrow approximately $22,000 on a monthly basis for replacements and repairs to be made at the St. Johns Town Center Property.
TI/LC Reserve – During the continuance of a Lockbox Event Period, the borrowers are required to escrow approximately $174,000 on a monthly basis for ongoing leasing reserves.
A “Lockbox Event Period” means the period commencing upon the occurrence of (i) an event of default, (ii) bankruptcy action of the borrowers or property manager (if the property manager is an affiliate of the borrowers) and the property manager is not replaced within 60 days with a qualified manager, or (iii) the debt yield based on the trailing four calendar quarters is less than 10.0% for two consecutive calendar quarters. A Lockbox Event Period will end (a) with respect to clause (i) above, if the cure of the event of default has been accepted by the lender, (b) with respect to clause (ii) above, if the property manager is replaced within 60 days or the bankruptcy action with respect to the property manager is dismissed within 90 days without adverse consequences to the St. Johns Town Center Property, or (c) with respect to clause (iii) above, (A) the debt yield based on the trailing four calendar quarters is greater than or equal to 10.0% for two consecutive calendar quarters (B) the borrowers prepay a portion of the St. Johns Town Center Whole Loan in accordance with the St. Johns Town Center Whole Loan documents in an amount sufficient such that the debt yield is no less than 10.00%, or (C) borrowers deliver to lender (1) cash, (2) U.S. obligations, (3) other securities having a rating reasonably acceptable to lender and for which a rating agency confirmation has been received, or (4) a letter of credit, in each case in an amount equal to an amount which, if applied to the repayment of the St. Johns Town Center Whole Loan would result in a debt yield equal to 10.00%; provided, however, that (A) no event of default or other Lockbox Event Period is continuing, (B) the borrowers have paid all of the lender’s reasonable expenses incurred in connection with the cure of such Lockbox Event Period, including reasonable attorney’s fees and expenses, (C) the borrowers may not cure a Lockbox Event Period more than a total of five times in the aggregate during the term of the St. Johns Town Center Whole Loan, and (D) in no event may the borrowers cure a Lockbox Event Period caused by a bankruptcy action of the borrowers.
Lockbox and Cash Management. The St. Johns Town Center Whole Loan is structured with a hard lockbox and springing cash management. The borrowers and property manager are required to direct the tenants to pay rent directly into the lockbox account, and to deposit any rents otherwise received in such account within two business days after receipt. During the continuance of a Lockbox Event Period, all funds in the lockbox account are required to be swept on a weekly basis and to a lender-controlled cash management account. Funds in the cash management account are required to be applied to debt service and the reserves and escrows described above, with any excess funds (i) to be deposited into an excess cash flow reserve account held by the lender as cash collateral for the St. Johns Town Center Whole Loan, or if (ii) no Lockbox Event Period is continuing, disbursed to the borrowers.
Property Management. The St. Johns Town Center Property is managed by Simon Management Associates, LLC, an affiliate of the borrowers.
Partial Release. The St. Johns Town Center Whole Loan documents permit the borrowers to obtain the release of non-income producing portions of the St. Johns Town Center Property in connection with a transfer to third parties or affiliates of the borrowers without the payment of a release price provided that, among other conditions, the borrowers satisfy customary REMIC requirements.
Real Estate Substitution. Not permitted.
Subordinate and Mezzanine Indebtedness. None.
Letter of Credit. None.
Right of First Offer / Right of First Refusal. None.
Ground Lease. Each of the Phase I and Phase II parcels at the St. Johns Town Center Property is subject to a long-term ground lease. Each ground lease is between an affiliate of the respective borrower, St. Johns Town Center, LLC, as fee owner, and such borrower, as tenant. In each case, the affiliated fee owner has mortgaged its fee interest in the St. Johns Town Center Property as collateral for the St. Johns Town Center Whole Loan. In the event of an exercise of remedies under the St. Johns Town Center Whole Loan documents, the lenders would be entitled to foreclose on both the fee and leasehold interests simultaneously and, if desired, eliminate the ground lease structure and take title to the St. Johns Town Center Property in fee (or if the lenders so elected, to retain the ground lease structure and own both fee and leasehold interests). The term of the ground lease for the Phase I parcel is scheduled to expire on March 21, 2064, and the term of the ground lease for the Phase II parcel is scheduled to expire on December 21, 2064.
Terrorism Insurance. The borrowers are required to obtain and maintain property insurance and business interruption insurance for 24 months plus a 365-day extended period of indemnity. Such insurance is required to cover perils of terrorism and acts of terrorism. If the Terrorism Risk Insurance Program Reauthorization Act of 2019 is not in effect, the borrower will only be required to pay for terrorism insurance a maximum of two times the annual insurance premiums payable for the St. Johns Town Center Property at the time with respect to the property and business income or rental income insurance interruption policies (excluding the terrorism and earthquake components of such premiums). See “Risk Factors—Risks Relating to the Mortgage Loans—Terrorism Insurance May Not Be Available for All Mortgaged Properties” in the Preliminary Prospectus.
PACE Loan. The St. Johns Town Center Whole Loan documents permit the borrowers to enter into a PACE loan for an amount not to exceed $5,000,000, subject to the consent of the lender and delivery of a rating agency confirmation.
| THE INFORMATION IN THIS STRUCTURAL AND COLLATERAL TERM SHEET IS NOT COMPLETE AND MAY BE AMENDED PRIOR TO THE TIME OF SALE. THIS TERM SHEET IS NOT AN OFFER TO SELL THESE SECURITIES AND IT IS NOT A SOLICITATION OF AN OFFER TO BUY THESE SECURITIES IN ANY JURISDICTION WHERE THE OFFER OR SALE IS NOT PERMITTED. |
| | 86 | |
| Multifamily - Cooperative | Loan #7 | Cut-off Date Balance: | | $43,000,000 |
| 250 Mercer Street | Mercer Square Owners Corp. | Cut-off Date LTV: | | 12.6% |
| New York, NY 10012 | | UW NCF DSCR: | | 4.00x |
| | | UW NOI Debt Yield: | | 24.6% |
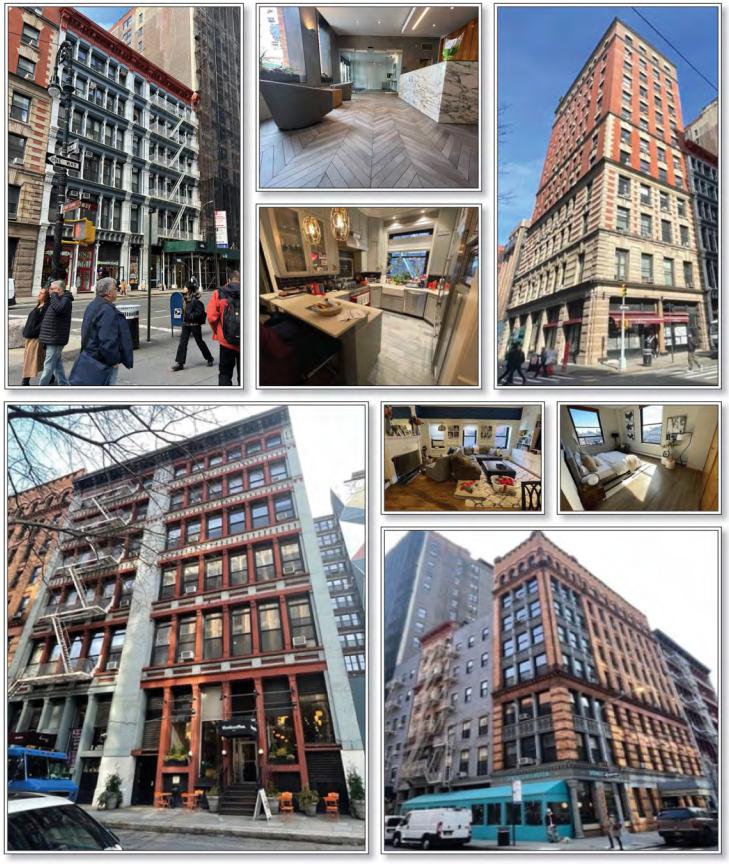
| THE INFORMATION IN THIS STRUCTURAL AND COLLATERAL TERM SHEET IS NOT COMPLETE AND MAY BE AMENDED PRIOR TO THE TIME OF SALE. THIS TERM SHEET IS NOT AN OFFER TO SELL THESE SECURITIES AND IT IS NOT A SOLICITATION OF AN OFFER TO BUY THESE SECURITIES IN ANY JURISDICTION WHERE THE OFFER OR SALE IS NOT PERMITTED. |
| | 87 | |
| Multifamily - Cooperative | Loan #7 | Cut-off Date Balance: | | $43,000,000 |
| 250 Mercer Street | Mercer Square Owners Corp. | Cut-off Date LTV: | | 12.6% |
| New York, NY 10012 | | UW NCF DSCR: | | 4.00x |
| | | UW NOI Debt Yield: | | 24.6% |
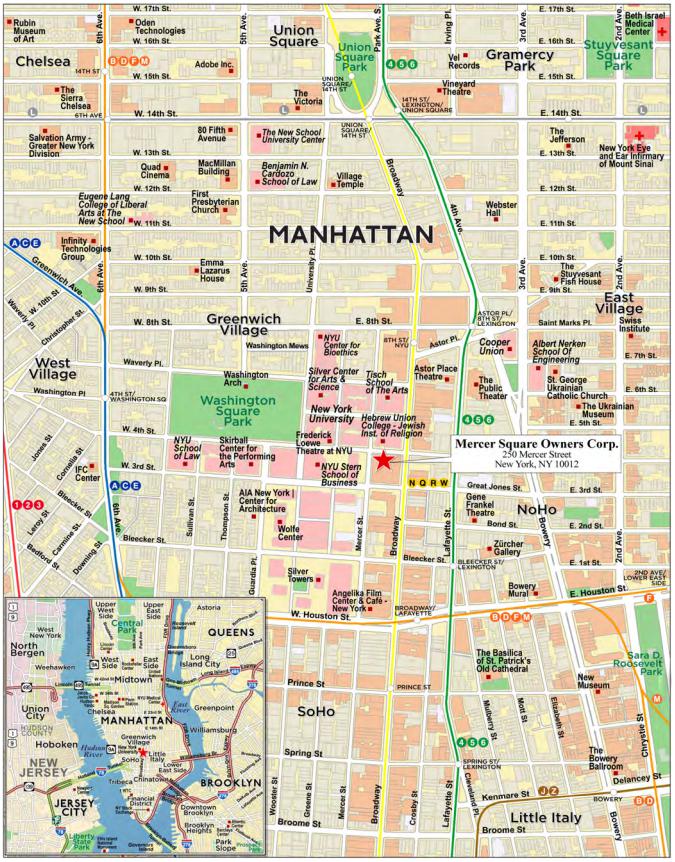
| THE INFORMATION IN THIS STRUCTURAL AND COLLATERAL TERM SHEET IS NOT COMPLETE AND MAY BE AMENDED PRIOR TO THE TIME OF SALE. THIS TERM SHEET IS NOT AN OFFER TO SELL THESE SECURITIES AND IT IS NOT A SOLICITATION OF AN OFFER TO BUY THESE SECURITIES IN ANY JURISDICTION WHERE THE OFFER OR SALE IS NOT PERMITTED. |
| | 88 | |
| No. 7 – Mercer Square Owners Corp. |
| |
| Mortgage Loan Information | | Mortgaged Property Information |
| Mortgage Loan Seller: | National Cooperative Bank, N.A. | | Single Asset/Portfolio: | Single Asset |
Credit Assessment (Fitch/KBRA/Moody’s): | AAAsf /AAA(sf)/Aaa(sf) | | Property Type – Subtype: | Multifamily – Cooperative |
| Original Principal Balance: | $43,000,000 | | Location: | New York, NY 10012 |
| Cut-off Date Balance: | $43,000,000 | | Size (5): | 258 Units |
| % of Initial Pool Balance: | 6.0% | | Cut-off Date Balance Unit: | $166,667 |
| Loan Purpose: | Refinance | | Maturity Date Balance Per Unit: | $166,667 |
| Borrower Sponsors (1): | NAP | | Year Built/Renovated: | 1887/1999 |
| Guarantors: | NAP | | Title Vesting: | Fee |
| Mortgage Rate: | 6.0300% | | Property Manager: | Residential Management |
| Note Date: | July 22, 2024 | | | Group, LLC d/b/a Douglas |
| Seasoning: | 0 months | | | Elliman Property |
| Maturity Date: | August 1, 2034 | | | Management |
| IO Period: | 120 months | | Current Occupancy (As of): | 95.0% (March 8, 2024) |
| Loan Term (Original): | 120 months | | YE 2023 Occupancy(6): | NAP |
| Amortization Term (Original): | 0 months | | YE 2022 Occupancy(6): | NAP |
| Loan Amortization Type: | Interest Only | | YE 2021 Occupancy(6): | NAP |
| Call Protection: | YM1(113),1%(3),O(4) | | As-Is Appraised Value(7): | $342,400,000 |
| Lockbox Type: | None | | As-Is Appraised Value Per Unit(7): | $1,327,132 |
| Additional Debt (2): | Revolving Line of Credit | | As-Is Appraisal Valuation Date: | March 8, 2024 |
| Additional Debt Type (Balance)(2): | $0 | | Coop-Rental Value(8): | $170,400,000 |
| Future Debt Permitted (Type)(3): | Yes (Secured) | | Coop-Rental Value Per Unit: | $660,465 |
| | | | Coop-Rental Valuation Date: | March 8, 2024 |
| | | | Underwriting and Financial Information |
| | | | TTM NOI(9): | NAP |
| | | | YE 2023 NOI(9): | NAP |
| | | YE 2022 NOI(9): | NAP |
| Escrows and Reserves(4) | | YE 2021 NOI(9): | NAP |
| | Initial | Monthly | Cap | | U/W Revenues(10): | $18,026,179 |
| Taxes | $827,250 | $275,750 | NAP | | U/W Expenses(10): | $7,438,270 |
| Insurance | $0 | Springing | NAP | | U/W NOI(10): | $10,587,909 |
| Capital Improvements Escrow | $3,000,000 | $0 | NAP | | U/W NCF(10): | $10,515,309 |
| Litigation Escrows | $656,250 | $0 | NAP | | U/W DSCR based on NOI/NCF(10): | 4.03x / 4.00x |
| Environmental Escrow | $47,500 | $0 | NAP | | U/W Debt Yield based on NOI/NCF(10): | 24.6% / 24.5% |
| | | | | | U/W Debt Yield at Maturity based on NOI/NCF(10): | 24.6% / 24.5% |
| | | | | | Cut-off Date LTV Ratio(7): | 12.6% |
| | | | | | LTV Ratio at Maturity(7): | 12.6% |
| | | | | | Coop-Rental Cut-off LTV Ratio(8): | 25.2% |
| | | | | | Coop-Rental LTV Ratio at Maturity(8): | 25.2% |
| | | | | | | | |
| Sources and Uses |
| Sources | | | | Uses | | |
| Mortgage Loan Amount | $43,000,000 | 100.0% | | Loan Payoff | $34,104,853 | 79.3 | % |
| | | | | Upfront Reserves | 4,531,000 | 10.5 | |
| | | | | Proceeds To Borrower | 4,016,633 | 9.3 | |
| | | | | Closing Costs | 347,514 | 0.8 | |
| | | | | | | |
| Total Sources | $43,000,000 | 100.0% | | Total Uses | $43,000,000 | 100.0 | % |
| (1) | See “The Borrower and Borrower Sponsor” section. |
| (2) | The Mercer Square Owners Corp. Property (as defined below) also secures a subordinate second lien mortgage loan to the borrower in the amount of up to $2,900,000 (the “Mercer Square Owners Corp. Subordinate Loan”) which permits advances from time to time. The outstanding balance of the Mercer Square Owners Corp. Subordinate Loan as of the Cut-Off Date is $0. National Cooperative Bank, N.A. is the holder of the Mercer Square Owners Corp. Subordinate Loan. With regard to the interest rate, term, payment terms and other statistical information relating to the Mercer Square Owners Corp. Subordinate Loan, see “Description of the Mortgage Pool—Additional Indebtedness—Other Secured Indebtedness—Additional Debt Financing For Mortgage Loans Secured by Residential Cooperatives” in the prospectus. All statistical information presented above relating to balances per unit, debt yields, debt service coverage ratios and loan-to-value ratios are based solely on the Mercer Square Owners Corp. Mortgage Loan (as defined below). |
| (3) | In addition to the Mercer Square Owners Corp. Subordinate Loan as described in footnote (2) above, National Cooperative Bank, N.A., the applicable master servicer of the Mercer Square Owners Corp. Mortgage Loan, will be permitted to waive the enforcement of the “due-on-encumbrance” clause in the related mortgage instrument to permit subordinate debt secured by the Mercer Square Owners Corp. Property, subject to the satisfaction of various conditions and subject to certain parameters set forth in the pooling and servicing agreement for the WFCM 2024-C63 securitization transaction. See “Description of the Mortgage Pool—Additional Indebtedness—Other Secured Indebtedness—Additional Debt Financing For Mortgage Loans Secured by Residential Cooperatives” in the prospectus. |
| THE INFORMATION IN THIS STRUCTURAL AND COLLATERAL TERM SHEET IS NOT COMPLETE AND MAY BE AMENDED PRIOR TO THE TIME OF SALE. THIS TERM SHEET IS NOT AN OFFER TO SELL THESE SECURITIES AND IT IS NOT A SOLICITATION OF AN OFFER TO BUY THESE SECURITIES IN ANY JURISDICTION WHERE THE OFFER OR SALE IS NOT PERMITTED. |
| | 89 | |
| Multifamily - Cooperative | Loan #7 | Cut-off Date Balance: | | $43,000,000 |
| 250 Mercer Street | Mercer Square Owners Corp. | Cut-off Date LTV: | | 12.6% |
| New York, NY 10012 | | UW NCF DSCR: | | 4.00x |
| | | UW NOI Debt Yield: | | 24.6% |
| (4) | See ”Escrows” section. |
| (5) | Based solely on residential units with shares and excludes a superintendent’s unit without shares, which is owned by the borrower. |
| (6) | YE 2021 Occupancy, YE 2022 Occupancy and YE 2023 Occupancy are not reported as all residential units are owned by tenant-shareholders or the cooperative sponsor. Current Occupancy reported as of March 8, 2024 reflects the assumption in the related appraisal for the purpose of determining the appraised value of the Mercer Square Owners Corp. Property as a multifamily rental (i.e, the Coop- Rental Value) as of the appraisal valuation date. |
| (7) | For purposes of determining the As-Is Appraised Value, the As-Is Appraised Value per Unit, the Cut-off Date LTV Ratio and the LTV Ratio at Maturity, the value estimate reflected in the appraisal of the Mercer Square Owners Corp. Property is determined as if such residential cooperative property is operated as a residential cooperative and, such value equals the sum of (i) the gross share value of all cooperative units in such residential cooperative property, based in part on various comparable sales of cooperative apartment units in the market, plus (ii) the amount of the underlying debt encumbering such residential cooperative property. See “Description of the Mortgage Pool-Certain Characteristics of Mortgage Loans Secured by Residential Cooperatives” in the prospectus. |
| (8) | The Coop-Rental Value, the Coop-Rental Cut-off LTV Ratio and Coop-Rental LTV Ratio at Maturity assumes the Mercer Square Owners Corp. Property is operated as a multifamily rental property. See “Risk Factors—Risks Relating to the Mortgage Loans—Residential Cooperative Properties Have Special Risks,” and “Description of the Mortgage Pool—Property Types—Multifamily Properties” in the prospectus. |
| (9) | TTM NOI, YE 2023 NOI, YE 2022 NOI, and YE 2021 NOI are not available. Residential cooperatives are not-for-profit entities that set maintenance fees to cover current expenses and plan for future capital needs. A residential cooperative can increase or decrease maintenance fees according to its anticipated expenses and level of cash reserves. The historical NOI figures are not representative of the cash flow generated by the Mercer Square Owners Corp. Property if it were operated as a multifamily rental property. |
| (10) | See “Underwritten Net Cash Flow” section below. |
The Mortgage Loan. The seventh largest mortgage loan (the “Mercer Square Owners Corp. Mortgage Loan”) is evidenced by a promissory note in the original principal amount of $43,000,000 and secured by a first priority fee interest in the residential condominium unit of a “cond-op” comprised of 258 residential units with appurtenant cooperative shares and proprietary leases in a project comprised of eight connected buildings located in the Greenwich Village neighborhood of Manhattan, New York (the “Mercer Square Owners Corp. Property”).
The Borrower and Borrower Sponsor. The borrower is Mercer Square Owners Corp., a cooperative housing corporation organized under the laws of the State of New York. No individual or entity (other than the borrower) has recourse obligations with respect to the Mercer Square Owners Corp. Mortgage Loan, including pursuant to any guaranty or environmental indemnity. At the time of the cooperative conversion, certain of the residential units were not purchased by eligible existing residents. Those unsold units, and their appurtenant cooperative shares and proprietary leases, were acquired by the cooperative sponsor, 250 Mercer Apartments, LLC, pursuant to the cooperative offering documents.
The Property. The Mercer Square Owners Corp. Property is the residential unit of a two unit “cond-op” known as Mercer Square Condominium. Mercer Square Condominium is comprised of a commercial unit (not loan collateral) and a residential unit, Mercer Square Owners Corp. Property (loan collateral). The “cond-op” as a whole is comprised of eight connected buildings split into four sections: an “A” wing, consisting of three six-story structures and an eight-story structure, a “B” wing consisting of a 16-story structure, a “C” wing consisting of two six-story structures, and a “D” wing consisting of a 12-story structure, each of which are located in the Greenwich Village neighborhood of Manhattan, New York. Constructed over a period of time from 1887-1951, the Mercer Square Owners Corp. Property contains 258 residential units with appurtenant cooperative shares and proprietary lease and consists of 215,830 SF of NRA. The Mercer Square Owners Corp. Property is 99.2% (256 units) shareholder-owned and 0.8% (2 units) sponsor owned (see “The Borrower and Borrower Sponsor” section). The residential condominium unit is a separate tax lot from the commercial condominium unit and has voting control over the material actions of the condominium.
The Mercer Square Owners Corp. Property features laundry rooms on the upper floors of the buildings, and basement bicycle and residential storage. There is also a lobby level package room.
The table below presents the residential apartment unit mix at the Mercer Square Owners Corp. Property.
| Unit Mix |
| Unit Type | Units(1) | SF | % of Total Units |
| Studio/Studio w/Loft | 118 | 729 | 45.7% |
| 1 Bedroom/1 Bedroom w/Loft | 112 | 803 | 43.4% |
| 2 Bedroom/2 Bedroom w/Loft | 18 | 1,157 | 7.0% |
| 3 Bedroom/3 Bedroom w/Loft | 8 | 1,575 | 3.1 % |
| 4 Bedroom | 2 | 2,900 | 0.8% |
| Total/Wtd. Avg. | 258 | 834 | 100.0% |
| (1) | Unit Mix/Unit Type are presented based on the Mortgage Loan Seller’s calculation (derived from its review of the cooperative maintenance schedule delivered at origination and the borrower’s cooperative offering plan) utilizing a weighted average per square foot based on the corresponding unit type. However, given the nature of loft-style residential cooperative units, and the variety of configurations that may be utilized by each resident shareholder, a truly precise determination of Unit Mix/Unit Type is not reasonably possible. |
| THE INFORMATION IN THIS STRUCTURAL AND COLLATERAL TERM SHEET IS NOT COMPLETE AND MAY BE AMENDED PRIOR TO THE TIME OF SALE. THIS TERM SHEET IS NOT AN OFFER TO SELL THESE SECURITIES AND IT IS NOT A SOLICITATION OF AN OFFER TO BUY THESE SECURITIES IN ANY JURISDICTION WHERE THE OFFER OR SALE IS NOT PERMITTED. |
| | 90 | |
| Multifamily - Cooperative | Loan #7 | Cut-off Date Balance: | | $43,000,000 |
| 250 Mercer Street | Mercer Square Owners Corp. | Cut-off Date LTV: | | 12.6% |
| New York, NY 10012 | | UW NCF DSCR: | | 4.00x |
| | | UW NOI Debt Yield: | | 24.6% |
Underwritten Net Cash Flow. The following table presents certain information relating to the underwritten net cash flow at the Mercer Square Owners Corp. Property:
Cash Flow Analysis
| Cash Flow Analysis(1) |
| | UW | UW Per Unit |
| Gross Potential Rent | $18,825,000 | $72,965 |
| Other Income(2) | 149,925 | 581 |
| Less Vacancy & Credit Loss(3) | (948,746) | (3,677) |
| Effective Gross Income | $18,026,179 | $69,869 |
| | | |
| Real Estate Taxes | $3,787,445 | $14,680 |
| Insurance | 290,000 | 1,124 |
| Other Expenses | 3,360,825 | 13,026 |
| Total Expenses | $7,438,270 | $28,831 |
| | | |
| Net Operating Income | $10,587,909 | $41,038 |
| Replacement Reserves | 72,600 | 281 |
| Net Cash Flow | $10,515,309 | $40,757 |
| | | |
| Occupancy %(3) | 95.0% | |
| NOI DSCR(4) | 4.03x | |
| NCF DSCR(4) | 4.00x | |
| NOI Debt Yield(4) | 24.6% | |
| NCF Debt Yield(4) | 24.5% | |
| (1) | Residential cooperatives are generally organized and operated as not-for-profit entities that set maintenance fees to cover current expenses and plan for future capital needs. The UW Net Operating Income and the UW Net Cash Flow for the Mercer Square Owners Corp. Property are the projected net operating income and the projected net cash flow, respectively, reflected in the appraisal. The projected net operating income, in general, equals projected effective gross income at the Mercer Square Owners Corp. Property assuming that it is operated as a multifamily rental property with rents and other income set at the prevailing market rates, reduced by underwritten property operating expenses and a market-rate vacancy assumption, in each case as determined by the appraiser. While such projected net operating income assumes the Mercer Square Owners Corp. Property is rented at market rates, all or a portion of the residential cooperative units at the Mercer Square Owners Corp. Property were rent restricted prior to the cooperative conversion and accordingly would again be subject to rent restrictions if the Mercer Square Owners Corp. Property were operated as a multifamily rental property. The projected net cash flow equals the projected net operating income reduced by the projected replacement reserves as determined by the appraiser. The projected rental income used in such determinations differs materially from the scheduled monthly maintenance payments from the tenant-shareholders at the Mercer Square Owners Corp. Property. See “Risk Factors—Risks Relating to the Mortgage Loans—Residential Cooperative Properties Have Special Risks” in the prospectus. |
| (2) | Other Income includes Laundry Income and Storage Income. |
| (3) | Occupancy % and Vacancy & Credit Loss reported reflect the vacancy assumption in the related appraisal for purposes of determining the appraised value of the Mercer Square Owners Corp. Property as a multifamily rental property, including commercial income and other income. |
| (4) | Debt service coverage ratios and debt yields are based on the Mercer Square Owners Corp. Mortgage Loan only and do not include any subordinate debt. |
| THE INFORMATION IN THIS STRUCTURAL AND COLLATERAL TERM SHEET IS NOT COMPLETE AND MAY BE AMENDED PRIOR TO THE TIME OF SALE. THIS TERM SHEET IS NOT AN OFFER TO SELL THESE SECURITIES AND IT IS NOT A SOLICITATION OF AN OFFER TO BUY THESE SECURITIES IN ANY JURISDICTION WHERE THE OFFER OR SALE IS NOT PERMITTED. |
| | 91 | |
| Multifamily - Cooperative | Loan #7 | Cut-off Date Balance: | | $43,000,000 |
| 250 Mercer Street | Mercer Square Owners Corp. | Cut-off Date LTV: | | 12.6% |
| New York, NY 10012 | | UW NCF DSCR: | | 4.00x |
| | | UW NOI Debt Yield: | | 24.6% |
Appraisal. The appraiser concluded to an “As-Is” Appraised Value for the Mercer Square Owners Corp. Property of $342,400,000 as of March 8, 2024 and a hypothetical, “As a Rental” Appraised Value of $170,400,000.
Environmental Matters. According to the Phase I environmental site assessment “ESA” dated March 25, 2024, there was a recognized environmental condition relating to an inactive but unclosed above ground storage tank “AST” at the Mercer Square Owners Corp. Property. The ESA consultant, Velocity Consulting, Inc., recommended that the tank be closed/removed, and stated in their escrow letter dated May 22, 2024, that the AST was a quantifiable environmental risk, but was not a significant environmental concern, as it does not present a health or safety risk. The ESA consultant recommended that an escrow be taken in the amount of $38,000, which would be sufficient to cover the estimated cost to remove the tank, as well as the estimated cost for the removal of sludge from the tank and the cleaning of the tank room, if necessary.
The borrower has informed NCB that the tank will be properly closed out and removed from the premises within 90 days of the note date. NCB escrowed $47,500 at loan closing (125% of the recommended cost of remediation), to be dispersed within 30 days after the earlier of full prepayment of the subject loan, or the borrower’s completion of the permanent closure of the inactive AST, including 1) the removal of all liquid and sludge from the tank, 2) rendering the tank free of petroleum vapors, 3) disconnecting, removing, or securely capping or plugging all fill and vent lines, 4) cutting open the tank, 5) stenciling the tank with the date of closure if the tank is closed in-place or removing the tank from the Mercer Square Owners Corp. Property. The New York State Department of Environmental Conservation must be notified by the tank owner/operator within 30 days prior to the permanent closure/removal of the tank.
Market Overview. The Mercer Square Owners Corp. Property is located in the Greenwich Village neighborhood of Manhattan, New York, which is in the Lower West Side Submarket. The Mercer Square Owners Corp. Property is located less than a quarter mile from the Broadway-Lafayette Street Station, which provides access to the “B”, “D”, “F”, and “M” subway lines, as well as the East 8th and Broadway subway station, which provides access to the “R” and “W” lines. Canal Street, Sixth Avenue, Broome Street, and West Houston Street contain a wide variety of merchants serving the neighborhood, including stores, restaurants, and retail services. National retailers can be found on Bowery and East Houston Street. The Mercer Square Owners Corp. Property is located less than two blocks from Washington Square Park and NYU, as well as less than a mile from Union Square. According to a third-party market research report, the Lower West Side submarket reported a 2.2% vacancy rate as of the second quarter of 2024.
The following table presents certain information relating to the multifamily rental properties comparable to the Mercer Square Owners Corp. Property:
Market Rent Summary(1)
| Property | Year Built(3) | Unit Type | Size (SF)(3) | Average Monthly Rent per Unit | Average Annual Rent Per SF |
| Mercer Square Owners Corp.(2) | 1887 | Studio | 729 | $4,361 | $5.98 |
| | | 1 BR | 803 | $5,953 | $7.41 |
| | | 2 BR | 1,157 | $8,167 | $7.06 |
| | | 3 BR | 1,575 | $19,688 | $12.50 |
| | | 4 BR | 2,900 | $31,600 | $10.90 |
| 1 Astor Place | 1909 | Studio | 788 | $3,785 | $4.81 |
| | | 1 BR | 600 | $4,750 | $7.92 |
| 2 Cooper Square | 2009 | Studio | 530 | $4,700 | $8.87 |
| | | 1 BR | 638 | $6,250 | $9.80 |
| | | 2 BR | 1,251 | $10,400 | $8.32 |
| 184 Thompson Street | 1910 | Studio | 548 | $3,567 | $6.51 |
| | | 1 BR | 657 | $5,400 | $8.22 |
| 95 Christopher Street | 1930 | 1 BR | 709 | $6,763 | $9.54 |
| | | 2 BR | 1,100 | $9,000 | $8.18 |
| 421 Hudson Street | 1920 | 1 BR | 970 | $6,000 | $6.19 |
| | | 2 BR | 1,614 | $11,475 | $7.11 |
| 300 Mercer Street | 1976 | 2 BR | NAV | $9,195 | NAV |
| 145 Sixth Avenue | 1910 | 3 BR | 2,900 | $16,500 | $5.69 |
| 640 Broadway | 1900 | 3 BR | 2,291 | $20,152 | $8.80 |
| 109 Greene Street | 1930 | 3 BR | 2,352 | $20,000 | $8.50 |
| (1) | The rents for the comparable properties are based on unit rents used by the appraiser in the income capitalization approach, prior to adjustments. Rents used for the Mercer Square Owners Corp. Property are based on the appraisal’s concluded market rents. |
| (2) | Unit Mix/Unit Type are presented based on the Mortgage Loan Seller’s calculation (derived from its review of the cooperative maintenance schedule delivered at origination and the borrower’s cooperative offering plan) utilizing a weighted average per square foot based on the corresponding unit type. However, given the nature of loft-style residential cooperative units, and the variety of configurations that may be utilized by each resident shareholder, a truly precise determination of Unit Mix/Unit Type is not reasonably possible. |
| (3) | Square Footage and Year Built for the comparable properties were sourced from various internet resources. |
| THE INFORMATION IN THIS STRUCTURAL AND COLLATERAL TERM SHEET IS NOT COMPLETE AND MAY BE AMENDED PRIOR TO THE TIME OF SALE. THIS TERM SHEET IS NOT AN OFFER TO SELL THESE SECURITIES AND IT IS NOT A SOLICITATION OF AN OFFER TO BUY THESE SECURITIES IN ANY JURISDICTION WHERE THE OFFER OR SALE IS NOT PERMITTED. |
| | 92 | |
| Multifamily - Cooperative | Loan #7 | Cut-off Date Balance: | | $43,000,000 |
| 250 Mercer Street | Mercer Square Owners Corp. | Cut-off Date LTV: | | 12.6% |
| New York, NY 10012 | | UW NCF DSCR: | | 4.00x |
| | | UW NOI Debt Yield: | | 24.6% |
Escrows.
Real Estate Taxes – The Mercer Square Owners Corp. Mortgage Loan documents require an upfront deposit of $827,250 and ongoing monthly real estate tax reserves in an amount equal to 1/12th of the real estate taxes that the lender estimates will be payable during the next 12 months, initially estimated at $275,750.
Capital Improvements Escrow – The Mercer Square Owners Corp. Mortgage Loan documents provide for a collateral security agreement for capital improvements (CSA), which established a collateral security account in the total amount of $3,000,000 at origination. Pursuant to the terms of the CSA, funds on account in the collateral security account are available for disbursement to the borrower in connection with the performance of façade and roof replacement, as well as any capital improvements warranted by the condition of the improvements, and as approved by the Lender.
Litigation Escrows – The Mercer Square Owners Corp. Mortgage Loan documents provide for two collateral security agreements as mitigants against two active litigation matters, in the aggregate amount of $656,250, comprised of $562,500 and $93,750, respectively. Pursuant to the terms of the two collateral security agreements, funds on account pursuant to those agreements are required to be disbursed to the borrower following the earlier of thirty-six months from the note date, or within ten business days after the borrower has obtained and delivered to the lender a stipulation of discontinuance of the respective litigations signed by the counsel for all parties, or a final non-appealable order of judgement finally determining the respective litigations. Once the funds are disbursed to the borrower, the borrower is required, if applicable and to the extent not otherwise covered by insurance or previously paid, to use the funds to satisfy any judgment or settlement amount resulting from the dismissal or other disposition of the matter.
Environmental Escrow – The Mercer Square Owners Corp. Mortgage Loan documents provide for a collateral security agreement for environmental concerns, which established a collateral security account in the total amount of $47,500 at origination as a mitigant against an open Recognized Environmental Condition. Pursuant to the terms of that collateral security agreement, funds on account pursuant to that agreement are available for disbursement upon the earlier of full prepayment of the subject loan, or the borrower’s completion of the permanent closure of the inactive AST, including 1) the removal of all liquid and sludge from the tank, 2) rendering the tank free of petroleum vapors, 3) disconnecting, removing, or securely capping or plugging all fill and vent lines, 4) cutting open the tank, 5) stenciling the tank with the date of closure if the tank is closed in-place, or removing the tank from the Mercer Street Owners Corp. Property. The NYSDEC must be notified by the tank/owner operator within 30 days prior to the permanent closure/removal of the tank.
Lockbox and Cash Management. Not Applicable.
Property Management. The Mercer Square Owners Corp. Property is managed by Residential Management Group, LLC d/b/a Douglas Elliman Property Management.
Partial Release. Not permitted.
Real Estate Substitution. Not permitted.
Subordinate and Mezzanine Indebtedness. The Mercer Square Owners Corp. Property is also secured by an NCB-held Revolving Line of Credit, with a maximum draw of $2,900,000. The line of credit is subordinate to the first mortgage in all aspects and is coterminous with the first mortgage. The balance of the line of credit at loan closing was $0. In addition, National Cooperative Bank, N.A., the applicable master servicer of the Mercer Square Owners Corp. Mortgage Loan, will be permitted to waiver the enforcement of the “due-on-encumbrance” clause in the related mortgage instrument to permit subordinate debt secured by the Mercer square Owners Corp. Property, subject to the satisfaction of various conditions and certain parameters set forth in the Series 2024-C63 Pooling and Servicing Agreement. See “Description of the Mortgage Pool—Additional Indebtedness—Other Secured Indebtedness—Additional Debt Financing For Mortgage Loans Secured by Residential Cooperatives” in the prospectus.
Ground Lease. None.
Terrorism Insurance. The Mercer Square Owners Corp. Mortgage Loan documents require an “all risk” insurance policy to be maintained by the borrower to provide coverage for terrorism in an amount equal to the full replacement cost of the Mercer Square Owners Corp. Property, as well as business income insurance covering no less than the 12-month period following the occurrence of a casualty event.
| THE INFORMATION IN THIS STRUCTURAL AND COLLATERAL TERM SHEET IS NOT COMPLETE AND MAY BE AMENDED PRIOR TO THE TIME OF SALE. THIS TERM SHEET IS NOT AN OFFER TO SELL THESE SECURITIES AND IT IS NOT A SOLICITATION OF AN OFFER TO BUY THESE SECURITIES IN ANY JURISDICTION WHERE THE OFFER OR SALE IS NOT PERMITTED. |
| | 93 | |
| Retail - Anchored | Loan #8 | Cut-off Date Balance: | | $40,000,000 |
| 680 Madison Avenue | 680 Madison Avenue | Cut-off Date LTV: | | 64.9% |
| New York, NY 10065 | | U/W NCF DSCR: | | 1.84x |
| | | U/W NOI Debt Yield: | | 12.6% |
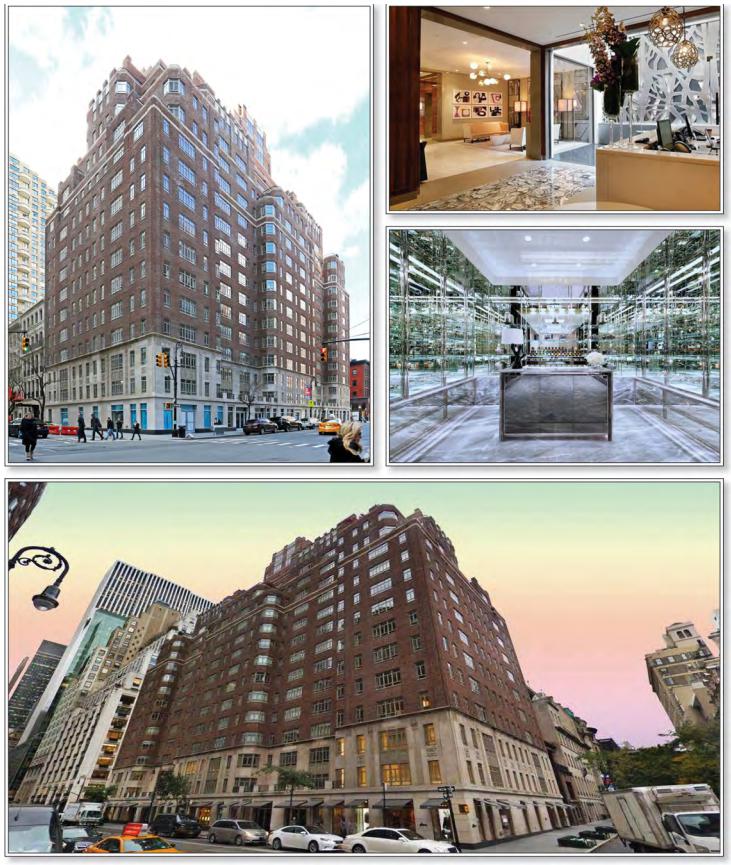
| THE INFORMATION IN THIS STRUCTURAL AND COLLATERAL TERM SHEET IS NOT COMPLETE AND MAY BE AMENDED PRIOR TO THE TIME OF SALE. THIS TERM SHEET IS NOT AN OFFER TO SELL THESE SECURITIES AND IT IS NOT A SOLICITATION OF AN OFFER TO BUY THESE SECURITIES IN ANY JURISDICTION WHERE THE OFFER OR SALE IS NOT PERMITTED. |
| | 94 | |
| Retail - Anchored | Loan #8 | Cut-off Date Balance: | | $40,000,000 |
| 680 Madison Avenue | 680 Madison Avenue | Cut-off Date LTV: | | 64.9% |
| New York, NY 10065 | | U/W NCF DSCR: | | 1.84x |
| | | U/W NOI Debt Yield: | | 12.6% |
| THE INFORMATION IN THIS STRUCTURAL AND COLLATERAL TERM SHEET IS NOT COMPLETE AND MAY BE AMENDED PRIOR TO THE TIME OF SALE. THIS TERM SHEET IS NOT AN OFFER TO SELL THESE SECURITIES AND IT IS NOT A SOLICITATION OF AN OFFER TO BUY THESE SECURITIES IN ANY JURISDICTION WHERE THE OFFER OR SALE IS NOT PERMITTED. |
| | 95 | |
| Retail - Anchored | Loan #8 | Cut-off Date Balance: | | $40,000,000 |
| 680 Madison Avenue | 680 Madison Avenue | Cut-off Date LTV: | | 64.9% |
| New York, NY 10065 | | U/W NCF DSCR: | | 1.84x |
| | | U/W NOI Debt Yield: | | 12.6% |

| THE INFORMATION IN THIS STRUCTURAL AND COLLATERAL TERM SHEET IS NOT COMPLETE AND MAY BE AMENDED PRIOR TO THE TIME OF SALE. THIS TERM SHEET IS NOT AN OFFER TO SELL THESE SECURITIES AND IT IS NOT A SOLICITATION OF AN OFFER TO BUY THESE SECURITIES IN ANY JURISDICTION WHERE THE OFFER OR SALE IS NOT PERMITTED. |
| | 96 | |
| No. 8 – 680 Madison Avenue |
| |
| Mortgage Loan Information | | Mortgaged Property Information |
| Mortgage Loan Seller: | Argentic Real Estate Finance 2 LLC | | Single Asset/Portfolio: | Single Asset |
Credit Assessment (Fitch/KBRA/Moody’s): | NR/NR/NR | | Property Type – Subtype: | Retail – Anchored |
| Original Principal Balance(1): | $40,000,000 | | Location: | New York, NY |
| Cut-off Date Balance(1): | $40,000,000 | | Size: | 34,298 SF |
| % of Initial Pool Balance: | 5.6% | | Cut-off Date Balance Per SF(1): | $3,498.75 |
| Loan Purpose: | Acquisition | | Maturity Date Balance Per SF(1): | $3,498.75 |
| Borrower Sponsor: | Steven Tananbaum | | Year Built/Renovated: | 1951/2014 |
| Guarantor: | Steven Tananbaum | | Title Vesting: | Leasehold |
| Mortgage Rate: | 6.7020% | | Property Manager: | G&E Real Estate Management Services, Inc. |
| Note Date: | May 21, 2024 | | Current Occupancy (As of): | 96.5% (5/1/2024) |
| Seasoning: | 2 months | | YE 2023 Occupancy(3): | NAV |
| Maturity Date: | June 6, 2034 | | YE 2022 Occupancy(3): | NAV |
| IO Period: | 120 months | | YE 2021 Occupancy(3): | NAV |
| Loan Term (Original): | 120 months | | YE 2020 Occupancy(3): | NAV |
| Amortization Term (Original): | 0 months | | As-Is Appraised Value: | $185,000,000 |
| Loan Amortization Type: | Interest Only | | As-Is Appraised Value Per SF: | $5,393.90 |
| Call Protection: | L(26),D(87),O(7) | | As-Is Appraisal Valuation Date: | April 23, 2024 |
| Lockbox Type: | Hard/Springing Cash Management | | Underwriting and Financial Information |
| Additional Debt(1): | Yes | | TTM (12/31/2023) NOI: | $13,771,281 |
| Additional Debt Type (Balance)(1): | Pari Passu ($80,000,000) | | YE 2022 NOI: | $14,319,292 |
| | | | YE 2021 NOI(3): | NAV |
| | | | YE 2020 NOI(3): | NAV |
| Escrows and Reserves(2) | | U/W Revenues: | $22,248,609 |
| | Initial | Monthly | Cap | | U/W Expenses: | $7,119,627 |
| Taxes: | $711,037 | $118,506 | NAP | | U/W NOI: | $15,128,981 |
| Insurance: | $18,068 | $9,034 | NAP | | U/W NCF: | $14,984,930 |
| Replacement Reserve: | $0 | $715 | NAP | | U/W DSCR based on NOI/NCF(1): | 1.86x / 1.84x |
| TI/LC Reserve: | $0 | $7,145 | NAP | | U/W Debt Yield based on NOI/NCF(1): | 12.6% / 12.5% |
| Ground Rent Reserve: | $371,250 | $371,250 | NAP | | U/W Debt Yield at Maturity based on NOI/NCF(1): | 12.6% / 12.5% |
| Outstanding TI Reserve: | $1,720,700 | $0 | NAP | | Cut-off Date LTV Ratio(1): | 64.9% |
| Free Rent Reserve: | $312,952 | $0 | NAP | | LTV Ratio at Maturity(1): | 64.9% |
| | | | | | | |
| | | | | | | | |
| Sources and Uses |
| Sources | | | | Uses | | |
| Original Whole Loan Amount | $120,000,000 | 65.3 | % | | Purchase Price | $177,651,354 | 96.7 | % |
| Sponsor Equity | 63,663,742 | 34.7 | | | Upfront Reserves | 3,134,008 | 1.7 | |
| | | | | Closing Costs | 2,878,380 | 1.6 | |
| Total Sources | $183,663,742 | 100.0 | % | | Total Uses | $183,663,742 | 100.0 | % |
| (1) | The 680 Madison Avenue Mortgage Loan (as defined below) is part of the 680 Madison Avenue Whole Loan (as defined below), which is evidenced by two pari passu promissory notes with an aggregate principal balance of $120,000,000. The Cut-off Date Balance Per SF, Maturity Date Balance Per SF, U/W Debt Yield based on NOI/NCF, U/W Debt Yield at Maturity based on NOI/NCF, U/W DSCR based on NOI/NCF, Cut-off Date LTV Ratio and LTV Ratio at Maturity numbers presented above are based on the aggregate principal balance of the promissory notes comprising the 680 Madison Avenue Whole Loan. |
| (2) | See “Escrows” section. |
| (3) | Historical occupancies and financials are not available for the noted period due to the recent acquisition of the 680 Madison Avenue Property (as defined below) by the borrower sponsor. |
The Mortgage Loan. The eighth largest mortgage loan (the “680 Madison Avenue Mortgage Loan”) is part of a whole loan (the “680 Madison Avenue Whole Loan”) evidenced by two pari passu promissory notes with an aggregate original principal balance of $120,000,000. The 680 Madison Avenue Mortgage Loan is evidenced by the non-controlling Note A-2, with an outstanding principal balance as of the Cut-off Date of $40,000,000. The 680 Madison Avenue Whole Loan was originated by Goldman Sachs Bank USA on May 21, 2024. Note A-2 was subsequently purchased by Argentic Real Estate Finance 2 LLC on June 28, 2024. The 680 Madison Avenue Whole Loan is secured by the borrower’s leasehold interest in the 34,298 square foot retail component (the “Retail Component”) of a mixed-use building that includes 68 non-collateral residential units (the “680 Madison Avenue Property”). Although the borrower also retains (and the 680 Madison Avenue Whole Loan is secured by) the leasehold interest in the residential component of the building (the “Residential Component”), the borrower subleases the Residential Component to 21 East 61st Street Apartment Corp., an unaffiliated third party (the “Residential Owner”). The Residential Owner has no obligation to pay rent to the borrower (and the borrower has no interest in the underlying revenues from the Residential Component), although the Residential Owner is responsible for a portion of certain expenses, including property taxes, as described under “Ground Lease” below. The 680 Madison Avenue Whole Loan has a 10-year term, is interest-only for the full term of the loan and accrues interest at a rate of 6.7020% per annum on an Actual/360 basis.
| THE INFORMATION IN THIS STRUCTURAL AND COLLATERAL TERM SHEET IS NOT COMPLETE AND MAY BE AMENDED PRIOR TO THE TIME OF SALE. THIS TERM SHEET IS NOT AN OFFER TO SELL THESE SECURITIES AND IT IS NOT A SOLICITATION OF AN OFFER TO BUY THESE SECURITIES IN ANY JURISDICTION WHERE THE OFFER OR SALE IS NOT PERMITTED. |
| | 97 | |
| Retail - Anchored | Loan #8 | Cut-off Date Balance: | | $40,000,000 |
| 680 Madison Avenue | 680 Madison Avenue | Cut-off Date LTV: | | 64.9% |
| New York, NY 10065 | | U/W NCF DSCR: | | 1.84x |
| | | U/W NOI Debt Yield: | | 12.6% |
The table below identifies the promissory notes that comprise the 680 Madison Avenue Whole Loan. The 680 Madison Avenue Whole Loan is serviced pursuant to the pooling and servicing agreement for the BMO 2024-C9 trust securitization. The relationship between the holders of the 680 Madison Avenue Whole Loan is governed by a co-lender agreement as described under “Description of the Mortgage Pool—The Whole Loans—The Non-Serviced Pari Passu Whole Loans” and “Pooling and Servicing Agreement—Servicing of the Non-Serviced Mortgage Loans” in the Preliminary Prospectus.
| 680 Madison Avenue Whole Loan Summary |
| Note | Original Balance | Cut-off Date Balance | Note Holder | Controlling Note |
| A-1 | $80,000,000 | $80,000,000 | | BMO 2024-C9 | Yes |
| A-2 | $40,000,000 | $40,000,000 | | WFCM 2024-C63 | No |
| Total | $120,000,000 | $120,000,000 | | | |
The Borrower and Borrower Sponsor. The borrower is TZ 680 Madison Owner LLC, a Delaware limited liability company structured to be bankruptcy-remote with two independent directors. Legal counsel to the borrower provided a non-consolidation opinion in connection with the origination of the 680 Madison Avenue Whole Loan. The borrower sponsor and non-recourse carveout guarantor is Steven Tananbaum. Steven Tananbaum is the founder and chief investment officer of GoldenTree Asset Management. GoldenTree Asset Management was founded in 2000 and manages approximately $55 billion for institutional investors.
The Property. The 680 Madison Avenue Property was built in 1951 and later renovated in 2014. The 680 Madison Avenue Whole Loan is secured by the borrower’s leasehold interest in a 34,298 SF Retail Component at the base of The Carlton House in New York City’s Upper East Side neighborhood. Spanning the entire western block front between East 61st and East 62nd Street, the 680 Madison Avenue Property is anchored by luxury tenants, such as Tom Ford and Brioni on long term leases in a prime retail corridor. In 2023, Oscar De La Renta signed a new lease for 7,697 SF at a base rent of $455 PSF, bringing the 680 Madison Avenue Property to 96.5% occupancy.
The 680 Madison Avenue Property is subject to a ground lease between 680 Special, L.L.C., as ground lessor, and TZ 680 Madison Owner LLC, as ground lessee, which commenced in April 1967 and expires in June 2169. The current base rent is approximately $4.46 million per year with approximately 10% increases every 5 years. The next increase is in July 2029 to approximately $4.90 million annually. Most of the retail leases at the 680 Madison Avenue Property have 3.0% contractual rent increases, which outpaces the 2.0% average ground rent annual increases for the 680 Madison Avenue Property. See “Ground Lease” below.
Major Tenants.
Largest Tenant by UW Base Rent: Tom Ford (13,194 square feet, 38.5% of net rentable area (“NRA”), 39.0% of underwritten base rent): Tom Ford is a luxury brand created in 2005, encompassing fashion, fragrance, eyewear and other accessories. Tom Ford was acquired by Estee Lauder in 2023. Tom Ford occupies 13,194 square feet on a lease that expires June 30, 2032 with one, five-year renewal option and no termination options. Tom Ford currently pays $587.25 per SF with annual rent increases.
2nd Largest Tenant by UW Base Rent: Brioni (6,469 square feet, 18.9% of NRA, 19.8% of underwritten base rent): Brioni was founded in Rome in 1945 by Nazareno Fonticoli. Today, Brioni is a menswear luxury brand. Brioni currently occupies 6,469 square feet on a lease that expires January 31, 2032 with no renewal options and no termination options. Brioni currently pays $608.10 per SF with annual rent increases.
3rd Largest Tenant by UW Base Rent: Oscar De La Renta (7,697 square feet, 22.4% of NRA, 17.6% of underwritten base rent): Oscar De La Renta is a luxury goods firm. The New York-based company was established in 1965, and encompasses a full line of women's accessories, bridal, fragrance and home goods, in addition to its women's ready-to-wear collection. Oscar De La Renta occupies 7,697 square feet on a lease that expires May 31, 2034 with one, ten-year renewal option and no termination options. Oscar De La Renta currently pays $454.72 per SF with annual rent increases.
| THE INFORMATION IN THIS STRUCTURAL AND COLLATERAL TERM SHEET IS NOT COMPLETE AND MAY BE AMENDED PRIOR TO THE TIME OF SALE. THIS TERM SHEET IS NOT AN OFFER TO SELL THESE SECURITIES AND IT IS NOT A SOLICITATION OF AN OFFER TO BUY THESE SECURITIES IN ANY JURISDICTION WHERE THE OFFER OR SALE IS NOT PERMITTED. |
| | 98 | |
| Retail - Anchored | Loan #8 | Cut-off Date Balance: | | $40,000,000 |
| 680 Madison Avenue | 680 Madison Avenue | Cut-off Date LTV: | | 64.9% |
| New York, NY 10065 | | U/W NCF DSCR: | | 1.84x |
| | | U/W NOI Debt Yield: | | 12.6% |
The following table presents certain information relating to the tenancy at the 680 Madison Avenue Property:
Major Tenants(1)
| Tenant Name | Credit Rating (Fitch/ Moody’s/
S&P)(2) | Tenant NRSF | % of
NRSF | Annual U/W Base Rent PSF | Annual
U/W Base Rent | % of Total Annual U/W Base Rent | Lease
Expiration
Date | Ext. Options | Term. Option (Y/N) |
| Major Tenants | | | | | | | | |
| Tom Ford | NR/A1/A | 13,194 | 38.5% | $587.25 | $7,748,205 | 39.0% | 6/30/2032 | 1, 5-year | N |
| Brioni | NR/NR/A- | 6,469 | 18.9% | $608.10 | $3,933,817 | 19.8% | 1/31/2032 | N | N |
| Oscar De La Renta | NR/NR/NR | 7,697 | 22.4% | $454.72 | $3,500,000 | 17.6% | 5/31/2034 | 1, 10-year | N |
| Missoni(3) | NR/NR/NR | 3,544 | 10.3% | $846.50 | $3,000,000 | 15.1% | 9/30/2034 | N | N |
| Morgenthal Frederics | NR/NR/NR | 582 | 1.7% | $1,486.60 | $865,200 | 4.4% | 6/30/2030 | N | N |
| Asprey | NR/NR/NR | 1,622 | 4.7% | $490.55 | $795,675 | 4.0% | 11/30/2032 | N | N |
| | 33,108 | 96.5% | $599.34 | $19,842,898 | 100.0% | | | |
| | | | | | | | | |
| Non-Major Tenants | 0 | 0.0% | $0.00 | $0 | 0.0% | | | |
| | | | | | | | | |
| Occupied Collateral Total | 33,108 | 96.5% | $599.34 | $19,842,898 | 100.0% | | | |
| | | | | | | | | |
| Vacant Space | 1,190 | 3.5% | | | | | | |
| | | | | | | | | |
| Collateral Total | 34,298 | 100.0% | | | | | | |
| | | | | | | | | | |
| (1) | Based on the underwritten rent roll dated May 1, 2024 with rent steps through February 2025. |
| (2) | Ratings are those of the parent company, whether or not the parent guarantees the lease. |
| (3) | Missoni has a one-time right to terminate its lease if gross sales for the period October 1, 2023 through September 30, 2024 are less than $6,000,000 with at least 365 days’ notice and payment of a $1.0 million termination fee. |
The following table presents certain information relating to the lease rollover schedule at the 680 Madison Avenue Property:
Lease Expiration Schedule(1)
Year Ending
December 31, | No. of Leases Expiring | Expiring NRSF | % of Total NRSF | Cumulative Expiring NRSF | Cumulative % of Total NRSF | Annual
U/W
Base Rent(2) | % of Total Annual U/W Base Rent | Annual
U/W
Base Rent
PSF(2) |
| MTM | 0 | 0 | 0.0% | 0 | 0.0% | $0 | 0.0% | $0.00 |
| 2024 | 0 | 0 | 0.0% | 0 | 0.0% | $0 | 0.0% | $0.00 |
| 2025 | 0 | 0 | 0.0% | 0 | 0.0% | $0 | 0.0% | $0.00 |
| 2026 | 0 | 0 | 0.0% | 0 | 0.0% | $0 | 0.0% | $0.00 |
| 2027 | 0 | 0 | 0.0% | 0 | 0.0% | $0 | 0.0% | $0.00 |
| 2028 | 0 | 0 | 0.0% | 0 | 0.0% | $0 | 0.0% | $0.00 |
| 2029 | 0 | 0 | 0.0% | 0 | 0.0% | $0 | 0.0% | $0.00 |
| 2030 | 1 | 582 | 1.7% | 582 | 1.7% | $865,200 | 4.4% | $1,486.60 |
| 2031 | 0 | 0 | 0.0% | 582 | 1.7% | $0 | 0.0% | $0.00 |
| 2032 | 3 | 21,285 | 62.1% | 21,867 | 63.8% | $12,477,698 | 62.9% | $586.22 |
| 2033 | 0 | 0 | 0.0% | 21,867 | 63.8% | $0 | 0.0% | $0.00 |
| 2034 | 2 | 11241 | 32.8% | 33,108 | 96.5% | $6,500,000 | 32.8% | $578.24 |
| Thereafter | 0 | 0 | 0.0% | 33,108 | 96.5% | $0 | 0.0% | $0.00 |
| Vacant | 0 | 1,190 | 3.5% | 34,298 | 100.0% | $0 | 0.0% | $0.00 |
| Total/Weighted Average | 6 | 34,298 | 100.0% | | | $19,842,898 | 100.0% | $599.34 |
| (1) | Information obtained from the underwritten rent roll dated May 1, 2024 with rent steps through February 2025. |
| (2) | Annual U/W Base Rent and Annual U/W Base Rent PSF does not include vacant space. |
| THE INFORMATION IN THIS STRUCTURAL AND COLLATERAL TERM SHEET IS NOT COMPLETE AND MAY BE AMENDED PRIOR TO THE TIME OF SALE. THIS TERM SHEET IS NOT AN OFFER TO SELL THESE SECURITIES AND IT IS NOT A SOLICITATION OF AN OFFER TO BUY THESE SECURITIES IN ANY JURISDICTION WHERE THE OFFER OR SALE IS NOT PERMITTED. |
| | 99 | |
| Retail - Anchored | Loan #8 | Cut-off Date Balance: | | $40,000,000 |
| 680 Madison Avenue | 680 Madison Avenue | Cut-off Date LTV: | | 64.9% |
| New York, NY 10065 | | U/W NCF DSCR: | | 1.84x |
| | | U/W NOI Debt Yield: | | 12.6% |
The following table presents historical occupancy percentages at the 680 Madison Avenue Property:
Historical Occupancy(1)
| (1) | Historical Occupancies are not available due to the recent acquisition of the 680 Madison Avenue Property by the borrower sponsor. |
| (2) | Information obtained from the underwritten rent roll dated May 1, 2024. |
Operating History and Underwritten Net Cash Flow. The following table presents certain information relating to the historical operating performance and underwritten net cash flow at the 680 Madison Avenue Property:
Cash Flow Analysis
| | 2022 | 2023 | U/W(1) | %(2) | U/W $ per
SF(1) |
| Base Rent | $14,086,711 | $15,670,694 | $19,842,898 | 84.7% | $578.54 |
| Credit Tenant Rent Steps | 0 | 0 | 326,705 | 1.4 | 9.53 |
| Overage / Percentage Rent | 291,187 | 120,334 | 0 | 0.0 | 0.00 |
| Commercial Reimbursement Revenue | 2,350,131 | 2,518,345 | 3,152,801 | 13.5 | 91.92 |
| Other Revenue | 3,330,779 | 1,262,350 | 97,184 | 0.4 | 2.83 |
| Gross Potential Rent | $20,058,808 | $19,571,723 | $23,419,588 | 100.0% | $682.83 |
| (Vacancy & Credit Loss) | 0 | 0 | (1,170,979) | (5.0) | (34.14) |
| Effective Gross Income | $20,058,808 | $19,571,723 | $22,248,609 | 95.0% | $648.69 |
| | | | | | |
| Real Estate Taxes | 1,261,527 | 1,276,524 | 1,422,074 | 6.4 | 41.46 |
| Insurance | 139,082 | 199,511 | 108,409 | 0.5 | 3.16 |
| Management Fee | 49,992 | 49,992 | 667,458 | 3.0 | 19.46 |
| Ground Rent | 4,050,000 | 4,050,000 | 4,663,817 | 21.0 | 135.98 |
| Other Expenses | 238,915 | 224,416 | 257,868 | 1.2 | 7.52 |
| Total Operating Expenses | $5,739,516 | $5,800,442 | $7,119,627 | 32.0% | $207.58 |
| | | | | | |
| Net Operating Income | $14,319,292 | $13,771,281 | $15,128,981 | 68.0% | $441.10 |
| Replacement Reserves | 0 | 0 | 6,860 | 0.0 | 0.20 |
| TI/LC | 0 | 0 | 137,192 | 0.6 | 4.00 |
| Net Cash Flow | $14,319,292 | $13,771,281 | $14,984,930 | 67.4% | $436.90 |
| | | | | | |
| NOI DSCR(3) | 1.76x | 1.69x | 1.86x | | |
| NCF DSCR(3) | 1.76x | 1.69x | 1.84x | | |
| NOI Debt Yield(3) | 11.9% | 11.5% | 12.6% | | |
| NCF Debt Yield(3) | 11.9% | 11.5% | 12.5% | | |
| (1) | U/W Base Rent PSF and U/W Base Rent include contractual rent steps through February 2025 totaling $588,628. |
| (2) | Represents percent of Gross Potential Rent for all revenue fields and percent of Effective Gross Income for all other fields. |
| | (3) | Figures are based on the 680 Madison Avenue Whole Loan debt service and original principal balance. |
Appraisal. The appraiser concluded to an “as-is” Appraised Value for the 680 Madison Avenue Property of $185,000,000 as of April 23, 2024.
Environmental Matters. According to the Phase I environmental site assessment dated April 29, 2024, there was no evidence of any recognized environmental conditions at the 680 Madison Avenue Property.
| THE INFORMATION IN THIS STRUCTURAL AND COLLATERAL TERM SHEET IS NOT COMPLETE AND MAY BE AMENDED PRIOR TO THE TIME OF SALE. THIS TERM SHEET IS NOT AN OFFER TO SELL THESE SECURITIES AND IT IS NOT A SOLICITATION OF AN OFFER TO BUY THESE SECURITIES IN ANY JURISDICTION WHERE THE OFFER OR SALE IS NOT PERMITTED. |
| | 100 | |
| Retail - Anchored | Loan #8 | Cut-off Date Balance: | | $40,000,000 |
| 680 Madison Avenue | 680 Madison Avenue | Cut-off Date LTV: | | 64.9% |
| New York, NY 10065 | | U/W NCF DSCR: | | 1.84x |
| | | U/W NOI Debt Yield: | | 12.6% |
Market Overview and Competition. The 680 Madison Avenue Property is located within the Madison Avenue retail submarket in Manhattan. A third-party brokerage company generally defines the Madison Avenue retail corridor as Madison Avenue from East 57th Street to East 72nd Street. This stretch of Madison Avenue is home to many luxury brands, jewelers, and couture fashion retailers. The corridor is also popular with European retailers seeking to locate in a well-established retail hub in Manhattan.
The following table presents retail market availability statistics for the surrounding area of the 680 Madison Avenue Property:
Manhattan Retail Submarket Availability Rate Statistics Madison Avenue East 57th Street to East 72nd Street(1) |
| Market/Submarket | Q4 2023 | Q1 2024 | % Point Change |
| Direct Availability Rate | 15.8% | 10.5% | (5.3%) |
| Total Availability Rate | 16.4% | 12.3% | (4.1%) |
| Sublease Availability Rate | 1.2% | 1.8% | 0.6% |
| (1) | Source: Third party market research report. |
The following table presents certain information relating to the appraiser’s market rent conclusions for the 680 Madison Avenue Property:
Market Rent Summary(1)
| Tenant Space | Market Rent PSF | Lease Term (Years) | Reimbursement Method | Rent Increase Projection | TI Allowance PSF (New / Renewal) | Leasing Commissions (New / Renewal) |
| Oscar De La Renta | $527 | 10 | Modified Gross | 3% per annum | $500 / $250 | 4.0% / 2.0% |
| Asprey | $561 | 10 | Modified Gross | 3% per annum | $500 / $250 | 4.0% / 2.0% |
| Morgenthal Frederics | $1,100 | 10 | Modified Gross | 3% per annum | $500 / $250 | 4.0% / 2.0% |
| Brioni | $730 | 10 | Modified Gross | 3% per annum | $500 / $250 | 4.0% / 2.0% |
| Missoni | $800 | 10 | Modified Gross | 3% per annum | $500 / $250 | 4.0% / 2.0% |
| Tom Ford | $465 | 10 | Modified Gross | 3% per annum | $500 / $250 | 4.0% / 2.0% |
| (1) | Information obtained from the appraisal. |
The table below presents certain information relating to comparable sales pertaining to the 680 Madison Avenue Property identified by the appraiser:
Comparable Retail Sales(1)
| Property Name | Year Built/Renovated | Rentable Area (SF) | Sale Date | Sale Price | Sale Price (PSF) | OAR |
717 Fifth Avenue Upper Fifth Avenue, Manhattan | 1958/1993 | 115,104 | Jan-24 | $967,438,642 | $8,405 | NAV |
144 Fulton Street Downtown Manhattan | 1909/2016 | 11,069 | Oct-23 | $38,000,000 | $3,433 | 5.31% |
155 Mercer Street SoHo, Manhattan | 1920/2018 | 14,589 | Mar-23 | $60,000,000 | $4,113 | NAV |
102 Greene Street SoHo, Manhattan | 1881/2019 | 9,339 | Oct-22 | $31,500,000 | $3,373 | NAV |
12 West 48th Street Plaza, Manhattan | 2019/NAP | 28,559 | Apr-22 | $49,500,000 | $1,733 | 4.20% |
1600 Broadway Times Square, Manhattan | 2005/NAP | 25,693 | Feb-22 | $191,500,000 | $7,453 | 4.38% |
530 Fifth Avenue Grand Central, Manhattan | 1956/NAP | 58,989 | Aug-21 | $192,000,000 | $3,255 | 5.10% |
609 Fifth Avenue Plaza District, Manhattan | 1925/1991 | 26,811 | May-20 | $164,961,209 | $6,153 | 5.51% |
| (1) | Information obtained from the appraisal. |
| THE INFORMATION IN THIS STRUCTURAL AND COLLATERAL TERM SHEET IS NOT COMPLETE AND MAY BE AMENDED PRIOR TO THE TIME OF SALE. THIS TERM SHEET IS NOT AN OFFER TO SELL THESE SECURITIES AND IT IS NOT A SOLICITATION OF AN OFFER TO BUY THESE SECURITIES IN ANY JURISDICTION WHERE THE OFFER OR SALE IS NOT PERMITTED. |
| | 101 | |
| Retail - Anchored | Loan #8 | Cut-off Date Balance: | | $40,000,000 |
| 680 Madison Avenue | 680 Madison Avenue | Cut-off Date LTV: | | 64.9% |
| New York, NY 10065 | | U/W NCF DSCR: | | 1.84x |
| | | U/W NOI Debt Yield: | | 12.6% |
The following table presents certain information relating to the appraiser’s market rent conclusions for the 680 Madison Avenue Property:
Comparable Retail Leases(1)
| Property Name/Location | Tenant | Tenant Size (SF) | Lease Start Date | Lease Term (Years) | Annual Base Rent PSF | Lease Type |
680 Madison Avenue (Subject) 680 Madison Avenue New York, NY | Tom Ford | 13,194(2) | Sep-16(2) | 15.8(2) | $587(2)(3) | Modified Gross |
796 Madison Avenue New York, NY | Parfumes de Marley | 500 | Apr-24 | 10 | $960 | Modified Gross |
729 Madison Avenue New York, NY | Gianvito Rossi | 1,828 | Mar-24 | 10 | $460 | Modified Gross |
727 Madison Avenue New York, NY | Messika | 1,254 | Mar-24 | 10 | $574 | Modified Gross |
610 Madison Avenue New York, NY | Herno | 3,065 | Jan-24 | 10 | $489 | Modified Gross |
691 Madison Avenue New York, NY | Dolce & Gabbana | 23,339 | Oct-23 | 10 | $514 | Modified Gross |
700 Madison Avenue New York, NY | Hermes x John Lobb | 9,103 | Mar-23 | 10 | $275 | Modified Gross |
690 Madison Avenue New York, NY | Van Cleef | 7,944 | Dec-22 | 10 | $455 | Modified Gross |
645 Madison Avenue New York, NY | Richemont | 8,721 | Dec-22 | 10 | $596 | Modified Gross |
667 Madison Avenue New York, NY | Michael Kors | 10,613 | Sep-22 | 10 | $426 | Modified Gross |
701-709 Madison Avenue New York, NY | Richemont | 5,779 | Sep-22 | 10 | $578 | Modified Gross |
696 Madison Avenue New York, NY | Swarovski | 14,000 | Jun-22 | 10 | $500 | Modified Gross |
| (1) | Information obtained from the appraisal. |
| (2) | Information based on the underwritten rent roll dated May 1, 2024. |
| (3) | Includes tenant’s rent step in July 2024. |
Escrows.
Real Estate Taxes – The 680 Madison Avenue Whole Loan documents require an upfront deposit of $711,037. On a monthly basis, the borrower is required to deposit into a property tax reserve an amount equal to 1/12th of the property taxes for the Retail Component that the lender reasonably estimates will be payable during the next ensuing 12 months (with the Residential Owner responsible under Residential Master Lease (as defined below) for any property taxes attributable to the Residential Component), initially estimated to be approximately $118,506. During a 680 Madison Avenue Tax Trigger Event (as defined below), the borrower is required to deposit an amount sufficient to cover the total property tax amount due for the 680 Madison Avenue Property, which includes the Residential Owner’s pro rata share.
Insurance – The 680 Madison Avenue Whole Loan documents require an upfront deposit of $18,068. On a monthly basis, the borrower is required to deposit into an insurance reserve an amount equal to 1/12th of the insurance premiums that the lender reasonably estimates will be payable during the next ensuing 12 months initially estimated to be approximately $9,034.
Replacement Reserve – The 680 Madison Avenue Whole Loan documents require an ongoing monthly replacement reserve deposit of approximately $715.
TI/LC Reserve – The 680 Madison Avenue Whole Loan documents require an ongoing monthly TI/LC reserve deposit of approximately $7,145.
Unfunded TI Obligations Reserve – The 680 Madison Avenue Whole Loan documents require an upfront deposit of $1,720,700 for outstanding tenant improvement expenses.
| THE INFORMATION IN THIS STRUCTURAL AND COLLATERAL TERM SHEET IS NOT COMPLETE AND MAY BE AMENDED PRIOR TO THE TIME OF SALE. THIS TERM SHEET IS NOT AN OFFER TO SELL THESE SECURITIES AND IT IS NOT A SOLICITATION OF AN OFFER TO BUY THESE SECURITIES IN ANY JURISDICTION WHERE THE OFFER OR SALE IS NOT PERMITTED. |
| | 102 | |
| Retail - Anchored | Loan #8 | Cut-off Date Balance: | | $40,000,000 |
| 680 Madison Avenue | 680 Madison Avenue | Cut-off Date LTV: | | 64.9% |
| New York, NY 10065 | | U/W NCF DSCR: | | 1.84x |
| | | U/W NOI Debt Yield: | | 12.6% |
Free Rent Reserve – The 680 Madison Avenue Whole Loan documents require an upfront deposit of $312,952. The borrower may, at its option, from time to time, remit to the lender for deposit into the unfunded obligations account the amount of any free rent and unpaid tenant improvement and leasing commission costs under any applicable leases for the purpose of concluding a 680 Madison Avenue Major Tenant Event Trigger Period (as defined below).
Ground Rent Reserve – The 680 Madison Avenue Whole Loan documents require an upfront deposit of $371,250. On a monthly basis, the borrower is required to deposit into the ground rent reserve an amount equal to 1/12th of the ground rent that the lender reasonably estimates will be payable during the next ensuing 12 months, initially estimated to be $371,250.
Missoni Reserve – During the continuance of a 680 Madison Avenue Missoni Trigger Period (as defined below) (provided no other 680 Madison Avenue Trigger Period is then continuing), any excess cash flow is required to be deposited into a Missoni reserve account for leasing commissions and tenant improvement costs incurred by the borrower in connection with a new lease (or lease extension) entered into solely with respect to the space currently occupied by Missoni until the aggregate amount deposited therein (excluding any amounts attributable to termination proceeds) equals $1,500,000.
A “680 Madison Avenue Trigger Period” means:
| (i) | a 680 Madison Avenue Major Tenant Event Trigger Period is then in effect, |
| (ii) | a 680 Madison Avenue Missoni Trigger Period is then in effect, and/or |
| (iii) | a 680 Madison Avenue Debt Yield Trigger Period (as defined below) is then in effect. |
A “680 Madison Avenue Major Tenant Event Trigger Period” means each period that commences upon the occurrence of a 680 Madison Avenue Major Tenant Event (as defined below) and concludes when the applicable 680 Madison Avenue Major Tenant (as defined below) space (or substantially all of such space) subject to such 680 Madison Avenue Major Tenant Event has been re-tenanted pursuant to one or more leases that have been entered into in accordance with the 680 Madison Avenue Whole Loan documents and for which all remaining free rent and unpaid costs of tenant improvements and leasing commissions in connection therewith have been deposited into the unfunded obligations reserve in accordance with the 680 Madison Avenue Whole Loan documents, or when the applicable 680 Madison Avenue Major Tenant Event has ceased to exist (provided that no other 680 Madison Avenue Major Tenant Event is then continuing), or, in the case of a 680 Madison Avenue Major Tenant Event arising under clause (iv) of the definition of 680 Madison Avenue Major Tenant Event such 680 Madison Avenue Major Tenant renews its lease.
A “680 Madison Avenue Missoni Trigger Period” means the period that commences upon the exercise by Missoni of its termination option and concludes when the amount of funds on deposit in the Missoni reserve account equal $1,500,000.
A “680 Madison Avenue Debt Yield Trigger Period” means each period that commences when the debt yield (as calculated under the 680 Madison Avenue Whole Loan documents), determined as of the first day of any fiscal quarter, is less than 11.0% and concludes when the debt yield, determined as of the first day of any fiscal quarter thereafter, is equal to or greater than 11.0% (and if the financial reports required under the 680 Madison Avenue Whole Loan documents are not delivered to the lender as and when required, a 680 Madison Avenue Trigger Period will be deemed to have commenced and be ongoing, unless and until such reports are delivered and they indicate that, in fact, no 680 Madison Avenue Trigger Period is ongoing). Notwithstanding the foregoing, provided no event of default is continuing, the borrower may avoid the commencement or terminate the continuance of a 680 Madison Avenue Debt Yield Trigger Period by delivering to the lender, as additional collateral, a letter of credit in an amount that when subtracted from the then-outstanding principal balance of the 680 Madison Avenue Whole Loan for purposes of calculating the debt yield would result in a debt yield that equals or exceeds 11.0%.
A “680 Madison Avenue Major Tenant” means Tom Ford, Brioni and any successor tenant to either of the foregoing.
A “680 Madison Avenue Major Tenant Event” means the occurrence of any one or more of the following with respect to any 680 Madison Avenue Major Tenant:
| (i) | a default by such 680 Madison Avenue Major Tenant under its lease beyond any applicable notice and cure period, |
| (ii) | a bankruptcy or insolvency of such 680 Madison Avenue Major Tenant or any guarantor of its rental obligations under its lease, |
| (iii) | such 680 Madison Avenue Major Tenant “goes dark,” vacates or ceases to occupy a substantial portion of the demised premises or discontinues its operations at the demised premises (excluding temporary vacancies for the purpose of repair, restoration or permitted alterations), or delivers written notice of its intention to do any of the foregoing, or |
| (iv) | such 680 Madison Avenue Major Tenant fails to (x) renew its lease by the earlier of 12 months prior to lease expiration or the contractual notice period required by such lease or (y) extend its lease pursuant to an extension period granted in such lease. |
A “680 Madison Avenue Tax Trigger Event” means the occurrence of any one or more of the following:
| (i) | the commencement of a 680 Madison Avenue Trigger Period, |
| (ii) | a failure by Residential Owner to either (x) pay to the borrower the property tax amount required to be paid by the Residential Owner pursuant to the Residential Master Lease (“Residential Owner Tax Amount”) or (y) deliver evidence that it has paid the Residential Owner Tax Amount directly to the applicable governmental authority, in each case, by the date that is 10 business days prior to the date that property taxes would become delinquent, or |
| (iii) | any other monetary default by the Residential Owner under the Residential Master Lease beyond any applicable notice and cure period. |
| THE INFORMATION IN THIS STRUCTURAL AND COLLATERAL TERM SHEET IS NOT COMPLETE AND MAY BE AMENDED PRIOR TO THE TIME OF SALE. THIS TERM SHEET IS NOT AN OFFER TO SELL THESE SECURITIES AND IT IS NOT A SOLICITATION OF AN OFFER TO BUY THESE SECURITIES IN ANY JURISDICTION WHERE THE OFFER OR SALE IS NOT PERMITTED. |
| | 103 | |
| Retail - Anchored | Loan #8 | Cut-off Date Balance: | | $40,000,000 |
| 680 Madison Avenue | 680 Madison Avenue | Cut-off Date LTV: | | 64.9% |
| New York, NY 10065 | | U/W NCF DSCR: | | 1.84x |
| | | U/W NOI Debt Yield: | | 12.6% |
Lockbox and Cash Management. The 680 Madison Avenue Whole Loan is structured with a hard lockbox and springing cash management. At origination, the borrower was required to direct each tenant to remit all rents directly to a lender-controlled lockbox account. In addition, the borrower is required to cause all cash revenues and all other money received by the borrower or the property manager (other than tenant security deposits) to be deposited into the lockbox account or a lender-controlled cash management account by the end of the second business day following receipt. On each business day during the continuance of a 680 Madison Avenue Trigger Period or event of default under the 680 Madison Avenue Whole Loan documents, all amounts in the lockbox are required to be remitted to the cash management account. At the end of each business day that no 680 Madison Avenue Trigger Period or an event of default under the 680 Madison Avenue Whole Loan is continuing, all amounts in the lockbox account are required to be remitted to a borrower-controlled operating account.
On each payment date during the continuance of a 680 Madison Avenue Trigger Period (or, at the lender’s discretion, during an event of default under the 680 Madison Avenue Whole Loan documents), all funds on deposit in the cash management account after payment of debt service on the 680 Madison Avenue Whole Loan, required reserves and budgeted operating expenses are required to be deposited into an excess cash flow reserve account as additional collateral for the 680 Madison Avenue Whole Loan.
Property Management. The 680 Madison Avenue Property is managed by G&E Real Estate Management Services, Inc., a Delaware corporation dba Newmark Management.
Partial Release. The 680 Madison Avenue Whole Loan documents permit the borrower to obtain a release of the Residential Component without the payment of a release price and subject to, among other things, satisfaction of customary REMIC requirements in connection with a Tax Lot Split (as defined below) as described under “Ground Lease” below.
Real Estate Substitution. Not permitted.
Subordinate and Mezzanine Indebtedness. None.
Ground Lease. The 680 Madison Avenue Property is subject to a ground lease between the borrower, as ground lessee, and 680 Special, L.L.C., as ground lessor (the “680 Madison Avenue Ground Lease”). The initial term of the 680 Madison Avenue Ground Lease expires on June 30, 2169. Annual base ground rent is $4,455,000 per annum, subject to a schedule of escalations set forth in the 680 Madison Avenue Whole Loan documents, including an increase of base rent to $4,901,000 per annum effective on July 1, 2029. As described above under “The Mortgage Loan,” the demised premises under the 680 Madison Avenue Ground Lease include both the Retail Component and the Residential Component. Pursuant to a sublease (the “Residential Master Lease”), the borrower subleases the Residential Component to the Residential Owner. Under the Residential Master Lease, the Residential Owner is not required to pay any rent for the Residential Component, provided that it is responsible for certain expenses including, among other things, its pro rata share of property taxes. The borrower and the Residential Owner have also entered into a building sharing agreement that, among other things, governs maintenance obligations for shared facilities. Under the 680 Madison Avenue Whole Loan documents, the borrower has the right to separate the Retail Component from the Residential Component into two separate parcels for purposes of obtaining separate tax bills (which separation may include the creation by the ground lessor of a condominium comprised of two units, the creation of a fee above a plane, or any other mechanism or process pursuant to which separate tax bills are obtained) (any of the foregoing, a “Tax Lot Split”) provided that, among other conditions, (i) the borrower is required to simultaneously with the Tax Lot Split transfer title to the leasehold interest in the Residential Component to the Residential Owner and (ii) satisfy customary REMIC requirements.
Terrorism Insurance. The 680 Madison Avenue Whole Loan documents require that the “all risk” insurance policy required to be maintained by the borrower provides coverage for terrorism in an amount equal to the full replacement cost of the 680 Madison Avenue Property, as well as business interruption insurance covering no less than the 18-month period following the occurrence of a casualty event, together with a 12-month extended period of indemnity (provided that if TRIPRA or a similar statute is not in effect, the borrowers will not be obligated to pay terrorism insurance premiums in excess of two times the premium for the casualty and business interruption coverage on a stand-alone basis).
| THE INFORMATION IN THIS STRUCTURAL AND COLLATERAL TERM SHEET IS NOT COMPLETE AND MAY BE AMENDED PRIOR TO THE TIME OF SALE. THIS TERM SHEET IS NOT AN OFFER TO SELL THESE SECURITIES AND IT IS NOT A SOLICITATION OF AN OFFER TO BUY THESE SECURITIES IN ANY JURISDICTION WHERE THE OFFER OR SALE IS NOT PERMITTED. |
| | 104 | |
| Hospitality – Full Service | Loan #9 | Cut-off Date Balance: | | $38,000,000 |
8000 South Arizona Grand Parkway
Phoenix, AZ 85044 | Arizona Grand Resort and Spa | Cut-off Date LTV: U/W NCF DSCR: U/W NOI Debt Yield: | | 39.2% 3.76x 24.2% |

| THE INFORMATION IN THIS STRUCTURAL AND COLLATERAL TERM SHEET IS NOT COMPLETE AND MAY BE AMENDED PRIOR TO THE TIME OF SALE. THIS TERM SHEET IS NOT AN OFFER TO SELL THESE SECURITIES AND IT IS NOT A SOLICITATION OF AN OFFER TO BUY THESE SECURITIES IN ANY JURISDICTION WHERE THE OFFER OR SALE IS NOT PERMITTED. |
| | 105 | |
| Hospitality – Full Service | Loan #9 | Cut-off Date Balance: | | $38,000,000 |
8000 South Arizona Grand Parkway
Phoenix, AZ 85044 | Arizona Grand Resort and Spa | Cut-off Date LTV: U/W NCF DSCR: U/W NOI Debt Yield: | | 39.2% 3.76x 24.2% |
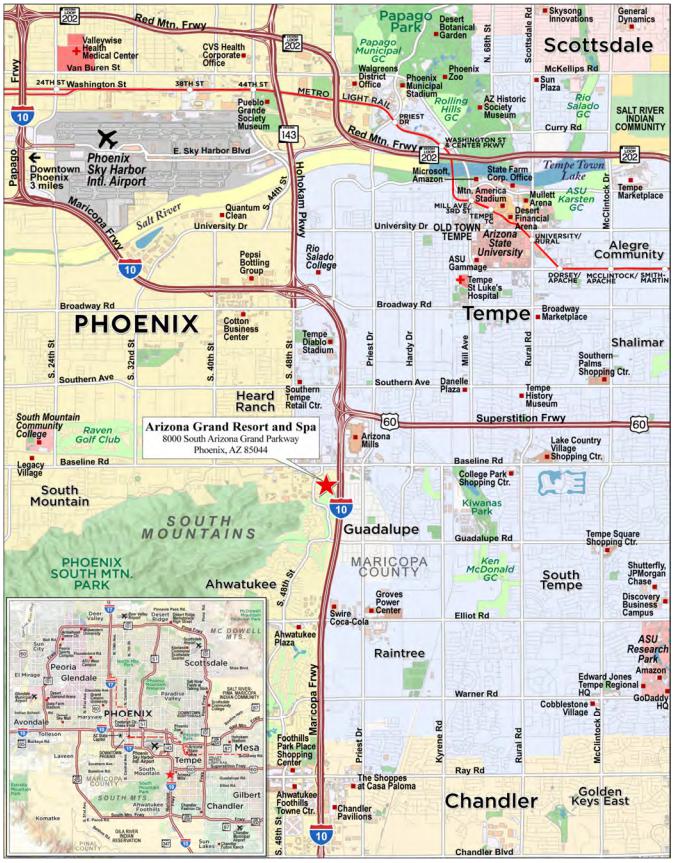
| THE INFORMATION IN THIS STRUCTURAL AND COLLATERAL TERM SHEET IS NOT COMPLETE AND MAY BE AMENDED PRIOR TO THE TIME OF SALE. THIS TERM SHEET IS NOT AN OFFER TO SELL THESE SECURITIES AND IT IS NOT A SOLICITATION OF AN OFFER TO BUY THESE SECURITIES IN ANY JURISDICTION WHERE THE OFFER OR SALE IS NOT PERMITTED. |
| | 106 | |
| No. 9 – Arizona Grand Resort and Spa |
| |
| Mortgage Loan Information | | Mortgaged Property Information |
| Mortgage Loan Sellers: | Wells Fargo Bank, National Association, Goldman Sachs Mortgage Company | | Single Asset/Portfolio: | Single Asset |
Credit Assessment (Fitch/KBRA/Moody’s): | A-sf/A(sf)/Baa3(sf) | | Property Type – Subtype: | Hospitality – Full Service |
| Original Principal Balance(1): | $38,000,000 | | Location: | Phoenix, AZ |
| Cut-off Date Balance(1): | $38,000,000 | | Size(5): | 744 Rooms |
| % of Initial Pool Balance: | 5.3% | | Cut-off Date Balance Per Room(1): | $168,011 |
| Loan Purpose: | Refinance | | Maturity Date Balance Per Room(1): | $168,011 |
| Borrower Sponsor: | Grossman Company Properties, Inc. | | Year Built/Renovated: | 1987 / 2017-2019 |
| Guarantor: | Southwest Recourse III, LLC | | Title Vesting: | Fee / Leasehold |
| Mortgage Rate: | 5.5500% | | Property Manager: | Arizona Grand Resort Manager, LLC |
| Note Date: | July 26, 2024 | | Current Occupancy (As of): | 63.2% (4/30/2024) |
| Seasoning: | 0 months | | YE 2023 Occupancy: | 61.8% |
| Maturity Date: | August 6, 2034 | | YE 2022 Occupancy: | 63.9% |
| IO Period: | 120 months | | YE 2021 Occupancy: | 54.3% |
| Loan Term (Original): | 120 months | | YE 2020 Occupancy: | 31.2% |
| Amortization Term (Original): | NAP | | As-Is Appraised Value: | $318,800,000 |
| Loan Amortization Type: | Interest Only | | As-Is Appraised Value Per Room: | $428,495 |
| Call Protection(2): | L(24),D(89),O(7) | | As-Is Appraisal Valuation Date: | June 4, 2024 |
| Lockbox Type: | Hard/Springing | | Underwriting and Financial Information |
| Additional Debt(1): | Yes | | TTM NOI (4/30/2024): | $30,264,845 |
| Additional Debt Type (Balance) (1): | Pari Passu ($87,000,000) | | YE 2023 NOI: | $28,119,164 |
| | | | YE 2022 NOI(6): | $31,053,244 |
| | | | YE 2021 NOI(6): | $14,579,127 |
| | | | U/W Revenues: | $99,267,457 |
| Escrows and Reserves(3) | | U/W Expenses: | $69,043,990 |
| | Initial | Monthly | Cap | | U/W NOI: | $30,223,467 |
| Taxes: | $0 | Springing | NAP | | U/W NCF: | $26,456,492 |
| Insurance: | $0 | Springing | NAP | | U/W DSCR based on NOI/NCF(1): | 4.30x / 3.76x |
| FF&E Reserve: | $0 | 3% of Gross Revenue | NAP | | U/W Debt Yield based on NOI/NCF(1): | 24.2% / 21.2% |
| Seasonal Working Capital Reserve: | $650,000 | Springing | $3,250,000 | | U/W Debt Yield at Maturity based on NOI/NCF(1): | 24.2% / 21.2% |
| Other(4): | $0 | Springing | NAP | | Cut-off Date LTV Ratio(1): | 39.2% |
| | | | | | LTV Ratio at Maturity(1): | 39.2% |
| | | | | | | |
| | | | | | | | |
| Sources and Uses |
| Sources | | | | Uses | | |
| Whole Loan Amount(1) | $125,000,000 | 100.0% | | Loan Payoff | $110,983,664 | 88.8% |
| | | | | Return of Equity | 11,291,870 | 9.0 |
| | | | | Closing Costs | 2,074,466 | 1.7 |
| | | | | Upfront Reserves | 650,000 | 0.5 |
| Total Sources | $125,000,000 | 100.0% | | Total Uses | $125,000,000 | 100.0% |
| (1) | The Arizona Grand Resort and Spa Mortgage Loan (as defined below) is part of a whole loan evidenced by five pari passu promissory notes with an aggregate original balance of $125,000,000 (the “Arizona Grand Resort and Spa Whole Loan”). The Arizona Grand Resort and Spa Whole Loan was originated by GACC, GSBI and WFBNA (each as defined below). For additional information, see “The Mortgage Loan” section below. The financial information presented above is calculated based on the Arizona Grand Resort and Spa Whole Loan. |
| (2) | Defeasance of the Arizona Grand Resort and Spa Whole Loan is permitted at any time after the earlier to occur of (a) the end of the two-year period commencing on the closing date of the securitization of the last promissory note representing a portion of the Arizona Grand Resort and Spa Whole Loan to be securitized and (b) July 26, 2027. The assumed defeasance lockout period of 24 payments is based on the anticipated closing date of the WFCM 2024-C63 securitization trust in August 2024. The actual lockout period may be longer. |
| (3) | See “Escrows” section. |
| (4) | Other Reserve represents the Refundable Advance Payment Reserve. |
| (5) | Size is based on 744 guestrooms, 643 of which are borrower-owned and 101 of which are located in villas owned by third parties which are available as additional rentable guestrooms through the villa rental pool program. See “The Property” section below. |
| (6) | The increase in Net Operating Income from 2021 to 2022 is primarily attributable to increased occupancy and food and beverage revenue. |
| THE INFORMATION IN THIS STRUCTURAL AND COLLATERAL TERM SHEET IS NOT COMPLETE AND MAY BE AMENDED PRIOR TO THE TIME OF SALE. THIS TERM SHEET IS NOT AN OFFER TO SELL THESE SECURITIES AND IT IS NOT A SOLICITATION OF AN OFFER TO BUY THESE SECURITIES IN ANY JURISDICTION WHERE THE OFFER OR SALE IS NOT PERMITTED. |
| | 107 | |
| Hospitality – Full Service | Loan #9 | Cut-off Date Balance: | | $38,000,000 |
8000 South Arizona Grand Parkway
Phoenix, AZ 85044 | Arizona Grand Resort and Spa | Cut-off Date LTV: U/W NCF DSCR: U/W NOI Debt Yield: | | 39.2% 3.76x 24.2% |
The Mortgage Loan. The ninth largest mortgage loan (the “Arizona Grand Resort and Spa Mortgage Loan”) is part of a whole loan that is evidenced by five pari passu promissory notes in the aggregate original principal amount of $125,000,000 secured by a first lien mortgage on the borrower’s fee simple and leasehold interest in a 744 all-suite resort located in Phoenix, Arizona (the “Arizona Grand Resort and Spa Property”). The Arizona Grand Resort and Spa Whole Loan was originated by German American Capital Corporation (“GACC”), Goldman Sachs Bank USA (“GSBI”) and Wells Fargo Bank, National Association (“WFBNA”) and has an outstanding principal balance as of the Cut-off Date of $125,000,000. The Arizona Grand Resort and Spa Whole Loan accrues interest at a fixed rate of 5.5500% per annum on an Actual/360 basis. The Arizona Grand Resort and Spa Whole Loan has a 120-month term and is interest-only for the full term. The Arizona Grand Resort and Spa Mortgage Loan is evidenced by the non-controlling Note A-3 contributed by WFBNA and the non-controlling Note A-2-2 contributed by Goldman Sachs Mortgage Company (“GSMC”), with an aggregate original principal balance of $38,000,000. The Arizona Grand Resort and Spa Whole Loan is expected to be serviced pursuant to the pooling and servicing agreement for the BBCMS 2024-C28 trust. See “Description of the Mortgage Pool—The Whole Loans—The Non-Serviced Pari Passu Whole Loans” and “Pooling and Servicing Agreement—Servicing of the Non-Serviced Mortgage Loans” in the Preliminary Prospectus.
Note Summary
| Notes | Original Balance | Cut-off Date Balance | Note Holder | Controlling Piece |
| A-1-1 | $48,000,000 | $48,000,000 | BBCMS 2024-C28(1) | Yes |
| A-1-2 | $17,000,000 | $17,000,000 | GACC | No |
| A-2-1 | $22,000,000 | $22,000,000 | BBCMS 2024-C28(1) | No |
| A-2-2 | $8,000,000 | $8,000,000 | WFCM 2024-C63 | No |
| A-3 | $30,000,000 | $30,000,000 | WFCM 2024-C63 | No |
| Total | $125,000,000 | $125,000,000 | | |
| (1) | The BBCMS 2024-C28 securitization transaction is expected to close on or about August 29, 2024. |
The Borrower and Borrower Sponsor. The borrower is Arizona Grand Resort, LLC, a Delaware limited liability company and special purpose entity. Legal counsel to the borrower delivered a non-consolidation opinion in connection with the origination of the Arizona Grand Resort and Spa Whole Loan.
The borrower sponsor is Grossman Company Properties, Inc, ("Grossman"), an Arizona corporation, and the non-recourse carveout guarantor is Southwest Recourse III, LLC, a Delaware limited liability company. The Arizona Grand Resort and Spa Whole Loan is also structured with a springing guarantor, Southwest Associates Investments, LLC, a Delaware limited liability company, which entity will become jointly and severally liable under the guaranty upon the occurrence of certain events as specified in the Arizona Grand Resort and Spa Whole Loan documents. Founded in 1962 and headquartered in Scottsdale, Arizona, Grossman has experience and knowledge in developing, managing, and operating hospitality, office, residential, and retail projects across the Western United States. Grossman purchased the Arizona Grand Resort and Spa Property in 2006 for $206.0 million (approximately $320,000 / owned key) and has invested $105.0 million since acquisition for a total cost basis of $311.0 million (approximately $417,997 / rentable key).
The Property. The Arizona Grand Resort and Spa Property is a luxury resort that offers 744 guestrooms on over 158 acres. The resort amenities include (i) the seven-acre Oasis Water Park featuring an eight-story tower and three water slides, wave pool, 25 person whirlpool, and lazy river, (ii) 89,397 square feet of indoor meeting space and 80,000 square feet of outdoor event space, (iii) a state-of-the-art 36,000 square foot athletic club, (iv) a destination spa, (v) five food and beverage outlets, and (vi) an 18-hole championship golf course. The spa, one of the largest in Arizona, offers 10 treatment rooms with an extensive menu of services. The Arizona Grand Resort and Spa Property offers in-suite dining as well as the following five food & beverage options: The Lobby Grill, The Lobby Bar, Marketplace Café, Aunt Chilada’s, and The Oasis Bar & Grill. There are 1,600 on-site surface parking spots.
643 of the guestrooms are borrower-owned suites that are collateral for the Arizona Grand Resort and Spa Whole Loan. The additional 101 rentable guestrooms (the “Villa Rental Pool Rooms”) are available to hotel guests through the villa rental pool program. The Villa Rental Pool Rooms are located in 50 luxury villas that were constructed in 2009 and sold to third parties as condominiums. The resort has a total of 52 villas but the owner of one villa (a one-bedroom villa that could not be split into two separate units, opted out of the rental pool, and the owner of another villa that has two bedrooms only included one of the bedrooms in the rental pool, for a total of 3 bedrooms left out of the 104 total). Each villa (except for one villa that contains one Villa Rental Pool Room) has a 1,400 square foot living area and can be locked off into a 400 square foot guestroom suite and a 1,000 square foot one-bedroom suite. All villas feature walk-in closets, custom cabinetry, designer countertops and appliances, private balconies, full-size refrigerators and microwaves, double sinks with garbage disposals and cookware/utensils. The villas are not collateral for the Arizona Grand Resort and Spa Whole Loan; however, the owners of 50 of the 52 villas (the “Participating Owners”) participate in the villa rental pool program pursuant to which the borrower rents the Villa Rental Pool Rooms as hotel accommodations and receives management fees as follows: (i) for one-bedroom units approximately 50% of the first $105,000 of annual rental revenue and 65% of all revenue in excess of $105,000 and (ii) for two-bedroom units 50% of the first $70,000 of annual rental revenue and 65% of all revenue in excess of $70,000. The rental pool program is evidenced by the rental pool agreements and related documentation (the “Rental Pool Documents”) which have been collaterally assigned to the lender. Pursuant to the Rental Pool Documents, the Participating Owners (i) are responsible for all FF&E and capital expenditures related to their Villa Rental Pool Rooms, as well as utilities, property taxes, and maintenance related to their Villa Rental Pool Rooms and (ii) are required to provide 36-months advanced written notice to remove a Villa Rental Pool Room from the rental pool. In addition to receiving rental revenue, villa owners are incentivized to participate in the rental pool as they are prohibited from renting their villa outside of the rental pool unless the rental is for a period of 365 days or more.
| THE INFORMATION IN THIS STRUCTURAL AND COLLATERAL TERM SHEET IS NOT COMPLETE AND MAY BE AMENDED PRIOR TO THE TIME OF SALE. THIS TERM SHEET IS NOT AN OFFER TO SELL THESE SECURITIES AND IT IS NOT A SOLICITATION OF AN OFFER TO BUY THESE SECURITIES IN ANY JURISDICTION WHERE THE OFFER OR SALE IS NOT PERMITTED. |
| | 108 | |
| Hospitality – Full Service | Loan #9 | Cut-off Date Balance: | | $38,000,000 |
8000 South Arizona Grand Parkway
Phoenix, AZ 85044 | Arizona Grand Resort and Spa | Cut-off Date LTV: U/W NCF DSCR: U/W NOI Debt Yield: | | 39.2% 3.76x 24.2% |
The following table presents historical occupancy, ADR, and RevPAR penetration rates of Arizona Grand Resort and Spa Property:
| Historical Occupancy, ADR, RevPAR(1)(2)(3) |
| | | Competitive Set(4) | | Arizona Grand Resort and Spa Property | | Penetration Factor |
| Year | | Occupancy | ADR | RevPAR | | Occupancy | ADR | RevPAR | | Occupancy | ADR | RevPAR |
| 12/31/2022 TTM | | 59.2% | $208.87 | $123.61 | | 63.9% | $230.70 | $147.44 | 108.0% | 110.5% | 119.3% |
| 12/31/2023 TTM | | 59.9% | $215.00 | $128.72 | | 61.8% | $229.41 | $141.85 | 103.3% | 106.7% | 110.2% |
| 4/30/2024 TTM | | 59.2% | $209.64 | $124.17 | | 63.2% | $219.51 | $138.72 | 106.7% | 104.7% | 111.7% |
| (1) | Data for the Arizona Grand Resort and Spa Property is based on the lender underwriting. |
| (2) | Data for the competitive set was provided by a third-party market research report. |
| (3) | The variances between the underwriting, appraisal and third-party market research provider date with respect to Occupancy, ADR and RevPAR at the Arizona Grand Resort and Spa Property are attributable to differing reporting methodologies and/or timing differences. |
| (4) | The competitive set includes The Scottsdale Plaza Resort, Marriott Phoenix Resort Tempe At The Buttes, DoubleTree Resort by Hilton Hotel Paradise Valley - Scottsdale, Pointe Hilton Tapatio Cliffs Resort, Hilton Phoenix Resort at the Peak, The Wigwam and Sheraton Grand at Wild Horse Pass. |
The following table presents historical occupancy percentages at Arizona Grand Resort and Spa Property:
Historical Occupancy(1)
12/31/2021 | 12/31/2022 | 12/31/2023 | 4/30/2024 |
| 54.3% | 63.9% | 61.8% | 63.2% |
| (1) | Information obtained from the historical operating statements. |
| THE INFORMATION IN THIS STRUCTURAL AND COLLATERAL TERM SHEET IS NOT COMPLETE AND MAY BE AMENDED PRIOR TO THE TIME OF SALE. THIS TERM SHEET IS NOT AN OFFER TO SELL THESE SECURITIES AND IT IS NOT A SOLICITATION OF AN OFFER TO BUY THESE SECURITIES IN ANY JURISDICTION WHERE THE OFFER OR SALE IS NOT PERMITTED. |
| | 109 | |
| Hospitality – Full Service | Loan #9 | Cut-off Date Balance: | | $38,000,000 |
8000 South Arizona Grand Parkway
Phoenix, AZ 85044 | Arizona Grand Resort and Spa | Cut-off Date LTV: U/W NCF DSCR: U/W NOI Debt Yield: | | 39.2% 3.76x 24.2% |
Operating History and Underwritten Net Cash Flow. The following table presents certain information relating to the historical operating performance and underwritten net cash flow at Arizona Grand Resort and Spa Property:
Cash Flow Analysis
| | 2021 | 2022 | 2023 | TTM 4/30/2024 | U/W | % of U/W Total Revenue(1) | U/W $ per Room(2) |
| Occupancy | 54.3% | 63.9% | 61.8% | 63.2% | 63.2% | | |
| ADR | $204.44 | $230.70 | $229.41 | $219.51 | $219.51 | | |
| RevPAR | $110.95 | $147.44 | $141.85 | $138.72 | $138.72 | | |
| | | | | | | | |
| Rooms Revenue | $30,128,618 | $40,038,231 | $38,521,241 | $37,774,927 | $37,671,717 | 37.9% | $50,634 |
| Food & Beverage Revenue | 10,482,659 | 32,677,902 | 33,275,339 | 37,753,841 | 37,753,841 | 38.0 | 50,744 |
| Golf Operations Revenue | 2,769,994 | 3,359,196 | 4,027,757 | 4,299,272 | 4,299,272 | 4.3 | 5,779 |
| The Oasis Water Park Revenue | 5,964,061 | 6,017,854 | 5,833,706 | 5,827,815 | 5,827,815 | 5.9 | 7,833 |
| Other Departmental Revenue(3) | 7,222,488 | 11,611,296 | 13,186,609 | 13,714,813 | 13,714,813 | 13.8 | 18,434 |
| Total Revenue | $56,567,820 | $93,704,479 | $94,844,651 | $99,370,667 | $99,267,457 | 100.0% | $133,424 |
| | | | | | | | |
| Room Expense | 9,010,045 | 13,511,471 | 13,704,741 | 13,765,323 | 13,727,712 | 36.4 | 18,451 |
| Food & Beverage Expenses | 5,991,312 | 15,929,874 | 17,267,717 | 18,848,593 | 18,848,593 | 49.9 | 25,334 |
| Golf Expenses | 1,929,854 | 2,260,844 | 2,443,410 | 2,502,830 | 2,502,830 | 58.2 | 3,364 |
| The Oasis Water Park Expenses | 4,349,077 | 5,336,419 | 5,092,628 | 5,149,479 | 5,149,479 | 88.4 | 6,921 |
| Other Departmental Expenses | 590,094 | 1,976,037 | 2,018,316 | 2,218,278 | 2,218,278 | 16.2 | 2,982 |
| Total Department Expenses | $21,870,381 | $39,014,645 | $40,526,813 | $42,484,503 | $42,446,893 | 42.8% | $57,052 |
| Gross Operating Income | $34,697,439 | $54,689,834 | $54,317,838 | $56,886,164 | $56,820,564 | 57.2% | $76,372 |
| | | | | | | | |
| Total Undistributed Expenses | $13,753,240 | $16,733,747 | $19,582,056 | $20,113,442 | $20,058,488 | 20.2% | $26,960 |
| | | | | | | | |
| Fixed Expenses | $6,365,072 | $6,902,844 | $6,616,618 | $6,507,877 | $6,538,610 | 6.6% | $8,788 |
| | | | | | | | |
| Net Operating Income | $14,579,127(4) | $31,053,244(4) | $28,119,164 | $30,264,845 | $30,223,467 | 30.4% | $40,623 |
| FF&E | 1,819,255 | 3,416,585 | 3,615,831 | 3,709,142 | 3,766,975 | 3.8 | 5,063 |
| Net Cash Flow | $12,759,872 | $27,636,659 | $24,503,333 | $26,555,703 | $26,456,492 | 26.7% | $35,560 |
| | | | | | | | |
| NOI DSCR(5) | 2.07x | 4.41x | 4.00x | 4.30x | 4.30x | | |
| NCF DSCR(5) | 1.81x | 3.93x | 3.48x | 3.78x | 3.76x | | |
| NOI DY(5) | 11.7% | 24.8% | 22.5% | 24.2% | 24.2% | | |
| NCF DY(5) | 10.2% | 22.1% | 19.6% | 21.2% | 21.2% | | |
| (1) | % of U/W Total Revenue for all department expenses are based on their corresponding revenue line items. All other line items represent percent of Total Revenue. |
| (2) | UW $ per Room values are based on 744 rooms. |
| (3) | Underwritten Other Departmental Revenue is inclusive of $1,286,648 of Spa Revenue. |
| (4) | The increase in NOI from 2021 to 2022 was primarily due to the effect of the novel coronavirus on the hospitality industry in 2020 and 2021, and the subsequent recovery in 2021 and 2022, as well as an increase in occupancy and ADR from 54.3% and $204.44, respectively, in 2021 to 63.9% and $230.70, respectively, in 2022 and increased food & beverage. |
| (5) | DSCR and Debt Yields are based on the Arizona Grand Resort and Spa Whole Loan. |
Appraisal. The As-Is Apprised Value as of June 4, 2024, is $318,800,000, which is equivalent to an appraised value per room of $428,495, a Cut-off Date LTV Ratio of 39.2%, and a Maturity Date LTV Ratio of 39.2%.
Environmental Matters. According to the Phase I environmental assessment dated July 12, 2024, there was no evidence of any recognized or controlled recognized environmental conditions at the Arizona Grand Resort and Spa Property.
Market Overview and Competition. The Arizona Grand Resort and Spa Property is located in the Phoenix-Mesa, AZ metropolitan statistical area. Phoenix is among the nation’s largest and fastest-growing metropolitan areas. With a population of over five million residents, the Phoenix MSA ranks as the 10th most populous metro in the United States. Due to its geographic proximity and access to markets throughout California and the Southwest, the Phoenix MSA serves as the primary commercial gateway of the western United States. Airport passenger traffic has increased year over year since the pandemic and 2023 reached an all-time high for number of travelers. The market benefits from a variety of tourism and leisure attractions in the area. Leisure demand generators include the Phoenix Zoo, Desert Botanical Garden, the Mill Avenue shopping and entertainment district, Tempe Town Lake, Sun Devil Stadium, and many world-class resorts and golf courses, as well as recreation opportunities in nearby mountain ranges.
Escrows.
Real Estate Taxes – During the continuance of a Trigger Event (as defined below), the borrower is required to escrow 1/12th of the annual estimated tax payments on a monthly basis.
Insurance – During the continuance of a Trigger Event, the borrower is required to escrow 1/12th of the annual estimated insurance payments on a monthly basis, except if the Arizona Grand Resort and Spa Property is insured under a blanket policy meeting the
| THE INFORMATION IN THIS STRUCTURAL AND COLLATERAL TERM SHEET IS NOT COMPLETE AND MAY BE AMENDED PRIOR TO THE TIME OF SALE. THIS TERM SHEET IS NOT AN OFFER TO SELL THESE SECURITIES AND IT IS NOT A SOLICITATION OF AN OFFER TO BUY THESE SECURITIES IN ANY JURISDICTION WHERE THE OFFER OR SALE IS NOT PERMITTED. |
| | 110 | |
| Hospitality – Full Service | Loan #9 | Cut-off Date Balance: | | $38,000,000 |
8000 South Arizona Grand Parkway
Phoenix, AZ 85044 | Arizona Grand Resort and Spa | Cut-off Date LTV: U/W NCF DSCR: U/W NOI Debt Yield: | | 39.2% 3.76x 24.2% |
requirements set forth in the related Arizona Grand Resort and Spa Whole Loan agreement (in which case, no insurance escrows will be required, notwithstanding the occurrence of a Trigger Event). A blanket policy is currently in place.
FF&E Reserves – On each monthly payment date, the borrower is required to escrow an amount equal to the greatest of (i) 3% of the projected gross revenue for the Arizona Grand Resort and Spa Property excluding any amounts payable to the borrower pursuant to the Rental Pool Documents for the prior month as set forth in the most recent approved annual budget (provided, that, to the extent the lender determines that actual gross revenue for the Arizona Grand Resort and Spa Property is materially in excess of such projections, the lender has the option to increase the percentage to match actual gross revenue for the Arizona Grand Resort and Spa Property), (ii) the then-current amount required by the property management agreement and (iii) the then-current amount required by any franchise agreement, for approved capital expenditures and the repair and replacement of the FF&E.
Custodial Funds and Hotel Tax Reserve – During the continuance of a Trigger Event, the borrower is required to deliver or cause to be delivered to the lender on each monthly payment date, for deposit into the custodial funds and hotel tax account, an amount reasonably budgeted by the borrower and approved by the lender in its reasonable discretion or reasonably determined by the lender as provided in the Arizona Grand Resort and Spa Whole Loan Documents if the borrower fails to establish a budgeted amount, to provide for custodial funds and sales and occupancy taxes that are anticipated to be payable during such month.
PIP Reserve - If any manager or franchisor requires the borrower to implement a property improvement plan (“PIP”) at the Arizona Grand Resort and Spa Property, the borrower is required to deposit 110% of the estimated costs to complete any PIP.
Seasonal Working Capital Reserve – At origination, the borrower deposited approximately $650,000 (the “Initial Seasonality Deposit”) into a seasonality reserve account.
In the event any funds have been disbursed from the seasonality reserve in accordance with the Arizona Grand Resort and Spa Whole Loan documents (such date, a “Seasonality Reserve Trigger”), the borrower is required on each monthly payment date, during the calendar months of February, March, April, May and June (each a “Seasonality Reserve Deposit Date”) to deposit the Applicable Seasonality Reserve Deposit Amount (as defined below) into the seasonality reserve up to a cap of $3,250,000. Provided no event of default is then ongoing, on each monthly payment date in each of July, August, September and January, the lender will disburse funds from the reserve (in an amount not to exceed the applicable shortfall) to cover a shortfall under the Arizona Grand Resort and Spa Whole Loan documents. Notwithstanding the foregoing, in the event (i) a Trigger Event (as defined below) has occurred and a portion of the Initial Seasonality Deposit has been disbursed, (ii) prior to the commencement of such Trigger Event, the full amount of the Initial Seasonality Deposit remained on deposit and (iii) the borrower has cured such Trigger Event and no other Trigger Event is continuing, then once the balance in the seasonality reserve is at least $650,000, the borrower will not be required to make ongoing deposits to the reserve until the occurrence of another Seasonality Reserve Trigger.
“Applicable Seasonality Reserve Deposit Amount” means (A) $650,000 during the first year of the term of the Arizona Grand Resort and Spa Whole Loan and (B) with respect to each Seasonality Reserve Deposit Date occurring during any other calendar year during the term of the Arizona Grand Resort and Spa Whole Loan, an amount equal to the lesser of: (i) $650,000 and (ii) 1/5th of the positive difference determined by subtracting: (x) the aggregate gross revenue (excluding extraordinary income) received with respect to the Arizona Grand Resort and Spa Property during the months of June, July, August and December in the immediately preceding calendar year from (y) without duplication, the aggregate of all operating expenses, debt service, deposits to reserves and other amounts payable pursuant to the Arizona Grand Resort and Spa Whole Loan documents during the months of June, July, August, and December of the immediate preceding calendar year.
Refundable Advance Payments Reserve – During the continuance of a Trigger Event, the borrower is required to deliver or cause to be delivered to the lender, for deposit into the Refundable Advance Payments account, as and when received an amount equal to the advance payments and deposits, including advance payments for, among other things, group business, banquets and other events (such amounts, “Refundable Advance Payments”); provided, however, notwithstanding the continuance of a Trigger Period, the borrower will not be required to deposit any such Refundable Advance Payments with the lender until such time as the aggregate amount of Refundable Advance Payments received by the borrower (and not yet disbursed) in such calendar year is in excess of $75,000.
Debt Service Reserve – During the continuation of a Low Debt Service Coverage Ratio Trigger (as defined below), all excess cash flow after payment of all monthly amounts due under the Arizona Grand Resort and Spa Whole Loan Documents (including, without limitation, taxes and insurance, debt service and required reserves) and approved budgeted property operating expenses will be swept to and held in a lender-controlled account (on an interest bearing basis for the benefit of the borrower) as additional collateral for the Arizona Grand Resort and Spa Whole Loan.
Lockbox and Cash Management. The Arizona Grand Resort and Spa Whole Loan is structured with a hard lockbox and springing cash management. Until the occurrence and during the continuance of a Trigger Event, all sums deposited into the lockbox account will be transferred daily into borrower’s operating account. Following a Trigger Event and until the cure thereof in accordance with the Arizona Grand Resort and Spa Whole Loan documents, any transfers to the borrower’s operating account will cease and such sums on deposit in the lockbox account will be transferred on a daily basis to an account controlled by the lender, at a financial institution selected by the lender, to be applied to the payment of all monthly amounts due under the Arizona Grand Resort and Spa Whole Loan documents (including, without limitation, taxes and insurance, approved operating expenses, including any additional operating expenses, approved capital expenses (via disbursements from the FF&E reserve) debt service and required reserves), with any excess funds being held by the lender (on an interest bearing basis for the benefit of the borrower other than tax and insurance) in a cash collateral account as additional collateral for the Arizona Grand Resort and Spa Whole Loan (provided that upon the occurrence of an
| THE INFORMATION IN THIS STRUCTURAL AND COLLATERAL TERM SHEET IS NOT COMPLETE AND MAY BE AMENDED PRIOR TO THE TIME OF SALE. THIS TERM SHEET IS NOT AN OFFER TO SELL THESE SECURITIES AND IT IS NOT A SOLICITATION OF AN OFFER TO BUY THESE SECURITIES IN ANY JURISDICTION WHERE THE OFFER OR SALE IS NOT PERMITTED. |
| | 111 | |
| Hospitality – Full Service | Loan #9 | Cut-off Date Balance: | | $38,000,000 |
8000 South Arizona Grand Parkway
Phoenix, AZ 85044 | Arizona Grand Resort and Spa | Cut-off Date LTV: U/W NCF DSCR: U/W NOI Debt Yield: | | 39.2% 3.76x 24.2% |
event of default under the Arizona Grand Resort and Spa Whole Loan documents, all sums received from the Arizona Grand Resort and Spa Property and all funds reserved with the lender will be applied to amounts owed under any of the Arizona Grand Resort and Spa Whole Loan documents in such amounts, order and manner as the lender elects in its sole discretion).
A “Trigger Event” will commence upon the earlier of the following:
| (i) | an event of default; or |
| (ii) | the bankruptcy or insolvency of any affiliated property manager; or |
| (iii) | the net cash flow debt service coverage ratio (“NCF DSCR”) falling below 1.20x for two consecutive quarters. |
A Trigger Event will end upon the occurrence of the following:
| ● | with regard to clause (i), the cure of such event of default; or |
| ● | with regard to clause (ii), until the replacement thereof with a non-affiliated manager approved by the lender, |
| ● | with regard to clause (iii), upon the NCF DSCR being equal to or greater than 1.20x for two consecutive quarters or the borrower depositing with the lender cash or an acceptable letter of credit in an amount sufficient to cure the low debt service coverage ratio trigger. |
Property Management. The Arizona Grand Resort and Spa Property is managed by Arizona Grand Resort Manager, LLC, a Delaware limited liability company and an affiliate of the borrower.
Partial Release. Not permitted.
Subordinate and Mezzanine Indebtedness. None.
Permitted Future Mezzanine Debt. Not permitted.
Ground Lease. A portion of the golf course is subject to a ground leased from the City of Phoenix with an annual rent payment of $100 and an expiration date of July 30, 2057, with no extension options remaining. The ground lease generally contains standard notice and cure rights for the benefit of the lender.
Terrorism Insurance. The Arizona Grand Resort and Spa Whole Loan documents require that the “all risk” insurance policy required to be maintained by the borrower provides coverage for terrorism in an amount equal to the full replacement cost of Arizona Grand Resort and Spa Property, as well as business interruption insurance covering no less than the 18-month period following the occurrence of a casualty event, together with a 12-month extended period of indemnity.
| THE INFORMATION IN THIS STRUCTURAL AND COLLATERAL TERM SHEET IS NOT COMPLETE AND MAY BE AMENDED PRIOR TO THE TIME OF SALE. THIS TERM SHEET IS NOT AN OFFER TO SELL THESE SECURITIES AND IT IS NOT A SOLICITATION OF AN OFFER TO BUY THESE SECURITIES IN ANY JURISDICTION WHERE THE OFFER OR SALE IS NOT PERMITTED. |
| | 112 | |
| Office – CBD | Loan #10 | Cut-off Date Balance: | | $31,200,000 |
| 57 Willoughby Street | 57 Willoughby | Cut-off Date LTV: | | 56.6% |
| Brooklyn, NY 11201 | | UW NCF DSCR: | | 1.43x |
| | | UW NOI Debt Yield: | | 12.2% |
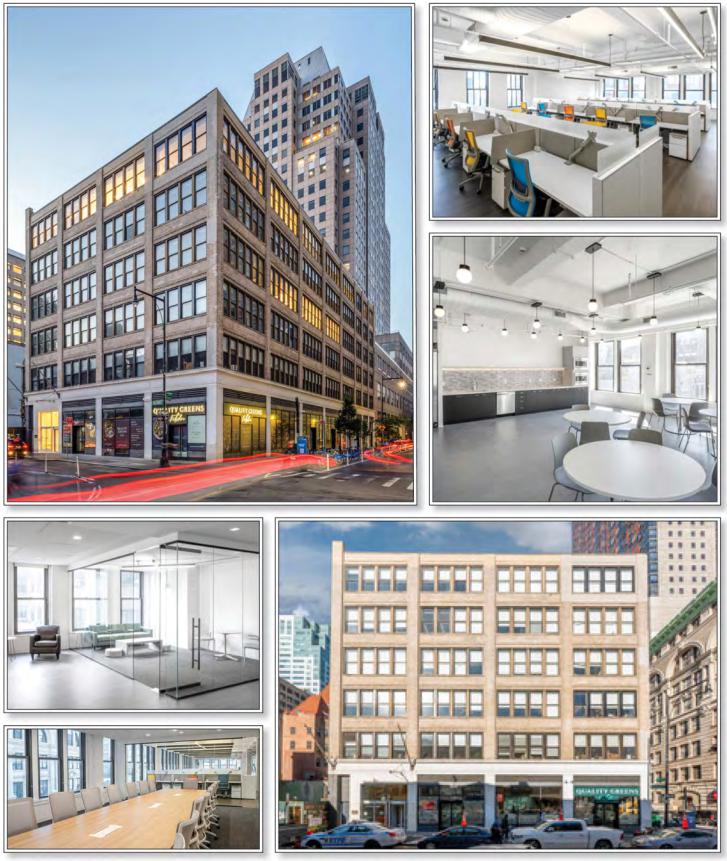
| THE INFORMATION IN THIS STRUCTURAL AND COLLATERAL TERM SHEET IS NOT COMPLETE AND MAY BE AMENDED PRIOR TO THE TIME OF SALE. THIS TERM SHEET IS NOT AN OFFER TO SELL THESE SECURITIES AND IT IS NOT A SOLICITATION OF AN OFFER TO BUY THESE SECURITIES IN ANY JURISDICTION WHERE THE OFFER OR SALE IS NOT PERMITTED. |
| | 113 | |
| Office – CBD | Loan #10 | Cut-off Date Balance: | | $31,200,000 |
| 57 Willoughby Street | 57 Willoughby | Cut-off Date LTV: | | 56.6% |
| Brooklyn, NY 11201 | | UW NCF DSCR: | | 1.43x |
| | | UW NOI Debt Yield: | | 12.2% |
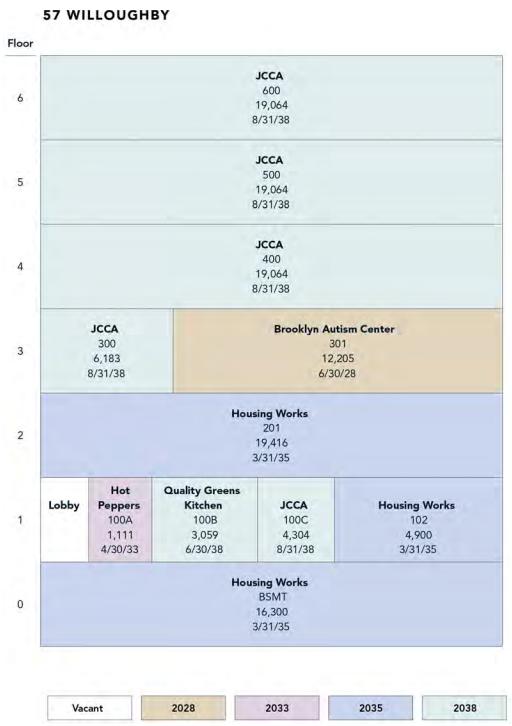
| THE INFORMATION IN THIS STRUCTURAL AND COLLATERAL TERM SHEET IS NOT COMPLETE AND MAY BE AMENDED PRIOR TO THE TIME OF SALE. THIS TERM SHEET IS NOT AN OFFER TO SELL THESE SECURITIES AND IT IS NOT A SOLICITATION OF AN OFFER TO BUY THESE SECURITIES IN ANY JURISDICTION WHERE THE OFFER OR SALE IS NOT PERMITTED. |
| | 114 | |
| Office – CBD | Loan #10 | Cut-off Date Balance: | | $31,200,000 |
| 57 Willoughby Street | 57 Willoughby | Cut-off Date LTV: | | 56.6% |
| Brooklyn, NY 11201 | | UW NCF DSCR: | | 1.43x |
| | | UW NOI Debt Yield: | | 12.2% |
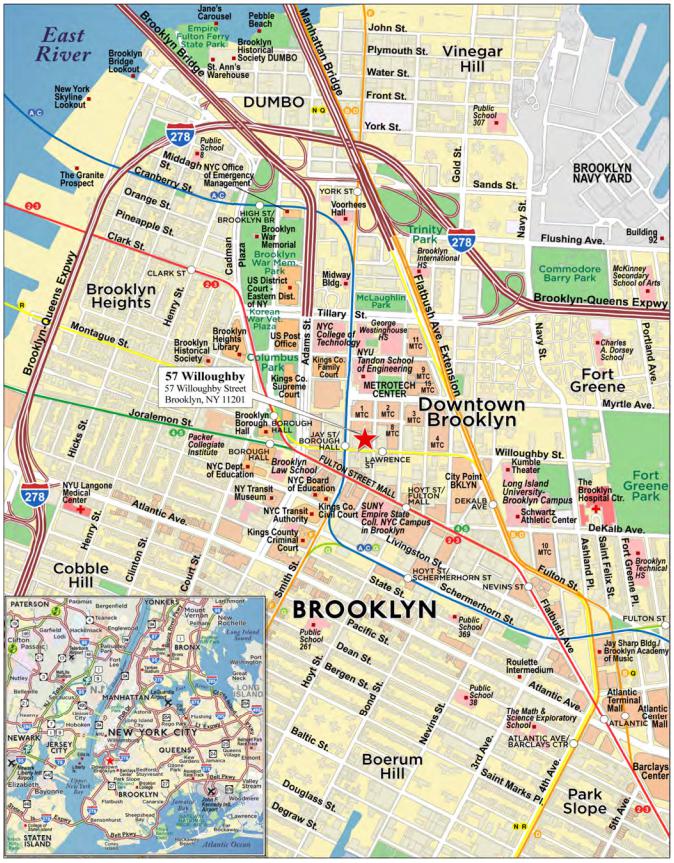
| THE INFORMATION IN THIS STRUCTURAL AND COLLATERAL TERM SHEET IS NOT COMPLETE AND MAY BE AMENDED PRIOR TO THE TIME OF SALE. THIS TERM SHEET IS NOT AN OFFER TO SELL THESE SECURITIES AND IT IS NOT A SOLICITATION OF AN OFFER TO BUY THESE SECURITIES IN ANY JURISDICTION WHERE THE OFFER OR SALE IS NOT PERMITTED. |
| | 115 | |
| No. 10 – 57 Willoughby |
| |
| Mortgage Loan Information | | Mortgaged Property Information |
| Mortgage Loan Seller: | Argentic Real Estate Finance 2 LLC | | Single Asset/Portfolio: | Single Asset |
Credit Assessment (Fitch/KBRA/Moody’s): | NR/NR/NR | | Property Type – Subtype: | Office – CBD |
| Original Principal Balance: | $31,200,000 | | Location: | Brooklyn, NY |
| Cut-off Date Balance: | $31,200,000 | | Size: | 124,670 SF |
| % of Initial Pool Balance: | 4.4% | | Cut-off Date Balance Per SF: | $250.26 |
| Loan Purpose: | Acquisition | | Maturity Date Balance Per SF: | $219.10 |
| Borrower Sponsors: | Damien Smith and Peter Zuccarello | | Year Built/Renovated: | 1929/2022 |
| Guarantors(1): | Gary Romaniello, Damien Smith and Peter Zuccarello | | Title Vesting: | Fee |
| Mortgage Rate: | 7.0920% | | Property Manager: | 57 Will Property Manager LLC |
| Note Date: | July 31, 2024 | | Current Occupancy (As of): | 100.0% (7/10/2024) |
| Seasoning: | 0 months | | YE 2023 Occupancy(2): | 100.0% |
| Maturity Date: | August 6, 2034 | | YE 2022 Occupancy(2): | 45.7% |
| IO Period: | 0 months | | YE 2021 Occupancy: | 43.5% |
| Loan Term (Original): | 120 months | | As-Is Appraised Value(3): | $55,100,000 |
| Amortization Term (Original): | 360 months | | As-Is Appraised Value Per SF: | $441.97 |
| Loan Amortization Type: | Amortizing Balloon | | As-Is Appraisal Valuation Date: | July 18, 2024 |
| Call Protection: | L(24),D(92),O(4) | | | |
| Lockbox Type: | Hard/Springing Cash Management | | Underwriting and Financial Information |
| Additional Debt: | None | | TTM NOI (6/30/2024)(2): | $2,725,512 |
| Additional Debt Type (Balance): | NAP | | YE 2023 NOI(2): | $577,701 |
| | | YE 2022 NOI: | $443,839 |
| Escrows and Reserves | | YE 2021 NOI: | $219,584 |
| | Initial | Monthly | Cap | | U/W Revenues: | $5,841,794 |
| Taxes | $297,809 | $99,270 | NAP | | U/W Expenses: | $2,032,590 |
| Insurance | $15,612 | $7,806 | NAP | | U/W NOI(2): | $3,809,204 |
| Replacement Reserve | $0 | $2,078 | $74,802 | | U/W NCF: | $3,597,265 |
| TI/LC Reserve | $500,000 | $15,584 | $1,500,000 | | U/W DSCR based on NOI/NCF: | 1.52x / 1.43x |
| Deferred Maintenance | $152,950 | $0 | NAP | | U/W Debt Yield based on NOI/NCF: | 12.2% / 11.5% |
| Free Rent Reserve | $15,450 | $0 | NAP | | U/W Debt Yield at Maturity based on NOI/NCF: | 13.9% / 13.2% |
| Outstanding TI/LC Reserve | $80,000 | $0 | NAP | | Cut-off Date LTV Ratio: | 56.6% |
| | | | | | LTV Ratio at Maturity: | 49.6% |
| | | | | | | | |
| Sources and Uses |
| Sources | | | | Uses | | |
| Mortgage Loan Amount | $31,200,000 | 62.2 | % | | Purchase Price(4) | $48,000,000 | 95.7 | % |
| Equity Contribution | 18,982,415 | 37.8 | | | Closing Costs | 1,120,594 | 2.2 | |
| | | | | Upfront Reserves | 1,061,821 | 2.1 | |
| | | | | | | |
| Total Sources | $50,182,415 | 100.0 | % | | Total Uses | $50,182,415 | 100.0 | % |
| (1) | In addition to the guaranty of recourse obligations made by Damien Smith and Peter Zuccarello, Gary Romaniello also signed a separate guaranty of recourse obligations for his acts and the acts of the GRA 57 Willoughby LLC borrowing entity only. |
| (2) | The increase in occupancy from YE 2022 to YE 2023 and increase in YE 2023 and TTM NOI to U/W NOI were due to a new tenant, JCCA, commencing its lease for 67,679 square feet (54.3% of net rentable area) in September 2023. |
| (3) | The As-Is Appraised Value includes $7,500,000 in present value for ICAP tax benefits. As of the Cut-off Date, the ICAP tax benefits have not yet been obtained. See “The Property” below. |
| (4) | Pursuant to an escrow holdback agreement with respect to the 57 Willoughby Property (as defined below), in connection with the origination of the 57 Willoughby Mortgage Loan (as defined below), a third-party escrow agent withheld (i) an amount equal to $1,000,000 pending the receipt of a final certificate of occupancy (“CO”) for the 57 Willoughby Property and (ii) an amount equal to $3,000,000 pending approval of a 25-year ICAP abatement. See “The Property” below. |
The Mortgage Loan. The tenth largest mortgage loan (the “57 Willoughby Mortgage Loan”) is evidenced by a promissory note in the original principal amount of $31,200,000 and secured by a first priority fee interest in a 124,670 square foot office property located in Brooklyn, New York (the “57 Willoughby Property”).
The Borrowers and Borrower Sponsors. The borrowers are 57 Will Owner LLC, ZUC 57 Will Owner LLC, PPG 57 Will Owner LLC, and GRA 57 Willoughby LLC, as tenants-in-common, with each entity being a Delaware limited liability company and single purpose entity with one independent director. The borrower sponsors and non-recourse carveout guarantors are Damien Smith and Peter Zuccarello. Additionally, Gary Romaniello signed a separate guaranty of recourse obligations limited only to his acts and the acts of the GRA 57 Willoughby LLC borrowing entity. Damien Smith is the CEO and founder of Prosper Property Group. Prosper Property Group is a commercial real estate development company that has owned and operated a cumulative 450,000 square feet of residential and
| THE INFORMATION IN THIS STRUCTURAL AND COLLATERAL TERM SHEET IS NOT COMPLETE AND MAY BE AMENDED PRIOR TO THE TIME OF SALE. THIS TERM SHEET IS NOT AN OFFER TO SELL THESE SECURITIES AND IT IS NOT A SOLICITATION OF AN OFFER TO BUY THESE SECURITIES IN ANY JURISDICTION WHERE THE OFFER OR SALE IS NOT PERMITTED. |
| | 116 | |
| Office – CBD | Loan #10 | Cut-off Date Balance: | | $31,200,000 |
| 57 Willoughby Street | 57 Willoughby | Cut-off Date LTV: | | 56.6% |
| Brooklyn, NY 11201 | | UW NCF DSCR: | | 1.43x |
| | | UW NOI Debt Yield: | | 12.2% |
mixed-use properties since its inception. Peter Zuccarello is a real estate investor that currently serves as an independent agent for P.Z. Insurance Brokerage, Inc.
The Property. The 57 Willoughby Property is a 124,670 square foot six-story office building located on a 0.38-acre site in Downtown Brooklyn, New York. The 57 Willoughby Property has 85 feet of frontage on Willoughby Street and 175 feet of frontage on Lawrence Street and features 4,170 square feet of ground floor retail space separated into two suites. Originally constructed in 1929, the 57 Willoughby Property was most recently renovated in 2022.
As of July 10, 2024, the 57 Willoughby Property was 100% occupied by five tenants. The 57 Willoughby Property previously served as the headquarters for the Helen Keller Services for the Blind and by 2017, the tenant occupied the entire premises with the exception of a vacant fifth floor suite. After Helen Keller Services for the Blind relocated its headquarters, occupancy at the 57 Willoughby Property fell to 43.5% in 2020. During this time, the previous owner of the 57 Willoughby Property invested $20.7 million in renovations that were completed in 2022 which included elevator upgrades, redesigned lobby and retail storefronts, improved infrastructure, and the implementation of a spec suite program on the top three floors. Following the renovations, the two retail suites became fully leased in 2022 and the office space became fully leased following JCCA commencing its lease in September 2023.
As of origination, the 57 Willoughby Property has a temporary certificate of occupancy (“TCO”) but has not yet received a full certificate of occupancy (“CO”) as certain outstanding fire code violations were cured but are pending the fire department’s inspection. As a result, even though the 57 Willoughby Property has been approved for a 25-year ICAP abatement, due to the lack of CO, the abatement has not yet been granted and is not yet in place. Pursuant to an escrow holdback agreement with respect to the 57 Willoughby Property, in connection with the origination of the 57 Willoughby Mortgage Loan, a third-party escrow agent withheld in (i) an amount equal to (i) $1,000,000 pending the receipt of a final CO for the 57 Willoughby Property (“PCO Holdback Reserve Funds”) and (ii) an amount equal to $3,000,000 pending approval of a 25-year ICAP tax abatement (“ICAP Holdback Reserve Funds”).
If the final CO is not obtained on or before November 13, 2025, the PCO Holdback Reserve Funds will be released by the third-party escrow agent to the lender to be held in a subaccount. Furthermore, if the final CO is not obtained on or before November 13, 2026, the lender will have the right, but not the obligation, whether or not an event of default has occurred and is continuing, to apply all or any portion of the PCO Holdback Reserve Funds towards a partial defeasance of the 57 Willoughby Mortgage Loan (together with any defeasance costs associated therewith).
If the approval for the 25-year ICAP abatement is not obtained on or before November 13, 2025, the ICAP Holdback Reserve Funds will be released by the third-party escrow agent to the lender to be held in a subaccount. Furthermore, if the ICAP is not obtained on or before November 13, 2026, the lender will have the right, but not the obligation, whether or not an event of default has occurred and is continuing, to apply all or any portion of the ICAP Holdback Reserve Funds towards a partial defeasance of the 57 Willoughby Mortgage Loan (together with any defeasance costs associated therewith).
Major Tenants.
JCCA (67,679 SF; 54.3% of NRA; 58.7% of underwritten base rent). Jewish Child Care Association of New York (d/b/a JCCA) provides healthcare services to children and their families such as foster and residential care, educational assistance, mental health services, and child maltreatment services. The company has an approximately $80 million endowment and receives approximately $27 million of annual funding from various public and private sources. JCCA recently executed a 15-year lease that commenced at the 57 Willoughby Property in September 2023 to serve as its headquarters and to accommodate growth. As such, JCCA has its third-floor space (6,183 square feet, 5.0% NRA) and its sixth-floor space (19,064 square feet, 15.3% NRA) on the market for sublease (“JCCA Sublease Posting”). JCCA has the right to terminate its lease at any point after December 31, 2025 if the tenant’s government funding is materially reduced or not renewed for any reason other than the tenant’s failure to comply with the requirements of such funding, provided the tenant gives 12-months’ notice and pays a termination fee equal to the sum of all leasing costs amortized over the initial 15-year lease at an interest rate of 7.0%. The leasing costs of JCCA’s lease totaled approximately $11.9 million. If JCCA were to terminate its lease effective January 1, 2026 (the earliest date it could terminate its lease), the termination fee would be equal to approximately $10.8 million, which fee will continue to amortize throughout the lease term if the termination option is not exercised. JCCA has two, five-year renewal options remaining.
Housing Works, Inc. (40,616 SF; 32.6% of NRA; 26.5% of underwritten base rent). Housing Works, Inc. provides housing, healthcare, meals, and counseling services to displaced and low-income individuals living with HIV / AIDS. The company was founded in 1990 and receives funding from individuals and public entities, including the NYC Department of Homeless Services which recently doubled its fiscal year 2024 budget to over $4.0 billion. Housing Works, Inc. has been a tenant at the 57 Willoughby Property since 2008 and has since signed a new 16-year lease in 2018. The Housing Works, Inc. space includes 16,300 square feet of basement space. The tenant has no renewal options remaining.
Brooklyn Autism Center (12,205 SF; 9.8% of NRA; 7.9% of underwritten base rent). Brooklyn Autism Center provides educational services to individuals ages five to 21 with autism spectrum disorder. The center generates revenue primarily through its operations as an educational institution, in addition to private grants, corporations, and individuals. Brooklyn Autism Center has been a tenant at the 57 Willoughby Property since 2013 and has since signed a new 10-year lease in 2018. The tenant has one, five-year renewal option remaining.
| THE INFORMATION IN THIS STRUCTURAL AND COLLATERAL TERM SHEET IS NOT COMPLETE AND MAY BE AMENDED PRIOR TO THE TIME OF SALE. THIS TERM SHEET IS NOT AN OFFER TO SELL THESE SECURITIES AND IT IS NOT A SOLICITATION OF AN OFFER TO BUY THESE SECURITIES IN ANY JURISDICTION WHERE THE OFFER OR SALE IS NOT PERMITTED. |
| | 117 | |
| Office – CBD | Loan #10 | Cut-off Date Balance: | | $31,200,000 |
| 57 Willoughby Street | 57 Willoughby | Cut-off Date LTV: | | 56.6% |
| Brooklyn, NY 11201 | | UW NCF DSCR: | | 1.43x |
| | | UW NOI Debt Yield: | | 12.2% |
The following table presents certain information relating to the tenancy at the 57 Willoughby Property:
Major Tenants(1)
| Tenant Name | Credit Rating (Fitch/ Moody’s/
S&P)(2) | Tenant NRSF | % of
NRSF | Annual U/W Base Rent PSF(3) | Annual
U/W Base Rent(3) | % of Total Annual U/W Base Rent | Lease
Expiration
Date | Ext. Options | Term. Option (Y/N) |
| Major Tenants | | | | | | | | |
| JCCA | NR/NR/NR | 67,679 | 54.3% | $50.17 | $3,395,303 | 58.7% | 10/31/2038 | 2, 5-year | Y(4) |
| Housing Works, Inc. | NR/NR/NR | 40,616 | 32.6% | $37.72 | $1,531,908 | 26.5% | 3/31/2035 | None | N |
| Brooklyn Autism Center | NR/NR/NR | 12,205 | 9.8% | $37.54 | $458,129 | 7.9% | 10/6/2028 | 1, 5-year | N |
| Quality Greens Kitchen | NR/NR/NR | 3,059 | 2.5% | $90.00 | $275,310 | 4.8% | 6/30/2038 | None | N |
| Hot Peppers | NR/NR/NR | 1,111 | 0.9% | $114.59 | $127,308 | 2.2% | 4/30/2033 | 1, 5-year | N |
| | 124,670 | 100.0% | $46.43 | $5,787,958 | 100.0% | | | |
| | | | | | | | | |
| Non-Major Tenants | 0 | 0.0% | $0.00 | $0 | 0.0% | | | |
| | | | | | | | | |
| Occupied Collateral Total | 124,670 | 100.0% | $46.43 | $5,787,958 | 100.0% | | | |
| | | | | | | | | |
| Vacant Space | 0 | 0.0% | | | | | | |
| | | | | | | | | |
| Collateral Total | 124,670 | 100.0% | | | | | | |
| | | | | | | | | | |
| (1) | Information obtained from the underwritten rent roll dated July 10, 2024. |
| (2) | Certain ratings are those of the parent company, whether or not the parent company guarantees the lease. |
| (3) | Annual U/W Base Rent PSF and Annual U/W Base Rent include contractual rent steps totaling $142,704 through June 2025. |
| (4) | JCCA has the right to terminate its lease at any point after December 31, 2025 if the tenant’s government funding is materially reduced or terminated for any reason other than the tenant’s failure to comply with the requirements of such funding, provided the tenant gives 12-months’ notice and pays a termination fee equal to the sum of all leasing costs amortized over the 15-year lease at an interest rate of 7.0%. The leasing costs of JCCA’s lease totaled approximately $11.9 million. If JCCA were to terminate its lease effective January 1, 2026 (the earliest date it could terminate its lease), the termination fee would be equal to approximately $10.8 million, which fee will continue to amortize throughout the lease term if the termination option is not exercised. |
The following table presents certain information relating to the lease rollover schedule at the 57 Willoughby Property:
Lease Expiration Schedule(1)(2)
Year Ending
December 31, | No. of Leases Expiring | Expiring NRSF | % of Total NRSF | Cumulative Expiring NRSF | Cumulative % of Total NRSF | Annual
U/W
Base Rent | % of Total Annual U/W Base Rent | Annual
U/W
Base Rent
PSF |
| MTM | 0 | 0 | 0.0% | 0 | 0.0% | $0 | 0.0% | $0.00 |
| 2024 | 0 | 0 | 0.0% | 0 | 0.0% | $0 | 0.0% | $0.00 |
| 2025 | 0 | 0 | 0.0% | 0 | 0.0% | $0 | 0.0% | $0.00 |
| 2026 | 0 | 0 | 0.0% | 0 | 0.0% | $0 | 0.0% | $0.00 |
| 2027 | 0 | 0 | 0.0% | 0 | 0.0% | $0 | 0.0% | $0.00 |
| 2028 | 1 | 12,205 | 9.8% | 12,205 | 9.8% | $458,129 | 7.9% | $37.54 |
| 2029 | 0 | 0 | 0.0% | 12,205 | 9.8% | $0 | 0.0% | $0.00 |
| 2030 | 0 | 0 | 0.0% | 12,205 | 9.8% | $0 | 0.0% | $0.00 |
| 2031 | 0 | 0 | 0.0% | 12,205 | 9.8% | $0 | 0.0% | $0.00 |
| 2032 | 0 | 0 | 0.0% | 12,205 | 9.8% | $0 | 0.0% | $0.00 |
| 2033 | 1 | 1,111 | 0.9% | 13,316 | 10.7% | $127,308 | 2.2% | $114.59 |
| 2034 | 0 | 0 | 0.0% | 13,316 | 10.7% | $0 | 0.0% | $0.00 |
| Thereafter | 3 | 111,354 | 89.3% | 124,670 | 100.0% | $5,202,521 | 89.9% | $46.72 |
| Vacant | 0 | 0 | 0.0% | 124,670 | 100.0% | $0 | 0.0% | $0.00 |
| Total/Weighted Average | 5 | 124,670 | 100.0% | | | $5,787,958 | 100.0% | $46.43 |
| (1) | Information obtained from the underwritten rent roll dated July 10, 2024 and includes contractual rent steps through June 2025. |
| (2) | Certain tenants may have lease termination options that are exercisable prior to the originally stated expiration date of the related lease and are not considered in the rollover schedule. |
| THE INFORMATION IN THIS STRUCTURAL AND COLLATERAL TERM SHEET IS NOT COMPLETE AND MAY BE AMENDED PRIOR TO THE TIME OF SALE. THIS TERM SHEET IS NOT AN OFFER TO SELL THESE SECURITIES AND IT IS NOT A SOLICITATION OF AN OFFER TO BUY THESE SECURITIES IN ANY JURISDICTION WHERE THE OFFER OR SALE IS NOT PERMITTED. |
| | 118 | |
| Office – CBD | Loan #10 | Cut-off Date Balance: | | $31,200,000 |
| 57 Willoughby Street | 57 Willoughby | Cut-off Date LTV: | | 56.6% |
| Brooklyn, NY 11201 | | UW NCF DSCR: | | 1.43x |
| | | UW NOI Debt Yield: | | 12.2% |
The following table presents historical occupancy percentages at the 57 Willoughby Property:
Historical Occupancy
2021(1) | 2022(1) | 2023(1)(2) | 7/10/2024(3) |
| 43.5% | 45.7% | 100.0% | 100.0% |
| (1) | Information obtained from the borrower. Represents the occupancy as of December 31 for each respective year. |
| (2) | The increase in occupancy from 2022 to 2023 was due to a new tenant (JCCA) commencing its lease for 67,679 square feet (54.3% of net rentable area) in September 2023. |
| (3) | Information obtained from the underwritten rent roll. |
Operating History and Underwritten Net Cash Flow. The following table presents certain information relating to the historical operating performance and underwritten net cash flow at the 57 Willoughby Property:
Cash Flow Analysis
| | 2021 | 2022 | 2023 | TTM
6/30/2024 | U/W | %(1) | U/W $
per SF |
| Base Rent | $1,721,082 | $2,052,201 | $2,763,166 | $4,943,169 | $5,787,958(2) | 94.2% | $46.43 |
| Other Income | 0 | 2,714 | 62,261 | 122,793 | 122,793 | 2.0 | 0.98 |
| Total Recoveries | 70,754 | 154,515 | 220,336 | 228,259 | 232,044 | 3.8 | 1.86 |
| Net Rental Income | $1,791,836 | $2,209,430 | $3,045,763 | $5,294,221 | $6,142,794 | 100.0% | $49.27 |
| (Vacancy & Credit Loss) | 0 | 0 | 0 | 0 | (301,000)(3) | (4.9) | (2.41) |
| Effective Gross Income | $1,791,836 | $2,209,430 | $3,045,763 | $5,294,221 | $5,841,794 | 95.1% | $46.86 |
| | | | | | | | |
| Real Estate Taxes | $663,767 | $882,482 | $1,184,187 | $1,199,966 | $994,340 | 17.0% | $7.98 |
| Insurance | 89,350 | 112,932 | 126,055 | 158,500 | 93,674 | 1.6 | 0.75 |
| Other Operating Expenses | 819,135 | 770,177 | 1,157,820 | 1,210,243 | 944,577 | 16.2 | 7.58 |
| Total Operating Expenses | $1,572,252 | $1,765,591 | $2,468,063 | $2,568,709 | $2,032,590 | 34.8% | $16.30 |
| | | | | | | | |
| Net Operating Income(4) | $219,584 | $443,839 | $577,701 | $2,725,512 | $3,809,204 | 65.2% | $30.55 |
| Replacement Reserves | 0 | 0 | 0 | 0 | 24,934 | 0.4 | 0.20 |
| TI/LC | 0 | 0 | 0 | 0 | 187,005 | 3.2 | 1.50 |
| Net Cash Flow | $219,584 | $443,839 | $577,701 | $2,725,512 | $3,597,265 | 61.6% | $28.85 |
| | | | | | | | |
| NOI DSCR | 0.09x | 0.18x | 0.23x | 1.08x | 1.52x | | |
| NCF DSCR | 0.09x | 0.18x | 0.23x | 1.08x | 1.43x | | |
| NOI Debt Yield | 0.7% | 1.4% | 1.9% | 8.7% | 12.2% | | |
| NCF Debt Yield | 0.7% | 1.4% | 1.9% | 8.7% | 11.5% | | |
| (1) | Represents (i) percent of Net Rental Income for all revenue fields and (ii) percent of Effective Gross Income for all other fields. |
| (2) | The U/W Base Rent includes contractual rent steps totaling $142,704 through June 2025. |
| (3) | The underwritten economic vacancy is 5.0%. The 57 Willoughby Property was 100.0% leased as of July 10, 2024. |
| (4) | The increase in 2023 and TTM NOI to U/W NOI is due to a new tenant (JCCA) signing a lease for 67,679 square feet (54.3% of net rentable area) in September 2023. |
Appraisal. The appraiser concluded to an “as-is” appraised value for the 57 Willoughby Property of $55,100,000 as of July 18, 2024. The appraiser’s valuation assumes that the 25-year ICAP abatement is granted for the 57 Willoughby Property and is applicable retrospectively beginning in the 2023/2024 tax year.
Environmental Matters. According to a Phase I environmental assessment dated July 15, 2024, there was no evidence of any recognized environmental conditions at the 57 Willoughby Property.
Market Overview and Competition. The 57 Willoughby Property is located on Willoughby Street in downtown Brooklyn, New York. The 57 Willoughby Property is located adjacent to the Jay St-MetroTech subway station, providing access to the A, C, F, and R subway lines. Additionally, the 57 Willoughby Property is located adjacent to Brooklyn Commons, a 16-acre urban-academic research park with 17,000 employees, 40,000 university students, and 1,300 companies. The downtown Brooklyn neighborhood has seen a significant amount of new development in recent years, with the emergence of the Brooklyn Tech Triangle and the construction of luxury high rise buildings throughout the neighborhood. According to the appraisal, the 2023 estimated population within the 11201 zip code was 71,969 and the 2023 estimated median household income within the 11021 zip code was approximately $143,345.
| THE INFORMATION IN THIS STRUCTURAL AND COLLATERAL TERM SHEET IS NOT COMPLETE AND MAY BE AMENDED PRIOR TO THE TIME OF SALE. THIS TERM SHEET IS NOT AN OFFER TO SELL THESE SECURITIES AND IT IS NOT A SOLICITATION OF AN OFFER TO BUY THESE SECURITIES IN ANY JURISDICTION WHERE THE OFFER OR SALE IS NOT PERMITTED. |
| | 119 | |
| Office – CBD | Loan #10 | Cut-off Date Balance: | | $31,200,000 |
| 57 Willoughby Street | 57 Willoughby | Cut-off Date LTV: | | 56.6% |
| Brooklyn, NY 11201 | | UW NCF DSCR: | | 1.43x |
| | | UW NOI Debt Yield: | | 12.2% |
According to the appraisal, the 57 Willoughby Property is situated in the Downtown Brooklyn office submarket within the greater Brooklyn Office market. As of the first quarter of 2024, the submarket reported a total inventory of approximately 24.69 million square feet within 190 buildings with an 18.9% vacancy rate and an average rent of $40.09 per square foot. The appraiser concluded a market rent for the 57 Willoughby Property of $55.00 per square foot for office space, $40.00 per square foot for office space with storage, and $115.00 for retail space.
The following table presents certain information relating to the appraiser’s market rent conclusions for the 57 Willoughby Property:
Market Rent Summary(1)
| | Office | Office with Storage | Retail |
| Market Rent (PSF) | $55.00 | $40.00 | $115.00 |
| Lease Term (Years) | 10 | 10 | 7 |
| Lease Type (Reimbursements) | Modified Gross | Modified Gross | Modified Gross |
| Rent Increase Projection | 3.0%/year | 3.0%/year | 3.0%/year |
| Tenant Improvements (New / Renewal) | $65.00 / $30.00 | $40.00 / $20.00 | $40.00 / $20.00 |
| Leasing Commissions (New / Renewal) | 5.0% / 2.5% | 5.0% / 2.5% | 5.0% / 2.5% |
| Free Rent Months (New / Renewal) | 9 / 3 | 9 / 3 | 6 / 3 |
| (1) | Information obtained from the appraisal. |
The table below presents certain information relating to comparable office sales pertaining to the 57 Willoughby Property, as identified by the appraiser:
Comparable Office Sales(1)
Property Name/Location | Year Built | Rentable Area (SF) | Occupancy | Sale Date | Sale Price(3) | Sale Price (PSF)(3) | OAR |
57 Willoughby (Subject) 57 Willoughby Street Brooklyn, NY | 1929 | 124,670(2) | 100%(2) | | | | |
Paragon Oil Building 21-00 49th Avenue Long Island City, NY | 1916 | 127,915 | 0% | Jun-23 | $64,269,306 | $502 | NAV |
Cornerstone Fresh Meadows 159-05 Union Turnpike Fresh Meadows, NY | 1960 | 79,800 | 100% | Feb-23 | $44,000,000 | $551 | 6.4% |
Packard Motor Building 32-02 Queens Boulevard Long Island City, NY | 1931 | 279,849 | 38% | Jul-22 | $111,993,021 | $400 | 5.1% |
Mixed-Use (Office/Retail) Building 2004 McDonald Avenue Brooklyn, NY | 1931 | 24,300 | 100% | Sep-21 | $8,600,000 | $354 | 5.5% |
345 Seventh Avenue 345 Seventh Avenue New York, NY | 1928 | 219,246 | 67% | Jun-21 | $107,000,000 | $488 | 2.4% |
One Whitehall Street 1 Whitehall Street New York, NY | 1962 | 366,209 | 100% | Jul-19 | $189,000,000 | $516 | 4.0% |
| (1) | Information obtained from the appraisal unless otherwise stated. |
| (2) | Information obtained from the underwritten rent roll dated July 10, 2024. |
| (3) | Sale Price and Sale Price (PSF) adjusted for cash equivalency, lease-up and/or deferred maintenance (where applicable). |
| THE INFORMATION IN THIS STRUCTURAL AND COLLATERAL TERM SHEET IS NOT COMPLETE AND MAY BE AMENDED PRIOR TO THE TIME OF SALE. THIS TERM SHEET IS NOT AN OFFER TO SELL THESE SECURITIES AND IT IS NOT A SOLICITATION OF AN OFFER TO BUY THESE SECURITIES IN ANY JURISDICTION WHERE THE OFFER OR SALE IS NOT PERMITTED. |
| | 120 | |
| Office – CBD | Loan #10 | Cut-off Date Balance: | | $31,200,000 |
| 57 Willoughby Street | 57 Willoughby | Cut-off Date LTV: | | 56.6% |
| Brooklyn, NY 11201 | | UW NCF DSCR: | | 1.43x |
| | | UW NOI Debt Yield: | | 12.2% |
The following table presents certain information relating to comparable office lease pertaining to the 57 Willoughby Property, as identified by the appraiser:
Comparable Office Leases(1)
| Property Name/Location | Tenant | Tenant Size (SF) | Lease Start Date | Lease Term | Annual Base Rent PSF | Lease Type |
57 Willoughby (Subject) Brooklyn, NY | JCCA | 67,679 | 3Q2023 | 15.0 Yrs. | $50.17 | Modified Gross |
1 Willoughby Square Brooklyn, NY | Architecture Research Office | 9,876 | 4Q2022 | 11.2 Yrs. | $60.00 | Modified Gross |
32 Court Street Brooklyn, NY | Neighborhood Psychiatry Associates of Manhattan | 2,100 | 1Q2024 | 5.2 Yrs. | $52.00 | Modified Gross |
16 Court Street Brooklyn, NY | Sasaki Associates | 9,312 | 1Q2023 | 10.6 Yrs. | $57.00 | Modified Gross |
25 Kent Avenue Brooklyn, NY | Amazon Music | 40,000 | 3Q2020 | 10.0 Yrs. | $81.00 | Modified Gross |
75 North 7th Street Brooklyn, NY | Le Labo North America | 15,500 | 4Q2021 | 6.5 Yrs. | $69.00 | Modified Gross |
55 Water Street Brooklyn, NY | Wasserman Music, LLC | 21,706 | 1Q2022 | 8.8 Yrs. | $52.00 | Modified Gross |
63 Flushing Ave (Bldg. 77) Brooklyn, NY | Huge | 70,925 | 3Q2022 | 11.9 Yrs. | $54.00 | Modified Gross |
49 South 2nd Street Brooklyn, NY | Vice Media | 23,500 | 2Q2022 | 4.0 Yrs. | $77.00 | Modified Gross |
285 Kent Avenue Brooklyn, NY | Vice Media | 50,300 | 2Q2022 | 4.0 Yrs. | $82.36 | Modified Gross |
| (1) | Information obtained from the appraisal, except for the 57 Willoughby Property, which information was obtained from the underwritten rent roll date July 10, 2024. |
Escrows.
Real Estate Taxes – The 57 Willoughby Mortgage Loan documents require an upfront deposit of $297,809. On a monthly basis, the borrower is required to deposit into a property tax reserve an amount equal to 1/12th of the property taxes the lender reasonably estimates will be payable during the next ensuing 12 months initially estimated to be approximately $99,270.
Insurance – The 57 Willoughby Mortgage Loan documents require an upfront deposit of approximately $15,612. On a monthly basis, the borrower is required to deposit into an insurance reserve an amount equal to 1/12th of the insurance premiums that the lender reasonably estimates will be payable during the next ensuing 12 months initially estimated to be approximately $7,806.
Replacement Reserve – The 57 Willoughby Mortgage Loan documents require an ongoing monthly replacement reserve deposit of approximately $2,078, subject to a cap of approximately $74,802.
TI/LC Reserve – The 57 Willoughby Mortgage Loan documents require an upfront deposit of $500,000. The borrower is required to deposit $15,584 monthly, subject to a cap of $1,500,000 (excluding lease termination fees).
Outstanding TI/LC Reserve – The 57 Willoughby Mortgage Loan documents require an upfront deposit of $80,000 for outstanding tenant improvement expenses.
Deferred Maintenance – The 57 Willoughby Mortgage Loan documents require an upfront deposit of $152,950 for deferred maintenance.
Free Rent Reserve – The 57 Willoughby Mortgage Loan documents require an upfront deposit of $15,450 for free rent.
Lockbox and Cash Management. The 57 Willoughby Mortgage Loan documents require a hard lockbox and springing cash management. The borrower is required at all times to cause tenants at the 57 Willoughby Property to pay all rent and other sums due under their respective leases directly into a lender-controlled lockbox account. Additionally, all revenues and other monies received by the borrower or related property manager are required to be deposited into the lockbox account within two business days upon receipt. After the occurrence and during the continuance of a Cash Management Period (as defined below), all funds are required to be swept each business day into the cash management account controlled by the lender and all funds on deposit in the cash management account after payment of debt service, required reserves and budgeted operating expenses are required to be reserved as additional security for the 57 Willoughby Mortgage Loan.
| THE INFORMATION IN THIS STRUCTURAL AND COLLATERAL TERM SHEET IS NOT COMPLETE AND MAY BE AMENDED PRIOR TO THE TIME OF SALE. THIS TERM SHEET IS NOT AN OFFER TO SELL THESE SECURITIES AND IT IS NOT A SOLICITATION OF AN OFFER TO BUY THESE SECURITIES IN ANY JURISDICTION WHERE THE OFFER OR SALE IS NOT PERMITTED. |
| | 121 | |
| Office – CBD | Loan #10 | Cut-off Date Balance: | | $31,200,000 |
| 57 Willoughby Street | 57 Willoughby | Cut-off Date LTV: | | 56.6% |
| Brooklyn, NY 11201 | | UW NCF DSCR: | | 1.43x |
| | | UW NOI Debt Yield: | | 12.2% |
A “Cash Management Period” means a period which will commence upon the occurrence of any of the following:
| (i) | the stated maturity date, |
| (ii) | an event of default and continuance thereof, or |
| (iii) | if the debt service coverage ratio is less than 1.20x (a “DSCR Cash Management Period”) or |
| (iv) | the commencement of a Lease Sweep Period (as defined below); |
and will end if:
(1) the 57 Willoughby Mortgage Loan has been repaid in full or (2) the stated maturity date has not occurred and
(A) with respect to the matters described in clause (ii) above, an event of default is no longer continuing and no other event of default has occurred and is continuing, or
(B) with respect to the matter described in clause (iii) above, the lender has determined in its sole but good faith discretion that the 57 Willoughby Property has achieved a debt service coverage ratio of at least 1.25x for two consecutive quarters, or
(C) with respect to the matter described in clause (iv) above, such Lease Sweep Period has ended.
A “Lease Sweep Period” will commence upon the occurrence of any of the following:
(i) the earlier of (a) the date that is 12 months prior to the end of the term of any Lease Sweep Lease (as defined below) (including any renewal terms); or (b) the date the applicable Lease Sweep Tenant (as defined below) actually gives such notice (whether actual or constructive) of its intention not to renew or extend; or
(ii) the date required under a Lease Sweep Lease by which the applicable Lease Sweep Tenant is required to give notice of its exercise of a renewal option thereunder (and such renewal has not been so exercised) or the date that any Lease Sweep Tenant gives written notice of its intention not to renew or extend its Lease Sweep Lease; or
(iii) any Lease Sweep Lease (or any material portion thereof) is surrendered or at least 20% of the demised premises thereunder is otherwise contractually contracted (other than the portion of JCCA’s premises subject to the JCCA Sublease Posting), cancelled or terminated prior to its then current expiration date or any Lease Sweep Tenant gives written notice of its intention to terminate, surrender, cancel or materially contract its Lease Sweep Lease (or any material portion thereof); or
(iv) any Lease Sweep Tenant discontinues its business in more than twenty percent (20%) of its premises (i.e., “goes dark”) or gives written notice that it intends to do the same (other than the portion of JCCA’s premises subject to the JCCA Sublease Posting); or
(v) the occurrence and continuance (beyond any applicable notice and cure periods) of a monetary or material non-monetary default under any Lease Sweep Lease by the applicable Lease Sweep Tenant thereunder; or
(vi) the occurrence of an insolvency proceeding with respect to any Lease Sweep Tenant; or
(vii) any Lease Sweep Tenant subleases any of its premises or puts any of its premises on the market for sublease (other than the portion of JCCA’s premises subject to the JCCA Sublease Posting).
A “Lease Sweep Period” will end upon the occurrence of any of the following:
(1) with respect to the matters described in clauses (i), (ii), (iii), (iv) or (vii) above, upon the earlier of (a) the date on which the subject Lease Sweep Tenant irrevocably exercises its renewal or extension option (or otherwise enters into an extension agreement with the 57 Willoughby borrower and acceptable to the lender in its good faith discretion) with respect to all of the space demised under its Lease Sweep Lease, and in the lender’s judgment, sufficient funds have been accumulated in the applicable reserve account (during the continuance of the subject Lease Sweep Period) to pay for all anticipated approved leasing expenses for such Lease Sweep Lease and any other anticipated expenses in connection with such renewal or extension, or (b) the date on which all of the space demised under the subject Lease Sweep Lease (or portion thereof) that gave rise to the subject Lease Sweep Period has been fully leased pursuant to a replacement lease(s) reasonably approved by the lender, not to be unreasonably withheld, conditioned or delayed, and all approved leasing expenses (and any other expenses in connection with the re-tenanting of such space) have been paid in full or reserved in the applicable reserve account;
(2) with respect to the matters described in clause (v) above, if the subject Lease Sweep Tenant default has been cured, and no other Lease Sweep Tenant default has occurred for a period of six consecutive months following such cure; or
(3) with respect to the matters described in clause (vi) above, if the applicable insolvency proceeding with respect to the Lease Sweep Tenant has terminated and the applicable Lease Sweep Lease has been affirmed, assumed or assigned in a manner satisfactory to the lender in its good faith discretion.
| THE INFORMATION IN THIS STRUCTURAL AND COLLATERAL TERM SHEET IS NOT COMPLETE AND MAY BE AMENDED PRIOR TO THE TIME OF SALE. THIS TERM SHEET IS NOT AN OFFER TO SELL THESE SECURITIES AND IT IS NOT A SOLICITATION OF AN OFFER TO BUY THESE SECURITIES IN ANY JURISDICTION WHERE THE OFFER OR SALE IS NOT PERMITTED. |
| | 122 | |
| Office – CBD | Loan #10 | Cut-off Date Balance: | | $31,200,000 |
| 57 Willoughby Street | 57 Willoughby | Cut-off Date LTV: | | 56.6% |
| Brooklyn, NY 11201 | | UW NCF DSCR: | | 1.43x |
| | | UW NOI Debt Yield: | | 12.2% |
“Lease Sweep Lease” means the JCCA lease, the Housing Works lease, and any other lease (leased by such tenant and/or its affiliates) which covers 12,500 or more rentable square feet of improvements at the 57 Willoughby Property.
“Lease Sweep Tenant” means any tenant under a Lease Sweep Lease, or under one or more Leases (leased by such tenant and/or its affiliates), which when taken together cover in the aggregate 12,500 or more rentable square feet of the 57 Willoughby Property.
Property Management. The 57 Willoughby Property is managed by 57 Will Property Manager LLC, an affiliate of the borrower.
Partial Release. Not permitted.
Real Estate Substitution. Not permitted.
Subordinate and Mezzanine Indebtedness. None.
Ground Lease. None.
Terrorism Insurance. The 57 Willoughby Mortgage Loan documents require that the “all risk” insurance policy required to be maintained by the borrower provides coverage for terrorism in an amount equal to the full replacement cost of the 57 Willoughby Property, as well as business interruption insurance covering no less than the 18-month period following the occurrence of a casualty event, together with a 6-month extended period of indemnity (provided that such coverage is available).
| THE INFORMATION IN THIS STRUCTURAL AND COLLATERAL TERM SHEET IS NOT COMPLETE AND MAY BE AMENDED PRIOR TO THE TIME OF SALE. THIS TERM SHEET IS NOT AN OFFER TO SELL THESE SECURITIES AND IT IS NOT A SOLICITATION OF AN OFFER TO BUY THESE SECURITIES IN ANY JURISDICTION WHERE THE OFFER OR SALE IS NOT PERMITTED. |
| | 123 | |
| No. 11 – Brooklyn Renaissance Plaza |
| |
| Mortgage Loan Information | | Mortgaged Property Information |
| Mortgage Loan Seller: | Argentic Real Estate Finance 2 LLC | | Single Asset/Portfolio: | Single Asset |
Credit Assessment (Fitch/KBRA/Moody’s): | NR/NR/NR | | Property Type – Subtype: | Office – CBD |
| Original Principal Balance: | $25,200,000 | | Location: | Brooklyn, NY |
| Cut-off Date Balance: | $25,200,000 | | Size: | 139,216 SF |
| % of Initial Pool Balance: | 3.5% | | Cut-off Date Balance Per SF: | $181.01 |
| Loan Purpose: | Refinance | | Maturity Date Balance Per SF: | $156.93 |
| Borrower Sponsor: | Joshua L. Muss | | Year Built/Renovated: | 1977/2001 |
| Guarantor: | Joshua L. Muss | | Title Vesting: | Leasehold |
| Mortgage Rate: | 6.7210% | | Property Manager: | Renaissance Property Managers LLC |
| Note Date: | July 30, 2024 | | Current Occupancy (As of): | 100.0% (5/28/2024) |
| Seasoning: | 0 months | | YE 2023 Occupancy(2): | 100.0% |
| Maturity Date: | August 6, 2034 | | YE 2022 Occupancy(2): | 88.2% |
| IO Period: | 0 months | | YE 2021 Occupancy: | 88.2% |
| Loan Term (Original): | 120 months | | As-Is Appraised Value: | $41,900,000 |
| Amortization Term (Original): | 360 months | | As-Is Appraised Value Per SF: | $300.97 |
| Loan Amortization Type: | Amortizing Balloon | | As-Is Appraisal Valuation Date: | April 25, 2024 |
| Call Protection: | L(24),D(92),O(4) | | | |
| Lockbox Type: | Hard/Springing Cash Management | | Underwriting and Financial Information |
| Additional Debt: | None | | TTM NOI (3/31/2024)(2): | $1,811,415 |
| Additional Debt Type (Balance): | NAP | | YE 2023 NOI: | $1,717,839 |
| | | YE 2022 NOI: | $1,889,150 |
| Escrows and Reserves | | YE 2021 NOI: | $1,975,933 |
| | Initial | Monthly | Cap | | U/W Revenues: | $7,560,037 |
| Taxes | $394,360 | $157,744 | NAP | | U/W Expenses: | $4,742,286 |
| Insurance | $0 | Springing(1) | NAP | | U/W NOI(2): | $2,817,751 |
| Replacement Reserve | $0 | $4,873 | NAP | | U/W NCF: | $2,620,064 |
| TI/LC Reserve | $1,500,000 | $11,601 | NAP | | U/W DSCR based on NOI/NCF: | 1.44x / 1.34x |
| Ground Rent Reserve | $0 | $50,246 | NAP | | U/W Debt Yield based on NOI/NCF: | 11.2% / 10.4% |
| | | | | | U/W Debt Yield at Maturity based on NOI/NCF: | 12.9% / 12.0% |
| | | | | | Cut-off Date LTV Ratio: | 60.1% |
| | | | | | LTV Ratio at Maturity: | 52.1% |
| | | | | | | | |
| Sources and Uses |
| Sources | | | | Uses | | |
| Mortgage Loan Amount | $25,200,000 | 86.5 | % | | Loan Payoff | $25,482,579 | 87.5 | % |
| Equity Contribution | 3,931,075 | 13.5 | | | Upfront Reserves | 1,894,360 | 6.5 | |
| | | | | Closing Costs(3) | 1,754,137 | 6.0 | |
| | | | | | | |
| Total Sources | $29,131,075 | 100.0 | % | | Total Uses | $29,131,075 | 100.0 | % |
| (1) | The borrower is required to deposit 1/12th of the annual insurance premium monthly if an acceptable blanket policy is no longer in place. The borrower is required to deliver evidence of acceptable renewals and timely-paid insurance premiums. |
| (2) | The increase in YE 2023 Occupancy from YE 2022 Occupancy and the increase in U/W NOI from TTM NOI are primarily due to the City of New York (KCDA) signing a new lease in December 2023 at an annual base rent of $970,403. |
| (3) | Closing costs include an approximately $1.0 million origination fee. |
The Mortgage Loan. The eleventh largest mortgage loan (the “Brooklyn Renaissance Plaza Mortgage Loan”) is evidenced by a promissory note in the original principal amount of $25,200,000 and secured by a leasehold interest in a 139,216 square foot office condominium located in Brooklyn, New York (the “Brooklyn Renaissance Plaza Property”).
The Borrower and Borrower Sponsor. The borrower is Brooklyn Renaissance Office/Retail LLC, a New York limited liability company and single purpose entity with one independent director. Legal counsel to the borrower delivered a non-consolidation opinion in connection with the origination of the Brooklyn Renaissance Plaza Mortgage Loan. The borrower sponsor and non-recourse carveout guarantor is Joshua L. Muss. Joshua L. Muss is a principal at Muss Development, LLC. Muss Development, LLC is a full-service real estate development and investment company headquartered in Forest Hills, New York. Muss Development, LLC has developed more than 15 million square feet of commercial, residential, industrial, and retail space throughout the five boroughs of New York City and currently owns nine office properties totaling 2.1 million square feet (excluding the Brooklyn Renaissance Plaza Property) in New York City.
| THE INFORMATION IN THIS STRUCTURAL AND COLLATERAL TERM SHEET IS NOT COMPLETE AND MAY BE AMENDED PRIOR TO THE TIME OF SALE. THIS TERM SHEET IS NOT AN OFFER TO SELL THESE SECURITIES AND IT IS NOT A SOLICITATION OF AN OFFER TO BUY THESE SECURITIES IN ANY JURISDICTION WHERE THE OFFER OR SALE IS NOT PERMITTED. |
| | 124 | |
| Office – CBD | Loan #11 | Cut-off Date Balance: | | $25,200,000 |
| 335 Adams Street | Brooklyn Renaissance Plaza | Cut-off Date LTV: | | 60.1% |
| Brooklyn, NY 11201 | | UW NCF DSCR: | | 1.34x |
| | | UW NOI Debt Yield: | | 11.2% |
The Property. The Brooklyn Renaissance Plaza Property is a 139,216 square foot office condominium which is part of a larger, 32-story commercial building known as Renaissance Plaza in Downtown Brooklyn, New York. Located on a 2.93-acre site, the Brooklyn Renaissance Plaza Property was constructed in 1977 and most recently renovated in 2001. The Brooklyn Renaissance Plaza Property is one of five condominiums across approximately 1.4 million square feet in aggregate at Renaissance Plaza. The four non-collateral condominiums include an office condominium, an office/retail condominium, a hotel condominium, and a parking garage condominium. The Brooklyn Renaissance Plaza Property consists of 53,877 square feet of office space on floors four through seven, 51,508 square feet of office space on floor 23, 14,270 square feet of ground floor retail space, and 19,561 square feet of storage space. Since acquiring the Brooklyn Renaissance Plaza Property in 1998, the borrower sponsor has invested approximately $23 million for capital expenditures, including a $2.2 million renovation of the lobby in 2019.
As of May 28, 2024, the Brooklyn Renaissance Plaza Property was 100% occupied by 12 tenants. Between 2016 and 2023, occupancy at the Brooklyn Renaissance Plaza Property averaged approximately 95%. Approximately 67% of the net rentable area is currently occupied by U.S. government sponsored tenants. The two largest tenants, NYC Employees’ Retirement System and New York City Department of Ed. have occupied the Brooklyn Renaissance Plaza Property since 2000.
The Brooklyn Renaissance Plaza Property is subject to a ground lease that expires in June 2086. See “Ground Lease” below.
Major Tenants.
NYC Employees’ Retirement System (“NYCERS”) (51,508 SF; 37.0% of NRA; 42.5% of underwritten base rent). NYCERS administers pension benefits to its members, retirees, and beneficiaries. NYCERS was founded in 1920 and currently has over 350,000 active members and retirees. NYCERS has been a tenant at the Brooklyn Renaissance Plaza Property since 2000, when it signed a 19-year 3-month lease. In October 2019, the tenant exercised its first renewal option which extended the lease expiration to April 2035. NYCERS has one, five-year renewal option remaining, provided, the tenant must be in occupancy of at least two full floors of the building to exercise its renewal option.
New York City Department of Ed. (22,486 SF; 16.2% of NRA; 18.8% of underwritten base rent). New York City Department of Ed. manages New York City’s public school system. The department provides primary and secondary education to over one million students in approximately 1,870 schools. New York City Department of Ed. has been a tenant at the Brooklyn Renaissance Plaza Property since 2000 when it signed a 15-year lease. In December 2015, the tenant exercised its first renewal option which extended the lease expiration to October 2030. The tenant has the ongoing right to terminate its lease at any time with at least 90 days written notice. The tenant does not have any renewal options remaining.
City of New York (KCDA) (17,999 SF; 12.9% of NRA; 18.3% of underwritten base rent). City of New York (KCDA) is the district attorney’s office of Kings County, New York City. In addition to the 17,999 square feet the tenant leases at the Brooklyn Renaissance Plaza Property, the tenant also occupies over 400,000 square feet throughout the other non-collateral condominiums of the Brooklyn Renaissance. City of New York (KCDA) has been a tenant at the Brooklyn Renaissance Plaza Property since December 2023, when it signed an 80-month lease. The tenant does not have any renewal options.
| THE INFORMATION IN THIS STRUCTURAL AND COLLATERAL TERM SHEET IS NOT COMPLETE AND MAY BE AMENDED PRIOR TO THE TIME OF SALE. THIS TERM SHEET IS NOT AN OFFER TO SELL THESE SECURITIES AND IT IS NOT A SOLICITATION OF AN OFFER TO BUY THESE SECURITIES IN ANY JURISDICTION WHERE THE OFFER OR SALE IS NOT PERMITTED. |
| | 125 | |
| Office – CBD | Loan #11 | Cut-off Date Balance: | | $25,200,000 |
| 335 Adams Street | Brooklyn Renaissance Plaza | Cut-off Date LTV: | | 60.1% |
| Brooklyn, NY 11201 | | UW NCF DSCR: | | 1.34x |
| | | UW NOI Debt Yield: | | 11.2% |
The following table presents certain information relating to the largest tenants by underwritten base rent at the Brooklyn Renaissance Plaza Property:
Major Tenants(1)
| Tenant Name | Credit Rating (Fitch/ Moody’s/
S&P)(2) | Tenant NRSF | % of
NRSF | Annual U/W Base Rent PSF(3) | Annual
U/W Base Rent(3) | % of Total Annual U/W Base Rent | Lease
Expiration
Date | Ext. Options | Term. Option (Y/N) |
| Major Tenants | | | | | | | | |
| NYC Employees' Retirement System | AA/Aa2/AA | 51,508 | 37.0% | $43.69 | $2,250,420 | 42.5% | 4/30/2035 | 1, 5-year | N |
| New York City Department of Ed. | AA/Aa2/AA | 22,486 | 16.2% | $44.19 | $993,624 | 18.8% | 10/31/2030 | None | Y(4) |
| City of New York (KCDA) | AA/Aa2/AA | 17,999 | 12.9% | $53.91 | $970,403 | 18.3% | 8/31/2030 | None | N |
| Municipal Credit Union | NR/NR/NR | 11,188 | 8.0% | $42.74 | $478,200 | 9.0% | 7/31/2026 | None | N |
| Eyecrafters LLC | NR/NR/NR | 1,566 | 1.1% | $207.20 | $324,475 | 6.1% | 8/31/2029 | None | N |
| | 104,747 | 75.2% | $47.90 | $5,017,123 | 94.8% | | | |
| | | | | | | | | |
| Non-Major Tenants | 34,469 | 24.8% | $7.98 | $275,208 | 5.2% | | | |
| | | | | | | | | |
| Occupied Collateral Total | 139,216 | 100.0% | $38.02 | $5,292,331 | 100.0% | | | |
| | | | | | | | | |
| Vacant Space | 0 | 0.0% | | | | | | |
| | | | | | | | | |
| Collateral Total | 139,216 | 100.0% | | | | | | |
| | | | | | | | | | |
| (1) | Information obtained from the underwritten rent roll dated May 28, 2024. |
| (2) | Certain ratings are those of the parent company, whether or not the parent company guarantees the lease. |
| (3) | Annual U/W Base Rent PSF and Annual U/W Base Rent include contractual rent steps totaling $36,156 through April 2025. |
| (4) | New York City Department of Ed. has the right to terminate its lease at any time with at least 90 days written notice. |
The following table presents certain information relating to the lease rollover schedule at the Brooklyn Renaissance Plaza Property:
Lease Expiration Schedule(1)(2)
Year Ending
December 31, | No. of Leases Expiring | Expiring NRSF | % of Total NRSF | Cumulative Expiring NRSF | Cumulative % of Total NRSF | Annual
U/W
Base Rent | % of Total Annual U/W Base Rent | Annual
U/W
Base Rent
PSF |
| MTM | 1 | 13,392 | 9.6% | 13,392 | 9.6% | $0 | 0.0% | $0.00 |
| 2024 | 1 | 720 | 0.5% | 14,112 | 10.1% | $70,318 | 1.3% | $97.66 |
| 2025 | 0 | 0 | 0.0% | 14112 | 10.1% | $0 | 0.0% | $0.00 |
| 2026 | 2 | 17,411 | 12.5% | 31523 | 22.6% | $597,933 | 11.3% | $34.34 |
| 2027 | 0 | 0 | 0.0% | 31523 | 22.6% | $0 | 0.0% | $0.00 |
| 2028 | 2 | 13,398 | 9.6% | 44,921 | 32.3% | $34,791 | 0.7% | $2.60 |
| 2029 | 3 | 2,302 | 1.7% | 47223 | 33.9% | $374,841 | 7.1% | $162.83 |
| 2030 | 2 | 40,485 | 29.1% | 87708 | 63.0% | $1,964,027 | 37.1% | $48.51 |
| 2031 | 0 | 0 | 0.0% | 87708 | 63.0% | $0 | 0.0% | $0.00 |
| 2032 | 0 | 0 | 0.0% | 87708 | 63.0% | $0 | 0.0% | $0.00 |
| 2033 | 0 | 0 | 0.0% | 87,708 | 63.0% | $0 | 0.0% | $0.00 |
| 2034 | 0 | 0 | 0.0% | 87,708 | 63.0% | $0 | 0.0% | $0.00 |
| Thereafter | 1 | 51,508 | 37.0% | 139,216 | 100.0% | $2,250,420 | 42.5% | $43.69 |
| Vacant | 0 | 0 | 0.0% | 139,216 | 100.0% | $0 | 0.0% | $0.00 |
| Total/Weighted Average | 12 | 139,216 | 100.0% | | | $5,292,331 | 100.0% | $38.02 |
| (1) | Information obtained from the underwritten rent roll dated May 28, 2024 and includes contractual rent steps through April 2025. |
| (2) | Certain tenants may have lease termination options that are exercisable prior to the originally stated expiration date of the related lease and are not considered in the rollover schedule. |
| THE INFORMATION IN THIS STRUCTURAL AND COLLATERAL TERM SHEET IS NOT COMPLETE AND MAY BE AMENDED PRIOR TO THE TIME OF SALE. THIS TERM SHEET IS NOT AN OFFER TO SELL THESE SECURITIES AND IT IS NOT A SOLICITATION OF AN OFFER TO BUY THESE SECURITIES IN ANY JURISDICTION WHERE THE OFFER OR SALE IS NOT PERMITTED. |
| | 126 | |
| Office – CBD | Loan #11 | Cut-off Date Balance: | | $25,200,000 |
| 335 Adams Street | Brooklyn Renaissance Plaza | Cut-off Date LTV: | | 60.1% |
| Brooklyn, NY 11201 | | UW NCF DSCR: | | 1.34x |
| | | UW NOI Debt Yield: | | 11.2% |
The following table presents historical occupancy percentages at the Brooklyn Renaissance Plaza Property:
Historical Occupancy
2021(1) | 2022(1)(2) | 2023(1)(2) | 5/28/2024(3) |
| 88.2% | 88.2% | 100.0% | 100.0% |
| (1) | Information obtained from the borrower. Represents the occupancy as of December 31 for each respective year. |
| (2) | The increase in occupancy from 2022 to 2023 is primarily due to the City of New York (KCDA) signing a new lease in December 2023 at an annual base rent of $970,403. |
| (3) | Information obtained from the underwritten rent roll. |
Operating History and Underwritten Net Cash Flow. The following table presents certain information relating to the historical operating performance and underwritten net cash flow at the Brooklyn Renaissance Plaza Property:
Cash Flow Analysis
| | 2021 | 2022 | 2023 | TTM
3/31/2024 | U/W | %(1) | U/W $
per SF |
| Base Rent | $3,928,500 | $3,944,717 | $4,341,163 | $4,540,587 | $5,291,788(2) | 67.4% | $38.01 |
| Other Income | 0 | 0 | 0 | 0 | 681,000 | 8.7 | 4.89 |
| Total Recoveries | 1,373,662 | 1,615,794 | 1,759,590 | 1,869,337 | 1,882,172 | 24.0 | 13.52 |
| Net Rental Income | $5,302,162 | $5,560,511 | $6,100,753 | $6,409,924 | $7,854,960 | 100.0% | $56.42 |
| (Vacancy & Credit Loss) | 0 | 0 | 0 | 0 | (294,923) | (3.8) | (2.12) |
| Effective Gross Income | $5,302,162 | $5,560,511 | $6,100,753 | $6,409,924 | $7,560,037 | 96.2% | $54.30 |
| | | | | | | | |
| Real Estate Taxes | $1,445,848 | $1,586,864 | $1,720,979 | $1,744,140 | $1,883,062 | 24.9% | $13.53 |
| Insurance | 65,071 | 70,178 | 78,361 | 78,361 | 98,329 | 1.3 | 0.71 |
| Other Operating Expenses | 1,815,310 | 2,014,319 | 2,583,575 | 2,776,009 | 2,760,895 | 36.5 | 19.83 |
| Total Operating Expenses | $3,326,229 | $3,671,361 | $4,382,914 | $4,598,509 | $4,742,286 | 62.7% | $34.06 |
| | | | | | | | |
| Net Operating Income(3) | $1,975,933 | $1,889,150 | $1,717,839 | $1,811,415 | $2,817,751 | 37.3% | $20.24 |
| Replacement Reserves | 0 | 0 | 0 | 0 | 58,471 | 0.8 | 0.42 |
| TI/LC | 0 | 0 | 0 | 0 | 139,216 | 1.8 | 1.00 |
| Net Cash Flow | $1,975,933 | $1,889,150 | $1,717,839 | $1,811,415 | $2,620,064 | 34.7% | $18.82 |
| | | | | | | | |
| NOI DSCR | 1.01x | 0.97x | 0.88x | 0.93x | 1.44x | | |
| NCF DSCR | 1.01x | 0.97x | 0.88x | 0.93x | 1.34x | | |
| NOI Debt Yield | 7.8% | 7.5% | 6.8% | 7.2% | 11.2% | | |
| NCF Debt Yield | 7.8% | 7.5% | 6.8% | 7.2% | 10.4% | | |
| (1) | Represents (i) percent of Net Rental Income for all revenue fields and (ii) percent of Effective Gross Income for all other fields. |
| (2) | U/W Base Rent includes contractual rent steps totaling $36,156 through April 2025. |
| (3) | The increase in Net Operating Income from TTM 3/31/2024 to U/W is primarily due to the City of New York (KCDA) commencing a new lease in December 2023 with an annual base rent of $970,403. |
Market Overview and Competition. The Brooklyn Renaissance Plaza Property is located on Adams Street in Brooklyn, New York. The Brooklyn Renaissance Plaza Property is located adjacent to Brooklyn Bridge Boulevard which provides access to Manhattan, one block from the Jay St-MetroTech subway station which provides access to the A, C, F, and R subway lines, and less than a mile from Atlantic Terminal which provides access to the LIRR and additional subway lines. The Brooklyn Renaissance Plaza Property is located just north of the Fulton Street Mall, a major retail center in Downtown Brooklyn. The downtown Brooklyn neighborhood has seen a significant amount of new development in recent years, with the emergence of the Brooklyn Tech Triangle and the construction of luxury high rise buildings throughout the neighborhood. According to the appraisal, the 2023 estimated population within the 11201 zip code was 71,969 and the 2023 estimated median household income within the 11201 zip code was approximately $143,345.
According to the appraisal, the Brooklyn Renaissance Plaza Property is situated in the Downtown Brooklyn office submarket within the greater Brooklyn Office market. As of the first quarter of 2024, the submarket reported a total inventory of approximately 24.69 million square feet within 190 buildings with an 18.9% vacancy rate and an average asking rent of $40.09 per square foot. The appraiser concluded a market rent for the Brooklyn Renaissance Plaza Property of $65.00 per square foot for 23rd floor office space, $55.00 per square foot for 4-7th floor office space, $75.00 per square foot for large retail space, $125.00 per square foot for small retail space, and $30.00 per square foot for storage space.
| THE INFORMATION IN THIS STRUCTURAL AND COLLATERAL TERM SHEET IS NOT COMPLETE AND MAY BE AMENDED PRIOR TO THE TIME OF SALE. THIS TERM SHEET IS NOT AN OFFER TO SELL THESE SECURITIES AND IT IS NOT A SOLICITATION OF AN OFFER TO BUY THESE SECURITIES IN ANY JURISDICTION WHERE THE OFFER OR SALE IS NOT PERMITTED. |
| | 127 | |
| Office – CBD | Loan #11 | Cut-off Date Balance: | | $25,200,000 |
| 335 Adams Street | Brooklyn Renaissance Plaza | Cut-off Date LTV: | | 60.1% |
| Brooklyn, NY 11201 | | UW NCF DSCR: | | 1.34x |
| | | UW NOI Debt Yield: | | 11.2% |
The following table presents certain information relating to the appraiser’s market rent conclusions for the Brooklyn Renaissance Plaza Property:
Market Rent Summary(1)
| | Office (Floor 23) | Office (Floors 4-7) | Retail (Large) | Retail (Small) | Storage |
| Market Rent (PSF) | $65.00 | $55.00 | $75.00 | $125.00 | $30.00 |
| Lease Term (Years) | 10 | 10 | 7 | 7 | 10 |
| Lease Type (Reimbursements) | Modified Gross | Modified Gross | Modified Gross | Modified Gross | Modified Gross |
| Rent Increase Projection | 3.0% / Yr | 3.0% / Yr | 3.0% / Yr | 3.0% / Yr | 3.0% / Yr |
| Tenant Improvements (New / Renewal) | $75.00 / $50.00 | $75.00 / $50.00 | $25.00 / $10.00 | $15.00 / $0.00 | None |
| Leasing Commissions (New / Renewal) | 5.0% / 2.5% | 5.0% / 2.5% | 5.0% / 2.5% | 5.0% / 2.5% | 5.0% / 2.5% |
| Free Rent Months (New / Renewal) | 9 / 3 | 9 / 3 | 6 / 3 | 3 / 0 | 0 / 0 |
| (1) | Information obtained from the appraisal. |
The table below presents certain information relating to comparable sales pertaining to the Brooklyn Renaissance Plaza Property, as identified by the appraiser:
Comparable Office Sales(1)
Property Name/Location | Year Built | Rentable Area
(SF) | Occupancy | Sale Date | Sale Price(3) | Sale Price
(PSF)(3) | OAR |
Brooklyn Renaissance Plaza (Subject) 335 Adams Street Brooklyn, NY | 1977 | 139,216(2) | 100%(2) | | | | |
Paragon Oil Building 21-00 49th Avenue Long Island City, NY | 1916 | 127,915 | NAV | Jun-23 | $64,269,306 | $502 | NAV |
Cornerstone Fresh Meadows 159-05 Union Turnpike Fresh Meadows, NY | 1960 | 79,800 | 100% | Feb-23 | $44,000,000 | $551 | 6.4% |
Packard Motor Building 32-02 Queens Boulevard Long Island City, NY | 1931 | 279,849 | 38% | Jul-22 | $111,993,021 | $400 | 5.1% |
Mixed-Use (Office/Retail) Building 2004 McDonald Avenue Brooklyn, NY | 1931 | 24,300 | 100% | Sep-21 | $8,600,000 | $354 | 5.5% |
345 Seventh Avenue 345 Seventh Avenue New York, NY | 1928 | 219,246 | 67% | Jun-21 | $107,000,000 | $488 | 2.4% |
One Whitehall Street 1 Whitehall Street New York, NY | 1962 | 366,209 | 100% | Jul-19 | $189,000,000 | $516 | 4.0% |
| (1) | Information obtained from the appraisal unless otherwise stated. |
| (2) | Information obtained from the underwritten rent roll dated May 28, 2024. |
| (3) | Sale Price and Sale Price (PSF) adjusted for cash equivalency, lease-up and/or deferred maintenance (where applicable). |
| THE INFORMATION IN THIS STRUCTURAL AND COLLATERAL TERM SHEET IS NOT COMPLETE AND MAY BE AMENDED PRIOR TO THE TIME OF SALE. THIS TERM SHEET IS NOT AN OFFER TO SELL THESE SECURITIES AND IT IS NOT A SOLICITATION OF AN OFFER TO BUY THESE SECURITIES IN ANY JURISDICTION WHERE THE OFFER OR SALE IS NOT PERMITTED. |
| | 128 | |
| Office – CBD | Loan #11 | Cut-off Date Balance: | | $25,200,000 |
| 335 Adams Street | Brooklyn Renaissance Plaza | Cut-off Date LTV: | | 60.1% |
| Brooklyn, NY 11201 | | UW NCF DSCR: | | 1.34x |
| | | UW NOI Debt Yield: | | 11.2% |
The following table presents certain information relating to the appraiser’s market rent conclusions for the Brooklyn Renaissance Plaza Property:
Comparable Office Leases(1)
| Property Name/Location | Tenant | Tenant Size (SF) | Lease Start Date | Lease Term | Annual Base Rent PSF | Lease Type |
Brooklyn Renaissance Plaza (Subject) Brooklyn, NY | City of New York (KCDA) | 17,999 | 4Q2023 | 6.7 Yrs. | $53.91 | Modified Gross |
1 Willoughby Square Brooklyn, NY | Architecture Research Office | 9,876 | 4Q2022 | 11.2 Yrs. | $60.00 | Modified Gross |
32 Court Street Brooklyn, NY | Neighborhood Psychiatry Associates of Manhattan | 2,100 | 1Q2024 | 5.2 Yrs. | $52.00 | Modified Gross |
16 Court Street Brooklyn, NY | Sasaki Associates | 9,312 | 1Q2023 | 10.6 Yrs. | $57.00 | Modified Gross |
25 Kent Avenue Brooklyn, NY | Amazon Music | 40,000 | 3Q2020 | 10.0 Yrs. | $81.00 | Modified Gross |
75 North 7th Street Brooklyn, NY | Le Labo North America | 15,500 | 4Q2021 | 6.5 Yrs. | $69.00 | Modified Gross |
55 Water Street Brooklyn, NY | Wasserman Music, LLC | 21,706 | 1Q2022 | 8.8 Yrs. | $52.00 | Modified Gross |
63 Flushing Ave (Bldg. 77) Brooklyn, NY | Huge | 70,925 | 3Q2022 | 11.9 Yrs. | $54.00 | Modified Gross |
49 South 2nd Street Brooklyn, NY | Vice Media | 23,500 | 2Q2022 | 4.0 Yrs. | $77.00 | Modified Gross |
285 Kent Avenue Brooklyn, NY | Vice Media | 50,300 | 2Q2022 | 4.0 Yrs. | $82.36 | Modified Gross |
| (1) | Information obtained from the appraisal, except for the Brooklyn Renaissance Plaza Property, which information was obtained from the underwritten rent roll dated May 28, 2024. |
Ground Lease. The Brooklyn Renaissance Plaza Property is subject to a 99-year ground lease agreement that commenced in 1987 and expires in June 2086. The lessor under the ground lease is The City of New York and the lessee is Brooklyn Renaissance Office/Retail LLC. The current annual rent under the ground lease is $415,818, with 34% increases every 10 years until June 2062. Beginning in July 2062 and through the expiration of the ground lease, the base rent under the ground lease will be equal to the Brooklyn Renaissance Plaza Property’s allocable share in the condominium regime (9.2404%) of the fair market rental value of the land. The next rental increase is set to occur in July 2032. Additionally, there is an annual payment required under the ground lease equal to 10% of all net cash flow remaining after the borrower retains from net cash flow an amount equal to 15% of the equity contributions made by the direct and indirect members of the borrower to the borrower, all as calculated in accordance with the ground lease. Annual payments are determined on a consolidated basis with the non-collateral condominium units, other than the hotel condominium unit. As of 2023, the net cash flow threshold (inclusive of the non-collateral condo units) for this additional payment was approximately $4.6 million. Other than a de-minimis amount paid in 2021, a net cash flow rental payment has never been made to the lessor.
| THE INFORMATION IN THIS STRUCTURAL AND COLLATERAL TERM SHEET IS NOT COMPLETE AND MAY BE AMENDED PRIOR TO THE TIME OF SALE. THIS TERM SHEET IS NOT AN OFFER TO SELL THESE SECURITIES AND IT IS NOT A SOLICITATION OF AN OFFER TO BUY THESE SECURITIES IN ANY JURISDICTION WHERE THE OFFER OR SALE IS NOT PERMITTED. |
| | 129 | |
| No. 12 – 30 E 85th St |
| |
| Mortgage Loan Information | | Mortgaged Property Information |
| Mortgage Loan Seller: | JPMorgan Chase Bank, National Association | | Single Asset/Portfolio: | Single Asset |
Credit Assessment
(Fitch/KBRA/Moody’s): | NR/NR/NR | | Property Type – Subtype: | Retail – Anchored |
| Original Principal Balance: | $24,000,000 | | Location: | New York, NY |
| Cut-off Date Balance: | $24,000,000 | | Size: | 25,015 SF |
| % of Initial Pool Balance: | 3.4% | | Cut-off Date Balance Per SF: | $959.42 |
| Loan Purpose: | Refinance | | Maturity Date Balance Per SF: | $959.42 |
| Borrower Sponsor: | The Zucker Organization | | Year Built/Renovated: | 1987 / NAP |
| Guarantor: | Donald Zucker | | Title Vesting: | Fee |
| Mortgage Rate: | 6.5500% | | Property Manager: | Manhattan Skyline Management Corp. |
| Note Date: | July 24, 2024 | | Current Occupancy (As of): | 100.0% (5/1/2024) |
| Seasoning: | 0 months | | YE 2023 Occupancy: | 100.0% |
| Maturity Date: | August 1, 2034 | | YE 2022 Occupancy: | 90.0% |
| IO Period: | 120 months | | YE 2021 Occupancy: | 100.0% |
| Loan Term (Original): | 120 months | | As-Is Appraised Value: | $49,000,000 |
| Amortization Term (Original): | NAP | | As-Is Appraised Value Per SF: | $1,958.82 |
| Loan Amortization Type: | Interest Only | | As-Is Appraisal Valuation Date: | June 26, 2024 |
| Call Protection(1): | L(24),D(90),O(6) | | |
| Lockbox Type: | Hard/Springing Cash Management | | Underwriting and Financial Information |
| Additional Debt: | None | | TTM NOI(6/30/2024): | $1,621,114 |
| Additional Debt Type (Balance): | NAP | | 2023 NOI(3): | $1,313,449 |
| | | | 2022 NOI: | $1,898,478 |
| | | | 2021 NOI: | $2,255,542 |
| | | | U/W Revenues: | $3,805,655 |
| Escrows and Reserves | | U/W Expenses: | $1,501,788 |
| | Initial | Monthly | Cap | | U/W NOI(3): | $2,303,867 |
| Taxes: | $198,484 | $96,840 | NAP | | U/W NCF: | $2,273,849 |
| Insurance: | $0 | Springing | NAP | | U/W DSCR based on NOI/NCF: | 1.45x / 1.43x |
| Replacement Reserves: | $417 | $417 | $10,008 | | U/W Debt Yield based on NOI/NCF: | 9.6% / 9.5% |
| TI/LC Reserve: | $2,085 | $2,085 | $50,040 | | U/W Debt Yield at Maturity based on NOI/NCF: | 9.6% / 9.5% |
| Other Reserves: | $264,059(2) | Springing | NAP | | Cut-off Date LTV Ratio: | 49.0% |
| | | | | | LTV Ratio at Maturity: | 49.0% |
| | | | | | | | |
| Sources and Uses |
| Sources | | | | Uses | | |
| Mortgage Loan Amount | $24,000,000 | 97.2 | % | | Loan Payoff | $23,772,443 | 96.2 | % |
| Borrower Sponsor Equity | 703,018 | 2.8 | | | Closing Costs | 465,530 | 1.9 | |
| | | | | Upfront Reserves | 465,045 | 1.9 | |
| Total Sources | $24,703,018 | 100.0 | % | | Total Uses | $24,703,018 | 100.0 | % |
| (1) | The borrower has the option to defease the 30 E 85th St Mortgage Loan (as defined below) in its entirety on September 1, 2026. Beginning March 1, 2034, the 30 E 85th St Mortgage Loan is open to prepayment without premium. |
| (2) | Other Reserves represent an Outstanding TI/LC Reserve of approximately $264,059 and springing monthly deposits for condominium assessments. |
| (3) | The increase from 2023 NOI to U/W NOI is primarily attributable to the Naftali Group, accounting for 21.4% of underwritten rent, commencing its lease in April 2024. |
The Mortgage Loan. The twelfth largest mortgage loan (the “30 E 85th St Mortgage Loan”) is evidenced by a promissory note in the original principal amount of $24,000,000 and is secured by the borrower’s fee interest in three retail condominium units totaling 25,015 square feet located on Madison Avenue and 85th Street in New York, New York (the “30 E 85th St Property”).
The Borrower and the Borrower Sponsor. The borrower is 30 East 85th Street Company, LLC, a special purpose, bankruptcy-remote entity and a Delaware limited liability company with one independent director. The borrower previously owned the Residential Condominium Units (as defined below) and was the original declarant under the related condominium declaration but has since transferred its ownership interest in the Residential Condominium Units to third parties. The 30 E 85th St Mortgage Loan documents include standard backward-looking representations and warranties from the borrower and provide for loss recourse in connection the borrower’s prior ownership of such property. Legal counsel to the borrower delivered a non-consolidation opinion in connection with the 30 E 85th St Mortgage Loan. The borrower sponsor of the 30 E 85th St Mortgage Loan is The Zucker Organization and the non-recourse carveout guarantor is Donald Zucker. Founded in 1961, The Zucker Organization is a Manhattan-based firm that builds, buys
| THE INFORMATION IN THIS STRUCTURAL AND COLLATERAL TERM SHEET IS NOT COMPLETE AND MAY BE AMENDED PRIOR TO THE TIME OF SALE. THIS TERM SHEET IS NOT AN OFFER TO SELL THESE SECURITIES AND IT IS NOT A SOLICITATION OF AN OFFER TO BUY THESE SECURITIES IN ANY JURISDICTION WHERE THE OFFER OR SALE IS NOT PERMITTED. |
| | 130 | |
| Retail – Anchored | Loan #12 | Cut-off Date Balance: | | $24,000,000 |
| 30 East 85th Street | 30 E 85th St | Cut-off Date LTV: | | 49.0% |
| New York, NY 10028 | | U/W NCF DSCR: | | 1.43x |
| | | U/W NOI Debt Yield: | | 9.6% |
and manages apartment and retail properties. The company has developed 30 buildings and has acquired 3,000 apartment units since inception, including the 35-story rental tower, Rivergate, which it sold for $443.4 million in 2011.
The Property. The 30 E 85th St Property consists of a portion of a 33-story mixed use luxury condominium property, evidenced by the borrower’s ownership in 3 of 96 total condominium units. The 30 E 85th St Property was constructed in 1987 and is located along the southwest corner of Madison Avenue and East 85th Street in the Upper East Side neighborhood of Manhattan. The 30 E 85th St Property is comprised of two commercial condominium units, making up the two commercial floors at the 30 E 85th St Property, totaling 25,015 square feet, plus a 9,766 square foot lower-level commercial parking garage unit, which contains 43 licensed parking spaces. As of May 1, 2024, the 30 E 85th St Property was 100.0% leased to four retail tenants with a weighted average remaining lease term of 10.4 years and one parking garage tenant with a lease expiration date in December 2031. Since 2021, the 30 E 85th St Property has maintained an average occupancy of 96.3%. According to the appraisal, the retail space in the 30 E 85th St Property features functional suites with good configuration, visibility and overall utility. Ceiling heights are 14 to 15 feet on the ground floor, 12 feet on the second floor and 10 to 12 feet in the parking garage.
The remaining 93 condominium units (the “Residential Condominium Units”), which make up the 30-story luxury residential portion of the mixed use luxury condominium property, are owned by third parties and do not serve as collateral for the 30 E 85th St Mortgage Loan. The borrower owns approximately 10.2% of the common share interest in the condominium regime. The condominium association is governed by a board consisting of nine managers, and the borrower, as the owner of the commercial units, has the right to appoint one manager to the board. See “Description of the Mortgage Pool—Mortgage Pool Characteristics—Condominium and Other Shared Interests” in the prospectus.
Major Tenants.
The three largest tenants based on underwritten base rent are Equinox Holdings, Inc., James Perse Enterprises LLC and Naftali Group.
Equinox Holdings, Inc. (14,110 square feet; 56.4% of NRA; 40.5% of underwritten rent) (“Equinox”). Founded in 1991, Equinox is a fitness company focusing on the premium health and fitness space with over 100 clubs worldwide. Equinox occupies the entire second floor at the 30 E 85th St Property and has been a tenant since July 2018. The 30 E 85th St Property serves as Equinox’s sole E by Equinox club in the United States, offering access to personal training, fitness classes, physical therapists, a medical concierge and nutritional counseling. Equinox is subject to a long-term lease that is set to expire in December 2043 with no renewal options. Equinox has the right to terminate its lease if the borrower leases or otherwise permits or allows any space at the 30 E 85th St Property to be used by others for fitness or fitness-related use provided (a) the borrower does not cure such default within 10 days after notice from tenant or (b) any tenant or occupant of the 30 E 85th St Property violates such exclusive use and the borrower is unwilling or unable to stop any such violation within 30 days after written notice thereof.
James Perse Enterprises LLC (3,450 square feet; 13.8% of NRA; 24.2% of underwritten rent) (“James Perse”). James Perse is an apparel & fashion company offering apparel for men, women and home fashion products. James Perse is located on the first floor of the 30 E 85th St Property and has been a tenant since March 2023. James Perse’s lease is set to expire in February 2028 and it has one, five-year renewal option remaining. James Perse has no remaining termination options.
Naftali Group (5,635 square feet; 22.5% of NRA; 21.4% of underwritten rent). Naftali Group is a privately owned global real estate development and investment firm that has developed or acquired approximately 31 million square feet across more than 40 projects over its over 35 years in business, with a total development value of approximately $15 billion. Naftali Group is located on the first floor of the 30 E 85th St Property and has been a tenant since April 2024. It is utilizing it’s space as a sales office for its current 45-unit condominium project at 211 West 84th Street. Naftali Group’s lease is set to expire in May 2026 and it has one, one-year renewal option remaining. Naftali Group has no remaining termination options.
The following table presents certain information relating to the major tenants at the 30 E 85th St Property:
Tenant Summary(1)
| Tenant Name | Credit Rating (Fitch/Moody’s /S&P)(2) | Tenant NRSF | % of NRSF | Annual U/W Base Rent | % of Total Annual U/W Base Rent | Annual U/W Base Rent PSF | | Ext. Options |
| Term. Option (Y/N) | Lease Expiration Date |
| Equinox | NR/NR/NR | 14,110 | 56.4% | $1,466,256 | 40.5% | $103.92 | Y(3) | 12/31/2043 | None |
| James Perse | NR/NR/NR | 3,450 | 13.8% | $875,243 | 24.2% | $253.69 | N | 2/29/2028 | 1 x 5 Yr |
| Naftali Group | NR/NR/NR | 5,635 | 22.5% | $772,500 | 21.4% | $137.09 | N | 5/31/2026 | 1 x 1 Yr |
| Starbucks Corp. | NR/Baa1/BBB+ | 1,820 | 7.3% | $504,000 | 13.9% | $276.92 | Y(4) | 7/1/2033 | 1 x 5 Yr |
| Occupied Total | | 25,015 | 100.0% | $3,617,999 | 100.0% | $144.63 | | | |
| Vacant Space | | 0 | 0.0% | | | | | | |
| Total/Wtd. Avg. | | 25,015 | 100.0% | | | | | | |
| (1) | Based on the underwritten rent roll dated May 1, 2024. |
| (2) | Certain ratings are those of the parent company whether or not the parent guarantees the lease. |
| (3) | Equinox has the right to terminate its lease if the borrower leases or otherwise permits or allows any space at the 30 E 85th St Property to be used by others for fitness or fitness-related use provided (a) the borrower does not cure such default within 10 days after notice from tenant or (b) any |
| THE INFORMATION IN THIS STRUCTURAL AND COLLATERAL TERM SHEET IS NOT COMPLETE AND MAY BE AMENDED PRIOR TO THE TIME OF SALE. THIS TERM SHEET IS NOT AN OFFER TO SELL THESE SECURITIES AND IT IS NOT A SOLICITATION OF AN OFFER TO BUY THESE SECURITIES IN ANY JURISDICTION WHERE THE OFFER OR SALE IS NOT PERMITTED. |
| | 131 | |
| Retail – Anchored | Loan #12 | Cut-off Date Balance: | | $24,000,000 |
| 30 East 85th Street | 30 E 85th St | Cut-off Date LTV: | | 49.0% |
| New York, NY 10028 | | U/W NCF DSCR: | | 1.43x |
| | | U/W NOI Debt Yield: | | 9.6% |
tenant or occupant of the 30 E 85th St Property violates such exclusive use and the borrower is unwilling or unable to stop any such violation within 30 days after written notice thereof.
| (4) | Provided the borrower receives no less than 300 days written notice, Starbucks Corp. has the right to terminate its lease on July 1, 2028, subject to a $450,000 termination fee. |
| THE INFORMATION IN THIS STRUCTURAL AND COLLATERAL TERM SHEET IS NOT COMPLETE AND MAY BE AMENDED PRIOR TO THE TIME OF SALE. THIS TERM SHEET IS NOT AN OFFER TO SELL THESE SECURITIES AND IT IS NOT A SOLICITATION OF AN OFFER TO BUY THESE SECURITIES IN ANY JURISDICTION WHERE THE OFFER OR SALE IS NOT PERMITTED. |
| | 132 | |
| Retail – Anchored | Loan #12 | Cut-off Date Balance: | | $24,000,000 |
| 30 East 85th Street | 30 E 85th St | Cut-off Date LTV: | | 49.0% |
| New York, NY 10028 | | U/W NCF DSCR: | | 1.43x |
| | | U/W NOI Debt Yield: | | 9.6% |
The following table presents certain information relating to the lease rollover schedule at the 30 E 85th St Property:
Lease Expiration Schedule(1)(2)
Year Ending
December 31 | No. of Leases Expiring | Expiring NRSF | % of Total NRSF | Cumulative Expiring NRSF | Cumulative % of Total NRSF | Annual
U/W
Base Rent(3) | % of Total Annual U/W Base Rent | Annual
U/W
Base Rent
PSF |
| 2024 & MTM | 0 | 0 | 0.0% | 0 | 0.0% | $0 | 0.0% | $0.00 |
| 2025 | 0 | 0 | 0.0% | 0 | 0.0% | $0 | 0.0% | $0.00 |
| 2026 | 1 | 5,635 | 22.5% | 5,635 | 22.5% | $772,500 | 21.4% | $137.09 |
| 2027 | 0 | 0 | 0.0% | 5,635 | 22.5% | $0 | 0.0% | $0.00 |
| 2028 | 1 | 3,450 | 13.8% | 9,085 | 36.3% | $875,243 | 24.2% | $253.69 |
| 2029 | 0 | 0 | 0.0% | 9,085 | 36.3% | $0 | 0.0% | $0.00 |
| 2030 | 0 | 0 | 0.0% | 9,085 | 36.3% | $0 | 0.0% | $0.00 |
| 2031 | 0 | 0 | 0.0% | 9,085 | 36.3% | $0 | 0.0% | $0.00 |
| 2032 | 0 | 0 | 0.0% | 9,085 | 36.3% | $0 | 0.0% | $0.00 |
| 2033 | 1 | 1,820 | 7.3% | 10,905 | 43.6% | $504,000 | 13.9% | $276.92 |
| 2034 | 0 | 0 | 0.0% | 10,905 | 43.6% | $0 | 0.0% | $0.00 |
| 2035 & Beyond | 1 | 14,110 | 56.4% | 25,015 | 100.0% | $1,466,256 | 40.5% | $103.92 |
| Vacant | 0 | 0 | 0% | 25,015 | 100.0% | $0 | 0.0% | $0.00 |
| Total/Wtd. Avg. | 4 | 25,015 | 100.0% | | | $3,617,999 | 100.0% | $144.63 |
| (1) | Based on the underwritten rent roll dated May 1, 2024. |
| (2) | Certain tenants may have lease termination options that are exercisable prior to the stated expiration date of the subject lease or leases which are not considered in the Lease Expiration Schedule. |
The following table presents historical occupancy percentages at the 30 E 85th St Property:
Historical Occupancy
12/31/2021 | 12/31/2022 | 12/31/2023 | 5/1/2024(1) |
| 100.0% | 90.0% | 100.0% | 100.0% |
| | | | |
| (1) | Current occupancy is based on the underwritten rent roll dated as of May 1, 2024. |
Market Overview and Competition. The 30 E 85th St Property is located in the Upper East Side neighborhood of Manhattan, New York. Located on the southwest corner of Madison Avenue and East 85th Street, the 30 E 85th St Property is just outside the prime Madison Avenue retail submarket, which extends up and down Madison Avenue from East 57th Street to East 72nd street. According to the appraisal, in the past decade, Madison Avenue has become one of New York’s premier shopping destinations, housing many luxury brands, jewelers and couture fashion retailers that cater to a wide variety of clients, including tourists, residents and office workers. The Upper East Side has historically been one of the more desirable neighborhoods for New York City residents and is home to a wide range of museums, including the Metropolitan Museum of Art, The Guggenheim Museum, The Museum of New York City, the Whitney Museum of American Art and the Frick Collection.
Primary access to the 30 E 85th St Property is via subway, public bus or automobile. Subway access on the Upper East Side is provided via the 4, 5 and 6 trains along Lexington Avenue with stops at 59th Street, 68th Street, 77th Street, 86th Street and 96th Street. Public bus routes in the neighborhood are substantial and include the M96, M86, M79, M72, M66, M31, M15, M98, M101, M102, M103, M1, M2, M3, M4, M106, Q60, Q101 and Q32 routes.
According to a third party market data provider, the 2023 population within a one-, two- and three-mile radius of the 30 E 85th St Property was 228,853, 686,836 and 1,231,613 respectively. The 2023 average household income within the same radii was $163,095, $147,384, $136,059, respectively.
According to the appraiser, the 30 E 85th St Property’s average underwritten rent is 18.8% below its concluded market rent.
| THE INFORMATION IN THIS STRUCTURAL AND COLLATERAL TERM SHEET IS NOT COMPLETE AND MAY BE AMENDED PRIOR TO THE TIME OF SALE. THIS TERM SHEET IS NOT AN OFFER TO SELL THESE SECURITIES AND IT IS NOT A SOLICITATION OF AN OFFER TO BUY THESE SECURITIES IN ANY JURISDICTION WHERE THE OFFER OR SALE IS NOT PERMITTED. |
| | 133 | |
| Retail – Anchored | Loan #12 | Cut-off Date Balance: | | $24,000,000 |
| 30 East 85th Street | 30 E 85th St | Cut-off Date LTV: | | 49.0% |
| New York, NY 10028 | | U/W NCF DSCR: | | 1.43x |
| | | U/W NOI Debt Yield: | | 9.6% |
The following table presents certain information relating to the appraisal’s market rent conclusion for the 30 E 85th St Property:
Market Rent Summary(1)
| | Retail | Retail - Small | 2nd Floor | Parking Garage |
| Market Rent (PSF) | $275.00 | $300.00 | $100.00 | $26.42 |
| Lease Term (Years) | 10 | 10 | 10 | 10 |
| Lease Type | Modified Gross | Modified Gross | Modified Gross | Modified Gross |
| Escalations (Annual) | 3% | 3% | 3% | 3% |
| Tenant Improvements (New/Renewal) | $100 / $50 | $100 / $50 | $50 / $25 | $0 / $0 |
| Leasing Commissions (New/Renewal) | 4.0% / 2.0% | 4.0% / 2.0% | 4.0% / 2.0% | 4.0% / 2.0% |
| Free Rent (Months) (New/Renewal) | 3 / 1 | 3 / 1 | 3 / 1 | 2 / 1 |
| (1) | Information obtained from the appraisal. |
The table below presents certain information relating to comparable properties to the 30 E 85th St Property identified by the appraiser:
Comparable Retail Leases(1)
| Property Name | Lease Size (SF) | Tenant | Lease Date/ Term (yrs.) | Free Rent (months) | Base Rent PSF |
| 30 E 85th St | 10,905(2) | Various | - | - | $197.32(2) |
| 1121 Madison Avenue | 4,200 | Tuckernuck | May-24 / 10 | 6 | $156.00 |
| 1025 Madison Avenue | 1,000 | Alan Mikli | Apr-24 / 5 | 0 | $380.00 |
| 1165 Madison Avenue | 2,703 | Todd Snyder | Mar-24 / 10 | 5 | $233.00 |
| 128 East 86th Street | 3,796 | Housing Works | Feb-24 / 10 | 0 | $205.00 |
| 1047 Madison Avenue | 2,019 | Barbour | Aug-23 / 10 | 0 | $292.00 |
| 1155 Madison Avenue | 3,622 | Vuori | Jun-23 / 10 | 3 | $304.00 |
| 1044 Madison Avenue | 2,324 | Five Story | Feb-23 / 5 | 0 | $218.00 |
| (1) | Source: Appraisal unless otherwise indicated. |
| (2) | Based on the underwritten rent roll dated May 1, 2024, excluding Equinox. |
Comparable Fitness Center Leases(1)
| Property Name | Lease Size (SF) | Tenant | Lease Date/ Term (yrs.) | Free Rent (months) | Base Rent PSF |
| 30 E 85th St | 14,110(2) | Equinox | - | - | $103.92(2) |
| 1534 Second Avenue | 9,500 | Goldfish Swim | May-23 / 10 | 7 | $105.00 |
| 330 East 59th Street | 7,000 | Body Space Fitness | May-23 / 10 | 7 | $35.00 |
| 537 West 27th Street | 12,895 | Central Rock Gym | Sep-22 / 10 | 6 | $59.00 |
| 829 Tenth Avenue | 2,200 | Champion Martial Arts | Jul-22 / 10 | 5 | $49.00 |
| 1180 Avenue of the Americas | 5,655 | Orangetheory Fitness | Jun-22 / 10 | 7 | $67.00 |
| 1231 Third Avenue | 9,250 | O2 Fit Nation | Nov-21 / 10 | 6 | $64.00 |
| (1) | Source: Appraisal unless otherwise indicated. |
| (2) | Based on the underwritten rent roll dated May 1, 2024. |
| THE INFORMATION IN THIS STRUCTURAL AND COLLATERAL TERM SHEET IS NOT COMPLETE AND MAY BE AMENDED PRIOR TO THE TIME OF SALE. THIS TERM SHEET IS NOT AN OFFER TO SELL THESE SECURITIES AND IT IS NOT A SOLICITATION OF AN OFFER TO BUY THESE SECURITIES IN ANY JURISDICTION WHERE THE OFFER OR SALE IS NOT PERMITTED. |
| | 134 | |
| Retail – Anchored | Loan #12 | Cut-off Date Balance: | | $24,000,000 |
| 30 East 85th Street | 30 E 85th St | Cut-off Date LTV: | | 49.0% |
| New York, NY 10028 | | U/W NCF DSCR: | | 1.43x |
| | | U/W NOI Debt Yield: | | 9.6% |
Operating History and Underwritten Net Cash Flow. The following table presents certain information relating to the historical operating performance and underwritten net cash flow at the 30 E 85th St Property:
Cash Flow Analysis
| | 2021 | 2022 | 2023 | TTM 6/30/2024 | U/W(1) | %(2) | U/W $
per SF |
| Rents in Place | $3,416,560 | $3,119,981 | $2,605,188 | $3,272,545 | $3,570,006 | 93.8% | $142.71 |
| Rent Steps | 0 | 0 | 0 | 0 | 47,993 | 1.3% | $1.92 |
| Total Reimbursements | 0 | 0 | 0 | 0 | 183,759 | 4.8% | $7.35 |
| Other Income | 626,386 | 282,070 | 276,965 | 332,979 | 193,985 | 5.1% | $7.75 |
| Vacancy | 0 | 0 | 0 | (493,960) | (190,088) | -5.0% | -$7.60 |
| Effective Gross Income | $4,042,946 | $3,402,051 | $2,882,153 | $3,111,564 | $3,805,655 | 100.0% | $152.13 |
| | | | | | | | |
| Real Estate Taxes | 1,501,838 | 1,213,269 | 1,237,767 | 1,154,671 | 1,162,074 | 30.5% | $46.46 |
| Insurance | 15,412 | 18,235 | 20,474 | 23,176 | 21,404 | 0.6% | $0.86 |
| Management Fee | 121,288 | 102,062 | 86,465 | 93,347 | 114,170 | 3.0% | $4.56 |
| Other Expenses | 148,866 | 170,007 | 223,998 | 219,256 | 204,140 | 5.4% | $8.16 |
| Total Expenses | $1,787,404 | $1,503,573 | $1,568,704 | $1,490,450 | $1,501,788 | 39.5% | $60.04 |
| | | | | | | | |
| Net Operating Income(3) | $2,255,542 | $1,898,478 | $1,313,449 | $1,621,114 | $2,303,867 | 60.5% | $92.10 |
| Capital Expenditures | 0 | 0 | 0 | 0 | 5,003 | 0.1% | $0.20 |
| TI/LC | 0 | 0 | 0 | 0 | 25,015 | 0.7% | $1.00 |
| Net Cash Flow | $2,255,542 | $1,898,478 | $1,313,449 | $1,621,114 | $2,273,849 | 59.7% | $90.90 |
| | | | | | | | |
| NOI DSCR | 1.42x | 1.19x | 0.82x | 1.02x | 1.45x | | |
| NCF DSCR | 1.42x | 1.19x | 0.82x | 1.02x | 1.43x | | |
| NOI Debt Yield | 9.4% | 7.9% | 5.5% | 6.8% | 9.6% | | |
| NCF Debt Yield | 9.4% | 7.9% | 5.5% | 6.8% | 9.5% | | |
| (1) | Based on the underwritten rent roll dated May 1, 2024. |
| (2) | Represents the percentage of Effective Gross Income. |
| (3) | The increase from 2023 Net Operating Income to U/W Net Operating Income is primarily attributable to the Naftali Group, accounting for 21.4% of underwritten rent, commencing its lease in April 2024. |
| THE INFORMATION IN THIS STRUCTURAL AND COLLATERAL TERM SHEET IS NOT COMPLETE AND MAY BE AMENDED PRIOR TO THE TIME OF SALE. THIS TERM SHEET IS NOT AN OFFER TO SELL THESE SECURITIES AND IT IS NOT A SOLICITATION OF AN OFFER TO BUY THESE SECURITIES IN ANY JURISDICTION WHERE THE OFFER OR SALE IS NOT PERMITTED. |
| | 135 | |
| No. 13 – Dallas Market Center |
| |
| Mortgage Loan Information | | Mortgaged Property Information |
| Mortgage Loan Seller: | Goldman Sachs Mortgage Company | | Single Asset/Portfolio: | Single Asset |
| Credit Assessment (Fitch/KBRA/Moody’s): | NR/NR/A3(sf) | | Property Type – Subtype: | Mixed Use – Merchandise Mart/Retail |
| Original Principal Balance(1): | $22,000,000 | | Location: | Dallas, TX |
| Cut-off Date Balance(1): | $22,000,000 | | Size(3): | 2,746,550 SF |
| % of Initial Pool Balance: | 3.1% | | Cut-off Date Balance Per SF(1): | $86.29 |
| Loan Purpose: | Refinance | | Maturity Date Balance Per SF(1): | $86.29 |
| Borrower Sponsor: | Dallas Market Center Financial, L.L.C. | | Year Built/Renovated: | 1957, 1958, 1974, 1979/1999,2019 |
| Guarantor: | Dallas Market Center Financial, L.L.C. | | Title Vesting: | Fee |
| Mortgage Rate: | 6.5020% | | Property Manager: | Market Center Management Company, LTD. (borrower-related) |
| Note Date: | May 31, 2024 | | Current Occupancy (As of): | 91.1% (3/31/2024) |
| Seasoning: | 2 months | | FYE 2024 Occupancy(4): | 89.5% |
| Maturity Date: | June 6, 2034 | | FYE 2023 Occupancy(4): | 88.2% |
| IO Period: | 120 months | | FYE 2022 Occupancy(4): | 83.4% |
| Loan Term (Original): | 120 months | | FYE 2021 Occupancy(4): | 84.0% |
| Amortization Term (Original): | NAP | | As-Is Appraised Value: | $636,500,000 |
| Loan Amortization Type: | Interest Only | | As-Is Appraised Value Per SF: | $231.75 |
| Call Protection: | L(26),D(87),O(7) | | As-Is Appraisal Valuation Date: | April 27, 2024 |
| Lockbox Type: | Hard/In Place Cash Management | | Underwriting and Financial Information |
| Additional Debt(1)(2): | Yes | | FYE 2024 NOI(4): | $36,427,639 |
| Additional Debt Type (Balance) (1)(2) | Pari Passu ($215,000,000) | | FYE 2023 NOI(4): | $35,092,715 |
| | | | FYE 2022 NOI(4): | $34,255,349 |
| | | FYE 2021 NOI(4): | $22,055,849 |
| Escrows and Reserves | | U/W Revenues: | $93,314,164 |
| | Initial | Monthly | Cap | | U/W Expenses: | $52,910,281 |
| Taxes: | $1,264,708 | $210,785 | NAP | | U/W NOI: | $40,403,884 |
| Insurance: | $0 | Springing | NAP | | U/W NCF: | $38,503,927 |
| Replacement Reserve: | $1,000,000 | Springing | $1,000,000 | | U/W DSCR based on NOI/NCF(1): | 2.59x / 2.46x |
| TI/LC Reserve: | $1,500,000 | Springing | $1,500,000 | | U/W Debt Yield based on NOI/NCF(1): | 17.0% /16.2% |
| Unfunded Obligations Reserve: | $431,802 | $0 | NAP | | U/W Debt Yield at Maturity based on NOI/NCF(1): | 17.0% /16.2% |
| | | | | | Cut-off Date LTV Ratio(1): | 37.2% |
| | | | | | LTV Ratio at Maturity(1): | 37.2% |
| | | | | | | | |
| Sources and Uses |
| Sources | | | | Uses | | |
| Whole Loan Amount(1) | $237,000,000 | 99.1 | % | | Loan Payoff | $231,913,303 | 96.9 | % |
| Borrower Sponsor Equity | 2,270,000 | 0.9 | | | Upfront reserves | 4,196,510 | 1.8 | |
| | | | | Closing costs | 3,160,187 | 1.3 | |
| | | | | | | |
| Total Sources | $239,270,000 | 100.0 | % | | Total Uses | $239,270,000 | 100.0 | % |
| (1) | The Dallas Market Center Mortgage Loan (as defined below) is part of the Dallas Market Center Whole Loan (as defined below), which is evidenced by of four pari passu promissory notes with an aggregate original principal balance of $237,000,000. The Cut-off Date Balance Per SF, Maturity Date Balance Per SF, U/W DSCR based on NOI/NCF, U/W Debt Yield based on NOI/NCF, U/W Debt Yield at Maturity based on NOI/NCF, Cut-off Date LTV Ratio and LTV Ratio at Maturity presented above are based on the aggregate Cut-off Date principal balance of the Dallas Market Center Whole Loan. |
| (2) | See “The Mortgage Loan” section below and “Description of the Mortgage Pool—Additional Indebtedness—Other Unsecured Indebtedness” in the Preliminary Prospectus for further discussion of additional mortgage debt. |
| (3) | Represents permanent collateral SF. There is an additional 696,823 SF that consists of temporary SF included in the collateral, per the borrowers. |
| (4) | FYE represents a Fiscal Year End at the end of February each annual period. |
| THE INFORMATION IN THIS STRUCTURAL AND COLLATERAL TERM SHEET IS NOT COMPLETE AND MAY BE AMENDED PRIOR TO THE TIME OF SALE. THIS TERM SHEET IS NOT AN OFFER TO SELL THESE SECURITIES AND IT IS NOT A SOLICITATION OF AN OFFER TO BUY THESE SECURITIES IN ANY JURISDICTION WHERE THE OFFER OR SALE IS NOT PERMITTED. |
| | 136 | |
| Mixed Use - Merchandise Mart/Retail | Loan #13 | Cut-off Date Balance: | | $22,000,000 |
| 2000 North Stemmons Freeway and | Dallas Market Center | Cut-off Date LTV: | | 37.2% |
| 2050-2100 North Stemmons Freeway | | U/W NCF DSCR: | | 2.46x |
| Dallas, TX 75207 | | U/W NOI Debt Yield: | | 17.0% |
The Mortgage Loan. The thirteenth largest mortgage loan (the "Dallas Market Center Mortgage Loan") is part of a whole loan (the "Dallas Market Center Whole Loan") evidenced by four pari passu notes issued to ITP & WTC Fee, L.P. and WTC-Trade Mart 2015, L.P. in the aggregate original principal amount of $237,000,000. The Dallas Market Center Mortgage Loan is evidenced by the non-controlling Note A-4, which has an outstanding principal balance as of the Cut-off Date of $22,000,000. The Dallas Market Center Whole Loan was originated on May 31, 2024, by Goldman Sachs Bank USA (“GSBI”). The Dallas Market Center Whole Loan is secured by the borrowers’ fee interest in three buildings that comprise a portion of the Dallas Market Center campus located in Dallas, Texas (the "Dallas Market Center Property"). The Dallas Market Center Whole Loan has a 10-year term, is interest-only for the full term and accrues interest a rate of 6.5020% per annum on an Actual/360 basis.
The table below identifies the promissory notes that comprise the Dallas Market Center Whole Loan. The Dallas Market Center Whole Loan is serviced pursuant to the pooling and servicing agreement for the BANK 2024-BNK47 securitization trust. The relationship between the holders of the Dallas Market Center Whole Loan is governed by a co-lender agreement as described under “Description of the Mortgage Pool—The Whole Loans—The Non-Serviced Pari Passu Whole Loans” and “The Pooling and Servicing Agreement—Servicing of the Non-Serviced Mortgage Loans” in the Preliminary Prospectus.
Whole Loan Note Summary
| Note | Original Balance | Cut-off Date Balance | Note Holder | Controlling Piece |
| A-1 | $90,000,000 | $90,000,000 | BANK 2024-BNK47 | Yes |
| A-2 | $75,000,000 | $75,000,000 | BMO 2024-C9 | No |
| A-3 | $50,000,000 | $50,000,000 | BBCMS 2024-C28 | No |
| A-4 | $22,000,000 | $22,000,000 | WFCM 2024-C63 | No |
| Total | $237,000,000 | $237,000,000 | | |
The Borrowers and Borrower Sponsor. The borrowers are ITP & WTC Fee, L.P. and WTC-Trade Mart 2015, L.P., each a single-purpose entity with two independent directors. Legal counsel to the borrowers delivered a non-consolidation opinion in connection with the origination of the Dallas Market Center Whole Loan. The borrower sponsor and non-recourse carveout guarantor is Dallas Market Center Financial, L.L.C., a Delaware limited liability company. The borrowers are indirectly owned by Crow Holdings, L.P., which has a substantial stake in the ownership of various businesses, both real estate and non-real estate related, in the United States and Europe. Crow Holdings, L.P. owns and manages the capital of the extended Trammell Crow family, which has had ownership in the Dallas Market Center Property for more than 55 years and is the original developer of the Dallas Market Center Property.
The Property. The Dallas Market Center Property campus includes the Trade Mart, World Trade Center, International Trade Plaza, and Market Hall. Dallas Market Center (“DMC”) opened in 1957 as a single building. International Trade Plaza, with the Trade Mart, Market Hall, and World Trade Center were later delivered in 1958, 1960, and 1974, respectively. The Trade Mart, World Trade Center, and International Trade Plaza are physically connected and have been renovated and expanded several times since delivery. The development currently totals over 5.0 million gross square feet (“SF”) across over 80 acres of land.
Dallas Market Center is one of the largest wholesale trade marts in the world, offering approximately 27,000 product lines with over 1,100 permanent showrooms and approximately 800,000 SF of temporary space across the four buildings, including Market Hall. It is estimated that DMC attracts over 200,000 visitors each year that conduct approximately $8.5 billion in annual wholesale transactions. DMC hosts 35 trade shows, or markets, each year and owns and produces each trade show with the exception of one. Tenants at the Dallas Market Center Property include manufacturers and representatives for a variety of consumer product categories including gift, lighting, women’s and men’s apparel, fashion accessories, jewelry, western and English riding, children’s, home accents, home textiles, rugs, gourmet, floral, and garden. Typical visitors include retail buyers from major department stores, specialty shops, and online retailers as well as interior designers. Examples of major retailers that consistently visit DMC include Dillard’s, Neiman Marcus, JC Penny, Zappos, Michaels, Hobby Lobby, At Home, Nebraska Furniture Mart, and Wayfair. Access to the Trade Mart, World Trade Center, and International Trade Plaza is restricted to credentialed retail buyers and designers. The Market Hall is the only building in the DMC development that is open to the public and is not a part of the collateral for the Dallas Market Center Whole Loan.
The Dallas Market Center Property features numerous amenities to accommodate trade show traffic including on-site food and shipping amenities. The Dallas Market Center Property also offers hotel reservations at preferred rates, shuttle services to and from hotels, and a luggage check on site to accommodate traveling wholesalers and retail buyers. There is also a DART (Dallas Area Rapid Transit) rail station located directly adjacent to the World Trade Center. The Dallas Market Center management team works with surrounding hotels like the Hilton Anatole (owned by Crow Holdings, L.P., an indirect owner of the borrowers) and Renaissance Hotel to reserve room blocks years in advance. It is estimated that DMC buyers and vendors purchase over 300,000 airline seats and 720,000 hotel room nights annually.
The permanent showroom space is currently 91.1% leased to approximately 800 tenants. No single tenant represents more than 1.3% of net rentable area SF or 1.8% of underwritten base rent. Permanent showroom tenants typically sign three to five year leases. These tenants have access to their showrooms 365 days per year; such showrooms are open daily in most cases. The permanent showroom tenants at the Dallas Market Center Property are classified in 18 groups, determined by product category and location within the DMC. The largest groups are gifts (26.9% of total permanent SF and 30.3% of total rent) and lighting (18.1% of total permanent SF and 21.9% of total rent). Apparel tenants are spread across multiple groups. The permanent square footage also includes a small office / storage component and amenity space, which represent 1.3% and 1.4% of total permanent SF, respectively.
| THE INFORMATION IN THIS STRUCTURAL AND COLLATERAL TERM SHEET IS NOT COMPLETE AND MAY BE AMENDED PRIOR TO THE TIME OF SALE. THIS TERM SHEET IS NOT AN OFFER TO SELL THESE SECURITIES AND IT IS NOT A SOLICITATION OF AN OFFER TO BUY THESE SECURITIES IN ANY JURISDICTION WHERE THE OFFER OR SALE IS NOT PERMITTED. |
| | 137 | |
| Mixed Use - Merchandise Mart/Retail | Loan #13 | Cut-off Date Balance: | | $22,000,000 |
| 2000 North Stemmons Freeway and | Dallas Market Center | Cut-off Date LTV: | | 37.2% |
| 2050-2100 North Stemmons Freeway | | U/W NCF DSCR: | | 2.46x |
| Dallas, TX 75207 | | U/W NOI Debt Yield: | | 17.0% |
The temporary space is comprised of 632,800 SF of space designated for temporary trade show exhibition booths and 64,023 SF of suites, known as Dallas Suites, according to the borrowers. Most markets held at DMC involve temporary exhibition tenants in addition to permanent showroom tenants. The temporary exhibition component of each market typically lasts four to five days. During this time, temporary exhibition tenants lease a booth space, display and sell products from their booth, and leave after the trade show concludes. Dallas Suites are leased to major retailers on a temporary basis. These suites are typically used for “private buys” when major retailers request that wholesalers bring their product to a centralized private location (as opposed to retail buyers visiting various wholesale showrooms).
Whether a tenant leases permanent showroom space or temporary exhibition space depends on their distribution model and industry in some cases. Permanent showroom tenants benefit from year-round access to their showrooms, daily retail buyer traffic, and the ability to give their showroom its own look and feel while temporary exhibitors benefit from flexibility and cost savings.
The following table presents a summary of Total SF and UW Annual Base Rent by tenant categories and industries at the Dallas Market Center Property:
| Total SF and UW Annual Base Rent by Tenant Category/Industry(1) |
| Tenant Category / Industry | Type | Total SF | % of Total SF | Leased SF | % Leased | PSF | UW Annual Base Rent | % of UW Annual Base Rent |
| Gifts | Hard Goods | 737,648 | 26.9% | 707,951 | 96.0% | $26.65 | $18,865,937 | 30.3% |
| Lighting | Hard Goods | 497,188 | 18.1% | 456,112 | 91.7% | $29.92 | $13,645,096 | 21.9% |
| 15th Floor | Soft Goods | 138,837 | 5.1% | 136,173 | 98.1% | $28.71 | $3,909,427 | 6.3% |
| 14th Floor | Soft Goods | 140,047 | 5.1% | 140,047 | 100.0% | $25.94 | $3,633,121 | 5.8% |
| Jewelry | Soft Goods | 124,165 | 4.5% | 113,457 | 91.4% | $29.27 | $3,321,169 | 5.3% |
| IHDC 1 | Hard Goods | 157,324 | 5.7% | 149,228 | 94.9% | $22.25 | $3,319,828 | 5.3% |
| Res. Design | Hard Goods | 133,592 | 4.9% | 133,592 | 100.0% | $19.00 | $2,538,818 | 4.1% |
| 13th Floor | Soft Goods | 84,091 | 3.1% | 82,029 | 97.5% | $29.63 | $2,430,409 | 3.9% |
| Accent 5 | Hard Goods | 141,644 | 5.2% | 131,802 | 93.1% | $17.24 | $2,272,868 | 3.7% |
| Accent 6 | Hard Goods | 136,757 | 5.0% | 126,918 | 92.8% | $16.78 | $2,129,445 | 3.4% |
| Childrens | Soft Goods | 78,041 | 2.8% | 71,860 | 92.1% | $24.32 | $1,747,391 | 2.8% |
| IHDC 2 | Hard Goods | 167,438 | 6.1% | 88,071 | 52.6% | $19.73 | $1,737,505 | 2.8% |
| WTC 1st Floor | Hard Goods | 46,325 | 1.7% | 46,325 | 100.0% | $26.93 | $1,247,642 | 2.0% |
| Western On 10 | Soft Goods | 66,606 | 2.4% | 25,703 | 38.6% | $33.60 | $863,604 | 1.4% |
| Menswear | Soft Goods | 19,709 | 0.7% | 19,709 | 100.0% | $20.75 | $408,936 | 0.7% |
| Office/Storage | Other | 35,481 | 1.3% | 31,898 | 89.9% | $4.52 | $144,151 | 0.2% |
| Dec. Acc. | Hard Goods | 3,108 | 0.1% | 2,253 | 72.5% | $11.00 | $24,783 | 0.0% |
| Amenity | Other | 38,549 | 1.4% | 38,549 | 100.0% | $0.00 | $0 | 0.0% |
| Total / Wtd. Avg. | | 2,746,550 | 100.0% | 2,501,677 | 91.1% | $24.88 | $62,240,131 | 100.0% |
| (1) | Based on the underwritten rent roll dated March 31, 2024. |
The following table presents a summary regarding the Rental Revenue by Permanent/Temporary status at the Dallas Market Center Property:
| | FYE 2018(1) | FYE 2019(1) | FYE 2020(1) | FYE 2021(1) | FYE 2022(1) | FYE 2023(1) | FYE 2024(1) |
| Permanent Revenue ($) | $56,485,618 | $55,366,986 | $54,948,062 | $48,867,662 | $52,589,621 | $55,234,047 | $57,760,787 |
| Temporary Revenue ($) | $11,212,786 | $11,705,982 | $12,210,858 | $7,670,144 | $17,717,485 | $23,786,176 | $25,912,064 |
| Total Rental Revenue ($) | $67,698,404 | $67,072,968 | $67,158,920 | $56,537,806 | $70,307,106 | $79,020,223 | $83,672,851 |
| (1) | FYE represents a Fiscal Year End at the end of February each annual period. |
| THE INFORMATION IN THIS STRUCTURAL AND COLLATERAL TERM SHEET IS NOT COMPLETE AND MAY BE AMENDED PRIOR TO THE TIME OF SALE. THIS TERM SHEET IS NOT AN OFFER TO SELL THESE SECURITIES AND IT IS NOT A SOLICITATION OF AN OFFER TO BUY THESE SECURITIES IN ANY JURISDICTION WHERE THE OFFER OR SALE IS NOT PERMITTED. |
| | 138 | |
| Mixed Use - Merchandise Mart/Retail | Loan #13 | Cut-off Date Balance: | | $22,000,000 |
| 2000 North Stemmons Freeway and | Dallas Market Center | Cut-off Date LTV: | | 37.2% |
| 2050-2100 North Stemmons Freeway | | U/W NCF DSCR: | | 2.46x |
| Dallas, TX 75207 | | U/W NOI Debt Yield: | | 17.0% |
The following table presents a summary regarding the major tenants at the Dallas Market Center Property:
Major Tenants(1)(2)
| Tenant Name | Credit Rating (Fitch/Moody’s/ S&P)(3) | Tenant NRSF | % of NRSF | Annual U/W Rent | % of Total Annual U/W Rent | Annual U/W Rent PSF | Lease Expiration Date | Ext. Options | Term. Option (Y/N) |
| ONECOAST, LLC | NR/NR/NR | 31,764 | 1.2% | $1,143,510 | 1.8% | $36.00 | 3/31/2031 | None | N |
| GOETZ, INC. | NR/NR/NR | 36,653 | 1.3% | $929,797 | 1.5% | $25.37 | 9/30/2025 | None | N |
| DIVERSE MARKETING | NR/NR/NR | 34,747 | 1.3% | $857,100 | 1.4% | $24.67 | Various | None | N |
| KUZCO LIGHTING, LLC | NR/NR/NR | 23,667 | 0.9% | $775,804 | 1.2% | $32.78 | 8/31/2025 | None | N |
| VISUAL COMFORT & CO. | NR/NR/NR | 26,027 | 0.9% | $713,964 | 1.1% | $27.43 | 7/31/2028 | None | N |
| ANNE MCGILVRAY AND COMPANY | NR/NR/NR | 23,498 | 0.9% | $702,396 | 1.1% | $29.89 | Various | None | N |
| IVYSTONE GROUP, LLC | NR/NR/NR | 25892 | 0.9% | $617,742 | 1.0% | $23.86 | 10/31/2028 | None | N |
| PROGRESS LIGHTING, INC. | NR/NR/NR | 20,712 | 0.8% | $612,247 | 1.0% | $29.56 | 9/30/2027 | None | N |
| DON BERNARD & ASSOCIATES, LLC | NR/NR/NR | 23,174 | 0.8% | $602,107 | 1.0% | $25.98 | Various | None | N |
| K. GRAVES & A. GRAVES, INC. | NR/NR/NR | 34,517 | 1.3% | $571,040 | 0.9% | $16.54 | 11/30/2026 | None | N |
| Total/Wtd. Avg. | | 280,651 | 10.2% | $7,525,706 | 12.1% | $26.82 | | | |
| | | | | | | | | | |
| Non-Major Tenants | | 2,221,026 | 80.9% | $54,714,426 | 87.9% | $24.63 | | | |
| | | | | | | | | | |
| Occupied Collateral Total | | 2,501,677 | 91.1% | $62,240,131 | 100.0% | $24.88 | | | |
| Vacant Space | | 244,873 | 8.9% | | | | | | |
| Total/Wtd. Avg. | | 2,746,550 | 100.0% | | | | | | |
| (1) | Only includes tenants who occupy permanent space. |
| (2) | Based on the underwritten rent roll dated March 31, 2024, inclusive of rent steps through May 31, 2025. |
| (3) | Certain ratings are those of the parent company whether or not the parent guarantees the lease. |
The following table presents certain information relating to the lease rollover schedule at the Dallas Market Center Property:
Lease Expiration Schedule(1)(2)
Year Ending
December 31, | No. of Leases Expiring | Expiring NRSF | % of Total NRSF | Cumulative Expiring NRSF | Cumulative % of Total NRSF | Annual
U/W
Base Rent | % of Total Annual U/W Base Rent | Annual
U/W
Base Rent
PSF |
| MTM | 38 | 67,710 | 2.5% | 67,710 | 2.5% | $294,975 | 0.5% | $4.36 |
| 2024 | 194 | 342,834 | 12.5% | 410,544 | 14.9% | $8,176,047 | 13.1% | $23.85 |
| 2025 | 295 | 686,955 | 25.0% | 1,097,500 | 40.0% | $17,018,345 | 27.3% | $24.77 |
| 2026 | 208 | 521,007 | 19.0% | 1,618,506 | 58.9% | $13,402,426 | 21.5% | $25.72 |
| 2027 | 87 | 421,410 | 15.3% | 2,039,916 | 74.3% | $11,015,915 | 17.7% | $26.14 |
| 2028 | 44 | 240,068 | 8.7% | 2,279,984 | 83.0% | $6,209,708 | 10.0% | $25.87 |
| 2029 | 28 | 152,892 | 5.6% | 2,432,876 | 88.6% | $3,998,014 | 6.4% | $26.15 |
| 2030 | 2 | 27,216 | 1.0% | 2,460,092 | 89.6% | $809,644 | 1.3% | $29.75 |
| 2031 | 1 | 31,764 | 1.2% | 2,491,856 | 90.7% | $1,143,510 | 1.8% | $36.00 |
| 2032 | 1 | 8,517 | 0.3% | 2,500,373 | 91.0% | $127,755 | 0.2% | $15.00 |
| 2033 | 0 | 0 | 0.0% | 2,500,373 | 91.0% | $0 | 0.0% | $0.00 |
| 2034 | 0 | 0 | 0.0% | 2,500,373 | 91.0% | $0 | 0.0% | $0.00 |
| 2035 & Beyond | 1 | 1,303 | 0.0% | 2,501,677 | 91.1% | $43,792 | 0.1% | $33.60 |
| Vacant | 0 | 244,873 | 8.9% | 2,746,550 | 100.0% | $0 | 0.0% | $0.00 |
| Total/Weighted Average | 899 | 2,746,550 | 100.0% | | | $62,240,131 | 100.0% | $24.88(3) |
| (1) | Based on the underwritten rent roll dated March 31, 2024, inclusive of rent steps through May 31, 2025. |
| (2) | Certain tenants may have lease termination options that are exercisable prior to the stated expiration date of the subject lease or leases which are not considered in the Lease Expiration Schedule. |
| (3) | Total/Weighted Average Annual U/W Base Rent PSF excludes vacant space. |
| THE INFORMATION IN THIS STRUCTURAL AND COLLATERAL TERM SHEET IS NOT COMPLETE AND MAY BE AMENDED PRIOR TO THE TIME OF SALE. THIS TERM SHEET IS NOT AN OFFER TO SELL THESE SECURITIES AND IT IS NOT A SOLICITATION OF AN OFFER TO BUY THESE SECURITIES IN ANY JURISDICTION WHERE THE OFFER OR SALE IS NOT PERMITTED. |
| | 139 | |
| Mixed Use - Merchandise Mart/Retail | Loan #13 | Cut-off Date Balance: | | $22,000,000 |
| 2000 North Stemmons Freeway and | Dallas Market Center | Cut-off Date LTV: | | 37.2% |
| 2050-2100 North Stemmons Freeway | | U/W NCF DSCR: | | 2.46x |
| Dallas, TX 75207 | | U/W NOI Debt Yield: | | 17.0% |
The following table presents historical occupancy percentages at the Dallas Market Center Property:
Historical Occupancy(1)(2)
FYE 2020 | FYE 2021 | FYE 2022 | FYE 2023 | FYE 2024 | 3/31/2024 |
| 86.0% | 84.0% | 83.4% | 88.2% | 89.5% | 91.1% |
| (1) | Information obtained from the borrower. |
| (2) | FYE represents a Fiscal Year End at the end of February each annual period. |
Operating History and Underwritten Net Cash Flow. The following table presents certain information relating to the historical operating performance and underwritten net cash flow at the Dallas Market Center Property:
Cash Flow Analysis
| | FYE February 2020 | FYE February 2021 | FYE February 2022 | FYE February 2023 | FYE February 2024 | U/W | %(1) | U/W $
per SF(2) |
| Base Rent (Permanent)(3) | $54,948,062 | $48,867,662 | $52,589,621 | $55,234,047 | $57,760,787 | $62,240,131 | 62.5% | $22.66 |
| Base Rent (Temporary) | 12,210,858 | 7,670,144 | 17,717,485 | 23,786,176 | 25,912,064 | 25,577,623 | 25.7 | 9.31 |
| Grossed Up Vacant Space(4) | 0 | 0 | 0 | 0 | 0 | 6,026,679 | 6.0 | 2.19 |
| Ground Rent Income(5) | 0 | 0 | 0 | 0 | 0 | 256,356 | 0.3 | 0.09 |
| Other Revenue | 4,134,506 | 2,166,624 | 4,279,949 | 5,513,897 | 5,583,678 | 5,522,654 | 5.5 | 2.01 |
| Net Rental Income | $71,293,426 | $58,704,430 | $74,587,055 | $84,534,120 | $89,256,529 | $99,623,443 | 100.0% | $36.27 |
| Less Vacancy | 0 | 0 | 0 | 0 | 0 | (6,026,679) | (6.0) | (2.19) |
| Less Credit Loss | (198,600) | (2,330,350) | 955,400 | 316,629 | (124,600) | (282,600) | (0.3) | (0.10) |
| Effective Gross Income | $71,094,826 | $56,374,080 | $75,542,455 | $84,850,749 | $89,131,929 | $93,314,164 | 93.7% | $33.98 |
| | | | | | | | | |
| Real Estate Taxes | 2,919,551 | 2,822,306 | 2,667,899 | 2,684,342 | 2,489,048 | 2,999,888 | 3.2 | 1.09 |
| Insurance | 721,385 | 894,142 | 1,034,696 | 1,283,145 | 3,305,875 | 3,759,707 | 4.0 | 1.37 |
| Ground Rent | 256,365 | 256,365 | 256,365 | 256,365 | 256,356 | 256,356 | 0.3 | 0.09 |
| Management Fee | 2,682,073 | 2,621,244 | 2,708,560 | 3,331,952 | 3,404,981 | 3,732,567 | 4.0 | 1.36 |
| Other Expenses | 36,268,938 | 27,724,174 | 34,619,586 | 42,202,230 | 43,248,030 | 42,161,763 | 45.2 | 15.35 |
| Total Expenses | $42,848,312 | $34,318,231 | $41,287,106 | $49,758,034 | $52,704,290 | $52,910,281 | 56.7% | $19.26 |
| | | | | | | | | |
| Net Operating Income(6) | $28,246,514 | $22,055,849 | $34,255,349 | $35,092,715 | $36,427,639 | $40,403,884 | 43.3% | $14.71 |
| TI/LC(7) | 0 | 0 | 0 | 0 | 0 | 1,268,250 | 1.4 | 0.46 |
| Capital Expenditures | 0 | 0 | 0 | 0 | 0 | 631,706 | 0.7 | 0.23 |
| Net Cash Flow | $28,246,514 | $22,055,849 | $34,255,349 | $35,092,715 | $36,427,639 | $38,503,927 | 41.3% | $14.02 |
| | | | | | | | | |
| NOI DSCR(8) | 1.81x | 1.41x | 2.19x | 2.25x | 2.33x | 2.59x | | |
| NCF DSCR(8) | 1.81x | 1.41x | 2.19x | 2.25x | 2.33x | 2.46x | | |
| NOI Debt Yield(8) | 11.9% | 9.3% | 14.5% | 14.8% | 15.4% | 17.0% | | |
| NCF Debt Yield(8) | 11.9% | 9.3% | 14.5% | 14.8% | 15.4% | 16.2% | | |
| (1) | Represents (i) percent of Net Rental Income for all revenue fields and Vacancy and (ii) percent of Effective Gross Income for all other fields. |
| (2) | U/W $ per SF is based on the total permanent collateral SF of 2,746,550. |
| (3) | Base Rent (Permanent) is based on the underwritten rent roll dated March 31, 2024, inclusive of rent steps through May 31, 2025. |
| (4) | Grossed Up Vacant Space is based on grossed up rent for vacant permanent suites. |
| (5) | Ground Rent Income is net-zero with ground rent given the mortgage alone is secured by both the leasehold and leased fee interest. |
| (6) | The increase from Most Recent NOI (TTM 2/29/2024) to UW NOI is primarily due to the inclusion of U/W rent steps through May 31, 2025 recent leasing that occurred in Q1 2024. |
| (7) | Leasing Commissions are not provided, as all leasing is handled in-house by Dallas Market Center property management. |
| (8) | Debt service coverage ratios and debt yields are based on the Dallas Market Center Whole Loan. |
| THE INFORMATION IN THIS STRUCTURAL AND COLLATERAL TERM SHEET IS NOT COMPLETE AND MAY BE AMENDED PRIOR TO THE TIME OF SALE. THIS TERM SHEET IS NOT AN OFFER TO SELL THESE SECURITIES AND IT IS NOT A SOLICITATION OF AN OFFER TO BUY THESE SECURITIES IN ANY JURISDICTION WHERE THE OFFER OR SALE IS NOT PERMITTED. |
| | 140 | |
| Mixed Use - Merchandise Mart/Retail | Loan #13 | Cut-off Date Balance: | | $22,000,000 |
| 2000 North Stemmons Freeway and | Dallas Market Center | Cut-off Date LTV: | | 37.2% |
| 2050-2100 North Stemmons Freeway | | U/W NCF DSCR: | | 2.46x |
| Dallas, TX 75207 | | U/W NOI Debt Yield: | | 17.0% |
Market Overview and Competition. Wholesale trade marts, also known as market centers, are permanent venues that provide buyers of wholesale goods the opportunity to view and purchase a variety of merchandise in one location. Trade marts offer manufacturers and sales representatives centralized permanent showrooms for year-round exhibition of their products. By leasing permanent showroom space, a manufacturer or sales representative gains access to a year-round sales facility as well as the ability to participate in various trade shows that are held throughout the year. Some trade marts, including Dallas Market Center, offer temporary trade show exhibition space that allows manufacturers or sales representatives to showcase their products during specific trade shows throughout the year. Temporary space can also potentially serve as an incubator for permanent tenants. Once tenants have leased temporary exhibition space, the hosting market is often well positioned to convert them into permanent tenants.
Trade shows, or markets, are short-term, seasonally recurring events that typically last between two to seven days and focus on a specific industry or related group of industries. A trade show is typically held at the same location each year and serves as both a transactional opportunity and a networking and educational experience for members of the retail community. There are thousands of different trade shows held annually across the globe at wholesale trade marts, arenas, and convention centers. Trade shows differ in size and geographic focus by catering to local, regional, national, or international buyers. Trade shows are most prominent in industries with many manufacturers and products that change frequently or require physical inspection before purchase. Successful trade shows have a broad offering of merchandise and are well attended by a variety of retail buyers.
The Dallas Market Center Property has a limited competitive set given its size and scope. The Dallas Market Center Property has three true competitors, which are all owned and operated by the same company, Andmore (previously International Market Centers):
— Andmore Atlanta Market: The Andmore Atlanta Market is primarily active in the gift industry, with a small collection of apparel and home products. Rental rates at the Atlanta market are reportedly higher than DMC, causing many tenants to vacate the property after not reaching desired returns. The Atlanta Market also lacks strong daily traffic, compared to DMC, which receives daily business from retail buyers across all industry groups. Lastly, the pandemic exacerbated safety concerns in the area surrounding the Atlanta Market, causing a decrease in attendance from retail buyers and a subsequent decrease in demand from wholesalers.
— Andmore High Point Market: The Andmore High Point Market is primarily competitive in the home industry. The High Point Market spans across multiple buildings and several blocks, making it potentially more challenging to navigate compared to DMC, which is connected and organized by industry group. High Point Market is also comparatively expensive to travel to and does not have as well suited of an infrastructure to accommodate trade show demand. Lastly, retailers and designers tend to browse at High Point Market and do not often receive orders. Wholesalers at Dallas Market Center reportedly regularly receive orders from retail buyers that initially browsed at High Point Market.
— Andmore Las Vegas Market: The Andmore Las Vegas Market is primarily active in the home & design and gift industries. The Las Vegas Market is reportedly struggling with rising vacancy rates, causing a domino effect of vacancies among other tenants as “industry mass” weakens. Without industry mass, retail buyers do not attend markets and sales decline. The Las Vegas Market also incurs higher expenses and spends more time organizing trade shows due to unions. Lastly, retail buyers’ dwell time at the property is reportedly brief, as many visiting retailers make time to visit tourist attractions in the city.
| THE INFORMATION IN THIS STRUCTURAL AND COLLATERAL TERM SHEET IS NOT COMPLETE AND MAY BE AMENDED PRIOR TO THE TIME OF SALE. THIS TERM SHEET IS NOT AN OFFER TO SELL THESE SECURITIES AND IT IS NOT A SOLICITATION OF AN OFFER TO BUY THESE SECURITIES IN ANY JURISDICTION WHERE THE OFFER OR SALE IS NOT PERMITTED. |
| | 141 | |
| No. 14 – Forest Green Apt. Corp. |
| |
| Mortgage Loan Information | | Mortgaged Property Information |
| Mortgage Loan Seller: | National Cooperative Bank, N.A. | | Single Asset/Portfolio: | Single Asset |
Credit Assessment (Fitch/KBRA/Moody’s): | NR/AAA(sf)/Aaa(sf) | | Property Type – Subtype: | Multifamily – Cooperative |
| Original Principal Balance: | $20,400,000 | | Location: | Islip, NY 11751 |
| Cut-off Date Balance: | $20,400,000 | | Size (4): | 253 Units |
| % of Initial Pool Balance: | 2.9% | | Cut-off Date Balance Unit: | $80,632 |
| Loan Purpose: | Refinance | | Maturity Date Balance Per Unit: | $80,632 |
| Borrower Sponsors (1): | NAP | | Year Built/Renovated: | 1965/2021 |
| Guarantors: | NAP | | Title Vesting: | Fee |
| Mortgage Rate: | 6.3900% | | Property Manager: | Einsidler Management, Inc. |
| Note Date: | June 28, 2024 | | Current Occupancy (As of): | 94.0% (February 5, 2024) |
| Seasoning: | 1 month | | YE 2023 Occupancy (5): | NAP |
| Maturity Date: | July 1, 2034 | | YE 2022 Occupancy (5): | NAP |
| IO Period: | 120 months | | YE 2021 Occupancy (5): | NAP |
| Loan Term (Original): | 120 months | | As-Is Appraised Value (6): | $72,500,000 |
| Amortization Term (Original): | 0 months | | As-Is Appraised Value Per Unit (6): | $286,561 |
| Loan Amortization Type: | Interest Only | | As-Is Appraisal Valuation Date: | February 5, 2024 |
| Call Protection: | YM1(113),1%(3),O(4) | | Coop-Rental Value (7): | $73,400,000 |
| Lockbox Type: | None | | | |
| Additional Debt (2): | Revolving Line of Credit | | | |
| Additional Debt Type (Balance)(2): | $0 | | Underwriting and Financial Information |
| Future Debt Permitted (Type)(3): | Yes (Secured) | | TTM NOI (8): | NAP |
| | | | YE 2023 NOI (8): | NAP |
| | | YE 2022 NOI (8): | NAP |
| Escrows and Reserves | | YE 2021 NOI (8): | NAP |
| | Initial | Monthly | Cap | | U/W Revenues (9): | $6,955,925 |
| Taxes | $0 | Springing | NAP | | U/W Expenses (9): | $2,463,520 |
| Insurance | $0 | Springing | NAP | | U/W NOI (9): | $4,492,405 |
| Capital Improvements Escrow | $18,750 | $0 | NAP | | U/W NCF (9): | $4,403,505 |
| Maintenance Arrears Escrows | $250,000 | $0 | NAP | | U/W DSCR based on NOI/NCF(9): | 3.40x / 3.33x |
| | | | | | U/W Debt Yield based on NOI/NCF(9): | 22.0% / 21.6% |
| | | | | | U/W Debt Yield at Maturity based on NOI/NCF(9) | 22.0% / 21.6% |
| | | | | | Cut-off Date LTV Ratio(6): | 28.1% |
| | | | | | LTV Ratio at Maturity (6): | 28.1% |
| | | | | | Coop-Rental Cut-off LTV Ratio(7): | 27.8% |
| | | | | | Coop-Rental LTV Ratio at Maturity(7): | 27.8% |
| | | | | | | |
| | | | | | | | |
| Sources and Uses |
| Sources | | | | Uses | | |
| Mortgage Loan Amount | $20,400,000 | 100.0% | | Loan Payoff | $16,240,001 | 79.6% |
| | | | | Upfront Reserves | 268,750 | 1.3 |
| | | | | Proceeds To Borrower | 3,459,625 | 17.0 |
| | | | | Closing Costs | 431,625 | 2.1 |
| Total Sources | $20,400,000 | 100.0% | | Total Uses | $20,400,000 | 100.0% |
| (1) | See “The Borrower and Borrower Sponsor” section. |
| (2) | The Forest Green Apt. Corp. Property (as defined below) also secures a subordinate second lien mortgage loan to the borrower in the amount of up to $500,000 (the “Forest Green Apt. Corp. Subordinate Loan”) which permits advances from time to time. The outstanding balance of the Forest Green Apt. Corp. Subordinate Loan as of the Cut-off Date is $0. National Cooperative Bank, N.A. is the holder of the Forest Green Apt. Corp. Subordinate Loan. With regard to the interest rate, term, payment terms and other statistical information relating to the Forest Green Apt. Corp. Subordinate Loan, see “Description of the Mortgage Pool—Additional Indebtedness—Other Secured Indebtedness—Additional Debt Financing For Mortgage Loans Secured by Residential Cooperatives” in the prospectus. All statistical information presented above relating to balances per unit, debt yields, debt service coverage ratios and loan-to-value ratios are based solely on the Forest Green Apt. Corp. Mortgage Loan (as defined below). |
| (3) | In addition to the Forest Green Apt. Corp. Subordinate Loan as described in footnote (2) above, National Cooperative Bank, N.A., the applicable master servicer of the Forest Green Apt. Corp. Mortgage Loan, will be permitted to waive the enforcement of the “due-on-encumbrance” clause in the related mortgage instrument to permit subordinate debt secured by the Forest Green Apt. Corp. Property, subject to the satisfaction of various conditions and subject to certain parameters set forth in the pooling and servicing agreement for the WFCM 2024-C63 securitization transaction. See “Description of the Mortgage Pool—Additional Indebtedness—Other Secured Indebtedness—Additional Debt Financing For Mortgage Loans Secured by Residential Cooperatives” in the prospectus. |
| (4) | Based solely on residential units with shares and excludes a superintendent’s unit without shares, which is owned by the borrower. |
| (5) | YE 2021 Occupancy, YE 2022 Occupancy and YE 2023 Occupancy are not reported as all residential units are owned by tenant-shareholders or the cooperative investor. Current Occupancy reported as of February 5, 2024 reflects the assumption in the related appraisal for the purpose of determining the appraised value of the Forest Green Apt. Corp. Property as a multifamily rental (i.e, the Coop- Rental Value) as of the appraisal valuation date. |
| THE INFORMATION IN THIS STRUCTURAL AND COLLATERAL TERM SHEET IS NOT COMPLETE AND MAY BE AMENDED PRIOR TO THE TIME OF SALE. THIS TERM SHEET IS NOT AN OFFER TO SELL THESE SECURITIES AND IT IS NOT A SOLICITATION OF AN OFFER TO BUY THESE SECURITIES IN ANY JURISDICTION WHERE THE OFFER OR SALE IS NOT PERMITTED. |
| | 142 | |
| Multifamily - Cooperative | Loan #14 | Cut-off Date Balance: | | $20,400,000 |
| 2433-2453 Union Boulevard | Forest Green Apt. Corp. | Cut-off Date LTV: | | 28.1% |
| Islip, NY 11751 | | UW NCF DSCR: | | 3.33x |
| | | UW NOI Debt Yield: | | 22.0% |
| (6) | For purposes of determining the As-Is Appraised Value, the As-Is Appraised Value per Unit, the Cut-off Date LTV Ratio and the LTV Ratio at Maturity, the value estimate reflected in the appraisal of the Forest Green Apt. Corp. Property is determined as if such residential cooperative property is operated as a residential cooperative and, such value equals the sum of (i) the gross share value of all cooperative units in such residential cooperative property, based in part on various comparable sales of cooperative apartment units in the market, plus (ii) the amount of the underlying debt encumbering such residential cooperative property. See “Description of the Mortgage Pool-Certain Characteristics of Mortgage Loans Secured by Residential Cooperatives” in the prospectus. |
| (7) | The Coop-Rental Value, the Coop-Rental Cut-off LTV Ratio and Coop-Rental LTV Ratio at Maturity assumes the Forest Green Apt. Corp. Property is operated as a multifamily rental property. See “Risk Factors—Risks Relating to the Mortgage Loans—Residential Cooperative Properties Have Special Risks,” and “Description of the Mortgage Pool—Property Types—Multifamily Properties” in the prospectus. |
| (8) | TTM NOI, YE 2023 NOI, YE 2022 NOI, and YE 2021 NOI are not available. Residential cooperatives are not-for-profit entities that set maintenance fees to cover current expenses and plan for future capital needs. A residential cooperative can increase or decrease maintenance fees according to its anticipated expenses and level of cash reserves. The historical NOI figures are not representative of the cash flow generated by the Forest Green Apt. Corp. Property if it were operated as a multifamily rental property. |
| (9) | See “Underwritten Net Cash Flow” section below. |
The Mortgage Loan. The mortgage loan (the “Forest Green Apt. Corp. Mortgage Loan”) is evidenced by a promissory note in the original principal amount of $20,400,000 and secured by a first priority fee interest in the residential cooperative comprised of 253 residential units with appurtenant cooperative shares and proprietary leases in a project comprised of ten buildings located in Islip, Suffolk County, New York (the “Forest Green Apt. Corp. Property”).
The Borrower and Borrower Sponsor. The borrower is Forest Green Apt. Corp., a cooperative housing corporation organized under the laws of the State of New York. No individual or entity (other than the borrower) has recourse obligations with respect to the Forest Green Apt. Corp. Mortgage Loan, including pursuant to any guaranty or environmental indemnity. At the time of the cooperative conversion, certain of the residential units were not purchased by eligible existing residents. Those unsold units, and their appurtenant cooperative shares and proprietary leases, were acquired by the cooperative sponsor and subsequently transferred to an investor, Loric Tower Properties.
The Property. The Forest Green Apt. Corp. Property is a residential apartment building, owned as a cooperative, containing 253 residential units with shares and one superintendent’s unit without shares. Built from 1965-1969 and incorporated as a cooperative in 1987, The subject has a gross building area of 240,046 SF and a net saleable area of 183,700 SF. Amenities at the subject include onsite laundry, parking and a pool, which are income producing to the cooperative. There is also a community kitchen and fitness room. The Forest Green Apt. Corp. Property is 99.2% sold (with 251 units owned by tenant-shareholders) and 0.8% unsold (with 2 units owned by an investor) see “The Borrower and Borrower Sponsor” section.
The table below presents the residential apartment unit mix at the Forest Green Apt. Corp. Property.
| Unit Mix |
| Unit Type | Units | SF | % of Total Units |
| Studio | 8 | 425 | 3.2% |
| 1 Bedroom | 188 | 684 | 74.3% |
| 2 Bedroom | 55 | 900 | 21.7% |
| 3 Bedroom | 2 | 1,100 | 0.8% |
| Total/Wtd. Avg. | 253 | 726 | 100.0% |
Market Overview. The Forest Green Apt. Corp. Property is located in the Town of Islip, New York, within the ‘Southwestern Suffolk Submarket’. The Forest Green Apt. Corp. Property is located in close proximity to the Islip train station, which provides access to the Long Island Railroad. The subject is also in close proximity from the main retail strip, Main Street, which is where national and local retailers are located. The Southwestern Suffolk Submarket had a vacancy rate of 7.2% as of the end of Q2 2024, according to a third-party market research report.
| THE INFORMATION IN THIS STRUCTURAL AND COLLATERAL TERM SHEET IS NOT COMPLETE AND MAY BE AMENDED PRIOR TO THE TIME OF SALE. THIS TERM SHEET IS NOT AN OFFER TO SELL THESE SECURITIES AND IT IS NOT A SOLICITATION OF AN OFFER TO BUY THESE SECURITIES IN ANY JURISDICTION WHERE THE OFFER OR SALE IS NOT PERMITTED. |
| | 143 | |
| Multifamily - Cooperative | Loan #14 | Cut-off Date Balance: | | $20,400,000 |
| 2433-2453 Union Boulevard | Forest Green Apt. Corp. | Cut-off Date LTV: | | 28.1% |
| Islip, NY 11751 | | UW NCF DSCR: | | 3.33x |
| | | UW NOI Debt Yield: | | 22.0% |
The following table presents certain information relating to the multifamily rental properties comparable to the Forest Green Apt. Corp. Property:
Market Rent Summary (1)
| Property | Year Built (2) | Unit Type | Size (SF) (2) | Average Monthly Rent per Unit | Average Annual Rent Per SF |
| Forest Green Apt. Corp. | 1965 | Studio | 425 | $1,622 | $3.82 |
| | | 1 BR | 684 | $2,306 | $3.37 |
| | | 2 BR | 900 | $2,700 | $3.00 |
| | | 3 BR | 1,100 | $3,163 | $2.88 |
| 31 Willoughby Place | NAV | Studio | 404 | $1,500 | $3.71 |
| 12 Gillette Avenue | NAV | Studio | 300 | $1,700 | $5.67 |
| 359 Main Street | NAV | 1 BR | NAV | $2,001 | NAV |
| 280 Bellmore Avenue | 1975 | 1 BR | 620 | $2,471 | $3.99 |
| | | 2 BR | 951 | $2,799 | $2.94 |
| 265 East Main Street | 1983 | 1 BR | 646 | $2,648 | $4.10 |
| 255 East Main Street | 1983 | 1 BR | 646 | $2,272 | $3.52 |
| | | 2 BR | 822 | $2,548 | $3.10 |
| 80 Grant Avenue | NAV | 2 BR | 491 | $2,472 | $5.04 |
| 255 East Main Street | 1983 | 2 BR | 822 | $2,548 | $3.10 |
| 39 Cooper Street | 1988 | 3 BR | NAV | $3,040 | NAV |
| (1) | The rents for the comparable properties are based on unit rents used by the appraiser in the income capitalization approach, prior to adjustments. Rents used for the Forest Green Apt. Corp. Property are based on the appraisal’s concluded market rents. |
| (2) | Size (SF) and Year Built for the comparable properties were sourced from various internet resources. |
| THE INFORMATION IN THIS STRUCTURAL AND COLLATERAL TERM SHEET IS NOT COMPLETE AND MAY BE AMENDED PRIOR TO THE TIME OF SALE. THIS TERM SHEET IS NOT AN OFFER TO SELL THESE SECURITIES AND IT IS NOT A SOLICITATION OF AN OFFER TO BUY THESE SECURITIES IN ANY JURISDICTION WHERE THE OFFER OR SALE IS NOT PERMITTED. |
| | 144 | |
| Multifamily - Cooperative | Loan #14 | Cut-off Date Balance: | | $20,400,000 |
| 2433-2453 Union Boulevard | Forest Green Apt. Corp. | Cut-off Date LTV: | | 28.1% |
| Islip, NY 11751 | | UW NCF DSCR: | | 3.33x |
| | | UW NOI Debt Yield: | | 22.0% |
Underwritten Net Cash Flow. The following table presents certain information relating to the underwritten net cash flow at the Forest Green Apt. Corp. Property:
Cash Flow Analysis
| Cash Flow Analysis (1) |
| | UW | UW Per Unit |
| Gross Potential Rent | 7,215,720 | $28,521 |
| Other Income (2) | 184,200 | 728 |
| Less Vacancy & Credit Loss (3) | (443,995) | (1,755) |
| Effective Gross Income | $6,955,925 | $27,494 |
| | | |
| Real Estate Taxes | $1,111,519 | $4,393 |
| Insurance | 276,053 | 1,091 |
| Other Expenses | 1,075,948 | 4,253 |
| Total Expenses | $2,463,520 | $9,737 |
| | | |
| Net Operating Income | $4,492,405 | $17,757 |
| Replacement Reserves | 88,900 | 351 |
| Net Cash Flow | $4,403,505 | $17,405 |
| | | |
| Occupancy % (3) | 94.0% | |
| NOI DSCR (4) | 3.40x | |
| NCF DSCR (4) | 3.33x | |
| NOI Debt Yield (4) | 22.0% | |
| NCF Debt Yield (4) | 21.6% | |
| (1) | Residential cooperatives are generally organized and operated as not-for-profit entities that set maintenance fees to cover current expenses and plan for future capital needs. The UW Net Operating Income and the UW Net Cash Flow for the Forest Green Apt. Corp. Property are the projected net operating income and the projected net cash flow, respectively, reflected in the appraisal. The projected net operating income, in general, equals projected effective gross income at the Forest Green Apt. Corp. Property assuming that it is operated as a multifamily rental property with rents and other income set at the prevailing market rates, reduced by underwritten property operating expenses and a market-rate vacancy assumption, in each case as determined by the appraiser. While such projected net operating income assumes the Forest Green Apt. Corp. Property is rented at market rates, all or a portion of the residential cooperative units at the Forest Green Apt. Corp. Property were rent restricted prior to the cooperative conversion and accordingly would again be subject to rent restrictions if the Forest Green Apt. Corp. Property were operated as a multifamily rental property. The projected net cash flow equals the projected net operating income reduced by the projected replacement reserves as determined by the appraiser. The projected rental income used in such determinations differs materially from the scheduled monthly maintenance payments from the tenant-shareholders at the Forest Green Apt. Corp. Property. See “Risk Factors—Risks Relating to the Mortgage Loans—Residential Cooperative Properties Have Special Risks” in the prospectus. |
| (2) | Other Income includes Laundry Income and Storage Income. |
| (3) | Occupancy % and Vacancy & Credit Loss reported reflect the vacancy assumption in the related appraisal for purposes of determining the appraised value of the Forest Green Apt. Corp. Property as a multifamily rental property, including commercial income and other income. |
| (4) | Debt service coverage ratios and debt yields are based on the Forest Green Apt. Corp. Mortgage Loan only and do not include any subordinate debt. |
| THE INFORMATION IN THIS STRUCTURAL AND COLLATERAL TERM SHEET IS NOT COMPLETE AND MAY BE AMENDED PRIOR TO THE TIME OF SALE. THIS TERM SHEET IS NOT AN OFFER TO SELL THESE SECURITIES AND IT IS NOT A SOLICITATION OF AN OFFER TO BUY THESE SECURITIES IN ANY JURISDICTION WHERE THE OFFER OR SALE IS NOT PERMITTED. |
| | 145 | |
| No. 15 – 900 North Michigan |
| |
| Mortgage Loan Information | | Mortgaged Property Information |
| Mortgage Loan Seller: | Goldman Sachs Mortgage Company | | Single Asset/Portfolio: | Single Asset |
| Credit Assessment (Fitch/KBRA/Moody’s): | NR/NR/NR | | Property Type – Subtype: | Mixed Use – Retail/Office |
| Original Principal Balance(1): | $20,000,000 | | Location: | Chicago, IL |
| Cut-off Date Balance(1): | $20,000,000 | | Size: | 831,350 SF |
| % of Initial Pool Balance: | 2.8% | | Cut-off Date Balance Per SF(1): | $216.52 |
| Loan Purpose: | Refinance | | Maturity Date Balance Per SF(1): | $216.52 |
| Borrower Sponsor: | JMB Realty Corporation | | Year Built/Renovated: | 1988/2015-2018 |
| Guarantor: | JMB Realty Corporation | | Title Vesting: | Fee |
| Mortgage Rate: | 6.8530% | | Property Manager: | JMB Financial Advisors, LLC (borrower-related) |
| Note Date: | July 22, 2024 | | Current Occupancy (As of): | 88.8% (7/17/2024) |
| Seasoning: | 0 months | | YE 2023 Occupancy: | 93.9% |
| Maturity Date: | August 6, 2034 | | YE 2022 Occupancy: | 96.5% |
| IO Period: | 120 months | | YE 2021 Occupancy: | 96.9% |
| Loan Term (Original): | 120 months | | As-Is Appraised Value: | $315,000,000 |
| Amortization Term (Original): | NAP | | As-Is Appraised Value Per SF: | $378.90 |
| Loan Amortization Type: | Interest Only | | As-Is Appraisal Valuation Date: | May 29, 2024 |
| Call Protection(2): | L(24),D(89),O(7) | | |
| Lockbox Type: | Hard/Springing Cash Management | | Underwriting and Financial Information(1) |
| Additional Debt(1): | Yes | | YE 2023 NOI: | $26,715,339 |
| Additional Debt Type (Balance)(1): | Pari Passu ($160,000,000) | | YE 2022 NOI: | $25,795,686 |
| | | | YE 2021 NOI: | $26,702,341 |
| Escrows and Reserves | | U/W Revenues: | $56,031,359 |
| | Initial | Monthly | Cap | | U/W Expenses: | $33,262,367 |
| Taxes: | $2,586,212 | $1,293,106 | NAP | | U/W NOI: | $22,768,993 |
| Insurance: | $0 | Springing | NAP | | U/W NCF: | $22,103,101 |
| Replacement Reserve: | $0 | $18,705 | $831,350 | | U/W DSCR based on NOI/NCF: | 1.82x / 1.77x |
| TI/LC Reserve: | $5,000,000 | $166,667 | $10,000,000 | | U/W Debt Yield based on NOI/NCF: | 12.6% /12.3% |
| Other Reserves(3): | $13,552,345 | Springing | NAP | | U/W Debt Yield at Maturity based on NOI/NCF: | 12.6% /12.3% |
| | | | | | Cut-off Date LTV Ratio: | 57.1% |
| | | | | | LTV Ratio at Maturity: | 57.1% |
| | | | | | | | |
| Sources and Uses |
| Sources | | | | Uses | | |
| Whole Loan(1) | $180,000,000 | 76.2 | % | | Loan Payoff | $206,807,744 | 87.5 | % |
| Sponsor | 56,362,388 | 23.8 | | | Upfront Reserves | 21,138,557 | 8.9 | |
| | | | | Closing Costs | 8,416,086 | 3.6 | |
| | | | | | | |
| Total Sources | $236,362,388 | 100.0 | % | | Total Uses | $236,362,388 | 100.0 | % |
| (1) | The 900 North Michigan Mortgage Loan (as defined below) is part of a whole loan evidenced by three pari passu notes with an aggregate outstanding principal balance as of the Cut-off Date of $180.0 million (the “900 North Michigan Whole Loan”). The Underwriting and Financial Information in the chart above reflects the 900 North Michigan Whole Loan. |
| (2) | The lockout period will be at least 24 months beginning with and including the first payment date on September 6, 2024. Defeasance of the 900 North Michigan Whole Loan is permitted after the date that is the earlier of (i) two years from the closing date of the securitization that includes the last note to be securitized and (ii) July 22, 2027. The assumed lockout period is based on the anticipated closing date of the WFCM 2024-C63 securitization in August 2024. The actual lockout period may be longer. |
| (3) | Other Reserves represents an unfunded obligations reserve that consists of unpaid tenant improvements (approximately $9.1 million), future rent abatements (approximately $3.8 million) and unpaid leasing commissions (approximately $0.6 million). |
| THE INFORMATION IN THIS STRUCTURAL AND COLLATERAL TERM SHEET IS NOT COMPLETE AND MAY BE AMENDED PRIOR TO THE TIME OF SALE. THIS TERM SHEET IS NOT AN OFFER TO SELL THESE SECURITIES AND IT IS NOT A SOLICITATION OF AN OFFER TO BUY THESE SECURITIES IN ANY JURISDICTION WHERE THE OFFER OR SALE IS NOT PERMITTED. |
| | 146 | |
| Mixed Use – Retail/Office | Loan #15 | Cut-off Date Balance: | | $20,000,000 |
| 900 North Michigan Avenue | 900 North Michigan | Cut-off Date LTV: | | 57.1% |
| Chicago, IL 60611 | | U/W NCF DSCR: | | 1.77x |
| | | U/W NOI Debt Yield: | | 12.6% |
The Mortgage Loan. The fifteenth largest mortgage loan (the “900 North Michigan Mortgage Loan”) is part of a fixed rate whole loan secured by the borrower’s fee interest in a mixed use retail and office property located in Chicago, Illinois (the “900 North Michigan Property”). The 900 North Michigan Whole Loan is evidenced by three pari passu notes and accrues interest at a rate of 6.8530% per annum. The 900 North Michigan Whole Loan has a 10-year term, is interest-only for the entire term and accrues interest on an Actual/360 basis. The controlling Note A-1 is expected to be included in the BBCMS 2024-C28 securitization trust. The non-controlling Note A-2 will be included in the WFCM 2024-C63 securitization trust. The remaining non-controlling note A-3 is currently held by Goldman Sachs Bank USA (“GSBI”) and is expected to be contributed to one or more future securitization trust(s). The 900 North Michigan Whole Loan is expected to be serviced pursuant to the pooling and servicing agreement for the BBCMS 2024-C28 trust. See “Description of the Mortgage Pool—The Whole Loans—The Non-Serviced Pari Passu Whole Loans” and “Pooling and Servicing Agreement—Servicing of the Non-Serviced Mortgage Loans” in the Preliminary Prospectus.
Whole Loan Note Summary
| Note | Original Balance | Cut-off Date Balance | Note Holder | Controlling Piece |
| A-1 | $80,000,000 | $80,000,000 | BBCMS 2024-C28(2) | Yes |
| A-2 | 20,000,000 | 20,000,000 | WFCM 2024-C63 | No |
| A-3(1) | 80,000,000 | 80,000,000 | GSBI | No |
| Total | $180,000,000 | $180,000,000 | | |
| (1) | The note held by the GSBI is expected to be contributed to one or more future securitization transactions or may otherwise be transferred at any time. |
| (2) | The BBCMS 2024-C28 securitization transaction is expected to close on or about August 29, 2024. |
The Borrowers and Borrower Sponsor. The borrower under the 900 North Michigan Whole Loan is 900 North Michigan, LLC, a Delaware limited liability company and single purpose entity with two independent directors. Legal counsel to the borrower delivered a non-consolidation opinion in connection with the origination of the 900 North Michigan Whole Loan. The borrower sponsor and non-recourse carveout guarantor is JMB Realty Corporation (“JMB”), a Delaware corporation. JMB is a privately-owned real estate investment and development firm with more than 50 years of history. Based in Chicago, the company has real estate interests in Illinois, California, Texas and Hawaii.
The Property. The 900 North Michigan Property is an 831,350 square foot mixed use retail and office property located on the north end of the Magnificent Mile in Chicago, Illinois. Built in 1988 and renovated between 2015 and 2018, the 900 North Michigan Property has retail, office, medical office and parking components. The 900 North Michigan Property has approximately 469,000 square feet of vertical retail space with a remaining weighted-average lease term (a “WALT”) of 4.1 years, approximately 305,000 square feet of general office space with a WALT of 4.1 years, approximately 13,000 square feet of high street retail space with a WALT of 3.3 years and approximately 44,000 square feet of medical office space with a WALT of 6.6 years. Additionally, the 900 North Michigan Property has a self-park garage with 1,325 spaces and a 225-space valet parking garage.
Major Tenants.
Bloomingdale’s (265,148 square feet; 31.9% of NRA; 6.4% of underwritten base rent): Founded in 1872 and headquartered in New York, New York, Bloomingdale’s is an American department store chain with over 2,500 employees located across the United States. Bloomingdale’s offers a variety of shopping services including stylists, beauty, gift shopping, tailoring and wedding registry. Bloomingdale’s has four, five-year extension options remaining.
Grosvenor Capital Mgmnt, L.P. (“GCM Grosvenor”) (72,738 square feet; 8.7% of NRA; 6.6% of underwritten base rent): GCM Grosvenor is a global alternatives asset manager with holdings across private equity, absolute return strategies, credit and other asset classes. Founded in 1971, GCM Grosvenor has $79 billion assets under management as of March 31, 2024. GCM Grosvenor has two, five-year extension options remaining.
Equinox (30,021 square feet; 3.6% of NRA; 4.2% of underwritten base rent): Equinox Group is an American luxury fitness company with over 100 fitness clubs located across the globe. Founded in 1991, Equinox Group’s portfolio of brands include Equinox Fitness Clubs, Equinox Hotels and SoulCycle, amongst others.
The following table presents certain information relating to the historical occupancy of the 900 North Michigan Property:
| Historical and Current Occupancy(1) |
| 2021 | 2022 | 2023 | Current(2) |
| 96.9% | 96.5% | 93.9% | 88.8% |
| (1) | Historical occupancies are as of December 31 for each respective year unless otherwise indicated. |
| (2) | Current occupancy is as of July 17, 2024. |
| THE INFORMATION IN THIS STRUCTURAL AND COLLATERAL TERM SHEET IS NOT COMPLETE AND MAY BE AMENDED PRIOR TO THE TIME OF SALE. THIS TERM SHEET IS NOT AN OFFER TO SELL THESE SECURITIES AND IT IS NOT A SOLICITATION OF AN OFFER TO BUY THESE SECURITIES IN ANY JURISDICTION WHERE THE OFFER OR SALE IS NOT PERMITTED. |
| | 147 | |
| Mixed Use – Retail/Office | Loan #15 | Cut-off Date Balance: | | $20,000,000 |
| 900 North Michigan Avenue | 900 North Michigan | Cut-off Date LTV: | | 57.1% |
| Chicago, IL 60611 | | U/W NCF DSCR: | | 1.77x |
| | | U/W NOI Debt Yield: | | 12.6% |
The following table presents certain information relating to the major tenants at the 900 North Michigan Property:
| Tenant Summary(1) |
| Tenant Name | Tenant
Type | Credit Rating (Moody's/
S&P/Fitch)(2) | Tenant
NRSF | % of
NRSF | Annual U/W Rent | % of Total
Annual
U/W
Rent | Annual
U/W Rent
PSF | Term.
Option
(Y/N) | Lease Expiration Date | Ext.
Options |
| Gucci | Retail | NR/NR/NR | 15,914 | 1.9% | $4,527,448 | 16.7% | $284.49 | N | 1/31/2026 | None |
| Aritzia | Retail | NR/NR/NR | 7,736 | 0.9% | $3,781,862 | 13.9% | $488.87 | N | 1/31/2028 | 2 x 5 Yr |
| Tesla | Retail | Baa3/BBB/NR | 5,345 | 0.6% | $2,287,269 | 8.4% | $427.93 | N | 3/31/2027 | 2 x 5 Yr |
| Max Mara(3) | Retail | NR/NR/NR | 5,188 | 0.6% | $1,867,530 | 6.9% | $359.97 | N | Various | None |
| Grosvenor Capital Mgmnt, L.P.(4) | Office | NR/NR/NR | 72,738 | 8.7% | $1,782,081 | 6.6% | $24.50 | Y | 9/30/2037 | 2 x 5 Yr |
| Bloomingdale's | Retail | Ba1/BB+/NR | 265,148 | 31.9% | $1,747,440 | 6.4% | $6.59 | N | 9/30/2028 | 4 x 5 Yr |
| Equinox | Retail | NR/NR/NR | 30,021 | 3.6% | $1,140,798 | 4.2% | $38.00 | N | 6/30/2028 | None |
| Michael Kors Collection | Retail | NR/BBB-/NR | 3,198 | 0.4% | $1,112,372 | 4.1% | $347.83 | N | 4/30/2025 | None |
| Walton Street Capital LLC | Office | NR/NR/NR | 30,304 | 3.6% | $818,208 | 3.0% | $27.00 | N | 8/31/2029 | 2 x 5 Yr |
| J. Crew | Retail | NR/NR/NR | 9,237 | 1.1% | $645,876 | 2.4% | $69.92 | N | 1/31/2027 | None |
| Major Tenants | | | 444,829 | 53.5% | $19,710,884 | 72.6% | $44.31 | | | |
| Non-Major Tenants | | | 293,085 | 35.3% | $7,422,191 | 27.4% | $25.32 | | | |
| Total Occupied | | | 737,914 | 88.8% | $27,133,075 | 100.0% | $36.77 | | | |
| Vacant Space | | | 93,436 | 11.2% | | | | | | |
| Total | | | 831,350 | 100.0% | | | | | | |
| (1) | Based on the underwritten rent roll dated July 17, 2024, inclusive of rent steps through July 2025. |
| (2) | Certain ratings are those of the parent company whether or not the parent guarantees the lease. |
| (3) | Max Mara has three leases at the 900 North Michigan Property; one lease ($35,150 base rent, 703 square feet) expires in December 2025 and the remaining two leases (collectively, $1,832,380 base rent, 4,485 square feet) expire in May 2029. |
| (4) | GCM Grosvenor has a one-time option to terminate its lese effective September 2032, with notice to be given by September 30, 2031 and payment of a termination fee. |
The following table presents a summary of sales for certain tenants at the 900 North Michigan Property:
| Sales Summary(1) |
| | 2021 Sales (PSF) | 2022 Sales (PSF) | 2023 Sales (PSF) | TTM 4/30/2024 Sales (PSF) |
| Bloomingdale's | $219.93 | $247.06 | $234.26 | $236.30 |
| Gucci | $4,007.82 | $3,091.94 | $2,221.17 | $2,175.08 |
| Max Mara | $2,387.26 | $2,788.30 | $2,777.89 | $2,607.28 |
| Mario Tricoci Hair Salon | $572.41 | $678.14 | $702.60 | $694.68 |
| J. Crew | $521.19 | $598.95 | $667.48 | $711.87 |
| Aster Hall | $133.01 | $236.22 | $268.75 | $269.63 |
| lululemon athletica | $1,494.33 | $1,414.67 | $1,774.24 | $1,674.12 |
| Sur La Table | $335.97 | $389.77 | $447.03 | $477.39 |
| Sidney Garber | $1,347.96 | $1,140.42 | $1,247.29 | $1,252.97 |
| (1) | All sales information presented herein with respect to the 900 North Michigan Property is based upon information provided by the borrower sponsor. |
| THE INFORMATION IN THIS STRUCTURAL AND COLLATERAL TERM SHEET IS NOT COMPLETE AND MAY BE AMENDED PRIOR TO THE TIME OF SALE. THIS TERM SHEET IS NOT AN OFFER TO SELL THESE SECURITIES AND IT IS NOT A SOLICITATION OF AN OFFER TO BUY THESE SECURITIES IN ANY JURISDICTION WHERE THE OFFER OR SALE IS NOT PERMITTED. |
| | 148 | |
| Mixed Use – Retail/Office | Loan #15 | Cut-off Date Balance: | | $20,000,000 |
| 900 North Michigan Avenue | 900 North Michigan | Cut-off Date LTV: | | 57.1% |
| Chicago, IL 60611 | | U/W NCF DSCR: | | 1.77x |
| | | U/W NOI Debt Yield: | | 12.6% |
The following table presents certain information relating to the lease rollover schedule at the 900 North Michigan Property:
| Lease Rollover Schedule(1) |
| Year | Number
of Leases Expiring | Net
Rentable
Area
Expiring | % of NRA Expiring | UW Base
Rent
Expiring | % of UW
Base Rent Expiring | Cumulative Net Rentable Area Expiring | Cumulative
% of NRA
Expiring | Cumulative
UW Base
Rent
Expiring | Cumulative % of UW Base Rent Expiring |
| Vacant | 0 | 93,436 | 11.2 | % | 0 | 0 | | 93,436 | 11.2% | 0 | 0 | |
| 2024 & MTM | 14 | 20,559 | 2.5 | | $574,516 | 2.1 | % | 113,995 | 13.7% | $574,516 | 2.1 | % |
| 2025 | 15 | 42,970 | 5.2 | | $1,799,604 | 6.6 | | 156,965 | 18.9% | $2,374,120 | 8.7 | % |
| 2026 | 7 | 30,133 | 3.6 | | $5,127,238 | 18.9 | | 187,098 | 22.5% | $7,501,358 | 27.6 | % |
| 2027 | 7 | 26,984 | 3.2 | | $3,280,614 | 12.1 | | 214,082 | 25.8% | $10,781,971 | 39.7 | % |
| 2028 | 11 | 351,637 | 42.3 | | $7,787,687 | 28.7 | | 565,719 | 68.0% | $18,569,659 | 68.4 | % |
| 2029 | 8 | 59,712 | 7.2 | | $3,649,301 | 13.4 | | 625,431 | 75.2% | $22,218,960 | 81.9 | % |
| 2030 | 2 | 18,434 | 2.2 | | $580,211 | 2.1 | | 643,865 | 77.4% | $22,799,170 | 84.0 | % |
| 2031 | 2 | 16,407 | 2.0 | | $112,778 | 0.4 | | 660,272 | 79.4% | $22,911,949 | 84.4 | % |
| 2032 | 1 | 12,636 | 1.5 | | $372,762 | 1.4 | | 672,908 | 80.9% | $23,284,711 | 85.8 | % |
| 2033 | 1 | 24,155 | 2.9 | | $513,294 | 1.9 | | 697,063 | 83.8% | $23,798,005 | 87.7 | % |
| 2034 | 2 | 24,586 | 3.0 | | $663,292 | 2.4 | | 721,649 | 86.8% | $24,461,296 | 90.2 | % |
| 2035 & Beyond | 6 | 109,701 | 13.2 | | $2,671,778 | 9.8 | | 831,350 | 100.0% | $27,133,075 | 100.0 | % |
| Total / Wtd. Avg. | 76 | 831,350 | 100.0 | % | $27,133,075 | 100.0 | % | | | | |
| (1) | Based on the underwritten rent roll dated July 17, 2024, inclusive of rent steps through July 2025. |
| Cash Flow Analysis(1) |
| | 2021 | 2022 | 2023 | U/W | U/W Per SF | %(2) |
| Base Rent | $28,440,562 | $27,722,113 | $28,564,953 | $27,133,075 | $32.64 | 44.0% |
| Rent Steps | $0 | $0 | $0 | $97,789 | $0.12 | 0.2% |
| Overage / Percent Rent | $29,005 | $119,704 | $292,976 | $292,873 | $0.35 | 0.5% |
| Other Rental Revenue(3) | $4,773,408 | $5,894,595 | $7,127,673 | $5,257,060 | $6.32 | 8.5% |
| Vacant Income | $0 | $0 | $0 | $5,656,880 | $6.80 | 9.2% |
| Total Reimbursements | $20,936,127 | $21,711,908 | $21,817,795 | $23,250,563 | $27.97 | 37.7% |
| Potential Gross Revenue | $54,179,102 | $55,448,320 | $57,803,398 | $61,688,239 | $74.20 | 100.0% |
| (Vacancy/Credit Loss) | $0 | $0 | $0 | ($5,656,880) | ($6.80) | (9.2)% |
| Effective Gross Income | $54,179,102 | $55,448,320 | $57,803,398 | $56,031,359 | $67.40 | 90.8% |
| Real Estate Taxes | $13,090,323 | $14,382,348 | $14,703,165 | $15,065,313 | $18.12 | 26.9% |
| Insurance | $306,155 | $324,033 | $390,918 | $777,654 | $0.94 | 1.4% |
| Utilities | $4,881,821 | $4,274,791 | $4,895,712 | $5,330,400 | $6.41 | 9.5% |
| Repairs & Maintenance | $3,854,624 | $4,309,932 | $4,540,068 | $5,047,300 | $6.07 | 9.0% |
| Management Fee | $1,417,222 | $1,420,020 | $1,418,004 | $1,500,000 | $1.80 | 2.7% |
| Payroll | $2,054,207 | $1,956,932 | $2,216,017 | $2,399,100 | $2.89 | 4.3% |
| Other Expenses | $1,872,411 | $2,984,579 | $2,924,174 | $3,142,600 | $3.78 | 5.6% |
| Total Expenses | $27,476,761 | $29,652,635 | $31,088,059 | $33,262,367 | $40.01 | 59.4% |
| Net Operating Income | $26,702,341 | $25,795,686 | $26,715,339 | $22,768,993 | $27.39 | 40.6% |
| Replacement Reserves | $0 | $0 | $0 | $224,465 | $0.27 | 0.4% |
| TI/LC | $0 | $0 | $0 | $441,427 | $0.53 | 0.8% |
| Net Cash Flow | $26,702,341 | $25,795,686 | $26,715,339 | $22,103,101 | $26.59 | 39.4% |
| | | | | | | |
| NOI DSCR | 2.14x | 2.06x | 2.14x | 1.82x | | |
| NCF DSCR | 2.14x | 2.06x | 2.14x | 1.77x | | |
| NOI Debt Yield | 14.8% | 14.3% | 14.8% | 12.6% | | |
| NCF Debt Yield | 14.8% | 14.3% | 14.8% | 12.3% | | |
| (1) | Based on the underwritten rent roll dated July 17, 2024, inclusive of rent steps through July 2025. |
| (2) | % column represents percentage of Potential Gross Revenue for all revenue lines and represents percentage of Effective Gross Income for the remaining fields. |
| (3) | Other Rental Revenue includes kiosks / temporary / specialty revenue, parking income and income associated with sponsorships, signage and vitrines.
|
| THE INFORMATION IN THIS STRUCTURAL AND COLLATERAL TERM SHEET IS NOT COMPLETE AND MAY BE AMENDED PRIOR TO THE TIME OF SALE. THIS TERM SHEET IS NOT AN OFFER TO SELL THESE SECURITIES AND IT IS NOT A SOLICITATION OF AN OFFER TO BUY THESE SECURITIES IN ANY JURISDICTION WHERE THE OFFER OR SALE IS NOT PERMITTED. |
| | 149 | |
| Mixed Use – Retail/Office | Loan #15 | Cut-off Date Balance: | | $20,000,000 |
| 900 North Michigan Avenue | 900 North Michigan | Cut-off Date LTV: | | 57.1% |
| Chicago, IL 60611 | | U/W NCF DSCR: | | 1.77x |
| | | U/W NOI Debt Yield: | | 12.6% |
The Market. The 900 North Michigan Property is located in the Chicago-Naperville-Elgin metropolitan statistical area (the “Chicago MSA”) and the North Michigan Avenue submarket. The 900 North Michigan Property is easily accessible from I-290, I-90, Route 41 and streets in the Chicago downtown area.
The Chicago MSA is the third-largest office market in the United States. According to CoStar, market rents have grown 2.37% on average over the last 10 years. New supply under construction is approximately 1.5 million square feet, which represents 0.3% of existing inventory.
The Chicago MSA is the second-largest retail market in the United States. Market vacancy is currently 4.9%.
| THE INFORMATION IN THIS STRUCTURAL AND COLLATERAL TERM SHEET IS NOT COMPLETE AND MAY BE AMENDED PRIOR TO THE TIME OF SALE. THIS TERM SHEET IS NOT AN OFFER TO SELL THESE SECURITIES AND IT IS NOT A SOLICITATION OF AN OFFER TO BUY THESE SECURITIES IN ANY JURISDICTION WHERE THE OFFER OR SALE IS NOT PERMITTED. |
| | 150 | |
| Wells Fargo Commercial Mortgage Trust 2024-C63 | Transaction Contact Information |
VI. Transaction Contact Information
Questions regarding this Structural and Collateral Term Sheet may be directed to any of the following individuals:
| Wells Fargo Securities, LLC | |
| | |
| Brigid Mattingly | Tel. (312) 269-3062 |
| | |
| Daniel Thomas | Tel. (212) 214-2813 |
| | |
| Sean Duffy | Tel. (312) 827-1518 |
| Goldman Sachs & Co. LLC | |
| | |
| Scott Epperson | Tel. (212) 934-2882 |
| | |
| Justin Peterson | Tel. (212) 902-4283 |
| J.P. Morgan Securities LLC | |
| | |
| Kunal Singh | Tel. (212) 834-5467 |
| | |
| Harris Rendelstein | Tel. (212) 834-6737 |
| | |
| Derrick Fetzer | Tel. (212) 834-3111 |
| | |
| Avinash Sharma | Tel. (212) 834-3111 |
| SG Americas Securities, LLC | |
| | |
| Jim Barnard | Tel. (212) 278-6263 |
| | |
| Justin Cappuccino | Tel. (212) 278-6393 |
| | |
| Mark Lacerenza | Tel. (212) 278-5243 |
| | |
| Claire Weiss | Tel. (212) 278-6570 |
| THE INFORMATION IN THIS STRUCTURAL AND COLLATERAL TERM SHEET IS NOT COMPLETE AND MAY BE AMENDED PRIOR TO THE TIME OF SALE. THIS TERM SHEET IS NOT AN OFFER TO SELL THESE SECURITIES AND IT IS NOT A SOLICITATION OF AN OFFER TO BUY THESE SECURITIES IN ANY JURISDICTION WHERE THE OFFER OR SALE IS NOT PERMITTED. |
| | 151 | |