| FREE WRITING PROSPECTUS | ||
| FILED PURSUANT TO RULE 433 | ||
| REGISTRATION FILE NO.: 333-282099-01 | ||
 |  |  |  |  |
Free Writing Prospectus
Structural and Collateral Term Sheet
$833,520,429
(Approximate Initial Pool Balance)
$722,037,000
(Approximate Aggregate Certificate Balance of Offered Certificates)
Wells Fargo Commercial Mortgage Trust 2025-5C3
as Issuing Entity
Wells Fargo Commercial Mortgage Securities, Inc.
as Depositor
Wells Fargo Bank, National Association
Argentic Real Estate Finance 2 LLC
Citi Real Estate Funding Inc.
JPMorgan Chase Bank, National Association
Goldman Sachs Mortgage Company
LMF Commercial, LLC
UBS AG
as Sponsors and Mortgage Loan Sellers
Commercial Mortgage Pass-Through Certificates
Series 2025-5C3
January 6, 2025
| WELLS FARGO SECURITIES | CITIGROUP | GOLDMAN SACHS & CO. LLC | J.P. MORGAN | UBS SECURITIES |
Co-Lead Manager Joint Bookrunner | Co-Lead Manager Joint Bookrunner | Co-Lead Manager Joint Bookrunner | Co-Lead Manager Joint Bookrunner | Co-Lead Manager Joint Bookrunner |
Academy Securities, Inc. Co-Manager | Drexel Hamilton Co-Manager | Siebert Williams Shank Co-Manager |
STATEMENT REGARDING THIS FREE WRITING PROSPECTUS
The depositor has filed a registration statement (including a prospectus) with the Securities and Exchange Commission (“SEC”) (SEC File No. 333-282099) for the offering to which this communication relates. Before you invest, you should read the prospectus in the registration statement and other documents the depositor has filed with the SEC for more complete information about the depositor, the issuing entity and this offering. You may get these documents for free by visiting EDGAR on the SEC Web site at www.sec.gov. Alternatively, the depositor, any underwriter, or any dealer participating in the offering will arrange to send you the prospectus after filing if you request it by calling toll free 1-800-745-2063 (8 a.m. – 5 p.m. Eastern Time) or by emailing wfs.cmbs@wellsfargo.com.
Nothing in this document constitutes an offer of securities for sale in any jurisdiction where the offer or sale is not permitted. The information contained herein is preliminary as of the date hereof, supersedes any such information previously delivered to you and will be superseded by any such information subsequently delivered and ultimately by the final prospectus relating to the securities. These materials are subject to change, completion, supplement or amendment from time to time.
This free writing prospectus has been prepared by the underwriters for information purposes only and does not constitute, in whole or in part, a prospectus for the purposes of (i) Regulation (EU) 2017/1129 (as amended), (ii) such Regulation as it forms part of UK domestic law, or (iii) Part VI of the UK Financial Services and Markets Act 2000, as amended; and does not constitute an offering document for any other purpose.
STATEMENT REGARDING ASSUMPTIONS AS TO SECURITIES, PRICING ESTIMATES AND OTHER INFORMATION
The attached information contains certain tables and other statistical analyses (the “Computational Materials”) which have been prepared in reliance upon information furnished by the Mortgage Loan Sellers. Numerous assumptions were used in preparing the Computational Materials, which may or may not be reflected herein. As such, no assurance can be given as to the Computational Materials’ accuracy, appropriateness or completeness in any particular context; or as to whether the Computational Materials and/or the assumptions upon which they are based reflect present market conditions or future market performance. The Computational Materials should not be construed as either projections or predictions or as legal, tax, financial or accounting advice. You should consult your own counsel, accountant and other advisors as to the legal, tax, business, financial and related aspects of a purchase of these securities. Any weighted average lives, yields and principal payment periods shown in the Computational Materials are based on prepayment and/or loss assumptions, and changes in such prepayment and/or loss assumptions may dramatically affect such weighted average lives, yields and principal payment periods. In addition, it is possible that prepayments or losses on the underlying assets will occur at rates higher or lower than the rates shown in the attached Computational Materials. The specific characteristics of the securities may differ from those shown in the Computational Materials due to differences between the final underlying assets and the preliminary underlying assets used in preparing the Computational Materials. The principal amount and designation of any security described in the Computational Materials are subject to change prior to issuance. None of Wells Fargo Securities, LLC, Citigroup Global Markets Inc., Goldman Sachs & Co. LLC, J.P. Morgan Securities LLC, UBS Securities LLC, Academy Securities, Inc., Drexel Hamilton, LLC, Siebert Williams Shank & Co., LLC or any of their respective affiliates, make any representation or warranty as to the actual rate or timing of payments or losses on any of the underlying assets or the payments or yield on the securities. The information in this presentation is based upon management forecasts and reflects prevailing conditions and management’s views as of this date, all of which are subject to change. In preparing this presentation, we have relied upon and assumed, without independent verification, the accuracy and completeness of all information available from public sources or which was provided to us by or on behalf of the Mortgage Loan Sellers or which was otherwise reviewed by us.
This free writing prospectus contains certain forward-looking statements. If and when included in this free writing prospectus, the words “expects”, “intends”, “anticipates”, “estimates” and analogous expressions and all statements that are not historical facts, including statements about our beliefs or expectations, are intended to identify forward-looking statements. Any forward-looking statements are made subject to risks and uncertainties which could cause actual results to differ materially from those stated. Those risks and uncertainties include, among other things, declines in general economic and business conditions, increased competition, changes in demographics, changes in political and social conditions, regulatory initiatives and changes in customer preferences, many of which are beyond our control and the control of any other person or entity related to this offering. The forward-looking statements made in this free writing prospectus are made as of the date stated on the cover. We have no obligation to update or revise any forward-looking statement.
Wells Fargo Securities is the trade name for the capital markets and investment banking services of Wells Fargo & Company and its subsidiaries, including but not limited to Wells Fargo Securities, LLC, a member of NYSE, FINRA, NFA and SIPC, Wells Fargo Prime Services, LLC, a member of FINRA, NFA and SIPC, and Wells Fargo Bank, N.A. Wells Fargo Securities, LLC and Wells Fargo Prime Services, LLC are distinct entities from affiliated banks and thrifts.
J.P. Morgan is the marketing name for the investment banking businesses of JPMorgan Chase & Co. and its subsidiaries worldwide. Securities, syndicated loan arranging, financial advisory and other investment banking activities are performed by JPMS and its securities affiliates, and lending, derivatives and other commercial banking activities are performed by JPMorgan Chase Bank, National Association and its banking affiliates. JPMS is a member of SIPC and the NYSE.
IMPORTANT NOTICE REGARDING THE OFFERED CERTIFICATES
The information herein is preliminary and may be supplemented or amended prior to the time of sale. In addition, the Offered Certificates referred to in these materials and the asset pool backing them are subject to modification or revision (including the possibility that one or more classes of certificates may be split, combined or eliminated at any time prior to issuance or availability of a final prospectus) and are offered on a “when, as and if issued” basis.
The underwriters described in these materials may from time to time perform investment banking services for, or solicit investment banking business from, any company named in these materials. The underwriters and/or their affiliates or respective employees may from time to time have a long or short position in any security or contract discussed in these materials.
The information contained herein supersedes any previous such information delivered to any prospective investor and will be superseded by information delivered to such prospective investor prior to the time of sale.
IMPORTANT NOTICE RELATING TO AUTOMATICALLY-GENERATED EMAIL DISCLAIMERS
Any legends, disclaimers or other notices that may appear at the bottom of any email communication to which this free writing prospectus is attached relating to (1) these materials not constituting an offer (or a solicitation of an offer), (2) any representation that these materials are accurate or complete and may not be updated or (3) these materials possibly being confidential, are not applicable to these materials and should be disregarded. Such legends, disclaimers or other notices have been automatically generated as a result of these materials having been sent via Bloomberg or another system.
| THE INFORMATION IN THIS STRUCTURAL AND COLLATERAL TERM SHEET IS NOT COMPLETE AND MAY BE AMENDED PRIOR TO THE TIME OF SALE. THIS TERM SHEET IS NOT AN OFFER TO SELL THESE SECURITIES AND IT IS NOT A SOLICITATION OF AN OFFER TO BUY THESE SECURITIES IN ANY JURISDICTION WHERE THE OFFER OR SALE IS NOT PERMITTED. | ||
| 2 | ||
| Wells Fargo Commercial Mortgage Trust 2025-5C3 | Certificate Structure |
| I. | Certificate Structure |
| Class | Expected Ratings (Fitch/KBRA/Moody’s)(1) | Approximate Initial Certificate Balance or Notional Amount(2) | Approximate Initial Available Certificate Balance or Notional Amount(2) | Approximate Initial Retained Certificate Balance or Notional Amount(2)(3) | Approx. Initial Credit Support(4) | Pass-Through Rate Description | Weighted Average Life (Years)(5) | Expected Principal Window(5) | Certificate Principal to Value Ratio(6) | Certificate Principal U/W NOI Debt Yield(7) | |
| Offered Certificates | |||||||||||
| A-1 | AAAsf/AAA(sf)/Aaa(sf) | $8,317,000 | $8,135,000 | $182,000 | 30.000% | (8) | 2.55 | 02/25-11/29 | 41.6% | 16.5% | |
| A-2 | AAAsf/AAA(sf)/Aaa(sf) | (9) | (9) | (9) | 30.000% | (8) | (9) | (9) | 41.6% | 16.5% | |
| A-3 | AAAsf/AAA(sf)/Aaa(sf) | (9) | (9) | (9) | 30.000% | (8) | (9) | (9) | 41.6% | 16.5% | |
| X-A | AAAsf/AAA(sf)/Aaa(sf) | $583,464,000(10) | $570,744,000(10) | $12,720,000(10) | N/A | Variable(11) | N/A | N/A | N/A | N/A | |
| X-B | A-sf/AAA(sf)/NR | $138,573,000(12) | $135,552,000(12) | $3,021,000(12) | N/A | Variable(13) | N/A | N/A | N/A | N/A | |
| A-S | AAAsf/AAA(sf)/Aa3(sf) | $53,137,000 | $51,978,000 | $1,159,000 | 23.625% | (8) | 4.96 | 01/30-01/30 | 45.4% | 15.2% | |
| B | AA-sf/AA+(sf)/NR | $47,927,000 | $46,882,000 | $1,045,000 | 17.875% | (8) | 4.96 | 01/30-01/30 | 48.8% | 14.1% | |
| C | A-sf/A(sf)/NR | $37,509,000 | $36,691,000 | $818,000 | 13.375% | (8) | 4.96 | 01/30-01/30 | 51.5% | 13.4% | |
| Non-Offered Certificates | |||||||||||
| X-D | BBB-sf/AAA(sf)/NR | $33,340,000(14) | $32,613,000(14) | $727,000(14) | N/A | Variable(15) | N/A | N/A | N/A | N/A | |
| X-F | BB-sf/BBB-(sf)/NR | $21,880,000(16) | $21,403,000(16) | $477,000(16) | N/A | Variable(17) | N/A | N/A | N/A | N/A | |
| D | BBBsf/A-(sf)/NR | $21,879,000 | $21,402,000 | $477,000 | 10.750% | (8) | 4.96 | 01/30-01/30 | 53.0% | 13.0% | |
| E | BBB-sf/BBB+(sf)/NR | $11,461,000 | $11,211,000 | $250,000 | 9.375% | (8) | 4.96 | 01/30-01/30 | 53.8% | 12.8% | |
| F | BB-sf/BBB-(sf)/NR | $21,880,000 | $21,403,000 | $477,000 | 6.750% | (8) | 4.96 | 01/30-01/30 | 55.4% | 12.4% | |
| G-RR | B-sf/BB(sf)/NR | $14,587,000 | $14,269,000 | $318,000 | 5.000% | (8) | 4.96 | 01/30-01/30 | 56.4% | 12.2% | |
| J-RR | NR/NR/NR | $41,676,428 | $40,767,428 | $909,000 | 0.000% | (8) | 4.96 | 01/30-01/30 | 59.4% | 11.6% | |
| (1) | The expected ratings presented are those of Fitch Ratings, Inc. (“Fitch”), Kroll Bond Rating Agency, LLC (“KBRA”) and Moody’s Investors Service, Inc. (“Moody’s”), which the depositor hired to rate the Offered Certificates. One or more other nationally recognized statistical rating organizations that were not hired by the depositor may use information they receive pursuant to Rule 17g-5 under the Securities Exchange Act of 1934, as amended (the “Exchange Act”) or otherwise, to rate or provide market reports and/or published commentary related to the Offered Certificates. We cannot assure you as to what ratings a non-hired nationally recognized statistical rating organization would assign or that its reports will not express differing, possibly negative, views of the mortgage loans and/or the Offered Certificates. The ratings of each Class of Offered Certificates address the likelihood of the timely distribution of interest and, except in the case of the Class X-A and X-B Certificates, the ultimate distribution of principal due on those Classes on or before the Rated Final Distribution Date. See “Risk Factors—Other Risks Relating to the Certificates—Nationally Recognized Statistical Rating Organizations May Assign Different Ratings to the Certificates; Ratings of the Certificates Reflect Only the Views of the Applicable Rating Agencies as of the Dates Such Ratings Were Issued; Ratings May Affect ERISA Eligibility; Ratings May Be Downgraded” and “Ratings” in the Preliminary Prospectus, expected to be dated January 6, 2025 (the “Preliminary Prospectus”). Fitch, KBRA and Moody’s have informed us that the “sf” designation in their ratings represents an identifier for structured finance product ratings. |
| (2) | The Certificate Balances and Notional Amounts set forth in the table are approximate. The actual initial Certificate Balances and Notional Amounts may be larger or smaller in connection with any variation in the Certificate Balance of the VRR Interest and/or the Horizontal Risk Retention Certificates following the calculation of the actual fair value of all of the ABS interests (as such term is defined in the Credit Risk Retention Rules) issued by the issuing entity, as described under “Credit Risk Retention” in the Preliminary Prospectus. The actual initial Certificate Balances and Notional Amounts also depend on the initial pool balance of the mortgage loans definitively included in the pool of mortgage loans, which aggregate cut-off date balance may be as much as 5% larger or smaller than the amount presented in the Preliminary Prospectus. In addition, the Notional Amounts of the Class X-A, X-B, X-D and X-F Certificates may vary depending upon the final pricing of the Classes of Principal Balance Certificates (as defined below) and, if, as a result of such pricing, the pass-through rate of any of the Class X-A, X-B, X-D and X-F Certificates, as applicable, would be equal to zero at all times, such Class of Certificates may not be issued on the closing date of this securitization. |
| (3) | On the closing date, the Certificates with the initial Certificate Balances or Notional Amounts, as applicable, set forth in the table above under “Approximate Initial Retained Certificate Balance or Notional Amount” (such Certificates, collectively the “VRR Interest”) are expected to be purchased for cash from the underwriters by a majority-owned affiliate of Argentic Real Estate Finance 2 LLC (a sponsor and affiliate of the special servicer), as the “retaining sponsor” (as such term is defined in the Credit Risk Retention Rules), as further described in “Credit Risk Retention” in the Preliminary Prospectus. |
| (4) | The approximate initial credit support with respect to the Class A-1, A-2 and A-3 Certificates represents the approximate credit enhancement for the Class A-1, A-2 and A-3 Certificates in the aggregate. |
| (5) | Weighted Average Lives and Expected Principal Windows are calculated based on an assumed prepayment rate of 0% CPR and the “Structuring Assumptions” described under “Yield and Maturity Considerations—Weighted Average Life” in the Preliminary Prospectus. |
| (6) | The Certificate Principal to Value Ratio for each Class of Certificates (other than the Class A-1, A-2 and A-3 Certificates) is calculated as the product of (a) the weighted average Cut-off Date LTV Ratio for the mortgage loans and (b) a fraction, the numerator of which is the total initial Certificate Balance of such Class of Certificates and all Classes of Principal Balance Certificates senior to such Class of Certificates and the denominator of which is the total initial Certificate Balance of all of the Classes of Principal Balance Certificates. The Certificate Principal to Value Ratio for each of the Class A-1, A-2 and A-3 Certificates is calculated in the aggregate for those Classes as if they were a single Class and is calculated as the product of (a) the weighted average Cut-off Date LTV Ratio for the mortgage loans and (b) a fraction, the numerator of which is the total initial Certificate Balance of such Classes of Certificates and the denominator of which is the total initial Certificate Balance of all of the Classes of Principal Balance Certificates. In any event, however, excess mortgaged property value associated with a mortgage loan will not be available to offset losses on any other mortgage loan. |
| (7) | The Certificate Principal U/W NOI Debt Yield for each Class of Certificates (other than the Class A-1, A-2 and A-3 Certificates) is calculated as the product of (a) the weighted average U/W NOI Debt Yield for the mortgage loans and (b) a fraction, the numerator of which is the total initial Certificate Balance of all of the Classes of Principal Balance Certificates and the denominator of which is the total initial Certificate Balance of such Class of Certificates and all Classes of Principal Balance Certificates senior to such Class of Certificates. The Certificate Principal U/W NOI Debt Yield for each of the Class A-1, A-2 and A-3 Certificates is calculated in the aggregate for those Classes as if they were a single Class and is calculated as the product of (a) the weighted average U/W NOI Debt Yield for the mortgage loans and (b) a fraction, the numerator of which is the total initial Certificate Balance of all of the Classes of Principal Balance Certificates and the denominator of which is the total initial Certificate Balance of such Classes of Certificates. In any event, however, cash flow from each mortgaged property supports only the related mortgage loan and will not be available to support any other mortgage loan. |
| THE INFORMATION IN THIS STRUCTURAL AND COLLATERAL TERM SHEET IS NOT COMPLETE AND MAY BE AMENDED PRIOR TO THE TIME OF SALE. THIS TERM SHEET IS NOT AN OFFER TO SELL THESE SECURITIES AND IT IS NOT A SOLICITATION OF AN OFFER TO BUY THESE SECURITIES IN ANY JURISDICTION WHERE THE OFFER OR SALE IS NOT PERMITTED. | ||
| 3 | ||
| Wells Fargo Commercial Mortgage Trust 2025-5C3 | Certificate Structure |
| (8) | The pass-through rates for the Class A-1, A-2, A-3, A-S, B, C, D, E, F, G-RR and J-RR Certificates (collectively, the “Principal Balance Certificates”) for any distribution date, in each case, will be one of the following: (i) a fixed rate per annum, (ii) a variable rate per annum equal to the weighted average of the net mortgage interest rates on the mortgage loans for the related distribution date, (iii) a variable rate per annum equal to the lesser of (a) a fixed rate and (b) the weighted average of the net mortgage interest rates on the mortgage loans for the related distribution date or (iv) a variable rate per annum equal to the weighted average of the net mortgage interest rates on the mortgage loans for the related distribution date minus a specified percentage. For purposes of the calculation of the weighted average of the net mortgage interest rates on the mortgage loans for each distribution date, the mortgage interest rates will be adjusted as necessary to a 30/360 basis. |
| (9) | The exact initial Certificate Balances of the Class A-2 and A-3 Certificates are unknown and will be determined based on the final pricing of the Certificates. However, the initial Certificate Balances, weighted average lives and principal windows of the Class A-2 and A-3 Certificates are expected to be within the applicable ranges reflected in the following chart. The aggregate initial Certificate Balance of the Class A-2 and A-3 Certificates is expected to be approximately $575,147,000, subject to a variance of plus or minus 5%. In the event that the Class A-3 Certificates are issued with the maximum certificate balance (i.e., with an initial certificate balance of $575,147,000), the Class A-2 Certificates will not be issued. |
| Class of Certificates | Expected Range of Approximate Initial Certificate Balance | Expected Range of Weighted Average Life (Years) | Expected Range of Principal Window | ||||
| Class A-2 | $0 – $250,000,000 | N/A - 4.85 | N/A / 11/29 – 12/29 | ||||
| Class A-3 | $325,147,000 – $575,147,000 | 4.88 - 4.91 | 11/29 – 01/30 / 12/29 – 01/30 |
| (10) | The Class X-A Certificates are notional amount certificates. The Notional Amount of the Class X-A Certificates will be equal to the aggregate Certificate Balance of the Class A-1, A-2 and A-3 Certificates outstanding from time to time. The Class X-A Certificates will not be entitled to distributions of principal. |
| (11) | The pass-through rate for the Class X-A Certificates for any distribution date will be a per annum rate equal to the excess, if any, of (a) the weighted average of the net mortgage interest rates on the mortgage loans for the related distribution date, over (b) the weighted average of the pass-through rates on the Class A-1, A-2 and A-3 Certificates for the related distribution date, weighted on the basis of their respective Certificate Balances outstanding immediately prior to that distribution date. For purposes of the calculation of the weighted average of the net mortgage interest rates on the mortgage loans for each distribution date, the mortgage interest rates will be adjusted as necessary to a 30/360 basis. |
| (12) | The Class X-B Certificates are notional amount certificates. The Notional Amount of the Class X-B Certificates will be equal to the aggregate Certificate Balance of the Class A-S, B and C Certificates outstanding from time to time. The Class X-B Certificates will not be entitled to distributions of principal. |
| (13) | The pass-through rate for the Class X-B Certificates for any distribution date will be a per annum rate equal to the excess, if any, of (a) the weighted average of the net mortgage interest rates on the mortgage loans for the related distribution date, over (b) the weighted average of the pass-through rates on the Class A-S, B and C Certificates for the related distribution date, weighted on the basis of their respective Certificate Balances outstanding immediately prior to that distribution date. For purposes of the calculation of the weighted average of the net mortgage interest rates on the mortgage loans for each distribution date, the mortgage interest rates will be adjusted as necessary to a 30/360 basis. |
| (14) | The Class X-D Certificates are notional amount certificates. The Notional Amount of the Class X-D Certificates will be equal to the aggregate Certificate Balance of the Class D and E Certificates outstanding from time to time. The Class X-D Certificates will not be entitled to distributions of principal. |
| (15) | The pass-through rate for the Class X-D Certificates for any distribution date will be a per annum rate equal to the excess, if any, of (a) the weighted average of the net mortgage interest rates on the mortgage loans for the related distribution date, over (b) the weighted average of the pass-through rates on the Class D and E Certificates for the related distribution date, weighted on the basis of their respective Certificate Balances outstanding immediately prior to that distribution date. For purposes of the calculation of the weighted average of the net mortgage interest rates on the mortgage loans for each distribution date, the mortgage interest rates will be adjusted as necessary to a 30/360 basis. |
| (16) | The Class X-F Certificates are notional amount certificates. The Notional Amount of the Class X-F Certificates will be equal to the Certificate Balance of the Class F Certificates outstanding from time to time. The Class X-F Certificates will not be entitled to distributions of principal. |
| (17) | The pass-through rate for the Class X-F Certificates for any distribution date will be a per annum rate equal to the excess, if any, of (a) the weighted average of the net mortgage interest rates on the mortgage loans for the related distribution date, over (b) the pass-through rate on the Class F Certificates for the related distribution date. For purposes of the calculation of the weighted average of the net mortgage interest rates on the mortgage loans for each distribution date, the mortgage interest rates will be adjusted as necessary to a 30/360 basis. |
| THE INFORMATION IN THIS STRUCTURAL AND COLLATERAL TERM SHEET IS NOT COMPLETE AND MAY BE AMENDED PRIOR TO THE TIME OF SALE. THIS TERM SHEET IS NOT AN OFFER TO SELL THESE SECURITIES AND IT IS NOT A SOLICITATION OF AN OFFER TO BUY THESE SECURITIES IN ANY JURISDICTION WHERE THE OFFER OR SALE IS NOT PERMITTED. | ||
| 4 | ||
| Wells Fargo Commercial Mortgage Trust 2025-5C3 | Transaction Highlights |
| II. | Transaction Highlights |
Mortgage Loan Sellers:
Mortgage Loan Seller | Number of | Number of | Aggregate Cut-off Date Balance | % of Initial Pool | ||
| Argentic Real Estate Finance 2 LLC | 12 | 18 | $222,325,307 | 26.7 | % | |
| Wells Fargo Bank, National Association | 6 | 18 | 183,582,641 | 22.0 | ||
| Citi Real Estate Funding Inc. | 2 | 13 | 117,500,000 | 14.1 | ||
| JPMorgan Chase Bank, National Association / Citi Real Estate Funding Inc. | 1 | 1 | 76,000,000 | 9.1 | ||
| Wells Fargo Bank, National Association / JPMorgan Chase Bank, National Association | 1 | 3 | 75,000,000 | 9.0 | ||
| Goldman Sachs Mortgage Company | 2 | 2 | 69,600,000 | 8.4 | ||
| Citi Real Estate Funding Inc. / Argentic Real Estate Finance 2 LLC | 1 | 1 | 54,500,000 | 6.5 | ||
| LMF Commercial, LLC | 3 | 5 | 14,912,481 | 1.8 | ||
| JPMorgan Chase Bank, National Association | 1 | 1 | 13,700,000 | 1.6 | ||
UBS AG | 1 | 1 | 6,400,000 |
| 0.8 |
|
Total | 30 | 63 | $833,520,429 |
| 100.0 | % |
Loan Pool:
| Initial Pool Balance: | $833,520,429 |
| Number of Mortgage Loans: | 30 |
| Average Cut-off Date Balance per Mortgage Loan: | $27,784,014 |
| Number of Mortgaged Properties: | 63 |
| Average Cut-off Date Balance per Mortgaged Property(1): | $13,230,483 |
| Weighted Average Mortgage Interest Rate: | 6.9314% |
| Ten Largest Mortgage as % of Initial Pool Balance: | 68.1% |
| Weighted Average Original Term to Maturity (months): | 60 |
| Weighted Average Remaining Term to Maturity (months): | 59 |
| Weighted Average Original Amortization Term (months)(2): | 360 |
| Weighted Average Remaining Amortization Term (months)(2): | 360 |
| Weighted Average Seasoning (months): | 1 |
| (1) | Information regarding mortgage loans secured by multiple properties is based on an allocation according to relative appraised values or the allocated loan amounts or property-specific release prices set forth in the related loan documents or such other allocation as the related mortgage loan seller deemed appropriate. |
| (2) | Excludes any mortgage loan that does not amortize. |
Credit Statistics:
| Weighted Average U/W Net Cash Flow DSCR(1): | 1.52x |
| Weighted Average U/W Net Operating Income Debt Yield(1): | 11.6% |
| Weighted Average Cut-off Date Loan-to-Value Ratio(1): | 59.4% |
| Weighted Average Balloon Loan-to-Value Ratio(1): | 58.8% |
| % of Mortgage Loans with Additional Subordinate Debt(2): | 14.2% |
| % of Mortgage Loans with Single Tenants(3): | 1.3% |
| (1) | With respect to any mortgage loan that is part of a whole loan, loan-to-value ratio, debt service coverage ratio and debt yield calculations include the related pari passu companion loan(s) but exclude any related subordinate companion loan(s) (unless otherwise stated). The debt service coverage ratio, debt yield and loan-to-value ratio information do not take into account any subordinate debt (whether or not secured by the related mortgaged property), that currently exists or is allowed under the terms of any mortgage loan. See “Description of the Mortgage Pool—Mortgage Pool Characteristics” in the Preliminary Prospectus and Annex A-1 to the Preliminary Prospectus. |
| (2) | The percentage figure expressed as “% of Mortgage Loans with Additional Subordinate Debt” is determined as a percentage of the initial pool balance and does not take into account any future subordinate debt (whether or not secured by the mortgaged property), if any, that may be permitted under the terms of any mortgage loan or the pooling and servicing agreement. See “Description of the Mortgage Pool—Additional Indebtedness” in the Preliminary Prospectus. |
| (3) | Excludes mortgage loans that are secured by multiple single tenant properties. |
| THE INFORMATION IN THIS STRUCTURAL AND COLLATERAL TERM SHEET IS NOT COMPLETE AND MAY BE AMENDED PRIOR TO THE TIME OF SALE. THIS TERM SHEET IS NOT AN OFFER TO SELL THESE SECURITIES AND IT IS NOT A SOLICITATION OF AN OFFER TO BUY THESE SECURITIES IN ANY JURISDICTION WHERE THE OFFER OR SALE IS NOT PERMITTED. | ||
| 5 | ||
| Wells Fargo Commercial Mortgage Trust 2025-5C3 | Transaction Highlights |
Loan Structural Features:
Amortization: Based on the Initial Pool Balance, 20.1% of the mortgage pool (7 mortgage loans) has scheduled amortization, as follows:
17.0% (5 mortgage loans) require amortization during the entire loan term; and
3.1% (2 mortgage loans) provide for an interest-only period followed by an amortization period.
Interest-Only: Based on the Initial Pool Balance, 79.9% of the mortgage pool (23 mortgage loans) provide for interest-only payments during the entire loan term through maturity. The Weighted Average Cut-off Date Loan-to-Value Ratio and Weighted Average U/W Net Cash Flow DSCR for those mortgage loans are 59.3% and 1.52x, respectively.
Hard Lockboxes: Based on the Initial Pool Balance, 46.4% of the mortgage pool (14 mortgage loans) have hard lockboxes in place.
Reserves: The mortgage loans require amounts to be escrowed monthly as follows (excluding any mortgage loans with springing provisions):
| Real Estate Taxes: | 95.7% of the pool |
| Insurance: | 52.3% of the pool |
| Capital Replacements: | 95.7% of the pool |
| TI/LC: | 83.3% of the pool(1) |
| (1) | The percentage of Initial Pool Balance for mortgage loans with TI/LC reserves is based on the aggregate principal balance allocable to loans that include office, retail, mixed use and industrial properties. |
Call Protection/Defeasance: Based on the Initial Pool Balance, the mortgage pool has the following call protection and defeasance features:
70.6% of the mortgage pool (20 mortgage loans) features a lockout period, then defeasance only until an open period;
12.4% of the mortgage pool (6 mortgage loans) features a lockout period, then greater of a prepayment premium (1.0%) or yield maintenance until an open period;
12.0% of the mortgage pool (2 mortgage loans) features a lockout period, then defeasance or greater of a prepayment premium (1.0%) or yield maintenance until an open period;
4.2% of the mortgage pool (1 mortgage loan) features the greater of a prepayment premium (1.0%) or yield maintenance, then defeasance or greater of a prepayment premium (1.0%) or yield maintenance until an open period; and
0.8% of the mortgage pool (1 mortgage loan) features a lockout period, then greater of a prepayment premium (2.0%) or yield maintenance until an open period.
Prepayment restrictions for each mortgage loan reflect the entire life of the mortgage loan. Please refer to Annex A-1 to the Preliminary Prospectus and the footnotes related thereto for further information regarding individual loan call protection.
| THE INFORMATION IN THIS STRUCTURAL AND COLLATERAL TERM SHEET IS NOT COMPLETE AND MAY BE AMENDED PRIOR TO THE TIME OF SALE. THIS TERM SHEET IS NOT AN OFFER TO SELL THESE SECURITIES AND IT IS NOT A SOLICITATION OF AN OFFER TO BUY THESE SECURITIES IN ANY JURISDICTION WHERE THE OFFER OR SALE IS NOT PERMITTED. | ||
| 6 | ||
| Wells Fargo Commercial Mortgage Trust 2025-5C3 | Issue Characteristics |
| III. | Issue Characteristics |
| Securities Offered: | $722,037,000 approximate monthly pay, multi-class, commercial mortgage REMIC pass-through certificates consisting of eight classes (Classes A-1, A-2, A-3, A-S, B, C, X-A and X-B), which are offered pursuant to a registration statement filed with the SEC (such classes of certificates, the “Offered Certificates”). |
| Mortgage Loan Sellers: | Wells Fargo Bank, National Association (“WFB”), Argentic Real Estate Finance 2 LLC (“AREF2”), Citi Real Estate Funding Inc. (“CREFI”), JPMorgan Chase Bank, National Association (“JPMCB”), Goldman Sachs Mortgage Company (“GSMC”), LMF Commercial, LLC (“LMF”) and UBS AG (“UBS”) |
| Joint Bookrunners and Co- Lead Managers: | Wells Fargo Securities, LLC, Citigroup Global Markets Inc., Goldman Sachs & Co. LLC, J.P. Morgan Securities LLC and UBS Securities LLC |
| Co-Managers: | Academy Securities, Inc., Drexel Hamilton, LLC and Siebert Williams Shank & Co., LLC |
| Rating Agencies: | Fitch Ratings, Inc., Kroll Bond Rating Agency, LLC and Moody’s Investors Service, Inc. |
| Master Servicer: | Wells Fargo Bank, National Association |
| Special Servicer: | Argentic Services Company LP |
| Certificate Administrator: | Computershare Trust Company, N.A. |
| Trustee: | Computershare Trust Company, N.A. |
| Operating Advisor: | BellOak, LLC |
| Asset Representations Reviewer: | BellOak, LLC |
| Initial Controlling Class Certificateholder: | Argentic Securities Holdings 2 Cayman Limited, an affiliate of Argentic Real Estate Finance 2 LLC and Argentic Services Company LP |
| U.S. Credit Risk Retention: | For a discussion on the manner in which the U.S. credit risk retention requirements will be satisfied by Argentic Real Estate Finance 2 LLC, as the retaining sponsor, see “Credit Risk Retention” in the Preliminary Prospectus. Argentic Real Estate Finance 2 LLC, the retaining sponsor, intends to cause Argentic Securities Holdings 2 Cayman Limited, a majority-owned affiliate, to retain (i) an “eligible horizontal residual interest”, in the form of certificates representing approximately 2.86% of the fair value of all of the ABS interests issued, which will be comprised of the Class G-RR and J-RR certificates (other than the portion that comprises the VRR Interest) and (ii) an “eligible vertical interest”, in the form of certificates representing approximately 2.18% of the certificate balance, notional amount or percentage interest of each class of certificates (other than the Class R certificates) in a manner that satisfies the U.S. credit risk retention requirements. Under the U.S. credit risk retention rules, Argentic Real Estate Finance 2 LLC or the applicable majority-owned affiliate will be permitted to transfer the horizontal risk retention certificates to a subsequent third-party purchaser. For additional information, see “Credit Risk Retention” in the Preliminary Prospectus. |
| EU SR Rules and UK Securitization Framework: | No transaction party or any other person intends to retain a material net economic interest in the securitization constituted by the issue of the Certificates, or take any other action in respect of such securitization, in a manner prescribed or contemplated by (i) Regulation (EU) 2017/2402 and related technical standards (collectively the “EU SR Rules”), or (ii) the Securitisation Regulations 2024 and related rules made by the Financial Conduct Authority and the Prudential Regulation Authority (collectively the “UK Securitization Framework”). In particular, no such person undertakes to take any action which may be required by any prospective investor or certificateholder for the purposes of its compliance with any requirement of the EU SR Rules or the UK Securitization Framework. In addition, the arrangements described under “Credit Risk Retention” in the Preliminary Prospectus have not been structured with the objective of ensuring or facilitating compliance by any person with any such requirement. See “Risk Factors—Other Risks Relating to the Certificates—EU SR Rules and UK Securitization Framework” in the Preliminary Prospectus. |
| Cut-off Date: | The Cut-off Date with respect to each mortgage loan is the payment due date for the monthly debt service payment that is due in January 2025 (or, in the case of any mortgage loan that has its first payment due date in January 2025, the date that would have been its payment due date in January 2025 under the terms of that mortgage loan if a monthly debt service payment were scheduled to be due in that month). |
| Expected Closing Date: | On or about January 28, 2025. |
| THE INFORMATION IN THIS STRUCTURAL AND COLLATERAL TERM SHEET IS NOT COMPLETE AND MAY BE AMENDED PRIOR TO THE TIME OF SALE. THIS TERM SHEET IS NOT AN OFFER TO SELL THESE SECURITIES AND IT IS NOT A SOLICITATION OF AN OFFER TO BUY THESE SECURITIES IN ANY JURISDICTION WHERE THE OFFER OR SALE IS NOT PERMITTED. | ||
| 7 | ||
| Wells Fargo Commercial Mortgage Trust 2025-5C3 | Issue Characteristics |
| Determination Dates: | The 11th day of each month (or if that day is not a business day, the next succeeding business day), commencing in February 2025. |
| Distribution Dates: | The 4th business day following the Determination Date in each month, commencing in February 2025. |
| Rated Final Distribution Date: | The Distribution Date in January 2058. |
| Interest Accrual Period: | With respect to any Distribution Date, the calendar month immediately preceding the month in which such Distribution Date occurs. |
| Day Count: | The Offered Certificates will accrue interest on a 30/360 basis. |
| Minimum Denominations: | $10,000 for each Class of Offered Certificates (other than the Class X-A and X-B Certificates) and $1,000,000 for the Class X-A and X-B Certificates. Investments may also be made in any whole dollar denomination in excess of the applicable minimum denomination. |
| Clean-up Call: | 1.0% |
| Delivery: | DTC, Euroclear and Clearstream Banking |
| ERISA/SMMEA Status: | Each Class of Offered Certificates is expected to be eligible for exemptive relief under ERISA. No Class of Offered Certificates will be Secondary Mortgage Market Enhancement Act of 1984, as amended (“SMMEA”) eligible. |
| Risk Factors: | THE CERTIFICATES INVOLVE CERTAIN RISKS AND MAY NOT BE SUITABLE FOR ALL INVESTORS. SEE THE “RISK FACTORS” SECTION OF THE PRELIMINARY PROSPECTUS. |
| Bond Analytics Information: | The Certificate Administrator will be authorized to make distribution date statements, CREFC® reports and certain supplemental reports (other than confidential information) available to certain financial modeling and data provision services, including Bloomberg, L.P., CRED iQ, Trepp, LLC, Intex Solutions, Inc., Interactive Data Corp., Markit Group Limited, BlackRock Financial Management, Inc., CMBS.com, Inc., Moody’s Analytics, Inc., Morningstar Credit Information & Analytics, LLC, KBRA Analytics, LLC, MBS Data, LLC, Thomson Reuters Corporation, RealINSIGHT and DealX. |
| Tax Treatment | For U.S. federal income tax purposes, the issuing entity will consist of one or more REMICs arranged in a tiered structure. The Offered Certificates will represent REMIC regular interests. |
| THE INFORMATION IN THIS STRUCTURAL AND COLLATERAL TERM SHEET IS NOT COMPLETE AND MAY BE AMENDED PRIOR TO THE TIME OF SALE. THIS TERM SHEET IS NOT AN OFFER TO SELL THESE SECURITIES AND IT IS NOT A SOLICITATION OF AN OFFER TO BUY THESE SECURITIES IN ANY JURISDICTION WHERE THE OFFER OR SALE IS NOT PERMITTED. | ||
| 8 | ||
| Wells Fargo Commercial Mortgage Trust 2025-5C3 | Characteristics of the Mortgage Pool |
| IV. | Characteristics of the Mortgage Pool(1) |
| A. | Ten Largest Mortgage Loans |
| Mortgage Loan Seller | Mortgage Loan Name | City | State | Number of Mortgage Loans/ Mortgaged Properties | Mortgage Loan Cut-off Date Balance ($) | % of Cut-off Date Pool Balance (%) | Property Type | Number of SF/ Units/ Rooms/ Pads | Cut-off Date Balance Per SF/Unit/ Room/Pad ($) | Cut-off Date LTV Ratio (%) | Balloon or ARD LTV Ratio (%) | U/W NCF DSCR (x) | U/W NOI Debt Yield (%) |
| WFB | Radius at Harbor Bay | Alameda | CA | 1 / 10 | $83,000,000 | 9.96% | Various | 643,220 | $330 | 67.0% | 62.9% | 1.45x | 10.7% |
| JPMCB/ CREFI | POD Williamsburg | Brooklyn | NY | 1 / 1 | 76,000,000 | 9.1 | Hospitality | 249 | 305,221 | 52.8 | 52.8 | 1.62 | 13.7 |
| WFB/JPMCB | Wilshire Office Portfolio | Various | CA | 1 / 3 | 75,000,000 | 9.0 | Office | 351,464 | 299 | 51.9 | 51.9 | 1.73 | 13.2 |
| CREFI | WAND MHC Portfolio | Various | Various | 1 / 10 | 70,500,000 | 8.5 | Manufactured Housing | 962 | 73,285 | 67.1 | 67.1 | 1.32 | 8.4 |
CREFI/ AREF2 | The Brazilian Court Hotel | Palm Beach | FL | 1 / 1 | 54,500,000 | 6.5 | Hospitality | 75 | 726,667 | 50.5 | 50.5 | 1.58 | 13.1 |
| CREFI | Georgia Multifamily Portfolio | Various | GA | 1 / 3 | 47,000,000 | 5.6 | Multifamily | 374 | 125,668 | 63.6 | 63.6 | 1.29 | 9.0 |
| GSMC | Welleon | Cleveland | OH | 1 / 1 | 44,600,000 | 5.4 | Multifamily | 130 | 343,077 | 65.1 | 65.1 | 1.25 | 8.0 |
| AREF2 | Christopher Crossing Apartments | Newport News | VA | 1 / 1 | 42,000,000 | 5.0 | Multifamily | 531 | 79,096 | 72.3 | 72.3 | 1.39 | 9.7 |
| WFB | 240 West 40th Street-NY | New York | NY | 1 / 1 | 40,000,000 | 4.8 | Office | 185,529 | 216 | 49.4 | 49.4 | 1.54 | 13.1 |
| WFB | Riverwalk Business Park | Scottsdale | AZ | 1 / 4 | 34,982,641 | 4.2 | Office | 454,653 | 77 | 42.1 | 40.3 | 1.90 | 19.0 |
| Top Three Total/Weighted Average | 3 / 14 | $234,000,000 | 28.1% | 57.5% | 56.1% | 1.59x | 12.5% | ||||||
| Top Five Total/Weighted Average | 5 / 25 | $359,000,000 | 43.1% | 58.4% | 57.4% | 1.54x | 11.8% | ||||||
| Top Ten Total/Weighted Average | 10 / 35 | $567,582,641 | 68.1% | 58.7% | 58.0% | 1.51x | 11.6% | ||||||
| Non-Top Ten Total/Weighted Average | 20 / 28 | $265,937,788 | 31.9% | 60.9% | 60.4% | 1.55x | 11.5% | ||||||
| (1) | With respect to any mortgage loan that is part of a whole loan, Cut-off Date Balance Per SF/Unit/Room/Pad, loan-to-value ratio, debt service coverage ratio and debt yield calculations include the related pari passu companion loan(s) (unless otherwise stated). With respect to each mortgage loan, debt service coverage ratio, debt yield and loan-to-value ratio information do not take into account subordinate debt (whether or not secured by the related mortgaged property), if any, that currently exists or is allowed under the terms of such mortgage loan. |
| THE INFORMATION IN THIS STRUCTURAL AND COLLATERAL TERM SHEET IS NOT COMPLETE AND MAY BE AMENDED PRIOR TO THE TIME OF SALE. THIS TERM SHEET IS NOT AN OFFER TO SELL THESE SECURITIES AND IT IS NOT A SOLICITATION OF AN OFFER TO BUY THESE SECURITIES IN ANY JURISDICTION WHERE THE OFFER OR SALE IS NOT PERMITTED. | ||
| 9 | ||
| Wells Fargo Commercial Mortgage Trust 2025-5C3 | Characteristics of the Mortgage Pool |
| B. | Summary of the Whole Loans |
| Loan No. | Property Name | Mortgage Loan Seller in WFCM 2025-5C3 | Mortgage Loan Cut-off Date Balance | Aggregate Pari-Passu Companion Loan Cut-off Date Balance | Combined Cut-off Date Balance | Controlling Pooling / Trust and Servicing Agreement | Master Servicer | Special Servicer | Related Pari Passu Companion Loan(s) Securitizations | Combined UW NCF DSCR(1) | Combined UW NOI Debt Yield(1) | Combined Cut-off Date LTV(1) |
| 1 | Radius at Harbor Bay | WFB | $83,000,000 | $129,000,000 | $212,000,000 | WFCM 2025-5C3 | Wells Fargo | Argentic | Future Securitization | 1.45x | 10.7% | 67.0% |
| 3 | Wilshire Office Portfolio | WFB/JPMCB | $75,000,000 | $30,000,000 | $105,000,000 | WFCM 2025-5C3 | Wells Fargo | Argentic | Future Securitization | 1.73x | 13.2% | 51.9% |
| 13 | Queens Center | GSMC | $25,000,000 | $500,000,000 | $525,000,000 | BBCMS 2024-5C31 | Wells Fargo | LNR Partners, LLC | BMARK 2024-V12; BMO 2024-5C8; WFCM 2024-5C2; BANK5 2024-5YR11; BANK5 2024-5YR12; BBCMS 2024-5C31 | 1.84x | 10.2% | 49.5% |
| 17 | The Outlet Collection Seattle | AREF2 | $17,297,500 | $35,970,000 | $53,267,500 | BMO 2024-5C8 | Wells Fargo | Greystone Servicing Company LLC | BMO 2024-5C8 | 2.40x | 19.5% | 50.3% |
| (1) | The loan-to-value ratio, debt service coverage ratio, and debt yield calculations include any related pari passu companion loans and exclude any subordinate companion loans and/or mezzanine loans, as applicable. |
| THE INFORMATION IN THIS STRUCTURAL AND COLLATERAL TERM SHEET IS NOT COMPLETE AND MAY BE AMENDED PRIOR TO THE TIME OF SALE. THIS TERM SHEET IS NOT AN OFFER TO SELL THESE SECURITIES AND IT IS NOT A SOLICITATION OF AN OFFER TO BUY THESE SECURITIES IN ANY JURISDICTION WHERE THE OFFER OR SALE IS NOT PERMITTED. | ||
| 10 | ||
| Wells Fargo Commercial Mortgage Trust 2025-5C3 | Characteristics of the Mortgage Pool |
| C. | Mortgage Loans with Additional Secured and Mezzanine Financing |
| Loan No. | Mortgage Loan Seller | Mortgage Loan Name | Mortgage Loan Cut-off Date Balance ($) | % of Initial Pool Balance (%) | Sub Debt Cut-off Date Balance ($) | Mezzanine Debt Cut-off Date Balance ($) | Total Debt Interest Rate (%)(1) | Mortgage Loan U/W NCF DSCR (x)(2) | Total Debt U/W NCF DSCR (x) | Mortgage Loan Cut-off Date U/W NOI Debt Yield (%)(2) | Total Debt Cut-off Date U/W NOI Debt Yield (%) | Mortgage Loan Cut-off Date LTV Ratio (%)(2) | Total Debt Cut-off Date LTV Ratio (%) |
| 2 | JPMCB/ CREFI | POD Williamsburg | $76,000,000 | 9.1% | NAP | $8,933,796 | 8.2284% | 1.62x | 1.37x | 13.7% | 12.3% | 52.8% | 59.0% |
| 8 | AREF2 | Christopher Crossing Apartments | 42,000,000 | 5.0 | NAP | 5,500,000 | 7.4657 | 1.39 | 1.09 | 9.7 | 8.5 | 72.3 | 81.8 |
| Total/Weighted Average | $118,000,000 | 14.2% | $14,433,796 | 7.9569% | 1.54x | 1.27x | 12.3% | 10.9% | 59.7% | 67.1% | |||
| (1) | Total Debt Interest Rate for any specified mortgage loan reflects the weighted average of the interest rates on the respective components of the total debt. |
| (2) | With respect to any mortgage loan that is part of a whole loan, the loan-to-value ratio, debt service coverage ratio and debt yield calculations include the related pari passu companion loan(s) but excludes any related subordinate companion loan and/or mezzanine loans. |
| THE INFORMATION IN THIS STRUCTURAL AND COLLATERAL TERM SHEET IS NOT COMPLETE AND MAY BE AMENDED PRIOR TO THE TIME OF SALE. THIS TERM SHEET IS NOT AN OFFER TO SELL THESE SECURITIES AND IT IS NOT A SOLICITATION OF AN OFFER TO BUY THESE SECURITIES IN ANY JURISDICTION WHERE THE OFFER OR SALE IS NOT PERMITTED. | ||
| 11 | ||
| Wells Fargo Commercial Mortgage Trust 2025-5C3 | Characteristics of the Mortgage Pool |
| D. | Previous Securitization History(1) |
| Loan No. | Mortgage Loan Seller | Mortgage Loan or Mortgaged Property Name | City | State | Property Type | Mortgage Loan or Mortgaged Property Cut-off Date Balance ($) | % of Cut-off Date Pool Balance (%) | Previous Securitization | |
| 4.03 | CREFI | Cedrona Community | Lakewood | WA | Manufactured Housing | $6,650,000 | 0.8 | % | LCCM 2017-LC26 |
| 4.04 | CREFI | Sunrise Terrace Community | University Place | WA | Manufactured Housing | 6,250,000 | 0.7 | LCCM 2017-LC26 | |
| 4.05 | CREFI | Moxie Community | Moxee | WA | Manufactured Housing | 5,300,000 | 0.6 | LCCM 2017-LC26 | |
| 4.06 | CREFI | Chinook Mobile Community | Kennewick | WA | Manufactured Housing | 4,950,000 | 0.6 | LCCM 2017-LC26 | |
| 4.07 | CREFI | Laurel Lane MHC | Tacoma | WA | Manufactured Housing | 4,500,000 | 0.5 | LCCM 2017-LC26 | |
| 4.08 | CREFI | Northwest Community | Tacoma | WA | Manufactured Housing | 3,900,000 | 0.5 | LCCM 2017-LC26 | |
| 4.09 | CREFI | Squilchuck Creek Community | Wenatchee | WA | Manufactured Housing | 3,750,000 | 0.4 | LCCM 2017-LC26 | |
| 4.10 | CREFI | Sun City Center and Community | Kennewick | WA | Manufactured Housing | 3,600,000 | 0.4 | LCCM 2017-LC26 | |
| 5.00 | CREFI/ AREF2 | The Brazilian Court Hotel | Palm Beach | FL | Hospitality | 54,500,000 | 6.5 | CGCMT 2019-C7 | |
| 6.01 | CREFI | Brookfield Park | Conyers | GA | Multifamily | 18,582,677 | 2.2 | ARCLO 2022-FL1 | |
| 6.02 | CREFI | Retreat at Baywood | Morrow | GA | Multifamily | 17,500,000 | 2.1 | GSTNE 2017-FL1 | |
| 6.03 | CREFI | Ashford Brook | Conyers | GA | Multifamily | 10,917,323 | 1.3 | ARCLO 2022-FL1 | |
| 12.00 | AREF2 | Falls of Westpark | Houston | TX | Multifamily | 29,000,000 | 3.5 | AN1262 | |
| 13.00 | GSMC | Queens Center | Elmhurst | NY | Retail | 25,000,000 | 3.0 | QCMT 2013-QCA | |
| 15.00 | AREF2 | The Vesper Apartments | Dallas | TX | Multifamily | 18,250,000 | 2.2 | BDS 2021-FL10 | |
| 16.00 | AREF2 | Plaza at Eastlake | Chula Vista | CA | Office | 17,700,000 | 2.1 | GPMT 2019-FL2 | |
| 20.00 | JPMCB | Brookhill Village | Westminster | CO | Retail | 13,700,000 | 1.6 | MSBAM 2015-C20 | |
| 24.00 | AREF2 | Burlington Plaza | Fresno | CA | Retail | 6,500,000 | 0.8 | MSBAM 2015-C20 | |
| Total | $250,550,000 | 30.1 | % | ||||||
| (1) | The table above represents the most recent securitization with respect to the mortgaged property securing the related mortgage loan, based on information provided by the related borrower or obtained through searches of a third-party database. While loans secured by the above mortgaged properties may have been securitized multiple times in prior transactions, mortgage loans in this securitization are only listed in the above chart if the mortgage loan paid off a loan in another securitization. The information has not otherwise been confirmed by the mortgage loan sellers. |
| THE INFORMATION IN THIS STRUCTURAL AND COLLATERAL TERM SHEET IS NOT COMPLETE AND MAY BE AMENDED PRIOR TO THE TIME OF SALE. THIS TERM SHEET IS NOT AN OFFER TO SELL THESE SECURITIES AND IT IS NOT A SOLICITATION OF AN OFFER TO BUY THESE SECURITIES IN ANY JURISDICTION WHERE THE OFFER OR SALE IS NOT PERMITTED. | ||
| 12 | ||
| Wells Fargo Commercial Mortgage Trust 2025-5C3 | Characteristics of the Mortgage Pool |
| F. | Property Type Distribution(1) |

| Property Type | Number of Mortgaged Properties | Aggregate Cut-off Date Balance ($) | % of Initial Pool Balance (%) | Weighted Average Cut-off Date LTV Ratio (%) | Weighted Average Balloon LTV Ratio (%) | Weighted Average U/W NCF DSCR (x) | Weighted Average U/W NOI Debt Yield (%) | Weighted Average U/W NCF Debt Yield (%) | Weighted Average Mortgage Rate (%) | |||||||
| Multifamily | 17 | $250,462,481 | 30.0 | % | 66.9 | % | 66.7 | % | 1.29 | x | 9.1 | % | 8.9 | % | 6.6916 | % |
| Garden | 5 | 107,250,000 | 12.9 | 67.6 | 67.6 | 1.31 | 9.2 | 8.9 | 6.6684 | |||||||
| Mid Rise | 6 | 97,762,481 | 11.7 | 66.7 | 66.1 | 1.24 | 8.6 | 8.6 | 6.6082 | |||||||
| Low Rise | 6 | 45,450,000 | 5.5 | 65.7 | 65.7 | 1.36 | 9.7 | 9.5 | 6.9256 | |||||||
| Office | 12 | 199,040,164 | 23.9 | 51.7 | 50.9 | 1.75 | 14.5 | 13.5 | 7.3753 | |||||||
| CBD | 4 | 115,000,000 | 13.8 | 51.0 | 51.0 | 1.66 | 13.2 | 12.7 | 7.5215 | |||||||
| Suburban | 6 | 61,692,704 | 7.4 | 50.9 | 48.4 | 1.70 | 16.0 | 14.1 | 7.3405 | |||||||
| Medical | 2 | 22,347,460 | 2.7 | 57.8 | 57.2 | 2.33 | 17.5 | 16.1 | 6.7188 | |||||||
| Hospitality | 3 | 146,500,000 | 17.6 | 52.9 | 52.9 | 1.61 | 13.5 | 12.5 | 7.6642 | |||||||
| Limited Service | 2 | 92,000,000 | 11.0 | 54.3 | 54.3 | 1.62 | 13.7 | 12.8 | 7.7615 | |||||||
| Full Service | 1 | 54,500,000 | 6.5 | 50.5 | 50.5 | 1.58 | 13.1 | 12.0 | 7.5000 | |||||||
| Manufactured Housing | 15 | 77,750,000 | 9.3 | 64.9 | 64.8 | 1.32 | 8.7 | 8.7 | 6.3232 | |||||||
| Manufactured Housing | 15 | 77,750,000 | 9.3 | 64.9 | 64.8 | 1.32 | 8.7 | 8.7 | 6.3232 | |||||||
| Retail | 5 | 73,497,500 | 8.8 | 54.6 | 54.6 | 1.81 | 12.8 | 12.1 | 6.5737 | |||||||
| Super Regional Mall | 1 | 25,000,000 | 3.0 | 49.5 | 49.5 | 1.84 | 10.2 | 10.0 | 5.3700 | |||||||
| Anchored | 2 | 20,200,000 | 2.4 | 56.3 | 56.3 | 1.55 | 12.1 | 11.4 | 7.2136 | |||||||
| Outlet Center | 1 | 17,297,500 | 2.1 | 50.3 | 50.3 | 2.40 | 19.5 | 17.8 | 7.3300 | |||||||
| Single Tenant | 1 | 11,000,000 | 1.3 | 69.6 | 69.6 | 1.32 | 9.3 | 9.3 | 6.9450 | |||||||
| Mixed Use | 9 | 69,934,642 | 8.4 | 65.3 | 61.7 | 1.43 | 10.5 | 10.4 | 6.1796 | |||||||
| R&D/Lab/Office | 8 | 61,334,642 | 7.4 | 67.0 | 62.9 | 1.45 | 10.7 | 10.6 | 6.1260 | |||||||
| Retail/Office | 1 | 8,600,000 | 1.0 | 53.4 | 53.4 | 1.32 | 8.8 | 8.8 | 6.5620 | |||||||
| Industrial | 2 | 16,335,641 | 2.0 | 66.5 | 63.4 | 1.44 | 10.5 | 10.2 | 6.3509 | |||||||
| R&D | 1 | 9,935,641 | 1.2 | 67.0 | 62.9 | 1.45 | 10.7 | 10.6 | 6.1260 | |||||||
| Warehouse | 1 | 6,400,000 | 0.8 | 65.6 | 64.3 | 1.42 | 10.1 | 9.6 | 6.7000 | |||||||
| Total/Weighted Average: | 63 | $833,520,429 | 100.0 | % | 59.4 | % | 58.8 | % | 1.52 | x | 11.6 | % | 11.0 | % | 6.9314 | % |
| (1) | Because this table presents information relating to the mortgaged properties and not the mortgage loans, the information for mortgage loans secured by more than one mortgaged property is based on allocated loan amounts (allocating the principal balance of the mortgage loan to each of those properties according to the relative appraised values of the mortgaged properties or the allocated loan amounts or property-specific release prices set forth in the related mortgage loan documents or such other allocation as the related mortgage loan seller deemed appropriate). With respect to any mortgage loan that is part of a whole loan, the loan-to-value ratio, debt service coverage ratio and debt yield calculations include the related pari passu companion loan(s) but exclude any related subordinate secured loan(s) (unless otherwise stated). With respect to each mortgage loan, debt service coverage ratio, debt yield and loan-to-value ratio information do not take into account any subordinate debt (whether or not secured by the related mortgaged property) that currently exists or is allowed under the terms of such mortgage loan. See Annex A-1 to the Preliminary Prospectus. |
| THE INFORMATION IN THIS STRUCTURAL AND COLLATERAL TERM SHEET IS NOT COMPLETE AND MAY BE AMENDED PRIOR TO THE TIME OF SALE. THIS TERM SHEET IS NOT AN OFFER TO SELL THESE SECURITIES AND IT IS NOT A SOLICITATION OF AN OFFER TO BUY THESE SECURITIES IN ANY JURISDICTION WHERE THE OFFER OR SALE IS NOT PERMITTED. | ||
| 13 | ||
| Wells Fargo Commercial Mortgage Trust 2025-5C3 | Characteristics of the Mortgage Pool |
| G. | Geographic Distribution(1)(2) |

| Location | Number of Mortgaged Properties | Aggregate Cut-off Date Balance ($) | % of Initial Pool Balance (%) | Weighted Average Cut-off Date LTV Ratio (%) | Weighted Average Balloon LTV Ratio (%) | Weighted Average U/W NCF DSCR (x) | Weighted Average U/W NOI Debt Yield (%) | Weighted Average U/W NCF Debt Yield (%) | Weighted Average Mortgage Rate (%) |
| California | 19 | $241,880,347 | 29.0% | 60.3% | 58.7% | 1.59x | 11.9% | 11.6% | 6.7570% |
| Southern California | 7 | 122,280,347 | 14.7 | 54.8 | 54.4 | 1.75 | 13.4 | 12.8 | 7.1947 |
| Northern California | 12 | 119,600,000 | 14.3 | 66.0 | 63.1 | 1.43 | 10.4 | 10.3 | 6.3094 |
| New York | 13 | 191,912,481 | 23.0 | 55.6 | 55.2 | 1.54 | 12.1 | 11.5 | 7.2977 |
| Washington | 9 | 56,197,500 | 6.7 | 61.9 | 61.9 | 1.65 | 11.8 | 11.3 | 6.5686 |
| Florida | 1 | 54,500,000 | 6.5 | 50.5 | 50.5 | 1.58 | 13.1 | 12.0 | 7.5000 |
| Texas | 7 | 54,500,000 | 6.5 | 62.2 | 62.1 | 1.33 | 9.8 | 9.5 | 6.8963 |
| Georgia | 3 | 47,000,000 | 5.6 | 63.6 | 63.6 | 1.29 | 9.0 | 8.7 | 6.6500 |
| Ohio | 1 | 44,600,000 | 5.4 | 65.1 | 65.1 | 1.25 | 8.0 | 7.9 | 6.2300 |
| Virginia | 1 | 42,000,000 | 5.0 | 72.3 | 72.3 | 1.39 | 9.7 | 9.3 | 6.6100 |
| Other(3) | 9 | 100,930,101 | 12.1 | 56.5 | 55.7 | 1.59 | 13.5 | 12.2 | 7.1418 |
| Total/Weighted Average: | 63 | $833,520,429 | 100.0% | 59.4% | 58.8% | 1.52x | 11.6% | 11.0% | 6.9314% |
| (1) | The mortgaged properties are located in 13 states. |
| (2) | Because this table presents information relating to the mortgaged properties and not the mortgage loans, the information for mortgage loans secured by more than one mortgaged property is based on allocated loan amounts (allocating the principal balance of the mortgage loan to each of those properties according to the relative appraised values of the mortgaged properties or the allocated loan amounts or property-specific release prices set forth in the related mortgage loan documents or such other allocation as the related mortgage loan seller deemed appropriate). With respect to any mortgage loan that is part of a whole loan, the loan-to-value ratio, debt service coverage ratio and debt yield calculations include the related pari passu companion loan(s) but exclude any related subordinate secured loan(s) (unless otherwise stated). With respect to each mortgage loan, debt service coverage ratio, debt yield and loan-to-value ratio information do not take into account any subordinate debt (whether or not secured by the related mortgaged property) that currently exists or is allowed under the terms of such mortgage loan. See Annex A-1 to the Preliminary Prospectus. |
| (3) | Includes 5 other states. |
| THE INFORMATION IN THIS STRUCTURAL AND COLLATERAL TERM SHEET IS NOT COMPLETE AND MAY BE AMENDED PRIOR TO THE TIME OF SALE. THIS TERM SHEET IS NOT AN OFFER TO SELL THESE SECURITIES AND IT IS NOT A SOLICITATION OF AN OFFER TO BUY THESE SECURITIES IN ANY JURISDICTION WHERE THE OFFER OR SALE IS NOT PERMITTED. | ||
| 14 | ||
| Wells Fargo Commercial Mortgage Trust 2025-5C3 | Characteristics of the Mortgage Pool |
| H. | Characteristics of the Mortgage Pool(1) |
| CUT-OFF DATE BALANCE | ||||
| Range of Cut-off Date Balances ($) | Number of Mortgage Loans | Aggregate Cut-off Date Balance ($) | Percent by Aggregate Cut-off Date Pool Balance (%) | |
| 4,462,481 - 5,000,000 | 2 | $9,109,941 | 1.1 | % |
| 5,000,001 - 6,000,000 | 3 | 16,450,000 | 2.0 | |
| 6,000,001 - 7,000,000 | 2 | 12,900,000 | 1.5 | |
| 7,000,001 - 8,000,000 | 1 | 7,250,000 | 0.9 | |
| 8,000,001 - 9,000,000 | 1 | 8,600,000 | 1.0 | |
| 9,000,001 - 15,000,000 | 3 | 39,680,347 | 4.8 | |
| 15,000,001 - 20,000,000 | 5 | 87,847,500 | 10.5 | |
| 20,000,001 - 30,000,000 | 2 | 54,000,000 | 6.5 | |
| 30,000,001 - 50,000,000 | 6 | 238,682,641 | 28.6 | |
| 50,000,001 - 70,000,000 | 1 | 54,500,000 | 6.5 | |
| 70,000,001 - 80,000,000 | 3 | 221,500,000 | 26.6 | |
| 80,000,001 - 83,000,000 | 1 | 83,000,000 | 9.96 | |
| Total: | 30 | $833,520,429 | 100.0 | % |
| Average: | $27,784,014 | |||
| UNDERWRITTEN NOI DEBT SERVICE COVERAGE RATIO | ||||
| Range of U/W NOI DSCRs (x) | Number of Mortgage Loans | Aggregate Cut-off Date Balance ($) | Percent by Aggregate Cut-off Date Pool Balance (%) | |
| 1.23 - 1.30 | 7 | $128,000,000 | 15.4 | % |
| 1.31 - 1.40 | 7 | 162,512,481 | 19.5 | |
| 1.41 - 1.50 | 4 | 160,400,000 | 19.2 | |
| 1.51 - 1.60 | 1 | 14,980,347 | 1.8 | |
| 1.61 - 1.70 | 1 | 40,000,000 | 4.8 | |
| 1.71 - 1.80 | 5 | 226,147,460 | 27.1 | |
| 1.81 - 1.90 | 1 | 25,000,000 | 3.0 | |
| 1.91 - 2.25 | 2 | 41,482,641 | 5.0 | |
| 2.26 - 2.73 | 2 | 34,997,500 | 4.2 | |
| Total: | 30 | $833,520,429 | 100.0 | % |
| Weighted Average: | 1.59x | |||
| UNDERWRITTEN NOI DEBT YIELD | ||||
| Range of U/W NOI Debt Yields (%) | Number of Mortgage Loans | Aggregate Cut-off Date Balance ($) | Percent by Aggregate Cut-off Date Pool Balance (%) | |
| 8.0 | 1 | $44,600,000 | 5.4 | % |
| 8.1 - 12.1 | 18 | 431,312,481 | 51.7 | |
| 12.2 - 16.1 | 7 | 281,127,807 | 33.7 | |
| 16.2 - 19.5 | 4 | 76,480,141 | 9.2 | |
| Total: | 30 | $833,520,429 | 100.0 | % |
| Weighted Average: | 11.6% | |||
LOAN PURPOSE | ||||
| Loan Purpose | Number of Mortgage Loans | Aggregate Cut-off Date Balance ($) | Percent by Aggregate Cut-off Date Pool Balance (%) | |
| Refinance | 22 | $645,775,469 | 77.5 | % |
| Acquisition | 7 | 117,244,960 | 14.1 | |
| Refinance/Acquisition | 1 | 70,500,000 | 8.5 | |
| Total: | 30 | $833,520,429 | 100.0 | % |
| MORTGAGE RATE | ||||
| Range of Mortgage Rates (%) | Number of Mortgage Loans | Aggregate Cut-off Date Balance ($) | Percent by Aggregate Cut-off Date Pool Balance (%) | |
| 5.3700 - 5.5000 | 1 | $25,000,000 | 3.0 | % |
| 5.5001 - 6.2500 | 3 | 198,100,000 | 23.8 | |
| 6.2501 - 6.7500 | 6 | 151,800,000 | 18.2 | |
| 6.7501 - 7.0000 | 4 | 64,250,000 | 7.7 | |
| 7.0001 - 7.2500 | 4 | 31,400,000 | 3.8 | |
| 7.2501 - 7.5000 | 8 | 195,987,788 | 23.5 | |
| 7.5001 - 7.7850 | 4 | 166,982,641 | 20.0 | |
| Total: | 30 | $833,520,429 | 100.0 | % |
| Weighted Average: | 6.9314% | |||
| UNDERWRITTEN NCF DEBT SERVICE COVERAGE RATIO | ||||
| Range of U/W NCF DSCRs (x) | Number of Mortgage Loans | Aggregate Cut-off Date Balance ($) | Percent by Aggregate Cut-off Date Pool Balance (%) | |
| 1.20 | 1 | $18,250,000 | 2.2 | % |
| 1.21 - 1.30 | 7 | 156,750,000 | 18.8 | |
| 1.31 - 1.40 | 7 | 157,512,481 | 18.9 | |
| 1.41 - 1.50 | 4 | 133,380,347 | 16.0 | |
| 1.51 - 1.60 | 2 | 94,500,000 | 11.3 | |
| 1.61 - 1.70 | 2 | 92,000,000 | 11.0 | |
| 1.71 - 1.80 | 2 | 79,647,460 | 9.6 | |
| 1.81 - 1.90 | 2 | 59,982,641 | 7.2 | |
| 1.91 - 2.25 | 1 | 6,500,000 | 0.8 | |
| 2.26 - 2.48 | 2 | 34,997,500 | 4.2 | |
| Total: | 30 | $833,520,429 | 100.0 | % |
| Weighted Average: | 1.52x | |||
| UNDERWRITTEN NCF DEBT YIELD | ||||
| Range of U/W NCF Debt Yields (%) | Number of Mortgage Loans | Aggregate Cut-off Date Balance ($) | Percent by Aggregate Cut-off Date Pool Balance (%) | |
| 7.9 - 8.1 | 1 | $44,600,000 | 5.4 | % |
| 8.2 - 12.1 | 21 | 540,792,828 | 64.9 | |
| 12.2 - 16.1 | 5 | 178,147,460 | 21.4 | |
| 16.2 - 17.8 | 3 | 69,980,141 | 8.4 | |
| Total: | 30 | $833,520,429 | 100.0 | % |
| Weighted Average: | 11.0% | |||
| (1) | With respect to any mortgage loan that is part of a whole loan, the loan-to-value ratio, debt service coverage ratio and debt yield calculations include the related pari passu companion loan(s) but exclude any related subordinate debt (unless otherwise stated). With respect to each mortgage loan, debt service coverage ratio, debt yield and loan-to-value ratio information do not take into account any subordinate debt (whether or not secured by the related mortgaged property) that currently exists or is allowed under the terms of such mortgage loan. See Annex A-1 to the Preliminary Prospectus. Prepayment provisions for each mortgage loan reflects the entire life of the loan (from origination to maturity) and may be currently prepayable. |
| THE INFORMATION IN THIS STRUCTURAL AND COLLATERAL TERM SHEET IS NOT COMPLETE AND MAY BE AMENDED PRIOR TO THE TIME OF SALE. THIS TERM SHEET IS NOT AN OFFER TO SELL THESE SECURITIES AND IT IS NOT A SOLICITATION OF AN OFFER TO BUY THESE SECURITIES IN ANY JURISDICTION WHERE THE OFFER OR SALE IS NOT PERMITTED. | ||
| 15 | ||
| Wells Fargo Commercial Mortgage Trust 2025-5C3 | Characteristics of the Mortgage Pool |
ORIGINAL TERM TO MATURITY | ||||
| Original Terms to Maturity (months) | Number of Mortgage Loans | Aggregate Cut- off Date Balance | Percent by Aggregate Cut-off Date Pool Balance (%) | |
| 60 | 30 | $833,520,429 | 100.0 | % |
| Total: | 30 | $833,520,429 | 100.0 | % |
| Weighted Average: | 60 months | |||
| REMAINING TERM TO MATURITY | ||||
| Range of Remaining Terms to Maturity (months) | Number of Mortgage Loans | Aggregate Cut- off Date Balance | Percent by Aggregate Cut-off Date Pool Balance (%) | |
| 58 - 60 | 30 | $833,520,429 | 100.0 | % |
| Total: | 30 | $833,520,429 | 100.0 | % |
| Weighted Average: | 59 months | |||
| ORIGINAL AMORTIZATION TERM(1) | ||||
| Original Amortization Terms (months) | Number of Mortgage Loans | Aggregate Cut- off Date Balance | Percent by Aggregate Cut-off Date Pool Balance (%) | |
| Non-Amortizing | 23 | $665,597,500 | 79.9 | % |
| 360 | 7 | 167,922,929 | 20.1 | |
| Total: | 30 | $833,520,429 | 100.0 | % |
| Weighted Average(3): | 360 months | |||
| REMAINING AMORTIZATION TERM(2) | ||||
| Range of Remaining Amortization Terms (months) | Number of Mortgage Loans | Aggregate Cut- off Date Balance | Percent by Aggregate Cut-off Date Pool Balance (%) | |
| Non-Amortizing | 23 | $665,597,500 | 79.9 | % |
| 358 - 360 | 7 | 167,922,929 | 20.1 | |
| Total: | 30 | $833,520,429 | 100.0 | % |
| Weighted Average(3): | 360 months | |||
| LOCKBOXES | ||||
| Type of Lockbox | Number of Mortgage Loans | Aggregate Cut- off Date Balance | Percent by Aggregate Cut-off Date Pool Balance (%) | |
| Hard / Springing Cash Management | 13 | $346,725,307 | 41.6 | % |
| Springing | 9 | 230,362,481 | 27.6 | |
| Soft / Springing Cash Management | 6 | 171,832,641 | 20.6 | |
| None | 1 | 44,600,000 | 5.4 | |
| Hard / In Place Cash Management | 1 | 40,000,000 | 4.8 | |
| Total: | 30 | $833,520,429 | 100.0 | % |
| PREPAYMENT PROVISION SUMMARY | ||||
| Prepayment Provision | Number of Mortgage Loans | Aggregate Cut- off Date Balance | Percent by Aggregate Cut-off Date Pool Balance (%) | |
| Lockout / Defeasance / Open | 20 | $588,725,307 | 70.6 | % |
| Lockout / GRTR 1% or YM / Open | 6 | 103,312,481 | 12.4 | |
| Lockout / GRTR 1% or YM or Defeasance / Open | 2 | 100,000,000 | 12.0 | |
| GRTR 1% or YM / GRTR 1% or YM or Defeasance / Open | 1 | 34,982,641 | 4.2 | |
| Lockout / GRTR 2% or YM / Open | 1 | 6,500,000 | 0.8 | |
| Total: | 30 | $833,520,429 | 100.0 | % |
CUT-OFF DATE LOAN-TO-VALUE RATIO | ||||
| Range of Cut-off Date LTV Ratios (%) | Number of Mortgage Loans | Aggregate Cut- off Date Balance | Percent by Aggregate Cut-off Date Pool Balance (%) | |
| 40.8 - 45.0 | 3 | $48,732,641 | 5.8 | % |
| 45.1 - 50.0 | 2 | 65,000,000 | 7.8 | |
| 50.1 - 55.0 | 6 | 236,044,960 | 28.3 | |
| 55.1 - 60.0 | 2 | 32,680,347 | 3.9 | |
| 60.1 - 65.0 | 5 | 110,162,481 | 13.2 | |
| 65.1 - 70.0 | 10 | 292,900,000 | 35.1 | |
| 70.1 - 72.3 | 2 | 48,000,000 | 5.8 | |
| Total: | 30 | $833,520,429 | 100.0 | % |
| Weighted Average: | 59.4% | |||
| BALLOON LOAN-TO-VALUE RATIO | ||||
| Range of Balloon LTV Ratios (%) | Number of Mortgage Loans | Aggregate Cut- off Date Balance | Percent by Aggregate Cut-off Date Pool Balance (%) | |
| 40.3 - 45.0 | 3 | $48,732,641 | 5.8 | % |
| 45.1 - 50.0 | 2 | 65,000,000 | 7.8 | |
| 50.1 - 55.0 | 6 | 236,044,960 | 28.3 | |
| 55.1 - 60.0 | 3 | 37,142,828 | 4.5 | |
| 60.1 - 65.0 | 6 | 195,100,000 | 23.4 | |
| 65.1 - 70.0 | 8 | 203,500,000 | 24.4 | |
| 70.1 - 72.3 | 2 | 48,000,000 | 5.8 | |
| Total: | 30 | $833,520,429 | 100.0 | % |
| Weighted Average: | 58.8% | |||
| AMORTIZATION TYPE | ||||
| Amortization Type | Number of Mortgage Loans | Aggregate Cut- off Date Balance | Percent by Aggregate Cut-off Date Pool Balance (%) | |
| Interest Only | 23 | $665,597,500 | 79.9 | % |
| Amortizing Balloon | 5 | 142,072,929 | 17.0 | |
| Interest Only, Amortizing Balloon | 2 | 25,850,000 | 3.1 | |
| Total: | 30 | $833,520,429 | 100.0 | % |
| ORIGINAL TERM OF INTEREST-ONLY PERIOD FOR PARTIAL IO LOANS | ||||
| IO Terms (months) | Number of Mortgage Loans | Aggregate Cut- off Date Balance | Percent by Aggregate Cut-off Date Pool Balance (%) | |
| 12 | 1 | $18,600,000 | 2.2 | % |
| 36 | 1 | 7,250,000 | 0.9 | |
| Total: | 2 | $25,850,000 | 3.1 | % |
| Weighted Average: | 19 months | |||
| SEASONING | ||||
| Seasoning (months) | Number of Mortgage Loans | Aggregate Cut- off Date Balance | Percent by Aggregate Cut-off Date Pool Balance (%) | |
| 0 | 11 | $354,800,000 | 42.6 | % |
| 1 | 15 | 378,490,082 | 45.4 | |
| 2 | 4 | 100,230,347 | 12.0 | |
| Total: | 30 | $833,520,429 | 100.0 | % |
| Weighted Average: | 1 month | |||
| (1) | The original amortization term shown for any mortgage loan that is interest only for part of its term does not include the number of months in its interest only period and reflects only the number of months as of the commencement of amortization remaining from the end of such interest-only period. |
| (2) | The remaining amortization term shown for any mortgage loan that is interest only for part of its term does not include the number of months in its interest only period and reflects only the number of months as of the commencement of amortization remaining from the end of such interest-only period. |
| (3) | Excludes the non-amortizing mortgage loans. |
| THE INFORMATION IN THIS STRUCTURAL AND COLLATERAL TERM SHEET IS NOT COMPLETE AND MAY BE AMENDED PRIOR TO THE TIME OF SALE. THIS TERM SHEET IS NOT AN OFFER TO SELL THESE SECURITIES AND IT IS NOT A SOLICITATION OF AN OFFER TO BUY THESE SECURITIES IN ANY JURISDICTION WHERE THE OFFER OR SALE IS NOT PERMITTED. | ||
| 16 | ||
| Wells Fargo Commercial Mortgage Trust 2025-5C3 | Certain Terms and Conditions |
| V. | Certain Terms and Conditions |
| Interest Entitlements: | The interest entitlement of each Class of Certificates on each Distribution Date generally will be the interest accrued during the related Interest Accrual Period on the related Certificate Balance or Notional Amount at the related pass-through rate, net of any prepayment interest shortfalls allocated to that Class for such Distribution Date as described below. If prepayment interest shortfalls arise from voluntary prepayments (without the Master Servicer’s consent) on particular non-specially serviced loans during any collection period, the Master Servicer is required to make a compensating interest payment to offset those shortfalls, generally up to an amount equal to the portion of its master servicing fees that accrue at 0.25 basis points per annum. The remaining amount of prepayment interest shortfalls will be allocated to reduce the interest entitlement on all Classes of Certificates that are entitled to interest, on a pro rata basis, based on their respective amounts of accrued interest for the related Distribution Date. If a Class receives less than the entirety of its interest entitlement on any Distribution Date, then the shortfall (excluding any shortfall due to prepayment interest shortfalls), together with interest thereon, will be added to its interest entitlement for the next succeeding Distribution Date. |
| Principal Distribution Amount: | The Principal Distribution Amount for each Distribution Date generally will be the aggregate amount of principal received or advanced in respect of the mortgage loans, net of any non-recoverable advances and interest thereon and workout-delayed reimbursement amounts that are reimbursed to the Master Servicer, the Special Servicer or the Trustee during the related collection period. Non-recoverable advances and interest thereon are reimbursable from principal collections and advances before reimbursement from other amounts. Workout-delayed reimbursement amounts are reimbursable from principal collections. |
| Subordination, Allocation of Losses and Certain Expenses | The chart below describes the manner in which the payment rights of certain Classes of Certificates will be senior or subordinate, as the case may be, to the payment rights of other Classes of Certificates. The chart also shows the corresponding entitlement to receive principal and/or interest of certain Classes of Certificates on any distribution date in descending order. It also shows the manner in which losses are allocated to certain Classes of Certificates in ascending order (beginning with the Non-Offered Certificates, other than the Class X-D, X-F and Class R Certificates) to reduce the Certificate Balance of each such Class to zero; provided that no principal payments or mortgage loan losses will be allocated to the Class X-A, X-B, X-D, X-F or R Certificates, although principal payments and losses may reduce the Notional Amounts of the Class X-A, X-B, X-D and X-F Certificates and, therefore, the amount of interest they accrue. |
 |
| (1) | The Class X-A, X-B, X-D and X-F Certificates are interest-only certificates. |
| (2) | Non-Offered Certificates. |
| (3) | Other than the Class X-D, X-F and R Certificates |
| Distributions: | On each Distribution Date, funds available for distribution from the mortgage loans, net of specified trust fees, expenses and reimbursements will generally be distributed in the following amounts and order of priority (in each case to the extent of remaining available funds): |
| 1. Class A-1, A-2, A-3, X-A, X-B, X-D and X-F Certificates: To interest on the Class A-1, A-2, A-3, X-A, X-B, X-D and X-F Certificates, pro rata, according to their respective interest entitlements. |
| THE INFORMATION IN THIS STRUCTURAL AND COLLATERAL TERM SHEET IS NOT COMPLETE AND MAY BE AMENDED PRIOR TO THE TIME OF SALE. THIS TERM SHEET IS NOT AN OFFER TO SELL THESE SECURITIES AND IT IS NOT A SOLICITATION OF AN OFFER TO BUY THESE SECURITIES IN ANY JURISDICTION WHERE THE OFFER OR SALE IS NOT PERMITTED. | ||
| 17 | ||
| Wells Fargo Commercial Mortgage Trust 2025-5C3 | Certain Terms and Conditions |
| 2. Class A-1, A-2 and A-3 Certificates: To principal on the Class A-1, A-2 and A-3 Certificates in the following amounts and order of priority: (i) first, to principal on the Class A-1 Certificates until their Certificate Balance is reduced to zero; (ii) second, to principal on the Class A-2 Certificates until their Certificate Balance is reduced to zero, up to the remainder of the Principal Distribution Amount for such Distribution Date; (iii) third, to principal on the Class A-3 Certificates until their Certificate Balance is reduced to zero, up to the remainder of the Principal Distribution Amount for such Distribution Date. However, if the Certificate Balance of each and every Class of Principal Balance Certificates, other than the Class A-1, A-2 and A-3 Certificates, has been reduced to zero as a result of the allocation of Mortgage Loan losses and expenses and any of the Class A-1, A-2 and A-3 Certificates remains outstanding, then the Principal Distribution Amount will be distributed to the Class A-1, A-2 and A-3 Certificates, pro rata, based on their respective outstanding Certificate Balances, until their Certificate Balances have been reduced to zero. | |
| 3. Class A-1, A-2 and A-3 Certificates: To reimburse the holders of the Class A-1, A-2 and A-3 Certificates, pro rata, on the basis of previously allocated unreimbursed losses, for any previously unreimbursed losses (plus interest thereon) on the mortgage loans that were previously allocated in reduction of the Certificate Balances of such Classes. | |
4. Class A-S Certificates: To make distributions on the Class A-S Certificates as follows: (a) first, to interest on the Class A-S Certificates in the amount of the interest entitlement for that Class; (b) next, to the extent of the portion of the Principal Distribution Amount remaining after distributions in respect of principal to each Class with a higher distribution priority (in this case, the Class A-1, A-2 and A-3 Certificates), to principal on the Class A-S Certificates until their Certificate Balance is reduced to zero; and (c) next, to reimburse the holders of the Class A-S Certificates for any previously unreimbursed losses (plus interest thereon) on the mortgage loans that were previously allocated to that Class in reduction of their Certificate Balance. | |
5. Class B Certificates: To make distributions on the Class B Certificates as follows: (a) first, to interest on the Class B Certificates in the amount of the interest entitlement for that Class; (b) next, to the extent of the portion of the Principal Distribution Amount remaining after distributions in respect of principal to each Class with a higher distribution priority (in this case, the Class A-1, A-2, A-3 and A-S Certificates), to principal on the Class B Certificates until their Certificate Balance is reduced to zero; and (c) next, to reimburse the holders of the Class B Certificates for any previously unreimbursed losses (plus interest thereon) on the mortgage loans that were previously allocated to that Class in reduction of their Certificate Balance. | |
6. Class C Certificates: To make distributions on the Class C Certificates as follows: (a) first, to interest on the Class C Certificates in the amount of the interest entitlement for that Class; (b) next, to the extent of the portion of the Principal Distribution Amount remaining after distributions in respect of principal to each Class with a higher distribution priority (in this case, the Class A-1, A-2, A-3, A-S and B Certificates), to principal on the Class C Certificates until their Certificate Balance is reduced to zero; and (c) next, to reimburse the holders of the Class C Certificates for any previously unreimbursed losses (plus interest thereon) on the mortgage loans that were previously allocated to that Class in reduction of their Certificate Balance. | |
7. After the Class A-1, A-2, A-3, A-S, B and C Certificates are paid all amounts to which they are entitled, the remaining funds available for distribution will be used to pay interest, principal and loss reimbursement amounts on the Class D, E, F, G-RR and J-RR Certificates sequentially in that order in a manner analogous to the Class C Certificates. | |
| Allocation of Yield Maintenance Charges and Prepayment Premiums: | If any Yield Maintenance Charge or Prepayment Premium is collected during any particular collection period with respect to any mortgage loan, then on the Distribution Date corresponding to that collection period, the certificate administrator will pay that Yield Maintenance Charge or Prepayment Premium (net of liquidation fees payable therefrom) in the following manner: (1) to each class of the Class A-1, A-2, A-3, A-S, B, C, D and E Certificates, the product of (a) such Yield Maintenance Charge or Prepayment Premium, (b) the related Base Interest Fraction for such class and the applicable principal prepayment, and (c) a fraction, the numerator of which is equal to the amount of principal distributed to such class for that Distribution Date, and the denominator of which is the total amount of principal distributed to the Class A-1, A-2, A-3, A-S, B, C, D, E, F, G-RR and J-RR Certificates for that Distribution Date, (2) to the Class X-A Certificates, the excess, if any, of (a) the product of (i) such Yield Maintenance Charge or Prepayment Premium and (ii) a fraction, the |
| THE INFORMATION IN THIS STRUCTURAL AND COLLATERAL TERM SHEET IS NOT COMPLETE AND MAY BE AMENDED PRIOR TO THE TIME OF SALE. THIS TERM SHEET IS NOT AN OFFER TO SELL THESE SECURITIES AND IT IS NOT A SOLICITATION OF AN OFFER TO BUY THESE SECURITIES IN ANY JURISDICTION WHERE THE OFFER OR SALE IS NOT PERMITTED. | ||
| 18 | ||
| Wells Fargo Commercial Mortgage Trust 2025-5C3 | Certain Terms and Conditions |
numerator of which is equal to the total amount of principal distributed to the Class A-1, A-2 and the Class A-3 Certificates for that Distribution Date, and the denominator of which is the total amount of principal distributed to the Class A-1, A-2, A-3, A-S, B, C, D, E, F, G-RR and J-RR Certificates for that Distribution Date, over (b) the total amount of such Yield Maintenance Charge or Prepayment Premium distributed to the Class A-1, A-2 and A-3 Certificates as described above, (3) to the holders of the Class X-B Certificates, the excess, if any, of (a) the product of (i) such Yield Maintenance Charge or Prepayment Premium and (ii) a fraction, the numerator of which is equal to the total amount of principal distributed to the Class A-S, B and C Certificates for that Distribution Date, and the denominator of which is the total amount of principal distributed to the Class A-1, A-2, A-3, A-S, B, C, D, E, F, G-RR and J-RR Certificates for that Distribution Date, over (b) the total amount of such Yield Maintenance Charge or Prepayment Premium distributed to the Class A-S, Class B and Class C Certificates as described above, and (4) to the Class X-D Certificates, any remaining portion of such Yield Maintenance Charge or Prepayment Premium not distributed as described above; provided, however, that after the Certificate Balances of the Class A-1, A-2, A-3, A-S, B, C, D and E Certificates have been reduced to zero, all prepayment premiums and yield maintenance charges with respect to the mortgage loans will be allocated among the holders of the Class F, G-RR and J-RR Certificates as provided in the WFCM 2025-5C3 pooling and servicing agreement. No Prepayment Premiums or Yield Maintenance Charges will be distributed to the holders of the Class X-F or R Certificates. For a description of when Prepayment Premiums and Yield Maintenance Charges are generally required on the mortgage loans, see Annex A-1 to the Preliminary Prospectus. See also “Risk Factors—Risks Relating to the Mortgage Loans—Risks Relating to Enforceability of Yield Maintenance Charges, Prepayment Premiums or Defeasance Provisions” and “Risk Factors—Other Risks Relating to the Certificates—Your Yield May Be Affected by Defaults, Prepayments and Other Factors” in the Preliminary Prospectus. Prepayment Premiums and Yield Maintenance Charges will be distributed on each Distribution Date only to the extent they are actually received on the mortgage loans as of the related Determination Date. | |
| Realized Losses: | The Certificate Balances of the Class A-1, A-2, A-3, A-S, B, C, D, E, F, G-RR and J-RR Certificates will be reduced without distribution on any Distribution Date as a write-off to the extent of any losses realized on the mortgage loans allocated to such Class on such Distribution Date. Such losses will be applied in the following order, in each case until the related Certificate Balance is reduced to zero: first, to the Class J-RR Certificates; second, to the Class G-RR Certificates; third, to the Class F Certificates; fourth, to the Class E Certificates; fifth, to the Class D Certificates; sixth, to the Class C Certificates; seventh, to the Class B Certificates; eighth, to the Class A-S Certificates; and, finally, pro rata, to the Class A-1, A-2 and A-3 Certificates based on their outstanding Certificate Balances. The Notional Amount of the Class X-A Certificates will be reduced by the amount of all losses that are allocated to the Class A-1, A-2 and A-3 Certificates as write-offs in reduction of their Certificate Balances. The Notional Amount of the Class X-B Certificates will be reduced by the amount of all losses that are allocated to the Class A-S, B and C Certificates as write-offs in reduction of their Certificate Balances. |
| P&I Advances: | The Master Servicer or, if the Master Servicer fails to do so, the Trustee, will be obligated to advance delinquent debt service payments (other than balloon payments and default interest) and assumed debt service payments on mortgage loans with delinquent balloon payments (excluding any related companion loan), except to the extent any such advance is deemed non-recoverable from collections on the related mortgage loan. In addition, if an Appraisal Reduction Amount exists for a given mortgage loan, the interest portion of any P&I advance for such mortgage loan will be reduced, which will have the effect of reducing the amount of interest available for distribution to the Certificates in reverse alphabetical order of their Class designations (except that interest payments on the Class A-1, A-2, A-3, X-A, X-B, X-D and X-F Certificates would be affected on a pari passu basis). |
| Servicing Advances: | The Master Servicer or, if the Master Servicer fails to do so, the Trustee, will be obligated to make servicing advances, including the payment of delinquent property taxes, insurance premiums and ground rent, except to the extent that those advances are deemed non-recoverable from collections on the related mortgage loan. The Master Servicer or the Trustee, as applicable, will have the primary obligation to make any required servicing advances with respect to any serviced whole loan. With respect to any non-serviced whole loan, the master servicer or trustee, as |
| THE INFORMATION IN THIS STRUCTURAL AND COLLATERAL TERM SHEET IS NOT COMPLETE AND MAY BE AMENDED PRIOR TO THE TIME OF SALE. THIS TERM SHEET IS NOT AN OFFER TO SELL THESE SECURITIES AND IT IS NOT A SOLICITATION OF AN OFFER TO BUY THESE SECURITIES IN ANY JURISDICTION WHERE THE OFFER OR SALE IS NOT PERMITTED. | ||
| 19 | ||
| Wells Fargo Commercial Mortgage Trust 2025-5C3 | Certain Terms and Conditions |
| applicable, under the related lead securitization servicing agreement will have the primary obligation to make any required servicing advances with respect to such non-serviced whole loan. | |
Appraisal Reduction Amounts and Collateral | An “Appraisal Reduction Amount” generally will be created in the amount, if any, by which the principal balance of a required appraisal loan (which is a mortgage loan (other than a non-serviced mortgage loan) with respect to which certain defaults, modifications or insolvency events have occurred as further described in the Preliminary Prospectus) plus other amounts overdue or advanced in connection with such mortgage loan exceeds 90% of the appraised value of the related mortgaged property plus certain escrows and reserves (including letters of credit) held with respect to the mortgage loan. With respect to any serviced whole loan, any Appraisal Reduction Amount will be allocated, pro rata, to the related mortgage loan and the related pari passu companion loan(s). With respect to any non-serviced mortgage loan, appraisal reduction amounts are expected to be calculated in a similar manner under the related non-serviced pooling and servicing agreement.
A mortgage loan will cease to be a required appraisal loan when the same has ceased to be a specially serviced loan (if applicable), has been brought current for at least three consecutive months and no other circumstances exist that would cause such mortgage loan to be a required appraisal loan. A “Collateral Deficiency Amount” will exist with respect to any mortgage loan that is modified into an AB loan structure and remains a corrected mortgage loan and will generally equal the excess of (i) the stated principal balance of such AB modified loan (taking into account the related junior note(s) and any pari passu notes included therein), over (ii) the sum of (in the case of a whole loan, solely to the extent allocable to the subject mortgage loan) (x) the most recent appraised value of the related mortgaged property plus (y) solely to the extent not reflected or taken into account in such appraised value and to the extent on deposit with, or otherwise under the control of, the lender as of the date of such determination, any capital or additional collateral contributed by the related borrower at the time the mortgage loan (and as part of the modification thereto) became an AB modified loan plus (z) any other escrows or reserves (in addition to any amounts set forth in the immediately preceding clause (y) and solely to the extent not reflected or taken into account in the calculation of any related Appraisal Reduction Amount) held by the lender with respect to the mortgage loan as of the date of such determination. A “Cumulative Appraisal Reduction Amount” with respect to any mortgage loan will be the sum of any Appraisal Reduction Amount and any Collateral Deficiency Amount. Appraisal Reduction Amounts will affect the amount of debt service advances in respect of the related mortgage loan. Additionally, Cumulative Appraisal Reduction Amounts will be taken into account in the determination of the identity of the Class whose majority constitutes the “controlling class certificateholder” and is entitled to appoint the directing certificateholder. |
Clean-Up Call and Exchange Termination: | On each Distribution Date occurring after the aggregate unpaid principal balance of the pool of mortgage loans is less than 1.0% of the principal balance of the mortgage loans as of the cut-off date, certain specified persons will have the option to purchase all of the remaining mortgage loans (and the trust’s interest in all property acquired through exercise of remedies in respect of any mortgage loan) at the price specified in the Preliminary Prospectus. Exercise of the option will terminate the trust and retire the then-outstanding Certificates. If the aggregate Certificate Balances of each of the Class A-1, A-2, A-3, A-S, B, C, D and E Certificates have been reduced to zero, the trust may also be terminated in connection with an exchange of all the then-outstanding Certificates (other than the Class R Certificates) for the mortgage loans and REO properties then remaining in the issuing entity, subject to payment of a price specified in the Preliminary Prospectus, but all of the holders of those outstanding Classes of Certificates (other than the Class R Certificates) would have to voluntarily participate in the exchange. |
| Liquidation Loan Waterfall: | Following the liquidation of any mortgage loan or mortgaged property, the net liquidation proceeds generally will be applied (after reimbursement of advances and certain trust fund expenses), first, as a recovery of accrued interest, other than delinquent interest that was not advanced as a result of Appraisal Reduction Amounts, second, as a recovery of principal until all principal has been recovered, and then as a recovery of delinquent interest that was not advanced as a result of Appraisal Reduction Amounts. Please see “Description of the Certificates—Distributions—Application Priority of Mortgage Loan Collections or Whole Loan Collections” in the Preliminary Prospectus. |
| Control Eligible Certificates: | The Class G-RR and J-RR Certificates. |
| Directing Certificateholder/ Controlling Class: | A directing certificateholder may be appointed by the “controlling class certificateholder”, which will be the holder(s) of a majority of the Controlling Class. The “Controlling Class” will be, as of any time of determination, the most subordinate Class of Control Eligible Certificates then outstanding that has an aggregate Certificate Balance (as |
| THE INFORMATION IN THIS STRUCTURAL AND COLLATERAL TERM SHEET IS NOT COMPLETE AND MAY BE AMENDED PRIOR TO THE TIME OF SALE. THIS TERM SHEET IS NOT AN OFFER TO SELL THESE SECURITIES AND IT IS NOT A SOLICITATION OF AN OFFER TO BUY THESE SECURITIES IN ANY JURISDICTION WHERE THE OFFER OR SALE IS NOT PERMITTED. | ||
| 20 | ||
| Wells Fargo Commercial Mortgage Trust 2025-5C3 | Certain Terms and Conditions |
notionally reduced by any Cumulative Appraisal Reduction Amounts allocable to such Class(es)) at least equal to 25% of the initial Certificate Balance of that Class; provided, however, that if at any time the Certificate Balances of the Certificates other than the Control Eligible Certificates have been reduced to zero as a result of principal payments on the Mortgage Loans, then the Controlling Class will be the most subordinate Class of Control Eligible Certificates that has a Certificate Balance greater than zero without regard to any Cumulative Appraisal Reduction Amounts. The Controlling Class as of the closing date will be the Class J-RR Certificates. | |
| Control and Consultation: | The rights of various parties to replace the Special Servicer and approve or consult with respect to major actions of the Special Servicer will vary according to defined periods. A “Control Termination Event” will occur when the Class G-RR Certificates have a Certificate Balance (taking into account the application of any Cumulative Appraisal Reduction Amounts to notionally reduce the Certificate Balance of such Class) of less than 25% of the initial Certificate Balance of that Class; provided that a Control Termination Event will not be deemed continuing in the event that the Certificate Balances of the Certificates other than the Control Eligible Certificates have been reduced to zero as a result of principal payments on the mortgage loans. A “Consultation Termination Event” will occur when there is no Class of Control Eligible Certificates that has a then-outstanding Certificate Balance at least equal to 25% of the initial Certificate Balance of that Class, in each case, without regard to the application of any Cumulative Appraisal Reduction Amounts; provided that a Consultation Termination Event will not be deemed continuing in the event that the Certificate Balances of the Certificates other than the Control Eligible Certificates have been reduced to zero as a result of principal payments on the mortgage loans. If no Control Termination Event has occurred and is continuing, except with respect to the Excluded Loans (as defined below) (i) the directing certificateholder will be entitled to grant or withhold approval of asset status reports prepared, and material servicing actions proposed, by the Special Servicer, and (ii) the directing certificateholder will be entitled to terminate and replace the Special Servicer with or without cause, and appoint itself or another person as the successor special servicer. It will be a condition to such appointment that Fitch, KBRA and Moody’s (and any rating agency rating any securities backed by any pari passu companion loan(s) serviced under this transaction) confirm that the appointment would not result in a qualification, downgrade or withdrawal of any of their then-current ratings of Certificates (and any certificates backed by any pari passu companion loan(s) serviced under this transaction). If a Control Termination Event has occurred and is continuing but no Consultation Termination Event has occurred and is continuing, the Special Servicer will be required to consult with the directing certificateholder (other than with respect to Excluded Loans) and the Operating Advisor in connection with asset status reports and material special servicing actions. If a Consultation Termination Event has occurred and is continuing, the Special Servicer must seek to consult with the Operating Advisor in connection with asset status reports and material special servicing actions, and, in general, no directing certificateholder will be recognized or have any right to terminate the Special Servicer or approve, direct or consult with respect to servicing matters. With respect to each serviced whole loan, the rights of the directing certificateholder described above will be subject to the consultation rights of the holders of the related pari passu companion loans. Those consultation rights will generally extend to asset status reports and material special servicing actions involving the related whole loan, will be as set forth in the related intercreditor agreement, and will be in addition to the rights of the directing certificateholder in this transaction described above. With respect to each non-serviced whole loan, the applicable servicing agreement for the related controlling pari passu companion loan(s) generally grants (or will grant) the directing certificateholder under the related securitization control rights that may include the right to approve or disapprove various material servicing actions involving the related whole loan. The directing certificateholder for this securitization (so long as no Consultation Termination Event has occurred and is occurring) generally will nonetheless have the right to be consulted on a non-binding basis with respect to such actions. For purposes of the servicing of any such whole loan contemplated by this paragraph, the occurrence and continuance of a Control Termination Event or Consultation Termination Event under this securitization will not limit the control or other rights of the directing certificateholder (or equivalent) under the securitization of the related controlling pari passu companion loan(s). The control rights and consent and consultation rights described in the preceding paragraphs are subject to various limitations, conditions and exceptions as described in the Preliminary Prospectus. |
| THE INFORMATION IN THIS STRUCTURAL AND COLLATERAL TERM SHEET IS NOT COMPLETE AND MAY BE AMENDED PRIOR TO THE TIME OF SALE. THIS TERM SHEET IS NOT AN OFFER TO SELL THESE SECURITIES AND IT IS NOT A SOLICITATION OF AN OFFER TO BUY THESE SECURITIES IN ANY JURISDICTION WHERE THE OFFER OR SALE IS NOT PERMITTED. | ||
| 21 | ||
| Wells Fargo Commercial Mortgage Trust 2025-5C3 | Certain Terms and Conditions |
Notwithstanding any contrary description set forth above, in the event that, with respect to any mortgage loan, the controlling class certificateholder or the directing certificateholder is a Borrower Party, the controlling class certificateholder and the directing certificateholder will have no right to receive asset status reports or such other information as may be specified in the WFCM 2025-5C3 pooling and servicing agreement, to grant or withhold approval of, or consult with respect to, asset status reports prepared, and material servicing actions proposed, by the Special Servicer, with respect to such mortgage loan, and such mortgage loan will be referred to as an “Excluded Loan” as to such party. In addition, notwithstanding any contrary description set forth above, in the event that, with respect to any mortgage loan, a controlling class certificateholder is a Borrower Party, such controlling class certificateholder will have no right to receive asset status reports or such other information as may be specified in the WFCM 2025-5C3 pooling and servicing agreement with respect to such mortgage loan. “Borrower Party” means a borrower, a mortgagor or a manager of a mortgaged property, an Accelerated Mezzanine Loan Lender, or any Borrower Party Affiliate. “Accelerated Mezzanine Loan Lender” means a mezzanine lender under a mezzanine loan that has been accelerated or as to which foreclosure or enforcement proceedings have been commenced against the equity collateral pledged to secure such mezzanine loan. “Borrower Party Affiliate” means, with respect to a borrower, a mortgagor, a manager of a mortgaged property or an Accelerated Mezzanine Loan Lender, (x) any other person controlling or controlled by or under common control with such borrower, mortgagor, manager or Accelerated Mezzanine Loan Lender, as applicable, or (y) any other person owning, directly or indirectly, 25% or more of the beneficial interests in such borrower, mortgagor, manager or Accelerated Mezzanine Loan Lender. | |
| Risk Retention Consultation Party: | A risk retention consultation party may be appointed by the holder or holders of more than 50% of the VRR Interest, by Certificate Balance. The holder of the majority of the VRR Interest will have a continuing right to appoint, remove or replace the risk retention consultation party in its sole discretion. This right may be exercised at any time and from time to time. There is expected to be no initial risk retention consultation party as of the closing date. Notwithstanding any contrary description set forth above, in the event that, with respect to any mortgage loan, the holder of the majority of the VRR Interest or the risk retention consultation party is a Borrower Party, such mortgage loan will be referred to as an “Excluded Loan” as to such party. Except with respect to an Excluded Loan as to such party, the risk retention consultation party will be entitled to consult with the Special Servicer, upon request of the risk retention consultation party, with respect to certain material servicing actions proposed by the Special Servicer. |
| Replacement of Special Servicer: | If a Control Termination Event has occurred and is continuing, the Special Servicer may be removed and replaced without cause upon the affirmative direction of certificate owners holding not less than 66-2/3% of a certificateholder quorum, following a proposal from certificate owners holding not less than 25% of the appraisal-reduced voting rights of all Principal Balance Certificates. The certificateholders who initiate a vote on a termination and replacement of the Special Servicer without cause must cause Fitch, KBRA and Moody’s to confirm the then-current ratings of the Certificates (or decline to review the matter) and cause the payment of the fees and expenses incurred in the replacement. If no Control Termination Event has occurred and is continuing, the Special Servicer may be replaced by the directing certificateholder, subject to Fitch, KBRA and Moody’s (and any Rating Agency rating any securities backed by any pari passu companion loan(s) serviced under this transaction) confirming the then-current ratings of the Certificates (and any certificates backed by any pari passu companion loans serviced under this transaction) or declining to review the matter. In addition, if at any time the Operating Advisor determines, in its sole discretion exercised in good faith, that (i) the Special Servicer is not performing its duties as required under the pooling and servicing agreement in accordance with the Servicing Standard and (ii) the replacement of the Special Servicer would be in the best interest of the certificateholders as a collective whole, then the Operating Advisor will have the right to recommend the replacement of the Special Servicer and will submit its formal recommendation to the Trustee and the Certificate Administrator (along with its rationale, its proposed replacement special servicer and other relevant information justifying its recommendation). The Operating Advisor’s recommendation to replace the Special Servicer must be confirmed by an affirmative vote of holders of Certificates representing a majority of the aggregate outstanding Certificate Balance of all Principal Balance Certificates whose holders voted on the matter, provided that the holders of Principal Balance Certificates that so voted on the matter (i) hold Principal Balance Certificates representing at least 20% of the outstanding Certificate Balance of all Principal Balance Certificates on an aggregate basis and (ii) consist of at least three certificateholders or certificate owners that are not “risk retention affiliated” with each other. In the event the holders of Principal Balance Certificates evidencing at least a majority of a quorum |
| THE INFORMATION IN THIS STRUCTURAL AND COLLATERAL TERM SHEET IS NOT COMPLETE AND MAY BE AMENDED PRIOR TO THE TIME OF SALE. THIS TERM SHEET IS NOT AN OFFER TO SELL THESE SECURITIES AND IT IS NOT A SOLICITATION OF AN OFFER TO BUY THESE SECURITIES IN ANY JURISDICTION WHERE THE OFFER OR SALE IS NOT PERMITTED. | ||
| 22 | ||
| Wells Fargo Commercial Mortgage Trust 2025-5C3 | Certain Terms and Conditions |
of certificateholders elect to remove and replace the Special Servicer (which requisite affirmative votes must be received within 180 days of the posting of the notice of the Operating Advisor’s recommendation to replace the Special Servicer to the Certificate Administrator’s website), the Certificate Administrator will be required to receive a Rating Agency Confirmation from each of the Rating Agencies at that time. | |
| Excluded Special Servicer: | In the event that, with respect to any mortgage loan, the Special Servicer is a Borrower Party, the Special Servicer will be required to resign as special servicer of such mortgage loan (referred to as an “excluded special servicer loan”). If no Control Termination Event has occurred and is continuing, the directing certificateholder will be entitled to appoint (and may replace with or without cause) a separate special servicer that is not a Borrower Party (referred to as an “excluded special servicer”) with respect to such excluded special servicer loan unless such excluded special servicer loan is also an excluded loan. Otherwise, upon resignation of the Special Servicer with respect to an excluded special servicer loan, the resigning Special Servicer will be required to use reasonable efforts to appoint the excluded special servicer. |
| Appraisal Remedy: | If the Class of Certificates comprising the Controlling Class loses its status as Controlling Class because of the application of an Appraisal Reduction Amount or Collateral Deficiency Amount, the holders of a majority of the voting rights of such Class may require the Special Servicer to order a second appraisal for any mortgage loan in respect of which an Appraisal Reduction Amount or Collateral Deficiency Amount has been applied. The Special Servicer must thereafter determine whether, based on its assessment of such second appraisal, any recalculation of the Appraisal Reduction Amount or Collateral Deficiency Amount is warranted and, if so warranted, will recalculate such Appraisal Reduction Amount or Collateral Deficiency Amount. Such Class will not be able to exercise any direction, control, consent and/or similar rights of the Controlling Class unless and until reinstated as the Controlling Class through such determination; and pending such determination, the rights of the Controlling Class will be exercised by the Control Eligible Certificates, if any, that would be the Controlling Class taking into account the subject appraisal reduction amount. |
| Sale of Defaulted Assets: | There will be no “fair value” purchase option. Instead, the WFCM 2025-5C3 pooling and servicing agreement will authorize the Special Servicer to sell defaulted mortgage loans serviced by the Special Servicer to the highest bidder in a manner generally similar to sales of REO properties. The sale of a defaulted loan (other than a non-serviced whole loan) for less than par plus accrued interest and certain other fees and expenses owed on the loan will be subject to consent or consultation rights of the directing certificateholder, Operating Advisor and/or Risk Retention Consultation Party, as described in the Preliminary Prospectus. Generally speaking, the holder of a pari passu companion loan will have consent and/or consultation rights, as described in the Preliminary Prospectus. With respect to any serviced whole loan, if such whole loan becomes a defaulted loan under the WFCM 2025-5C3 pooling and servicing agreement, the Special Servicer will generally be required to sell both the mortgage loan and the related pari passu companion loan(s) as a single whole loan.
With respect to each non-serviced whole loan, the applicable servicing agreement governing the servicing of such whole loan generally provides (or is expected to provide) that, if the related pari passu companion loan(s) serviced under such agreement become a defaulted loan under such servicing agreement, then the related special servicer may offer to sell to any person (or may offer to purchase) for cash such whole loan during such time as such applicable pari passu companion loan(s) constitutes a defaulted loan under such servicing agreement. Generally speaking, in connection with any such sale, the related special servicer is required to sell both the mortgage loan and the related pari passu companion loan(s) as a whole loan. The directing certificateholder for this securitization generally will have consultation rights as the holder of an interest in the related mortgage loan, as described in the Preliminary Prospectus. The procedures for the sale of any whole loan that becomes a defaulted whole loan, and any associated consultation rights, are subject to various limitations, conditions and exceptions as described in the Preliminary Prospectus. |
| “As-Is” Appraisals: | Appraisals must be conducted on an “as-is” basis, and must be no more than 12 months old, for purposes of determining Appraisal Reduction Amounts and market value in connection with REO sales. Required appraisals may consist of updates of prior appraisals. Internal valuations by the Special Servicer are permitted if the principal balance of a mortgage loan is less than $2,000,000. |
| THE INFORMATION IN THIS STRUCTURAL AND COLLATERAL TERM SHEET IS NOT COMPLETE AND MAY BE AMENDED PRIOR TO THE TIME OF SALE. THIS TERM SHEET IS NOT AN OFFER TO SELL THESE SECURITIES AND IT IS NOT A SOLICITATION OF AN OFFER TO BUY THESE SECURITIES IN ANY JURISDICTION WHERE THE OFFER OR SALE IS NOT PERMITTED. | ||
| 23 | ||
| Wells Fargo Commercial Mortgage Trust 2025-5C3 | Certain Terms and Conditions |
| Operating Advisor: | The Operating Advisor will have certain review and consultation rights relating to the performance of the Special Servicer and with respect to its actions taken in connection with the resolution and/or liquidation of Specially Serviced Loans. With respect to each mortgage loan (other than a Non-Serviced Mortgage Loan) or serviced whole loan, the Operating Advisor will be responsible for: ● reviewing the actions of the Special Servicer with respect to any Specially Serviced Loan; ● reviewing (i) all reports by the Special Servicer made available to Privileged Persons on the Certificate Administrator’s website that are relevant to the Operating Advisor’s obligations under the pooling and servicing agreement and (ii) each Asset Status Report (as defined in the Preliminary Prospectus) (after the occurrence and during the continuance of an Operating Advisor Consultation Event (as defined below)) and Final Asset Status Report (as defined in the Preliminary Prospectus); ● reviewing for accuracy and consistency with the WFCM 2025-5C3 pooling and servicing agreement the mathematical calculations by the special servicer and the corresponding application of the non-discretionary portion of the applicable formulas required to be utilized in connection with Appraisal Reduction Amounts, Collateral Deficiency Amounts and net present value calculations used in the Special Servicer’s determination of what course of action to take in connection with the workout or liquidation of a Specially Serviced Loan; and ● preparing an annual report (if any mortgage loan (other than any Non-Serviced Mortgage Loan) or serviced whole loan was a Specially Serviced Loan at any time during the prior calendar year or an Operating Advisor Consultation Event (as defined below) occurred during the prior calendar year) that sets forth whether the Operating Advisor believes, in its sole discretion exercised in good faith, that the Special Servicer is operating in compliance with the Servicing Standard with respect to its performance of its duties under the pooling and servicing agreement with respect to Specially Serviced Loans (and, after the occurrence and during the continuance of an Operating Advisor Consultation Event (as defined below), with respect to major decisions on non-Specially Serviced Loans) during the prior calendar year on an “asset-level basis”. The Operating Advisor will identify (1) which, if any, standards the Operating Advisor believes, in its sole discretion exercised in good faith, the Special Servicer has failed to comply with and (2) any material deviations from the Special Servicer’s obligations under the pooling and servicing agreement with respect to the resolution or liquidation of any Specially Serviced Loan or REO Property (other than with respect to any REO Property related to any Non-Serviced Mortgage Loan). In preparing any Operating Advisor Annual Report (as defined in the Preliminary Prospectus), the Operating Advisor will not be required to report on instances of non-compliance with, or deviations from, the Servicing Standard or the Special Servicer’s obligations under the pooling and servicing agreement that the Operating Advisor determines, in its sole discretion exercised in good faith, to be immaterial. With respect to each mortgage loan (other than any Non-Serviced Mortgage Loan) or serviced whole loan, after the Operating Advisor has received notice that an Operating Advisor Consultation Event (as defined below) has occurred and is continuing, in addition to the duties described above, the Operating Advisor will be required to perform the following additional duties: ● to consult (on a non-binding basis) with the Special Servicer in respect of asset status reports and ● to consult (on a non-binding basis) with the Special Servicer with respect to “major decisions” processed by the Special Servicer. An “Operating Advisor Consultation Event” will occur when the Certificate Balance of the Class G-RR and Class J-RR Certificates in the aggregate (taking into account the application of any Cumulative Appraisal Reduction Amounts to notionally reduce the Certificate Balances of such Classes) is 25% or less of the initial Certificate Balances of such Classes in the aggregate. |
| Asset Representations Reviewer: | The Asset Representations Reviewer will be required to review certain delinquent mortgage loans after a specified delinquency threshold has been exceeded (an “Asset Review Trigger”) and the required percentage of certificateholders vote to direct a review of such delinquent loans. An Asset Review Trigger will occur when either (1) mortgage loans with an aggregate outstanding principal balance of 25.0% or more of the aggregate outstanding principal balance of all of the mortgage loans (including any REO loans) held by the issuing entity as of the end of the applicable collection period are delinquent loans or (2)(A) prior to and including the second anniversary of the Closing Date, at least 10 mortgage loans are delinquent loans as of the end of the applicable collection period and the outstanding principal balance of such delinquent loans in the aggregate constitutes at least 15.0% of the aggregate outstanding principal balance of all of the mortgage |
| THE INFORMATION IN THIS STRUCTURAL AND COLLATERAL TERM SHEET IS NOT COMPLETE AND MAY BE AMENDED PRIOR TO THE TIME OF SALE. THIS TERM SHEET IS NOT AN OFFER TO SELL THESE SECURITIES AND IT IS NOT A SOLICITATION OF AN OFFER TO BUY THESE SECURITIES IN ANY JURISDICTION WHERE THE OFFER OR SALE IS NOT PERMITTED. | ||
| 24 | ||
| Wells Fargo Commercial Mortgage Trust 2025-5C3 | Certain Terms and Conditions |
loans (including any REO loans) held by the issuing entity as of the end of the applicable collection period, or (B) after the second anniversary of the Closing Date, at least 15 mortgage loans are delinquent loans as of the end of the applicable collection period and the outstanding principal balance of such delinquent loans in the aggregate constitutes at least 20.0% of the aggregate outstanding principal balance of all of the mortgage loans (including any REO loans) held by the issuing entity as of the end of the applicable collection period. See “Pooling and Servicing Agreement—The Asset Representations Reviewer—Asset Review” in the Preliminary Prospectus. The Asset Representations Reviewer may be terminated and replaced without cause. Upon (i) the written direction of certificateholders evidencing not less than 25% of the voting rights (without regard to the application of any Cumulative Appraisal Reduction Amounts) requesting a vote to terminate and replace the Asset Representations Reviewer with a proposed successor Asset Representations Reviewer that is an eligible asset representations reviewer, and (ii) payment by such holders to the certificate administrator of the reasonable fees and expenses to be incurred by the certificate administrator in connection with administering such vote, the certificate administrator will promptly provide notice to all certificateholders and the Asset Representations Reviewer of such request by posting such notice on its internet website, and by mailing such notice to all certificateholders and the Asset Representations Reviewer. Upon the written direction of certificateholders evidencing at least 75% of a certificateholder quorum (without regard to the application of any Cumulative Appraisal Reduction Amounts), the Trustee will terminate all of the rights and obligations of the Asset Representations Reviewer under the WFCM 2025-5C3 pooling and servicing agreement by written notice to the Asset Representations Reviewer, and the proposed successor Asset Representations Reviewer will be appointed. See “Pooling and Servicing Agreement—The Asset Representations Reviewer” in the Preliminary Prospectus. | |
| Dispute Resolution Provisions: | The mortgage loan sellers will be subject to the dispute resolution provisions set forth in the WFCM 2025-5C3 pooling and servicing agreement to the extent those provisions are triggered with respect to any mortgage loan sold to the depositor by a mortgage loan seller and such mortgage loan seller will be obligated under the related mortgage loan purchase agreement to comply with all applicable provisions and to take part in any mediation or arbitration proceedings that may result. Generally, in the event that a Repurchase Request (as defined in the Preliminary Prospectus) is not “Resolved” (as defined below) within 180 days after the related mortgage loan seller receives such Repurchase Request, then the enforcing servicer will be required to send a notice to the “Initial Requesting Certificateholder” (if any) and the Certificate Administrator indicating the enforcing servicer’s intended course of action with respect to the Repurchase Request. If (a) the enforcing servicer’s intended course of action with respect to the Repurchase Request does not involve pursuing further action to exercise rights against the related mortgage loan seller with respect to the Repurchase Request and the Initial Requesting Certificateholder, if any, or any other certificateholder or certificate owner wishes to exercise its right to refer the matter to mediation (including non-binding arbitration) or arbitration, or (b) the enforcing servicer’s intended course of action is to pursue further action to exercise rights against the related mortgage loan seller with respect to the Repurchase Request but the Initial Requesting Certificateholder, if any, or any other certificateholder or certificate owner does not agree with the dispute resolution method selected by the enforcing servicer, then the Initial Requesting Certificateholder, if any, or such other certificateholder or certificate owner may deliver a written notice to the Special Servicer indicating its intent to exercise its right to refer the matter to either mediation or arbitration. “Resolved” means, with respect to a Repurchase Request, (i) that the related Material Defect has been cured, (ii) the related mortgage loan has been repurchased in accordance with the related mortgage loan purchase agreement, (iii) a mortgage loan has been substituted for the related mortgage loan in accordance with the related mortgage loan purchase agreement, (iv) the applicable mortgage loan seller has made a Loss of Value Payment (as defined in the Preliminary Prospectus), (v) a contractually binding agreement is entered into between the enforcing servicer, on behalf of the issuing entity, and the related mortgage loan seller that settles the related mortgage loan seller’s obligations under the related mortgage loan purchase agreement or (vi) the related mortgage loan is no longer property of the issuing entity as a result of a sale or other disposition in accordance with the WFCM 2025-5C3 pooling and servicing agreement. See “Pooling and Servicing Agreement—Dispute Resolution Provisions” in the Preliminary Prospectus. |
| Investor Communications: | The certificate administrator is required to include on any Form 10–D any request received from a certificateholder to communicate with other certificateholders related to certificateholders exercising their rights under the terms of the WFCM 2025-5C3 pooling and servicing agreement. Any certificateholder wishing to communicate with other certificateholders regarding the exercise of its rights under the terms of the WFCM 2025-5C3 pooling and servicing agreement will be able to deliver a written request signed by an authorized representative of the requesting investor to the certificate administrator. |
| THE INFORMATION IN THIS STRUCTURAL AND COLLATERAL TERM SHEET IS NOT COMPLETE AND MAY BE AMENDED PRIOR TO THE TIME OF SALE. THIS TERM SHEET IS NOT AN OFFER TO SELL THESE SECURITIES AND IT IS NOT A SOLICITATION OF AN OFFER TO BUY THESE SECURITIES IN ANY JURISDICTION WHERE THE OFFER OR SALE IS NOT PERMITTED. | ||
| 25 | ||
| Wells Fargo Commercial Mortgage Trust 2025-5C3 | Certain Terms and Conditions |
| Certain Fee Offsets: | If a workout fee is earned by the Special Servicer following a loan default with respect to any mortgage loan that it services, then certain limitations will apply based on modification fees paid by the borrower. The modification fee generally must not exceed 1% of the principal balance of the loan as modified in any 12-month period. In addition, if the loan re-defaults, any subsequent workout fee on that loan must be reduced by a portion of the modification fees paid by the borrower in the previous 12-months. Likewise, liquidation fees collected in connection with a liquidation or partial liquidation of a mortgage loan must be reduced by a portion of the modification fees paid by the borrower in the previous 12 months. |
| Deal Website: | The Certificate Administrator will be required to maintain a deal website, which will include, among other items: (a) summaries of asset status reports prepared by the Special Servicer, (b) inspection reports, (c) appraisals, (d) various “special notices” described in the Preliminary Prospectus, (e) the “Investor Q&A Forum”, (f) a voluntary “Investor Registry” and (g) the “Risk Retention Special Notices” tab. Investors may access the deal website following execution of a certification and confidentiality agreement. |
| Initial Controlling Class Certificateholder: | It is expected that Argentic Securities Holdings 2 Cayman Limited, an affiliate of Argentic Real Estate Finance 2 LLC and Argentic Services Company LP or an affiliate will be the initial controlling class certificateholder. |
| Whole Loans: | Each of the mortgaged properties identified above under “IV. Characteristics of the Mortgage Pool—B. Summary of the Whole Loans” secures both a mortgage loan to be included in the trust fund and one or more other mortgage loans that will not be included in the trust fund, each of which will be pari passu or subordinate in right of payment with the mortgage loan included in the trust fund. We refer to each such group of mortgage loans as a “whole loan”. Such “—Summary of the Whole Loans” section includes further information regarding the various notes in each whole loan, the holders of such notes, the lead servicing agreement for each such whole loan, and the master servicer and special servicer under such lead servicing agreement. |
| THE INFORMATION IN THIS STRUCTURAL AND COLLATERAL TERM SHEET IS NOT COMPLETE AND MAY BE AMENDED PRIOR TO THE TIME OF SALE. THIS TERM SHEET IS NOT AN OFFER TO SELL THESE SECURITIES AND IT IS NOT A SOLICITATION OF AN OFFER TO BUY THESE SECURITIES IN ANY JURISDICTION WHERE THE OFFER OR SALE IS NOT PERMITTED. | ||
| 26 | ||
| Various - Various | Loan #1 | Cut-off Date Balance: | $83,000,000 | |
| Various | Radius at Harbor Bay | Cut-off Date LTV: | 67.0% | |
| Alameda, CA 94502 | UW NCF DSCR: | 1.45x | ||
| UW NOI Debt Yield: | 10.7% |
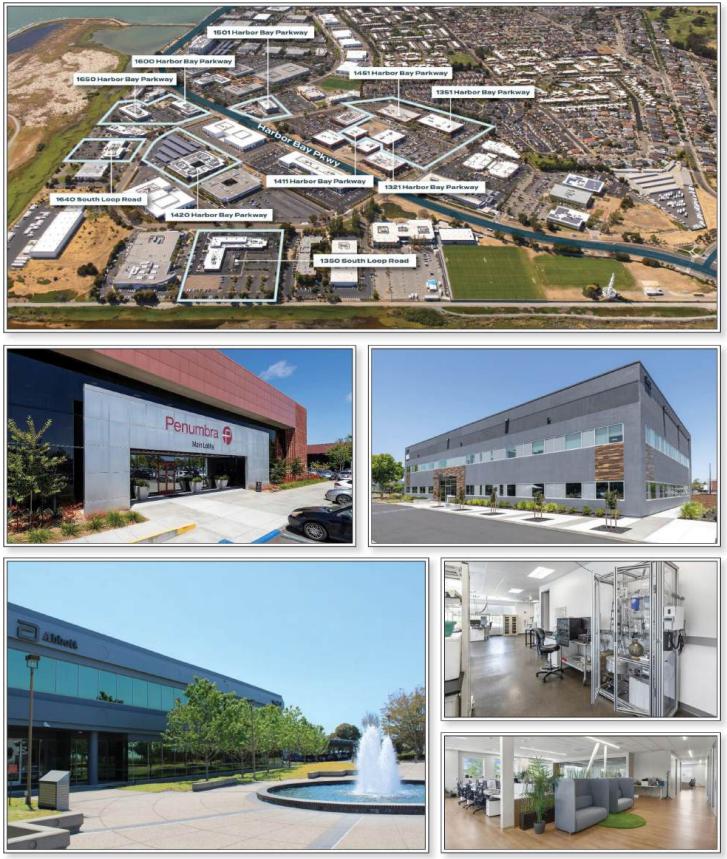
| THE INFORMATION IN THIS STRUCTURAL AND COLLATERAL TERM SHEET IS NOT COMPLETE AND MAY BE AMENDED PRIOR TO THE TIME OF SALE. THIS TERM SHEET IS NOT AN OFFER TO SELL THESE SECURITIES AND IT IS NOT A SOLICITATION OF AN OFFER TO BUY THESE SECURITIES IN ANY JURISDICTION WHERE THE OFFER OR SALE IS NOT PERMITTED. | ||
| 27 | ||
| Various - Various | Loan #1 | Cut-off Date Balance: | $83,000,000 | |
| Various | Radius at Harbor Bay | Cut-off Date LTV: | 67.0% | |
| Alameda, CA 94502 | UW NCF DSCR: | 1.45x | ||
| UW NOI Debt Yield: | 10.7% |
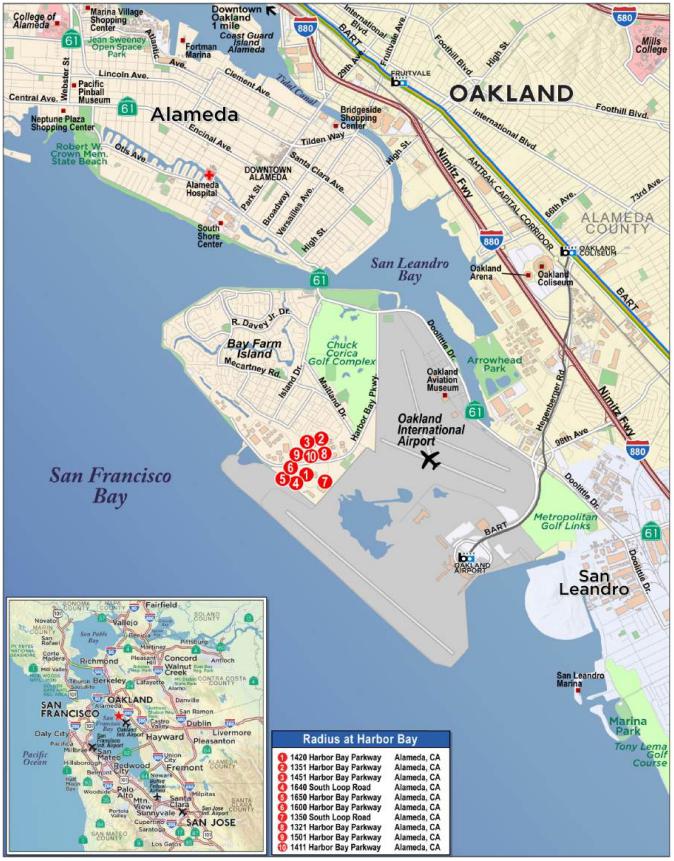
| THE INFORMATION IN THIS STRUCTURAL AND COLLATERAL TERM SHEET IS NOT COMPLETE AND MAY BE AMENDED PRIOR TO THE TIME OF SALE. THIS TERM SHEET IS NOT AN OFFER TO SELL THESE SECURITIES AND IT IS NOT A SOLICITATION OF AN OFFER TO BUY THESE SECURITIES IN ANY JURISDICTION WHERE THE OFFER OR SALE IS NOT PERMITTED. | ||
| 28 | ||
| Mortgage Loan No. 1 – Radius at Harbor Bay |
| Mortgage Loan Information | Property Information | |||||
| Mortgage Loan Seller: | WFB | Single Asset/Portfolio: | Portfolio | |||
| Credit Assessment (Moody’s/Fitch/KBRA): | NR/NR/NR | Location: | Alameda, CA 94502 | |||
| Original Balance(1): | $83,000,000 | General Property Type: | Various | |||
| Cut-off Date Balance(1): | $83,000,000 | Detailed Property Type: | Various | |||
| % of Initial Pool Balance: | 9.96% | Title Vesting: | Fee | |||
| Loan Purpose: | Refinance | Year Built/Renovated: | Various/Various | |||
| Borrower Sponsors: | TNREF IV REIV, LLC and True North Real Estate Fund IV, L.P. | Size: Cut-off Date Balance per SF: | 643,220 SF $330 | |||
| Guarantors: | TNREF IV REIV, LLC and True North Real Estate Fund IV, L.P. | Maturity Balance per SF: Property Manager: | $309 CBRE, INC. | |||
| Mortgage Rate: | 6.1260% | |||||
| Note Date: | 12/30/2024 | |||||
| Maturity Date: | 1/11/2030 | |||||
| Original Term to Maturity: | 60 months | |||||
| Original Amortization Term: | 360 months | Underwriting and Financial Information(1) | ||||
| IO Period: | 0 months | UW NOI(3): | $22,761,221 | |||
| Seasoning: | 0 months | UW NCF: | $22,439,357 | |||
| Prepayment Provisions: | L(24),D(29),O(7) | UW NOI Debt Yield: | 10.7% | |||
| Lockbox/Cash Mgmt Status: | Hard/Springing | UW NCF Debt Yield: | 10.6% | |||
| Additional Debt Type: | Pari Passu | UW NOI Debt Yield at Maturity: | 11.4% | |||
| Additional Debt Balance: | $129,000,000 | UW NCF DSCR: | 1.45x | |||
| Future Debt Permitted (Type): | No (NAP) | Most Recent NOI(3): | $18,029,392 (9/30/2024 TTM) | |||
| 2nd Most Recent NOI(3): | $12,162,354 (12/31/2023) | |||||
| Reserves(2) | 3rd Most Recent NOI: | $10,220,790 (12/31/2022) | ||||
| Type | Initial | Monthly | Cap | Most Recent Occupancy: | 93.9% (Various) | |
| RE Taxes: | $1,000,744 | $250,186 | NAP | 2nd Most Recent Occupancy: | 89.5% (12/31/2023) | |
| Insurance: | $0 | Springing | NAP | 3rd Most Recent Occupancy: | 90.7% (12/31/2022) | |
| Replacement Reserve: | $0 | $10,721 | $385,932 | Appraised Value (as of)(4): | $316,270,000 (Various) | |
| Leasing Reserve: | $4,500,000 | $53,602 | (2) | Appraised Value per SF(4): | $492 | |
| Abbott Reserve: | $0 | Springing | (2) | Cut-off Date LTV Ratio: | 67.0% | |
| Existing TI/LC Reserve: | $20,860,736 | $0 | NAP | Maturity Date LTV Ratio: | 62.9% | |
| Rent Concessions Reserve: | $355,039 | $0 | NAP | |||
| Sources and Uses | ||||||
| Sources | Proceeds | % of Total | Uses | Proceeds | % of Total | |
| Whole Loan Amount(1): | $212,000,000 | 98.1% | Loan Payoff: | $177,584,940 | 82.2% | |
| Borrower Sponsor Equity: | $4,133,191 | 1.9% | Reserves: | $26,716,519 | 12.4% | |
| Closing Costs: | $11,831,733 | 5.5% | ||||
| Total Sources: | $216,133,191 | 100.0% | Total Uses: | $216,133,191 | 100.0% | |
| (1) | The Radius at Harbor Bay Mortgage Loan (as defined below) is part of a whole loan evidenced by four pari passu promissory notes with an aggregate original principal balance of $212,000,000. The information presented is based on the Radius at Harbor Bay Whole Loan (as defined below). |
| (2) | See “Escrows and Reserves” below for further discussion of reserve requirements. |
| (3) | The increase in NOI from 2022 to UW was primarily due to an increase in occupancy from 90.7% to 93.9% and an increase in average rental rates from $22.08 PSF to $37.62 PSF. Additionally, Penumbra, Inc. is converting the 1451 Harbor Bay Parkway property into an R&D. Demolition has started, and Penumbra, Inc. is expected to complete the buildout by July 2025. |
| (4) | The appraisal provided “hypothetical as-stabilized” or “hypothetical as-complete/stabilized” values for all ten of the Radius at Harbor Bay Properties (as defined below). For eight of the ten properties where “hypothetical as-stabilized” or “hypothetical as- complete/stabilized” values were used, the property conversions from office to life science use has been completed, property occupancy has stabilized and all outstanding TI/LC reserves of $20,860,736 have been reserved for up-front. For the remaining non-stabilized properties that have not been converted, as-is values were used. The aggregate portfolio value on this combined basis was $316,270,000 as of October 21, 2024 and October 23, 2024. |
The Mortgage Loan. The largest mortgage loan (the “Radius at Harbor Bay Mortgage Loan”) is part of a whole loan (the “Radius at Harbor Bay Whole Loan”) evidenced by four pari passu promissory notes with an aggregate original principal amount $212,000,000. The Radius at Harbor Bay Whole Loan is secured by a first priority fee mortgage encumbering the borrowers’ fee interests in 10 office, industrial, and mixed use properties totaling 643,220 SF of net rentable area located in Alameda, California, (collectively the “Radius at Harbor Bay Properties”). The Radius at Harbor Bay Mortgage Loan is evidenced by the controlling Note A-1, with an original principal balance of $83,000,000. The Radius at Harbor Bay Whole Loan will be serviced pursuant to the pooling and servicing agreement for the WFCM 2025-5C3 transaction. See “Description of the Mortgage Pool—The Serviced Pari Passu Whole Loans” and “Pooling and Servicing Agreement” in the Preliminary Prospectus.
| THE INFORMATION IN THIS STRUCTURAL AND COLLATERAL TERM SHEET IS NOT COMPLETE AND MAY BE AMENDED PRIOR TO THE TIME OF SALE. THIS TERM SHEET IS NOT AN OFFER TO SELL THESE SECURITIES AND IT IS NOT A SOLICITATION OF AN OFFER TO BUY THESE SECURITIES IN ANY JURISDICTION WHERE THE OFFER OR SALE IS NOT PERMITTED. | ||
| 29 | ||
| Various - Various | Loan #1 | Cut-off Date Balance: | $83,000,000 | |
| Various | Radius at Harbor Bay | Cut-off Date LTV: | 67.0% | |
| Alameda, CA 94502 | UW NCF DSCR: | 1.45x | ||
| UW NOI Debt Yield: | 10.7% |
| Radius at Harbor Bay Whole Loan Summary | ||||
| Note | Original Balance | Cut-off Date Balance | Note Holder | Controlling Note |
| A-1 | $83,000,000 | $83,000,000 | WFB | Yes |
| A-2(1) | $75,000,000 | $75,000,000 | WFB | No |
| A-3(1) | $11,600,000 | $11,600,000 | WFB | No |
| A-4(1) | $42,400,000 | $42,400,000 | GACC | No |
| Total | $212,000,000 | $212,000,000 | ||
| (1) | Expected to be contributed to one or more future securitization trust(s). |
The Borrowers and the Borrower Sponsors. The borrowers are Harbor Bay Parkway LLC, 1640 South Loop Road LLC, 1501 Harbor Bay LLC, 1321 & 1351 Harbor Bay LLC, 1411 Harbor Bay LLC, 1420 Harbor Bay LLC, 1451 Harbor Bay LLC and 1350 South Loop LLC, each a single-purpose, Delaware limited liability company with one independent director.
The borrower sponsors and non-recourse carveout guarantors are TNREF IV REIV, LLC and True North Real Estate Fund IV, L.P. (individually or collectively, “True North Management Group”).
True North Management Group is a real estate investment firm that invests in middle market real estate assets in growing United States metropolitan areas with a value add and opportunistic approach. True North Management Group has raised over $1.5 billion in discretionary institutional equity capital across four funds and multiple co-investment vehicles.
The Properties. The Radius at Harbor Bay Properties comprise 643,220 SF across 10 buildings consisting of a mix of R&D, laboratory, and office uses located on a 33.93-acre site in Alameda, California. The Radius at Harbor Bay Properties consist of 435,949 SF of mixed use (R&D/Lab/Office) space, 121,216 SF of headquartered office space, and 86,055 SF of industrial R&D space. As of October 16, 2024 and November 26, 2024, the Radius at Harbor Bay Properties were 93.9% leased to 18 unique tenants with a weighted average lease term of approximately 8.2 years. The Radius at Harbor Bay Properties also include 2,525 on-site parking spaces (3.93 spaces per 1,000 SF), inclusive of 1,498 spaces shared on a non-exclusive basis to the entire Empire Parkway Centre condominium regime.
The following table presents certain information relating to the Radius at Harbor Bay Properties:
| Radius at Harbor Bay Properties Summary | |||||||||
| Property Name / Property Type / Property Sub-Type | Allocated Whole Loan Cut-off Date Balance | % of Portfolio Cut-off Date Balance | Occupancy(1) | Year Built / Renovated(2) | Net Rentable Area (SF)(1) | Appraised Value(2) | Allocated Cut-off Date LTV | UW NOI(1) | % of UW NOI(1) |
1420 Harbor Bay Parkway Office / Suburban | $29,960,240 | 14.1% | 100.0% | 1986 / Various | 121,216 | $46,420,000 | 64.5% | $4,225,296 | 18.6% |
1351 Harbor Bay Parkway Mixed Use / R&D/Lab/Office | $28,895,302 | 13.6% | 100.0% | 1984 / Various | 97,980 | $44,770,000 | 64.5% | $2,826,526 | 12.4% |
1451 Harbor Bay Parkway Industrial / R&D | $25,377,782 | 12.0% | 100.0% | 1984 / Various | 86,055 | $39,320,000 | 64.5% | $2,482,514 | 10.9% |
1640 South Loop Road Mixed Use / R&D/Lab/Office | $23,557,707 | 11.1% | 100.0% | 1996 / 2021-2022 | 51,780 | $36,500,000 | 64.5% | $3,245,026 | 14.3% |
1650 Harbor Bay Parkway Mixed Use / R&D/Lab/Office | $23,493,165 | 11.1% | 67.1% | 2001 / 2019-2024 | 67,537 | $29,600,000 | 79.4% | $1,400,062 | 6.2% |
1600 Harbor Bay Parkway Mixed Use / R&D/Lab/Office | $23,041,374 | 10.9% | 100.0% | 2001 / 2019-2024 | 62,696 | $35,700,000 | 64.5% | $2,692,701 | 11.8% |
1350 South Loop Road Mixed Use / R&D/Lab/Office | $20,324,170 | 9.6% | 100.0% | 1987 / 2022 | 43,645 | $31,490,000 | 64.5% | $2,827,643 | 12.4% |
1321 Harbor Bay Parkway Mixed Use / R&D/Lab/Office | $14,799,403 | 7.0% | 100.0% | 1984 / Various | 50,177 | $22,930,000 | 64.5% | $1,447,506 | 6.4% |
1501 Harbor Bay Parkway Mixed Use / R&D/Lab/Office | $14,199,166 | 6.7% | 49.8% | 1985 / 2021 | 33,817 | $16,600,000 | 85.5% | $797,057 | 3.5% |
1411 Harbor Bay Parkway Mixed Use / R&D/Lab/Office | $8,351,691 | 3.9% | 100.0% | 1984 / Various | 28,317 | $12,940,000 | 64.5% | $816,889 | 3.6% |
| Total/Weighted Average | $212,000,000 | 100.0% | 93.9% | 643,220 | $316,270,000 | 67.0% | $22,761,221 | 100.0% | |
| (1) | Information based on the underwritten rent roll. |
| (2) | Source: Appraisal. |
| (3) | The appraisal provided “hypothetical as-stabilized” or “hypothetical as-complete/stabilized” values for all ten of the Radius at Harbor Bay Properties. For eight of the ten properties where “hypothetical as-stabilized” or “hypothetical as- complete/stabilized” values were used, the property conversions from office to life science use has been completed, property occupancy has stabilized and all outstanding TI/LC reserves of $20,860,736 have been reserved for up-front. For the remaining non-stabilized properties that have not been converted, as-is values were used. The aggregate portfolio value on this combined basis was $316,270,000 as of October 21, 2024 and October 23, 2024. |
| THE INFORMATION IN THIS STRUCTURAL AND COLLATERAL TERM SHEET IS NOT COMPLETE AND MAY BE AMENDED PRIOR TO THE TIME OF SALE. THIS TERM SHEET IS NOT AN OFFER TO SELL THESE SECURITIES AND IT IS NOT A SOLICITATION OF AN OFFER TO BUY THESE SECURITIES IN ANY JURISDICTION WHERE THE OFFER OR SALE IS NOT PERMITTED. | ||
| 30 | ||
| Various - Various | Loan #1 | Cut-off Date Balance: | $83,000,000 | |
| Various | Radius at Harbor Bay | Cut-off Date LTV: | 67.0% | |
| Alameda, CA 94502 | UW NCF DSCR: | 1.45x | ||
| UW NOI Debt Yield: | 10.7% |
Major Tenants.
Penumbra, Inc. (262,529 SF, 40.8% net rentable area, 31.3% underwritten base rent). Founded in 2004, Penumbra, Inc. (NYSE: PEN) is a global provider of neurological and vascular medical devices. Penumbra, Inc. offers a 3D computer-based technology platform for the surgical removal of fluid and tissue from the ventricles and cerebrum. Penumbra, Inc. started occupying the 1351 Harbor Bay Parkway property in May 2008, and has since expanded into the 1451 Harbor Bay Parkway property, 1411 Harbor Bay Parkway property, and 1321 Harbor Bay Parkway property. In addition, Penumbra, Inc. also occupies space at five adjacent buildings (non-collateral) including its headquarters located at 1310 Harbor Bay Parkway (non-collateral). Penumbra, Inc. employs approximately 4,200 individuals and generates annual revenue of over $1.06 billion through a combination of direct sales and distributor arrangements. The Penumbra, Inc. lease has a current expiration of December 31, 2036, with three five-year renewal options and no termination options remaining.
Abbott Diabetes Care, Inc. (121,216 SF, 18.8% of net rentable area; 17.4% of underwritten base rent). Abbott Labs (NYSE: ABT), the parent company of Abbott Diabetes Care, Inc. (“Abbott”) is a global medical device company that develops and sells healthcare products worldwide. The company’s product portfolio spans across four segments: pharmaceutical products, diagnostic products, nutritional products, and medical devices. The company generated over $40.1 billion in revenue in 2023. The Abbott lease has a current expiration of December 31, 2029, with two five-year renewals and no termination options.
Vivani Medical, Inc. (43,645 SF; 6.8% of net rentable area; 11.7% of underwritten base rent). Vivani Medical, Inc. (Nasdaq: VANI) is a biopharmaceutical company that specializes in miniaturized and subdermal implants, utilizing its advanced nano portal implant technology to treat chronic diseases. The Vivani Medical, Inc. lease has a current expiration of September 30, 2033, with two five-year renewals and no termination options remaining.
The following table presents certain information relating to the tenancy at the Radius at Harbor Bay Properties:
| Tenant Summary | |||||||||
| Tenant Name | Credit Rating (Fitch/Moody's/ S&P)(1) | Tenant SF | % of Total SF | Annual UW Rent(2) | % of Total Annual UW Rent(2) | Annual UW Rent PSF(2) | Lease Expiration | Term. Option (Y/N) | Renewal Options |
| Penumbra, Inc.(3) | NR/NR/NR | 262,529 | 40.8% | $7,573,435 | 31.3% | $28.85 | 12/31/2036 | N | 3 x 5 Yr |
| Abbott Diabetes Care, Inc. | NR/Aa3/AA- | 121,216 | 18.8% | $4,216,554 | 17.4% | $34.79 | 12/31/2029 | N | 2 x 5 Yr |
| Vivani Medical, Inc. | NR/NR/NR | 43,645 | 6.8% | $2,839,299 | 11.7% | $65.05 | 9/30/2033 | N | 2 x 5 Yr |
| Bay Area Disruptor | NR/NR/NR | 28,488 | 4.4% | $1,589,630 | 6.6% | $55.80 | 9/30/2037 | N | None |
| AllCells, LLC | NR/NR/NR | 25,865 | 4.0% | $1,580,554 | 6.5% | $61.11 | 11/30/2033 | N | 1 x 5 Yr |
| Subtotal/Wtd. Avg. | 481,743 | 74.9% | $17,799,472 | 73.6% | $36.95 | ||||
| Other Tenants | 122,285 | 19.0% | $6,399,187 | 26.4% | $52.33 | ||||
| Total Occupied Space | 604,028 | 93.9% | $24,198,660 | 100.0% | $40.06 | ||||
| Vacant Space | 39,192 | 6.1% | |||||||
| Total/Wtd. Avg. | 643,220 | 100.0% | |||||||
| (1) | Credit Ratings are those of the parent company, whether or not the parent company guarantees the lease. |
| (2) | The Annual UW Rent and Annual UW Rent PSF includes rent steps through December 2025 totaling $1,036,969. |
| (3) | Penumbra, Inc. is converting the 1451 Harbor Bay Parkway property into an R&D/advanced manufacturing facility on a lease through December 31, 2036, totaling 86,055 SF. Demolition has started, and Penumbra, Inc. is expected to complete the buildout by July 2025. |
| THE INFORMATION IN THIS STRUCTURAL AND COLLATERAL TERM SHEET IS NOT COMPLETE AND MAY BE AMENDED PRIOR TO THE TIME OF SALE. THIS TERM SHEET IS NOT AN OFFER TO SELL THESE SECURITIES AND IT IS NOT A SOLICITATION OF AN OFFER TO BUY THESE SECURITIES IN ANY JURISDICTION WHERE THE OFFER OR SALE IS NOT PERMITTED. | ||
| 31 | ||
| Various - Various | Loan #1 | Cut-off Date Balance: | $83,000,000 | |
| Various | Radius at Harbor Bay | Cut-off Date LTV: | 67.0% | |
| Alameda, CA 94502 | UW NCF DSCR: | 1.45x | ||
| UW NOI Debt Yield: | 10.7% |
The following table presents certain information relating to the lease rollover schedule at the Radius at Harbor Bay Properties:
| Lease Rollover Schedule(1) | ||||||||
| Year | # of Leases Rolling | SF Rolling | Approx. % of SF Rolling | Approx. Cumulative % of SF Rolling | Total UW Rent Rolling | Approx. % of Total UW Rent Rolling | Approx. Cumulative % of Total UW Rent Rolling | UW Rent PSF Rolling |
| MTM/2025 | 2 | 18,267 | 2.8% | 2.8% | $559,096 | 2.3% | 2.3% | $30.61 |
| 2026 | 2 | 11,363 | 1.8% | 4.6% | $616,283 | 2.5% | 4.9% | $54.24 |
| 2027 | 2 | 13,772 | 2.1% | 6.7% | $742,411 | 3.1% | 7.9% | $53.91 |
| 2028 | 2 | 16,830 | 2.6% | 9.4% | $584,790 | 2.4% | 10.3% | $34.75 |
| 2029 | 2 | 131,044 | 20.4% | 29.7% | $4,860,913 | 20.1% | 30.4% | $37.09 |
| 2030 | 0 | 0 | 0.0% | 29.7% | $0 | 0.0% | 30.4% | $0.00 |
| 2031 | 2 | 25,915 | 4.0% | 33.8% | $1,657,538 | 6.8% | 37.3% | $63.96 |
| 2032 | 2 | 26,310 | 4.1% | 37.9% | $1,594,711 | 6.6% | 43.9% | $60.61 |
| 2033 | 2 | 69,510 | 10.8% | 48.7% | $4,419,853 | 18.3% | 62.1% | $63.59 |
| 2034 | 0 | 0 | 0.0% | 48.7% | $0 | 0.0% | 62.1% | $0.00 |
| 2035 | 0 | 0 | 0.0% | 48.7% | $0 | 0.0% | 62.1% | $0.00 |
| Thereafter | 2 | 291,017 | 45.2% | 93.9% | $9,163,065 | 37.9% | 100.0% | $31.49 |
| Vacant | 0 | 39,192 | 6.1% | 100.0% | $0 | 0.0% | 100.0% | $0.00 |
| Total/Wtd. Avg.(2) | 18 | 643,220 | 100.0% | $24,198,660 | 100.0% | $40.06 | ||
| (1) | Information is based on the underwritten rent roll. |
| (2) | Total/Wtd. Avg. UW Rent PSF Rolling excludes vacant space. |
The Market. The Radius at Harbor Bay Properties are located within Alameda County, California, and are part of the San Francisco-Oakland-Fremont, CA, MSA. The Radius at Harbor Bay Properties are located in the southern section of Alameda in an area known as Bay Farm Island. The Bay Farm Island neighborhood consists of a mix of residential and commercial uses. Commercial uses in the area include hotels, office buildings, R&D developments, industrial developments and a shopping center. Primary access to the Radius at Harbor Bay neighborhood is provided by State Route 61 (Doolittle Drive). The nearest freeway, which is Interstate 880, is approximately one mile from the neighborhood, but is about a four-mile drive from the Radius at Harbor Bay Properties. Oakland International Airport is located approximately 1.3 miles southeast of the Radius at Harbor Bay Properties.
The Radius at Harbor Bay Properties are located in the Alameda office submarket. The Alameda office submarket consists of approximately 4,329,309 square feet of office space with a 5.1% vacancy rate as of the first quarter of 2025.
The following table presents certain information relating to the appraisals’ market rent conclusions for the Radius at Harbor Bay Properties:
| Market Rent Summary | |||||||||||||
| 1321 Harbor Bay Parkway | 1351 Harbor Bay Parkway | 1411 Harbor Bay Parkway | 1451 Harbor Bay Parkway | 1420 Harbor Bay Parkway | 1350 South Loop Road | 1501 Harbor Bay Parkway - Café | 1501 Harbor Bay Parkway - Office/Lab | 1640 South Loop Road | 1600 Harbor Bay Parkway-Lab | 1600 Harbor Bay Parkway-Office | 1650 Harbor Bay Parkway-Lab | 1650 Harbor Bay Parkway-Office | |
| Market Rent (PSF) | $42.00 | $42.00 | $42.00 | $42.00 | $32.40 | $55.20 | $30.00 | $55.20 | $55.20 | $55.20 | $42.00 | $55.20 | $42.00 |
| Lease Term (Years) | 7 | 7 | 7 | 7 | 5 | 7 | 5 | 7 | 7 | 7 | 5 | 7 | 5 |
| Lease Type | NNN | NNN | NNN | NNN | Net | NNN | MG | Net | Net | Net | Base Year Stop | Net | Base Year Stop |
| Rent Increase Projection | 3.0% per annum | 3.0% per annum | 3.0% per annum | 3.0% per annum | 3.0% per annum | 3.0% per annum | 3.0% per annum | 3.0% per annum | 3.0% per annum | 3.0% per annum | 3.0% per annum | 3.0% per annum | 3.0% per annum |
| Tenant Improvements (New) | $25 PSF | $25 PSF | $25 PSF | $25 PSF | $50 PSF | $25 PSF | $10 PSF | $25 PSF | $25 PSF | $25 PSF | $25 PSF | $25 PSF | $25 PSF |
| Leasing Commissions (New) | 6.00% | 6.00% | 6.00% | 6.00% | 6.00% | 6.00% | 6.00% | 6.00% | 6.00% | 6.00% | 6.00% | 6.00% | 6.00% |
| Free Rent (New) | NAP | NAP | NAP | NAP | NAP | NAP | NAP | NAP | NAP | NAP | NAP | NAP | NAP |
| THE INFORMATION IN THIS STRUCTURAL AND COLLATERAL TERM SHEET IS NOT COMPLETE AND MAY BE AMENDED PRIOR TO THE TIME OF SALE. THIS TERM SHEET IS NOT AN OFFER TO SELL THESE SECURITIES AND IT IS NOT A SOLICITATION OF AN OFFER TO BUY THESE SECURITIES IN ANY JURISDICTION WHERE THE OFFER OR SALE IS NOT PERMITTED. | ||
| 32 | ||
| Various - Various | Loan #1 | Cut-off Date Balance: | $83,000,000 | |
| Various | Radius at Harbor Bay | Cut-off Date LTV: | 67.0% | |
| Alameda, CA 94502 | UW NCF DSCR: | 1.45x | ||
| UW NOI Debt Yield: | 10.7% |
Appraisal. The appraisal provided “hypothetical as-stabilized” or “hypothetical as-complete/stabilized” values for all ten of the Radius at Harbor Bay Properties. For eight of the ten properties where “hypothetical as-stabilized” or “hypothetical as- complete/stabilized” values were used, the property conversions from office to life science use has been completed, property occupancy has stabilized and all outstanding TI/LC reserves of $20,860,736 have been reserved for up-front. For the remaining non-stabilized properties that have not been converted, as-is values were used. The aggregate portfolio value on this combined basis was $316,270,000 as of October 21, 2024 and October 23, 2024.
Environmental Matters. According to the Phase I environmental site assessment dated October 16, 2024, there was no evidence of any recognized environmental l conditions at the Radius at Harbor Bay Properties.
Operating History and Underwritten Net Cash Flow. The following table presents certain information relating to the historical operating performance and underwritten net cash flow at the Radius at Harbor Bay Properties:
| Cash Flow Analysis | ||||||
| 2021 | 2022 | 2023 | TTM 9/30/2024 | UW | UW PSF | |
| Base Rent(1) | $6,907,151 | $14,203,703 | $18,060,546 | $21,415,565 | $24,198,660 | $37.62 |
| Grossed Up Vacant Space | $0 | $0 | $0 | $0 | $2,163,398 | $3.36 |
| Gross Potential Rent | $6,907,151 | $14,203,703 | $18,060,546 | $21,415,565 | $26,362,058 | $40.98 |
| Total Recoveries | $1,271,131 | $2,764,535 | $5,146,479 | $5,754,206 | $7,209,534 | $11.21 |
| Free Rent Adjustment | ($66,025) | ($231,018) | ($3,079,675) | ($955,146) | $0 | $0.00 |
| Other Income | $40,054 | $3,294 | $5,676 | $27,968 | $27,968 | $0.04 |
| Parking/Garage/Other | $32,980 | $33,969 | $34,988 | $35,774 | $36,302 | $0.06 |
| Less Vacancy & Credit Loss | $0 | $0 | $0 | $0 | ($2,163,398) | ($3.36) |
| Effective Gross Income | $8,185,291 | $16,774,483 | $20,168,014 | $26,278,366 | $31,472,463 | $48.93 |
| Management Fee | $195,980 | $401,493 | $584,721 | $703,679 | $944,174 | $1.47 |
| Real Estate Taxes | $1,362,226 | $2,367,596 | $2,692,786 | $2,795,238 | $2,957,367 | $4.60 |
| Insurance | $164,552 | $380,590 | $463,153 | $500,199 | $559,844 | $0.87 |
| Other Operating Expenses | $1,942,768 | $3,404,014 | $4,264,999 | $4,249,857 | $4,249,857 | $6.61 |
| Total Expenses | $3,665,526 | $6,553,693 | $8,005,660 | $8,248,974 | $8,711,242 | $13.54 |
| Net Operating Income | $4,519,765 | $10,220,790(2) | $12,162,354(2) | $18,029,392(2) | $22,761,221(2) | $35.39 |
| CapEx | $0 | $0 | $0 | $0 | $128,644 | $0.20 |
| TI/LC | $0 | $0 | $0 | $0 | $643,220 | $1.00 |
| TI/LC Reserve(3) | $0 | $0 | $0 | $0 | ($450,000) | ($0.70) |
| Net Cash Flow | $4,519,765 | $10,220,790 | $12,162,354 | $18,029,392 | $22,439,357 | $34.89 |
| Occupancy % | 81.4% | 90.7% | 89.5% | 93.9%(4) | 91.8%(4) | |
| NOI DSCR(5) | 0.29x | 0.66x | 0.79x | 1.17x | 1.47x | |
| NCF DSCR(5) | 0.29x | 0.66x | 0.79x | 1.17x | 1.45x | |
| NOI Debt Yield(5) | 2.1% | 4.8% | 5.7% | 8.5% | 10.7% | |
| NCF Debt Yield(5) | 2.1% | 4.8% | 5.7% | 8.5% | 10.6% | |
| (1) | UW Base Rent includes rent steps through December 2025 totaling $1,036,969 representing approximately 4.5% of the underwritten base rent (excluding such rent steps). |
| (2) | The increase in NOI from 2022 to UW was primarily due to an increase in occupancy from 90.7% to 93.9% and an increase in average rental rates from $22.08 PSF to $37.62 PSF. Additionally, Penumbra, Inc. is converting the 1451 Harbor Bay Parkway property into an R&D facility. Demolition has started, and Penumbra, Inc. is expected to complete the buildout by July 2025. |
| (3) | Represents a credit for 10% of the upfront TI/LC reserve of $4,500,000. |
| (4) | The underwritten economic vacancy is 8.2%. The Radius at Harbor Bay Properties were 93.9% physically occupied as of October 16, 2024 and November 26, 2024. |
| (5) | The information presented is based on the Radius at Harbor Bay Whole Loan. |
Escrows and Reserves.
Real Estate Taxes – The loan documents require an upfront reserve of $1,000,744 and ongoing monthly real estate tax reserves in an amount equal to 1/12th of the real estate taxes that the lender estimates will be payable during the next 12 months, initially estimated at $250,186 monthly.
Insurance – The loan documents require an ongoing monthly deposit into an insurance reserve equal to 1/12th of the insurance premiums that the lender reasonably estimates will be payable during the next ensuing 12 months; provided that no deposits are required if (i) no event of default is continuing, (ii) the borrower maintains insurance coverage for the Radius at Harbor Bay Properties as part of blanket or umbrella coverage reasonably approved by the lender, and (iii) the borrower provides the lender with evidence of the renewals of the insurance policies and paid receipts for the payment of the insurance premiums no later than 10 business days prior to the expiration dates of the policies.
Replacement Reserve – The loan documents require an ongoing monthly replacement reserve deposit of $10,721 until such time as the amount on deposit in the replacement reserve equals $385,932.
| THE INFORMATION IN THIS STRUCTURAL AND COLLATERAL TERM SHEET IS NOT COMPLETE AND MAY BE AMENDED PRIOR TO THE TIME OF SALE. THIS TERM SHEET IS NOT AN OFFER TO SELL THESE SECURITIES AND IT IS NOT A SOLICITATION OF AN OFFER TO BUY THESE SECURITIES IN ANY JURISDICTION WHERE THE OFFER OR SALE IS NOT PERMITTED. | ||
| 33 | ||
| Various - Various | Loan #1 | Cut-off Date Balance: | $83,000,000 | |
| Various | Radius at Harbor Bay | Cut-off Date LTV: | 67.0% | |
| Alameda, CA 94502 | UW NCF DSCR: | 1.45x | ||
| UW NOI Debt Yield: | 10.7% |
Leasing Reserve – The loan documents require an upfront deposit of $4,500,000 and ongoing leasing reserve deposits, as follows: (i) $53,602 on each monthly payment date until Abbott exercises its extension option in writing or a replacement tenant event (an “Abbott Renewal Event”) has occurred, and (ii) following an Abbott Renewal Event, if leasing reserve funds are less than $1,400,000, $53,602 on each monthly payment date up to a cap of $1,400,000.
Abbott Reserve – Commencing in August 2028, the loan documents require an ongoing monthly replacement reserve deposit of $500,000 on each monthly payment date until the earlier of (i) the occurrence of an Abbott Renewal Event has occurred, or (ii) the combined amounts deposit sum for the leasing reserve and Abbott Reserve equals $12,000,000, provided, however, that such reserve fund will no longer apply from and after the release of the 1420 Harbor Bay Parkway property.
Existing TI/LC Reserve – The loan documents require an upfront deposit of $20,860,736, which represents the leasing commissions and tenant improvements payable by the borrower under existing leases at the Radius at Harbor Bay Properties.
Rent Concessions Reserve – The loan documents require an upfront deposit of $355,039, which represents the future rent credits or abatements under existing leases at the Radius at Harbor Bay Properties.
Lockbox and Cash Management. The Radius at Harbor Bay Whole Loan is structured with a hard lockbox and springing cash management. The borrowers and property manager are required to direct the tenants to pay rent directly into the lockbox account, and to deposit any rents otherwise received in such account within three business days after receipt. So long as no Cash Trap Event Period (as defined below) is continuing, the borrowers will have access to the funds deposited into the lockbox account, and may utilize the lockbox account as an operating account. During the continuance of a Cash Trap Event Period, the borrowers will no longer have any further access to the funds in the lockbox account, and such funds in the lockbox account are required to be swept to a lender-controlled cash management account, and applied and disbursed in accordance with the Radius at Harbor Bay Whole Loan documents, with any excess funds (i) above $125,000 per month, disbursed to the borrowers if the net cash flow debt service coverage ratio ("NCF DSCR") is below 1.20x and greater than or equal to 1.15x, tested quarterly, (ii) to be deposited into an excess cash flow reserve account held by the lender as cash collateral for the Radius at Harbor Bay Whole Loan during the continuance of such Cash Trap Event Period, or (iii) if no Cash Trap Event Period is continuing, disbursed to the borrowers.
A “Cash Trap Event Period” will commence upon the earlier of the following:
| (i) | the occurrence and continuance of an event of default under the loan documents; |
| (ii) | the NCF DSCR is below 1.20x, tested quarterly; |
| (iii) | Abbott or Penumbra, Inc. (or any lease guarantor of either of the foregoing) avails itself of any creditor’s rights laws, provided this clause will no longer apply (a) with respect to Abbott from and after the 1420 Harbor Bay Parkway property is released from the lien or (b) with respect to Penumbra, Inc. from and after the 1411 Harbor Bay Parkway property, 1451 Harbor Bay Parkway property, 1321 Harbor Bay Parkway property, and 1351 Harbor Bay Parkway property are released from the lien; or |
| (iv) | Abbott or Penumbra, Inc. goes 50% or more dark. |
A Cash Trap Event Period will end upon the occurrence of the following:
| ● | with regard to clause (i) above, the cure of such event of default; |
| ● | with regard to clause (ii) above, the NCF DSCR being equal to or greater than 1.20x for two consecutive calendar quarters; |
| ● | with regard to clause (iii)(a)-(b) above, an Abbott Renewal Event has occurred without any negative material change in the economics, scope or duration of such lease (unless approved by the lender in its reasonable discretion) pursuant to an order or confirmed plan of reorganization under the applicable creditors rights law; and |
| ● | with regard to clause (iv) above, Abbott and/or Penumbra, Inc. has re-commenced occupancy of its leased space or a replacement tenant event has occurred. |
Release of Property. The loan documents provide for the partial release of any individual property following the defeasance lockout date, subject to certain conditions, including: (i) partial defeasance of the loan equal to the greatest of (A) 115% of the allocated loan amount for the release property, (B) an amount that results in the post-release debt yield for the remaining properties being not less than the greater of 10.6% or the pre-release debt yield of then-encumbered properties, (C) an amount that results in the post-release debt service coverage ratio for the remaining properties being not less than the greater of 1.40x or the pre-release debt service coverage ratio of then-encumbered properties and (D) an amount that results in the post-release loan-to-value ratio for the remaining properties being not greater than the lesser of 62.7% or the pre-release loan-to-value ratio for then-encumbered properties; (ii) if any of the four constituent properties included in the Empire Parkway Centre condominium regime (i.e. the 1321 Harbor Bay Parkway property, 1351 Harbor Bay Parkway property, 1411 Harbor Bay Parkway property and 1451 Harbor Bay Parkway property) are among the remaining properties post-release, the remaining borrowers will have a voting rights interest in the related owners’ association of no less than 50%; (iii) an opinion of counsel that the partial release satisfies applicable REMIC requirements; and (iv) if determined by lender in good faith that the applicable pooling and servicing agreement requires it, a rating agency confirmation.
Condominium. Each of the 1351 Harbor Bay Parkway property, 1451 Harbor Bay Parkway property, 1321 Harbor Bay Parkway property, and 1411 Harbor Bay Parkway property are units in the eight-unit Empire Parkway Centre condominium regime. The Borrower owns four of the eight units, and have an aggregate 50.00% voting rights interest in the related owners’ association and the resulting power to veto any modification or termination of the condominium regime, among other things. Each unit owner is responsible for its building maintenance and property insurance.
Terrorism Insurance. The loan documents require an “all risk” insurance policy on a replacement cost basis, together with (i) business interruption insurance covering no less than the 18-month period following the occurrence of a casualty event, together with a 6-month extended period of indemnity, (ii) windstorm and/or named storm coverage with a deductible up to 5% of the total insurable value, and (iii) terrorism coverage as defined by TRIPRA. See “Risk Factors—Risks Relating to the Mortgage Loans—Terrorism Insurance May Not Be Available for All Mortgaged Properties” in the Preliminary Prospectus.
| THE INFORMATION IN THIS STRUCTURAL AND COLLATERAL TERM SHEET IS NOT COMPLETE AND MAY BE AMENDED PRIOR TO THE TIME OF SALE. THIS TERM SHEET IS NOT AN OFFER TO SELL THESE SECURITIES AND IT IS NOT A SOLICITATION OF AN OFFER TO BUY THESE SECURITIES IN ANY JURISDICTION WHERE THE OFFER OR SALE IS NOT PERMITTED. | ||
| 34 | ||
| Hospitality – Limited Service | Loan #2 | Cut-off Date Balance: | $76,000,000 | |
| 247 Metropolitan Avenue | POD Williamsburg | Cut-off Date LTV: | 52.8% | |
| Brooklyn, NY 11211 | UW NCF DSCR: | 1.62x | ||
| UW NOI Debt Yield: | 13.7% |

| THE INFORMATION IN THIS STRUCTURAL AND COLLATERAL TERM SHEET IS NOT COMPLETE AND MAY BE AMENDED PRIOR TO THE TIME OF SALE. THIS TERM SHEET IS NOT AN OFFER TO SELL THESE SECURITIES AND IT IS NOT A SOLICITATION OF AN OFFER TO BUY THESE SECURITIES IN ANY JURISDICTION WHERE THE OFFER OR SALE IS NOT PERMITTED. | ||
| 35 | ||
| Hospitality – Limited Service | Loan #2 | Cut-off Date Balance: | $76,000,000 | |
| 247 Metropolitan Avenue | POD Williamsburg | Cut-off Date LTV: | 52.8% | |
| Brooklyn, NY 11211 | UW NCF DSCR: | 1.62x | ||
| UW NOI Debt Yield: | 13.7% |

| THE INFORMATION IN THIS STRUCTURAL AND COLLATERAL TERM SHEET IS NOT COMPLETE AND MAY BE AMENDED PRIOR TO THE TIME OF SALE. THIS TERM SHEET IS NOT AN OFFER TO SELL THESE SECURITIES AND IT IS NOT A SOLICITATION OF AN OFFER TO BUY THESE SECURITIES IN ANY JURISDICTION WHERE THE OFFER OR SALE IS NOT PERMITTED. | ||
| 36 | ||
| Mortgage Loan No. 2 – POD Williamsburg |
| Mortgage Loan Information | Property Information | |||||||
| Mortgage Loan Seller: | JPMCB / CREFI | Single Asset/Portfolio: | Single Asset | |||||
| Credit Assessment (Fitch/Moody’s/KBRA): | NR/NR/NR | Location: | Brooklyn, NY 11211 | |||||
| Original Balance: | $76,000,000 | General Property Type: | Hospitality | |||||
| Cut-off Date Balance: | $76,000,000 | Detailed Property Type: | Limited Service | |||||
| % of Initial Pool Balance: | 9.1% | Title Vesting: | Fee(2) | |||||
| Loan Purpose: | Refinance | Year Built/Renovated: | 2017/NAP | |||||
| Borrower Sponsor: | CBSK Development | Size: | 249 Rooms | |||||
| Guarantors: | Charles Blaichman, Abram Shnay | Cut-off Date Balance Per Room: | $305,221 | |||||
| and Scott Shnay | Maturity Date Balance Per Room: | $305,221 | ||||||
| Mortgage Rate: | 7.7850% | Property Manager: | POD BK Management LLC | |||||
| Note Date: | 12/30/2024 | (borrower-affiliate)(3) | ||||||
| Maturity Date: | 1/1/2030 | |||||||
| Term to Maturity: | 60 months | |||||||
| Amortization Term: | 0 months | Underwriting and Financial Information | ||||||
| IO Period: | 60 months | UW NOI: | $10,406,528 | |||||
| Seasoning: | 0 months | UW NCF: | $9,716,944 | |||||
| Prepayment Provisions: | L(24),YM1(30),O(6) | UW NOI Debt Yield: | 13.7% | |||||
| Lockbox/Cash Mgmt Status: | Hard / Springing | UW NCF Debt Yield: | 12.8% | |||||
| Additional Debt Type: | Mezzanine | UW NOI Debt Yield at Maturity: | 13.7% | |||||
| Additional Debt Balance: | $8,933,796 | UW NCF DSCR: | 1.62x | |||||
| Future Debt Permitted (Type): | No (NAP) | Most Recent NOI: | $10,363,928 (10/31/2024 TTM) | |||||
| 2nd Most Recent NOI: | $9,680,557 (12/31/2023) | |||||||
| Reserves(1) | 3rd Most Recent NOI: | $7,607,648 (12/31/2022) | ||||||
| Type | Initial | Monthly | Cap | Most Recent Occupancy: | 93.9% (10/31/2024) | |||
| RE Taxes: | $21,067 | $21,067 | NAP | 2nd Most Recent Occupancy: | 91.7% (12/31/2023) | |||
| Insurance: | $105,873 | Springing | NAP | 3rd Most Recent Occupancy: | 86.8% (12/31/2022) | |||
| FF&E Reserve: | $60,521 | $57,297 | NAP | Appraised Value (as of): | $144,000,000 (10/3/2024) | |||
| Appraised Value Per Room: | $578,313 | |||||||
| Cut-off Date LTV Ratio: | 52.8% | |||||||
| Maturity Date LTV Ratio: | 52.8% | |||||||
| Sources and Uses | ||||||
| Sources | Proceeds | % of Total | Uses | Proceeds | % of Total | |
| Mortgage Loan Amount: | $76,000,000 | 89.4% | Loan Payoff: | $83,128,322 | 97.8% | |
| Mezzanine Loan(4): | $8,933,796 | 10.5% | Upfront Reserves: | $187,461 | 0.2% | |
| Borrower Sponsor Equity: | $67,130 | 0.1% | Closing Costs: | $1,685,143 | 2.0% | |
| Total Sources: | $85,000,926 | 100.0% | Total Uses: | $85,000,926 | 100.0% | |
| (1) | See “Escrows and Reserves” below. |
| (2) | The POD Williamsburg Mortgage Loan (as defined below) is secured by the overlapping fee interest of the Fee Borrower (as defined below) in the POD Williamsburg Property (as defined below) and the leasehold interest of the Leasehold Borrower (as defined below). The Fee Borrower has leased the POD Williamsburg Property to the Leasehold Borrower under an operating lease. |
| (3) | POD BK Management LLC, as the hotel manager (the "Manager") operates the POD Williamsburg Property pursuant to a hotel management agreement which expires in December 2034 (the "Hotel Management Agreement") between the Leasehold Borrower and the Manager. The Manager’s members are affiliates of Richard Born and Ira Drukier who together own an approximately 11% indirect equity interest in the borrowers. BD Hotels LLC (“BD Hotels”), jointly owned by Richard Born and Ira Drukier, owns the brand “POD Hotel” and licenses the brand to the Manager. |
| (4) | Concurrently with the funding of the POD Williamsburg Mortgage Loan, an existing mezzanine loan in the amount of $8,933,796 (“The POD Williamsburg Mezzanine Loan”; and, together with The POD Williamsburg Mortgage Loan, “The POD Williamsburg Total Debt”), previously funded by a third-party lender, was assigned to POD Brooklyn Mezz Lender LLC, an affiliate of the Manager and the borrowers, as the new mezzanine lender (the “Mezzanine Lender”). The POD Williamsburg Total Debt results in a Cut-off Date LTV Ratio and Maturity Date LTV Ratio of 59.0%, an UW NCF DSR of 1.37x and an UW NOI Debt Yield of 12.3%. See “Mezzanine Loan Summary” below. |
The Mortgage Loan. The second largest mortgage loan (the “POD Williamsburg Mortgage Loan”) is a mortgage loan in the original principal amount of $76,000,000. The POD Williamsburg Mortgage Loan was co-originated by JPMorgan Chase Bank, National Association (“JPMCB”) and Citi Real Estate Funding Inc. (“CREFI”) on December 30, 2024. The POD Williamsburg Mortgage Loan is secured by a first priority fee mortgage encumbering a 249-room, limited service, non-union hospitality property located in Brooklyn, New York (the “POD Williamsburg Property”). JPMCB is selling Note A-1 and Note A-2 with an outstanding principal balance of $30,000,000 and $18,000,000, respectively, as of the Cut-off Date and CREFI is selling Note A-3 and Note A-4 with an outstanding principal balance of $18,000,000 and $10,000,000, respectively, as of the Cut-off Date.
The Borrowers and the Borrower Sponsor. The borrowers for the POD Williamsburg Mortgage Loan are CBWB BKLN FEE LLC, a Delaware limited liability company (the “Fee Borrower”), and POD BK Hotel, LLC, a New York limited liability company (the “Leasehold Borrower”), each having two independent directors. The borrower sponsor for the POD Williamsburg Mortgage Loan is CBSK Development, a New York based developer. The non-recourse carveout guarantors are Charles Blaichman, Abram Shnay and Scott Shnay. The Fee Borrower owns the fee interest in the POD Williamsburg Property and leases it to the Leasehold Borrower under an operating lease pursuant to which the Leasehold Borrower operates the POD Williamsburg Property.
| THE INFORMATION IN THIS STRUCTURAL AND COLLATERAL TERM SHEET IS NOT COMPLETE AND MAY BE AMENDED PRIOR TO THE TIME OF SALE. THIS TERM SHEET IS NOT AN OFFER TO SELL THESE SECURITIES AND IT IS NOT A SOLICITATION OF AN OFFER TO BUY THESE SECURITIES IN ANY JURISDICTION WHERE THE OFFER OR SALE IS NOT PERMITTED. | ||
| 37 | ||
| Hospitality – Limited Service | Loan #2 | Cut-off Date Balance: | $76,000,000 | |
| 247 Metropolitan Avenue | POD Williamsburg | Cut-off Date LTV: | 52.8% | |
| Brooklyn, NY 11211 | UW NCF DSCR: | 1.62x | ||
| UW NOI Debt Yield: | 13.7% |
CBSK Development (“CBSK”) is led by Charles Blaichman, as well as the father-son duo of Abram Shnay and Scott Shnay. Scott Shnay brings 15 years of experience acquiring and developing real estate throughout the New York metropolitan area. Abram Shnay has been in real estate development, management and construction for over 50 years, building and owning a controlling interest in over 1,000 residential rental units and multiple commercial/retail properties throughout New York. Over 35 years, Charles Blaichman has built a track record of partnerships with other developers, hotel operators, managers and investors. CBSK is experienced at developing, building and managing real estate across strategies, including ground-up construction, adaptive re-use and the conversion and expansion of existing structures. CBSK projects include residential and retail condominiums, rental apartment buildings, office buildings and boutique hotels, with a current development pipeline totaling over $500 million and 500,000 square feet.
The Property. The POD Williamsburg Property is a five-story, 249-room, limited service, non-union hospitality property located in Brooklyn, New York. Designed by Garrison Architects, the POD Williamsburg Property was built and opened for business in 2017. The borrower sponsor currently has a cost basis of $114.7 million and has $38.7 million of cash equity remaining post origination. Of the 249 guestrooms available at the POD Williamsburg Property, 189 are designated as queen pods and the remaining 60 rooms are designated as bunk pods. Guestrooms are located on the second floor through the fifth floor and are accessible through two passenger elevators. Room accommodations come standard with oversized windows, a work desk, flat screen televisions and free high-speed internet. Additionally, rooms are designed to be minimalist in nature, with most pods averaging approximately 110 square feet in size, and the 13 ADA compliant pods ranging up to 207 square feet.
In 1986, Richard Born partnered with Ira Drukier to form BD Hotels, a real estate development and hotel operation company. In 2007, BD Hotels opened the first POD hotel in New York City. Since then, BD Hotels has opened three more POD hotels, including the POD Williamsburg Property, throughout New York City, totaling approximately 1,700 rooms. As such, the POD Williamsburg Property offers a unique value proposition for prospective travelers, providing an affordable and convenient option for those who prefer convenience over luxury. The POD Williamsburg Property averaged approximately 89.7% occupancy between 2019 and the trailing-12-months ended October 2024. Furthermore, the POD Williamsburg Property’s net cash flow margin has averaged approximately 51.9% over the same time period. While maintaining strong margins and occupancy, the POD Williamsburg Property has also increased ADR and RevPAR, increasing approximately 33.9% and 45.2%, respectively, from 2019 as compared to the trailing-12-months ended October 2024. The POD Williamsburg Property currently benefits from the City of New York’s Industrial and Commercial Abatement Program (“ICAP”) tax abatement, which provides for a 100% abatement of real estate taxes through 2034, with taxes then phased in over a 10-year period through 2043. The POD Williamsburg Property is subject to a condominium structure comprised of five units, of which four are part of the POD Williamsburg Property. The Fee Borrower owns all units which are a part of the POD Williamsburg Property and controls the condominium board.
Amenities at the POD Williamsburg Property include two onsite food and beverage outlets consisting of a ground floor restaurant and rooftop bar. The ground floor restaurant is open for all three meals daily, with 113 indoor seats and 90 seats available in an outdoor courtyard, as well as 40 seats available at an outdoor sidewalk café. The rooftop bar consists of 1,725 square feet of space and has seating capacity for 115 people. Separate from the rooftop bar is a rooftop event space, which is capable of hosting private events and hosts seasonal fitness classes. The onsite food and beverage outlets are master leased to a borrower affiliate and are operated by a third party. Further, located right above the lobby of the POD Williamsburg Property is an open-concept lounge, where guests can work, connect with other guests or just relax. The POD Williamsburg Property also includes a 24/7 subterranean parking garage equipped with 84 parking spaces which is operated by a third-party. There are also three separate street-facing, ground-floor retail outlets leased to CAVA, Just Salad and Cozy Nails & Beauty as part of the collateral for the POD Williamsburg Property. CAVA is a rapidly growing Mediterranean based restaurant, focused on healthy customizable salads, pitas and grain bowls. Just Salad is a fast-casual concept restaurant serving plant-centric meals made with homemade dressings, batch-cooked proteins, from-scratch recipes and daily-prepped produce. Cozy Nails & Beauty specializes in beauty services including waxing, brow dye, lash dye, manicures and pedicures, and has been serving the Williamsburg community for 25 years. The retail component of the POD Williamsburg Property accounts for approximately 4.9% of underwritten gross revenues.
The following table presents certain information relating to the Occupancy, ADR and RevPAR of the POD Williamsburg Property and its competitive set:
| Historical Occupancy, ADR, RevPAR | |||||||||
| Competitive Set(1) | POD Williamsburg(2)(3) | Penetration Factor | |||||||
| Year | Occupancy | ADR | RevPAR | Occupancy | ADR | RevPAR | Occupancy | ADR | RevPAR |
| 2020 | 55.3% | $145.35 | $80.35 | 85.9% | $121.35 | $104.29 | 155.5% | 83.5% | 129.8% |
| 2021 | 69.5% | $182.98 | $127.10 | 93.0% | $133.63 | $124.29 | 133.9% | 73.0% | 97.8% |
| 2022 | 73.8% | $239.50 | $176.64 | 86.8% | $161.74 | $140.35 | 117.7% | 67.5% | 79.5% |
| 2023 | 76.9% | $248.20 | $190.95 | 91.7% | $180.91 | $165.96 | 119.2% | 72.9% | 86.9% |
| TTM August 2024(4) | 81.5% | $243.50 | $198.53 | 90.3% | $185.91 | $167.94 | 110.8% | 76.3% | 84.6% |
Source: Industry Report.
| (1) | The 2020, 2021, 2022, 2023 and TTM August 2024 competitive sets include Aloft New York Brooklyn, Holiday Inn Brooklyn Downtown, Arlo Williamsburg, The Tillary Hotel Brooklyn, Hotel Indigo Williamsburg – Brooklyn, La Quinta Inns & Suites Brooklyn Central, The Box House Hotel, MOXY Brooklyn Williamsburg, The Penny Williamsburg and 42 Hotel. |
| (2) | Occupancy, ADR and RevPAR figures for the POD Williamsburg Property are based on historical operating statements provided by the borrower sponsor. |
| (3) | Variances between the underwriting, the appraisal and the industry report with respect to occupancy, ADR and RevPAR for the POD Williamsburg Property are attributable in part to variances in reporting methodologies and timing differences. |
| (4) | TTM August 2024 Occupancy, ADR and RevPAR figures for the POD Williamsburg Property are based on an Industry Report. |
The Market. The POD Williamsburg Property is located in Brooklyn, New York, and is specifically situated within the South Williamsburg neighborhood. According to a third-party market research report, the POD Williamsburg Property is located within the East River-Queens/Brooklyn West submarket (the “Brooklyn West Submarket”). Accounting for approximately 7% of New York City’s room inventory, the Brooklyn West Submarket typically achieves the highest RevPAR outside of the six submarkets within Manhattan. Roughly 30% of rooms within the submarket are associated with city contracts to house refugees, migrants and the homeless population. Reportedly, all hotels planning to reopen to tourists after sheltering migrants will have to undertake expensive renovations, and the cost of repairs has led some operators to consider permanently shutting down after the contracts with the city expire. From January 2024 to September 2024, RevPAR for the Brooklyn West Submarket increased by approximately 13.6%. Growth was fueled by an ADR acceleration of 9.8% despite demand softening. RevPAR growth is expected to be around 14.3% as of 2024, implying continued strong growth. The Brooklyn hospitality industry has experienced a strong post-pandemic recovery, due in part to strong leisure demand, an increase in meeting and group business, and the gradual return of commercial demand. Further, tourism-related tax revenues have already surpassed previous levels, generating an estimated $4.9 billion in 2024, up 16% from 2020. Future events, such as the 2026 FIFA World Cup Final and the city’s celebration of its 400th anniversary in 2025 are also anticipated to drive future tourism. Amid the limited space and availability of lodging, demand for hotel rooms has increased, subsequently
| THE INFORMATION IN THIS STRUCTURAL AND COLLATERAL TERM SHEET IS NOT COMPLETE AND MAY BE AMENDED PRIOR TO THE TIME OF SALE. THIS TERM SHEET IS NOT AN OFFER TO SELL THESE SECURITIES AND IT IS NOT A SOLICITATION OF AN OFFER TO BUY THESE SECURITIES IN ANY JURISDICTION WHERE THE OFFER OR SALE IS NOT PERMITTED. | ||
| 38 | ||
| Hospitality – Limited Service | Loan #2 | Cut-off Date Balance: | $76,000,000 | |
| 247 Metropolitan Avenue | POD Williamsburg | Cut-off Date LTV: | 52.8% | |
| Brooklyn, NY 11211 | UW NCF DSCR: | 1.62x | ||
| UW NOI Debt Yield: | 13.7% |
elevating ADR in 2023 to be above pre-pandemic levels for hotels located within the city. As room rates have risen, gross profitability also rose, growing 47.1% from 2022 to 2023, and ranking the highest among the top 25 U.S. hotel markets.
South Williamsburg is characterized by bars, music venues and eateries, as well as several vintage stores and kosher bakeries. Notable iconic landmarks and nearby activities include the Smorgasburg, considered the country’s biggest weekly, open-air food market, the Barclays Center, an indoor arena which serves as the home court for the Brooklyn Nets, Bedford Avenue, full of vintage clothing shops, boutique shops and fine dining, Domino Park, an urban park for walking, running, biking and sightseeing and the Music Hall of Williamsburg and Brooklyn Bowl, which both offer live music throughout the year. Moreover, to complement the wide suite of activities available, the POD Williamsburg Property offers complimentary POD bicycles for guests to use and borrow. Due to the POD Williamsburg Property’s close proximity to the nearby L train, convenient access into Manhattan is available for guests, with the L train providing transportation into lower Manhattan as well as a connection to Union Square, where most other major subway lines can be accessed.
According to a third-party market research report, the estimated 2024 population within a one-, three-, and five-mile radius of the POD Williamsburg Property was 154,356, 1,348,622, and 3,076,994, respectively. According to the same third-party market research report, the 2024 average household income within the same radii was $124,996, $130,915 and $125,723, respectively.
According to the appraisal, there are no proposed hotels anticipated to enter the immediate area in the near future that would be considered competitive with the POD Williamsburg Property, despite an anticipated moderate new supply pipeline for the overall surrounding area over the next several years. The appraisal noted that the majority of this new supply pipeline is speculative and/or consists of properties that are not anticipated to directly compete with the POD Williamsburg Property. In addition, according to a third party market research report, the Citywide Hotels Text Amendment, adopted by the City Council of New York City on December 9, 2021, places a special permit requirement on all new hotels built in New York City boroughs, which may curb interest for new development projects. Coupled with Local Law 18, which regulates short-term rental properties, such as Airbnbs, the current regulatory environment results in a combination of curtailed short-term rentals as well as fewer new rooms coming online.
The following table presents the primary competitive properties to the POD Williamsburg Property:
| Competitive Property Summary | ||||||||
| Property | Year Built | Rooms | Commercial | Group | Leisure | 2023 Occupancy(1)(2) | 2023 ADR(1)(2) | 2023 RevPAR(1)(2) |
| POD Williamsburg(2) | 2017 | 249 | 10% | 5% | 85% | 91.7% | $180.91 | $165.96 |
| Hotel Indigo Williamsburg – Brooklyn | 2019 | 187 | 20% | 25% | 55% | 70% - 75% | $275 - $285 | $200 - $210 |
| Moxy Brooklyn Williamsburg | 2023 | 216 | 15% | 10% | 75% | 80% - 85% | $285 - $295 | $230 - $240 |
| The Penny Williamsburg | 2022 | 118 | 15% | 10% | 75% | 75% - 80% | $270 - $280 | $200 - $210 |
| Wythe Hotel | 2012 | 69 | 15% | 15% | 70% | 80% - 85% | $310 - $330 | $260 - $270 |
| Arlo Williamsburg | 2016 | 147 | 20% | 15% | 65% | 75% - 80% | $355 - $375 | $285 - $295 |
| The William Vale | 2016 | 183 | 20% | 15% | 65% | 80% - 85% | $425 - $445 | $355 - $365 |
| Hoxton Williamsburg | 2018 | 175 | 20% | 10% | 70% | 80% - 85% | $310 - $330 | $255 - $265 |
| Total/Average | 1,344 | 81% | $299.60 | $241.31 | ||||
Source: Appraisal.
| (1) | Variances between the underwriting, the appraisal and the industry report with respect to occupancy, ADR and RevPAR of the POD Williamsburg Property are attributable in part to variances in reporting methodologies and timing differences. |
| (2) | 2023 Occupancy, 2023 ADR and 2023 RevPAR figures for the POD Williamsburg Property represent the annual period ending December 2023 based on historical operating statements provided by the borrower sponsor. |
Appraisal. The appraisal concluded to an “as is” value for the POD Williamsburg Property of $144,000,000 as of October 3, 2024.
Environmental Matters. According to the Phase I environmental site assessment dated October 9, 2024 (the “ESA”), there was no evidence of any recognized environmental conditions at the POD Williamsburg Property. However, the ESA did identify a controlled recognized environmental condition in connection with the POD Williamsburg Property’s prior use for various commercial and manufacturing use. Notwithstanding such prior uses, a notice of satisfaction was issued by the NYC OER in July 2017. See “Description of the Mortgage Pool—Environmental Considerations” in the Preliminary Prospectus for additional information.
| THE INFORMATION IN THIS STRUCTURAL AND COLLATERAL TERM SHEET IS NOT COMPLETE AND MAY BE AMENDED PRIOR TO THE TIME OF SALE. THIS TERM SHEET IS NOT AN OFFER TO SELL THESE SECURITIES AND IT IS NOT A SOLICITATION OF AN OFFER TO BUY THESE SECURITIES IN ANY JURISDICTION WHERE THE OFFER OR SALE IS NOT PERMITTED. | ||
| 39 | ||
| Hospitality – Limited Service | Loan #2 | Cut-off Date Balance: | $76,000,000 | |
| 247 Metropolitan Avenue | POD Williamsburg | Cut-off Date LTV: | 52.8% | |
| Brooklyn, NY 11211 | UW NCF DSCR: | 1.62x | ||
| UW NOI Debt Yield: | 13.7% |
Operating History and Underwritten Net Cash Flow. The following table presents certain information relating to the historical operating performance and the underwritten net cash flow at the POD Williamsburg Property:
| Cash Flow Analysis(1)(2) | ||||||||
| 2019 | 2020(3) | 2021(3) | 2022 | 2023 | TTM (10/31/2024) | UW | UW per Room | |
| Occupancy | 86.6% | 85.9% | 93.0% | 86.8% | 91.7% | 93.9% | 90.5% | |
| ADR | $139.15 | $121.35 | $133.63 | $161.74 | $180.91 | $186.30 | $186.30 | |
| RevPAR | $120.53 | $104.29 | $124.29 | $140.35 | $165.96 | $174.97 | $168.67 | |
| Room Revenue | $10,531,963 | $9,305,097 | $10,859,979 | $12,384,215 | $14,282,361 | $15,329,378 | $15,329,378 | $61,564 |
| Food & Beverage(4) | $244,200 | $41,200 | $82,400 | $247,200 | $247,200 | $247,200 | $247,200 | $993 |
| Retail | $175,040 | $287,820 | $341,888 | $430,171 | $848,337 | $883,874 | $885,033 | $3,554 |
| Other Departmental Income | $788,594 | $163,316 | $307,329 | $1,361,666 | $1,654,596 | $1,694,757 | $1,694,757 | $6,806 |
| Total Revenue | $11,739,797 | $9,797,432 | $11,591,597 | $14,423,252 | $17,032,494 | $18,155,208 | $18,156,367 | $72,917 |
| Room Expense | $3,267,994 | $1,307,019 | $1,614,530 | $3,124,802 | $3,540,252 | $3,513,486 | $3,513,486 | $14,110 |
| Undistributed Expenses | $2,075,357 | $1,860,662 | $2,062,894 | $2,673,814 | $2,615,097 | $2,921,547 | $2,921,636 | $11,733 |
| Management Fee | $352,194 | $293,923 | $347,748 | $432,698 | $510,975 | $544,656 | $544,691 | $2,188 |
| Real Estate Taxes(5) | $199,767 | $192,724 | $245,058 | $249,267 | $247,846 | $244,451 | $245,441 | $986 |
| Insurance | $141,584 | $226,026 | $230,928 | $249,133 | $351,877 | $466,047 | $423,492 | $1,701 |
| Other Expenses | $90,340 | $90,340 | $90,340 | $85,891 | $85,891 | $101,094 | $101,094 | $406 |
| Total Expenses | $6,127,235 | $3,970,695 | $4,591,499 | $6,815,604 | $7,351,937 | $7,791,281 | $7,749,840 | $31,124 |
| Net Operating Income | $5,612,562 | $5,826,737 | $7,000,098 | $7,607,648 | $9,680,557 | $10,363,928 | $10,406,528 | $41,793 |
| FF&E | $443,561 | $370,500 | $436,912 | $542,837 | $644,431 | $718,792 | $689,583 | $2,769 |
| Net Cash Flow | $5,169,001 | $5,456,237 | $6,563,186 | $7,064,811 | $9,036,126 | $9,645,135 | $9,716,944 | $39,024 |
| NOI DSCR | 0.94x | 0.97x | 1.17x | 1.27x | 1.61x | 1.73x | 1.73x | |
| NCF DSCR | 0.86x | 0.91x | 1.09x | 1.18x | 1.51x | 1.61x | 1.62x | |
| NOI Debt Yield | 7.4% | 7.7% | 9.2% | 10.0% | 12.7% | 13.6% | 13.7% | |
| NCF Debt Yield | 6.8% | 7.2% | 8.6% | 9.3% | 11.9% | 12.7% | 12.8% | |
| (1) | Variances between the underwriting, the appraisal and the industry report with respect to occupancy, ADR and RevPAR are attributable in part to variances in reporting methodologies and timing differences. |
| (2) | Certain items such as interest expense, interest income, depreciation, amortization, debt service payments and any other non-recurring items were excluded from the historical presentation and are not considered for the underwritten cash flow. |
| (3) | During the initial phases of the COVID-19 pandemic, the POD Williamsburg Property was leased to the City of New York from April 2020 through August 2021. |
| (4) | UW Food & Beverage revenue is based on an in-place food and beverage master lease with an affiliate of the borrower sponsor. The food and beverage venues are operated via a third party, the revenues of which are not reflected above. |
| (5) | UW Real Estate Taxes are based on the abated taxes for 2024, inclusive of abatements associated with the ICAP. According to the appraisal, projected unabated taxes for 2025 are $1,331,250. |
Escrows and Reserves.
Real Estate Taxes – On the loan origination date, the borrowers were required to make an upfront deposit of $21,067 into a reserve for real estate taxes. In addition, the borrowers are required to deposit into a real estate tax reserve, on a monthly basis, an amount equal to 1/12th of the real estate taxes that the mortgage lender estimates will be payable during the next ensuing twelve months (initially estimated to be $21,067.03).
Insurance – On the loan origination date, the borrowers were required to make an upfront deposit of $105,873 into a reserve for the installment payment plan for the blanket insurance policy (the “Static Insurance Escrow Fund”). The borrowers are required to deposit into an insurance reserve, on a monthly basis, an amount equal to 1/12th of the insurance premiums that the mortgage lender estimates will be payable for the renewal of the insurance coverage; provided, however, that such monthly reserves for insurance premiums have been conditionally suspended so long as (i) no event of default has occurred and is continuing and (ii) the insurance coverage for The POD Williamsburg Property is included in a blanket policy approved by the lender in its reasonable discretion. The lender will apply the funds in the Static Insurance Escrow Fund towards payment of an installment under the blanket insurance policy if it has not been paid by the borrowers prior to delinquency. If at any time either (i) funds from the Static Insurance Escrow Fund have been disbursed, or (ii) the premium for the blanket insurance policy has been increased such that the amount in the Static Insurance Escrow Fund no longer represents 25% of the annual premium for such blanket insurance policy, the borrowers are required to deposit additional funds in the Static Insurance Escrow Fund so that it always contains sufficient funds to cover 25% of the annual premium for the blanket insurance policy. Notwithstanding the foregoing, the lender will waive the requirement for the borrowers to make deposits to the Static Insurance Escrow Fund so long as (a) no event of default has occurred and is continuing, and (b) the borrowers have provided satisfactory evidence that the POD Williamsburg Property is no longer insured under a blanket insurance policy subject to an installment plan.
FF&E – On the loan origination date, the borrowers were required to make an upfront deposit of $60,521 into a reserve for replacements, improvements and repairs to FF&E required to be made during the calendar year. In addition, the borrowers are required to deposit into an FF&E reserve on a monthly basis, $57,297.26.
| THE INFORMATION IN THIS STRUCTURAL AND COLLATERAL TERM SHEET IS NOT COMPLETE AND MAY BE AMENDED PRIOR TO THE TIME OF SALE. THIS TERM SHEET IS NOT AN OFFER TO SELL THESE SECURITIES AND IT IS NOT A SOLICITATION OF AN OFFER TO BUY THESE SECURITIES IN ANY JURISDICTION WHERE THE OFFER OR SALE IS NOT PERMITTED. | ||
| 40 | ||
| Hospitality – Limited Service | Loan #2 | Cut-off Date Balance: | $76,000,000 | |
| 247 Metropolitan Avenue | POD Williamsburg | Cut-off Date LTV: | 52.8% | |
| Brooklyn, NY 11211 | UW NCF DSCR: | 1.62x | ||
| UW NOI Debt Yield: | 13.7% |
Lockbox and Cash Management. The POD Williamsburg Mortgage Loan is structured with a hard lockbox and springing cash management. The borrowers and manager are required to direct the tenants to pay rents and credit card companies or credit card clearing banks with which the borrowers or managers has entered into merchant's agreements to deliver all receipts payable directly into the lockbox account, and to deposit any rents otherwise received in such account within one business day after receipt. If no Cash Sweep Event (as defined below) is continuing, all funds in the lockbox account will be swept each business day to the borrowers’ operating account. During the continuance of a Cash Sweep Event, all funds in the lockbox account are required to be swept each business day to a lender-controlled cash management account. Funds in the cash management account are required to be applied to debt service and the reserves and escrows described above, with any excess funds (i) to be deposited into an excess cash flow reserve account held by the lender as cash collateral for the POD Williamsburg Mortgage Loan, or (ii) if no Cash Sweep Event is continuing, disbursed to the borrowers.
A “Cash Sweep Event” means the period commencing upon the occurrence of (i) an event of default, (ii) a bankruptcy action of the borrowers or manager, or (iii) the debt service coverage ratio based on the trailing 12-month period being less than 1.35x.
A Cash Sweep Event will end (a) with respect to clause (i) above, if the cure of the event of default has been accepted by the lender, (b) with respect to clause (ii) above, if the manager is replaced within 60 days with a qualified manager under a replacement management agreement, or (c) with respect to clause (iii) above, if the debt service coverage ratio is greater than or equal to 1.35x for three consecutive months based upon the trailing 12-month period immediately preceding the date of determination or during any period during which the Collateral Cure Conditions (as defined below) are satisfied; provided, however, that (A) no event of default is continuing, (B) the borrowers have paid all of the lender’s reasonable expenses incurred in connection with the cure of the Cash Sweep Event, including reasonable attorney’s fees and expenses, and (C) with respect to clause (i) and clause (ii) above, the borrowers may not cure a Cash Sweep Event more than a total of four times in the aggregate during the term of POD Williamsburg Mortgage Loan.
“Collateral Cure Conditions” will be deemed to exist if the borrowers deposit cash into an escrow reserve account or deliver a letter of credit, which, in either case, serves as additional collateral for the POD Williamsburg Mortgage Loan, in an amount of $2,099,571.25 (the “Collateral Deposit Amount”). On the first monthly payment date in each and every calendar year thereafter that the borrowers elect to deposit the Collateral Deposit Amount in lieu of a Cash Sweep Event, in order for the Collateral Cure Conditions to be deemed to have been satisfied, the borrowers will make an additional deposit of the Collateral Deposit Amount. The lender acknowledges that the collateral referenced in this definition will be returned to the borrowers, provided that no event of default is ongoing, at such time as the debt service coverage ratio based on the trailing twelve month period immediately preceding the date of determination is less than 1.35x would have been cured had the borrowers not satisfied the Collateral Cure Conditions (i.e. at such time as the debt service coverage ratio (without taking into account the cash deposit and/or letter of credit) will equal or be greater than 1.35x for three consecutive months).
Property Management. The POD Williamsburg Property is managed by the Manager, POD BK Management LLC pursuant to the Hotel Management Agreement, which expires in December 2034. The Manager’s members are affiliates of Richard Born and Ira Drukier who together own an approximately 11% indirect equity interest in the borrowers. BD Hotels LLC, jointly owned by Richard Born and Ira Drukier, owns the brand “POD Hotel” and licenses the brand to the Manager.
Mezzanine Loan and Preferred Equity. Concurrently with the funding of the POD Williamsburg Mortgage Loan, an existing mezzanine loan in the amount of $8,933,796.30 (the “POD Williamsburg Mezzanine Loan”), secured by (i) the mezzanine borrower’s (a) 100% interest in the Fee Borrower, (b) 99.5% interest in the Leasehold Borrower, and (c) 100% interest in Pod BK SPE LLC, a Delaware limited liability company (“Pod BK SPE”) and (ii) Pod BK SPE’s 0.5% interest in the Leasehold Borrower, and previously funded by a third-party lender, was assigned to an affiliate of the Manager and the borrowers as the new mezzanine lender (the “Mezzanine Lender”). The POD Williamsburg Mezzanine Loan is coterminous with the POD Williamsburg Mortgage Loan. Under a subordination and standstill agreement executed by the borrowers, the Mezzanine Lender, and the lender of the POD Williamsburg Mortgage Loan (the “Subordination Agreement”), the payments to the Mezzanine Lender are fully subordinated to the POD Williamsburg Mortgage Loan and may only be made (a) out of the borrowers’ available cash flow after payments due under the POD Williamsburg Mortgage Loan documents and other related expenses and (b) if no monetary or material non-monetary event of default or cash sweep event is continuing under the POD Williamsburg Mortgage Loan documents; provided, however, to the extent no monetary or material non-monetary default or cash sweep event is continuing under the POD Williamsburg Mortgage Loan documents and a capital contribution to the mezzanine borrower is made, the mezzanine borrower will have the option to make payments in reduction of the POD Williamsburg Mezzanine Loan without making any pro rata payments in reduction of the POD Williamsburg Mortgage Loan. Additionally under the Subordination Agreement, the Mezzanine Lender may not, without the prior written consent of the lender of the POD Williamsburg Mortgage Loan, (i) take any enforcement action with respect to the collateral securing the POD Williamsburg Mezzanine Loan or (ii) assign its rights or obligations under the Subordination Agreement or the POD Williamsburg Mezzanine Loan documents. The Subordination Agreement may terminate only upon the (i) full payment of the POD Williamsburg Mortgage Loan, (ii) termination of all obligations under the POD Williamsburg Mortgage Loan, and (iii) written agreement by the lender under the POD Williamsburg Mortgage Loan that each of clauses (i) and (ii) have occurred. The POD Williamsburg Mezzanine Loan accrues interest at a rate of 12.0000% per annum to be paid as part of each monthly debt service payment amount and is interest-only until its maturity date. See “Description of the Mortgage Pool—Additional Indebtedness—Mezzanine Indebtedness” in the Preliminary Prospectus.
| Mezzanine Loan Summary | |||||||||
| Mezzanine Original Principal Balance | Mezzanine Interest Rate | Mezzanine Loan Term | Mezzanine Amortization Term | Mezzanine IO Period | Total Debt UW DSCR based on NOI/NCF | Total Debt UW Debt Yield based on NOI/NCF | Total Debt Cut-off Date LTV Ratio(1) | Total Debt Maturity Date LTV Ratio(1) | |
| POD Williamsburg Mezzanine Loan | $8,933,796.30 | 12.00% | 61 | 0 | 61 | 1.47x / 1.37x | 12.3% / 11.4% | 59.0% | \59.0% |
| (1) | Based on the as-is appraised value of $144,000,000. |
Condominium: The POD Williamsburg Property is subject to a condominium structure comprised of five units, of which four are part of the POD Williamsburg Property. The Fee Borrower owns all units which are a part of the POD Williamsburg Property and controls the condominium board.
Real Estate Substitution. Not permitted.
Future Subordinate or Mezzanine Indebtedness. Not permitted.
Letter of Credit. None.
| THE INFORMATION IN THIS STRUCTURAL AND COLLATERAL TERM SHEET IS NOT COMPLETE AND MAY BE AMENDED PRIOR TO THE TIME OF SALE. THIS TERM SHEET IS NOT AN OFFER TO SELL THESE SECURITIES AND IT IS NOT A SOLICITATION OF AN OFFER TO BUY THESE SECURITIES IN ANY JURISDICTION WHERE THE OFFER OR SALE IS NOT PERMITTED. | ||
| 41 | ||
| Hospitality – Limited Service | Loan #2 | Cut-off Date Balance: | $76,000,000 | |
| 247 Metropolitan Avenue | POD Williamsburg | Cut-off Date LTV: | 52.8% | |
| Brooklyn, NY 11211 | UW NCF DSCR: | 1.62x | ||
| UW NOI Debt Yield: | 13.7% |
Right of First Offer/Right of First Refusal. None.
Ground Lease. None. However, note that the POD Williamsburg Mortgage Loan is secured by the overlapping fee interest of the Fee Borrower in the POD Williamsburg Property and the leasehold interest of the Leasehold Borrower under the operating lease between the Fee Borrower and the Leasehold Borrower.
Terrorism Insurance. The borrowers are required to obtain and maintain property insurance for 100% of full replacement cost and business interruption insurance for 18 months plus a 12-month extended period of indemnity. Such insurance is required to cover perils of terrorism and acts of terrorism. See “Risk Factors—Risks Relating to the Mortgage Loans— Terrorism Insurance May Not Be Available for All Mortgaged Properties” in the Preliminary Prospectus.
| THE INFORMATION IN THIS STRUCTURAL AND COLLATERAL TERM SHEET IS NOT COMPLETE AND MAY BE AMENDED PRIOR TO THE TIME OF SALE. THIS TERM SHEET IS NOT AN OFFER TO SELL THESE SECURITIES AND IT IS NOT A SOLICITATION OF AN OFFER TO BUY THESE SECURITIES IN ANY JURISDICTION WHERE THE OFFER OR SALE IS NOT PERMITTED. | ||
| 42 | ||
| Office – CBD | Loan #3 | Cut-off Date Balance: | $75,000,000 | |
| Various | Wilshire Office Portfolio | Cut-off Date LTV: | 51.9% | |
| Various, CA Various | UW NCF DSCR: | 1.73x | ||
| UW NOI Debt Yield: | 13.2% |

| THE INFORMATION IN THIS STRUCTURAL AND COLLATERAL TERM SHEET IS NOT COMPLETE AND MAY BE AMENDED PRIOR TO THE TIME OF SALE. THIS TERM SHEET IS NOT AN OFFER TO SELL THESE SECURITIES AND IT IS NOT A SOLICITATION OF AN OFFER TO BUY THESE SECURITIES IN ANY JURISDICTION WHERE THE OFFER OR SALE IS NOT PERMITTED. | ||
| 43 | ||
| Office – CBD | Loan #3 | Cut-off Date Balance: | $75,000,000 | |
| Various | Wilshire Office Portfolio | Cut-off Date LTV: | 51.9% | |
| Various, CA Various | UW NCF DSCR: | 1.73x | ||
| UW NOI Debt Yield: | 13.2% |
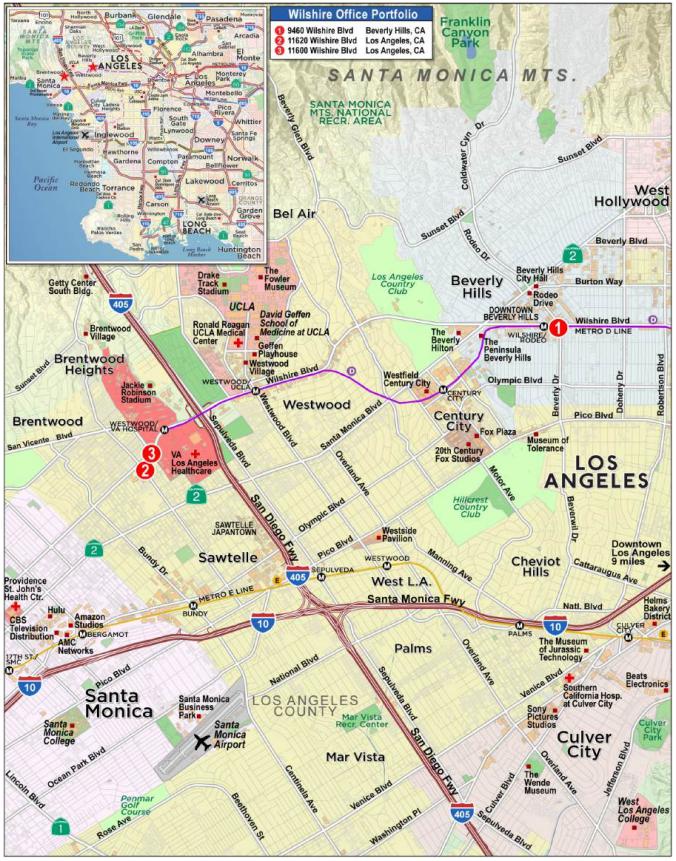
| THE INFORMATION IN THIS STRUCTURAL AND COLLATERAL TERM SHEET IS NOT COMPLETE AND MAY BE AMENDED PRIOR TO THE TIME OF SALE. THIS TERM SHEET IS NOT AN OFFER TO SELL THESE SECURITIES AND IT IS NOT A SOLICITATION OF AN OFFER TO BUY THESE SECURITIES IN ANY JURISDICTION WHERE THE OFFER OR SALE IS NOT PERMITTED. | ||
| 44 | ||
| Mortgage Loan No. 3 – Wilshire Office Portfolio |
| Mortgage Loan Information | Property Information | |||||
| Mortgage Loan Seller: | WFB/JPMCB | Single Asset/Portfolio: | Portfolio | |||
| Credit Assessment (Moody’s/Fitch/KBRA): | NR/NR/NR | Location: | Various, CA Various | |||
| Original Balance(1): | $75,000,000 | General Property Type: | Office | |||
| Cut-off Date Balance(1): | $75,000,000 | Detailed Property Type: | CBD | |||
| % of Initial Pool Balance: | 9.0% | Title Vesting: | Fee | |||
| Loan Purpose: | Refinance | Year Built/Renovated: | Various/Various | |||
| Borrower Sponsors: | Creative Media & Community Trust Corporation and CIM Group Investments, LLC | Size: Cut-off Date Balance per SF: | 351,464 SF $299 | |||
| Guarantors: | Creative Media & Community Trust Corporation and CIM Group Investments, LLC | Maturity Balance per SF: Property Manager: | $299 CIM Management, Inc. (borrower-sponsors related) | |||
| Mortgage Rate: | 7.4130% | |||||
| Note Date: | 12/27/2024 | |||||
| Maturity Date: | 1/11/2030 | |||||
| Original Term to Maturity: | 60 months | |||||
| Original Amortization Term: | 0 months | Underwriting and Financial Information(1) | ||||
| IO Period: | 60 months | UW NOI(4): | $13,813,785 | |||
| Seasoning: | 0 months | UW NCF: | $13,648,594 | |||
| Prepayment Provisions: | L(24),DorYM1(29),O(7) | UW NOI Debt Yield: | 13.2% | |||
| Lockbox/Cash Mgmt Status: | Soft/Springing | UW NCF Debt Yield: | 13.0% | |||
| Additional Debt Type(1): | Pari Passu | UW NOI Debt Yield at Maturity: | 13.2% | |||
| Additional Debt Balance(1): | $30,000,000 | UW NCF DSCR: | 1.73x | |||
| Future Debt Permitted (Type): | No (NAP) | Most Recent NOI(4): | $12,382,146 (8/31/2024 TTM) | |||
| 2nd Most Recent NOI(4): | $11,335,735 (12/31/2023) | |||||
| Reserves(3) | 3rd Most Recent NOI(4): | $10,151,699 (12/31/2022) | ||||
| Type | Initial | Monthly | Cap | Most Recent Occupancy: | 82.3% (12/2/2024) | |
| RE Taxes: | $1,126,644 | $281,661 | NAP | 2nd Most Recent Occupancy: | 84.2% (12/31/2023) | |
| Insurance: | $0 | Springing | NAP | 3rd Most Recent Occupancy: | 71.8% (12/31/2022) | |
| Replacement Reserve: | $0 | $13,766 | $495,573 | Appraised Value (as of)(5): | $202,400,000 (Various) | |
| TI/LC Reserve: | $9,000,000 | $73,222 | NAP | Appraised Value per SF(5): | $576 | |
| Existing TI/LC Reserve: | $8,396,806 | $0 | NAP | Cut-off Date LTV Ratio: | 51.9% | |
| Rent Concessions Reserve: | $1,990,340 | $0 | NAP | Maturity Date LTV Ratio: | 51.9% | |
| Sources and Uses | ||||||
| Sources | Proceeds | % of Total | Uses | Proceeds | % of Total | |
| Whole Loan Amount(1): | $105,000,000 | 99.1% | Loan Payoff: | $82,681,287 | 78.1% | |
| Borrower Sponsor Equity | $933,392 | 0.9% | Reserves: | $20,513,790 | 19.4% | |
| Closing Costs: | $2,738,314 | 2.6% | ||||
| Total Sources: | $105,933,392 | 100.0% | Total Uses: | $105,933,392 | 100.0% | |
| (1) | The Wilshire Office Portfolio Mortgage Loan (as defined below) is part of a whole loan evidenced by three pari passu promissory notes with an aggregate original principal balance of $105,000,000. The information presented is based on the Wilshire Office Portfolio Whole Loan (as defined below). |
| (2) | Prepayment with yield maintenance is permitted at any time in connection with a partial release. See “Release of Property” below. |
| (3) | See “Escrows and Reserves” below for further discussion of reserve requirements. |
| (4) | The increase in Net Operating Income from 2022 to UW was primarily due to an increase in occupancy from 71.8% to 82.3%. From 2022 to UW the borrower sponsors executed 48 new and renewal, relocation or expansion leases totaling 173,252 SF. |
| (5) | The appraisals concluded to an overall Appraised Value for the Wilshire Office Portfolio Properties (as defined below) of $202,400,000, which reflects a hypothetical as-is value for 9460 Wilshire Boulevard Property (as defined below) of $107,600,000, the appraisal concluded to a hypothetical value assuming the outstanding tenant improvement allowances owed to O’Gara Coach Company, L.L.C. have already been paid. Such amount is included in an upfront reserve for existing TI/LC obligations. The aggregate as-is appraised values of the Wilshire Office Portfolio Properties is $194,000,000 as of October 14, 2024, and October 17, 2024. |
The Mortgage Loan. The third largest mortgage loan (the “Wilshire Office Portfolio Mortgage Loan”) is part of a whole loan (the “Wilshire Office Portfolio Whole Loan”) evidenced by three pari passu promissory notes with an aggregate original principal amount of $105,000,000. The Wilshire Office Portfolio Whole Loan is secured by a first priority fee mortgage encumbering the borrowers’ fee interests in three office properties totaling 351,464 SF of net rentable area located in Beverly Hills and Los Angeles, California (collectively the “Wilshire Office Portfolio Properties”). The Wilshire Office Portfolio Mortgage Loan is evidenced by the controlling Note A-1, with an original principal balance of $48,750,000 and the non-controlling Note A-3 with an original principal balance of $26,250,000. The Wilshire Office Portfolio Whole Loan will be serviced pursuant to the pooling and servicing agreement for the WFCM 2025-5C3 transaction. See “Description of the Mortgage Pool—The Serviced Pari Passu Whole Loans” and “Pooling and Servicing Agreement” in the Preliminary Prospectus.
| THE INFORMATION IN THIS STRUCTURAL AND COLLATERAL TERM SHEET IS NOT COMPLETE AND MAY BE AMENDED PRIOR TO THE TIME OF SALE. THIS TERM SHEET IS NOT AN OFFER TO SELL THESE SECURITIES AND IT IS NOT A SOLICITATION OF AN OFFER TO BUY THESE SECURITIES IN ANY JURISDICTION WHERE THE OFFER OR SALE IS NOT PERMITTED. | ||
| 45 | ||
| Office – CBD | Loan #3 | Cut-off Date Balance: | $75,000,000 | |
| Various | Wilshire Office Portfolio | Cut-off Date LTV: | 51.9% | |
| Various, CA Various | UW NCF DSCR: | 1.73x | ||
| UW NOI Debt Yield: | 13.2% |
| Wilshire Office Portfolio Whole Loan Summary | ||||
| Note | Original Balance | Cut-off Date Balance | Note Holder | Controlling Note |
| A-1 | $48,750,000 | $48,750,000 | WFCM 2025-5C3 | Yes |
| A-2(1) | $30,000,000 | $30,000,000 | Bank of America, N.A. | No |
| A-3 | $26,250,000 | $26,250,000 | WFCM 2025-5C3 | No |
| Total | $105,000,000 | $105,000,000 | ||
| (1) | Expected to be contributed to one or more future securitization trust(s). |
The Borrowers and the Borrower Sponsors. The borrowers are 9460 Wilshire Boulevard (BH) Owner, L.P., CIM/11600 Wilshire (Los Angeles), LP and CIM/11620 Wilshire (Los Angeles), LP, each a single-purpose, Delaware limited partnership with two independent directors.
The borrower sponsors and non-recourse carveout guarantors are Creative Media & Community Trust Corporation and CIM Group Investments, LLC (collectively, “CIM”). CIM Group Investments, LLC is a non-recourse carve-out guarantor for bankruptcy-related carve-out events only, subject to certain CIM-related entities being in control of the Borrower at the time of the triggering event. CIM is a full-service private equity real estate investment firm which specializes in high-density urban communities with approximately $29 billion of assets owned and operated across its various funds. Each borrower is ultimately controlled by the three co-founders/principals of CIM, Shaul Kuba, Richard Ressler, and Avi Shemesh, and are 100% owned by CIM’s publicly-traded REIT, Creative Media & Community Trust Corporation (Nasdaq: CMCT). The borrower sponsors disclosed one prior deed-in-lieu of foreclosure and one loan that was transferred to special servicing in August 2024. See “Description of the Mortgage Pool—Loan Purpose; Default History, Bankruptcy Issues and Other Proceedings” in the Preliminary Prospectus.
The Properties. The Wilshire Office Portfolio Properties comprise three office buildings totaling 351,464 SF, inclusive of 116,081 SF of medical office space (33.0% of net rentable area; 31.0% of underwritten base rent), located in Los Angeles, California and 39,121 SF of ground floor retail space (11.1% of net rentable area; 22.5% of underwritten base rent), located approximately 0.1 miles southeast of Rodeo Drive in Beverly Hills and Los Angeles, California. As of December 2, 2024, the portfolio is 82.3% leased to 78 tenants, with no tenant representing more than 7.8% of the net portfolio rentable area and has averaged 82.0% occupancy since 2019.
9460 Wilshire Boulevard
The 9460 Wilshire Boulevard Property is a 9-story office building totaling 97,655 SF located in Beverly Hills, California (the “9460 Wilshire Boulevard Property”). The 9460 Wilshire Boulevard Property includes 33,000 SF of ground floor retail space, which is leased to O’Gara Coach Company, L.L.C., which is currently building out its space as a new flagship Rolls-Royce Motor Cars showroom and is expected to open for business in April 2025, and U.S. Bank National Association. The 9460 Wilshire Boulevard Property was built in 1959 and renovated between 2019 and 2024. The borrower sponsors have invested approximately $2.4 million in capital improvements and approximately $5.3 million in TI/LCs since 2018. Situated on a 0.77-acre site, the 9460 Wilshire Boulevard Property includes an onsite parking garage with 235 parking spaces (2.41 spaces per 1,000 SF). As of December 2, 2024, the 9460 Wilshire Boulevard Property was 91.6% leased to 11 tenants and has averaged 81.2% occupancy since 2019.
11620 Wilshire Boulevard
The 11620 Wilshire Boulevard Property is an 11-story office building totaling 196,928 SF, inclusive of 60,265 SF of medical office space, located in Los Angeles, California (the “11620 Wilshire Boulevard Property”). The 11620 Wilshire Property was built in 1976 and renovated in 2002. The borrower sponsors have invested approximately $4.5 million in capital improvements and approximately $18.6 million in TI/LCs since 2010. Situated on a 1.13-acre site, the 11620 Wilshire Boulevard Property includes an onsite parking garage totaling 617 parking spaces (3.13 per 1,000 SF). There is an easement agreement that provides 135 parking spaces to the 11600 Wilshire Boulevard Property, resulting in 482 total parking spaces available to the 11620 Wilshire Boulevard Property (2.45 spaces per 1,000 SF). As of December 2, 2024, the 11620 Wilshire Boulevard Property was 80.3% leased to 38 tenants and has averaged 81.4% occupancy since 2019.
11600 Wilshire Boulevard
The 11600 Wilshire Boulevard Property is a 5-story medical office building totaling 56,881 SF located in Los Angeles, California (the “11600 Wilshire Boulevard Property”). The 11600 Wilshire Boulevard Property was built in 1960 and renovated in 2000. The borrower sponsors have invested approximately $2.4 million in capital improvements and approximately $4.3 million in TI/LCs since 2010. Situated on a 0.57-acre site, the 11600 Wilshire Boulevard Property includes an onsite parking garage with 31 parking spaces (0.54 spaces per 1,000 SF). There is an easement agreement that provides 135 parking spaces to the 11600 Wilshire Boulevard Property, resulting in 166 total parking spaces available to the 11600 Wilshire Boulevard Property (2.92 spaces per 1,000 SF). As of December 2, 2024, the 11600 Wilshire Boulevard Property was 73.4% leased to 29 tenants and has averaged 85.1% occupancy since 2019.
| THE INFORMATION IN THIS STRUCTURAL AND COLLATERAL TERM SHEET IS NOT COMPLETE AND MAY BE AMENDED PRIOR TO THE TIME OF SALE. THIS TERM SHEET IS NOT AN OFFER TO SELL THESE SECURITIES AND IT IS NOT A SOLICITATION OF AN OFFER TO BUY THESE SECURITIES IN ANY JURISDICTION WHERE THE OFFER OR SALE IS NOT PERMITTED. | ||
| 46 | ||
| Office – CBD | Loan #3 | Cut-off Date Balance: | $75,000,000 | |
| Various | Wilshire Office Portfolio | Cut-off Date LTV: | 51.9% | |
| Various, CA Various | UW NCF DSCR: | 1.73x | ||
| UW NOI Debt Yield: | 13.2% |
The following table presents certain information relating to the Wilshire Office Portfolio Properties:
| Wilshire Office Portfolio Property Summary | |||||||||
| Property Name / Location | Allocated Whole Loan Cut-off Date Balance | % of Portfolio Cut-off Date Balance | Occupancy(1) | Year Built/ Renovated(2) | Net Rentable Area (SF)(1) | Appraised Value(2) | Allocated Cut-off Date LTV | UW NOI(1) | % of UW NOI(1) |
9460 Wilshire Boulevard Beverly Hills, CA | $52,863,911 | 50.3% | 91.6% | 1959/2019-2024 | 97,655 | $107,600,000(3) | 49.1% | $6,954,769 | 50.3% |
11620 Wilshire Boulevard Los Angeles, CA | $39,077,548 | 37.2% | 80.3% | 1976/2002 | 196,928 | $65,800,000 | 59.4% | $5,141,037 | 37.2% |
11600 Wilshire Boulevard Los Angeles, CA | $13,058,541 | 12.4% | 73.4% | 1960/2000 | 56,881 | $29,000,000 | 45.0% | $1,717,980 | 12.4% |
| Total/Weighted Average | $105,000,000 | 100.0% | 82.3% | 351,464 | $202,400,000(3) | 51.9% | $13,813,785 | 100.0% | |
| (1) | Information based on the underwritten rent roll. |
| (2) | Source: Appraisal. |
| (3) | The appraisals concluded to an overall Appraised Value for the Wilshire Office Portfolio Properties (as defined below) of $202,400,000, which reflects a hypothetical as-is value for 9460 Wilshire Boulevard Property (as defined below) of $107,600,000, the appraisal concluded to a hypothetical value assuming the outstanding tenant improvement allowances owed to O’Gara Coach Company, L.L.C. have already been paid. Such amount is included in an upfront reserve for existing TI/LC obligations. The aggregate as-is appraised values of the Wilshire Office Portfolio Properties is $194,000,000 as of October 14, 2024, and October 17, 2024. |
Major Tenants.
U.S. Bank National Association (27,569 SF; 7.8% of net portfolio rentable area; 19.3% of portfolio underwritten base rent). U.S. Bank National Association is an American bank (“USB”) based in Minneapolis, Minnesota. Founded in 1863, USB has more than 70,000 employees and over 2,000 branches in 26 states. USB’s space includes 14,843 SF of retail space (53.8% of USB net rentable area) and 12,726 SF of office space (46.2% of USB net rentable area). Additionally, USB has exterior building signage at the top of the property. USB has been a tenant at the 9460 Wilshire Boulevard Property since 1990 and most recently renewed its lease in 2019 for a 10-year term. The tenant’s lease expires on July 31, 2029, with two five-year renewals and no termination options remaining.
3 Arts Entertainment, L.L.C. (27,112 SF; 7.7% of net portfolio rentable area; 10.7% of portfolio underwritten base rent). 3 Arts Entertainment, L.L.C. (“3 Arts Entertainment”) is an American production company and talent management agency. Founded in 1991, 3 Arts Entertainment is headquartered in Beverly Hills at the 9460 Wilshire Boulevard Property. 3 Arts Entertainment has produced TV shows including The Office, Parks and Recreation, Brooklyn Nine-Nine, and It's Always Sunny in Philadelphia. 3 Arts Entertainment is currently owned by Lionsgate, an American film and television production and distribution conglomerate based in Santa Monica, California. 3 Arts Entertainment has been a tenant at the 9460 Wilshire Boulevard property since 1994 and most recently renewed its lease in 2023. The tenant’s lease expires on February 28, 2026, with one five-year renewal and no termination options remaining.
Rexford Industrial Realty, L.P. (24,693 SF; 7.0% of net portfolio rentable area; 5.5% of portfolio underwritten base rent). Rexford Industrial Realty, L.P. (“Rexford”) (NYSE: REXR) is a REIT focused on infill industrial properties in southern California. Founded in 2001, Rexford is headquartered in Los Angeles at the 11620 Wilshire Boulevard Property. As of October 15, 2024, Rexford owns 424 properties consisting of 720 buildings totaling 50 million SF. The tenant’s lease expires on April 30, 2028, with one three-year renewal and no termination options remaining.
The following table presents certain information relating to the tenancy at the Wilshire Office Portfolio Properties:
| Tenant Summary | ||||||||||
| Tenant Name | Space Type | Credit Rating (Fitch/Moody's/ S&P)(1) | Tenant SF | % of Total SF | Annual UW Rent(2) | % of Total Annual UW Rent | Annual UW Rent PSF(2) | Lease Expiration | Term. Option (Y/N) | Renewal Options |
| U.S. Bank National Association | Retail/Office | A+/A3/A | 27,569(3) | 7.8% | $3,628,415 | 19.3% | $131.61 | 7/31/2029 | N | 2 x 5 Yr |
| 3 Arts Entertainment, L.L.C.(4) | Office | NR/NR/NR | 27,112 | 7.7% | $2,010,900 | 10.7% | $74.17 | 2/28/2026 | N | 1 x 5 Yr |
| Rexford Industrial Realty, L.P. | Office | BBB+/NR/BBB+ | 24,693 | 7.0% | $1,037,106 | 5.5% | $42.00 | 4/30/2028 | N | 1 x 3 Yr |
| Rolls Royce Motor Cars Beverly Hills (O’Gara Coach Company, L.L.C.)(5) | Retail | NR/NR/NR | 18,157 | 5.2% | $1,808,559 | 9.6% | $99.61 | 5/31/2043 | N | 2 x 5 Yr |
| City of Los Angeles Building & Safety | Office | AAA/Aa2/AA | 10,614 | 3.0% | $508,198 | 2.7% | $47.88 | 11/30/2027 | N | 1 x 3 Yr |
| Subtotal/Wtd. Avg. | 108,145 | 30.8% | $8,993,178 | 47.9% | $83.16 | |||||
| Other Tenants | 181,247 | 51.6% | $9,793,746 | 52.1% | $54.04 | |||||
| Total Occupied Space | 289,392 | 82.3% | $18,786,924 | 100.0% | $64.92 | |||||
| Vacant Space | 62,072 | 17.7% | ||||||||
| Total/Wtd. Avg. | 351,464 | 100.0% | ||||||||
| (1) | Credit Ratings are those of the parent company, whether or not the parent company guarantees the lease. |
| (2) | The Annual UW Rent and Annual UW Rent PSF includes rent steps through December 2025 totaling $147,691. |
| (3) | U.S. Bank National Association SF includes 14,843 SF of retail space and 12,726 SF of office space. |
| THE INFORMATION IN THIS STRUCTURAL AND COLLATERAL TERM SHEET IS NOT COMPLETE AND MAY BE AMENDED PRIOR TO THE TIME OF SALE. THIS TERM SHEET IS NOT AN OFFER TO SELL THESE SECURITIES AND IT IS NOT A SOLICITATION OF AN OFFER TO BUY THESE SECURITIES IN ANY JURISDICTION WHERE THE OFFER OR SALE IS NOT PERMITTED. | ||
| 47 | ||
| Office – CBD | Loan #3 | Cut-off Date Balance: | $75,000,000 | |
| Various | Wilshire Office Portfolio | Cut-off Date LTV: | 51.9% | |
| Various, CA Various | UW NCF DSCR: | 1.73x | ||
| UW NOI Debt Yield: | 13.2% |
| (4) | 3 Arts Entertainment, L.L.C. (Suites 500, 650, and 700) is on a lease through February 28, 2026. 3 Arts Entertainment, L.L.C. is subleasing a portion of Suite 500 to an affiliated company, 42 US Inc. on a lease through September 1, 2024, which has been extended on month-to-month basis, with a base rent of $26,600 per month. 3 Arts Entertainment, L.L.C. and 42 US Inc. are sister companies that work together through a TV partnership with Lionsgate, which acquired a stake in 42 US Inc. in 2022. |
| (5) | O’Gara Coach Company, L.L.C. is currently building out its space as a new flagship Rolls-Royce Motor Cars showroom and is expected to open for business in April 2025. |
The following table presents certain information relating to the lease rollover schedule at the Wilshire Office Portfolio Properties:
| Lease Rollover Schedule(1) | ||||||||
| Year | # of Leases Rolling | SF Rolling | Approx. % of SF Rolling | Approx. Cumulative % of SF Rolling | Total UW Rent Rolling | Approx. % of Total UW Rent Rolling | Approx. Cumulative % of Total UW Rent Rolling | UW Rent PSF Rolling |
| MTM/2025 | 11 | 23,644 | 6.7% | 6.7% | $1,119,423 | 6.0% | 6.0% | $47.34 |
| 2026 | 23 | 83,251 | 23.7% | 30.4% | $4,876,599 | 26.0% | 31.9% | $58.58 |
| 2027 | 13 | 33,317 | 9.5% | 39.9% | $1,920,780 | 10.2% | 42.1% | $57.65 |
| 2028 | 11 | 58,286 | 16.6% | 56.5% | $3,020,428 | 16.1% | 58.2% | $51.82 |
| 2029 | 7 | 39,091 | 11.1% | 67.6% | $4,269,917 | 22.7% | 80.9% | $109.23 |
| 2030 | 8 | 17,175 | 4.9% | 72.5% | $924,789 | 4.9% | 85.9% | $53.85 |
| 2031 | 2 | 12,533 | 3.6% | 76.1% | $557,883 | 3.0% | 88.8% | $44.51 |
| 2032 | 1 | 932 | 0.3% | 76.3% | $43,618 | 0.2% | 89.1% | $46.80 |
| 2033 | 0 | 0 | 0.0% | 76.3% | $0 | 0.0% | 89.1% | $0.00 |
| 2034 | 1 | 3,006 | 0.9% | 77.2% | $244,929 | 1.3% | 90.4% | $81.48 |
| 2035 | 0 | 0 | 0.0% | 77.2% | $0 | 0.0% | 90.4% | $0.00 |
| Thereafter | 1 | 18,157 | 5.2% | 82.3% | $1,808,559 | 9.6% | 100.0% | $99.61 |
| Vacant | 0 | 62,072 | 17.7% | 100.0% | $0 | 0.0% | 100.0% | $0.00 |
| Total/Wtd. Avg. | 78 | 351,464 | 100.0% | $18,786,924 | 100.0% | $64.92(2) | ||
| (1) | Information is based on the underwritten rent roll. |
| (2) | Total/Wtd. Avg. Annual UW Rent PSF Rolling excludes vacant space. |
The Market. The 9460 Wilshire Boulevard Property is located in Beverly Hills, California, approximately 11.5 miles west of downtown Los Angeles. The 9460 Wilshire Boulevard Property is located approximately 14.3 miles west of the Los Angeles International Airport and 8.3 miles south of The Universal Studios Hollywood. In addition, the 9460 Wilshire Boulevard Property is located approximately 0.1 miles southeast of Rodeo Drive.
9460 Wilshire Boulevard
According to the appraisal, the estimated 2024 population within a one-, three- and five-mile radius of the 9460 Wilshire Boulevard Property was approximately 32,023, 272,572, and 703,680, respectively and the estimated 2024 average household income within the same radii was approximately $172,625, $165,239, and $152,835, respectively.
According to the appraisal, the 9460 Wilshire Boulevard Property is situated within the Beverly Hills Golden Triangle office submarket within the greater Los Angeles office market. As of the second quarter of 2024, the submarket reported a total inventory of approximately 3.5 million SF with a 14.0% vacancy rate and an average asking rent of $81.36 PSF.
11600 Wilshire Boulevard and 11620 Wilshire Boulevard
The 11600 Wilshire Boulevard and 11620 Wilshire Boulevard Properties are located in Los Angeles, California, approximately 14.4 miles west of downtown Los Angeles. The 11600 Wilshire Boulevard and 11620 Wilshire Boulevard Properties are located approximately 14.5 miles west of the Los Angeles International Airport. In addition, the Pacific Coast Highway is situated approximately 3.5 miles west of the 11600 Wilshire Boulevard and 11620 Wilshire Boulevard Properties.
According to the appraisal, the estimated 2024 population within a one-, three- and five-mile radius of the 11620 Wilshire Boulevard Property was approximately 52,154, 243,847, and 532,666, respectively and the estimated 2024 average household income within the same radii was approximately $166,991, $180,887, and $178,210, respectively.
According to the appraisal, the estimated 2024 population within a one-, three- and five-mile radius of the 11600 Wilshire Boulevard Property was approximately 52,981, 244,716, and 534,977, respectively and the estimated 2024 average household income within the same radii was approximately $166,909, $180,244, and $178,260, respectively.
According to the appraisal, the 11600 Wilshire Boulevard and 11620 Wilshire Boulevard Properties are situated within the Brentwood office submarket within the greater Los Angeles office market. As of the second quarter of 2024, the submarket reported a total inventory of approximately 3.5 million SF with a 21.0% vacancy rate and an average asking rent of $53.64 PSF.
| THE INFORMATION IN THIS STRUCTURAL AND COLLATERAL TERM SHEET IS NOT COMPLETE AND MAY BE AMENDED PRIOR TO THE TIME OF SALE. THIS TERM SHEET IS NOT AN OFFER TO SELL THESE SECURITIES AND IT IS NOT A SOLICITATION OF AN OFFER TO BUY THESE SECURITIES IN ANY JURISDICTION WHERE THE OFFER OR SALE IS NOT PERMITTED. | ||
| 48 | ||
| Office – CBD | Loan #3 | Cut-off Date Balance: | $75,000,000 | |
| Various | Wilshire Office Portfolio | Cut-off Date LTV: | 51.9% | |
| Various, CA Various | UW NCF DSCR: | 1.73x | ||
| UW NOI Debt Yield: | 13.2% |
The following table presents certain information relating to the appraisals’ market rent conclusions for the Wilshire Office Portfolio Properties:
| Market Rent Summary | ||||||
| 9460 Wilshire Boulevard | 11620 Wilshire Boulevard | 11600 Wilshire Boulevard | ||||
| Office | Retail | Office | Medical Office | Medical Office (Basement) | Medical Office | |
| Market Rent (PSF) | $75.00 | $120.00 | $45.00 | $54.00 | $45.00 | $55.20 |
| Lease Term (Years) | 5 | 10 | 5 | 5 | 5 | 5 |
| Lease Type | BY Stop | Net | BY Stop | BY Stop | FSG | FSG |
| Rent Increase Projection | 3% per annum | 3% per annum | 3% per annum | 3% per annum | 3% per annum | 3% per annum |
| Tenant Improvements (New) | $40 PSF | $100 PSF | $20 PSF | $20 PSF | $20 PSF | $20 PSF |
| Leasing Commissions (New) | 6.0% | 6.0% | 6.0% | 6.0% | 6.00% | 6.00% |
| Free Rent (New) | NAP | NAP | NAP | NAP | NAP | NAP |
Appraisal. The appraisals concluded to an overall Appraised Value for the Wilshire Office Portfolio Properties of $202,400,000, which reflects a hypothetical as-is value for 9460 Wilshire Boulevard Property of $107,600,000. The appraisal concluded to a hypothetical value assuming the outstanding tenant improvement allowances owed to O’Gara Coach Company, L.L.C. have already been paid. Such amount is included in an upfront reserve for existing TI/LC obligations. The appraisals concluded an “as-is” Appraised Value for the Wilshire Office Portfolio Properties of $194,000,000 as of October 14, 2024, and October 17, 2024.
Environmental Matters. According to the Phase I environmental site assessments dated November 5, 2024 and October 25, 2024, there was no evidence of any recognized environmental conditions at the 9460 Wilshire Boulevard Property or the 11620 Wilshire Boulevard Property.
The Phase I environmental site assessment for the 11600 Wilshire Boulevard Property dated October 25, 2024 identified a recognized environmental condition (“REC”) associated with the property formerly being occupied by a gas station between 1934 and 1958. See “Description of the Mortgage Pool—Environmental Considerations” in the Preliminary Prospectus.
| THE INFORMATION IN THIS STRUCTURAL AND COLLATERAL TERM SHEET IS NOT COMPLETE AND MAY BE AMENDED PRIOR TO THE TIME OF SALE. THIS TERM SHEET IS NOT AN OFFER TO SELL THESE SECURITIES AND IT IS NOT A SOLICITATION OF AN OFFER TO BUY THESE SECURITIES IN ANY JURISDICTION WHERE THE OFFER OR SALE IS NOT PERMITTED. | ||
| 49 | ||
| Office – CBD | Loan #3 | Cut-off Date Balance: | $75,000,000 | |
| Various | Wilshire Office Portfolio | Cut-off Date LTV: | 51.9% | |
| Various, CA Various | UW NCF DSCR: | 1.73x | ||
| UW NOI Debt Yield: | 13.2% |
Operating History and Underwritten Net Cash Flow. The following table presents certain information relating to the historical operating performance and underwritten net cash flow at the Wilshire Office Portfolio Properties:
| Cash Flow Analysis | ||||||
| 2021 | 2022 | 2023 | TTM 8/31/2024 | UW | UW PSF | |
| Base Rent | $15,941,271 | $16,065,291 | $17,146,628 | $18,231,210 | $18,786,924(1) | $53.45 |
| Grossed Up Vacant Space | $0 | $0 | $0 | $0 | $3,224,704 | $9.18 |
| Gross Potential Rent | $15,941,271 | $16,065,291 | $17,146,628 | $18,231,210 | $22,011,628 | $62.63 |
| Total Recoveries | $1,214,604 | $1,485,553 | $1,542,313 | $1,860,816 | $1,908,233 | $5.43 |
| Other Income | $836,400 | $858,538 | $1,007,855 | $1,019,170 | $1,019,170 | $2.90 |
| Parking/Garage/Other | $1,436,619 | $1,596,139 | $1,813,742 | $1,851,677 | $1,851,677 | $5.27 |
| Straight Line Rent(2) | $0 | $0 | $0 | $0 | $52,839 | $0.15 |
| Less: Free Rent Adjustment | ($807,324) | ($1,189,399) | ($1,094,314) | ($929,202) | $0 | $0.00 |
| (Vacancy & Credit Loss) | $0 | $0 | $0 | $0 | ($3,224,704) | ($9.18) |
| Effective Gross Income | $18,621,570 | $18,816,121 | $20,416,224 | $22,033,671 | $23,618,844 | $67.20 |
| Management Fee | $565,855 | $556,883 | $573,716 | $623,018 | $708,565 | $2.02 |
| Real Estate Taxes | $2,980,491 | $3,009,358 | $3,100,541 | $3,169,911 | $3,218,988 | $9.16 |
| Insurance | $279,830 | $301,630 | $346,918 | $413,403 | $432,313 | $1.23 |
| Other Operating Expenses | $4,354,298 | $4,796,551 | $5,059,314 | $5,445,193 | $5,445,193 | $15.49 |
| Total Expenses | $8,180,475 | $8,664,422 | $9,080,489 | $9,651,524 | $9,805,059 | $27.90 |
| Net Operating Income | $10,441,095 | $10,151,699(3) | $11,335,735(3) | $12,382,146(3) | $13,813,785(3) | $39.30 |
| Replacement Reserves | $0 | $0 | $0 | $0 | $165,191 | $0.47 |
| TI/LC | $0 | $0 | $0 | $0 | $900,000 | $2.56 |
| TI/LC Reserve | $0 | $0 | $0 | $0 | ($900,000)(4) | ($2.56) |
| Net Cash Flow | $10,441,095 | $10,151,699 | $11,335,735 | $12,382,146 | $13,648,594 | $38.83 |
| Occupancy % | 77.8% | 71.8% | 84.2% | 82.3%(5) | 85.3%(5) | |
| NOI DSCR(6) | 1.32x | 1.29x | 1.44x | 1.57x | 1.75x | |
| NCF DSCR(6) | 1.32x | 1.29x | 1.44x | 1.57x | 1.73x | |
| NOI Debt Yield(6) | 9.9% | 9.7% | 10.8% | 11.8% | 13.2% | |
| NCF Debt Yield(6) | 9.9% | 9.7% | 10.8% | 11.8% | 13.0% | |
| (1) | UW Base Rent includes rent steps through December 2025 totaling $147,691. |
| (2) | Represents straight line rent averaging for investment grade tenants. |
| (3) | The increase in Net Operating Income from 2022 to UW was primarily due to an increase in occupancy from 71.8% to 82.3%. From 2022 to UW the borrower sponsors executed 48 new and renewal, relocation or expansion leases totaling 173,252 SF. |
| (4) | Represents a credit for 10% of the upfront TI/LC reserve of $9,000,000. |
| (5) | The underwritten economic vacancy is 14.7%. The Wilshire Office Portfolio Properties was 82.3% physically occupied as of December 2, 2024. |
| (6) | The information presented is based on the Wilshire Office Portfolio Whole Loan. |
Escrows and Reserves.
Real Estate Taxes – The loan documents require an upfront reserve of $1,126,644 and ongoing monthly real estate tax reserves in an amount equal to 1/12th of the real estate taxes that the lender estimates will be payable during the next 12 months, initially estimated at $281,661 monthly.
Insurance – The loan documents require an ongoing monthly deposit into an insurance reserve equal to 1/12th of the insurance premiums that the lender reasonably estimates will be payable during the next ensuing 12 months; provided that no deposits are required if (i) no event of default is continuing, (ii) the borrower maintains insurance coverage for the Wilshire Office Portfolio Properties as part of blanket or umbrella coverage reasonably approved by the lender, and (iii) the borrowers provide the lender with evidence of the renewals of the insurance policies and paid receipts for the payment of the insurance premiums no later than 10 business days prior to the expiration dates of the policies.
Replacement Reserve – The loan documents require an ongoing monthly replacement reserve deposit of $13,766, subject to a cap of $495,573.
TI/LC Reserve – The loan documents require an upfront deposit of $9,000,000 and an ongoing monthly TI/LC reserve deposit of $73,222.
Existing TI/LC Reserve – The loan documents require an upfront deposit of $8,396,806, which represents the leasing commissions and tenant improvements payable by the borrowers under existing leases at the Wilshire Office Portfolio Properties.
Rent Concessions Reserve – The loan documents require an upfront deposit of $1,990,340, which represents the future rent credits or abatements under existing leases at the Wilshire Office Portfolio Properties.
Lockbox and Cash Management. The Wilshire Office Portfolio Mortgage Loan is structured with a soft lockbox and springing cash management. Prior to the occurrence of a Cash Trap Event Period (as defined below), the borrowers and property manager are required to deposit all rents and other income
| THE INFORMATION IN THIS STRUCTURAL AND COLLATERAL TERM SHEET IS NOT COMPLETE AND MAY BE AMENDED PRIOR TO THE TIME OF SALE. THIS TERM SHEET IS NOT AN OFFER TO SELL THESE SECURITIES AND IT IS NOT A SOLICITATION OF AN OFFER TO BUY THESE SECURITIES IN ANY JURISDICTION WHERE THE OFFER OR SALE IS NOT PERMITTED. | ||
| 50 | ||
| Office – CBD | Loan #3 | Cut-off Date Balance: | $75,000,000 | |
| Various | Wilshire Office Portfolio | Cut-off Date LTV: | 51.9% | |
| Various, CA Various | UW NCF DSCR: | 1.73x | ||
| UW NOI Debt Yield: | 13.2% |
directly into the deposit account within two business days of receipt. During a Cash Trap Event Period, funds in the lockbox account are required to be swept to a lender-controlled cash management account and all excess funds are required to be swept to an excess cash flow subaccount controlled by the lender.
A “Cash Trap Event Period” will commence upon the earlier of the following:
| (i) | the occurrence and continuance of an event of default under the loan documents; |
| (ii) | the net cash flow debt service coverage ratio (“NCF DSCR”) falling below 1.20x, tested quarterly; or |
| (iii) | U.S. Bank fails to renew its lease for an additional five year period on or before the date required for renewal pursuant to the terms under its lease (initially July 31, 2028). |
A Cash Trap Event Period will end upon the occurrence of the following:
| ● | with regard to clause (i) above, the cure of such event of default; |
| ● | with regard to clause (ii) above, the NCF DSCR being equal to or greater than 1.20x on a trailing three-month basis, provided, the borrowers have the option (A) after the defeasance lockout release date to prepay the Wilshire Office Portfolio Whole Loan in an amount that would result in a debt service coverage ratio of 1.20x on a trailing three-month basis or (B) to post collateral in an amount that if applied to prepay the Wilshire Office Portfolio Whole Loan would result in a debt service coverage ratio of 1.20x on a trailing three-month basis; |
| ● | with regard to clause (iii) above, upon the date on which (i) U.S. Bank renews its lease in writing for not less than an additional five year term, or (ii) a replacement lease is executed by a replacement tenant, such lease and tenant as may be reasonably acceptable to the lender and otherwise approved by the lender in accordance with the loan documents (to the extent consent is required pursuant to the terms thereof), and such replacement tenant has taken occupancy, commenced paying base rent (without offset or abatement) and is conducting its normal business operations in the entire premises formerly occupied by U.S. Bank. |
Release of Property. The loan documents provide for the partial release of the 11620 Wilshire Boulevard Property (having an allocated loan amount of $39,077,548 or 37.2% of the original principal balance) and/or the 11600 Wilshire Boulevard Property (having an allocated loan amount of $13,058,541 or 12.4% of the original principal balance) in connection with a bona fide sale to an unaffiliated third party subject to certain conditions, including: (i) partial prepayment of the Wilshire Office Portfolio Whole Loan with the applicable yield maintenance premium or, at any time following the expiration of the defeasance lockout period, partial defeasance of the Wilshire Office Portfolio Whole Loan in an amount equal to the greater of (A) 100% of the net proceeds of such sale or (B) 115% of the allocated loan amount for the related release property; (ii) the post-release debt yield for the remaining properties is not less than the pre-release debt yield for then-encumbered properties; (iii) the post-release debt service coverage ratio for the remaining properties is not less than the pre-release debt service coverage ratio for then-encumbered properties; (iv) the post-release loan-to-value ratio for the remaining properties is not greater than the pre-release loan-to-value ratio for then-encumbered properties; (v) an opinion of counsel that the partial release satisfies applicable REMIC requirements; and (vi) unless waived by an applicable rating agency, a rating agency confirmation.
Terrorism Insurance. The loan documents require an “all risk” insurance policy on a replacement cost basis, together with (i) business interruption insurance covering no less than the 18-month period following the occurrence of a casualty event, together with a 6-month extended period of indemnity, (ii) named storm with a deductible up to 5% of the total insurable value and earthquake insurance with $25 million policy limits and subject to 10% deductible, and (iii) terrorism insurance as defined by TRIPRA, provided that if TRIPRA or a successor statute is not in effect, the borrowers will not be required to spend on terrorism insurance more than two times the cost of the then-current all-risk coverage under a stand-alone all-risk policy (including property/casualty coverage and loss of rents/ business interruption coverage). See “Risk Factors—Risks Relating to the Mortgage Loans—Terrorism Insurance May Not Be Available for All Mortgaged Properties” in the Preliminary Prospectus.
| THE INFORMATION IN THIS STRUCTURAL AND COLLATERAL TERM SHEET IS NOT COMPLETE AND MAY BE AMENDED PRIOR TO THE TIME OF SALE. THIS TERM SHEET IS NOT AN OFFER TO SELL THESE SECURITIES AND IT IS NOT A SOLICITATION OF AN OFFER TO BUY THESE SECURITIES IN ANY JURISDICTION WHERE THE OFFER OR SALE IS NOT PERMITTED. | ||
| 51 | ||
| Manufactured Housing – Manufactured Housing | Loan #4 | Cut-off Date Balance: | $70,500,000 | |
| Various | WAND MHC Portfolio | Cut-off Date LTV: | 67.1% | |
| Various | UW NCF DSCR: | 1.32x | ||
| UW NOI Debt Yield: | 8.4% |
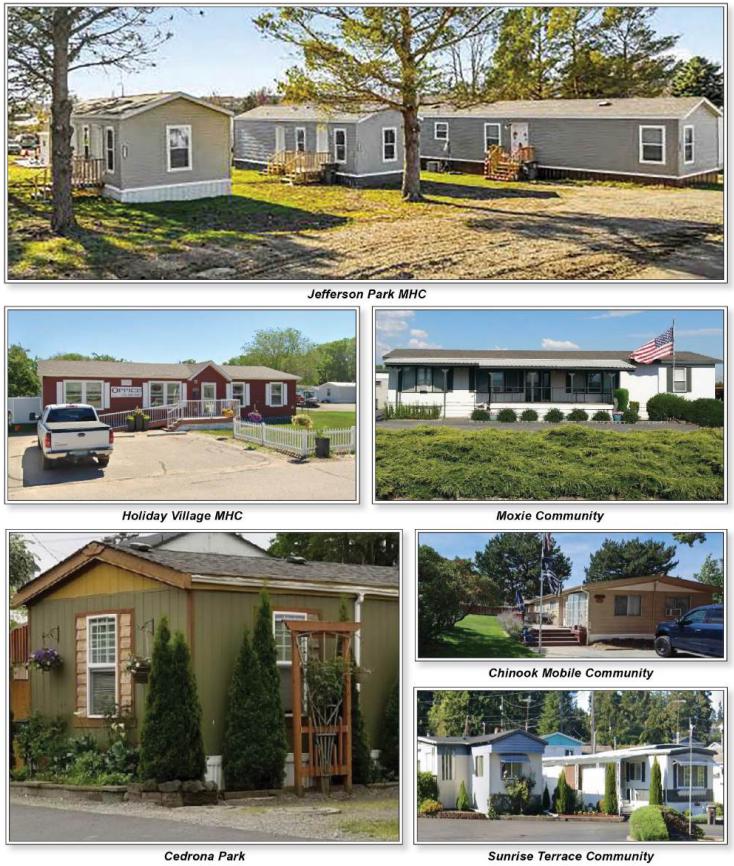
| THE INFORMATION IN THIS STRUCTURAL AND COLLATERAL TERM SHEET IS NOT COMPLETE AND MAY BE AMENDED PRIOR TO THE TIME OF SALE. THIS TERM SHEET IS NOT AN OFFER TO SELL THESE SECURITIES AND IT IS NOT A SOLICITATION OF AN OFFER TO BUY THESE SECURITIES IN ANY JURISDICTION WHERE THE OFFER OR SALE IS NOT PERMITTED. | ||
| 52 | ||
| Manufactured Housing – Manufactured Housing | Loan #4 | Cut-off Date Balance: | $70,500,000 | |
| Various | WAND MHC Portfolio | Cut-off Date LTV: | 67.1% | |
| Various | UW NCF DSCR: | 1.32x | ||
| UW NOI Debt Yield: | 8.4% |

| THE INFORMATION IN THIS STRUCTURAL AND COLLATERAL TERM SHEET IS NOT COMPLETE AND MAY BE AMENDED PRIOR TO THE TIME OF SALE. THIS TERM SHEET IS NOT AN OFFER TO SELL THESE SECURITIES AND IT IS NOT A SOLICITATION OF AN OFFER TO BUY THESE SECURITIES IN ANY JURISDICTION WHERE THE OFFER OR SALE IS NOT PERMITTED. | ||
| 53 | ||
| Mortgage Loan No. 4 – WAND MHC Portfolio |
| Mortgage Loan Information | Property Information | ||||||
| Mortgage Loan Seller: | CREFI | Single Asset/Portfolio: | Portfolio | ||||
| Credit Assessment (KBRA/Fitch/Moody’s): | NR/NR/NR | Location(2): | Various, Various | ||||
| Original Balance: | $70,500,000 | General Property Type: | Manufactured Housing | ||||
| Cut-off Date Balance: | $70,500,000 | Detailed Property Type: | Manufactured Housing | ||||
| % of Initial Pool Balance: | 8.5% | Title Vesting: | Fee | ||||
| Loan Purpose: | Refinance/Acquisition | Year Built/Renovated(2): | Various / Various | ||||
| Borrower Sponsors: | Caleb Romack and Hurst & Son LLC | Size: | 962 Pads | ||||
| Guarantors: | Caleb Romack and Hurst & Son LLC | Cut-off Date Balance per Pad: | $73,285 | ||||
| Mortgage Rate: | 6.23000% | Maturity Date Balance per Pad: | $73,285 | ||||
| Note Date: | 11/26/2024 | Property Manager: | Hurst & Son LLC (borrower affiliated) | ||||
| Maturity Date: | 12/6/2029 | Underwriting and Financial Information | |||||
| Term to Maturity: | 60 months | UW NOI: | $5,940,082 | ||||
| Amortization Term: | 0 months | UW NCF: | $5,891,982 | ||||
| IO Period: | 60 months | UW NOI Debt Yield: | 8.4% | ||||
| Seasoning: | 1 month | UW NCF Debt Yield: | 8.4% | ||||
| Prepayment Provisions: | L(25),D(28),O(7) | UW NOI Debt Yield at Maturity: | 8.4% | ||||
| Lockbox/Cash Mgmt Status: | Springing/Springing | UW NCF DSCR: | 1.32x | ||||
| Additional Debt Type: | NAP | Most Recent NOI: | $5,935,722 (9/30/2024 TTM) | ||||
| Additional Debt Balance: | NAP | 2nd Most Recent NOI: | $5,451,422 (12/31/2023) | ||||
| Future Debt Permitted (Type): | NAP | 3rd Most Recent NOI(3)--: | NAV | ||||
| Most Recent Occupancy: | 97.7% (9/1/2024) | ||||||
| Reserves(1) | 2nd Most Recent Occupancy: | 99.0% (12/31/2023) | |||||
| Type | Initial | Monthly | Cap | 3rd Most Recent Occupancy(3): | NAV | ||
| RE Taxes: | $70,276 | $23,425 | NAP | Appraised Value (as of)(2)(4): | $105,055,000 (Various) | ||
| Insurance: | $8,050 | $8,050 | NAP | Appraised Value per Pad: | $109,205 | ||
| Replacement Reserve: | $0 | $4,008 | NAP | Cut-off Date LTV Ratio: | 67.1% | ||
| Deferred Maintenance: | $100,000 | $0 | NAP | Maturity Date LTV Ratio: | 67.1% | ||
| Sources and Uses | ||||||
| Sources | Proceeds | % of Total | Uses | Proceeds | % of Total | |
| Loan Amount: | $70,500,000 | 99.4% | Purchase Price(6): | $50,000,000 | 70.5% | |
| Other Sources(5): | $459,504 | 0.6% | Loan Payoff(7): | $16,357,827 | 23.1% | |
| Closing Costs: | $3,782,020 | 5.3% | ||||
| Return of Equity: | $641,331 | 0.9% | ||||
| Upfront Reserves: | $178,325 | 0.3% | ||||
| Total Sources: | $70,959,504 | 100.0% | Total Uses: | $70,959,504 | 100.0% | |
| (1) | See “Escrows and Reserves” below for further discussion. |
| (2) | See “Portfolio Summary” below. |
| (3) | Third Most Recent Occupancy and NOI figures are not available because two of the WAND MHC Portfolio Properties (as defined below) were acquired at origination of the WAND MHC Portfolio Mortgage Loan (as defined below). |
| (4) | The As-Is Appraisal Valuation Dates are between October 13, 2024 and October 15, 2024. |
| (5) | Other Sources include credits and prorations in relation to the acquisition of the two WAND MHC Portfolio Properties located in North Dakota. |
| (6) | Purchase Price relates to the two WAND MHC Portfolio Properties located in North Dakota, which were acquired at origination, and includes $7.5 million allocated to manufactured homes owned by the borrowers or their affiliates and located on such properties. Such manufactured homes are not collateral for the WAND MHC Portfolio Mortgage Loan. |
| (7) | Loan Payoff refers to refinance of a prior loan secured by the eight WAND MHC Portfolio Properties located in Washington. |
The Mortgage Loan. The fourth largest mortgage loan (the “WAND MHC Portfolio Mortgage Loan”) is secured by the borrowers’ fee interest in ten manufactured housing communities totaling 962 pads located in Washington and North Dakota (the “WAND MHC Portfolio Properties”). The WAND MHC Portfolio Mortgage Loan has a 5-year term, is interest-only for the full term and accrues interest at a rate of 6.2300% per annum on an actual/360 basis.
The Borrowers and the Borrower Sponsors. The borrowers are Cedrona Community LLC, Chinook Mobile Community LLC, Laurel Lane MHC LLC, Moxie Community LLC, Northwest Community LLC, Squilchuck Creek Community LLC, Sunrise Terrace Community LLC, Sun City Center and Community LLC, Holiday Village Community LLC and Jefferson Community LLC, each a Washington limited liability company and single purpose entity with one independent director in its organizational structure. The borrower sponsors and non-recourse carveout guarantors are Caleb Romack and Hurst & Son LLC. Caleb Romack is a principal of Hurst & Son LLC, a privately owned and operated real estate investment, property management and construction company that predominantly specializes in manufactured housing communities. Hurst & Son LLC’s portfolio includes 83 manufactured housing communities located in North Dakota, Montana, Oregon, Idaho, and Washington.
The Properties. The WAND MHC Portfolio Properties are comprised of ten manufactured housing communities totaling 962 pads located in Washington and North Dakota. At origination, proceeds from the WAND MHC Portfolio Mortgage Loan were used to acquire the two WAND MHC Portfolio Properties located in North Dakota (the “North Dakota Properties”) which total 559 pad sites accounting for 44.3% of underwritten net cash flow and to refinance the eight WAND MHC Portfolio Properties located in Washington which total 403 pad sites accounting for 55.7% of underwritten net cash flow. The WAND MHC Portfolio Properties were built between 1958 and 2005 and are situated on sites ranging from approximately 3.2 acres to 57.3 acres. The WAND
| THE INFORMATION IN THIS STRUCTURAL AND COLLATERAL TERM SHEET IS NOT COMPLETE AND MAY BE AMENDED PRIOR TO THE TIME OF SALE. THIS TERM SHEET IS NOT AN OFFER TO SELL THESE SECURITIES AND IT IS NOT A SOLICITATION OF AN OFFER TO BUY THESE SECURITIES IN ANY JURISDICTION WHERE THE OFFER OR SALE IS NOT PERMITTED. | ||
| 54 | ||
| Manufactured Housing – Manufactured Housing | Loan #4 | Cut-off Date Balance: | $70,500,000 | |
| Various | WAND MHC Portfolio | Cut-off Date LTV: | 67.1% | |
| Various | UW NCF DSCR: | 1.32x | ||
| UW NOI Debt Yield: | 8.4% |
MHC Portfolio Properties range in size from 37 pad sites to 287 pad sites, with monthly rents ranging from $566 to $989 per pad. As of September 1, 2024, the WAND MHC Portfolio Properties were 97.7% leased.
The North Dakota Properties include 336 pads (out of a total of 559 pads) on which manufactured homes owned by a borrower affiliate (“Owned Mobile Homes”) are located, which are master leased to such borrower affiliate (the “WAND MHC Master Tenant”),. Each of the related borrowers leases the pads occupied by the Owned Mobile Homes to the WAND MHC Master Tenant under a separate master lease (the “WAND MHC Master Leases”), and the WAND MHC Master Tenant leases the Owned Mobile Homes to the occupants of such Owned Mobile Homes. Pursuant to the WAND MHC Master Leases, the WAND MHC Master Tenant is required to pay the related borrower monthly rent at the prevailing rental rate charged by such borrower to other owners of manufactured homes within the applicable WAND MHC Portfolio Property. The WAND MHC Portfolio Mortgage Loan documents permit up to 40% of all manufactured housing units on the WAND MHC Portfolio Mortgaged Properties (in the aggregate) to be owned by the WAND MHC Master Tenant, the borrowers, or other affiliates, provided that such homes must be subject to one of the WAND MHC Master Leases. See “Description of the Mortgage Pool—Mortgage Pool Characteristics—Property Types—Manufactured Housing Properties” in the Preliminary Prospectus.
The following table presents detailed information with respect to the WAND MHC Portfolio Properties:
| Portfolio Summary | |||||||||||
Property Name |
City, State |
Year Built/Year Renovated(1) |
# of Pads(2) |
Occ.(2) |
Allocated Cut-off Date Loan Amounts | % of Allocated Cut-off Date Loan Amount |
UW NCF(2) |
% of UW NCF(2) |
UW NCF per Pad(2) |
Avg Monthly Rent per Pad(2) |
Appraised Value(1) |
| Jefferson Park MHC | Minot, ND | 1970 / NAP | 287(3) | 95.1% | $16,600,000 | 23.5% | $1,289,088 | 21.9% | $4,492 | $566 | $22,420,000 |
| Holiday Village MHC | Minot, ND | 1975 / 2011 | 272(3) | 97.4% | $15,000,000 | 21.3% | $1,323,537 | 22.5% | $4,866 | $580 | $20,210,000 |
| Cedrona Community | Lakewood, WA | 1961 / NAP | 54 | 98.1% | $6,650,000 | 9.4% | $479,563 | 8.1% | $8,881 | $875 | $9,575,000 |
| Sunrise Terrace Community | University Place, WA | 1962 / NAP | 55 | 100.0% | $6,250,000 | 8.9% | $540,640 | 9.2% | $9,830 | $989 | $10,750,000 |
| Moxie Community | Moxee, WA | 1970 / 1990 | 63 | 100.0% | $5,300,000 | 7.5% | $403,462 | 6.8% | $6,404 | $663 | $7,125,000 |
| Chinook Mobile Community | Kennewick, WA | 1978 / NAP | 62 | 100.0% | $4,950,000 | 7.0% | $460,506 | 7.8% | $7,428 | $723 | $8,400,000 |
| Laurel Lane MHC | Tacoma, WA | 1958 / NAP | 37 | 100.0% | $4,500,000 | 6.4% | $328,709 | 5.6% | $8,884 | $902 | $6,675,000 |
| Northwest Community | Tacoma, WA | 1965 / NAP | 53 | 100.0% | $3,900,000 | 5.5% | $487,717 | 8.3% | $9,202 | $930 | $9,525,000 |
| Squilchuck Creek Community | Wenatchee, WA | 2005 / NAP | 40 | 100.0% | $3,750,000 | 5.3% | $301,836 | 5.1% | $7,546 | $722 | $5,250,000 |
| Sun City Center and Community | Kennewick, WA | 1973 / NAP | 39 | 100.0% | $3,600,000 | 5.1% | $276,925 | 4.7% | $7,101 | $724 | $5,125,000 |
| Total/Wtd. Avg. | 962 | 97.7% | $70,500,000 | 100.0% | $5,891,982 | 100.0% | $6,125 | $712 | $105,055,000 | ||
| (1) | Source: Appraisals. |
| (2) | Based on the underwritten rent rolls dated September 1, 2024. |
| (3) | 141 pads at the Jefferson Park MHC property, and 195 pads at the Holiday Village MHC property, are leased to the WAND MHC Master Tenant pursuant to the applicable WAND MHC Master Lease. |
| THE INFORMATION IN THIS STRUCTURAL AND COLLATERAL TERM SHEET IS NOT COMPLETE AND MAY BE AMENDED PRIOR TO THE TIME OF SALE. THIS TERM SHEET IS NOT AN OFFER TO SELL THESE SECURITIES AND IT IS NOT A SOLICITATION OF AN OFFER TO BUY THESE SECURITIES IN ANY JURISDICTION WHERE THE OFFER OR SALE IS NOT PERMITTED. | ||
| 55 | ||
| Manufactured Housing – Manufactured Housing | Loan #4 | Cut-off Date Balance: | $70,500,000 | |
| Various | WAND MHC Portfolio | Cut-off Date LTV: | 67.1% | |
| Various | UW NCF DSCR: | 1.32x | ||
| UW NOI Debt Yield: | 8.4% |
The Market. The WAND MHC Portfolio Properties are located across four different metropolitan statistical areas (“MSA”) in Washington (Seattle-Tacoma-Bellevue (“Seattle”), Kennewick-Richland (“Kennewick”), Yakima and Wenatchee-East Wenatchee (“Wenatchee”)) and the Minot MSA of North Dakota.
The following table presents certain information relating to markets for the WAND MHC Portfolio Properties:
| Market Summary(1) | ||||||||||||
| MSA | # of Properties | # of Pads(2) | % of Total Pads(2) | Allocated Cut-off Date Loan Amount | % of Allocated Cut-off Date Loan Amount | Appraised Value | Underwritten NOI(2) | % of Underwritten NOI | Debt Yield (NOI) | LTV | ||
| Minot | 2 | 559 | 58.1 | % | $31,600,000 | 44.8% | $42,630,000 | $2,640,575 | 44.5 | % | 8.4% | 74.1% |
| Seattle | 4 | 199 | 20.7 | % | $21,300,000 | 30.2% | $36,525,000 | $1,846,579 | 31.1 | % | 8.7% | 58.3% |
| Kennewick | 2 | 101 | 10.5 | % | $8,550,000 | 12.1% | $13,525,000 | $742,481 | 12.5 | % | 8.7% | 63.2% |
| Yakima | 1 | 63 | 6.5 | % | $5,300,000 | 7.5% | $7,125,000 | $406,612 | 6.8 | % | 7.7% | 74.4% |
| Wenatchee | 1 | 40 | 4.2 | % | $3,750,000 | 5.3% | $5,250,000 | $303,836 | 5.1 | % | 8.1% | 71.4% |
| Total / Wtd. Avg. | 10 | 962 | 100.0 | % | $70,500,000 | 100.0% | $105,055,000 | $5,940,082 | 100.0 | % | 8.4% | 67.1% |
| (1) | Source: Appraisal unless indicated otherwise. |
| (2) | Based on the underwritten rent roll as of September 1, 2024. |
The following table presents certain information relating to demographics surrounding the WAND MHC Portfolio Properties:
| Demographic Summary(1) | |||||
| Population | Average Household Income | ||||
| Property Name | Location | 3-Mile | 5-Mile | 3-Mile | 5-Mile |
| Jefferson Park MHC | Minot, ND | 26,145 | 52,562 | $97,591 | $103,920 |
| Holiday Village MHC | Minot, ND | 28,606 | 52,702 | $97,238 | $104,162 |
| Cedrona Community | Lakewood, WA | 41,679 | 129,265 | $95,847 | $95,954 |
| Sunrise Terrace Community | University Place, WA | 102,044 | 245,622 | $111,804 | $109,132 |
| Moxie Community | Moxee, WA | 5,227 | 8,695 | $108,098 | $109,560 |
| Chinook Mobile Community | Kennewick, WA | 53,839 | 102,964 | $100,205 | $98,832 |
| Laurel Lane MHC | Tacoma, WA | 117,802 | 264,035 | $89,831 | $97,572 |
| Northwest Community | Tacoma, WA | 68,047 | 198,027 | $91,625 | $97,167 |
| Squilchuck Creek Community | Wenatchee, WA | 49,012 | 74,659 | $98,799 | $108,236 |
| Sun City Center and Community | Kennewick, WA | 79,026 | 179,742 | $104,572 | $112,028 |
| Wtd. Avg. (based on UW NOI) | 47,845 | 108,290 | $99,059 | $103,484 | |
| (1) | Source: Appraisal. |
Appraisal. According to the appraisals dated from October 13, 2024 to October 15, 2024, the WAND MHC Portfolio Properties had an aggregate “as is” appraised value of $105,055,000 which results in a Cut-off Date LTV and Maturity Date LTV of 67.1%.
Environmental Matters. According to the Phase I environmental reports dated between October 28, 2024 and October 30, 2024, there was a recognized environmental condition at the Laurel Lane MHC property related to impacts to groundwater from perfluoroalkyl and polyfluoroalkyl substances identified in the property’s potable water well. See “Description of the Mortgage Pool—Environmental Considerations” in the Preliminary Prospectus.
| THE INFORMATION IN THIS STRUCTURAL AND COLLATERAL TERM SHEET IS NOT COMPLETE AND MAY BE AMENDED PRIOR TO THE TIME OF SALE. THIS TERM SHEET IS NOT AN OFFER TO SELL THESE SECURITIES AND IT IS NOT A SOLICITATION OF AN OFFER TO BUY THESE SECURITIES IN ANY JURISDICTION WHERE THE OFFER OR SALE IS NOT PERMITTED. | ||
| 56 | ||
| Manufactured Housing – Manufactured Housing | Loan #4 | Cut-off Date Balance: | $70,500,000 | |
| Various | WAND MHC Portfolio | Cut-off Date LTV: | 67.1% | |
| Various | UW NCF DSCR: | 1.32x | ||
| UW NOI Debt Yield: | 8.4% |
Operating History and Underwritten Net Cash Flow. The following table presents certain information relating to the operating history and underwritten net cash flow at the WAND MHC Portfolio Properties:
| Cash Flow Analysis(1) | ||||
| 2023 | TTM 9/30/2024 | U/W(2) | U/W $ per Pad | |
| Base Rent | $7,670,275 | $7,594,495 | $7,776,468 | $8,084 |
| Potential Income from Vacant Units | $0 | $0 | $160,800 | $167 |
| Gross Potential Rent | $7,670,275 | $7,594,495 | $7,937,268 | $8,251 |
| Other Income(3) | $25,657 | $559,191 | $559,191 | $581 |
| Net Rental Income | $7,695,932 | $8,153,686 | $8,496,459 | $8,832 |
| (Vacancy) | ($81,960) | ($94,580) | ($415,084) | ($431) |
| Effective Gross Income | $7,613,973 | $8,059,106 | $8,081,375 | $8,401 |
| Real Estate Taxes | $423,848 | $458,922 | $493,368 | $513 |
| Insurance | $111,358 | $98,811 | $91,988 | $96 |
| Management Fee | $228,419 | $241,773 | $242,441 | $252 |
| Other Expenses(4) | $1,398,925 | $1,323,877 | $1,313,495 | $1,365 |
| Total Expenses | $2,162,550 | $2,123,384 | $2,141,292 | $2,226 |
| Net Operating Income | $5,451,422 | $5,935,722 | $5,940,082 | $6,175 |
| Replacement Reserves | $0 | $0 | $48,100 | $50 |
| TI/LC | $0 | $0 | $0 | $0 |
| Net Cash Flow | $5,451,422 | $5,935,722 | $5,891,982 | $6,125 |
| Occupancy | 99.0% | 98.5% | 95.0%(5) | |
| NOI DSCR | 1.22x | 1.33x | 1.33x | |
| NCF DSCR | 1.22x | 1.33x | 1.32x | |
| NOI Debt Yield | 7.7% | 8.4% | 8.4% | |
| NCF Debt Yield | 7.7% | 8.4% | 8.4% | |
| (1) | Historical financial information prior to 2023 is not available because two of the WAND MHC Portfolio Properties were acquired at origination of the WAND MHC Portfolio Mortgage Loan. |
| (2) | Based on the underwritten rent roll as of September 1, 2024. |
| (3) | Other Income includes recreational vehicle income as well as income from the properties’ RUBS program (Ratio Utility Billing System), whereby a portion of the utility expense is shared by tenants and reimbursed to the landlord on a pro rata basis. |
| (4) | Other Expenses include payroll and benefits, repairs and maintenance, utilities, general and administrative expenses and all other miscellaneous expenses. |
| (5) | Represents economic occupancy. |
Escrows and Reserves. At origination of the WAND MHC Portfolio Mortgage Loan, the borrowers deposited approximately (i) $70,276 into a real estate tax reserve account, (ii) $8,050 into an insurance reserve; and (iii) $100,000 into an immediate repairs reserve.
Real Estate Taxes – On each monthly payment date, the borrowers are required to deposit an amount equal to 1/12th of the real estate taxes that the lender estimates will be payable during the next 12 months into the real estate tax reserve account (initially estimated to be approximately $23,425).
Insurance – On each monthly payment date, the borrowers are required to deposit into the insurance reserve, 1/12th of the amount which will be sufficient to pay the insurance premiums due for the renewal of coverage afforded by such policies (initially estimated to be approximately $8,050).
Replacement Reserve – On each monthly payment date, the borrowers are required to deposit $4,008 into a replacement reserve account.
Lockbox and Cash Management. The WAND MHC Portfolio Mortgage Loan is structured with a springing lockbox and springing cash management. Upon the first occurrence of a Trigger Period (as defined below), the borrowers are required to establish a lender-controlled lockbox account, and are thereafter required to deposit, or cause the property manager to deposit, immediately upon receipt, all revenue generated by the WAND MHC Portfolio Properties into such lender-controlled lockbox account. Within five days after the first occurrence of a Trigger Period, the borrowers are required to deliver a notice to all tenants directing them to remit all payments into the lender-controlled lockbox account. All funds deposited into the lockbox account are required to be transferred on each business day to or at the direction of the borrowers unless a Trigger Period exists and the lender elects (in its sole and absolute discretion) to deliver a restricted account notice, in which case all funds in the lockbox account are required to be swept on each business day to a lender-controlled cash management account to be applied and disbursed in accordance with the WAND MHC Portfolio Mortgage Loan documents, and all excess cash flow funds remaining in the cash management account after the application of such funds in accordance with the WAND MHC Portfolio Mortgage Loan documents are required to be held by the lender in an excess cash flow reserve account as additional collateral for the WAND MHC Portfolio Mortgage Loan. Upon the cure of the applicable Trigger Period, so long as no other Trigger Period exists, the lender is required to return any amounts remaining on deposit in the excess cash flow reserve account to the borrowers. Upon an event of default under the WAND MHC Portfolio Mortgage Loan documents, the lender may apply funds to the debt in such priority as it may determine.
“Trigger Period” means a period (A) commencing upon the earliest of (i) the occurrence and continuance of an event of default under the WAND MHC Portfolio Mortgage Loan documents, and (ii) the debt service coverage ratio being less than 1.15x (unless the Collateral Cure Conditions (as defined below) are satisfied); and (B) expiring upon (x) with regard to clause (i) above, the cure (if applicable) of such event of default under the WAND MHC
| THE INFORMATION IN THIS STRUCTURAL AND COLLATERAL TERM SHEET IS NOT COMPLETE AND MAY BE AMENDED PRIOR TO THE TIME OF SALE. THIS TERM SHEET IS NOT AN OFFER TO SELL THESE SECURITIES AND IT IS NOT A SOLICITATION OF AN OFFER TO BUY THESE SECURITIES IN ANY JURISDICTION WHERE THE OFFER OR SALE IS NOT PERMITTED. | ||
| 57 | ||
| Manufactured Housing – Manufactured Housing | Loan #4 | Cut-off Date Balance: | $70,500,000 | |
| Various | WAND MHC Portfolio | Cut-off Date LTV: | 67.1% | |
| Various | UW NCF DSCR: | 1.32x | ||
| UW NOI Debt Yield: | 8.4% |
Portfolio Mortgage Loan documents, and (y) with regard to clause (ii) above, the date that the debt service coverage ratio is equal to or greater than 1.20x for two consecutive calendar quarters.
“Collateral Cure Conditions” exist if and for so long as the borrowers deposit cash into an account with the lender or deliver a letter of credit to the lender to serve as additional collateral for the WAND MHC Portfolio Mortgage Loan in an amount equal to the Collateral Deposit Amount (as defined below) and, thereafter, on each date occurring one year after the date that the borrowers made the most recent such deposit (or delivered a letter of credit), the borrowers deposit any additional cash collateral in the amount of the Collateral Deposit Amount or increase the letter of credit by an amount equal to the Collateral Deposit Amount, as applicable. Such amounts will be returned to the borrowers, provided that no event of default is ongoing, at such time as the Trigger Period that the Collateral Cure Conditions relate to would have been cured had the borrowers not satisfied the Collateral Cure Conditions.
“Collateral Deposit Amount” means the amount of funds which, if the outstanding principal balance of the WAND MHC Portfolio Mortgage Loan were reduced thereby, would cause the debt service coverage ratio to equal 1.20x.
Property Management. The WAND MHC Portfolio Properties are managed by Hurst & Son LLC, a borrower-affiliated property manager.
Release of Collateral. At any time after the second anniversary of the closing date of the WFCM 2025-5C3 securitization, the borrowers may obtain the release of one or more of the individual WAND MHC Portfolio Properties, in each case, provided that, among other conditions, (i) the borrowers defease an amount of the WAND MHC Portfolio Mortgage Loan equal to the greater of (a) 125% of the allocated loan amount for the applicable individual WAND MHC Portfolio Properties, and (b) 100% of the net sales proceeds of such individual WAND MHC Portfolio Properties, (ii) the borrowers deliver a REMIC opinion, (iii) after giving effect to the release, the debt service coverage ratio with respect to the remaining WAND MHC Portfolio Properties is equal to or greater than the greater of (a) 1.34x, and (b) the debt service coverage ratio of all of the WAND MHC Portfolio Properties immediately prior to the release, (iv) after giving effect to the release, the loan-to-value ratio with respect to the remaining WAND MHC Portfolio Properties is no greater than the lesser of (a) 67.5% and (b) the loan-to-value ratio for all of the WAND MHC Portfolio Properties immediately prior to the release, and (v) after giving effect to the release, the debt yield with respect to the remaining WAND MHC Portfolio Properties is greater than the greater of (a) 8.35% and (b) the debt yield with respect to all of the WAND MHC Portfolio Properties immediately prior to the release.
Real Estate Substitution. Not permitted.
Subordinate and Mezzanine Indebtedness. None.
Future Subordinate or Mezzanine Indebtedness. Not permitted.
Letter of Credit. None.
Right of First Offer/Right of First Refusal. None.
Ground Lease. None.
Terrorism Insurance. The borrowers are required to maintain or cause to be maintained an “all-risk” insurance policy that provides coverage for terrorism in an amount equal to the full replacement cost of the WAND MHC Portfolio Properties and business interruption insurance that includes coverage for terrorism for a period of 18 months and containing an extended period of indemnity for up to six months. See “Risk Factors—Risks Relating to the Mortgage Loans—Terrorism Insurance May Not Be Available for All Mortgaged Properties” in the Preliminary Prospectus.
| THE INFORMATION IN THIS STRUCTURAL AND COLLATERAL TERM SHEET IS NOT COMPLETE AND MAY BE AMENDED PRIOR TO THE TIME OF SALE. THIS TERM SHEET IS NOT AN OFFER TO SELL THESE SECURITIES AND IT IS NOT A SOLICITATION OF AN OFFER TO BUY THESE SECURITIES IN ANY JURISDICTION WHERE THE OFFER OR SALE IS NOT PERMITTED. | ||
| 58 | ||
| Hospitality – Full Service | Loan #5 | Cut-off Date Balance: | $54,500,000 | |
| 300 and 301 Australian Avenue | The Brazilian Court Hotel | Cut-off Date LTV: | 50.5% | |
| Palm Beach, FL 33480 | UW NCF DSCR: | 1.58x | ||
| UW NOI Debt Yield: | 13.1% |
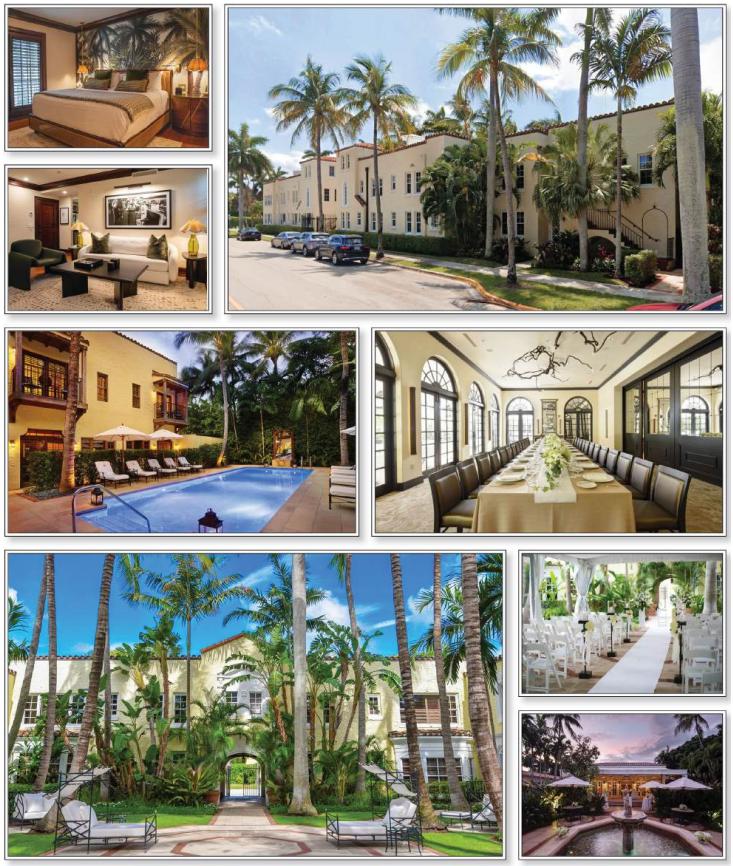
| THE INFORMATION IN THIS STRUCTURAL AND COLLATERAL TERM SHEET IS NOT COMPLETE AND MAY BE AMENDED PRIOR TO THE TIME OF SALE. THIS TERM SHEET IS NOT AN OFFER TO SELL THESE SECURITIES AND IT IS NOT A SOLICITATION OF AN OFFER TO BUY THESE SECURITIES IN ANY JURISDICTION WHERE THE OFFER OR SALE IS NOT PERMITTED. | ||
| 59 | ||
| Hospitality – Full Service | Loan #5 | Cut-off Date Balance: | $54,500,000 | |
| 300 and 301 Australian Avenue | The Brazilian Court Hotel | Cut-off Date LTV: | 50.5% | |
| Palm Beach, FL 33480 | UW NCF DSCR: | 1.58x | ||
| UW NOI Debt Yield: | 13.1% |
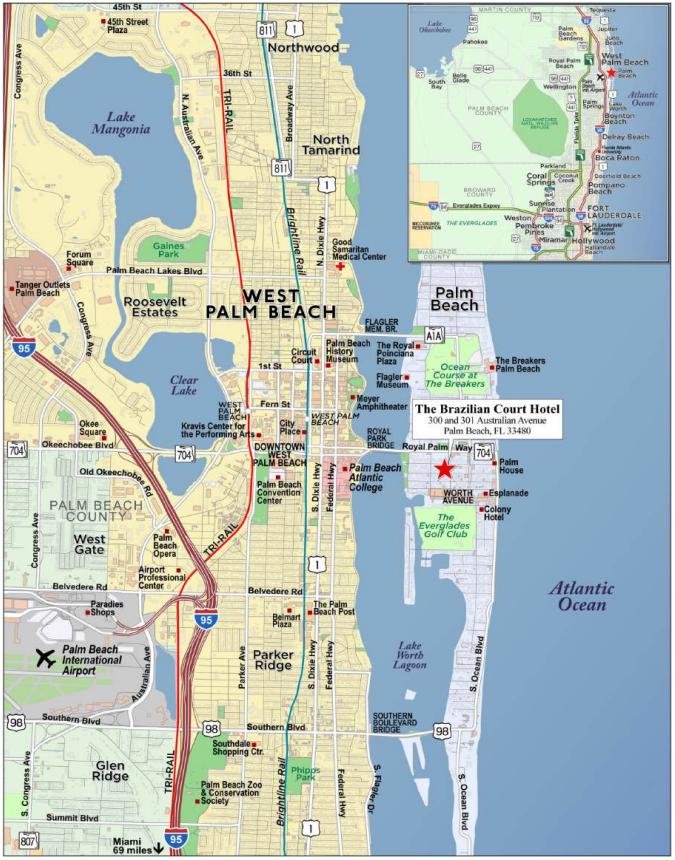
| THE INFORMATION IN THIS STRUCTURAL AND COLLATERAL TERM SHEET IS NOT COMPLETE AND MAY BE AMENDED PRIOR TO THE TIME OF SALE. THIS TERM SHEET IS NOT AN OFFER TO SELL THESE SECURITIES AND IT IS NOT A SOLICITATION OF AN OFFER TO BUY THESE SECURITIES IN ANY JURISDICTION WHERE THE OFFER OR SALE IS NOT PERMITTED. | ||
| 60 | ||
| Mortgage Loan No. 5 – The Brazilian Court Hotel |
| Mortgage Loan Information | Property Information | |||||
| Mortgage Loan Seller: | CREFI, AREF2 | Single Asset/Portfolio: | Single Asset | |||
| Credit Assessment (Fitch/Moody’s/KBRA): | NR/NR/NR | Location: | Palm Beach, FL | |||
| Original Balance: | $54,500,000 | General Property Type: | Hospitality | |||
| Cut-off Date Balance: | $54,500,000 | Detailed Property Type: | Full Service | |||
| % of Initial Pool Balance: | 6.5% | Title Vesting: | Fee | |||
| Loan Purpose: | Refinance | Year Built/Renovated: | 1926/2019-2024 | |||
| Borrower Sponsor: | Robert Schlesinger | Size(2): | 75 Rooms | |||
| Guarantor: | Robert Schlesinger | Cut-off Date Balance per Room: | $726,667 | |||
| Mortgage Rate: | 7.5000% | Maturity Date Balance per Room: | $726,667 | |||
| Note Date: | 12/6/2024 | Property Manager: | Obadon Hotels, LLC (borrower affiliated) | |||
| Maturity Date: | 12/6/2029 | |||||
| Term to Maturity: | 60 months | Underwriting and Financial Information | ||||
| Amortization Term: | 0 months | UW NOI: | $7,145,004 | |||
| IO Period: | 60 months | UW NCF: | $6,554,501 | |||
| Seasoning: | 1 month | UW NOI Debt Yield: | 13.1% | |||
| Prepayment Provisions: | L(25),D(28),O(7) | UW NCF Debt Yield: | 12.0% | |||
| Lockbox/Cash Mgmt Status: | Hard/Springing | UW NOI Debt Yield at Maturity: | 13.1% | |||
| Additional Debt Type: | No | UW NCF DSCR: | 1.58x | |||
| Additional Debt Balance: | NAP | Most Recent NOI: | $7,306,814 (11/30/2024 TTM) | |||
| Future Debt Permitted (Type): | No (NAP) | 2nd Most Recent NOI(3): | $7,963,812 (12/31/2023) | |||
| 3rd Most Recent NOI(3): | $10,013,338 (12/31/2022) | |||||
| Escrows and Reserves(1) | Most Recent Occupancy: | 49.3% (11/30/2024) | ||||
| Type | Initial | Monthly | Cap | 2nd Most Recent Occupancy: | 52.5% (12/31/2023) | |
| RE Taxes: | $139,098 | $69,549 | NAP | 3rd Most Recent Occupancy: | 52.3% (12/31/2022) | |
| Insurance: | $582,490 | $76,680 | NAP | Appraised Value (as of): | $108,000,000 (10/31/2024) | |
| FF&E Reserve: | $0 | $47,686 | NAP | Appraised Value per Room: | $1,440,000 | |
| Seasonality Reserve: | $373,422 | Springing | NAP | Cut-off Date LTV Ratio: | 50.5% | |
| Maturity Date LTV Ratio: | 50.5% | |||||
| Sources and Uses | ||||||
| Sources | Proceeds | % of Total | Uses | Proceeds | % of Total | |
| Original Loan Amount: | $54,500,000 | 100.0% | Loan Payoff: | $34,267,927 | 62.9% | |
| Sponsor Equity: | $17,426,856 | 32.0% | ||||
| Closing Costs: | $1,710,208 | 3.1% | ||||
| Upfront Reserves: | $1,095,010 | 2.0% | ||||
| Total Sources: | $54,500,000 | 100.0% | Total Uses: | $54,500,000 | 100.0% | |
| (1) | See “Escrows and Reserves” section below for further discussion. |
| (2) | The Brazilian Court Hotel Property (as defined below) is comprised of a borrower-owned hotel condominium unit comprised primarily of certain common elements, two borrower-owned commercial condominium units, and 62 borrower-owned residential condominium units that operate as 75 hotel rooms through the use of lockout units. The related condominium includes 80 residential condominium units, of which 62 are owned by the borrower (as described above) and 18 are third-party owned. Of the third-party owned residential units, nine are part of the hotel’s rental program (subject to the owner’s right to occupy such units at certain times) and as such are operated by the borrower as hotel rooms, with income from such rentals allocated from 50% to the third-party owners and 50% to the borrower under rental program agreements in effect at origination. |
| (3) | The decrease from 3rd Most Recent NOI to 2nd Most Recent NOI is primarily attributable to eight units going offline between 2022 and 2023. |
The Mortgage Loan. The fifth largest mortgage loan (the “Brazilian Court Hotel Mortgage Loan”) is evidenced by two promissory notes with an aggregate original principal balance of $54,500,000 and secured by the fee interest in a full-service hotel located in Palm Beach, Florida comprised of a hotel condominium unit, two commercial condominium units and 62 residential condominium units operated as up to 75 hotel rooms through the use of lockout units (the “Brazilian Court Hotel Property”). CREFI is contributing Note A-1, in the original principal amount of $40,875,000, and AREF2 is contributing Note A-2, in the original principal amount of $13,625,000, which it is purchasing from CREFI.
The Borrower and the Borrower Sponsor. The borrower is CSC Brazilian, L.P., a single-purpose, Delaware limited partnership with two independent directors in its organizational structure. Legal counsel to the borrower delivered a non-consolidation opinion in connection with the origination of the Brazilian Court Hotel Mortgage Loan.
The borrower sponsor and non-recourse guarantor is Robert Schlesinger of Copperline Partners (“Copperline”). Copperline is a fully integrated multifamily and hospitality-focused real estate investment company with a core portfolio located in the East Coast of the United States. Copperline has 50 years of experience and has a portfolio of 21,876 units. Robert Schlesinger serves as a managing principal and the managing investment partner of Copperline.
The Property. The Brazilian Court Hotel Property is a two and three-story full-service hotel located in Palm Beach, Florida, one block south of Royal Palm Way and 0.3-miles west of the beach and Atlantic Ocean. The Brazilian Court Hotel Property was originally constructed in 1926 and was recently renovated from 2019 to 2024, with over $7.8 million of capital expenditures completed since 2019 ($104,000 per room). These expenditures funded renovations and/or updates to the pool bar and deck, lobby and front desk, retail store, and salon, all owned hotel room units, new windows, and sections of the roof. The Brazilian Court Hotel Property is an independent hotel that consists primarily of condominium units in a condominium (the “Brazilian Court
| THE INFORMATION IN THIS STRUCTURAL AND COLLATERAL TERM SHEET IS NOT COMPLETE AND MAY BE AMENDED PRIOR TO THE TIME OF SALE. THIS TERM SHEET IS NOT AN OFFER TO SELL THESE SECURITIES AND IT IS NOT A SOLICITATION OF AN OFFER TO BUY THESE SECURITIES IN ANY JURISDICTION WHERE THE OFFER OR SALE IS NOT PERMITTED. | ||
| 61 | ||
| Hospitality – Full Service | Loan #5 | Cut-off Date Balance: | $54,500,000 | |
| 300 and 301 Australian Avenue | The Brazilian Court Hotel | Cut-off Date LTV: | 50.5% | |
| Palm Beach, FL 33480 | UW NCF DSCR: | 1.58x | ||
| UW NOI Debt Yield: | 13.1% |
Condominium”). The Brazilian Court Condominium includes a borrower-owned hotel condominium unit which is comprised primarily of shared components, including but not limited to structural components, the pool, lobby, loading dock and similar areas, two borrower-owned commercial condominium units, and 80 residential condominium units, of which 62 are owned by the borrower, operated as up to 75 hotel rooms through the use of lockout units, and included in the Brazilian Court Hotel Property and 18 are third-party owned. Of the third-party owned residential units, nine are part of the hotel’s rental program (subject to the owner’s right to occupy such units at certain times) and as such are operated by the borrower as hotel rooms, with income from such rentals allocated 50% to the third-party owners and 50% to the borrower under rental program agreements in effect at origination. Owners of the third-party owned residential condominium units may withdraw their units from the hotel’s rental program, and accordingly the number of such units that are available as hotel rooms may fluctuate year over year. The two borrower-owned commercial condominium units of the Brazilian Court Condominium are occupied by Café Boulud and the Brazilian Court Salon. Café Boulud is a French American restaurant created by Chef Daniel Boulud and his culinary team, and operated by a third-party operator, which has been at the Brazilian Court Hotel Property since 2003. The Brazilian Court Salon is owned and operated by the borrower and provides poolside treatment rooms for hair treatments, nail care, massages, and other spa treatments with the perk of being able to order lunch or cocktails from its service chairs. The borrower has the power to exercise 92 out of the 110 votes of the members of the condominium association of the Brazilian Court Condominium. The condominium board consists of three members, which are generally elected by a plurality of votes in an election in which at least 20% of eligible voters participate.
Amenities at the Brazilian Court Hotel Property include approximately 3,190 square feet of meeting space, an outdoor pool, a hot tub, a fitness center, complimentary beach transportation, a game room, golf cart service, a retail boutique, complimentary bicycles, private courtyards, hotel car service, a 24-hour concierge, 92 onsite surface parking spaces, and complimentary Wi-Fi. Additionally, the Brazilian Court Hotel Property operates its own 44 foot yacht, BC One, exclusively for hotel guests with complimentary trips available daily and private group excursion packages also available. The Brazilian Court Hotel Property guestroom configuration consists of studio, one-, two-, and three-bedroom units. The guestrooms feature in-room iPad control systems, marble baths with jetted tubs and walk-in showers, twice daily maid service, same day laundry, garment pressing and dry-cleaning service, minibars, plush bedding, central air conditioning and complimentary newspapers.
The following table presents historical occupancy, ADR, and RevPAR penetration rates of the Brazilian Court Hotel Property:
| Historical Occupancy, ADR, RevPAR(1) | |||||||||||||
| The Brazilian Court Hotel Property(2) | Competitive Set(3) | Penetration Factor(4) | |||||||||||
| Year | Occupancy | ADR | RevPAR | Occupancy | ADR | RevPAR | Occupancy | ADR | RevPAR | ||||
| 12/31/2021 | 57.0% | $770.47 | $438.99 | 45.0% | $898.00 | $401.00 | 126.6% | 85.8% | 109.5% | ||||
| 12/31/2022 | 52.3% | $959.25 | $501.94 | 51.0% | $961.00 | $486.00 | 102.6% | 99.8% | 103.3% | ||||
| 12/31/2023 | 52.5% | $899.97 | $472.04 | 51.0% | $930.00 | $472.00 | 102.8% | 96.8% | 100.0% | ||||
Source: Third-party research report.
| (1) | Variances between the underwriting, the appraisal and the above table with respect to Occupancy, ADR and RevPAR at the Brazilian Court Hotel Property are attributable to variances in reporting methodologies and/or timing differences. |
| (2) | Occupancy, ADR and RevPAR for the Brazilian Court Hotel Property are based on the operating statements provided by the borrower. |
| (3) | Occupancy, ADR and RevPAR for the Competitive Set are based on data provided by the appraisal. The Competitive Set includes Eau Palm Beach Resort & Spa, Four Seasons Resort Palm Beach, The Colony Hotel, Tideline Palm Beach Ocean Resort and Spa, and White Elephant Palm Beach. |
| (4) | Penetration Factor is calculated based on the operating statements provided by the borrower and competitive set data provided by the appraisal. |
The Market. The Brazilian Court Hotel Property is located in Palm Beach, Florida at the southwest corner of Australian Avenue and Hibiscus Avenue. The Brazilian Court Hotel Property is located approximately 0.3 miles west of the beach and three blocks north of the Worth Avenue shopping and dining district. Palm Beach is a popular tourism destination and experienced a record 9.48 million visitors during 2023. Demand drivers include access to beaches, arts and culture, golf, and upscale shopping and dining experiences. The Brazilian Court Hotel Property’s 2023 demand segmentation was 90% transient and 10% group. The group demand segment includes both corporate and social groups (such as weddings, family gatherings, sports team and religious gatherings). While the corporate group demand typically occurs midweek, the social group demand mostly occurs on the weekends.
The following table presents the primary competitive properties to the Brazilian Court Hotel Property:
| Competitive Property Summary(1) | |||||||
| Property | Year Built | Rooms | Transient | Group | Estimated 2023 Occupancy | Estimated 2023 ADR | Estimated 2023 RevPAR |
| The Brazilian Court Hotel(2) | 1926 | 75 | 90% | 10% | 52.5% | $899.97 | $472.04 |
| Eau Palm Beach Resort & Spa | 1991 | 309 | 70% | 30% | 55%-60% | $1,000-$1,005 | $560-$565 |
| Four Seasons Resort Palm Beach | 1989 | 207 | 70% | 30% | 55%-60% | $1,210-$1,215 | $690-$695 |
| The Colony Hotel | 1947 | 93 | 90% | 10% | 30%-35% | $650-$655 | $215-$220 |
| Tideline Palm Beach Ocean Resort and Spa | 1980 | 134 | 80% | 20% | 40%-45% | $360-$365 | $160-$165 |
| White Elephant Palm Beach | 1923 | 32 | 90% | 10% | 40%-45% | $650-$655 | $260-$265 |
| Subtotal/Average(3) | 775 | 75% | 25% | 51% | $930 | $472 | |
Source: Appraisal
| (1) | The variances between the underwriting, the appraisal and industry report data with respect to occupancy, ADR and RevPAR at the Brazilian Court Hotel Property are attributable in part to variances in reporting methodologies and/or timing differences. |
| (2) | Occupancy, ADR and RevPAR for the Brazilian Court Hotel Property are based on operating statements provided by the borrower dated as of December 31, 2023. |
| (3) | Subtotal/Average does not include the subject property. |
Appraisal. The appraisal concluded to an “as-is” value for the Brazilian Court Hotel Property of $108,000,000 as of October 31, 2024.
Environmental Matters. According to the Phase I environmental site assessment dated November 11, 2024, there was no evidence of any recognized environmental conditions at the Brazilian Court Hotel Property.
| THE INFORMATION IN THIS STRUCTURAL AND COLLATERAL TERM SHEET IS NOT COMPLETE AND MAY BE AMENDED PRIOR TO THE TIME OF SALE. THIS TERM SHEET IS NOT AN OFFER TO SELL THESE SECURITIES AND IT IS NOT A SOLICITATION OF AN OFFER TO BUY THESE SECURITIES IN ANY JURISDICTION WHERE THE OFFER OR SALE IS NOT PERMITTED. | ||
| 62 | ||
| Hospitality – Full Service | Loan #5 | Cut-off Date Balance: | $54,500,000 | |
| 300 and 301 Australian Avenue | The Brazilian Court Hotel | Cut-off Date LTV: | 50.5% | |
| Palm Beach, FL 33480 | UW NCF DSCR: | 1.58x | ||
| UW NOI Debt Yield: | 13.1% |
Operating History and Underwritten Net Cash Flow. The following table presents certain information relating to the historical operating performance and underwritten net cash flow at the Brazilian Court Hotel Property:
| Cash Flow Analysis | |||||||
| 2020(1) | 2021(1) | 2022(1) | 2023(1) | 11/30/2024 TTM | UW | UW per Room(2) | |
| Occupancy(3) | 41.0% | 57.0% | 52.3% | 52.5% | 49.3% | 49.3% | |
| ADR(3) | $547.15 | $770.47 | $959.25 | $899.97 | $912.40 | $912.40 | |
| RevPAR(3) | $224.44 | $438.99 | $501.94 | $472.04 | $450.09 | $450.09 | |
| Room Revenue | $7,030,385 | $13,123,459 | $15,167,654 | $12,857,888 | $12,328,340 | $12,321,138 | $164,282 |
| Gross Income from Third Party Units(4) | $546,448 | $535,220 | $551,461 | $564,318 | $527,756 | $527,448 | $7,033 |
| Other Departmental Income(5) | $2,227,585 | $2,491,953 | $2,965,892 | $2,654,749 | $2,665,122 | $2,663,566 | $35,514 |
| Total Revenue | $9,804,418 | $16,150,632 | $18,685,007 | $16,076,955 | $15,521,218 | $15,512,152 | $206,829 |
| Rooms Expense | $1,833,374 | $2,326,000 | $2,781,637 | $2,692,121 | $2,836,944 | $2,835,287 | $37,804 |
| Other Departmental Expenses | $0 | $0 | $0 | $0 | $0 | $0 | $0 |
| Total Departmental Expenses | $1,833,374 | $2,326,000 | $2,781,637 | $2,692,121 | $2,836,944 | $2,835,287 | $37,804 |
| Departmental Profit | $7,971,044 | $13,824,632 | $15,903,370 | $13,384,834 | $12,684,274 | $12,676,864 | $169,025 |
| Management Fee | $277,739 | $468,462 | $544,006 | $465,379 | $449,804 | $449,541 | $5,994 |
| Marketing and Franchise Fee | $709,598 | $902,154 | $910,735 | $836,378 | $708,696 | $708,282 | $9,444 |
| Other Undistributed Expenses(6) | $1,813,911 | $2,196,955 | $2,723,455 | $2,498,550 | $2,492,062 | $2,490,606 | $33,208 |
| Total Undistributed Expenses | $2,801,248 | $3,567,571 | $4,178,196 | $3,800,307 | $3,650,562 | $3,648,430 | $48,646 |
| Real Estate Taxes | $625,324 | $625,839 | $702,443 | $741,581 | $788,625 | $784,980 | $10,466 |
| Insurance | $353,830 | $408,657 | $483,616 | $522,650 | $716,163 | $876,341 | $11,685 |
| Distribution of Rent Share to Third- Party Unit Owners(7) | $334,088 | $635,566 | $525,777 | $356,484 | $222,110 | $222,110 | $2,961 |
| Total Expenses | $1,313,242 | $1,670,062 | $1,711,836 | $1,620,715 | $1,726,898 | $1,883,430 | $25,112 |
| Net Operating Income | $3,856,554 | $8,586,999 | $10,013,338 | $7,963,812 | $7,306,814 | $7,145,004 | $95,267 |
| FF&E | $356,955 | $599,194 | $704,311 | $606,246 | $590,854 | $590,504 | $7,873 |
| Net Cash Flow | $3,499,598 | $7,987,805 | $9,309,027 | $7,357,566 | $6,715,960 | $6,554,501 | $87,393 |
| NOI DSCR | 0.93x | 2.07x | 2.42x | 1.92x | 1.76x | 1.72x | |
| NCF DSCR | 0.84x | 1.93x | 2.25x | 1.78x | 1.62x | 1.58x | |
| NOI Debt Yield | 7.1% | 15.8% | 18.4% | 14.6% | 13.4% | 13.1% | |
| NCF Debt Yield | 6.4% | 14.7% | 17.1% | 13.5% | 12.3% | 12.0% | |
| (1) | The increases in Net Operating Income from 2020 to 2022 are primarily attributable to the recovery from the Covid-19 pandemic. Decrease in NOI from 2022 to 2023 is primarily attributable to eight units going offline between 2022 and 2023 bringing the total room count from 83 keys to 75 keys. |
| (2) | UW per Room is based on 75 rooms. |
| (3) | The variances between the underwriting, the appraisal, and the industry report data with respect to Occupancy, ADR and RevPAR at the Brazilian Court Hotel Property are attributable in part to variances in reporting methodologies and/or timing differences. |
| (4) | Represents gross rent from residential condominium units owned by third parties, and rented out by the borrower as hotel rooms pursuant to rental agreements pursuant to which the rent from such units is divided between the borrower and the owners of such third-party units. The distribution to the third-party owners of such units is shown under the “Distribution of Rent Share to Third-Party Unit Owners” in the table above. |
| (5) | Other Departmental Income consists of revenue associated with the mini-bar, telephone, beauty salon, Café Boulud, rental and other income. |
| (6) | Other Undistributed Expenses consists of heat, power and light, operations and maintenance and administrative and general expenses. |
| (7) | Distribution of rental share to third-party unit owners consists of revenue that is distributed to the third-party owners of residential condominium units that participate in the hotel’s rental unit program pursuant to rental program agreements net of the condominium fees owed to the borrower as an operator of the condominium. |
Escrows and Reserves. At origination of the Brazilian Court Hotel Mortgage Loan, the borrower deposited approximately (i) $139,098 into a real estate tax reserve, (ii) $582,490 into an insurance reserve and (iii) $373,422 into a seasonality reserve.
Real Estate Taxes – The loan documents require ongoing monthly deposits into the real estate tax reserve equal to 1/12th of the taxes that the lender reasonably estimates will be payable over the next-ensuing 12-month period (initially estimated to be approximately $69,549).
Insurance – The loan documents require at the option of the lender, if the liability or casualty policies maintained by the borrower do not constitute an approved blanket or umbrella policy, or the lender requires a separate policy, ongoing monthly deposits into the insurance reserve equal to 1/12th of the amount which would be sufficient to pay the insurance premiums due for the renewal of coverage afforded by the insurance policies (initially estimated to be approximately $76,680).
| THE INFORMATION IN THIS STRUCTURAL AND COLLATERAL TERM SHEET IS NOT COMPLETE AND MAY BE AMENDED PRIOR TO THE TIME OF SALE. THIS TERM SHEET IS NOT AN OFFER TO SELL THESE SECURITIES AND IT IS NOT A SOLICITATION OF AN OFFER TO BUY THESE SECURITIES IN ANY JURISDICTION WHERE THE OFFER OR SALE IS NOT PERMITTED. | ||
| 63 | ||
| Hospitality – Full Service | Loan #5 | Cut-off Date Balance: | $54,500,000 | |
| 300 and 301 Australian Avenue | The Brazilian Court Hotel | Cut-off Date LTV: | 50.5% | |
| Palm Beach, FL 33480 | UW NCF DSCR: | 1.58x | ||
| UW NOI Debt Yield: | 13.1% |
FF&E Reserve – The loan documents require ongoing monthly deposits into a furniture, fixtures and equipment (“FF&E”) reserve, in an amount equal to the greater of (i) the FF&E Payment (as defined below), and (ii) the amount of the deposit (if any) then required by the franchisor, if any, on account of FF&E under the franchise agreement, if any is entered into in the future (initially estimated to be approximately $47,686).
“FF&E Payment” means, with respect to the corresponding monthly payment date, an amount equal to 1/12th of 4.0% of the greater of (x) the annual gross revenues for the hotel-related operations at the Brazilian Court Hotel Property for the immediately preceding calendar year as reasonably determined by the lender and (y) the projected annual gross revenues for the hotel-related operations at the Brazilian Court Hotel Property for the calendar year in which such monthly payment occurs as set forth in the then-current annual budget (or during a Trigger Period (as defined below), the approved annual budget); provided that if, as of any applicable date of determination, no approved annual budget exists for the applicable calendar year, the amount of the FF&E Payment will be determined by the lender in its reasonable discretion.
Seasonality Reserve – The loan documents require on each monthly payment date occurring in November through April of any calendar year commencing in 2025, a deposit of $373,422, into the seasonality reserve, which, provided no event of default exists under the Brazilian Court Hotel Mortgage Loan, will be used to cover shortfalls in available funds for debt service, reserve payments and operating expenses during the months of May through October of the calendar year.
Lockbox and Cash Management. The Brazilian Court Hotel Mortgage Loan is structured with a hard lockbox and springing cash management. The borrower was required to execute a lockbox account agreement and have the lockbox account in place within 20 days of the origination date, which actions have not yet been completed. The borrower is required to deliver direction letters to each of the credit card companies with which the borrower has entered into a merchant’s or other credit card agreement directing them to pay to the lender-controlled lockbox account all payments which would otherwise be paid to the borrower under the applicable credit card processing agreement. In addition, the borrower is required to deliver direction letters to each commercial tenant at the Brazilian Court Hotel Property directing them to pay rent to the lender-controlled lockbox account. The borrower is required to (or cause the property manager to) immediately deposit all revenue derived from the Brazilian Court Hotel Property and received by the borrower or property manager into the lender-controlled lockbox account. All funds deposited into the lockbox account are required to be transferred on each business day to or at the direction of the borrower unless a Trigger Period exists and the lender elects in its sole discretion to deliver a restricted account notice, in which case all such funds will be required to be swept on each business day to a cash management account under the control of the lender to be applied and disbursed in accordance with the Brazilian Court Hotel Mortgage Loan documents, and all excess cash flow funds remaining in the cash management account after the application of such funds in accordance with the Brazilian Court Hotel Mortgage Loan documents may be held by the lender in an excess cash flow reserve account as additional collateral for the Brazilian Court Hotel Mortgage Loan, provided that the lender is required to disburse funds in the excess cash flow reserve to pay approved operating expenses or approved extraordinary expenses upon the borrower’s request. Upon the cure of the applicable Trigger Period, so long as no event of default exists, the lender is required to return any amounts remaining on deposit in the excess cash flow reserve account to the borrower. Upon an event of default under the Brazilian Court Hotel Mortgage Loan documents, the lender may apply funds to the debt in such priority as it may determine.
A “Trigger Period” will commence upon the earlier of the following:
| (i) | an event of default; or |
| (ii) | the debt yield falling below 9.0%. |
A Trigger Period will end upon the occurrence of the following:
| ● | with regard to clause (i), the cure (if applicable) of such event of default; or |
| ● | with regard to clause (ii), upon the debt yield being at least 9.0% for two consecutive calendar quarters. |
Property Management. The Brazilian Court Hotel Property is managed by Obadon Hotels, LLC, a borrower-affiliated hotel manager.
Release of Collateral. At any time after the second anniversary of the closing date of the WFCM 2025-5C3 securitization, the borrower has the right to obtain the release of a parcel identified in the Brazilian Court Hotel Mortgage Loan documents (the “Brazilian Court Release Parcel”), which consists of a surface parking parcel containing approximately 92 striped parking spaces that currently services the valet parking operation at the Brazilian Court Hotel Property, upon defeasance of $2,300,000 of the principal amount of the Brazilian Court Hotel Mortgage Loan (which amount constitutes 115% of the allocated loan amount of the Brazilian Court Release Parcel) and satisfaction of the following conditions among others; (i) the Brazilian Court Release Parcel must be vacant and unimproved (other than paved parking spaces, roadways, underground utility lines, lighting fixtures and similar infrastructure improvements), (ii) the borrower certifies to the lender that after the release the remaining Brazilian Court Hotel Property (the “Remaining Property”) (A) complies with applicable legal requirements, and (B) will have access to adequate parking facilities sufficient to comply with applicable legal requirements and sufficient to service the Brazilian Court Hotel Property as a hotel in a manner consistent with the parking facilities available to the Brazilian Court Hotel Property prior to the partial release, and the release will not materially and adversely affect the use of the Remaining Property as a hotel, and does not violate certain agreements applicable to the Brazilian Court Hotel Property, (iii) if the Brazilian Court Release Parcel is not on a separate tax lot or legally subdivided, then following the release the borrower must take all reasonable actions necessary under applicable law for the Brazilian Court Release Parcel to be subdivided and designated as a separate tax parcel, and until that occurs the borrower must reserve and pay for taxes for the Brazilian Court Release Parcel, (iv) the borrower delivers evidence to the lender that the Remaining Property will be granted easement rights over the Brazilian Court Release Parcel for parking, vehicular and pedestrian ingress, egress and access to public rights of way, (v) the borrower delivers amendments to the condominium documents for the Brazilian Court Hotel Property to reflect the release of the Brazilian Court Release Parcel from the related condominium and (vi) compliance with REMIC related requirements.
Real Estate Substitution. Not permitted.
Subordinate and Mezzanine Indebtedness. None.
Future Subordinate or Mezzanine Indebtedness. Not permitted.
Letter of Credit. None.
| THE INFORMATION IN THIS STRUCTURAL AND COLLATERAL TERM SHEET IS NOT COMPLETE AND MAY BE AMENDED PRIOR TO THE TIME OF SALE. THIS TERM SHEET IS NOT AN OFFER TO SELL THESE SECURITIES AND IT IS NOT A SOLICITATION OF AN OFFER TO BUY THESE SECURITIES IN ANY JURISDICTION WHERE THE OFFER OR SALE IS NOT PERMITTED. | ||
| 64 | ||
| Hospitality – Full Service | Loan #5 | Cut-off Date Balance: | $54,500,000 | |
| 300 and 301 Australian Avenue | The Brazilian Court Hotel | Cut-off Date LTV: | 50.5% | |
| Palm Beach, FL 33480 | UW NCF DSCR: | 1.58x | ||
| UW NOI Debt Yield: | 13.1% |
Right of First Offer/Right of First Refusal. The borrower has a right of first refusal to buy additional hotel units in the Brazilian Court Condominium, and is permitted under the loan documents to exercise such right provided that certain conditions are satisfied. See “Description of the Mortgage Pool—Certain Terms of the Mortgage Loans—Releases; Partial Releases; Property Additions” in the Preliminary Prospectus.
Ground Lease. None.
Terrorism Insurance. The loan documents require that the “all risk” insurance policy required to be maintained by the borrower provides coverage for terrorism in an amount equal to the full replacement cost of the Brazilian Court Hotel Property, as well as 18 months of business interruption insurance, together with an extended period of indemnity of up to six months. See “Risk Factors-Risks Relating to the Mortgage Loans-Terrorism Insurance May Not Be Available for All Mortgaged Properties” in the Preliminary Prospectus.
| THE INFORMATION IN THIS STRUCTURAL AND COLLATERAL TERM SHEET IS NOT COMPLETE AND MAY BE AMENDED PRIOR TO THE TIME OF SALE. THIS TERM SHEET IS NOT AN OFFER TO SELL THESE SECURITIES AND IT IS NOT A SOLICITATION OF AN OFFER TO BUY THESE SECURITIES IN ANY JURISDICTION WHERE THE OFFER OR SALE IS NOT PERMITTED. | ||
| 65 | ||
| Multifamily – Garden | Loan #6 | Cut-off Date Balance: | $47,000,000 | |
| Various | Georgia Multifamily Portfolio | Cut-off Date LTV: | 63.6% | |
| Various, GA | UW NCF DSCR: | 1.29x | ||
| UW NOI Debt Yield: | 9.0% |
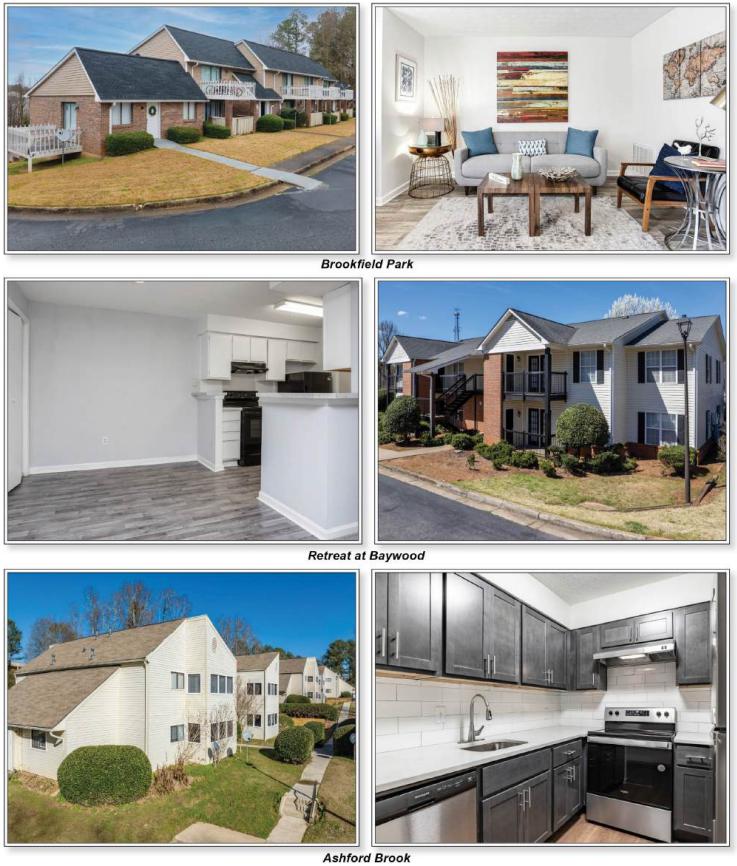
| THE INFORMATION IN THIS STRUCTURAL AND COLLATERAL TERM SHEET IS NOT COMPLETE AND MAY BE AMENDED PRIOR TO THE TIME OF SALE. THIS TERM SHEET IS NOT AN OFFER TO SELL THESE SECURITIES AND IT IS NOT A SOLICITATION OF AN OFFER TO BUY THESE SECURITIES IN ANY JURISDICTION WHERE THE OFFER OR SALE IS NOT PERMITTED. | ||
| 66 | ||
| Multifamily – Garden | Loan #6 | Cut-off Date Balance: | $47,000,000 | |
| Various | Georgia Multifamily Portfolio | Cut-off Date LTV: | 63.6% | |
| Various, GA | UW NCF DSCR: | 1.29x | ||
| UW NOI Debt Yield: | 9.0% |
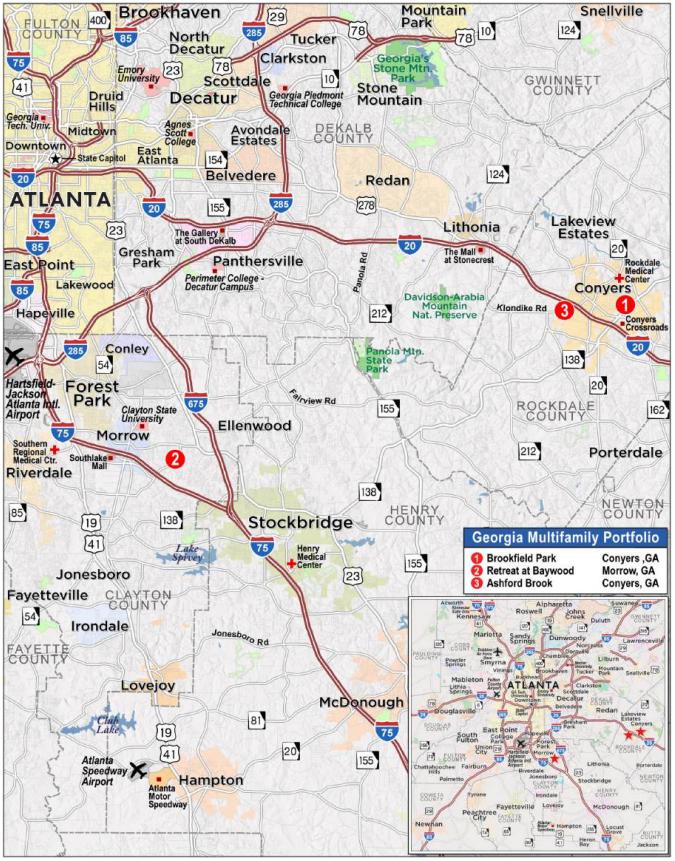
| THE INFORMATION IN THIS STRUCTURAL AND COLLATERAL TERM SHEET IS NOT COMPLETE AND MAY BE AMENDED PRIOR TO THE TIME OF SALE. THIS TERM SHEET IS NOT AN OFFER TO SELL THESE SECURITIES AND IT IS NOT A SOLICITATION OF AN OFFER TO BUY THESE SECURITIES IN ANY JURISDICTION WHERE THE OFFER OR SALE IS NOT PERMITTED. | ||
| 67 | ||
| Mortgage Loan No. 6 – Georgia Multifamily Portfolio |
| Mortgage Loan Information | Property Information | ||||||
| Mortgage Loan Seller: | CREFI | Single Asset/Portfolio: | Portfolio | ||||
| Credit Assessment (KBRA/Fitch/Moody’s): | NR/NR/NR | Location(2): | Various, GA | ||||
| Original Balance: | $47,000,000 | General Property Type: | Multifamily | ||||
| Cut-off Date Balance: | $47,000,000 | Detailed Property Type: | Garden | ||||
| % of Initial Pool Balance: | 5.6% | Title Vesting: | Fee | ||||
| Loan Purpose: | Refinance | Year Built/Renovated(2): | Various/2023 | ||||
| Borrower Sponsors: | Joseph Jemal and Norman Jemal | Size: | 374 Units | ||||
| Guarantors: | Joseph Jemal and Norman Jemal | Cut-off Date Balance per Unit: | $125,668 | ||||
| Mortgage Rate: | 6.6500% | Maturity Date Balance per Unit: | $125,668 | ||||
| Note Date: | 12/17/2024 | Property Manager: | R James Properties, Inc. | ||||
| Maturity Date: | 1/6/2030 | Underwriting and Financial Information | |||||
| Term to Maturity: | 60 months | UW NOI(3): | $4,208,814 | ||||
| Amortization Term: | 0 months | UW NCF: | $4,075,390 | ||||
| IO Period: | 60 months | UW NOI Debt Yield: | 9.0% | ||||
| Seasoning: | 0 months | UW NCF Debt Yield: | 8.7% | ||||
| Prepayment Provisions: | L(24),D(30),O(6) | UW NOI Debt Yield at Maturity: | 9.0% | ||||
| Lockbox/Cash Mgmt Status: | Springing/Springing | UW NCF DSCR: | 1.29x | ||||
| Additional Debt Type: | NAP | Most Recent NOI(3): | $3,492,261 (8/31/2024 TTM) | ||||
| Additional Debt Balance: | NAP | 2nd Most Recent NOI(4): | NAV | ||||
| Future Debt Permitted (Type): | No (NAP) | 3rd Most Recent NOI(4): | NAV | ||||
| Most Recent Occupancy: | 98.4% (7/1/2024) | ||||||
| Reserves(1) | 2nd Most Recent Occupancy(4): | NAV | |||||
| Type | Initial | Monthly | Cap | 3rd Most Recent Occupancy(4): | NAV | ||
| RE Taxes: | $92,426 | $46,213 | NAP | Appraised Value (as of): | $73,900,000 (7/23/2024) | ||
| Insurance: | $70,793 | $5,899 | NAP | Appraised Value per Unit: | $197,594 | ||
| Replacement Reserve: | $0 | $11,100 | NAP | Cut-off Date LTV Ratio: | 63.6% | ||
| Deferred Maintenance: | $200,545 | $0 | NAP | Maturity Date LTV Ratio: | 63.6% | ||
| Sources and Uses | ||||||
| Sources | Proceeds | % of Total | Uses | Proceeds | % of Total | |
| Loan Amount: | $47,000,000 | 98.8% | Loan Payoff: | $45,872,257 | 96.5% | |
| Borrower Sponsor Equity: | $551,136 | 1.2% | Closing Costs: | $1,315,115 | 2.8% | |
| Upfront Reserves: | $363,764 | 0.8% | ||||
| Total Sources: | $47,551,136 | 100.0% | Total Uses: | $47,551,136 | 100.0% | |
| (1) | See “Escrows” below for further discussion. |
| (2) | See “The Properties” below. |
| (3) | The increase from Most Recent NOI to UW NOI is primarily attributable to lease-up following renovations to the Georgia Multifamily Portfolio Properties (as defined below). |
| (4) | 2nd Most Recent NOI, 3rd Most Recent NOI, 2nd Most Recent Occupancy and 3rd Most Recent Occupancy are not available because the Georgia Multifamily Portfolio Properties were recently renovated in 2023. |
The Mortgage Loan. The sixth largest mortgage loan (the “Georgia Multifamily Portfolio Mortgage Loan”) is evidenced by a promissory note in the original principal amount of $47,000,000 and secured by a first priority fee mortgage encumbering a three property, 374-unit, garden-style multifamily portfolio located in Conyers and Morrow, Georgia (the “Georgia Multifamily Portfolio Properties”).
The Borrowers and the Borrower Sponsors. The borrowers are ICER of Ashford LLC, ICER of Baywood LLC and ICER of Brookfield LLC, each a Delaware limited liability company and single purpose entity with one independent director. The borrower sponsors and non-recourse carveout guarantors are Joseph Jemal and Norman Jemal.
Joseph Jemal and Norman Jemal are the President and CEO of ICER Properties, a family-owned real estate company that focuses on multifamily, retail and office properties. The firm’s portfolio includes over 1.25 million square feet of retail and office properties in New York, 2,387 multifamily units in Georgia and 336 multifamily units in South Carolina.
| THE INFORMATION IN THIS STRUCTURAL AND COLLATERAL TERM SHEET IS NOT COMPLETE AND MAY BE AMENDED PRIOR TO THE TIME OF SALE. THIS TERM SHEET IS NOT AN OFFER TO SELL THESE SECURITIES AND IT IS NOT A SOLICITATION OF AN OFFER TO BUY THESE SECURITIES IN ANY JURISDICTION WHERE THE OFFER OR SALE IS NOT PERMITTED. | ||
| 68 | ||
| Multifamily – Garden | Loan #6 | Cut-off Date Balance: | $47,000,000 | |
| Various | Georgia Multifamily Portfolio | Cut-off Date LTV: | 63.6% | |
| Various, GA | UW NCF DSCR: | 1.29x | ||
| UW NOI Debt Yield: | 9.0% |
The Properties. The Georgia Multifamily Portfolio Properties consist of three garden-style multifamily properties totaling 374-units located in Conyers and Morrow, Georgia within the Atlanta-Sandy Springs-Roswell, Georgia metropolitan statistical area (“Atlanta MSA”).
The following table presents detailed information with respect to the Georgia Multifamily Portfolio Properties:
| Portfolio Summary | |||||||||
Property Name |
Location(1) |
Year Built / Renovated(1) |
# of Units(2) |
Occ.(2) |
Allocated Cut-off Date Balance | % of Allocated Cut-off Date Balance |
UW NOI |
% of UW NOI |
Appraised Value |
| Brookfield Park | Conyers, GA | 1973 / 2023 | 160 | 99.4% | $18,582,677 | 39.5% | $1,735,545 | 41.2% | $29,900,000 |
| Retreat at Baywood | Morrow, GA | 1995 / 2023 | 120 | 95.8% | $17,500,000 | 37.2% | $1,458,316 | 34.6% | $26,700,000 |
| Ashford Brook | Conyers, GA | 1981 / 2023 | 94 | 100.0% | $10,917,323 | 23.2% | $1,014,953 | 24.1% | $17,300,000 |
| Total/ Wtd. Avg | 374 | 98.4% | $47,000,000 | 100.0% | $4,208,814 | 100.0% | $73,900,000 | ||
| (1) | Source: Appraisals. |
| (2) | Based on underwritten rent rolls dated July 1, 2024. |
Brookfield Park
The Brookfield Park property is a 160-unit garden-style apartment community located in Conyers, Georgia (the “Brookfield Park Property”), located approximately 26.2 miles southeast of Atlanta. The Brookfield Park Property is comprised of 23 two-story apartment buildings as well as a leasing office and clubhouse and is situated on a 20.37-acre site which includes 366 surface parking spaces (2.29 spaces per unit). The Brookfield Park Property was originally constructed in 1973 and most recently renovated in 2023. Renovations totaled approximately $1.3 million and primarily consisted of unit renovations, roof replacement and a pool remodeling. The Brookfield Park Property unit mix consists of 56 one-bedroom / one-bathroom units, 62 two-bedroom / 1.5-bathroom units, 22 two-bedroom / 2-bathroom units and 20 three-bedroom / 1.5-bathroom units. Amenities at the Brookfield Park Property include a clubhouse, swimming pool, playground and a barbeque/picnic area. Unit amenities include stainless-steel appliance packages, hardwood floors, washer and dryer connections, and private patios or balconies for select units. As of July 1, 2024 the Brookfield Park Property was 99.4% leased.
Retreat at Baywood
The Retreat at Baywood property is a 120-unit garden-style apartment community located in Morrow, Georgia (the “Retreat at Baywood Property”), located approximately 16.6 miles south of Atlanta. The Retreat at Baywood Property is comprised of 14 two-story apartment buildings as well as a clubhouse and is situated on a 26.87-acre site which includes 225 surface parking spaces (1.88 spaces per unit). The Retreat at Baywood Property was originally constructed in 1995 and most recently renovated in 2023. Renovations totaled approximately $829,000 and primarily consisted of unit renovations, HVACs and smart equipment installations. The Retreat at Baywood unit mix consists of 48 two-bedroom / two-bathroom units and 72 three-bedroom / two-bathroom units. Amenities at the Retreat at Baywood Property include a clubhouse/recreation building, fitness center and playground. Unit amenities include stainless-steel appliance packages, washer and dryer connections, and balconies for select units. As of July 1, 2024 the Retreat at Baywood Property was 95.8% leased.
Ashford Brook
The Ashford Brook property is a 94-unit garden-style apartment community located in Conyers, Georgia (the “Ashford Brook Property”), located approximately 24.3 miles southeast of Atlanta. The Ashford Brook Property is comprised of 23 two-story apartment buildings as well as a leasing office and clubhouse and is situated on a 11.0-acre site which includes 198 surface parking spaces (2.11 spaces per unit). The Ashford Brook Property was originally constructed in 1981 and most recently renovated in 2023. Renovations totaled approximately $1.0 million and primarily consisted of unit renovations, HVAC and roof replacement, and landscaping upgrades. The Ashford Brook unit mix consists of 20 one-bedroom / one-bathroom units, 54 two-bedroom / one-bathroom units, and 20 three-bedroom / 1.5-bathroom units. Amenities at the Ashford Brook Property include a clubhouse, swimming pool, and laundry. Unit amenities include stainless-steel appliance packages, vinyl flooring, washer and dryer connections, and balconies for select units. As of July 1, 2024 the Ashford Brook Property was 100.0% leased.
| THE INFORMATION IN THIS STRUCTURAL AND COLLATERAL TERM SHEET IS NOT COMPLETE AND MAY BE AMENDED PRIOR TO THE TIME OF SALE. THIS TERM SHEET IS NOT AN OFFER TO SELL THESE SECURITIES AND IT IS NOT A SOLICITATION OF AN OFFER TO BUY THESE SECURITIES IN ANY JURISDICTION WHERE THE OFFER OR SALE IS NOT PERMITTED. | ||
| 69 | ||
| Multifamily – Garden | Loan #6 | Cut-off Date Balance: | $47,000,000 | |
| Various | Georgia Multifamily Portfolio | Cut-off Date LTV: | 63.6% | |
| Various, GA | UW NCF DSCR: | 1.29x | ||
| UW NOI Debt Yield: | 9.0% |
The following table presents certain information relating to the unit mix at the Brookfield Park Property:
| Brookfield Park Unit Mix(1) | ||||||
| Unit Mix / Type | Units | Occupied Units | % Occupied | Average SF per Unit | Monthly Average Rent per Unit(2) | Monthly Average Market Rent per Unit(3) |
| 1 BR / 1 BA(4) | 56 | 56 | 100.0% | 677 | $1,080 | $1,144 |
| 2 BR / 1.5 BA | 62 | 62 | 100.0% | 1,045 | $1,312 | $1,290 |
| 2 BR / 2 BA | 22 | 22 | 100.0% | 950 | $1,249 | $1,375 |
| 3 BR / 1.5 BA | 20 | 19 | 95.0% | 1,300 | $1,377 | $1,403 |
| Total/Wtd. Avg. | 160 | 159 | 99.4% | 935 | $1,230 | $1,265 |
| (1) | Based on the underwritten rent roll dated July 1, 2024. |
| (2) | Monthly Average Rent per Unit is based on occupied units. |
| (3) | Source: Appraisal. |
| (4) | 1 BR / 1 BA includes one Corporate Management Office that is occupied but to which no rent is attributable. The Management Office is included in the occupancy count but is excluded from the monthly average rent per unit. |
The following table presents certain information relating to the unit mix at the Retreat at Baywood Property:
| Retreat at Baywood Unit Mix(1) | ||||||
| Unit Mix / Type | Units | Occupied Units | % Occupied | Average SF per Unit | Monthly Average Rent per Unit(2) | Monthly Average Market Rent per Unit(3) |
| 2 BR / 2 BA | 48 | 48 | 100.0% | 1,004 | $1,343 | $1,400 |
| 3 BR / 2 BA | 72 | 67 | 93.1% | 1,180 | $1,482 | $1,578 |
| Total/Wtd. Avg. | 120 | 115 | 95.8% | 1,109 | $1,424 | $1,507 |
| (1) | Based on the underwritten rent roll dated July 1, 2024. |
| (2) | Monthly Average Rent per Unit is based on occupied units. |
| (3) | Source: Appraisal. |
The following table presents certain information relating to the unit mix at the Ashford Brook Property:
| Ashford Brook Unit Mix(1) | ||||||
| Unit Mix / Type | Units | Occupied Units | % Occupied | Average SF per Unit | Monthly Average Rent per Unit(2) | Monthly Average Market Rent per Unit(3) |
| 1 BR / 1 BA | 20 | 20 | 100.0% | 650 | $1,021 | $1,100 |
| 2 BR / 1 BA | 54 | 54 | 100.0% | 875 | $1,165 | $1,220 |
| 3 BR / 1.5 BA | 20 | 20 | 100.0% | 1,244 | $1,409 | $1,450 |
| Total/Wtd. Avg. | 94 | 94 | 100.0% | 906 | $1,186 | $1,244 |
| (1) | Based on the underwritten rent roll dated July 1, 2024. |
| (2) | Monthly Average Rent per Unit is based on occupied units. |
| (3) | Source: Appraisal. |
| THE INFORMATION IN THIS STRUCTURAL AND COLLATERAL TERM SHEET IS NOT COMPLETE AND MAY BE AMENDED PRIOR TO THE TIME OF SALE. THIS TERM SHEET IS NOT AN OFFER TO SELL THESE SECURITIES AND IT IS NOT A SOLICITATION OF AN OFFER TO BUY THESE SECURITIES IN ANY JURISDICTION WHERE THE OFFER OR SALE IS NOT PERMITTED. | ||
| 70 | ||
| Multifamily – Garden | Loan #6 | Cut-off Date Balance: | $47,000,000 | |
| Various | Georgia Multifamily Portfolio | Cut-off Date LTV: | 63.6% | |
| Various, GA | UW NCF DSCR: | 1.29x | ||
| UW NOI Debt Yield: | 9.0% |
The Market. The Georgia Multifamily Portfolio Properties are located within the Rockdale County and Clayton County submarkets of the Atlanta Metropolitan Statistical Area (“MSA”). According to the appraisal, the Atlanta MSA is home to approximately 6,399,274 people and is the ninth largest MSA in the country. The Atlanta MSA is home to numerous large corporations with major employers including Delta Airlines, The Home Depot, UPS, AT&T, and Coca Cola. The Atlanta MSA is also home to Georgia State University, Georgia Institute of Technology and Emory University. According to the appraisal, as of the second quarter of 2024, the Atlanta MSA had an inventory of 649,229 units, a vacancy rate of 12.0%, and an average asking rental rate of $1,581 per unit.
The Brookfield Park Property and the Ashford Brook Property are located in the Rockdale County submarket. According to the related appraisals, Rockdale County had a 2024 population of 96,381 with an average household income of $102,593. According to the related appraisals, as of the second quarter of 2024, the Rockdale County apartment submarket had an inventory of 5,226 units, a vacancy rate of 17.9%, and an average asking rental rate of $1,468 per unit.
The Retreat at Baywood Property is located in the Clayton County submarket. According to the appraisal, Clayton County had a 2024 population of 304,277 with an average household income of $78,231. According to the appraisal, as of the second quarter of 2024, the Rockdale County apartment submarket had an inventory of 32,177 units, a vacancy rate of 12.9%, and an average asking rental rate of $1,250 per unit.
The following table presents information regarding certain competitive properties to the Brookfield Park Property and the Ashford Brook Property:
| Competitive Rental Properties Summary- Brookfield Park and Ashford Brook(1) | |||||||
| Property Name / Address | Distance from Subject(2) | Year Built / Renovated | Occupancy | Number of Units | Unit Type | Average Unit Size(3) | Average Rent Per Unit(3) |
Brookfield Park and Ashford Brook(4) Various Conyers, GA Various | - | 1973, 1981 / 2023 | 99.6%
| 254
| 1 BR / 1 BA - Brookfield | 677 SF | $1,080 |
| 1 BR / 1 BA – Ashford | 650 SF | $1,021 | |||||
| 2 BR / 1 BA – Ashford | 875 SF | $1,165 | |||||
| 2 BR / 1.5 BA - Brookfield | 1,045 SF | $1,312 | |||||
| 2 BR / 2 BA - Brookfield | 950 SF | $1,249 | |||||
| 3 BR / 1.5 BA – Ashford | 1,244 SF | $1,409 | |||||
| 3 BR / 1.5 BA - Brookfield | 1,300 SF | $1,377 | |||||
Tall Oaks Apartments and Villas 348 Tall Oaks Drive Conyers, GA 30013 | 2.3 mi | 1988 / NAV | 90.2% | 174 | 1 BR / 1 BA | 950 SF | $1,238 |
| 2 BR / 1.5 BA | 1,200 SF | $1,213 | |||||
| 2 BR / 2 BA | 1,159 SF | $1,273 | |||||
| 3 BR / 1.5 BA | 1,300 SF | $1,416 | |||||
| 3 BR / 2 BA | 1,300 SF | $1,411 | |||||
| 3 BR / 2.5 BA | 1,300 SF | $1,515 | |||||
Meadow Crossing Apartments 1190 Millcrest Walk Northwest Conyers, GA 30012 | 3.0 mi | 1984 / NAV | 89.6% | 182 | 2 BR / 1 BA | 1,000 SF | $1,119 |
| 2 BR / 2 BA | 1,070 SF | $1,317 | |||||
Evans Mills Townhomes 2670 Evans Mill Drive Lithonia, GA 30058 | 9.9 mi | 1986 / NAV | 97.2% | 170 | 2 BR / 1.5 BA | 1,024 SF | $835 |
Chelsea Place 2361 Parc Chateau Drive Lithonia, GA 30058 | 10.6 mi | 1973 / NAV | 93.1% | 174 | 1 BR / 1 BA 2 BR / 1.5 BA 3 BR / 1.5 BA | 596 SF 930 SF 1,125 SF | $1,206 $1,116 $1,593 |
| (1) | Source: Brookfield Park and Ashford Brook Appraisals. |
| (2) | Distance from Subject represents the distance from the Brookfield Park Property. |
| (3) | Represents the Average SF Per Unit and Average Rent Per Unit per each unit type. |
| (4) | The Brookfield Park and Ashford Brook Occupancy, Average Unit Size and Average Rent Per Unit are based on the underwritten rent rolls dated July 1, 2024. |
| THE INFORMATION IN THIS STRUCTURAL AND COLLATERAL TERM SHEET IS NOT COMPLETE AND MAY BE AMENDED PRIOR TO THE TIME OF SALE. THIS TERM SHEET IS NOT AN OFFER TO SELL THESE SECURITIES AND IT IS NOT A SOLICITATION OF AN OFFER TO BUY THESE SECURITIES IN ANY JURISDICTION WHERE THE OFFER OR SALE IS NOT PERMITTED. | ||
| 71 | ||
| Multifamily – Garden | Loan #6 | Cut-off Date Balance: | $47,000,000 | |
| Various | Georgia Multifamily Portfolio | Cut-off Date LTV: | 63.6% | |
| Various, GA | UW NCF DSCR: | 1.29x | ||
| UW NOI Debt Yield: | 9.0% |
The following table presents information regarding certain competitive properties to the Retreat at Baywood Property:
| Competitive Rental Properties Summary- Retreat at Baywood(1) | |||||||
| Property Name / Address | Distance from Subject | Year Built / Renovated | Occupancy | Number of Units | Unit Type | Average Unit Size(2) | Average Rent Per Unit(2) |
Retreat at Baywood 6655 Mount Zion Boulevard Morrow, GA 30260(3) | - | 1995 / 2023 | 95.8% | 120 | 2 BR / 2 BA | 1,004 SF | $1,343 |
| 3 BR / 2 BA | 1,180 SF | $1,482 | |||||
| Hidden Creek | 0.6 mi | 1999 / NAV | 85.3% | 116 | 1 BR / 1 BA | 767 SF | $1,218 |
| 6595 Mount Zion Boulevard | 2 BR / 2 BA | 1,071 SF | $1,387 | ||||
| Morrow, GA 30260 | 3 BR / 2 BA | 1,338 SF | $1,679 | ||||
Magnolia Place at Stockbridge 3110 Mount Zion Road Stockbridge, GA 30281 | 2.8 mi | 1989 / NAV | 88.1% | 160 | 1 BR / 1 BA | 808 SF | $1,235 |
| 2 BR / 2 BA | 1,140 SF | $1,432 | |||||
| 3 BR / 2 BA | 1,350 SF | $1,658 | |||||
Spring Lake Apartments 7000 Southlake Parkway | 3.2 mi | 1986 / NAV | 96.8% | 188 | 1 BR / 1 BA | 770 SF | $1,195 |
| Morrow, GA 30260 | 2 BR / 2 BA | 1,158 SF | $1,417 | ||||
Retreat 138 3384 Mount Zion Road Stockbridge, GA 30281 | 3.6 mi | 2001 / NAV | 85.0% | 180 | 1 BR / 1 BA | 809 SF | $1,244 |
| 2 BR / 2 BA | 1,074 SF | $1,468 | |||||
| 3 BR / 2 BA | 1,197 SF | $1,591 | |||||
| 4 BR / 3 BA | 1,448 SF | $2,090 | |||||
The Mark 7120 7120 Southlake Parkway Morrow, GA 30260 | 3.6 mi | 1990 / NAV | 93.5% | 200 | 1 BR / 1 BA | 908 SF | $1,236 |
| 2 BR / 2 BA | 1,200 SF | $1,588 | |||||
| 3 BR / 2BA | 1,400 SF | $1,782 | |||||
Ballantyne Commons 7195 Hannover Parkway North Stockbridge, GA 30281 | 4.9 mi | 2000 / NAV | 88.0%
| 158
| 1 BR / 1 BA | 850 SF | $1,341 |
| 2 BR / 2 BA | 1,000 SF | $1,351 | |||||
| 3 BR / 2 BA | 1,200 SF | $1,525 | |||||
| (1) | Source: The Retreat at Baywood Appraisal. |
| (2) | Represents the Average SF Per Unit and Average Rent Per Unit per each unit type. |
| (3) | The Retreat at Baywood Occupancy, Average Unit Size and Average Rent Per Unit are based on the underwritten rent roll dated July 1, 2024. |
Appraisal. The appraisals concluded to an aggregate “as-is” value for the Georgia Multifamily Portfolio Properties of $73,900,000 as of July 23, 2024.
Environmental Matters. According to the Phase I environmental site assessments dated July 31, 2024, there was no evidence of any recognized environmental conditions at the Georgia Multifamily Portfolio Properties.
| THE INFORMATION IN THIS STRUCTURAL AND COLLATERAL TERM SHEET IS NOT COMPLETE AND MAY BE AMENDED PRIOR TO THE TIME OF SALE. THIS TERM SHEET IS NOT AN OFFER TO SELL THESE SECURITIES AND IT IS NOT A SOLICITATION OF AN OFFER TO BUY THESE SECURITIES IN ANY JURISDICTION WHERE THE OFFER OR SALE IS NOT PERMITTED. | ||
| 72 | ||
| Multifamily – Garden | Loan #6 | Cut-off Date Balance: | $47,000,000 | |
| Various | Georgia Multifamily Portfolio | Cut-off Date LTV: | 63.6% | |
| Various, GA | UW NCF DSCR: | 1.29x | ||
| UW NOI Debt Yield: | 9.0% |
Operating History and Underwritten Net Cash Flow. The following table presents certain information relating to the historical operating performance and underwritten net cash flow at the Georgia Multifamily Portfolio Properties:
| Cash Flow Analysis(1) | |||
| 8/31/2024 TTM | UW | UW Per Unit | |
| Gross Potential Rent | $5,955,843 | $5,635,874 | $15,069 |
| Potential Income from Vacant Units | $0 | $111,000 | $297 |
| Potential Gross Income | $5,955,843 | $5,746,874 | $15,366 |
| Vacancy/Credit Loss | ($1,029,888) | ($305,455) | ($817) |
| Other Income(2) | $498,142 | $583,434 | $1,560 |
| Effective Gross Income | $5,424,096 | $6,024,853 | $16,109 |
| Real Estate Taxes | $528,149 | $528,149 | $1,412 |
| Insurance | $180,922 | $194,079 | $519 |
| Management Fee | $163,960 | $180,746 | $483 |
| Other Operating Expenses(3) | $1,058,804 | $913,066 | $2,441 |
| Total Operating Expenses | $1,931,835 | $1,816,040 | $4,856 |
| Net Operating Income | $3,492,261 | $4,208,814 | $11,254 |
| Replacement Reserves | $0 | $133,424 | $357 |
| Net Cash Flow | $3,492,261 | $4,075,390 | $10,897 |
| Occupancy | NAV(4) | 95.0%(5) | |
| NOI DSCR | 1.10 | 1.33 | |
| NCF DSCR | 1.10 | 1.29 | |
| NOI Debt Yield | 7.4% | 9.0% | |
| NCF Debt Yield | 7.4% | 8.7% | |
| (1) | Historical periods prior to the 8/31/2024 TTM are not available because the Georgia Multifamily Properties were renovated in 2023. |
| (2) | Other Income includes forfeited deposits, pet fees, damage deposits, and late charges as well as income from the properties’ RUBS program (Ratio Utility Billing System), whereby a portion of the utility expense is shared by tenants and reimbursed to the landlord on a pro rata basis. |
| (3) | Other Operating Expenses represents payroll and benefits, repairs and maintenance, utilities, advertising and marketing, and general and administrative expenses. |
| (4) | 8/31/2024 TTM Occupancy is not available because the borrower sponsors recently renovated the Georgia Multifamily Portfolio Properties in 2023. |
| (5) | Represents Economic Occupancy. |
| THE INFORMATION IN THIS STRUCTURAL AND COLLATERAL TERM SHEET IS NOT COMPLETE AND MAY BE AMENDED PRIOR TO THE TIME OF SALE. THIS TERM SHEET IS NOT AN OFFER TO SELL THESE SECURITIES AND IT IS NOT A SOLICITATION OF AN OFFER TO BUY THESE SECURITIES IN ANY JURISDICTION WHERE THE OFFER OR SALE IS NOT PERMITTED. | ||
| 73 | ||
| Multifamily – Garden | Loan #6 | Cut-off Date Balance: | $47,000,000 | |
| Various | Georgia Multifamily Portfolio | Cut-off Date LTV: | 63.6% | |
| Various, GA | UW NCF DSCR: | 1.29x | ||
| UW NOI Debt Yield: | 9.0% |
Escrows. At origination, the borrowers deposited into escrow (i) approximately $92,426 for real estate taxes, (ii) $70,793 for insurance premiums and (iii) $200,545 for deferred maintenance.
Real Estate Taxes – On a monthly basis, the borrowers are required to escrow 1/12th of the annual estimated tax payments, which currently equates to approximately $46,213.
Insurance – At the option of the lender, if the liability or casualty policy maintained by the borrowers does not constitute an approved blanket or umbrella policy, or the lender requires the borrowers to obtain a separate policy, the borrowers are required to escrow 1/12th of the amount which will be sufficient to pay the insurance premiums due for the renewal of coverage afforded by such policies. As of the origination date, the Brookfield Park and Ashford Brook Properties were insured under blanket policies and the Retreat at Baywood Property was insured under a separate policy, as to which the monthly deposit currently equates to approximately $5,899.
Replacement Reserve – On a monthly basis, the borrowers are required to escrow approximately $11,100 for replacement reserves.
Lockbox and Cash Management. The Georgia Multifamily Portfolio Mortgage Loan is structured with a springing lockbox and springing cash management. Upon the first occurrence of a Trigger Period (defined below), the borrowers are required to establish a lockbox account for the benefit of the lender, into which all rents and other revenue from the Georgia Multifamily Portfolio Properties are required to be deposited by the borrowers. Within five business days after the first occurrence of a Trigger Period, the borrowers are required to deliver notices to each of the credit card companies or credit card clearing banks with which the borrowers have entered into a merchant’s or other credit card agreement directing them to remit all payments into the lender-controlled lockbox account. Upon the first occurrence of a Trigger Period, the borrowers are required to (or cause the property manager to) immediately deposit all revenue derived from the Georgia Multifamily Portfolio Properties and received by the borrowers or property manager into the lender-controlled lockbox account. All funds in the lockbox account are required to be transferred to a lender-controlled cash management account on each business day and disbursed in accordance with the Georgia Multifamily Portfolio Mortgage Loan documents. Also, during a Trigger Period, all excess cash is required to be collected by the lender and held as additional security for the Georgia Multifamily Portfolio Mortgage Loan. Upon the cure of the applicable Trigger Period, so long as no event of default exists, the lender is required to return any amounts remaining on deposit in the excess cash flow reserve account to the borrowers. Upon an event of default under the Georgia Multifamily Portfolio Mortgage Loan documents, the lender may apply funds to the debt in such priority as it may determine.
A “Trigger Period” will commence on the earlier of the following:
(i) an event of default; or
(ii) the debt service coverage ratio falling below 1.15x.
A Trigger Period will end upon the occurrence of the following:
| ● | With regard to clause (i), the cure (if applicable) of such event of default; or |
| ● | With regard to clause (ii), the date that the debt service coverage ratio is equal to or greater than 1.20x for two consecutive calendar quarters. |
Property Management. The Georgia Multifamily Portfolio Properties are managed by R. James Properties, Inc., a third party property manager.
Release of Collateral. At any time after the second anniversary of the closing date of the WFCM 2025-5C3 securitization (the “Release Date”), the borrowers may obtain the release of one or more of the individual Georgia Multifamily Portfolio Properties, in each case, provided that, among other conditions, (i) the borrowers defease an amount of the Georgia Multifamily Portfolio Mortgage Loan (the “Release Price”) equal to the greater of (a) 125% of the allocated loan amount for the applicable individual Georgia Multifamily Portfolio Properties, and (b) 100% of the net sales proceeds of such individual Georgia Multifamily Portfolio Properties, (ii) the borrowers deliver a REMIC opinion, (iii) after giving effect to the release, the debt service coverage ratio with respect to the remaining Georgia Multifamily Portfolio Properties is greater than 1.30x, and (iv) after giving effect to the release, the loan-to-value ratio with respect to the remaining Georgia Multifamily Portfolio Properties is no greater than 65%. In addition, prior to the Release Date, the borrowers have the right to obtain the release of one or more of the individual Georgia Multifamily Portfolio Properties, upon prepayment of the Release Price together with payment of a prepayment fee equal to the greater of 1% of the amount prepaid and a yield maintenance premium, and satisfaction of the same conditions as are required to be satisfied upon a partial defeasance; provided that, in addition, after giving effect to the release, the debt yield with respect to the remaining Georgia Multifamily Portfolio Properties must be greater than 8.67%.
Real Estate Substitution. Not permitted.
Subordinate and Mezzanine Indebtedness. None.
Future Subordinate or Mezzanine Indebtedness. Not permitted.
Letter of Credit. None.
Right of First Offer/Right of First Refusal. None.
Ground Lease. None.
Terrorism Insurance. The borrowers are required to obtain and maintain property insurance in an amount equal to the full replacement cost of the Georgia Multifamily Portfolio Properties and are required to obtain and maintain business interruption insurance for 12 months plus an extended period of indemnity of up to six months. Such insurance is required to include terrorism insurance coverage. See “Risk Factors—Risks Relating to the Mortgage Loans—Terrorism Insurance May Not Be Available for All Mortgaged Properties” in the Preliminary Prospectus.
| THE INFORMATION IN THIS STRUCTURAL AND COLLATERAL TERM SHEET IS NOT COMPLETE AND MAY BE AMENDED PRIOR TO THE TIME OF SALE. THIS TERM SHEET IS NOT AN OFFER TO SELL THESE SECURITIES AND IT IS NOT A SOLICITATION OF AN OFFER TO BUY THESE SECURITIES IN ANY JURISDICTION WHERE THE OFFER OR SALE IS NOT PERMITTED. | ||
| 74 | ||
| Multifamily – Mid Rise | Loan #7 | Cut-off Date Balance: | $44,600,000 | |
| 5506 & 5416 Detroit Avenue | Welleon | Cut-off Date LTV: | 65.1% | |
Cleveland, OH 44102
| UW NCF DSCR: | 1.25x | ||
| UW NOI Debt Yield: | 8.0% |
| THE INFORMATION IN THIS STRUCTURAL AND COLLATERAL TERM SHEET IS NOT COMPLETE AND MAY BE AMENDED PRIOR TO THE TIME OF SALE. THIS TERM SHEET IS NOT AN OFFER TO SELL THESE SECURITIES AND IT IS NOT A SOLICITATION OF AN OFFER TO BUY THESE SECURITIES IN ANY JURISDICTION WHERE THE OFFER OR SALE IS NOT PERMITTED. | ||
| 75 | ||
| Multifamily – Mid Rise | Loan #7 | Cut-off Date Balance: | $44,600,000 | |
| 5506 & 5416 Detroit Avenue | Welleon | Cut-off Date LTV: | 65.1% | |
Cleveland, OH 44102
| UW NCF DSCR: | 1.25x | ||
| UW NOI Debt Yield: | 8.0% |

| THE INFORMATION IN THIS STRUCTURAL AND COLLATERAL TERM SHEET IS NOT COMPLETE AND MAY BE AMENDED PRIOR TO THE TIME OF SALE. THIS TERM SHEET IS NOT AN OFFER TO SELL THESE SECURITIES AND IT IS NOT A SOLICITATION OF AN OFFER TO BUY THESE SECURITIES IN ANY JURISDICTION WHERE THE OFFER OR SALE IS NOT PERMITTED. | ||
| 76 | ||
| Mortgage Loan No. 7 – Welleon |
| Mortgage Loan Information | Property Information | ||||||
| Mortgage Loan Seller: | GSMC | Single Asset/Portfolio: | Single Asset | ||||
| Credit Assessment (Fitch/Moody’s/KBRA): | NR/NR/NR | Location: | Cleveland, OH 44102 | ||||
| Original Balance: | $44,600,000 | General Property Type: | Multifamily | ||||
| Cut-off Date Balance: | $44,600,000 | Detailed Property Type: | Mid Rise | ||||
| % of Initial Pool Balance: | 5.4% | Title Vesting: | Fee | ||||
| Loan Purpose: | Refinance | Year Built/Renovated: | 1910, 2024/NAP | ||||
| Borrower Sponsor: | Todd M. Leebow | Size: | 130 Units | ||||
| Guarantor: | Todd M. Leebow | Cut-off Date Balance Per Unit: | $343,077 | ||||
| Mortgage Rate: | 6.2300% | Maturity Date Balance Per Unit: | $343,077 | ||||
| Note Date: | 11/7/2024 | Property Manager: | RHM Real Estate, Inc. | ||||
| Maturity Date: | 12/6/2029 | ||||||
| Term to Maturity: | 60 months | ||||||
| Amortization Term: | 0 months | Underwriting and Financial Information | |||||
| IO Period: | 60 months | UW NOI(2): | $3,565,573 | ||||
| Seasoning: | 1 month | UW NCF: | $3,525,147 | ||||
| Prepayment Provisions: | L(25),D(28),O(7) | UW NOI Debt Yield: | 8.0% | ||||
| Lockbox/Cash Mgmt Status: | None/None | UW NCF Debt Yield: | 7.9% | ||||
| Additional Debt Type: | NAP | UW NOI Debt Yield at Maturity: | 8.0% | ||||
| Additional Debt Balance: | NAP | UW NCF DSCR: | 1.25x | ||||
| Future Debt Permitted (Type): | No (NAP) | Most Recent NOI(2): | NAV | ||||
| 2nd Most Recent NOI(2): | NAV | ||||||
| Reserves(1) | 3rd Most Recent NOI(2): | NAV | |||||
| Type | Initial | Monthly | Cap | Most Recent Occupancy: | 91.5% (10/30/2024) | ||
| Taxes: | $50,248 | $8,388 | NAP | 2nd Most Recent Occupancy(2): | NAV | ||
| Insurance: | $38,922 | $6,487 | NAP | 3rd Most Recent Occupancy(2): | NAV | ||
| Replacement Reserves: | $0 | $2,167 | NAP | Appraised Value (as of)(3): | $68,500,000 (10/1/2024) | ||
| TI/LC Reserve: | $0 | $1,388 | $66,604 | Appraised Value Per Unit(3): | $526,923 | ||
| Unfunded Obligations Reserve: | $90,334 | $0 | NAP | Cut-off Date LTV Ratio: | 65.1% | ||
| Maturity Date LTV Ratio: | 65.1% | ||||||
| Sources and Uses | ||||||
| Sources | Proceeds | % of Total | Uses | Proceeds | % of Total | |
| Mortgage Loan | $44,600,000 | 100.0% | Loan Payoff | $40,800,099 | 91.5% | |
| Closing Costs(4) | $3,217,995 | 7.2% | ||||
| Principal Equity Distribution | $402,403 | 0.9% | ||||
| Upfront Reserves | $179,503 | 0.4% | ||||
| Total Sources | $44,600,000 | 100.0% | Total Uses | $44,600,000 | 100.0% | |
| (1) | See “Escrows” below for further discussion of reserve information. |
| (2) | Historical Occupancy and Historical NOI are unavailable due to the Welleon Property (as defined below) recent construction which was completed in phases between August 2023 and May 2024. |
| (3) | Appraised Value includes $16.6 million associated with the net present value of abated taxes for 30 years. The “as is market value” (excluding the net present value of abated taxes and projected lease-up costs) of $52.3 million results in an LTV of 85.3%. |
| (4) | Closing Costs are inclusive of a $1,576,610 rate buydown. |
The Mortgage Loan. The seventh largest mortgage loan (the “Welleon Mortgage Loan”) is evidenced by a single promissory note with a principal balance as of the cut-off Date of $44,600,000, secured by a first lien deed of trust on the borrower’s fee interest in a newly constructed 130-unit Class A apartment building, which includes a separate two-story building that was built in 1910 that contains three apartment units on the upper floor and a retail space on the lower floor. (the “Welleon Property”) located in Cleveland, Ohio. The Welleon Mortgage Loan was originated by Goldman Sachs Bank USA on November 7, 2024, has a 5-year interest-only term and accrues interest at a rate of 6.23% per annum. The proceeds of the Welleon Mortgage Loan were used to refinance the existing the debt on the Welleon Property. The Welleon Mortgage Loan had an original term of 60 months and has a remaining term of 59 months as of the cut-off Date. The scheduled maturity date of the Welleon Mortgage Loan is the payment date in December 2029.
The Borrower and the Borrower Sponsor. The borrower is Waverly & Oak Project, LLC, a Delaware limited liability company and special purpose entity with two independent directors in its organizational structure. Legal counsel to the borrower delivered a non-consolidation opinion in connection with the origination of the Welleon Mortgage Loan. The borrower sponsor and non-recourse carveout guarantor is Todd M. Leebow.
| THE INFORMATION IN THIS STRUCTURAL AND COLLATERAL TERM SHEET IS NOT COMPLETE AND MAY BE AMENDED PRIOR TO THE TIME OF SALE. THIS TERM SHEET IS NOT AN OFFER TO SELL THESE SECURITIES AND IT IS NOT A SOLICITATION OF AN OFFER TO BUY THESE SECURITIES IN ANY JURISDICTION WHERE THE OFFER OR SALE IS NOT PERMITTED. | ||
| 77 | ||
| Multifamily – Mid Rise | Loan #7 | Cut-off Date Balance: | $44,600,000 | |
| 5506 & 5416 Detroit Avenue | Welleon | Cut-off Date LTV: | 65.1% | |
Cleveland, OH 44102
| UW NCF DSCR: | 1.25x | ||
| UW NOI Debt Yield: | 8.0% |
The Properties. The Welleon Property consists of a newly constructed seven-story, 130-unit Class A apartment building located in Cleveland, Ohio, as well as a separate two-story building that was built in 1910 that contains three apartment units on the upper floor and a retail space on the lower floor. Construction of the Welleon Property began in October 2021, with units completed in phases between August 2023 and May 2024. As of the October 30, 2024 rent roll, the apartments were 91.5% occupied. The Welleon Property’s 130 units are comprised of 20 studio apartments (15.4%), 100 one-bedroom apartments (76.9%), and 10 two-bedroom apartments (7.7%). Amenities available to residents of the Welleon Property include a penthouse lounge equipped with grills and a fireplace with televisions and a kitchenette, rooftop pool and lounge area, a lake-facing outdoor terrace, fitness center, wellness studio, and bicycle storage. Parking for residents includes a 97-space parking garage below the Welleon Property and a 37-space surface parking lot.
The Welleon Property has 16,651 square feet of street level retail space that is currently 68.8% leased to two tenants, Bluemoon Holdings, LLC and Banter Beer and Wine. See “Commercial Tenancy” below for additional detail.
Additionally, the Welleon Property benefits from two economic packages offered by the City of Cleveland to help spur multifamily development. The residential portion of the Welleon Property benefits from a 15-year 100.0% tax abatement that commenced in 2024 and benefits from a non-school approximate 35.0% tax abatement through a tax increment financing (“TIF”) agreement with a 30-year term that commenced in 2022. The tax abatement and TIF package continue for 10 and 23 years, respectively, past the maturity date of the Welleon Mortgage Loan. Given the 15-year 100% abatement, the 35% TIF abatement will only have an economic impact on the residential component after the expiration of the 100% abatement. The commercial component of the Welleon Property benefits from the same 35.0% TIF agreement, which has a total term of 30 years and is currently in place. Without the tax abatement, the Welleon Property’s expense load increases by approximately $1 million to $1.84 million annually resulting in an underwritten debt yield of 5.70%.
The following table sets forth certain information regarding the Welleon Property:
| Property Summary(1) | ||||||||
| Description | Total Units | Occupied Units | Vacant Units | Unit SF | Total SF | Avg In-Place Rent Per Unit | Avg In-Place Rent Per SF | Total In-Place Rent |
| Studio | 20 | 15 | 5 | 537 | 10,730 | 1,721 | $3.21 | 309,780 |
| 1 Bedroom | 100 | 96 | 4 | 807 | 80,710 | 2,488 | $3.08 | 2,866,092 |
| 2 Bedroom | 10 | 8 | 2 | 1134 | 11,336 | 3,900 | $3.44 | 374,400 |
| Total / Wtd. Avg. | 130 | 119 | 11 | 791 | 102,776 | 2,486 | $3.12 | 3,550,272 |
| (1) | Source: Appraisal and underwritten rent roll. |
The following table presents Commercial Tenancy at the Welleon Property:
| Commercial Tenancy(1) | ||||||
| Tenant Name | Tenant NRSF | % of NRSF | Annual U/W Rent | % of Total Annual U/W Commercial Rent | Annual U/W Rent PSF | Lease Expiration Date |
| Bluemoon Holdings, LLC dba NUIQ, PureFyx, & Soulspace | 8,851 | 53.2% | $247,828 | 80.3% | $28.00 | 7/31/2035 |
| Banter Beer and Wine | 2,600 | 15.6% | $60,694 | 19.7% | $23.34 | 8/31/2026 |
| Total/Wtd. Avg. | 11,451 | 68.8% | $308,522 | 100.0% | $26.94 | |
| Vacant Space | 5,200 | 31.2% | ||||
| Total/Wtd. Avg. | 16,651 | 100.0% | ||||
| (1) | Based on the underwritten rent roll dated October 30, 2024. |
The Market. The Welleon Property is located in the Gordon Square Arts District multifamily submarket. According to a third party report, as of December 2024, submarket vacancy is 14.5% and the submarket asking rent per unit for studios, 1-bedroom, 2- bedroom and 3-bedroom is $1,224, $1,514, $2,057 and $2,921, respectively.
Appraisal. According to the appraisal, the Welleon Property had an “as-is with abatement value” appraised value of $68,500,000 and an “as is market value” (excluding the net present value of abated taxes and projected lease-up costs) of $52,300,000 as of October 1, 2024.
Environmental Matters. According to the Phase I environmental report dated October 14, 2024, there was evidence of a controlled recognized environmental condition at the Welleon Property based on the Welleon Property being granted Urban Setting Designation by the Ohio Environmental Protection Agency, as more fully described in “Description of the Mortgage Pool—Environmental Considerations” in the Preliminary Prospectus.
| THE INFORMATION IN THIS STRUCTURAL AND COLLATERAL TERM SHEET IS NOT COMPLETE AND MAY BE AMENDED PRIOR TO THE TIME OF SALE. THIS TERM SHEET IS NOT AN OFFER TO SELL THESE SECURITIES AND IT IS NOT A SOLICITATION OF AN OFFER TO BUY THESE SECURITIES IN ANY JURISDICTION WHERE THE OFFER OR SALE IS NOT PERMITTED. | ||
| 78 | ||
| Multifamily – Mid Rise | Loan #7 | Cut-off Date Balance: | $44,600,000 | |
| 5506 & 5416 Detroit Avenue | Welleon | Cut-off Date LTV: | 65.1% | |
Cleveland, OH 44102
| UW NCF DSCR: | 1.25x | ||
| UW NOI Debt Yield: | 8.0% |
Operating History and Underwritten Net Cash Flow. The following table presents certain information relating to the historical operating performance and underwritten net cash flow at the Welleon Property:
| Cash Flow Analysis(1) | ||
| U/W(2) | U/W $ per Unit | |
| Underwritten Residential Potential Rent | $3,846,906 | $29,592 |
| Residential Vacancy Loss | (296,634) | ($2,282) |
| Residential Bad Debt Loss | (19,235) | ($148) |
| Residential Concessions | 0 | $0 |
| Residential Non-Revenue Unit Loss | (48,960) | ($377) |
| Net Residential Revenue | $3,482,077 | $26,785 |
| Parking Income | 255,600 | $1,966 |
| Other Miscellaneous Revenue | 344,143 | $2,647 |
| Net Commercial Revenue | 308,522 | $2,373 |
| Effective Gross Revenue | $4,390,343 | $33,772 |
| Real Estate Taxes | 50,378 | $388 |
| Insurance | 77,843 | $599 |
| Utilities | 276,120 | $2,124 |
| Repairs & Maintenance | 138,925 | $1,069 |
| Management Fee | 87,807 | $675 |
| Payroll (Office, Security, Maintenance) | 128,069 | $985 |
| Advertising | 32,692 | $251 |
| General and Administrative - Direct | 32,936 | $253 |
| Total Expenses | $824,770 | $6,344 |
| Net Operating Income | $3,565,573 | $27,427 |
| CapEx | 26,000 | $200 |
| TI/LC | 14,426 | $111 |
| Net Cash Flow | $3,525,147 | $27,117 |
| Occupancy(3) | 92.3% | |
| NOI DSCR | 1.27x | |
| NCF DSCR | 1.25x | |
| NOI Debt Yield | 8.0% | |
| NCF Debt Yield | 7.9% | |
| (1) | Historical Financials are unavailable due to the Welleon Property’s recent construction which was completed in phases between August 2023 and May 2024. |
| (2) | Based on the underwritten cash flow dated October 30, 2024. |
| (3) | Based on an economic vacancy of 7.7%. |
Escrows and Reserves. At origination, the borrower deposited (a) approximately $38,922 into an upfront insurance reserve, (b) approximately $50,248 into an upfront tax reserve and (c) approximately $90,334 into an unfunded obligations reserve related to outstanding leasing commissions for retail tenant Bluemoon Holdings, LLC.
Tax Escrows – On each payment date the borrower is required to deposit into a real estate tax reserve an amount equal to 1/12th of the amount that the lender reasonably estimates will be necessary to pay real estate taxes over the next 12-month period, currently estimated to equal $8,388.
| THE INFORMATION IN THIS STRUCTURAL AND COLLATERAL TERM SHEET IS NOT COMPLETE AND MAY BE AMENDED PRIOR TO THE TIME OF SALE. THIS TERM SHEET IS NOT AN OFFER TO SELL THESE SECURITIES AND IT IS NOT A SOLICITATION OF AN OFFER TO BUY THESE SECURITIES IN ANY JURISDICTION WHERE THE OFFER OR SALE IS NOT PERMITTED. | ||
| 79 | ||
| Multifamily – Mid Rise | Loan #7 | Cut-off Date Balance: | $44,600,000 | |
| 5506 & 5416 Detroit Avenue | Welleon | Cut-off Date LTV: | 65.1% | |
Cleveland, OH 44102
| UW NCF DSCR: | 1.25x | ||
| UW NOI Debt Yield: | 8.0% |
Insurance Escrows – On each payment date, the borrower is required to deposit into an insurance reserve an amount equal to 1/12th of the amount that the lender reasonably estimates will be necessary to cover premiums over the next 12-month period, currently estimated to equal $6,487.
TI/LC Reserve – On each payment date, if and to the extent the amount in the TI/LC reserve is less than $66,604, the borrower is required to deposit approximately $1,388 into a tenant improvement and leasing commissions reserve.
Capital Expenditure Reserve – On each payment date, the borrower is required to deposit approximately $2,167 into a capital expenditure account, equal to approximately $200 per unit per annum.
Property Management. The Welleon Property is managed by RHM Real Estate, Inc.
Lockbox / Cash Management. The Welleon Mortgage Loan is structured with no lockbox or cash management provisions. A cash flow sweep will trigger if the debt service coverage ratio, based on the actual interest-only debt service, falls below 1.15x and will continue until the debt service coverage ratio is equal to or greater than 1.15x at the first day of two consecutive fiscal quarters thereafter. During any Welleon Trigger Period (as defined below) or during the continuance of an event of default, the borrower will remit to the lender all excess cash flow after payment of approved operating expenses and capital expenditures (pursuant to a budget approved by the lender), debt service, and the reserves described above. The lender will hold such excess cash flow in a reserve account until the termination of the Welleon Trigger Period or the cure of the event of default, at which time all excess cash flow reserved by the lender will be disbursed to the borrower.
A “Welleon Trigger Period” means each period that commences (a) as of the fiscal quarter which commences on April 1, 2025 and as of the first day of any fiscal quarter thereafter, each period that commences when the debt service coverage ratio, determined as of the first day of any such fiscal quarter, is less than the 1.15x and concludes when the debt service coverage ratio, determined as of the first day of each of two consecutive fiscal quarters thereafter, is equal to or greater than 1.15x; and (b) if the financial reports required pursuant to the Welleon Mortgage Loan documents are not delivered to the lender when required (subject, in any event, to the notice and cure period specified in Welleon Mortgage Loan documents), a Welleon Trigger Period will be deemed to have commenced and be ongoing, unless and until such reports are delivered and they indicate that, in fact, no Welleon Trigger Period is ongoing.
Terrorism Insurance. The borrower is required to obtain and maintain property insurance and business interruption insurance for 12 months plus a 365-day extended period of indemnity. Such insurance is required to cover perils of terrorism and acts of terrorism. See “Risk Factors—Risks Relating to the Mortgage Loans—Terrorism Insurance May Not Be Available for All Mortgaged Properties” in the Preliminary Prospectus.
| THE INFORMATION IN THIS STRUCTURAL AND COLLATERAL TERM SHEET IS NOT COMPLETE AND MAY BE AMENDED PRIOR TO THE TIME OF SALE. THIS TERM SHEET IS NOT AN OFFER TO SELL THESE SECURITIES AND IT IS NOT A SOLICITATION OF AN OFFER TO BUY THESE SECURITIES IN ANY JURISDICTION WHERE THE OFFER OR SALE IS NOT PERMITTED. | ||
| 80 | ||
| Multifamily – Garden | Loan #8 | Cut-off Date Balance: | $42,000,000 | |
| 11054 Warwick Boulevard | Christopher Crossing Apartments | Cut-off Date LTV: | 72.3% | |
| Newport News, VA 23601 | U/W NCF DSCR: | 1.39x | ||
| U/W NOI Debt Yield: | 9.7% |
| THE INFORMATION IN THIS STRUCTURAL AND COLLATERAL TERM SHEET IS NOT COMPLETE AND MAY BE AMENDED PRIOR TO THE TIME OF SALE. THIS TERM SHEET IS NOT AN OFFER TO SELL THESE SECURITIES AND IT IS NOT A SOLICITATION OF AN OFFER TO BUY THESE SECURITIES IN ANY JURISDICTION WHERE THE OFFER OR SALE IS NOT PERMITTED. | ||
| 81 | ||
| Mortgage Loan No. 8 – Christopher Crossing Apartments |
| Mortgage Loan Information | Property Information | ||||||
| Mortgage Loan Seller: | AREF2 | Single Asset/Portfolio: | Single Asset | ||||
| Credit Assessment (KBRA/Fitch/Moody’s): | NR/NR/NR | Location: | Newport News, VA 23601 | ||||
| Original Balance: | $42,000,000 | General Property Type: | Multifamily | ||||
| Cut-off Date Balance: | $42,000,000 | Detailed Property Type: | Garden | ||||
| % of Initial Pool Balance: | 5.0% | Title Vesting: | Fee | ||||
| Loan Purpose: | Acquisition | Year Built/Renovated: | 1963/2018 | ||||
| Borrower Sponsors: | Tzvi Safirstein, Michael Stern, Avrohom Farber and David Salamon | Size: | 531 Units | ||||
| Guarantors: | Tzvi Safirstein, Michael Stern, Avrohom Farber and David Salamon | Cut-off Date Balance per Unit: | $79,096 | ||||
| Mortgage Rate: | 6.6100% | Maturity Date Balance per Unit: | $79,096 | ||||
| Note Date: | 10/31/2024 | Property Manager: | Nexus Management Company LLC | ||||
| Maturity Date: | 11/6/2029 | Underwriting and Financial Information | |||||
| Term to Maturity: | 60 months | UW NOI: | $4,056,129 | ||||
| Amortization Term: | 0 months | UW NCF: | $3,915,424 | ||||
| IO Period: | 60 months | UW NOI Debt Yield: | 9.7% | ||||
| Seasoning: | 2 months | UW NCF Debt Yield: | 9.3% | ||||
| Prepayment Provisions: | L(26),D(27),O(7) | UW NOI Debt Yield at Maturity: | 9.7% | ||||
| Lockbox/Cash Mgmt Status: | Springing/Springing | UW NCF DSCR: | 1.39x | ||||
| Additional Debt Type:(1) | Mezzanine | Most Recent NOI: | $3,897,891 (8/31/2024 TTM) | ||||
| Additional Debt Balance:(1) | $5,500,000 | 2nd Most Recent NOI: | $3,422,601 (12/31/2023) | ||||
| Future Debt Permitted (Type): | No (NAP) | 3rd Most Recent NOI: | $3,128,950 (12/31/2022) | ||||
| Most Recent Occupancy: | 94.7% (10/23/2024) | ||||||
| Reserves(2) | 2nd Most Recent Occupancy: | 93.4% (12/1/2023) | |||||
| Type | Initial | Monthly | Cap | 3rd Most Recent Occupancy: | 91.3% (12/1/2022) | ||
| RE Taxes: | $56,052 | $56,052 | NAP | Appraised Value (as of): | $58,100,000 (10/9/2024) | ||
| Insurance: | $62,694 | $31,347 | NAP | Appraised Value per Unit: | $109,416 | ||
| Replacement Reserve: | $0 | $11,726 | NAP | Cut-off Date LTV Ratio: | 72.3% | ||
| Deferred Maintenance: | $156,580 | $0 | NAP | Maturity Date LTV Ratio: | 72.3% | ||
| Sources and Uses | ||||||
| Sources | Proceeds | % of Total | Uses | Proceeds | % of Total | |
| Loan Amount: | $42,000,000 | 66.0% | Purchase: | $57,000,000 | 89.6% | |
| Additional Sponsor Equity: | $13,127,067 | 20.6% | Closing Costs:(3) | $3,351,741 | 5.3% | |
| Mezzanine Initial Advance:(1) | $5,500,000 | 8.6% | Upfront Mezzanine Reserve:(1) | $3,000,000 | 4.7% | |
| Mezzanine Additional Advance:(1) | $3,000,000 | 4.7% | Upfront Reserves: | $275,325 | 0.4% | |
| Total Sources: | $63,627,067 | 100.0% | Total Uses: | $63,627,067 | 100.0% | |
| (1) | The Christopher Crossing Apartments Mezzanine Loan (as defined below) includes a $5,500,000 initial advance and a $3,000,000 additional advance to fund future capital expenditures. See “Subordinate and Mezzanine Indebtedness” below for further discussion. |
| (2) | See “Escrows and Reserves” below for further discussion. |
| (3) | Closing Costs include an origination fee of $1,680,000. |
The Mortgage Loan. The eighth largest mortgage loan (the “Christopher Crossing Apartments Mortgage Loan”) is evidenced by a promissory note in the original principal amount of $42,000,000 and secured by a first-priority fee mortgage encumbering a 531-unit garden style multifamily property in Newport News, Virginia (the “Christopher Crossing Apartments Property”).
The Borrower and the Borrower Sponsors. The borrower for the Christopher Crossing Apartments Mortgage Loan is Christopher Crossing Apts LLC, a single-purpose, Delaware limited liability company, with one independent director in its organizational structure. Legal counsel to the borrower delivered a non-consolidation opinion in connection with the origination of the Christopher Crossing Apartments Mortgage Loan. The borrower sponsors and non-recourse carve-out guarantors for the Christopher Crossing Apartments Mortgage Loan are Tzvi Safirstein, Michael Stern, Avrohom Farber and David Salamon. Tzvi Safirstein, Michael Stern and Avrohom Farber are principals of The Temple Group, a real estate investment firm specializing in multifamily properties. Since its establishment in 2021, The Temple Group has acquired over 2,000 multifamily units across various states including Florida, Texas and Virginia. David Salamon is an individual real estate investor who currently owns seven commercial properties with a market value of approximately $45.0 million.
The Property. The Christopher Crossing Apartments Property is a 531-unit, garden-style multifamily complex located in Newport News, Virginia, approximately three miles from Interstate 64, which provides access to Richmond and Norfolk. Situated on a 25.51-acre site, the improvements consist of 44 two- and three-story residential buildings and one leasing office constructed in 1963. The Christopher Crossing Apartments Property features amenities such as a swimming pool, playground, picnic area, dog park, fitness center and tennis court. Unit amenities include in-unit laundry, granite countertops, dishwashers, walk-in closets and balconies. The Christopher Crossing Apartments Property features 728 surface parking spaces, resulting in a parking ratio of 1.37 spaces per unit.
| THE INFORMATION IN THIS STRUCTURAL AND COLLATERAL TERM SHEET IS NOT COMPLETE AND MAY BE AMENDED PRIOR TO THE TIME OF SALE. THIS TERM SHEET IS NOT AN OFFER TO SELL THESE SECURITIES AND IT IS NOT A SOLICITATION OF AN OFFER TO BUY THESE SECURITIES IN ANY JURISDICTION WHERE THE OFFER OR SALE IS NOT PERMITTED. | ||
| 82 | ||
| Multifamily – Garden | Loan #8 | Cut-off Date Balance: | $42,000,000 | |
| 11054 Warwick Boulevard | Christopher Crossing Apartments | Cut-off Date LTV: | 72.3% | |
| Newport News, VA 23601 | U/W NCF DSCR: | 1.39x | ||
| U/W NOI Debt Yield: | 9.7% |
Previous ownership completed extensive renovations totaling approximately $14.9 million ($28,000 per unit) in 2018. Renovations included updates to the infrastructure including tree removal, plumbing, roofing and HVAC repairs, as well as unit interior renovations including updates to the cabinetry and flooring and painting. Going forward, the borrower sponsors plan to invest approximately $3.7 million ($6,983 per unit) in additional renovations to all 531 units on a turn-by-turn basis as well as updates to exterior and community amenities. The Christopher Crossing Apartments Mezzanine Loan (as defined below) features $3.0 million of additional advance to fund the future capital expenditures, which was reserved in connection with the origination of the Christopher Crossing Apartments Mezzanine Loan. The Christopher Crossing Apartments Mortgage Loan is structured with a completion guaranty to ensure completion of these renovations.
As of October 23, 2024, the Christopher Crossing Apartments Property was 94.7% occupied. The unit mix at the Christopher Crossing Apartments Property is comprised of 97 one-bedroom units, 411 two-bedroom units and 23 three-bedroom units. As of October 2024, there were 18 tenants that utilized Section 8 vouchers.
The following table presents certain information relating to the unit mix at the Christopher Crossing Apartments Property:
| Unit Mix(1) | |||||||
| Unit Mix / Type | Units | Occupied Units | % Occupied | Average SF per Unit | Total SF | Monthly Average Rent per Unit(2) | Monthly Average Market Rent per Unit(3) |
| One Bedroom | 97 | 93 | 95.9% | 606 | 58,760 | $971 | $1,058 |
| Two Bedroom | 411 | 388 | 94.4% | 860 | 353,602 | $1,164 | $1,208 |
| Three Bedroom | 23 | 22 | 95.7% | 1,150 | 26,460 | $1,465 | $1,485 |
| Total/Wtd. Avg. | 531 | 503 | 94.7% | 826 | 438,822 | $1,141 | $1,192 |
| (1) | Based on the borrower rent roll dated October 23, 2024. |
| (2) | Monthly Average Rent per Unit is based on occupied units. |
| (3) | Source: Appraisal. |
The Market. The Christopher Crossing Apartments Property is located in Newport News, Virginia approximately 71 miles southeast of Richmond. Newport News is on the southeastern end of the Virginia Peninsula, on the northern shore of the James River. Highways serving the city include Interstates 64 and 664, U.S. Routes 17 and 60 and State Routes 143 and 171. Air transportation is provided by Newport News/Williamsburg International Airport, a public use airport in the central portion of the city. The local economy is primarily driven by the maritime industry and features one of the largest shipbuilding facilities in the world, Newport News Shipbuilding, which employs approximately 23,000 people. Other major employers in Newport News include Riverside Regional Medical Center, Newport News Public School District and the City of Newport News. The primary office employment hub in the immediate area is centered around the Newport News City Center at Oyster Point business district, a 52-acre mixed-use district that is approximately five miles northwest of the Christopher Crossing Apartments Property.
According to the appraisal, the 2023 estimated population within a one-, three- and five-mile radius of the Christopher Crossing Apartments Property is 7,036, 67,272 and 152,498, respectively. The 2023 estimated median household income within the same radii was $61,509, $63,643 and $63,136, respectively.
According to the appraisal, the Christopher Crossing Apartments Property is situated in the Newport News multifamily submarket, which contained approximately 26,615 units as of the second quarter of 2024. The Newport News multifamily submarket reported a vacancy rate of 6.2% with an average effective rent of $1,358 per unit.
| THE INFORMATION IN THIS STRUCTURAL AND COLLATERAL TERM SHEET IS NOT COMPLETE AND MAY BE AMENDED PRIOR TO THE TIME OF SALE. THIS TERM SHEET IS NOT AN OFFER TO SELL THESE SECURITIES AND IT IS NOT A SOLICITATION OF AN OFFER TO BUY THESE SECURITIES IN ANY JURISDICTION WHERE THE OFFER OR SALE IS NOT PERMITTED. | ||
| 83 | ||
| Multifamily – Garden | Loan #8 | Cut-off Date Balance: | $42,000,000 | |
| 11054 Warwick Boulevard | Christopher Crossing Apartments | Cut-off Date LTV: | 72.3% | |
| Newport News, VA 23601 | U/W NCF DSCR: | 1.39x | ||
| U/W NOI Debt Yield: | 9.7% |
The following table presents information regarding certain competitive properties to the Christopher Crossing Apartments Property:
| Competitive Rental Properties Summary(1) | |||||
Property Name/Location
| Year Built
| # Units
| Occupancy
| Unit Mix
|
In-Place Monthly Rent per Unit
|
Christopher Crossing Apartments(2) Newport News, VA | 1963 | 531 | 94.7% | 1BR | $971 |
| 2BR | $1,164 | ||||
| 3BR | $1,465 | ||||
The Jamestown Apartments Newport News, VA | 1963 | 152 | 98.7% | 1BR | $1,100 |
| 2BR | $1,444 | ||||
| 3BR | $1,590 | ||||
Harborstone Newport News, VA | 1964 | 296 | 95.6% | 1BR | $1,061 |
| 2BR | $1,118 | ||||
| 3BR | $1,319 | ||||
The Point at Tech Center Newport News, VA | 1986 | 208 | 97.1% | 1BR | $1,356 |
| 2BR | $1,583 | ||||
| 3BR | N/A | ||||
Abbington Landing Newport News, VA | 1970 | 519 | 98.3% | 1BR | $1,286 |
| 2BR | $1,489 | ||||
| 3BR | $1,899 | ||||
Forest Lake at Oyster Pond Newport News, VA | 1986 | 296 | 91.0% | 1BR | $1,210 |
| 2BR | $1,339 | ||||
| 3BR | $1,664 | ||||
| (1) | Source: Appraisal. |
| (2) | Based on the borrower rent roll dated October 23, 2024. |
Appraisal. The appraisal concluded to an “as-is” appraised value as of October 9, 2024 of $58,100,000.
Environmental Matters. According to the Phase I environmental report dated October 3, 2024, there was no evidence of any recognized environmental conditions at the Christopher Crossing Apartments Property.
| THE INFORMATION IN THIS STRUCTURAL AND COLLATERAL TERM SHEET IS NOT COMPLETE AND MAY BE AMENDED PRIOR TO THE TIME OF SALE. THIS TERM SHEET IS NOT AN OFFER TO SELL THESE SECURITIES AND IT IS NOT A SOLICITATION OF AN OFFER TO BUY THESE SECURITIES IN ANY JURISDICTION WHERE THE OFFER OR SALE IS NOT PERMITTED. | ||
| 84 | ||
| Multifamily – Garden | Loan #8 | Cut-off Date Balance: | $42,000,000 | |
| 11054 Warwick Boulevard | Christopher Crossing Apartments | Cut-off Date LTV: | 72.3% | |
| Newport News, VA 23601 | U/W NCF DSCR: | 1.39x | ||
| U/W NOI Debt Yield: | 9.7% |
Operating History and Underwritten Net Cash Flow. The following table presents certain information relating to the historical operating performance and underwritten net cash flow at the Christopher Crossing Apartments Property:
| Cash Flow Analysis | |||||
| 2022 | 2023 | 8/31/2024 TTM | UW | UW Per Unit | |
| Gross Potential Rent(1) | $7,655,471 | $7,346,773 | $7,978,283 | $7,286,190 | $13,722 |
| Other Income(2) | $617,927 | $608,547 | $683,440 | $683,440 | $1,287 |
| Net Rental Income | $8,273,398 | $7,955,320 | $8,661,723 | $7,969,630 | $15,009 |
| Less Vacancy, Concessions & Credit Loss | ($1,890,888) | ($923,544) | ($768,995) | ($453,814) | ($855) |
| Effective Gross Income | $6,382,510 | $7,031,776 | $7,892,729 | $7,515,817 | $14,154 |
| Real Estate Taxes | $567,531 | $677,131 | $717,176 | $672,621 | $1,267 |
| Insurance | $86,293 | $600,829 | $891,104 | $376,162 | $708 |
| Management Fee | $0 | $171,365 | $201,127 | $225,475 | $425 |
| Other Expenses | $2,599,736 | $2,159,851 | $2,185,430 | $2,185,430 | $4,116 |
| Total Operating Expenses | $3,253,560 | $3,609,176 | $3,994,837 | $3,459,688 | $6,515 |
| Net Operating Income | $3,128,950 | $3,422,601 | $3,897,891 | $4,056,129 | $7,639 |
| Capital Expenditures | $0 | $0 | $0 | $140,704 | $265 |
| Net Cash Flow | $3,128,950 | $3,422,601 | $3,897,891 | $3,915,424 | $7,374 |
| Occupancy | 91.3% | 93.4% | 94.7%(3) | 93.8%(4) | |
| NOI DSCR | 1.11x | 1.22x | 1.38x | 1.44x | |
| NCF DSCR | 1.11x | 1.22x | 1.38x | 1.39x | |
| NOI Debt Yield | 7.4% | 8.1% | 9.3% | 9.7% | |
| NCF Debt Yield | 7.4% | 8.1% | 9.3% | 9.3% | |
| (1) | UW Gross Potential Rent is based on the borrower rent roll dated October 23, 2024. |
| (2) | Other Income is comprised of utility reimbursements and other miscellaneous fees. |
| (3) | Represents occupancy based on the borrower rent roll dated October 23, 2024. |
| (4) | Based on an economic vacancy of 6.2% |
Escrows and Reserves. At origination, the borrower deposited into escrow (i) approximately $56,052 for real estate taxes, (ii) $62,694 for insurance premiums, and (iii) $156,580 for deferred maintenance.
Real Estate Taxes – On a monthly basis, the borrower is required to escrow 1/12th of the annual estimated tax payments, which currently equates to approximately $56,052.
Insurance – On a monthly basis, the borrower is required to escrow 1/12th of the insurance premiums that the lender estimates will be payable during the next 12 months, which currently equates to approximately $31,347.
Replacement Reserve – On a monthly basis, the borrower is required to escrow approximately $11,726 for replacement reserves.
Lockbox and Cash Management. The Christopher Crossing Apartments Mortgage Loan is structured with a springing lockbox and springing cash management. During the continuation of a Cash Management Period (as defined below), the Christopher Crossing Apartments Mortgage Loan documents require the borrower to deposit, or cause the property manager to deposit, all rents into the lockbox account within one business day of receipt. All funds in the lockbox account will be swept daily into a cash management account controlled by the lender and applied in accordance with the Christopher Crossing Apartments Mortgage Loan documents.
A “Cash Management Period” will commence upon the earliest of the following:
| (i) | the occurrence of an event of default; |
| (ii) | if as of the last day of any calendar quarter, the net operating income debt service coverage ratio (based on the trailing 12-month period as calculated by the lender) is less than 1.15x, provided that if the debt service coverage ratio is less than 1.15x and greater than 1.00x, the borrower has the option to deposit with the lender cash or a letter of credit in an amount (the “DSCR Cure Amount”) such that if the DSCR Cure Amount were used to prepay a portion of the debt, the debt service coverage ratio would be at least 1.15x. If the DSCR Cure Amount is deposited, the Cash Management Period will be deemed cured for the 12-month period immediately following the date on which the DSCR Cure Amount was deposited. On each one-year anniversary of such Cash Management Period, the borrower may deposit an additional DSCR Cure Amount as is necessary to maintain a debt service coverage ratio of 1.15x, and in each such case the Cash Management Period will again be deemed cured for the forward 12-month period; or |
| (iii) | the occurrence of an event of default under the Christopher Crossing Apartments Mezzanine Loan documents. |
| THE INFORMATION IN THIS STRUCTURAL AND COLLATERAL TERM SHEET IS NOT COMPLETE AND MAY BE AMENDED PRIOR TO THE TIME OF SALE. THIS TERM SHEET IS NOT AN OFFER TO SELL THESE SECURITIES AND IT IS NOT A SOLICITATION OF AN OFFER TO BUY THESE SECURITIES IN ANY JURISDICTION WHERE THE OFFER OR SALE IS NOT PERMITTED. | ||
| 85 | ||
| Multifamily – Garden | Loan #8 | Cut-off Date Balance: | $42,000,000 | |
| 11054 Warwick Boulevard | Christopher Crossing Apartments | Cut-off Date LTV: | 72.3% | |
| Newport News, VA 23601 | U/W NCF DSCR: | 1.39x | ||
| U/W NOI Debt Yield: | 9.7% |
A Cash Management Period will end upon the occurrence of the following:
| ● | with regard to clause (i), the cure of such event of default and no other event of default has occurred and is continuing; |
| ● | with regard to clause (ii), the net operating income debt service coverage ratio and net operating income debt yield (based on the trailing 12-month period as calculated by the lender) is at least 1.25x and 8.25%, respectively, for two consecutive calendar quarters; or |
| ● | with regard to clause (iii), the cure of such event of default and no other event of default had occurred and is continuing under the Christopher Crossing Apartments Mezzanine Loan documents. |
Subordinate and Mezzanine Indebtedness. Concurrently with the origination of the Christopher Crossing Apartments Mortgage Loan, an $8,500,000 mezzanine loan (the “Christopher Crossing Apartments Mezzanine Loan”) was originated by AP Chris Crossing Mezz Owner LLC. At origination, the mezzanine lender advanced $5,500,000 of the Christopher Crossing Apartments Mezzanine Loan to the borrower’s sole member, as the borrower under the Christopher Crossing Apartments Mezzanine Loan (the “Christopher Crossing Apartments Mezzanine Borrower”), while the remaining $3,000,000 was reserved and can be drawn within 36 months from the origination date of the Christopher Crossing Apartments Mezzanine Loan term and used for capital expenditures, subject to loan-to-value and debt yield tests. The interest rate under the Christopher Crossing Apartments Mezzanine Loan is 14.0% per annum, provided that to the extent that rents derived from the operation of the mortgaged property are insufficient to pay any monthly interest payment amount due under the Christopher Crossing Apartments Mezzanine Loan after the borrower has made any principal and interest payments due, and funded all reserves required under the Christopher Crossing Apartment Mortgage Loan by the related payment date, the Christopher Crossing Apartments Mezzanine Loan documents permit the Christopher Crossing Apartments Mezzanine Borrower to defer payment of such monthly interest amount due up to (i) 7.0% per annum during the first 12 months of the Christopher Crossing Apartments Mezzanine Loan term, (ii) 4.0% per annum thereafter from 12th through 24th month of the Christopher Crossing Apartment Mezzanine Loan term and (iii) 0% per annum thereafter, which deferred amounts will be added to the principal on the Christopher Crossing Apartments Mezzanine Loan.
Release of Property. None.
Substitution. None.
Letter of Credit. None.
Purchase Option/ RoFO/FoFR. None.
Ground lease. None.
Terrorism Insurance. The Christopher Crossing Apartments Mortgage Loan documents require that the “all risk” insurance policy required to be maintained by the borrower provides coverage for terrorism in an amount equal to the full replacement cost of the Christopher Crossing Apartments Property, as well as business interruption insurance covering no less than the 18-month period following the occurrence of a casualty event, together with a 12-month extended period of indemnity.
| THE INFORMATION IN THIS STRUCTURAL AND COLLATERAL TERM SHEET IS NOT COMPLETE AND MAY BE AMENDED PRIOR TO THE TIME OF SALE. THIS TERM SHEET IS NOT AN OFFER TO SELL THESE SECURITIES AND IT IS NOT A SOLICITATION OF AN OFFER TO BUY THESE SECURITIES IN ANY JURISDICTION WHERE THE OFFER OR SALE IS NOT PERMITTED. | ||
| 86 | ||
| Office - CBD | Loan #9 | Cut-off Date Balance: | $40,000,000 | |
| 240 West 40th Street | 240 West 40th Street | Cut-off Date LTV: | 49.4% | |
| New York, NY 10018 | UW NCF DSCR: | 1.54x | ||
| UW NOI Debt Yield: | 13.1% |

| THE INFORMATION IN THIS STRUCTURAL AND COLLATERAL TERM SHEET IS NOT COMPLETE AND MAY BE AMENDED PRIOR TO THE TIME OF SALE. THIS TERM SHEET IS NOT AN OFFER TO SELL THESE SECURITIES AND IT IS NOT A SOLICITATION OF AN OFFER TO BUY THESE SECURITIES IN ANY JURISDICTION WHERE THE OFFER OR SALE IS NOT PERMITTED. | ||
| 87 | ||
| Office - CBD | Loan #9 | Cut-off Date Balance: | $40,000,000 | |
| 240 West 40th Street | 240 West 40th Street | Cut-off Date LTV: | 49.4% | |
| New York, NY 10018 | UW NCF DSCR: | 1.54x | ||
| UW NOI Debt Yield: | 13.1% |
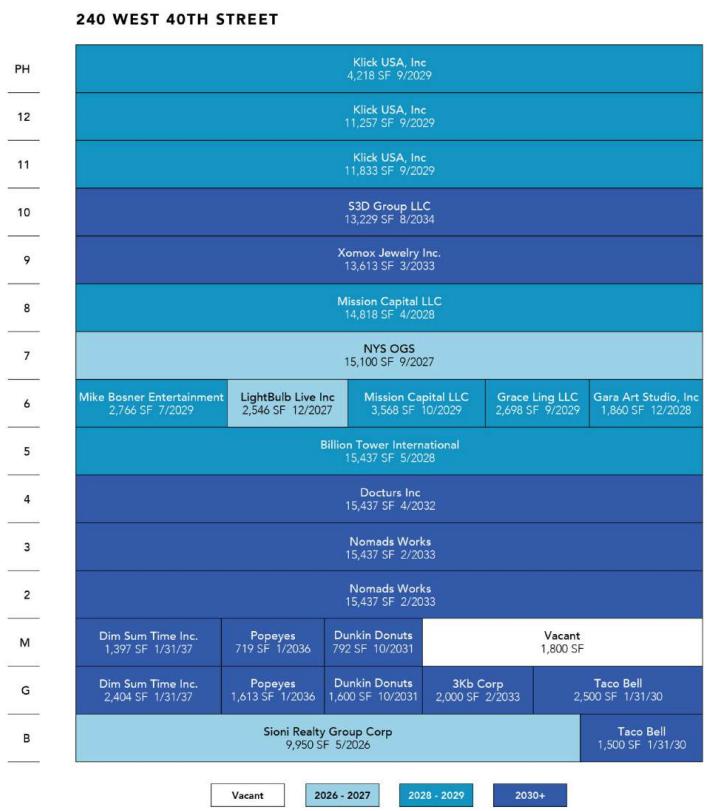
| THE INFORMATION IN THIS STRUCTURAL AND COLLATERAL TERM SHEET IS NOT COMPLETE AND MAY BE AMENDED PRIOR TO THE TIME OF SALE. THIS TERM SHEET IS NOT AN OFFER TO SELL THESE SECURITIES AND IT IS NOT A SOLICITATION OF AN OFFER TO BUY THESE SECURITIES IN ANY JURISDICTION WHERE THE OFFER OR SALE IS NOT PERMITTED. | ||
| 88 | ||
| Office - CBD | Loan #9 | Cut-off Date Balance: | $40,000,000 | |
| 240 West 40th Street | 240 West 40th Street | Cut-off Date LTV: | 49.4% | |
| New York, NY 10018 | UW NCF DSCR: | 1.54x | ||
| UW NOI Debt Yield: | 13.1% |
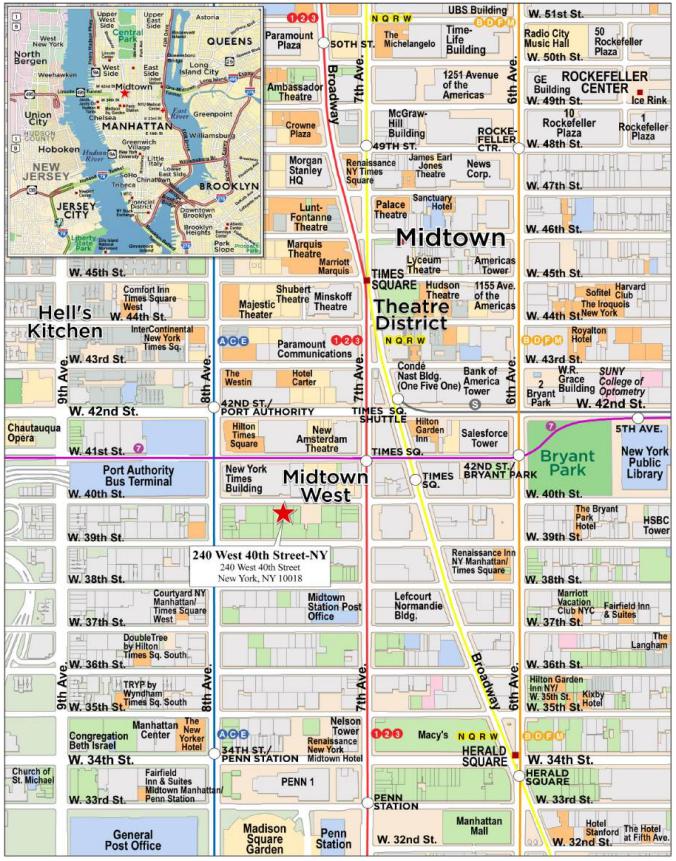
| THE INFORMATION IN THIS STRUCTURAL AND COLLATERAL TERM SHEET IS NOT COMPLETE AND MAY BE AMENDED PRIOR TO THE TIME OF SALE. THIS TERM SHEET IS NOT AN OFFER TO SELL THESE SECURITIES AND IT IS NOT A SOLICITATION OF AN OFFER TO BUY THESE SECURITIES IN ANY JURISDICTION WHERE THE OFFER OR SALE IS NOT PERMITTED. | ||
| 89 | ||
| Mortgage Loan No. 9 – 240 West 40th Street |
| Mortgage Loan Information | Property Information | ||||||
| Mortgage Loan Seller: | WFB | Single Asset/Portfolio: | Single Asset | ||||
| Credit Assessment (Fitch/Moody’s/KBRA): | NR/NR/NR | Location: | New York, NY 10018 | ||||
| Original Balance: | $40,000,000 | General Property Type: | Office | ||||
| Cut-off Date Balance: | $40,000,000 | Detailed Property Type: | CBD | ||||
| % of Initial Pool Balance: | 4.8% | Title Vesting: | Fee | ||||
| Loan Purpose: | Refinance | Year Built/Renovated: | 1923/2022 | ||||
| Borrower Sponsors: | Payman Yadidi & Pajman Yadidi | Size: | 185,529 SF | ||||
| Guarantors: | Payman Yadidi & Pajman Yadidi | Cut-off Date Balance PSF: | $216 | ||||
| Mortgage Rate: | 7.7250% | Maturity Balance PSF: | $216 | ||||
| Note Date: | 11/27/2024 | Property Manager: | Self-Managed | ||||
| Maturity Date: | 12/11/2029 | ||||||
| Term to Maturity: | 60 months | ||||||
| Amortization Term: | 0 months | Underwriting and Financial Information | |||||
| IO Period: | 60 months | UW NOI: | $5,223,031 | ||||
| Seasoning: | 1 month | UW NCF | $4,814,867 | ||||
| Prepayment Provisions: | L(25),D(31),O(4) | UW NOI Debt Yield: | 13.1% | ||||
| Lockbox/Cash Mgmt Status: | Hard/In place | UW NCF Debt Yield: | 12.0% | ||||
| Additional Debt Type: | NAP | UW NOI Debt Yield at Maturity: | 13.1% | ||||
| Additional Debt Balance: | NAP | UW NCF DSCR: | 1.54x | ||||
| Future Debt Permitted (Type): | No (NAP) | Most Recent NOI(2): | $3,751,885 (9/30/2024 TTM) | ||||
| 2nd Most Recent NOI(2): | $2,859,639 (12/31/2023) | ||||||
| 3rd Most Recent NOI(2): | $2,271,873 (12/31/2022) | ||||||
| Reserves(1) | Most Recent Occupancy(2): | 99.0% (10/9/2024) | |||||
| Type | Initial | Monthly | Cap | 2nd Most Recent Occupancy(2): | 77.4% (12/31/2023) | ||
| RE Taxes: | $0 | $196,735 | NAP | 3rd Most Recent Occupancy(2): | 68.4% (12/31/2022) | ||
| Insurance: | $0 | Springing | NAP | Appraised Value (as of): | $81,000,000 (7/24/2024) | ||
| Replacement Reserve: | $0 | $3,092 | NAP | Appraised Value PSF: | $437 | ||
| TI/LC Reserves: | $1,000,000 | $30,922 | NAP | Cut-off Date LTV Ratio: | 49.4% | ||
| Rent Concession Reserve: | $708,203 | $0 | NAP | Maturity Date LTV Ratio: | 49.4% | ||
| Sources and Uses | ||||||
| Sources | Proceeds | % of Total | Uses | Proceeds | % of Total | |
| Loan Amount: | $40,000,000 | 81.3% | Loan Payoff(3): | $45,704,476 | 92.9% | |
| Sponsor Equity: | $9,215,327 | 18.7% | Upfront Reserves: | $1,708,203 | 3.5% | |
| Closing Costs: | $1,802,647 | 3.7% | ||||
| Total Sources: | $49,215,327 | 100.0% | Total Uses: | $49,215,327 | 100.0% | |
| (1) | See “Escrows” section. |
| (2) | The increase in NOI and occupancy was primarily attributable to the renovation and subsequent re-leasing of the property. The office space was 100% leased to Donna Karan, which vacated at its lease maturity in July 2020. The borrower sponsors subsequently completed a renovation in 2022 and re-leased the office space between 2021 and 2024 to 13 tenants. |
| (3) | The 240 West 40th Street Mortgage Loan is a refinancing of prior mortgage debt of the borrower that was the subject of a discounted pay off in the amount of $52,000,000. The Loan payoff shown above reflects the net payoff inclusive of interest, processing fees, escrow and deposit credits. |
The Mortgage Loan. The ninth largest mortgage loan (the “240 West 40th Street Mortgage Loan”) is evidenced by a single promissory note in the original principal balance of $40,000,000 and secured by the borrower’s first priority fee interest in an office building with ground floor retail totaling 185,529 square feet located in New York, New York (the “240 West 40th Street Property”).
The Borrower and the Borrower Sponsors. The borrower is 240 W 40 LLC, a special purpose, bankruptcy-remote entity and a Delaware limited liability company with one independent director. Legal counsel to the borrower delivered a non-consolidation opinion in connection with the origination of the 240 West 40th Street Mortgage Loan.
The borrower sponsors and non-recourse carveout guarantors are Payman “Ray” Yadidi and Pajman “Jack” Yadidi. Ray and Jack Yadidi own Sioni Group, a New York based commercial landlord, developer, and management company, that currently has eight NYC office assets in their portfolio. The borrower and guarantors have full-recourse liability in the amount of $7,000,000 on a ‘last dollar’ basis for the 240 West 40th Street Mortgage Loan. The 240 West 40th Street Mortgage Loan is a refinancing of prior mortgage debt of the borrower that was the subject of a discounted pay-off. See “Description of the Mortgage Pool – Loan Purpose; Default History, Bankruptcy Issues and Other Proceedings” in the Preliminary Prospectus.
The Property. The 240 West 40th Street Property is a 13-story, 185,529 square foot Class B office building located in New York, NY that includes 10,117 square feet of ground floor retail space. The 240 West 40th Street Property was built in 1923 and most recently renovated by the borrower in 2022 for approximately $14.3 million. Renovations included replacing the roof, upgrading mechanical systems, elevator upgrades, expanding and enhancing the lobby, installing individual tenant HVAC units, as well as pre-building all of the office space. Historically, the office space was 100% leased to Donna Karan,
| THE INFORMATION IN THIS STRUCTURAL AND COLLATERAL TERM SHEET IS NOT COMPLETE AND MAY BE AMENDED PRIOR TO THE TIME OF SALE. THIS TERM SHEET IS NOT AN OFFER TO SELL THESE SECURITIES AND IT IS NOT A SOLICITATION OF AN OFFER TO BUY THESE SECURITIES IN ANY JURISDICTION WHERE THE OFFER OR SALE IS NOT PERMITTED. | ||
| 90 | ||
| Office - CBD | Loan #9 | Cut-off Date Balance: | $40,000,000 | |
| 240 West 40th Street | 240 West 40th Street | Cut-off Date LTV: | 49.4% | |
| New York, NY 10018 | UW NCF DSCR: | 1.54x | ||
| UW NOI Debt Yield: | 13.1% |
which vacated at its lease maturity in July 2020. The borrower sponsors subsequently completed the renovation, which was completed in 2022 and re-leased the office space between 2021 and 2024 to 13 tenants. As of October 9, 2024, the 240 West 40th Street Property was 99.0% occupied by 18 tenants with a weighted average lease term of approximately 7.2 years.
Major Tenants.
Nomad Works (30,874 SF, 16.6% of NRA; 15.3% of underwritten base rent). Nomad Works is a co-working tenant that offers a variety of working spaces including conferences rooms, shared coworking spaces, dedicated desks, podcast studio, conversation booths, and a meditation room. Nomad Works has two locations in Midtown Manhattan. Nomad Works has been a tenant at the 240 West 40th Street Property since 2022 and is on a lease expiring in February 2033 with no extension or termination options.
Klick USA, Inc. (27,308 SF, 14.7% of NRA; 20.0% of underwritten base rent). Klick USA, Inc. (“Klick”) is an independent commercialization partner for life sciences companies and provides services including marketing and advertising, media strategy and purchasing, medical affairs and medical communications, value and market access services. Klick was named 2024 Clio Health Independent Agency of the Year, London International Awards Global (and Regional) Independent Health & Pharma Agency of the Year, as well as Cannes Lions #2 Healthcare Agency and #2 Healthcare Network for the second year running. Cannes Lions also recognized Klick as the 2024 #3 Independent Agency of the Year. Founded in 1997, Klick has offices in New York, Philadelphia, Toronto, London, São Paulo, and Singapore. Klick has been a tenant since 2022 and is on a lease expiring in September 2029 with one, 5-year extension option. The tenant has the option to terminate its lease effective September 30, 2027 with notice by December 31, 2026 and by paying a termination fee equal to the landlord’s unamortized transaction costs (broker commissions, rent abatement, and landlord’s legal fees).
Mission Capital LLC (18,386 SF, 9.9% of NRA; 8.5% of underwritten base rent). Mission Capital LLC (doing business as “SBG Funding”) is a provider of alternative financing solutions for small and medium-sized businesses. Founded in 2017, the company offers a range of financial products designed to help businesses thrive. Mission Capital has been a tenant at the 240 West 40th Street Property since 2023 and Mission Capital LLC is on two leases expiring on April 30, 2028 (14,818 SF) and October 31, 2029 (3,568 SF).
The following table presents certain information relating to the tenancy at the 240 West 40th Street Property:
| Tenant Summary(1) | |||||||||
| Tenant Name | Credit Rating (Fitch/Moody's/S&P)(2) | Tenant SF | Approx % of Total SF | Annual UW Rent | % of Total Annual UW Rent | Annual UW Rent PSF | Lease Expiration | Term. Option (Y/N) | Renewal Options |
| Nomads Works | NR/NR/NR | 30,874 | 16.6% | $1,381,988 | 15.3% | $44.76 | 2/28/2033 | N | None |
| Klick | NR/NR/NR | 27,308 | 14.7% | $1,808,320(3) | 20.0% | $66.22 | 9/30/2029 | Y(4) | 1 x 5 Yr |
| Mission Capital LLC | NR/NR/NR | 18,386 | 9.9% | $768,434 | 8.5% | $41.79 | Various(5) | N | None |
| Docturs Inc | NR/NR/NR | 15,437 | 8.3% | $721,200 | 8.0% | $46.72 | 4/30/2032 | N | 1 x 10 Yr |
| Billion Tower International | NR/NR/NR | 15,437 | 8.30% | $664,958 | 7.4% | $43.08 | 5/31/2028 | N | None |
| Subtotal/Wtd. Avg. | 107,442 | 57.9% | $5,344,901 | 59.2% | $49.75 | ||||
| Other Tenants | 76,287 | 41.12% | $3,687,047 | 40.8% | $48.33 | ||||
| Occupied Collateral Total | 183,729 | 99.0% | $9,031,948 | 100.0% | $49.16 | ||||
| Vacant Space | 1,800 | 1.0% | |||||||
| Total/Wtd. Avg. | 185,529 | 100.0% | |||||||
| (1) | Based on the underwritten rent roll dated October 9, 2024. |
| (2) | Represents the credit rating of the parent company, whether or not the parent guarantees the lease. |
| (3) | Klick has outstanding rent abatements for October 2025, October 2026, October 2027 and October 2028. Related rent abatement amounts are included in the Rent Concession Reserve and the full unabated rent was underwritten. |
| (4) | Klick may terminate its lease effective September 30, 2027 with notice by December 31, 2026 and by paying a termination fee equal to the landlord’s unamortized transaction costs (broker commissions, rent abatement, and landlord’s legal fees). |
| (5) | Mission Capital LLC is on two leases expiring on April 30, 2028 (14,818 SF) and October 31, 2029 (3,568 SF). |
| THE INFORMATION IN THIS STRUCTURAL AND COLLATERAL TERM SHEET IS NOT COMPLETE AND MAY BE AMENDED PRIOR TO THE TIME OF SALE. THIS TERM SHEET IS NOT AN OFFER TO SELL THESE SECURITIES AND IT IS NOT A SOLICITATION OF AN OFFER TO BUY THESE SECURITIES IN ANY JURISDICTION WHERE THE OFFER OR SALE IS NOT PERMITTED. | ||
| 91 | ||
| Office - CBD | Loan #9 | Cut-off Date Balance: | $40,000,000 | |
| 240 West 40th Street | 240 West 40th Street | Cut-off Date LTV: | 49.4% | |
| New York, NY 10018 | UW NCF DSCR: | 1.54x | ||
| UW NOI Debt Yield: | 13.1% |
The following table presents certain information relating to the lease rollover schedule at the 240 West 40th Street Property:
| Lease Rollover Schedule(1)(2) | |||||||||
| Year | # of Leases Rolling | SF Rolling | Approx. % of Total SF Rolling | Approx. Cumulative % of SF Rolling | Total UW Rent Rolling(3) | Approx. % of Total Rent Rolling | Approx. Cumulative % of Total Rent Rolling | UW Rent PSF Rolling(3) | |
| MTM/2025 | 0 | 0 | 0.0% | 0.0% | $0 | 0.0% | 0.0% | $0.00 | |
| 2026 | 1 | 9,950 | 5.4% | 5.4% | $99,500 | 1.1% | 1.1% | $10.00 | |
| 2027 | 2 | 17,646 | 9.5% | 14.9% | $941,313 | 10.4% | 11.5% | $53.34 | |
| 2028 | 3 | 32,115 | 17.3% | 32.2% | $1,370,611 | 15.2% | 26.7% | $42.68 | |
| 2029 | 6 | 36,340 | 19.6% | 51.8% | $2,183,026 | 24.2% | 50.9% | $60.07 | |
| 2030 | 2 | 4,000 | 2.2% | 53.9% | $348,876 | 3.9% | 54.7% | $87.22 | |
| 2031 | 2 | 2,392 | 1.3% | 55.2% | $224,449 | 2.5% | 57.2% | $93.83 | |
| 2032 | 1 | 15,437 | 8.3% | 63.5% | $721,200 | 8.0% | 65.2% | $46.72 | |
| 2033 | 4 | 46,487 | 25.1% | 88.6% | $2,148,513 | 23.8% | 89.0% | $46.22 | |
| 2034 | 1 | 13,229 | 7.1% | 95.7% | $516,927 | 5.7% | 94.7% | $39.08 | |
| 2035 | 0 | 0 | 0.0% | 95.7% | $0 | 0.0% | 94.7% | $0.00 | |
| Thereafter | 4 | 6,133 | 3.3% | 99.0% | $477,532 | 5.3% | 100.0% | $77.86 | |
| Vacant | 0 | 1,800 | 1.0% | 100.0% | $0 | 0.0% | 100.0% | $0.00 | |
| Total/Wtd. Avg. | 26 | 185,529 | 100.0% | $9,031,948 | 100.0% | $49.16 | |||
| (1) | Based on the underwritten rent roll dated October 9, 2024. |
| (2) | Certain tenants may have lease termination options that are exercisable prior to the stated expiration date of the subject lease or leases which are not considered in the Lease Rollover Schedule. |
| (3) | Total UW Rent Rolling and Wtd. Avg. UW Rent PSF Rolling does not include vacant space. |
The Market. The 240 West 40th Street Property is located in New York, New York, 0.2 miles from Times Square, six blocks north of Penn Station, which provides access to NJ Transit and the Long Island Rail Road, and two blocks south of Port Authority Bus Terminal, which provides access to bus routes into New Jersey. According to the appraisal, the estimated 2023 population within a 0.25, 0.5 and one-mile radius was approximately 7,708, 40,834, and 176,746, respectively, and the estimated 2023 average household income within the same radii was approximately $167,709, $145,890, and $178,765, respectively.
According to the appraisal, the 240 West 40th Street Property is located within Times Square South office submarket of Midtown. As of the second quarter of 2024, the Times Square South office submarket reported a total inventory of approximately 35.7 million square feet with a 12.8% vacancy rate and an average asking rent of $51.99 per square foot, net. The appraisal identified twelve comparable buildings located within New York County with rents ranging from $33.00 to $70.00 per square foot, modified gross. The appraisal concluded a market rent for the 240 West 40th Street Property of $45.00 to $60.00 per square foot, modified gross, for the office space and $25 per square foot, gross, to $125 per square foot, modified gross, for the retail space.
The following table presents certain information relating to the appraisal’s market rent conclusions for the 240 West 40th Street Property:
| Market Rent Summary | |||||
| Office (Floors 2-10) | Office (11-PH) | Retail (Ground) | Retail (Mezzanine) | Basement | |
| Market Rent (PSF) | $45.00 | $60.00 | $125.00 | $25.00 | $25.00 |
| Lease Term (Years) | 5 | 5 | 10 | 10 | 10 |
| Lease Type | Modified Gross | Modified Gross | Modified Gross | Gross | Gross |
| Escalations | 2.5% annually | 2.5% annually | 3.0% annually | 3.0% annually | 3.0% annually |
| Tenant Improvements (New/Renewal) – First Generation | $50 / $25 | $50 / $25 | None | None | None |
| Tenant Improvements (New/Renewal) – Second Generation | $20 / $10 | $20 / $10 | None | None | None |
| Leasing Commissions (New/Renewal) | 4.9% / 2.4% | 4.9% / 2.4% | 4.0% / 2.0% | 4.0% / 2.0% | 4.0% / 2.0% |
| Free Rent (Months) (New/Renewal) | 4 / 2 | 4 / 2 | 6 / 3 | None | None |
| Source: Appraisal. |
| THE INFORMATION IN THIS STRUCTURAL AND COLLATERAL TERM SHEET IS NOT COMPLETE AND MAY BE AMENDED PRIOR TO THE TIME OF SALE. THIS TERM SHEET IS NOT AN OFFER TO SELL THESE SECURITIES AND IT IS NOT A SOLICITATION OF AN OFFER TO BUY THESE SECURITIES IN ANY JURISDICTION WHERE THE OFFER OR SALE IS NOT PERMITTED. | ||
| 92 | ||
| Office - CBD | Loan #9 | Cut-off Date Balance: | $40,000,000 | |
| 240 West 40th Street | 240 West 40th Street | Cut-off Date LTV: | 49.4% | |
| New York, NY 10018 | UW NCF DSCR: | 1.54x | ||
| UW NOI Debt Yield: | 13.1% |
The following table presents certain information relating to the appraisal’s market rent conclusions for the 240 West 40th Street Property:
| Comparable Office Leases(1) | ||||||||
| Property Name/Location | Year Built/ Renovated | Total GLA (SF) | Tenant | Tenant Size (SF) | Lease Start Date | Lease Term (months) | Annual Base Rent PSF | Lease Type |
240 West 40th Street, Times Square South, Midtown | 1923/2022 | 185,529(2) | ||||||
1040 Avenue of the Americas, Times Square South, Midtown | 1925/1979 | 255,000 | Dice Holdings Inc. | 12,007 | Mar-24 | 84 | $63.04 | Modified Gross |
1450 Broadway, Times Square South, Midtown | 1931/NAP | 388,060 | QVC | 13,357 | Mar-24 | 65 | $70.00 | Modified Gross |
250 West 39th Street, Times Square South, Midtown | 1926/2007 | 210,347 | Gemini Apparel International | 834 | Mar-24 | 61 | $38.00 | Modified Gross |
264 West 40th Street, Times Square South, Midtown | 1927/2004 | 130,000 | Act First Studios | 860 | Feb-24 | 85 | $34.88 | Modified Gross |
307 West 38th Street, Times Square South, Midtown | 1933/2004 | 325,000 | Paul Taylor Dance Company | 31,000 | Jan-24 | 360 | $33.00 | Modified Gross |
1400 Broadway, Times Square South, Midtown | 1930/NAP | 937,892 | Two Rivers Distribution | 14,307 | Jan-24 | 135 | $60.00 | Modified Gross |
8 West 38th Street, Times Square South, Midtown | 1913/NAP | 142,388 | The Dessy Group | 11,750 | Dec-23 | 64 | $45.50 | Modified Gross |
320 West 37th Street, Times Square South, Midtown | 1927/1989 | 125,800 | ASL Productions | 7,500 | Oct-23 | 126 | $37.00 | Modified Gross |
53 West 36th Street, Times Square South, Midtown | 1934/NAP | 78,582 | The RealReal, Inc | 13,880 | Sep-23 | 63 | $50.00 | Modified Gross |
8-10 West 37th Street, Times Square South, Midtown | 1900/NAP | 49,500 | KBKG, Inc. | 4,850 | Sep-23 | 38 | $41.00 | Modified Gross |
263 West 38th Street, Times Square South, Midtown | 1925/NAP | 193,182 | Advance Care Alliance of NY
| 5,729 | Aug-23 | 120 | $45.95 | Modified Gross |
104 West 40th Street, Times Square South, Midtown | 1963/NAP | 200,000 | HKMP LLP | 3,858 | Jul-23 | 130 | $50.00 | Modified Gross |
| (1) | Information obtained from the appraisal. |
| (2) | Information obtained from the underwritten rent roll. |
Appraisal. The appraisal concluded to an “as-is” value of $81,000,000 as of July 24, 2024 for the 240 West 40th Street Property.
Environmental Matters. According to the Phase I environmental site assessment dated July 30, 2024, there was no evidence of any recognized environmental conditions at the 240 West 40th Street Property.
| THE INFORMATION IN THIS STRUCTURAL AND COLLATERAL TERM SHEET IS NOT COMPLETE AND MAY BE AMENDED PRIOR TO THE TIME OF SALE. THIS TERM SHEET IS NOT AN OFFER TO SELL THESE SECURITIES AND IT IS NOT A SOLICITATION OF AN OFFER TO BUY THESE SECURITIES IN ANY JURISDICTION WHERE THE OFFER OR SALE IS NOT PERMITTED. | ||
| 93 | ||
| Office - CBD | Loan #9 | Cut-off Date Balance: | $40,000,000 | |
| 240 West 40th Street | 240 West 40th Street | Cut-off Date LTV: | 49.4% | |
| New York, NY 10018 | UW NCF DSCR: | 1.54x | ||
| UW NOI Debt Yield: | 13.1% |
Operating History and Underwritten Net Cash Flow. The following table presents certain information relating to the historical operating performance and underwritten net cash flow at the 240 West 40th Street Property:
| Cash Flow Analysis | ||||||
| 2021 | 2022 | 2023 | TTM 09/30/2024 | UW | UW PSF | |
| Base Rent | $1,558,635 | $5,152,665 | $5,513,411 | $6,532,140 | $8,354,552 | $45.03 |
| Grossed Up Vacant Space | 0 | 0 | 0 | 0 | 677,396 | 3.65 |
| Gross Potential Rent | $1,558,635 | $5,152,665 | $5,513,411 | $6,532,140 | $9,031,948 | $48.68 |
| Total Recoveries | 126,288 | 90,053 | 694,976 | 717,575 | 512,906 | 2.76 |
| Net Rental Income | $1,684,923 | $5,242,718 | $6,208,387 | $7,249,715 | $9,544,854 | $51.45 |
| (Vacancy & Credit Loss) | $0 | $0 | $0 | $0 | (677,396) | (3.65) |
| Effective Gross Income | $1,684,923 | $5,242,718 | $6,208,387 | $7,249,715 | $8,867,458 | $47.80 |
| Real Estate Taxes | 2,328,293 | 2,219,133 | 2,248,854 | 2,218,799 | 2,285,472 | 12.32 |
| Insurance | 62,794 | 70,003 | 114,645 | 118,795 | 127,931 | 0.69 |
| Management Fee | 0 | 0 | 0 | 0 | 266,024 | 1.43 |
| Other Operating Expenses | 536,345 | 681,709 | 985,249 | 1,160,236 | 965,000 | 5.20 |
| Total Expenses | $2,927,433 | $2,970,845 | $3,348,748 | $3,497,830 | $3,644,426 | $19.64 |
| Net Operating Income(1) | ($1,242,510) | $2,271,873 | $2,859,639 | $3,751,885 | $5,223,031 | $28.15 |
| Replacement Reserves | 0 | 0 | 0 | 0 | 37,106 | 0.20 |
| TI/LC | 0 | 0 | 0 | 0 | 371,058 | 2.00 |
| Net Cash Flow | ($1,242,510) | $2,271,873 | $2,859,639 | $3,751,885 | $4,814,867 | $25.95 |
| Occupancy %(2) | 9.3% | 68.4% | 77.4% | 99.0% | 92.5% | |
| NOI DSCR | (0.40)x | 0.73x | 0.91x | 1.20x | 1.67x | |
| NCF DSCR | (0.40)x | 0.73x | 0.91x | 1.20x | 1.54x | |
| NOI Debt Yield | (3.1)% | 5.7% | 7.1% | 9.4% | 13.1% | |
| NCF Debt Yield | (3.1)% | 5.7% | 7.1% | 9.4% | 12.0% | |
| (1) | The increase in Net Operating Income and occupancy year-over-year is due to the borrower sponsors renovating the property and subsequent re-leasing of the office space. The office space was 100% leased to Donna Karan, which vacated at its lease maturity in July 2020. The borrower sponsors subsequently completed a renovation in 2022 and re-leased the office space between 2021 and 2024 to 13 tenants. |
| (2) | The UW Occupancy % represents the in-place economic occupancy based on the underwritten rent roll dated October 9, 2024. Historical occupancies represent physical occupancies. |
Escrows and Reserves.
Real Estate Taxes – The loan documents require ongoing monthly reserves for real estate taxes in an amount equal to 1/12th of the real estate taxes that the lender estimates will be payable during the next 12 months, initially $196,735.
Insurance – The loan documents require ongoing monthly insurance reserves in an amount equal to 1/12th of the insurance premiums that the lender estimates will be payable for the renewal of the coverage afforded by the policies upon the expiration thereof; provided that no deposits are required if (i) no event of default is continuing, (ii) the borrower maintains insurance coverage for the property as part of blanket or umbrella coverage reasonably approved by the lender, and (iii) the borrower provides the lender with evidence of the renewals of the insurance policies and paid receipts for the payment of the insurance premiums no later than 10 business days prior to the expiration dates of the policies.
Replacement Reserve – The loan documents require an ongoing monthly replacement reserve deposit of $3,092.
Leasing Reserve – The loan documents require the borrower to make an upfront deposit of $1,000,000 and ongoing monthly deposits of $30,922 for tenant improvements and leasing commissions.
Rent Concession Reserve – The loan documents require the borrower to make an upfront deposit of $708,203 for future rent credits or abatements related to Klick, NYS OGS, Xomox Jewerly Inc., S3D Group, LLC, and Lightbulb Live Inc.
Lockbox and Cash Management. The 240 West 40th Street Mortgage Loan is structured with a hard lockbox and in place cash management. The borrower is required to direct the tenants to pay rent directly into the lockbox account, and to deposit any rents otherwise received in such account within one business day after receipt. On each business day, the lockbox bank is required to transfer amounts on deposit in the lockbox account into a lender controlled cash management account, which amounts are to be applied in accordance with the loan documents. If no Cash Trap Event Period (as defined below) exists, all excess cash flow will be disbursed to the borrower. During the continuance of a Cash Trap Event Period, excess cash flow is required to be held by the lender as additional collateral.
A “Cash Trap Event Period” will commence upon the earlier of the following:
| (i) | the occurrence and continuance of an event of default under the loan documents; or |
| (ii) | the debt service coverage ratio (“DSCR”) being less than 1.35x as of the end of any calendar quarter, |
| (iii) | the occurrence of a Material Tenant Cash Trap Event Period (as defined below). |
| THE INFORMATION IN THIS STRUCTURAL AND COLLATERAL TERM SHEET IS NOT COMPLETE AND MAY BE AMENDED PRIOR TO THE TIME OF SALE. THIS TERM SHEET IS NOT AN OFFER TO SELL THESE SECURITIES AND IT IS NOT A SOLICITATION OF AN OFFER TO BUY THESE SECURITIES IN ANY JURISDICTION WHERE THE OFFER OR SALE IS NOT PERMITTED. | ||
| 94 | ||
| Office - CBD | Loan #9 | Cut-off Date Balance: | $40,000,000 | |
| 240 West 40th Street | 240 West 40th Street | Cut-off Date LTV: | 49.4% | |
| New York, NY 10018 | UW NCF DSCR: | 1.54x | ||
| UW NOI Debt Yield: | 13.1% |
A Cash Trap Event Period will end upon the occurrence of the following:
| ● | with regard to clause (i), upon the cure of such event of default; |
| ● | with regard to clause (ii), upon DSCR being equal to or greater than 1.40x for two consecutive calendar quarters; |
| ● | with regard to clause (iii), a Material Tenant Cash Trap Event Period ceasing to exist. |
A “Material Tenant Cash Trap Event Period” will commence upon the earlier of the following:
| (i) | Klick, Nomad Works, or any lessee of their space (each a “Material Tenant”) and/or the borrower being in default under the applicable lease; |
| (ii) | a Material Tenant failing to be in actual, physical possession of the Material Tenant space, failing to be open to the public for business during customary hours, or “going dark” in the Material Tenant space; |
| (iii) | a Material Tenant giving notice that it is terminating its lease for all or any portion of the Material Tenant space (or applicable portion thereof), |
| (iv) | any termination or cancellation of any Material Tenant space or any Material Tenant lease failing to otherwise be in full force and effect; |
| (v) | any bankruptcy or similar insolvency of Material Tenant; |
| (vi) | a Material Tenant failing to extend or renew the applicable lease on or prior to the earlier of 12 months prior to the lease expiration or the expiration of the contractual notice period set forth in the lease, irrespective of whether it is exercised, or |
| (vii) | 12 months prior to the date upon which any unilateral termination option may become effective. |
A “Material Tenant Cash Trap Event Period” will end upon the occurrence of the following:
| ● | the lender’s receipt of evidence reasonably acceptable to lender (which such evidence will include a duly executed estoppel certificate from the applicable Material Tenant in form and substance reasonably acceptable to lender) of the satisfaction of the following conditions: |
| o | with regard to clause (i) above, the applicable Material Tenant or the borrower, as applicable, has cured all defaults under the applicable Material Tenant lease, |
| o | with regard to clause (ii) above, the applicable Material Tenant is in actual, physical possession of the Material Tenant space, open to the public for business during customary hours and not “dark” in the Material Tenant space (or applicable portion thereof), |
| o | with regard to clause (iii) above, the applicable Material Tenant has revoked or rescinded all termination or cancellation notices with respect to the applicable Material Tenant lease and has re-affirmed the applicable Material Tenant lease as being in full force and effect, |
| o | with regard to clause (v) above, the applicable Material Tenant is no longer insolvent or subject to any bankruptcy or insolvency proceedings and has affirmed the applicable Material Tenant lease pursuant to final, non-appealable order of a court of competent jurisdiction, |
| o | with regard to clause (vi) above, the applicable Material Tenant has renewed or extended the applicable Material Tenant lease in accordance with the terms of the loan documents for at least 5 years and with a base rent per square foot not less than the Material Tenant renewal base rent, |
| o | with regard to clause (vii) above, the applicable period for the exercise of any such unilateral termination option by the applicable Material Tenant has expired without being exercised and is no longer capable of being exercised by the applicable Material Tenant, and |
| o | with respect to clauses (i)-(vii) above, the applicable Material Tenant is paying full, unabated rent under the applicable Material Tenant lease. |
| ● | the borrower (i) leasing the entirety of the applicable Material Tenant space for a period of at least 5 years and with a base rent per square foot not less than the Material Tenant renewal base rent, and the applicable tenant(s) under such lease(s) being in actual, physical occupancy of the space, (ii) there are no tenant improvements, tenant improvement allowances or leasing commissions due and payable in connection with such replacement lease(s), (iii) the applicable new tenant(s) is(are) paying full, unabated rent under its applicable lease(s), and (iv) such lease(s) may not be revoked, rescinded, terminated or cancelled by tenant or otherwise contain any “outs” of tenant under the lease(s). |
Subordinate Debt. None.
Mezzanine Loan and Preferred Equity. None.
Release of Property. Not permitted.
Letter of Credit. None.
Right of First Offer/Right of First Refusal. None.
Ground Lease. None.
Terrorism Insurance. The 240 West 40th Street Mortgage Loan documents require an “all risk” insurance policy on a replacement cost basis, including (i) business interruption insurance covering no less than the 12-month period following the occurrence of a casualty event, together with a 6-month extended period of indemnity, and (ii) terrorism coverage as defined by TRIPRA. See “Risk Factors—Risks Relating to the Mortgage Loans—Terrorism Insurance May Not Be Available for All Mortgaged Properties” in the Preliminary Prospectus.
| THE INFORMATION IN THIS STRUCTURAL AND COLLATERAL TERM SHEET IS NOT COMPLETE AND MAY BE AMENDED PRIOR TO THE TIME OF SALE. THIS TERM SHEET IS NOT AN OFFER TO SELL THESE SECURITIES AND IT IS NOT A SOLICITATION OF AN OFFER TO BUY THESE SECURITIES IN ANY JURISDICTION WHERE THE OFFER OR SALE IS NOT PERMITTED. | ||
| 95 | ||
| Office – Suburban | Loan #10 | Cut-off Date Balance: | $34,982,641 | |
| Various | Riverwalk Business Park | Cut-off Date LTV: | 42.1% | |
| Scottsdale, AZ 85256 | UW NCF DSCR: | 1.90x | ||
| UW NOI Debt Yield: | 19.0% |

| THE INFORMATION IN THIS STRUCTURAL AND COLLATERAL TERM SHEET IS NOT COMPLETE AND MAY BE AMENDED PRIOR TO THE TIME OF SALE. THIS TERM SHEET IS NOT AN OFFER TO SELL THESE SECURITIES AND IT IS NOT A SOLICITATION OF AN OFFER TO BUY THESE SECURITIES IN ANY JURISDICTION WHERE THE OFFER OR SALE IS NOT PERMITTED. | ||
| 96 | ||
| Office – Suburban | Loan #10 | Cut-off Date Balance: | $34,982,641 | |
| Various | Riverwalk Business Park | Cut-off Date LTV: | 42.1% | |
| Scottsdale, AZ 85256 | UW NCF DSCR: | 1.90x | ||
| UW NOI Debt Yield: | 19.0% |
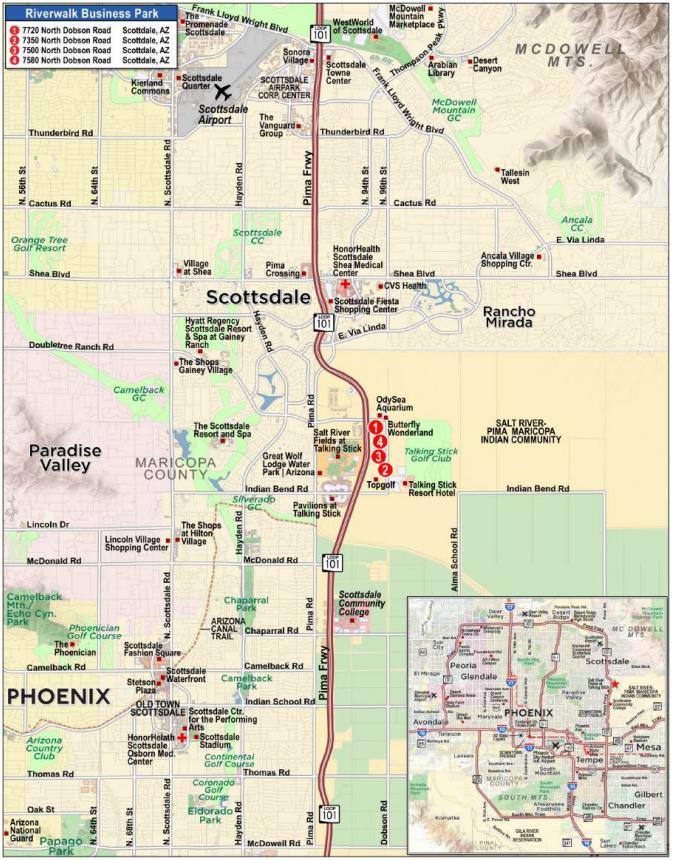
| THE INFORMATION IN THIS STRUCTURAL AND COLLATERAL TERM SHEET IS NOT COMPLETE AND MAY BE AMENDED PRIOR TO THE TIME OF SALE. THIS TERM SHEET IS NOT AN OFFER TO SELL THESE SECURITIES AND IT IS NOT A SOLICITATION OF AN OFFER TO BUY THESE SECURITIES IN ANY JURISDICTION WHERE THE OFFER OR SALE IS NOT PERMITTED. | ||
| 97 | ||
| Mortgage Loan No. 10 – Riverwalk Business Park |
| Mortgage Loan Information | Property Information | |||||
| Mortgage Loan Seller: | WFB | Single Asset/Portfolio: | Portfolio | |||
| Credit Assessment (Moody’s/Fitch/KBRA): | NR/NR/NR | Location: | Scottsdale, AZ | |||
| Original Balance: | $35,000,000 | General Property Type: | Office | |||
| Cut-off Date Balance: | $34,982,641 | Detailed Property Type: | Suburban | |||
| % of Initial Pool Balance: | 4.2% | Title Vesting: | Leasehold(2) | |||
| Loan Purpose: | Refinance | Year Built/Renovated: | Various/Various | |||
| Borrower Sponsor: | Creighton Barker | Size: | 454,653 SF | |||
| Guarantors: | Forum Capital, L.C. and FREP II Holdings, L.L.C. | Cut-off Date Balance per SF: | $77 | |||
| Mortgage Rate: | 7.7180% | Maturity Balance per SF: | $74 | |||
| Note Date: | 11/26/2024 | Property Manager: | Forum Property Services, L.C. (borrower-related) | |||
| Maturity Date: | 12/11/2029 | |||||
| Original Term to Maturity: | 60 months | |||||
| Original Amortization Term: | 360 months | Underwriting and Financial Information | ||||
| IO Period: | 0 months | UW NOI(2): | $6,660,404 | |||
| Seasoning: | 1 month | UW NCF: | $5,691,555 | |||
| Prepayment Provisions: | YM1(25),DorYM1(28),O(7) | UW NOI Debt Yield: | 19.0% | |||
| Lockbox/Cash Mgmt Status: | Soft/Springing | UW NCF Debt Yield: | 16.3% | |||
| Additional Debt Type: | None | UW NOI Debt Yield at Maturity: | 19.9% | |||
| Additional Debt Balance: | NAP | UW NCF DSCR: | 1.90x | |||
| Future Debt Permitted (Type): | No (NAP) | Most Recent NOI(3): | $5,789,594 (6/30/2024 TTM) | |||
| 2nd Most Recent NOI(3): | $4,596,676 (12/31/2023) | |||||
| Reserves(1) | 3rd Most Recent NOI: | $4,865,846 (12/31/2022) | ||||
| Type | Initial | Monthly | Cap | Most Recent Occupancy: | 94.3% (11/20/2024) | |
| RE Taxes: | $154,828 | $77,414 | NAP | 2nd Most Recent Occupancy: | 87.6% (12/31/2023) | |
| Insurance: | $0 | Springing | NAP | 3rd Most Recent Occupancy: | 94.0% (12/31/2022) | |
| Replacement Reserve: | $0 | $13,295 | NAP | Appraised Value (as of)(4): | $83,000,000 (6/1/2024) | |
| TI/LC Reserve: | $1,000,000 | $75,776 | NAP | Appraised Value per SF(4): | $183 | |
| Deferred Maintenance: | $228,240 | $0 | NAP | Cut-off Date LTV Ratio: | 42.1% | |
| Existing TI/LC Reserve: | $363,669 | $0 | NAP | Maturity Date LTV Ratio: | 40.3% | |
| Sources and Uses | ||||||
| Sources | Proceeds | % of Total | Uses | Proceeds | % of Total | |
| Original Loan Amount(1): | $35,000,000 | 87.8% | Loan Payoff: | $37,090,339 | 93.1% | |
| Borrower Equity: | $4,854,086 | 12.2% | Reserves: | $1,746,737 | 4.4% | |
| Closing Costs: | $1,017,010 | 2.6% | ||||
| Total Sources: | $39,854,086 | 100.0% | Total Uses: | $39,854,086 | 100.0% | |
| (1) | See “Escrows and Reserves” below for further discussion of reserve requirements. |
| (2) | See “Ground Lease” below for further discussion of the borrower’s leasehold interest. |
| (3) | The increase in Net Operating Income from 2023 to TTM 6/30/2024 and TTM 6/30/2024 to UW was primarily due to occupancy increasing from 87.6% in 2023 to 94.3% as of November 20, 2024. |
| (4) | The appraisals concluded to an “as-is portfolio” Appraised Value for the Riverwalk Business Park Portfolio (as defined below) of $83,000,000 as of June 1, 2024. The aggregate as-is appraised values of the Riverwalk Business Park Portfolio is $82,400,000 as of June 1, 2024. |
The Mortgage Loan. The tenth largest mortgage loan (the “Riverwalk Business Park Mortgage Loan”) is evidenced by a single promissory note in the original principal balance of $35,000,000 and secured by the leasehold interests in four office buildings totaling 454,653 SF, located in Scottsdale, Arizona (the “Riverwalk Business Park Portfolio”).
The Borrowers and the Borrower Sponsor. The borrowers are 7350R Dobson Associates, LLC, 7500MN Dobson Associates, LLC
and 7720ICE Associates, LLC, each a single-purpose, Delaware limited liability company with one independent director. The borrower is owned with a joint venture between Farallon Capital Management (90.0%) and Forum Capital, L.C. (10.0%).
The borrower sponsor is Creighton Barker and the non-recourse carveout guarantors are Forum Capital, L.C. (“Forum Capital”) and FREP II Holdings, L.L.C. Creighton Barker is Partner and Chief Financial Officer of Forum Capital, a developer of office, retail, and residential properties based in Scottsdale, Arizona. In addition to development, Forum Capital’s services include property management, leasing and construction management.
Founded in 1986, Farallon Capital Management (“Farallon”) is a registered investment adviser. Farallon has seven offices worldwide with over 320 employees and $39.0 billion of assets under management.
| THE INFORMATION IN THIS STRUCTURAL AND COLLATERAL TERM SHEET IS NOT COMPLETE AND MAY BE AMENDED PRIOR TO THE TIME OF SALE. THIS TERM SHEET IS NOT AN OFFER TO SELL THESE SECURITIES AND IT IS NOT A SOLICITATION OF AN OFFER TO BUY THESE SECURITIES IN ANY JURISDICTION WHERE THE OFFER OR SALE IS NOT PERMITTED. | ||
| 98 | ||
| Office – Suburban | Loan #10 | Cut-off Date Balance: | $34,982,641 | |
| Various | Riverwalk Business Park | Cut-off Date LTV: | 42.1% | |
| Scottsdale, AZ 85256 | UW NCF DSCR: | 1.90x | ||
| UW NOI Debt Yield: | 19.0% |
The Properties. The Riverwalk Business Park Portfolio comprises four suburban office buildings totaling 454,653 SF located in Scottsdale, Arizona. As of November 20, 2024, the portfolio is 94.3% leased to 19 tenants, with no tenant representing more than 32.9% of the net portfolio rentable area. The co-borrowers have leasehold interests in the respective constituent buildings pursuant to three ground leases from certain allotted landowners of the Salt River Pima-Maricopa Indian Community, as ground lessors. Each of the ground leases expires on May 29, 2088. See “Risk Factors—Risks Relating to Leasehold Interests in Mortgaged Properties Located within Native American Reservations” in the Preliminary Prospectus.
7720 North Dobson Road
The 7720 North Dobson Road property is a three-story, suburban office building totaling 149,544 SF, located in Scottsdale, Arizona (the “7720 North Dobson Road Property”). Situated on a 15.44-acre site, the 7720 North Dobson Road Property was built in 2008 and renovated in 2017. Amenities include a fitness center, cafeteria with kitchen, barista, health & wellness center, multiple conference rooms, classroom, and outdoor patio. The 7720 North Dobson Road Property includes 1,057 parking spaces (7.07 spaces per 1,000 SF). As of November 20, 2024, the 7720 North Dobson Road Property is 100.0% leased to one tenant.
7350 North Dobson Road
The 7350 North Dobson Road property is a single-story suburban office building totaling 140,383 SF, located in Scottsdale, Arizona (the “7350 North Dobson Road Property”). Situated on a 15.91-acre site, the 7350 North Dobson Road Property was built in 2005 and renovated in 2015. Amenities include a deli, coffee bar, and lounge area. The 7350 North Dobson Road Property includes 936 parking spaces (6.67 space per 1,000 SF). As of November 20, 2024 the 7350 North Dobson Road Property is 100.0% leased to four tenants.
7500 North Dobson Road
The 7500 North Dobson Road property is a three-story suburban office building totaling 100,477 SF, located in Scottsdale, Arizona (the “7500 North Dobson Road Property”). Situated on a 6.62-acre site, the 7500 North Dobson Road Property was built in 2007 and amenities include City Market Deli, a 1,445 SF fitness center, and an outdoor patio. The 7500 North Dobson Road Property includes 502 parking spaces (5.00 spaces per 1,000 SF). As of November 20, 2024, the 7500 North Dobson Road Property is 100.0% leased to ten tenants.
7580 North Dobson Road
The 7580 North Dobson Road property is a three-story suburban office building totaling 64,249 SF, located in Scottsdale, Arizona (the “7580 North Dobson Road Property”). Situated on a 4.41-acre site, the 7580 North Dobson Road Property was built in 2007 and includes 330 parking spaces (5.14 spaces per 1,000 SF). As of November 20, 2024, the 7580 North Dobson Road Property is 59.8% leased to five tenants.
The following table presents certain information relating to the Riverwalk Business Park Portfolio:
| Riverwalk Business Park Portfolio Summary | ||||||||
| Property Name / Location | Allocated Mortgage Loan Cut-off Date Balance | % of Portfolio Cut-off Date Balance | Occupancy(1) | Year Built/ Renovated(2) | Net Rentable Area (SF) (1) | As-Is Appraised Value(2) | Allocated Cut-off Date LTV | % of UW NOI |
7720 North Dobson Road Scottsdale, AZ | $12,566,580 | 35.9% | 100.0% | 2008/2017 | 149,544 | $29,600,000 | 42.5% | 37.9% |
7350 North Dobson Road Scottsdale, AZ | $11,420,304 | 32.6% | 100.0% | 2005/2015 | 140,383 | $26,900,000 | 42.5% | 31.6% |
7500 North Dobson Road Scottsdale, AZ | $7,302,202 | 20.9% | 100.0% | 2007/NAP | 100,477 | $17,200,000 | 42.5% | 23.3% |
7580 North Dobson Road Scottsdale, AZ | $3,693,555 | 10.6% | 59.8% | 2007/NAP | 64,249 | $8,700,000 | 42.5% | 7.2% |
| Total/Weighted Average | $34,982,641 | 100.0% | 94.3% | 454,653 | $83,000,000(3) | 42.1% | 100.0% | |
| (1) | Information based on the underwritten rent roll. |
| (2) | Source: Appraisal. |
| (3) | The appraisals concluded to an “as-is” Appraised Value for the Riverwalk Business Park Portfolio of $83,000,000 as of June 1, 2024. The aggregate as-is appraised values of the Riverwalk Business Park Portfolio is $82,400,000 as of June 1, 2024. |
| THE INFORMATION IN THIS STRUCTURAL AND COLLATERAL TERM SHEET IS NOT COMPLETE AND MAY BE AMENDED PRIOR TO THE TIME OF SALE. THIS TERM SHEET IS NOT AN OFFER TO SELL THESE SECURITIES AND IT IS NOT A SOLICITATION OF AN OFFER TO BUY THESE SECURITIES IN ANY JURISDICTION WHERE THE OFFER OR SALE IS NOT PERMITTED. | ||
| 99 | ||
| Office – Suburban | Loan #10 | Cut-off Date Balance: | $34,982,641 | |
| Various | Riverwalk Business Park | Cut-off Date LTV: | 42.1% | |
| Scottsdale, AZ 85256 | UW NCF DSCR: | 1.90x | ||
| UW NOI Debt Yield: | 19.0% |
Major Tenants.
Arrivia/Equality Health (149,544 SF; 32.9% of net portfolio rentable area; 36.4% of portfolio underwritten base rent). Arrivia was originally founded in 1997 as International Cruise and Excursion and rebranded in 2020 as Arrivia. Arrivia is a travel technology and loyalty program solution provider. The company has a 24/7 customer service team and 10 offices around the world, including the United States, India, Mexico, Australia, the United Kingdom, Portugal, and the Philippines. Arrivia’s clients include American Express, Marriott Vacation Club, Hilton Grand Vacations, Morgan Stanley and Bank of America. Arrivia has been a tenant at the 7720 North Dobson Road Property since 2017 and is on a lease through May 31, 2028. Arrivia is currently subleasing approximately 121,351 SF of its space to Equality Health (73,324 SF) through May 2028 and Prosperity Home Mortgage (48,027 SF) through December 2025. Equality Health’s sublease will expand to include the space currently being subleased by Prosperity Home Mortgage in January 2026 upon sublease expiration. Additionally, Equality Health has executed a five-year direct lease with the landlord for the entirety of the 7720 North Dobson Road Property (Arrivia’s space), which will commence in June 2028 and expire May 2033.
GlobalTranz Enterprises (70,347 SF; 15.5% of net portfolio rentable area; 12.3% of portfolio underwritten base rent). GlobalTranz Enterprises (“GlobalTranz”) is a full-service, technology-driven logistics solutions provider founded in 2003. GlobalTranz’s transportation network includes over 45,000 truckload carriers serving more than 108,000 customers. The company employs more than 2,500 people in the U.S. and Mexico and had approximately $4.3 billion in revenue. GlobalTranz has been a tenant at the 7350 North Dobson Road Property since 2015 and is on a lease through July 31, 2033 with two, 5-year renewal options and no termination options. GlobalTranz subleases their entire space to Open Network Exchange (“ONE”) on a sublease expiring in June 2027 with three, one-year extension options and a fourth option for 35 months that would extend the sublease term to the expiration of the GlobalTranz lease in July 2033.
Progress Residential (57,199 SF; 12.6% of net portfolio rentable area; 15.0% of portfolio underwritten base rent). Progress Residential is a single-family rental home provider with over 85,000 homes across 30 metro areas. Headquartered at the 7500 North Dobson Road Property, Progress Residential has been a tenant since 2016 and is on a lease expiring December 31, 2029 with two 5-year renewal options termination options.
The following table presents certain information relating to the tenancy at the Riverwalk Business Park Portfolio:
| Tenant Summary | |||||||||
| Tenant Name | Credit Rating (Fitch/Moody's/ S&P) | Tenant SF | % of Total SF | Annual UW Rent(1) | % of Total Annual UW Rent(1) | Annual UW Rent PSF(1) | Lease Expiration | Term. Option (Y/N) | Renewal Options |
| Arrivia/Equality Health(2) | NR/NR/NR | 149,544 | 32.9% | 4,018,247 | 36.4% | $26.87(2) | 5/31/2033(2) | N | 2 x 5 Yr |
| GlobalTranz Enterprises(3) | NR/NR/NR | 70,347 | 15.5% | 1,354,180 | 12.3% | $19.25(3) | 7/31/2033 | N | 2 x 5 Yr |
| Progress Residential | NR/NR/NR | 57,199 | 12.6% | 1,658,771 | 15.0% | $29.00 | 12/31/2029 | N | 2 x 5 Yr |
| Allstate Insurance Company | NR/NR/NR | 45,190 | 9.9% | 1,266,992 | 11.5% | $28.04 | 6/30/2027 | N | 1 x 5 Yr |
| Real Zone Partners | NR/NR/NR | 14,889 | 3.3% | 406,321 | 3.7% | $27.29 | 7/31/2028 | N | 2 x 5 Yr |
| Subtotal/Wtd. Avg. | 337,169 | 74.2% | $8,704,511 | 78.9% | $25.82 | ||||
| Other Tenants | 91,628 | 20.2% | $2,333,583 | 21.1% | $25.47 | ||||
| Total Occupied Space | 428,797 | 94.3% | $11,038,094 | 100.0% | $25.74 | ||||
| Vacant Space | 25,856 | 5.7% | |||||||
| Total/Wtd. Avg. | 454,653 | 100.0% | |||||||
| (1) | The Annual UW Rent and Annual UW Rent PSF includes rent steps through November 2025 totaling $150,460. |
| (2) | Arrivia is on a lease through May 31, 2028 and the Annual UW Rent PSF above reflects Arrivia’s rent step as of May 2025. Arrivia is currently subleasing approximately 121,351 SF of its space to Equality Health (73,324 SF through May 2028) and Prosperity Home Mortgage (48,027 SF through December 2025). Equality Health’s sublease will expand to include the 48,027 SF currently being subleased by Prosperity Home Mortgage in January 2026 upon sublease expiration. Equality Health has executed a five-year direct lease with the borrower for the entirety of the 7720 North Dobson Road Property (Arrivia’s space), which will commence in June 2028 at a staring Annual UW Rent PSF of $28.50 PSF and expire May 2033. |
| (3) | GlobalTranz subleases its entire space to Open Network Exchange (“ONE”) on a sublease expiring in June 2027 with three, one-year extension options and a 4th option for 35 months that would extend the sublease term to the expiration of the GlobalTranz lease in July 2033. The Annual UW Rent PSF reflects the sublease rent paid by ONE, GlobalTranz’s contractual UW rent is $26.00 PSF. |
| THE INFORMATION IN THIS STRUCTURAL AND COLLATERAL TERM SHEET IS NOT COMPLETE AND MAY BE AMENDED PRIOR TO THE TIME OF SALE. THIS TERM SHEET IS NOT AN OFFER TO SELL THESE SECURITIES AND IT IS NOT A SOLICITATION OF AN OFFER TO BUY THESE SECURITIES IN ANY JURISDICTION WHERE THE OFFER OR SALE IS NOT PERMITTED. | ||
| 100 | ||
| Office – Suburban | Loan #10 | Cut-off Date Balance: | $34,982,641 | |
| Various | Riverwalk Business Park | Cut-off Date LTV: | 42.1% | |
| Scottsdale, AZ 85256 | UW NCF DSCR: | 1.90x | ||
| UW NOI Debt Yield: | 19.0% |
The following table presents certain information relating to the lease rollover schedule at the Riverwalk Business Park Portfolio:
| Lease Rollover Schedule(1) | ||||||||
| Year | # of Leases Rolling | SF Rolling | Approx. % of SF Rolling | Approx. Cumulative % of SF Rolling | Total UW Rent Rolling | Approx. % of Total UW Rent Rolling | Approx. Cumulative % of Total UW Rent Rolling | UW Rent PSF Rolling |
| MTM/2025 | 2 | 6,436 | 1.4% | 1.4% | $146,037 | 1.3% | 1.3% | $22.69 |
| 2026 | 4 | 20,004 | 4.4% | 5.8% | $513,672 | 4.7% | 6.0% | $25.68 |
| 2027 | 5 | 62,023 | 13.6% | 19.5% | $1,676,814 | 15.2% | 21.2% | $27.04 |
| 2028 | 1 | 14,889 | 3.3% | 22.7% | $406,321 | 3.7% | 24.8% | $27.29 |
| 2029 | 3 | 67,156 | 14.8% | 37.5% | $1,917,653 | 17.4% | 42.2% | $28.56 |
| 2030 | 2 | 9,903 | 2.2% | 39.7% | $293,672 | 2.7% | 44.9% | $29.65 |
| 2031 | 2 | 15,498 | 3.4% | 43.1% | $329,950 | 3.0% | 47.9% | $21.29 |
| 2032 | 2 | 12,997 | 2.9% | 45.9% | $381,548 | 3.5% | 51.3% | $29.36 |
| 2033 | 2 | 219,891 | 48.4% | 94.3% | $5,372,427 | 48.7% | 100.0% | $24.43 |
| 2034 | 0 | 0 | 0.0% | 94.3% | $0 | 0.0% | 100.0% | $0.00 |
| 2035 | 0 | 0 | 0.0% | 94.3% | $0 | 0.0% | 100.0% | $0.00 |
| 2036 & Thereafter | 0 | 0 | 0.0% | 94.3% | $0 | 0.0% | 100.0% | $0.00 |
| Vacant | 0 | 25,856 | 5.7% | 100.0% | $0 | 0.0% | 100.0% | $0.00 |
| Total/Wtd. Avg. | 23 | 454,653 | 100.0% | $11,038,094 | 100.0% | $25.74(2) | ||
| (1) | Information is based on the underwritten rent roll. |
| (2) | Total/Wtd. Avg. Annual UW Rent PSF Rolling excludes vacant space. |
The Market. The Riverwalk Business Park Portfolio is located along Loop 101, which carries approximately 200,000 vehicles per day, approximately 12 miles northeast of the Phoenix Central Business District and 2.5 miles northeast of the Scottsdale Central Business District. The four properties are located within 0.6 miles of one another. The top employers in Scottsdale include HonorHealth (Scottsdale Healthcare) with 7,131 employees, Vanguard (2,770), General Dynamics (2,700), city of Scottsdale (2,623), Scottsdale Unified School District (2,093), Mayo Clinic (1,917), Axon (1,600), Nationwide (1,407), CVS Health (1,345) and The Hartford (785).
According to the appraisal, the estimated 2023 population within a one, three and five-mile radius of the Riverwalk Business Park Portfolio was approximately 6,353, 50,612, and 138,476, respectively, and the estimated 2023 average household income within the same radii was approximately $129,825, $138,630, and $139,647, respectively.
According to the appraisal, all four properties in the Riverwalk Business Park Portfolio are situated within the Central Scottsdale office submarket within the greater Metro Phoenix office market. As of the second quarter of 2024, the submarket reported a total inventory of approximately 9.29 million SF with a 15.2% vacancy rate and an average asking rent of $30.11 PSF.
The following table presents certain information relating to the appraisals’ market rent conclusions for the Riverwalk Business Park Portfolio:
| Market Rent Summary | |||
| 7350 North Dobson Road | 7500/7580 North Dobson Road | 7720 North Dobson Road | |
| Market Rent (PSF) | $25.50 | $29.00 | $28.50 |
| Lease Term (Years) | 7 | 7 | 10 |
| Lease Type | BY Stop | BY Stop | NNN |
| Rent Increase Projection | 2.5% per annum | 2.5% per annum | $0.75/SF per annum |
| Tenant Improvements (New) | $30 PSF | $30 PSF | $50 PSF |
| Leasing Commissions (New) | 7.0% | 7.0% | 7.0% |
| Free Rent (New) | 6 months | 6 months | 7 months |
| THE INFORMATION IN THIS STRUCTURAL AND COLLATERAL TERM SHEET IS NOT COMPLETE AND MAY BE AMENDED PRIOR TO THE TIME OF SALE. THIS TERM SHEET IS NOT AN OFFER TO SELL THESE SECURITIES AND IT IS NOT A SOLICITATION OF AN OFFER TO BUY THESE SECURITIES IN ANY JURISDICTION WHERE THE OFFER OR SALE IS NOT PERMITTED. | ||
| 101 | ||
| Office – Suburban | Loan #10 | Cut-off Date Balance: | $34,982,641 | |
| Various | Riverwalk Business Park | Cut-off Date LTV: | 42.1% | |
| Scottsdale, AZ 85256 | UW NCF DSCR: | 1.90x | ||
| UW NOI Debt Yield: | 19.0% |
Appraisal. The appraisal concluded to an “as-is portfolio” Appraised Value for the Riverwalk Business Park Portfolio of $83,000,000 as of June 1, 2024. The aggregate as-is appraised values of the Riverwalk Business Park Portfolio is $82,400,000 as of June 1, 2024.
Environmental Matters. According to the Phase I environmental site assessment dated May 30, 2024, there was no evidence of any recognized environmental l conditions at the Riverwalk Business Park Portfolio.
Operating History and Underwritten Net Cash Flow. The following table presents certain information relating to the historical operating performance and underwritten net cash flow at the Riverwalk Business Park Portfolio:
| Cash Flow Analysis | ||||||
| 2021 | 2022 | 2023 | TTM 6/30/2024 | UW | UW PSF | |
| Base Rent | $9,949,177 | $8,583,195 | $8,444,036 | $9,639,304 | $11,038,094(1) | $24.28 |
| Grossed Up Vacant Space | 0 | 0 | 0 | 0 | 749,824 | $1.65 |
| Gross Potential Rent | $9,949,177 | $8,583,195 | $8,444,036 | $9,639,304 | $11,787,918 | $25.93 |
| Total Recoveries | $283,554 | $262,615 | $183,226 | $241,939 | $148,036 | $0.33 |
| Other Income | 280,954 | 0 | 1,720 | 1,307 | 0 | $0.00 |
| Parking/Garage/Other | 33,420 | 37,900 | 41,585 | 49,040 | 49,040 | $0.11 |
| Less Vacancy & Credit Loss | (0) | (0) | (0) | (0) | (1,178,792) | ($2.59) |
| Effective Gross Income | $10,547,104 | $8,883,710 | $8,670,567 | $9,931,589 | $10,806,203 | $23.77 |
| Management Fee | $376,884 | $299,013 | $329,782 | $341,333 | $324,186 | $0.71 |
| Real Estate Taxes | 999,269 | 888,252 | 884,730 | 844,648 | 884,730 | $1.95 |
| Insurance | 114,407 | 91,589 | 92,411 | 91,401 | 72,269 | $0.16 |
| Ground Rent(2) | 847,860 | 847,860 | 847,860 | 847,860 | 847,860 | $1.86 |
| Other Operating Expenses | 1,953,973 | 1,891,149 | 1,919,108 | 2,016,753 | 2,016,753 | $4.44 |
| Total Expenses | $4,292,394 | $4,017,863 | $4,073,891 | $4,141,995 | $4,145,799 | $9.12 |
| Net Operating Income | $6,254,711(3) | $4,865,846(3) | $4,596,676(4) | $5,789,594(4) | $6,660,404(4) | $14.65 |
| CapEx | 0 | 0 | 0 | 0 | 159,543 | $0.35 |
| TI/LC | 0 | 0 | 0 | 0 | 809,306 | $1.78 |
| Net Cash Flow | $6,254,711 | $4,865,846 | $4,596,676 | $5,789,594 | $5,691,555 | $12.52 |
| Occupancy %(5) | 97.0% | 94.0% | 87.6% | 94.3% | 90.0% | |
| NOI DSCR | 2.09x | 1.62x | 1.53x | 1.93x | 2.22x | |
| NCF DSCR | 2.09x | 1.62x | 1.53x | 1.93x | 1.90x | |
| NOI Debt Yield | 17.9% | 13.9% | 13.1% | 16.5% | 19.0% | |
| NCF Debt Yield | 17.9% | 13.9% | 13.1% | 16.5% | 16.3% | |
| (1) | UW Base Rent includes rent steps through November 2025 totaling $150,460. |
| (2) | The ground rent at each for the four properties is the greater of $20,000 per year versus 8% of net operating income. Ground rent is reconciled for each building on a calendar year basis. |
| (3) | The decrease in Net Operating Income between 2021 and 2022 was primarily due to occupancy at the 7500 North Dobson Road Property declining from 93% to 88% from 2021 to 2022 and occupancy at the 7580 North Dobson Road Property declining from 90% to 76% from 2021 to 2022. |
| (4) | The increase in Net Operating Income from 2023 to TTM 6/30/2024 and TTM 6/30/2024 to UW was primarily due to occupancy increasing from 87.6% in 2023 to 94.3% as of November 20, 2024. |
| (5) | UW Occupancy % represents the in-place economic occupancy based on the underwritten rent roll dated November 20, 2024. Historical occupancies represent physical occupancies. |
| THE INFORMATION IN THIS STRUCTURAL AND COLLATERAL TERM SHEET IS NOT COMPLETE AND MAY BE AMENDED PRIOR TO THE TIME OF SALE. THIS TERM SHEET IS NOT AN OFFER TO SELL THESE SECURITIES AND IT IS NOT A SOLICITATION OF AN OFFER TO BUY THESE SECURITIES IN ANY JURISDICTION WHERE THE OFFER OR SALE IS NOT PERMITTED. | ||
| 102 | ||
| Office – Suburban | Loan #10 | Cut-off Date Balance: | $34,982,641 | |
| Various | Riverwalk Business Park | Cut-off Date LTV: | 42.1% | |
| Scottsdale, AZ 85256 | UW NCF DSCR: | 1.90x | ||
| UW NOI Debt Yield: | 19.0% |
Escrows and Reserves.
Real Estate Taxes – The loan documents require an upfront reserve of $154,828 for real estate taxes and ongoing monthly reserves in an amount equal to 1/12th of the real estate taxes that the lender estimates will be payable during the next 12 months, initially estimated at $77,414 monthly.
Insurance – The loan documents require an ongoing monthly deposit into an insurance reserve equal to 1/12th of the insurance premiums that the lender reasonably estimates will be payable during the next ensuing 12 months; provided that no deposits are required if (i) no event of default is continuing, (ii) the borrower maintains insurance coverage for the Riverwalk Business Park Portfolio as part of blanket or umbrella coverage reasonably approved by the lender, and (iii) the borrower provides the lender with evidence of the renewals of the insurance policies and paid receipts for the payment of the insurance premiums no later than 10 business days prior to the expiration dates of the policies.
Replacement Reserve – The loan documents require an ongoing monthly replacement reserve deposit of $13,295.
Deferred Maintenance - The loan documents require an upfront reserve of $228,240 for immediate repairs at the properties.
TI/LC Reserve – The loan documents require an upfront deposit of $1,000,000 ($2.20 PSF) and an ongoing monthly TI/LC reserve deposit of $75,776 ($2.00 PSF annually).
Existing TI/LC Reserve – The loan documents require an upfront deposit of $363,669, which represents the leasing commissions and tenant improvements payable by the borrower under existing leases at the Riverwalk Business Park Portfolio.
Lockbox and Cash Management. The Riverwalk Business Park Mortgage Loan is structured with a soft lockbox and springing cash management. Prior to the occurrence of a Cash Trap Event Period (as defined below), the borrower and property manager are required to deposit all rents and other income directly into the deposit account within three business days of receipt. During a Cash Trap Event Period, funds in the lockbox account are required to be swept to a lender-controlled cash management account and all excess funds are required to be swept to an excess cash flow subaccount controlled by the lender.
A “Cash Trap Event Period” will commence upon the earlier of the following:
| (i) | the occurrence and continuance of an event of default under the loan documents; |
| (ii) | the net cash flow debt service coverage ratio (“NCF DSCR”) is below 1.30x, tested quarterly; or |
| (iii) | if Equality Health or any replacement tenant (each a “Major Tenant”) (a) terminates or cancels its lease, (b) goes dark or vacates its space, (c) files bankruptcy or similar insolvency proceeding, or (d) defaults under its lease. |
A Cash Trap Event Peiod will end upon the occurrence of the following:
| ● | with regard to clause (i), the cure of such event of default; |
| ● | with regard to clause (ii), the NCF DSCR being equal to or greater than 1.35x for two consecutive calendar quarters; |
| ● | with regard to clause (iii)(a)-(d) above, upon lender receiving reasonably satisfactory evidence that at least 75% of the Major Tenant space has been leased to one or more replacement tenants pursuant to a lease reasonably satisfactory to lender, that each such Major Tenant is in occupancy of its premises, open for business and is then paying full, unabated rent pursuant to the terms of its lease (or if rent is abated, that borrower has deposited the full amount of the abated rent in a reserve fund under lender’s control), and that all TI/LCs provided in each such replacement Major Tenant lease have been paid (or borrower has deposited the full amount of unpaid TI/LCs in a reserve fund in lender’s control), and delivery of an estoppel certificate reasonably satisfactory to lender from each replacement Major Tenant affirming the foregoing; |
| ● | with regard to clause (iii)(a) above, the Major Tenant revokes any notification of any termination, cancellation or surrender of its lease and delivers an estoppel reasonably acceptable to lender; |
| ● | with regard to clause (iii)(b) above, the Major Tenant has re-occupied its entire space and is open for business; |
| ● | with regard to clause (iii)(c) above, bankruptcy or insolvency proceeding has terminated in a manner reasonably satisfactory to the lender, the related lease has been affirmed, and the terms of such lease, as affirmed, are reasonably satisfactory to lender; and |
| ● | with regard to clause (iii)(d) above, the subject default is cured, and no other default under the related lease occurs (in each case, beyond any applicable notice and cure period) for a period of two consecutive calendar quarters following such cure. |
Additional Secured Indebtedness (not including trade debts). None.
Mezzanine Loan and Preferred Equity. None.
Release of Property. From and after the prepayment lockout date, in connection with a bona fide sale to an unaffiliated third party, the borrower may obtain the release of any of the properties that make up the Riverwalk Business Park Portfolio, provided the following conditions, among others, are satisfied: (i) no event of default is continuing; (ii) defeasance of the greatest of (a) 100% of the net proceeds of the sale, (b) 125% of the allocated loan amount, (iii) (a) an amount that would result in the debt service coverage ratio following the release being no less than the greater of 1.90x and the debt service coverage ratio immediately prior to the release, (b) an amount that would result in the debt yield following the release being no less than the greater of 16.3% and the debt yield immediately prior to the release, (c) an amount that would result in the loan-to-value ratio being not more than the lesser of 42.5% or the loan-to-value ratio prior to release.
Letter of Credit. None.
Right of First Offer/Right of First Refusal. None.
Ground Lease. The borrowers ground lease the land beneath the portfolio from The Salt River Pima-Maricopa Indian Community on a ground lease through May 2088. The ground rent at each for the four properties is the greater of $20,000 per year versus 8% of net operating income. Ground rent is reconciled for each building on a calendar year basis. See “Risk Factors-Risks Relating to the Mortgage Loans-Risks Relating to Leasehold Interests in Mortgaged Properties Located within Native American Reservations” in the Preliminary Prospectus.
| THE INFORMATION IN THIS STRUCTURAL AND COLLATERAL TERM SHEET IS NOT COMPLETE AND MAY BE AMENDED PRIOR TO THE TIME OF SALE. THIS TERM SHEET IS NOT AN OFFER TO SELL THESE SECURITIES AND IT IS NOT A SOLICITATION OF AN OFFER TO BUY THESE SECURITIES IN ANY JURISDICTION WHERE THE OFFER OR SALE IS NOT PERMITTED. | ||
| 103 | ||
| Office – Suburban | Loan #10 | Cut-off Date Balance: | $34,982,641 | |
| Various | Riverwalk Business Park | Cut-off Date LTV: | 42.1% | |
| Scottsdale, AZ 85256 | UW NCF DSCR: | 1.90x | ||
| UW NOI Debt Yield: | 19.0% |
Terrorism Insurance. The Riverwalk Business Park Mortgage Loan documents require an “all risk” insurance policy on a replacement cost basis, together with (i) business interruption insurance covering no less than the 18-month period following the occurrence of a casualty event, together with a 6-month extended period of indemnity, (ii) named storm and earthquake coverage with a deductible up to 5% of the total insurable value, and (iii) terrorism coverage as defined by TRIPRA. See “Risk Factors—Risks Relating to the Mortgage Loans—Terrorism Insurance May Not Be Available for All Mortgaged Properties” in the Preliminary Prospectus.
| THE INFORMATION IN THIS STRUCTURAL AND COLLATERAL TERM SHEET IS NOT COMPLETE AND MAY BE AMENDED PRIOR TO THE TIME OF SALE. THIS TERM SHEET IS NOT AN OFFER TO SELL THESE SECURITIES AND IT IS NOT A SOLICITATION OF AN OFFER TO BUY THESE SECURITIES IN ANY JURISDICTION WHERE THE OFFER OR SALE IS NOT PERMITTED. | ||
| 104 | ||
| Mortgage Loan No. 11 – Addison Arts Apartments |
| Mortgage Loan Information | Property Information | |||||
| Mortgage Loan Seller: | AREF2 | Single Asset/Portfolio: | Single Asset | |||
| Credit Assessment (KBRA/Fitch/Moody’s): | NR/NR/NR | Location: | Berkeley, CA 94704 | |||
| Original Balance: | $30,100,000 | General Property Type: | Multifamily | |||
| Cut-off Date Balance: | $30,100,000 | Detailed Property Type: | Mid Rise | |||
| % of Initial Pool Balance: | 3.6% | Title Vesting: | Fee | |||
| Loan Purpose: | Refinance | Year Built/Renovated: | 2016/NAP | |||
| Borrower Sponsor: | Avi Nevo | Size: | 69 Units | |||
| Guarantor(1): | Avi Nevo | Cut-off Date Balance per Unit: | $436,232 | |||
| Mortgage Rate: | 6.5600% | Maturity Date Balance per Unit: | $436,232 | |||
| Note Date: | 11/25/2024 | Property Manager: | Self-managed | |||
| Maturity Date: | 12/6/2029 | Underwriting and Financial Information | ||||
| Term to Maturity: | 60 months | UW NOI: | $2,471,023 | |||
| Amortization Term: | 0 months | UW NCF: | $2,453,773 | |||
| IO Period: | 60 months | UW NOI Debt Yield: | 8.2% | |||
| Seasoning: | 1 month | UW NCF Debt Yield: | 8.2% | |||
| Prepayment Provisions: | L(25),D(28),O(7) | UW NOI Debt Yield at Maturity: | 8.2% | |||
| Lockbox/Cash Mgmt Status: | Springing/Springing | UW NCF DSCR: | 1.23x | |||
| Additional Debt Type: | NAP | Most Recent NOI: | $2,561,645 (10/31/2024 TTM) | |||
| Additional Debt Balance: | NAP | 2nd Most Recent NOI: | $2,433,838 (12/31/2023) | |||
| Future Debt Permitted (Type): | No (NAP) | 3rd Most Recent NOI: | $1,882,553 (12/31/2022) | |||
| Most Recent Occupancy: | 100.0% (11/1/2024) | |||||
| Reserves | 2nd Most Recent Occupancy: | 96.4% (12/31/2023) | ||||
| Type | Initial | Monthly | Cap | 3rd Most Recent Occupancy: | 98.8% (12/31/2022) | |
| RE Taxes: | $151,471 | $37,868 | NAP | Appraised Value (as of): | $43,900,000 (10/15/2024) | |
| Insurance: | $5,753 | $2,876 | NAP | Appraised Value per Unit: | $636,232 | |
| Replacement Reserve: | $0 | $1,438 | $51,750 | Cut-off Date LTV Ratio: | 68.6% | |
| Maturity Date LTV Ratio: | 68.6% | |||||
| Sources and Uses | ||||||
| Sources | Proceeds | % of Total | Uses | Proceeds | % of Total | |
| Loan Amount: | $30,100,000 | 100.0% | Payoff | $27,694,197 | 92.0% | |
| Closing Costs(2) | $2,183,662 | 7.3% | ||||
| Upfront Reserves | $157,224 | 0.5% | ||||
| Return of Equity | $64,917 | 0.2% | ||||
| Total Sources: |
$30,100,000 | 100.0% | Total Uses: | $30,100,000 | 100.0% | |
| (1) | The Addison Arts Apartments Mortgage Loan (as defined below) is structured with a partial guaranty in the amount of $2,500,000 which will remain outstanding until the Addison Arts Apartments Property achieves a 9.0% debt yield. |
| (2) | Closing Costs include a rate buydown of $1,505,000. |
The Mortgage Loan. The eleventh largest mortgage loan (the “Addison Arts Apartments Mortgage Loan”) is evidenced by a promissory note in the original principal amount of $30,100,000 and secured by a first-priority fee mortgage encumbering a 69-unit mid-rise multifamily property in Berkeley, California (the “Addison Arts Apartments Property”).
The Borrower and the Borrower Sponsor. The borrower for the Addison Arts Apartments Mortgage Loan is 1935 Addison Street, LLC, a single-purpose, Delaware limited liability company, with one independent director in its organizational structure. Legal counsel to the borrower delivered a non-consolidation opinion in connection with the origination of the Addison Arts Apartments Mortgage Loan. The borrower sponsor and non-recourse carve-out guarantor for the Addison Arts Apartments Mortgage Loan is Avi Nevo. Avi Nevo is the founder and owner of Segula Investments, a Berkeley, California based real estate development company that has developed over 380 residential units and over 120,000 square feet of commercial office and ground floor retail, all of which is located in the Berkeley area. The Addison Arts Apartments Mortgage Loan is structured with a partial guaranty in the amount of $2,500,000 which will remain outstanding until the Addison Arts Apartments Property achieves a 9.0% debt yield.
The Property. The Addison Arts Apartments Property is a 69-unit, mid-rise multifamily property located in Berkeley, California, three blocks west of the University of California, Berkeley (“UC Berkeley”). Situated on a 0.34-acre site, the improvements consist of a single six-story building constructed in 2016. The Addison Arts Apartments Property features amenities such as on-site laundry, a rooftop lounge, bike storage, and a parking garage. Unit amenities include stainless steel appliances, granite countertops, garbage disposals, dishwashers, ceiling fans, and private patios in select units. The Addison Arts Apartments Property features nine garage spaces that may be leased by residents for an additional fee.
| THE INFORMATION IN THIS STRUCTURAL AND COLLATERAL TERM SHEET IS NOT COMPLETE AND MAY BE AMENDED PRIOR TO THE TIME OF SALE. THIS TERM SHEET IS NOT AN OFFER TO SELL THESE SECURITIES AND IT IS NOT A SOLICITATION OF AN OFFER TO BUY THESE SECURITIES IN ANY JURISDICTION WHERE THE OFFER OR SALE IS NOT PERMITTED. | ||
| 105 | ||
| Multifamily – Mid Rise | Loan #11 | Cut-off Date Balance: | $30,100,000 | |
| 1933 Addison Street | Addison Arts Apartments | Cut-off Date LTV: | 68.6% | |
| Berkeley, CA 94704 | UW NCF DSCR: | 1.23x | ||
| UW NOI Debt Yield: | 8.2% |
As of November 1, 2024, the Addison Arts Apartments Property was 100.0% occupied. Since January 2022, occupancy has averaged 97.4%. The unit mix at the Addison Arts Apartments Property is comprised of nine studio units, six one-bedroom units, 53 two-bedroom units and one three-bedroom unit. The Addison Arts Apartments Property also features 7,172 square feet of commercial space which is currently 100.0% leased to three tenants and contributes $293,340 of rental income (8.4% of effective gross income). The three commercial tenants are The Office, LLC (5,905 square feet, 82% of commercial NRA), a professional coworking space, Rush Bowls (690 square feet, 10% of commercial NRA), an acai bowl shop, and Lorrie Williams Stylist, (577 square feet, 8% of commercial NRA), a hair salon. Rent concessions have not been offered at the Addison Arts Apartments Property and are not prevalent in the market.
While the Addison Arts Apartments Property is operated as a market-rate building, approximately 89.9% of units are leased to students that in general attend UC Berkeley. All units are rented on a per-unit basis and are not furnished. Parental guarantees are required for tenants that do not meet an income threshold equal to three times the annual rent. As of November 2024, 39 units (56.5%) were leased to students with parental guarantees. Additionally, 23 units (33.3%) were leased to international students. Tenants are permitted to sign shorter term leases on a case-by-case basis, with new leases signed in the trailing-twelve month as of November 2024 averaging a term of approximately 9.7 months.
UC Berkeley does not require students to live on-campus. According to a third-party source, the ratio of on-campus beds to total enrollment at UC Berkeley is 16.3% (7,593 beds), and the ratio of off-campus purpose-built student housing and student-competitive beds to total enrollment ratio is 31.3% (14,544 beds). Combined, the total student housing beds available to UC Berkeley students is 47.6% of total enrollment.
The following table presents certain information relating to the unit mix at the Addison Arts Apartments Property:
| Unit Mix(1) | |||||||
| Unit Mix / Type | Units | Occupied Units | % Occupied | Average SF per Unit | Total SF | Monthly Average Rent per Unit(2) | Monthly Average Market Rent per Unit(3) |
| Studio | 9 | 9 | 100.0% | 397 | 3,573 | $2,498 | $2,500 |
| One Bedroom | 6 | 6 | 100.0% | 668 | 4,010 | $3,337 | $3,200 |
| Two Bedroom | 53 | 53 | 100.0% | 872 | 46,200 | $4,309 | $4,358 |
| Three Bedroom | 1 | 1 | 100.0% | 1,042 | 1,042 | $6,425 | $6,425 |
| Total/Wtd. Avg. | 69 | 69 | 100.0% | 795 | 54,825 | $4,019 | $4,045 |
| (1) | Based on the underwritten rent roll dated November 1, 2024. |
| (2) | Monthly Average Rent per Unit is based on occupied units. |
| (3) | Source: Appraisal. |
The Market. The Addison Arts Apartments Property is located in Berkeley, California three blocks west of UC Berkeley. The Addison Arts Apartments Property is located on Addison Street, one block south of University Avenue and one block west of Shattuck Avenue, both of which are the main thoroughfares running through Berkeley. UC Berkeley is a four-year public university with an enrollment of 46,535 students as of the fall 2024 semester. Enrollment at UC Berkeley has increased every year since 2012 (when enrollment was 35,893 students), with the exception of 2020, when enrollment decreased by approximately 858 students due to the COVID-19 pandemic. Approximately 7,593 students (16.3% of total enrollment) live on campus although UC Berkeley does not require students to live on campus at any time.
According to the appraisal, the 2024 estimated population within a one-, three- and five-mile radius of the Addison Arts Apartments Property is 59,211, 215,055 and 393,796, respectively. The 2024 estimated median household income within the same radii was $77,692, $122,131 and $118,901, respectively.
According to the appraisal, the Addison Arts Apartments Property is situated in the Oakland/Berkeley apartment submarket, which contained approximately 96,437 units as of the second quarter of 2024. The Oakland/Berkeley multifamily submarket reported a vacancy rate of 7.6% with an average effective rent of $2,718 per unit.
| THE INFORMATION IN THIS STRUCTURAL AND COLLATERAL TERM SHEET IS NOT COMPLETE AND MAY BE AMENDED PRIOR TO THE TIME OF SALE. THIS TERM SHEET IS NOT AN OFFER TO SELL THESE SECURITIES AND IT IS NOT A SOLICITATION OF AN OFFER TO BUY THESE SECURITIES IN ANY JURISDICTION WHERE THE OFFER OR SALE IS NOT PERMITTED. | ||
| 106 | ||
| Multifamily – Mid Rise | Loan #11 | Cut-off Date Balance: | $30,100,000 | |
| 1933 Addison Street | Addison Arts Apartments | Cut-off Date LTV: | 68.6% | |
| Berkeley, CA 94704 | UW NCF DSCR: | 1.23x | ||
| UW NOI Debt Yield: | 8.2% |
The following table presents information regarding certain competitive properties to the Addison Arts Apartments Property:
| Competitive Rental Properties Summary(1) | |||||
| Property Name/Location | Year Built | # Units | Occupancy | Unit Mix | In-Place Monthly Rent per Unit |
Addison Arts Apartments Berkeley, CA | 2016 | 69(2) | 100.0%(2) | Studio | $2,498(2) |
| 1BR | $3,337(2) | ||||
| 2BR | $4,279 - $4,389(2) | ||||
| 3BR | $6,425(2) | ||||
Hillside Village Berkeley, CA | 2006 | 94 | 87.0% | Studio | $3,310 - $4,450 |
| 1BR | $3,500 - $4,500 | ||||
| 2BR | $3,662 - $6,200 | ||||
Stadium Place Berkeley, CA | 2006 | 74 | 90.0% | Studio | $2,900 |
| 1BR | $3,400 | ||||
| 2BR | $5,000 | ||||
B28 Berkeley, CA | 2023 | 37 | 97.0% | Studio | $2,795 |
| 1BR | $2,895 - $3,395 | ||||
| 2BR | $3,995 - $4,295 | ||||
Modera Berkeley Berkeley, CA | 2021 | 205 | 93.0% | Studio | $3,057 - $3,344 |
| 1BR | $3,173 - $3,810 | ||||
| 2BR | $3,880 - $5,252 | ||||
| 3BR | $5,445 | ||||
The Berkeley Place Berkeley, CA | 2021 | 50 | 92.0% | 1BR | $2,650 - $3,250 |
| 2BR | $3,550 - $4,050 | ||||
The Kittridge Berkeley, CA | 2024 | 169 | 90.0% | Studio | $2,295 |
| 1BR | $2,790 | ||||
The Standard at Berkeley Berkeley, CA | 2021 | 117 | 81.0% | Studio | $1,636 - $3,990 |
| 1BR | $3,250 - $3,490 | ||||
| 2BR | $6,099 - $8,640 | ||||
| (1) | Source: Appraisal. |
| (2) | Based on the underwritten rent roll dated November 1 2024. |
Appraisal. The appraisal concluded to an “as-is” appraised value as of October 15, 2024 of $43,900,000.
Environmental Matters. According to the Phase I environmental report dated October 11, 2024, there was no evidence of any recognized environmental conditions at the Addison Arts Apartments Property.
| THE INFORMATION IN THIS STRUCTURAL AND COLLATERAL TERM SHEET IS NOT COMPLETE AND MAY BE AMENDED PRIOR TO THE TIME OF SALE. THIS TERM SHEET IS NOT AN OFFER TO SELL THESE SECURITIES AND IT IS NOT A SOLICITATION OF AN OFFER TO BUY THESE SECURITIES IN ANY JURISDICTION WHERE THE OFFER OR SALE IS NOT PERMITTED. | ||
| 107 | ||
| Multifamily – Mid Rise | Loan #11 | Cut-off Date Balance: | $30,100,000 | |
| 1933 Addison Street | Addison Arts Apartments | Cut-off Date LTV: | 68.6% | |
| Berkeley, CA 94704 | UW NCF DSCR: | 1.23x | ||
| UW NOI Debt Yield: | 8.2% |
Operating History and Underwritten Net Cash Flow. The following table presents certain information relating to the historical operating performance and underwritten net cash flow at the Addison Arts Apartments Property:
| Cash Flow Analysis | ||||||
| 2021 | 2022 | 2023 | 10/31/2024 TTM | U/W | U/W $ per unit | |
| Gross Potential Rent(1) | $2,690,240 | $2,937,769 | $3,380,713 | $3,530,769 | $3,327,372 | $48,223 |
| Commercial Income | $0 | $0 | $0 | $0 | $293,340 | $4,251 |
| Other Income(2) | $0 | $0 | $28,419 | $26,985 | $47,325 | $686 |
| Net Rental Income | $2,690,240 | $2,937,769 | $3,409,132 | $3,557,754 | $3,668,037 | $53,160 |
| Less Vacancy, Concessions & Credit Loss | $0 | $0 | $0 | $0 | ($166,369) | ($2,411) |
| Effective Gross Income | $2,690,240 | $2,937,769 | $3,409,132 | $3,557,754 | $3,501,669 | $50,749 |
| Real Estate Taxes | $467,738 | $466,612 | 485,561 | $492,329 | $504,158 | $7,307 |
| Insurance | $36,138 | $23,185 | $38,485 | $37,331 | $34,516 | $500 |
| Management Fee | $66,000 | $96,570 | $67,115 | $79,527 | $105,050 | $1,522 |
| Other Expenses | $370,748 | $468,849 | $384,133 | $386,922 | $386,922 | $5,608 |
| Total Operating Expenses | $940,624 | $1,055,216 | $975,294 | $996,109 | $1,030,646 | $14,937 |
| Net Operating Income | $1,749,616 | $1,882,553 | $2,433,838 | $2,561,645 | $2,471,023 | $35,812 |
| Capital Expenditures | $0 | $0 | $0 | $0 | $17,250 | $250 |
| Net Cash Flow | $1,749,616 | $1,882,553 | $2,433,838 | $2,561,645 | $2,453,773 | $35,562 |
| Occupancy(3) | NAV | 98.8% | 96.4% | 100.0%(4) | 95.0%(5) | |
| NOI DSCR | 0.87x | 0.94x | 1.22x | 1.28x | 1.23x | |
| NCF DSCR | 0.87x | 0.94x | 1.22x | 1.28x | 1.23x | |
| NOI Debt Yield | 5.8% | 6.3% | 8.1% | 8.5% | 8.2% | |
| NCF Debt Yield | 5.8% | 6.3% | 8.1% | 8.5% | 8.2% | |
| (1) | U/W Gross Potential Rent is based on the underwritten rent roll dated November 1, 2024. |
| (2) | Other Income is comprised of parking revenue and in-place pet rent. |
| (3) | Historical Occupancies represent physical occupancies. |
| (4) | Represents occupancy based on the underwritten rent roll dated November 1, 2024. |
| (5) | Based on an economic vacancy of 5.0%. |
| THE INFORMATION IN THIS STRUCTURAL AND COLLATERAL TERM SHEET IS NOT COMPLETE AND MAY BE AMENDED PRIOR TO THE TIME OF SALE. THIS TERM SHEET IS NOT AN OFFER TO SELL THESE SECURITIES AND IT IS NOT A SOLICITATION OF AN OFFER TO BUY THESE SECURITIES IN ANY JURISDICTION WHERE THE OFFER OR SALE IS NOT PERMITTED. | ||
| 108 | ||
| Mortgage Loan No. 12 – Falls of Westpark |
| Mortgage Loan Information | Property Information | |||||
| Mortgage Loan Seller: | AREF2 | Single Asset/Portfolio: | Single Asset | |||
| Credit Assessment (KBRA/Fitch/Moody’s): | NR/NR/NR | Location: | Houston, TX 77057 | |||
| Original Balance: | $29,000,000 | General Property Type: | Multifamily | |||
| Cut-off Date Balance: | $29,000,000 | Detailed Property Type: | Low Rise | |||
| % of Initial Pool Balance: | 3.5% | Title Vesting: | Fee | |||
| Loan Purpose: | Refinance | Year Built/Renovated: | 1970/2009 | |||
| Borrower Sponsor: | Rao J. Polavarapu | Size: | 352 Units | |||
| Guarantor: | Rao J. Polavarapu | Cut-off Date Balance per Unit: | $82,386 | |||
| Mortgage Rate: | 6.8420% | Maturity Date Balance per Unit: | $82,386 | |||
| Note Date: | 12/2/2024 | Property Manager: | NMJ, Inc. | |||
| Maturity Date: | 12/6/2029 | Underwriting and Financial Information | ||||
| Term to Maturity: | 60 months | UW NOI: | $2,925,819(4) | |||
| Amortization Term: | 0 months | UW NCF: | $2,837,819 | |||
| IO Period: | 60 months | UW NOI Debt Yield: | 10.1% | |||
| Seasoning: | 1 month | UW NCF Debt Yield: | 9.8% | |||
| Prepayment Provisions: | L(25),D(32),O(3) | UW NOI Debt Yield at Maturity: | 10.1% | |||
| Lockbox/Cash Mgmt Status: | Soft/Springing | UW NCF DSCR: | 1.41x | |||
| Additional Debt Type: | NAP | Most Recent NOI(4): | $2,601,562 (10/31/2024 TTM) | |||
| Additional Debt Balance: | NAP | 2nd Most Recent NOI: | $2,118,666 (12/31/2023) | |||
| Future Debt Permitted (Type): | No (NAP) | 3rd Most Recent NOI: | $1,858,087 (12/31/2022) | |||
| Most Recent Occupancy: | 95.5% (10/31/2024) | |||||
| Reserves | 2nd Most Recent Occupancy: | 91.5% (12/31/2023) | ||||
| Type | Initial | Monthly | Cap | 3rd Most Recent Occupancy: | 92.7% (12/31/2022) | |
| Taxes: | $0 | $39,857 | NAP | Appraised Value (as of): | $45,500,000 (10/21/2024) | |
| Insurance: | $55,022 | $27,511 | NAP | Appraised Value per Unit: | $129,261 | |
| Replacement Reserve: | $0 | $7,333 | NAP | Cut-off Date LTV Ratio: | 63.7% | |
| Deferred Maintenance: | $168,475 | $0 | NAP | Maturity Date LTV Ratio: | 63.7% | |
| Earnout Reserve(1): | $2,140,000 | $0 | NAP | |||
| Sources and Uses | ||||||
| Sources | Proceeds | % of Total | Uses | Proceeds | % of Total | |
| Loan Amount: | $29,000,000 | 100.0% | Loan Payoff(2) | $23,889,183 | 82.4% | |
| Upfront Reserves | $2,363,497 | 8.1% | ||||
| Closing Costs(3) | $1,982,772 | 6.8% | ||||
| Return of Equity | $764,548 | 2.6% | ||||
| Total Sources: |
$29,000,000 | 100.0% | Total Uses: | $29,000,000 | 100.0% | |
| (1) | Provided no event of default has occurred and is continuing, the earnout reserve funds may be disbursed to the borrower when the earnout debt service coverage ratio (“Earnout DSCR”) equals at least 1.20x (based on the lender’s adjustments to vacancy, operating expenses, taxes and insurance and capital items). If the earnout reserve funds have not been disbursed by December 2, 2027, the earnout reserve funds may be partially disbursed in an amount such that the outstanding principal balance of the Falls of Westpark Mortgage Loan (as defined below) net of the earnout reserve funds remaining in reserve results in an Earnout DSCR of at least 1.20x. Any outstanding funds remaining in the earnout reserve on December 2, 2027 will be used to partially prepay the Falls of Westpark Mortgage Loan (as defined below), subject to required yield maintenance premiums. The UW DSCR based on NOI/NCF, UW Debt Yield based on NOI/NCF, UW Debt Yield at Maturity based on NOI/NCF, Cut-off Date LTV Ratio, and LTV Ratio at Maturity based on the Falls of Westpark Mortgage Loan net of the amounts on deposit in the earnout reserve fund are 1.57x / 1.52x, 10.9% / 10.6%, 10.9% / 10.6%, 59.0%, and 59.0%, respectively. |
| (2) | Loan payoff include $9,345,233.13 of unsecured loans from unaffiliate third parties. |
| (3) | Closing Costs include an origination fee of $290,000. |
| (4) | The increase from Most Recent NOI to UW NOI is primarily due to an increase an occupancy from a 93.6% average in the 10/31/2024 TTM period to the current occupancy of 95.5%, an increase in net effective rents of 3.2%, and a decrease in insurance expense of approximately $138,000. |
The Mortgage Loan. The twelfth largest mortgage loan (the “Falls of Westpark Mortgage Loan”) is evidenced by a promissory note in the original principal amount of $29,000,000 and secured by a first-priority fee mortgage encumbering a 352-unit low rise multifamily property in Houston, Texas (the “Falls of Westpark Property”).
The Borrower and the Borrower Sponsor. The borrower for the Falls of Westpark Mortgage Loan is Falls of Westpark Apartments, Ltd., a single-purpose, Texas limited partnership, with one independent director in its organizational structure. Legal counsel to the borrower delivered a non-consolidation opinion in connection with the origination of the Falls of Westpark Mortgage Loan. The borrower sponsor and non-recourse carve-out guarantor for the Falls of Westpark Mortgage Loan is Rao J. Polavarapu. Rao J. Polavarapu is the owner and founder of Falls Apartment Group, a Houston-based real estate investment company founded in 1998. The Falls Apartment Group currently holds an interest in 23 multifamily properties in the Houston area.
The Property. The Falls of Westpark Property is a 352-unit multifamily complex located in Houston, Texas, approximately 10 miles west of downtown Houston. Situated on an 8.21-acre site, the improvements consist of 13, three-story buildings constructed in 1970. The Falls of Westpark Property features
| THE INFORMATION IN THIS STRUCTURAL AND COLLATERAL TERM SHEET IS NOT COMPLETE AND MAY BE AMENDED PRIOR TO THE TIME OF SALE. THIS TERM SHEET IS NOT AN OFFER TO SELL THESE SECURITIES AND IT IS NOT A SOLICITATION OF AN OFFER TO BUY THESE SECURITIES IN ANY JURISDICTION WHERE THE OFFER OR SALE IS NOT PERMITTED. | ||
| 109 | ||
| Multifamily – Low Rise | Loan #12 | Cut-off Date Balance: | $29,000,000 | |
| 6130 Southwest Freeway | Falls of Westpark | Cut-off Date LTV: | 63.7% | |
| Houston, TX 77057 | UW NCF DSCR: | 1.41x | ||
| UW NOI Debt Yield: | 10.1% |
amenities such as a swimming pool, fitness center, gated entrance, clubhouse, and three laundry facilities. Unit amenities include granite countertops, stainless steel appliances, ceiling fans, and walk-in closets. The Falls of Westpark Property features 270 surface parking spaces, resulting in a parking ratio of 0.77 spaces per unit.
The borrower sponsor acquired the Falls of Westpark Property in 2003 and has invested approximately $6.0 million in capital expenditures since acquisition. Approximately $638,000 has been spent on capital improvements since 2021, including interior improvements such as appliances, wood flooring and carpeting, and exterior improvements such as roofing and landscaping. The borrower sponsor successfully increased net operating income by approximately 42.0%, from $1.8 million in 2021 to $2.6 million in the trailing-twelve months ending October 31, 2024, primarily driven by a 32.0% increase in net rental collections per unit and a 6.7% increase in occupancy.
As of October 31, 2024, the Falls of Westpark Property was 95.5% occupied. Between January 2021 and October 2024 occupancy averaged 91.7%. The unit mix at the Falls of Westpark Property is comprised of 56 studio units, 205 one-bedroom units, 54 two-bedroom units, 30 three-bedroom units and seven four-bedroom units.
The table below shows the unit mix at the Falls of Westpark Property:
| Unit Mix(1) | |||||||
| Unit Mix / Type | Units | Occupied Units | % Occupied | Average SF per Unit | Total SF | Monthly Average Rent per Unit(2) | Monthly Average Market Rent per Unit(3) |
| Studio | 56 | 55 | 98.2% | 440 | 24,640 | $875 | $875 |
| One Bedroom | 205 | 190 | 92.7% | 727 | 149,036 | $1,201 | $1,218 |
| Two Bedroom | 54 | 54 | 100.0% | 920 | 49,680 | $1,488 | $1,490 |
| Three Bedroom | 30 | 30 | 100.0% | 1,471 | 44,130 | $1,903 | $1,903 |
| Four Bedroom | 7 | 7 | 100.0% | 1,900 | 13,300 | $2,124 | $2,130 |
| Total/Wtd. Avg. | 352 | 336 | 95.5% | 798 | 280,786 | $1,275 | $1,282 |
| (1) | Based on the underwritten rent roll dated October 31, 2024. |
| (2) | Monthly Average Rent per Unit is based on occupied units. |
| (3) | Source: Appraisal. |
The Market. The Falls of Westpark Property is located in Houston, Texas approximately ten miles west of downtown Houston. Highways proximate to the Falls of Westpark Property include Interstate 69, Interstate 610 and the Westpark Tollway, which provide access to the greater Houston metropolitan area. The Fall of Westpark Property is located in the Galleria/Uptown submarket of Houston, which is a retail hub with affluent demographics with a location near major interstate highways. The Galleria, an approximately 2.4 million square foot super-regional mall, is located approximately 2.5 miles from the Falls of Westpark Property. Major employers in the Houston metropolitan area include NASA Johnson Space Center, University of Texas Medical Branch, ExxonMobil, Shell Oil Co. and Chevron Corp.
According to the appraisal, the 2024 estimated population within a one-, three- and five-mile radius of the Falls of Westpark Property is 42,832, 233,873 and 532,434, respectively. The 2024 estimated median household income within the same radii was $41,003, $63,381 and $68,856, respectively.
According to the appraisal, the Falls of Westpark Property is situated in the Galleria/Uptown multifamily submarket, which contained approximately 17,266 units as of the third quarter of 2024. The Galleria/Uptown multifamily submarket reported a vacancy rate of 7.9% with an average effective rent of $1,504 per unit.
| THE INFORMATION IN THIS STRUCTURAL AND COLLATERAL TERM SHEET IS NOT COMPLETE AND MAY BE AMENDED PRIOR TO THE TIME OF SALE. THIS TERM SHEET IS NOT AN OFFER TO SELL THESE SECURITIES AND IT IS NOT A SOLICITATION OF AN OFFER TO BUY THESE SECURITIES IN ANY JURISDICTION WHERE THE OFFER OR SALE IS NOT PERMITTED. | ||
| 110 | ||
| Multifamily – Low Rise | Loan #12 | Cut-off Date Balance: | $29,000,000 | |
| 6130 Southwest Freeway | Falls of Westpark | Cut-off Date LTV: | 63.7% | |
| Houston, TX 77057 | UW NCF DSCR: | 1.41x | ||
| UW NOI Debt Yield: | 10.1% |
The following table presents information regarding certain competitive properties to the Falls of Westpark Property:
| Competitive Rental Properties Summary(1) | |||||
| Property Name/Location | Year Built | # Units | Occupancy | Unit Mix |
In-Place Monthly Rent per Unit |
Falls of Westpark Houston, TX | 1970 | 352(2) | 95.5%(2) | Studio | $875(2) |
| 1BR | $1,201(2) | ||||
| 2BR | $1,488(2) | ||||
| 3BR | $1,903(2) | ||||
| 4BR | $2,124(2) | ||||
Watermill Houston, TX | 1968 | 192 | 99.0% | Studio | $1,070 |
| 1BR | $1,440 | ||||
| 2BR | $1,475 - $1,712 | ||||
The Alora Houston, TX | 1973 | 400 | 96.0% | Studio | $781 - $929 |
| 1BR | $869 - $1,169 | ||||
| 2BR | $1,193 - $1,572 | ||||
| 3BR | $1,275 - $1,869 | ||||
Stonehaven at the Galleria Houston, TX | 1968 | 338 | 97.0% | 1BR | $1,074 - $1,386 |
| 2BR | $1,337 - $1,730 | ||||
| 3BR | $1,860 - $2,191 | ||||
Lantern Village Houston, TX | 1968 | 1,793 | 90.0% | 1BR | $880 - $1,000 |
| 2BR | $1,150 - $1,450 | ||||
| 3BR | $1,810 - $1,855 | ||||
| 4BR | $1,930 - $2,310 | ||||
Galleria Flats Houston, TX | 1971 | 160 | 98.0% | 1BR | $1,061 - $1,365 |
| 2BR | $1,365 - $1,616 | ||||
| 3BR | $1,833 | ||||
| (1) | Source: Appraisal. |
| (2) | Based on the underwritten rent roll dated October 31, 2024. |
Appraisal. The appraisal concluded to an “as-is” appraised value as of October 21, 2024 of $45,500,000.
Environmental Matters. According to the Phase I environmental report dated October 25, 2024, there was no evidence of any recognized environmental conditions at the Falls of Westpark Property.
| THE INFORMATION IN THIS STRUCTURAL AND COLLATERAL TERM SHEET IS NOT COMPLETE AND MAY BE AMENDED PRIOR TO THE TIME OF SALE. THIS TERM SHEET IS NOT AN OFFER TO SELL THESE SECURITIES AND IT IS NOT A SOLICITATION OF AN OFFER TO BUY THESE SECURITIES IN ANY JURISDICTION WHERE THE OFFER OR SALE IS NOT PERMITTED. | ||
| 111 | ||
| Multifamily – Low Rise | Loan #12 | Cut-off Date Balance: | $29,000,000 | |
| 6130 Southwest Freeway | Falls of Westpark | Cut-off Date LTV: | 63.7% | |
| Houston, TX 77057 | UW NCF DSCR: | 1.41x | ||
| UW NOI Debt Yield: | 10.1% |
Operating History and Underwritten Net Cash Flow. The following table presents certain information relating to the historical operating performance and underwritten net cash flow at the Falls of Westpark Property:
| Cash Flow Analysis | ||||||
| 2021 | 2022 | 2023 | 10/31/2024 TTM | UW | UW per unit | |
| Gross Potential Rent(1) | $3,722,201 | $4,031,514 | $4,337,698 | $4,928,254 | $5,373,228 | $15,265 |
| Other Income(2) | $58,545 | $59,613 | $60,488 | $55,506 | $55,506 | $158 |
| Net Rental Income | $3,780,745 | $4,091,127 | $4,398,186 | $4,983,760 | $5,428,734 | $15,423 |
| Less Vacancy, Concessions & Credit Loss | ($88,346) | ($111,555) | ($109,589) | ($131,523) | ($325,651) | ($925) |
| Effective Gross Income | $3,692,399 | $3,979,573 | $4,288,597 | $4,852,237 | $5,103,083 | $14,497 |
| Real Estate Taxes | $395,305 | $452,447 | $450,348 | $433,687 | $478,284 | $1,359 |
| Insurance | $220,992 | $270,801 | $340,378 | $468,681 | $330,729 | $940 |
| Management Fee | $119,926 | $120,225 | $131,923 | $150,039 | $153,092 | $435 |
| Other Expenses | $1,123,736 | $1,278,012 | $1,247,283 | $1,198,268 | $1,215,159 | $3,452 |
| Total Operating Expenses | $1,859,959 | $2,121,485 | $2,169,932 | $2,250,675 | $2,177,264 | $6,185 |
| Net Operating Income | $1,832,441 | $1,858,087 | $2,118,666 | $2,601,562 | $2,925,819 | $8,312 |
| Capital Expenditures | $0 | $0 | $0 | $0 | $88,000 | $250 |
| Net Cash Flow | $1,832,441 | $1,858,087 | $2,118,666 | $2,601,562 | $2,837,819 | $8,062 |
| Occupancy(3) | 89.5% | 92.7% | 91.5% | 95.5%(4) | 93.9%(5) | |
| NOI DSCR | 0.91x | 0.92x | 1.05x | 1.29x | 1.45x | |
| NCF DSCR | 0.91x | 0.92x | 1.05x | 1.29x | 1.41x | |
| NOI Debt Yield | 6.3% | 6.4% | 7.3% | 9.0% | 10.1% | |
| NCF Debt Yield | 6.3% | 6.4% | 7.3% | 9.0% | 9.8% | |
| (1) | UW Gross Potential Rent is based on the borrower rent roll dated October 31, 2024. |
| (2) | Other Income is comprised of laundry, application fees, month-to-month fees, and other miscellaneous fees. |
| (3) | Historical occupancies represent physical occupancies. |
| (4) | Represents occupancy based on the borrower rent roll dated October 31, 2024. |
| (5) | Based on an economic vacancy of 6.1%. |
| THE INFORMATION IN THIS STRUCTURAL AND COLLATERAL TERM SHEET IS NOT COMPLETE AND MAY BE AMENDED PRIOR TO THE TIME OF SALE. THIS TERM SHEET IS NOT AN OFFER TO SELL THESE SECURITIES AND IT IS NOT A SOLICITATION OF AN OFFER TO BUY THESE SECURITIES IN ANY JURISDICTION WHERE THE OFFER OR SALE IS NOT PERMITTED. | ||
| 112 | ||
| Mortgage Loan No. 13 – Queens Center |
| Mortgage Loan Information | Property Information | ||||||
| Mortgage Loan Seller: | GSMC | Single Asset/Portfolio: | Single Asset | ||||
| Credit Assessment (Fitch/Moody’s/KBRA): | BBB/NR/BBB | Location: | Elmhurst, NY 11373 | ||||
| Original Balance(1): | $25,000,000 | General Property Type: | Retail | ||||
| Cut-off Date Balance(1): | $25,000,000 | Detailed Property Type: | Super Regional Mall | ||||
| % of Initial Pool Balance: | 3.0% | Title Vesting(3): | Fee/Leasehold | ||||
| Loan Purpose: | Refinance | Year Built/Renovated: | 1973/2004 | ||||
| Borrower Sponsor: | The Macerich Partnership, L.P. | Size(4): | 412,033 SF | ||||
| Guarantor: | The Macerich Partnership, L.P. | Cut-off Date Balance PSF(1): | $1,274 | ||||
| Mortgage Rate: | 5.3700% | Maturity Date Balance PSF(1): | $1,274 | ||||
| Note Date: | 10/28/2024 | Property Manager: | Macerich Property Management Company, LLC | ||||
| Maturity Date: | 11/6/2029 | (borrower-related) | |||||
| Term to Maturity: | 60 months | ||||||
| Amortization Term: | 0 months | Underwriting and Financial Information | |||||
| IO Period: | 60 months | UW NOI: | $53,620,566 | ||||
| Seasoning: | 2 months | UW NCF: | $52,532,319 | ||||
| Prepayment Provisions(2): | L(26),DorYM1(27),O(7) | UW NOI Debt Yield(1): | 10.2% | ||||
| Lockbox/Cash Mgmt Status: | Hard/Springing | UW NCF Debt Yield(1): | 10.0% | ||||
| Additional Debt Type(1): | Pari Passu | UW NOI Debt Yield at Maturity(1): | 10.2% | ||||
| Additional Debt Balance(1): | $500,000,000 | UW NCF DSCR(1): | 1.84x | ||||
| Future Debt Permitted (Type): | No (NAP) | Most Recent NOI: | $49,730,304 (9/30/2024 TTM) | ||||
| 2nd Most Recent NOI: | $52,482,275 (12/31/2023) | ||||||
| Reserves | 3rd Most Recent NOI: | $55,476,544 (12/31/2022) | |||||
| Type | Initial | Monthly | Cap | Most Recent Occupancy: | 95.4% (10/7/2024) | ||
| Taxes: | $0 | Springing | NAP | 2nd Most Recent Occupancy: | 98.9% (12/31/2023) | ||
| Insurance: | $0 | Springing | NAP | 3rd Most Recent Occupancy: | 98.7% (12/31/2022) | ||
| Replacement Reserves: | $0 | Springing | $206,017 | Appraised Value (as of): | $1,060,000,000 (9/19/2024) | ||
| TI / LC Reserve: | $0 | Springing | $641,476 | Appraised Value PSF: | $2,573 | ||
| Outstanding TI/LC and Gap Rent: | $12,211,534 | $0 | NAP | Cut-off Date LTV Ratio(1): | 49.5% | ||
| Maturity Date LTV Ratio(1): | 49.5% | ||||||
| Sources and Uses | ||||||
| Sources | Proceeds | % of Total | Uses | Proceeds | % of Total | |
| Whole Loan(1) | $525,000,000 | 85.2% | Loan Payoff | $601,802,949 | 97.7% | |
| Borrower Sponsor Equity | $91,238,851 | 14.8% | Reserves | $12,211,534 | 2.0% | |
| Closing Costs | $2,224,368 | 0.4% | ||||
| Total Sources: | $616,238,851 | 100.0% | Total Uses: | $616,238,851 | 100.0% | |
| (1) | The Queens Center Mortgage Loan (as defined below) is part of the Queens Center Whole Loan (as defined below), which is comprised of 33 pari passu promissory notes with an aggregate original principal balance of $525,000,000. The Financial Information in the chart above is based on the Queens Center Whole Loan. See “The Mortgage Loan” below. |
| (2) | The lockout period will be at least 26 payment dates beginning with and including the first payment date on December 6, 2024. Defeasance of the Queens Center Whole Loan in full is permitted at any time after the earlier to occur of (i) November 6, 2027 and (ii) the date that is two years from the closing date of the securitization that includes the last pari passu note to be securitized (the “Lockout Release Date”). In addition, on any business day from and after the Lockout Release Date, voluntary prepayment of the Queens Center Whole Loan is permitted in whole (but not in part), together with, if such voluntary prepayment occurs prior to the monthly payment date that occurs in May 2029, a prepayment fee equal to the greater of (x) 1.00% of the principal amount of the Queens Center Whole Loan being prepaid and (y) a yield maintenance premium. The assumed lockout period of 26 payments is based on the anticipated closing date of the WFCM 2025-5C3 securitization in January 2025. The actual lockout period may be longer. |
| (3) | See “Ground Lease” below. |
| (4) | Size is exclusive of 556,724 square feet associated with Macy’s and JCPenney, both of which are non-collateral anchor tenants. |
The Mortgage Loan. The thirteenth largest mortgage loan (the “Queens Center Mortgage Loan”) is part of a whole loan (the “Queens Center Whole Loan”) evidenced by 33 pari passu promissory notes with an aggregate outstanding principal balance as of the Cut-off Date of $525,000,000. The Queens Center Whole Loan is secured by the borrowers’ fee and leasehold interests in a 412,033 square foot retail property located in Elmhurst, New York (the “Queens Center Property”) as well as the Pledgor Borrower’s (as defined below) membership interest in the Property Borrower (as defined below). The Queens Center Mortgage Loan is evidenced by the non-controlling Note A-2-6. The Queens Center Whole Loan was originated by German American Capital Corporation (“GACC”), Goldman Sachs Bank USA (“GSBI”), JPMorgan Chase Bank, National Association (“JPMCB”), Bank of Montreal (“BMO”) and Morgan Stanley Bank, N.A. (“MSBNA”).
The relationship among the holders of the notes evidencing the Queens Center Whole Loan is governed by a co-lender agreement as described under “Description of the Mortgage Pool—The Whole Loans—The Non-Serviced Pari Passu Whole Loans” in the Preliminary Prospectus. The Queens Center Whole Loan will be serviced pursuant to the pooling and servicing agreement for the BBCMS 2024-5C31 securitization trust. See “Pooling and Servicing Agreement—Servicing of the Non-Serviced Mortgage Loans” in the Preliminary Prospectus.
| THE INFORMATION IN THIS STRUCTURAL AND COLLATERAL TERM SHEET IS NOT COMPLETE AND MAY BE AMENDED PRIOR TO THE TIME OF SALE. THIS TERM SHEET IS NOT AN OFFER TO SELL THESE SECURITIES AND IT IS NOT A SOLICITATION OF AN OFFER TO BUY THESE SECURITIES IN ANY JURISDICTION WHERE THE OFFER OR SALE IS NOT PERMITTED. | ||
| 113 | ||
| Retail – Super Regional Mall | Loan #13 | Cut-off Date Balance: | $25,000,000 | |
| 90-15 Queens Boulevard | Queens Center | Cut-off Date LTV: | 49.5% | |
| Elmhurst, NY 11373 | UW NCF DSCR: | 1.84x | ||
| UW NOI Debt Yield: | 10.2% |
The table below identifies the promissory notes that comprise the Queens Center Whole Loan:
| Whole Loan Summary | ||||
| Note | Original Balance | Cut-off Date Balance | Note Holder | Controlling Piece |
| A-1-1 | $50,000,000 | $50,000,000 | BBCMS 2024-5C31 | Yes |
| A-1-2 | $25,000,000 | $25,000,000 | Benchmark 2024-V12 | No |
| A-1-3(1) | $25,000,000 | $25,000,000 | GACC | No |
| A-1-4-1 | $16,000,000 | $16,000,000 | BMO 2024-5C8 | No |
| A-1-4-2(1) | $4,000,000 | $4,000,000 | GACC | No |
| A-1-5 | $15,000,000 | $15,000,000 | BMO 2024-5C8 | No |
| A-1-6-1 | $7,000,000 | $7,000,000 | Benchmark 2024-V12 | No |
| A-1-6-2(1) | $8,000,000 | $8,000,000 | GACC | No |
| A-2-1 | $15,000,000 | $15,000,000 | WFCM 2024-5C2 | No |
| A-2-2-1 | $10,000,000 | $10,000,000 | Benchmark 2024-V12 | No |
| A-2-2-2 | $5,000,000 | $5,000,000 | BMO 2024-5C8 | No |
| A-2-3 | $15,000,000 | $15,000,000 | BMO 2024-5C8 | No |
| A-2-4-1 | $11,500,000 | $11,500,000 | Benchmark 2024-V12 | No |
| A-2-4-2(1) | $3,500,000 | $3,500,000 | GSBI | No |
| A-2-5(1) | $15,000,000 | $15,000,000 | GSBI | No |
| A-2-6 | $25,000,000 | $25,000,000 | WFCM 2025-5C3 | No |
| A-3-1 | $43,000,000 | $43,000,000 | BANK5 2024-5YR11 | No |
| A-3-2 | $20,000,000 | $20,000,000 | BANK5 2024-5YR12 | No |
| A-3-3 | $15,000,000 | $15,000,000 | WFCM 2024-5C2 | No |
| A-3-4 | $15,000,000 | $15,000,000 | BANK5 2024-5YR12 | No |
| A-3-5 | $7,000,000 | $7,000,000 | BANK5 2024-5YR12 | No |
| A-4-1-1 | $10,000,000 | $10,000,000 | BBCMS 2024-5C31 | No |
| A-4-1-2 | $5,000,000 | $5,000,000 | BMO 2024-5C8 | No |
| A-4-2 | $15,000,000 | $15,000,000 | BMO 2024-5C8 | No |
| A-4-3 | $15,000,000 | $15,000,000 | Benchmark 2024-V12 | No |
| A-4-4-1(1) | $8,500,000 | $8,500,000 | BMO | No |
| A-4-4-2 | $6,500,000 | $6,500,000 | Benchmark 2024-V12 | No |
| A-4-5(1) | $15,000,000 | $15,000,000 | BMO | No |
| A-4-6 | $25,000,000 | $25,000,000 | BBCMS 2024-5C31 | No |
| A-5-1 | $32,000,000 | $32,000,000 | BANK5 2024-5YR11 | No |
| A-5-2 | $20,000,000 | $20,000,000 | BANK5 2024-5YR12 | No |
| A-5-3 | $15,000,000 | $15,000,000 | BANK5 2024-5YR12 | No |
| A-5-4 | $8,000,000 | $8,000,000 | BANK5 2024-5YR12 | No |
| Total | $525,000,000 | $525,000,000 | ||
| (1) | Expected to be contributed to one or more future securitization transactions. |
The Borrowers and the Borrower Sponsor. The borrowers are Queens Center SPE LLC (the “Property Borrower”) and Queens Center Pledgor LLC (the “Pledgor Borrower”; together with the Property Borrower, the “Borrowers”), each a Delaware limited liability company and single purpose entity with two independent directors. Legal counsel to the Borrowers delivered a non-consolidation opinion in connection with the origination of the Queens Center Whole Loan.
The borrower sponsor and non-recourse carveout guarantor is The Macerich Partnership, L.P., which is a subsidiary of Macerich. Macerich is a fully integrated, self-managed and self-administered real estate investment trust. Developing and managing properties that serve as community cornerstones, Macerich currently owns 44 million square feet of real estate consisting primarily of interests in 41 retail centers.
The Property. Built in 1973 and renovated in 2004, Queens Center (the “Queens Center Mall”) is a 968,757 square foot (412,033 collateral square feet) super regional mall located in Elmhurst, New York situated on an 11.21-acre parcel with 8.41 acres of owned acreage and 1,903 parking spaces. Of the 968,757 total square feet, 412,033 square feet constitutes the collateral for the Queens Center Whole Loan, with the remaining non-collateral areas of the Queens Center Mall occupied by Macy’s and JCPenney and owned by third parties.
Representing the sole enclosed super-regional shopping center in Queens, the Queens Center Mall attracts 9.4 million visitors annually and has a trade area of 2.4 million people as of 2022. The Queens Center Mall has historically benefited from high tenant demand with occupancy averaging nearly 99% over the last 10 years. Further, the Queens Center Property is currently 95.4% leased and features a mix of 120 national and regional tenants. Since 2022, the borrower sponsor has been able to re-tenant or renew over 60% of the collateral square feet. Recently, the borrower sponsor has leased to several new tenants including Primark (54,832 square feet), ZARA (36,463 square feet) and H&M (19,694 square feet).
The Queens Center Mall was originally acquired by the borrower sponsor in 1995. In 2004, the borrower sponsor invested $275.0 million to fully redevelop and expand the Queens Center Property. The expansion featured the addition of 250,000 in-line square feet and JCPenney’s development of an
| THE INFORMATION IN THIS STRUCTURAL AND COLLATERAL TERM SHEET IS NOT COMPLETE AND MAY BE AMENDED PRIOR TO THE TIME OF SALE. THIS TERM SHEET IS NOT AN OFFER TO SELL THESE SECURITIES AND IT IS NOT A SOLICITATION OF AN OFFER TO BUY THESE SECURITIES IN ANY JURISDICTION WHERE THE OFFER OR SALE IS NOT PERMITTED. | ||
| 114 | ||
| Retail – Super Regional Mall | Loan #13 | Cut-off Date Balance: | $25,000,000 | |
| 90-15 Queens Boulevard | Queens Center | Cut-off Date LTV: | 49.5% | |
| Elmhurst, NY 11373 | UW NCF DSCR: | 1.84x | ||
| UW NOI Debt Yield: | 10.2% |
approximately 204,000 square foot box, which JCPenney subsequently sold to Ashkenazy Acquisition Corporation in January 2022. Since 2019, the borrowers have invested $65.2 million in leasing capital, common area renovations and operational upgrades with a planned investment of an additional $13.0 million by the end of 2024 (such additional investment is not required or reserved for under the Queens Center Whole Loan documents). Of the $78.2 million spent or budgeted from 2019 through year end 2024, $15.2 million has been allocated toward buildout of ZARA’s new 36,463 square foot store, which combined 10 in-line units across two floors. Furthermore, The Macerich Company (“Macerich”) has invested $19.7 million and $6.3 million in tenant allowances and buildout costs for Primark (54,832 square feet) and H&M (19,694 square feet), respectively.
According to the appraisal, the Queens Center Mall is a top-producing center in New York City, attracting significant foot traffic and generating over $500 million in annual sales. The Queens Center Mall’s sales PSF are significantly higher than the national average, with comparable mall shop sales reported at $1,731 PSF ($1,165 PSF excluding Apple). According to the borrower sponsor, as of TTM July 2024, the non-collateral Macy’s and JCPenney reported annual sales of $132,000,000 and $26,000,000, respectively.
Major Tenants. The four largest tenants by underwritten base rent at Queens Center Property are Primark, American Eagle Outfitters, ZARA and H&M.
Primark (54,832 square feet; 13.3% of NRA; 5.6% of underwritten base rent). Founded in 1969, Primark is an international fashion retailer that offers affordable fashion, home goods and accessories. Primark operates over 450 stores across 17 countries across Europe and the United States. The Queens Center Property hosts Primark’s newest location in the Tri-State area. Primark is in occupancy, having taken possession of its space in December 2024. Primark’s lease expires in January 2035, with two, five-year extension options remaining and a termination option in the event that gross sales between December 2027 and November 2028 do not exceed $23,000,000, provided Primark gives notice within 90 days following November 30, 2028.
American Eagle Outfitters (10,268 square feet; 2.5% of NRA; 3.4% of underwritten base rent). Founded in 1977, American Eagle Outfitters is a global specialty retailer that offers various types of apparel, intimates, activewear, accessories and personal care products. With over 1,000 stores worldwide, American Eagle Outfitters focuses on providing a unique shopping experience for the 15 to 25 year-old consumer demographic. American Eagle Outfitters reported annual sales for the TTM July 2024 period of $10,541,311 ($1,027 PSF). American Eagle Outfitters’ lease at the Queens Center Property expires in September 2032 and has no extension or termination options.
ZARA (36,463 square feet; 8.8% of NRA; 3.2% of underwritten base rent). Founded in 1974, ZARA is an international fashion retailer and part of the Inditex Group. ZARA operates approximately 3,000 stores in 96 countries, offering a wide range of fashion-forward apparel. ZARA’s forecasted reported annual sales for the TTM July 2024 period are $23,559,201 ($646 PSF). ZARA’s lease at the Queens Center Property expires in November 2033, with one, five-year extension option remaining and a termination option effective either (i) December 31, 2028 or (ii) May 31, 2031, in each case upon 270 days’ prior notice and payment of a termination fee.
H&M (19,694 square feet; 4.8% of NRA; 2.8% of underwritten base rent). Founded in 1947, H&M, part of the H&M Group, is a global fashion retailer offering a broad range of clothing and accessories for men, women and children. H&M has over 4,300 stores across 77 countries worldwide and is known for its commitment to affordable fashion. H&M’s lease at the Queens Center Property expires in January 2035, with two, four-year extension options remaining and a termination option if its gross sales (i) between January 2028 and December 2028 do not exceed $16,000,000 or (ii) between January 2031 and December 2031 do not exceed $18,000,000, in each case, provided H&M gives notice within 120 days following such period.
The following table presents certain information relating to the sales history for the Queens Center Property:
| Comparable Sales History(1) | |||||
| 2019 | 2021 | 2022 | 2023 | TTM July 2024 | |
| Comparable Inline (<10,000 SF) Sales PSF | $1,581 | $1,615 | $1,717 | $1,751 | $1,731 |
| Comparable Inline (<10,000 SF excluding Apple) Sales PSF | $1,145 | $1,122 | $1,189 | $1,147 | $1,165 |
| Comparable Inline (<10,000 SF excluding Apple) Occupancy Cost(2) | 22.5% | 21.7% | 21.1% | 22.8% | 22.1% |
| Non-collateral Anchor Sales(3) | $173,300,000 | $159,700,000 | $164,000,000 | $164,000,000 | $158,000,000 |
| Comparable Total Queens Center Mall Sales | $616,120,375 | $536,343,372 | $561,506,309 | $562,896,033 | $533,839,416 |
| (1) | All sales information presented above is based upon information provided by the borrower sponsor. In certain instances, sales figures represent estimates because the tenants are not required to report, or otherwise may not have reported sales information on a timely basis. Further, because sales are self-reported, such information is not independently verified by the borrower sponsor. 2020 numbers are excluded due to the COVID-19 pandemic. |
| (2) | Occupancy Cost is calculated based on gross sales divided by the sum of (i) contractual rent and (ii) reimbursements, each based on the underwritten rent roll dated October 7, 2024. |
| (3) | Includes sales of Macy’s and JCPenney, both of which are non-collateral anchors, as provided by the borrower sponsor. |
| THE INFORMATION IN THIS STRUCTURAL AND COLLATERAL TERM SHEET IS NOT COMPLETE AND MAY BE AMENDED PRIOR TO THE TIME OF SALE. THIS TERM SHEET IS NOT AN OFFER TO SELL THESE SECURITIES AND IT IS NOT A SOLICITATION OF AN OFFER TO BUY THESE SECURITIES IN ANY JURISDICTION WHERE THE OFFER OR SALE IS NOT PERMITTED. | ||
| 115 | ||
| Retail – Super Regional Mall | Loan #13 | Cut-off Date Balance: | $25,000,000 | |
| 90-15 Queens Boulevard | Queens Center | Cut-off Date LTV: | 49.5% | |
| Elmhurst, NY 11373 | UW NCF DSCR: | 1.84x | ||
| UW NOI Debt Yield: | 10.2% |
The following table presents certain information relating to the tenancy at the Queens Center Property:
| Tenant Summary(1) | ||||||||||||
| Tenant Name | Credit Rating (Fitch/Moody's/S&P)(2) | Tenant SF | Approx. % of SF | Annual UW Rent | % of Total Annual UW Rent | Annual UW Rent PSF | 2023 Sales $ | 2023 Sales PSF | Occ Cost % | Lease Expiration | Renewal Options | Termination Option (Y/N) |
| Major Tenants | ||||||||||||
| Primark(3) | NR/NR/NR | 54,832 | 13.3% | $2,967,306 | 5.6% | $54.12 | NAV | NAV | NAV | 1/31/2035 | 2 x 5 Yr | Y |
| ZARA(4) | NR/NR/NR | 36,463 | 8.8% | $1,700,000 | 3.2% | $46.62 | 3,994,896 | $110 | 42.6% | 11/30/2033 | 1 x 5 Yr | Y |
| H&M(5) | NR/NR/NR | 19,694 | 4.8% | $1,477,050 | 2.8% | $75.00 | NAV | NAV | NAV | 1/31/2035 | 2 x 4 Yr | Y |
| American Eagle Outfitters | NR/NR/NR | 10,268 | 2.5% | $1,773,181 | 3.4% | $172.69 | 10,590,053 | $1,031 | 16.7% | 9/30/2032 | None | N |
| Subtotal/Wtd. Avg. | 121,257 | 29.4% | $7,917,537 | 15.0% | $65.30 | |||||||
| Select In-Line < 10,000 SF | ||||||||||||
| Apple Store | NR/Aaa/AA+ | 8,706 | 2.1% | $1,558,044 | 3.0% | $178.96 | 139,751,549 | $16,052 | 1.1% | 7/31/2025 | 1 x 5 Yr | N |
| Finish Line | NR/NR/NR | 8,625 | 2.1% | $1,669,923 | 3.2% | $193.61 | 9,045,252 | $1,049 | 18.5% | 8/31/2025 | None | N |
| Adidas | NR/NR/NR | 8,183 | 2.0% | $1,104,705(6) | 2.1% | $135.00 | 5,184,028 | $634 | 21.3% | 1/31/2029 | None | Y(7) |
| The Cheesecake Factory | NR/NR/NR | 8,077 | 2.0% | $848,085 | 1.6% | $105.00 | 9,583,610 | $1,187 | 8.8% | 1/31/2037 | 2 x 5 Yr | N |
| Hollister Co. | NR/NR/NR | 8,028 | 1.9% | $879,028 | 1.7% | $109.50 | 7,586,511 | $945 | 11.6% | 1/31/2027 | None | N |
| Victoria’s Secret | NR/NR/NR | 7,767 | 1.9% | $1,285,796 | 2.4% | $165.55 | 10,693,232 | $1,377 | 12.0% | 1/31/2033 | None | N |
| Subtotal/Wtd. Avg. | 49,386 | 12.0% | $7,345,580 | 13.9% | $148.74 | |||||||
| Other Tenants | 222,284 | 53.9% | $37,530,596 | 71.1% | $168.84 | |||||||
| Occupied Collateral Total | 392,927 | 95.4% | $52,793,713 | 100.0% | $134.36 | |||||||
| Vacant Space(8) | 19,106 | 4.6% | ||||||||||
| Total/Wtd. Avg. | 412,033 | 100.0% | ||||||||||
| (1) | Based on the underwritten rent roll dated as of October 7, 2024 and exclusive of 556,724 square feet associated with Macy’s and JCPenney, both of which are non-collateral anchors. |
| (2) | Certain ratings are those of the parent company whether or not the parent guarantees the lease. |
| (3) | Primark has the right to terminate its lease if its gross sales between December 2027 and November 2028 do not exceed $23,000,000, provided it gives notice within 90 days following November 30, 2028, and pays a termination fee. |
| (4) | ZARA has the right to terminate its lease effective either (i) December 31, 2028 or (ii) May 31, 2031, in each case upon 270 days’ prior notice and payment of a termination fee. |
| (5) | H&M has the right to terminate its lease if its gross sales (i) between January 2028 and December 2028 do not exceed $16,000,000 or (ii) between January 2031 and December 2031 do not exceed $18,000,000, in each case, provided that it gives notice within 120 days following such period and pays a termination fee. |
| (6) | During the period commencing January 2024 and continuing through December 2024, in lieu of fixed minimum rent and percentage rent set forth in the lease, Adidas paid reduced monthly rent in the amount of (a) $92,058.75 plus (b) the product obtained by multiplying 6% by annual gross sales in excess of $14,452,452.47. |
| (7) | If Adidas’ gross sales for calendar year 2024 (the “Test Period”) do not exceed $7,000,000, anytime during the 60-day period immediately following the Test Period, Adidas will have the one-time right to terminate its lease upon 90 days’ prior written notice and the payment of a termination fee. Adidas’ sales for the TTM July 2024 period were $5,438,309. |
| (8) | Vacant space includes 8,351 square feet currently occupied by tenants known to be vacating that is underwritten as vacant. The Queens Center Property was 97.4% physically occupied inclusive of such tenants as of October 7, 2024. |
| THE INFORMATION IN THIS STRUCTURAL AND COLLATERAL TERM SHEET IS NOT COMPLETE AND MAY BE AMENDED PRIOR TO THE TIME OF SALE. THIS TERM SHEET IS NOT AN OFFER TO SELL THESE SECURITIES AND IT IS NOT A SOLICITATION OF AN OFFER TO BUY THESE SECURITIES IN ANY JURISDICTION WHERE THE OFFER OR SALE IS NOT PERMITTED. | ||
| 116 | ||
| Retail – Super Regional Mall | Loan #13 | Cut-off Date Balance: | $25,000,000 | |
| 90-15 Queens Boulevard | Queens Center | Cut-off Date LTV: | 49.5% | |
| Elmhurst, NY 11373 | UW NCF DSCR: | 1.84x | ||
| UW NOI Debt Yield: | 10.2% |
The following table presents certain information relating to the lease rollover schedule at the Queens Center Property:
| Lease Rollover Schedule(1)(2) | ||||||||
| Year | # of Leases Rolling | SF Rolling(3) | Approx. % of Total SF Rolling(3) | Approx. Cumulative % of SF Rolling(3) | Total UW Rent Rolling | Approx. % of Total Rent Rolling | Approx. Cumulative % of Total Rent Rolling | UW Rent PSF Rolling(3) |
| MTM/2024 | 10 | 21,754 | 5.3% | 5.3% | $4,334,114 | 8.2% | 8.2% | $199.23 |
| 2025 | 28 | 77642 | 18.8% | 24.1% | $9,690,548 | 18.4% | 26.6% | $124.81 |
| 2026 | 17 | 37,142 | 9.0% | 33.1% | $7,896,124 | 15.0% | 41.5% | $212.59 |
| 2027 | 13 | 25,249 | 6.1% | 39.3% | $3,456,921 | 6.5% | 48.1% | $136.91 |
| 2028 | 11 | 19,816 | 4.8% | 44.1% | $3,090,862 | 5.9% | 53.9% | $155.98 |
| 2029 | 16 | 32,294 | 7.8% | 51.9% | $6,424,947 | 12.2% | 66.1% | $198.95 |
| 2030 | 5 | 8572 | 2.1% | 54.0% | $1,167,451 | 2.2% | 68.3% | $136.19 |
| 2031 | 1 | 389 | 0.1% | 54.1% | $175,873 | 0.3% | 68.6% | $452.12 |
| 2032 | 2 | 11,788 | 2.9% | 56.9% | $1,966,221 | 3.7% | 72.4% | $166.80 |
| 2033 | 8 | 52,114 | 12.6% | 69.6% | $3,599,219 | 6.8% | 79.2% | $69.06 |
| 2034 | 10 | 12,981 | 3.2% | 72.7% | $3,290,888 | 6.2% | 85.4% | $253.52 |
| 2035 & Thereafter | 8 | 93,186 | 22.6% | 95.4% | $7,700,543 | 14.6% | 100.0% | $82.64 |
| Vacant | 0 | 19,106 | 4.6% | 100.0% | $0 | 0.0% | 100.0% | $0.00 |
| Total/Wtd. Avg.(4) | 129 | 412,033 | 100.0% | $52,793,713 | 100.0% | $134.36 | ||
| (1) | Based on the underwritten rent roll as of October 7, 2024. |
| (2) | Certain tenants may have lease termination options that were not taken into account in the Lease Rollover Schedule. |
| (3) | SF Rolling, Approx. % of Total SF Rolling, Approx. Cumulative % of SF Rolling and UW Rent PSF Rolling are exclusive of 556,724 square feet associated with Macy’s and JCPenney, both of which are non-collateral anchor tenants. |
| (4) | Wtd. Avg. UW Rent PSF Rolling excludes vacant space. |
The Market. The Queens Center Property is located in the Elmhurst neighborhood of Queens, New York. Elmhurst is a densely populated area with a mix of residential and commercial developments. The neighborhood is well-connected via public transportation, including the Long Island Rail Road and New York City subway system, providing access to Manhattan and other parts of New York City. The area is characterized by a diverse population and a variety of housing types, including multi-tenant rentals and cooperative apartments. In 2023, the average household income within a one-, three- and five-mile radius was $86,791, $92,204 and $98,765, respectively. In 2023, the population within the same radii was 191,469, 907,210 and 2,357,847, respectively.
The Queens Center Mall benefits from its location and strong tenant mix, making it a key retail center in the region. Notably, Apple is a significant draw, with TTM July 2024 sales of approximately $130 million. According to the appraisal, the Queens Retail market, as of the second quarter of 2024, had a total inventory of approximately 5.7 million square feet with an 11.3% vacancy rate.
As the only enclosed super regional shopping center in Queens County, the Queens Center Property serves a trade area of 2.4 million people and approximately 861,000 households. Queens County spans 108.1 square miles and is home to 2.4 million residents, making Queens the fourth densest county in the United States. The Queens Center Mall’s trade area is characterized by a dynamic and culturally rich population with an average household income of approximately $104,000. The Queens Center Mall has four power centers and four super-regional retail centers in its market; however, the Queens Center Mall offers superior access via car, bus, subway or foot, as it is located adjacent to a highly trafficked subway station and the intersection of Queens Boulevard, Woodhaven Boulevard and the Long Island Expressway.
| THE INFORMATION IN THIS STRUCTURAL AND COLLATERAL TERM SHEET IS NOT COMPLETE AND MAY BE AMENDED PRIOR TO THE TIME OF SALE. THIS TERM SHEET IS NOT AN OFFER TO SELL THESE SECURITIES AND IT IS NOT A SOLICITATION OF AN OFFER TO BUY THESE SECURITIES IN ANY JURISDICTION WHERE THE OFFER OR SALE IS NOT PERMITTED. | ||
| 117 | ||
| Retail – Super Regional Mall | Loan #13 | Cut-off Date Balance: | $25,000,000 | |
| 90-15 Queens Boulevard | Queens Center | Cut-off Date LTV: | 49.5% | |
| Elmhurst, NY 11373 | UW NCF DSCR: | 1.84x | ||
| UW NOI Debt Yield: | 10.2% |
The following table presents certain information relating to the appraisal’s market rent conclusions for the Queens Center Property:
| Market Rent Summary(1) | |||||
| Market Rent (PSF) | Lease Term (Yrs.) | Rent Increase Projections | New Tenant Improvements PSF | Renewal Tenant Improvements PSF | |
| 0 – 1,000 SF | $225.00 | 5 | 3% per annum | $100.00 | $25.00 |
| 1,001 – 2,000 SF | $200.00 | 5 | 3% per annum | $100.00 | $25.00 |
| 2,001 – 3,000 SF | $200.00 | 5 | 3% per annum | $100.00 | $25.00 |
| 3,001 – 5,000 SF | $175.00 | 5 | 3% per annum | $100.00 | $25.00 |
| 5,001 – 7,500 SF | $150.00 | 10 | 3% per annum | $100.00 | $25.00 |
| 7,501+ SF | $150.00 | 10 | 3% per annum | $100.00 | $25.00 |
| Jewelry | $400.00 | 10 | 3% per annum | $100.00 | $25.00 |
| Food Court | $410.00 | 10 | 3% per annum | $250.00 | $75.00 |
| Kiosk 0-100 SF | $2,000.00 | 5 | 3% per annum | $0.00 | $0.00 |
| Kiosk 100+ SF | $650.00 | 5 | 3% per annum | $0.00 | $0.00 |
| Major | $75.00 | 10 | 10% in Year 6 | $100.00 | $25.00 |
| Junior Anchor | $50.00 | 10 | 10% in Year 6 | $100.00 | $25.00 |
| (1) | Information obtained from the appraisal. |
The table below presents certain information relating to retail centers comparable to the Queens Center Property identified by the appraisal:
| Competitive Set(1) | |||||
| Property Name | Year Built/Renovated | Total NRA | Total Occupancy | Anchor / Major Tenants | Distance to Queens Center Property |
| Queens Center | 1973 / 2004 | 412,033(2) | 95.4%(2) | Primark, ZARA(2) | NAP |
| Queens Place Retail Center | 1965 / 1999, 2001 | 445,953 | 96.0% | Target, Macy’s Furniture Store, DSW Shoes, Best Buy, Lidl | One Block North |
| Rego Park Center I | 1996 / 2005 | 342,869 | 75.0% | Burlington, Marshalls | Two Blocks South |
| Rego Park Center II | 2010 / NAP | 616,820 | 100.0% | Costco, At Home, Aldi, Petco, TJ Maxx | Two Blocks South |
| The Shops at Atlas Park | 2006 / NAP | 372,000 | 95.0% | Ashley Furniture, Forever 21, HomeGoods, NYSC, Regal Cinemas, Ulta, TJ Maxx | 1.8 Miles South |
| Kings Plaza(3) | 1969 / 2018 | 1,146,035 | 88.0% | Burlington, Lowe’s, Macy’s, Target, Primark | 10.0 Miles South |
| Green Acres Mall(3) | 1956 / 2016 | 2,075,000 | 93.0% | Macy’s, Kohl’s, Primark | 11.0 Miles Southeast |
| Staten Island Mall(3) | 1972 / 2018 | 1,700,000 | 94.0% | Primark, JC Penney, Macy’s, Lidl, AMC Theatres | 22.0 Miles Southwest |
| Roosevelt Field | 1956 / 2014 | 2,330,000 | 98.0% | Bloomingdale’s, JC Penney, Primark, Macy’s, Nordstrom, Dick’s Sporting Goods, Neiman Marcus | 15.0 Miles East |
| Weighted Average | 93.9%(4) | ||||
| (1) | Information obtained from the appraisal, unless otherwise specified. |
| (2) | Based on the underwritten rent roll dated as of October 7, 2024 and does not include 556,724 SF of space associated with Macy’s and JCPenney, which are non-collateral anchor tenants. |
| (3) | Owned by the borrower sponsor. |
| (4) | Weighted Average excludes the Queens Center Property. |
| THE INFORMATION IN THIS STRUCTURAL AND COLLATERAL TERM SHEET IS NOT COMPLETE AND MAY BE AMENDED PRIOR TO THE TIME OF SALE. THIS TERM SHEET IS NOT AN OFFER TO SELL THESE SECURITIES AND IT IS NOT A SOLICITATION OF AN OFFER TO BUY THESE SECURITIES IN ANY JURISDICTION WHERE THE OFFER OR SALE IS NOT PERMITTED. | ||
| 118 | ||
| Retail – Super Regional Mall | Loan #13 | Cut-off Date Balance: | $25,000,000 | |
| 90-15 Queens Boulevard | Queens Center | Cut-off Date LTV: | 49.5% | |
| Elmhurst, NY 11373 | UW NCF DSCR: | 1.84x | ||
| UW NOI Debt Yield: | 10.2% |
Operating History and Underwritten Net Cash Flow. The following table presents certain information relating to the historical operating performance and underwritten net cash flow at the Queens Center Property:
| Cash Flow Analysis | ||||||||
| 2019 | 2020 | 2021 | 2022 | 2023 | TTM 9/30/2024 | UW(1) | UW Per SF | |
| Rents in Place | $67,057,833 | $59,301,650 | $52,916,768 | $51,918,944 | $52,818,458 | $51,520,695 | $52,793,713 | $128.13 |
| Rent Steps | $0 | $0 | $0 | $0 | $0 | $0 | $1,247,807 | $3.03 |
| Vacant Income | $0 | $0 | $0 | $0 | $0 | $0 | $4,370,011 | $10.61 |
| Gross Potential Income | $67,057,833 | $59,301,650 | $52,916,768 | $51,918,944 | $52,818,458 | $51,520,695 | $58,411,531 |
$141.76 |
| Reimbursements | $30,790,847 | $29,765,742 | $27,453,264 | $29,305,910 | $29,580,066 | $30,900,451 | $31,470,373 | $76.38 |
| Percentage Rent | $87,927 | $284,409 | $1,504,768 | $1,176,649 | $211,061 | $4,663 | $0 | $0.00 |
| Other Income(2) | $18,077,641 | $9,515,462 | $14,790,599 | $20,746,611 | $16,405,772 | $15,580,030 | $15,262,235 | $37.04 |
| Net Rental Income | $116,014,248 | $98,867,263 | $96,665,399 | $103,148,114 | $99,015,357 | $98,005,839 | $105,144,139 |
$255.18 |
| (Vacancy/Bad Debt)(3) | ($482,316) | ($7,429,704) | $3,086,693 | ($396,362) | $285,757 | ($1,035,603) | ($4,370,011) | (10.61) |
| Effective Gross Income | $115,531,932 | $91,437,559 | $99,752,092 | $102,751,752 | $99,301,114 | $96,970,236 | $100,774,128 | $244.58 |
| Real Estate Taxes | $28,285,488 | $29,999,255 | $29,577,588 | $27,309,540 | $26,831,221 | $26,587,630 | $26,925,545 | $65.35 |
| Insurance | $254,934 | $356,236 | $424,981 | $453,227 | $419,257 | $486,435 | $531,957 | $1.29 |
| Management Fee | $1,106,734 | $952,496 | $923,502 | $1,003,129 | $876,335 | $860,247 | $1,000,000 | $2.43 |
| Ground Rent Expense | $441,719 | $441,719 | $461,478 | $471,358 | $471,358 | $502,544 | $608,041 | $1.48 |
| Other Operating Expenses | $17,087,387 | $11,923,051 | $16,497,949 | $18,037,954 | $18,220,668 | $18,803,076 | $18,088,019 | $43.90 |
| Total Expenses | $47,176,262 | $43,672,757 | $47,885,498 | $47,275,208 | $46,818,839 | $47,239,932 | $47,153,562 |
$114.44 |
| Net Operating Income | $68,355,670 | $47,764,802 | $51,866,594 | $55,476,544 | $52,482,275 | $49,730,304 | $53,620,566 | $130.14 |
| Capital Expenditures | $0 | $0 | $0 | $0 | $0 | $0 | $119,490 | $0.29 |
| TI/LC | $0 | $0 | $0 | $0 | $0 | $0 | $968,757 | $2.35 |
| Net Cash Flow(4) | $68,355,670 | $47,764,802 | $51,866,594 | $55,476,544 | $52,482,275 | $49,730,304 | $52,532,319 | $127.50 |
| Occupancy | 98.9% | 97.9% | 97.6% | 98.7% | 98.9% | 95.4%(1) | 95.8%(5) | |
| NOI DSCR(6) | 2.39x | 1.67x | 1.81x | 1.94x | 1.84x | 1.74x | 1.88x | |
| NCF DSCR(6) | 2.39x | 1.67x | 1.81x | 1.94x | 1.84x | 1.74x | 1.84x | |
| NOI Debt Yield(6) | 13.0% | 9.1% | 9.9% | 10.6% | 10.0% | 9.5% | 10.2% | |
| NCF Debt Yield(6) | 13.0% | 9.1% | 9.9% | 10.6% | 10.0% | 9.5% | 10.0% | |
| (1) | Based on the underwritten rent roll dated October 7, 2024. |
| (2) | Other Income is based on the borrower sponsor’s budget and includes income from parking, business development/advertising, specialty leasing, overage rent and other miscellaneous income. |
| (3) | Vacancy/Bad Debt reflects bad debt for historical periods and vacancy for UW. Positive periods reflect recovery of bad debt. |
| (4) | The decrease in Net Cash Flow from 2019 to 2020 and subsequent increase from 2020 to 2021 is primarily attributable to impacts from the COVID-19 pandemic. |
| (5) | UW Occupancy is based on an economic vacancy of 4.2%. |
| (6) | Debt service coverage ratios and debt yields are based on the Queens Center Whole Loan. |
Ground Lease. A 17,450 square foot portion of the Queens Center Property located on the northeast corner of 92nd Street and 59th Avenue (the “Ground Leased Parcel”) is subject to a ground lease (the “Ground Lease”) between Tiliakos Enterprises LLC, as the ground landlord (the “Ground Landlord”), and the Property Borrower, as the ground tenant (in such capacity, the “Ground Tenant”). The current annual base rent is $595,510, which is required to be adjusted every three years by the greater of (a) $325,000 (which was the initial annual base rent) or (b) the adjusted annual base rent based on the Consumer Price Index. The Ground Lease has a maturity date of May 31, 2048, with no renewal options, but with a purchase option for the Property Borrower, exercisable as follows: between May 1, 2039 and April 30, 2046, the Ground Landlord must serve notice to the Ground Tenant for the Ground Tenant to purchase the ground-leased parcel (the “Put Right”), with the notice date being deemed to be March 2, 2046, if the Ground Landlord fails to provide such notice by April 30, 2046, and the Ground Tenant will subsequently have three years to send notice of its acceptance of the Put Right beginning 60 days after Ground Landlord’s notice is sent (the “Call Right”). The Ground Landlord and the Ground Tenant are each required to appoint an appraiser, and to agree to a third, disinterested appraiser, to obtain a fair market value of the Ground Leased Parcel, and the average of the two closest valuations will be treated as the purchase price to be paid by the Ground Tenant for the Ground Leased Parcel.
| THE INFORMATION IN THIS STRUCTURAL AND COLLATERAL TERM SHEET IS NOT COMPLETE AND MAY BE AMENDED PRIOR TO THE TIME OF SALE. THIS TERM SHEET IS NOT AN OFFER TO SELL THESE SECURITIES AND IT IS NOT A SOLICITATION OF AN OFFER TO BUY THESE SECURITIES IN ANY JURISDICTION WHERE THE OFFER OR SALE IS NOT PERMITTED. | ||
| 119 | ||
| Mortgage Loan No. 14 – Teller Avenue Portfolio |
| Mortgage Loan Information | Property Information | ||||||
| Mortgage Loan Seller: | AREF2 | Single Asset/Portfolio: | Portfolio | ||||
| Credit Assessment (KBRA/Fitch/Moody’s): | NR/NR/NR | Location: | Bronx, NY | ||||
| Original Balance: | $18,600,000 | General Property Type: | Multifamily | ||||
| Cut-off Date Balance: | $18,600,000 | Detailed Property Type: | Mid Rise | ||||
| % of Initial Pool Balance: | 2.2% | Title Vesting: | Fee | ||||
| Loan Purpose: | Refinance | Year Built/Renovated: | Various | ||||
| Borrower Sponsor: | Joel Mittelman | Size: | 61 Units | ||||
| Guarantor(1): | Joel Mittelman | Cut-off Date Balance per Unit: | $304,918 | ||||
| Mortgage Rate: | 7.4200% | Maturity Date Balance per Unit: | $293,837 | ||||
| Note Date: | 12/24/2024 | Property Manager: | Various | ||||
| Maturity Date: | 1/6/2030 | Underwriting and Financial Information | |||||
| Term to Maturity: | 60 months | UW NOI: | $1,914,097 | ||||
| Amortization Term: | 360 months | UW NCF: | $1,898,847 | ||||
| IO Period: | 12 months | UW NOI Debt Yield: | 10.3% | ||||
| Seasoning: | 0 months | UW NCF Debt Yield: | 10.2% | ||||
| Prepayment Provisions: | L(24),D(32),O(4) | UW NOI Debt Yield at Maturity: | 10.7% | ||||
| Lockbox/Cash Mgmt Status: | Springing/Springing | UW NCF DSCR: | 1.23x | ||||
| Additional Debt Type: | NAP | Most Recent NOI(2): | $1,969,015 (10/31/2024 TTM) | ||||
| Additional Debt Balance: | $0 | 2nd Most Recent NOI: | NAV | ||||
| Future Debt Permitted (Type): | No (NAP) | 3rd Most Recent NOI: | NAV | ||||
| Most Recent Occupancy: | 96.7% (12/11/2024) | ||||||
| Reserves | 2nd Most Recent Occupancy: | NAV | |||||
| Type | Initial | Monthly | Cap | 3rd Most Recent Occupancy: | NAV | ||
| RE Taxes: | $47,049 | $23,524 | NAP | Appraised Value (as of)(3)(4): | $27,200,000 (Various) | ||
| Insurance: | $16,715 | $5,572 | NAP | Appraised Value per Unit: | $445,902 | ||
| Replacement Reserve: | $0 | $1,271 | NAP | Cut-off Date LTV Ratio: | 68.4% | ||
| Deferred Maintenance: | $38,600 | $0 | NAP | Maturity Date LTV Ratio: | 65.9% | ||
| Sources and Uses | ||||||
| Sources | Proceeds | % of Total | Uses | Proceeds | % of Total | |
| Loan Amount: | $18,600,000 | 94.2% | Loan Payoff: | $18,600,000 | 94.2% | |
| Borrower Sponsor Equity: | $1,145,376 | 5.8% | Closing Costs(5): | $1,043,012 | 5.3% | |
| Upfront Reserves: | $102,364 | 0.5% | ||||
| Total Sources: | $19,745,376 | 100.0% | Total Uses: | $19,745,376 | 100.0% | |
| (1) | The Teller Avenue Portfolio Mortgage Loan (as defined below) is structured with a partial guaranty in the amount of $1,860,000. |
| (2) | Most Recent NOI for the 80 Clinton Place Property is T-9 annualized. |
| (3) | The Appraised Value includes $7,851,335 in present value of 421A tax savings. See –“The Property” for more information. |
| (4) | The Appraised Value is as of September 30, 2024 for the 1433 Teller Avenue Property and the 1441 Teller Avenue Property, and as of November 1, 2024 for the 80 Clinton Place Property. |
| (5) | Closing Costs include an interest rate buydown of $186,000. |
The Mortgage Loan. The fourteenth largest mortgage loan (the “Teller Avenue Portfolio Mortgage Loan”) is evidenced by a promissory note in the original principal amount of $18,600,000 and secured by a first-priority fee mortgage encumbering three, mid-rise style multifamily properties totaling 61 units in Bronx, New York (the “Teller Avenue Portfolio Properties”).
The Borrowers and the Borrower Sponsor. The borrowers for the Teller Avenue Portfolio Mortgage Loan are 1433 Teller Ave LLC, 1441 Teller Ave LLC and 80 Clinton Place LLC, three single-purpose, New York limited liability companies. The borrower sponsor and non-recourse carve-out guarantor for the Teller Avenue Portfolio Mortgage Loan is Joel Mittelman. In 2017, Mr. Mittelman founded Skyward Developers, a construction company specializing in renovations and new builds. Mr. Mittelman’s current portfolio includes full or partial ownership interests in 12 multifamily properties totaling 258 units, all located in the Bronx, New York.
The Property. The Teller Avenue Portfolio Properties are comprised of a 26-unit multifamily property (the “80 Clinton Place Property”), a 19-unit multifamily property (the “1433 Teller Avenue Property”), and a 16-unit multifamily property (the “1441 Teller Avenue Property”). The Teller Avenue Portfolio Properties are all located in Bronx, New York within 2.0 miles of one another. As of December 11, 2024, the Teller Avenue Portfolio Properties were 96.7% occupied in aggregate. The 1433 Teller Avenue Property and the 1441 Teller Avenue Property are located within a five minute walk to Claremont Park, and a thirteen minute walk to the 170th Street subway station. The 80 Clinton Place Property is located within a seven minute walk to Bronx Community College and the 183rd Street subway station.
The Teller Avenue Portfolio Properties are expected to benefit from tax abatements under the 421a tax abatement program, whereby a specific number of units at each of the Teller Avenue Portfolio Properties must be rented to tenants whose income does not exceed 130% of the area median income. A total of 58 of the 61 units at the Teller Avenue Portfolio Properties have been designated as affordable units under the 421a tax abatement program. The appraisal concluded that the in-place rents for all 58 affordable units are in compliance with the income requirements. The 421a tax abatement program grants partial exemptions of real estate taxes for qualifying newly constructed properties located outside of Manhattan’s “exclusion zone” during its construction period and, with respect to qualifying developments that provide affordable housing, may grant an additional 35-year tax exemption. With
| THE INFORMATION IN THIS STRUCTURAL AND COLLATERAL TERM SHEET IS NOT COMPLETE AND MAY BE AMENDED PRIOR TO THE TIME OF SALE. THIS TERM SHEET IS NOT AN OFFER TO SELL THESE SECURITIES AND IT IS NOT A SOLICITATION OF AN OFFER TO BUY THESE SECURITIES IN ANY JURISDICTION WHERE THE OFFER OR SALE IS NOT PERMITTED. | ||
| 120 | ||
| Multifamily – Mid Rise | Loan #14 | Cut-off Date Balance: | $18,600,000 | |
| Various | Teller Avenue Portfolio | Cut-off Date LTV: | 68.4% | |
| Bronx, NY | U/W NCF DSCR: | 1.23x | ||
| U/W NOI Debt Yield: | 10.3% |
respect to the Teller Avenue Portfolio Properties, each 35-year tax exemption is expected to phase out in the last 10 years based on the percentage of affordable units provided at the respective Teller Avenue Portfolio Property.
As of origination, the 1441 Teller Avenue Property has received the 421a tax abatement, while the 80 Clinton Place Property and the 1433 Teller Avenue Property are still awaiting approval from the city. Legal counsel for the 421a tax abatement program issued an opinion for the benefit of the borrowers and the lender opining that the Teller Avenue Portfolio Properties should be approved to receive the 421a tax abatement. The Teller Avenue Portfolio Mortgage Loan is structured with a full payment guaranty until all three of the Teller Avenue Portfolio Properties have received the 421a tax abatement.
Additionally, the Teller Avenue Portfolio Properties participate in the New York City Family Homelessness and Eviction Supplement (“CityFHEPS”) program. The CityFHEPS program provides rental assistance in the form of housing vouchers to households with children, with a household income of up to 200% of the federal poverty level and that are either staying at a shelter or at risk of entering a shelter. The subsidy amounts provided by CityFHEPS are published by the Department of Social Services each year and the appraisal concluded that the current in-place rents at the Teller Avenue Portfolio Properties are achievable based on the maximum subsidy amounts.
The Teller Avenue Portfolio Mortgage Loan is structured with (a) a 100% payment guaranty, which burns off at such time as the 1433 Teller Avenue Property and the 80 Clinton Place Property are approved for the tax abatement under the 421a tax abatement program; (b) springing full recourse in the event that any of the Teller Avenue Portfolio Properties fail to maintain their respective tax abatements under the 421a tax abatement program, the related borrower has CityFHEPs tenants and fails to comply with such program, the city amends or terminates the CityFHEPs program in any manner that reduces the rental stream at any of the Teller Avenue Portfolio Properties or any of the Teller Avenue Portfolio Properties become ineligible to receive CityFHEPs tenants; and (c) a partial guaranty in the amount of $1,860,000 for the term of the Teller Avenue Portfolio Mortgage Loan.
The following table presents a portfolio summary of the Teller Avenue Portfolio Properties:
| Portfolio Summary(1) | |||||||
| Property Name | Year Built / Renovated(1) | Number of Units(2) | Occ. %(2) | Allocated Cut-off Date Mortgage Loan Amount (“ALA”) | Appraised Value(2) | Underwritten Net Cash Flow | Monthly Average In-Place Rent per Unit(3) |
| 80 Clinton Place | 2023 / NAP | 26 | 92.3% | $7,250,000 | $10,600,000 | $762,182 | $2,898 |
| 1433 Teller Avenue | 1920 / 2023 | 19 | 100.0% | 5,950,000 | 8,700,000 | 585,745 | $2,983 |
| 1441 Teller Avenue | 1920 / 2023 | 16. | 100.0% | 5,400,000 | 7,900,000 | 550,920 | $3,248 |
| Total/Wtd. Avg. | 61 | 96.7% | $18,600,000 | $27,200,000 | $1,898,847 | $3,020 | |
| (1) | Source: Appraisal. |
| (2) | Based on the underwritten rent roll dated December 11, 2024. |
| (3) | Monthly Average In-Place Rent per Unit is based on occupied units. |
80 Clinton Place Property. The 80 Clinton Place Property is a 26-unit, mid-rise multifamily property that consists of one, five-story apartment building built in 2023. The 80 Clinton Place Property features 19 studio and seven one-bedroom layouts. As of December 11, 2024, the 80 Clinton Place Property was 92.3% occupied.
| 80 Clinton Place Property Unit Mix(1) | |||||||
| Unit Mix / Type | Units | Occupied Units | % Occupied | Average SF per Unit | Total SF | Monthly Average In-Place Rent per Unit(2) | Monthly Average Market Rent per Unit |
| Studio | 19 | 17 | 89.5% | 351 | 6,677 | $2,851 | $2,851 |
| One Bedroom | 7 | 7 | 100.0% | 357 | 2,499 | $3,013 | $3,013 |
| Total/Wtd. Avg. | 26 | 24 | 92.3% | 353 | 9,176 | $2,898 | $2,895 |
| (1) | Source: Appraisal. |
| (2) | Based on the underwritten rent roll dated December 11, 2024. |
| (3) | Monthly Average In-Place Rent per Unit is based on occupied units. |
1433 Teller Avenue Property. The 1433 Teller Avenue Property is a 19-unit mid-rise multifamily property that consists of one, five-story apartment building. The 1433 Teller Avenue Property was originally constructed in 1920 and has undergone significant renovations totaling $4.6 million since being acquired by the related borrower in 2021. The 1433 Teller Avenue Property features 14 studio and five one-bedroom layouts. As of December 11, 2024, the 1433 Teller Avenue Property was 100.0% occupied.
| 1433 Teller Avenue Property Unit Mix(1) | |||||||
| Unit Mix / Type | Units | Occupied Units | % Occupied | Average SF per Unit | Total SF | Monthly Average In-Place Rent per Unit | Monthly Average Market Rent per Unit |
| Studio | 14 | 14 | 100.0% | 420 | 5,880 | $2,911 | $2,864 |
| One Bedroom | 5 | 5 | 100.0% | 521 | 2,605 | $3,186 | $3,059 |
| Total/Wtd. Avg. | 19 | 19 | 100.0% | 447 | 8,485 | $2,983 | $2,915 |
| (1) | Based on the underwritten rent roll dated December 11, 2024. |
| THE INFORMATION IN THIS STRUCTURAL AND COLLATERAL TERM SHEET IS NOT COMPLETE AND MAY BE AMENDED PRIOR TO THE TIME OF SALE. THIS TERM SHEET IS NOT AN OFFER TO SELL THESE SECURITIES AND IT IS NOT A SOLICITATION OF AN OFFER TO BUY THESE SECURITIES IN ANY JURISDICTION WHERE THE OFFER OR SALE IS NOT PERMITTED. | ||
| 121 | ||
| Multifamily – Mid Rise | Loan #14 | Cut-off Date Balance: | $18,600,000 | |
| Various | Teller Avenue Portfolio | Cut-off Date LTV: | 68.4% | |
| Bronx, NY | U/W NCF DSCR: | 1.23x | ||
| U/W NOI Debt Yield: | 10.3% |
1441 Teller Avenue Property. The 1441 Teller Avenue Property is a 16-unit mid-rise multifamily property that consists of one, five-story apartment building. The 1441 Teller Avenue Property was originally constructed in 1920 and has undergone significant renovations totaling $4.5 million since being acquired by the related borrower in 2021. The 1441 Teller Avenue Property features six studio, four one-bedroom, and six two-bedroom layouts. As of December 11, 2024, the 1441 Teller Avenue Property was 100.0% occupied.
| 1441 Teller Avenue Property Unit Mix (1) | |||||||
| Unit Mix / Type | Units | Occupied Units | % Occupied | Average SF per Unit | Total SF | Monthly Average In-Place Rent per Unit | Monthly Average Market Rent per Unit |
| Studio | 6 | 6 | 100.0% | 330 | 1,980 | $2,854 | $2,829 |
| One Bedroom | 4 | 4 | 100.0% | 406 | 1,624 | $3,141 | $3,059 |
| Two Bedroom | 6 | 6 | 100.0% | 589 | 3,535 | $3,711 | $3,599 |
| Total/Wtd. Avg. | 16 | 16 | 100.0% | 446 | 7,139 | $3,248 | $3,175 |
| (1) | Based on the underwritten rent roll dated December 11, 2024. |
The Market. The Teller Avenue Portfolio Properties are located in Bronx, New York in the Bronx County apartment submarket.
The 80 Clinton Place Property is located in the University Heights neighborhood of the Bronx, within six blocks of the 183rd Street subway station. Additionally, the 80 Clinton Place Property is located within one mile of the University Heights train station, the Major Deegan Expressway, Cross Bronx Expressway and the George Washington Bridge. The 1433 Teller Avenue Property and the 1441 Teller Avenue Property are located adjacent to each other in the Concourse neighborhood of the Bronx, within 0.5 miles of the 170th Street subway station. Additionally, the 1433 Teller Avenue Property and the 1441 Teller Avenue Property are located within one mile of the Cross Bronx Expressway and the Major Deegan Expressway.
As of the third quarter of 2024, the Bronx County apartment submarket had an inventory of 45,874 units with a vacancy rate of 3.5%. The average monthly asking rent was $2,220 per unit.
The following table presents information regarding certain competitive properties to the Teller Avenue Portfolio Properties:
| Competitive Rental Properties Summary(1) | |||||
| Property Name/Location | Year Built / Renovated | # Units | Occupancy | Unit Mix |
In-Place Monthly Rent per Unit |
| 80 Clinton Place | 2023 / NAP | 26 | 92.3% | Studio | $2,851(2) |
| Bronx, NY | 1BR | $3,013(2) | |||
| 1433 Teller Avenue | 1920 / 2023 | 19 | 100.0% | Studio | $2,911(2) |
| Bronx, NY | 1BR | $3,186(2) | |||
| 1441 Teller Avenue | 1920 / 2023 | 16 | 100.0% | Studio | $2,854(2) |
| 1BR | $3,141(2) | ||||
| Bronx, NY | 2BR | $3,711(2) | |||
| 548 East 183rd Street | 1912 / 2021 | 32 | NAV | Studio | $2,378 |
| Bronx, NY | 1BR | $2,457 | |||
| 2415 Arthur Avenue | 2015 / NAP | 64 | NAV | Studio | $2,200 |
| Bronx, NY | 1BR | $2,350 | |||
| 1182 Ogden Avenue | 2022 / NAP | 21 | NAV | Studio | N/A |
| Bronx, NY | 1BR | $2,400 | |||
| 23 Bruckner Boulevard | 2016 / NAP | 190 | NAV | Studio | $2,650 |
| Bronx, NY | 1BR | $2,750 | |||
| 2001 Story Ave & 2103 Honeywell Ave | 1973 / 2023 | 552 | NAV | Studio | $2,589 |
| Bronx, NY | 1BR | $2,601 | |||
| 2321 Belmont Avenue | 2022 / NAP | 42 | NAV | Studio | N/A |
| Bronx, NY | 1BR | $2,318 | |||
| (1) | Source: Appraisal. |
| (2) | Based on the underwritten rent roll dated December 11, 2024. |
Appraisal. The appraisal concluded to an “as-is” appraised value as of September 30, 2024 and November 1, 2024 of $27,200,000.
Environmental Matters. According to the Phase I environmental reports dated October 7, 2024 and December 2, 2024, there was no evidence of any recognized environmental conditions at the Teller Avenue Portfolio Properties.
| THE INFORMATION IN THIS STRUCTURAL AND COLLATERAL TERM SHEET IS NOT COMPLETE AND MAY BE AMENDED PRIOR TO THE TIME OF SALE. THIS TERM SHEET IS NOT AN OFFER TO SELL THESE SECURITIES AND IT IS NOT A SOLICITATION OF AN OFFER TO BUY THESE SECURITIES IN ANY JURISDICTION WHERE THE OFFER OR SALE IS NOT PERMITTED. | ||
| 122 | ||
| Multifamily – Mid Rise | Loan #14 | Cut-off Date Balance: | $18,600,000 | |
| Various | Teller Avenue Portfolio | Cut-off Date LTV: | 68.4% | |
| Bronx, NY | U/W NCF DSCR: | 1.23x | ||
| U/W NOI Debt Yield: | 10.3% |
Operating History and Underwritten Net Cash Flow. The following table presents certain information relating to the historical operating performance and underwritten net cash flow at the Teller Avenue Portfolio Properties:
| 10/31/2024 TTM(1) | UW | UW Per Unit | |
| Gross Potential Rent(2) | $2,173,867 | $2,206,794 | $36,177 |
| Other Income(3) | $0 | $135,792 | $2,226 |
| Net Rental Income | $2,173,867 | $2,342,586 | $38,403 |
| Less Vacancy, Concessions & Credit Loss | $0 | ($109,292) | ($1,792) |
| Effective Gross Income | $2,173,867 | $2,233,294 | $36,611 |
| Real Estate Taxes(4) | $0 | $10,333 | $169 |
| Insurance | $64,794 | $66,861 | $1,096 |
| Management Fee | $65,216 | $66,999 | $1,098 |
| Other Expenses | $74,842 | $175,005 | $2,869 |
| Total Operating Expenses | $204,852 | $319,197 | $5,233 |
| Net Operating Income | $1,969,015 | $1,914,097 | $31,379 |
| Replacement Reserves | $0 | $15,250 | $250 |
| Net Cash Flow | $1,969,015 | $1,898,847 | $31,129 |
| Occupancy (%) | 96.7%(5) | 95.0%(6) | |
| NOI DSCR | 1.27x | 1.24x | |
| NCF DSCR | 1.27x | 1.23x | |
| NOI Debt Yield | 10.6% | 10.3% | |
| NCF Debt Yield | 10.6% | 10.2% |
| (1) | Most Recent NOI for the 80 Clinton Place Property is T-9 annualized as of October 31, 2024. |
| (2) | UW Gross Potential Rent is based on the underwritten rent roll dated December 11, 2024. |
| (3) | Other Income is comprised of utility reimbursements and other miscellaneous fees. |
| (4) | UW based on the average annual abated tax payment under the 421a program over the next 10 years. |
| (5) | Represents occupancy based on the underwritten rent roll dated December 11, 2024. |
| (6) | Based on an economic vacancy of 5.0%. |
| THE INFORMATION IN THIS STRUCTURAL AND COLLATERAL TERM SHEET IS NOT COMPLETE AND MAY BE AMENDED PRIOR TO THE TIME OF SALE. THIS TERM SHEET IS NOT AN OFFER TO SELL THESE SECURITIES AND IT IS NOT A SOLICITATION OF AN OFFER TO BUY THESE SECURITIES IN ANY JURISDICTION WHERE THE OFFER OR SALE IS NOT PERMITTED. | ||
| 123 | ||
| Mortgage Loan No. 15 – The Vesper Apartments |
| Mortgage Loan Information | Property Information | ||||||
| Mortgage Loan Seller: | AREF2 | Single Asset/Portfolio: | Single Asset | ||||
| Credit Assessment (KBRA/Fitch/Moody’s): | NR/NR/NR | Location: | Dallas, TX 75254 | ||||
| Original Balance: | $18,250,000 | General Property Type: | Multifamily | ||||
| Cut-off Date Balance: | $18,250,000 | Detailed Property Type: | Garden | ||||
| % of Initial Pool Balance: | 2.2% | Title Vesting: | Fee | ||||
| Loan Purpose: | Refinance | Year Built/Renovated: | 1978/2014 | ||||
| Borrower Sponsors: | Robert Tobolowsky, John Bowden, Jacob M. Silverstein, Willowood Group LLC and Shah Holdings, LLC | Size: | 192 Units | ||||
| Guarantors: | Robert Tobolowsky, John Bowden, Jacob M. Silverstein, Willowood Group LLC and Shah Holdings, LLC | Cut-off Date Balance per Unit: | $95,052 | ||||
| Mortgage Rate: | 6.8500% | Maturity Date Balance per Unit: | $95,052 | ||||
| Note Date: | 11/1/2024 | Property Manager: | Frontline Anterra, LLC | ||||
| Maturity Date: | 11/6/2029 | Underwriting and Financial Information | |||||
| Term to Maturity: | 60 months | UW NOI: | $1,577,067 | ||||
| Amortization Term: | 0 months | UW NCF: | $1,519,467 | ||||
| IO Period: | 60 months | UW NOI Debt Yield: | 8.6% | ||||
| Seasoning: | 2 months | UW NCF Debt Yield: | 8.3% | ||||
| Prepayment Provisions: | L(26),D(30),O(4) | UW NOI Debt Yield at Maturity: | 8.6% | ||||
| Lockbox/Cash Mgmt Status: | Soft/Springing | UW NCF DSCR: | 1.20x | ||||
| Additional Debt Type: | NAP | Most Recent NOI: | $1,425,800 (9/30/2024 TTM) | ||||
| Additional Debt Balance: | NAP | 2nd Most Recent NOI: | $1,254,937 (12/31/2023) | ||||
| Future Debt Permitted (Type): | No (NAP) | 3rd Most Recent NOI: | $1,133,888 (12/31/2022) | ||||
| Most Recent Occupancy: | 96.4% (10/9/2024) | ||||||
| Reserves | 2nd Most Recent Occupancy: | 91.6% (12/31/2023) | |||||
| Type | Initial | Monthly | Cap | 3rd Most Recent Occupancy: | 93.1% (12/31/2022) | ||
| RE Taxes: | $0 | $36,971 | NAP | Appraised Value (as of): | $27,100,000 (9/4/2024) | ||
| Insurance: | $145,392 | $12,509 | NAP | Appraised Value per Unit: | $141,146 | ||
| Replacement Reserve: | $150,000 | $4,800 | NAP | Cut-off Date LTV Ratio: | 67.3% | ||
| Deferred Maintenance: | $62,350 | $0 | NAP | Maturity Date LTV Ratio: | 67.3% | ||
| Sources and Uses | ||||||
| Sources | Proceeds | % of Total | Uses | Proceeds | % of Total | |
| Loan Amount: | $18,250,000 | 89.3% | Loan Payoff: | $19,020,435 | 93.1% | |
| Additional Sponsor Equity: | $2,185,619 | 10.7% | Closing Costs(1): | $1,057,442 | 5.2% | |
| Upfront Reserves: | $357,742 | 1.8% | ||||
| Total Sources: | $20,435,619 | 100.0% | Total Uses: | $20,435,619 | 100.0% | |
| (1) | Closing Costs include an interest rate buydown of $273,750. |
The Mortgage Loan. The fifteenth largest mortgage loan (the “The Vesper Apartments Mortgage Loan”) is evidenced by a promissory note in the original principal amount of $18,250,000 and secured by a first-priority fee mortgage encumbering a 192-unit garden style multifamily property in Dallas, Texas (the “The Vesper Apartments Property”).
The Borrower and the Borrower Sponsors. The borrower for The Vesper Apartments Mortgage Loan is 5616 Aspen Creek, LLC, a single-purpose, Texas limited liability company. The borrower sponsors and non-recourse carve-out guarantors for The Vesper Apartments Mortgage Loan are Robert Tobolowsky, John Bowden, Jacob M. Silverstein, Willowood Group LLC, and Shah Holdings, LLC. Robert Tobolowsky, John Bowden, and Jacob M. Silverstein are principals of Willowood Group LLC, a real estate investment firm specializing in multifamily properties. Willowood Group LLC currently owns approximately 1,500 multifamily units in the Dallas/Fort Worth metropolitan area.
The Property. The Vesper Apartments Property is a 192-unit, garden-style multifamily complex located in Dallas, Texas, approximately 10 miles north of downtown Dallas. Situated on a 7.46-acre site, the improvements consist of 16 two-story residential buildings constructed in 1978 and renovated in 2014. The Vesper Apartments Property features shared amenities such as a swimming pool, playground, business center, and laundry facilities. Unit amenities include private balconies, fireplaces, garbage disposal, dishwasher and ceiling fans. The Vesper Apartments Property also features 294 surface parking spaces, resulting in a parking ratio of approximately 1.53 spaces per unit.
The borrower acquired The Vesper Apartments Property in September 2021 for $23.1 million and has invested approximately $1.2 million ($6,250 per unit) in capital expenditures since acquisition. Approximately $650,000 ($3,385 per unit) was spent on interior upgrades to units, with the remainder going towards exterior renovations including landscaping, paint, signage, and other common area upgrades. The borrower sponsors have successfully increased net operating income by 27.3% from approximately $1.1 million in 2021 to approximately $1.4 million in the trailing-twelve months ending September 2024 primarily through rent growth and institution of an amenity/technology fee.
| THE INFORMATION IN THIS STRUCTURAL AND COLLATERAL TERM SHEET IS NOT COMPLETE AND MAY BE AMENDED PRIOR TO THE TIME OF SALE. THIS TERM SHEET IS NOT AN OFFER TO SELL THESE SECURITIES AND IT IS NOT A SOLICITATION OF AN OFFER TO BUY THESE SECURITIES IN ANY JURISDICTION WHERE THE OFFER OR SALE IS NOT PERMITTED. | ||
| 124 | ||
| Multifamily – Garden | Loan #15 | Cut-off Date Balance: | $18,250,000 | |
| 5616 Spring Valley Road | The Vesper Apartments | Cut-off Date LTV: | 67.3% | |
| Dallas, TX 75254 | UW NCF DSCR: | 1.20x | ||
| UW NOI Debt Yield: | 8.6% |
As of October 9, 2024, The Vesper Apartments Property was 96.4% occupied. Between October 2021 and September 2024, occupancy at The Vesper Apartments Property averaged 93.3%. The unit mix at The Vesper Apartments Property is comprised of 112 one-bedroom floorplans and 80 two-bedroom floorplans.
The following table presents certain information relating to the unit mix at The Vesper Apartments Property:
| Unit Mix(1) | |||||||
| Unit Mix / Type | Units | Occupied Units | % Occupied | Average SF per Unit | Total SF | Monthly Average Rent per Unit(2) | Monthly Average Market Rent per Unit(3) |
| One Bedroom | 112 | 108 | 96.4% | 681 | 76,272 | $1,038 | $1,060 |
| Two Bedroom | 80 | 77 | 96.3% | 892 | 71,328 | $1,414 | $1,452 |
| Total/Wtd. Avg. | 192 | 185 | 96.4% | 769 | 147,600 | $1,195 | $1,223 |
| (1) | Based on the underwritten rent roll dated October 9, 2024. |
| (2) | Monthly Average Rent per Unit is based on occupied units. |
| (3) | Source: Appraisal. |
The Market. The Vesper Apartments Property is located in Dallas, Texas approximately 10 miles north of downtown Dallas. Primary access is provided by the Dallas North Tollway and Interstate 635. The neighborhood surrounding The Vesper Apartments Property consists primarily of office buildings, retail centers, hotels, multifamily, and a large private prep school. Approximately two blocks south of The Vesper Apartments Property is a major commercial center that includes the Galleria Towers office buildings, the Westin Galleria Hotel, and the Galleria Dallas Mall, a shopping mall anchored by Nordstrom’s and Macy’s and featuring over 200 additional stores. According to the appraisal, the 2024 estimated population within a one-, three- and five-mile radius of The Vesper Apartments Property is 31,692, 134,465 and 379,024, respectively. The 2024 estimated median household income within the same radii was $61,425, $84,843 and $83,888, respectively.
According to the appraisal, The Vesper Apartments Property is situated in the Far North Dallas apartment submarket, which contained approximately 36,714 units as of the second quarter of 2024. The Far North Dallas apartment submarket reported a vacancy rate of 9.0% with an average rent of $1,382 per unit as of the second quarter of 2024. Competitive rental properties have occupancies ranging from 91.0% to 97.0%.
The following table presents information regarding certain competitive properties to The Vesper Apartments Property:
| Competitive Rental Properties Summary(1) | |||||
| Property Name/Location | Year Built | # Units | Occupancy | Unit Mix | In-Place Monthly Rent per Unit |
| The Vesper Apartments(2) | 1978 | 192 | 96.4% | 1BR | $1,038 |
| Dallas, TX | 2BR | $1,414 | |||
| 5636 Apartment Homes | 1978 | 169 | 93.0% | 1BR | $967 - $1,460 |
| Dallas, TX | 2BR | $1,443 - $1,637 | |||
| Brownstones | 1997 | 301 | 97.0% | 1BR | $1,585 |
| Dallas, TX | 2BR | $1,970 - $2,100 | |||
| Davenport I & II | 1978 | 501 | 91.0% | 1BR | $775 - $1,432 |
| Dallas, TX | 2BR | $1,099 - $1,664 | |||
| Suncrest | 1979 | 134 | 96.0% | 1BR | $1,320 - $1,365 |
| Dallas, TX | 2BR | $1,490 - $1,670 | |||
| Tiburon | 1980 | 362 | 92.0% | 1BR | $1,298 - $1,323 |
| Dallas, TX | 2BR | $1,607 - $1,745 | |||
| The District at Midtown | 1980 | 217 | 91.0% | 1BR | $1,229 - $1,345 |
| Dallas, TX | 2BR | $1,499 - $1,637 | |||
| (1) | Source: Appraisal. |
| (2) | Based on the underwritten rent roll dated October 9, 2024. |
Appraisal. The appraisal concluded to an “as-is” appraised value as of September 4, 2024 of $27,100,000.
Environmental Matters. According to the Phase I environmental report dated September 6, 2024, there was no evidence of any recognized environmental conditions at The Vesper Apartments Property.
| THE INFORMATION IN THIS STRUCTURAL AND COLLATERAL TERM SHEET IS NOT COMPLETE AND MAY BE AMENDED PRIOR TO THE TIME OF SALE. THIS TERM SHEET IS NOT AN OFFER TO SELL THESE SECURITIES AND IT IS NOT A SOLICITATION OF AN OFFER TO BUY THESE SECURITIES IN ANY JURISDICTION WHERE THE OFFER OR SALE IS NOT PERMITTED. | ||
| 125 | ||
| Multifamily – Garden | Loan #15 | Cut-off Date Balance: | $18,250,000 | |
| 5616 Spring Valley Road | The Vesper Apartments | Cut-off Date LTV: | 67.3% | |
| Dallas, TX 75254 | UW NCF DSCR: | 1.20x | ||
| UW NOI Debt Yield: | 8.6% |
Operating History and Underwritten Net Cash Flow. The following table presents certain information relating to the historical operating performance and underwritten net cash flow at The Vesper Apartments Property:
| Cash Flow Analysis | |||||
| 2022 | 2023 | 9/30/2024 TTM | UW | UW Per Unit | |
| Gross Potential Rent(1) | $2,766,516 | $2,812,889 | $2,787,577 | $2,767,860 | $14,416 |
| Other Income(2) | $281,107 | $292,053 | $380,968 | $426,848 | $2,223 |
| Net Rental Income | $3,047,623 | $3,104,942 | $3,168,545 | $3,194,708 | $16,639 |
| Less Vacancy, Concessions & Credit Loss | ($583,804) | ($456,455) | ($240,553) | ($175,593) | ($915) |
| Effective Gross Income | $2,463,819 | $2,648,488 | $2,927,992 | $3,019,115 | $15,725 |
| Real Estate Taxes | $411,075 | $410,766 | $491,126 | $443,653 | $2,311 |
| Insurance | $144,336 | $178,250 | $167,032 | $150,466 | $784 |
| Management Fee | $74,418 | $80,645 | $87,804 | $90,573 | $472 |
| Other Expenses | $700,103 | $723,890 | $756,230 | $757,356 | $3,945 |
| Total Operating Expenses | $1,329,931 | $1,393,551 | $1,502,191 | $1,442,048 | $7,511 |
| Net Operating Income | $1,133,888 | $1,254,937 | $1,425,800 | $1,577,067 | $8,214 |
| Capital Expenditures | $0 | $0 | $0 | $57,600 | $300 |
| Net Cash Flow | $1,133,888 | $1,254,937 | $1,425,800 | $1,519,467 | $7,914 |
| Occupancy | 93.1% | 91.6% | 96.4%(3) | 93.7%(4) | |
| NOI DSCR | 0.89x | 0.99x | 1.12x | 1.24x | |
| NCF DSCR | 0.89x | 0.99x | 1.12x | 1.20x | |
| NOI Debt Yield | 6.2% | 6.9% | 7.8% | 8.6% | |
| NCF Debt Yield | 6.2% | 6.9% | 7.8% | 8.3% | |
| (1) | UW Gross Potential Rent is based on the underwritten rent roll dated October 9, 2024. |
| (2) | Other Income is comprised of utility reimbursements and other miscellaneous fees. |
| (3) | Represents occupancy based on the underwritten rent roll dated October 9, 2024. |
| (4) | Based on an economic vacancy of 6.3%. |
| THE INFORMATION IN THIS STRUCTURAL AND COLLATERAL TERM SHEET IS NOT COMPLETE AND MAY BE AMENDED PRIOR TO THE TIME OF SALE. THIS TERM SHEET IS NOT AN OFFER TO SELL THESE SECURITIES AND IT IS NOT A SOLICITATION OF AN OFFER TO BUY THESE SECURITIES IN ANY JURISDICTION WHERE THE OFFER OR SALE IS NOT PERMITTED. | ||
| 126 | ||
| Wells Fargo Commercial Mortgage Trust 2025-5C3 | Transaction Contact Information |
VI. Transaction Contact Information
Questions regarding this Structural and Collateral Term Sheet may be directed to any of the following individuals:
| Wells Fargo Securities, LLC | |
| Brigid Mattingly | Tel. (312) 269-3062 |
| Daniel Thomas | Tel. (212) 214-2813 |
| Sean Duffy | Tel. (312) 827-1518 |
| Citigroup Global Markets Inc. | |
| Raul Orozco | Tel. (212) 723-1295 |
| Rick Simpson | Tel. (212) 816-5343 |
| Jay Mercandetti | Tel. (212) 816-6384 |
| Goldman Sachs & Co. LLC | |
| Scott Epperson | Tel. (212) 934-2882 |
| Justin Peterson | Tel. (212) 902-4283
|
| J.P. Morgan Securities LLC | |
| Kunal Singh | Tel. (212) 834-5467 |
| Harris Rendelstein | Tel. (212) 834-6737 |
| Derrick Fetzer | Tel. (212) 834-3111 |
| Avinash Sharma | Tel. (212) 834-3111 |
| UBS Securities LLC | |
| Nicholas Galeone | Tel. (212) 713-8832 |
| Siho Ham | Tel. (212) 713-1278
|
| Michael Barbieri | Tel. (212) 713-1181 |
| THE INFORMATION IN THIS STRUCTURAL AND COLLATERAL TERM SHEET IS NOT COMPLETE AND MAY BE AMENDED PRIOR TO THE TIME OF SALE. THIS TERM SHEET IS NOT AN OFFER TO SELL THESE SECURITIES AND IT IS NOT A SOLICITATION OF AN OFFER TO BUY THESE SECURITIES IN ANY JURISDICTION WHERE THE OFFER OR SALE IS NOT PERMITTED. | ||
| 127 | ||