| FREE WRITING PROSPECTUS | ||
| FILED PURSUANT TO RULE 433 | ||
| REGISTRATION FILE NO.: 333-282099-02 | ||
 |  |  |  |  |  |  |
Free Writing Prospectus
Structural and Collateral Term Sheet
$822,168,756
(Approximate Initial Pool Balance)
$719,397,000
(Approximate Aggregate Certificate Balance of Offered Certificates)
Wells Fargo Commercial Mortgage Trust 2025-C64
as Issuing Entity
Wells Fargo Commercial Mortgage Securities, Inc.
as Depositor
Wells Fargo Bank, National Association
Goldman Sachs Mortgage Company
Citi Real Estate Funding Inc.
UBS AG
Societe Generale Financial Corporation
JPMorgan Chase Bank, National Association
Bank of Montreal
LMF Commercial, LLC
Natixis Real Estate Capital LLC
as Sponsors and Mortgage Loan Sellers
Commercial Mortgage Pass-Through Certificates
Series 2025-C64
February 3, 2025
| WELLS FARGO SECURITIES | BMO CAPITAL MARKETS | CITIGROUP | GOLDMAN SACHS & CO. LLC | J.P. MORGAN | SOCIÉTÉ GÉNÉRALE | UBS SECURITIES LLC |
| Co-Lead Manager and Joint Bookrunner | Co-Lead Manager and Joint Bookrunner | Co-Lead Manager and Joint Bookrunner | Co-Lead Manager and Joint Bookrunner | Co-Lead Manager and Joint Bookrunner | Co-Lead Manager and Joint Bookrunner | Co-Lead Manager and Joint Bookrunner |
| Academy Securities, Inc. | Drexel Hamilton | Natixis Securities Americas LLC | Siebert Williams Shank |
| Co-Manager | Co-Manager | Co-Manager | Co-Manager |
STATEMENT REGARDING THIS FREE WRITING PROSPECTUS
The depositor has filed a registration statement (including a prospectus) with the Securities and Exchange Commission (“SEC”) (SEC File No. 333-282099) for the offering to which this communication relates. Before you invest, you should read the prospectus in the registration statement and other documents the depositor has filed with the SEC for more complete information about the depositor, the issuing entity and this offering. You may get these documents for free by visiting EDGAR on the SEC Web site at www.sec.gov. Alternatively, the depositor, any underwriter, or any dealer participating in the offering will arrange to send you the prospectus after filing if you request it by calling toll free 1-800-745-2063 (8 a.m. – 5 p.m. EST) or by emailing wfs.cmbs@wellsfargo.com.
Nothing in this document constitutes an offer of securities for sale in any jurisdiction where the offer or sale is not permitted. The information contained herein is preliminary as of the date hereof, supersedes any such information previously delivered to you and will be superseded by any such information subsequently delivered and ultimately by the final prospectus relating to the securities. These materials are subject to change, completion, supplement or amendment from time to time.
This free writing prospectus has been prepared by the underwriters for information purposes only and does not constitute, in whole or in part, a prospectus for the purposes of (i) Regulation (EU) 2017/1129 (as amended), (ii) such Regulation as it forms part of UK domestic law, or (iii) Part VI of the UK Financial Services and Markets Act 2000, as amended; and does not constitute an offering document for any other purpose.
STATEMENT REGARDING ASSUMPTIONS AS TO SECURITIES, PRICING ESTIMATES AND OTHER INFORMATION
The attached information contains certain tables and other statistical analyses (the “Computational Materials”) which have been prepared in reliance upon information furnished by the Mortgage Loan Sellers. Numerous assumptions were used in preparing the Computational Materials, which may or may not be reflected herein. As such, no assurance can be given as to the Computational Materials’ accuracy, appropriateness or completeness in any particular context; or as to whether the Computational Materials and/or the assumptions upon which they are based reflect present market conditions or future market performance. The Computational Materials should not be construed as either projections or predictions or as legal, tax, financial or accounting advice. You should consult your own counsel, accountant and other advisors as to the legal, tax, business, financial and related aspects of a purchase of these securities. Any weighted average lives, yields and principal payment periods shown in the Computational Materials are based on prepayment and/or loss assumptions, and changes in such prepayment and/or loss assumptions may dramatically affect such weighted average lives, yields and principal payment periods. In addition, it is possible that prepayments or losses on the underlying assets will occur at rates higher or lower than the rates shown in the attached Computational Materials. The specific characteristics of the securities may differ from those shown in the Computational Materials due to differences between the final underlying assets and the preliminary underlying assets used in preparing the Computational Materials. The principal amount and designation of any security described in the Computational Materials are subject to change prior to issuance. None of Wells Fargo Securities, LLC, BMO Capital Markets Corp., Citigroup Global Markets Inc., Goldman Sachs & Co. LLC, UBS Securities LLC, J.P. Morgan Securities LLC, SG Americas Securities LLC, Academy Securities, Inc., Drexel Hamilton, LLC, Natixis Securities Americas LLC, Siebert Williams Shank & Co., LLC or any of their respective affiliates, make any representation or warranty as to the actual rate or timing of payments or losses on any of the underlying assets or the payments or yield on the securities. The information in this presentation is based upon management forecasts and reflects prevailing conditions and management’s views as of this date, all of which are subject to change. In preparing this presentation, we have relied upon and assumed, without independent verification, the accuracy and completeness of all information available from public sources or which was provided to us by or on behalf of the Mortgage Loan Sellers or which was otherwise reviewed by us.
This free writing prospectus contains certain forward-looking statements. If and when included in this free writing prospectus, the words “expects”, “intends”, “anticipates”, “estimates” and analogous expressions and all statements that are not historical facts, including statements about our beliefs or expectations, are intended to identify forward-looking statements. Any forward-looking statements are made subject to risks and uncertainties which could cause actual results to differ materially from those stated. Those risks and uncertainties include, among other things, declines in general economic and business conditions, increased competition, changes in demographics, changes in political and social conditions, regulatory initiatives and changes in customer preferences, many of which are beyond our control and the control of any other person or entity related to this offering. The forward-looking statements made in this free writing prospectus are made as of the date stated on the cover. We have no obligation to update or revise any forward-looking statement.
Wells Fargo Securities is the trade name for the capital markets and investment banking services of Wells Fargo & Company and its subsidiaries, including but not limited to Wells Fargo Securities, LLC, a member of NYSE, FINRA, NFA and SIPC, Wells Fargo Prime Services, LLC, a member of FINRA, NFA and SIPC, and Wells Fargo Bank, N.A. Wells Fargo Securities, LLC and Wells Fargo Prime Services, LLC are distinct entities from affiliated banks and thrifts.
J.P. Morgan is the marketing name for the investment banking businesses of JPMorgan Chase & Co. and its subsidiaries worldwide. Securities, syndicated loan arranging, financial advisory and other investment banking activities are performed by JPMS and its securities affiliates, and lending, derivatives and other commercial banking activities are performed by JPMorgan Chase Bank, National Association and its banking affiliates. JPMS is a member of SIPC and the NYSE.
BMO Capital Markets is a trade name used by BMO Financial Group for the wholesale banking businesses of Bank of Montreal, BMO Harris Bank N.A. (member FDIC), Bank of Montreal Europe p.l.c, and Bank of Montreal (China) Co. Ltd, the institutional broker dealer business of BMO Capital Markets Corp. (Member FINRA and SIPC) and the agency broker dealer business of Clearpool Execution Services, LLC (Member FINRA and SIPC) in the U.S., and the institutional broker dealer businesses of BMO Nesbitt Burns Inc. (Member Investment Industry Regulatory Organization of Canada and Member Canadian Investor Protection Fund) in Canada and Asia, Bank of Montreal Europe p.l.c. (authorized and regulated by the Central Bank of Ireland) in Europe and BMO Capital Markets Limited (authorized and regulated by the Financial Conduct Authority) in the UK and Australia.
Société Générale is the marketing name for SG Americas Securities, LLC.
IMPORTANT NOTICE REGARDING THE OFFERED CERTIFICATES
The information herein is preliminary and may be supplemented or amended prior to the time of sale. In addition, the Offered Certificates referred to in these materials and the asset pool backing them are subject to modification or revision (including the possibility that one or more classes of certificates may be split, combined or eliminated at any time prior to issuance or availability of a final prospectus) and are offered on a “when, as and if issued” basis.
The underwriters described in these materials may from time to time perform investment banking services for, or solicit investment banking business from, any company named in these materials. The underwriters and/or their affiliates or respective employees may from time to time have a long or short position in any security or contract discussed in these materials.
The information contained herein supersedes any previous such information delivered to any prospective investor and will be superseded by information delivered to such prospective investor prior to the time of sale.
IMPORTANT NOTICE RELATING TO AUTOMATICALLY-GENERATED EMAIL DISCLAIMERS
Any legends, disclaimers or other notices that may appear at the bottom of any email communication to which this free writing prospectus is attached relating to (1) these materials not constituting an offer (or a solicitation of an offer), (2) any representation that these materials are accurate or complete and may not be updated or (3) these materials possibly being confidential, are not applicable to these materials and should be disregarded. Such legends, disclaimers or other notices have been automatically generated as a result of these materials having been sent via Bloomberg or another system.
| THE INFORMATION IN THIS STRUCTURAL AND COLLATERAL TERM SHEET IS NOT COMPLETE AND MAY BE AMENDED PRIOR TO THE TIME OF SALE. THIS TERM SHEET IS NOT AN OFFER TO SELL THESE SECURITIES AND IT IS NOT A SOLICITATION OF AN OFFER TO BUY THESE SECURITIES IN ANY JURISDICTION WHERE THE OFFER OR SALE IS NOT PERMITTED. | ||
| 2 | ||
| Wells Fargo Commercial Mortgage Trust 2025-C64 | Certificate Structure |
| I. | Certificate Structure |
| Class | Expected Ratings (Fitch/KBRA/Moody’s)(1) | Approximate Initial Certificate Balance or Notional Amount(2) |
Approx. Initial Credit Support(3) | Pass-Through Rate Description | Weighted Average Life (Years)(4) | Expected Principal Window(4) | Certificate Principal UW NOI Debt Yield(5) | Certificate Principal to Value Ratio(6) |
| Offered Certificates | ||||||||
| A-1 | AAAsf/AAA(sf)/Aaa(sf) | $11,231,000 | 30.000% | (7) | 2.73 | 03/25-02/30 | 19.0% | 37.9% |
| A-2 | AAAsf/AAA(sf)/Aaa(sf) | $21,000,000 | 30.000% | (7) | 4.97 | 02/30-02/30 | 19.0% | 37.9% |
| A-SB | AAAsf/AAA(sf)/Aaa(sf) | $16,454,000 | 30.000% | (7) | 7.32 | 02/30-08/34 | 19.0% | 37.9% |
| A-4 | AAAsf/AAA(sf)/Aaa(sf) | (8) | 30.000% | (7) | (8) | (8) | 19.0% | 37.9% |
| A-5 | AAAsf/AAA(sf)/Aaa(sf) | (8) | 30.000% | (7) | (8) | (8) | 19.0% | 37.9% |
| X-A | AAAsf/AAA(sf)/Aaa(sf) | $575,518,000(9) | N/A | Variable IO(10) | N/A | N/A | N/A | N/A |
| X-B | A-sf/AAA(sf)/NR | $143,879,000(11) | N/A | Variable IO(12) | N/A | N/A | N/A | N/A |
| A-S | AAAsf/AAA(sf)/Aa1(sf) | $68,856,000 | 21.625% | (7) | 9.88 | 01/35-01/35 | 16.9% | 42.5% |
| B | AA-sf/AA+(sf)/NR | $43,164,000 | 16.375% | (7) | 9.96 | 01/35-02/35 | 15.9% | 45.3% |
| C | A-sf/A+(sf)/NR | $31,859,000 | 12.500% | (7) | 9.97 | 02/35-02/35 | 15.2% | 47.4% |
| Non-Offered Certificates | |||||||
| X-D | BBB-sf/AAA(sf)/NR | (13)(15) | N/A | Variable IO(14) | N/A | N/A | N/A | N/A |
| D | BBBsf/A(sf)/NR | $13,596,000 | 10.846% | (7) | 9.97 | 02/35-02/35 | 14.9% | 48.3% |
| E | BBB-sf/A-(sf)/NR | (15) | (15) | (7) | 9.97 | 02/35-02/35 | 14.7% | 48.8% |
| F-RR | BB+sf/BBB+(sf)/NR | (15) | 8.000% | (7) | 9.97 | 02/35-02/35 | 14.4% | 49.8% |
| G-RR | BB-sf/BBB-(sf)/NR | $11,305,000 | 6.625% | (7) | 9.97 | 02/35-02/35 | 14.2% | 50.6% |
| J-RR | B-sf/BB(sf)/NR | $13,360,000 | 5.000% | (7) | 9.97 | 02/35-02/35 | 14.0% | 51.5% |
| K-RR | NR/NR/NR | $41,108,756 | 0.000% | (7) | 9.97 | 02/35-02/35 | 13.3% | 54.2% |
| (1) | The expected ratings presented are those of Fitch Ratings, Inc. (“Fitch”), Kroll Bond Rating Agency, LLC (“KBRA”) and Moody’s Investors Service Inc. (“Moody’s”), which the depositor hired to rate the Offered Certificates. One or more other nationally recognized statistical rating organizations that were not hired by the depositor may use information they receive pursuant to Rule 17g-5 under the Securities Exchange Act of 1934, as amended (the “Exchange Act”) or otherwise, to rate or provide market reports and/or published commentary related to the Offered Certificates. We cannot assure you as to what ratings a non-hired nationally recognized statistical rating organization would assign or that its reports will not express differing, possibly negative, views of the mortgage loans and/or the Offered Certificates. The ratings of each Class of Offered Certificates address the likelihood of the timely distribution of interest and, except in the case of the Class X-A, X-B and X-D Certificates, the ultimate distribution of principal due on those Classes on or before the Rated Final Distribution Date. See “Risk Factors—Other Risks Relating to the Certificates—Nationally Recognized Statistical Rating Organizations May Assign Different Ratings to the Certificates; Ratings of the Certificates Reflect Only the Views of the Applicable Rating Agencies as of the Dates Such Ratings Were Issued; Ratings May Affect ERISA Eligibility; Ratings May Be Downgraded” and “Ratings” in the Preliminary Prospectus, expected to be dated February 3, 2025 (the “Preliminary Prospectus”). Fitch, KBRA and Moody’s have informed us that the “sf” designation in their ratings represents an identifier for structured finance product ratings. |
| (2) | The Certificate Balances and Notional Amounts set forth in the table are approximate. The actual initial Certificate Balances and Notional Amounts may be larger or smaller depending on the initial pool balance of the mortgage loans definitively included in the pool of mortgage loans, which aggregate cut-off date balance may be as much as 5% larger or smaller than the amount presented in the Preliminary Prospectus. In addition, the Notional Amounts of the Class X-A, X-B and X-D Certificates (collectively referred to herein as “Class X Certificates”) may vary depending upon the final pricing of the Classes of Principal Balance Certificates (as defined below) whose Certificate Balances comprise such Notional Amounts and, if as a result of such pricing the pass-through rate of any Class of the Class X Certificates would be equal to zero at all times, such Class of Certificates will not be issued on the closing date of this securitization. |
| (3) | The Approximate Initial Credit Support with respect to the Class A-1, A-2, A-SB, A-4 and A-5 Certificates represents the approximate credit enhancement for the Class A-1, A-2, A-SB, A-4 and A-5 Certificates in the aggregate. |
| (4) | Weighted Average Lives and Expected Principal Windows are calculated based on an assumed prepayment rate of 0% CPR and the “Structuring Assumptions” described under “Yield and Maturity Considerations—Weighted Average Life” in the Preliminary Prospectus. |
| (5) | The Certificate Principal U/W NOI Debt Yield for each Class of Certificates (other than the Class A-1, A-2, A-SB, A-4 and A-5 Certificates) is calculated as the product of (a) the weighted average U/W NOI Debt Yield for the mortgage loans and (b) a fraction, the numerator of which is the total initial Certificate Balance of all of the Classes of Principal Balance Certificates and the denominator of which is the total initial Certificate Balance for such Class of Certificates and all Classes of Principal Balance Certificates senior to such Class of Certificates. The Certificate Principal U/W NOI Debt Yield for each of the Class A-1, A-2, A-SB, A-4 and A-5 Certificates is calculated in the aggregate for those Classes as if they were a single Class and is calculated as the product of (a) the weighted average U/W NOI Debt Yield for the mortgage loans and (b) a fraction, the numerator of which is the total initial Certificate Balance of all of the Classes of Principal Balance Certificates and the denominator of which is the total aggregate initial Certificate Balances for the Class A-1, A-2, A-SB, A-4 and A-5 Certificates. In any event, however, cash flow from each mortgaged property supports only the related mortgage loan and will not be available to support any other mortgage loan. |
| (6) | The Certificate Principal to Value Ratio for each Class of Certificates (other than the Class A-1, A-2, A-SB, A-4 and A-5 Certificates) is calculated as the product of (a) the weighted average Cut-off Date LTV Ratio for the mortgage loans and (b) a fraction, the numerator of which is the total initial Certificate Balance of such Class of Certificates and all Classes of Principal Balance Certificates senior to such Class of Certificates and the denominator of which is the total initial Certificate Balance of all of the Principal Balance Certificates. The Certificate Principal to Value Ratio for each of the Class A-1, A-2, A-SB, A-4 and A-5 Certificates is calculated in the aggregate for those Classes as if they were a single Class and is calculated as the product of (a) the weighted average Cut-off Date LTV Ratio for the mortgage loans and (b) a fraction, the numerator of which is the total initial aggregate Certificate Balances of such Classes of Certificates and the denominator of which is the total initial Certificate Balance of all of the Principal Balance Certificates. In any event, however, excess mortgaged property value associated with a mortgage loan will not be available to offset losses on any other mortgage loan. |
| (7) | The pass-through rates for the Class A-1, A-2, A-SB, A-4, A-5, A-S, B, C, D, E, F-RR, G-RR, J-RR and K-RR Certificates (collectively, the “Principal Balance Certificates”) for any distribution date will, in each case, be one of the following: (i) a fixed rate per annum, (ii) a variable rate per annum equal to the weighted average of the net mortgage interest rates on the mortgage loans for the related distribution date, (iii) a variable rate per annum equal to the lesser of (a) a fixed rate and (b) the weighted average of the net mortgage interest rates on the mortgage loans for the related distribution date or (iv) a variable rate per annum equal to the weighted average of the net mortgage interest rates on the mortgage loans for the related distribution date minus a specified percentage. For purposes of the calculation of the weighted average of the net mortgage interest rates on the mortgage loans for each distribution date, the mortgage interest rates will be adjusted as necessary to a 30/360 basis. |
| THE INFORMATION IN THIS STRUCTURAL AND COLLATERAL TERM SHEET IS NOT COMPLETE AND MAY BE AMENDED PRIOR TO THE TIME OF SALE. THIS TERM SHEET IS NOT AN OFFER TO SELL THESE SECURITIES AND IT IS NOT A SOLICITATION OF AN OFFER TO BUY THESE SECURITIES IN ANY JURISDICTION WHERE THE OFFER OR SALE IS NOT PERMITTED. | ||
| 3 | ||
| Wells Fargo Commercial Mortgage Trust 2025-C64 | Certificate Structure |
| (8) | The exact initial Certificate Balances of the Class A-4 and A-5 Certificates are unknown and will be determined based on the final pricing of those Classes of Certificates. However, the initial Certificate Balances, weighted average lives and principal windows of the Class A-4 and A-5 Certificates are expected to be within the applicable ranges reflected in the following chart. The aggregate initial Certificate Balance of the Class A-4 and A-5 Certificates is expected to be approximately $526,833,000, subject to a variance of plus or minus 5%. In the event that the Class A-5 Certificates is issued with the maximum certificate balance (i.e., with an initial certificate balance of $526,833,000), the Class A-4 Certificates will not be issued. |
| Class of Certificates | Expected Range of Approximate Initial Certificate Balance | Expected Range of Weighted Average Life (Years) | Expected Range of Principal Window | ||||
| Class A-4 | $0 - $250,000,000 | N/A – 9.62 | N/A / 08/34 - 11/34 | ||||
| Class A-5 | $276,833,000 - $526,833,000 | 9.71 – 9.80 | 08/34- 01/35 / 11/34 – 01/35 |
| (9) | The Class X-A Certificates are notional amount certificates. The Notional Amount of the Class X-A Certificates will be equal to the aggregate Certificate Balance of the Class A-1, A-2, A-SB, A-4 and A-5 Certificates outstanding from time to time. The Class X-A Certificates will not be entitled to distributions of principal. |
| (10) | The pass-through rate for the Class X-A Certificates for any distribution date will be a per annum rate equal to the excess, if any, of (a) the weighted average of the net mortgage interest rates on the mortgage loans for the related distribution date, over (b) the weighted average of the pass-through rates on the Class A-1, A-2, A-SB, A-4 and A-5 Certificates for the related distribution date, weighted on the basis of their respective Certificate Balances outstanding immediately prior to that distribution date. For purposes of the calculation of the weighted average of the net mortgage interest rates on the mortgage loans for each distribution date, the mortgage interest rates will be adjusted as necessary to a 30/360 basis. |
| (11) | The Class X-B Certificates are notional amount certificates. The Notional Amount of the Class X-B Certificates will be equal to the aggregate Certificate Balance of the Class A-S, B and C Certificates outstanding from time to time. The Class X-B Certificates will not be entitled to distributions of principal. |
| (12) | The pass-through rate for the Class X-B Certificates for any distribution date will be a per annum rate equal to the excess, if any, of (a) the weighted average of the net mortgage interest rates on the mortgage loans for the related distribution date, over (b) the weighted average of the pass-through rates on the Class A-S, B and C Certificates for the related distribution date, weighted on the basis of their respective Certificate Balances outstanding immediately prior to that distribution date. For purposes of the calculation of the weighted average of the net mortgage interest rates on the mortgage loans for each distribution date, the mortgage interest rates will be adjusted as necessary to a 30/360 basis. |
| (13) | The Class X-D Certificates are notional amount certificates. The Notional Amount of the Class X-D Certificates will be equal to the aggregate Certificate Balance of the Class D and E Certificates outstanding from time to time. The Class X-D Certificates will not be entitled to distributions of principal. |
| (14) | The pass-through rate for the Class X-D Certificates for any distribution date will be a per annum rate equal to the excess, if any, of (a) the weighted average of the net mortgage interest rates on the mortgage loans for the related distribution date, over (b) the weighted average pass-through rates on the Class D and E Certificates for the related distribution date, weighted on the basis of their respective Certificate Balances outstanding immediately prior to that distribution date. For purposes of the calculation of the weighted average of the net mortgage interest rates on the mortgage loans for each distribution date, the mortgage interest rates will be adjusted as necessary to a 30/360 basis. |
| (15) | The initial Certificate Balance of each of the Class E and Class F-RR Certificates is estimated based in part on the estimated ranges of Certificate Balances and estimated fair values described in “Credit Risk Retention” in the Preliminary Prospectus. The initial Certificate Balance of the Class E Certificates is expected to fall within a range of $6,547,000 to $8,222,000, and the initial Certificate Balance of the Class F-RR Certificates is expected to fall within a range of $15,180,000 to $16,855,000, with the ultimate initial Certificate Balance of each determined such that the aggregate fair value of the Class F-RR, G-RR, J-RR and K-RR Certificates will equal at least 5% of the estimated fair value as of the Closing Date of all of the Classes of Certificates (other than the Class R Certificates) issued by the issuing entity. Any variation in the initial Certificate Balance of the Class E Certificates would affect the initial notional amount of the Class X-D certificates. Additionally, the Approximate Initial Credit Support for the Class E Certificates will range between approximately 9.846% and 10.050%. |
| THE INFORMATION IN THIS STRUCTURAL AND COLLATERAL TERM SHEET IS NOT COMPLETE AND MAY BE AMENDED PRIOR TO THE TIME OF SALE. THIS TERM SHEET IS NOT AN OFFER TO SELL THESE SECURITIES AND IT IS NOT A SOLICITATION OF AN OFFER TO BUY THESE SECURITIES IN ANY JURISDICTION WHERE THE OFFER OR SALE IS NOT PERMITTED. | ||
| 4 | ||
| Wells Fargo Commercial Mortgage Trust 2025-C64 | Transaction Highlights |
| II. | Transaction Highlights |
Mortgage Loan Sellers:
Mortgage Loan Seller | Number of | Number of | Aggregate Cut-off Date Balance | Approx. % of Initial Pool | ||||
| Goldman Sachs Mortgage Company | 5 | 7 | $193,000,055 | 23.5 | % | |||
| Citi Real Estate Funding Inc. | 8 | 28 | 172,246,464 | 21.0 | ||||
| Wells Fargo Bank, National Association | 5 | 5 | 132,187,683 | 16.1 | ||||
| UBS AG | 3 | 10 | 81,500,000 | 9.9 | ||||
| Societe Generale Financial Corporation | 6 | 6 | 78,004,605 | 9.5 | ||||
| JPMorgan Chase Bank, National Association | 1 | 2 | 70,000,000 | 8.5 | ||||
| Bank of Montreal | 1 | 1 | 45,000,000 | 5.5 | ||||
| LMF Commercial, LLC | 2 | 2 | 30,229,949 | 3.7 | ||||
| Natixis Real Estate Capital LLC | 1 | 1 | 20,000,000 | 2.4 | ||||
Total | 32 |
| 62 |
| $822,168,756 |
| 100.0 | % |
Loan Pool:
| Initial Pool Balance: | $822,168,756 |
| Number of Mortgage Loans: | 32 |
| Average Cut-off Date Balance per Mortgage Loan: | $25,692,774 |
| Number of Mortgaged Properties: | 62 |
| Average Cut-off Date Balance per Mortgaged Property(1): | $13,260,786 |
| Number of crossed loans | 2 |
| Crossed loans as a percentage | 2.2% |
| Weighted Average Interest Rate: | 6.6418% |
| Ten Largest Mortgage/Cross-collateralized Loans as % of Initial Pool Balance: | 58.8% |
| Weighted Average Original Term to Maturity (months): | 118 |
| Weighted Average Remaining Term to Maturity (months): | 116 |
| Weighted Average Original Amortization Term (months)(2): | 356 |
| Weighted Average Remaining Amortization Term (months)(2): | 355 |
| Weighted Average Seasoning (months): | 2 |
| (1) | Information regarding mortgage loans secured by multiple properties is based on an allocation according to relative appraised values or the allocated loan amounts or property-specific release prices set forth in the related loan documents or such other allocation as the related mortgage loan seller deemed appropriate. |
| (2) | Excludes any mortgage loan that does not amortize. |
Credit Statistics:
| Weighted Average U/W Net Cash Flow DSCR(1): | 1.80x |
| Weighted Average U/W Net Operating Income Debt Yield(1): | 13.3% |
| Weighted Average Cut-off Date Loan-to-Value Ratio(1): | 54.2% |
| Weighted Average Balloon or ARD Loan-to-Value Ratio(1): | 52.2% |
| % of Mortgage Loans with Additional Subordinate Debt(2): | 17.5% |
| % of Mortgage Loans with Single Tenants(3): | 4.5% |
| (1) | With respect to any mortgage loan that is part of a whole loan, loan-to-value ratio, debt service coverage ratio and debt yield calculations include the related pari passu companion loan(s) but exclude any related subordinate companion loan(s) (unless otherwise stated). The information for each mortgaged property that relates to a mortgage loan that is cross-collateralized or cross-defaulted with one or more other mortgage loans is based upon the principal balance of that mortgage loan, except that the applicable loan-to-value ratio, debt service coverage ratio, and debt yield for each such mortgage loan is based upon the ratio or yield (as applicable) for the aggregate indebtedness evidenced by all loans in the group (without regard to any limitation on the amount of indebtedness secured by any mortgaged property in such cross-collateralized group). The debt service coverage ratio, debt yield and loan-to-value ratio information do not take into account any subordinate debt (whether or not secured by the related mortgaged property), that currently exists or is allowed under the terms of any mortgage loan. See “Description of the Mortgage Pool—Mortgage Pool Characteristics” in the Preliminary Prospectus and Annex A-1 to the Preliminary Prospectus. |
| (2) | The percentage figure expressed as “% of Mortgage Loans with Additional Subordinate Debt” is determined as a percentage of the initial pool balance and does not take into account any future subordinate debt (whether or not secured by the mortgaged property), if any, that may be permitted under the terms of any mortgage loan or the pooling and servicing agreement. See “Description of the Mortgage Pool—Additional Indebtedness—Other Unsecured Indebtedness” in the Preliminary Prospectus. |
| (3) | Excludes mortgage loans that are secured by multiple single tenant properties. |
| THE INFORMATION IN THIS STRUCTURAL AND COLLATERAL TERM SHEET IS NOT COMPLETE AND MAY BE AMENDED PRIOR TO THE TIME OF SALE. THIS TERM SHEET IS NOT AN OFFER TO SELL THESE SECURITIES AND IT IS NOT A SOLICITATION OF AN OFFER TO BUY THESE SECURITIES IN ANY JURISDICTION WHERE THE OFFER OR SALE IS NOT PERMITTED. | ||
| 5 | ||
| Wells Fargo Commercial Mortgage Trust 2025-C64 | Transaction Highlights |
Loan Structural Features:
Amortization: Based on the Initial Pool Balance, 30.8% of the mortgage pool (16 mortgage loans) has scheduled amortization, as follows:
22.4% (13 mortgage loans) requires amortization during the entire loan term; and
8.4% (3 mortgage loans) provides for an interest-only period followed by an amortization period.
Interest-Only: Based on the Initial Pool Balance, 69.2% of the mortgage pool (16 mortgage loans) provides for interest-only payments during the entire loan term through maturity. The weighted average Cut-off Date Loan-to-Value Ratio and weighted average U/W Net Cash Flow DSCR for those mortgage loans are 53.9% and 1.86x, respectively.
Hard Lockboxes: Based on the Initial Pool Balance, 60.7% of the mortgage pool (15 mortgage loans) has hard lockboxes in place.
Reserves: The mortgage loans require amounts to be escrowed monthly as follows (excluding any mortgage loans with springing provisions):
| Real Estate Taxes: | 85.9% of the pool |
| Insurance: | 31.3% of the pool |
| Capital Replacements: | 77.0% of the pool |
| TI/LC: | 38.0% of the pool(1) |
| (1) | The percentage of Initial Pool Balance for mortgage loans with TI/LC reserves is based on the aggregate principal balance allocable to loans that include mixed use, retail and industrial properties. |
Call Protection/Defeasance: Based on the Initial Pool Balance, the mortgage pool has the following call protection and defeasance features:
52.1% of the mortgage pool (19 mortgage loans) features a lockout period, then defeasance only until an open period;
41.3% of the mortgage pool (11 mortgage loans) features a lockout period, then greater of a prepayment premium (1.0%) or yield maintenance until an open period; and
6.6% of the mortgage pool (2 mortgage loans) features a lockout period, then defeasance or greater of a prepayment premium (1.0%) or yield maintenance until an open period.
| THE INFORMATION IN THIS STRUCTURAL AND COLLATERAL TERM SHEET IS NOT COMPLETE AND MAY BE AMENDED PRIOR TO THE TIME OF SALE. THIS TERM SHEET IS NOT AN OFFER TO SELL THESE SECURITIES AND IT IS NOT A SOLICITATION OF AN OFFER TO BUY THESE SECURITIES IN ANY JURISDICTION WHERE THE OFFER OR SALE IS NOT PERMITTED. | ||
| 6 | ||
| Wells Fargo Commercial Mortgage Trust 2025-C64 | Issue Characteristics |
| III. | Issue Characteristics |
| Securities Offered: | $719,397,000 approximate monthly pay, multi-class, commercial mortgage REMIC pass-through certificates consisting of ten classes (Classes A-1, A-2, A-SB, A-4, A-5, A-S, B, C, X-A and X-B), which are offered pursuant to a registration statement filed with the SEC (such Classes of certificates, the “Offered Certificates”). |
| Mortgage Loan Sellers: | Wells Fargo Bank, National Association (“WFB”), Goldman Sachs Mortgage Company (“GSMC”), Citi Real Estate Funding Inc. (“CREFI”), UBS AG (“UBS AG”), Societe Generale Financial Corporation (“SGFC”), JPMorgan Chase Bank, National Association (“JPMCB”), Bank of Montreal (“BMO”), LMF Commercial, LLC (“LMF”) and Natixis Real Estate Capital LLC (“Natixis”) |
| Joint Bookrunners and Co-Lead Managers: | Wells Fargo Securities, LLC, BMO Capital Markets Corp., Goldman Sachs & Co. LLC, J.P. Morgan Securities LLC, UBS Securities LLC, Citigroup Global Markets Inc and SG Americas Securities, LLC. |
| Co-Managers: | Academy Securities, Inc., Drexel Hamilton, LLC, Natixis Securities Americas LLC and Siebert Williams Shank & Co., LLC |
| Rating Agencies: | Fitch Ratings, Inc., Kroll Bond Rating Agency, LLC and Moody’s Investors Service, Inc. |
| Master Servicer: | Wells Fargo Bank, National Association |
| Special Servicer: | Rialto Capital Advisors, LLC |
| Certificate Administrator: | Computershare Trust Company, N.A. |
| Trustee: | Computershare Trust Company, N.A. |
| Operating Advisor: | Park Bridge Lender Services LLC |
| Asset Representations Reviewer: | Park Bridge Lender Services LLC |
| U.S. Credit Risk Retention: | For a discussion of the manner in which the U.S. credit risk retention requirements are being addressed by Wells Fargo Bank, National Association, as the retaining sponsor, see “Credit Risk Retention” in the Preliminary Prospectus. This transaction is being structured with a “third-party purchaser” that will acquire an “eligible horizontal residual interest”, which will be comprised of the Class F-RR, G-RR, J-RR and K-RR Certificates (the “horizontal risk retention certificates”). RREF V - D AIV RR H, LLC (in satisfaction of the retention obligations of Wells Fargo Bank, National Association, as the retaining sponsor) will be contractually obligated to retain (or to cause its “majority-owned affiliate” to retain) the horizontal risk retention certificates for a minimum of five years after the closing date, subject to certain permitted exceptions provided for under the risk retention rules. During this time, RREF V - D AIV RR H, LLC will agree to comply with hedging, transfer and financing restrictions that are applicable to third party purchasers under the credit risk retention rules. For additional information, see “Credit Risk Retention” in the Preliminary Prospectus. |
| EU Securitization Regulation and UK Securitization Regulation: | No transaction party, or any other person, intends to retain a material net economic interest in the securitization constituted by the issuance of the Certificates, or to take any other action in respect of such securitization, in a manner prescribed or contemplated (i) in the European Union by Regulation (EU) 2017/2402 and related technical standards (collectively the “EU Securitization Rules”), or (ii) in the United Kingdom by the Securitisation Regulations 2024 and related rules made by each of the Financial Conduct Authority and the Prudential Regulation Authority (collectively the “UK Securitization Rules”). In particular, no such person undertakes to take any action, or refrain from taking any action, for purposes of, or in connection with, compliance by any prospective investor or Certificateholder with any applicable requirement of the EU Securitization Rules or the UK Securitization Rules. In addition, the arrangements described under “Credit Risk Retention” in the Preliminary Prospectus have not been structured with the objective of ensuring or facilitating compliance by any person with any applicable requirement of the EU Securitization Rules or the UK Securitization Rules. See “Risk Factors—Other Risks Relating to the Certificates—EU Securitization Rules and UK Securitization Rules” in the Preliminary Prospectus |
| Initial Controlling Class Certificateholder: | RREF V – D AIV RR H, LLC |
| THE INFORMATION IN THIS STRUCTURAL AND COLLATERAL TERM SHEET IS NOT COMPLETE AND MAY BE AMENDED PRIOR TO THE TIME OF SALE. THIS TERM SHEET IS NOT AN OFFER TO SELL THESE SECURITIES AND IT IS NOT A SOLICITATION OF AN OFFER TO BUY THESE SECURITIES IN ANY JURISDICTION WHERE THE OFFER OR SALE IS NOT PERMITTED. | ||
| 7 | ||
| Wells Fargo Commercial Mortgage Trust 2025-C64 | Issue Characteristics |
| Cut-off Date: | The Cut-off Date with respect to each mortgage loan is the due date for the monthly debt service payment that is due in February 2025 (or, in the case of any mortgage loan that has its first due date after February 2025, the date that would have been its due date in February 2025 under the terms of that mortgage loan if a monthly debt service payment were scheduled to be due in that month). |
| Expected Closing Date: | On or about February 27, 2025. |
| Determination Dates: | The 11th day of each month (or if that day is not a business day, the next succeeding business day), commencing in March 2025. |
| Distribution Dates: | The fourth business day following the Determination Date in each month, commencing in March 2025. |
| Rated Final Distribution Date: | The Distribution Date in February 2058. |
| Interest Accrual Period: | With respect to any Distribution Date, the calendar month immediately preceding the month in which such Distribution Date occurs. |
| Day Count: | The Offered Certificates will accrue interest on a 30/360 basis. |
| Minimum Denominations: | $10,000 for each Class of Offered Certificates (other than the Class X-A and X-B Certificates) and $1,000,000 for the Class X-A and X-B Certificates. Investments may also be made in any whole dollar denomination in excess of the applicable minimum denomination. |
| Clean-up Call: | 1.0% |
| Delivery: | DTC, Euroclear and Clearstream Banking |
| ERISA/SMMEA Status: | Each Class of Offered Certificates is expected to be eligible for exemptive relief under ERISA. No Class of Offered Certificates will be Secondary Mortgage Market Enhancement Act of 1984, as amended (“SMMEA”) eligible. |
| Risk Factors: | THE CERTIFICATES INVOLVE CERTAIN RISKS AND MAY NOT BE SUITABLE FOR ALL INVESTORS. SEE THE “SUMMARY OF RISK FACTORS” AND “RISK FACTORS” SECTIONS OF THE PRELIMINARY PROSPECTUS. |
| Bond Analytics Information: | The Certificate Administrator will be authorized to make distribution date statements, CREFC® reports and certain supplemental reports (other than confidential information) available to certain financial modeling and data provision services, including Bloomberg, L.P., CRED iQ, Trepp, LLC, Intex Solutions, Inc., Markit Group Limited, Interactive Data Corp., BlackRock Financial Management, Inc., CMBS.com, Inc., Moody’s Analytics, Inc., Morningstar Credit Information & Analytics, LLC, KBRA Analytics, LLC, MBS Data, LLC, RealInsight, Thomson Reuters Corporation and DealX. |
| Tax Treatment | For U.S. federal income tax purposes, the issuing entity will consist of one or more REMICs arranged in a tiered structure. The Offered Certificates will represent REMIC regular interests. |
| THE INFORMATION IN THIS STRUCTURAL AND COLLATERAL TERM SHEET IS NOT COMPLETE AND MAY BE AMENDED PRIOR TO THE TIME OF SALE. THIS TERM SHEET IS NOT AN OFFER TO SELL THESE SECURITIES AND IT IS NOT A SOLICITATION OF AN OFFER TO BUY THESE SECURITIES IN ANY JURISDICTION WHERE THE OFFER OR SALE IS NOT PERMITTED. | ||
| 8 | ||
| Wells Fargo Commercial Mortgage Trust 2025-C64 | Characteristics of the Mortgage Pool |
| IV. | Characteristics of the Mortgage Pool(1) |
| A. | Ten Largest Mortgage Loans or Cross-Collateralized Mortgage Loans |
| Mortgage Loan Seller | Mortgage Loan Name | City | State | Number of Mortgage Loans/ Mortgaged Properties | Mortgage Loan Cut-off Date Balance ($) | % of Cut-off Date Pool Balance (%) | Property Type | Number of SF/ Units/ Rooms | Cut-off Date Balance Per SF/Unit/ Room ($) | Cut-off Date LTV Ratio (%) | Balloon or ARD LTV Ratio (%) | U/W NCF DSCR (x) | U/W NOI Debt Yield (%) | |||||
| GSMC | TheWit Chicago | Chicago | IL | 1 / 1 | $81,000,000 | 9.9 | % | Hospitality | 310 | $261,290 | 54.4 | % | 54.4 | % | 1.59 | x | 13.5 | % |
| WFB | Ventana Residences | San Francisco | CA | 1 / 1 | 73,500,000 | 8.9 | Multifamily | 193 | 380,829 | 65.6 | 65.6 | 1.25 | 7.9 | |||||
| JPMCB | Soho Grand & The Roxy Hotel | New York | NY | 1 / 2 | 70,000,000 | 8.5 | Hospitality | 548 | 371,350 | 40.1 | 40.1 | 3.49 | 21.9 | |||||
| CREFI | West Michigan Industrial Portfolio | Various | MI | 1 / 10 | 57,000,000 | 6.9 | Industrial | 1,696,701 | 34 | 57.6 | 57.6 | 1.90 | 12.6 | |||||
| GSMC | Outlet Shoppes of the Bluegrass | Simpsonville | KY | 1 / 1 | 45,900,055 | 5.6 | Retail | 428,074 | 154 | 60.4 | 52.6 | 1.72 | 14.2 | |||||
| BMO | UOVO QPN | Long Island City | NY | 1 / 1 | 45,000,000 | 5.5 | Self Storage | 281,494 | 508 | 60.9 | 60.9 | 1.47 | 9.7 | |||||
| UBS AG | Phoenix Industrial Portfolio XII | Various | Various | 1 / 8 | 30,000,000 | 3.6 | Industrial | 2,013,085 | 26 | 48.1 | 48.1 | 1.60 | 11.7 | |||||
| GSMC | Newport Centre | Jersey City | NJ | 1 / 1 | 28,000,000 | 3.4 | Retail | 966,186 | 195 | 43.0 | 43.0 | 2.66 | 15.3 | |||||
| UBS AG | Union Square Shopping Center | Harrisburg | PA | 1 / 1 | 27,950,000 | 3.4 | Retail | 307,913 | 91 | 65.0 | 65.0 | 1.56 | 11.2 | |||||
| CREFI | Shops at Mission Viejo | Mission Viejo | CA | 1 / 1 | 25,000,000 | 3.0 | Retail | 1,012,005 | 178 | 52.4 | 49.5 | 1.69 | 13.4 | |||||
| Top Three Total/Weighted Average | 3 / 4 | $224,500,000 | 27.3 | % | 53.6 | % | 53.6 | % | 2.07 | x | 14.3 | % | ||||||
| Top Five Total/Weighted Average | 5 / 15 | $327,400,055 | 39.8 | % | 55.3 | % | 54.2 | % | 1.99 | x | 14.0 | % | ||||||
| Top Ten Total/Weighted Average | 10 / 27 | $483,350,055 | 58.8 | % | 55.0 | % | 54.2 | % | 1.92 | x | 13.3 | % | ||||||
| Non-Top Ten Total/Weighted Average | 22 / 35 | $338,818,701 | 41.2 | % | 53.0 | % | 49.5 | % | 1.64 | x | 13.2 | % | ||||||
| (1) | With respect to any mortgage loan that is part of a whole loan, Cut-off Date Balance Per SF/Unit/Room, loan-to-value ratio, debt service coverage ratio and debt yield calculations include the related pari passu companion loan(s) (unless otherwise stated). With respect to each mortgage loan, debt service coverage ratio, debt yield and loan-to-value ratio information do not take into account subordinate debt (whether or not secured by the related mortgaged property), if any, that currently exists or is allowed under the terms of such mortgage loan. The information for each mortgaged property that relates to a mortgage loan that is cross-collateralized or cross-defaulted with other mortgage loans is based upon the principal balance of that mortgage loan, except that the applicable loan-to-value ratio, debt service coverage ratio and debt yield for each such mortgage loan is based upon the ratio or yield (as applicable) for the aggregate indebtedness evidenced by all loans in the group (without regard to any limitation on the amount of indebtedness secured by any mortgaged property in such cross-collateralized group). On an individual basis, without regard to the cross-collateralization feature, any mortgage loan that is part of a cross-collateralized group of mortgage loans may have a higher loan-to-value ratio, lower debt service coverage ratio and/or lower debt yield than is presented herein. |
| THE INFORMATION IN THIS STRUCTURAL AND COLLATERAL TERM SHEET IS NOT COMPLETE AND MAY BE AMENDED PRIOR TO THE TIME OF SALE. THIS TERM SHEET IS NOT AN OFFER TO SELL THESE SECURITIES AND IT IS NOT A SOLICITATION OF AN OFFER TO BUY THESE SECURITIES IN ANY JURISDICTION WHERE THE OFFER OR SALE IS NOT PERMITTED. | ||
| 9 | ||
| Wells Fargo Commercial Mortgage Trust 2025-C64 | Characteristics of the Mortgage Pool |
| B. | Summary of the Whole Loans |
| Loan No. | Property Name | Mortgage Loan Seller in WFCM 2025-C64 | Mortgage Loan Cut-off Date Balance | Aggregate Pari-Passu Companion Loan Cut-off Date Balance(1) | Combined Cut-off Date Balance | Controlling Pooling / Trust and Servicing Agreement | Master Servicer | Special Servicer | Related Pari Passu Companion Loan(s) Securitizations | Combined UW NCF DSR(2) | Combined UW NOI Debt Yield(2) | Combined Cut-off Date LTV(2) |
| 3 | Soho Grand & The Roxy Hotel | JPMCB | $70,000,000 | $133,500,000 | $203,500,000 | BANK 2024-BNK48 | Wells Fargo | LNR | BANK 2024-BNK48 | 3.09x | 19.4% | 45.3% |
| 5 | Outlet Shoppes of the Bluegrass | GSMC | $45,900,055 | $19,956,546 | $65,856,600 | WFCM 2025-C64 | Wells Fargo | Rialto Capital Advisors, LLC | Future Securitization | 1.72x | 14.2% | 60.4% |
| 6 | UOVO QPN | BMO | $45,000,000 | $98,000,000 | $143,000,000 | WFCM 2025-C64 | Wells Fargo | Rialto Capital Advisors, LLC | Future Securitization | 1.47x | 9.7% | 60.9% |
| 7 | Phoenix Industrial Portfolio XII | UBS AG | $30,000,000 | $22,500,000 | $52,500,000 | WFCM 2025-C64 | Wells Fargo | Rialto | BBCMS 2025-C32 | 1.60x | 11.7% | 48.1% |
| 8 | Newport Centre | GSMC | $28,000,000 | $160,000,000 | $188,000,000 | BBCMS 2024-C30 | Midland | Rialto Capital Advisors, LLC | BBCMS 2024-C30; BMO 2024-C10; BANK 2024-BNK48 | 2.66x | 15.3% | 43.0% |
| 10 | Shops at Mission Viejo | CREFI | $25,000,000 | $155,000,000 | $180,000,000 | BBCMS 2025-C32 | Midland | Argentic Services Company LP | BBCMS 2025-C32 | 1.69x | 13.4% | 52.4% |
| 11 | 900 North Michigan | GSMC | $25,000,000 | $155,000,000 | $180,000,000 | BBCMS 2024-C28 | Wells Fargo | LNR Partners, LLC | BBCMS 2024-C28; WFCM 2024-C63; BANK 2024-BNK48; BBCMS 2024-C30 | 1.77x | 12.6% | 57.1% |
| 19 | Twin Cities Premium Outlets | Natixis | $20,000,000 | $75,000,000 | $95,000,000 | BBCMS 2024-C30 | Midland | Rialto Capital Advisors, LLC | BBCMS 2024-C30 | 2.01x | 14.3% | 47.0% |
| (1) | The Aggregate Pari Passu Companion Loan Cut-off Date Balance excludes the related Subordinate Companion Loans. |
| (2) | DSCR, Debt Yield and LTV calculations include any related pari passu companion loans and exclude any subordinate companion loans and/or mezzanine loans, as applicable. |
| THE INFORMATION IN THIS STRUCTURAL AND COLLATERAL TERM SHEET IS NOT COMPLETE AND MAY BE AMENDED PRIOR TO THE TIME OF SALE. THIS TERM SHEET IS NOT AN OFFER TO SELL THESE SECURITIES AND IT IS NOT A SOLICITATION OF AN OFFER TO BUY THESE SECURITIES IN ANY JURISDICTION WHERE THE OFFER OR SALE IS NOT PERMITTED. | ||
| 10 | ||
| Wells Fargo Commercial Mortgage Trust 2025-C64 | Characteristics of the Mortgage Pool |
| C. | Mortgage Loans with Additional Secured and Mezzanine Financing |
| Loan No. | Mortgage Loan Seller | Mortgage Loan Name | Mortgage Loan Cut-off Date Balance ($) | % of Initial Pool Balance (%) | Sub Debt Cut-off Date Balance ($) | Mezzanine Debt Cut-off Date Balance ($) | Total Debt Interest Rate (%)(1) | Mortgage Loan U/W NCF DSCR (x)(2) | Total Debt U/W NCF DSCR (x) | Mortgage Loan Cut-off Date U/W NOI Debt Yield (%)(2) | Total Debt Cut-off Date U/W NOI Debt Yield (%) | Mortgage Loan Cut-off Date LTV Ratio (%)(2) | Total Debt Cut-off Date LTV Ratio (%) |
| 2 | WFB | Ventana Residences | $73,500,000 | 8.9% | NAP | $34,750,000 | 6.7547% | 1.25x | 0.78x | 7.9% | 5.4% | 65.6% | 96.7% |
| 3 | JPMCB | Soho Grand & The Roxy Hotel | 70,000,000 | 8.5 | $26,500,000 | NAP | 5.5400 | 3.49 | 3.09 | 21.9 | 19.4 | 40.1 | 45.3 |
| Total/Weighted Average | $143,500,000 | 17.5% | $26,500,000 | $34,750,000 | 6.1622% | 2.34x | 1.91x | 14.7% | 12.2% | 53.2% | 71.6% | ||
| (1) | Total Debt Interest Rate for any specified mortgage loan reflects the weighted average of the interest rates on the respective components of the total debt. |
| (2) | With respect to any mortgage loan that is part of a whole loan, the loan-to-value ratio, debt service coverage ratio and debt yield calculations include the related pari passu companion loan(s) but excludes any related subordinate companion loan or mezzanine debt. |
| THE INFORMATION IN THIS STRUCTURAL AND COLLATERAL TERM SHEET IS NOT COMPLETE AND MAY BE AMENDED PRIOR TO THE TIME OF SALE. THIS TERM SHEET IS NOT AN OFFER TO SELL THESE SECURITIES AND IT IS NOT A SOLICITATION OF AN OFFER TO BUY THESE SECURITIES IN ANY JURISDICTION WHERE THE OFFER OR SALE IS NOT PERMITTED. | ||
| 11 | ||
| Wells Fargo Commercial Mortgage Trust 2025-C64 | Characteristics of the Mortgage Pool |
| D. | Previous Securitization History(1) |
Loan No. | Mortgage Loan Seller | Mortgage Loan or Mortgaged Property Name | City | State | Property Type | Mortgage Loan or Mortgaged Property Cut-off Date Balance ($) | % of Cut-off Date Pool Balance (%) | Previous Securitization | |
| 3.00 | JPMCB | Soho Grand & The Roxy Hotel | New York | NY | Hospitality | $70,000,000 | 8.5 | % | CSAIL 2015-C1; CSAIL 2015-C2; CSAIL 2015-C3 |
| 4.01 | CREFI | 553 - 555 76th Street Southwest | Byron Center | MI | Industrial | 7,600,000 | 0.9 | COMM 2015-PC1 | |
| 4.02 | CREFI | 3366 Kraft Avenue Southeast | Grand Rapids | MI | Industrial | 7,400,000 | 0.9 | COMM 2015-PC1 | |
| 4.03 | CREFI | 8181 Logistics Drive | Zeeland | MI | Industrial | 7,100,000 | 0.9 | COMM 2015-PC1 | |
| 4.04 | CREFI | 3300 Kraft Avenue Southeast | Grand Rapids | MI | Industrial | 7,100,000 | 0.9 | COMM 2015-PC1 | |
| 4.05 | CREFI | 3232 Kraft Avenue Southeast | Grand Rapids | MI | Industrial | 6,900,000 | 0.8 | COMM 2015-PC1 | |
| 4.06 | CREFI | 511 76th Street Southwest | Byron Center | MI | Industrial | 6,800,000 | 0.8 | COMM 2015-PC1 | |
| 4.07 | CREFI | 425 Gordon Industrial Court Southwest | Byron Center | MI | Industrial | 5,400,000 | 0.7 | COMM 2015-PC1 | |
| 4.08 | CREFI | 2851 Prairie Street Southwest | Grandville | MI | Industrial | 4,100,000 | 0.5 | COMM 2015-PC1 | |
| 4.09 | CREFI | 100 84th Street Southwest | Byron Center | MI | Industrial | 2,700,000 | 0.3 | COMM 2015-PC1 | |
| 4.10 | CREFI | 5001 Kendrick Street Southeast | Grand Rapids | MI | Industrial | 1,900,000 | 0.2 | COMM 2015-PC1 | |
| 5.00 | GSMC | Outlet Shoppes of the Bluegrass | Simpsonville | KY | Retail | 45,900,055 | 5.6 | JPMBB 2015-C27 | |
| 6.00 | BMO | UOVO QPN | Long Island City | NY | Self Storage | 45,000,000 | 5.5 | CD 2017-CD4 | |
| 8.00 | GSMC | Newport Centre | Jersey City | NJ | Retail | 28,000,000 | 3.4 | CSMC 2022-NWPT | |
| 9.00 | UBS AG | Union Square Shopping Center | Harrisburg | PA | Retail | 27,950,000 | 3.4 | CGCMT 2015-GC27; JPMCC 2004-C3 | |
| 11.00 | GSMC | 900 North Michigan | Chicago | IL | Mixed Use | 25,000,000 | 3.0 | LBUBS 2005-C3 | |
| 15.04 | CREFI | Tuckaway Village MHP | Germantown Hills | IL | Manufactured Housing | 2,150,000 | 0.3 | WFCM 2015-C31 | |
| 15.05 | CREFI | Minot MHP | Minot | ND | Manufactured Housing | 2,020,000 | 0.2 | CGCMT 2015-GC35 | |
| 16.00 | SGFC | Escondido HHSA Building | Escondido | CA | Mixed Use | 21,000,000 | 2.6 | CSAIL 2016-C5 | |
| 19.00 | Natixis | Twin Cities Premium Outlets | Eagan | MN | Retail | 20,000,000 | 2.4 | GSMS 2014-GC26; CGCMT 2015-GC27 | |
| 28.00 | WFB | Security Public Storage | Fairfield | CA | Self Storage | 9,465,474 | 1.2 | WFRBS 2014-C24 | |
| 29.00 | WFB | North Huntingdon Square | Irwin | PA | Retail | 7,974,238 | 1.0 | JPMBB 2014-C19 | |
| 31.00 | CREFI | Skyview Plaza | East Liverpool | OH | Retail | 7,481,998 | 0.9 | JPMBB 2014-C24 | |
| Total | $368,941,765 | 44.9 | % | ||||||
| (1) | The table above represents the most recent securitization with respect to the mortgaged property securing the related mortgage loan, based on information provided by the related borrower or obtained through searches of a third-party database. While loans secured by the above mortgaged properties may have been securitized multiple times in prior transactions, mortgage loans in this securitization are only listed in the above chart if the mortgage loan paid off a loan in another securitization. The information has not otherwise been confirmed by the mortgage loan sellers. |
| THE INFORMATION IN THIS STRUCTURAL AND COLLATERAL TERM SHEET IS NOT COMPLETE AND MAY BE AMENDED PRIOR TO THE TIME OF SALE. THIS TERM SHEET IS NOT AN OFFER TO SELL THESE SECURITIES AND IT IS NOT A SOLICITATION OF AN OFFER TO BUY THESE SECURITIES IN ANY JURISDICTION WHERE THE OFFER OR SALE IS NOT PERMITTED. | ||
| 12 | ||
| Wells Fargo Commercial Mortgage Trust 2025-C64 | Characteristics of the Mortgage Pool |
| E. | Mortgage Loans with Scheduled Balloon Payments and Related Classes |
| Class A-2(1) | ||||||||||||||||
| Loan No. | Mortgage Loan Seller | Mortgage Loan Name | State | Property Type | Mortgage Loan Cut-off Date Balance ($) | % of Initial Pool Balance (%) | Mortgage Loan Balance at Maturity ($) | % of Class A-2 Certificate Principal Balance (%)(2) | Pads | Loan per Pad ($) | U/W NCF DSCR (x) | U/W NOI Debt Yield (%) | Cut-off Date LTV Ratio (%) | Balloon LTV Ratio (%) | Rem. IO Period (mos.) | Rem. Term to Maturity (mos.) |
| 15 | CREFI | Elevation MHC Portfolio | Various | Manufactured Housing | $21,200,000 | 2.6% | $21,200,000 | 101.0% | 1,139 | $18,613 | 1.44x | 10.4% | 40.5% | 40.5% | 60 | 60 |
| Total/Weighted Average | $21,200,000 | 2.6% | $21,200,000 | 101.0% | 1.44x | 10.4% | 40.5% | 40.5% | 60 | 60 | ||||||
| (1) | The table above presents the mortgage loan whose balloon payments would be applied to pay down the principal balance of the Class A-2 Certificates, assuming a 0% CPR and applying the “Structuring Assumptions” described in the Preliminary Prospectus, including the assumptions that (i) none of the mortgage loans in the pool experience prepayments prior to maturity, defaults or losses; (ii) there are no extensions of maturity dates of any mortgage loans in the pool; and (iii) each mortgage loan in the pool is paid in full on its stated maturity date. Each Class of Certificates evidences undivided ownership interests in the entire pool of mortgage loans. Debt service coverage ratio, debt yield and loan-to-value ratio information do not take into account subordinate debt (whether or not secured by the related mortgaged property), if any, that currently exists or is allowed under the terms of any mortgage loan. See Annex A-1 to the Preliminary Prospectus. |
| (2) | Reflects the percentage equal to the applicable Mortgage Loan Balance at Maturity divided by the initial Class A-2 Certificate Balance. |
| THE INFORMATION IN THIS STRUCTURAL AND COLLATERAL TERM SHEET IS NOT COMPLETE AND MAY BE AMENDED PRIOR TO THE TIME OF SALE. THIS TERM SHEET IS NOT AN OFFER TO SELL THESE SECURITIES AND IT IS NOT A SOLICITATION OF AN OFFER TO BUY THESE SECURITIES IN ANY JURISDICTION WHERE THE OFFER OR SALE IS NOT PERMITTED. | ||
| 13 | ||
| Wells Fargo Commercial Mortgage Trust 2025-C64 | Characteristics of the Mortgage Pool |
| F. | Property Type Distribution(1) |
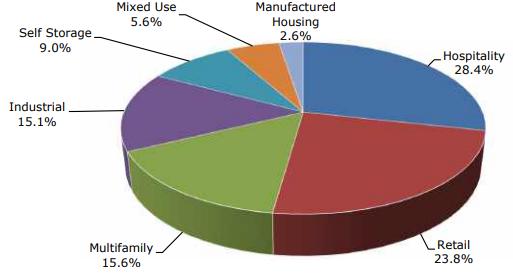
| Property Type | Number of Mortgaged Properties | Aggregate Cut-off Date Balance ($) | % of Cut-off Date Balance (%) | Weighted Average Cut-off Date LTV Ratio (%) | Weighted Average Balloon or ARD LTV Ratio (%) | Weighted Average U/W NCF DSCR (x) | Weighted Average U/W NOI Debt Yield (%) | Weighted Average U/W NCF Debt Yield (%) | Weighted Average Mortgage Rate (%) |
| Hospitality | 8 | $233,712,386 | 28.4% | 47.6% | 45.7% | 2.28x | 17.5% | 15.5% | 6.8065% |
| Full Service | 4 | 174,550,000 | 21.2 | 47.1 | 47.1 | 2.35 | 17.0 | 15.0 | 6.7208 |
| Extended Stay | 1 | 20,947,971 | 2.5 | 25.7 | 22.1 | 2.99 | 25.6 | 22.3 | 6.3100 |
| Select Service | 1 | 15,800,000 | 1.9 | 72.1 | 59.6 | 1.34 | 13.4 | 12.4 | 7.9900 |
| Limited Service; Extended Stay | 1 | 11,584,466 | 1.4 | 48.5 | 42.1 | 1.98 | 17.3 | 15.5 | 6.7800 |
| Limited Service | 1 | 10,829,949 | 1.3 | 59.8 | 52.9 | 1.64 | 15.3 | 13.8 | 7.4500 |
| Retail | 11 | 195,706,291 | 23.8 | 57.6 | 54.3 | 1.80 | 13.2 | 12.6 | 6.5322 |
| Outlet Center | 2 | 65,900,055 | 8.0 | 56.3 | 50.9 | 1.81 | 14.2 | 13.6 | 6.7949 |
| Anchored | 3 | 55,731,998 | 6.8 | 65.8 | 63.3 | 1.54 | 11.7 | 11.1 | 6.5945 |
| Super Regional Mall | 2 | 53,000,000 | 6.4 | 47.4 | 46.1 | 2.20 | 14.4 | 13.9 | 6.0445 |
| Shadow Anchored | 4 | 21,074,238 | 2.6 | 65.1 | 62.0 | 1.46 | 11.2 | 10.6 | 6.7727 |
| Multifamily | 6 | 127,904,605 | 15.6 | 60.8 | 59.0 | 1.31 | 9.2 | 9.0 | 6.5677 |
| Mid Rise | 1 | 73,500,000 | 8.9 | 65.6 | 65.6 | 1.25 | 7.9 | 7.8 | 6.1660 |
| Garden | 4 | 33,004,605 | 4.0 | 57.0 | 49.9 | 1.28 | 10.6 | 10.4 | 7.1560 |
| Student Housing | 1 | 21,400,000 | 2.6 | 50.4 | 50.4 | 1.55 | 11.5 | 11.1 | 7.0400 |
| Industrial | 21 | 123,780,000 | 15.1 | 51.4 | 50.8 | 1.73 | 12.4 | 11.6 | 6.5346 |
| Warehouse/Distribution | 9 | 41,881,018 | 5.1 | 53.2 | 53.2 | 1.76 | 12.2 | 11.3 | 6.3512 |
| Warehouse | 6 | 37,001,651 | 4.5 | 56.5 | 56.5 | 1.86 | 12.5 | 11.7 | 6.2240 |
| Manufacturing/Warehouse | 1 | 24,000,000 | 2.9 | 38.1 | 35.2 | 1.55 | 12.9 | 12.6 | 7.1950 |
| Manufacturing/Distribution | 2 | 12,780,000 | 1.6 | 56.1 | 56.1 | 1.60 | 12.0 | 11.1 | 6.8400 |
| Manufacturing | 3 | 8,117,331 | 1.0 | 50.3 | 50.3 | 1.67 | 11.9 | 10.9 | 6.4634 |
| Self Storage | 3 | 73,865,474 | 9.0 | 60.2 | 59.2 | 1.46 | 9.8 | 9.8 | 6.4396 |
| Self Storage | 3 | 73,865,474 | 9.0 | 60.2 | 59.2 | 1.46 | 9.8 | 9.8 | 6.4396 |
| Mixed Use | 2 | 46,000,000 | 5.6 | 59.3 | 55.8 | 1.64 | 12.6 | 12.2 | 6.9489 |
| Retail/Office | 1 | 25,000,000 | 3.0 | 57.1 | 57.1 | 1.77 | 12.6 | 12.3 | 6.8530 |
| Office/Retail | 1 | 21,000,000 | 2.6 | 61.9 | 54.2 | 1.49 | 12.7 | 12.0 | 7.0630 |
| Manufactured Housing | 11 | 21,200,000 | 2.6 | 40.5 | 40.5 | 1.44 | 10.4 | 10.1 | 6.9500 |
| Manufactured Housing | 11 | 21,200,000 | 2.6 | 40.5 | 40.5 | 1.44 | 10.4 | 10.1 | 6.9500 |
| Total/Weighted Average | 62 | $822,168,756 | 100.0% | 54.2% | 52.2% | 1.80x | 13.3% | 12.4% | 6.6418% |
| (1) | Because this table presents information relating to the mortgaged properties and not the mortgage loans, (a) the information for mortgage loans secured by more than one mortgaged property (other than through cross-collateralization with other mortgage loans) is based on allocated loan amounts (allocating the principal balance of the mortgage loan to each of those properties according to the relative appraised values of the mortgaged properties or the allocated loan amounts or property-specific release prices set forth in the related mortgage loan documents or such other allocation as the related mortgage loan seller deemed appropriate) and (b) the information for each mortgaged property that relates to a mortgage loan that is cross-collateralized or cross-defaulted with other mortgage loans is based upon the principal balance of that mortgage loan, except that the applicable loan-to-value ratio, debt service coverage ratio and debt yield for each such mortgage loan is based upon the ratio or yield (as applicable) for the aggregate indebtedness evidenced by all loans in the group (without regard to any limitation on the amount of indebtedness secured by any mortgaged property in such cross-collateralized group). On an individual basis, without regard to the cross-collateralization feature, any mortgage loan that is part of a cross-collateralized group of mortgage loans may have a higher loan-to-value ratio, lower debt service coverage ratio and/or lower debt yield than is presented herein. With respect to any mortgage loan that is part of a whole loan, the loan-to-value ratio, debt service coverage ratio and debt yield calculations include the related pari passu companion loan(s) but exclude any related subordinate secured loan(s) (unless otherwise stated). With respect to each mortgage loan, debt service coverage ratio, debt yield and loan-to-value ratio information do not take into account any subordinate debt (whether or not secured by the related mortgaged property) that currently exists or is allowed under the terms of such mortgage loan. See Annex A-1 to the Preliminary Prospectus. |
| THE INFORMATION IN THIS STRUCTURAL AND COLLATERAL TERM SHEET IS NOT COMPLETE AND MAY BE AMENDED PRIOR TO THE TIME OF SALE. THIS TERM SHEET IS NOT AN OFFER TO SELL THESE SECURITIES AND IT IS NOT A SOLICITATION OF AN OFFER TO BUY THESE SECURITIES IN ANY JURISDICTION WHERE THE OFFER OR SALE IS NOT PERMITTED. | ||
| 14 | ||
| Wells Fargo Commercial Mortgage Trust 2025-C64 | Characteristics of the Mortgage Pool |
| G. | Geographic Distribution(1)(2) |
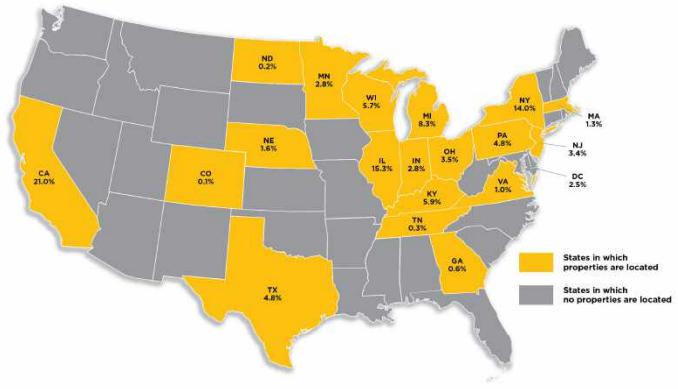
| Location | Number of Mortgaged Properties | Aggregate Cut-off Date Balance ($) | % of Cut-off Date Balance (%) | Weighted Average Cut-off Date LTV Ratio (%) | Weighted Average Balloon LTV Ratio (%) | Weighted Average U/W NCF DSCR (x) | Weighted Average U/W NOI Debt Yield (%) | Weighted Average U/W NCF Debt Yield (%) | Weighted Average Interest Rate (%) | ||||||||
| California | 6 | $172,365,474 | 21.0 | % | 58.3 | % | 56.1 | % | 1.42 | x | 10.3 | % | 10.1 | % | 6.5336 | % | |
| Northern California | 3 | 102,365,474 | 12.5 | 63.7 | 63.0 | 1.31 | 8.5 | 8.4 | 6.2232 | ||||||||
| Southern California | 3 | 70,000,000 | 8.5 | 50.3 | 46.0 | 1.58 | 13.0 | 12.6 | 6.9875 | ||||||||
| Illinois | 6 | 126,188,074 | 15.3 | 53.2 | 53.2 | 1.61 | 12.9 | 11.6 | 7.1096 | ||||||||
| New York | 3 | 115,000,000 | 14.0 | 48.2 | 48.2 | 2.70 | 17.1 | 15.7 | 5.9098 | ||||||||
| Michigan | 11 | 68,584,466 | 8.3 | 56.1 | 55.0 | 1.91 | 13.4 | 12.5 | 6.2813 | ||||||||
| Kentucky | 2 | 48,265,942 | 5.9 | 59.8 | 52.4 | 1.71 | 14.1 | 13.5 | 6.8239 | ||||||||
| Wisconsin | 11 | 46,478,484 | 5.7 | 53.9 | 48.9 | 1.36 | 10.9 | 10.4 | 7.0073 | ||||||||
| Other(3) | 23 | 245,286,316 | 29.8 | 53.0 | 50.8 | 1.82 | 14.0 | 13.0 | 6.8162 | ||||||||
| Total/Weighted Average | 62 | $822,168,756 | 100.0 | % | 54.2 | % | 52.2 | % | 1.80 | x | 13.3 | % | 12.4 | % | 6.6418 | % | |
| (1) | The mortgaged properties are located in 19 states and the District of Columbia. |
| (2) | Because this table presents information relating to the mortgaged properties and not the mortgage loans, (a) the information for mortgage loans secured by more than one mortgaged property (other than through cross-collateralization with other mortgage loans) is based on allocated loan amounts (allocating the principal balance of the mortgage loan to each of those properties according to the relative appraised values of the mortgaged properties or the allocated loan amounts or property-specific release prices set forth in the related mortgage loan documents or such other allocation as the related mortgage loan seller deemed appropriate) and (b) the information for each mortgaged property that relates to a mortgage loan that is cross-collateralized or cross-defaulted with other mortgage loans is based upon the principal balance of that mortgage loan, except that the applicable loan-to-value ratio, debt service coverage ratio and debt yield for each such mortgage loan is based upon the ratio or yield (as applicable) for the aggregate indebtedness evidenced by all loans in the group (without regard to any limitation on the amount of indebtedness secured by any mortgaged property in such cross-collateralized group). On an individual basis, without regard to the cross-collateralization feature, any mortgage loan that is part of a cross-collateralized group of mortgage loans may have a higher loan-to-value ratio, lower debt service coverage ratio and/or lower debt yield than is presented herein. With respect to any mortgage loan that is part of a whole loan, the loan-to-value ratio, debt service coverage ratio and debt yield calculations include the related pari passu companion loan(s) but exclude any related subordinate secured loan(s) (unless otherwise stated). With respect to each mortgage loan, debt service coverage ratio, debt yield and loan-to-value ratio information do not take into account any subordinate debt (whether or not secured by the related mortgaged property) that currently exists or is allowed under the terms of such mortgage loan. See Annex A-1 to the Preliminary Prospectus. |
| (3) | Includes 13 other states and the District of Columbia. |
| THE INFORMATION IN THIS STRUCTURAL AND COLLATERAL TERM SHEET IS NOT COMPLETE AND MAY BE AMENDED PRIOR TO THE TIME OF SALE. THIS TERM SHEET IS NOT AN OFFER TO SELL THESE SECURITIES AND IT IS NOT A SOLICITATION OF AN OFFER TO BUY THESE SECURITIES IN ANY JURISDICTION WHERE THE OFFER OR SALE IS NOT PERMITTED. | ||
| 15 | ||
| Wells Fargo Commercial Mortgage Trust 2025-C64 | Characteristics of the Mortgage Pool |
| H. | Characteristics of the Mortgage Pool(1) |
| CUT-OFF DATE BALANCE | ||||
| Range of Cut-off Date Balances ($) | Number of Mortgage Loans | Aggregate Cut-off Date Balance ($) | Percent by Aggregate Cut-off Date Pool Balance (%) | |
| 7,284,605 - 8,000,000 | 4 | $30,410,841 | 3.7 | % |
| 8,000,001 - 9,000,000 | 1 | 8,600,000 | 1.0 | |
| 9,000,001 - 10,000,000 | 2 | 18,915,474 | 2.3 | |
| 10,000,001 - 15,000,000 | 4 | 48,294,415 | 5.9 | |
| 15,000,001 - 20,000,000 | 3 | 55,200,000 | 6.7 | |
| 20,000,001 - 30,000,000 | 12 | 288,347,971 | 35.1 | |
| 30,000,001 - 50,000,000 | 2 | 90,900,055 | 11.1 | |
| 50,000,001 - 70,000,000 | 2 | 127,000,000 | 15.4 | |
| 70,000,001 - 80,000,000 | 1 | 73,500,000 | 8.9 | |
| 80,000,001 - 81,000,000 | 1 | 81,000,000 | 9.9 | |
| Total: | 32 | $822,168,756 | 100.0 | % |
| Average: | $25,692,774 | |||
| UNDERWRITTEN NOI DEBT SERVICE COVERAGE RATIO | ||||
| Range of U/W NOI DSCRs (x) | Number of Mortgage Loans | Aggregate Cut-off Date Balance ($) | Percent by Aggregate Cut-off Date Pool Balance (%) | |
| 1.27 - 1.30 | 1 | $73,500,000 | 8.9 | % |
| 1.31 - 1.40 | 5 | 52,404,605 | 6.4 | |
| 1.41 - 1.50 | 3 | 82,000,000 | 10.0 | |
| 1.51 - 1.60 | 5 | 86,374,238 | 10.5 | |
| 1.61 - 1.70 | 3 | 58,815,474 | 7.2 | |
| 1.71 - 1.80 | 5 | 98,811,998 | 12.0 | |
| 1.81 - 1.90 | 4 | 162,730,003 | 19.8 | |
| 1.91 - 2.00 | 1 | 57,000,000 | 6.9 | |
| 2.01 - 2.25 | 2 | 31,584,466 | 3.8 | |
| 2.26 - 3.00 | 1 | 28,000,000 | 3.4 | |
| 3.01 - 3.50 | 1 | 20,947,971 | 2.5 | |
| 3.51 - 3.91 | 1 | 70,000,000 | 8.5 | |
| Total: | 32 | $822,168,756 | 100.0 | % |
| Weighted Average: | 1.93x | |||
| UNDERWRITTEN NOI DEBT YIELD | ||||
| Range of U/W NOI Debt Yields (%) | Number of Mortgage Loans | Aggregate Cut-off Date Balance ($) | Percent by Aggregate Cut-off Date Pool Balance (%) | |
| 7.9 - 8.0 | 1 | $73,500,000 | 8.9 | % |
| 8.1 - 12.1 | 15 | 261,574,317 | 31.8 | |
| 12.2 - 16.1 | 13 | 384,562,001 | 46.8 | |
| 16.2 - 20.1 | 1 | 11,584,466 | 1.4 | |
| 20.2 - 25.6 | 2 | 90,947,971 | 11.1 | |
| Total: | 32 | $822,168,756 | 100.0 | % |
| Weighted Average: | 13.3% | |||
| LOAN PURPOSE | ||||
| Loan Purpose | Number of Mortgage Loans | Aggregate Cut-off Date Balance ($) | Percent by Aggregate Cut-off Date Pool Balance (%) | |
| Refinance | 29 | $769,688,756 | 93.6 | % |
| Acquisition | 2 | 39,700,000 | 4.8 | |
| Recapitalization | 1 | 12,780,000 | 1.6 | |
| Total: | 32 | $822,168,756 | 100.0 | % |
| MORTGAGE RATE | ||||
| Range of Mortgage Rates (%) | Number of Mortgage Loans | Aggregate Cut-off Date Balance ($) | Percent by Aggregate Cut-off Date Pool Balance (%) | |
| 5.4370 - 5.5000 | 1 | $28,000,000 | 3.4 | % |
| 5.5001 - 5.7500 | 1 | 70,000,000 | 8.5 | |
| 5.7501 - 6.0000 | 1 | 9,465,474 | 1.2 | |
| 6.0001 - 6.2500 | 2 | 130,500,000 | 15.9 | |
| 6.2501 - 6.5000 | 4 | 81,404,207 | 9.9 | |
| 6.5001 - 6.7500 | 6 | 142,650,000 | 17.4 | |
| 6.7501 - 7.0000 | 6 | 123,749,126 | 15.1 | |
| 7.0001 - 7.2500 | 7 | 105,220,000 | 12.8 | |
| 7.2501 - 7.5000 | 2 | 91,829,949 | 11.2 | |
| 7.5001 - 8.3450 | 2 | 39,350,000 | 4.8 | |
| Total: | 32 | $822,168,756 | 100.0 | % |
| Weighted Average: | 6.6418% | |||
| UNDERWRITTEN NCF DEBT SERVICE COVERAGE RATIO | ||||
| Range of U/W NCF DSCRs (x) | Number of Mortgage Loans | Aggregate Cut-off Date Balance ($) | Percent by Aggregate Cut-off Date Pool Balance (%) | |
| 1.25 - 1.30 | 5 | $106,504,605 | 13.0 | % |
| 1.31 - 1.40 | 2 | 35,200,000 | 4.3 | |
| 1.41 - 1.50 | 6 | 128,574,238 | 15.6 | |
| 1.51 - 1.60 | 9 | 237,627,472 | 28.9 | |
| 1.61 - 1.70 | 2 | 35,829,949 | 4.4 | |
| 1.71 - 1.80 | 2 | 70,900,055 | 8.6 | |
| 1.81 - 1.90 | 1 | 57,000,000 | 6.9 | |
| 1.91 - 2.00 | 1 | 11,584,466 | 1.4 | |
| 2.01 - 2.25 | 1 | 20,000,000 | 2.4 | |
| 2.26 - 2.75 | 1 | 28,000,000 | 3.4 | |
| 2.76 - 3.00 | 1 | 20,947,971 | 2.5 | |
| 3.01 - 3.49 | 1 | 70,000,000 | 8.5 | |
| Total: | 32 | $822,168,756 | 100.0 | % |
| Weighted Average: | 1.80x | |||
| UNDERWRITTEN NCF DEBT YIELD | ||||
| Range of U/W NCF Debt Yields (%) | Number of Mortgage Loans | Aggregate Cut-off Date Balance ($) | Percent by Aggregate Cut-off Date Pool Balance (%) | |
| 7.8 - 8.1 | 1 | $73,500,000 | 8.9 | % |
| 8.2 - 12.1 | 19 | 428,056,315 | 52.1 | |
| 12.2 - 16.1 | 10 | 229,664,470 | 27.9 | |
| 16.2 - 22.3 | 2 | 90,947,971 | 11.1 | |
| Total: | 32 | $822,168,756 | 100.0 | % |
| Weighted Average: | 12.4% | |||
(1) | With respect to any mortgage loan that is part of a whole loan, the loan-to-value ratio, debt service coverage ratio and debt yield calculations include the related pari passu companion loan(s) but exclude any related subordinate debt (unless otherwise stated). With respect to each mortgage loan, debt service coverage ratio, debt yield and loan-to-value ratio information do not take into account any subordinate debt (whether or not secured by the related mortgaged property) that currently exists or is allowed under the terms of such mortgage loan. See Annex A-1 to the Preliminary Prospectus. Prepayment provisions for each mortgage loan reflects the entire life of the loan (from origination to maturity) and may be currently prepayable. |
| THE INFORMATION IN THIS STRUCTURAL AND COLLATERAL TERM SHEET IS NOT COMPLETE AND MAY BE AMENDED PRIOR TO THE TIME OF SALE. THIS TERM SHEET IS NOT AN OFFER TO SELL THESE SECURITIES AND IT IS NOT A SOLICITATION OF AN OFFER TO BUY THESE SECURITIES IN ANY JURISDICTION WHERE THE OFFER OR SALE IS NOT PERMITTED. | ||
| 16 | ||
| Wells Fargo Commercial Mortgage Trust 2025-C64 | Characteristics of the Mortgage Pool |
| ORIGINAL TERM TO MATURITY | ||||
| Original Terms to Maturity (months) | Number of Mortgage Loans | Aggregate Cut- off Date Balance | Percent by Aggregate Cut-off Date Pool Balance (%) | |
| 60 | 1 | $21,200,000 | 2.6 | % |
| 120 | 31 | 800,968,756 | 97.4 | |
| Total: | 32 | $822,168,756 | 100.0 | % |
| Weighted Average: | 118 months | |||
| REMAINING TERM TO MATURITY | ||||
| Range of Remaining Terms to Maturity (months) | Number of Mortgage Loans | Aggregate Cut- off Date Balance | Percent by Aggregate Cut-off Date Pool Balance (%) | |
| 60 | 1 | $21,200,000 | 2.6 | % |
| 114 - 120 | 31 | 800,968,756 | 97.4 | |
| Total: | 32 | $822,168,756 | 100.0 | % |
| Weighted Average: | 116 months | |||
| ORIGINAL AMORTIZATION TERM(1) | ||||
| Original Amortization Terms (months) | Number of Mortgage Loans | Aggregate Cut- off Date Balance | Percent by Aggregate Cut-off Date Pool Balance (%) | |
| Non-Amortizing | 16 | $568,880,000 | 69.2 | % |
| 300 | 1 | 15,800,000 | 1.9 | |
| 360 | 15 | 237,488,756 | 28.9 | |
| Total: | 32 | $822,168,756 | 100.0 | % |
| Weighted Average(3): | 356 months | |||
| REMAINING AMORTIZATION TERM(2) | ||||
| Range of Remaining Amortization Terms (months) | Number of Mortgage Loans | Aggregate Cut- off Date Balance | Percent by Aggregate Cut-off Date Pool Balance (%) | |
| Non-Amortizing | 16 | $568,880,000 | 69.2 | % |
| 300 | 1 | 15,800,000 | 1.9 | |
| 356 - 360 | 15 | 237,488,756 | 28.9 | |
| Total: | 32 | $822,168,756 | 100.0 | % |
| Weighted Average(3): | 355 months | |||
| LOCKBOXES | ||||
| Type of Lockbox | Number of Mortgage Loans | Aggregate Cut- off Date Balance | Percent by Aggregate Cut-off Date Pool Balance (%) | |
| Hard / Springing Cash Management | 14 | $486,374,293 | 59.2 | % |
| Springing | 15 | 204,514,463 | 24.9 | |
| Soft / Springing Cash Management | 2 | 118,500,000 | 14.4 | |
| Hard / In Place Cash Management | 1 | 12,780,000 | 1.6 | |
| Total: | 32 | $822,168,756 | 100.0 | % |
| PREPAYMENT PROVISION SUMMARY | ||||
| Prepayment Provision | Number of Mortgage Loans | Aggregate Cut- off Date Balance | Percent by Aggregate Cut-off Date Pool Balance (%) | |
| Lockout / Defeasance / Open | 19 | $428,148,677 | 52.1 | % |
| Lockout / GRTR 1% or YM / Open | 11 | 339,554,605 | 41.3 | |
| Lockout / GRTR 1% or YM or Defeasance / Open | 2 | 54,465,474 | 6.6 | |
| Total: | 32 | $822,168,756 | 100.0 | % |
| CUT-OFF DATE LOAN-TO-VALUE RATIO | ||||
| Range of Cut-off Date LTV Ratios (%) | Number of Mortgage Loans | Aggregate Cut- off Date Balance | Percent by Aggregate Cut-off Date Pool Balance (%) | |
| 25.7 - 30.0 | 1 | $20,947,971 | 2.5 | % |
| 30.1 - 40.0 | 1 | 24,000,000 | 2.9 | |
| 40.1 - 45.0 | 4 | 142,750,000 | 17.4 | |
| 45.1 - 50.0 | 3 | 61,584,466 | 7.5 | |
| 50.1 - 55.0 | 4 | 136,865,474 | 16.6 | |
| 55.1 - 60.0 | 10 | 154,070,790 | 18.7 | |
| 60.1 - 65.0 | 5 | 159,250,055 | 19.4 | |
| 65.1 - 70.0 | 3 | 106,900,000 | 13.0 | |
| 70.1 - 72.1 | 1 | 15,800,000 | 1.9 | |
| Total: | 32 | $822,168,756 | 100.0 | % |
| Weighted Average: | 54.2% | |||
| BALLOON LOAN-TO-VALUE RATIO | ||||
| Range of Balloon LTV Ratios (%) | Number of Mortgage Loans | Aggregate Cut- off Date Balance | Percent by Aggregate Cut-off Date Pool Balance (%) | |
| 22.1 - 25.0 | 1 | $20,947,971 | 2.5 | % |
| 25.1 - 40.0 | 1 | 24,000,000 | 2.9 | |
| 40.1 - 45.0 | 6 | 163,799,940 | 19.9 | |
| 45.1 - 50.0 | 6 | 100,720,000 | 12.3 | |
| 50.1 - 55.0 | 8 | 202,870,844 | 24.7 | |
| 55.1 - 60.0 | 4 | 110,580,000 | 13.4 | |
| 60.1 - 65.0 | 3 | 92,350,000 | 11.2 | |
| 65.1 - 68.8 | 3 | 106,900,000 | 13.0 | |
| Total: | 32 | $822,168,756 | 100.0 | % |
| Weighted Average: | 52.2% | |||
| AMORTIZATION TYPE | ||||
| Amortization Type | Number of Mortgage Loans | Aggregate Cut- off Date Balance | Percent by Aggregate Cut-off Date Pool Balance (%) | |
| Interest Only | 16 | $568,880,000 | 69.2 | % |
| Amortizing Balloon | 13 | 183,988,756 | 22.4 | |
| Interest Only, Amortizing Balloon | 3 | 69,300,000 | 8.4 | |
| Total: | 32 | $822,168,756 | 100.0 | % |
| ORIGINAL TERM OF INTEREST-ONLY PERIOD FOR PARTIAL IO LOANS | ||||
| IO Terms (months) | Number of Mortgage Loans | Aggregate Cut- off Date Balance | Percent by Aggregate Cut-off Date Pool Balance (%) | |
| 36 | 1 | $24,000,000 | 2.9 | % |
| 60 | 2 | 45,300,000 | 5.5 | |
| Total: | 3 | $69,300,000 | 8.4 | % |
| Weighted Average: | 52 months | |||
| SEASONING | ||||
| Seasoning (months) | Number of Mortgage Loans | Aggregate Cut- off Date Balance | Percent by Aggregate Cut-off Date Pool Balance (%) | |
| 0 | 8 | $202,220,000 | 24.6 | % |
| 1 | 4 | 153,550,000 | 18.7 | |
| 2 | 6 | 115,784,466 | 14.1 | |
| 3 | 9 | 210,174,578 | 25.6 | |
| 4 | 2 | 17,439,712 | 2.1 | |
| 5 | 2 | 98,000,000 | 11.9 | |
| 6 | 1 | 25,000,000 | 3.0 | |
| Total: | 32 | $822,168,756 | 100.0 | % |
| Weighted Average: | 2 months | |||
| (1) | The original amortization term shown for any mortgage loan that is interest only for part of its term does not include the number of months in its interest only period and reflects only the number of months as of the commencement of amortization remaining from the end of such interest-only period. |
| (2) | The remaining amortization term shown for any mortgage loan that is interest only for part of its term does not include the number of months in its interest only period and reflects only the number of months as of the commencement of amortization remaining from the end of such interest-only period. |
| (3) | Excludes the non-amortizing mortgage loans. |
| THE INFORMATION IN THIS STRUCTURAL AND COLLATERAL TERM SHEET IS NOT COMPLETE AND MAY BE AMENDED PRIOR TO THE TIME OF SALE. THIS TERM SHEET IS NOT AN OFFER TO SELL THESE SECURITIES AND IT IS NOT A SOLICITATION OF AN OFFER TO BUY THESE SECURITIES IN ANY JURISDICTION WHERE THE OFFER OR SALE IS NOT PERMITTED. | ||
| 17 | ||
| Wells Fargo Commercial Mortgage Trust 2025-C64 | Certain Terms and Conditions |
| V. | Certain Terms and Conditions |
| Interest Entitlements: | The interest entitlement of each Class of Certificates (other than the Class R Certificates) on each Distribution Date generally will be the interest accrued during the related Interest Accrual Period on the related Certificate Balance or Notional Amount at the related pass-through rate, net of any prepayment interest shortfalls allocated to that Class for such Distribution Date as described below. If prepayment interest shortfalls arise from voluntary prepayments (without the Master Servicer’s consent) on particular non-specially serviced loans during any collection period, the Master Servicer is required to make a compensating interest payment to offset those shortfalls, generally up to an amount equal to the portion of its master servicing fees that accrue at 0.25 basis points per annum. The remaining amount of prepayment interest shortfalls will be allocated to reduce the interest entitlement on all Classes of Certificates that are entitled to interest, on a pro rata basis, based on their respective amounts of accrued interest for the related Distribution Date. If a Class receives less than the entirety of its interest entitlement on any Distribution Date, then the shortfall (excluding any shortfall due to prepayment interest shortfalls), together with interest thereon, will be added to its interest entitlement for the next succeeding Distribution Date. |
| Principal Distribution Amount: | The Principal Distribution Amount for each Distribution Date generally will be the aggregate amount of principal received or advanced in respect of the mortgage loans, net of any non-recoverable advances and interest thereon and workout-delayed reimbursement amounts that are reimbursed to the Master Servicer, the Special Servicer or the Trustee during the related collection period. Non-recoverable advances and interest thereon are reimbursable from principal collections and advances before reimbursement from other amounts. Workout-delayed reimbursement amounts are reimbursable from principal collections. |
| Subordination, Allocation of Losses and Certain Expenses: | The chart below describes the manner in which the payment rights of certain Classes of Certificates will be senior or subordinate, as the case may be, to the payment rights of other Classes of Certificates. The chart also shows the corresponding entitlement to receive principal and/or interest of certain Classes of Certificates on any distribution date in descending order. It also shows the manner in which losses are allocated to certain Classes of Certificates in ascending order (beginning with the Non-Offered Certificates, other than the Class X-D and R Certificates) to reduce the balance of each such Class to zero; provided that no principal payments or mortgage loan losses will be allocated to the Class X-A, X-B, X-D or R Certificates, although principal payments and losses may reduce the Notional Amounts of the Class X-A, X-B and X-D Certificates, and, therefore, the amount of interest they accrue. |
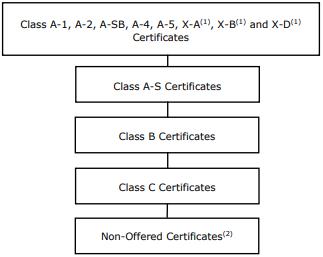 |
| (1) | The Class X-A, X-B and X-D Certificates are interest-only certificates. |
| (2) | Other than the Class X-D and R Certificates. |
| Distributions: | On each Distribution Date, funds available for distribution from the mortgage loans, net of specified trust fees, expenses and reimbursements will generally be distributed in the following amounts and order of priority (in each case to the extent of remaining available funds): |
1. Class A-1, A-2, A-SB, A-4, A-5, X-A, X-B and X-D Certificates: To interest on the Class A-1, A-2, A-SB, A-4, A-5, X-A, X-B and X-D Certificates, pro rata, according to their respective interest entitlements. | |
2. Class A-1, A-2, A-SB, A-4 and A-5 Certificates: To principal on the Class A-1, A-2, A-SB, A-4 and A-5 Certificates in the following amounts and order of priority: (i) first, to |
| THE INFORMATION IN THIS STRUCTURAL AND COLLATERAL TERM SHEET IS NOT COMPLETE AND MAY BE AMENDED PRIOR TO THE TIME OF SALE. THIS TERM SHEET IS NOT AN OFFER TO SELL THESE SECURITIES AND IT IS NOT A SOLICITATION OF AN OFFER TO BUY THESE SECURITIES IN ANY JURISDICTION WHERE THE OFFER OR SALE IS NOT PERMITTED. | ||
| 18 | ||
| Wells Fargo Commercial Mortgage Trust 2025-C64 | Certain Terms and Conditions |
principal on the Class A-SB Certificates, in an amount up to the Principal Distribution Amount for such Distribution Date until their Certificate Balance is reduced to the Class A-SB Planned Principal Balance for such Distribution Date; (ii) second, to principal on the Class A-1 Certificates until their Certificate Balance is reduced to zero, up to the remainder of the Principal Distribution Amount for such Distribution Date; (iii) third, to principal on the Class A-2 Certificates until their Certificate Balance is reduced to zero, up to the remainder of the Principal Distribution Amount for such Distribution Date; (iv) fourth, to principal on the Class A-4 Certificates until their Certificate Balance is reduced to zero, up to the remainder of the Principal Distribution Amount for such Distribution Date; (v) fifth, to principal on the Class A-5 Certificates until their Certificate Balance is reduced to zero, up to the remainder of the Principal Distribution Amount for such Distribution Date; and (vi) sixth, to principal on the Class A-SB Certificates until their Certificate Balance is reduced to zero, up to the remainder of the Principal Distribution Amount for such Distribution Date. However, if the Certificate Balance of each and every Class of Principal Balance Certificates, other than the Class A-1, A-2, A-SB, A-4 and A-5 Certificates, has been reduced to zero as a result of the allocation of Mortgage Loan losses and expenses and any of the Class A-1, A-2, A-SB, A-4 and A-5 Certificates remains outstanding, then the Principal Distribution Amount will be distributed to the Class A-1, A-2, A-SB, A-4 and A-5 Certificates, pro rata, based on their respective outstanding Certificate Balances, until their Certificate Balances have been reduced to zero. | |
3. Class A-1, A-2, A-SB, A-4 and A-5 Certificates: To reimburse the holders of the Class A-1, A-2, A-SB, A-4 and A-5 Certificates, pro rata, on the basis of previously allocated unreimbursed losses, for any previously unreimbursed losses (plus interest thereon) on the mortgage loans that were previously allocated in reduction of the Certificate Balances of such Classes. | |
4. Class A-S Certificates: To make distributions on the Class A-S Certificates as follows: (a) first, to interest on the Class A-S Certificates in the amount of the interest entitlement for that Class; (b) next, to the extent of the portion of the Principal Distribution Amount remaining after distributions in respect of principal to each Class with a higher distribution priority (in this case, the Class A-1, A-2, A-SB, A-4 and A-5 Certificates), to principal on the Class A-S Certificates until their Certificate Balance is reduced to zero; and (c) next, to reimburse the holders of the Class A-S Certificates for any previously unreimbursed losses (plus interest thereon) on the mortgage loans that were previously allocated to that Class in reduction of their Certificate Balance. 5. Class B Certificates: To make distributions on the Class B Certificates as follows: (a) first, to interest on the Class B Certificates in the amount of the interest entitlement for that Class; (b) next, to the extent of the portion of the Principal Distribution Amount remaining after distributions in respect of principal to each Class with a higher distribution priority (in this case, the Class A-1, A-2, A-SB, A-4, A-5 and A-S Certificates), to principal on the Class B Certificates until their Certificate Balance is reduced to zero; and (c) next, to reimburse the holders of the Class B Certificates for any previously unreimbursed losses (plus interest thereon) on the mortgage loans that were previously allocated to that Class in reduction of their Certificate Balance. 6. Class C Certificates: To make distributions on the Class C Certificates as follows: (a) first, to interest on the Class C Certificates in the amount of the interest entitlement for that Class; (b) next, to the extent of the portion of the Principal Distribution Amount remaining after distributions in respect of principal to each Class with a higher distribution priority (in this case, the Class A-1, A-2, A-SB, A-4, A-5, A-S and B Certificates), to principal on the Class C Certificates until their Certificate Balance is reduced to zero; and (c) next, to reimburse the holders of the Class C Certificates for any previously unreimbursed losses (plus interest thereon) on the mortgage loans that were previously allocated to that Class in reduction of their Certificate Balance. 7. After the Class A-1, A-2, A-SB, A-4, A-5, A-S, B and C Certificates are paid all amounts to which they are entitled, the remaining funds available for distribution will be used to pay interest, principal and loss reimbursement amounts on the Class D, E, F-RR, G-RR, J-RR and K-RR Certificates sequentially in that order in a manner analogous to the Class C Certificates. | |
| Allocation of Yield Maintenance Charges and Prepayment Premiums: | If any yield maintenance charge or prepayment premium is collected during any particular collection period with respect to any mortgage loan, then on the Distribution Date corresponding to that collection period, the Certificate Administrator will pay that yield maintenance charge or prepayment premium (net of liquidation fees payable therefrom) in the following manner: |
| THE INFORMATION IN THIS STRUCTURAL AND COLLATERAL TERM SHEET IS NOT COMPLETE AND MAY BE AMENDED PRIOR TO THE TIME OF SALE. THIS TERM SHEET IS NOT AN OFFER TO SELL THESE SECURITIES AND IT IS NOT A SOLICITATION OF AN OFFER TO BUY THESE SECURITIES IN ANY JURISDICTION WHERE THE OFFER OR SALE IS NOT PERMITTED. | ||
| 19 | ||
| Wells Fargo Commercial Mortgage Trust 2025-C64 | Certain Terms and Conditions |
(1) to each of the Class A-1, A-2, A-SB, A-4, A-5, A-S, B, C, D and E Certificates, the product of (a) the yield maintenance charge or prepayment premium, (b) the related Base Interest Fraction (as defined in the Preliminary Prospectus) for such class and the applicable principal prepayment, and (c) a fraction, the numerator of which is equal to the amount of principal distributed to such class for that Distribution Date, and the denominator of which is the total amount of principal distributed to the Class A-1, A-2, A-SB, A-4, A-5, A-S, B, C, D, E, F-RR, G-RR, J-RR and K-RR Certificates; (2) to the Class X-A Certificates, the excess, if any, of (a) the product of (i) such yield maintenance charge or prepayment premium and (ii) a fraction, the numerator of which is equal to the total amount of principal distributed to the Class A-1, A-2, A-SB, A-4 and A-5 Certificates and the denominator of which is the total amount of principal distributed to the Class A-1, A-2, A-SB, A-4, A-5, A-S, B, C, D, E, F-RR, G-RR, J-RR and K-RR Certificates over (b) the total amount of such yield maintenance charge or prepayment premium distributed to the Class A-1, A-2, A-SB, A-4 and A-5 Certificates as described above; (3) to the Class X-B Certificates, the excess, if any, of (a) the product of (i) such yield maintenance charge or prepayment premium and (ii) a fraction, the numerator of which is equal to the total amount of principal distributed to the Class A-S, B and C Certificates and the denominator of which is the total amount of principal distributed to the Class A-1, A-2, A-SB, A-4, A-5, A-S, B, C, D, E, F-RR, G-RR, J-RR and K-RR Certificates over (b) the total amount of such yield maintenance charge or prepayment premium distributed to the Class A-S, B and C Certificates as described above; and (4) to the Class X-D Certificates, any remaining portion of such yield maintenance charge or prepayment premium not distributed as described above; provided, however, that after the notional amounts of the Class X-A, X-B and X-D Certificates and the Certificate Balances of the Class A-1, A-2, A-SB, A-4, A-5, A-S, B, C, D and E Certificates have been reduced to zero, all prepayment premiums and yield maintenance charges with respect to the mortgage loans will be allocated among the holders of the Class F-RR, G-RR, J-RR and K-RR Certificates as provided in the WFCM 2025-C64 pooling and servicing agreement. No prepayment premiums or yield maintenance charges will be distributed to the holders of the Class R Certificates. For a description of when prepayment premiums and yield maintenance charges are generally required on the mortgage loans, see Annex A-1 to the Preliminary Prospectus. See also “Risk Factors—Risks Relating to the Mortgage Loans—Risks Relating to Enforceability of Yield Maintenance Charges, Prepayment Premiums or Defeasance Provisions” and “Risk Factors—Other Risks Relating to the Certificates—Your Yield May Be Affected by Defaults, Prepayments and Other Factors” in the Preliminary Prospectus. Prepayment premiums and yield maintenance charges will be distributed on each Distribution Date only to the extent they are actually received on the mortgage loans as of the related Determination Date. | |
| Realized Losses: | The Certificate Balances of the Class A-1, A-2, A-SB, A-4, A-5, A-S, B, C, D, E, F-RR, G-RR, J-RR and K-RR Certificates will be reduced without distribution on any Distribution Date as a write-off to the extent of any losses realized on the mortgage loans allocated to such Class on such Distribution Date. Such losses will be applied in the following order, in each case until the related Certificate Balance is reduced to zero: first, to the Class K-RR Certificates; second, to the Class J-RR Certificates; third, to the Class G-RR Certificates; fourth, to the Class F-RR Certificates; fifth, to the Class E Certificates; sixth, to the Class D Certificates; seventh, to the Class C Certificates; eighth, to the Class B Certificates; ninth, to the Class A-S Certificates; and, finally, pro rata, to the Class A-1, A-2, A-SB, A-4 and A-5 Certificates based on their outstanding Certificate Balances. The Notional Amount of the Class X-A Certificates will be reduced by the amount of all losses that are allocated to the Class A-1, A-2, A-SB, A-4 or A-5 Certificates as write-offs in reduction of their Certificate Balances. The Notional Amount of the Class X-B Certificates will be reduced by the amount of all losses that are allocated to the Class A-S, B or C Certificates as write-offs in reduction of their Certificate Balances. The Notional Amount of the Class X-D Certificates will be reduced by the amount of all losses that are allocated to the Class D or E Certificates as write-offs in reduction of its Certificate Balance. |
| P&I Advances: | The Master Servicer or, if the Master Servicer fails to do so, the Trustee, will be obligated to advance delinquent debt service payments with respect to the mortgage loans it services (other than balloon payments, excess interest and default interest) and assumed debt service payments |
| THE INFORMATION IN THIS STRUCTURAL AND COLLATERAL TERM SHEET IS NOT COMPLETE AND MAY BE AMENDED PRIOR TO THE TIME OF SALE. THIS TERM SHEET IS NOT AN OFFER TO SELL THESE SECURITIES AND IT IS NOT A SOLICITATION OF AN OFFER TO BUY THESE SECURITIES IN ANY JURISDICTION WHERE THE OFFER OR SALE IS NOT PERMITTED. | ||
| 20 | ||
| Wells Fargo Commercial Mortgage Trust 2025-C64 | Certain Terms and Conditions |
on mortgage loans with delinquent balloon payments (excluding any related companion loan), except to the extent any such advance is deemed non-recoverable from collections on the related mortgage loan. In addition, if an Appraisal Reduction Amount exists for a given mortgage loan, the interest portion of any P&I advance for such mortgage loan will be reduced, which will have the effect of reducing the amount of interest available for distribution to the Certificates, which with respect to the Certificates (other than the Class R Certificates) will be applied in reverse alphabetical order of their Class designations (except that interest payments on the Class A-1, A-2, A-SB, A-4, A-5, X-A, X-B and X-D Certificates would be affected on a pari passu basis). The Special Servicer will not be required to make any P&I Advance or any recoverability determination with respect to any P&I Advance. | |
| Servicing Advances: | The Master Servicer or, if the Master Servicer fails to do so, the Trustee, will be obligated to make servicing advances, including the payment of delinquent property taxes, insurance premiums and ground rent, except to the extent that those advances are deemed non-recoverable from collections on the related mortgage loan. The Master Servicer or the Trustee, as applicable, will have the primary obligation to make any required servicing advances with respect to any serviced whole loan. With respect to any non-serviced whole loan, the master servicer or trustee, as applicable, under the related lead securitization servicing agreement will have the primary obligation to make any required servicing advances with respect to such non-serviced whole loan. |
Appraisal Reduction Amounts and Collateral | An “Appraisal Reduction Amount” generally will be created in the amount, if any, by which the principal balance of a required appraisal loan (which is a mortgage loan (other than a non-serviced mortgage loan) with respect to which certain defaults, modifications or insolvency events have occurred as further described in the Preliminary Prospectus) plus other amounts overdue or advanced in connection with such mortgage loan exceeds 90% of the appraised value of the related mortgaged property plus certain escrows and reserves (including letters of credit) held with respect to the mortgage loan. With respect to any serviced whole loan, any Appraisal Reduction Amount will be allocated first to the related subordinate companion loan(s), if any, and then, pro rata, to the related mortgage loan and the related pari passu companion loan(s). With respect to any non-serviced mortgage loan, appraisal reduction amounts are expected to be calculated in a similar manner under the related non-serviced pooling and servicing agreement. A mortgage loan will cease to be a required appraisal loan when the same has ceased to be a specially serviced loan (if applicable), has been brought current for at least three consecutive months and no other circumstances exist that would cause such mortgage loan to be a required appraisal loan. A “Collateral Deficiency Amount” will exist with respect to any mortgage loan that is modified into an AB loan structure and remains a corrected mortgage loan and will generally equal the excess of (i) the stated principal balance of such AB modified loan (taking into account the related junior note(s) and any pari passu notes included therein), over (ii) the sum of (in the case of a whole loan, solely to the extent allocable to the subject mortgage loan) (x) the most recent appraised value of the related mortgaged property plus (y) solely to the extent not reflected or taken into account in such appraised value (or in the calculation of any related Appraisal Reduction Amount) and to the extent on deposit with, or otherwise under the control of, the lender as of the date of such determination, any capital or additional collateral contributed by the related borrower at the time the mortgage loan (and as part of the modification thereto) became an AB modified loan plus (z) any other escrows or reserves (in addition to any amounts set forth in the immediately preceding clause (y) and solely to the extent not reflected or taken into account in the calculation of any related Appraisal Reduction Amount) held by the lender with respect to the mortgage loan as of the date of such determination. A “Cumulative Appraisal Reduction Amount” with respect to any mortgage loan will be the sum of any Appraisal Reduction Amount and any Collateral Deficiency Amount. Appraisal Reduction Amounts will affect the amount of debt service advances in respect of the related mortgage loan. Additionally, Cumulative Appraisal Reduction Amounts will be taken into account in the determination of the identity of the Class whose majority constitutes the “controlling class certificateholder” and is entitled to appoint the directing certificateholder. |
Clean-Up Call and Exchange Termination: | On each Distribution Date occurring after the aggregate unpaid principal balance of the pool of mortgage loans is less than 1.0% of the principal balance of the mortgage loans as of the cut-off date, certain specified persons will have the option to purchase all of the remaining mortgage loans (and the trust’s interest in all property acquired through exercise of remedies in respect of any mortgage loan) at the price specified in the Preliminary Prospectus. Exercise of the option will terminate the trust and retire the then-outstanding Certificates. If the aggregate Certificate Balances of each of the Class A-1, A-2, A-SB, A-4, A-5, A-S, B, C, D and E Certificates have been reduced to zero, the trust may also be terminated in connection with an exchange of all the then-outstanding Certificates (other than the Class R Certificates) for the |
| THE INFORMATION IN THIS STRUCTURAL AND COLLATERAL TERM SHEET IS NOT COMPLETE AND MAY BE AMENDED PRIOR TO THE TIME OF SALE. THIS TERM SHEET IS NOT AN OFFER TO SELL THESE SECURITIES AND IT IS NOT A SOLICITATION OF AN OFFER TO BUY THESE SECURITIES IN ANY JURISDICTION WHERE THE OFFER OR SALE IS NOT PERMITTED. | ||
| 21 | ||
| Wells Fargo Commercial Mortgage Trust 2025-C64 | Certain Terms and Conditions |
mortgage loans and REO properties then remaining in the issuing entity, subject to payment of a price specified in the Preliminary Prospectus, but all of the holders of those outstanding Classes of Certificates (other than the Class R Certificates) would have to voluntarily participate in the exchange. | |
| Liquidation Loan Waterfall: | Following the liquidation of any mortgage loan or mortgaged property, the net liquidation proceeds generally will be applied (after reimbursement of advances and certain trust fund expenses), first, as a recovery of accrued interest, other than delinquent interest that was not advanced as a result of Appraisal Reduction Amounts, second, as a recovery of principal until all principal has been recovered, and then as a recovery of delinquent interest that was not advanced as a result of Appraisal Reduction Amounts. Please see “Description of the Certificates—Distributions—Application Priority of Mortgage Loan Collections or Whole Loan Collections” in the Preliminary Prospectus. |
| Control Eligible Certificates: | The Class J-RR and K-RR Certificates. |
| Directing Certificateholder/ Controlling Class: | A directing certificateholder may be appointed by the “controlling class certificateholder”, which will be the holder(s) of a majority of the Controlling Class. The “Controlling Class” will be, as of any time of determination, the most subordinate Class of Control Eligible Certificates then-outstanding that has an aggregate Certificate Balance (as notionally reduced by any Cumulative Appraisal Reduction Amounts allocable to such Class) at least equal to 25% of the initial Certificate Balance of that Class; provided, however, that if at any time the Certificate Balances of the Certificates other than the Control Eligible Certificates have been reduced to zero as a result of principal payments on the Mortgage Loans, then the Controlling Class will be the most subordinate Class of Control Eligible Certificates that has a Certificate Balance greater than zero without regard to any Cumulative Appraisal Reduction Amounts. The Controlling Class as of the Closing Date will be the Class K-RR Certificates. |
| Control and Consultation/ Replacement of Special Servicer by Directing Certificateholder: | The rights of various parties to replace the Special Servicer and approve or consult with respect to major actions of the Special Servicer will vary according to defined periods. A “Control Termination Event” will occur when the Class J-RR Certificates have a Certificate Balance (taking into account the application of any Cumulative Appraisal Reduction Amounts to notionally reduce the Certificate Balance of such Class) of less than 25% of the initial Certificate Balance of that Class; provided, that a Control Termination Event will not be deemed continuing in the event that the Certificate Balances of the Certificates other than the Control Eligible Certificates have been reduced to zero as a result of principal payments on the Mortgage Loans. A “Consultation Termination Event” will occur when there is no Class of Control Eligible Certificates that has a then-outstanding Certificate Balance at least equal to 25% of the initial Certificate Balance of that Class, in each case, without regard to the application of any Cumulative Appraisal Reduction Amounts; provided, however, that a Consultation Termination Event will not be deemed continuing in the event that the Certificate Balances of the Certificates other than the Control Eligible Certificates have been reduced to zero as a result of principal payments on the Mortgage Loans. If no Control Termination Event has occurred and is continuing, except with respect to the Excluded Loans (as defined below) with respect to the directing certificateholder (i) the directing certificateholder will be entitled to grant or withhold approval of asset status reports prepared, and material servicing actions proposed, by the Special Servicer, and (ii) the directing certificateholder will be entitled to terminate and replace the Special Servicer with or without cause, and appoint itself or another person as the successor special servicer. It will be a condition to such appointment that Fitch, KBRA and Moody’s (and any rating agency rating any securities backed by any pari passu companion loan(s) serviced under this transaction) confirm that the appointment would not result in a qualification, downgrade or withdrawal of any of their then-current ratings of Certificates (and any certificates backed by any pari passu companion loan(s) serviced under this transaction). If a Control Termination Event has occurred and is continuing but no Consultation Termination Event has occurred and is continuing, the Special Servicer will be required to consult with the directing certificateholder (other than with respect to Excluded Loans as to such party) and the Operating Advisor in connection with asset status reports and material special servicing actions. If a Consultation Termination Event has occurred and is continuing, the Special Servicer must seek to consult with the Operating Advisor in connection with asset status reports and material special servicing actions, and, in general, no directing certificateholder will be recognized or have any right to terminate the Special Servicer or approve, direct or consult with respect to servicing matters. With respect to each serviced whole loan, the rights of the directing certificateholder described above will be subject to the consultation rights of the holders of the related pari passu companion |
| THE INFORMATION IN THIS STRUCTURAL AND COLLATERAL TERM SHEET IS NOT COMPLETE AND MAY BE AMENDED PRIOR TO THE TIME OF SALE. THIS TERM SHEET IS NOT AN OFFER TO SELL THESE SECURITIES AND IT IS NOT A SOLICITATION OF AN OFFER TO BUY THESE SECURITIES IN ANY JURISDICTION WHERE THE OFFER OR SALE IS NOT PERMITTED. | ||
| 22 | ||
| Wells Fargo Commercial Mortgage Trust 2025-C64 | Certain Terms and Conditions |
loans. Those consultation rights will generally extend to asset status reports and material special servicing actions involving the related whole loan, will be as set forth in the related intercreditor agreement, and will be in addition to the rights of the directing certificateholder in this transaction described above. With respect to each non-serviced whole loan, the applicable servicing agreement for the related controlling pari passu companion loan(s) generally grants (or will grant) the directing certificateholder under the related securitization (or, in some cases, a controlling companion loan holder) control rights that may include the right to approve or disapprove various material servicing actions involving the related whole loan. The directing certificateholder for this securitization (so long as no Consultation Termination Event has occurred and is occurring) generally will nonetheless have the right to be consulted on a non-binding basis with respect to such actions. For purposes of the servicing of any such whole loan contemplated by this paragraph, the occurrence and continuance of a Control Termination Event or Consultation Termination Event under this securitization will not limit the control or other rights of the directing certificateholder (or equivalent) under the securitization of the related controlling pari passu companion loan(s). The control rights and consent and consultation rights described in the preceding paragraphs are subject to various limitations, conditions and exceptions as described in the Preliminary Prospectus. Notwithstanding any contrary description set forth above, in the event that, with respect to any mortgage loan, the controlling class certificateholder or the directing certificateholder is a Borrower Party, the controlling class certificateholder and the directing certificateholder will have no right to receive asset status reports or such other information as may be specified in the WFCM 2025-C64 pooling and servicing agreement, to grant or withhold approval of, or consult with respect to, asset status reports prepared, and material servicing actions proposed, by the Special Servicer, with respect to such mortgage loan, and such mortgage loan will be referred to as an “Excluded Loan” as to such party. In addition, notwithstanding any contrary description set forth above, in the event that, with respect to any mortgage loan, a controlling class certificateholder is a Borrower Party, such controlling class certificateholder will have no right to receive asset status reports or such other information as may be specified in the WFCM 2025-C64 pooling and servicing agreement with respect to such mortgage loan. “Borrower Party” means a borrower, a mortgagor or a manager of a mortgaged property, an Accelerated Mezzanine Loan Lender, or any Borrower Party Affiliate. “Accelerated Mezzanine Loan Lender” means a mezzanine lender under a mezzanine loan that has been accelerated or as to which foreclosure or enforcement proceedings have been commenced against the equity collateral pledged to secure such mezzanine loan. “Borrower Party Affiliate” means, with respect to a borrower, a mortgagor, a manager of a Mortgaged Property or an Accelerated Mezzanine Loan Lender, (x) any other person controlling or controlled by or under common control with such borrower, mortgagor, manager or Accelerated Mezzanine Loan Lender, as applicable, or (y) any other person owning, directly or indirectly, 25% or more of the beneficial interests in such borrower, mortgagor, manager or Accelerated Mezzanine Loan Lender. With respect to a mortgage loan secured by a residential cooperative property, a person will not be considered a “Borrower Party” solely by reason of such person holding one or more cooperative unit loans that are secured by direct equity interests in the related borrower or owning one or more residential cooperative units comprising the related mortgaged property as a result of any foreclosure, transfer in lieu of foreclosure or other exercise of remedies with respect to any such unit loan(s). | |
| Replacement of Special Servicer: | If a Control Termination Event has occurred and is continuing, the Special Servicer may be removed and replaced without cause upon the affirmative direction of certificate owners holding not less than 66-2/3% of a certificateholder quorum, following a proposal from certificate owners holding not less than 25% of the appraisal-reduced voting rights of all Principal Balance Certificates. The certificateholders who initiate a vote on a termination and replacement of the Special Servicer without cause must cause Fitch, KBRA and Moody’s to confirm the then-current ratings of the Certificates (or decline to review the matter) and cause the payment of the fees and expenses incurred in the replacement. If no Control Termination Event has occurred and is continuing, the Special Servicer may be replaced by the directing certificateholder, subject to Fitch, KBRA and Moody’s (and any rating agency rating any securities backed by any pari passu companion loan(s) serviced under this transaction) confirming the then-current ratings of the Certificates (and any certificates backed by any pari passu companion loans serviced under this transaction) or declining to review the matter. In addition, if at any time the Operating Advisor determines, in its sole discretion exercised in good faith, that (i) the Special Servicer is not performing its duties as required under the pooling and servicing agreement in accordance with the Servicing Standard and (ii) the replacement of |
| THE INFORMATION IN THIS STRUCTURAL AND COLLATERAL TERM SHEET IS NOT COMPLETE AND MAY BE AMENDED PRIOR TO THE TIME OF SALE. THIS TERM SHEET IS NOT AN OFFER TO SELL THESE SECURITIES AND IT IS NOT A SOLICITATION OF AN OFFER TO BUY THESE SECURITIES IN ANY JURISDICTION WHERE THE OFFER OR SALE IS NOT PERMITTED. | ||
| 23 | ||
| Wells Fargo Commercial Mortgage Trust 2025-C64 | Certain Terms and Conditions |
the Special Servicer would be in the best interest of the certificateholders as a collective whole, then the Operating Advisor will have the right to recommend the replacement of the Special Servicer and will submit its formal recommendation to the Trustee and the Certificate Administrator (along with its rationale, its proposed replacement special servicer and other relevant information justifying its recommendation). The Operating Advisor’s recommendation to replace the Special Servicer must be confirmed by an affirmative vote of holders of Principal Balance Certificates whose holders voted on the matter, provided that the holders of Principal Balance Certificates that so voted on the matter (i) hold Principal Balance Certificates representing at least 20% of the outstanding Certificate Principal Balance of all Principal Balance Certificates on an aggregate basis and (ii) consist of at least three certificateholders or certificate owners that are not “risk retention affiliated” with each other. | |
| In the event the holders of Principal Balance Certificates evidencing at least a majority of a quorum of certificateholders elect to remove and replace the Special Servicer (which requisite affirmative votes must be received within 180 days of the posting of the notice of the Operating Advisor’s recommendation to replace the Special Servicer to the Certificate Administrator’s website), the Certificate Administrator will be required to receive a Rating Agency Confirmation from each of the Rating Agencies at that time, and confirmation from the applicable rating agencies that such replacement will not result in the downgrade, withdrawal or qualification of the then-current ratings of any class of any related serviced pari passu companion loan securities. | |
| Excluded Special Servicer: | In the event that, with respect to any mortgage loan, the Special Servicer is a Borrower Party, the Special Servicer will be required to resign as special servicer of such mortgage loan (referred to as an “excluded special servicer loan”). If no Control Termination Event has occurred and is continuing, the directing certificateholder will be entitled to appoint (and may replace with or without cause) a separate special servicer that is not a Borrower Party (referred to as an “excluded special servicer”) with respect to such excluded special servicer loan unless such excluded special servicer loan is also an excluded loan. Otherwise, upon resignation of the Special Servicer with respect to an excluded special servicer loan, the resigning Special Servicer will be required to use reasonable efforts to appoint the excluded special servicer. |
| Appraisal Remedy: | If the Class of Certificates comprising the Controlling Class loses its status as Controlling Class because of the application of an Appraisal Reduction Amount or Collateral Deficiency Amount, the holders of a majority of the voting rights of such Class may require the Special Servicer to order a second appraisal for any mortgage loan in respect of which an Appraisal Reduction Amount or Collateral Deficiency Amount has been applied. The Special Servicer must thereafter determine whether, based on its assessment of such second appraisal, any recalculation of the Appraisal Reduction Amount or Collateral Deficiency Amount is warranted, and if so warranted, the Special Servicer will recalculate such Appraisal Reduction Amount or Collateral Deficiency Amount. Such Class will not be able to exercise any direction, control, consent and/or similar rights of the Controlling Class unless and until reinstated as the Controlling Class through such determination; and pending such determination, the rights of the Controlling Class will be exercised by the Control Eligible Certificates, if any, that would be the Controlling Class taking into account the subject appraisal reduction amount. |
| Sale of Defaulted Assets: | There will be no “fair value” purchase option. Instead, the WFCM 2025-C64 pooling and servicing agreement will authorize the Special Servicer to sell defaulted mortgage loans serviced by the Special Servicer to the highest bidder in a manner generally similar to sales of REO properties. The sale of a defaulted loan (other than a non-serviced whole loan) for less than par plus accrued interest and certain other fees and expenses owed on the loan will be subject to consent or consultation rights of the directing certificateholder and/or Operating Advisor, as described in the Preliminary Prospectus. Generally speaking, the holder of a pari passu companion loan will have consent and/or consultation rights, as described in the Preliminary Prospectus. If the subject whole loan includes one or more subordinate companion loans, those subordinate companion loans may be included in such sale as well. With respect to each serviced whole loan, if such whole loan becomes a defaulted loan under the WFCM 2025-C64 pooling and servicing agreement, the Special Servicer will generally be required to sell both the mortgage loan and the related pari passu companion loan(s) as a single whole loan. If the subject whole loan includes one or more subordinate companion loans, those subordinate companion loans may be included in such sale as well. With respect to each non-serviced whole loan, the applicable servicing agreement governing the servicing of such whole loan generally will provide that, if the related pari passu companion loan(s) serviced under such agreement become a defaulted loan under such servicing agreement, then the related special servicer may offer to sell to any person (or may offer to purchase) for cash such whole loan during such time as such applicable pari passu companion loan(s) constitutes a defaulted loan under such servicing agreement. Generally speaking, in connection with any such sale, the related special servicer is required to sell both the mortgage loan and the |
| THE INFORMATION IN THIS STRUCTURAL AND COLLATERAL TERM SHEET IS NOT COMPLETE AND MAY BE AMENDED PRIOR TO THE TIME OF SALE. THIS TERM SHEET IS NOT AN OFFER TO SELL THESE SECURITIES AND IT IS NOT A SOLICITATION OF AN OFFER TO BUY THESE SECURITIES IN ANY JURISDICTION WHERE THE OFFER OR SALE IS NOT PERMITTED. | ||
| 24 | ||
| Wells Fargo Commercial Mortgage Trust 2025-C64 | Certain Terms and Conditions |
related pari passu companion loan(s) as a whole loan. The directing certificateholder for this securitization generally will have consent and/or consultation rights as the holder of an interest in the related mortgage loan, as described in the Preliminary Prospectus. If the subject whole loan includes one or more subordinate companion loans, those subordinate companion loans may be included in such sale as well. The procedures for the sale of any whole loan that becomes a defaulted whole loan, and any associated consultation rights, are subject to various limitations, conditions and exceptions as described in the Preliminary Prospectus. | |
| “As-Is” Appraisals: | Appraisals must be conducted on an “as-is” basis, and must be no more than 12 months old, for purposes of determining Appraisal Reduction Amounts and market value in connection with REO sales. Required appraisals may consist of updates of prior appraisals. Internal valuations by the Special Servicer are permitted if the principal balance of a mortgage loan is less than $2,000,000. |
| Operating Advisor: | The Operating Advisor will have certain review and consultation rights relating to the performance of the Special Servicer and with respect to its actions taken in connection with the resolution and/or liquidation of specially serviced loans. With respect to each mortgage loan (other than a non-serviced mortgage loan) or serviced whole loan, the Operating Advisor will be responsible for: ● reviewing the actions of the Special Servicer with respect to any specially serviced loan; ● reviewing (i) all reports by the Special Servicer made available to Privileged Persons on the Certificate Administrator’s website that are relevant to the Operating Advisor’s obligations under the pooling and servicing agreement and (ii) each Asset Status Report (as defined in the Preliminary Prospectus) (after the occurrence and during the continuance of an Operating Advisor Consultation Event (as defined below)) and Final Asset Status Report (as defined in the Preliminary Prospectus); ● recalculating and reviewing for accuracy and consistency with the WFCM 2025-C64 pooling and servicing agreement the mathematical calculations by the Special Servicer and the corresponding application of the non-discretionary portion of the applicable formulas required to be utilized in connection with Appraisal Reduction Amounts, Collateral Deficiency Amounts and net present value calculations used in the Special Servicer’s determination of what course of action to take in connection with the workout or liquidation of a specially serviced loan; and |
● preparing an annual report (if any mortgage loan (other than any non-serviced mortgage loan) or serviced whole loan was a specially serviced loan at any time during the prior calendar year or an Operating Advisor Consultation Event (as defined below) occurred during the prior calendar year) that sets forth whether the Operating Advisor believes, in its sole discretion exercised in good faith, that the Special Servicer is operating in compliance with the Servicing Standard with respect to its performance of its duties under the pooling and servicing agreement with respect to specially serviced loans (and, after the occurrence and continuance of an Operating Advisor Consultation Event (as defined below), with respect to major decisions on non-specially serviced loans) during the prior calendar year on a “asset-level basis”. The Operating Advisor will identify (1) which, if any, standards the Operating Advisor believes, in its sole discretion exercised in good faith, the Special Servicer has failed to comply with and (2) any material deviations from the Special Servicer’s obligations under the pooling and servicing agreement with respect to the resolution or liquidation of any specially serviced loan or REO property (other than with respect to any REO property related to any non-serviced mortgage loan). In preparing any Operating Advisor Annual Report (as defined in the Preliminary Prospectus), the Operating Advisor will not be required to report on instances of non-compliance with, or deviations from, the Servicing Standard or the Special Servicer’s obligations under the pooling and servicing agreement that the Operating Advisor determines, in its sole discretion exercised in good faith, to be immaterial. With respect to each mortgage loan (other than any non-serviced mortgage loan) or serviced whole loan, after the Operating Advisor has received notice that an Operating Advisor Consultation Event (as defined below) has occurred and is continuing, in addition to the duties described above, the Operating Advisor will be required to perform the following additional duties: ● to consult (on a non-binding basis) with the Special Servicer in respect of asset status reports and ● to consult (on a non-binding basis) with the Special Servicer with respect to “major decisions” processed by the Special Servicer. |
| THE INFORMATION IN THIS STRUCTURAL AND COLLATERAL TERM SHEET IS NOT COMPLETE AND MAY BE AMENDED PRIOR TO THE TIME OF SALE. THIS TERM SHEET IS NOT AN OFFER TO SELL THESE SECURITIES AND IT IS NOT A SOLICITATION OF AN OFFER TO BUY THESE SECURITIES IN ANY JURISDICTION WHERE THE OFFER OR SALE IS NOT PERMITTED. | ||
| 25 | ||
| Wells Fargo Commercial Mortgage Trust 2025-C64 | Certain Terms and Conditions |
An “Operating Advisor Consultation Event” will occur when the Certificate Balances of the Class F-RR, G-RR, J-RR and K-RR Certificates in the aggregate (taking into account the application of any Cumulative Appraisal Reduction Amounts to notionally reduce the Certificate Balances of such Classes) is 25% or less of the initial Certificate Balances of such Classes in the aggregate. | |
| Asset Representations Reviewer: | The Asset Representations Reviewer will be required to review certain delinquent mortgage loans after a specified delinquency threshold has been exceeded (an “Asset Review Trigger”) and the required percentage of certificateholders vote to direct a review of such delinquent loans. An Asset Review Trigger will occur when either (1) mortgage loans with an aggregate outstanding principal balance of 25.0% or more of the aggregate outstanding principal balance of all of the mortgage loans (including any REO loans (or a portion of any REO loan in the case of a whole loan)) held by the issuing entity as of the end of the applicable collection period are delinquent loans or (2)(A) prior to and including the second anniversary of the Closing Date, at least 10 mortgage loans are delinquent loans as of the end of the applicable collection period and the outstanding principal balance of such delinquent loans in the aggregate constitutes at least 15.0% of the aggregate outstanding principal balance of all of the mortgage loans (including any REO loans (or a portion of any REO loan in the case of a whole loan)) held by the issuing entity as of the end of the applicable collection period, or (B) after the second anniversary of the Closing Date, at least 15 mortgage loans are delinquent loans as of the end of the applicable collection period and the outstanding principal balance of such delinquent loans in the aggregate constitutes at least 20.0% of the aggregate outstanding principal balance of all of the mortgage loans (including any REO loans (or a portion of any REO loan in the case of a whole loan)) held by the issuing entity as of the end of the applicable collection period. See “Pooling and Servicing Agreement—The Asset Representations Reviewer—Asset Review” in the Preliminary Prospectus. The Asset Representations Reviewer may be terminated and replaced without cause. Upon (i) the written direction of certificateholders evidencing not less than 25% of the voting rights (without regard to the application of any Cumulative Appraisal Reduction Amounts) requesting a vote to terminate and replace the Asset Representations Reviewer with a proposed successor Asset Representations Reviewer that is an eligible asset representations reviewer, and (ii) payment by such holders to the Certificate Administrator of the reasonable fees and expenses to be incurred by the Certificate Administrator in connection with administering such vote, the Certificate Administrator will promptly provide notice to all certificateholders and the Asset Representations Reviewer of such request by posting such notice on its internet website, and by mailing such notice to all certificateholders and the Asset Representations Reviewer. Upon the written direction of certificateholders evidencing at least 75% of a certificateholder quorum (without regard to the application of any Cumulative Appraisal Reduction Amounts), the Trustee will terminate all of the rights and obligations of the Asset Representations Reviewer under the WFCM 2025-C64 pooling and servicing agreement by written notice to the Asset Representations Reviewer, and the proposed successor Asset Representations Reviewer will be appointed. See “Pooling and Servicing Agreement—The Asset Representations Reviewer” in the Preliminary Prospectus. |
| Dispute Resolution Provisions: | The mortgage loan sellers will be subject to the dispute resolution provisions set forth in the WFCM 2025-C64 pooling and servicing agreement to the extent those provisions are triggered with respect to any mortgage loan sold to the depositor by a mortgage loan seller and such mortgage loan seller will be obligated under the related mortgage loan purchase agreement to comply with all applicable provisions and to take part in any mediation or arbitration proceedings that may result. Generally, in the event that a Repurchase Request (as defined in the Preliminary Prospectus) is not “Resolved” (as defined below) within 180 days after the related mortgage loan seller receives such Repurchase Request, then the enforcing servicer will be required to send a notice to the “Initial Requesting Certificateholder” (if any) and the Certificate Administrator indicating the enforcing servicer’s intended course of action with respect to the Repurchase Request. If (a) the enforcing servicer’s intended course of action with respect to the Repurchase Request does not involve pursuing further action to exercise rights against the related mortgage loan seller with respect to the Repurchase Request and the Initial Requesting Certificateholder, if any, or any other certificateholder or certificate owner wishes to exercise its right to refer the matter to mediation (including non-binding arbitration) or arbitration, or (b) the enforcing servicer’s intended course of action is to pursue further action to exercise rights against the related mortgage loan seller with respect to the Repurchase Request but the Initial Requesting Certificateholder, if any, or any other certificateholder or certificate owner does not agree with the dispute resolution method selected by the enforcing servicer, then the Initial Requesting Certificateholder, if any, or such other certificateholder or certificate owner may deliver a written notice to the Special Servicer indicating its intent to exercise its right to refer the matter to either mediation or arbitration. “Resolved” means, with respect to a Repurchase Request, (i) that the related Material Defect has been cured, (ii) the related mortgage loan has been repurchased in accordance with the related |
| THE INFORMATION IN THIS STRUCTURAL AND COLLATERAL TERM SHEET IS NOT COMPLETE AND MAY BE AMENDED PRIOR TO THE TIME OF SALE. THIS TERM SHEET IS NOT AN OFFER TO SELL THESE SECURITIES AND IT IS NOT A SOLICITATION OF AN OFFER TO BUY THESE SECURITIES IN ANY JURISDICTION WHERE THE OFFER OR SALE IS NOT PERMITTED. | ||
| 26 | ||
| Wells Fargo Commercial Mortgage Trust 2025-C64 | Certain Terms and Conditions |
mortgage loan purchase agreement, (iii) a mortgage loan has been substituted for the related mortgage loan in accordance with the related mortgage loan purchase agreement, (iv) the applicable mortgage loan seller has made a Loss of Value Payment (as defined in the Preliminary Prospectus), (v) a contractually binding agreement is entered into between the enforcing servicer, on behalf of the issuing entity, and the related mortgage loan seller that settles the related mortgage loan seller’s obligations under the related mortgage loan purchase agreement, or (vi) the related mortgage loan is no longer property of the issuing entity as a result of a sale or other disposition in accordance with the WFCM 2025-C64 pooling and servicing agreement. See “Pooling and Servicing Agreement—Dispute Resolution Provisions” in the Preliminary Prospectus. | |
| Investor Communications: | The Certificate Administrator is required to include on any Form 10–D any request received from a certificateholder to communicate with other certificateholders related to certificateholders exercising their rights under the terms of the WFCM 2025-C64 pooling and servicing agreement. Any certificateholder wishing to communicate with other certificateholders regarding the exercise of its rights under the terms of the WFCM 2025-C64 pooling and servicing agreement will be able to deliver a written request signed by an authorized representative of the requesting investor to the Certificate Administrator. |
| Certain Fee Offsets: | If a workout fee is earned by the Special Servicer following a loan default with respect to any mortgage loan that it services, then certain limitations will apply based on modification fees paid by the borrower. The modification fee generally must not exceed 1% of the principal balance of the loan as modified in any 12-month period. In addition, if the loan re-defaults, any subsequent workout fee on that loan must be reduced by a portion of the modification fees paid by the borrower in the previous 12 months. Likewise, liquidation fees collected in connection with a liquidation or partial liquidation of a mortgage loan must be reduced by a portion of the modification fees paid by the borrower in the previous 12 months. |
| Deal Website: | The Certificate Administrator will be required to maintain a deal website, which will include, among other items: (a) summaries of asset status reports prepared by the Special Servicer, (b) inspection reports, (c) appraisals, (d) various “special notices” described in the Preliminary Prospectus, (e) the “Investor Q&A Forum”, (f) a voluntary “Investor Registry” and (g) the “Risk Retention Special Notices” tab. Investors may access the deal website following execution of a certification and confidentiality agreement. |
| Initial Controlling Class Certificateholder: | It is expected that RREF V – D AIV RR H, LLC or its affiliate will be the initial controlling class certificateholder. |
| Whole Loans: | Each of the mortgaged properties identified above under “IV. Characteristics of the Mortgage Pool—B. Summary of the Whole Loans” secures both a mortgage loan to be included in the trust fund and one or more other mortgage loans that will not be included in the trust fund, each of which will be pari passu or subordinate in right of payment with the mortgage loan included in the trust fund. We refer to each such group of mortgage loans as a “whole loan”. Such “—Summary of the Whole Loans” section includes further information regarding the various notes in each whole loan, the holders of such notes, the lead servicing agreement for each such whole loan, and the applicable master servicer and applicable special servicer under such lead servicing agreement. |
| THE INFORMATION IN THIS STRUCTURAL AND COLLATERAL TERM SHEET IS NOT COMPLETE AND MAY BE AMENDED PRIOR TO THE TIME OF SALE. THIS TERM SHEET IS NOT AN OFFER TO SELL THESE SECURITIES AND IT IS NOT A SOLICITATION OF AN OFFER TO BUY THESE SECURITIES IN ANY JURISDICTION WHERE THE OFFER OR SALE IS NOT PERMITTED. | ||
| 27 | ||
| Hospitality – Full Service | Loan #1 | Cut-off Date Balance: | $81,000,000 | |
| 201 North State Street | TheWit Chicago | Cut-off Date LTV: | 54.4% | |
Chicago, IL 60601
| UW NCF DSCR: | 1.59x | ||
| UW NOI Debt Yield: | 13.5% |
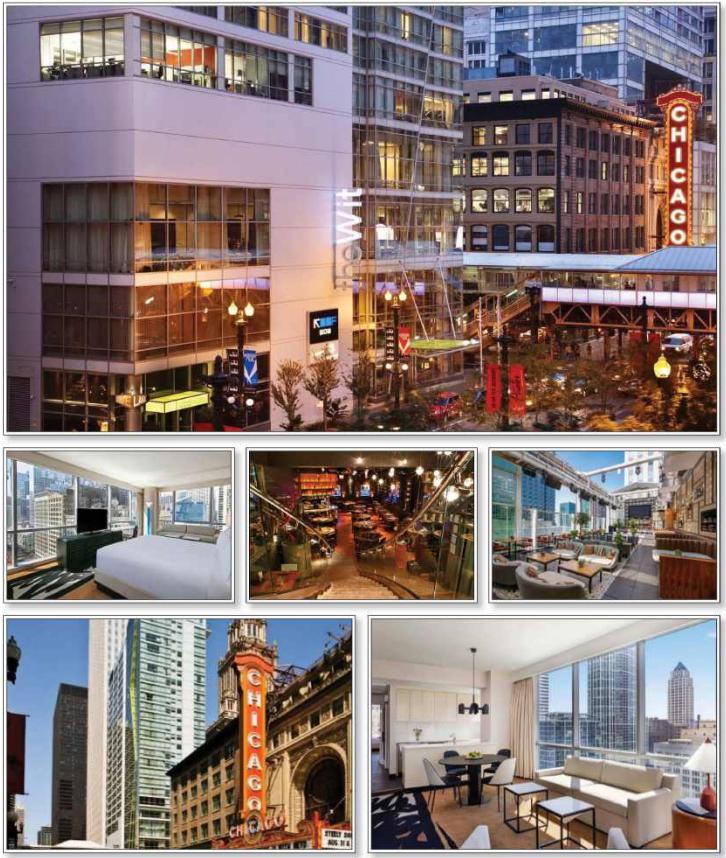
| THE INFORMATION IN THIS STRUCTURAL AND COLLATERAL TERM SHEET IS NOT COMPLETE AND MAY BE AMENDED PRIOR TO THE TIME OF SALE. THIS TERM SHEET IS NOT AN OFFER TO SELL THESE SECURITIES AND IT IS NOT A SOLICITATION OF AN OFFER TO BUY THESE SECURITIES IN ANY JURISDICTION WHERE THE OFFER OR SALE IS NOT PERMITTED. | ||
| 28 | ||
| Hospitality – Full Service | Loan #1 | Cut-off Date Balance: | $81,000,000 | |
| 201 North State Street | TheWit Chicago | Cut-off Date LTV: | 54.4% | |
Chicago, IL 60601
| UW NCF DSCR: | 1.59x | ||
| UW NOI Debt Yield: | 13.5% |
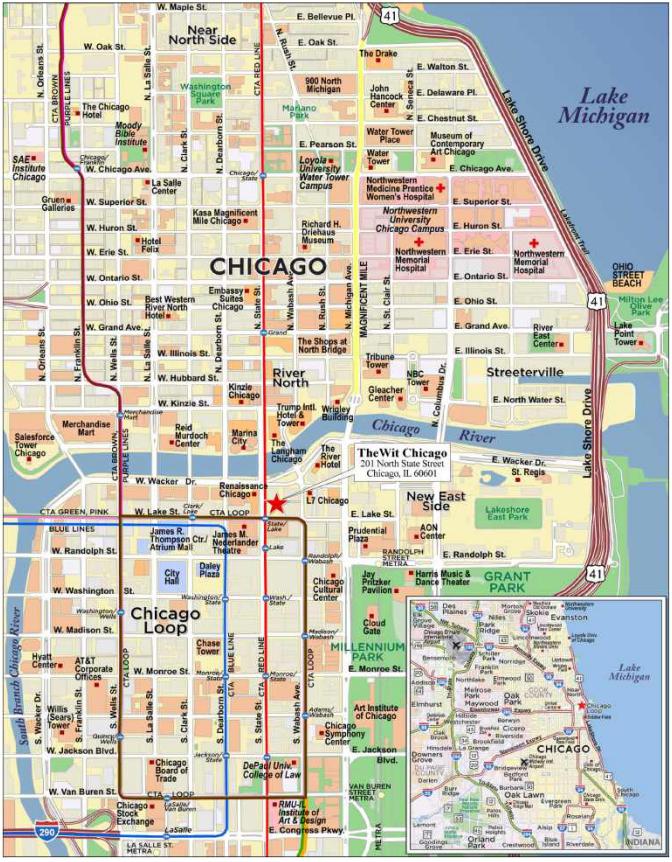
| THE INFORMATION IN THIS STRUCTURAL AND COLLATERAL TERM SHEET IS NOT COMPLETE AND MAY BE AMENDED PRIOR TO THE TIME OF SALE. THIS TERM SHEET IS NOT AN OFFER TO SELL THESE SECURITIES AND IT IS NOT A SOLICITATION OF AN OFFER TO BUY THESE SECURITIES IN ANY JURISDICTION WHERE THE OFFER OR SALE IS NOT PERMITTED. | ||
| 29 | ||
| Mortgage Loan No. 1 – TheWit Chicago |
| Mortgage Loan Information | Property Information | ||||||
| Mortgage Loan Seller: | GSMC | Single Asset/Portfolio: | Single Asset | ||||
| Credit Assessment (Fitch/Moody’s/KBRA): | NR/NR/NR | Location: | Chicago, IL 60601 | ||||
| Original Balance: | $81,000,000 | General Property Type: | Hospitality | ||||
| Cut-off Date Balance: | $81,000,000 | Detailed Property Type: | Full Service | ||||
| % of Initial Pool Balance: | 9.9% | Title Vesting: | Fee | ||||
| Loan Purpose: | Refinance | Year Built/Renovated: | 2009/2019, 2023 | ||||
| Borrower Sponsors: | Scott D. Greenberg, an individual, Scott David Greenberg, as Trustee of Declaration of Trust of Scott David Greenberg dated October 3, 2001 | Size: | 310 rooms | ||||
| Guarantor: | Scott D. Greenberg, an individual, Scott David Greenberg, as Trustee of Declaration of Trust of Scott David Greenberg dated October 3, 2001 | Cut-off Date Balance Per Room: | $261,290 | ||||
| Mortgage Rate: | 7.2690% | Maturity Date Balance Per Room: | $261,290 | ||||
| Note Date: | 12/11/2024 | Property Manager: | Dreamweaver Hotels Inc. – TheWit | ||||
| Maturity Date: | 1/6/2035 | (borrower affiliated) | |||||
| Term to Maturity: | 120 months | ||||||
| Amortization Term: | 0 months | Underwriting and Financial Information | |||||
| IO Period: | 120 months | UW NOI: | $10,932,267 | ||||
| Seasoning: | 1 month | UW NCF: | $9,503,101 | ||||
| Prepayment Provisions: | L(23),YM1(90),O(7) | UW NOI Debt Yield: | 13.5% | ||||
| Lockbox/Cash Mgmt Status: | Hard/Springing | UW NCF Debt Yield: | 11.7% | ||||
| Additional Debt Type: | NAP | UW NOI Debt Yield at Maturity: | 13.5% | ||||
| Additional Debt Balance: | NAP | UW NCF DSCR: | 1.59x | ||||
| Future Debt Permitted (Type): | No (NAP) | Most Recent NOI: | $11,430,385 (12/31/2024) | ||||
| 2nd Most Recent NOI: | $6,528,974 (12/31/2023) | ||||||
| Reserves(1) | 3rd Most Recent NOI: | $9,731,261 (12/31/2022) | |||||
| Type | Initial | Monthly | Cap | Most Recent Occupancy: | 69.8% (12/31/2024) | ||
| Taxes: | $572,275 | $206,202 | NAP | 2nd Most Recent Occupancy: | 60.0% (12/31/2023) | ||
| Insurance: | $0 | Springing | NAP | 3rd Most Recent Occupancy: | 65.7% (12/31/2022) | ||
| Replacement Reserves: | $0 | $118,052 | NAP | Appraised Value (as of): | $149,000,000 (10/3/2024) | ||
| FF&E Reserve: | $0 | $0 | NAP | Appraised Value Per Room: | $480,645 | ||
| PIP Reserve: | $192,500 | $0 | NAP | Cut-off Date LTV Ratio: | 54.4% | ||
| Maturity Date LTV Ratio: | 54.4% | ||||||
| Sources and Uses | ||||||
| Sources | Proceeds | % of Total | Uses | Proceeds | % of Total | |
| Mortgage Loan | $81,000,000 | 98.6% | Loan Payoff | $80,721,571 | 98.3% | |
| Principal Cash Contribution | $1,155,066 | 1.4% | Upfront Reserves | $764,775 | 0.9% | |
| Closing Costs | $668,720 | 0.8% | ||||
| Total Sources | $82,155,066 | 100.0% | Total Uses | $82,155,066 | 100.0% | |
| (1) | See “Escrows” below for further discussion of reserve information. |
The Mortgage Loan. The largest mortgage loan (“TheWit Chicago Mortgage Loan”) is evidenced by a single promissory note issued by ECD-Great Street DE, LLC in the original principal amount of $81,000,000 and secured by the borrower’s fee simple interest in a 310-room full-service hotel located in Chicago, Illinois (“TheWit Chicago Property”). TheWit Chicago Mortgage Loan has a 10-year interest-only term and accrues interest a rate of 7.2690% per annum on an Actual/360 basis.
| THE INFORMATION IN THIS STRUCTURAL AND COLLATERAL TERM SHEET IS NOT COMPLETE AND MAY BE AMENDED PRIOR TO THE TIME OF SALE. THIS TERM SHEET IS NOT AN OFFER TO SELL THESE SECURITIES AND IT IS NOT A SOLICITATION OF AN OFFER TO BUY THESE SECURITIES IN ANY JURISDICTION WHERE THE OFFER OR SALE IS NOT PERMITTED. | ||
| 30 | ||
| Hospitality – Full Service | Loan #1 | Cut-off Date Balance: | $81,000,000 | |
| 201 North State Street | TheWit Chicago | Cut-off Date LTV: | 54.4% | |
Chicago, IL 60601
| UW NCF DSCR: | 1.59x | ||
| UW NOI Debt Yield: | 13.5% |
The Borrower and the Borrower Sponsor. The borrower is ECD-Great Street DE, LLC, a Delaware limited liability company and special purpose entity with two independent directors in its organizational structure. Legal counsel to the borrower delivered a non-consolidation opinion in connection with the origination of TheWit Chicago Mortgage Loan. The borrower sponsors and non-recourse carveout guarantors are Scott D. Greenberg, an individual, Scott David Greenberg, as Trustee of Declaration of Trust of Scott David Greenberg dated October 3, 2001.
The Property. TheWit Chicago Property is a 310-room full-service hotel located on the northeast corner of North State Street and East Lake Street in Downtown Chicago. The hotel commenced operations in May 2009 and was originally affiliated with the Doubletree by Hilton flag. Between 2019 and 2023, TheWit Chicago Property underwent a renovation to an upscale/luxury hotel. Today, the property spans 27 floors and offers multiple food and beverage operations (State & Lake Chicago Tavern and ROOF on TheWit), as well as an on-site spa, fitness center, business center, valet parking services and 11,934 SF of meeting and event space, exclusive of the 4,917 SF rooftop indoor/outdoor venue.
The Market. TheWit Chicago Property is located in the Chicago CBD hotel submarket. According to a third party report, as of January 2025, submarket occupancy is 67.5% and submarket ADR is $239.67.
The following table presents the Competitive Properties of the TheWit Chicago Property:
| Competitive Properties(1) | ||||||
| Property | Year Built | # of Rooms | % Commercial | % Meeting & Group | % Leisure | Total Meeting Space |
| TheWit Chicago | 2009 | 310 | 40.00% | 15.00% | 45.00% | 11,934 |
| The Allegro Royal Sonesta Hotel Chicago Loop | 1927 | 483 | 35.00% | 20.00% | 45.00% | 14,000 |
| Westin Chicago River North | 1987 | 445 | 35.00% | 35.00% | 30.00% | 29,294 |
| Renaissance Chicago Downtown Hotel | 1991 | 560 | 40.00% | 40.00% | 20.00% | 41,572 |
| Luxury Collection The Gwen Chicago | 2001 | 311 | 35.00% | 25.00% | 40.00% | 15,000 |
| Hyatt Centric The Loop Chicago | 2015 | 257 | 40.00% | 15.00% | 45.00% | 2,500 |
| LondonHouse Chicago, Curio Collection | 2016 | 452 | 35.00% | 25.00% | 40.00% | 25,000 |
| Total/Averages | 2,818 | 37.00% | 27.00% | 36.00% | 139,300 | |
| (1) | Source: Appraisal. |
Appraisal. According to the appraisal, TheWit Chicago Property had an “as-is” appraised value of $149,000,000 as of October 3, 2024.
Environmental Matters. According to the Phase I environmental report dated October 11, 2024, there was no evidence of any recognized environmental condition at the TheWit Chicago Property.
| THE INFORMATION IN THIS STRUCTURAL AND COLLATERAL TERM SHEET IS NOT COMPLETE AND MAY BE AMENDED PRIOR TO THE TIME OF SALE. THIS TERM SHEET IS NOT AN OFFER TO SELL THESE SECURITIES AND IT IS NOT A SOLICITATION OF AN OFFER TO BUY THESE SECURITIES IN ANY JURISDICTION WHERE THE OFFER OR SALE IS NOT PERMITTED. | ||
| 31 | ||
| Hospitality – Full Service | Loan #1 | Cut-off Date Balance: | $81,000,000 | |
| 201 North State Street | TheWit Chicago | Cut-off Date LTV: | 54.4% | |
Chicago, IL 60601
| UW NCF DSCR: | 1.59x | ||
| UW NOI Debt Yield: | 13.5% |
Operating History and Underwritten Net Cash Flow. The following table presents certain information relating to the historical operating performance and underwritten net cash flow at the TheWit Chicago Property:
| Cash Flow Analysis(1) | |||||||
| 2019 | 2021 | 2022 | 2023 | 2024 | U/W(2) | U/W $ per Unit | |
| Occupancy | 79.5% | 40.8% | 65.7% | 60.0% | 69.8% | 69.8% | |
| ADR | $225.68 | $192.15 | $255.13 | $254.29 | $265.63 | $265.63 | |
| RevPAR | $179.51 | $78.33 | $167.49 | $152.54 | $185.52 | $185.52 | |
| Rooms Revenue | $20,311,928 | $8,863,189 | $18,951,986 | $17,259,734 | $21,049,467 | $20,991,955 | $67,716 |
| Food and Beverage Revenue | 10,951,225 | 5,199,619 | 12,314,213 | 12,126,988 | 14,467,362 | 14,427,834 | 46,541 |
| Spa Income | 341,079 | 112,399 | 204,110 | 123,340 | (43) | (43) | 0 |
| LED Display Revenue | 0 | 0 | 0 | 0 | 0 | 0 | 0 |
| Miscellaneous Income | 694,022 | 208,612 | 494,297 | 143,305 | 1,200,088 | 1,200,088 | 3,871 |
| Total Operating Revenue | $32,298,254 | $14,383,819 | $31,964,606 | $29,653,367 | $36,716,874 | $36,619,834 | $118,128 |
| 0 | |||||||
| Rooms Expense | $5,257,098 | $2,204,659 | $4,362,520 | $4,985,903 | $5,927,970 | $5,911,773 | $19,070 |
| Food and Beverage Expense | 7,745,897 | 3,118,093 | 7,837,701 | 7,758,772 | 8,496,231 | 8,473,017 | 27,332 |
| Spa Expense | 335,658 | 112,665 | 247,328 | 171,876 | 4,793 | 4,780 | 15 |
| Administrative and General | 2,410,345 | 1,859,214 | 2,502,900 | 2,716,057 | 2,290,324 | 2,290,324 | 7,388 |
| Sales and Marketing | 2,385,556 | 746,633 | 1,815,400 | 1,996,409 | 2,259,990 | 2,259,990 | 7,290 |
| Franchise Fees | 1,697,740 | 760,333 | 1,626,614 | 1,176,367 | 1,404,165 | 1,315,577 | 4,244 |
| Property Operation and Maintenance | 1,150,072 | 898,642 | 1,265,460 | 1,377,032 | 1,483,029 | 1,483,029 | 4,784 |
| Utilities | 664,156 | 525,482 | 543,501 | 602,384 | 763,723 | 763,723 | 2,464 |
| Base Management Fee(3) | 970,267 | 431,533 | 1,024,513 | 891,684 | 1,104,825 | 1,098,595 | 3,544 |
| Total Operating Expenses | $22,616,789 | $10,657,254 | $21,225,937 | $21,676,484 | $23,735,050 | $23,600,809 | $76,132 |
| Income Before Non-Operating Income and Expenses | $9,681,465 | $3,726,565 | $10,738,669 | $7,976,883 | $12,981,824 | $13,019,025 | $41,997 |
| Property and Other Taxes | $1,400,953 | $1,434,262 | $633,528 | $986,422 | $1,016,702 | $1,603,283 | $5,172 |
| Insurance | $252,231 | $291,934 | $373,880 | $461,487 | $534,737 | $483,475 | $1,560 |
| Net Operating Income | $8,028,281 | $2,000,369 | $9,731,261 | $6,528,974 | $11,430,385 | $10,932,267 | $35,265 |
| FF&E | 0 | 0 | 0 | 0 | 0 | 1,429,166 | 4,610 |
| Net Cash Flow | $8,028,281 | $2,000,369 | $9,731,261 | $6,528,974 | $11,430,385 | $9,503,101 | $30,655 |
| NOI DSCR | 1.34x | 0.34x | 1.63x | 1.09x | 1.91x | 1.83x | |
| NCF DSCR | 1.34x | 0.34x | 1.63x | 1.09x | 1.91x | 1.59x | |
| NOI Debt Yield | 9.9% | 2.5% | 12.0% | 8.1% | 14.1% | 13.5% | |
| NCF Debt Yield | 9.9% | 2.5% | 12.0% | 8.1% | 14.1% | 11.7% | |
| (1) | TheWit Chicago Property shut operations during 2020 due to the COVID-19 pandemic. |
| (2) | Based on the underwritten cash flow dated December 31, 2024. |
| (3) | Base Management Fee is based on 3.0% of total operating revenue. |
Escrows and Reserves. At origination, the borrower deposited (a) $572,274.60 for real estate taxes and (b) $192,500 into a property improvement plan reserve for current renovations.
Tax Escrows – On each payment date, the borrower is required to deposit into a real estate tax reserve an amount equal to 1/12 of the amount that the lender reasonably estimates will be necessary to pay real estate taxes over the next 12-month period, initially estimated to be $206,201.68 through June 6, 2025, to be recalculated starting July 6, 2025.
Insurance Escrows – On each payment date, the borrower is required to deposit into an insurance reserve an amount equal to 1/12 of the amount that the lender reasonably estimates will be necessary to cover premiums over the next 12-month period (such reserve will be conditionally waived (i) so long as no event of default under TheWit Chicago Mortgage Loan documents has occurred and is continuing, and (ii) the borrower has provided evidence that
| THE INFORMATION IN THIS STRUCTURAL AND COLLATERAL TERM SHEET IS NOT COMPLETE AND MAY BE AMENDED PRIOR TO THE TIME OF SALE. THIS TERM SHEET IS NOT AN OFFER TO SELL THESE SECURITIES AND IT IS NOT A SOLICITATION OF AN OFFER TO BUY THESE SECURITIES IN ANY JURISDICTION WHERE THE OFFER OR SALE IS NOT PERMITTED. | ||
| 32 | ||
| Hospitality – Full Service | Loan #1 | Cut-off Date Balance: | $81,000,000 | |
| 201 North State Street | TheWit Chicago | Cut-off Date LTV: | 54.4% | |
Chicago, IL 60601
| UW NCF DSCR: | 1.59x | ||
| UW NOI Debt Yield: | 13.5% |
insurance satisfying the requirements set forth in TheWit Chicago Mortgage Loan documents has been obtained under one or more blanket insurance policies and insurance premiums have been paid in accordance with the requirements of TheWit Chicago Mortgage Loan documents.
FF&E Reserve - On each payment date, the borrower is required to deposit into a FF&E reserve an amount equal to (i) $118,052,44 through January 2026 and (ii) thereafter a consistent monthly amount equal to the greater of (a) the monthly amount required to be reserved pursuant to the related franchise agreement for the replacement of FF&E or (b) 4% of the operating income of TheWit Chicago Property for the previous 12-month period (excluding any parking revenue and any revenue attributable to the display), which consistent monthly payment for each 12-month period as described immediately above will be as determined on the anniversary of the last day of the calendar month in which the origination date occurred.
Lockbox / Cash Management. TheWit Chicago Mortgage Loan is structured with a hard lockbox and springing cash management. The borrower is required to deliver direction letters to each of the credit card companies with which borrower has entered into a merchant’s or other credit card agreement directing them to pay to the lender-controlled lockbox account all payments which would otherwise be paid to borrower under the applicable credit card processing agreement. The borrower and property manager are required to deposit all revenue generated by TheWit Chicago Property into the lender-controlled lockbox account within two business days of receipt. All funds deposited into the lockbox are required to be transferred on each business day to or at the direction of the borrower unless a Cash Management Period (as defined below) exists. Upon the occurrence and during the continuance of a Cash Management Period, all funds in the lockbox account are required to be swept on each business day to a cash management account under the control of the lender to be applied and disbursed in accordance with TheWit Chicago Mortgage Loan documents, and all excess cash flow funds remaining in the cash management account after the application of such funds in accordance with TheWit Chicago Mortgage Loan documents may be held by the lender in an excess cash flow reserve account as additional collateral for TheWit Chicago Mortgage Loan.
A "Cash Management Period" means any of the following periods: (i) the period from the commencement of a Trigger Period (as defined below) until the earlier to occur of the end of such Trigger Period or the indebtedness is paid in full; or (ii) the period from the occurrence of an event of default until the earlier to occur of such event of default is no longer continuing or is waived by the lender or the indebtedness is paid in full. A Cash Management Period will not be terminated unless, at the time the borrower satisfies the conditions for termination of the applicable Cash Management Period as set forth in clause (i) or clause (ii) above, there is no continuing event of default and no other event has occurred which would cause an additional Cash Management Period as described above. In the event that a Cash Management Period is terminated as set forth in clause (i) or clause (ii) above, a Cash Management Period will be reinstated upon the subsequent occurrence of a Trigger Period or event of default.
A “Trigger Period” means each of the following:
(i) each period that commences when debt yield, determined as of the first day of any two consecutive fiscal quarters, is less than 9.4% (each, a "Debt Yield Trigger Event") and the borrower has not timely made the cash deposit into the excess cash flow account or delivered the letter of credit to the lender, in each case, as required under the related loan agreement, and concludes upon the earlier to occur of (y) the debt yield, determined as of the first day of each of any two consecutive fiscal quarters thereafter, is equal to or greater than 9.4% or (z) an appropriate deposit of cash is made to the excess cash flow account or a letter of credit is deposited with the lender as permitted pursuant to the terms and conditions of the related loan agreement;
(ii) if the financial reports required under the related loan agreement are not delivered to the lender as and when required (subject, in any event, to the notice and cure period specified in the loan agreement), a Trigger Period will be deemed to have commenced and be ongoing, unless and until such reports are delivered and they indicate that, in fact, no Trigger Period is ongoing); and
(iii) except as provided in franchise agreement provisions of the related loan agreement, any period from (a) the date TheWit Chicago Property is no longer subject to the related franchise agreement or any replacement thereof entered in accordance with TheWit Chicago Mortgage Loan documents to (b) the date upon which the New License Conditions (as defined below) are satisfied.
“New License Conditions” means the delivery to the lender of the following items, each of which is satisfactory to the lender in its commercially reasonable discretion: (i) a replacement franchise agreement with the franchisor or another franchisor or licensor acceptable to lender, or the extension of the existing franchise agreement, in any case for a term of no less than five years beyond the maturity date and which contains market terms reasonably consistent with other license agreements being issued by the franchisor or any replacement thereof for other properties; (ii) a tri-party agreement or comfort letter issued by the franchisor or any replacement thereof for the benefit of the lender in substantially the same form provided to lender prior to the origination date or otherwise approved by the lender, which approval may not be unreasonably withheld, delayed or conditioned, and which relates to the franchise agreement, as extended, or any replacement franchise agreement referenced in subsection (i) immediately above; and (iii) a completion guaranty from the borrower sponsors (or another person reasonably acceptable to the lender and the borrower) in form reasonably satisfactory to the lender for the completion of any PIP requirements required to satisfy any PIP implemented in conjunction with the entering of any extension or replacement franchise agreement as referenced in subsection (i) above.
Property Management. TheWit Chicago Property is managed by Dreamweaver Hotels Inc. – TheWit, an affiliate of the borrower.
Terrorism Insurance. The borrower is required to obtain and maintain property insurance and business interruption insurance for 18 months plus a 12-month extended period of indemnity. Such insurance is required to cover perils of terrorism and acts of terrorism (provided that if TRIPRA or a similar statute is not in effect, the borrower will not be obligated to pay terrorism insurance premiums in excess of two times the premium for the casualty and business interruption coverage on a stand-alone basis). See “Risk Factors—Risks Relating to the Mortgage Loans—Terrorism Insurance May Not Be Available for All Mortgaged Properties” in the prospectus.
| THE INFORMATION IN THIS STRUCTURAL AND COLLATERAL TERM SHEET IS NOT COMPLETE AND MAY BE AMENDED PRIOR TO THE TIME OF SALE. THIS TERM SHEET IS NOT AN OFFER TO SELL THESE SECURITIES AND IT IS NOT A SOLICITATION OF AN OFFER TO BUY THESE SECURITIES IN ANY JURISDICTION WHERE THE OFFER OR SALE IS NOT PERMITTED. | ||
| 33 | ||
| Multifamily – Mid Rise | Loan #2 | Cut-off Date Balance: | $73,500,000 | |
| 99 Ocean Avenue and 1820 Alemany Boulevard | Ventana Residences | Cut-off Date LTV: | 65.5% | |
| San Francisco, CA 94112 | UW NCF DSCR: | 1.25x | ||
| UW NOI Debt Yield: | 7.9% |
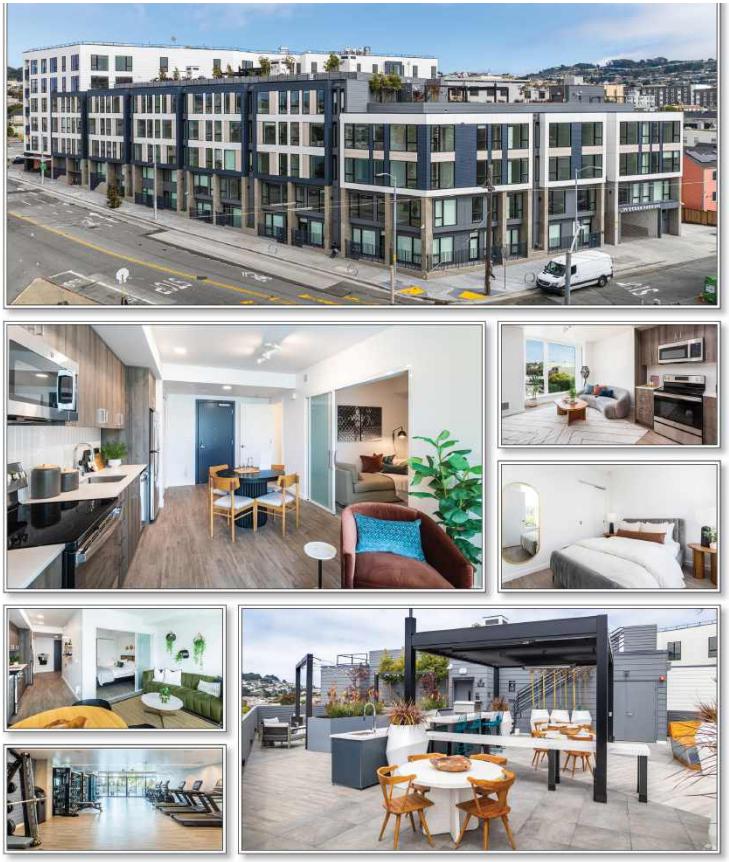
| THE INFORMATION IN THIS STRUCTURAL AND COLLATERAL TERM SHEET IS NOT COMPLETE AND MAY BE AMENDED PRIOR TO THE TIME OF SALE. THIS TERM SHEET IS NOT AN OFFER TO SELL THESE SECURITIES AND IT IS NOT A SOLICITATION OF AN OFFER TO BUY THESE SECURITIES IN ANY JURISDICTION WHERE THE OFFER OR SALE IS NOT PERMITTED. | ||
| 34 | ||
| Multifamily – Mid Rise | Loan #2 | Cut-off Date Balance: | $73,500,000 | |
| 99 Ocean Avenue and 1820 Alemany Boulevard | Ventana Residences | Cut-off Date LTV: | 65.6% | |
| San Francisco, CA 94112 | UW NCF DSCR: | 1.25x | ||
| UW NOI Debt Yield: | 7.9% |
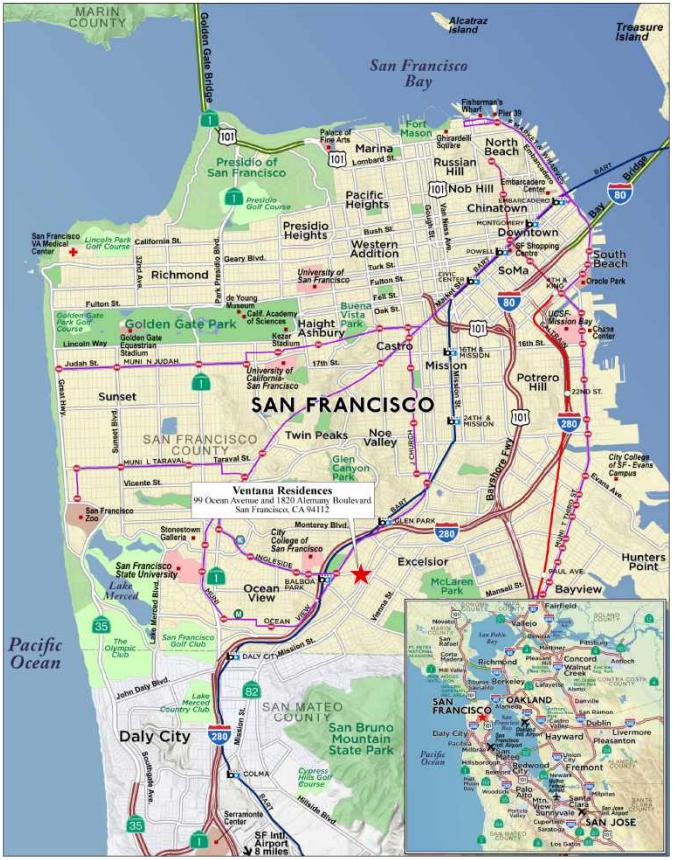
| THE INFORMATION IN THIS STRUCTURAL AND COLLATERAL TERM SHEET IS NOT COMPLETE AND MAY BE AMENDED PRIOR TO THE TIME OF SALE. THIS TERM SHEET IS NOT AN OFFER TO SELL THESE SECURITIES AND IT IS NOT A SOLICITATION OF AN OFFER TO BUY THESE SECURITIES IN ANY JURISDICTION WHERE THE OFFER OR SALE IS NOT PERMITTED. | ||
| 35 | ||
| Mortgage Loan No. 2 – Ventana Residences |
| Mortgage Loan Information | Property Information | ||||||
| Mortgage Loan Sellers: | WFB | Single Asset/Portfolio: | Single Asset | ||||
| Credit Assessment (Fitch/KBRA/Moody’s): | NR/NR/NR | Location: | San Francisco, CA 94112 | ||||
| Original Balance: | $73,500,000 | General Property Type: | Multifamily | ||||
| Cut-off Date Balance: | $73,500,000 | Detailed Property Type: | Mid Rise | ||||
| % of Initial Pool Balance: | 8.9% | Title Vesting: | Fee | ||||
| Loan Purpose: | Refinance | Year Built/Renovated: | 2023/NAP | ||||
| Borrower Sponsor: | Presidio Bay Ventures, LLC | Size: | 193 Units | ||||
| Guarantor: | Libertas Ventures, LLC | Cut-off Date Balance per Unit: | $380,829 | ||||
| Mortgage Rate: | 6.1660% | Maturity Balance per Unit: | $380,829 | ||||
| Note Date: | 1/29/2025 | Property Manager: | Greystar California, Inc. | ||||
| Maturity Date: | 2/11/2035 | ||||||
| Term to Maturity: | 120 months | Underwriting and Financial Information | |||||
| Amortization Term: | 0 months | UW NOI: | $5,819,367 | ||||
| IO Period: | 120 months | UW NCF: | $5,758,221 | ||||
| Seasoning: | 0 months | UW NOI Debt Yield: | 7.9% | ||||
| Prepayment Provisions: | L(24),D(92),O(4) | UW NCF Debt Yield: | 7.8% | ||||
| Lockbox/Cash Mgmt Status: | Soft/Springing | UW NOI Debt Yield at Maturity: | 7.9% | ||||
| Additional Debt Type(1): | Mezzanine | UW NCF DSCR: | 1.25x | ||||
| Additional Debt Balance(1): | $34,750,000 | Most Recent NOI: | $2,059,103 (12/31/2024) | ||||
| Future Debt Permitted (Type): | No (NAP) | 2nd Most Recent NOI(3): | NAV | ||||
| 3rd Most Recent NOI(3): | NAV | ||||||
| Reserves(2) | Most Recent Occupancy: | 92.2% (1/22/2025) | |||||
| Type | Initial | Monthly | Cap | 2nd Most Recent Occupancy: | 91.7% (12/31/2024) | ||
| RE Taxes: | $0 | $84,581 | NAP | 3rd Most Recent Occupancy: | 40.4% (12/31/2023) | ||
| Insurance: | $115,548 | $19,258 | NAP | Appraised Value (as of): | $112,000,000 (10/28/2024) | ||
| Replacement Reserve: | $0 | $4,096 | NAP | Appraised Value per Unit: | $580,311 | ||
| TI/LC Reserve: | $0 | $1,000 | NAP | Cut-off Date LTV Ratio: | 65.6% | ||
| Master Lease Reserve: | $345,000 | $0 | NAP | Maturity Date LTV Ratio: | 65.6% | ||
Sources and Uses | ||||||
| Sources | Proceeds | % of Total | Uses | Proceeds | % of Total | |
| Mortgage Loan Amount: | $73,500,000 | 67.9% | Loan Payoff: | $80,624,431 | 74.5% | |
| Mezzanine Loan Amount: | $34,750,000 | 32.1% | Closing Costs: | $7,940,708 | 7.3% | |
| Upfront Reserves: | $460,548 | 0.4% | ||||
| Mezzanine Loan Reserve: | $2,500,000 | 2.3% | ||||
| Equity(4): | $16,724,313 | 15.4% | ||||
| Total Sources: | $108,250,000 | 100.00% | Total Uses: | $108,250,000 | 100.00% | |
| (1) | See “Mezzanine Loan and Preferred Equity” section below. |
| (2) | See “Escrows and Reserves” section below. |
| (3) | Historical NOI figures are not presented as the Ventana Residences Property (as defined below) was delivered in April 2023 and has been undergoing lease up. |
| (4) | Existing preferred equity will be extinguished no later than February 13, 2025 in exchange for (i) the payment of $16.7MM and (ii) a 31.5% common equity ownership position in the Borrower (as defined below). |
The Mortgage Loan. The second largest mortgage loan (the “Ventana Residences Mortgage Loan”) is evidenced by a promissory note in the original principal amount of $73,500,000 and secured by the borrower’s fee interest in a mid-rise multifamily property totaling 193 units located in San Francisco, CA (the “Ventana Residences Property”).
The Borrower and the Borrower Sponsor. The borrower is 99 Ocean Avenue LP, a Delaware limited partnership. The borrower is structured to be a single purpose bankruptcy-remote entity with one independent director. The borrower sponsor is Presidio Bay Ventures, LLC (“Presidio Bay”) and the non-recourse carveout guarantor is Libertas Ventures, LLC, a California limited liability company.
Founded in 2012 by K. Cyrus Sanandaji, Presidio Bay constructs and operates commercial real estate for private and public sector tenants across the U.S. Presidio Bay is headquartered in San Francisco and has 38 projects totaling approximately 5.8 million SF valued at approximately $5.4 billion. Presidio Bay specializes in both new construction and major renovation of mid- to large-scale office, life science and R&D spaces, mixed-use, urban infill multifamily communities, industrial distribution centers and other special-use facilities. Presidio Bay has experience in advisory work, asset management services, and strategic venture investment in early-stage commercial real estate technology companies. Libertas Ventures, LLC is wholly owned by K. Cyrus Sanandaji, managing principal and founder of Presidio Bay.
The Property. The Ventana Residences Property is a newly constructed, four-story apartment complex containing 193 units and 5,977 SF of ground floor commercial space. The sponsor constructed the property in 2023 and has a total cost basis of $125.5MM. The property is situated on a 0.93-acre site and includes a parking garage with 76 spaces (0.4 spaces per unit). Amenities include an indoor-outdoor fitness center with a yoga studio and meditation rooms, two roof decks with outdoor grills, pizza ovens and audio systems, fire pits, lounges, a dog run, business center, onsite childcare, tesla carshare service, secured bike storage, and wi-fi in all common areas. The ground floor commercial space is leased to a not-for-profit children’s daycare tenant on a lease
| THE INFORMATION IN THIS STRUCTURAL AND COLLATERAL TERM SHEET IS NOT COMPLETE AND MAY BE AMENDED PRIOR TO THE TIME OF SALE. THIS TERM SHEET IS NOT AN OFFER TO SELL THESE SECURITIES AND IT IS NOT A SOLICITATION OF AN OFFER TO BUY THESE SECURITIES IN ANY JURISDICTION WHERE THE OFFER OR SALE IS NOT PERMITTED. | ||
| 36 | ||
| Multifamily – Mid Rise | Loan #2 | Cut-off Date Balance: | $73,500,000 | |
| 99 Ocean Avenue and 1820 Alemany Boulevard | Ventana Residences | Cut-off Date LTV: | 65.6% | |
| San Francisco, CA 94112 | UW NCF DSCR: | 1.25x | ||
| UW NOI Debt Yield: | 7.9% |
through October 2038. The property includes 47 studio units, 67 one-bedroom units, 57 two-bedroom units, and 22, three-bedrooms units. Unit amenities include in-unit washer/dryer, stainless steel appliances, wood cabinets, walk-in closets, and ceramic tile floors. As of January 22, 2025, the property was 92.2% physically occupied.
The following table presents certain information relating to the unit mix of the Ventana Residences Property:
| Unit Mix(1) | ||||||
| Unit Type | Total No. of Units | Occupied Units | % of Total Units | Occupancy | Average Unit Size (SF) | Average Underwritten Monthly Rent per Unit |
| Studio | 47 | 45 | 24.4% | 95.7% | 430 | $2,485 |
| 1 Bedroom | 67 | 61 | 34.7% | 91.0% | 582 | $2,969 |
| 2 Bedrooms | 57 | 55 | 29.5% | 96.5% | 832 | $3,699 |
| 3 Bedrooms | 22 | 17 | 11.4% | 77.3% | 1,046 | $4,909 |
| Total/Weighted Average | 193 | 178 | 100.0% | 92.2% | 672 | $3,288 |
| (1) | Information based on the underwritten rent roll. |
The Market. The Ventana Residences Property is located in the Mission Terrace District of San Francisco, approximately 4.3 miles south of downtown San Francisco. The property is located within walking distance of the Balboa Park BART Station and MUNI Light Rail. Additionally, the property is located one block east of Mission Street, which has a variety of pubs, restaurants, and coffee shops, a half mile south of Interstate 280 and 11.5 miles from the San Francisco International Airport. According to the appraisal, as of 2023, the population within a 1-, 3,- and 5-mile radius is 65,051, 405,641, and 901,487, respectively. and the average household income within the same radii was $161,797, $181,848, and $173,243, respectively. San Francisco’s average household income is $166,342, which is 26% higher than State of California ($123,517).
According to a third party market research report, the property is located in the Bayview / Visitacion Valley submarket of the San Francisco - CA market. As of January 2025, the submarket reported total inventory of 1,313 units with a 4.6% vacancy rate and average asking rents of $2,929 per month. The appraisal identified seven directly competitive multifamily comparables with average asking rents ranging from $2,801 to $7,622 per unit and are further detailed in the table below.
| Competitive Set | |||||||||
| Ventana Residences (Subject) | 793 S Van Ness | Windsor at Dogpatch | Alta Potrero | The Landing | The Madelon | Avalon Dogpatch | Avalon Ocean Avenue | ||
| Location | San Francisco, CA | San Francisco, CA | San Francisco, CA | San Francisco, CA | San Francisco, CA | San Francisco, CA | San Francisco, CA | San Francisco, CA | |
| Distance to Subject | -- | 3.4 miles | 4.4 miles | 4.6 Miles | 4.1 miles | 3.8 Miles | 4.2 Miles | 1.0 mile | |
| Year Built/Renovated | 2023/NAP | 2022/NAP | 2017/NAP | 2020/NAP | 2019/NAP | 2020/NAP | 2018/NAP | 2012/NAP | |
| Number of Units | 193(1) | 75 | 263 | 172 | 263 | 203 | 326 | 173 | |
| Average Monthly Rent (per unit) | |||||||||
| Studio | $2,485 | (1) | NAP | $3,218 | $2,974 | NAP | $2,924 | $2,801 | NAP |
| 1 Bedroom | $2,969 | (1) | $3,925 | $3,799 | $3,147 | $3,732 | $3,182 | $3,441 | $3,228 |
| 2 Bedrooms | $3,699 | (1) | $4,855 | $4,867 | $4,448 | $4,889 | $4,434 | $4,823 | $4,034 |
| 3 Bedrooms | $4,909 | (1) | NAP | $6,484 | $5,690 | $6,198 | NAP | $7,622 | NAP |
| Occupancy | 92.2% | (1) | 97.9% | 94.6% | 96.0% | 95.5% | 93.2% | 93.6% | 91.6% |
Source: Appraisal, unless otherwise indicated.
| (1) | Information obtained from the underwritten rent roll. |
Appraisal. The appraiser concluded to an “as-is” value for the Ventana Residences Property of $112,000,000 as of October 28, 2024.
Environmental Matters. According to the Phase I environmental site assessment dated November 20, 2024, there was no evidence of any recognized environmental l conditions at the Ventana Residences Property.
| THE INFORMATION IN THIS STRUCTURAL AND COLLATERAL TERM SHEET IS NOT COMPLETE AND MAY BE AMENDED PRIOR TO THE TIME OF SALE. THIS TERM SHEET IS NOT AN OFFER TO SELL THESE SECURITIES AND IT IS NOT A SOLICITATION OF AN OFFER TO BUY THESE SECURITIES IN ANY JURISDICTION WHERE THE OFFER OR SALE IS NOT PERMITTED. | ||
| 37 | ||
| Multifamily – Mid Rise | Loan #2 | Cut-off Date Balance: | $73,500,000 | |
| 99 Ocean Avenue and 1820 Alemany Boulevard | Ventana Residences | Cut-off Date LTV: | 65.6% | |
| San Francisco, CA 94112 | UW NCF DSCR: | 1.25x | ||
| UW NOI Debt Yield: | 7.9% |
Underwritten Net Cash Flow. The following table presents certain information relating to the Underwritten Net Cash Flow at the Ventana Residences Property:
| Cash Flow Analysis(1) | |||
| 2024 | UW | UW per Unit | |
| Base Rent | $5,029,502 | $6,889,308 | $35,696 |
| Grossed Up Vacant Space | $2,771,229 | $726,228 | $3,763 |
| Gross Potential Rent | $7,800,731 | $7,615,536 | $39,459 |
| Concessions | ($893,863) | ($72,348) | ($375) |
| Commercial Income(2) | $266,098 | $233,784 | $1,211 |
| Other Income(3) | $449,949 | $563,952 | $2,922 |
| Net Rentable Income | $7,622,915 | $8,340,924 | $43,217 |
| (Vacancy / Credit Loss) | ($2,764,137) | ($416,951) | ($2,160) |
| Effective Gross Income | $4,858,778 | $7,923,974 | $41,057 |
| Real Estate Taxes | $959,702 | $465,786(4) | $2,413 |
| Insurance | $381,520 | $220,085 | $1,140 |
| Management Fee | $221,601 | $260,365 | $1,349 |
| Other Operating Expenses | $1,236,852 | $1,158,370 | $6,002 |
| Total Operating Expenses | $2,799,675 | $2,104,606 | $10,905 |
| Net Operating Income | $2,059,103 | $5,819,367 | $30,152 |
| TI/LC | $0 | $12,000 | $2.00(5) |
| Replacement Reserves | $0 | $49,147 | $255(6) |
| Net Cash Flow | $2,059,103 | $5,758,221 | $29,835 |
| Occupancy (%) | 91.7% | 95.0%(7) | |
| NOI DSCR | 0.45x | 1.27x | |
| NCF DSCR | 0.45x | 1.25x | |
| NOI Debt Yield | 2.8% | 7.9% | |
| NCF Debt Yield | 2.8% | 7.8% | |
| (1) | Historical operating history is not presented as the Ventana Residences Property was delivered in April 2023 and has been undergoing lease up. | |
| (2) | Commercial Income represents rent from the daycare tenant. The UW Commercial Rent includes a 5% vacancy factor. |
| (3) | Other Income includes parking, storage, and vending. |
| (4) | Real Estate Taxes were underwritten inclusive of the expected 52% tax abatement. The ongoing property tax reserve will be based on the fully assessed tax bill. |
| (5) | UW TI/LC Per Unit are based on the 5,977 SF of ground floor commercial space. |
| (6) | UW Replacement Reserves Per Unit are based on the 193 multifamily units at the property. |
| (7) | Represents the underwritten economic occupancy. The property was 90.5% economically occupied and 92.2% physically occupied as of January 22, 2025. |
Escrows and Reserves.
Real Estate Taxes – The loan documents require ongoing monthly reserve deposits equal to 1/12th of the annual estimated tax payments payable during the next ensuing 12 months, initially $84,581.
Insurance – The loan documents require an upfront insurance reserve deposit equal to $115,548 and ongoing monthly insurance reserves in an amount equal to 1/12th of the insurance premiums that the lender reasonably estimates will be payable during the next ensuing 12 months, initially $19,258.
Replacement Reserve – The loan documents require ongoing monthly deposits of $4,096 for replacement reserves.
TI/LC Reserve – The loan documents require ongoing monthly deposits of $1,000 for TI/LCs related to the 5,977 SF of commercial space at the property.
Master Lease Reserve – At loan closing, the sponsor executed a master lease, which is guaranteed by K. Cyrus Sanandaji, in an amount equal to the difference between the current economic occupancy and 95.0%, which equates to $28,750 in monthly rent ($345,000 annually). The loan documents require an upfront deposit of $345,000. Provided no event of default is continuing, the Master Lease Reserve may be released upon the property achieving an actual economic occupancy of 95.0% (excluding the master lease) and a minimum net cash flow debt yield of at least 7.83%.
Lockbox and Cash Management. The Ventana Residences Mortgage Loan is structured with a soft lockbox and springing cash management. The borrower and manager are required to deposit all rents into an established deposit account within one business day of receipt. After the commencement of a Trigger Event Period (as defined below) all funds in the deposit account are required to be transferred periodically to a lender controlled cash management account to be disbursed in accordance with the cash management waterfall set forth in the loan documents. Any excess funds after the waterfall are required to be deposited into an excess cash flow account to serve as additional collateral for the loan.
| THE INFORMATION IN THIS STRUCTURAL AND COLLATERAL TERM SHEET IS NOT COMPLETE AND MAY BE AMENDED PRIOR TO THE TIME OF SALE. THIS TERM SHEET IS NOT AN OFFER TO SELL THESE SECURITIES AND IT IS NOT A SOLICITATION OF AN OFFER TO BUY THESE SECURITIES IN ANY JURISDICTION WHERE THE OFFER OR SALE IS NOT PERMITTED. | ||
| 38 | ||
| Multifamily – Mid Rise | Loan #2 | Cut-off Date Balance: | $73,500,000 | |
| 99 Ocean Avenue and 1820 Alemany Boulevard | Ventana Residences | Cut-off Date LTV: | 65.6% | |
| San Francisco, CA 94112 | UW NCF DSCR: | 1.25x | ||
| UW NOI Debt Yield: | 7.9% |
A “Trigger Event Period” will commence upon the earlier of the following:
| (i) | the occurrence and continuance of an event of default; or |
| (ii) | the net cash flow debt service coverage ratio (“NCF DSCR”) on the Ventana Residences Mortgage Loan falling below 1.15x for one calendar quarter. |
A Trigger Event Period will end upon;
| ● | with regard to clause (i) above, the cure of such event of default; and |
| ● | with regard to clause (ii) above, the NCF DSCR on the Ventana Residences Mortgage Loan being above 1.20x for two consecutive calendar quarters. |
Regulatory Agreements. The property is subject to two regulatory agreements:
| ● | The HOME-SF regulatory agreement is with the City & County of San Francisco and requires the property to have at least 25% of the units designated as HOME-SF Units for the life of the property. HOME-SF Units are defined as Below Market Rate (“BMR”) units to tenants meeting average median income (“AMI”) eligibility requirements ranging from 55% to 110% of AMI. As of loan closing, the property met the threshold via 48 BMR units. |
| ● | An agreement with the California Municipal Finance Authority (“CMFA”), was executed at loan closing for a 30-year term and requires at least 100 of 193 units to be available to be leased as low income units in exchange for a property tax reimbursement. At loan closing, the property had at least 100 qualifying units. Taxes were underwritten inclusive of the expected tax abatement; however, the ongoing property tax reserve will be based on the fully assessed tax bill. |
Mezzanine Loan and Preferred Equity. Concurrently with the funding of the Ventana Residences Mortgage Loan, Ponos Lending, LLC funded a mezzanine loan in the amount of $34,750,000 (the “Ventana Residences Mezzanine Loan”) to be secured by the mezzanine borrowers’ interests in the borrowers as collateral for the Ventana Residences Mezzanine Loan. The Ventana Residences Mezzanine Loan is coterminous with the Ventana Residences Mortgage Loan. The Ventana Residences Mezzanine Loan accrues interest at a rate of 8.0000% per annum, which is comprised of (i) a 5% “current pay” component for monthly interest only debt service payments, and (ii) an additional 3% which shall either (a) accrue and be added to the outstanding balance of the Ventana Residences Mezzanine Loan, or (b) provided no cash sweep period is continuing, be collected from any excess cash flow available after Ventana Residences Mortgage Loan debt service and the “current pay” debt service. At the Ventana Residences Mezzanine Loan closing, $2.5MM was reserved with the mezzanine lender, which is available to be drawn down upon to the extent all or a portion of the 5% current pay debt service is not available from excess cash flow at the property. Once the $2.5MM reserve is completely drawn down, the mezzanine borrower’s debt service obligation is considered satisfied until loan maturity, and there is not a payment default for any current pay debt service that is not available to be paid from excess cash flow. Rather, such amounts will accrue until maturity. A mezzanine intercreditor agreement was executed at loan origination.
| Mezzanine Loan Summary | |||||||||
| Mezzanine Original Principal Balance | Mezzanine Interest Rate | Loan Term (Original) | Amortization Term (Original) | IO Period | Total Debt U/W DSCR based on NOI/NCF | Total Debt U/W Debt Yield based on NOI/NCF | Total Debt Cut-off Date LTV Ratio | Total Debt LTV Ratio at Maturity | |
| Ventana Residences Mezzanine Loan | $34,750,000 | 8.000% | 120 | 0 | 120 | 0.79x / 0.78x(1) | 5.4% / 5.3% | 96.7% | 96.7%(1) |
| (1) | The Total Debt U/W DSCR based on NOI/NCF assuming the 5.0% current pay interest rate on the Ventana Residences Mezzanine Loan is 0.92x and 0.91x. |
Terrorism Insurance. The loan documents require an “all risk” insurance policy on a replacement cost basis, together with (i) business interruption insurance covering no less than the 18-month period following the occurrence of a casualty event, together with a 6-month extended period of indemnity, windstorm/ named storm insurance with a deductible up to 5% of the total insurable value, and (iii) terrorism insurance as defined by TRIPRA. See “Risk Factors—Risks Relating to the Mortgage Loans—Terrorism Insurance May Not Be Available for All Mortgaged Properties” in the prospectus.
| THE INFORMATION IN THIS STRUCTURAL AND COLLATERAL TERM SHEET IS NOT COMPLETE AND MAY BE AMENDED PRIOR TO THE TIME OF SALE. THIS TERM SHEET IS NOT AN OFFER TO SELL THESE SECURITIES AND IT IS NOT A SOLICITATION OF AN OFFER TO BUY THESE SECURITIES IN ANY JURISDICTION WHERE THE OFFER OR SALE IS NOT PERMITTED. | ||
| 39 | ||
| Hospitality – Full Service | Loan #3 | Cut-off Date Balance: | $70,000,000 | |
| Various | Soho Grand & The Roxy Hotel | Cut-off Date LTV: | 40.1% | |
| New York, NY 10013 | UW NCF DSCR: | 3.49x | ||
| UW NOI Debt Yield: | 21.9% |

| THE INFORMATION IN THIS STRUCTURAL AND COLLATERAL TERM SHEET IS NOT COMPLETE AND MAY BE AMENDED PRIOR TO THE TIME OF SALE. THIS TERM SHEET IS NOT AN OFFER TO SELL THESE SECURITIES AND IT IS NOT A SOLICITATION OF AN OFFER TO BUY THESE SECURITIES IN ANY JURISDICTION WHERE THE OFFER OR SALE IS NOT PERMITTED. | ||
| 40 | ||
| Hospitality – Full Service | Loan #3 | Cut-off Date Balance: | $70,000,000 | |
| Various | Soho Grand & The Roxy Hotel | Cut-off Date LTV: | 40.1% | |
| New York, NY 10013 | UW NCF DSCR: | 3.49x | ||
| UW NOI Debt Yield: | 21.9% |
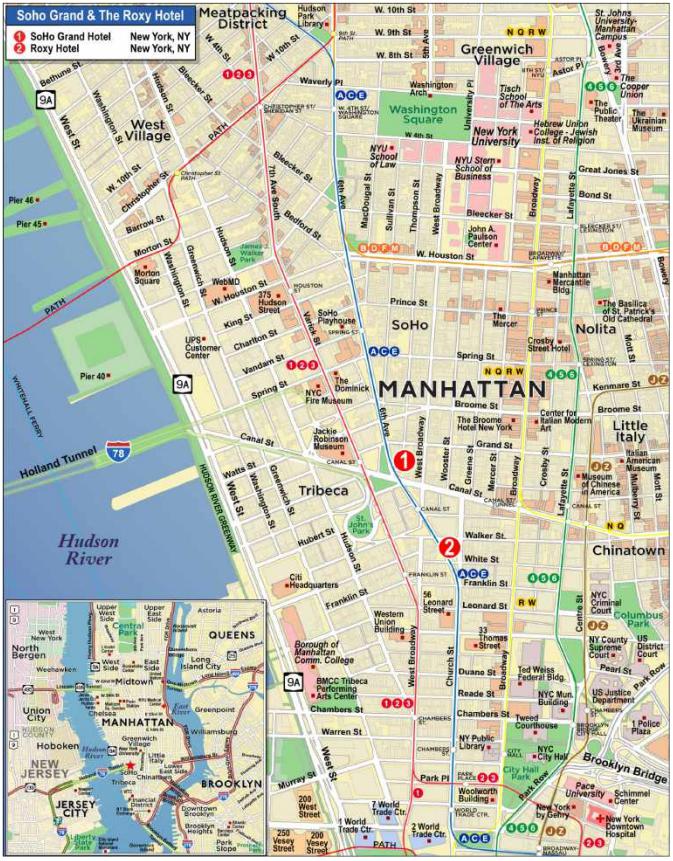
| THE INFORMATION IN THIS STRUCTURAL AND COLLATERAL TERM SHEET IS NOT COMPLETE AND MAY BE AMENDED PRIOR TO THE TIME OF SALE. THIS TERM SHEET IS NOT AN OFFER TO SELL THESE SECURITIES AND IT IS NOT A SOLICITATION OF AN OFFER TO BUY THESE SECURITIES IN ANY JURISDICTION WHERE THE OFFER OR SALE IS NOT PERMITTED. | ||
| 41 | ||
| Mortgage Loan No. 3 – Soho Grand & The Roxy Hotel |
| Mortgage Loan Information | Property Information | |||||||
| Mortgage Loan Seller: | JPMCB | Single Asset/Portfolio: | Portfolio(4) | |||||
| Credit Assessment (Moody’s/Fitch//KBRA): | Aa3/A-/A | Location: | New York, NY 10013 | |||||
| Original Balance(1): | $70,000,000 | General Property Type: | Hospitality | |||||
| Cut-off Date Balance(1): | $70,000,000 | Detailed Property Type: | Full Service | |||||
| % of Initial Pool Balance: | 8.5% | Title Vesting: | Fee | |||||
| Loan Purpose: | Refinance | Year Built/Renovated: | Various/Various | |||||
| Borrower Sponsor: | Hartz Mountain Industries | Size: | 548 Rooms | |||||
| Guarantors: | NAP | Cut-off Date Balance Per Room(1): | $371,350 | |||||
| Mortgage Rate: | 5.5400% | Maturity Date Balance Per Room(1): | $371,350 | |||||
| Note Date: | 8/20/2024 | Property Manager: | Hartz Hotel Services, Inc. | |||||
| Maturity Date: | 9/1/2034 | (borrower-related) | ||||||
| Term to Maturity: | 120 months | Underwriting and Financial Information | ||||||
| Amortization Term: | 0 months | UW NOI: | $44,656,440 | |||||
| IO Period: | 120 months | UW NCF: | $39,863,397 | |||||
| Seasoning: | 5 months | UW NOI Debt Yield(1): | 21.9% | |||||
| Prepayment Provisions: | L(24),YM1(89),O(7) | UW NCF Debt Yield(1): | 19.6% | |||||
| Lockbox/Cash Mgmt Status: | Hard/Springing | UW NOI Debt Yield at Maturity(1): | 21.9% | |||||
| Additional Debt Type(1): | Pari Passu/B-Note | UW NCF DSCR(1): | 3.49x | |||||
| Additional Debt Balance(1): | $133,500,000/$26,500,000 | Most Recent NOI: | $45,406,894 (11/30/2024 TTM) | |||||
| Future Debt Permitted (Type): | No (NAP) | 2nd Most Recent NOI: | $42,431,610 (12/31/2023) | |||||
| 3rd Most Recent NOI: | $44,960,439 (12/31/2022) | |||||||
| Most Recent Occupancy: | 90.5% (11/30/2024) | |||||||
| 2nd Most Recent Occupancy: | 89.3% (12/31/2023) | |||||||
| Reserves(2) | 3rd Most Recent Occupancy: | 89.3% (12/31/2022) | ||||||
| Type | Initial | Monthly | Cap | Appraised Value (as of): | $508,000,000 (7/1/2024) | |||
| RE Taxes: | $1,907,655 | $635,885 | NAP | Appraised Value Per Room: | $927,007 | |||
| Insurance: | $0 | Springing | NAP | Cut-off Date LTV Ratio(1): | 40.1% | |||
| FF&E Reserve: | $387,448 | (3) | NAP | Maturity Date LTV Ratio(1): | 40.1% | |||
| Sources and Uses | ||||||
| Sources | Proceeds | % of Total | Uses | Proceeds | % of Total | |
| Whole Loan Amount(1): | $230,000,000 | 90.4% | Loan Payoff: | $250,909,055 | 98.7% | |
| Borrower Equity: | $24,286,447 | 9.6% | Upfront Reserves: | $2,295,103 | 0.9% | |
| Closing Costs: | $1,082,289 | 0.4% | ||||
| Total Sources: | $254,286,447 | 100.0% | Total Uses: | $254,286,447 | 100.0% | |
| (1) | The Soho Grand & The Roxy Hotel Mortgage Loan (as defined below) is part of the Soho Grand & The Roxy Hotel Whole Loan (as defined below), which is comprised of (i) four pari passu senior promissory notes with an aggregate original principal balance of $203,500,000 and (ii) one subordinate note with an original principal balance of $26,500,000. The Credit Assessment, Cut-off Date Balance Per Room, Maturity Date Balance Per Room, UW NOI Debt Yield, UW NCF Debt Yield, UW NOI Debt Yield at Maturity, UW NCF DSCR, Cut-off Date LTV Ratio and Maturity Date LTV Ratio presented above are based on the aggregate principal balance of the promissory notes comprising the Soho Grand & The Roxy Hotel Senior Loan (as defined below). The Cut-off Date Balance Per Room, Maturity Date Balance Per Room, UW NOI Debt Yield, UW NCF Debt Yield, UW NOI Debt Yield at Maturity, UW NCF DSCR, Cut-off Date LTV Ratio and Maturity Date LTV Ratio based on the principal balance of the Soho Grand & The Roxy Hotel Whole Loan are $419,708, $419,708, 19.4%, 17.3%, 19.4%, 3.09x, 45.3% and 45.3%, respectively. |
| (2) | See “Escrows and Reserves”. |
| (3) | Monthly FF&E Reserve of 1/12th of 4% estimated annual gross revenues for the succeeding 12 month period (as determined by the lender in good faith). |
| (4) | No property releases are permitted. |
The Mortgage Loan. The third largest mortgage loan (the “Soho Grand & The Roxy Hotel Loan”) is part of a whole loan (the “Soho Grand & The Roxy Hotel Whole Loan”) comprised of (i) four pari passu senior promissory notes with an aggregate original principal balance of $203,500,000 (collectively, the “Soho Grand & The Roxy Hotel Senior Loan”) and (ii) one subordinate note with an original principal balance of $26,500,000. The Soho Grand & The Roxy Hotel Whole Loan is secured by a first priority fee mortgage encumbering two full-service hotels: the 347-room Soho Grand Hotel (the “Soho Grand Property”) and a 201-room Roxy Hotel (“The Roxy Hotel Property”, and together with the Soho Grand Property, the “Soho Grand & The Roxy Hotel Properties”). There are no property releases permitted under the Soho Grand & The Roxy Hotel Whole Loan documents. The Soho Grand & The Roxy Hotel Mortgage Loan is evidenced by the non-controlling Note A-2 with an original principal balance of $70,000,000. The promissory notes comprising the Soho Grand & The Roxy Hotel Whole Loan are summarized in the below table. The Soho Grand & The Roxy Hotel Whole Loan is serviced pursuant to the pooling and servicing agreement for the BANK 2024-BNK48 securitization trust. See “Description of the Mortgage Pool—The Whole Loans—The Soho Grand & The Roxy Hotel—AB Whole Loan” and “Pooling and Servicing Agreement” in the prospectus.
| THE INFORMATION IN THIS STRUCTURAL AND COLLATERAL TERM SHEET IS NOT COMPLETE AND MAY BE AMENDED PRIOR TO THE TIME OF SALE. THIS TERM SHEET IS NOT AN OFFER TO SELL THESE SECURITIES AND IT IS NOT A SOLICITATION OF AN OFFER TO BUY THESE SECURITIES IN ANY JURISDICTION WHERE THE OFFER OR SALE IS NOT PERMITTED. | ||
| 42 | ||
| Hospitality – Full Service | Loan #3 | Cut-off Date Balance: | $70,000,000 | |
| Various | Soho Grand & The Roxy Hotel | Cut-off Date LTV: | 40.1% | |
| New York, NY 10013 | UW NCF DSCR: | 3.49x | ||
| UW NOI Debt Yield: | 21.9% |
| Soho Grand & The Roxy Hotel Whole Loan Summary | ||||
Note | Original Balance | Cut-off Date Balance | Note Holder | Controlling Piece |
| A-1 | $80,000,000 | $80,000,000 | BANK 2024-BNK48 | No(1) |
| A-2 | $70,000,000 | $70,000,000 | WFCM 2025-C64 | No |
| A-3(2) | $33,500,000 | $33,500,000 | JPMCB | No |
| A-4 | $20,000,000 | $20,000,000 | BANK 2024-BNK48 | No |
| Senior Notes | $203,500,000 | $203,500,000 | ||
| B | $26,500,000 | $26,500,000 | BANK 2024-BNK48 (loan-specific interests)(3) | Yes(1) |
| Whole Loan | $230,000,000 | $230,000,000 | ||
| (1) | Pursuant to the related co-lender agreement, the holder of Note B is the controlling noteholder unless a “control appraisal period” has occurred and is continuing under the co-lender agreement, in which case Note A-1 will become the controlling noteholder. For so long as Note B is included in the BANK 2024-BNK48 securitization and no control appraisal event has occurred, such rights will be exercised by the controlling class representative of the BANK 2024-BNK48 loan-specific interests. |
| (2) | Expected to be contributed to one or more future securitization trusts. |
| (3) | Note B serves as collateral only with respect to the loan-specific interests. Note B is not part of the pool of mortgage loans securing the BANK 2024-BNK48 pooled certificates. See “Description of the Mortgage Pool—The Whole Loans—The Soho Grand & The Roxy Hotel A/B Whole Loan” in the prospectus. |
The Borrowers and the Borrower Sponsor. The borrowers are Soho Grand Hotel, Inc. and Tribeca Grand Hotel, Inc., each a New York Corporation structured to be a single-purpose entity with a principal that is a Delaware single-purpose entity with at least two independent directors. The borrower sponsor of the Soho Grand & The Roxy Hotel Whole Loan is Hartz Mountain Industries. There is no non-recourse carveout guarantor and the borrowers are the sole indemnitors under the environmental indemnity agreement.
Hartz Mountain Industries constructed the Soho Grand & The Roxy Hotel Properties in 1996 and 2000, respectively, and has owned and operated each property since inception. Hartz Mountain Industries was founded in 1926 and has since evolved into a diversified privately owned family business. Hartz Mountain Industries focuses on four lines of business: industrial real estate, multifamily rental real estate, hospitality and renewable energy development. Hartz Mountain Industries’ growing and changing portfolio includes warehouses, data centers, hotels, freestanding parking garages, multifamily residential rental units, offices and other properties.
The Properties. The Soho Grand & The Roxy Hotel Properties comprise two full service hotels totaling 548 keys located in the Soho and Tribeca neighborhoods of Lower Manhattan, New York.
The Soho Grand Property (64.6% of underwritten net cash flow), located in Soho, New York City, is a 16-story, 347-room hotel that was constructed in 1996 and renovated between 2018 and 2021. The 189,986 square foot building operates as an independent hotel known as the Soho Grand Hotel and is credited as the first boutique hotel in Soho. The Soho Grand Property offers various facilities and amenities, including a concierge, a fitness center and 2,489 SF of dedicated event and meeting space. Additionally, valet parking is offered via a third-party operator. The Soho Grand Property also offers a variety of food and beverage (“F&B”) outlets for both hotel guests and the public, including (a) the Grand Bar & Salon (a restaurant and bar serving three meals per day), (b) the Club Room (a parlor and bar in a nightclub setting) and (c) Gilligan’s (a seasonal outdoor café and bar operating from May through September). All F&B outlets are owned and operated by the borrowers.
The Soho Grand Property has a wide variety of guestroom layouts, but generally contains standard guestrooms, suites, terrace suites and two penthouse lofts. Standard in-room amenities include custom-designed furniture, an industrial marble work desk, a built-in closet, oak flooring, a smart TV, motorized blackout shades and complimentary WiFi. In addition, the Soho Grand Property charges a $34.95 to $39.95 per night amenity fee for: a champagne toast on arrival, premium high-speed WiFi, digital access to the New York Times, two water bottles, complimentary bicycle usage, access to the member-only Soho Grand dog park, access to the fitness center and 24-hour concierge service.
The borrowers invested approximately $38.6 million in capital improvements at the Soho Grand Property between 2018 and April 2024. Room renovations occurring between 2018 and 2021 made up the bulk of recent capital improvements, accounting for approximately $32.1 million ($92,640 per key). Between 2018 and 2024, the borrowers also made significant investments across F&B outlets, including approximately $1.4 million on the Club Room upgrades and an additional $471,085 across its two other F&B outlets.
According to the appraisal, the property segmentation at the Soho Grand Property is estimated to be 55% leisure, 35% commercial and 10% meeting and group.
The following table presents certain information relating to the Occupancy, ADR and RevPAR of the Soho Grand Property and its competitive set:
| Historical Occupancy, ADR, RevPAR(1) | |||||||||
| Competitive Set | Soho Grand Property | Penetration Factor | |||||||
| Year | Occupancy | ADR | RevPAR | Occupancy | ADR | RevPAR | Occupancy | ADR | RevPAR |
| 2022(2) | 80.3% | $393.91 | $316.48 | 89.9% | $427.67 | $384.41 | 111.9% | 108.6% | 121.5% |
| 2023(2) | 83.4% | $395.94 | $330.21 | 89.3% | $440.11 | $393.21 | 107.1% | 111.2% | 119.1% |
| May 2024 TTM(3) | 84.3% | $395.39 | $333.27 | 90.0% | $443.37 | $398.87 | 106.7% | 112.1% | 119.7% |
Source: Industry Report
| (1) | Data obtained from third-party hospitality research reports. Variances between underwriting and the industry report data are attributable to variances in reporting methodology and/or timing differences. |
| (2) | The 2022 and 2023 competitive sets include NoMo SoHo, SIXTY SoHo, ModernHaus SoHo, Hotel Hugo Soho and 11 Howard. |
| (3) | The competitive set includes NoMo SoHo, 60 Thompson St SoHo, ModernHaus SoHo, Hotel Hugo Soho and 11 Howard. |
| THE INFORMATION IN THIS STRUCTURAL AND COLLATERAL TERM SHEET IS NOT COMPLETE AND MAY BE AMENDED PRIOR TO THE TIME OF SALE. THIS TERM SHEET IS NOT AN OFFER TO SELL THESE SECURITIES AND IT IS NOT A SOLICITATION OF AN OFFER TO BUY THESE SECURITIES IN ANY JURISDICTION WHERE THE OFFER OR SALE IS NOT PERMITTED. | ||
| 43 | ||
| Hospitality – Full Service | Loan #3 | Cut-off Date Balance: | $70,000,000 | |
| Various | Soho Grand & The Roxy Hotel | Cut-off Date LTV: | 40.1% | |
| New York, NY 10013 | UW NCF DSCR: | 3.49x | ||
| UW NOI Debt Yield: | 21.9% |
The Roxy Hotel Property (35.4% of underwritten net cash flow), located in Tribeca, is an eight-story, 201-room hotel that was constructed in 2000 and renovated in 2016. The 133,895 square foot building operates as an independent hotel known as The Roxy Hotel. The Roxy Hotel Property offers various facilities, including a fitness center and 500 SF of dedicated event and meeting space. Additionally valet parking is offered via a third-party operator. The Roxy Hotel Property also has significant F&B offerings that are open to both guests and the public, including (a) the Roxy Bar (a restaurant and bar serving three meals per day), (b) the Django (a jazz bar located on the cellar level), (c) Paul’s Cocktail Lounge (a tropical-themed cocktail lounge), (d) the Oyster Bar (a bar serving oysters) and (e) Jack’s Stir Brew Coffee (a coffee bar). In addition, The Roxy Hotel Property contains the Roxy Cinema, a 118-seat, art-deco-themed theater with two to three showings per day. All F&B outlets, as well as the Roxy Cinema, are owned and operated by the borrowers.
The Roxy Hotel Property has a wide variety of guestroom options, but generally contains king rooms and suites, along with several lofts and a penthouse. Standard in-room amenities include a work area, nightstand, dresser, sofa chair, flatscreen TV and coffee maker. Similar to the Soho Grand Property, The Roxy Hotel Property charges a $34.95 to $39.95 per night amenity fee for: a champagne toast on arrival, premium high-speed WiFi, digital access to the New York Times, a water bottle, complimentary bicycle usage, access to the member-only Soho Grand dog park and access to the fitness center.
The borrowers completed a major renovation in 2016 to reposition The Roxy Hotel Property from the upscale Tribeca Grand Hotel to the current boutique offering. In addition, the borrowers invested approximately $7.3 million in capital improvements between 2017 and May 2024. Major capital improvement projects included upgrades to the Oyster Bar, Paul’s Cocktail Lounge, Django and the Roxy Bar. In addition, the borrowers have budgeted approximately $5.1 million to upgrade HVAC systems in the Roxy Cinema and the guestrooms; however, such upgrades are not required or reserved for under the Soho Grand & The Roxy Hotel Whole Loan documents.
According to the appraisal, the property segmentation at The Roxy Hotel Property is estimated to be 55% leisure, 35% commercial and 10% meeting and group.
The following table presents certain information relating to the Occupancy, ADR and RevPAR of The Roxy Hotel Property and its competitive set:
| Historical Occupancy, ADR, RevPAR(1) | |||||||||
| Competitive Set | The Roxy Hotel Property | Penetration Factor | |||||||
| Year | Occupancy | ADR | RevPAR | Occupancy | ADR | RevPAR | Occupancy | ADR | RevPAR |
| 2022(2) | 78.8% | $347.94 | $274.04 | 86.9% | $394.07 | $342.52 | 110.4% | 113.3% | 125.0% |
| 2023(2) | 81.9% | $350.21 | $286.95 | 87.8% | $394.52 | $346.38 | 107.2% | 112.7% | 120.7% |
| May 2024 TTM(3) | 82.4% | $357.14 | $294.25 | 88.4% | $399.23 | $352.99 | 107.3% | 111.8% | 120.0% |
Source: Industry Report
| (1) | Data obtained from third-party hospitality research reports. Variances between underwriting and the industry report data are attributable to variances in reporting methodology and/or timing differences. |
| (2) | The 2022 and 2023 competitive sets include 11 Howard, The Frederick Hotel, Smyth Tribeca, The Standard, East Village, NYC and NoMo SoHo. |
| (3) | The May 2024 TTM competitive set includes 11 Howard, Smyth Tribeca, The Standard, East Village, NYC and Walker Hotel Tribeca. |
The Markets. The Soho Grand Property is located in the Soho neighborhood of Manhattan, New York. The Soho neighborhood is situated between Greenwich Village/Noho to the north and Tribeca/Financial District to the south. According to the appraisal, the Soho Grand Property’s location provides for good access to public transportation. The Soho Grand Property is three blocks away from the A, C, E, 1, 2 and 3 subway lines. According to the appraisal, the Soho neighborhood is a convenient location within downtown Manhattan in terms of accessibility to other areas. The hotel is within walking distance of other popular districts in Manhattan, including Tribeca, Chinatown and the Financial District.
The Soho neighborhood is densely populated by commercial loft-type office buildings, high-end retail and ancillary uses, such as hotels and numerous service establishments. Soho maintains unique character and charm, with its cobblestone streets and historic architecture. Soho consistently attracts tourists as one of New York City’s historical districts, known for high-end restaurants and New York’s Fashion Week. It is a trendy and fashionable area, home to many upscale boutiques, galleries and restaurants. According to the appraisal, there are no proposed hotels anticipated to enter the immediate market in the near future.
The Roxy Hotel Property is located in the Tribeca neighborhood of Manhattan, New York. The Tribeca neighborhood is situated between Soho to the north, Chinatown, Little Italy and Civic Center to the east, and Financial District and Battery Park City to the south. According to the appraisal, The Roxy Hotel Property’s location provides for good access to public transportation. The Roxy Hotel Property is three blocks away from the A, C, E, 1, 2, 3, N, Q, R and W subway lines. According to the appraisal, the Tribeca neighborhood is a convenient location within downtown Manhattan in terms of accessibility to other areas. The hotel is within walking distance of other popular districts in Manhattan, including Soho, Chinatown and the Financial District.
The Tribeca neighborhood is densely improved with a mix of office, residential, hotel and retail properties. As one of New York City’s historical districts, Tribeca consistently attracts tourists. Tribeca is known for its high-end restaurants and the Tribeca Film Festival. It is a trendy and fashionable area that is home to many upscale boutiques, galleries and restaurants. Proximate tourist attractions to The Roxy Hotel Property include Tribeca Cinemas, the Brooklyn Bridge, New York City Fire Museum and City Hall. According to the appraisal, there are no proposed hotels anticipated to enter the immediate market in the near future.
| THE INFORMATION IN THIS STRUCTURAL AND COLLATERAL TERM SHEET IS NOT COMPLETE AND MAY BE AMENDED PRIOR TO THE TIME OF SALE. THIS TERM SHEET IS NOT AN OFFER TO SELL THESE SECURITIES AND IT IS NOT A SOLICITATION OF AN OFFER TO BUY THESE SECURITIES IN ANY JURISDICTION WHERE THE OFFER OR SALE IS NOT PERMITTED. | ||
| 44 | ||
| Hospitality – Full Service | Loan #3 | Cut-off Date Balance: | $70,000,000 | |
| Various | Soho Grand & The Roxy Hotel | Cut-off Date LTV: | 40.1% | |
| New York, NY 10013 | UW NCF DSCR: | 3.49x | ||
| UW NOI Debt Yield: | 21.9% |
The following table presents the primary competitive properties to the Soho Grand & The Roxy Hotel Properties:
| Competitive Property Summary | ||||||||
| Property | Year Built | Rooms | Leisure | Commercial | Meeting & Group | Estimated 2023 Occupancy | Estimated 2023 ADR | Estimated 2023 RevPAR |
| Soho Grand Property(1) | 1996 | 347 | 55% | 35% | 10% | 89.8% | $438.53 | $394.00 |
| The Roxy Hotel Property(1) | 2000 | 201 | 55% | 35% | 10% | 88.3% | $393.57 | $347.33 |
| Smyth Tribeca | 2009 | 100 | 65% | 30% | 5% | 75%-80% | $390-$410 | $300-$320 |
| SIXTY SoHo | 2001 | 97 | 60% | 35% | 5% | 85%-90% | $430-$450 | $380-$400 |
| 11 Howard | 1992 | 207 | 65% | 30% | 5% | 75%-80% | $415-$435 | $320-$340 |
| NoMo SoHo | 2011 | 264 | 65% | 30% | 5% | 80%-85% | $315-$335 | $255-$275 |
| ModernHaus SoHo | 2010 | 114 | 55% | 35% | 10% | 75%-80% | $375-$395 | $290-$310 |
| Hotel Hugo Soho | 2014 | 122 | 70% | 25% | 5% | 75%-80% | $315-$335 | $245-$265 |
| Walker Hotel Tribeca | 1915 | 171 | 55% | 35% | 10% | 80%-85% | $255-$265 | $210-$230 |
| Subtotal/Average | 1,623 | 61% | 32% | 7% | 84% | $381.20 | $318.64 | |
Source: Appraisal dated July 22, 2024.
| (1) | Based on actual 2023 metrics. |
Appraisal. The appraisal concluded an “as-is” value of $327,000,000 and $181,000,000 for the Soho Grand Property and The Roxy Hotel Property, respectively, resulting in an aggregate appraised value of $508,000,000 as of July 1, 2024.
Environmental Matters. According to the Phase I environmental site assessments dated July 18, 2024, there was no evidence of any recognized environmental conditions at the Soho Grand & The Roxy Hotel Properties.
Operating History and Underwritten Net Cash Flow. The following table presents certain information relating to the historical hotel operating performance at the Soho Grand & The Roxy Hotel Properties.
| Soho Grand & The Roxy Hotel Properties Cash Flow Analysis(1) | |||||||
| 2019(2) | 2021(2) | 2022(2) | 2023(2) | November 2024 TTM(2) | UW | UW per Room | |
| Occupancy | 82.9% | 66.8% | 89.3% | 89.3% | 90.5% | 90.5% | |
| ADR | $333.17 | $310.24 | $414.05 | $422.22 | $440.14 | $440.14 | |
| RevPAR | $276.35 | $207.37 | $369.65 | $376.88 | $398.48 | $398.48 | |
| Room Revenue | $55,879,820 | $41,477,823 | $73,936,988 | $75,383,605 | $79,922,512 | $79,704,144 | $145,446 |
| Food & Beverage Revenue | $26,875,205 | $18,682,444 | $34,610,772 | $34,032,958 | $35,016,263 | $34,920,590 | $63,724 |
| Other Departmental Income | $2,686,461 | $4,794,532 | $5,163,505 | $5,139,056 | $5,194,497 | $5,201,331 | $9,491 |
| Total Revenue | $85,441,486 | $64,954,799 | $113,711,265 | $114,555,619 | $120,133,272 | $119,826,066 | $218,661 |
| Room Expense | $15,039,152 | $10,660,553 | $15,420,944 | $17,186,859 | $17,538,911 | $17,490,990 | $31,918 |
| Food & Beverage Expense | $20,112,375 | $11,585,044 | $21,686,816 | $22,322,256 | $23,371,442 | $23,307,586 | $42,532 |
| Other Departmental Expenses | $699,634 | $745,053 | $257,262 | $196,673 | $198,822 | $198,279 | $362 |
| Real Estate Taxes | $7,780,017 | $7,695,825 | $7,093,866 | $7,135,720 | $6,980,518 | $7,630,621 | $13,924 |
| Insurance | $138,344 | $224,080 | $675,730 | $872,522 | $966,006 | $908,252 | $1,657 |
| Other Expenses | $20,391,173 | $16,585,100 | $23,616,208 | $24,409,979 | $25,670,679 | $25,633,898 | $46,777 |
| Total Expenses | $64,160,695 | $47,495,655 | $68,750,826 | $72,124,009 | $74,726,378 | $75,169,626 | $137,171 |
| Net Operating Income | $21,280,791 | $17,459,144 | $44,960,439 | $42,431,610 | $45,406,894 | $44,656,440 | $81,490 |
| FF&E | $3,417,659 | $2,598,192 | $4,548,451 | $4,582,225 | $4,805,331 | $4,793,043 | $8,746 |
| Net Cash Flow | $17,863,132 | $14,860,952 | $40,411,988 | $37,849,385 | $40,601,563 | $39,863,397 | $72,743 |
| NOI DSCR(3) | 1.86x | 1.53x | 3.93x | 3.71x | 3.97x | 3.91x | |
| NCF DSCR(3) | 1.56x | 1.30x | 3.54x | 3.31x | 3.55x | 3.49x | |
| NOI Debt Yield(3) | 10.5% | 8.6% | 22.1% | 20.9% | 22.3% | 21.9% | |
| NCF Debt Yield(3) | 8.8% | 7.3% | 19.9% | 18.6% | 20.0% | 19.6% | |
| (1) | 2020 excluded as the Soho Grand & The Roxy Hotel Properties were adversely impacted by temporary closures related to the COVID-19 pandemic. |
| (2) | The decrease in Occupancy and Net Operating Income from 2019 to 2021, as well as the subsequent recovery from 2022 through November 2024 TTM, was primarily due to the effects of the COVID-19 pandemic on the hospitality industry. Additionally, the Soho Grand Property underwent significant guest room renovations between 2018 and 2021, resulting in reduced performance during those years and increased performance in subsequent years. |
| (3) | Based on the Soho Grand & The Roxy Hotel Senior Loan. |
| THE INFORMATION IN THIS STRUCTURAL AND COLLATERAL TERM SHEET IS NOT COMPLETE AND MAY BE AMENDED PRIOR TO THE TIME OF SALE. THIS TERM SHEET IS NOT AN OFFER TO SELL THESE SECURITIES AND IT IS NOT A SOLICITATION OF AN OFFER TO BUY THESE SECURITIES IN ANY JURISDICTION WHERE THE OFFER OR SALE IS NOT PERMITTED. | ||
| 45 | ||
| Hospitality – Full Service | Loan #3 | Cut-off Date Balance: | $70,000,000 | |
| Various | Soho Grand & The Roxy Hotel | Cut-off Date LTV: | 40.1% | |
| New York, NY 10013 | UW NCF DSCR: | 3.49x | ||
| UW NOI Debt Yield: | 21.9% |
| Soho Grand Property Cash Flow Analysis(1) | |||||||
| 2019(2) | 2021(2) | 2022(2) | 2023(2) | November 2024 TTM(2) | UW | UW per Room | |
| Occupancy | 78.6% | 68.3% | 90.5% | 89.8% | 91.6% | 91.6% | |
| ADR | $337.98 | $321.85 | $425.65 | $438.53 | $456.28 | $456.27 | |
| RevPAR | $265.56 | $219.77 | $385.06 | $394.00 | $417.73 | $417.73 | |
| Room Revenue | $34,216,198 | $27,834,377 | $48,769,607 | $49,901,834 | $53,052,358 | $52,907,406 | $152,471 |
| Food & Beverage Revenue | $12,116,719 | $9,859,586 | $15,454,161 | $14,136,273 | $14,861,741 | $14,821,135 | $42,712 |
| Other Departmental Income | $1,826,265 | $3,630,690 | $3,652,042 | $3,567,980 | $3,492,784 | $3,502,533 | $10,094 |
| Total Revenue | $48,159,182 | $41,324,653 | $67,875,809 | $67,606,088 | $71,406,883 | $71,231,075 | $205,277 |
| Room Expense | $9,327,895 | $6,974,836 | $10,032,357 | $10,922,882 | $11,140,516 | $11,110,077 | $32,018 |
| Food & Beverage Expense | $8,678,417 | $5,705,337 | $9,453,947 | $9,629,002 | $10,400,599 | $10,372,182 | $29,891 |
| Other Income Expense | $469,085 | $664,935 | $176,134 | $132,218 | $139,634 | $139,252 | $401 |
| Real Estate Taxes | $5,188,900 | $5,388,775 | $5,158,427 | $5,117,351 | $4,978,141 | $5,481,079 | $15,796 |
| Insurance | $78,771 | $125,316 | $417,352 | $525,945 | $581,266 | $551,756 | $1,590 |
| Other Departmental Expenses | $11,580,353 | $9,846,388 | $13,634,400 | $14,036,709 | $14,996,563 | $14,987,996 | $43,193 |
| Total Expenses | $35,323,421 | $28,705,587 | $38,872,617 | $40,364,107 | $42,236,719 | $42,642,343 | $122,889 |
| Net Operating Income | $12,835,761 | $12,619,066 | $29,003,193 | $27,241,981 | $29,170,164 | $28,588,732 | $82,388 |
| FF&E | $1,926,367 | $1,652,986 | $2,715,032 | $2,704,244 | $2,856,275 | $2,849,243 | $8,211 |
| Net Cash Flow | $10,909,394 | $10,966,080 | $26,288,160 | $24,537,738 | $26,313,889 | $25,739,489 | $74,177 |
| (1) | 2020 excluded as the Soho Grand Property was adversely impacted by temporary closures related to the COVID-19 pandemic. |
| (2) | The decrease in Occupancy and Net Operating Income from 2019 to 2021, as well as the subsequent recovery from 2022 through November 2024 TTM, was primarily due to the effects of the COVID-19 pandemic on the hospitality industry. Additionally, the Soho Grand Property underwent significant guest room renovations between 2018 and 2021, resulting in reduced performance during those years and increased performance in subsequent years. |
| The Roxy Hotel Property Cash Flow Analysis(1) | |||||||
| 2019(2) | 2021(2) | 2022(2) | 2023(2) | November 2024 TTM(2) | UW | UW per Room | |
| Occupancy | 90.6% | 64.4% | 87.2% | 88.3% | 88.8% | 88.8% | |
| ADR | $325.85 | $288.96 | $393.28 | $393.57 | $411.41 | $411.41 | |
| RevPAR | $295.29 | $185.97 | $343.04 | $347.33 | $365.25 | $365.25 | |
| Room Revenue | $21,663,622 | $13,643,446 | $25,167,381 | $25,481,770 | $26,870,154 | $26,796,738 | $133,317 |
| Food & Beverage Revenue | $14,758,486 | $8,822,858 | $19,156,611 | $19,896,685 | $20,154,522 | $20,099,455 | $99,997 |
| Other Departmental Income | $860,196 | $1,163,842 | $1,511,463 | $1,571,076 | $1,701,713 | $1,698,798 | $8,452 |
| Total Revenue | $37,282,304 | $23,630,146 | $45,835,455 | $46,949,531 | $48,726,389 | $48,594,991 | $241,766 |
| Room Expense | $5,711,257 | $3,685,717 | $5,388,586 | $6,263,978 | $6,398,395 | $6,380,913 | $31,746 |
| Food & Beverage Expense | $11,433,958 | $5,879,707 | $12,232,869 | $12,693,254 | $12,970,843 | $12,935,404 | $64,355 |
| Other Income Expense | $230,549 | $80,118 | $81,129 | $64,455 | $59,188 | $59,026 | $294 |
| Real Estate Taxes | $2,591,117 | $2,307,050 | $1,935,439 | $2,018,369 | $2,002,377 | $2,149,542 | $10,694 |
| Insurance | $59,573 | $98,764 | $258,378 | $346,577 | $384,740 | $356,496 | $1,774 |
| Other Departmental Expenses | $8,810,820 | $6,738,712 | $9,981,808 | $10,373,270 | $10,674,116 | $10,645,902 | $52,965 |
| Total Expenses | $28,837,274 | $18,790,068 | $29,878,209 | $31,759,903 | $32,489,659 | $32,527,283 | $161,827 |
| Net Operating Income | $8,445,030 | $4,840,078 | $15,957,246 | $15,189,629 | $16,236,730 | $16,067,708 | $79,939 |
| FF&E | $1,491,292 | $945,206 | $1,833,418 | $1,877,981 | $1,949,056 | $1,943,800 | $9,671 |
| Net Cash Flow | $6,953,738 | $3,894,872 | $14,123,828 | $13,311,647 | $14,287,674 | $14,123,909 | $70,268 |
| (1) | 2020 excluded as The Roxy Hotel Property was adversely impacted by temporary closures related to the COVID-19 pandemic. |
| (2) | The decrease in Occupancy and Net Operating Income from 2019 to 2021, as well as the subsequent recovery from 2022 through November 2024 TTM, was primarily due to the effects of the COVID-19 pandemic on the hospitality industry. |
| THE INFORMATION IN THIS STRUCTURAL AND COLLATERAL TERM SHEET IS NOT COMPLETE AND MAY BE AMENDED PRIOR TO THE TIME OF SALE. THIS TERM SHEET IS NOT AN OFFER TO SELL THESE SECURITIES AND IT IS NOT A SOLICITATION OF AN OFFER TO BUY THESE SECURITIES IN ANY JURISDICTION WHERE THE OFFER OR SALE IS NOT PERMITTED. | ||
| 46 | ||
| Hospitality – Full Service | Loan #3 | Cut-off Date Balance: | $70,000,000 | |
| Various | Soho Grand & The Roxy Hotel | Cut-off Date LTV: | 40.1% | |
| New York, NY 10013 | UW NCF DSCR: | 3.49x | ||
| UW NOI Debt Yield: | 21.9% |
Escrows and Reserves.
Tax Escrows – On the loan origination date, the borrowers were required to make an upfront deposit of approximately $1,907,655 into a reserve for real estate taxes. In addition, the borrowers are required to deposit into a real estate tax reserve, on a monthly basis, an amount equal to 1/12th of the annual estimated tax payments (which currently equates to $635,885).
Insurance Escrows – The borrowers are required to deposit into an insurance reserve, on a monthly basis, an amount equal to 1/12thth of the annual estimated insurance payments; provided, however, if the Soho Grand & The Roxy Hotel Properties are insured under a blanket policy, no monthly insurance escrows will be required.
FF&E Reserve – On the loan origination date, the borrowers were required to make an upfront deposit of approximately $387,448 into a reserve for furniture, fixtures and equipment (“FF&E”). In addition, the borrowers are required to deposit into an FF&E reserve, on a monthly basis, an amount equal to 1/12 of 4% of the estimated annual gross revenues at the Soho Grand & The Roxy Hotel Properties for the succeeding 12 month period.
Lockbox and Cash Management. The Soho Grand & The Roxy Hotel Whole Loan is structured with a hard lockbox and springing cash management. By the loan origination date, the borrowers and property manager were required to direct credit card companies to deposit all credit card receipts with respect to the Soho Grand & The Roxy Hotel Properties into a lockbox account controlled by the mortgage lender. Within one business day after receipt, all funds in the lockbox accounts will be swept to an account designated by the borrowers, unless a Cash Sweep Period (as defined below) is continuing, in which case such funds are required to be swept on each business day into a cash management account controlled by the lender, at which point, following payment of taxes and insurance, debt service, bank fees, operating expenses and required reserves, all funds are required to be deposited into the excess cash flow reserve, to be held by the lender as additional security for the Soho Grand & The Roxy Hotel Whole Loan and disbursed in accordance with the terms of the Soho Grand & The Roxy Hotel Whole Loan documents.
A “Cash Sweep Period” means the period during which any of the following has occurred and continued: (a) an event of default under the Soho Grand & The Roxy Hotel Whole Loan documents, (b) bankruptcy action of an individual borrower or manager or (c) the debt service coverage ratio for the Soho Grand & The Roxy Hotel Whole Loan based on the trailing 12-month period immediately preceding the date of such determination being less than 1.50x.
A Cash Sweep Period may be cured upon the occurrence of the following: (i) with respect to clause (a) above, the acceptance by the lender of a cure of such event of default in accordance with the Soho Grand & The Roxy Hotel Whole Loan documents, (ii) with respect to clause (b) above, in the case of the manager, the replacement of the manager with a qualified manager in accordance with the Soho Grand & The Roxy Hotel Whole Loan documents and (iii) with respect to clause (c) above, the achievement of a debt service coverage ratio for the Soho Grand & The Roxy Whole Loan of 1.60x or greater for two consecutive calendar quarters based upon the trailing 12-month period immediately preceding the date of determination; provided, however, among other additional conditions, (A) a Cash Sweep Period cure may occur no more than a total of two times in the aggregate during any five-year period during the term of the Soho Grand & The Roxy Hotel Whole Loan and (B) in no event may the borrower be entitled to cure a Cash Sweep Period caused by a bankruptcy action of the borrowers.
Subordinate Debt. The Soho Grand & The Roxy Hotel Properties secure the Soho Grand & The Roxy Hotel Senior Loan, which has an original principal balance of $203,500,000, and the Soho Grand & The Roxy Hotel subordinate note, which has an original principal balance of $26,500,000. The Soho Grand & The Roxy Hotel Senior Loan is included in the pool of mortgage loans that secures the BANK 2024-BNK48 pooled certificates. The subordinate note is not included in such pool of mortgage loans, but instead separately secures only the BANK 2024-BNK48 loan-specific certificates.
The following table presents certain metrics related to the subordinate note.
| Soho Grand & The Roxy Hotel Subordinate Note Metrics | |||||||
| Cut-off Date Balance | Interest Rate | UW NOI Debt Yield | UW NCF Debt Yield | UW NOI Debt Yield at Maturity | UW NCF DSCR | Cut-off Date LTV Ratio | Maturity Date LTV Ratio |
| $26,500,000 | 5.5400% | 19.4% | 17.3% | 19.4% | 3.09x | 45.3% | 45.3% |
The Soho Grand & The Roxy Hotel Senior Loan is entitled to payments of interest that are senior in right of payment to the Soho Grand & The Roxy Hotel subordinate note. The holders of the promissory notes evidencing the Soho Grand & The Roxy Hotel Whole Loan have entered into a co-lender agreement that sets forth the allocation of collections on the Soho Grand & The Roxy Hotel Whole Loan. See “Description of the Mortgage Pool—The Whole Loans—The Soho Grand & The Roxy Hotel—AB Whole Loan” and “Pooling and Servicing Agreement” in the prospectus.
Terrorism Insurance. The Soho Grand & The Roxy Hotel Whole Loan documents require that the “all risk” insurance policy required to be maintained by the borrowers provide coverage for terrorism in an amount not less than 100% of the full replacement cost of the Soho Grand & The Roxy Hotel Properties. The Soho Grand & The Roxy Hotel Whole Loan documents also require business income/loss of rents insurance for a period of no less than the 24-month period commencing at the time of loss, together with a twelve-month extended period of indemnity. See “Risk Factors—Risks Relating to the Mortgage Loans—Terrorism Insurance May Not Be Available for All Mortgaged Properties” in the prospectus.
| THE INFORMATION IN THIS STRUCTURAL AND COLLATERAL TERM SHEET IS NOT COMPLETE AND MAY BE AMENDED PRIOR TO THE TIME OF SALE. THIS TERM SHEET IS NOT AN OFFER TO SELL THESE SECURITIES AND IT IS NOT A SOLICITATION OF AN OFFER TO BUY THESE SECURITIES IN ANY JURISDICTION WHERE THE OFFER OR SALE IS NOT PERMITTED. | ||
| 47 | ||
| Industrial – Various | Loan #4 | Cut-off Date Balance: | $57,000,000 | |
| Various | West Michigan Industrial Portfolio | Cut-off Date LTV: | 57.6% | |
| Various, MI Various | UW NCF DSCR: | 1.90x | ||
| UW NOI Debt Yield: | 12.6% |
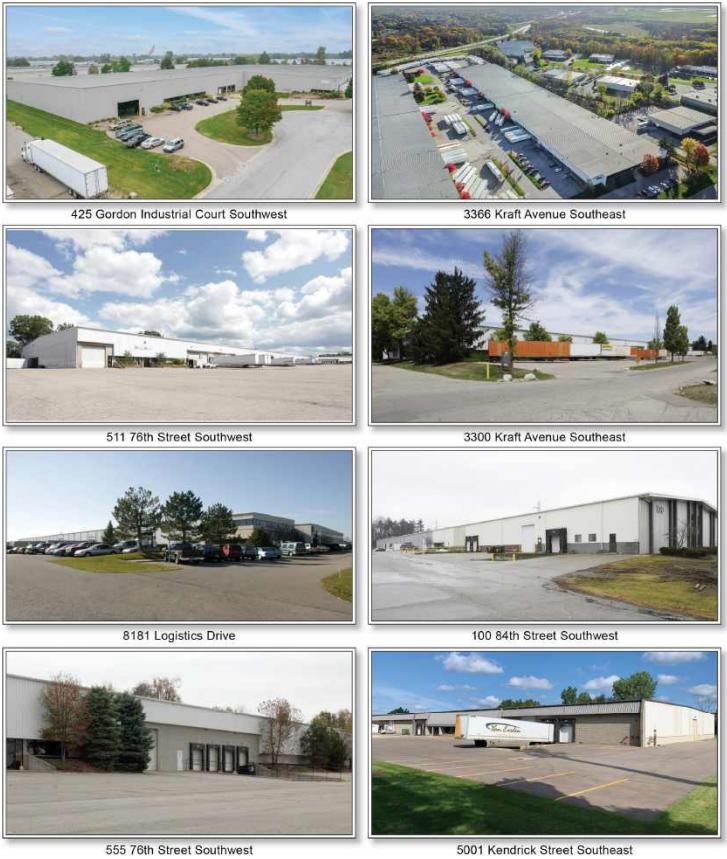
| THE INFORMATION IN THIS STRUCTURAL AND COLLATERAL TERM SHEET IS NOT COMPLETE AND MAY BE AMENDED PRIOR TO THE TIME OF SALE. THIS TERM SHEET IS NOT AN OFFER TO SELL THESE SECURITIES AND IT IS NOT A SOLICITATION OF AN OFFER TO BUY THESE SECURITIES IN ANY JURISDICTION WHERE THE OFFER OR SALE IS NOT PERMITTED. | ||
| 48 | ||
| Industrial – Various | Loan #4 | Cut-off Date Balance: | $57,000,000 | |
| Various | West Michigan Industrial Portfolio | Cut-off Date LTV: | 57.6% | |
| Various, MI Various | UW NCF DSCR: | 1.90x | ||
| UW NOI Debt Yield: | 12.6% |
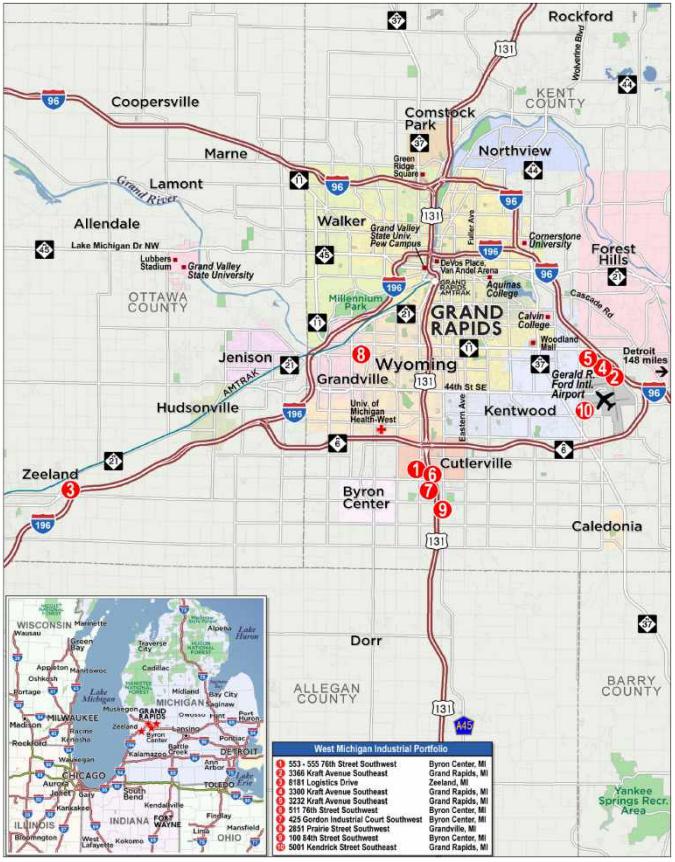
| THE INFORMATION IN THIS STRUCTURAL AND COLLATERAL TERM SHEET IS NOT COMPLETE AND MAY BE AMENDED PRIOR TO THE TIME OF SALE. THIS TERM SHEET IS NOT AN OFFER TO SELL THESE SECURITIES AND IT IS NOT A SOLICITATION OF AN OFFER TO BUY THESE SECURITIES IN ANY JURISDICTION WHERE THE OFFER OR SALE IS NOT PERMITTED. | ||
| 49 | ||
| Mortgage Loan No. 4 – West Michigan Industrial Portfolio |
| Mortgage Loan Information | Property Information | |||||||
| Mortgage Loan Seller: | CREFI | Single Asset/Portfolio: | Portfolio | |||||
| Credit Assessment (Fitch/KBRA/Moody’s): | NR/NR/NR | Location(3): | Various, MI Various | |||||
| Original Balance: | $57,000,000 | General Property Type: | Industrial | |||||
| Cut-off Date Balance: | $57,000,000 | Detailed Property Type(3): | Various | |||||
| % of Initial Pool Balance: | 6.9% | Title Vesting: | Fee | |||||
| Loan Purpose: | Refinance | Year Built/Renovated(3): | Various/Various | |||||
| Borrower Sponsor: | CORE Realty Holdings Management, Inc. | Size: | 1,696,701 SF | |||||
| Guarantors(1): | Various | Cut-off Date Balance Per SF: | $34 | |||||
| Mortgage Rate: | 6.1800% | Maturity Date Balance Per SF: | $34 | |||||
| Note Date: | 10/30/2024 | Property Manager: | CORE Realty Holdings Management, Inc. (borrower-related) | |||||
| Maturity Date: | 11/6/2034 | |||||||
| Term to Maturity: | 120 months | Underwriting and Financial Information | ||||||
| Amortization Term: | 0 months | UW NOI: | $7,154,469 | |||||
| IO Period: | 120 months | UW NCF: | $6,784,305 | |||||
| Seasoning: | 3 months | UW NOI Debt Yield: | 12.6% | |||||
| Prepayment Provisions: | L(27),YM1(86),O(7) | UW NCF Debt Yield: | 11.9% | |||||
| Lockbox/Cash Mgmt Status: | Hard/Springing | UW NOI Debt Yield at Maturity: | 12.6% | |||||
| Additional Debt Type: | NAP | UW NCF DSCR: | 1.90x | |||||
| Additional Debt Balance: | NAP | Most Recent NOI: | $7,330,072 (6/30/2024 TTM) | |||||
| Future Debt Permitted (Type): | No (NAP) | 2nd Most Recent NOI: | $6,795,613 (12/31/2023) | |||||
| Reserves(2) | 3rd Most Recent NOI: | $6,204,455 (12/31/2022) | ||||||
| Type | Initial | Monthly | Cap | Most Recent Occupancy: | 100.0% (7/31/2024) | |||
| RE Taxes: | $246,912 | $82,304 | NAP | 2nd Most Recent Occupancy: | 100.0% (12/31/2023) | |||
| Insurance: | $0 | Springing | NAP | 3rd Most Recent Occupancy: | 95.5% (12/31/2022) | |||
| Replacement Reserve: | $0 | $16,967 | NAP | Appraised Value (as of)(4): | $99,000,000 (8/8/2024) | |||
| Deferred Maintenance: | $75,167 | $0 | NAP | Appraised Value PSF: | $58 | |||
| TI/LC Reserve: | $1,000,000 | Springing | $1,000,000 | Cut-off Date LTV Ratio(4): | 57.6% | |||
| Maturity Date LTV Ratio(4): | 57.6% | |||||||
| Sources and Uses | ||||||
| Sources | Proceeds | % of Total | Uses | Proceeds | % of Total | |
| Mortgage Loan Amount: | $57,000,000 | 100.0% | Loan Payoff: | $37,385,333 | 65.6% | |
| Return of Equity: | $15,590,964 | 27.4% | ||||
| Closing Costs: | $2,701,624 | 4.7% | ||||
| Upfront Reserves: | $1,322,079 | 2.3% | ||||
| Total Sources: | $57,000,000 | 100.0% | Total Uses: | $57,000,000 | 100.0% | |
| (1) | The Guarantors for the West Michigan Industrial Portfolio Mortgage Loan (as defined below) are CORE Realty Holdings Management, Inc., Norman Arnold, Lawrence Wesley Beans, Ellen Franklin Beans, Cynthia Berkovich, Christina Y. Christensen, Joy A. Degroot, Ruth T. Demartini, Bryan J. Foertsch, James Kopeikin, Richard Craig Lugo, Margaret L. Lynch, Gary D. Massa, Phillip McGee, Gloria McGee, Sharon D. Metsch, Kevin E. Pascoe, Linda J. Perdue, Severn M. Perona, Patrick B. Quast, Brian C. Rees, Audrey I. Rees, Gary A. Romano, Joan K. Roth, Henry C. Sander, Sophia Sander, Sydney Kopeikin, Ken Thwaits, David F. Walker, Sharon L. Walker, Stephen A. Whitlock, Jeffrey C. Young and Jane S. Young. |
| (2) | See “Escrows and Reserves” section below for further discussion. |
| (3) | See “Portfolio Summary” section below. |
| (4) | Appraised Value (as of) reflects the portfolio appraised value which includes a 3.1% portfolio premium. The aggregate “as-is” appraised value is $96,050,000. Based on the aggregate “as-is” value the Cut-off Date LTV Ratio and Maturity Date LTV Ratio are 59.3%. |
The Mortgage Loan. The fourth largest mortgage loan (the “West Michigan Industrial Portfolio Mortgage Loan”) is evidenced by one promissory note in the original principal amount of $57,000,000. The West Michigan Industrial Portfolio Mortgage Loan was originated by Citi Real Estate Funding Inc. The West Michigan Industrial Portfolio Mortgage Loan is secured by a first priority fee mortgage encumbering ten industrial properties aggregating 1,696,701 SF (the “West Michigan Industrial Portfolio Properties”) located across the Grand Rapids-Wyoming metropolitan statistical area (“MSA”).
| THE INFORMATION IN THIS STRUCTURAL AND COLLATERAL TERM SHEET IS NOT COMPLETE AND MAY BE AMENDED PRIOR TO THE TIME OF SALE. THIS TERM SHEET IS NOT AN OFFER TO SELL THESE SECURITIES AND IT IS NOT A SOLICITATION OF AN OFFER TO BUY THESE SECURITIES IN ANY JURISDICTION WHERE THE OFFER OR SALE IS NOT PERMITTED. | ||
| 50 | ||
| Industrial – Various | Loan #4 | Cut-off Date Balance: | $57,000,000 | |
| Various | West Michigan Industrial Portfolio | Cut-off Date LTV: | 57.6% | |
| Various, MI Various | UW NCF DSCR: | 1.90x | ||
| UW NOI Debt Yield: | 12.6% |
The Borrowers and the Borrower Sponsor. The borrowers are CORE West Michigan Industrial S, LLC, TIC West Michigan Industrial 1, LLC, TIC West Michigan Industrial 2, LLC, TIC West Michigan Industrial 3, LLC, TIC West Michigan Industrial 4, LLC, TIC West Michigan Industrial 6, LLC, TIC West Michigan Industrial 7, LLC, TIC West Michigan Industrial 8, LLC, TIC West Michigan Industrial 9, LLC, TIC West Michigan Industrial 10, LLC, TIC West Michigan Industrial 12, LLC, TIC West Michigan Industrial 13, LLC, TIC West Michigan Industrial 15, LLC, TIC West Michigan Industrial 16, LLC, TIC West Michigan Industrial 18, LLC, TIC West Michigan Industrial 19, LLC, TIC West Michigan Industrial 21, LLC, TIC West Michigan Industrial 22, LLC, TIC West Michigan Industrial 25, LLC, TIC West Michigan Industrial 27, LLC, TIC West Michigan Industrial 29, LLC, TIC West Michigan Industrial 30, LLC, TIC West Michigan Industrial 31, LLC, TIC West Michigan Industrial 32, LLC, TIC West Michigan Industrial 33, LLC, TIC West Michigan Industrial 34, LLC and TIC West Michigan Industrial 35, LLC, as tenants in common, each a Delaware limited liability company and single purpose entity with one independent director (collectively, the “Borrowers”). The borrower sponsor and non-recourse carveout guarantor is CORE Realty Holdings Management, Inc. (“Core Realty”), an affiliate of Core Pacific Advisors. In addition, 31 individuals also serve as additional non-recourse carveout guarantors for the West Michigan Industrial Portfolio Mortgage Loan. Core Pacific Advisors, is an investment advisory and investment firm specializing in commercial real estate and related investments. Core Pacific Advisors portfolio includes 16 commercial assets which include 4,166,980 SF of industrial space.
The Properties. The West Michigan Industrial Portfolio Properties consist of a 1,696,701 SF, 10-building industrial portfolio located across the Grand Rapids – Wyoming MSA. The West Michigan Industrial Portfolio Properties are comprised of five warehouses, four warehouse and distribution facilities and one manufacturing center. The West Michigan Industrial Portfolio Properties were constructed between 1979 and 1990 and are situated on sites ranging in size from 4.0-acres to 15.7-acres. The West Michigan Industrial Portfolio Properties feature clear heights ranging from 18’ to 23’, 51 drive-in doors and 169 dock high doors. As of the underwritten rent rolls dated July 31, 2024, the West Michigan Industrial Portfolio Properties were 100.0% leased by 14 tenants. The West Michigan Industrial Portfolio Properties’ tenant base has a long occupancy history with a weighted average occupancy of 13.0 years as of the cut-off date.
| Portfolio Summary | ||||||||||||
Property Name(2) |
Location(1)(1) |
Year Built / Renovated(1)(1) |
Sq. Ft.(2) |
Occupancy(2) (2) |
Allocated Cut-off Date Balance | % of Allocated Cut-off Date Balance |
Appraised Value(1)(3) |
No. of Drive-in Doors(1) | No. of Dock High Doors(1) |
Clear Height (Ft.)(1) | ||
| 553 - 555 76th Street Southwest | Byron Center, MI | 1985 / NAP | 210,000 | 100.0% | $7,600,000 | 13.3% | $12,750,000 | 7 | 18 | 23’ | ||
| 3366 Kraft Avenue Southeast | Grand Rapids, MI | 1987 / NAP | 200,000 | 100.0% | $7,400,000 | 13.0% | $12,600,000 | 5 | 21 | 20’ | ||
| 8181 Logistics Drive | Zeeland, MI | 1989 / NAP | 234,575 | 100.0% | $7,100,000 | 12.5% | $12,000,000 | 6 | 16 | 23’ | ||
| 3300 Kraft Avenue Southeast | Grand Rapids, MI | 1987 / NAP | 200,000 | 100.0% | $7,100,000 | 12.5% | $11,950,000 | 3 | 22 | 23’ | ||
| 3232 Kraft Avenue Southeast | Grand Rapids, MI | 1989 / NAP | 216,000 | 100.0% | $6,900,000 | 12.1% | $11,350,000 | 6 | 18 | 23’ | ||
| 511 76th Street Southwest | Byron Center, MI | 1985 / NAP | 202,500 | 100.0% | $6,800,000 | 11.9% | $11,450,000 | 6 | 28 | 23’ | ||
| 425 Gordon Industrial Court Southwest | Byron Center, MI | 1990 / 1997 | 173,875 | 100.0% | $5,400,000 | 9.5% | $9,250,000 | 3 | 18 | 23’ | ||
| 2851 Prairie Street Southwest | Grandville, MI | 1989 / NAP | 117,251 | 100.0% | $4,100,000 | 7.2% | $6,950,000 | 4 | 10 | 21’ | ||
| 100 84th Street Southwest | Byron Center, MI | 1979 / NAP | 81,000 | 100.0% | $2,700,000 | 4.7% | $4,500,000 | 9 | 10 | 18’ | ||
| 5001 Kendrick Street Southeast | Grand Rapids, MI | 1984 / 1995 | 61,500 | 100.0% | $1,900,000 | 3.3% | $3,250,000 | 2 | 8 | 18’ | ||
| Total/ Wtd. Avg | 1,696,701 | 100.0% | $57,000,000 | 100.0% | $96,050,000 | 51 | 169 | 22’ | ||||
| (1) | Information is from the appraisals dated between August 8, 2024 and August 22, 2024. |
| (2) | Information is based on the underwritten rent rolls dated July 31, 2024. |
| (3) | The Appraised Values represent the “as-is” appraised values for each property and the aggregate “as-is” appraised value of $96,050,000. |
Major Tenants.
Sprinter Services, Inc. (400,000 SF, 23.6% of NRA, 26.6% of UW Rent). Sprinter Services, Inc. (“Sprinter”) warehouses and distributes raw and finished goods for Kellogg’s, Hearthside Foods, General Mills and Coca-Cola. Sprinter also provides logistics solutions for its clients’ supply chain, specializing in food and manufacturing support. Sprinter leases 200,000 SF of space at the 3300 Kraft Avenue Southeast property and 200,000 SF of space at the 3366 Kraft Avenue Southeast property. Sprinter has been a tenant at the 3300 Kraft Avenue Southeast property since February 2007 and at the 3366 Kraft Avenue Southeast property since January 2023 and has current lease terms through December 2028 and December 2027, respectively, with no renewal or termination options remaining.
The Empire Company, Inc. (234,575 SF, 13.8% of NRA, 12.5% of UW Rent). Founded in 1946, The Empire Company, Inc. (“Empire”) is a millwork distribution and manufacturing company offering millwork, molding and trim products. Empire has been a tenant at the 8181 Logistics Drive property since October 2005 and has a current lease term through October 2030 with no renewal or termination options remaining.
Jomar Qsub, Inc. (173,875 SF, 10.2% of NRA, 9.2% of UW Rent). Founded in 1974, Jomar Qsub, Inc. d/b/a New Life Transport Parts Center is a wholesale distributor of aftermarket and OEM heavy duty truck and trailer parts. Jomar Qsub, Inc. has been a tenant at the 425 Gordon Industrial Court Southwest property since May 2021 and has a current lease term through July 2028 with no renewal or termination options remaining.
| THE INFORMATION IN THIS STRUCTURAL AND COLLATERAL TERM SHEET IS NOT COMPLETE AND MAY BE AMENDED PRIOR TO THE TIME OF SALE. THIS TERM SHEET IS NOT AN OFFER TO SELL THESE SECURITIES AND IT IS NOT A SOLICITATION OF AN OFFER TO BUY THESE SECURITIES IN ANY JURISDICTION WHERE THE OFFER OR SALE IS NOT PERMITTED. | ||
| 51 | ||
| Industrial – Various | Loan #4 | Cut-off Date Balance: | $57,000,000 | |
| Various | West Michigan Industrial Portfolio | Cut-off Date LTV: | 57.6% | |
| Various, MI Various | UW NCF DSCR: | 1.90x | ||
| UW NOI Debt Yield: | 12.6% |
The following table presents certain information relating to the tenancy at the West Michigan Industrial Portfolio Properties:
| Tenant Summary(1) | |||||||||||
Tenant Name |
Property |
Credit Rating (Moody’s/ Fitch/S&P)(2) |
Tenant SF |
Approx. % of SF |
Annual UW Rent |
% of Total Annual UW Rent |
Annual UW Rent PSF |
Lease Exp. |
Renewal Options |
Term. Option (Y/N) | |
| Major Tenants | |||||||||||
| Sprinter Services, Inc. | 3366 Kraft Avenue Southeast, 3300 Kraft Avenue Southeast | NR/NR/NR | 400,000 | 23.6% | $2,071,227 | 26.6% | $5.18 | Various | N | N | |
| The Empire Company, Inc. | 8181 Logistics Drive | NR/NR/NR | 234,575 | 13.8% | $973,138 | 12.5% | $4.15 | 10/31/2030 | N | N | |
| Jomar Qsub, Inc. | 425 Gordon Industrial Court Southwest | NR/NR/NR | 173,875 | 10.2% | $719,721 | 9.2% | $4.14 | 7/31/2028 | N | N | |
| Scott Group Custom Carpets | 3232 Kraft Avenue Southeast | NR/NR/NR | 171,750 | 10.1% | $688,170 | 8.8% | $4.01 | 11/30/2029 | 1 x 5 yr | N | |
| BPV, LLC | 511 76th Street Southwest | NR/NR/NR | 140,000 | 8.3% | $623,000 | 8.0% | $4.45 | 12/31/2027 | N | N | |
| Major Tenants Subtotal/Wtd. Avg. | 1,120,200 | 66.0% | $5,075,256 | 65.2% | $4.53 | ||||||
| Other Tenants | 576,501 | 34.0% | $2,708,535 | 34.8% | $4.70 | ||||||
| Occupied Subtotal/Wtd. Avg. | 1,696,701 | 100.0% | $7,783,790 | 100.0% | $4.59 | ||||||
| Vacant Space | 0 | 0.0% | |||||||||
| Total/Wtd. Avg. | 1,696,701 | 100.0% | |||||||||
| (1) | Information is based on the underwritten rent rolls dated July 31, 2024, inclusive of rent steps through July 1, 2025. |
| (2) | Certain ratings are those of the parent company whether or not the parent guarantees the lease. |
| (3) | Sprinter Services, Inc. occupies 200,000 SF of space at the 3300 Kraft Avenue Southeast property that expires December 31, 2028 and 200,000 SF of space at the 3366 Kraft Avenue Southeast property that expires December 31, 2027. |
The following table presents certain information relating to the lease rollover schedule at the West Michigan Industrial Portfolio Properties:
| Lease Rollover Schedule(1)(2) | ||||||||
Year |
# of Leases Rolling |
SF Rolling |
Approx. % of SF Rolling |
Approx. Cumulative % of SF Rolling |
Total UW Rent Rolling |
Approx. % of Total UW Rent Rolling | Approx. Cumulative % of Total UW Rent Rolling |
UW Rent PSF Rolling |
| MTM/2025 | 1 | 61,500 | 3.6% | 3.6% | $256,110 | 3.3% | 3.3% | $4.16 |
| 2026 | 3 | 154,250 | 9.1% | 12.7% | $763,528 | 9.8% | 13.1% | $4.95 |
| 2027 | 4 | 400,000 | 23.6% | 36.3% | $1,980,987 | 25.5% | 38.5% | $4.95 |
| 2028 | 4 | 536,375 | 31.6% | 67.9% | $2,490,581 | 32.0% | 70.5% | $4.64 |
| 2029 | 2 | 192,750 | 11.4% | 79.3% | $775,988 | 10.0% | 80.5% | $4.03 |
| 2030 | 1 | 234,575 | 13.8% | 93.1% | $973,138 | 12.5% | 93.0% | $4.15 |
| 2031 | 0 | 0 | 0.0% | 93.1% | $0 | 0.0% | 93.0% | $0.00 |
| 2032 | 1 | 117,251 | 6.9% | 100.0% | $543,459 | 7.0% | 100.0% | $4.64 |
| 2033 | 0 | 0 | 0.0% | 100.0% | $0 | 0.0% | 100.0% | $0.00 |
| 2034 | 0 | 0 | 0.0% | 100.0% | $0 | 0.0% | 100.0% | $0.00 |
| 2035 & Thereafter | 0 | 0 | 0.0% | 100.0% | $0 | 0.0% | 100.0% | $0.00 |
| Vacant | 0 | 0 | 0.0% | 100.0% | $0 | 0.0% | 100.0% | $0.00 |
| Total/Wtd. Avg. | 16 | 1,696,701 | 100.0% | $7,783,790 | 100.0% | $4.59 | ||
| (1) | Information is based on the underwritten rent rolls dated July 31, 2024, inclusive of rent steps through July 1, 2025. |
| (2) | Certain tenants may have lease termination options that are exercisable prior to the originally stated expiration date of the related lease and are not considered in the lease rollover schedule. |
| THE INFORMATION IN THIS STRUCTURAL AND COLLATERAL TERM SHEET IS NOT COMPLETE AND MAY BE AMENDED PRIOR TO THE TIME OF SALE. THIS TERM SHEET IS NOT AN OFFER TO SELL THESE SECURITIES AND IT IS NOT A SOLICITATION OF AN OFFER TO BUY THESE SECURITIES IN ANY JURISDICTION WHERE THE OFFER OR SALE IS NOT PERMITTED. | ||
| 52 | ||
| Industrial – Various | Loan #4 | Cut-off Date Balance: | $57,000,000 | |
| Various | West Michigan Industrial Portfolio | Cut-off Date LTV: | 57.6% | |
| Various, MI Various | UW NCF DSCR: | 1.90x | ||
| UW NOI Debt Yield: | 12.6% |
The Market. The West Michigan Industrial Portfolio Properties are located across three submarkets of the West Michigan Industrial Market: Kent County (five properties), SE Grand Rapids Cascade (four properties), and Zeeland (one property). As of the trailing four quarters ended June 30, 2024, the West Michigan industrial market had inventory of 365,421,925 SF, a vacancy rate of 2.3% and overall triple net rent of $5.86 PSF. Nine of the properties are located within Kent County which had a 2024 population of 669,956 with an average household income of $108,149 while the 8181 Logistics Drive property is located in Ottawa County which had a 2024 population of 306,943 with an average household income of $110,900.
The 553 – 555 76th Street Southwest, 511 76th Street Southwest, 425 Gordon Industrial Court Southwest, 2851 Prairie Street Southwest and 100 84th Street Southwest properties are located in the Kent County industrial submarket. As of the trailing four quarters ended June 30, 2024, the Kent County Industrial submarket had inventory of 133,479,109 SF, a vacancy rate of 2.5% and overall triple net rent of $5.86 PSF.
The 3366 Kraft Avenue Southeast, 3300 Kraft Avenue Southeast, 3232 Kraft Avenue Southeast and 50001 Kendrick Street Southeast properties are located in the SE Grand Rapids Cascade industrial submarket. As of the trailing four quarters ended June 30, 2024, the Kent County Industrial submarket had inventory of 32,012,239 SF, a vacancy rate of 2.5% and overall triple net rent of $6.38 PSF.
The 8181 Logistics Drive property is located in the Zeeland industrial submarket. As of the trailing four quarters ended June 30, 2024, the Zeeland industrial submarket had inventory of 45,745,470 SF, a vacancy rate of 2.1% and overall triple net rent of $6.45 PSF.
The following table presents certain information relating to the submarkets at the West Michigan Industrial Portfolio Properties:
| Industrial Market Analysis(1) | ||||||
| Property Name / Address | Market | Submarket | Submarket Inventory (SF) | Submarket Vacancy | Sub market Rent (PSF) | UW Base Rent PSF(2) |
553 - 555 76th Street Southwest 553 and 555 76th Street Southwest Byron Center, MI |
West Michigan | Kent County |
133,479,109 |
2.50% |
$5.86 |
$4.98 |
3366 Kraft Avenue Southeast 3366 Kraft Avenue Southeast Grand Rapids, MI |
West Michigan | SE Grand Rapids Cascade |
32,012,239 |
2.50% |
$6.38 |
$5.46 |
8181 Logistics Drive 8181 Logistics Drive Zeeland, MI |
West Michigan | Zeeland |
45,745,470 |
2.10% |
$6.45 |
$4.15 |
3300 Kraft Avenue Southeast 3300 Kraft Avenue Southeast |
West Michigan | SE Grand Rapids Cascade |
32,012,239 |
2.50% |
$6.38 |
$4.89 |
3232 Kraft Avenue Southeast 3232 Kraft Avenue Southeast |
West Michigan |
SE Grand Rapids Cascade |
32,012,239 |
2.50% |
$6.38 |
$4.09 |
511 76th Street Southwest 511 76th Street Southwest |
West Michigan | Kent County |
133,479,109 |
2.50% |
$5.86 |
$4.63 |
425 Gordon Industrial Court Southwest 425 Gordon Industrial Court Southwest |
West Michigan | Kent County |
133,479,109 |
2.50% |
$5.86 |
$4.14 |
2851 Prairie Street Southwest 2851 Prairie Street Southwest |
West Michigan | Kent County |
133,479,109 |
2.50% |
$5.86 |
$4.64 |
100 84th Street Southwest 100 84th Street Southwest |
West Michigan | Kent County |
133,479,109 |
2.50% |
$5.86 |
$4.36 |
5001 Kendrick Street Southeast 5001 Kendrick Street Southeast |
West Michigan | SE Grand Rapids Cascade |
32,012,239 |
2.50% |
$6.38 |
$4.16 |
| (1) | Source: Appraisals dated between August 8, 2024 and August 22, 2024. |
| (2) | Based on the underwritten rent roll dated July 31, 2024, inclusive of rent steps through July 1, 2025. |
Appraisals. The appraisals concluded to an “as portfolio” value for the West Michigan Industrial Portfolio Properties of $99,000,000 as of August 8, 2024, which includes a 3.1% portfolio premium. The aggregate “as-is” appraised value is $96,050,000. Based on the aggregate “as-is” value the Cut-off Date LTV Ratio and Maturity Date LTV ratio are 59.3%.
Environmental Matters. The Phase I environmental site assessments dated August 27, 2024, identified aluminum and lead impacts above applicable standards that were found in one groundwater well each during investigation conducted in 2003 and in 2005, respectively, as a recognized environmental condition at the 100 84th Street Southwest property. See “Description of the Mortgage Pool – Environmental Considerations” in the prospectus.
| THE INFORMATION IN THIS STRUCTURAL AND COLLATERAL TERM SHEET IS NOT COMPLETE AND MAY BE AMENDED PRIOR TO THE TIME OF SALE. THIS TERM SHEET IS NOT AN OFFER TO SELL THESE SECURITIES AND IT IS NOT A SOLICITATION OF AN OFFER TO BUY THESE SECURITIES IN ANY JURISDICTION WHERE THE OFFER OR SALE IS NOT PERMITTED. | ||
| 53 | ||
| Industrial – Various | Loan #4 | Cut-off Date Balance: | $57,000,000 | |
| Various | West Michigan Industrial Portfolio | Cut-off Date LTV: | 57.6% | |
| Various, MI Various | UW NCF DSCR: | 1.90x | ||
| UW NOI Debt Yield: | 12.6% |
Operating History and Underwritten Net Cash Flow. The following table presents certain information relating to the historical operating performance and Underwritten Net Cash Flow at the West Michigan Industrial Portfolio Properties:
| Cash Flow Analysis(1) | |||||||
| 2020 | 2021 | 2022 | 2023 | 6/2024 TTM | UW | UW PSF | |
| Base Rent | $5,674,787 | $5,827,304 | $6,293,916 | $7,030,017 | $7,338,626 | $7,576,769 | $4.47 |
| Contractual Rent Steps | $0 | $0 | $0 | $0 | $0 | $207,021 | $0.12 |
| Gross Potential Rent | $5,674,787 | $5,827,304 | $6,293,916 | $7,030,017 | $7,338,626 | $7,783,790 | $4.59 |
| Reimbursements | $1,824,520 | $1,757,224 | $1,957,768 | $2,052,376 | $2,305,991 | $2,365,677 | $1.39 |
| Net Rentable Income | $7,499,307 | $7,584,528 | $8,251,684 | $9,082,393 | $9,644,617 | $10,149,467 | $5.98 |
| (Vacancy / Credit Loss) | $0 | $0 | $0 | $0 | $0 | ($507,473) | ($0.30) |
| Effective Gross Income | $7,499,307 | $7,584,528 | $8,251,684 | $9,082,393 | $9,644,617 | $9,641,994 | $5.68 |
| Management Fee | $224,979 | $227,536 | $247,551 | $272,472 | $289,339 | $385,680 | $0.23 |
| Real Estate Taxes | $836,230 | $845,484 | $867,791 | $909,878 | $930,922 | $956,982 | $0.56 |
| Insurance | $198,820 | $132,868 | $144,563 | $231,414 | $283,172 | $333,750 | $0.20 |
| Other Operating Expenses(2) | $644,176 | $728,369 | $787,325 | $873,016 | $811,113 | $811,113 | $0.48 |
| Total Operating Expenses | $1,904,205 | $1,934,256 | $2,047,230 | $2,286,780 | $2,314,545 | $2,487,525 | $1.47 |
| Net Operating Income | $5,595,102 | $5,650,272 | $6,204,455 | $6,795,613 | $7,330,072 | $7,154,469 | $4.22 |
| Replacement Reserves | $0 | $0 | $0 | $0 | $0 | $203,604 | $0.12 |
| TI/LC | $0 | $0 | $0 | $0 | $0 | $166,559 | $0.10 |
| Net Cash Flow | $5,595,102 | $5,650,272 | $6,204,455 | $6,795,613 | $7,330,072 | $6,784,305 | $4.00 |
| Occupancy (%) | 100.0% | 95.5% | 95.5% | 100.0% | 100.0% | 95.0%(3) | |
| NOI DSCR | 1.57x | 1.58x | 1.74x | 1.90x | 2.05x | 2.00x | |
| NCF DSCR | 1.57x | 1.58x | 1.74x | 1.90x | 2.05x | 1.90x | |
| NOI Debt Yield | 9.8% | 9.9% | 10.9% | 11.9% | 12.9% | 12.6% | |
| NCF Debt Yield | 9.8% | 9.9% | 10.9% | 11.9% | 12.9% | 11.9% | |
| (1) | Information is based on the underwritten rent roll dated July 31, 2024. |
| (2) | Other Operating Expenses represents payroll and benefits, contract services, general operating expenses, repairs and maintenance, utilities, and general and administrative expenses. |
| (3) | UW Occupancy represents economic occupancy. |
| THE INFORMATION IN THIS STRUCTURAL AND COLLATERAL TERM SHEET IS NOT COMPLETE AND MAY BE AMENDED PRIOR TO THE TIME OF SALE. THIS TERM SHEET IS NOT AN OFFER TO SELL THESE SECURITIES AND IT IS NOT A SOLICITATION OF AN OFFER TO BUY THESE SECURITIES IN ANY JURISDICTION WHERE THE OFFER OR SALE IS NOT PERMITTED. | ||
| 54 | ||
| Industrial – Various | Loan #4 | Cut-off Date Balance: | $57,000,000 | |
| Various | West Michigan Industrial Portfolio | Cut-off Date LTV: | 57.6% | |
| Various, MI Various | UW NCF DSCR: | 1.90x | ||
| UW NOI Debt Yield: | 12.6% |
Escrows and Reserves. At origination of the West Michigan Industrial Portfolio Mortgage Loan, the Borrowers deposited approximately (i) $246,912 into a real estate tax reserve account, (ii) $75,167 into an immediate repairs reserve; and (iii) $1,000,000 into a leasing reserve.
Real Estate Taxes – On each monthly payment date, the Borrowers are required to deposit an amount equal to 1/12th of the annual real estate tax payments that the lender estimates will be payable during the next ensuing 12 months into the real estate tax reserve account (initially estimated to be approximately $82,304).
Insurance – The loan documents require at the option of the lender, if the liability or casualty policies maintained by the Borrowers do not constitute an approved blanket or umbrella policy, or the lender requires a separate policy, ongoing monthly deposits into the insurance reserve equal to 1/12th of the amount which would be sufficient to pay the insurance premiums due for the renewal of coverage afforded by the insurance policies.
Replacement Reserve – On each monthly payment date, the Borrowers are required to deposit an amount equal to approximately $16,967 for replacements to the West Michigan Industrial Portfolio Properties.
TI/LC Reserve – On each monthly payment date during the continuance of a Trigger Period or Leasing Reserve Deposit Period (each as defined below), the Borrowers are required to deposit an amount equal to $25,000 for general tenant improvements and leasing commissions relating to the West Michigan Industrial Portfolio Properties; provided, however, that such monthly deposit shall not be required to the extent such deposit would cause the balance of the leasing reserve to exceed $1,000,000.
Lockbox and Cash Management. The West Michigan Industrial Portfolio Mortgage Loan is structured with a hard lockbox and springing cash management. The Borrowers were required to execute a lockbox account agreement and have the lockbox account in place within 30 days of the origination date, which actions have been completed. Within two business days after the establishment of the lockbox account, the Borrowers are required to deliver direction letters to each tenant at the West Michigan Industrial Portfolio Properties directing them to pay rent and other sums due to the lender-controlled lockbox account. From and after the establishment of the lockbox account, the Borrowers are required to (or cause the property manager to) immediately deposit all revenue derived from the West Michigan Industrial Portfolio Properties and received by the Borrowers or property manager into the lender-controlled lockbox account. All funds deposited into the lockbox account are required to be transferred on each business day to or at the direction of the Borrowers unless a Trigger Period exists and the lender elects in its sole discretion to deliver a restricted account notice, in which case all such funds will be required to be swept on each business day to a cash management account under the control of the lender to be applied and disbursed in accordance with the West Michigan Industrial Portfolio Mortgage Loan documents, and all excess cash flow funds remaining in the cash management account after the application of such funds in accordance with the West Michigan Industrial Portfolio Mortgage Loan documents may be held by the lender in an excess cash flow reserve account as additional collateral for the West Michigan Industrial Portfolio Mortgage Loan. Upon the cure of the applicable Trigger Period, so long as no other Trigger Period exists, the lender is required to return any amounts remaining on deposit in the excess cash flow reserve account to the Borrowers. Upon an event of default under the West Michigan Industrial Portfolio Mortgage Loan documents, the lender may apply funds to the debt in such priority as it may determine.
A “Trigger Period” means a period (A) commencing upon the earliest of (i) the occurrence and continuance of an event of default under the West Michigan Industrial Portfolio Mortgage Loan documents, (ii) the debt service coverage ratio being less than 1.20x and (iii) at any time from and after the date that is 12 months prior to the stated maturity date, the debt yield being less than 11.9%; and (B) expiring upon (x) with regard to clause (i) above, the cure (if applicable) of such event of default under the West Michigan Industrial Portfolio Mortgage Loan documents and (y) with regard to clause (ii) above, the date that the debt service coverage ratio is equal to or greater than 1.25x for two consecutive calendar quarters. The West Michigan Industrial Portfolio Mortgage Loan documents do not provide for the expiration of a Trigger Period commenced in connection with clause (iii) above.
A “Leasing Reserve Deposit Period” means any period commencing on any date on which the balance of funds in the leasing reserve is less than $400,000, and ending on the first date thereafter on which the balance of funds in the leasing reserve is $1,000,000.
Release of Property. Provided that no event of default is continuing under the West Michigan Industrial Portfolio Mortgage Loan documents, at any time prior to November 6, 2034 (other than a period beginning thirty days prior to and ending thirty days following the closing date of the WFCM 2025-C64 securitization), the Borrowers may obtain the release of the 100 84th Street Southwest property (the “Release Property”) in connection with a sale of the Release Property to a third party pursuant to an arms-length transaction, provided that, among other conditions, (i) the Borrowers partially prepay the West Michigan Industrial Portfolio Mortgage Loan in an amount equal to $3,375,000 (the “Prepayment Amount”), together with a prepayment fee equal to the greater of 1% of the amount prepaid and a yield maintenance premium (unless the prepayment occurs on or after the open prepayment date), (ii) the Borrowers deliver a REMIC opinion if reasonably requested by the lender, (iii) after giving effect to the release, the debt service coverage ratio with respect to the remaining West Michigan Industrial Portfolio Properties is equal to or greater than 1.90x, (iv) after giving effect to the release, the debt yield with respect to the remaining West Michigan Industrial Portfolio Properties is equal to or greater than 11.90% and (v) after giving effect to the release, the loan-to-value ratio with respect to the remaining West Michigan Industrial Portfolio Properties is not greater than 57.6%. The Borrowers, in their sole discretion, may increase the Prepayment Amount to cause the requirements in clauses (iii), (iv) and (v) above to be satisfied.
Terrorism Insurance. The Borrowers are required to maintain or cause to be maintained an “all-risk” insurance policy that provides coverage for terrorism in an amount equal to the full replacement cost of the West Michigan Industrial Portfolio Properties and business interruption insurance that includes coverage for terrorism for a period of 18 months and contains an extended period of indemnity for up to sixty days (until renewed, at which point such required period increases to six months). See “Risk Factors—Risks Relating to the Mortgage Loans—Terrorism Insurance May Not Be Available for All Mortgaged Properties” in the prospectus.
| THE INFORMATION IN THIS STRUCTURAL AND COLLATERAL TERM SHEET IS NOT COMPLETE AND MAY BE AMENDED PRIOR TO THE TIME OF SALE. THIS TERM SHEET IS NOT AN OFFER TO SELL THESE SECURITIES AND IT IS NOT A SOLICITATION OF AN OFFER TO BUY THESE SECURITIES IN ANY JURISDICTION WHERE THE OFFER OR SALE IS NOT PERMITTED. | ||
| 55 | ||
| Retail – Outlet Center | Loan #5 | Cut-off Date Balance: | $45,900,055 | |
| 1155 Buck Creek Road | Outlet Shoppes of the Bluegrass | Cut-off Date LTV: | 60.4% | |
Simpsonville, KY 40067
| UW NCF DSCR: | 1.72x | ||
| UW NOI Debt Yield: | 14.2% |
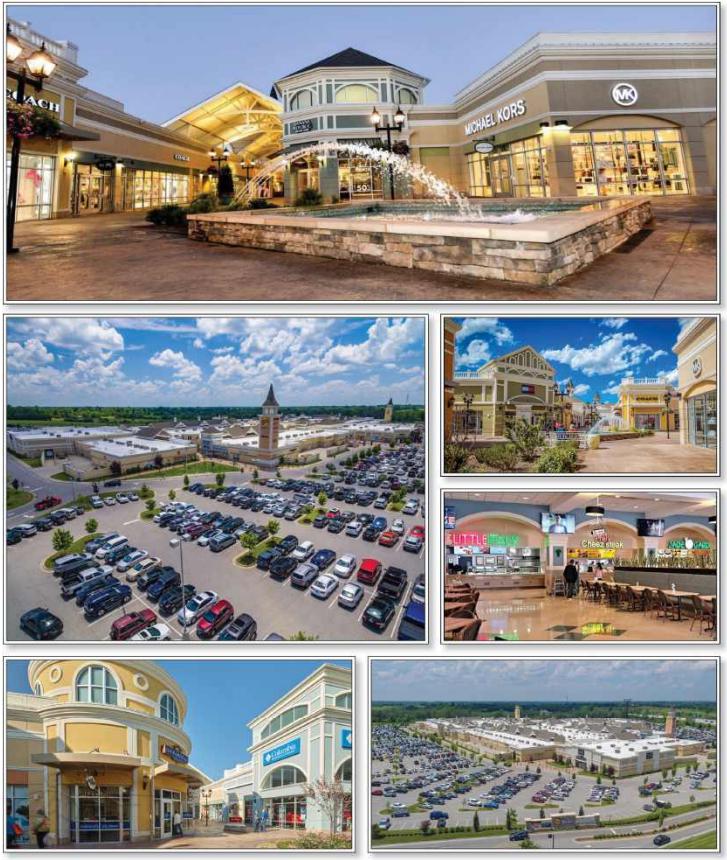
| THE INFORMATION IN THIS STRUCTURAL AND COLLATERAL TERM SHEET IS NOT COMPLETE AND MAY BE AMENDED PRIOR TO THE TIME OF SALE. THIS TERM SHEET IS NOT AN OFFER TO SELL THESE SECURITIES AND IT IS NOT A SOLICITATION OF AN OFFER TO BUY THESE SECURITIES IN ANY JURISDICTION WHERE THE OFFER OR SALE IS NOT PERMITTED. | ||
| 56 | ||
| Retail – Outlet Center | Loan #5 | Cut-off Date Balance: | $45,900,055 | |
| 1155 Buck Creek Road | Outlet Shoppes of the Bluegrass | Cut-off Date LTV: | 60.4% | |
Simpsonville, KY 40067
| UW NCF DSCR: | 1.72x | ||
| UW NOI Debt Yield: | 14.2% |
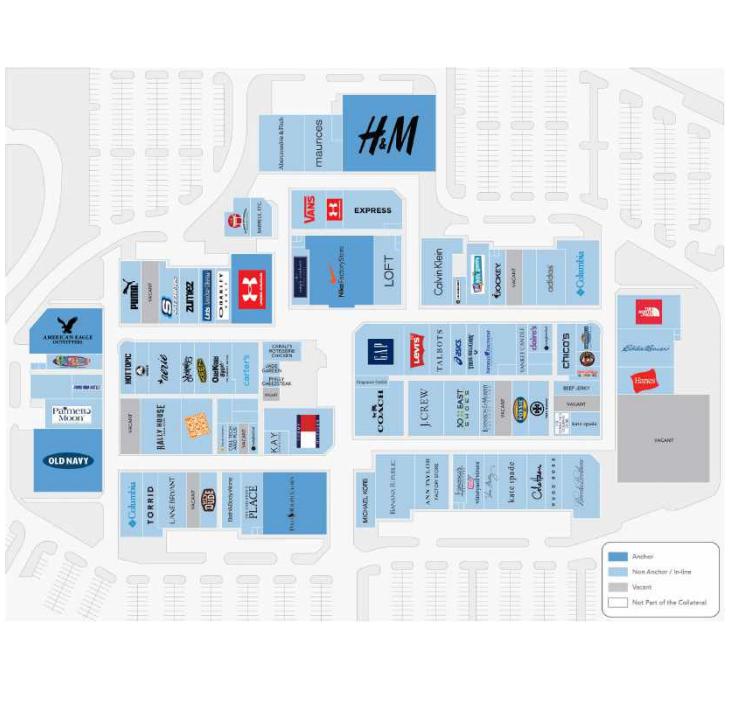
| THE INFORMATION IN THIS STRUCTURAL AND COLLATERAL TERM SHEET IS NOT COMPLETE AND MAY BE AMENDED PRIOR TO THE TIME OF SALE. THIS TERM SHEET IS NOT AN OFFER TO SELL THESE SECURITIES AND IT IS NOT A SOLICITATION OF AN OFFER TO BUY THESE SECURITIES IN ANY JURISDICTION WHERE THE OFFER OR SALE IS NOT PERMITTED. | ||
| 57 | ||
| Retail – Outlet Center | Loan #5 | Cut-off Date Balance: | $45,900,055 | |
| 1155 Buck Creek Road | Outlet Shoppes of the Bluegrass | Cut-off Date LTV: | 60.4% | |
Simpsonville, KY 40067
| UW NCF DSCR: | 1.72x | ||
| UW NOI Debt Yield: | 14.2% |
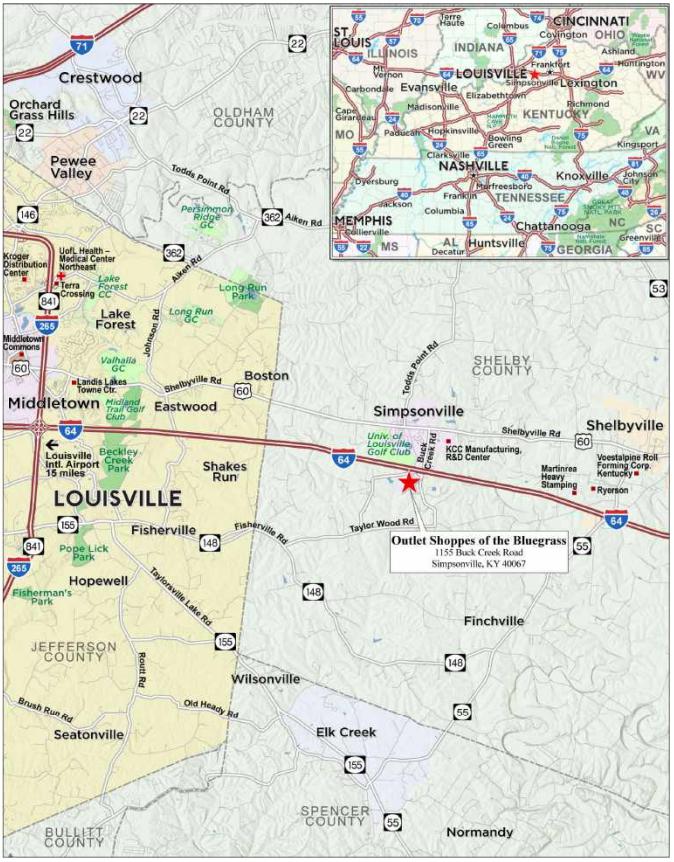
| THE INFORMATION IN THIS STRUCTURAL AND COLLATERAL TERM SHEET IS NOT COMPLETE AND MAY BE AMENDED PRIOR TO THE TIME OF SALE. THIS TERM SHEET IS NOT AN OFFER TO SELL THESE SECURITIES AND IT IS NOT A SOLICITATION OF AN OFFER TO BUY THESE SECURITIES IN ANY JURISDICTION WHERE THE OFFER OR SALE IS NOT PERMITTED. | ||
| 58 | ||
| Mortgage Loan No. 5 – Outlet Shoppes of the Bluegrass |
| Mortgage Loan Information | Property Information | ||||||
| Mortgage Loan Seller: | GSMC | Single Asset/Portfolio: | Single Asset | ||||
| Credit Assessment (Fitch/Moody’s/KBRA): | NR/NR/NR | Location: | Simpsonville, KY 40067 | ||||
| Original Balance(1): | $46,000,000 | General Property Type: | Retail | ||||
| Cut-off Date Balance(1): | $45,900,055 | Detailed Property Type: | Outlet Center | ||||
| % of Initial Pool Balance: | 5.6% | Title Vesting: | Fee | ||||
| Loan Purpose: | Refinance | Year Built/Renovated: | 2014, 2015/NAP | ||||
| Borrower Sponsors: | CBL & Associates Limited Partnership and Horizon Group Properties, Inc. | Size: | 428,074 SF | ||||
| Guarantors: | CBL & Associates Limited Partnership and Horizon Group Properties, Inc. | Cut-off Date Balance Per SF(1): | $154 | ||||
| Mortgage Rate: | 6.8380% | Maturity Date Balance Per SF(1): | $134 | ||||
| Note Date: | 10/31/2024 | Property Manager: | Horizon Group Properties, L.P. | ||||
| Maturity Date: | 11/6/2034 | (borrower affiliated) | |||||
| Term to Maturity: | 120 months | ||||||
| Amortization Term: | 360 months | Underwriting and Financial Information | |||||
| IO Period: | 0 months | UW NOI: | $9,383,499 | ||||
| Seasoning: | 3 months | UW NCF: | $8,930,399 | ||||
| Prepayment Provisions: | L(27),D(86),O(7) | UW NOI Debt Yield(1): | 14.2% | ||||
| Lockbox/Cash Mgmt Status: | Hard/Springing | UW NCF Debt Yield(1): | 13.6% | ||||
| Additional Debt Type(1): | Pari Passu | UW NOI Debt Yield at Maturity(1): | 16.4% | ||||
| Additional Debt Balance(1): | $19,956,546 | UW NCF DSCR(1): | 1.72x | ||||
| Future Debt Permitted (Type): | No (NAP) | Most Recent NOI: | $8,990,020 (8/31/2024 TTM) | ||||
| 2nd Most Recent NOI: | $9,420,943 (12/31/2023) | ||||||
| Reserves(2) | 3rd Most Recent NOI: | $9,036,411 (12/31/2022) | |||||
| Type | Initial | Monthly | Cap | Most Recent Occupancy: | 90.2% (10/30/2024) | ||
| RE Taxes: | $0 | $59,050 | NAP | 2nd Most Recent Occupancy: | 96.0% (12/31/2023) | ||
| Insurance: | $0 | Springing | NAP | 3rd Most Recent Occupancy: | 94.6% (12/31/2022) | ||
| Replacement Reserves: | $0 | $5,351 | $256,844 | Appraised Value (as of): | $109,100,000 (9/26/2024) | ||
| TI/LC Reserve: | $2,0000,000 | Springing | $1,000,000 | Appraised Value Per SF: | $255 | ||
| Outstanding TI/LC Reserve: | $84,982 | $0 | NAP | Cut-off Date LTV Ratio(1): | 60.4% | ||
| Maturity Date LTV Ratio(1): | 52.6% | ||||||
| Sources and Uses | ||||||
| Sources | Proceeds | % of Total | Uses | Proceeds | % of Total | |
| Whole Loan Amount | $66,000,000 | 100.0% | Loan Payoff | $61,690,303 | 93.5% | |
| Upfront Reserves | $2,084,982 | 3.2% | ||||
| Return of Equity | $1,204,485 | 1.8% | ||||
| Closing Costs | $1,020,230 | 1.5% | ||||
| Total Sources | $66,000,000 | 100.0% | Total Uses | $66,000,000 | 100.0% | |
| (1) | The Outlet Shoppes of the Bluegrass Mortgage Loan (as defined below) is part of the Outlet Shoppes of the Bluegrass Whole Loan (as defined below), which is comprised of two pari passu promissory notes with an aggregate original principal balance of $66,000,000. The Financial Information in the chart above is based on the Outlet Shoppes of the Bluegrass Whole Loan. See "The Mortgage Loan" below. |
| (2) | See “Escrows” below for further discussion of reserve information. |
The Mortgage Loan. The fifth mortgage loan (the “Outlet Shoppes of the Bluegrass Mortgage Loan”) is part of a whole loan (the “Outlet Shoppes of the Bluegrass Whole Loan”) evidenced by two notes issued to Bluegrass Outlet Shoppes CMBS 2024, LLC in the aggregate original principal amount of $66,000,000. The Outlet Shoppes of the Bluegrass Mortgage Loan is evidenced by the controlling Note A-1, which has an outstanding principal balance as of the Cut-off Date of $45,900,055. The Outlet Shoppes of the Bluegrass Mortgage Loan will be included in the WFCM 2025-C64 securitization trust and represents approximately 5.6% of the initial pool balance. The Outlet Shoppes of the Bluegrass Whole Loan was originated on October 31, 2024, by Goldman Sachs Bank USA (“GSBI”). The Outlet Shoppes of the Bluegrass Whole Loan is secured by the borrowers’ fee simple interest in a 428,074 square foot retail property located in Simpsonville, Kentucky (the "Outlet Shoppes of the Bluegrass Property"). The Outlet Shoppes of the Bluegrass Whole Loan has a 10-year amortizing balloon term and accrues interest a rate of 6.8380% per annum on an Actual/360 basis.
| THE INFORMATION IN THIS STRUCTURAL AND COLLATERAL TERM SHEET IS NOT COMPLETE AND MAY BE AMENDED PRIOR TO THE TIME OF SALE. THIS TERM SHEET IS NOT AN OFFER TO SELL THESE SECURITIES AND IT IS NOT A SOLICITATION OF AN OFFER TO BUY THESE SECURITIES IN ANY JURISDICTION WHERE THE OFFER OR SALE IS NOT PERMITTED. | ||
| 59 | ||
| Retail – Outlet Center | Loan #5 | Cut-off Date Balance: | $45,900,055 | |
| 1155 Buck Creek Road | Outlet Shoppes of the Bluegrass | Cut-off Date LTV: | 60.4% | |
Simpsonville, KY 40067
| UW NCF DSCR: | 1.72x | ||
| UW NOI Debt Yield: | 14.2% |
The table below identifies the promissory notes that comprise the Outlet Shoppes of the Bluegrass Whole Loan. The Outlet Shoppes of the Bluegrass Whole Loan will be serviced pursuant to the pooling and servicing agreement for the WFCM 2025-C64 securitization trust. The relationship between the holders of the Outlet Shoppes of the Bluegrass Whole Loan is governed by a co-lender agreement as described under “Description of the Mortgage Pool—The Whole Loans—The Serviced Pari Passu Whole Loans” and “The Pooling and Servicing Agreement” in the Preliminary Prospectus.
| Outlet Shoppes of the Bluegrass Whole Loan Summary | ||||
Note | Original Balance | Cut-off Date Balance | Note Holder | Controlling Piece |
| A-1 | $46,000,000 | $45,900,055 | WFCM 2025-C64 | Yes |
| A-2(1) | $20,000,000 | $19,956,546 | GSBI | No |
| Whole Loan | $66,000,000 | $65,856,600 | ||
| (1) | Expected to be contributed to a future securitization. |
The Borrower and the Borrower Sponsor. The borrower is Bluegrass Outlet Shoppes CMBS 2024, LLC, a Delaware limited liability company and special purpose entity with two independent directors in its organizational structure. Legal counsel to the borrower delivered a non-consolidation opinion in connection with the origination of the Outlet Shoppes of the Bluegrass Whole Loan. The borrower sponsors and non-recourse carveout guarantors are Horizon Group Properties, Inc., and CBL & Associates Limited Partnership.
The Property. The Outlet Shoppes of the Bluegrass Property is a multi-building, open-air retail center. The outlet center contains 428,074 square feet of net rentable area on a 44.49-acre parcel of land. The subject property is anchored by H&M, Nike Factory Store, Old Navy, Polo Ralph Lauren and adidas; there is also one vacant anchor position (a former Saks Off 5th). Each of the anchor stores are owned and leased to the respective retailers. The outlet center was constructed in two phases in 2014 and 2015.
Major Tenants.
H&M (22,142 SF, 5.2% of NRA, 1.4% of annual underwritten rent). Founded in 1947, H&M, part of the H&M Group, is a global fashion retailer offering a broad range of clothing and accessories for men, women and children. H&M has over 4,300 stores across 77 countries worldwide and is known for its commitment to affordable fashion.
Nike Factory Store (14,355 SF, 3.4% of NRA, 3.1% of annual underwritten rent). Nike Factory Store is a part of Nike, Inc., which sells athletic footwear, apparel, equipment, accessories and services and was founded in 1964 by Philip Knight.
Old Navy (13,266 SF, 3.1% of NRA, 2.3% of annual underwritten rent). Old Navy is a North American value apparel brand. Old Navy opened its first store in 1994 in the United States and since then has expanded to more than 1,200 Company-operated stores in the U.S. and Canada, as well as franchise stores around the world.
| THE INFORMATION IN THIS STRUCTURAL AND COLLATERAL TERM SHEET IS NOT COMPLETE AND MAY BE AMENDED PRIOR TO THE TIME OF SALE. THIS TERM SHEET IS NOT AN OFFER TO SELL THESE SECURITIES AND IT IS NOT A SOLICITATION OF AN OFFER TO BUY THESE SECURITIES IN ANY JURISDICTION WHERE THE OFFER OR SALE IS NOT PERMITTED. | ||
| 60 | ||
| Retail – Outlet Center | Loan #5 | Cut-off Date Balance: | $45,900,055 | |
| 1155 Buck Creek Road | Outlet Shoppes of the Bluegrass | Cut-off Date LTV: | 60.4% | |
Simpsonville, KY 40067
| UW NCF DSCR: | 1.72x | ||
| UW NOI Debt Yield: | 14.2% |
The following table presents the Tenant Summary at the Outlet Shoppes of the Bluegrass Property:
| Tenant Summary(1) | ||||||||||||||
| July 2024 TTM Sales | ||||||||||||||
| Tenant Name | Credit Rating (Moody’s/ Fitch/S&P)(2) | Tenant SF | Approx. % of SF | Annual UW Rent(3) | % of Total Annual UW Rent | Annual UW Rent PSF | Sales $ | Sales PSF | Occ Cost % | Lease Exp. | Renewal Options | Term. Option (Y/N) | ||
| Major Tenants | ||||||||||||||
| H&M | NR/NR/BBB | 22,142 | 5.2% | $178,187 | 1.4% | $8.05 | $2,545,530 | $115 | 7.0% | 1/31/2026 | 3 x 5 yrs | Y(4) | ||
| Nike Factory Store | A1/NR/AA- | 14,355 | 3.4% | $409,118 | 3.1% | $28.50 | $11,911,389 | $830 | 3.4% | 1/31/2030 | 1 x 5 yrs | N | ||
| Old Navy | Ba3/NR/BB | 13,266 | 3.1% | $307,092 | 2.3% | $23.15 | $4,705,176 | $355 | 6.5% | 7/31/2029 | None | N | ||
| Polo Ralph Lauren | A3/NR/A- | 12,317 | 2.9% | $107,549 | 0.8% | $8.73 | $3,584,953 | $291 | 3.0% | 7/31/2029 | 3 x 5 yrs | N | ||
| Under Armour(5) | Ba2/NR/BB- | 11,053 | 2.6% | $414,712 | 3.2% | $37.52 | $7,191,808 | $651 | 5.8% | 7/31/2029 | None | N | ||
| adidas | A3/NR/A- | 10,203 | 2.4% | $429,082 | 3.3% | $42.05 | $4,024,536 | $394 | 10.7% | 3/31/2032 | None | N | ||
| American Eagle | NR/NR/NR | 9,194 | 2.1% | $347,418 | 2.6% | $37.79 | $5,885,904 | $640 | 5.9% | 1/31/2028 | 1 x 5 yrs | N | ||
| Tommy Hilfiger | Baa3/NR/BBB- | 8,039 | 1.9% | $292,132 | 2.2% | $36.34 | $2,038,771 | $254 | 14.3% | 7/31/2029 | None | N | ||
| Abercrombie & Fitch | NR/NR/BB | 8,000 | 1.9% | $332,092 | 2.5% | $41.51 | $2,641,842 | $330 | 12.6% | 10/31/2025 | None | N | ||
| Gap Outlet | Ba3/NR/BB | 7,836 | 1.8% | $184,945 | 1.4% | $23.60 | $2,880,724 | $368 | 6.4% | 7/31/2029 | None | N | ||
| Major Tenants Subtotal/Wtd. Avg. | 116,405 | 27.2% | $3,002,327 | 22.9% | $25.79 | $47,410,633 | $407 | 6.3% | ||||||
| Other Tenants | 269,848 | 63.0% | $10,113,712 | 77.1% | $37.48 | $97,369,562 | $361 | 10.4% | ||||||
| Occupied Subtotal/Wtd. Avg. | 386,253 | 90.2% | $13,116,039 | 100.0% | $33.96 | $144,780,195 | $375 | 9.1% | ||||||
| Vacant Space | 41,821 | 9.8% | ||||||||||||
| Total/Wtd. Avg. | 428,074 | 100.0% | ||||||||||||
| (1) | Based on the underwritten rent roll dated October 30, 2024. |
| (2) | Credit Ratings are those of the parent company, whether or not the parent company guarantees the lease. |
| (3) | Inclusive of rent steps, overage rent and marketing recovery. |
| (4) | H&M has an ongoing right to terminate its lease with nine months’ notice until the lease expiration date on January 31, 2026. |
| (5) | Includes 2,206 SF of storage space and $18,000 of UW Rent attributable to Under Armour. The storage lease is month-to-month. |
The following table presents certain information relating to the lease rollover schedule at the Outlet Shoppes of the Bluegrass Property:
| Lease Rollover Schedule(1) | ||||||||
| Year | # of Leases Rolling | SF Rolling | Approx. % of SF Rolling | Approx. Cumulative % of SF Rolling | Total UW Rent Rolling | Approx. % of Total UW Rent Rolling | Approx. Cumulative % of Total UW Rent Rolling | UW Rent PSF Rolling |
| MTM/2025 | 28 | 93,238 | 21.8% | 21.8% | $2,823,449 | 21.5% | 21.5% | $30.28 |
| 2026 | 9 | 41,288 | 9.6% | 31.4% | $995,668 | 7.6% | 29.1% | $24.12 |
| 2027 | 15 | 45,587 | 10.6% | 42.1% | $1,469,248 | 11.2% | 40.3% | $32.23 |
| 2028 | 7 | 35,168 | 8.2% | 50.3% | $1,209,425 | 9.2% | 49.5% | $34.39 |
| 2029 | 23 | 112,684 | 26.3% | 76.6% | $4,102,407 | 31.3% | 80.8% | $36.41 |
| 2030 | 7 | 40,128 | 9.4% | 86.0% | $1,565,447 | 11.9% | 92.8% | $39.01 |
| 2031 | 1 | 1,253 | 0.3% | 86.3% | $53,372 | 0.4% | 93.2% | $42.60 |
| 2032 | 1 | 10,203 | 2.4% | 88.7% | $429,082 | 3.3% | 96.4% | $42.05 |
| 2033 | 0 | 0 | 0.0% | 88.7% | $0 | 0.0% | 96.4% | $0.00 |
| 2034 | 0 | 0 | 0.0% | 88.7% | $0 | 0.0% | 96.4% | $0.00 |
| 2035 | 2 | 6,704 | 1.6% | 90.2% | $467,940 | 3.6% | 100.0% | $69.80 |
| 2036 & Thereafter | 0 | 0 | 0.0% | 90.2% | $0 | 0.0% | 100.0% | $0.00 |
| Vacant | 0 | 41,821 | 9.8% | 100.0% | $0 | 0.0% | 100.0% | $0.00 |
| Total/Wtd. Avg.(2) | 93 | 428,074 | 100.0% | $13,116,039 | 100.0% | $33.96 | ||
| (1) | Based on the underwritten rent roll dated October 30, 2024. |
| (2) | Total/Wtd. Avg. UW Rent PSF Rolling excludes vacant space. |
| THE INFORMATION IN THIS STRUCTURAL AND COLLATERAL TERM SHEET IS NOT COMPLETE AND MAY BE AMENDED PRIOR TO THE TIME OF SALE. THIS TERM SHEET IS NOT AN OFFER TO SELL THESE SECURITIES AND IT IS NOT A SOLICITATION OF AN OFFER TO BUY THESE SECURITIES IN ANY JURISDICTION WHERE THE OFFER OR SALE IS NOT PERMITTED. | ||
| 61 | ||
| Retail – Outlet Center | Loan #5 | Cut-off Date Balance: | $45,900,055 | |
| 1155 Buck Creek Road | Outlet Shoppes of the Bluegrass | Cut-off Date LTV: | 60.4% | |
Simpsonville, KY 40067
| UW NCF DSCR: | 1.72x | ||
| UW NOI Debt Yield: | 14.2% |
The Market. The Outlet Shoppes of the Bluegrass Property is located in the East retail submarket. According to a third party report, as of the second quarter of 2024, submarket vacancy is 10.2% and the submarket asking rent per SF is $21.66.
The following table presents the Competitive Properties of the Outlet Shoppes of the Bluegrass Property:
| Competitive Properties(1) | ||||||
| Property | City, State | Built / Renovated | Total GLA | Anchor Tenants | Sales/SF | Occupancy |
| Outlet Shoppes of the Bluegrass | Simpsonville, KY | 2014, 2015 / NAP | 428,074(2) | H&M Nike Factory Old Navy Polo Ralph Lauren adidas | $408 | 90.2%(2) |
| The Paddock Shops | Louisville, KY | 1999 / 2020 | 371,486 | Barnes & Noble DSW, Gap Pottery Barn REI, Ulta Williams Sonoma | N/A | 97% |
| Springhurst Towne Center | Louisville, KY | 1997 / 2023 | 877,044 | Meijer, Target T.J. Maxx, Cinemark OfficeMax, HomeGoods Old Navy, Liquor Barn and Party Mart O’Charley’s | N/A | 99% |
| Shelbyville Road Plaza | Louisville, KY | 1954 / 2001, 2007 | 420,330 | Jo-Anne Fabric Off Broadway Shoe Warehouse Quest Outdoors, World Market Guitar Center, Old Navy, Ross Trader Joe’s, Yudofsky Fur & Leather | N/A | 86% |
| Summit at Fritz Farm | Lexington, KY | 2016 / NAP | 219,536 | Whole Foods Market Pottery Barn Arhaus Apple Williams Sonoma | N/A | 99% |
| Cincinnati Premium Outlets | Monroe, OH | 2009 / NAP | 398,986 | Columbia, Gap Under Armour J. Crew Tommy Hilfiger Nike, Polo | $672 | 98% |
| Indiana Premium Outlets | Edinburgh, IN | 1989 / 2005 | 378,015 | Lee Wrangler Clearance Center Columbia adidas Coach, Polo Nike / Under Armour | $356 | 99% |
| Source: | Appraisal. |
| (1) | Based on the underwritten rent roll dated October 30, 2024. |
| (2) | Represents NRA at the Outlet Shoppes of the Bluegrass Property. |
Appraisal. According to the appraisal, the Outlet Shoppes of the Bluegrass Property had an “as-is” appraised value of $109,100,000 as of September 26, 2024.
Environmental Matters. According to the Phase I environmental report dated September 23, 2024, there was no evidence of any recognized environmental condition at the Outlet Shoppes of the Bluegrass Property.
| THE INFORMATION IN THIS STRUCTURAL AND COLLATERAL TERM SHEET IS NOT COMPLETE AND MAY BE AMENDED PRIOR TO THE TIME OF SALE. THIS TERM SHEET IS NOT AN OFFER TO SELL THESE SECURITIES AND IT IS NOT A SOLICITATION OF AN OFFER TO BUY THESE SECURITIES IN ANY JURISDICTION WHERE THE OFFER OR SALE IS NOT PERMITTED. | ||
| 62 | ||
| Retail – Outlet Center | Loan #5 | Cut-off Date Balance: | $45,900,055 | |
| 1155 Buck Creek Road | Outlet Shoppes of the Bluegrass | Cut-off Date LTV: | 60.4% | |
Simpsonville, KY 40067
| UW NCF DSCR: | 1.72x | ||
| UW NOI Debt Yield: | 14.2% |
Operating History and Underwritten Net Cash Flow. The following table presents certain information relating to the historical operating performance and underwritten net cash flow at the Outlet Shoppes of the Bluegrass Property:
| Cash Flow Analysis | ||||||
| 2021 | 2022 | 2023 | TTM August 2024 | U/W | U/W $ per Unit | |
| Base Rental Revenue | $7,642,587 | $8,788,888 | $9,046,201 | $9,044,341 | $9,311,687(1) | $21.75 |
| Credit Tenant Rent Steps | 0 | 0 | 0 | 0 | 79,098(2) | $0.18 |
| Overage / Percentage Rent | 2,140,357 | 1,911,755 | 1,876,965 | 1,562,228 | 1,667,386(3) | $3.90 |
| Other Rental Revenue | 353,977 | 309,979 | 510,614 | 487,227 | 373,067 | $0.87 |
| Total Commercial Reimbursement Revenue | 1,995,212 | 2,370,857 | 2,408,306 | 2,506,087 | 2,546,006 | $5.95 |
| Market Revenue from Vacant Units | 0 | 0 | 0 | 0 | 996,830 | $2.33 |
| Potential Gross Revenue | $12,132,133 | $13,381,479 | $13,842,086 | $13,599,882 | $14,974,075 | $34.98 |
| Vacancy Loss | 0 | 0 | 0 | 0 | (996,830) | ($2.33) |
| Commercial Credit Loss | 190,783 | (31,510) | 40,315 | (54,175) | (103,412) | ($0.24) |
| Effective Gross Revenue | $12,322,916 | $13,349,969 | $13,882,401 | $13,545,707 | $13,873,832 | $32.41 |
| Real Estate Taxes | 631,912 | 690,164 | 686,880 | 658,396 | 708,600 | $1.66 |
| Insurance | 456,337 | 351,358 | 212,976 | 281,756 | 237,128 | $0.55 |
| Repairs & Maintenance | 1,751,255 | 1,805,135 | 1,946,040 | 1,931,364 | 1,958,645 | $4.58 |
| Management Fee(4) | 430,485 | 471,745 | 483,166 | 472,467 | 485,584 | $1.13 |
| Advertising | 833,243 | 836,743 | 933,790 | 1,055,161 | 978,448 | $2.29 |
| General and Administrative – Direct | 244,513 | 158,413 | 198,606 | 156,543 | 121,927 | $0.28 |
| Total Expenses | $4,347,745 | $4,313,558 | $4,461,458 | $4,555,687 | $4,490,333 | $10.49 |
| Net Operating Income | $7,975,171 | $9,036,411 | $9,420,943 | $8,990,020 | $9,383,499 | $21.92 |
| CapEx | 0 | 0 | 0 | 0 | 64,211 | $0.15 |
| TI/LC | 0 | 0 | 0 | 0 | 388,889 | $0.91 |
| Net Cash Flow | $7,975,171 | $9,036,411 | $9,420,943 | $8,990,020 | $8,930,399 | $20.86 |
| Occupancy | 86.8% | 94.6% | 96.0% | 90.2%(1) | 93.3%(5) | |
| NOI DSCR(6) | 1.54x | 1.74x | 1.82x | 1.73x | 1.81x | |
| NCF DSCR(6) | 1.54x | 1.74x | 1.82x | 1.73x | 1.72x | |
| NOI Debt Yield(6) | 12.1% | 13.7% | 14.3% | 13.7% | 14.2% | |
| NCF Debt Yield(6) | 12.1% | 13.7% | 14.3% | 13.7% | 13.6% | |
| (1) | Based on the underwritten rent roll dated October 30, 2024. |
| (2) | Based on the present value of straight-line rent step increments through lease term for IG tenants. |
| (3) | Based on TTM Sales and in-place breakpoints. Includes rent attributable to PIL tenants totaling $1,078,494. |
| (4) | Based on 3.5% Maximum Management Fee, although the contractual fee is 2.50%. |
| (5) | Represents UW Economic Occupancy. |
| (6) | Based on the Outlet Shoppes of the Bluegrass Whole Loan. |
Escrows and Reserves. At origination, the borrower deposited (a) $2,000,000 into a TI/LC reserve related to tenant improvement and leasing commission obligations and (b) $84,982.44 into an outstanding TI/LC reserve for outstanding leasing fees for 10 tenants identified in a schedule to the related loan agreement.
Tax Escrows – On each payment date the borrower is required to deposit into a real estate tax reserve an amount equal to 1/12 of the amount that the lender reasonably estimates will be necessary to pay real estate taxes over the next 12-month period, initially estimated to be $59,050.
Insurance Escrows – On each payment date, the borrower is required to deposit into an insurance reserve an amount equal to 1/12 of the amount that the lender reasonably estimates will be necessary to cover premiums over the next 12-month period (such reserve will be conditionally waived (i) so long as no event of default under the Outlet Shoppes of the Bluegrass Whole Loan documents has occurred and is continuing, and (ii) the borrower has provided evidence that insurance satisfying the requirements set forth in the Outlet Shoppes of the Bluegrass Whole Loan documents has been obtained under one or more blanket insurance policies and insurance premiums have been paid in accordance with the requirements of the Outlet Shoppes of the Bluegrass Whole Loan documents).
| THE INFORMATION IN THIS STRUCTURAL AND COLLATERAL TERM SHEET IS NOT COMPLETE AND MAY BE AMENDED PRIOR TO THE TIME OF SALE. THIS TERM SHEET IS NOT AN OFFER TO SELL THESE SECURITIES AND IT IS NOT A SOLICITATION OF AN OFFER TO BUY THESE SECURITIES IN ANY JURISDICTION WHERE THE OFFER OR SALE IS NOT PERMITTED. | ||
| 63 | ||
| Retail – Outlet Center | Loan #5 | Cut-off Date Balance: | $45,900,055 | |
| 1155 Buck Creek Road | Outlet Shoppes of the Bluegrass | Cut-off Date LTV: | 60.4% | |
Simpsonville, KY 40067
| UW NCF DSCR: | 1.72x | ||
| UW NOI Debt Yield: | 14.2% |
Replacement Reserve – On each payment date, the borrower is required to deposit approximately $5,351 into a replacement reserve account for replacements and repairs required to be made to the Outlet Shoppes of the Bluegrass Property during the calendar year, subject to a cap of $256,844.
TI/LC Reserve – On each payment date that the sums on deposit in the TI/LC reserve account are less than $1,000,000, the borrower is required to deposit approximately $35,673 into such reserve account for tenant improvement and leasing commission obligations incurred following the origination date.
Outstanding TI/LC Reserve – During the term of the Outlet Shoppes of the Bluegrass Whole Loan, in connection with new leases or lease renewals, the borrower has the option to deposit additional amounts into the outstanding TI/LC reserve account and deliver an updated schedule of outstanding leasing fees to the lender in connection with such additional deposit.
A “Trigger Period” means a period of time (A) commencing upon the earliest of (i) the occurrence of an event of default, (ii) the occurrence of an “event of default” under any mezzanine loan (if applicable) and (iii) the debt yield being less than 11.75% for two (2) consecutive calendar quarters; and (B) expiring upon (x) with regard to any Trigger Period commenced in connection with clause (i) above, the cure (if applicable) of such event of default, (y) with regard to any Trigger Period commenced in connection with clause (ii) above, the cure (if applicable) of such “event of default” and (z) with regard to any Trigger Period commenced in connection with clause (iii) above, the date that the Outlet Shoppes of the Bluegrass Property achieves a debt yield of at least 11.75% for two (2) consecutive calendar quarters. Notwithstanding the foregoing, a Trigger Period will not be deemed to expire in the event that a Trigger Period then exists for any other reason.
Lockbox / Cash Management. The Outlet Shoppes of the Bluegrass Whole Loan is structured with a hard lockbox and springing cash management. The borrower is required to deposit all rents into a lender-controlled lockbox account within two business days of receipt, and to direct all tenants to make direct rent deposits into the lockbox account. As long as a Trigger Period is not in effect, all funds in the lockbox account are required to be distributed to the borrower in accordance with the lockbox agreement. During the continuance of a Trigger Period, all funds in the lockbox will be transferred on a daily basis to a lender-controlled cash management account to be disbursed in accordance with the Outlet Shoppes of the Bluegrass Whole Loan documents, with any excess funds required to be held as additional security in an excess cash flow subaccount controlled by the lender for so long as the Trigger Period continues.
Real Estate Substitution. Not permitted.
Property Management. The Outlet Shoppes of the Bluegrass Property is managed by Horizon Group Properties, L.P., an affiliate of the borrower.
Subordinate and Mezzanine Indebtedness. None.
Permitted Future Subordinate or Mezzanine Debt. Not permitted.
Partial Release. The Outlet Shoppes of the Bluegrass Whole Loan documents permit the borrower to obtain a release of a designated parcel at the Bluegrass Property in connection with a transfer to third parties or affiliates of the borrower without the payment of a release price provided that, among other conditions, the borrower satisfies customary REMIC requirements.
Ground Lease. None.
Rights of First Offer / Rights of First Refusal. None.
Letter of Credit. None.
Terrorism Insurance. The borrower is required to obtain and maintain property insurance and business interruption insurance for 18 months plus an extended period of indemnity for continued loss of income after the physical loss to the improvements and the personal property has been repaired, until such income either returns to the same level it was at prior to the loss, or the expiration of six (6) months from the date that the Outlet Shoppes of the Bluegrass Property is repaired or replaced and operations are resumed, whichever first occurs. Such insurance is required to cover perils of terrorism and acts of terrorism. See “Risk Factors—Risks Relating to the Mortgage Loans—Terrorism Insurance May Not Be Available for All Mortgaged Properties” in the Preliminary Prospectus.
| THE INFORMATION IN THIS STRUCTURAL AND COLLATERAL TERM SHEET IS NOT COMPLETE AND MAY BE AMENDED PRIOR TO THE TIME OF SALE. THIS TERM SHEET IS NOT AN OFFER TO SELL THESE SECURITIES AND IT IS NOT A SOLICITATION OF AN OFFER TO BUY THESE SECURITIES IN ANY JURISDICTION WHERE THE OFFER OR SALE IS NOT PERMITTED. | ||
| 64 | ||
| Self Storage – Self Storage | Loan #6 | Cut-off Date Balance: | $45,000,000 | |
| 41-45 21st Street and 41-54 22nd Street | UOVO QPN | Cut-off Date LTV: | 60.9% | |
| Long Island City, New York 11101 | U/W NCF DSCR: | 1.47x | ||
| U/W NOI Debt Yield: | 9.7% |
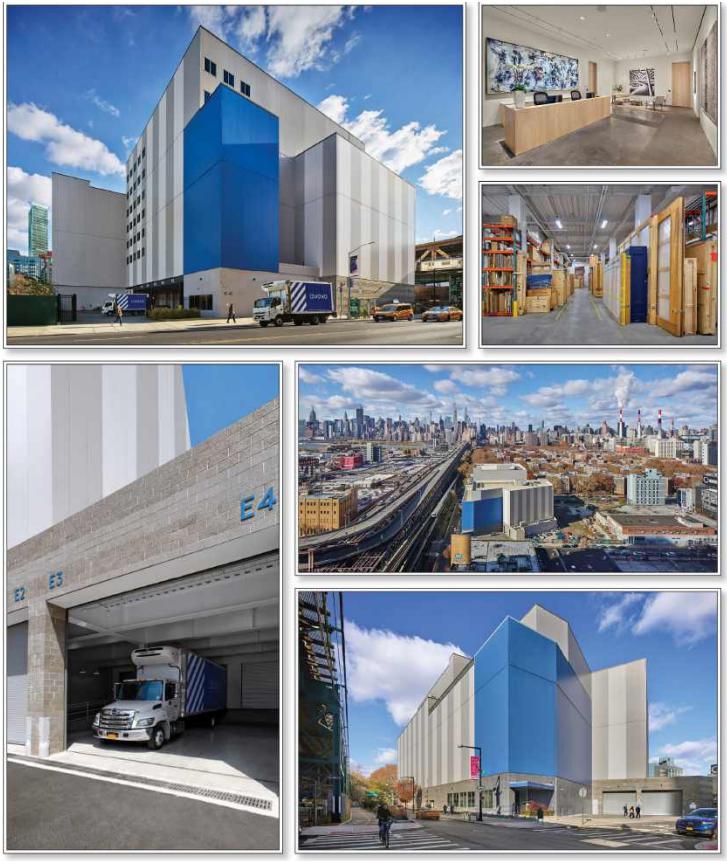
| THE INFORMATION IN THIS STRUCTURAL AND COLLATERAL TERM SHEET IS NOT COMPLETE AND MAY BE AMENDED PRIOR TO THE TIME OF SALE. THIS TERM SHEET IS NOT AN OFFER TO SELL THESE SECURITIES AND IT IS NOT A SOLICITATION OF AN OFFER TO BUY THESE SECURITIES IN ANY JURISDICTION WHERE THE OFFER OR SALE IS NOT PERMITTED. | ||
| 65 | ||
| Self Storage – Self Storage | Loan #6 | Cut-off Date Balance: | $45,000,000 | |
| 41-45 21st Street and 41-54 22nd Street | UOVO QPN | Cut-off Date LTV: | 60.9% | |
| Long Island City, New York 11101 | U/W NCF DSCR: | 1.47x | ||
| U/W NOI Debt Yield: | 9.7% |
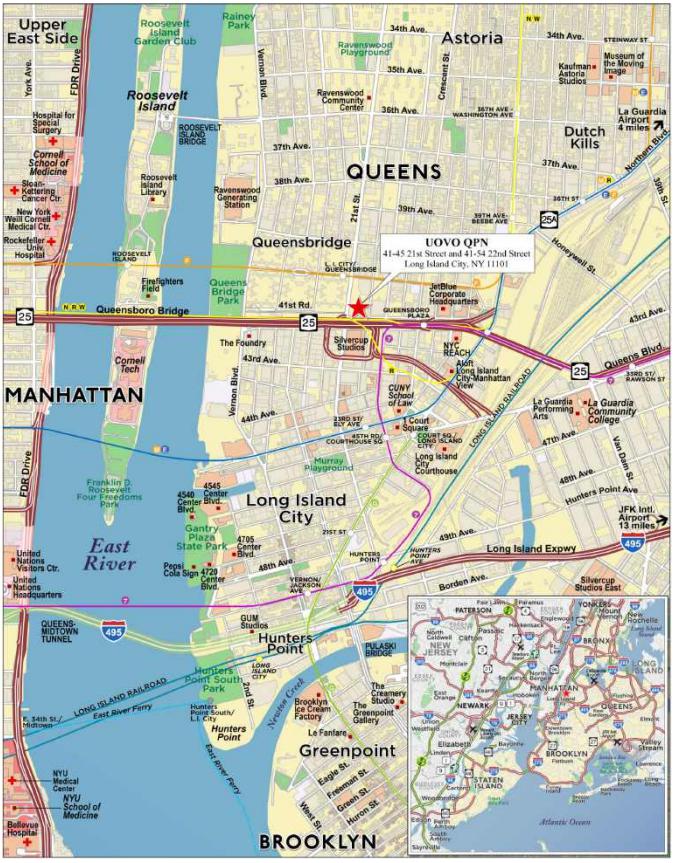
| THE INFORMATION IN THIS STRUCTURAL AND COLLATERAL TERM SHEET IS NOT COMPLETE AND MAY BE AMENDED PRIOR TO THE TIME OF SALE. THIS TERM SHEET IS NOT AN OFFER TO SELL THESE SECURITIES AND IT IS NOT A SOLICITATION OF AN OFFER TO BUY THESE SECURITIES IN ANY JURISDICTION WHERE THE OFFER OR SALE IS NOT PERMITTED. | ||
| 66 | ||
| Mortgage Loan No. 6 – UOVO QPN |
| Mortgage Loan Information | Property Information | ||||||
| Mortgage Loan Seller: | BMO | Single Asset/Portfolio: | Single Asset | ||||
| Credit Assessment (Moody’s/Fitch/KBRA): | NR/NR/NR | Location: | Long Island City, NY 11101 | ||||
| Original Balance(1): | $45,000,000 | General Property Type: | Self Storage | ||||
| Cut-off Date Balance(1): | $45,000,000 | Detailed Property Type: | Self Storage | ||||
| % of Initial Pool Balance: | 5.5% | Title Vesting: | Fee | ||||
| Loan Purpose: | Refinance | Year Built/Renovated: | 2013/NAP | ||||
| Borrower Sponsor: | Steven J. Guttman | Size: | 281,494 SF | ||||
| Guarantor: | Steven J. Guttman | Cut-off Date Balance per SF(1): | $508 | ||||
| Mortgage Rate: | 6.4850% | Maturity Date Balance per SF(1): | $508 | ||||
| Note Date: | 1/22/2025 | Property Manager: | UOVO Management LLC | ||||
| Maturity Date: | 2/6/2035 | Underwriting and Financial Information | |||||
| Term to Maturity: | 120 months | UW NOI: | $13,904,062 | ||||
| Amortization Term: | 0 months | UW NCF: | $13,861,838 | ||||
| IO Period: | 120 months | UW NOI Debt Yield(1): | 9.7% | ||||
| Seasoning: | 0 months | UW NCF Debt Yield(1): | 9.7% | ||||
| Prepayment Provisions(2): | L(24),DorYM1(89),O(7) | UW NOI Debt Yield at Maturity(1): | 9.7% | ||||
| Lockbox/Cash Mgmt Status: | Soft/Springing | UW NCF DSCR(1): | 1.47x | ||||
| Additional Debt Type(1): | Pari Passu | Most Recent NOI: | $12,841,638 (9/30/2024 TTM) | ||||
| Additional Debt Balance(1): | $98,000,000 | 2nd Most Recent NOI: | $13,136,852 (12/31/2023) | ||||
| Future Debt Permitted (Type)(1): | No (NAP) | 3rd Most Recent NOI: | $12,230,675 (12/31/2022) | ||||
| Most Recent Occupancy(4): | 87.3% (11/1/2024) | ||||||
| Reserves(3) | 2nd Most Recent Occupancy: | 91.4% (12/31/2023) | |||||
| Type | Initial | Monthly | Cap | 3rd Most Recent Occupancy: | 91.1% (12/31/2022) | ||
| RE Taxes: | $183,288 | $61,096 | NAP | Appraised Value (as of): | $234,900,000 (12/16/2024) | ||
| Insurance: | $0 | Springing | NAP | Appraised Value per SF: | $834 | ||
| Replacement Reserve: | $0 | Springing | NAP | Cut-off Date LTV Ratio(1): | 60.9% | ||
| Deferred Maintenance: | $14,300 | $0 | NAP | Maturity Date LTV Ratio(1): | 60.9% | ||
| Sources and Uses | ||||||
| Sources | Proceeds | % of Total | Uses | Proceeds | % of Total | |
| Whole Loan Amount: | $143,000,000 | 100.0% | Loan Payoff: | $75,832,056 | 53.0% | |
| Equity Repatriation: | $63,964,738 | 44.7% | ||||
| Closing Costs: | $3,005,619 | 2.1% | ||||
| Reserves: | $197,588 | 0.1% | ||||
| Total Sources: | $143,000,000 | 100.0% | Total Uses: | $143,000,000 | 100.0% | |
| (1) | The UOVO QPN Mortgage Loan (as defined below) is part of the UOVO QPN Whole Loan (as defined below), which is evidenced by six pari passu promissory notes with an aggregate original principal balance of $143,000,000. The Financial Information presented above is based on the aggregate original principal balance of the promissory notes comprising the UOVO QPN Whole Loan. See “The Mortgage Loan” below for further discussion. |
| (2) | The lockout period will be at least 24 payment dates beginning with and including the first payment date on March 6, 2025. Defeasance of the UOVO QPN Whole Loan is permitted after the date that is the earlier of (i) two years from the closing date of the securitization that includes the last note comprising a part of the UOVO QPN Whole Loan to be securitized and (ii) January 22, 2028. The assumed lockout period of 24 payments is based on the expected WFCM 2025-C64 securitization closing date in February 2025. The actual lockout period may be longer. |
| (3) | See “Escrows and Reserves” below for further discussion of reserve information. |
| (4) | Occupancy represents the occupancy percentage for the private storage space (measured in square feet). The managed storage space is measured in cubic feet and is 55.4% leased as of November 1, 2024. See “The Property” below for further discussion of the property type. |
The Mortgage Loan. The sixth largest mortgage loan (the “UOVO QPN Mortgage Loan”) is part of a fixed rate whole loan evidenced by six pari passu promissory notes with an aggregate outstanding principal balance as of the Cut-off Date of $143,000,000 (the “UOVO QPN Whole Loan”). The UOVO QPN Whole Loan is secured by the borrowers’ fee interest in 281,494 SF self storage property located in Long Island City, New York (the “UOVO QPN Property”). The UOVO QPN Whole Loan is evidenced by the controlling Note A-1, with an outstanding principal balance as of the Cut-off Date of $45,000,000. The UOVO QPN Whole Loan was originated by Bank of Montreal (“BMO”) on January 22, 2025. The UOVO QPN Whole Loan will be serviced pursuant to the pooling and servicing agreement for the WFCM 2025-C64 securitization trust. See “Description of the Mortgage Pool—The Whole Loans—The Serviced Pari Passu Whole Loans”, and “Pooling and Servicing Agreement” in the preliminary prospectus.
| THE INFORMATION IN THIS STRUCTURAL AND COLLATERAL TERM SHEET IS NOT COMPLETE AND MAY BE AMENDED PRIOR TO THE TIME OF SALE. THIS TERM SHEET IS NOT AN OFFER TO SELL THESE SECURITIES AND IT IS NOT A SOLICITATION OF AN OFFER TO BUY THESE SECURITIES IN ANY JURISDICTION WHERE THE OFFER OR SALE IS NOT PERMITTED. | ||
| 67 | ||
| Self Storage – Self Storage | Loan #6 | Cut-off Date Balance: | $45,000,000 | |
| 41-45 21st Street and 41-54 22nd Street | UOVO QPN | Cut-off Date LTV: | 60.9% | |
| Long Island City, New York 11101 | U/W NCF DSCR: | 1.47x | ||
| U/W NOI Debt Yield: | 9.7% |
| UOVO QPN Whole Loan Summary | ||||
| Note | Original Balance | Cut-off Date Balance | Note Holder | Controlling Note |
| Note A-1 | $45,000,000 | $45,000,000 | WFCM 2025-C64 | Yes |
| Note A-2(1) | $23,250,000 | $23,250,000 | BMO | No |
| Note A-3(1) | $24,700,000 | $24,700,000 | BMO | No |
| Note A-4(1) | $36,750,000 | $36,750,000 | GACC | No |
| Note A-5(1) | $6,650,000 | $6,650,000 | GACC | No |
| Note A-6(1) | $6,650,000 | $6,650,000 | GACC | No |
| Total | $143,000,000 | $143,000,000 | ||
| (1) | Expected to be contributed to one or more future securitization trust(s). |
The Borrowers and the Borrower Sponsor. The borrowers are QPN 1 DE LLC and QPN 10 DE LLC, each a Delaware limited liability company and single purpose entity with two independent directors. The borrower sponsor and the non-recourse carveout guarantor is Steven J. Guttman. Legal counsel to the borrowers delivered a non-consolidation opinion in connection with the origination of the UOVO QPN Whole Loan.
Steven J. Guttman is the founder of Storage Deluxe Management Company, a leading self storage developer in the New York City metropolitan area. The company has 84 projects completed and in development, totaling 8 million SF for a total investment in excess of $2.5 billion. Mr. Guttman is also an avid art collector and founded Storage Deluxe affiliate UOVO Fine Art Storage in 2014. Such affiliate was designed for the sole purpose of safe-guarding collections. UOVO’s privately-owned, state-of-the-art facilities are ideal for the long-term preservation and care of art, fashion, wine, archives, cultural artifacts, and rare objects. UOVO has art storage facilities (inclusive of the UOVO QPN Property) in major markets such as Los Angeles, Orange County, San Francisco, Aspen, Denver, Delaware, Miami, West Palm Beach, Brooklyn, Long Island City, Rockland County and Dallas Texas.
The Property. The UOVO QPN Property has 281,494 SF and 669 self storage units across two interconnected buildings located in Long Island City, New York. The UOVO QPN Property was developed in 2013 and is situated on a 1.27-acre site. The UOVO QPN Property is specially designed for fine art storage and contains two storage components: private storage on floors 3 through 8 (163,150 SF with 282 storage units), and managed/concierge storage on floors 1 through 3 (164,916 CF with 387 storage units). The UOVO QPN Property also serves as UOVO’s headquarters and features 20-foot clear heights, four enclosed loading docks, five covered loading docks, five viewing galleries, private meeting rooms, client café and two freight elevators.
Private Storage. According to the appraisal, the private storage (“Private Storage”) is similar to traditional self storage and is ideal for clients who prefer direct and frequent access to their works. Private storage includes individual locks, roll-up doors and 8- to 10-foot clear heights. Private storage space can be leased at a minimum of 50 SF and may range to over 20,000 SF. According to the appraisal, private storage is tailored to each specific client’s needs as they partner with an in-house designer to configure a customized plan with racking, lighting, flooring, and climate conditions best suited to their collection.
Managed Storage. According to the appraisal, the managed space (“Managed Storage”) functions on open-air racks within a fully controlled environment in terms of climate, temperature, humidity and UV filtration lighting. Managed storage is considered a more cost-effective option for clients with fluctuating inventory or temporary storage needs and is exclusively accessed and managed by an expert technical team and tracked using digital inventory. The Managed Storage space is leased by cubic feet on floors 1 through 3 as it consists of an open storage area optimized for large and small pieces of artwork.
The following table presents certain information relating to the Private Storage at the UOVO QPN Property:
| Unit Mix(1) | |||||||||
| Unit Type | Net Rentable Area (SF) | % of UW Rent | Occupied SF | Occupancy % (SF) | # of Units | % of Total Units | Occupied Units |
Avg. Actual Rent Per SF(2) |
Market Rent Per SF(3) |
| Private Storage | 163,150 | 82.1% | 142,410 | 87.3% | 282 | 42.2% | 249 | $98.45 | $54.00 - $102.00 |
| (1) | Based on the borrowers’ rent roll dated November 1, 2024. |
| (2) | Avg. Actual Rent Per SF is calculated using actual rent for occupied square feet and market rent for vacant square feet. |
| (3) | Source: Appraisal dated January 9, 2025. |
The following table presents certain information relating to the Managed Storage at the UOVO QPN Property:
| Unit Mix(1) | |||||||||
| Unit Type | Net Rentable Area (CF) | % of UW Rent | Occupied CF | Occupancy % (CF) | # of Units | % of Total Units | Occupied Units |
Avg. Actual Rent Per CF(2) |
Market Rent Per CF(3) |
| Managed Storage | 164,916 | 17.9% | 91,301 | 55.4% | 387 | 57.8% | 386 | $33.58 | $16.20 - $38.40 |
| (1) | Based on the borrowers’ rent roll dated November 1, 2024. |
| (2) | Avg. Actual Rent Per CF is calculated using actual rent for occupied cubic feet and market rent for vacant cubic feet. |
| (3) | Source: Appraisal dated January 9, 2025. |
The Market. The UOVO QPN Property is located in Long Island City, Queens County, New York. Long Island City is a residential and commercial neighborhood in the most western part of Queens, bordering the neighborhood of Astoria to the north, Sunnyside to the east, and Greenpoint to the South. The Long Island City neighborhood has undergone a transformation in recent years due to new high-rise developments, making the neighborhood increasingly residential, as well as new office and retail developments. The neighborhood’s mass transit infrastructure provides easy access to Manhattan, Brooklyn, the Bronx, and surrounding areas. Twelve New York City subway lines travel through Queens, as well as buses and the Long Island Railroad.
| THE INFORMATION IN THIS STRUCTURAL AND COLLATERAL TERM SHEET IS NOT COMPLETE AND MAY BE AMENDED PRIOR TO THE TIME OF SALE. THIS TERM SHEET IS NOT AN OFFER TO SELL THESE SECURITIES AND IT IS NOT A SOLICITATION OF AN OFFER TO BUY THESE SECURITIES IN ANY JURISDICTION WHERE THE OFFER OR SALE IS NOT PERMITTED. | ||
| 68 | ||
| Self Storage – Self Storage | Loan #6 | Cut-off Date Balance: | $45,000,000 | |
| 41-45 21st Street and 41-54 22nd Street | UOVO QPN | Cut-off Date LTV: | 60.9% | |
| Long Island City, New York 11101 | U/W NCF DSCR: | 1.47x | ||
| U/W NOI Debt Yield: | 9.7% |
Both the Long Island Expressway and the Brooklyn Queens Expressway run through the neighborhood. Additionally, two of the three major airports serving the New York City metropolitan area (LaGuardia Airport and JFK International Airport) are located in Queens. According to the appraisal, as of 2024, the total population in Queens is 2,356,325, the median household income is $83,331, and the most common job type is health care/social assistance.
According to the appraisal, the national art industry revenue is expected to have grown at a CAGR of 0.9% to $13.1 billion over the last 5 years up through 2024. The national art industry is expected to grow at a CAGR of 2.3% to $15.5 billion by the end of 2029. Additionally, the major concentrations of art dealership establishments in the U.S. are in California, Florida, and New York with New York being home to 14.1% of establishments in the country.
In New York City, several industrial, office, special-use, and retail buildings have converted to self storage. In May 2023, 41 East 21st Street completed the conversion of a four story, 50,000 SF parking garage into a self storage facility to be managed by CubeSmart. The CMX Cinema at 400 E 62nd Street is being converted into a 65,000 SF self storage facility by Manhattan Mini Storage. The Shell industrial building at 78 Walker has also been proposed for conversion.
The following table presents information regarding certain competitive properties to the UOVO QPN Property:
| Competitive Properties Summary(1) | |||||||||
| Property Name/Location | Year Built / Renovated |
Private Occupancy |
Square Feet (Private) |
Managed Occupancy | Cubic Feet (Managed) | Unit Type | Actual ($/SF) | Actual ($/CF) | Rent Per Annum (SF/CF) |
UOVO QPN 41-45 21st Street and 41-54 22nd Street Long Island City, NY(2) | 2013 / NAP |
87.3%
|
163,150
|
55.4% | 164,916 | Private Storage Managed Storage | $8.20 | $2.80 | $98.45 $33.58 |
105 Evergreen Ave Brooklyn, NY | 1955 / 2019 |
86.0% |
48,145
|
58.0%
| 330,000 | Private Storage Managed Storage | $8.22 | $1.60 | $98.64 $19.20 |
4200 Westgate Avenue Westgate, FL | 2023 / NAP (Lease-Up) |
41.0% |
9,765 |
9.0% | 177,000 | Private Storage Managed Storage | $6.77 | $2.25 | $81.24 $27.00 |
346 NW 29th Street Miami, FL | 2008 / NAP |
89.0% |
55,063 |
70.0% | 42,670 | Private Storage Managed Storage | $5.91 | $2.94 | $70.92 $35.28 |
1333 Lowrie Ave South San Francisco, CA | 2022 / NAP |
N/A |
N/A |
68.0% | 177,222 | Private Storage Managed Storage | N/A | $1.93 | N/A $23.16 |
101 Lake Drive Newark, DE | 1986 / NAP |
53.0% |
7,675 |
24.0% | 238,000 | Private Storage Managed Storage | $4.92 | $1.06 | $59.04 $12.72 |
130 South Myers Street Los Angeles, CA | 2024 / NAP (Lease-Up) |
80.0% |
3,675 |
12.0% | 118,000 | Private Storage Managed Storage | $9.20 | $1.09 | $110.40 $13.08 |
| (1) | Source: Appraisal. |
| (2) | Based on the borrowers’ rent roll dated November 1, 2024. |
Appraisal. The appraiser concluded to an “as-is” value for the UOVO QPN Property of $234,900,000 as of December 16, 2024.
Environmental Matters. According to the Phase I environmental site assessment dated December 31, 2024, there was no evidence of any recognized environmental conditions at the UOVO QPN Property.
| THE INFORMATION IN THIS STRUCTURAL AND COLLATERAL TERM SHEET IS NOT COMPLETE AND MAY BE AMENDED PRIOR TO THE TIME OF SALE. THIS TERM SHEET IS NOT AN OFFER TO SELL THESE SECURITIES AND IT IS NOT A SOLICITATION OF AN OFFER TO BUY THESE SECURITIES IN ANY JURISDICTION WHERE THE OFFER OR SALE IS NOT PERMITTED. | ||
| 69 | ||
| Self Storage – Self Storage | Loan #6 | Cut-off Date Balance: | $45,000,000 | |
| 41-45 21st Street and 41-54 22nd Street | UOVO QPN | Cut-off Date LTV: | 60.9% | |
| Long Island City, New York 11101 | U/W NCF DSCR: | 1.47x | ||
| U/W NOI Debt Yield: | 9.7% |
Operating History and Underwritten Net Cash Flow. The following table presents certain information relating to the historical operating performance and Underwritten Net Cash Flow at the UOVO QPN Property:
| Cash Flow Analysis | ||||||
| 2021 | 2022 | 2023 | 9/30/2024 TTM | UW | UW Per SF | |
| In-Place Rent (Private) | $12,987,102 | $13,375,690 | $13,627,670 | $13,442,957 | $13,782,417 | $48.96 |
| In-Place Rent (Managed) | 2,056,784 | 2,514,142 | 3,075,775 | 2,996,002 | 3,065,534 | 10.89 |
| Vacancy Lease-Up (Private) | 0 | 0 | 0 | 0 | 2,215,620 | 7.87 |
| Vacancy Lease-Up (Managed) | 0 | 0 | 0 | 0 | 2,471,707 | 8.78 |
| Contractual Rent Steps | 0 | 0 | 0 | 0 | 237,174 | 0.84 |
| Expense Recoveries | 93,476 | 79,734 | 107,350 | $107,189 | 108,407 | 0.39 |
| Gross Potential Rent(1) | $15,137,362 | $15,969,566 | $16,810,795 | $16,546,148 | $21,880,859 | $77.73 |
| Other Income(2) | ($1,914) | $232,314 | $346,630 | $343,631 | $370,989 | $1.32 |
| Net Rental Income | $15,135,447 | $16,201,880 | $17,157,425 | $16,889,779 | $22,251,847 | $79.05 |
| Discount Units (Private) | ($5,270) | ($36,025) | ($16,330) | ($16,265) | ($16,676) | ($0.06) |
| Discount Units (Managed) | (13,400) | (13,598) | (3,816) | 0 | 0 | 0.00 |
| In-Place Vacancy (Private) | 0 | 0 | 0 | 0 | (2,215,620) | (7.87) |
| In-Place Vacancy (Managed) | 0 | 0 | 0 | 0 | (2,471,707) | (8.78) |
| Effective Gross Income | $15,116,777 | $16,152,257 | $17,137,279 | $16,873,514 | $17,547,845 | $62.34 |
| Real Estate Taxes(3) | $428,914 | $511,658 | $563,172 | $623,887 | $751,970 | $2.67 |
| Insurance | 161,940 | 254,884 | 266,436 | 258,860 | 225,164 | 0.80 |
| Other Operating Expenses | 2,654,815 | 3,155,041 | 3,170,819 | 3,149,129 | 2,666,649 | 9.47 |
| Total Operating Expenses | $3,245,669 | $3,921,582 | $4,000,428 | $4,031,876 | $3,643,783 | $12.94 |
| Net Operating Income | $11,871,108 | $12,230,675 | $13,136,852 | $12,841,638 | $13,904,062 | $49.39 |
| Replacement Reserves | 0 | 0 | 0 | 0 | 42,224 | 0.15 |
| Net Cash Flow | $11,871,108 | $12,230,675 | $13,136,852 | $12,841,638 | $13,861,838 | $49.24 |
| Occupancy | 91.9% | 91.1% | 91.4% | 87.3%(4) | 78.6% | |
| NOI DSCR(5) | 1.26x | 1.30x | 1.40x | 1.37x | 1.48x | |
| NCF DSCR(5) | 1.26x | 1.30x | 1.40x | 1.37x | 1.47x | |
| NOI Debt Yield(5) | 8.3% | 8.6% | 9.2% | 9.0% | 9.7% | |
| NCF Debt Yield(5) | 8.3% | 8.6% | 9.2% | 9.0% | 9.7% | |
| (1) | UW Gross Potential Rent is based on the borrower rent roll dated November 1, 2024. |
| (2) | Other Income includes viewing room rent, private work space, and fortress payments. |
| (3) | The UOVO QPN Property benefits from a tax abatement program for 25 years. The Property receives 100% of the exemption benefit for the first 16 years, which then decreases each year thereafter by 10%. The physical improvements will be fully taxable in year 26. |
| (4) | Represents occupancy based on the borrower rent roll dated November 1, 2024. |
| (5) | The NOI DSCR, NCF DSCR, NOI Debt Yield, and NCF Debt Yield presented above is based on the aggregate original principal balance of the promissory notes comprising the UOVO QPN Whole Loan. |
Escrows and Reserves. At origination, the borrowers deposited into escrow (i) approximately $183,288 for real estate taxes and (ii) $14,300 for deferred maintenance.
Real Estate Taxes – On a monthly basis, the borrowers are required to escrow 1/12th of the annual estimated tax payments, which currently equates to approximately $61,096.
Insurance – If there is no approved blanket policy in place, the borrowers are required to escrow 1/12th of the annual estimated insurance payments on a monthly basis. The UOVO QPN Property is currently insured under a blanket insurance policy.
Replacement Reserves – On a monthly basis during a Triggering Event (as defined below), the borrowers are required to deposit approximately $3,519 for replacement reserves.
Lockbox and Cash Management. The UOVO QPN Whole Loan is structured with a soft lockbox and springing cash management. The borrowers are required to establish a lockbox account for the benefit of the lender, into which all rents and other revenue from the UOVO QPN Property are required to be deposited by the borrowers. During a Triggering Event, all funds in the lockbox account are required to be transferred to the lender-controlled cash management account on each business day and disbursed in accordance with the UOVO QPN Whole Loan documents. Also, during a Triggering Event, all excess cash is required to be collected by the lender and held as additional security for the UOVO QPN Whole Loan.
| THE INFORMATION IN THIS STRUCTURAL AND COLLATERAL TERM SHEET IS NOT COMPLETE AND MAY BE AMENDED PRIOR TO THE TIME OF SALE. THIS TERM SHEET IS NOT AN OFFER TO SELL THESE SECURITIES AND IT IS NOT A SOLICITATION OF AN OFFER TO BUY THESE SECURITIES IN ANY JURISDICTION WHERE THE OFFER OR SALE IS NOT PERMITTED. | ||
| 70 | ||
| Self Storage – Self Storage | Loan #6 | Cut-off Date Balance: | $45,000,000 | |
| 41-45 21st Street and 41-54 22nd Street | UOVO QPN | Cut-off Date LTV: | 60.9% | |
| Long Island City, New York 11101 | U/W NCF DSCR: | 1.47x | ||
| U/W NOI Debt Yield: | 9.7% |
A “Triggering Event” will commence upon the earliest of (i) the occurrence of an event of default under the UOVO QPN Whole Loan documents or (ii) the debt yield being less than 9.0%, and will expire upon (a) with respect to clause (i) above, the event of default has been cured or (b) with respect to clause (ii) above, the debt yield being at least 9.0% for two consecutive quarters.
Terrorism Insurance. The borrowers are required to obtain and maintain property insurance and is required to obtain and maintain business interruption insurance for 18 months of casualty and 12 months of extended period of indemnity. Such insurance is required to cover perils of terrorism and acts of terrorism; provided that if TRIPRA or a subsequent statute is in effect and covers both foreign and domestic acts of terror, the provisions of TRIPRA will determine the acts of terrorism for which coverage will be required. See “Risk Factors—Risks Relating to the Mortgage Loans—Terrorism Insurance May Not Be Available for All Mortgaged Properties” in the prospectus.
| THE INFORMATION IN THIS STRUCTURAL AND COLLATERAL TERM SHEET IS NOT COMPLETE AND MAY BE AMENDED PRIOR TO THE TIME OF SALE. THIS TERM SHEET IS NOT AN OFFER TO SELL THESE SECURITIES AND IT IS NOT A SOLICITATION OF AN OFFER TO BUY THESE SECURITIES IN ANY JURISDICTION WHERE THE OFFER OR SALE IS NOT PERMITTED. | ||
| 71 | ||
| Industrial - Various | Loan #7 | Cut-off Date Balance: | $30,000,000 | |
| Various | Phoenix Industrial Portfolio XII | Cut-off Date LTV: | 48.1% | |
| Various, Various | UW NCF DSCR: | 1.60x | ||
| UW NOI Debt Yield: | 11.7% |
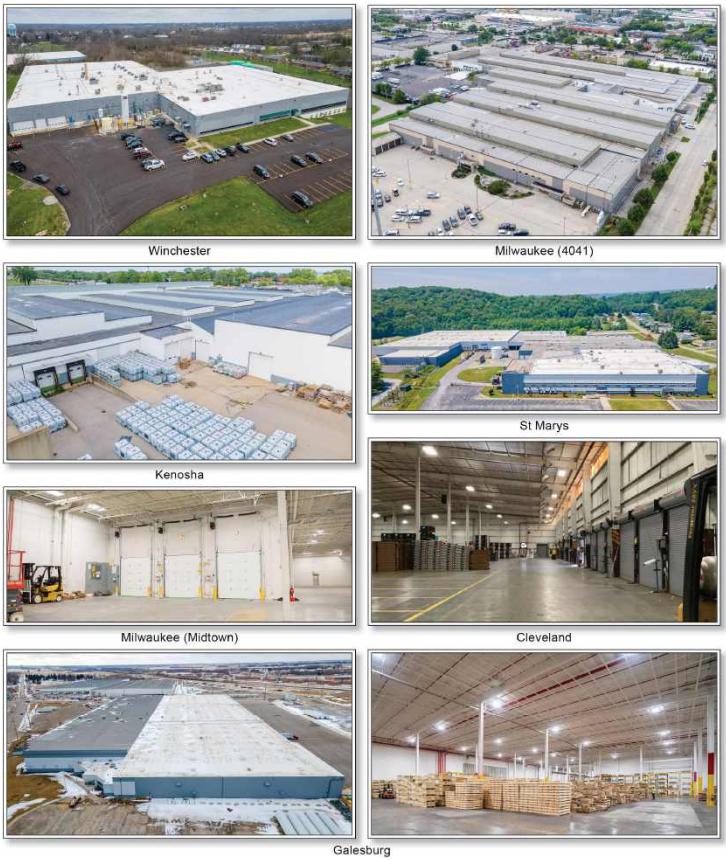
| THE INFORMATION IN THIS STRUCTURAL AND COLLATERAL TERM SHEET IS NOT COMPLETE AND MAY BE AMENDED PRIOR TO THE TIME OF SALE. THIS TERM SHEET IS NOT AN OFFER TO SELL THESE SECURITIES AND IT IS NOT A SOLICITATION OF AN OFFER TO BUY THESE SECURITIES IN ANY JURISDICTION WHERE THE OFFER OR SALE IS NOT PERMITTED. | ||
| 72 | ||
| Industrial - Various | Loan #7 | Cut-off Date Balance: | $30,000,000 | |
| Various | Phoenix Industrial Portfolio XII | Cut-off Date LTV: | 48.1% | |
| Various, Various | UW NCF DSCR: | 1.60x | ||
| UW NOI Debt Yield: | 11.7% |
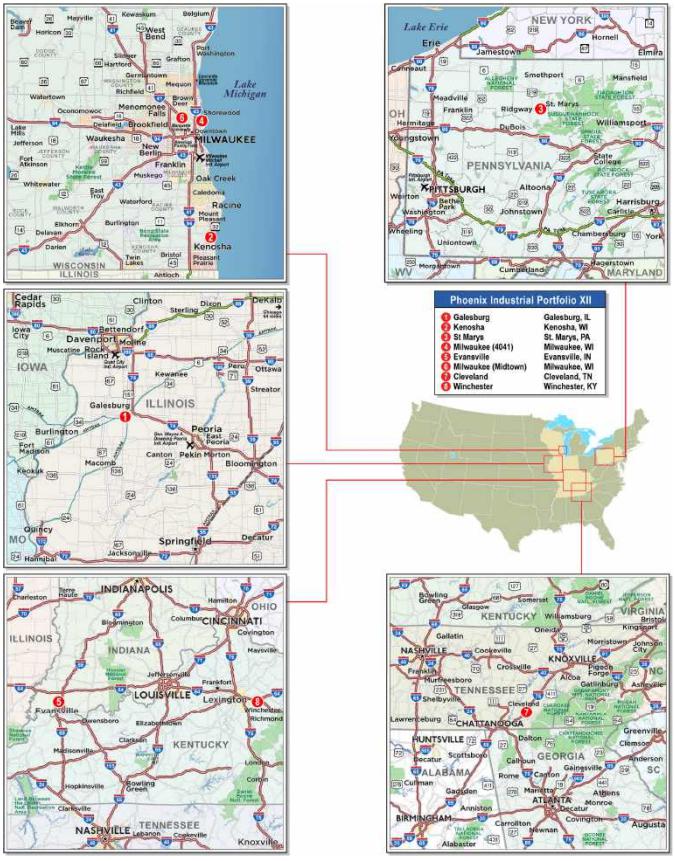
| THE INFORMATION IN THIS STRUCTURAL AND COLLATERAL TERM SHEET IS NOT COMPLETE AND MAY BE AMENDED PRIOR TO THE TIME OF SALE. THIS TERM SHEET IS NOT AN OFFER TO SELL THESE SECURITIES AND IT IS NOT A SOLICITATION OF AN OFFER TO BUY THESE SECURITIES IN ANY JURISDICTION WHERE THE OFFER OR SALE IS NOT PERMITTED. | ||
| 73 | ||
| Mortgage Loan No. 7 – Phoenix Industrial Portfolio XII |
| Mortgage Loan Information | Property Information | |||||
| Mortgage Loan Seller: | UBS AG | Single Asset/Portfolio: | Portfolio | |||
| Credit Assessment (Fitch/Moody’s/KBRA): | NR/NR/NR | Location: | Various, Various | |||
| Original Balance(1): | $30,000,000 | General Property Type: | Industrial | |||
| Cut-off Date Balance(1): | $30,000,000 | Detailed Property Type: | Various | |||
| % of Initial Pool Balance: | 3.6% | Title Vesting: | Fee | |||
| Loan Purpose: | Refinance | Year Built/Renovated: | Various/Various | |||
| Borrower Sponsor: | Phoenix Investors | Size: | 2,013,085 SF | |||
| Guarantor: | Phoenix Fund Symbol LLC | Cut-off Date Balance PSF(1): | $26 | |||
| Mortgage Rate: | 6.5500% | Maturity Balance PSF(1): | $26 | |||
| Note Date: | 11/26/2024 | Property Manager: | Phoenix Investors | |||
| Maturity Date: | 12/6/2034 | (borrower-related) | ||||
| Original Term to Maturity: | 120 months | Underwriting and Financial Information | ||||
| Original Amortization Term: | 0 months | UW NOI(4): | $6,133,248 | |||
| IO Period: | 120 months | UW NCF: | $5,585,579 | |||
| Seasoning: | 2 months | UW NOI Debt Yield(1): | 11.7% | |||
| Prepayment Provisions: | L(12),YM1(102),O(6) | UW NCF Debt Yield(1): | 10.6% | |||
| Lockbox/Cash Mgmt Status: | Hard/Springing | UW NOI Debt Yield at Maturity(1): | 11.7% | |||
| Additional Debt Type(1): | Pari Passu | UW NCF DSCR(1): | 1.60x | |||
| Additional Debt Balance(1): | $22,500,000 | Most Recent NOI(4): | $5,067,115 (9/30/2024 TTM) | |||
| Future Debt Permitted (Type): | Yes (Mezzanine) | 2nd Most Recent NOI(5): | NAV | |||
| Reserves(2) | 3rd Most Recent NOI(5): | NAV | ||||
| Type | Initial | Monthly | Cap | Most Recent Occupancy: | 81.1% (11/25/2024) | |
| RE Taxes: | $218,800 | $47,300 | NAP | 2nd Most Recent Occupancy(5): | NAV | |
| Insurance: | $0 | Springing | NAP | 3rd Most Recent Occupancy(5): | NAV | |
| Replacement Reserve: | $0 | $16,776 | $402,624 | Appraised Value (as of): | $109,050,000 (Various) | |
| TI/LC Reserve: | $2,000,000 | Springing | $1,000,000 | Appraised Value per SF: | $54 | |
| Immediate Repairs: | $362,940 | $0 | NAP | Cut-off Date LTV Ratio(1): | 48.1% | |
| Other Reserves(3): | $738,560 | Springing | NAP | Maturity Date LTV Ratio(1): | 48.1% | |
| Sources and Uses | ||||||
| Sources | Proceeds | % of Total | Uses | Proceeds | % of Total | |
| Whole Loan Amount(1): | $52,500,000 | 100.0% | Loan Payoff: | $34,998,785 | 66.7% | |
| Return of Equity: | $13,105,644 | 25.0% | ||||
| Upfront Reserves: | $3,320,300 | 6.3% | ||||
| Closing Costs(6): | $1,075,271 | 2.0% | ||||
| Total Sources: | $52,500,000 | 100.0% | Total Uses: | $52,500,000 | 100.0% | |
| (1) | The Phoenix Industrial Portfolio XII Mortgage Loan (as defined below) is part of the Phoenix Industrial Portfolio XII Whole Loan (as defined below) with an original aggregate principal balance of $52,500,000. The Cut-off Date Balance PSF, Maturity Date Balance PSF, UW NOI Debt Yield, UW NOI Debt Yield at Maturity, UW NCF DSCR, Cut-off Date LTV Ratio and Maturity Date LTV Ratio numbers presented above are based on the Phoenix Industrial Portfolio XII Whole Loan. |
| (2) | See “Escrows and Reserves” below for further discussion of reserve requirements. |
| (3) | Other Reserves consist of (i) $238,560 for unfunded obligations with respect to the Thrushwood Farms Quality Meats lease at the Galesburg property, (ii) $500,000 for capital expenditure work at the St Marys property and (iii) a monthly springing material tenant reserve. |
| (4) | The increase from Most Recent NOI to UW NOI is mainly attributable to (i) the lease up at the Galesburg property with the addition of the Thrushwood Farms Quality Meats lease at a base rent of $715,680 and (ii) approximately $152,068 of contractual rent steps through February 2026. |
| (5) | 2nd Most Recent NOI, 3rd Most Recent NOI, 2nd Most Recent Occupancy and 3rd Most Recent Occupancy are unavailable as the borrower sponsor acquired the Phoenix Industrial Portfolio XII Properties (as defined below) between 2015 and 2021. |
| (6) | Includes a St. Marys tax appeal reserve of $130,852, which was collected and held by the title company at origination. |
The Mortgage Loan. The seventh largest mortgage loan (the “Phoenix Industrial Portfolio XII Mortgage Loan”) is part of a whole loan (the “Phoenix Industrial Portfolio XII Whole Loan”) secured by first priority fee interests in a 2,013,085 square foot portfolio of eight industrial properties located in Wisconsin, Illinois, Pennsylvania, Indiana, Tennessee and Kentucky (each, a “Phoenix Industrial Portfolio XII Property”, and collectively, the “Phoenix Industrial Portfolio XII Properties”). The Phoenix Industrial Portfolio XII Whole Loan has an original aggregate principal balance of $52,500,000 and is comprised of four pari passu notes. The Phoenix Industrial Portfolio XII Mortgage Loan, with an original principal balance of $30,000,000 is evidenced by the controlling Note A-1 and non-controlling Note A-2-2. The Phoenix Industrial Portfolio XII Whole Loan will be serviced under the pooling and servicing agreement for the WFCM 2025-C64 securitization trust. See “Description of the Mortgage Pool—The Whole Loans—The Serviced Pari Passu Whole Loans” and “Pooling and Servicing Agreement—Servicing of the Serviced Mortgage Loans” in the prospectus.
| THE INFORMATION IN THIS STRUCTURAL AND COLLATERAL TERM SHEET IS NOT COMPLETE AND MAY BE AMENDED PRIOR TO THE TIME OF SALE. THIS TERM SHEET IS NOT AN OFFER TO SELL THESE SECURITIES AND IT IS NOT A SOLICITATION OF AN OFFER TO BUY THESE SECURITIES IN ANY JURISDICTION WHERE THE OFFER OR SALE IS NOT PERMITTED. | ||
| 74 | ||
| Industrial - Various | Loan #7 | Cut-off Date Balance: | $30,000,000 | |
| Various | Phoenix Industrial Portfolio XII | Cut-off Date LTV: | 48.1% | |
| Various, Various | UW NCF DSCR: | 1.60x | ||
| UW NOI Debt Yield: | 11.7% |
| Phoenix Industrial Portfolio XII Whole Loan Summary | ||||
| Note | Original Balance | Cut-off Date Balance | Note Holder | Controlling Note |
| A-1 | $25,000,000 | $25,000,000 | WFCM 2025-C64 | Yes |
| A-2-1 | $20,000,000 | $20,000,000 | BBCMS 2025-C32 | No |
| A-2-2 | $5,000,000 | $5,000,000 | WFCM 2025-C64 | No |
| A-3 | $2,500,000 | $2,500,000 | BBCMS 2025-C32 | No |
| Total | $52,500,000 | $52,500,000 | ||
The Borrowers and the Borrower Sponsor. The borrowers are Phoenix Galesburg III Industrial Investors LLC, Phoenix Winchester Industrial Investors LLC, Phoenix St. Marys Industrial Investors LLC, Phoenix Cleveland TN Industrial Investors II LLC, Phoenix Evansville LLC, Phoenix Midtown Industrial Investors LLC, Phoenix Richards Industrial Investors LLC and Phoenix Kenosha Industrial Investors LLC, each a Delaware limited liability company and a single purpose entity with one independent director. Legal counsel to the borrowers delivered a non-consolidation opinion in connection with the origination of the Phoenix Industrial Portfolio XII Whole Loan.
The borrower sponsor is Phoenix Investors, which is the affiliated management company for the guarantor’s investments. Phoenix Investors is a national commercial real estate firm based in Milwaukee, Wisconsin that redevelops former manufacturing facilities throughout the United States. Phoenix Investors’ affiliated companies hold interests in approximately 78 million square feet of industrial, retail, office and single tenant net-leased properties across 29 states. Phoenix Investors engages in the renovation and repositioning of large, former single tenant industrial facilities throughout the United States that were previously owned by corporate entities, real estate investment trusts or financial institutions. The non-recourse carveout guarantor of the Phoenix Industrial Portfolio XII Whole Loan is Phoenix Fund Symbol LLC.
The Properties. The Phoenix Industrial Portfolio XII Whole Loan is secured by eight industrial properties totaling 2,013,085 square feet located in Wisconsin (three properties, 31.0% of NRA), Illinois (one property, 23.0% of NRA), Pennsylvania (one property, 18.9% of NRA), Indiana (one property, 10.2% of NRA), Kentucky (one property, 8.8% of NRA) and Tennessee (one property, 8.1% of NRA). The borrower sponsor acquired the Phoenix Industrial Portfolio XII Properties between 2015 and 2021 for an aggregate purchase price of $10.9 million. Since acquisition, the borrower sponsor has invested approximately $37.4 million in capital improvements and approximately $2.5 million in soft costs resulting in a total cost basis of approximately $50.8 million at the Phoenix Industrial Portfolio XII Properties. The Phoenix Industrial Portfolio XII Properties were 81.1% occupied by 21 tenants as of November 25, 2024.
The following table presents certain information relating to the Phoenix Industrial Portfolio XII Properties:
| Portfolio Summary(1) | ||||||||||||
| Property | State | Subtype | Net Rentable Area (SF)(2) | Year Built/ Renovated | % UW NOI(2) | Allocated Loan Amount “ALA” | % of ALA | “As-Is” Appraised Value | % Office | Clear Heights | Dock Doors | Drive-In Doors |
| Galesburg | IL | Warehouse/Distribution | 462,087 | 1972/2020 | 30.8% | $14,346,630 | 27.3% | $29,800,000 | 1.0% | 28' | 25 | 4 |
| Kenosha | WI | Warehouse | 276,500 | 1949/2017 | 5.8% | $7,702,889 | 14.7% | $16,000,000 | 1.0% | 25' - 30' | 13 | 8 |
| St Marys | PA | Manufacturing | 380,136 | 1953/2020 | 11.6% | $6,740,028 | 12.8% | $14,000,000 | 6.0% | 24' | 17 | 6 |
| Milwaukee (4041) | WI | Warehouse/Distribution | 213,194 | 1945/2017 | 12.7% | $6,114,168 | 11.6% | $12,700,000 | 33.0% | 18' | 7 | 3 |
| Evansville | IN | Warehouse/Distribution | 205,982 | 1943/2023 | 10.8% | $4,958,735 | 9.4% | $10,300,000 | 4.0% | 12' - 49' | 18 | 4 |
| Milwaukee (Midtown) | WI | Warehouse/Distribution | 134,134 | 2004/NAP | 6.6% | $4,284,731 | 8.2% | $8,900,000 | 1.0% | 23' | 7 | 1 |
| Cleveland | TN | Warehouse/Distribution | 163,964 | 1985/2022 | 12.8% | $4,212,517 | 8.0% | $8,750,000 | 5.3% | 20' - 24' | 28 | 5 |
| Winchester | KY | Manufacturing | 177,088 | 1953/2023 | 9.0% | $4,140,302 | 7.9% | $8,600,000 | 19.5% | 19.5' - 32' | 6 | 3 |
| Total | 2,013,085 | 100.0% | $52,500,000 | 100.0% | $109,050,000 | 121 | 34 | |||||
| (1) | Source: Appraisals. |
| (2) | Information is based on the underwritten rent rolls dated November 25, 2024. |
| THE INFORMATION IN THIS STRUCTURAL AND COLLATERAL TERM SHEET IS NOT COMPLETE AND MAY BE AMENDED PRIOR TO THE TIME OF SALE. THIS TERM SHEET IS NOT AN OFFER TO SELL THESE SECURITIES AND IT IS NOT A SOLICITATION OF AN OFFER TO BUY THESE SECURITIES IN ANY JURISDICTION WHERE THE OFFER OR SALE IS NOT PERMITTED. | ||
| 75 | ||
| Industrial - Various | Loan #7 | Cut-off Date Balance: | $30,000,000 | |
| Various | Phoenix Industrial Portfolio XII | Cut-off Date LTV: | 48.1% | |
| Various, Various | UW NCF DSCR: | 1.60x | ||
| UW NOI Debt Yield: | 11.7% |
The following table presents certain information relating to the tenancy at the Phoenix Industrial Portfolio XII Properties:
| Tenant Summary(1) | |||||||||
| Tenant Name | Credit Rating (Fitch/Moody's/ S&P)(2) | Tenant SF | % of Total SF | Annual UW Rent(3) | % of Total Annual UW Rent(3) | Annual UW Rent PSF(3) | Lease Expiration | Term. Option (Y/N) | Renewal Options |
| E.I. Du Pont De Nemours & Company | NR/Baa1/BBB+ | 283,166 | 14.1% | $906,131 | 13.5% | $3.20 | 12/21/2025 | N | None |
| Thrushwood Farms Quality Meats | NR/NR/NR | 178,920 | 8.9% | $715,680 | 10.6% | $4.00 | 3/31/2035 | N | 2 x 15 yr |
| SRG Global Trim, LLC | NR/NR/NR | 161,319 | 8.0% | $696,898 | 10.4% | $4.32 | 5/31/2028 | N | 2 x 5 yr |
| Gasbarre Products, Inc | NR/NR/NR | 145,169 | 7.2% | $407,925 | 6.1% | $2.81 | 9/30/2042 | N | 1 x 5 yr |
| Phoenix Logistics, LLC (Cargill) | NR/NR/NR | 142,338 | 7.1% | $589,274 | 8.8% | $4.14 | 12/31/2036 | N | 3 x 3 yr |
| Subtotal/Wtd. Avg. | 910,912 | 45.2% | $3,315,909 | 49.3% | $3.64 | ||||
| Other Tenants | 720,805 | 35.8% | $3,409,565 | 50.7% | $4.73 | ||||
| Total Occupied Space | 1,631,717 | 81.1% | $6,725,474 | 100.0% | $4.12 | ||||
| Vacant Space | 381,368 | 18.9% | |||||||
| Total/Wtd. Avg. | 2,013,085 | 100.0% | |||||||
| (1) | Information is based on the underwritten rent rolls dated November 25, 2024. |
| (2) | In certain instances, ratings provided are those of the parent company of the entity shown, whether or not the parent company guarantees the lease. |
| (3) | The Annual UW Rent, % of Total Annual UW Rent and Annual UW Rent PSF are inclusive of approximately $152,068 of contractual rent steps through February 2026. |
The following table presents certain information relating to the lease rollover schedule at the Phoenix Industrial Portfolio XII Properties:
| Lease Rollover Schedule(1) | ||||||||
| Year | # of Leases Rolling | SF Rolling | Approx. % of SF Rolling | Approx. Cumulative % of SF Rolling | Total UW Rent Rolling | Approx. % of Total UW Rent Rolling | Approx. Cumulative % of Total UW Rent Rolling | UW Rent PSF Rolling(2) |
| MTM/2025 | 9 | 405,271 | 20.1% | 20.1% | $1,778,199 | 26.4% | 26.4% | $4.39 |
| 2026 | 4 | 249,332 | 12.4% | 32.5% | $919,818 | 13.7% | 40.1% | $3.69 |
| 2027 | 2 | 155,198 | 7.7% | 40.2% | $656,257 | 9.8% | 49.9% | $4.23 |
| 2028 | 3 | 192,465 | 9.6% | 49.8% | $1,052,428 | 15.6% | 65.5% | $5.47 |
| 2029 | 2 | 163,024 | 8.1% | 57.9% | $605,892 | 9.0% | 74.5% | $3.72 |
| 2030 | 0 | 0 | 0.0% | 57.9% | $0 | 0.0% | 74.5% | $0.00 |
| 2031 | 0 | 0 | 0.0% | 57.9% | $0 | 0.0% | 74.5% | $0.00 |
| 2032 | 0 | 0 | 0.0% | 57.9% | $0 | 0.0% | 74.5% | $0.00 |
| 2033 | 0 | 0 | 0.0% | 57.9% | $0 | 0.0% | 74.5% | $0.00 |
| 2034 | 0 | 0 | 0.0% | 57.9% | $0 | 0.0% | 74.5% | $0.00 |
| 2035 | 1 | 178,920 | 8.9% | 66.8% | $715,680 | 10.6% | 85.2% | $4.00 |
| 2036 & Thereafter | 2 | 287,507 | 14.3% | 81.1% | $997,199 | 14.8% | 100.0% | $3.47 |
| Vacant | 0 | 381,368 | 18.9% | 100.0% | $0 | 0.0% | 100.0% | $0.00 |
| Total/Wtd. Avg. | 23 | 2,013,085 | 100.0% | $6,725,474 | 100.0% | $4.12 | ||
| (1) | Information is based on the underwritten rent rolls dated November 25, 2024, inclusive of rent steps through February 2026 totaling $152,068. |
| (2) | Total/Wtd. Avg. Annual UW Rent PSF Rolling excludes vacant space. |
The Market. The Phoenix Industrial Portfolio XII Properties are located in Wisconsin (34.5% of ALA), Illinois (27.3% of ALA), Pennsylvania (12.8% of ALA), Indiana (9.4% of ALA), Tennessee (8.0% of ALA) and Kentucky (7.9% of ALA).
| THE INFORMATION IN THIS STRUCTURAL AND COLLATERAL TERM SHEET IS NOT COMPLETE AND MAY BE AMENDED PRIOR TO THE TIME OF SALE. THIS TERM SHEET IS NOT AN OFFER TO SELL THESE SECURITIES AND IT IS NOT A SOLICITATION OF AN OFFER TO BUY THESE SECURITIES IN ANY JURISDICTION WHERE THE OFFER OR SALE IS NOT PERMITTED. | ||
| 76 | ||
| Industrial - Various | Loan #7 | Cut-off Date Balance: | $30,000,000 | |
| Various | Phoenix Industrial Portfolio XII | Cut-off Date LTV: | 48.1% | |
| Various, Various | UW NCF DSCR: | 1.60x | ||
| UW NOI Debt Yield: | 11.7% |
The following table presents certain market information with respect to the Phoenix Industrial Portfolio XII Properties:
| Market Overview(1) | |||||||||
| Property | Year Built / Renovated(2) | Net Rentable Area (SF)(3) | Submarket | Property Vacancy(3) | Submarket Vacancy | Appraisal Concluded Vacancy | Submarket Inventory (SF) | UW Base Rent PSF(3)(4) | Submarket Rent PSF |
| Galesburg(5) | 1972/2020 | 462,087 | Galesburg - IL | 0.0% | 5.1% | 5.0% | 3,694,821 | $3.95 | $3.89 |
| Kenosha | 1949/2017 | 276,500 | Kenosha East | 55.3% | 12.5% | 5.0% | 51,310,381 | $5.07 | $7.36 |
| St Marys(5) | 1953/2020 | 380,136 | St. Mary's - PA | 32.4% | 12.0% | 10.0% | 4,017,573 | $3.76 | $6.95 |
| Milwaukee (4041) | 1945/2017 | 213,194 | Milwaukee East | 22.7% | 4.0% | 5.0% | 8,519,198 | $5.02 | $6.43 |
| Evansville | 1943/2023 | 205,982 | Northside/Airport | 21.7% | 3.0% | 3.0% | 18,318,110 | $4.32 | $5.51 |
| Milwaukee (Midtown) | 2004/NAP | 134,134 | Milwaukee NW | 0.0% | 4.1% | 0.0% | 36,086,546 | $3.55 | $6.11 |
| Cleveland(5) | 1985/2022 | 163,964 | Cleveland - TN | 0.0% | 3.0% | 2.5% | 16,061,712 | $4.72 | $7.12 |
| Winchester | 1953/2023 | 177,088 | Clark County | 6.8% | 2.9% | 3.0% | 3,945,972 | $3.24 | $6.91 |
| Total/Wtd. Avg. | 2,013,085 | 18.9% | 6.7% | 5.0% | 141,954,313 | $4.12 | $6.06 | ||
| (1) | Source: Third-party market research reports. |
| (2) | Source: Appraisals. |
| (3) | Information is based on the underwritten rent rolls dated November 25, 2024. |
| (4) | UW Base Rent PSF excludes underwritten vacant space and is inclusive of approximately $152,068 of contractual rent steps through February 2026. |
| (5) | No submarket data for the Galesburg, St Marys and Cleveland properties was available. Market information is presented in the table above. |
The following table presents certain demographic information with respect to the Phoenix Industrial Portfolio XII Properties:
| Demographics Overview | |||||||
| Property | Net Rentable Area (SF)(1) | ALA | % of ALA | UW NOI | % of UW NOI | Estimated 2024 Population (5-mile Radius)(2) | Estimated 2024 Average Household Income (5-mile Radius)(2) |
| Galesburg | 462,087 | $14,346,630 | 27.3% | $1,887,158 | 30.8% | 31,172 | $65,289 |
| Kenosha | 276,500 | $7,702,889 | 14.7% | $355,888 | 5.8% | 105,079 | $88,737 |
| St Marys | 380,136 | $6,740,028 | 12.8% | $712,292 | 11.6% | 12,393 | $83,828 |
| Milwaukee (4041) | 213,194 | $6,114,168 | 11.6% | $776,664 | 12.7% | 319,777 | $78,207 |
| Evansville | 205,982 | $4,958,735 | 9.4% | $659,590 | 10.8% | 110,668 | $76,013 |
| Milwaukee (Midtown) | 134,134 | $4,284,731 | 8.2% | $404,316 | 6.6% | 388,165 | $78,254 |
| Cleveland | 163,964 | $4,212,517 | 8.0% | $785,422 | 12.8% | 74,162 | $75,266 |
| Winchester | 177,088 | $4,140,302 | 7.9% | $551,919 | 9.0% | 29,364 | $86,362 |
| Total/Wtd. Avg. | 2,013,085 | $52,500,000 | 100.0% | $6,133,248 | 100.0% | 103,605 | $78,006 |
| (1) | Information is based on the underwritten rent rolls dated November 25, 2024. |
| (2) | Information obtained from third-party market research reports. |
Appraisal. The appraisals concluded to a combined “as-is” appraised value for the Phoenix Industrial Portfolio XII Properties of $109,050,000 as of October 1, 2024 through October 16, 2024.
Environmental Matters. According to the Phase I environmental reports dated on October 15, 2024 and October 21, 2024, there was no evidence of recognized environmental conditions at the Phoenix Industrial Portfolio XII Properties.
| THE INFORMATION IN THIS STRUCTURAL AND COLLATERAL TERM SHEET IS NOT COMPLETE AND MAY BE AMENDED PRIOR TO THE TIME OF SALE. THIS TERM SHEET IS NOT AN OFFER TO SELL THESE SECURITIES AND IT IS NOT A SOLICITATION OF AN OFFER TO BUY THESE SECURITIES IN ANY JURISDICTION WHERE THE OFFER OR SALE IS NOT PERMITTED. | ||
| 77 | ||
| Industrial - Various | Loan #7 | Cut-off Date Balance: | $30,000,000 | |
| Various | Phoenix Industrial Portfolio XII | Cut-off Date LTV: | 48.1% | |
| Various, Various | UW NCF DSCR: | 1.60x | ||
| UW NOI Debt Yield: | 11.7% |
Operating History and Underwritten Net Cash Flow. The following table presents certain information relating to the historical operating performance and Underwritten Net Cash Flow at the Phoenix Industrial Portfolio XII Properties:
| Cash Flow Analysis | |||
| TTM 9/30/2024 | UW | UW PSF | |
| Base Rent(1) | $5,573,164 | $6,573,406 | $3.27 |
| Rent Steps(2) | $0 | $152,068 | $0.08 |
| Vacant Income | $0 | $1,777,698 | $0.88 |
| Gross Potential Rent | $5,573,164 | $8,503,171 | $4.22 |
| Total Recoveries | $2,255,124 | $2,516,130 | $1.25 |
| Other Income | ($5,032) | $91,194 | $0.05 |
| Net Rental Income | $7,823,257 | $11,110,495 | $5.52 |
| Less Vacancy & Credit Loss | $0 | ($1,777,698) | ($0.88) |
| Effective Gross Income | $7,823,257 | $9,332,798 | $4.64 |
| Real Estate Taxes | $629,476 | $567,598 | $0.28 |
| Insurance | $461,799 | $402,366 | $0.20 |
| Management Fee | $236,487 | $279,984 | $0.14 |
| Other Expenses | $1,428,380 | $1,949,602 | $0.97 |
| Total Expenses | $2,756,142 | $3,199,550 | $1.59 |
| Net Operating Income(3) | $5,067,115 | $6,133,248 | $3.05 |
| CapEx | $0 | $201,309 | $0.10 |
| TI/LC | $0 | $346,360 | $0.17 |
| Net Cash Flow | $5,067,115 | $5,585,579 | $2.77 |
| Occupancy %(4) | 72.2% | 83.9% | |
| NOI DSCR(5) | 1.45x | 1.76x | |
| NCF DSCR(5) | 1.45x | 1.60x | |
| NOI Debt Yield(5) | 9.7% | 11.7% | |
| NCF Debt Yield(5) | 9.7% | 10.6% | |
| (1) | Base Rent is based on the underwritten rent rolls dated November 25, 2024. |
| (2) | Rent Steps totaling $152,068 are taken through February 2026. |
| (3) | The increase from TTM 9/30/2024 NOI to UW NOI is mainly attributable to (i) the lease up at the Galesburg property with the addition of the Thrushwood Farms Quality Meats lease at a base rent of $715,680 and (ii) approximately $152,068 of contractual rent steps through February 2026. |
| (4) | The UW Occupancy % represents the in-place economic occupancy. Historical occupancies represent physical occupancies. The Phoenix Industrial Portfolio XII Properties were 81.1% occupied as of November 25, 2024. |
| (5) | The information presented is based on the Phoenix Industrial Portfolio XII Whole Loan. |
Escrows and Reserves.
Real Estate Taxes – The loan documents require an upfront deposit of approximately $218,800 and ongoing monthly real estate tax reserves in an amount equal to 1/12th of the real estate taxes that the lender estimates will be payable during the next 12 months, initially estimated at approximately $47,300 monthly; provided, such monthly deposits will be waived so long as (a) the applicable lease demises the entirety of the applicable property; (b) the applicable lease is in full force and effect and no event of default under such lease exists; (c) the then current term of the applicable lease will expire no earlier than (i) twelve months after the date on which the next tax installment for the applicable property is due (if such installments are due annually), (ii) six months after the date on which the next tax installment is due (if such installments are due and payable semi-annually) or (iii) three months after the date on which the next tax installment is due (if such installments are due quarterly); (d) if the applicable tenant is a Material Tenant (as defined below), no Material Tenant Trigger Event (as defined below) exists; (e) the applicable tenant is required under its lease to make the payments relating to the obligations and liabilities for which the tax reserve account was established; and (f) the applicable tenant continues to make the payments relating to the obligations and liabilities for which the tax reserve account was established and the borrowers deliver evidence of the same to the lender in a timely manner.
Insurance – The loan documents require ongoing monthly insurance reserves in an amount equal to 1/12th of the insurance premiums that the lender estimates will be payable for the renewal of the coverage afforded by the policies upon the expiration thereof; provided, such monthly deposits will be waived so long as the borrowers maintain a blanket insurance policy acceptable to the lender.
Replacement Reserve – The loan documents require an ongoing monthly replacement reserve deposit of $16,776, capped at $402,624.
TI/LC Reserve – The loan documents require an upfront deposit of $2,000,000. If at any time the balance of the reserve is equal to or less than $250,000, the borrowers are required to deposit $25,164 monthly for rollover reserves until such time as the reserve is restored to a cap of $1,000,000.
Immediate Repairs – The loan documents require an upfront deposit of $362,940 for immediate repairs.
| THE INFORMATION IN THIS STRUCTURAL AND COLLATERAL TERM SHEET IS NOT COMPLETE AND MAY BE AMENDED PRIOR TO THE TIME OF SALE. THIS TERM SHEET IS NOT AN OFFER TO SELL THESE SECURITIES AND IT IS NOT A SOLICITATION OF AN OFFER TO BUY THESE SECURITIES IN ANY JURISDICTION WHERE THE OFFER OR SALE IS NOT PERMITTED. | ||
| 78 | ||
| Industrial - Various | Loan #7 | Cut-off Date Balance: | $30,000,000 | |
| Various | Phoenix Industrial Portfolio XII | Cut-off Date LTV: | 48.1% | |
| Various, Various | UW NCF DSCR: | 1.60x | ||
| UW NOI Debt Yield: | 11.7% |
Unfunded Obligations – The loan documents require an upfront deposit of $238,560 for unfunded obligations funds with respect to the Thrushwood Farms Quality Meats lease.
St. Marys Capital Expenditure Work – The loan documents require an upfront deposit of $500,000 for St. Marys capital expenditure work.
Lockbox and Cash Management. The Phoenix Industrial Portfolio XII Whole Loan is structured with a hard lockbox and springing cash management upon the occurrence and continuance of a Cash Management Trigger Event (as defined below). Rents from the Phoenix Industrial Portfolio XII Properties are required to be deposited directly into the lockbox account or, if received by the borrowers or the property manager, deposited within three business days of receipt. During the continuance of a Cash Management Trigger Event, all funds in the lockbox account are required to be swept each business day to a lender-controlled cash management account and disbursed in accordance with the Phoenix Industrial Portfolio XII Whole Loan documents, and all excess funds on deposit in the cash management account (after payment of required monthly reserve deposits, debt service payment on the Phoenix Industrial Portfolio XII Whole Loan, operating expenses and cash management bank fees) will be applied as follows: (a) if a Material Tenant Trigger Event has occurred and is continuing, to a Material Tenant rollover reserve, (b) if a Cash Sweep Trigger Event (as defined below) has occurred and is continuing (but not a Material Tenant Trigger Event), to the lender-controlled excess cash flow account or (c) if no Material Tenant Trigger Event or Cash Sweep Trigger Event has occurred and is continuing, to an account designated by the borrowers.
A “Cash Management Trigger Event” means a period commencing upon the occurrence of (i) an event of default under the Phoenix Industrial Portfolio XII Whole Loan documents, (ii) any bankruptcy action involving any of the borrowers, the guarantor, the key principal or the property manager, (iii) the trailing 12-month period debt service coverage ratio falling below 1.35x, (iv) the indictment for fraud or misappropriation of funds by any of the borrowers, the guarantor, the key principal or an affiliated or third-party property manager (provided that, in the case of the third-party property manager, such fraud or misappropriation is related to any of the Phoenix Industrial Portfolio XII Properties), or any director or officer of the aforementioned parties or (v) a Material Tenant Trigger Event, and expiring upon (a) with respect to clause (i) above, the cure of such event of default, (b) with respect to clause (ii) above, the filing being discharged, stayed or dismissed within 45 days for the borrowers, the guarantor or the key principal, or within 120 days for the property manager, and the lender’s determination that such filing does not materially affect the borrowers’, the guarantor’s, the key principal’s or the property manager’s monetary obligations, (c) with respect to clause (iii) above, the trailing 12-month debt service coverage ratio being at least 1.35x for two consecutive calendar quarters, (d) with respect to clause (iv) above, the dismissal of the applicable indictment with prejudice or acquittal of the applicable person, or the replacement of the property manager with a third-party property manager that constitutes a qualified property manager under the Phoenix Industrial Portfolio XII Whole Loan documents or (e) with respect to clause (v) above, the cure of such Material Tenant Trigger Event.
A “Cash Sweep Trigger Event” means a period commencing upon the occurrence of (i) an event of default under the Phoenix Industrial Portfolio XII Whole Loan documents, (ii) any bankruptcy action involving any of the borrowers, the guarantor, the key principal or the property manager or (iii) the trailing 12-month period debt service coverage ratio falling below 1.30x, and expiring upon (a) with respect to clause (i) above, the cure of such event of default, (b) with respect to clause (ii) above, as to an involuntary filing, the filing being discharged, stayed or dismissed within 45 days for any of the borrowers, the guarantor or the key principal, or within 120 days for the property manager, and the lender’s determination that such filing does not materially affect the borrowers’, the guarantor’s, the key principal’s or the property manager’s monetary obligations or (c) with respect to clause (iii) above, the trailing 12-month debt service coverage ratio is at least 1.35x for two consecutive calendar quarters.
A “Material Tenant” means any tenant at the Phoenix Industrial Portfolio XII Properties that, together with its affiliates, either (a) leases no less than 20% of the total rentable square footage of the Phoenix Industrial Portfolio XII Properties or (b) accounts for (or would account for) no less than 20% of the total in-place base rent at the Phoenix Industrial Portfolio XII Properties.
A “Material Tenant Trigger Event” means a period commencing upon the occurrence of (i) a Material Tenant giving notice of its intention to terminate, cancel, or not to extend or renew its lease, (ii) on or prior to the date a Material Tenant is required under its Material Tenant lease to notify the borrowers of its election to extend or renew its lease, if such Material Tenant does not give notice, (iii) an event of default under a Material Tenant lease occurring and continuing beyond any applicable notice and/or cure period, (iv) a bankruptcy action of a Material Tenant or a lease guarantor of any Material Tenant lease occurring, (v) a Material Tenant lease being terminated in whole or (vi) a Material Tenant “going dark”, vacating, ceasing to occupy or ceasing to conduct business in the ordinary course at the applicable property or a portion thereof constituting no less than 20% of the total net rentable square footage at the applicable property (other than temporary cessation of operations in connection with remodeling, renovation or restoration of its leased premises), and expiring upon (a) with respect to clause (i) above, the date that (1) the applicable Material Tenant revokes or rescinds all termination or cancellation notices, (2) the applicable Material Tenant lease is extended on terms satisfying the requirements of the Phoenix Industrial Portfolio XII Whole Loan documents or (3) all or substantially all of the applicable Material Tenant space is leased to a replacement tenant, (b) with respect to clause (ii) above, the date that (1) the applicable Material Tenant lease is extended on terms satisfying the requirements of the Phoenix Industrial Portfolio XII Whole Loan documents or (2) all or substantially all of the applicable Material Tenant space is leased to a replacement tenant, (c) with respect to clause (iii) above, a cure of the applicable event of default, (d) with respect to clause (iv) above, the affirmation of the Material Tenant lease in the applicable bankruptcy proceeding and confirmation that the Material Tenant is actually paying all rents and other amounts under its lease (or, if applicable, the discharge or dismissal of the applicable Material Tenant lease guarantor from the applicable bankruptcy proceeding; provided that such bankruptcy (after dismissal or discharge) does not have an adverse effect on such Material Tenant lease guarantor’s ability to perform its obligations under its lease guaranty), (e) with respect to clause (v) above, all or substantially all of the applicable Material Tenant space being leased to a replacement tenant or (f) with respect to clause (vi) above, the Material Tenant re-commencing its normal business operations at the applicable property or a portion thereof constituting more than 20% of the total net rentable square footage at the applicable property.
Property Management. The Phoenix Industrial Portfolio XII Properties are managed by Phoenix Investors, the borrower sponsor.
Mezzanine Loan and Preferred Equity. The borrowers are permitted a one-time right to incur a future mezzanine loan, subject to the satisfaction of the requirements set forth in the Phoenix Industrial Portfolio XII Whole Loan documents, including, without limitation: (i) no event of default under the Phoenix Industrial Portfolio XII Whole Loan documents is continuing; (ii) the aggregate loan-to-value ratio based on the Phoenix Industrial Portfolio XII Whole Loan and the mezzanine loan is no greater than 48.1%; (iii) the actual combined debt service coverage ratio based on the Phoenix Industrial Portfolio XII Whole Loan and the mezzanine loan is no less than 1.63x; (iv) the actual combined net operating income debt yield based on the Phoenix Industrial Portfolio XII Whole Loan and the mezzanine loan is no less than 10.7%; (v) the execution of an intercreditor agreement acceptable to the lender and satisfactory to the rating agencies; and (vi) receipt of a rating agency confirmation.
| THE INFORMATION IN THIS STRUCTURAL AND COLLATERAL TERM SHEET IS NOT COMPLETE AND MAY BE AMENDED PRIOR TO THE TIME OF SALE. THIS TERM SHEET IS NOT AN OFFER TO SELL THESE SECURITIES AND IT IS NOT A SOLICITATION OF AN OFFER TO BUY THESE SECURITIES IN ANY JURISDICTION WHERE THE OFFER OR SALE IS NOT PERMITTED. | ||
| 79 | ||
| Industrial - Various | Loan #7 | Cut-off Date Balance: | $30,000,000 | |
| Various | Phoenix Industrial Portfolio XII | Cut-off Date LTV: | 48.1% | |
| Various, Various | UW NCF DSCR: | 1.60x | ||
| UW NOI Debt Yield: | 11.7% |
Release of Property. The Phoenix Industrial Portfolio XII Whole Loan documents permit releases of outparcels located at the St Marys and Evansville properties without prepayment or defeasance, provided that, among other conditions, (i) each such outparcel is vacant, non-income producing and unimproved at the time of release and (ii) certain REMIC-related conditions are satisfied.
Terrorism Insurance. The loan documents require that the “all risk” insurance policy required to be maintained by the borrower provides coverage for terrorism in an amount equal to the full replacement cost of the property, as well as business interruption insurance covering no less than the 12-month period following the occurrence of a casualty event, together with a 6-month extended period of indemnity.
| THE INFORMATION IN THIS STRUCTURAL AND COLLATERAL TERM SHEET IS NOT COMPLETE AND MAY BE AMENDED PRIOR TO THE TIME OF SALE. THIS TERM SHEET IS NOT AN OFFER TO SELL THESE SECURITIES AND IT IS NOT A SOLICITATION OF AN OFFER TO BUY THESE SECURITIES IN ANY JURISDICTION WHERE THE OFFER OR SALE IS NOT PERMITTED. | ||
| 80 | ||
| Retail – Super Regional Mall | Loan #8 | Cut-off Date Balance: | $28,000,000 | |
| 30 Mall Drive West | Newport Centre | Cut-off Date LTV: | 43.0% | |
Jersey City, NJ 07310
| UW NCF DSCR: | 2.66x | ||
| UW NOI Debt Yield: | 15.3% |
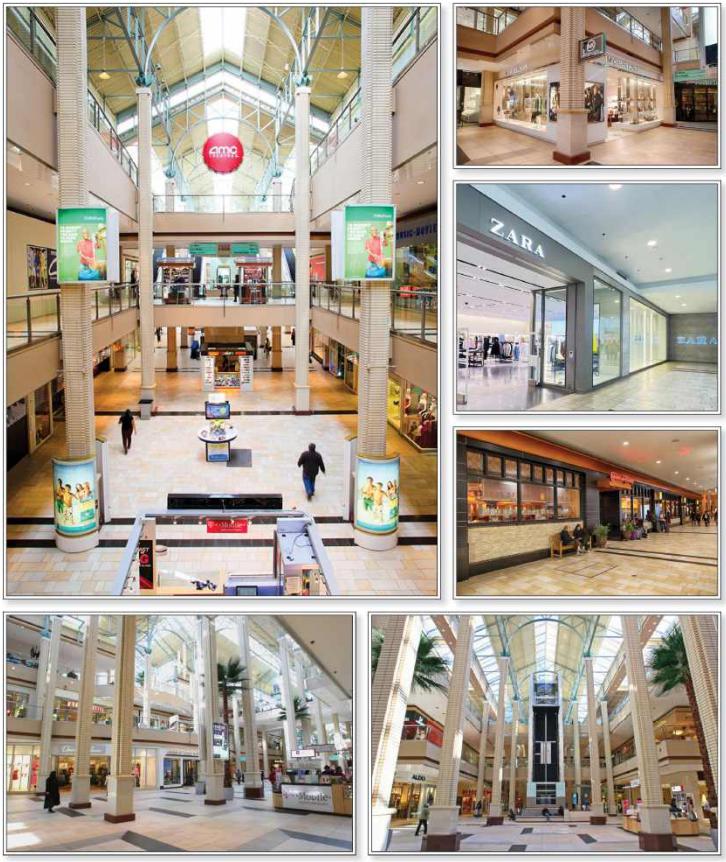
| THE INFORMATION IN THIS STRUCTURAL AND COLLATERAL TERM SHEET IS NOT COMPLETE AND MAY BE AMENDED PRIOR TO THE TIME OF SALE. THIS TERM SHEET IS NOT AN OFFER TO SELL THESE SECURITIES AND IT IS NOT A SOLICITATION OF AN OFFER TO BUY THESE SECURITIES IN ANY JURISDICTION WHERE THE OFFER OR SALE IS NOT PERMITTED. | ||
| 81 | ||
| Retail – Super Regional Mall | Loan #8 | Cut-off Date Balance: | $28,000,000 | |
| 30 Mall Drive West | Newport Centre | Cut-off Date LTV: | 43.0% | |
Jersey City, NJ 07310
| UW NCF DSCR: | 2.66x | ||
| UW NOI Debt Yield: | 15.3% |
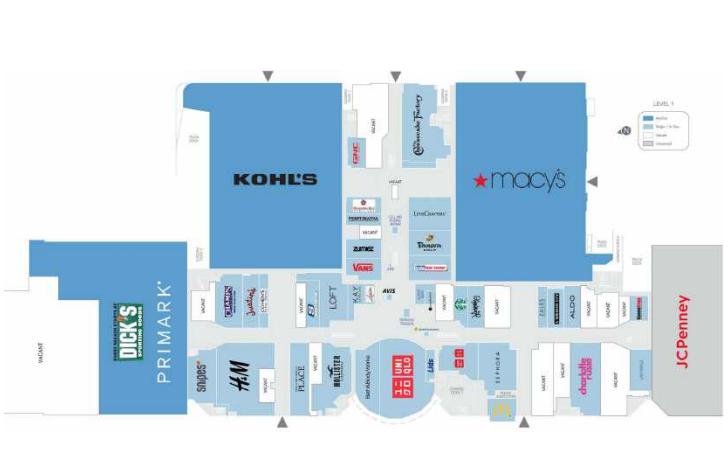
| THE INFORMATION IN THIS STRUCTURAL AND COLLATERAL TERM SHEET IS NOT COMPLETE AND MAY BE AMENDED PRIOR TO THE TIME OF SALE. THIS TERM SHEET IS NOT AN OFFER TO SELL THESE SECURITIES AND IT IS NOT A SOLICITATION OF AN OFFER TO BUY THESE SECURITIES IN ANY JURISDICTION WHERE THE OFFER OR SALE IS NOT PERMITTED. | ||
| 82 | ||
| Retail – Super Regional Mall | Loan #8 | Cut-off Date Balance: | $28,000,000 | |
| 30 Mall Drive West | Newport Centre | Cut-off Date LTV: | 43.0% | |
Jersey City, NJ 07310
| UW NCF DSCR: | 2.66x | ||
| UW NOI Debt Yield: | 15.3% |
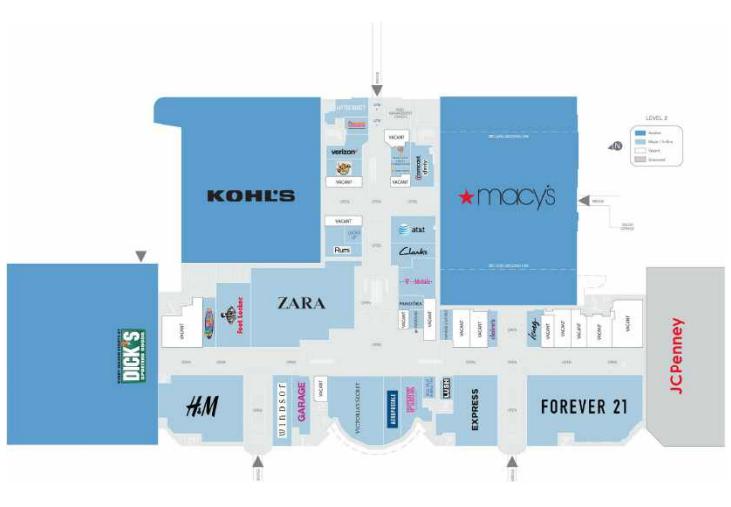
| THE INFORMATION IN THIS STRUCTURAL AND COLLATERAL TERM SHEET IS NOT COMPLETE AND MAY BE AMENDED PRIOR TO THE TIME OF SALE. THIS TERM SHEET IS NOT AN OFFER TO SELL THESE SECURITIES AND IT IS NOT A SOLICITATION OF AN OFFER TO BUY THESE SECURITIES IN ANY JURISDICTION WHERE THE OFFER OR SALE IS NOT PERMITTED. | ||
| 83 | ||
| Retail – Super Regional Mall | Loan #8 | Cut-off Date Balance: | $28,000,000 | |
| 30 Mall Drive West | Newport Centre | Cut-off Date LTV: | 43.0% | |
Jersey City, NJ 07310
| UW NCF DSCR: | 2.66x | ||
| UW NOI Debt Yield: | 15.3% |
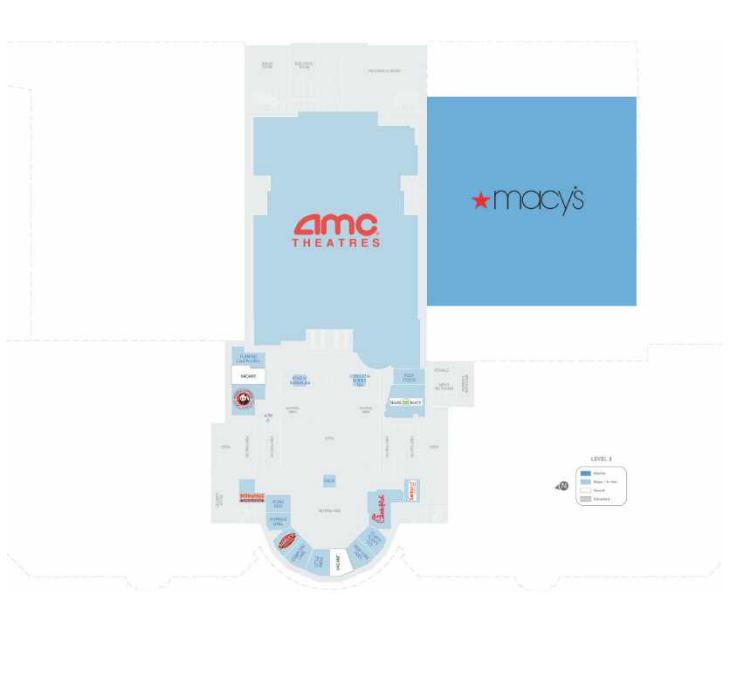
| THE INFORMATION IN THIS STRUCTURAL AND COLLATERAL TERM SHEET IS NOT COMPLETE AND MAY BE AMENDED PRIOR TO THE TIME OF SALE. THIS TERM SHEET IS NOT AN OFFER TO SELL THESE SECURITIES AND IT IS NOT A SOLICITATION OF AN OFFER TO BUY THESE SECURITIES IN ANY JURISDICTION WHERE THE OFFER OR SALE IS NOT PERMITTED. | ||
| 84 | ||
| Retail – Super Regional Mall | Loan #8 | Cut-off Date Balance: | $28,000,000 | |
| 30 Mall Drive West | Newport Centre | Cut-off Date LTV: | 43.0% | |
Jersey City, NJ 07310
| UW NCF DSCR: | 2.66x | ||
| UW NOI Debt Yield: | 15.3% |
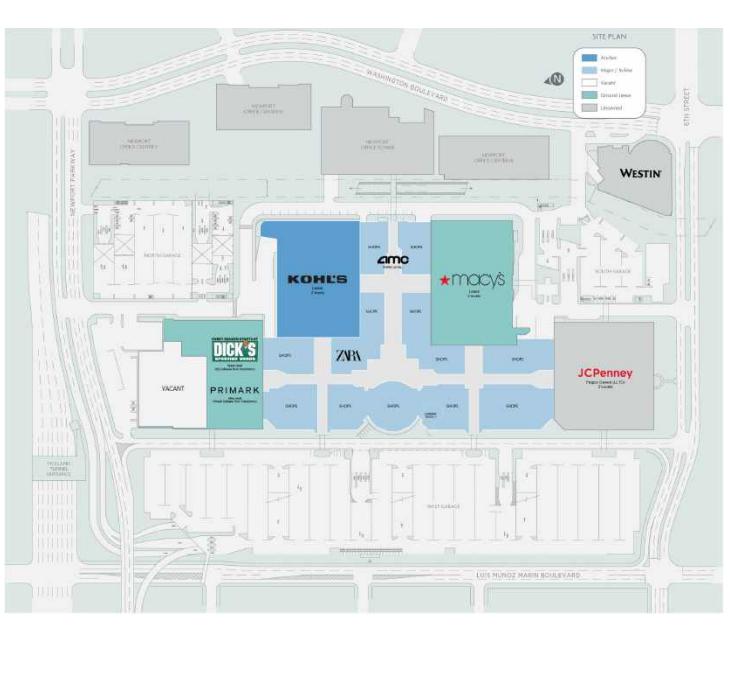
| THE INFORMATION IN THIS STRUCTURAL AND COLLATERAL TERM SHEET IS NOT COMPLETE AND MAY BE AMENDED PRIOR TO THE TIME OF SALE. THIS TERM SHEET IS NOT AN OFFER TO SELL THESE SECURITIES AND IT IS NOT A SOLICITATION OF AN OFFER TO BUY THESE SECURITIES IN ANY JURISDICTION WHERE THE OFFER OR SALE IS NOT PERMITTED. | ||
| 85 | ||
| Retail – Super Regional Mall | Loan #8 | Cut-off Date Balance: | $28,000,000 | |
| 30 Mall Drive West | Newport Centre | Cut-off Date LTV: | 43.0% | |
Jersey City, NJ 07310
| UW NCF DSCR: | 2.66x | ||
| UW NOI Debt Yield: | 15.3% |
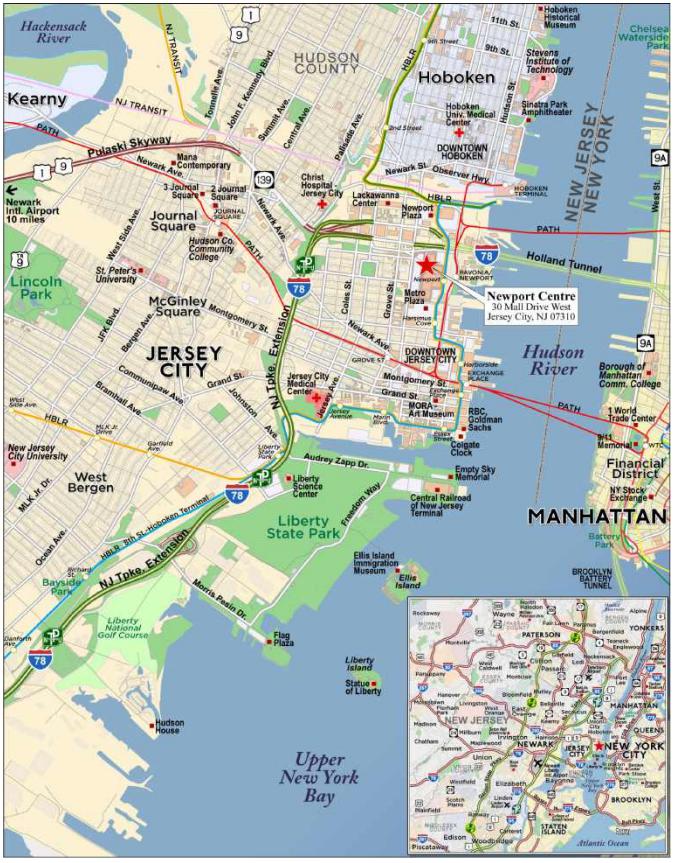
| THE INFORMATION IN THIS STRUCTURAL AND COLLATERAL TERM SHEET IS NOT COMPLETE AND MAY BE AMENDED PRIOR TO THE TIME OF SALE. THIS TERM SHEET IS NOT AN OFFER TO SELL THESE SECURITIES AND IT IS NOT A SOLICITATION OF AN OFFER TO BUY THESE SECURITIES IN ANY JURISDICTION WHERE THE OFFER OR SALE IS NOT PERMITTED. | ||
| 86 | ||
| Mortgage Loan No. 8 – Newport Centre |
| Mortgage Loan Information | Property Information | ||||||
| Mortgage Loan Seller: | GSMC | Single Asset/Portfolio: | Single Asset | ||||
| Credit Assessment (Fitch/Moody’s/KBRA): | BBB/A3/BBB- | Location: | Jersey City, NJ 07310 | ||||
| Original Balance(1): | $28,000,000 | General Property Type: | Retail | ||||
| Cut-off Date Balance(1): | $28,000,000 | Detailed Property Type: | Super Regional Mall | ||||
| % of Initial Pool Balance: | 3.4% | Title Vesting: | Fee | ||||
| Loan Purpose: | Refinance | Year Built/Renovated: | 1987/2006 | ||||
| Borrower Sponsors: | Simon Newport Limited Partnership and LF Newport Jersey Limited Partnership | Size: | 966,186 SF | ||||
| Guarantors: | Newport Associates Phase I Developers Limited Partnership | Cut-off Date Balance Per SF: | $195 | ||||
| Mortgage Rate: | 5.4370% | Maturity Date Balance Per SF: | $195 | ||||
| Note Date: | 8/22/2024 | Property Manager: | M.S. Management Associates, Inc. | ||||
| Maturity Date: | 9/1/2034 | (borrower affiliated) | |||||
| Term to Maturity: | 120 months | ||||||
| Amortization Term: | 0 months | Underwriting and Financial Information(1) | |||||
| IO Period: | 120 months | UW NOI: | $28,762,228 | ||||
| Seasoning: | 5 months | UW NCF: | $27,602,805 | ||||
| Prepayment Provisions: | L(29),D(84),O(7) | UW NOI Debt Yield: | 15.3% | ||||
| Lockbox/Cash Mgmt Status: | Hard/Springing | UW NCF Debt Yield: | 14.7% | ||||
| Additional Debt Type(1): | Pari Passu | UW NOI Debt Yield at Maturity: | 15.3% | ||||
| Additional Debt Balance(1): | $160,000,000 | UW NCF DSCR: | 2.66x | ||||
| Future Debt Permitted (Type) (1): | No (NAP) | Most Recent NOI: | $27,014,364 (6/30/2024 TTM) | ||||
| 2nd Most Recent NOI: | $27,822,648 (12/31/2023) | ||||||
| Reserves(2) | 3rd Most Recent NOI: | $27,402,194 (12/31/2022) | |||||
| Type | Initial | Monthly | Cap | Most Recent Occupancy: | 92.5% (7/29/2024) | ||
| Real Estate Taxes: | $0 | Springing | N/A | 2nd Most Recent Occupancy: | 82.7% (12/31/2023) | ||
| Insurance: | $0 | Springing | N/A | 3rd Most Recent Occupancy: | 86.0% (12/31/2022) | ||
| Replacement Reserves(3): | $0 | Springing | N/A | Appraised Value (as of): | $436,800,000 (7/11/2024) | ||
| TI / LC Reserve: | $0 | Springing | N/A | Appraised Value Per SF: | $452 | ||
| Cut-off Date LTV Ratio: | 43.0% | ||||||
| Maturity Date LTV Ratio: | 43.0% | ||||||
| Sources and Uses | ||||||
| Sources | Proceeds | % of Total | Uses | Proceeds | % of Total | |
| Whole Loan(1) | $188,000,000 | 100.0% | Loan Payoff: | $156,209,178 | 83.1% | |
| Return of Equity: | $30,599,394 | 16.3% | ||||
| Closing Costs: | $1,191,428 | 0.6% | ||||
| Total Sources | $188,000,000 | 100.0% | Total Uses | $188,000,000 | 100.0% | |
| (1) | The Newport Centre Mortgage Loan (as defined below) is part of the Newport Centre Whole Loan (as defined below), which is evidenced by nine pari passu promissory notes with an aggregate original principal balance of $188,000,000. The Financial Information presented above is based on the aggregate original principal balance of the promissory notes comprising the Newport Centre Whole Loan. |
| (2) | See “Escrows and Reserves” below for further discussion of reserve information. |
The Mortgage Loan. The eighth largest mortgage loan (the “Newport Centre Mortgage Loan”) is part of a whole loan (the “Newport Centre Whole Loan”) that is evidenced by nine pari passu promissory notes with an aggregate outstanding principal balance as of the Cut-off Date of $188,000,000, and accrues interest at a fixed rate of 5.43700% per annum on an Actual/360 basis. The Newport Centre Whole Loan is secured by the borrower’s fee interest in a super regional mall located in Jersey City, New Jersey (the “Newport Centre Property”). The Newport Centre Whole Loan was co-originated on August 22, 2024 by German American Capital Corporation (“GACC”) and Goldman Sachs Bank USA (“GSBI”). The Newport Centre Mortgage Loan is evidenced by non-controlling notes A-2-1-2 and A-2-3 and has an outstanding principal balance as of the Cut-off Date of $28,000,000. The scheduled maturity date of the Newport Centre Whole Loan is September 1, 2034.
The Newport Centre Whole Loan will be serviced under the pooling and servicing agreement for the BBCMS 2024-C30 securitization. See “Description of the Mortgage Pool—The Whole Loans” and “The Pooling and Servicing Agreement—Servicing of the Outside Serviced Mortgage Loans” in the Preliminary Prospectus.
| THE INFORMATION IN THIS STRUCTURAL AND COLLATERAL TERM SHEET IS NOT COMPLETE AND MAY BE AMENDED PRIOR TO THE TIME OF SALE. THIS TERM SHEET IS NOT AN OFFER TO SELL THESE SECURITIES AND IT IS NOT A SOLICITATION OF AN OFFER TO BUY THESE SECURITIES IN ANY JURISDICTION WHERE THE OFFER OR SALE IS NOT PERMITTED. | ||
| 87 | ||
| Retail – Super Regional Mall | Loan #8 | Cut-off Date Balance: | $28,000,000 | |
| 30 Mall Drive West | Newport Centre | Cut-off Date LTV: | 43.0% | |
Jersey City, NJ 07310
| UW NCF DSCR: | 2.66x | ||
| UW NOI Debt Yield: | 15.3% |
The table below identifies the promissory notes that comprise the Newport Centre Whole Loan:
| Whole Loan Summary | ||||
| Note | Original Balance | Cut-off Date Balance | Note Holder | Controlling Piece |
| A-1-1 | $40,000,000 | $40,000,000 | BBCMS 2024-C30 | Yes |
| A-1-2-1 | $20,000,000 | $20,000,000 | BMO 2024-C10 | No |
| A-1-2-2 | $10,000,000 | $10,000,000 | BBCMS 2024-C30 | No |
| A-1-3 | $20,000,000 | $20,000,000 | BMO 2024-C10 | No |
| A-1-4 | $30,000,000 | $30,000,000 | BBCMS 2024-C30 | No |
| A-2-1-1 | $20,000,000 | $20,000,000 | BMO 2024-C10 | No |
| A-2-1-2 | $10,000,000 | $10,000,000 | WFCM 2025-C64 | No |
| A-2-2 | $20,000,000 | $20,000,000 | BANK 2024-BNK48 | No |
| A-2-3 | $18,000,000 | $18,000,000 | WFCM 2025-C64 | No |
| Whole Loan | $188,000,000 | $188,000,000 | ||
The Borrower and the Borrower Sponsor. The borrower under the Newport Centre Whole Loan is Newport Centre, LLC, a Delaware limited liability company and single purpose entity with two independent directors in its organizational structure. Legal counsel to the borrower delivered a non-consolidation opinion in connection with the origination of the Newport Centre Whole Loan. The borrower sponsors are Simon Newport Limited Partnership (“Simon”) and LF Newport Jersey Limited Partnership. The non-recourse carveout guarantor is Newport Associates Phase I Developers Limited Partnership. Simon is a real estate investment trust engaged in the ownership of shopping, dining, entertainment and mixed-use destinations and an S&P 100 company (Simon Property Group, NYSE: SPG).
The Properties. The Newport Centre Property is a 966,186 square foot super regional mall property located in Jersey City, New Jersey. The Newport Centre Property was built in 1987 and most recently renovated in 2006 and is a three-story enclosed mall situated on a 33.39-acre parcel. The Newport Centre Property is anchored by Kohl’s, Macy’s and Sears (currently occupied by Dick’s House of Sport & Primark) and shadow anchored by JC Penney. Macy’s owns its improvements, ground leases and the underlying land from the borrower. Sears also owns its improvements, ground leases and the underlying land from the borrower; however Sears subleases its space to Dick’s House of Sport & Primark with a small portion of the bottom floor space currently vacant. JC Penney owns its store and the underlying land and is not part of the collateral for the Newport Centre Whole Loan. JCPenney serves as a non-collateral anchor of the Newport Centre Property. Notable tenants at the Newport Centre Property include H&M, AMC Theatres and Zara. As of July 29, 2024 the Newport Centre Property was 92.5% leased.
The following table presents certain information relating to the sales history of certain tenants at the Newport Centre Property:
| Sales History(1) | ||||
| 2021 Sales (PSF) | 2022 Sales (PSF) | 2023 Sales (PSF) | TTM 6/30/2024 Sales (PSF) | |
| H&M | $331.05 | $330.34 | $275.99 | $263.61 |
| AMC Theatres | $101.45 | $197.28 | $231.20 | $208.39 |
| Zara | $454.65 | $472.78 | $496.87 | $473.28 |
| Kohl's | $57.89 | $86.68 | $99.73 | $55.41 |
| Victoria's Secret | $595.86 | $568.97 | $534.11 | $518.28 |
| (1) | All sales information presented herein with respect to the Newport Centre Property is based upon information obtained from the borrower. |
Major Tenants. The three largest tenants based on SF are Macy’s, Sears (subject to a ground lease that is subleased to Dick’s House of Sport & Primark) and Kohl’s.
Macy’s (229,889 SF; 23.8% of NRA; 0.7% of underwritten annual rent): Macy’s is a modern department store that was founded in New York City in 1856 as a dry goods store. As of January 2025, there are 479 total Macy’s locations, 24 small format locations and nine freestanding Macy’s Backstage locations. Macy’s has been a tenant at the Newport Centre Property since November 2002.
Sears (subleased to Dick’s House of Sport & Primark) (192,000 SF; 19.9% of NRA; 6.8% of underwritten annual rent): Sears is an American retailer offering a range of home merchandise, apparel and automotive products and services through Sears-branded and affiliated full-line and specialty retail stores in the United States. Sears’ current lease at the Newport Centre Property expires in October 2027. Sears has subleased its entire top floor to Dick’s new concept, Dick’s House of Sport (“Dick’s”), and Primark is taking two-thirds of the bottom floor with the remaining space yet to be subleased.
Dick’s and Primark have each signed subleases for their respective portions of the Sears space, but only Dick’s has taken occupancy. Dick’s has taken possession of its space and will open fall 2025. Primark has taken possession of its space and will open early summer 2025. We cannot assure you that Dick’s House of Sport and Primark will open as expected or at all.
Dick’s Sporting Goods, Inc. is an American chain of sporting goods stores founded in 1948. It is the largest sporting goods retailer in the United States and is listed on the Fortune 500. Dick’s House of Sport is a new concept introduced by Dick’s Sporting Goods, Inc. It is an approximately 82,500 square foot store that provides customers with a wide assortment of products along with in-store experiences, including a climbing wall, multiple golf bays with simulators, and multi-sport cages for baseball, softball, lacrosse, and soccer.
| THE INFORMATION IN THIS STRUCTURAL AND COLLATERAL TERM SHEET IS NOT COMPLETE AND MAY BE AMENDED PRIOR TO THE TIME OF SALE. THIS TERM SHEET IS NOT AN OFFER TO SELL THESE SECURITIES AND IT IS NOT A SOLICITATION OF AN OFFER TO BUY THESE SECURITIES IN ANY JURISDICTION WHERE THE OFFER OR SALE IS NOT PERMITTED. | ||
| 88 | ||
| Retail – Super Regional Mall | Loan #8 | Cut-off Date Balance: | $28,000,000 | |
| 30 Mall Drive West | Newport Centre | Cut-off Date LTV: | 43.0% | |
Jersey City, NJ 07310
| UW NCF DSCR: | 2.66x | ||
| UW NOI Debt Yield: | 15.3% |
Primark is an international clothing retailer that sells affordable clothing, accessories, footwear, beauty products, and homeware for women, men, and children. The company was founded in Dublin, Ireland in 1969 by Arthur Ryan. Primark has since expanded to over 450 stores in 17 countries, including the UK, United States, Spain, Germany, and Italy.
Kohl’s (144,654 SF; 15.0% of NRA; 4.0% of underwritten annual rent): Kohl’s is an omnichannel retailer that operates more than 1,100 stores across 49 states and generates over $17 billion in revenue, as of January 2025. Kohl’s was founded in Brookfield, WI in 1962. Kohl’s has been a tenant at the Newport Centre Property since January 2016.
The following table presents the Tenant Summary at the Newport Centre Property:
| Tenant Summary(1) | ||||||||||||
| June 2024 TTM Sales(3) | ||||||||||||
| Tenant Name | Credit Rating (Moody’s/ Fitch/S&P)(2) | Tenant SF | Approx. % of SF | Annual UW Rent | % of Total Annual UW Rent | Annual UW Rent PSF | Sales $ | Sales PSF | Occ Cost % | Lease Exp. | Renewal Options | Term. Option (Y/N) |
| Major Tenants | ||||||||||||
| Macy’s | Ba1/BBB-/BB+ | 229,889 | 23.8% | 140,000 | 0.7% | $0.61 | $49,538,202 | $215 | 0.3% | 1/29/2028 | 4 x 10 yrs | N |
| Sears (Dick’s and Primark)(3) | NR/NR/NR | 192,000 | 19.9% | $1,385,000 | 6.8% | $7.21 | $0 | $0 | 0.0% | 10/31/2027 | 4 x 5 yrs and 2 x 5 yrs | N |
| Kohl’s | Ba3/BB/BB- | 144,654 | 15.0% | $807,169 | 4.0% | $5.58 | $8,015,874 | $55 | 10.1% | 1/29/2028 | 2 x 10 yrs | N |
| AMC Theatres | Ca/NR/CCC+ | 45,165 | 4.7% | $1,410,000 | 6.9% | $31.22 | $9,412,066 | $208 | 15.0% | 1/31/2026 | 3 x 5 yrs | N |
| H&M | NR/NR/BBB | 26,863 | 2.8% | $1,414,620 | 7.0% | $52.66 | $7,081,282 | $264 | 20.0% | 1/31/2030 | 3 x 3 yrs | N |
| Zara | NR/NR/NR | 23,662 | 2.4% | $1,307,554 | 6.4% | $55.26 | $11,198,726 | $473 | 11.7% | 10/31/2028 | None | N |
| XXI Forever(4) | NR/NR/NR | 22,366 | 2.3% | $0 | 0.0% | $0.00 | $2,965,986 | $133 | 0.0% | 1/31/2026 | None | N |
| Uniqlo | NR/NR/NR | 11,983 | 1.2% | $461,226 | 2.3% | $38.49 | $9,480,348 | $791 | 4.9% | 1/31/2034 | None | N |
| Express/Express Men | NR/NR/NR | 10,422 | 1.1% | $177,487 | 0.9% | $17.03 | $2,883,599 | $277 | 6.2% | 1/31/2028 | None | N |
| Victoria's Secret | B1/NR/BB- | 9,895 | 1.0% | $573,910 | 2.8% | $58.00 | $5,128,423 | $518 | 11.2% | 1/31/2025 | None | N |
| Major Tenants Subtotal/Wtd. Avg. | 716,899 | 74.2% | $7,676,966 | 37.8% | $10.71 | |||||||
| Other Tenants | 176,421 | 18.3% | $12,632,818 | 62.2% | $71.61 | |||||||
| Occupied Subtotal/Wtd. Avg. | 893,320 | 92.5% | $20,309,783 | 100.0% | $22.74 | |||||||
| Vacant Space | 72,866 | 7.5% | ||||||||||
| Total/Wtd. Avg. | 966,186 | 100.0% | ||||||||||
| (1) | Based on the underwritten rent roll dated July 29, 2024. |
| (2) | Certain ratings are those of the parent company whether or not the parent guarantees the lease. |
| (3) | Dick’s has taken possession of its space and will open fall 2025. Primark has taken possession of its space and will open early summer 2025. We cannot assure you that Dick’s House of Sport and Primark will open as expected or at all. |
| (4) | XXI Forever pays PIL rent that totals $336,639. |
| THE INFORMATION IN THIS STRUCTURAL AND COLLATERAL TERM SHEET IS NOT COMPLETE AND MAY BE AMENDED PRIOR TO THE TIME OF SALE. THIS TERM SHEET IS NOT AN OFFER TO SELL THESE SECURITIES AND IT IS NOT A SOLICITATION OF AN OFFER TO BUY THESE SECURITIES IN ANY JURISDICTION WHERE THE OFFER OR SALE IS NOT PERMITTED. | ||
| 89 | ||
| Retail – Super Regional Mall | Loan #8 | Cut-off Date Balance: | $28,000,000 | |
| 30 Mall Drive West | Newport Centre | Cut-off Date LTV: | 43.0% | |
Jersey City, NJ 07310
| UW NCF DSCR: | 2.66x | ||
| UW NOI Debt Yield: | 15.3% |
The following table presents certain information relating to the lease rollover schedule at the Newport Centre Property:
| Lease Rollover Schedule(1)(2) | |||||||||
| Year | Number of Leases Expiring | Net Rentable Area Expiring | % of NRA Expiring | UW Base Rent Expiring | % of UW Base Rent Expiring | Cumulative Net Rentable Area Expiring | Cumulative % of NRA Expiring | Cumulative UW Base Rent Expiring | Cumulative % of UW Base Rent Expiring |
| Vacant | NAP | 72,866 | 7.5% | NAP | NAP | 72,866 | 7.5% | NAP | NAP |
| 2024 & MTM | 13 | 18,126 | 1.9% | $1,399,383 | 6.9% | 90,992 | 9.4% | $1,399,383 | 6.9% |
| 2025 | 15 | 34,223 | 3.5% | $2,113,477 | 10.4% | 125,215 | 13.0% | $3,512,860 | 17.3% |
| 2026 | 19 | 96,227 | 10.0% | $3,608,065 | 17.8% | 221,442 | 22.9% | $7,120,925 | 35.1% |
| 2027 | 13 | 228,259 | 23.6% | $3,425,449 | 16.9% | 449,701 | 46.5% | $10,546,375 | 51.9% |
| 2028 | 11 | 422,169 | 43.7% | $3,478,432 | 17.1% | 871,870 | 90.2% | $14,024,807 | 69.1% |
| 2029 | 10 | 21,273 | 2.2% | $1,864,328 | 9.2% | 893,143 | 92.4% | $15,889,134 | 78.2% |
| 2030 | 6 | 35,367 | 3.7% | $2,389,629 | 11.8% | 928,510 | 96.1% | $18,278,764 | 90.0% |
| 2031 | 1 | 726 | 0.1% | $99,382 | 0.5% | 929,236 | 96.2% | $18,378,146 | 90.5% |
| 2032 | 3 | 7,044 | 0.7% | $526,082 | 2.6% | 936,280 | 96.9% | $18,904,228 | 93.1% |
| 2033 | 3 | 3,669 | 0.4% | $276,331 | 1.4% | 939,949 | 97.3% | $19,180,559 | 94.4% |
| 2034 | 3 | 16,448 | 1.7% | $770,946 | 3.8% | 956,397 | 99.0% | $19,951,506 | 98.2% |
| 2035 & Beyond | 3 | 9,789 | 1.0% | $358,277 | 1.8% | 966,186 | 100.0% | $20,309,783 | 100.0% |
| Total/Wtd. Avg. | 100 | 966,186 | 100.0% | $20,309,783 | 100.0% | ||||
| (1) | Based on the underwritten rent roll dated July 29, 2024. |
| (2) | Certain tenants may have lease termination options that are exercisable prior to the stated expiration date of the subject lease or leases which are not considered in the Lease Rollover Schedule. |
The Market. The Newport Centre Property is located in Jersey City, New Jersey in the Jersey City Waterfront District in northern New Jersey. According to the appraisal, the northern New Jersey region is named the “gateway region” given its easy access to Manhattan. The Newport Centre Property is the largest retail development in Hudson County and occupies a densely-developed city infill location, leaving few available sites for competing development. The area is accessible by highways, ferry, subway and light rail.
According to the appraisal, Jersey City is the fastest-growing metropolitan area in New Jersey and ranks 3rd for fastest residential growth in the country. Newport, New Jersey ranks 13th for highest office density in the country, with eight commercial buildings, 5,600,000 square feet of space, consisting of 50 corporations (including: Bank of America, Chase Manhattan Bank, Cigna Healthcare, Citi Group, Fidelity Investments, Forbes Media, HSBC, JP Morgan Chase, Merrill Lynch and UBS Financial Services). According to the appraisal, there are approximately 30,000 employees that work in Newport, with 97% of them shopping at Newport Centre, benefiting from New Jersey’s tax-free pricing on apparel. According to the appraisal, the average household income in the area is $123,149.
According to the appraisal, Northern New Jersey’s demographic characteristics indicate a population that is identical in age to the nation and earns $36,477 more in terms of average annual household income when compared to other areas of the United States. The region also contains a higher concentration of educational attainment than the United States, with 42.3% of its population having a bachelor’s degree or higher versus 31.9% for the nation.
According to the appraisal, the Newport Centre Property is in the Hudson submarket of northern New Jersey. The submarket is 94.0% occupied with an average asking rent of $28.98 per square foot. Over the past five years, new construction activity in the Hudson submarket outpaced absorption, with an annual average of 10,400 square feet completed and 8,800 square feet absorbed.
The following table presents information regarding certain competitive properties to the Newport Centre Property:
Competitive Property Summary(1) | ||||||
| Newport Centre | The Mills at Jersey Gardens | The Shops at Riverside | Garden State Plaza | Willowbrook Mall | Bergen Town Center | |
Year Built/ Renovated | 1987 / 2006 | 1999/2013 | 1986/2020 | 1957/2000 | 1969/1997 | 1957/2020 |
| Total GLA (SF) | 966,186(2) | 1,300,000 | 743,800 | 2,130,000 | 1,525,000 | 1,020,000 |
| Ownership | Simon Property Group | Simon Property Group | Simon Property Group | Unibail Rodamco- Westfield SE | Seritage Growth Properties | Urban Edge Properties |
| Occupancy % | 92.5%(2) | 95.0% | 90.0% | 92.0% | 99.0% | 91.0% |
| Inline Sales PSF | $714(3) | $1,025 | $910 | $950 | $925 | $670 |
| Anchors | Macy’s, Kohl’s, JCPenney (non-collateral), Sears (Dicks & Primark) | AMC Theatres, Burlington, Cohoes, Forever 21, Marshalls, Saks Off 5th | Bloomingdale’s, Barnes and Noble, AMC Theatres | Macy’s, Neiman Marcus, Nordstrom, AMC Theatres | Bloomingdale’s, Macy’s, BJ’s Wholesale Club, JCPenney, Cinemark | Kohl’s, Target, Whole Foods |
| (1) | Source: Third party report. |
| (2) | Information is based on the underwritten rent roll dated July 29, 2024. |
| (3) | Represents sales PSF as of June 2024 as provided by the borrower sponsors. |
| THE INFORMATION IN THIS STRUCTURAL AND COLLATERAL TERM SHEET IS NOT COMPLETE AND MAY BE AMENDED PRIOR TO THE TIME OF SALE. THIS TERM SHEET IS NOT AN OFFER TO SELL THESE SECURITIES AND IT IS NOT A SOLICITATION OF AN OFFER TO BUY THESE SECURITIES IN ANY JURISDICTION WHERE THE OFFER OR SALE IS NOT PERMITTED. | ||
| 90 | ||
| Retail – Super Regional Mall | Loan #8 | Cut-off Date Balance: | $28,000,000 | |
| 30 Mall Drive West | Newport Centre | Cut-off Date LTV: | 43.0% | |
Jersey City, NJ 07310
| UW NCF DSCR: | 2.66x | ||
| UW NOI Debt Yield: | 15.3% |
Appraisal. According to the appraisal, the Newport Centre Property had an “as-is” appraised value of $436,800,000 as of July 11, 2024. The table below shows the appraisal’s “as-is” conclusions.
Environmental Matters. According to the Phase I environmental report dated July 18, 2024, there was evidence of a recognized environmental condition at the Newport Centre Property related to historical coal-gas manufacturing at two on-site locations from approximately 1885 through the late 1920s. The Newport Centre Property is currently being remediated in a New Jersey Department of Environmental Protection (“NJDEP”) remediation program on behalf of the state. Remedial actions are ongoing until the NJDEP deems the responses to be completed according to established cleanup goals. See “Description of the Mortgage Pool—Environmental Considerations” in the Preliminary Prospectus.
Operating History and Underwritten Net Cash Flow. The following table presents certain information relating to the historical operating performance and underwritten net cash flow at the Newport Centre Property:
| Operating History and Underwritten Net Cash Flow | |||||||||||
| 2019 | 2020 | 2021 | 2022 | 2023 | TTM 6/30/2024 | Underwritten | PSF | %(1) | |||
| Base Rent | $20,564,204 | $20,338,102 | $18,549,753 | $19,306,882 | $19,270,653 | $19,146,217 | $20,309,783(2) | $21.02 | 41.1% | ||
| Rent Steps | 0 | 0 | 0 | 0 | 0 | 0 | 259,850 | 0.27 | 0.5 | ||
| Recoveries | 15,345,651 | 15,581,064 | 13,975,987 | 15,371,903 | 15,270,988 | 15,205,829 | 14,276,516 | 14.78 | 28.9 | ||
| Other Income | 11,230,520 | 6,356,856 | 9,909,900 | 11,462,036 | 12,872,322 | 12,586,027 | 12,337,560 | 12.77 | 24.9 | ||
| Value of Vacant Space | 0 | 0 | 0 | 0 | 0 | 0 | 2,274,447 | 2.35 | 4.6 | ||
| Total Gross Income | $47,140,375 | $42,276,022 | $42,435,640 | $46,140,821 | $47,413,963 | $46,938,073 | $49,458,156 | $51.19 | 100.0% | ||
| (Vacancy/Bad Debt) | 17,020 | (4,531,116) | (508,428) | 291,531 | (225,830) | (251,829) | (2,274,447) | (2.35) | (4.6) | ||
| Effective Gross Income | $47,157,395 | $37,744,906 | $41,927,212 | $46,432,352 | $47,188,133 | $46,686,244 | $47,183,709 | $48.84 | 95.4% | ||
| Real Estate Taxes | 4,119,652 | 4,306,134 | 4,292,885 | 5,668,751 | 6,025,755 | 6,060,072 | 5,753,660 | 5.96 | 12.2 | ||
| Insurance | 802,878 | 798,798 | 774,449 | 835,508 | 848,610 | 865,888 | 901,508 | 0.93 | 1.9 | ||
| Utilities | 2,387,284 | 1,944,879 | 2,310,660 | 2,941,366 | 2,337,947 | 2,325,281 | 2,511,587 | 2.60 | 5.3 | ||
| Repairs & Maintenance | 1,444,702 | 1,231,504 | 1,508,906 | 1,771,794 | 1,835,080 | 1,895,740 | 1,910,156 | 1.98 | 4.0 | ||
| Management Fee | 2,058,409 | 1,650,597 | 1,915,075 | 2,039,250 | 2,070,600 | 2,010,650 | 1,250,000 | 1.29 | 2.6 | ||
| Other Expenses | 5,877,233 | 4,330,456 | 5,000,337 | 5,773,489 | 6,247,493 | 6,514,249 | 6,094,570 | 6.31 | 12.9 | ||
| Total Expenses | $16,690,158 | $14,262,368 | $15,802,312 | $19,030,158 | $19,365,485 | $19,671,880 | $18,421,481 | $19.07 | 39.0% | ||
| Net Operating Income | $30,467,237 | $23,482,538 | $26,124,900 | $27,402,194 | $27,822,648 | $27,014,364 | $28,762,228 | $29.77 | 61.0% | ||
| Total TI/LC, Capex/RR | 0 | 0 | 0 | 0 | 0 | 0 | 1,159,423 | 1.20 | 2.5 | ||
| Net Cash Flow | $30,467,237 | $23,482,538 | $26,124,900 | $27,402,194 | $27,822,648 | $27,014,364 | $27,602,805 | $28.57 | 58.5% | ||
| Occupancy | 90.5% | 83.2% | 83.3% | 86.0% | 82.7% | 92.5% | 95.4 | %(3) | |||
| NOI DSCR | 2.94x | 2.27x | 2.52x | 2.64x | 2.68x | 2.61x | 2.78x | ||||
| NCF DSCR | 2.94x | 2.27x | 2.52x | 2.64x | 2.68x | 2.61x | 2.66x | ||||
| NOI Debt Yield | 16.2% | 12.5% | 13.9% | 14.6% | 14.8% | 14.4% | 15.3% | ||||
| NCF Debt Yield | 16.2% | 12.5% | 13.9% | 14.6% | 14.8% | 14.4% | 14.7% | ||||
| (1) | Represents percent of Total Gross Income for all revenue fields and percent of Effective Gross Income for all other fields. |
| (2) | Underwritten Base Rent is based on the underwritten rent roll dated July 29, 2024. |
| (3) | Based on economic occupancy. |
Property Management. The Newport Centre Property is currently managed by M.S. Management Associates, Inc., an affiliate of the borrower.
Escrows and Reserves.
Real Estate Taxes – During a Lockbox Event Period (as defined below), the borrower is required to deposit monthly to a real estate tax reserve 1/12th of the annual estimated real estate taxes.
Insurance – During a Lockbox Event Period, to the extent the borrower has not provided evidence satisfactory to the lender that the Newport Centre Property is covered by a reasonably acceptable blanket insurance policy, the borrower is required to deposit monthly 1/12th of the annual estimated insurance premiums to the insurance reserve.
Replacement Reserve – During a Lockbox Event Period, the borrower is required to deposit monthly approximately $8,396 to a reserve for replacements to the Newport Centre Property.
Rollover Reserve – During a Lockbox Event Period, the borrower is required to deposit monthly approximately $64,583 to a reserve for costs of tenant improvements, tenant allowances and/or leasing commissions incurred by the borrower under leases at the Newport Centre Property.
| THE INFORMATION IN THIS STRUCTURAL AND COLLATERAL TERM SHEET IS NOT COMPLETE AND MAY BE AMENDED PRIOR TO THE TIME OF SALE. THIS TERM SHEET IS NOT AN OFFER TO SELL THESE SECURITIES AND IT IS NOT A SOLICITATION OF AN OFFER TO BUY THESE SECURITIES IN ANY JURISDICTION WHERE THE OFFER OR SALE IS NOT PERMITTED. | ||
| 91 | ||
| Retail – Super Regional Mall | Loan #8 | Cut-off Date Balance: | $28,000,000 | |
| 30 Mall Drive West | Newport Centre | Cut-off Date LTV: | 43.0% | |
Jersey City, NJ 07310
| UW NCF DSCR: | 2.66x | ||
| UW NOI Debt Yield: | 15.3% |
Lockbox / Cash Management. The Newport Centre Whole Loan is structured with a hard lockbox and springing cash management. All rents from the Newport Centre Property are required to be deposited directly to the lockbox by tenants upon delivery of a tenant direction letter. During a Lockbox Event Period, funds will be transferred to the lender-controlled cash management account within two business days and disbursed according to the Newport Centre Whole Loan documents. During a Lockbox Event Period, all excess cash is required to be held by the lender as additional security for the Newport Centre Whole Loan; provided that excess cash will be disbursed at the direction of the borrower in the event of shortfalls in certain monthly expense items, so long as no event of default is continuing for which the lender has initiated an enforcement action.
A “Lockbox Event” will occur during the existence of any of: (i) an event of default, (ii) a bankruptcy action of the borrower or property manager if the property manager is an affiliate of the borrower and not replaced within 60 days by a qualified property manager in accordance with the Newport Centre Whole Loan documents, (iii) a Debt Yield Trigger Event (as defined below) or (iv) a Major Tenant Trigger Event (as defined below).
A “Lockbox Event Period” will commence on the occurrence of a Lockbox Event and continue until the occurrence of the applicable Lockbox Termination Event (as defined below).
A “Lockbox Termination Event” means (a) if the Lockbox Event is caused solely by the occurrence of a Debt Yield Trigger Event, the achievement of a Debt Yield Trigger Event cure, (b) if the Lockbox Event is caused solely by an event of default, the acceptance by the lender of a cure of such event of default (which cure the lender is not obligated to accept and may reject or accept in its sole and absolute discretion) provided that the lender has not accelerated the Newport Centre Whole Loan, moved for a receiver or commenced foreclosure proceedings, (c) if the Lockbox Event is caused solely by a bankruptcy action of the property manager, if the borrower replaces the property manager with a qualified property manager under a replacement management agreement in accordance with the Newport Centre Whole Loan documents within 60 days or such bankruptcy action of the property manager is discharged or dismissed within 90 days without any adverse consequences to the Newport Centre Property or the Newport Centre Whole Loan, or (d) if the Lockbox Event is caused solely by the occurrence of a Major Tenant Trigger Event, so long as only one (1) Major Tenant Trigger Event exists, the earlier to occur of (x) the date on which the applicable Major Tenant Threshold Amount (as defined below) has been deposited in the excess cash flow reserve account or (y) a Major Tenant Trigger Event has been cured in accordance with the Newport Centre Whole Loan documents; provided, however, that, each such Lockbox Termination Event set forth in this definition will be subject to the following conditions, (i) no other Lockbox Event exists, (ii) no other event of default exists under the Newport Centre Whole Loan documents, (iii) the borrower may not cure a Lockbox Event (x) more than a total of five times in the aggregate during the term of the Newport Centre Whole Loan or (y) triggered by a bankruptcy action of the borrower at any time during the term of the Newport Centre Whole Loan, and (iv) the borrower has paid all of the lender’s reasonable out-of-pocket expenses incurred in connection with such Lockbox Termination Event including, reasonable attorney’s fees and expenses.
A “Debt Yield Trigger Event” means, as of any date of determination, the debt yield based on the trailing four calendar quarter period immediately preceding such date of determination is less than 11.5% for two consecutive calendar quarters and will be cured upon the achievement of a debt yield of 11.5% or greater for two consecutive calendar quarters.
A “Major Tenant” means (i) Macy’s, (ii) Kohl’s, (iii) AMC Theatres, and/or (iv) any replacement tenant that occupies (x) at least 75% of the entire premises occupied by AMC Theatres as of the origination date, and/or (as applicable) (y) 50% of the entire premises occupied by Macy’s or Kohl’s as of the origination date.
An “Major Tenant Trigger Event” will commence on the earlier to occur of (i) a bankruptcy action of a Major Tenant, (ii) a Major Tenant Operations Event (meaning the date that a Major Tenant “goes dark” or vacates, on a permanent basis (or for more than 90 consecutive days with an intention to vacate permanently) its demised space at the Newport Centre Property; provided that none of the following will constitute a Major Tenant Operations Event: (a) a temporary closure in connection with a restoration or renovation, (b) any other temporary closure with a duration of less than 90 days, (c) a temporary closure in compliance with applicable law, regulations and/or governmental mandates or (d) a temporary closure related to COVID mandated stay-at-home closures), or (iii) a Major Tenant Renewal Event (as defined below).
An “Major Tenant Renewal Event”” will commence unless such Major Tenant lease has been renewed or extended on terms approved in writing by lender, the earlier of (x) the date on which such Major Tenant gives notice that it will not be renewing its lease in accordance with its terms, and (y) the date in its lease by which such Major Tenant is required to give notice to renew.
“Major Tenant Threshold Amount” means, with respect to (i) the space occupied by Macy’s as of the origination date, the amount of $11,494,450.00, (ii) with respect to the space occupied by Kohl’s as of the origination date, the amount of $7,232,700.00 and (iii) with respect to the space occupied by AMC Theatres as of the origination date, the amount of $2,258,250.00.
Subordinate and Mezzanine Indebtedness. None.
Permitted Future Subordinate or Mezzanine Debt. Not permitted.
Partial Release. Not Permitted.
Ground Lease. None.
| THE INFORMATION IN THIS STRUCTURAL AND COLLATERAL TERM SHEET IS NOT COMPLETE AND MAY BE AMENDED PRIOR TO THE TIME OF SALE. THIS TERM SHEET IS NOT AN OFFER TO SELL THESE SECURITIES AND IT IS NOT A SOLICITATION OF AN OFFER TO BUY THESE SECURITIES IN ANY JURISDICTION WHERE THE OFFER OR SALE IS NOT PERMITTED. | ||
| 92 | ||
| Retail – Anchored | Loan #9 | Cut-off Date Balance: | $27,950,000 | |
| 3529-3915 Union Deposit Road | Union Square Shopping Center | Cut-off Date LTV: | 65.0% | |
| Harrisburg, PA 17109 | UW NCF DSCR: | 1.56x | ||
| UW NOI Debt Yield: | 11.2% |
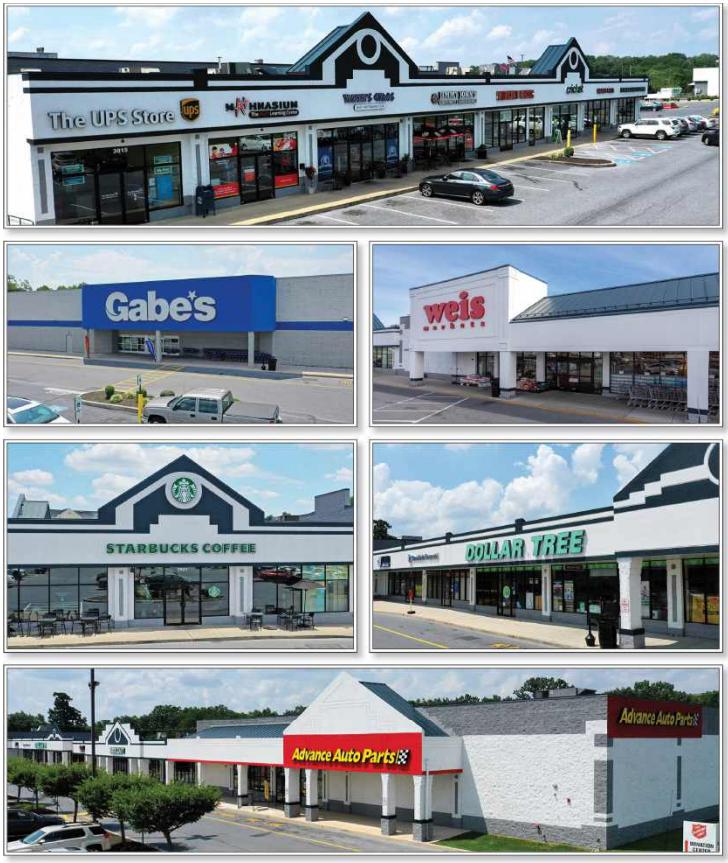
| THE INFORMATION IN THIS STRUCTURAL AND COLLATERAL TERM SHEET IS NOT COMPLETE AND MAY BE AMENDED PRIOR TO THE TIME OF SALE. THIS TERM SHEET IS NOT AN OFFER TO SELL THESE SECURITIES AND IT IS NOT A SOLICITATION OF AN OFFER TO BUY THESE SECURITIES IN ANY JURISDICTION WHERE THE OFFER OR SALE IS NOT PERMITTED. | ||
| 93 | ||
| Retail – Anchored | Loan #9 | Cut-off Date Balance: | $27,950,000 | |
| 3529-3915 Union Deposit Road | Union Square Shopping Center | Cut-off Date LTV: | 65.0% | |
| Harrisburg, PA 17109 | UW NCF DSCR: | 1.56x | ||
| UW NOI Debt Yield: | 11.2% |
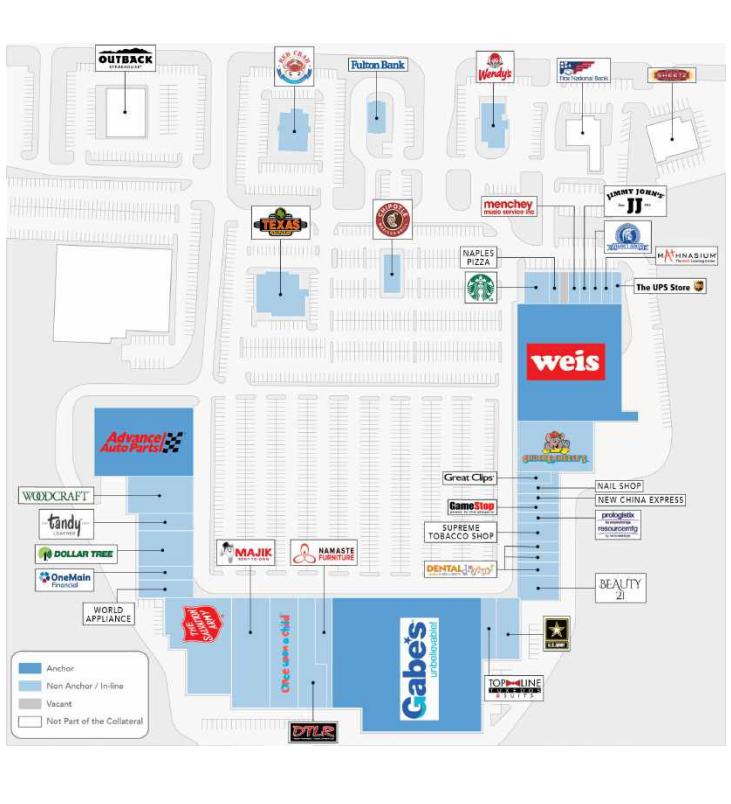
| THE INFORMATION IN THIS STRUCTURAL AND COLLATERAL TERM SHEET IS NOT COMPLETE AND MAY BE AMENDED PRIOR TO THE TIME OF SALE. THIS TERM SHEET IS NOT AN OFFER TO SELL THESE SECURITIES AND IT IS NOT A SOLICITATION OF AN OFFER TO BUY THESE SECURITIES IN ANY JURISDICTION WHERE THE OFFER OR SALE IS NOT PERMITTED. | ||
| 94 | ||
| Retail – Anchored | Loan #9 | Cut-off Date Balance: | $27,950,000 | |
| 3529-3915 Union Deposit Road | Union Square Shopping Center | Cut-off Date LTV: | 65.0% | |
| Harrisburg, PA 17109 | UW NCF DSCR: | 1.56x | ||
| UW NOI Debt Yield: | 11.2% |
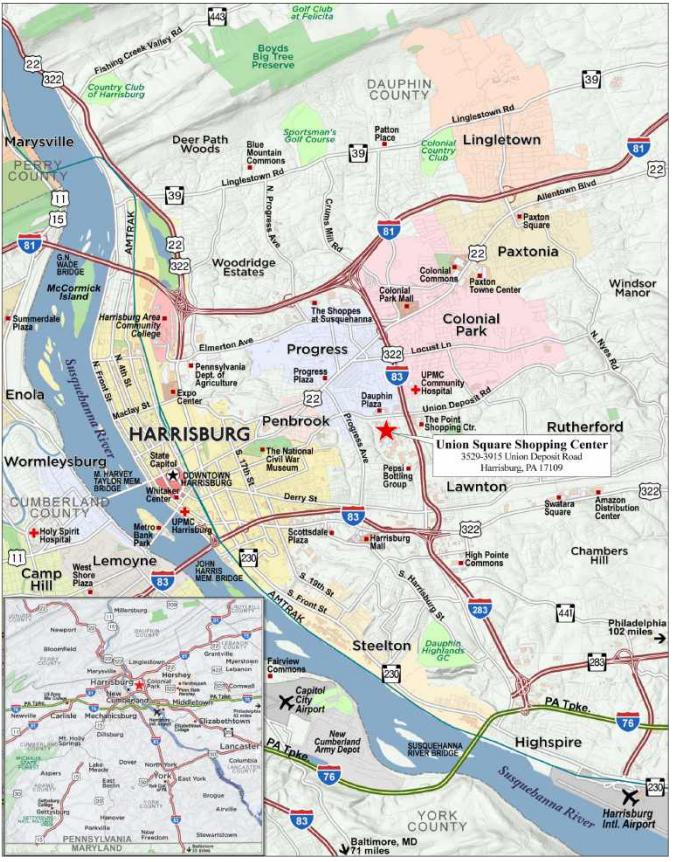
| THE INFORMATION IN THIS STRUCTURAL AND COLLATERAL TERM SHEET IS NOT COMPLETE AND MAY BE AMENDED PRIOR TO THE TIME OF SALE. THIS TERM SHEET IS NOT AN OFFER TO SELL THESE SECURITIES AND IT IS NOT A SOLICITATION OF AN OFFER TO BUY THESE SECURITIES IN ANY JURISDICTION WHERE THE OFFER OR SALE IS NOT PERMITTED. | ||
| 95 | ||
| Mortgage Loan No. 9 – Union Square Shopping Center |
| Mortgage Loan Information | Property Information | ||||||
| Mortgage Loan Seller: | UBS AG | Single Asset/Portfolio: | Single Asset | ||||
| Credit Assessment (Fitch/Moody’s/KBRA): | NR/NR/NR | Location: | Harrisburg, PA 17109 | ||||
| Original Balance: | $27,950,000 | General Property Type: | Retail | ||||
| Cut-off Date Balance: | $27,950,000 | Detailed Property Type: | Anchored | ||||
| % of Initial Pool Balance: | 3.4% | Title Vesting: | Fee | ||||
| Loan Purpose: | Refinance | Year Built/Renovated: | 1988/2006 | ||||
| Borrower Sponsor: | Milton S. Schneider | Size: | 307,913 SF | ||||
| Guarantor: | Milton S. Schneider | Cut-off Date Balance PSF: | $91 | ||||
| Mortgage Rate: | 6.6130% | Maturity Balance PSF: | $91 | ||||
| Note Date: | 11/4/2024 | Property Manager: | Paramount LMS LLC | ||||
| Maturity Date: | 11/6/2034 | ||||||
| Term to Maturity: | 120 months | ||||||
| Amortization Term: | 0 months | Underwriting and Financial Information | |||||
| IO Period: | 120 months | UW NOI: | $3,129,684 | ||||
| Seasoning: | 3 months | UW NCF | $2,924,682 | ||||
| Prepayment Provisions: | L(27),D(89),O(4) | UW NOI Debt Yield: | 11.2% | ||||
| Lockbox/Cash Mgmt Status: | Hard/Springing | UW NCF Debt Yield: | 10.5% | ||||
| Additional Debt Type: | NAP | UW NOI Debt Yield at Maturity: | 11.2% | ||||
| Additional Debt Balance: | NAP | UW NCF DSCR: | 1.56x | ||||
| Future Debt Permitted (Type): | No (NAP) | Most Recent NOI: | $3,227,536 (8/31/2024 TTM) | ||||
| 2nd Most Recent NOI: | $3,118,040 (12/31/2023) | ||||||
| 3rd Most Recent NOI: | $3,138,846 (12/31/2022) | ||||||
| Reserves(1) | Most Recent Occupancy(2): | 97.4% (10/23/2024) | |||||
| Type | Initial | Monthly | Cap | 2nd Most Recent Occupancy: | 98.5% (12/31/2023) | ||
| RE Taxes: | $409,233 | $55,544 | NAP | 3rd Most Recent Occupancy: | 97.4% (12/31/2022) | ||
| Insurance: | $30,640 | $8,511 | NAP | Appraised Value (as of): | $43,000,000 (9/22/2024) | ||
| Replacement Reserve: | $96,000 | Springing | $96,000 | Appraised Value PSF: | $140 | ||
| TI/LC Reserve: | $500,000 | Springing | $500,000 | Cut-off Date LTV Ratio: | 65.0% | ||
| Maturity Date LTV Ratio: | 65.0% | ||||||
| Sources and Uses | ||||||
| Sources | Proceeds | % of Total | Uses | Proceeds | % of Total | |
| Loan Amount: | $27,950,000 | 100.0% | Loan Payoff: | $25,864,047 | 92.5% | |
| Upfront Reserves: | $1,035,873 | 3.7% | ||||
| Return of Equity: | $528,755 | 1.9% | ||||
| Closing Costs: | $521,325 | 1.9% | ||||
| Total Sources: | $27,950,000 | 100.0% | Total Uses: | $27,950,000 | 100.0% | |
| (1) | See “Escrows and Reserves” section. |
| (2) | Most Recent Occupancy is 100.0% as of October 23, 2024. UBS AG is underwriting to a 97.4% occupancy due to a tenant that vacated at the end of October 2024 (Cricket Wireless; 0.5% of NRA), a tenant vacating at the end of January 2025 (Top Line Tuxedo; 1.0% of NRA) and a tenant that has ceased operations but is continuing to pay rent (World Appliance; 1.1% of NRA). |
The Mortgage Loan. The ninth largest mortgage loan (the “Union Square Shopping Center Mortgage Loan”) is evidenced by a single promissory note in the original principal balance of $27,950,000 and secured by the borrower’s first priority fee interest in a 307,913 square foot anchored retail center located in Harrisburg, Pennsylvania (the “Union Square Shopping Center Property”).
The Borrower and the Borrower Sponsor. The borrower is Union Square Shopping Center, L.P., a Pennsylvania limited partnership and single purpose entity with one independent director. Legal counsel to the borrower delivered a non-consolidation opinion in connection with the origination of the Union Square Shopping Center Mortgage Loan. The borrower sponsor and guarantor is Milton S. Schneider, principal and founder of The Glenville Group.
The Property. The Union Square Shopping Center Property consists of an anchored retail center totaling 307,913 square feet located in Harrisburg, Pennsylvania. Built in 1988 and renovated in 2006, the Union Square Shopping Center Property is situated on a 33.2-acre site. The Union Square Shopping Center Property includes six buildings and a total of 1,324 parking spaces, which results in a parking ratio of 4.3 spaces per 1,000 square feet. The Union Square Shopping Center Property is anchored by Gabriel Brothers and Weis Markets and includes national retailers such as Chipotle, Dollar Tree, GameStop, Great Clips Salon, Starbucks, UPS and Wendy's. As of October 23, 2024, the Union Square Shopping Center Property was 100.0% leased to 37 tenants. UBS AG is underwriting to a 97.4% occupancy due to a tenant that vacated at the end of October 2024 (Cricket Wireless; 0.5% of NRA), a tenant vacating at the end of January 2025 (Top Line Tuxedo; 1.0% of NRA) and a tenant that has ceased operations but is continuing to pay rent (World Appliance; 1.1% of NRA). Investment-grade tenants occupy 13.5% of the NRA at the Union Square Shopping Center Property, representing 14.8% of underwritten base rent.
| THE INFORMATION IN THIS STRUCTURAL AND COLLATERAL TERM SHEET IS NOT COMPLETE AND MAY BE AMENDED PRIOR TO THE TIME OF SALE. THIS TERM SHEET IS NOT AN OFFER TO SELL THESE SECURITIES AND IT IS NOT A SOLICITATION OF AN OFFER TO BUY THESE SECURITIES IN ANY JURISDICTION WHERE THE OFFER OR SALE IS NOT PERMITTED. | ||
| 96 | ||
| Retail – Anchored | Loan #9 | Cut-off Date Balance: | $27,950,000 | |
| 3529-3915 Union Deposit Road | Union Square Shopping Center | Cut-off Date LTV: | 65.0% | |
| Harrisburg, PA 17109 | UW NCF DSCR: | 1.56x | ||
| UW NOI Debt Yield: | 11.2% |
Major Tenants.
Gabriel Brothers (78,823 square feet; 25.6% of NRA; 17.4% of underwritten base rent). Founded in 1961 in Morgantown, West Virginia, Gabriel Brothers is an off-price retailer offering top brands and more for less. Since opening more than 60 years ago, Gabriel Brothers provides up to 70% savings off department store prices on fashion and footwear, home, pantry and more. Old Time Pottery, a Tennessee-based home merchandise store, became a part of the Gabriel Brothers family in 2023. Approximately 164 Gabriel Brothers and Old Town Pottery store locations are found across 20 states, with the support of six distribution centers serving the Mid-Atlantic, Midwest, and Southeast. Gabriel Brothers has been a tenant since 1993 and has a lease expiration of September 30, 2029. Gabriel Brothers has one, five-year renewal option remaining. In the event of a casualty, if more than 50% of the ground floor area, in the aggregate, of all the buildings at the Union Square Shopping Center Property is closed due to damage and the Required Space (as defined here) is not repaired within 10 months, Gabriel Brothers may terminate its lease by providing notice. The lease terminates 60 days after notice unless repairs are completed before this date. “Required Space” means the amount of ground floor building area in the Union Square Shopping Center Property which when added to the ground floor building area at the Union Square Shopping Center Property that has not been damaged or destroyed equals 75% of the ground floor building area at the Union Square Shopping Center Property existing immediately prior to such damage or destruction (excluding the Gabriel Brothers premises).
Weis Markets (45,000 square feet; 14.6% of NRA; 11.0% of underwritten base rent). Weis Markets (NYSE: WMK) is a Pennsylvania business founded by Harry and Sigmund Weis in 1912 and incorporated in 1924. Weis Markets is engaged principally in the retail sale of food in Pennsylvania and surrounding states. Weis Markets retail food stores sell groceries, dairy products, frozen foods, meats, seafood, fresh produce, floral products, pharmacy services, deli products, prepared foods, bakery products, beer and wine, fuel and general merchandise items, such as health and beauty care and household products. Weis Markets currently owns and operates 197 retail food stores many of which have on-line order customer service. Weis Markets has been a tenant since 1989 and has a lease expiration of December 31, 2031. Weis Markets has a one-time right to terminate effective December 31, 2026, with 12-months' notice.
Advanced Auto Parts (24,300 square feet; 7.9% of NRA; 5.9% of underwritten base rent). Advance Auto Parts (NYSE: AAP) is an automotive aftermarket parts provider that serves both professional installers and do-it-yourself customers. As of July 13, 2024, Advance Auto Parts operated 4,776 stores and 321 Worldpac branches primarily within the United States, with additional locations in Canada, Puerto Rico and the U.S. Virgin Islands. Advance Auto Parts also served 1,138 independently owned Carquest branded stores across these locations in addition to Mexico and various Caribbean islands. Advance Auto Parts has been a tenant since 2020 and has a lease expiration of July 31, 2031. Advance Auto Parts has three, five-year renewal options remaining. Advance Auto Parts has a one-time right to terminate its lease, effective on the expiration of the 5th lease year provided (i) Advance Auto Parts provides the landlord at least 365 days prior written notice and (ii) on or before the date of termination, Advance Auto Parts pays to the landlord the unamortized portion of the tenant allowance as of the date of termination and the unamortized portion of any fees paid to the brokers, both amounts amortized on an even basis over the initial term.
The following table presents certain information relating to the tenancy at the Union Square Shopping Center Property:
| Tenant Summary(1) | |||||||||
| Tenant Name | Credit Rating (Fitch/Moody's/ S&P)(2) | Tenant SF | Approx % of Total SF | Annual UW Rent(3) | % of Total Annual UW Rent | Annual UW Rent PSF(3) | Lease Expiration | Term. Option (Y/N) | Renewal Options |
| Gabriel Brothers | NR/NR/NR | 78,823 | 25.6% | $571,467 | 17.4% | $7.25 | 9/30/2029 | Y(4) | 1, 5-year |
| Weis Markets | NR/NR/NR | 45,000 | 14.6% | $360,000 | 11.0% | $8.00 | 12/31/2031 | Y(5) | None |
| Advance Auto Parts | NR/Ba1/BB+ | 24,300 | 7.9% | $194,400 | 5.9% | $8.00 | 7/31/2031 | Y(6) | 3, 5-year |
| The Salvation Army | NR/NR/NR | 22,250 | 7.2% | $206,925 | 6.3% | $9.30 | 4/30/2026 | Y(7) | None |
| Majik Enterprises | NR/NR/NR | 16,211 | 5.3% | $87,500 | 2.7% | $5.40 | 1/31/2033 | N | 1, 5-year |
| DTLR (Villa) | NR/NR/NR | 14,128 | 4.6% | $102,428 | 3.1% | $7.25 | 8/31/2029 | N | 1, 5-year |
| Chuck E Cheese | NR/NR/NR | 14,042 | 4.6% | $126,378 | 3.9% | $9.00 | 7/31/2029 | Y(8) | 2, 5-year |
| Subtotal/Wtd. Avg. | 214,754 | 69.7% | $1,649,098 | 50.3% | $7.68 | ||||
| Other Tenants | 85,259 | 27.7% | $1,626,323 | 49.7% | $19.08 | ||||
| Occupied Collateral Total | 300,013 | 97.4% | $3,275,421 | 100.0% | $10.92 | ||||
| Vacant Space | 7,900 | 2.6% | |||||||
| Total/Wtd. Avg. | 307,913 | 100.0% | |||||||
| (1) | Based on the underwritten rent roll dated October 23, 2024. |
| (2) | Represents the credit rating of the parent company, whether or not the parent guarantees the lease. |
| (3) | Annual UW Rent and Annual UW Rent PSF include contractual rent steps through December 31, 2025 totaling $56,354. |
| (4) | Gabriel Brothers may terminate its lease by providing notice if more than 50% of the ground floor area at the Union Square Shopping Center Property is closed due to damage and not repaired within 10 months. The lease terminates 60 days after notice unless repairs are completed before this date. |
| (5) | Weis Markets has a one-time right to terminate effective December 31, 2026, with 12-months' notice. |
| (6) | Advance Auto Parts has a one-time right to terminate its lease, effective on the expiration of the 5th lease year provided (i) Advance Auto Parts provides the landlord at least 365 days prior written notice and (ii) on or before the date of termination, Advance Auto Parts pays to the landlord the unamortized portion of the tenant allowance as of the date of termination and the unamortized portion of any fees paid to the brokers, both amounts amortized on an even basis over the initial term. |
| (7) | Should The Salvation Army be unable to operate a retail store for the sale of new and/or second-hand merchandise due to any restriction, covenant, regulation, ordinance, or local zoning laws, at The Salvation Army's option, upon written notice from The Salvation Army Board of Trustees, West Nyack, New York and 90 days right to cure, the lease will become null and void. |
| (8) | If after five years, Union Square Shopping Center Property is 50.0% vacant, the landlord has six months to raise the occupancy level of the Union Square Shopping Center Property or Chuck E Cheese may elect to terminate its lease. |
| THE INFORMATION IN THIS STRUCTURAL AND COLLATERAL TERM SHEET IS NOT COMPLETE AND MAY BE AMENDED PRIOR TO THE TIME OF SALE. THIS TERM SHEET IS NOT AN OFFER TO SELL THESE SECURITIES AND IT IS NOT A SOLICITATION OF AN OFFER TO BUY THESE SECURITIES IN ANY JURISDICTION WHERE THE OFFER OR SALE IS NOT PERMITTED. | ||
| 97 | ||
| Retail – Anchored | Loan #9 | Cut-off Date Balance: | $27,950,000 | |
| 3529-3915 Union Deposit Road | Union Square Shopping Center | Cut-off Date LTV: | 65.0% | |
| Harrisburg, PA 17109 | UW NCF DSCR: | 1.56x | ||
| UW NOI Debt Yield: | 11.2% |
The following table presents certain information relating to the lease rollover schedule at the Union Square Shopping Center Property:
| Lease Rollover Schedule(1)(2) | ||||||||
| Year | # of Leases Rolling | SF Rolling | Approx. % of Total SF Rolling | Approx. Cumulative % of SF Rolling | Total UW Rent Rolling(3)(4) | Approx. % of Total Rent Rolling(4) | Approx. Cumulative % of Total Rent Rolling | UW Rent PSF Rolling(3)(4) |
| MTM/2025 | 2 | 9,195 | 3.0% | 3.0% | $117,527 | 3.6% | 3.6% | $12.78 |
| 2026 | 7 | 33,511 | 10.9% | 13.9% | $483,131 | 14.8% | 18.3% | $14.42 |
| 2027 | 7 | 18,001 | 5.8% | 19.7% | $316,825 | 9.7% | 28.0% | $17.60 |
| 2028 | 4 | 16,001 | 5.2% | 24.9% | $302,478 | 9.2% | 37.2% | $18.90 |
| 2029 | 8 | 135,792 | 44.1% | 69.0% | $1,226,224 | 37.4% | 74.7% | $9.03 |
| 2030 | 2 | 2 | 0.0% | 69.0% | $152,317 | 4.7% | 79.3% | $76,158.50 |
| 2031 | 2 | 69,300 | 22.5% | 91.5% | $554,400 | 16.9% | 96.3% | $8.00 |
| 2032 | 1 | 2,000 | 0.6% | 92.2% | $35,018 | 1.1% | 97.3% | $17.51 |
| 2033 | 1 | 16,211 | 5.3% | 97.4% | $87,500 | 2.7% | 100.0% | $5.40 |
| 2034 | 0 | 0 | 0.0% | 97.4% | $0 | 0.0% | 100.0% | $0.00 |
| 2035 | 0 | 0 | 0.0% | 97.4% | $0 | 0.0% | 100.0% | $0.00 |
| Thereafter | 0 | 0 | 0.0% | 97.4% | $0 | 0.0% | 100.0% | $0.00 |
| Vacant | 0 | 7,900 | 2.6% | 100.0% | $0 | 0.0% | 100.0% | $0.00 |
| Total/Wtd. Avg. | 34 | 307,913 | 100.0% | $3,275,421 | 100.0% | $10.92 | ||
| (1) | Based on the underwritten rent roll dated October 23, 2024. |
| (2) | Certain tenants may have lease termination options that are exercisable prior to the stated expiration date of the subject lease or leases which are not considered in the Lease Rollover Schedule. |
| (3) | Total UW Rent Rolling and Wtd. Avg. UW Rent PSF Rolling does not include vacant space. |
| (4) | Total UW Rent Rolling, Approx. % of Total Rent Rolling and UW Rent PSF Rolling shown above include contractual rent steps through December 31, 2025 totaling $56,354. |
The Market. The Union Square Shopping Center Property is located in Dauphin County, Harrisburg, Pennsylvania. As the state capital, Harrisburg is the largest city of the region at 11.2 square miles. The Union Square Shopping Center Property is approximately 3.9 miles east of the Harrisburg central business district, approximately 9.0 miles northwest of the Harrisburg International Airport, approximately 83.1 miles north of Baltimore, Maryland and approximately 104 miles west of Philadelphia. Access to the neighborhood is provided by Interstate 83, a highway located in Maryland and Pennsylvania running from Baltimore, Maryland to Harrisburg, Pennsylvania, Interstate 283 and US Route 22. The immediate area is primarily composed of a mix of hospitality, retail, office, and restaurant uses. Retailers in the immediate surrounding area include Price Rite, Waffle House, Crunch Fitness, Big Lots, Lowe's, McDonald's, IHOP, Staples, GIANT, Burlington, and many more. Colonial Commons, approximately 3.6 miles from the Union Square Shopping Center Property, includes retailers such as Hobby Lobby, At Home, Dick's Sporting Goods, Sally Beauty, Marshalls, Bath & Body Works and Dollar Tree with other nationally recognized retailers being Ulta, Great Clips, Old Navy, Five Guys, and Olive Garden.
According to a third-party market research report, the estimated 2024 population within a one-, three- and five-mile radius of the Union Square Shopping Center Property was 11,503, 95,959 and 195,415, respectively, and the estimated 2024 average household income is $72,224, $77,484 and $89,606, respectively. According to a third-party market research report, the Union Square Shopping Center Property is located along high-traffic Union Deposit Road and Able Drive that sees, on average, 12,669 vehicles per day.
The Union Square Shopping Center Property is part of the Harrisburg-Carlisle, Pennsylvania Metropolitan Statistical Area (the “MSA”). Specifically, the Union Square Shopping Center Property is located within the Harrisburg Area East retail submarket. According to a third-party market research report, the MSA had an estimated 2024 population of approximately 610,059 and experienced an annual growth rate of approximately 0.8% since 2020. According to a third-party market research report, as of August 2024, the Harrisburg Area East retail submarket reported an inventory of approximately 19.4 million square feet, with an average asking rent of $17.17 and an overall vacancy rate of 5.7%. The appraisal concluded to market rents in the market rent summary below
The following table presents certain information relating to the appraisal’s market rent conclusions for the Union Square Shopping Center Property:
| Market Rent Summary | |||||||
| Large Inline > 5,000 SF | Medium Inline < 5,000 SF | Small Inline < 2,500 SF | Pad | Anchor > 25,000 SF | Weis Market | Junior Anchor < 25,000 SF | |
| Market Rent (PSF) | $13.50 | $15.50 | $20.00 | $40.00 | $7.50 | $8.50 | $8.00 |
| Lease Term (Years) | 10 | 5 | 5 | 10 | 10 | 10 | 20 |
| Lease Type | Net | Net | Net | Net | Net | Net | Net |
| Escalations | 2.0% / Year | 2.0% / Year | 2.0% / Year | 10.0% / 5 Years | 10.0% / 5 Years | 10.0% / 5 Years | 10.0% / 5 Years |
| Source: Appraisal. |
| THE INFORMATION IN THIS STRUCTURAL AND COLLATERAL TERM SHEET IS NOT COMPLETE AND MAY BE AMENDED PRIOR TO THE TIME OF SALE. THIS TERM SHEET IS NOT AN OFFER TO SELL THESE SECURITIES AND IT IS NOT A SOLICITATION OF AN OFFER TO BUY THESE SECURITIES IN ANY JURISDICTION WHERE THE OFFER OR SALE IS NOT PERMITTED. | ||
| 98 | ||
| Retail – Anchored | Loan #9 | Cut-off Date Balance: | $27,950,000 | |
| 3529-3915 Union Deposit Road | Union Square Shopping Center | Cut-off Date LTV: | 65.0% | |
| Harrisburg, PA 17109 | UW NCF DSCR: | 1.56x | ||
| UW NOI Debt Yield: | 11.2% |
The table below presents certain information relating to comparable sales pertaining to the Union Square Shopping Center Property identified by the appraiser:
| Comparable Sales(1) | ||||||
| Property Name | Year Built/Renovated | Rentable Area (SF) | Occupancy | Sale Date | Sale Price | Sale Price (PSF) |
Union Square Shopping Center 3529-3915 Union Deposit Road Harrisburg, PA | 1988/2006 | 307,913(2) | 97.4%(2) | |||
Shippenburg Marketplace SC 397 Baltimore Road Shippensburg, PA | 2002/NAP | 59,339 | 85.0% | Apr-2024 | $6,630,000 | $112 |
Larkins Center 601 Conchester Highway Boothwyn, PA | 1994/NAP | 225,214 | 99.0% | Sep-2023 | $26,000,000 | $115 |
The Pavilion at Lansdale 401 South Broad Street Lansdale, PA | 1960/NAP | 135,808 | 96.0% | Apr-2023 | $19,500,000 | $144 |
Franklin Center 1320 Lincoln Way East Chambersburg, PA | 1989/2015 | 174,063 | 97.0% | May-2022 | $22,250,000 | $128 |
Dauphin Plaza 3812 Union Deposit Road Harrisburg, PA | 1989/NAP | 215,735 | 92.0% | Mar-2022 | $21,700,000 | $101 |
| (1) | Information obtained from the appraisal. |
| (2) | Information obtained from the underwritten rent roll dated October 23, 2024. |
Appraisal. The appraisal concluded to an “as-is” value of $43,000,000 as of September 22, 2024 for the Union Square Shopping Center Property.
Environmental Matters. According to the Phase I environmental site assessment dated September 19, 2024 for the Union Square Shopping Center Property, there was no evidence of any recognized environmental conditions.
Operating History and Underwritten Net Cash Flow. The following table presents certain information relating to the historical operating performance and underwritten net cash flow at the Union Square Shopping Center Property:
| Cash Flow Analysis | ||||||
| 2021 | 2022 | 2023 | TTM 8/31/2024 | UW | UW PSF | |
| Base Rent(1) | $3,123,681 | $3,137,695 | $3,166,253 | $3,336,494 | $3,275,421 | $10.64 |
| Straight-Line Rent | 0 | 0 | 0 | 0 | 14,765 | 0.05 |
| Grossed Up Vacant Space | 0 | 0 | 0 | 0 | 128,750 | 0.42 |
| Gross Potential Rent | $3,123,681 | $3,137,695 | $3,166,253 | $3,336,494 | $3,418,935 | $11.10 |
| Other Income | 6,744 | 25,835 | 41,578 | 24,783 | 24,783 | 0.08 |
| Total Recoveries | 1,111,048 | 1,053,359 | 1,011,894 | 1,052,897 | 1,121,145 | 3.64 |
| Net Rental Income | $4,241,473 | $4,216,889 | $4,219,725 | $4,414,174 | $4,564,864 | $14.83 |
| (Vacancy & Credit Loss) | 0 | 0 | 0 | 0 | (227,004) | (0.74) |
| Effective Gross Income | $4,241,473 | $4,216,889 | $4,219,725 | $4,414,174 | $4,337,860 | $14.09 |
| Real Estate Taxes | $594,984 | $602,451 | $616,657 | $653,195 | $653,195 | $2.12 |
| Insurance | 66,092 | 68,658 | 75,639 | 75,639 | 102,134 | 0.33 |
| Management Fee | 124,012 | 126,143 | 127,558 | 135,094 | 130,136 | 0.42 |
| Other Operating Expenses | 393,266 | 280,790 | 281,830 | 322,711 | 322,711 | 1.05 |
| Total Expenses | $1,178,354 | $1,078,043 | $1,101,684 | $1,186,638 | $1,208,175 | $3.92 |
| Net Operating Income | $3,063,119 | $3,138,846 | $3,118,040 | $3,227,536 | $3,129,684 | $10.16 |
| Replacement Reserves | 0 | 0 | 0 | 0 | 45,096 | 0.15 |
| TI/LC | 0 | 0 | 0 | 0 | 159,906 | 0.52 |
| Net Cash Flow | $3,063,119 | $3,138,846 | $3,118,040 | $3,227,536 | $2,924,682 | $9.50 |
| Occupancy %(2) | 98.8% | 97.4% | 98.5% | 100.0% | 95.0% | |
| NOI DSCR | 1.63x | 1.67x | 1.66x | 1.72x | 1.67x | |
| NCF DSCR | 1.63x | 1.67x | 1.66x | 1.72x | 1.56x | |
| NOI Debt Yield | 11.0% | 11.2% | 11.2% | 11.5% | 11.2% | |
| NCF Debt Yield | 11.0% | 11.2% | 11.2% | 11.5% | 10.5% | |
| (1) | Base Rent includes contractual rent steps totaling $56,354 through December 2025. |
| (2) | The UW Occupancy % represents the in-place economic occupancy. Historical occupancies represent physical occupancies. UW Occupancy % based on physical occupancy is 100.0% as of October 23, 2024. UBS AG is underwriting to a 97.4% occupancy due to a tenant that vacated at the end of October 2024 (Cricket Wireless; 0.5% of NRA), a tenant vacating at the end of January 2025 (Top Line Tuxedo; 1.0% of NRA) and a tenant that has ceased operations but is continuing to pay rent (World Appliance; 1.1% of NRA). |
| THE INFORMATION IN THIS STRUCTURAL AND COLLATERAL TERM SHEET IS NOT COMPLETE AND MAY BE AMENDED PRIOR TO THE TIME OF SALE. THIS TERM SHEET IS NOT AN OFFER TO SELL THESE SECURITIES AND IT IS NOT A SOLICITATION OF AN OFFER TO BUY THESE SECURITIES IN ANY JURISDICTION WHERE THE OFFER OR SALE IS NOT PERMITTED. | ||
| 99 | ||
| Retail – Anchored | Loan #9 | Cut-off Date Balance: | $27,950,000 | |
| 3529-3915 Union Deposit Road | Union Square Shopping Center | Cut-off Date LTV: | 65.0% | |
| Harrisburg, PA 17109 | UW NCF DSCR: | 1.56x | ||
| UW NOI Debt Yield: | 11.2% |
Escrows and Reserves.
Real Estate Taxes – The loan documents require an upfront deposit of approximately $409,233 and ongoing monthly reserves for real estate taxes in an amount equal to 1/12th of the real estate taxes that the lender estimates will be payable during the next 12 months, initially $55,544.
Insurance – The loan documents require an upfront deposit of approximately $30,640 and ongoing monthly insurance reserves in an amount equal to 1/12th of the insurance premiums that the lender estimates will be payable for the renewal of the coverage, initially $8,511.
Replacement Reserve – The loan documents require an upfront deposit of $96,000 and an ongoing monthly replacement reserve deposit of $4,002, capped at $96,000.
TI/LC Reserve – The loan documents require an upfront deposit of $500,000 and an ongoing monthly replacement reserve deposit of $19,245, capped at $500,000.
Lockbox and Cash Management. The Union Square Shopping Center Mortgage Loan is structured with a hard lockbox and springing cash management upon the occurrence and continuance of a Cash Management Trigger Event (as defined below). Rents from the Union Square Shopping Center Property are required to be deposited directly into the lockbox account or, if received by the borrower or the property manager, deposited within one business day of receipt. During the continuance of a Cash Management Trigger Event, all funds in the lockbox account are required to be swept each business day to a lender-controlled cash management account and disbursed in accordance with the Union Square Shopping Center Mortgage Loan documents, and all excess funds on deposit in the cash management account (after payment of required monthly reserve deposits, debt service payment on the Union Square Shopping Center Mortgage Loan, operating expenses and cash management bank fees) will be applied as follows: (a) if a Material Tenant Trigger Event (as defined below) has occurred and is continuing, to a Material Tenant (as defined below) rollover reserve, (b) if a Cash Sweep Trigger Event (as defined below) has occurred and is continuing (but not a Material Tenant Trigger Event), to the lender-controlled excess cash flow account or (c) if no Material Tenant Trigger Event or Cash Sweep Trigger Event has occurred and is continuing, to an account designated by the borrower.
A “Cash Management Trigger Event” means a period commencing upon the occurrence of (i) an event of default under the Union Square Shopping Center Mortgage Loan documents, (ii) any bankruptcy action involving any of the borrower, Glenville Union Square GP, LLC (the “SPC Party”), the guarantor or the property manager, (iii) the trailing 12-month period debt service coverage ratio falling below 1.30x or (iv) a Material Tenant Trigger Event, and expiring upon (a) with respect to clause (i) above, the cure of such event of default, (b) with respect to clause (ii) above, the filing being discharged, stayed or dismissed within 45 days for the borrower, the SPC Party, the guarantor or the property manager, and the lender’s determination that such filing does not materially affect the borrower’s, the SPC Party’s, the guarantor’s or the property manager’s monetary obligations, (c) with respect to clause (iii) above, the trailing 12-month debt service coverage ratio being at least (A) 1.40x for one calendar quarter or (B) 1.35x for two consecutive calendar quarters or (d) with respect to clause (iv) above, the cure of such Material Tenant Trigger Event.
A “Cash Sweep Trigger Event” means a period commencing upon the occurrence of (i) an event of default under the Union Square Shopping Center Mortgage Loan documents, (ii) any bankruptcy action involving any of the borrower, the SPC Party or the guarantor or (iii) the trailing 12-month period debt service coverage ratio falling below 1.20x, and expiring upon (a) with respect to clause (i) above, the cure of such event of default, (b) with respect to clause (ii) above, as to an involuntary filing, the filing being discharged, stayed or dismissed within 45 days for any of the borrower, the SPC Party or the guarantor, and the lender’s determination that such filing does not materially affect the borrower’s, the SPC Party’s or the guarantor’s monetary obligations or (c) with respect to clause (iii) above, the trailing 12-month debt service coverage ratio being at least (A) 1.30x for one calendar quarter or (B) 1.25x for two consecutive calendar quarters.
A “Material Tenant” means (i) Gabriel Brothers, (ii) Weis Markets or (iii) any tenant at the Union Square Shopping Center Property that, together with its affiliates, either (a) leases no less than 15% of the total rentable square footage of the Union Square Shopping Center Property or (b) accounts for (or would account for) no less than 15% of the total in-place base rent at the Union Square Shopping Center Property.
A “Material Tenant Trigger Event” means a period commencing upon the occurrence of (i) a Material Tenant giving notice of its intention to terminate, cancel, or not to extend or renew its lease, (ii) if, on or prior to the date that is 12 months prior to the then-applicable expiration date under its Material Tenant lease, a Material Tenant does not extend such Material Tenant lease, (iii) on or prior to the date a Material Tenant is required under its Material Tenant lease to notify the borrower of its election to extend or renew its lease, if such Material Tenant does not give notice, (iv) an event of default under a Material Tenant lease occurring and continuing beyond any applicable notice and/or cure period, (v) a bankruptcy action of a Material Tenant or a lease guarantor of any Material Tenant lease occurring, (vi) a Material Tenant lease being terminated in whole or in part or is no longer in full force and effect, (vii) a Material Tenant “going dark”, vacating, ceasing to occupy or ceasing to conduct business in the ordinary course at all or any portion of its Material Tenant space or (viii) a Material Tenant (or a person on its behalf) announces or discloses publicly its intention to relocate from or vacate all or any portion of its Material Tenant space, and expiring upon (a) with respect to clause (i), (ii), (iii), (vi), (vii) and (viii) above, the date that (1) the applicable Material Tenant lease is extended on terms satisfying the requirements of the Union Square Shopping Center Mortgage Loan documents or (2) all or substantially all of the applicable Material Tenant space is leased to a replacement tenant, (b) with respect to clause (i) above, if the conditions of clause (a) above are not satisfied, the unconditional revocation or rescission by the applicable Material Tenant of all termination or non-extension notices with respect to its Material Tenant lease, (c) with respect to clause (iv) above, a cure of the applicable event of default, (d) with respect to clause (v) above, the affirmation of the Material Tenant lease in the applicable bankruptcy proceeding and confirmation that the Material Tenant is actually paying all rents and other amounts under its lease (or, if applicable, the discharge or dismissal of the applicable Material Tenant lease guarantor from the applicable bankruptcy proceeding; provided that such bankruptcy (after dismissal or discharge) does not have an adverse effect on such Material Tenant lease guarantor’s ability to perform its obligations under its lease guaranty), (e) with respect to clause (vii) above, the applicable Material Tenant re-commencing its normal business operations at its Material Tenant space or the applicable portion thereof, such that it is no longer dark and has not vacated or ceased to conduct business at the Union Square Shopping Center Property or a portion thereof and (f) with respect to clause (viii) above, the unconditional retraction by the applicable Material Tenant of all announcements or disclosures of its intention to relocate from or vacate any portion of its Material Tenant space.
In order to avoid a Material Tenant Trigger Event, the Union Square Shopping Center Mortgage Loan documents permit the borrower to post a lump sum cash deposit in the amount of $1.25 million (the “Re-tenanting Reserve”), within five days of the occurrence of a Material Tenant Trigger Event. A deposit will defer the Material Tenant Trigger Event for one year. In addition, with respect to the Gabriel Brothers lease, in the event of the occurrence of a Material Tenant Trigger Event triggered solely pursuant to subsection (ii) of the definition thereof, the borrower can elect to defer the deposit of the Re-tenanting
| THE INFORMATION IN THIS STRUCTURAL AND COLLATERAL TERM SHEET IS NOT COMPLETE AND MAY BE AMENDED PRIOR TO THE TIME OF SALE. THIS TERM SHEET IS NOT AN OFFER TO SELL THESE SECURITIES AND IT IS NOT A SOLICITATION OF AN OFFER TO BUY THESE SECURITIES IN ANY JURISDICTION WHERE THE OFFER OR SALE IS NOT PERMITTED. | ||
| 100 | ||
| Retail – Anchored | Loan #9 | Cut-off Date Balance: | $27,950,000 | |
| 3529-3915 Union Deposit Road | Union Square Shopping Center | Cut-off Date LTV: | 65.0% | |
| Harrisburg, PA 17109 | UW NCF DSCR: | 1.56x | ||
| UW NOI Debt Yield: | 11.2% |
Reserve until the occurrence of Material Tenant Trigger Event triggered pursuant to subsection (iii) of the definition thereof. Failure of the borrower to post the Re-tenanting Reserve on the deferred date will be an event of default and trigger recourse on the Union Square Shopping Center Mortgage Loan. Such deposit will defer the Material Tenant Trigger Event for 12 months.
Property Management. The Union Square Shopping Center Property is managed by Paramount LMS LLC.
Mezzanine Loan and Preferred Equity. None.
Release of Property. Not permitted.
Terrorism Insurance. The loan documents require that the “all risk” insurance policy required to be maintained by the borrower provides coverage for terrorism in an amount equal to the full replacement cost of the property, as well as business interruption insurance covering no less than the 18-month period following the occurrence of a casualty event, together with a 12-month extended period of indemnity.
| THE INFORMATION IN THIS STRUCTURAL AND COLLATERAL TERM SHEET IS NOT COMPLETE AND MAY BE AMENDED PRIOR TO THE TIME OF SALE. THIS TERM SHEET IS NOT AN OFFER TO SELL THESE SECURITIES AND IT IS NOT A SOLICITATION OF AN OFFER TO BUY THESE SECURITIES IN ANY JURISDICTION WHERE THE OFFER OR SALE IS NOT PERMITTED. | ||
| 101 | ||
| Retail– Super Regional Mall | Loan #10 | Cut-off Date Balance: | $25,000,000 | |
| 555 The Shops at Mission Viejo | Shops at Mission Viejo | Cut-off Date LTV: | 52.4% | |
| Mission Viejo, CA 92691 | UW NCF DSCR: | 1.69x | ||
| UW NOI Debt Yield: | 13.4% |

| THE INFORMATION IN THIS STRUCTURAL AND COLLATERAL TERM SHEET IS NOT COMPLETE AND MAY BE AMENDED PRIOR TO THE TIME OF SALE. THIS TERM SHEET IS NOT AN OFFER TO SELL THESE SECURITIES AND IT IS NOT A SOLICITATION OF AN OFFER TO BUY THESE SECURITIES IN ANY JURISDICTION WHERE THE OFFER OR SALE IS NOT PERMITTED. | ||
| 102 | ||
| Retail– Super Regional Mall | Loan #10 | Cut-off Date Balance: | $25,000,000 | |
| 555 The Shops at Mission Viejo | Shops at Mission Viejo | Cut-off Date LTV: | 52.4% | |
| Mission Viejo, CA 92691 | UW NCF DSCR: | 1.69x | ||
| UW NOI Debt Yield: | 13.4% |
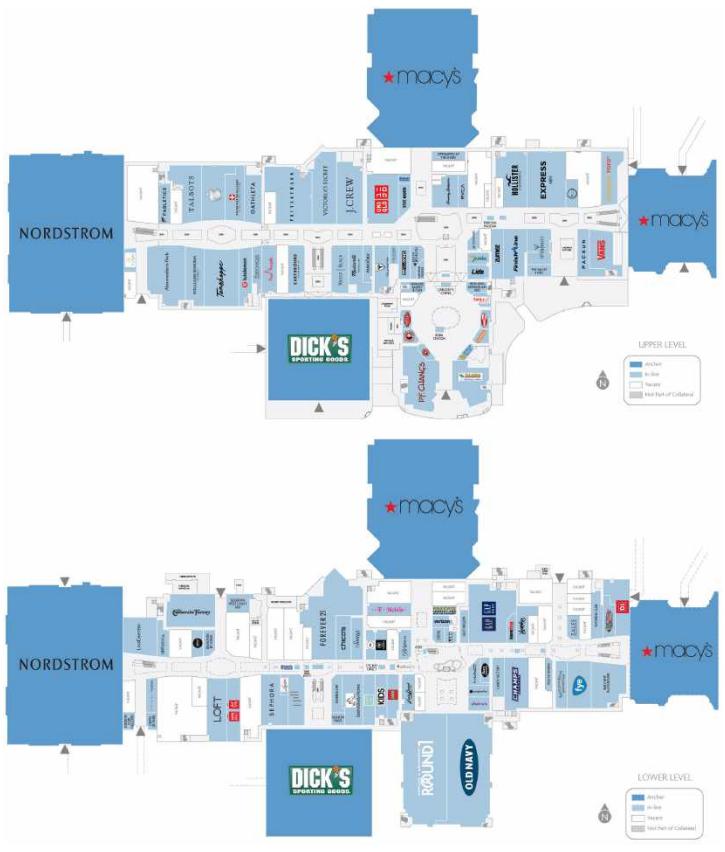
| THE INFORMATION IN THIS STRUCTURAL AND COLLATERAL TERM SHEET IS NOT COMPLETE AND MAY BE AMENDED PRIOR TO THE TIME OF SALE. THIS TERM SHEET IS NOT AN OFFER TO SELL THESE SECURITIES AND IT IS NOT A SOLICITATION OF AN OFFER TO BUY THESE SECURITIES IN ANY JURISDICTION WHERE THE OFFER OR SALE IS NOT PERMITTED. | ||
| 103 | ||
| Retail– Super Regional Mall | Loan #10 | Cut-off Date Balance: | $25,000,000 | |
| 555 The Shops at Mission Viejo | Shops at Mission Viejo | Cut-off Date LTV: | 52.4% | |
| Mission Viejo, CA 92691 | UW NCF DSCR: | 1.69x | ||
| UW NOI Debt Yield: | 13.4% |
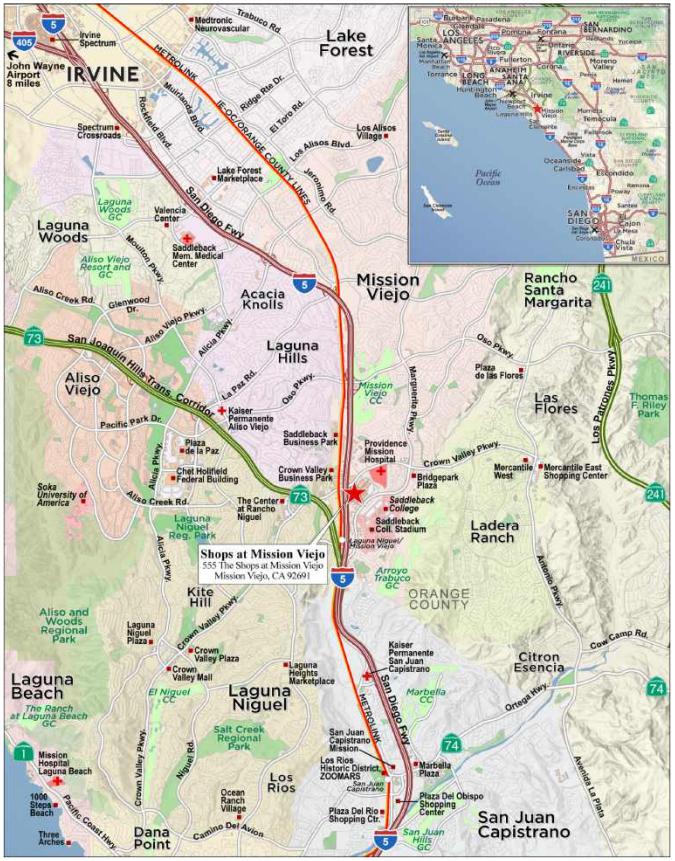
| THE INFORMATION IN THIS STRUCTURAL AND COLLATERAL TERM SHEET IS NOT COMPLETE AND MAY BE AMENDED PRIOR TO THE TIME OF SALE. THIS TERM SHEET IS NOT AN OFFER TO SELL THESE SECURITIES AND IT IS NOT A SOLICITATION OF AN OFFER TO BUY THESE SECURITIES IN ANY JURISDICTION WHERE THE OFFER OR SALE IS NOT PERMITTED. | ||
| 104 | ||
| Mortgage Loan No. 10 – Shops at Mission Viejo |
| Mortgage Loan Information | Property Information | |||||||
| Mortgage Loan Seller: | CREFI | Single Asset/Portfolio: | Single Asset | |||||
| Credit Assessment (Fitch/KBRA/Moody’s): | NR/NR/Baa3 | Location: | Mission Viejo, CA 92691 | |||||
| Original Balance(1): | $25,000,000 | General Property Type: | Retail | |||||
| Cut-off Date Balance(1): | $25,000,000 | Detailed Property Type: | Super Regional Mall | |||||
| % of Initial Pool Balance: | 3.0% | Title Vesting: | Fee | |||||
| Loan Purpose: | Refinance | Year Built/Renovated: | 1979 / 2000, 2021 | |||||
| Borrower Sponsors: | Simon Property Group, L.P. and Institutional Mall Investors LLC | Size(4): | 1,012,005 SF | |||||
| Guarantors: | Simon Property Group, L.P. | Cut-off Date Balance Per SF(1): | $178 | |||||
| Mortgage Rate: | 6.72500% | Maturity Date Balance Per SF(1): | $168 | |||||
| Note Date: | 12/4/2024 | Property Manager: | Simon Management Associates, LLC | |||||
| Maturity Date: | 1/1/2035 | |||||||
| Term to Maturity: | 120 months | Underwriting and Financial Information(1) | ||||||
| Amortization Term: | 360 months | UW NOI: | $24,174,721 | |||||
| IO Period: | 60 months | UW NCF: | $23,570,815 | |||||
| Seasoning: | 1 month | UW NOI Debt Yield: | 13.4% | |||||
| Prepayment Provisions(2): | L(25),D(88),O(7) | UW NCF Debt Yield: | 13.1% | |||||
| Lockbox/Cash Mgmt. Status: | Hard/Springing | UW NOI Debt Yield at Maturity: | 14.2% | |||||
| Additional Debt Type(1): | Pari Passu | UW NCF DSCR: | 1.69x | |||||
| Additional Debt Balance(1): | $155,000,000 | Most Recent NOI(5): | $24,142,803 (9/30/2024 TTM) | |||||
| Future Debt Permitted (Type): | No (NAP) | 2nd Most Recent NOI(5): | $25,221,490 (12/31/2023) | |||||
| Reserves(3) | 3rd Most Recent NOI: | $24,750,051 (12/31/2022) | ||||||
| Type | Initial | Monthly | Cap | Most Recent Occupancy: | 89.8% (10/23/2024) | |||
| RE Taxes: | $0 | Springing | NAP | 2nd Most Recent Occupancy: | 90.8% (12/31/2023) | |||
| Insurance: | $0 | Springing | NAP | 3rd Most Recent Occupancy: | 88.2% (12/31/2022) | |||
| Replacement Reserve: | $0 | Springing | NAP | Appraised Value (as of): | $343,600,000 (10/30/2024) | |||
| TI/LC Reserve: | $0 | Springing | NAP | Appraised Value PSF: | $340 | |||
| Gap Rent Reserve: | $429,705 | $0 | NAP | Cut-off Date LTV Ratio: | 52.4% | |||
| Outstanding TI/LC: | $1,981,224 | $0 | NAP | Maturity Date LTV Ratio: | 49.5% | |||
| Major Tenant Reserve: | $0 | Springing | NAP | |||||
| Sources and Uses | ||||||
| Sources | Proceeds | % of Total | Uses | Proceeds | % of Total | |
| Whole Loan Amount(1): | $180,000,000 | 62.8% | Loan Payoff: | $282,626,868 | 98.5% | |
| Borrower Sponsor Equity: | 106,843,216 | 37.2% | Upfront Reserves: | 2,410,929 | 0.8% | |
| Closing Costs: | 1,805,418 | 0.6% | ||||
| Total Sources: | $286,843,216 | 100.0% | Total Uses: | $286,843,216 | 100.0% | |
| (1) | The Shops at Mission Viejo Mortgage Loan (as defined below) is part of a whole loan evidenced by 10 pari passu promissory notes with an aggregate outstanding principal balance as of the Cut-off Date of $180,000,000 (the “Shops at Mission Viejo Whole Loan”). The Financial Information in the chart above reflects the Shops at Mission Viejo Whole Loan. |
| (2) | The lockout period will be at least 25 months beginning with and including the first payment date on February 1, 2025. Defeasance of the Shops at Mission Viejo Whole Loan is permitted after the date that is the earlier of (i) two years from the closing date of the securitization that includes the last note to be securitized (the “REMIC Prohibition Period”) and (ii) January 1, 2028 (the “Permitted Release Date”). The assumed lockout period is based on the anticipated closing date of the WFCM 2025-C64 securitization in February 2025. The actual lockout period may be longer. If the Permitted Release Date has occurred but the REMIC Prohibition Period has not yet occurred, the borrower may prepay the Shops at Mission Viejo Whole Loan in whole, but not in part, provided that such prepayment includes an amount equal to the yield maintenance premium. |
| (3) | See “Escrows and Reserves” below for further discussion. |
| (4) | The Shops at Mission Viejo Property (as defined below) is part of a larger retail development consisting of a total of 1,236,320 square feet (“SF”). Macy’s operates 193,500 SF at the Shops at Mission Viejo Property through a ground lease and has another suite consisting of 224,315 SF that is not part of the collateral. |
| (5) | The decrease from 2nd Most Recent NOI to Most Recent NOI is primarily driven by occupancy (including temporary tenants) decreasing from 98.8% as of the end of 2023 to 96.3% as of October 23, 2024. |
The Mortgage Loan. The Shops at Mission Viejo mortgage loan (the “Shops at Mission Viejo Mortgage Loan”) is part of a fixed rate whole loan secured by the borrower’s fee interest in a super-regional mall located in Mission Viejo, California (the “Shops at Mission Viejo Property”). The Shops at Mission Viejo Whole Loan consists of 10 pari passu promissory notes and accrues interest at a rate of 6.72500% per annum on an Actual/360 basis. The Shops at Mission Viejo Whole Loan has a 10-year term and is interest only for the first 60 months followed by amortization based on a 30 year schedule for the remaining term. The Shops at Mission Viejo Whole Loan was co-originated by Barclays Capital Real Estate Inc. (“Barclays”), Societe Generale Financial Corporation (“SGFC”) and Citi Real Estate Funding Inc. The Shops at Mission Viejo Mortgage Loan is evidenced by the non-controlling Note A-2-1 with an original principal balance of $25,000,000. The remaining notes are currently held by Barclays, SGFC and CREFI or their respective affiliates and are expected to be contributed to one or more future securitization trust(s). The Shops at Mission Viejo Whole Loan is expected to be serviced pursuant to the pooling and servicing agreement for the BBCMS 2025-C32 trust. See “Description of the Mortgage Pool—The Whole Loans—The Non-Serviced Pari Passu Whole Loans” and “Pooling and Servicing Agreement” in the Preliminary Prospectus.
| THE INFORMATION IN THIS STRUCTURAL AND COLLATERAL TERM SHEET IS NOT COMPLETE AND MAY BE AMENDED PRIOR TO THE TIME OF SALE. THIS TERM SHEET IS NOT AN OFFER TO SELL THESE SECURITIES AND IT IS NOT A SOLICITATION OF AN OFFER TO BUY THESE SECURITIES IN ANY JURISDICTION WHERE THE OFFER OR SALE IS NOT PERMITTED. | ||
| 105 | ||
| Retail– Super Regional Mall | Loan #10 | Cut-off Date Balance: | $25,000,000 | |
| 555 The Shops at Mission Viejo | Shops at Mission Viejo | Cut-off Date LTV: | 52.4% | |
| Mission Viejo, CA 92691 | UW NCF DSCR: | 1.69x | ||
| UW NOI Debt Yield: | 13.4% |
| Whole Loan Summary | |||||
| Note | Original Balance | Cut-off Date Balance | Note Holder | Controlling Piece | |
| A-1-1 | $35,000,000 | $35,000,000 | BBCMS 2025-C32 | Yes | |
| A-1-2(1) | $25,000,000 | $25,000,000 | Barclays | No | |
| A-1-3(1) | $15,000,000 | $15,000,000 | Barclays | No | |
| A-1-4 | $10,000,000 | $10,000,000 | BBCMS 2025-C32 | No | |
| A-1-5 | $5,000,000 | $5,000,000 | BBCMS 2025-C32 | No | |
| A-2-1 | $25,000,000 | $25,000,000 | WFCM 2025-C64 | No | |
| A-2-2 | $20,000,000 | $20,000,000 | BBCMS 2025-C32 | No | |
| A-3-1 | $20,000,000 | $20,000,000 | BBCMS 2025-C32 | No | |
| A-3-2(1) | $15,000,000 | $15,000,000 | SGFC | No | |
| A-3-3(1) | $10,000,000 | $10,000,000 | SGFC | No | |
| Whole Loan | $180,000,000 | $180,000,000 | |||
| (1) | Expected to be contributed to one or more future securitization trust(s). |
The Borrowers and the Borrower Sponsor. The borrower for the Shops at Mission Viejo Whole Loan is Shops at Mission Viejo, LLC, a Delaware limited liability company and single purpose entity with two independent directors. Legal counsel to the borrower delivered a non-consolidation opinion in connection with the origination of the Shops at Mission Viejo Whole Loan.
The borrower sponsors are Simon Property Group, L.P. (“Simon”) (51% interest) and Institutional Mall Investors LLC (“IMI”) (49% interest). Simon is the non-recourse carveout guarantor. So long as the non-recourse carveout guarantor is either Simon, Simon Property Group, Inc., a Delaware corporation, or an IMI Key Principal (as defined below), the liability under the guaranty is limited to 20% ($36,000,000) of the original principal amount of the Shops at Mission Viejo Whole Loan, plus all reasonable out-of-pocket costs and expenses incurred in the enforcement of the guaranty or preservation of the lenders’ rights under the guaranty. There is no separate environmental indemnity for the Shops at Mission Viejo Whole Loan; however, the non-recourse carveout guaranty provides loss recourse for breaches of representations, warranties and indemnification provisions in the Shops at Mission Viejo Whole Loan agreement concerning environmental laws and hazardous materials (subject to the aforementioned 20% cap).
Simon is the operating partnership of Simon Property Group Inc. (NYSE: SPG / S&P: A-), an S&P 100 company and owner of shopping, dining, entertainment and mixed-use destinations. As of March 31, 2024, Simon owned or held an interest in 195 income-producing properties in the United States, including 93 malls, 69 premium outlets, 14 Mills-branded shopping centers, six lifestyle centers and 13 other retail properties. Simon also owns an 84% non-controlling interest in The Taubman Realty Group, LLC, or TRG, which has an interest in 23 regional, super-regional and outlet malls in the United States and Asia. Additionally, Simon has a 22.4% ownership interest in Klépierre SA, a publicly traded, Paris-based real estate company, which owns shopping centers in 14 European countries. As of December 12, 2024, Simon had an equity market capitalization of approximately $57.8 billion.
IMI is a co-investment venture owned by an affiliate of Miller Capital Advisory and California Public Employees’ Retirement System (“CalPERS”), the nation’s largest public pension fund. IMI focuses on high-quality, fashion-oriented retail properties throughout the United States. As of September 2024, IMI’s portfolio included approximately 20.6 million SF of retail space and over approximately 1.2 million SF of prime office space.
“IMI Key Principal” means one or more of IMI, CalPERS or any person of which CalPERS owns, directly or indirectly, at least 50% of the capital and profits.
The Property. The Shops at Mission Viejo Property is a Class A, two-story, enclosed super-regional mall on a 66.70-acre site in Mission Viejo in Orange County, California. The Shops at Mission Viejo Property consists of a 1,012,005 square foot portion of a larger retail development consisting of 1,236,320 total SF. The Shops at Mission Viejo Property benefits from three anchor tenants: two Macy’s units (one of which is collateral), Dick’s Sporting Goods (“Dick’s”) and Nordstrom. Notable inline tenants include, among others, Apple, Tesla, Sephora, Lululemon, Steve Madden, Pandora and J. Crew. Food and beverage offerings at the food court include SmashBurger, Chipotle Mexican Grill and Cheesecake Factory. One Macy‘s unit representing 224,315 SF is not part of the collateral. The Shops at Mission Viejo Property was constructed in 1979 and was most recently renovated in 2021 which involved a $17.6 million interior and exterior redevelopment of the Dick’s space to allow for Dick’s to take occupancy on a build-to-suit basis.
As of October 23, 2024, the Shops at Mission Viejo Property was 89.8% leased to 116 unique tenants (excluding temporary tenants), including one medical office tenant (1.0% of underwritten base rent). Other than the three retail anchor tenants and one medical office tenant, no other tenant accounts for greater than 2.1% of net rentable area and 3.9% of underwritten base rent. In the trailing-12 month period ending September 30, 2024, the tenants at the Shops at Mission Viejo Property generated approximately $245.0 million in total sales (excluding Tesla, whose sales have been excluded from all sales data due to historical reporting variances in methodology), with comparable inline sales of $566 per square foot (less than 10,000 SF excluding Apple and Tesla) and $665 per square foot (less than 10,000 SF).
The Shops at Mission Viejo Property has benefitted from positive leasing momentum with 11 unique tenants totaling 43,868 SF (4.3% of collateral SF) and approximately $1.8 million of underwritten rent (9.2% of total underwritten rent) of recently executed leases since the beginning of 2024. Such new leasing includes two major tenants, Round 1 Bowling and Amusement and Uniqlo, collectively representing 32,196 SF.
Major Retail Tenants.
Macy’s (193,500 SF; 19.1% of NRA; 0.0% of underwritten base rent): Founded in 1858 and headquartered in New York, New York, Macy’s (Fitch/Moody’s/S&P: BBB-/Ba2/BB+) is a department store chain that operates approximately 735 stores in the United States as well as Guam and Puerto Rico. Macy’s has three banners that include Macy’s, bluemercury and Bloomingdale’s (and accompanying e-commerce sites), which sell men's, women's
| THE INFORMATION IN THIS STRUCTURAL AND COLLATERAL TERM SHEET IS NOT COMPLETE AND MAY BE AMENDED PRIOR TO THE TIME OF SALE. THIS TERM SHEET IS NOT AN OFFER TO SELL THESE SECURITIES AND IT IS NOT A SOLICITATION OF AN OFFER TO BUY THESE SECURITIES IN ANY JURISDICTION WHERE THE OFFER OR SALE IS NOT PERMITTED. | ||
| 106 | ||
| Retail– Super Regional Mall | Loan #10 | Cut-off Date Balance: | $25,000,000 | |
| 555 The Shops at Mission Viejo | Shops at Mission Viejo | Cut-off Date LTV: | 52.4% | |
| Mission Viejo, CA 92691 | UW NCF DSCR: | 1.69x | ||
| UW NOI Debt Yield: | 13.4% |
and children's apparel and accessories, cosmetics and home furnishings, among other merchandise. Macy’s, as ground lessee, occupies the Shops at Mission Viejo Property pursuant to a ground lease from the borrower, as ground lessor, with an expiration date of February 2030 and has five, 10-year renewal options remaining with no termination options. Ground rent will remain $10 during any renewal periods. Simon estimated Macy’s sales to be $11,100,000, or $57 per square foot, for the 193,500 SF of collateral space and $20,100,000, or $90 per square foot, for the 224,315 SF of non-collateral space from the trailing-12 month period through September 2024. The 224,315 SF non-collateral space is occupied by Macy’s pursuant to a ground lease through 2069. Macy’s has been in occupancy of such space since the Shops at Mission Viejo Property opened in 1977.
Nordstrom (165,000 SF; 16.3% of NRA; 0.0% of underwritten base rent): Nordstrom (Fitch/Moody’s/S&P: BB+/Ba2/BB) was founded in 1901 as a retail shoe business in Seattle, Washington. Nordstrom is a leading fashion designer offering clothing, shoes and accessories for men, women and kids. Nordstrom has more than 350 Nordstrom, Nordstrom Local and Nordstrom Rack locations. Nordstrom was added to the Shops at Mission Viejo Property upon executing a ground lease in January 1999 that was part of a significant renovation and expansion with an original cost of $20 million. The ground lease has an initial expiration date on February 2030. Nordstrom has seven, 10-year extension options remaining. Ground rent will remain $1 during any renewal periods. For the trailing-12 month period through September 2024, Nordstrom reported sales of approximately $49.4 million, which equates to approximately $299 per square foot.
Dick's (80,000 SF; 7.9% of NRA; 7.9% of underwritten base rent): Dick’s (Fitch/Moody's/S&P: NR/Baa2/BBB) was founded in 1948 as a bait-and-tackle shop in Binghamton, New York, and has since grown to become an omnichannel sporting goods retailer, with a primary focus on sports equipment, apparel, footwear and accessories. Headquartered in Coraopolis, Pennsylvania, Dick’s offers a wide range of products through its main and specialty concept stores, including Dick’s Sporting Goods, Public Lands, Moosejaw and Going Going Gone!. Dick’s has been in occupancy at the Shops at Mission Viejo Property since May 2020 and has a lease expiration date of January 2032. Dick’s has three, five-year extension options remaining. For the trailing-12 month period through September 2024, Dick’s reported sales of approximately $19.1 million, which equates to approximately $239 per square foot.
Major Medical Office Tenant.
Welltower Mission Viejo Medical (104,500 SF; 10.3% of NRA; 1.0% of underwritten base rent): Welltower Mission Viejo Medical (“Welltower”) is an outparcel medical office that is being operated as an outpatient center with a focus on cancer care. The medical office also includes an array of health and medical services in partnership with Providence Mission Viejo Hospital that is located adjacent to Welltower. Providence Mission Viejo Hospital is the largest employer in the city of Mission Viejo and is currently undergoing a $712 million expansion. Welltower is a real estate investment trust and S&P 500 company headquartered in Toledo, Ohio. Welltower invests with senior housing operators, post-acute providers and health systems to fund the real estate infrastructure needed for health care operations. Founded in 1970, Welltower currently has a portfolio of over 430 medical properties totaling approximately 26 million square feet with locations across all 50 states. Welltower, as ground lessee, occupies the Shops at Mission Viejo Property pursuant to a ground lease from the borrower, as ground lessor, with an expiration date of January 2074 with two, 10-year renewal options remaining.
The following tables present certain information relating to the tenancy at the Shops at Mission Viejo Property:
| 2019(1) | 2020(1) | 2021(1) | 2022(1) | 2023(1) | Current(2) | |
| Inc. Temp Tenants | 88.7% | 96.6% | 95.3% | 98.5% | 98.8% | 96.3% |
| Excl. Temp Tenants | 85.2% | 90.6% | 88.4% | 88.2% | 90.8% | 89.8% |
| (1) | Based on December 31 of each respective year. |
| (2) | Based on the underwritten rent roll as of October 23, 2024. Temporary tenants are underwritten as vacant, however, income from such tenants is included in underwritten income. |
| THE INFORMATION IN THIS STRUCTURAL AND COLLATERAL TERM SHEET IS NOT COMPLETE AND MAY BE AMENDED PRIOR TO THE TIME OF SALE. THIS TERM SHEET IS NOT AN OFFER TO SELL THESE SECURITIES AND IT IS NOT A SOLICITATION OF AN OFFER TO BUY THESE SECURITIES IN ANY JURISDICTION WHERE THE OFFER OR SALE IS NOT PERMITTED. | ||
| 107 | ||
| Retail– Super Regional Mall | Loan #10 | Cut-off Date Balance: | $25,000,000 | |
| 555 The Shops at Mission Viejo | Shops at Mission Viejo | Cut-off Date LTV: | 52.4% | |
| Mission Viejo, CA 92691 | UW NCF DSCR: | 1.69x | ||
| UW NOI Debt Yield: | 13.4% |
| Top Tenant Summary(1) | |||||||||
| Tenant | Ratings (Fitch/Moody’s/S&P)(2) | Net Rentable Area (SF) | % of Total NRA | UW Base Rent PSF(1) | UW Base Rent(1) | % of Total UW Base Rent(1) |
Lease | ||
| Anchor Tenants | |||||||||
| Macy’s(3) | BBB-/Ba2/BB+ | 193,500 | 19.1 | % | $0.00 | $10 | 0.0% | 2/2/2030 | |
| Nordstrom(3) | BB+/Ba2/BB | 165,000 | 16.3 | % | $0.00 | $0 | 0.0% | 2/28/2030 | |
| Dick’s | NR/Baa2/BBB | 80,000 | 7.9 | % | $19.50 | $1,560,000 | 7.9% | 1/31/2032 | |
| Anchor Tenants Subtotal / Wtd. Avg. | 438,500 | 43.3 | % | $3.56 | $1,560,010 | 7.9% | |||
| Medical Office Tenant | |||||||||
| Welltower(3) | NR/Baa1/BBB+ | 104,500 | 10.3 | % | $1.89 | $198,000 | 1.0% | 1/31/2074 | |
| Major Tenants | |||||||||
| Old Navy | NR/NR/NR | 21,196 | 2.1 | % | $22.64 | $479,945 | 2.4% | 1/31/2026 | |
| Round 1 Bowling and Amusement | NR/NR/NR | 20,465 | 2.0 | % | $37.63 | $770,000 | 3.9% | 1/31/2035 | |
| Forever 21 | NR/NR/NR | 13,141 | 1.3 | % | $11.78 | $154,757 | 0.8% | 1/31/2027 | |
| Uniqlo(4) | NR/NR/NR | 11,731 | 1.2 | % | $37.30 | $437,566 | 2.2% | 8/31/2035 | |
| The Gap/Gap Body | NR/B1/BB | 10,617 | 1.0 | % | $59.94 | $636,422 | 3.2% | 1/31/2027 | |
| Pottery Barn | NR/NR/NR | 10,048 | 1.0 | % | $35.64 | $358,138 | 1.8% | 1/31/2025 | |
| Express Men | NR/NR/NR | 9,748 | 1.0 | % | $14.53 | $141,638 | 0.7% | 1/31/2029 | |
| Abercrombie & Fitch | NR/NR/BB | 9,350 | 0.9 | % | $40.88 | $382,222 | 1.9% | 1/31/2026 | |
| Tenshoppe | NR/NR/NR | 8,681 | 0.9 | % | $25.43 | $220,758 | 1.1% | 11/30/2025 | |
| Victoria's Secret | NR/B1/BB- | 7,709 | 0.8 | % | $41.23 | $317,842 | 1.6% | 1/31/2033 | |
| Major Tenants Subtotal / Wtd. Avg. | 122,686 | 12.1 | % | $31.78 | $3,899,289 | 19.6% | |||
| Remaining Occupied | 243,443 | 24.1 | % | $58.31 | $14,194,421 | 71.5% | |||
| Occupied Collateral Total / Wtd. Avg. | 909,129 | 89.8 | % | $21.84 | $19,851,720 | 100.0% | |||
| Vacant Space | 102,876 | 10.2 | % | ||||||
| Collateral Total | 1,012,005 | 100.0 | % | ||||||
| (1) | Based on the underwritten rent roll dated October 23, 2024, inclusive of rent steps through December 2025. |
| (2) | In certain instances, ratings provided are those of the parent company of the entity shown, whether or not the parent company guarantees the lease. |
| (3) | Nordstrom, Macy’s and Welltower are subject to ground leases. |
| (4) | In the event that Uniqlo does not achieve sales of at least $4,271,726 during the 12 month period from September 1, 2027 through August 31, 2028 (the “Sales Measuring Period”), Uniqlo has the right to terminate its lease by providing notice within 90 days of the end of the Sales Measuring Period and the lease termination would be effective one year after providing such notice. |
| Tenant Sales(1)(2) | ||||||
| 2019 | 2021 | 2022 | 2023 | TTM(3) | ||
| Gross Mall Sales | $293,240,349 | $211,527,376 | $241,604,693 | $252,622,256 | $244,989,630 | |
| Sales PSF (Inline < 10,000 SF) | $715 | $569 | $653 | $684 | $665 | |
| Sales PSF (Inline < 10,000 SF, Ex-Apple / Tesla) | $553 | $501 | $565 | $580 | $566 | |
| Occupancy Cost (Inline < 10,000 SF) | 13.5% | 16.4% | 13.8% | 13.4% | 12.8% | |
| Occupancy Cost (Inline < 10,000 SF, Ex-Apple / Tesla) | 17.2% | 18.4% | 15.8% | 15.7% | 14.9% | |
| (1) | Includes the borrower sponsor’s provided estimates for non-reporting anchor tenants and/or non-collateral tenants. Macy’s does not report sales for its collateral and non-collateral spaces. |
| (2) | 2020 sales are excluded due to the adverse impact of the COVID-19 pandemic. Tesla sales are excluded from all sales data due to historical reporting variances. |
| (3) | Based on the trailing-12 month period as of September 30, 2024. |
| THE INFORMATION IN THIS STRUCTURAL AND COLLATERAL TERM SHEET IS NOT COMPLETE AND MAY BE AMENDED PRIOR TO THE TIME OF SALE. THIS TERM SHEET IS NOT AN OFFER TO SELL THESE SECURITIES AND IT IS NOT A SOLICITATION OF AN OFFER TO BUY THESE SECURITIES IN ANY JURISDICTION WHERE THE OFFER OR SALE IS NOT PERMITTED. | ||
| 108 | ||
| Retail– Super Regional Mall | Loan #10 | Cut-off Date Balance: | $25,000,000 | |
| 555 The Shops at Mission Viejo | Shops at Mission Viejo | Cut-off Date LTV: | 52.4% | |
| Mission Viejo, CA 92691 | UW NCF DSCR: | 1.69x | ||
| UW NOI Debt Yield: | 13.4% |
| Major Tenant Sales(1)(2) | ||||||||||
| Tenant Name | SF | 2019 | 2021 | 2022 | 2023 | 9/30/2024 TTM | Occupancy Cost | 9/30/2024 TTM Sales PSF | ||
| Anchor Tenants | ||||||||||
| Macy’s(3) | 193,500 | $13,100,000 | $11,800,000 | $11,700,000 | $11,100,000 | $11,100,000 | 0.6% | $57 | ||
| Nordstrom | 165,000 | $55,450,000 | $45,699,000 | $62,174,000 | $54,767,955 | $49,364,357 | 0.3% | $299 | ||
| Dick’s | 80,000 | NAV | NAV | $17,566,000 | $17,398,683 | $19,100,000 | 9.9% | $239 | ||
| Major Tenants | ||||||||||
| Old Navy | 21,196 | $3,813,000 | $3,041,000 | $2,809,000 | $2,855,915 | $2,925,013 | 20.2% | $138 | ||
| Forever 21 | 13,141 | NAV | $506,000 | $1,651,000 | $1,406,717 | $1,282,319 | 14.0% | $98 | ||
| The Gap/Gap Body | 10,617 | $2,601,000 | $1,960,000 | $2,010,000 | $2,163,548 | $2,542,138 | 45.0% | $239 | ||
| Pottery Barn | 10,048 | $6,880,000 | $7,500,000 | $8,801,000 | $7,556,008 | $7,153,671 | 10.2% | $712 | ||
| Signature Tenants | ||||||||||
| Abercrombie & Fitch | 9,350 | $1,731,000 | $1,954,000 | $2,071,000 | $2,557,750 | $3,036,791 | 14.7% | $325 | ||
| Victoria's Secret | 7,709 | $4,824,000 | $3,789,000 | $3,878,000 | $3,480,655 | $4,553,559 | 12.9% | $591 | ||
| J. Crew | 7,100 | $1,791,000 | $1,903,000 | $2,144,000 | $2,588,908 | $2,817,790 | 11.1% | $397 | ||
| Cheesecake Factory | 6,927 | $9,980,000 | $10,015,000 | $10,861,000 | $10,730,469 | $10,516,158 | 6.4% | $1,518 | ||
| Apple | 6,195 | $50,363,000 | $19,693,000 | $24,418,000 | $28,302,090 | $26,569,865 | 2.4% | $4,289 | ||
| Sephora | 5,338 | $7,128,000 | $4,576,000 | $6,627,000 | $8,894,692 | $9,298,805 | 7.7% | $1,742 | ||
| Williams-Sonoma | 4,718 | $2,485,000 | $3,080,000 | $3,168,000 | $3,260,723 | $3,434,306 | 10.9% | $728 | ||
| Tommy Bahama | 3,387 | $2,395,000 | $2,479,000 | $2,827,000 | $2,533,608 | $2,402,062 | 19.6% | $709 | ||
| Lululemon | 3,099 | $6,836,000 | $5,010,000 | $6,194,000 | $6,685,376 | $6,742,842 | 5.7% | $2,176 | ||
| Lego | 2,321 | $1,665,000 | $2,985,000 | $3,319,000 | $3,052,182 | $2,965,632 | 10.3% | $1,278 | ||
| (1) | All sales information presented herein with respect to the Shops at Mission Viejo Property is based upon information provided by the borrower sponsor. In certain instances, sales figures represent estimates because the tenants are not required to report, or otherwise may not have reported sales information on a timely basis. Further, because sales are self-reported, such information is not independently verified by the borrower sponsor. |
| (2) | 2020 excluded due to the adverse impact of the COVID-19 pandemic on the Shops at Mission Viejo Property. |
| (3) | Based on estimates provided by the borrower sponsor as Macy’s does not report sales. |
| THE INFORMATION IN THIS STRUCTURAL AND COLLATERAL TERM SHEET IS NOT COMPLETE AND MAY BE AMENDED PRIOR TO THE TIME OF SALE. THIS TERM SHEET IS NOT AN OFFER TO SELL THESE SECURITIES AND IT IS NOT A SOLICITATION OF AN OFFER TO BUY THESE SECURITIES IN ANY JURISDICTION WHERE THE OFFER OR SALE IS NOT PERMITTED. | ||
| 109 | ||
| Retail– Super Regional Mall | Loan #10 | Cut-off Date Balance: | $25,000,000 | |
| 555 The Shops at Mission Viejo | Shops at Mission Viejo | Cut-off Date LTV: | 52.4% | |
| Mission Viejo, CA 92691 | UW NCF DSCR: | 1.69x | ||
| UW NOI Debt Yield: | 13.4% |
The following table presents certain information relating to the lease rollover schedule at the Shops at Mission Viejo Property:
| Lease Rollover Schedule(1)(2) | ||||||||||
| Year | Number of Leases Expiring | Net Rentable Area Expiring | % of NRA Expiring | UW Base Rent Expiring | % of UW Base Rent Expiring | Cumulative Net Rentable Area Expiring | Cumulative % of NRA Expiring | Cumulative UW Base Rent Expiring | Cumulative % of UW Base Rent Expiring | |
| Vacant | NAP | 102,876 | 10.2% | NAP | NAP | 102,876 | 10.2% | NAP | NAP | |
| 2025 & MTM | 27 | 75,833 | 7.5% | $2,824,046 | 14.2% | 178,709 | 17.7% | $2,824,046 | 14.2% | |
| 2026 | 25 | 94,348 | 9.3% | $4,893,766 | 24.7% | 273,057 | 27.0% | $7,717,812 | 38.9% | |
| 2027 | 18 | 51,790 | 5.1% | $2,746,512 | 13.8% | 324,847 | 32.1% | $10,464,324 | 52.7% | |
| 2028 | 8 | 12,949 | 1.3% | $1,037,348 | 5.2% | 337,796 | 33.4% | $11,501,673 | 57.9% | |
| 2029 | 12 | 30,543 | 3.0% | $1,168,107 | 5.9% | 368,339 | 36.4% | $12,669,780 | 63.8% | |
| 2030 | 12 | 387,629 | 38.3% | $2,119,516 | 10.7% | 755,968 | 74.7% | $14,789,296 | 74.5% | |
| 2031 | 4 | 8,022 | 0.8% | $540,251 | 2.7% | 763,990 | 75.5% | $15,329,547 | 77.2% | |
| 2032 | 4 | 89,093 | 8.8% | $2,100,725 | 10.6% | 853,083 | 84.3% | $17,430,273 | 87.8% | |
| 2033 | 3 | 14,333 | 1.4% | $463,498 | 2.3% | 867,416 | 85.7% | $17,893,771 | 90.1% | |
| 2034 | 3 | 4,808 | 0.5% | $416,273 | 2.1% | 872,224 | 86.2% | $18,310,044 | 92.2% | |
| 2035 | 2 | 32,196 | 3.2% | $1,207,566 | 6.1% | 904,420 | 89.4% | $19,517,610 | 98.3% | |
| 2036 & Thereafter | 2 | 107,585 | 10.6% | $334,110 | 1.7% | 1,012,005 | 100.0% | $19,851,720 | 100.0% | |
| Total | 120 | 1,012,005 | 100.0% | $19,851,720 | 100.0 | % | ||||
| (1) | Based on the underwritten rent roll dated October 23, 2024 inclusive of rent steps through December 2025. |
| (2) | Certain tenants may have lease termination options that are exercisable prior to the originally stated expiration date of the subject lease and that are not considered in the Lease Rollover Schedule. |
The Market. The Shops at Mission Viejo Property is located in the South submarket of the broader Orange County retail market. The Shops at Mission Viejo Property benefits from its accessible location as it is adjacent to Interstate 5, which is a main thoroughfare throughout Orange County and allows for direct access to Los Angeles. Residential development dominates the area surrounding the Shops at Mission Viejo Property. Additionally, the Shops at Mission Viejo Property is the southernmost mall in the competitive set as identified in the appraisal. Providence Mission Hospital and Saddleback College, the two largest employers in Mission Viejo, are both located across the street from the Shops at Mission Viejo Property. Providence Mission Hospital is in the midst of a $712 million expansion and Saddleback College, which consists of approximately 26,000 students, recently completed an expansion project in March of 2024 that added a $60 million facility dedicated to student services.
The South retail submarket consists of approximately 9.7 million SF and is the second largest of the five submarkets within the approximately 41.6 million SF Orange County market. As of the second quarter of 2024, the 6.5% vacancy rate in the submarket is lower than the 6.7% vacancy rate for the Orange County retail market. Additionally, the South submarket asking rent of $39.34 per square foot is greater than the Orange County market asking rent of $34.68 per square foot. Asking rent in the submarket and market have grown each year since 2021.
According to the appraisal, the estimated 2023 population within a five-, seven- and 10-mile radius was 293,855, 469,899 and 651,466, respectively. Additionally, for the same period, the average household income within the same radii was $164,778, $166,335 and $167,972, respectively.
The following table presents certain information relating to comparable retail centers for the Shops at Mission Viejo Property:
| Competitive Retail Center Summary(1) | ||||||
| Property / Location | Year Built / Renovated or Expanded | Total NRA (SF) | Occupancy | Distance to Subject | Sales PSF | Anchor Tenants |
Shops at Mission Viejo Mission Viejo, CA | 1979 / 2000, 2021 | 1,012,005(2)(3) | 89.8%(2)(3) | NAP | $665(4) | Macy’s, Nordstrom, Dick’s |
Irvine Spectrum Center Irvine, CA | 1995 / 2016 | 1,388,737 | 95% | 11 miles | $1,100 - $1,200(5) | Nordstrom, Target, Regal Cinemas, Dave & Busters, Newfound Market |
Fashion Island Newport Beach, CA | 1967 / 2003, 2017 | 1,573,000 | 96% | 15 miles | $1,400 - $1,600(5) | Nordstrom, Macy’s, Bloomingdale’s, Neiman Marcus, Whole Foods, Cinema |
South Coast Plaza Costa Mesa, CA | 1967 / 1999 | 2,740,000 | 95% | 18 miles | $1,300 - $1,500(5) | Bloomingdale’s, Macy’s, Saks Fifth Avenue, Nordstrom |
Marketplace at Laguna Niguel and Plaza De La Paz Laguna Niguel, CA | 1990 & 1994 / 1994 | 811,000 | 94% | 4 miles | NAV | Kohl’s, Costco, The Home Depot, Hobby Lobby, Walmart, Marshall’s, Old Navy |
Outlets at San Clemente San Clemente, CA | 2015 / NAP | 369,500 | 85% | 11 miles | $500 - $550 | Metropolitan Theatres, Nike, H&M |
| (1) | Based on the appraisal. |
| (2) | Based on the underwritten rent roll as of October 23, 2024. |
| (3) | Total NRA (SF) and Occupancy exclude the non-collateral Macy’s space. |
| (4) | Represents sales per square foot as of September 30, 2024 for in-line tenants. All sales information presented herein with respect to the Shops at Mission Viejo Property is based upon information provided by the borrower sponsor. |
| (5) | Includes sales attributed to Apple. |
| THE INFORMATION IN THIS STRUCTURAL AND COLLATERAL TERM SHEET IS NOT COMPLETE AND MAY BE AMENDED PRIOR TO THE TIME OF SALE. THIS TERM SHEET IS NOT AN OFFER TO SELL THESE SECURITIES AND IT IS NOT A SOLICITATION OF AN OFFER TO BUY THESE SECURITIES IN ANY JURISDICTION WHERE THE OFFER OR SALE IS NOT PERMITTED. | ||
| 110 | ||
| Retail– Super Regional Mall | Loan #10 | Cut-off Date Balance: | $25,000,000 | |
| 555 The Shops at Mission Viejo | Shops at Mission Viejo | Cut-off Date LTV: | 52.4% | |
| Mission Viejo, CA 92691 | UW NCF DSCR: | 1.69x | ||
| UW NOI Debt Yield: | 13.4% |
The following table presents certain information relating to the appraiser’s market rent conclusions for the Shops at Mission Viejo Property:
| Market Rent Summary(1) | ||||
| Market Rent (PSF) | Lease Term (Yrs.) | Rent Increase Projections | New Tenant Improvements | |
| 0 – 1,200 SF | $80.00 | 8 | 3.0% | $40.00 |
| 1,201 – 2,000 SF | $60.00 | 8 | 3.0% | $40.00 |
| 2,001 – 3,500 SF | $45.00 | 8 | 3.0% | $40.00 |
| 3,501 – 5,000 SF | $35.00 | 8 | 3.0% | $40.00 |
| 5,001 – 10,000 SF | $27.00 | 8 | 3.0% | $40.00 |
| 10,000 SF + | $30.00 | 8 | 3.0% | $40.00 |
| Restaurants | $45.00 | 10 | 3.0% | $75.00 |
| Jewelers | $80.00 | 8 | 3.0% | $40.00 |
| Food Court | $100.00 | 8 | 3.0% | $40.00 |
| Kiosk | $400.00 | 5 | 3.0% | $40.00 |
| ATM | $600.00 | 5 | 3.0% | $40.00 |
| (1) | Based on the appraisal. |
Appraisal. The appraiser concluded to an “as is” value for the Shops at Mission Viejo Property of $343,600,000 as of October 30, 2024.
Environmental Matters. According to the Phase I environmental site assessment dated November 5, 2024, there was no evidence of any recognized environmental conditions at the Shops at Mission Viejo Property.
Operating History and Underwritten Net Cash Flow. The following table presents certain information relating to the historical operating performance and Underwritten Net Cash Flow at the Shops at Mission Viejo Property:
| Operating History and Underwritten Net Cash Flow(1) | ||||||
| 2021 | 2022 | 2023(2) | 9/30/2024 TTM(2) | UW | UW Per SF | |
| Base Rent | $20,285,085 | $19,884,382 | $19,881,736 | $19,292,499 | $19,487,194 | $19.26 |
| Contractual Rent Steps(3) | 0 | 0 | 0 | 0 | 364,526 | $0.36 |
| Credit Tenant Rent Steps | 0 | 0 | 0 | 0 | 121,892 | $0.12 |
| Temporary Tenant Rent | 1,568,156 | 2,041,575 | 2,193,164 | 2,015,799 | 2,101,000 | $2.08 |
| Percentage in Lieu Rent | 344,873 | 110,773 | 299,278 | 281,009 | 248,573 | $0.25 |
| Overage Rent | 926,893 | 1,599,365 | 1,334,111 | 1,266,529 | 862,043 | $0.85 |
| Other Rental Income | 205,717 | 205,944 | 189,833 | 196,947 | 202,000 | $0.20 |
| Gross-Up Vacant Rent | 0 | 0 | 0 | 0 | 4,465,543 | $4.41 |
| Net Rental Income | $23,330,724 | $23,842,039 | $23,898,122 | $23,052,783 | $27,852,771 | $27.52 |
| Total Recoveries | 8,741,330 | 7,737,820 | 8,631,027 | 8,571,797 | 9,056,105 | $8.95 |
| Gross Potential Income | $32,072,054 | $31,579,859 | $32,529,149 | $31,624,580 | $36,908,876 | $36.47 |
| Vacancy & Bad Debt | 0 | 0 | 0 | 0 | (5,283,576) | (5.22) |
| Miscellaneous Income | 1,028,204 | 1,018,361 | 1,213,703 | 1,146,579 | 1,321,000 | $1.31 |
| Effective Gross Income | $33,100,258 | $32,598,220 | $33,742,852 | $32,771,159 | $32,946,299 | $32.56 |
| Taxes | 1,501,687 | 1,719,161 | 1,748,385 | 1,757,126 | 1,780,005 | $1.76 |
| Insurance | 966,390 | 1,058,211 | 1,195,409 | 1,318,030 | 1,363,648 | $1.35 |
| Management Fee | 993,121 | 1,007,385 | 1,002,899 | 983,193 | 988,329 | $0.98 |
| Other Expenses | 3,770,823 | 4,063,412 | 4,574,669 | 4,570,007 | 4,639,596 | $4.58 |
| Total Expenses | 7,232,021 | 7,848,169 | 8,521,362 | 8,628,356 | 8,771,579 | $8.67 |
| Net Operating Income | $25,868,237 | $24,750,051 | $25,221,490 | $24,142,803 | $24,174,721 | $23.89 |
| Replacement Reserves | 0 | 0 | 0 | 0 | 54,901 | $0.05 |
| TI/LC | 0 | 0 | 0 | 0 | 549,005 | $0.54 |
| Net Cash Flow | $25,868,237 | $24,750,051 | $25,221,490 | $24,142,803 | $23,570,815 | $23.29 |
| Occupancy (%)(4) | 95.3% | 98.5% | 98.8% | 96.3%(5) | 85.7%(6) | |
| NOI DSCR(7) | 1.85x | 1.77x | 1.80x | 1.73x | 1.73x | |
| NCF DSCR(7) | 1.85x | 1.77x | 1.80x | 1.73x | 1.69x | |
| NOI Debt Yield(7) | 14.4% | 13.8% | 14.0% | 13.4% | 13.4% | |
| NCF Debt Yield(7) | 14.4% | 13.8% | 14.0% | 13.4% | 13.1% | |
| (1) | Based on the underwritten rent roll dated October 23, 2024. |
| (2) | The decrease from 2023 NOI to TTM 9/30/2024 NOI is primarily driven by occupancy (including temporary tenants) decreasing from 98.8% as of the end of 2023 to 96.3% as of October 23, 2024. |
| (3) | Contractual Rent Steps were taken through December 2025. |
| (4) | Occupancy (%) is shown including temporary tenants. |
| (5) | Based on the underwritten rent roll as of October 23, 2024. Temporary tenants are underwritten as vacant, however, income from such tenants is included in underwritten income. |
| (6) | Represents economic occupancy. |
| (7) | Based on the Shops at Mission Viejo Whole Loan. |
Property Management. The Shops at Mission Viejo Property is managed by Simon Management Associates, LLC, an affiliate of the borrower sponsor.
| THE INFORMATION IN THIS STRUCTURAL AND COLLATERAL TERM SHEET IS NOT COMPLETE AND MAY BE AMENDED PRIOR TO THE TIME OF SALE. THIS TERM SHEET IS NOT AN OFFER TO SELL THESE SECURITIES AND IT IS NOT A SOLICITATION OF AN OFFER TO BUY THESE SECURITIES IN ANY JURISDICTION WHERE THE OFFER OR SALE IS NOT PERMITTED. | ||
| 111 | ||
| Retail– Super Regional Mall | Loan #10 | Cut-off Date Balance: | $25,000,000 | |
| 555 The Shops at Mission Viejo | Shops at Mission Viejo | Cut-off Date LTV: | 52.4% | |
| Mission Viejo, CA 92691 | UW NCF DSCR: | 1.69x | ||
| UW NOI Debt Yield: | 13.4% |
Escrows and Reserves. At origination, the borrower was required to deposit into escrow (i) $1,981,224 for outstanding tenant improvement allowances and leasing commissions and (ii) $429,705 for outstanding gap rent.
Tax Escrows – On a monthly basis, during the continuance of a Reserve Trigger Period (as defined below) or at any time taxes are not paid by the borrower prior to the assessment of any penalty, the borrower is required to escrow 1/12th of the annual estimated tax payments payable during the next ensuing 12 months.
Insurance Escrows – During the continuance of a Reserve Trigger Period, except if the Shops at Mission Viejo Property is insured under an acceptable blanket policy, the borrower is required to escrow 1/12th of the annual estimated insurance payments on a monthly basis.
Replacement Reserves – During the continuance of a Reserve Trigger Period, the borrower is required to escrow approximately $12,000 on a monthly basis for replacements and repairs to be made at the Shops at Mission Viejo Property.
TI/LC Reserves – During the continuance of a Reserve Trigger Period, the borrower is required to escrow approximately $79,000 on a monthly basis for ongoing leasing reserves.
Major Tenant Reserve – During the continuance of a Major Tenant Trigger Event (as defined below), on a monthly basis the borrower is required to escrow an amount equal to 1/12th of the applicable Major Tenant Threshold Amount (as defined below) until such Major Tenant Threshold Amount is reached.
A “Reserve Trigger Period” commences upon the net operating income debt yield (the “NOI Debt Yield”) falling below 10.50% for two consecutive calendar quarters, and cures upon the NOI Debt Yield reaching 10.50% for two consecutive calendar quarters.
A “Major Tenant Trigger Event” commences upon the earlier to occur of (i) a Major Tenant (as defined below) bankruptcy event, (ii) a Major Tenant vacates its space or goes dark for a period of at least 90 days or (iii) a Major Tenant Renewal Event (as defined below).
Such Major Tenant Trigger Event will be cured with respect to (a) clause (i) above, upon the resolution of the bankruptcy event or the Major Tenant Threshold Amount has been deposited into the Major Tenant reserve account or a permitted guarantor has delivered to the lenders a Major Tenant guaranty with liability capped at the applicable Major Tenant Threshold Amount, (b) clause (ii) above, the Major Tenant reopens for 30 consecutive days or, if applicable, the Major Tenant Threshold Amount has been deposited into the Major Tenant reserve account or (c) clause (iii) above, a Major Tenant Renewal Event Cure (as defined below).
A “Major Tenant” means Macy’s (193,500 SF of collateral space), Nordstrom, Dick’s or any replacement tenant occupying at least 50% of the space occupied by one or more of the foregoing.
A “Major Tenant Renewal Event” means, unless such Major Tenant lease has been renewed or extended, the earlier of (x) the date on which such Major Tenant gives notice that it will not be renewing its lease and (y) the date that is six months prior to the date of such Major Tenant’s lease expiration.
A Major Tenant Renewal event will be cured upon (a) such Major Tenant renews and/or extends the Major Tenant lease, (b) not less than 50% of the space demised by the Major Tenant lease has been leased to one or more new tenants, (c) the applicable notice of intent not to renew has been rescinded, (d) the applicable Major Tenant Threshold Amount has been deposited into the Major Tenant Reserve Account or (e) at the borrower’s election, a permitted guarantor has delivered to the lenders a Major Tenant guaranty with liability limited to the applicable Major Tenant Threshold Amount (collectively, a “Major Tenant Renewal Event Cure”).
“Major Tenant Threshold Amount” means the amount, with respect to (i) the Macy’s collateral space, of $9,675,000, (ii) the space occupied by Nordstrom, of $8,250,000 and (iii) the space occupied by Dick’s, of $4,000,000.
Lockbox / Cash Management. The Shops at Mission Viejo Whole Loan is structured with a hard lockbox and springing cash management. The borrower and property manager are required to direct the tenants to pay rent directly into the lockbox account, and to deposit any rents otherwise received into such account within two business days after receipt. During the continuance of a Lockbox Event Period (as defined below), all funds in the lockbox account are required to be swept on a weekly basis to a lender-controlled cash management account. Funds in the cash management account are required to be applied to debt service and the reserves and escrows described above, with any excess funds (i) to be deposited into an excess cash flow reserve account held by the lenders as cash collateral for the Shops at Mission Viejo Whole Loan or (ii) if no Lockbox Event Period is continuing, disbursed to the borrower.
A “Lockbox Event Period” means the period commencing upon the occurrence of (i) an event of default, (ii) a bankruptcy action of the borrower or property manager (if the property manager is an affiliate of the borrower) and the property manager is not replaced within 60 days with a qualified manager or (iii) the NOI Debt Yield being less than 10.50% for two consecutive calendar quarters. A Lockbox Event Period will end with respect to (a) clause (i) above, if the cure of the event of default has been accepted by the lenders, (b) clause (ii) above, if the property manager is replaced within 60 days or the bankruptcy action with respect to the property manager is dismissed within 90 days without adverse consequences to the Shops at Mission Viejo Property or (c) clause (iii) above, if (A) the NOI Debt Yield is greater than or equal to 10.50% for two consecutive calendar quarters, (B) the borrower prepays a portion of the Shops at Mission Viejo Whole Loan in accordance with the Shops at Mission Viejo Whole Loan documents in an amount sufficient such that the debt yield is no less than 10.50%, together with, if prior to the open period, the yield maintenance premium or (C) the borrower delivers to the lenders (1) cash, (2) U.S. obligations, (3) other securities having a rating reasonably acceptable to the lenders and for which a rating agency confirmation has been received or (4) a letter of credit, in each case, in an amount which, if applied to the repayment of the Shops at Mission Viejo Whole Loan would result in a debt yield equal to 10.50%.
Permitted Future Subordinate or Mezzanine Debt. Not permitted. However, the Shops at Mission Viejo Whole Loan documents permit the borrower to enter into a Property Assessed Clean Energy loan for an amount not to exceed $5,000,000, subject to the consent of the lenders and delivery of a rating agency confirmation.
| THE INFORMATION IN THIS STRUCTURAL AND COLLATERAL TERM SHEET IS NOT COMPLETE AND MAY BE AMENDED PRIOR TO THE TIME OF SALE. THIS TERM SHEET IS NOT AN OFFER TO SELL THESE SECURITIES AND IT IS NOT A SOLICITATION OF AN OFFER TO BUY THESE SECURITIES IN ANY JURISDICTION WHERE THE OFFER OR SALE IS NOT PERMITTED. | ||
| 112 | ||
| Retail– Super Regional Mall | Loan #10 | Cut-off Date Balance: | $25,000,000 | |
| 555 The Shops at Mission Viejo | Shops at Mission Viejo | Cut-off Date LTV: | 52.4% | |
| Mission Viejo, CA 92691 | UW NCF DSCR: | 1.69x | ||
| UW NOI Debt Yield: | 13.4% |
Partial Release. The Shops at Mission Viejo Whole Loan documents permit the borrower to obtain the release of non-income producing portions of the Shops at Mission Viejo Property in connection with a transfer to third parties or affiliates of the borrower without the payment of a release price provided that, among other conditions, the borrower satisfies customary REMIC requirements.
Additionally, the borrower is permitted to release the proposed space for a planned 50,000 square foot lifestyle development that is expected to break ground in the near future without the payment of a release price provided that, among other conditions, the borrower satisfies the REMIC requirements. The proposed expansion space is expected to be located between Dick’s and Macy’s.
Terrorism Insurance. The borrower is required to obtain and maintain property insurance and business interruption insurance for 18 months. Such insurance is required to cover perils of terrorism and acts of terrorism (provided that if TRIPRA or a similar statute is not in effect, the borrower will not be obligated to pay terrorism insurance premiums in excess of two times the premium for the casualty and business interruption coverage on a stand-alone basis). See “Risk Factors—Risks Relating to the Mortgage Loans—Terrorism Insurance May Not Be Available for All Mortgaged Properties” in the prospectus.
| THE INFORMATION IN THIS STRUCTURAL AND COLLATERAL TERM SHEET IS NOT COMPLETE AND MAY BE AMENDED PRIOR TO THE TIME OF SALE. THIS TERM SHEET IS NOT AN OFFER TO SELL THESE SECURITIES AND IT IS NOT A SOLICITATION OF AN OFFER TO BUY THESE SECURITIES IN ANY JURISDICTION WHERE THE OFFER OR SALE IS NOT PERMITTED. | ||
| 113 | ||
| Mortgage Loan No. 11 – 900 North Michigan |
| Mortgage Loan Information | Property Information | ||||||
| Mortgage Loan Seller: | GSMC | Single Asset/Portfolio: | Single Asset | ||||
| Credit Assessment (Fitch/Moody’s/KBRA): | NR/NR/NR | Location: | Chicago, IL 60611 | ||||
| Original Balance(1): | $25,000,000 | General Property Type: | Mixed Use | ||||
| Cut-off Date Balance(1): | $25,000,000 | Detailed Property Type: | Retail/Office | ||||
| % of Initial Pool Balance: | 3.0% | Title Vesting: | Fee | ||||
| Loan Purpose: | Refinance | Year Built/Renovated: | 1988/2015-2018 | ||||
| Borrower Sponsors: | JMB Realty Corporation | Size: | 831,350 SF | ||||
| Guarantor: | JMB Realty Corporation | Cut-off Date Balance Per SF(1): | $217 | ||||
| Mortgage Rate: | 6.8530% | Maturity Date Balance Per SF(1): | $217 | ||||
| Note Date: | 7/22/2024 | Property Manager: | JMB Financial Advisors, LLC | ||||
| Maturity Date: | 8/6/2034 | (borrower related) | |||||
| Term to Maturity: | 120 months | Underwriting and Financial Information | |||||
| Amortization Term: | 0 months | UW NOI: | $22,768,993 | ||||
| IO Period: | 120 months | UW NCF: | $22,103,101 | ||||
| Seasoning: | 6 months | UW NOI Debt Yield(1): | 12.6% | ||||
| Prepayment Provisions: | L(30),D(83),O(7) | UW NCF Debt Yield(1): | 12.3% | ||||
| Lockbox/Cash Mgmt Status: | Hard/Springing | UW NOI Debt Yield at Maturity(1): | 12.6% | ||||
| Additional Debt Type(1): | Pari Passu | UW NCF DSCR(1): | 1.77x | ||||
| Additional Debt Balance(1): | $155,000,000 | Most Recent NOI: | $26,715,339 (12/31/2023) | ||||
| Future Debt Permitted (Type): | No (NAP) | 2nd Most Recent NOI: | $25,795,686 (12/31/2022) | ||||
| 3rd Most Recent NOI: | $26,702,341 (12/31/2021) | ||||||
| Reserves(2) | Most Recent Occupancy: | 88.8% (7/17/2024) | |||||
| Type | Initial | Monthly | Cap | 2nd Most Recent Occupancy: | 93.9% (12/31/2023) | ||
| RE Taxes: | $2,586,212 | $1,293,106 | NAP | 3rd Most Recent Occupancy: | 96.5% (12/31/2022) | ||
| Insurance: | $0 | Springing | NAP | Appraised Value (as of): | $315,000,000 (5/29/2024) | ||
| Replacement Reserve: | $0 | $18,705 | $831,350 | Appraised Value Per SF: | $379 | ||
| TI/LC Reserve: | $5,000,000 | $166,667 | $10,000,000 | Cut-off Date LTV Ratio(1): | 57.1% | ||
| Other Reserves(3) | $13,552,345 | Springing | NAP | Maturity Date LTV Ratio(1): | 57.1% | ||
| Sources and Uses | ||||||
| Sources | Proceeds | % of Total | Uses | Proceeds | % of Total | |
| Whole Loan(1) | $180,000,000 | 76.2% | Loan Payoff | $206,807,744 | 87.5% | |
| Sponsor Equity | $56,362,388 | 23.8% | Upfront Reserves | $21,138,557 | 8.9% | |
| Closing Costs | $8,416,086 | 3.6% | ||||
| Total Sources: | $236,362,388 | 100.0% | Total Uses: | $236,362,388 | 100.0% | |
| (1) | The 900 North Michigan Mortgage Loan (as defined below) is part of a whole loan evidenced by 5 pari passu notes with an aggregate outstanding principal balance as of the Cut-off Date of $180.0 million (the “900 North Michigan Whole Loan”). The Financial Information in the chart above reflects the 900 North Michigan Whole Loan. |
| (2) | See “Escrows and Reserves” below for further discussion of reserve requirements. |
| (3) | Other Reserves represents an unfunded obligations reserve that consists of unpaid tenant improvements (approximately $9.1 million), future rent abatements (approximately $3.8 million) and unpaid leasing commissions (approximately $0.6 million). |
The Mortgage Loan. The eleventh largest mortgage loan (the “900 North Michigan Mortgage Loan”) is part of a fixed rate whole loan secured by the borrower’s fee interest in a mixed use retail and office property located in Chicago, Illinois (the “900 North Michigan Property”). The 900 North Michigan Whole Loan consists of 5 pari passu notes and accrues interest at a rate of 6.8530% per annum. The 900 North Michigan Whole Loan has a 10-year term, is interest-only for the entire term and accrues interest on an Actual/360 basis. The non-controlling Note A-4-1, with a balance of $25,000,000, will be included in the WFCM 2025-C64 securitization trust. The 900 North Michigan Whole Loan will be serviced pursuant to the pooling and servicing agreement for the BBCMS 2024-C28 trust. See “Description of the Mortgage Pool—The Whole Loans—The Non-Serviced Pari Passu Whole Loans” and “Pooling and Servicing Agreement—Servicing of the Non-Serviced Mortgage Loans” in the Preliminary Prospectus.
| 900 North Michigan Whole Loan Summary | ||||
| Note | Original Balance | Cut-off Date Balance | Note Holder | Controlling Note |
| A-1 | $80,000,000 | $80,000,000 | BBCMS 2024-C28 | Yes |
| A-2 | $20,000,000 | $20,000,000 | WFCM 2024-C63 | No |
| A-3 | $45,000,000 | $45,000,000 | BANK 2024-BNK48 | No |
| A-4-1 | $25,000,000 | $25,000,000 | WFCM 2025-C64 | No |
| A-4-2 | $10,000,000 | $10,000,000 | BBCMS 2024-C30 | No |
| Total | $180,000,000 | $180,000,000 | ||
| THE INFORMATION IN THIS STRUCTURAL AND COLLATERAL TERM SHEET IS NOT COMPLETE AND MAY BE AMENDED PRIOR TO THE TIME OF SALE. THIS TERM SHEET IS NOT AN OFFER TO SELL THESE SECURITIES AND IT IS NOT A SOLICITATION OF AN OFFER TO BUY THESE SECURITIES IN ANY JURISDICTION WHERE THE OFFER OR SALE IS NOT PERMITTED. | ||
| 114 | ||
| Mixed Use – Retail/Office | Loan #11 | Cut-off Date Balance: | $25,000,000 | |
| 900 North Michigan Avenue | 900 North Michigan | Cut-off Date LTV: | 57.1% | |
| Chicago, IL 60611 | UW NCF DSCR: | 1.77x | ||
| UW NOI Debt Yield: | 12.6% |
The Borrower and the Borrower Sponsors. The borrower under the 900 North Michigan Whole Loan is 900 North Michigan, LLC, a Delaware limited liability company and single purpose entity with two independent directors (the “Borrower”). Legal counsel to the Borrower delivered a non-consolidation opinion in connection with the origination of the 900 North Michigan Whole Loan. The borrower sponsor and non-recourse carveout guarantor is JMB Realty Corporation (“JMB”), a Delaware corporation. JMB is a privately-owned real estate investment and development firm with more than 50 years of history. Based in Chicago, the company has significant real estate interests in Illinois, California, Texas and Hawaii.
The Property. The 900 North Michigan Property is a 831,350 square foot mixed use retail and office property located on the north end of the Magnificent Mile in Chicago, Illinois. Built in 1988 and renovated between 2015 and 2018, the 900 North Michigan Property has retail, office, medical office and parking components. The 900 North Michigan Property has approximately 469,000 square feet of vertical retail space with a remaining weighted-average lease term (a “WALT”) of 4.1 years, approximately 305,000 square feet of general office space with a WALT of 4.1 years, approximately 13,000 square feet of high street retail space with a WALT of 3.3 years and approximately 44,000 square feet of medical office space with a WALT of 6.6 years. Additionally, the 900 North Michigan Property has a self-park garage with 1,325 spaces and a 225-space valet parking garage that is managed by SP Plus Corporation.
The following table presents a summary of sales for certain tenants at the 900 North Michigan Property:
| Sales Summary(1) | ||||
| 2021 Sales (PSF) | 2022 Sales (PSF) | 2023 Sales (PSF) | TTM 4/30/2024 Sales (PSF) | |
| Bloomingdale's | $219.93 | $247.06 | $234.26 | $236.30 |
| Gucci | $4,007.82 | $3,091.94 | $2,221.17 | $2,175.08 |
| Max Mara | $2,387.26 | $2,788.30 | $2,777.89 | $2,607.28 |
| Mario Tricoci Hair Salon | $572.41 | $678.14 | $702.60 | $694.68 |
| J. Crew | $521.19 | $598.95 | $667.48 | $711.87 |
| Aster Hall | $133.01 | $236.22 | $268.75 | $269.63 |
| lululemon athletica | $1,494.33 | $1,414.67 | $1,774.24 | $1,674.12 |
| Sur La Table | $335.97 | $389.77 | $447.03 | $477.39 |
| Sidney Garber | $1,347.96 | $1,140.42 | $1,247.29 | $1,252.97 |
| (1) | All sales information presented in this Sales Summary with respect to the 900 North Michigan Property is based upon information provided by the borrower sponsor. |
Major Tenants.
Bloomingdale’s (265,148 SF; 31.9% of NRA; 6.4% of underwritten base rent): Founded in 1872 and headquartered in New York, New York, Bloomingdale’s is an American department store chain with over 2,500 employees located across the United States. Bloomingdale’s offers a variety of shopping services including stylists, beauty, gift shopping, tailoring and wedding registry. Bloomingdale’s has four, five-year extension options remaining.
Grosvenor Capital Mgmnt, L.P. (“GCM Grosvenor”) (72,738 SF; 8.7% of NRA; 6.6% of underwritten base rent): GCM Grosvenor is a global alternatives asset manager with holdings across private equity, absolute return strategies, credit and other asset classes. Founded in 1971, GCM Grosvenor has $79 billion assets under management as of March 31, 2024. GCM Grosvenor has two, five-year extension options remaining.
Equinox (30,021 SF; 3.6% of NRA; 4.2% of underwritten base rent): Equinox is an American luxury fitness company with over 100 fitness clubs located across the globe. Founded in 1991, Equinox’s portfolio of brands include Equinox Fitness Clubs, Equinox Hotels and SoulCycle, amongst others.
| THE INFORMATION IN THIS STRUCTURAL AND COLLATERAL TERM SHEET IS NOT COMPLETE AND MAY BE AMENDED PRIOR TO THE TIME OF SALE. THIS TERM SHEET IS NOT AN OFFER TO SELL THESE SECURITIES AND IT IS NOT A SOLICITATION OF AN OFFER TO BUY THESE SECURITIES IN ANY JURISDICTION WHERE THE OFFER OR SALE IS NOT PERMITTED. | ||
| 115 | ||
| Mixed Use – Retail/Office | Loan #11 | Cut-off Date Balance: | $25,000,000 | |
| 900 North Michigan Avenue | 900 North Michigan | Cut-off Date LTV: | 57.1% | |
| Chicago, IL 60611 | UW NCF DSCR: | 1.77x | ||
| UW NOI Debt Yield: | 12.6% |
The following table presents certain information relating to the major tenants at the 900 North Michigan Property:
| Tenant Summary(1) | ||||||||||
| Tenant Name | Tenant Type | Credit Rating (Moody's/ S&P/Fitch)(2) | Tenant SF | Approx. % of SF | Annual UW Rent | % of Total Annual UW Rent | Annual UW Rent PSF | Term. Option (Y/N) | Lease Expiration Date | Ext. Options |
| Gucci | Retail | NR/NR/NR | 15,914 | 1.9% | $4,527,448 | 16.7% | $284.49 | N | 1/31/2026 | None |
| Aritzia | Retail | NR/NR/NR | 7,736 | 0.9% | $3,781,862 | 13.9% | $488.87 | N | 1/31/2028 | 2 x 5 Yr |
| Tesla | Retail | Baa3/BBB/NR | 5,345 | 0.6% | $2,287,269 | 8.4% | $427.93 | N | 3/31/2027 | 2 x 5 Yr |
| Max Mara(3) | Retail | NR/NR/NR | 5,188 | 0.6% | $1,867,530 | 6.9% | $359.97 | N | Various | None |
| Grosvenor Capital Management L.P.(4) | Office | NR/NR/NR | 72,738 | 8.7% | $1,782,081 | 6.6% | $24.50 | Y | 9/30/2037 | 2 x 5 Yr |
| Bloomingdale's | Retail | Ba1/BB+/NR | 265,148 | 31.9% | $1,747,440 | 6.4% | $6.59 | N | 9/30/2028 | 4 x 5 Yr |
| Equinox | Retail | NR/NR/NR | 30,021 | 3.6% | $1,140,798 | 4.2% | $38.00 | N | 6/30/2028 | None |
| Michael Kors Collection(5) | Retail | NR/BBB-/NR | 3,198 | 0.4% | $1,112,372 | 4.1% | $347.83 | N | 4/30/2025 | None |
| Walton Street Capital LLC | Office | NR/NR/NR | 30,304 | 3.6% | $818,208 | 3.0% | $27.00 | N | 8/31/2029 | 2 x 5 Yr |
| J. Crew | Retail | NR/NR/NR | 9,237 | 1.1% | $645,876 | 2.4% | $69.92 | N | 1/31/2027 | None |
| Major Tenants | 444,829 | 53.5% | $19,710,884 | 72.6% | $44.31 | |||||
| Non-Major Tenants | 293,085 | 35.3% | $7,422,191 | 27.4% | $25.32 | |||||
| Total Occupied | 737,914 | 88.8% | $27,133,075 | 100.0% | $36.77 | |||||
| Vacant Space | 93,436 | 11.2% | ||||||||
| Total | 831,350 | 100.0% | ||||||||
| (1) | Based on the underwritten rent roll dated July 17, 2024, inclusive of rent steps through July 2025. |
| (2) | Certain ratings are those of the parent company whether or not the parent guarantees the lease. |
| (3) | Max Mara has three leases at the 900 North Michigan Property; one lease ($35,150 base rent, 703 square feet) expires in December 2025 and the remaining two leases (collectively, $1,832,380 base rent, 4,485 square feet) expire in May 2029. |
| (4) | GCM Grosvenor has a one-time option to terminate its lease effective September 2032, with notice to be given by September 30, 2031 and payment of a termination fee. |
| (5) | Michael Kors Collection is currently negotiating a 10-year lease renewal |
The following table presents certain information relating to the lease rollover schedule at the 900 North Michigan Property:
| Lease Rollover Table(1) | |||||||||
| Year | # of Leases Rolling | SF Rolling | Approx. % of SF Rolling | Approx. Cumulative % of SF Rolling | Total UW Rent Rolling | Approx. % of Total UW Rent Rolling | Approx. Cumulative % of Total UW Rent Rolling | UW Rent PSF Rolling | |
| 2024 & MTM | 14 | 20,559 | 2.5% | 2.5% | $574,516 | 2.1% | 2.1% | $27.94 | |
| 2025 | 15 | 42,970 | 5.2% | 7.7% | $1,799,604 | 6.6% | 8.7% | $41.88 | |
| 2026 | 7 | 30,133 | 3.6% | 11.3% | $5,127,238 | 18.9% | 27.6% | $170.15 | |
| 2027 | 7 | 26,984 | 3.2% | 14.5% | $3,280,614 | 12.1% | 39.7% | $121.58 | |
| 2028 | 11 | 351,637 | 42.3% | 56.8% | $7,787,687 | 28.7% | 68.4% | $22.15 | |
| 2029 | 8 | 59,712 | 7.2% | 64.0% | $3,649,301 | 13.4% | 81.9% | $61.12 | |
| 2030 | 2 | 18,434 | 2.2% | 66.2% | $580,211 | 2.1% | 84.0% | $31.48 | |
| 2031 | 2 | 16,407 | 2.0% | 68.2% | $112,778 | 0.4% | 84.4% | $6.87 | |
| 2032 | 1 | 12,636 | 1.5% | 69.7% | $372,762 | 1.4% | 85.8% | $29.50 | |
| 2033 | 1 | 24,155 | 2.9% | 72.6% | $513,294 | 1.9% | 87.7% | $21.25 | |
| 2034 | 2 | 24,586 | 3.0% | 75.6% | $663,292 | 2.4% | 90.2% | $26.98 | |
| 2035 & Thereafter | 6 | 109,701 | 13.2% | 88.8% | $2,671,778 | 9.8% | 100.0% | $24.36 | |
| Vacant | 0 | 93,436 | 11.2% | 100.0% | $0 | 0.0% | 100.0% | $0.00 | |
| Total / Wtd. Avg. | 76 | 831,350 | 100.0% | $27,133,075 | 100.0% | $36.77 | |||
| (1) | Based on the underwritten rent roll dated July 17, 2024, inclusive of rent steps through July 2025. |
The Market. The 900 North Michigan Property is located in the Chicago-Naperville-Elgin metropolitan statistical area (the “Chicago MSA”) and the North Michigan Avenue submarket. The 900 North Michigan Property is easily accessible from I-290, I-90, Route 41 and streets in the Chicago downtown area.
The Chicago MSA is the third-largest office market in the United States. According to CoStar, market rents have grown 2.37% on average over the last 10 years. New supply under construction is approximately 1.5 million square feet, which represents 0.3% of existing inventory.
| THE INFORMATION IN THIS STRUCTURAL AND COLLATERAL TERM SHEET IS NOT COMPLETE AND MAY BE AMENDED PRIOR TO THE TIME OF SALE. THIS TERM SHEET IS NOT AN OFFER TO SELL THESE SECURITIES AND IT IS NOT A SOLICITATION OF AN OFFER TO BUY THESE SECURITIES IN ANY JURISDICTION WHERE THE OFFER OR SALE IS NOT PERMITTED. | ||
| 116 | ||
| Mixed Use – Retail/Office | Loan #11 | Cut-off Date Balance: | $25,000,000 | |
| 900 North Michigan Avenue | 900 North Michigan | Cut-off Date LTV: | 57.1% | |
| Chicago, IL 60611 | UW NCF DSCR: | 1.77x | ||
| UW NOI Debt Yield: | 12.6% |
The Chicago MSA is the second-largest retail market in the United States. Absorption in the market has averaged -3.1 million square feet over the last five years. Market vacancy is currently 4.9%.
Environmental Matters. According to the Phase I environmental report dated June 7, 2024, there was evidence of a controlled recognized environmental condition at the 900 North Michigan Property in connection with two release incidents (in 1989 and 2003) involving an active underground storage tank, as more fully described in “Description of the Mortgage Pool—Environmental Considerations” in the Preliminary Prospectus. No Further Action / No Further Remediation letters were issued in 2005 and 2011, respectively, which included a groundwater use restriction with a concrete cap barrier and worker caution in place, and requirements for a safety plan in case of any future excavation on the 900 North Michigan Property.
Operating History and Underwritten Net Cash Flow. The following table presents certain information relating to the historical operating performance and the Underwritten Net Cash Flow at the 900 North Michigan Property:
| Operating History and Underwritten Net Cash Flow Analysis(1) | |||||
| 2021 | 2022 | 2023 | UW(1) | UW PSF | |
| Base Rent | $28,440,562 | $27,722,113 | $28,564,953 | $27,133,075 | $32.64 |
| Rent Steps | $0 | $0 | $0 | $97,789 | $0.12 |
| Overage / Percent Rent | $29,005 | $119,704 | $292,976 | $292,873 | $0.35 |
| Other Rental Revenue(3) | $4,773,408 | $5,894,595 | $7,127,673 | $5,257,060 | $6.32 |
| Vacant Income | $0 | $0 | $0 | $5,656,880 | $6.80 |
| Total Reimbursements | $20,936,127 | $21,711,908 | $21,817,795 | $23,250,563 | $27.97 |
| Potential Gross Revenue | $54,179,102 | $55,448,320 | $57,803,398 | $61,688,239 | $74.20 |
| (Vacancy/Credit Loss) | $0 | $0 | $0 | ($5,656,880) | ($6.80) |
| Effective Gross Income | $54,179,102 | $55,448,320 | $57,803,398 | $56,031,359 | $67.40 |
| Real Estate Taxes | $13,090,323 | $14,382,348 | $14,703,165 | $15,065,313 | $18.12 |
| Insurance | $306,155 | $324,033 | $390,918 | $777,654 | $0.94 |
| Utilities | $4,881,821 | $4,274,791 | $4,895,712 | $5,330,400 | $6.41 |
| Repairs & Maintenance | $3,854,624 | $4,309,932 | $4,540,068 | $5,047,300 | $6.07 |
| Management Fee | $1,417,222 | $1,420,020 | $1,418,004 | $1,500,000 | $1.80 |
| Payroll | $2,054,207 | $1,956,932 | $2,216,017 | $2,399,100 | $2.89 |
| Other Expenses | $1,872,411 | $2,984,579 | $2,924,174 | $3,142,600 | $3.78 |
| Total Expenses | $27,476,761 | $29,652,635 | $31,088,059 | $33,262,367 | $40.01 |
| Net Operating Income | $26,702,341 | $25,795,686 | $26,715,339 | $22,768,993 | $27.39 |
| Replacement Reserves | $0 | $0 | $0 | $224,465 | $0.27 |
| TI/LC | $0 | $0 | $0 | $441,427 | $0.53 |
| Net Cash Flow | $26,702,341 | $25,795,686 | $26,715,339 | $22,103,101 | $26.59 |
| Occupancy | 96.9% | 96.5% | 93.9% | 90.8% | |
| NOI DSCR(4) | 2.14x | 2.06x | 2.14x | 1.82x | |
| NCF DSCR(4) | 2.14x | 2.06x | 2.14x | 1.77x | |
| NOI Debt Yield(4) | 14.8% | 14.3% | 14.8% | 12.6% | |
| NCF Debt Yield(4) | 14.8% | 14.3% | 14.8% | 12.3% | |
| (1) | Based on the underwritten rent roll dated July 17, 2024, inclusive of rent steps through July 2025. |
| (2) | Other Rental Revenue includes kiosks / temporary / specialty revenue, parking income and income associated with sponsorships, signage and vitrines. |
| (3) | Represents the underwritten economic occupancy. The property was 88.8% physically occupied as of July 17, 2024. |
| (4) | Based on the 900 North Michigan Whole Loan. |
| THE INFORMATION IN THIS STRUCTURAL AND COLLATERAL TERM SHEET IS NOT COMPLETE AND MAY BE AMENDED PRIOR TO THE TIME OF SALE. THIS TERM SHEET IS NOT AN OFFER TO SELL THESE SECURITIES AND IT IS NOT A SOLICITATION OF AN OFFER TO BUY THESE SECURITIES IN ANY JURISDICTION WHERE THE OFFER OR SALE IS NOT PERMITTED. | ||
| 117 | ||
| Mortgage Loan No. 12 – FDS Manufacturing |
| Mortgage Loan Information | Property Information | ||||||
| Mortgage Loan Seller: | SGFC | Single Asset/Portfolio: | Single Asset | ||||
| Credit Assessment (Fitch/Moody’s/KBRA): | NR/NR/NR | Location: | Pomona, CA 91766 | ||||
| Original Balance: | $24,000,000 | General Property Type: | Industrial | ||||
| Cut-off Date Balance: | $24,000,000 | Detailed Property Type: | Manufacturing/Warehouse | ||||
| % of Initial Pool Balance: | 2.9% | Title Vesting: | Fee | ||||
| Loan Purpose: | Refinance | Year Built/Renovated: | 1964-1979/NAP | ||||
| Borrower Sponsors: | Robert B. Stevenson and Janet A. Stevenson | Size: | 228,775 SF | ||||
| Guarantors: | Robert B. Stevenson and Janet A. Stevenson | Cut-off Date Balance PSF: | $105 | ||||
| Mortgage Rate: | 7.1950% | Maturity Balance PSF: | $97 | ||||
| Note Date: | 12/20/2024 | Property Manager: | Self-Managed | ||||
| Maturity Date: | 1/1/2035 | ||||||
| Term to Maturity: | 120 months | ||||||
| Amortization Term: | 360 months | Underwriting and Financial Information | |||||
| IO Period: | 36 months | UW NOI: | $3,100,290 | ||||
| Seasoning: | 1 month | UW NCF | $3,031,657 | ||||
| Prepayment Provisions: | L(24),YM1(92),O(4) | UW NOI Debt Yield: | 12.9% | ||||
| Lockbox/Cash Mgmt Status: | Hard/Springing | UW NCF Debt Yield: | 12.6% | ||||
| Additional Debt Type: | NAP | UW NOI Debt Yield at Maturity: | 14.0% | ||||
| Additional Debt Balance: | NAP | UW NCF DSCR: | 1.55x | ||||
| Future Debt Permitted (Type): | No (NAP) | Most Recent NOI(2): | NAV | ||||
| 2nd Most Recent NOI(2): | NAV | ||||||
| 3rd Most Recent NOI(2): | NAV | ||||||
| Reserves | Most Recent Occupancy: | 100.0% (2/1/2025) | |||||
| Type | Initial | Monthly | Cap | 2nd Most Recent Occupancy(2): | NAV | ||
| RE Taxes: | $0 | $9,994 | NAP | 3rd Most Recent Occupancy(2): | NAV | ||
| Insurance: | $90,918 | $18,184 | NAP | Appraised Value (as of): | $63,000,000 (7/22/2024) | ||
| Replacement Reserve: | $0 | $1,906 | NAP | Appraised Value PSF: | $275 | ||
| TI/LC Reserves: | $0 | $3,813 | NAP | Cut-off Date LTV Ratio: | 38.1% | ||
| Deferred Maintenance | $44,313 | $0 | NAP | Maturity Date LTV Ratio: | 35.2% | ||
| Upfront Environmental Reserve(1): | $372,500 | $0 | NAP | ||||
| Sources and Uses | ||||||
| Sources | Proceeds | % of Total | Uses | Proceeds | % of Total | |
| Loan Amount: | $24,000,000 | 100.0% | Loan Payoff: | $14,178,580 | 59.1% | |
| Return of Equity: | $6,973,649 | 29.1% | ||||
| Closing Costs: | $2,340,040 | 9.8% | ||||
| Upfront Reserves: | $507,731 | 2.1% | ||||
| Total Sources: | $24,000,000 | 100.0% | Total Uses: | $24,000,000 | 100.0% | |
| (1) | The Upfront Environmental Reserve was established for the recognized environmental conditions at the FDS Manufacturing Property (as defined below) as described under “Description of the Mortgage Pool—Environmental Considerations” in the Preliminary Prospectus. |
| (2) | Historical NOI and Occupancy are unavailable as the borrower sponsors signed a new 15-year lease with the sole tenant, FDS Manufacturing Company, Inc. and Federated Diversified Sales, Inc. (“FDS Manufacturing”) at origination. |
The Mortgage Loan. The twelfth largest mortgage loan (the “FDS Manufacturing Mortgage Loan”) is evidenced by a promissory note in the original principal amount of $24,000,000 and secured by a first priority fee interest in a 228,775 square foot industrial property located in Pomona, California (the “FDS Manufacturing Property”).
The Borrower and the Borrower Sponsors. The borrower is 2200 South Reservoir Street, LLC, a Delaware limited liability company and single purpose entity with one independent director.
The borrower sponsors and non-recourse carveout guarantors are Robert B. Stevenson and Janet A. Stevenson. Robert B. Stevenson is the President and owner of FDS Manufacturing, a family-owned and operated manufacturer of industrial and agricultural packaging on the West Coast. Additionally, the borrower sponsors own a 110,000 square foot warehousing facility in Fowler, California.
The Property. The FDS Manufacturing Property is a 228,775 square foot industrial property containing two manufacturing and warehouse buildings located in Pomona, California. Situated on a 11.67-acre site, the FDS Manufacturing Property was constructed between 1964 and 1979. The FDS Manufacturing Property features 18 to 35-foot clear height, 14 grade-level dock doors and approximately 1.07% office space. As of February 1, 2025, FDS
| THE INFORMATION IN THIS STRUCTURAL AND COLLATERAL TERM SHEET IS NOT COMPLETE AND MAY BE AMENDED PRIOR TO THE TIME OF SALE. THIS TERM SHEET IS NOT AN OFFER TO SELL THESE SECURITIES AND IT IS NOT A SOLICITATION OF AN OFFER TO BUY THESE SECURITIES IN ANY JURISDICTION WHERE THE OFFER OR SALE IS NOT PERMITTED. | ||
| 118 | ||
| Industrial – Manufacturing/Warehouse | Loan #12 | Cut-off Date Balance: | $24,000,000 | |
| 2200 South Reservoir Street | FDS Manufacturing | Cut-off Date LTV: | 38.1% | |
| Pomona, CA 91766 | UW NCF DSCR: | 1.55x | ||
| UW NOI Debt Yield: | 12.9% |
Manufacturing Property was 100% occupied by FDS Manufacturing. The FDS Manufacturing Property has 236 surface parking spaces resulting in a parking ratio of approximately 1.03 parking spaces per 1,000 square feet.
Sole Tenant.
FDS Manufacturing (228,775 SF; 100.0% of NRA; 100.0% of underwritten base rent; 12/31/2039 lease expiration). Headquartered in Pomona, California, FDS Manufacturing is a family-owned and operated manufacturer of industrial and agricultural packaging on the West Coast. FDS Manufacturing produces high-quality and eco-friendly standard and custom packaging and also employs its own trucking fleet for deliveries. FDS Manufacturing uses extrusion, thermoforming, injection molding, and unique paper-converting processes to manufacture its packaging products. FDS Manufacturing also has a full machine shop which allows it to maintain and create custom tooling for a customer’s various packaging needs. Federated Diversified Sales, Inc., FDS Manufacturing’s sister entity, shares common ownership under the Stevenson family and serves as both the raw material procurement arm while also serving as the in-house distributor for direct business with larger growers such as Driscoll’s Inc. FDS Manufacturing executed a 15-year lease at the FDS Manufacturing Property in December 2024 with an expiration date of December 31, 2039. FDS Manufacturing has two, five-year extension options remaining and no termination options.
The following table presents certain information relating to the tenancy at the FDS Manufacturing Property:
| Tenant Summary(1) | |||||||||
| Tenant Name | Credit Rating (Fitch/Moody's/S&P)(2) | Tenant SF | Approx % of Total SF | Annual UW Rent | % of Total Annual UW Rent | Annual UW Rent PSF | Lease Expiration | Term. Option (Y/N) | Renewal Options |
| FDS Manufacturing | NR/NR/NR | 228,775 | 100.0% | $3,294,360 | 100.0% | $14.40 | 12/31/2039 | N | 2 x 5 yr |
| Occupied Collateral Total | 228,775 | 100.0% | $3,294,360 | 100.0% | $14.40 | ||||
| Vacant Space | 0 | 0.0% | |||||||
| Total/Wtd. Avg. | 228,775 | 100.0% | |||||||
| (1) | Based on the underwritten rent roll dated February 1, 2025. |
| (2) | Represents the credit rating of the parent company, whether or not the parent guarantees the lease. |
The following table presents certain information relating to the lease rollover schedule at the FDS Manufacturing Property:
| Lease Rollover Schedule(1)(2) | ||||||||
| Year | # of Leases Rolling | SF Rolling | Approx. % of Total SF Rolling | Approx. Cumulative % of SF Rolling | Total UW Rent Rolling | Approx. % of Total Rent Rolling | Approx. Cumulative % of Total Rent Rolling | UW Rent PSF Rolling |
| MTM/2025 | 0 | 0 | 0.0% | 0.0% | $0 | 0.0% | 0.0% | $0.00 |
| 2026 | 0 | 0 | 0.0% | 0.0% | $0 | 0.0% | 0.0% | $0.00 |
| 2027 | 0 | 0 | 0.0% | 0.0% | $0 | 0.0% | 0.0% | $0.00 |
| 2028 | 0 | 0 | 0.0% | 0.0% | $0 | 0.0% | 0.0% | $0.00 |
| 2029 | 0 | 0 | 0.0% | 0.0% | $0 | 0.0% | 0.0% | $0.00 |
| 2030 | 0 | 0 | 0.0% | 0.0% | $0 | 0.0% | 0.0% | $0.00 |
| 2031 | 0 | 0 | 0.0% | 0.0% | $0 | 0.0% | 0.0% | $0.00 |
| 2032 | 0 | 0 | 0.0% | 0.0% | $0 | 0.0% | 0.0% | $0.00 |
| 2033 | 0 | 0 | 0.0% | 0.0% | $0 | 0.0% | 0.0% | $0.00 |
| 2034 | 0 | 0 | 0.0% | 0.0% | $0 | 0.0% | 0.0% | $0.00 |
| 2035 | 0 | 0 | 0.0% | 0.0% | $0 | 0.0% | 0.0% | $0.00 |
| 2036 & Thereafter | 1 | 228,775 | 100.0% | 100.0% | $3,294,360 | 100.0% | 100.0% | $14.40 |
| Vacant | 0 | 0 | 0.0% | 100.0% | $0 | 0.0% | 100.0% | $0.00 |
| Total/Wtd. Avg. | 1 | 228,775 | 100.0% | $3,294,360 | 100.0% | $14.40 | ||
| (1) | Based on the underwritten rent roll dated February 1, 2025. |
| (2) | Certain tenants may have lease termination options that are exercisable prior to the stated expiration date of the subject lease or leases which are not considered in the Lease Rollover Schedule. |
The Market. The FDS Manufacturing Property is located in Pomona, California, approximately 35 miles east of Downtown Los Angeles within the Los Angeles-Long Beach-Anaheim, California metropolitan statistical area (the “Los Angeles MSA”). The region, comprising Los Angeles and Orange counties, is the second largest metropolitan area in the United States. The Los Angeles MSA is a major western market with global reach and access to several domestic and international markets within a few hours of travel. The Los Angeles MSA has strong accessibility to the major markets of San Diego to the south, Las Vegas to the east and San Francisco further north along the California coastline. Famous for its entertainment industry, the Los Angeles MSA is home to multiple major film studios, such as Warner Brothers Entertainment, Walt Disney Studios, NBCUniversal, Sony Pictures Entertainment Motion Picture Group and Paramount Pictures. Major companies within the Los Angeles MSA include American Honda Motor Co., Princess Cruise Lines and Trader Joe's. Additionally, Ingram Micro, Hyundai Motor America and Blizzard Entertainment maintain headquarters in Orange County. The Los Angeles MSA is served by several major highways, two rail operators and three international airports. Regional access is provided via the Santa Monica Freeway (I-10), Hollywood Freeway (US Highway 101), Arroyo Seco Parkway/Harbor Freeway (I-110) and Golden State Freeway (I-5).
| THE INFORMATION IN THIS STRUCTURAL AND COLLATERAL TERM SHEET IS NOT COMPLETE AND MAY BE AMENDED PRIOR TO THE TIME OF SALE. THIS TERM SHEET IS NOT AN OFFER TO SELL THESE SECURITIES AND IT IS NOT A SOLICITATION OF AN OFFER TO BUY THESE SECURITIES IN ANY JURISDICTION WHERE THE OFFER OR SALE IS NOT PERMITTED. | ||
| 119 | ||
| Industrial – Manufacturing/Warehouse | Loan #12 | Cut-off Date Balance: | $24,000,000 | |
| 2200 South Reservoir Street | FDS Manufacturing | Cut-off Date LTV: | 38.1% | |
| Pomona, CA 91766 | UW NCF DSCR: | 1.55x | ||
| UW NOI Debt Yield: | 12.9% |
According to the appraisal, the FDS Manufacturing Property is located within the San Gabriel Valley industrial market and the East San Gabriel Valley industrial submarket. As of the second quarter of 2024, the San Gabriel Valley industrial market reported inventory of approximately 193.3 million square feet with a 5.6% vacancy rate and an average asking rent of $17.40 per square foot. As of the second quarter of 2024, the East San Gabriel Valley industrial submarket reported inventory of approximately 28.4 million square feet with a 3.7% vacancy rate and an average asking rent of $15.60 per square foot.
The following table presents certain information relating to the appraisal’s market rent conclusions for the FDS Manufacturing Property:
| Market Rent Summary | |
| Industrial Space | |
| Market Rent (PSF) | $15.00 |
| Lease Term (Years) | 5 |
| Lease Type | NNN |
| Escalations | 4.0% annually |
| Tenant Improvements (New/Renewal) | $1.00 / $0.50 |
| Leasing Commissions (New/Renewal) | 6.0% / 3.0% |
| Free Rent (Months) (New/Renewal) | 2 / 0 |
| Source: | Appraisal dated August 12, 2024. |
The following table presents certain information relating to the appraisal’s market rent conclusions for the FDS Manufacturing Property:
| Comparable Industrial Leases(1) | ||||||||
| Property Name/Location | Year Built/ Renovated | Total GLA (SF) | Tenant | Tenant Size (SF) | Lease Start Date | Lease Term (years) | Annual Base Rent PSF | Lease Type |
FDS Manufacturing 2200 South Reservoir Street Pomona, CA | 1964-1979/NAP | 228,775(2) | ||||||
5540 4th Street Rancho Cucamonga, CA | 2000/NAP | 201,454 | McLane Company | 201,454 | Nov-24 | 5.2 | $18.60 | NNN |
| 14430 Monte Vista Avenue Chino, CA | 1998/NAP | 108,680 | Lynn Group | 108,680 | Aug-24 | 5.7 | $18.00 | NNN |
| 10750 7th Street Rancho Cucamonga, CA | 2000/NAP | 98,055 | Stone CK LA Company | 98,055 | Jul-24 | 5.3 | $15.60 | NNN |
| 5505 Concours Ontario, CA | 2001/NAP | 102,878 | Ys & Son Company | 102,878 | Jul-24 | 4.5 | $17.76 | NNN |
| 3350 East Cedar Street Ontario, CA | 1995/NAP | 220,461 | CHEP USA | 220,461 | Jun-24 | 5.0 | $18.60 | NNN |
| 2539 East Philadelphia Street Ontario, CA | 2007/NAP | 106,566 | Fly King Warehouse | 106,566 | Mar-24 | 5.4 | $16.80 | NNN |
| 8595 Milliken Avenue Rancho Cucamonga, CA | 2000/NAP | 221,546 | Gigacloud Technology | 221,546 | Mar-24 | 5.3 | $17.64 | NNN |
| 10404 6th Street Rancho Cucamonga, CA | 1998/NAP | 177,550 | GITI Tire | 177,550 | Mar-24 | 5.0 | $18.60 | NNN |
| 1105 Auto Center Drive Ontario, CA | 2001/NAP | 50,718 | Oadeer Home | 50,718 | Feb-24 | 7.2 | $17.40 | NNN |
| 5400 East Francis Street Ontario, CA | 1988/NAP | 142,892 | Building Materials Mnf. Corp. | 142,892 | Feb-24 | 4.2 | $18.72 | NNN |
| 10851 Sierra Avenue Fontana, CA | 2006/NAP | 116,205 | Ledvance
| 116,205 | Dec-23 | 5.3 | $17.40 | NNN |
| 2521 East Francis Street Ontario, CA | 1992/NAP | 200,036 | The Merchant of Tennis | 200,036 | Oct-23 | 3.1 | $18.60 | NNN |
| (1) | Information obtained from the appraisal dated August 12, 2024. |
| (2) | Information obtained fro1.5PTm the underwritten rent roll. |
| THE INFORMATION IN THIS STRUCTURAL AND COLLATERAL TERM SHEET IS NOT COMPLETE AND MAY BE AMENDED PRIOR TO THE TIME OF SALE. THIS TERM SHEET IS NOT AN OFFER TO SELL THESE SECURITIES AND IT IS NOT A SOLICITATION OF AN OFFER TO BUY THESE SECURITIES IN ANY JURISDICTION WHERE THE OFFER OR SALE IS NOT PERMITTED. | ||
| 120 | ||
| Industrial – Manufacturing/Warehouse | Loan #12 | Cut-off Date Balance: | $24,000,000 | |
| 2200 South Reservoir Street | FDS Manufacturing | Cut-off Date LTV: | 38.1% | |
| Pomona, CA 91766 | UW NCF DSCR: | 1.55x | ||
| UW NOI Debt Yield: | 12.9% |
Operating History and Underwritten Net Cash Flow. The following table presents certain information relating to the underwritten net cash flow at the FDS Manufacturing Property:
| Cash Flow Analysis | ||
| UW | UW PSF | |
| Base Rent | $3,294,360 | $14.40 |
| Grossed Up Vacant Space | $0 | $0.00 |
| Gross Potential Rent | $3,294,360 | $14.40 |
| Total Recoveries | $527,047 | $2.30 |
| Net Rental Income | $3,821,407 | $16.70 |
| (Vacancy & Credit Loss) | ($191,070) | ($0.84) |
| Effective Gross Income | $3,630,337 | $15.87 |
| Real Estate Taxes | $119,933 | $0.52 |
| Insurance | $218,204 | $0.95 |
| Management Fee | $108,910 | $0.48 |
| Other Operating Expenses | $83,000 | $0.36 |
| Total Expenses | $530,047 | $2.32 |
| Net Operating Income | $3,100,290 | $13.55 |
| Replacement Reserves | $22,878 | $0.10 |
| TI/LC | $45,755 | $0.20 |
| Net Cash Flow | $3,031,657 | $13.25 |
| Occupancy %(1) | 95.0% | |
| NOI DSCR | 1.59x | |
| NCF DSCR | 1.55x | |
| NOI Debt Yield | 12.9% | |
| NCF Debt Yield | 12.6% | |
| (1) | The UW Occupancy % represents the in-place economic occupancy based on the underwritten rent roll dated February 1, 2025. |
| THE INFORMATION IN THIS STRUCTURAL AND COLLATERAL TERM SHEET IS NOT COMPLETE AND MAY BE AMENDED PRIOR TO THE TIME OF SALE. THIS TERM SHEET IS NOT AN OFFER TO SELL THESE SECURITIES AND IT IS NOT A SOLICITATION OF AN OFFER TO BUY THESE SECURITIES IN ANY JURISDICTION WHERE THE OFFER OR SALE IS NOT PERMITTED. | ||
| 121 | ||
| Mortgage Loan No. 13 – DoubleTree Fort Worth |
| Mortgage Loan Information | Property Information | ||||||
| Mortgage Loan Seller: | UBS AG | Single Asset/Portfolio: | Single Asset | ||||
| Credit Assessment (Fitch/Moody’s/KBRA): | NR/NR/NR | Location: | Fort Worth, TX 76134 | ||||
| Original Balance: | $23,550,000 | General Property Type: | Hospitality | ||||
| Cut-off Date Balance: | $23,550,000 | Detailed Property Type: | Full Service | ||||
| % of Initial Pool Balance: | 2.9% | Title Vesting: | Fee | ||||
| Loan Purpose: | Refinance | Year Built/Renovated: | 1985/2019-2021, 2023 | ||||
| Borrower Sponsor: | Abdul Majid Hassanally | Size: | 232 Rooms | ||||
| Guarantor: | Abdul Majid Hassanally | Cut-off Date Balance Per Room: | $101,509 | ||||
| Mortgage Rate: | 8.3450% | Maturity Date Balance Per Room: | $101,509 | ||||
| Note Date: | 1/10/2025 | Property Manager: | FWTX Associates LLC | ||||
| Maturity Date: | 1/6/2035 | ||||||
| Term to Maturity: | 120 months | ||||||
| Amortization Term: | 0 months | ||||||
| IO Period: | 120 months | Underwriting and Financial Information | |||||
| Seasoning: | 1 month | UW NOI: | $3,490,986 | ||||
| Prepayment Provisions: | L(12),YM1(104),O(4) | UW NCF: | $3,062,193 | ||||
| Lockbox/Cash Mgmt Status: | Hard/Springing | UW NOI Debt Yield: | 14.8% | ||||
| Additional Debt Type: | NAP | UW NCF Debt Yield: | 13.0% | ||||
| Additional Debt Balance: | NAP | UW NOI Debt Yield at Maturity: | 14.8% | ||||
| Future Debt Permitted (Type)(1): | Yes (Mezzanine) | UW NCF DSCR: | 1.54x | ||||
| Most Recent NOI: | $3,693,589 (11/30/2024 TTM) | ||||||
| 2nd Most Recent NOI(3): | NAV | ||||||
| Reserves | 3rd Most Recent NOI(3): | NAV | |||||
| Type | Initial | Monthly | Cap | Most Recent Occupancy: | 64.0% (11/30/2024) | ||
| RE Taxes: | $0 | $21,618 | NAP | 2nd Most Recent Occupancy(3): | NAV | ||
| Insurance: | $204,312 | $17,613 | NAP | 3rd Most Recent Occupancy(3): | NAV | ||
| FF&E Reserve: | $0 | $28,586 | NAP | Appraised Value (as of): | $54,800,000 (9/16/2024) | ||
| Immediate Repairs: | $34,013 | $0 | NAP | Appraised Value Per Room: | $236,207 | ||
| Cash Collateral Reserve: | $500,000 | $0 | NAP | Cut-off Date LTV Ratio: | 43.0% | ||
| PIP Funds(2): | $0 | Springing | NAP | Maturity Date LTV Ratio: | 43.0% | ||
| Sources and Uses | ||||||
| Sources | Proceeds | % of Total | Uses | Proceeds | % of Total | |
| Loan Amount: | $23,550,000 | 100.0% | Loan Payoff: | $19,431,404 | 82.5% | |
| Return of Equity: | $1,326,960 | 5.6% | ||||
| Closing Costs: | $1,071,593 | 4.6% | ||||
| Other Debt(4): | $981,717 | 4.2% | ||||
| Upfront Reserves: | $738,325 | 3.1% | ||||
| Total Sources: | $23,550,000 | 100.0% | Total Uses: | $23,550,000 | 100.0% | |
| (1) | The borrower is permitted to incur a future mezzanine loan, subject to the satisfaction of the requirements set forth in the DoubleTree Fort Worth Mortgage Loan (as defined below) documents, including, without limitation: (i) the mezzanine loan is made no earlier than the date that is one full calendar month after the final securitization of the DoubleTree Fort Worth Mortgage Loan; (ii) the aggregate loan-to-value ratio based on the DoubleTree Fort Worth Mortgage Loan and the mezzanine loan is no greater than 50.0%; (iii) the actual combined net operating income debt yield based on the DoubleTree Fort Worth Mortgage Loan and the mezzanine loan is no less than 13.0%; (iv) the execution of an intercreditor agreement acceptable to the lender and satisfactory to the rating agencies; and (v) receipt of a rating agency confirmation. |
| (2) | On each Monthly Payment Date during a Franchise Trigger Event (as defined herein), the borrower is required to deposit with the lender all Franchise Trigger Event excess cash for costs incurred in connection with the property improvement plan (“PIP”) work. A “Franchise Trigger Event” means if (i) the franchisor gives written notice to the borrower of its intention to terminate or not extend the franchise agreement, (ii) on or prior to the date that is 12 months prior to the then-applicable expiration date under the franchise agreement, the franchise agreement is not extended on terms and conditions reasonably acceptable to the lender, (iii) an event of default by the borrower or an affiliate occurs under the franchise agreement, (iv) subject to clause (v) herein, an event of default by the franchisor occurs under the franchise agreement, (v) any bankruptcy action of the franchisor, (vi) the franchise agreement is terminated (in whole or in part) or is no longer in full force and effect or (vii) the franchisor requires the borrower to perform or otherwise satisfy (or cause to be performed or otherwise satisfied) any PIP work. |
| (3) | The DoubleTree Fort Worth Property (as defined below) completed a conversion to a Holiday Inn in 2021 and subsequently to a DoubleTree hotel in 2023. As such, historical cash flows and occupancies are unavailable. |
| (4) | Other Debt relates to pending interest charges, property tax financing and exit fees. |
The Mortgage Loan. The thirteenth largest mortgage loan (the “DoubleTree Fort Worth Mortgage Loan”) is evidenced by a single promissory note in the original principal balance of $23,550,000 and secured by the borrower’s first priority fee interest in a 232-room, full service, hospitality property located in Fort Worth, Texas (the “DoubleTree Fort Worth Property”).
The Borrower and the Borrower Sponsor. The borrower for the DoubleTree Fort Worth Mortgage Loan is Momentum Fort Worth Investment LLC, a Texas limited liability company and single purpose entity with one independent director. The borrower sponsor and non-recourse carveout guarantor for the DoubleTree Fort Worth Mortgage Loan is Abdul Majid Hassanally.
| THE INFORMATION IN THIS STRUCTURAL AND COLLATERAL TERM SHEET IS NOT COMPLETE AND MAY BE AMENDED PRIOR TO THE TIME OF SALE. THIS TERM SHEET IS NOT AN OFFER TO SELL THESE SECURITIES AND IT IS NOT A SOLICITATION OF AN OFFER TO BUY THESE SECURITIES IN ANY JURISDICTION WHERE THE OFFER OR SALE IS NOT PERMITTED. | ||
| 122 | ||
| Hospitality – Full Service | Loan #13 | Cut-off Date Balance: | $23,550,000 | |
| 100 Altamesa Boulevard East | DoubleTree Fort Worth | Cut-off Date LTV: | 43.0% | |
| Fort Worth, TX 76134 | UW NCF DSCR: | 1.54x | ||
| UW NOI Debt Yield: | 14.8% |
The Property. The DoubleTree Fort Worth Property is a 232-room, full service, hospitality property located in Fort Worth, Texas. Built and opened for business in 1985, the DoubleTree Fort Worth Property is situated on a 5.39-acre site (excluding 1.61 acres of excess land) and is comprised of a six-story building that totals approximately 155,904 square feet of gross building area. The DoubleTree Fort Worth Property provides 511 parking spaces, which results in a parking ratio of 2.2 spaces per key. The guestroom mix at the DoubleTree Fort Worth Property is comprised of 122 queen/queen rooms, 84 king rooms and 26 suites. Each of the guestrooms feature a HDTV, a coffee maker, a microwave, a mini refrigerator, 400 thread count sheets, blackout curtains, a desk and laptop workspace, and separate sitting areas. Hotel amenities include an indoor pool, a fitness center, a business center, guest laundry, 17 meeting rooms, 20,481 square feet of event space, an on-site steakhouse restaurant and bar/lounge, a sundry shop and high-speed internet.
The borrower sponsor acquired the DoubleTree Fort Worth Property in May of 2017 for $8.5 million, when it operated as a Radisson hotel. After acquisition, the borrower sponsor completed a comprehensive renovation of the DoubleTree Fort Worth Property for its conversion to a Holiday Inn & Suites hotel, which lasted from early 2019 to the fourth quarter of 2021. The DoubleTree Fort Worth Property operated as a Holiday Inn & Suites hotel until December 2022 when ownership terminated the franchise affiliation. The DoubleTree Fort Worth Property underwent additional renovations in 2023 and was converted to a DoubleTree hotel in May 2023. Since acquisition, the borrower sponsor has spent approximately $12.1 million in capital improvements and approximately $6.1 million in other/soft costs, which are inclusive of approximately $5.7 million in carry costs from acquisition to 2023, and a $400,000 Radisson franchise termination fee.
The DoubleTree Fort Worth Property is operated as a DoubleTree by Hilton hotel facility and subject to a 20-year franchise agreement with Hilton Franchise Holding LLC, a wholly-owned subsidiary of Hilton Worldwide Holdings, Inc. (NYSE: HLT), which commenced in May 2023 and expires in May 2043 with no renewal options. The agreement includes a royalty fee equal to 5.0% of gross room sales after the initial 3.0% in year one and 4.0% in year two, as well as a program/marketing fee of 4.0% of gross room sales.
According to the appraisal, the property segmentation at the DoubleTree Fort Worth Property is estimated at 65% commercial, 25% leisure and 10% group.
The following table presents certain information relating to the Occupancy, ADR and RevPAR of the DoubleTree Fort Worth Property and its competitive set:
| Historical Occupancy, ADR, RevPAR | |||||||||
| Competitive Set(1) | DoubleTree Fort Worth(2) | Penetration Factor | |||||||
| Year | Occupancy | ADR | RevPAR | Occupancy | ADR | RevPAR | Occupancy | ADR | RevPAR |
| 2021 | 58.3% | $113.93 | $66.46 | 14.1% | $88.65 | $12.52 | 24.2% | 77.8% | 18.8% |
| 2022 | 65.2% | $137.69 | $89.75 | 32.4% | $100.80 | $32.62 | 49.7% | 73.2% | 36.4% |
| 2023 | 67.7% | $145.19 | $98.25 | 41.0% | $115.70 | $47.45 | 60.6% | 79.7% | 48.3% |
| TTM November 2024 | 63.6% | $150.07 | $95.52 | 64.0% | $108.48 | $69.38 | 100.5% | 72.3% | 72.6% |
Source: Industry Report.
| (1) | The 2021, 2022, 2023 and TTM November 2024 competitive sets include DoubleTree by Hilton Fort Worth South Hotel & Conference Center, Radisson Hotel Fort Worth North-Fossil Creek, Courtyard Fort Worth West at Cityview, Holiday Inn Express & Suites Fort Worth Downtown, Hilton Garden Inn Fort Worth Medical Center, aloft Hotel Fort Worth Downtown and Hyatt Place Fort Worth/TCU. |
| (2) | Variances between the underwriting, the appraisal and the industry report with respect to occupancy, ADR and RevPAR are attributable in part to variances in reporting methodologies and timing differences. |
The Market. The DoubleTree Fort Worth Property is located in Fort Worth, Tarrant County, Texas, approximately 8.0 miles south of the Fort Worth central business district. Fort Worth is located in the western portion of the Dallas-Fort Worth Metroplex and is the 13th most populated city in the United States and the fifth largest city in Texas according to the appraisal. The DoubleTree Fort Worth Property is approximately 16.6 miles southwest of Arlington, approximately 37.8 miles southwest of Dallas and approximately 27.5 miles southwest of the Dallas Fort Worth International Airport. The DoubleTree Fort Worth Property is located just east of Interstate 35, a major north/south highway connecting Fort Worth with Laredo, Texas to the south and Duluth, Minnesota to the north and is a NAFTA superhighway, and south of Interstate 20, a major east/west interstate highway.
Texas Christian University is located approximately 5.7 miles northwest of the DoubleTree Fort Worth Property and is home to approximately 2,336 faculties, as well as 9,704 undergraduate and 1,675 graduate students. Other demand drives in the area include The Fort Worth Zoo (approximately 7.4 miles north), Fort Worth Stockyards (approximately 10.3 miles) and the Texas Motor Speedway (approximately 27.6 miles). Given the DoubleTree Fort Worth Property’s proximity to Arlington and Dallas, the DoubleTree Fort Worth Property also benefits from additional nearby attractions such as AT&T Stadium (approximately 18.9 miles), home of the Dallas Cowboys, Globe Life Field Stadium (approximately 19.3 miles), home of the Texas Rangers, Choctaw Stadium (approximately 20.8 miles), home to multiple minor league sports franchises, and Six Flags Over Texas (approximately 21.3 miles).
According to a third-party market research report, the estimated 2024 population within a one-, three- and five-mile radius of the DoubleTree Fort Worth Property was 4,846, 98,598 and 269,323, respectively. The 2024 average household income within the same radii was $92,179, $70,077 and $81,719, respectively.
| THE INFORMATION IN THIS STRUCTURAL AND COLLATERAL TERM SHEET IS NOT COMPLETE AND MAY BE AMENDED PRIOR TO THE TIME OF SALE. THIS TERM SHEET IS NOT AN OFFER TO SELL THESE SECURITIES AND IT IS NOT A SOLICITATION OF AN OFFER TO BUY THESE SECURITIES IN ANY JURISDICTION WHERE THE OFFER OR SALE IS NOT PERMITTED. | ||
| 123 | ||
| Hospitality – Full Service | Loan #13 | Cut-off Date Balance: | $23,550,000 | |
| 100 Altamesa Boulevard East | DoubleTree Fort Worth | Cut-off Date LTV: | 43.0% | |
| Fort Worth, TX 76134 | UW NCF DSCR: | 1.54x | ||
| UW NOI Debt Yield: | 14.8% |
The following table presents the primary competitive properties to the DoubleTree Fort Worth Property:
| Competitive Property Summary | ||||||||
| Property | Year Built | Rooms | Commercial | Group | Leisure | 2023 Occupancy(1) | 2023 ADR(1) | 2023 RevPAR(1) |
| DoubleTree Fort Worth | 1985 | 232 | 65% | 10% | 25% | 59.0% | $109.67 | $65.11 |
| Radisson Hotel Fort Worth North-Fossil Creek | 1986 | 247 | 60% - 65% | 20% - 25% | 20% - 25% | 55% - 65% | $70 - $80 | $40 - $50 |
| Courtyard Fort Worth West at Cityview | 2009 | 104 | 70% - 75% | 10% - 15% | 20% - 25% | 65% - 75% | $130 - $140 | $90 - $100 |
| Holiday Inn Express & Suites Fort Worth Downtown | 1957 | 163 | 60% - 65% | 10% - 15% | 30% - 35% | 65% - 75% | $120 - $130 | $80 - $90 |
| Hilton Garden Inn Fort Worth Medical Center | 2012 | 157 | 70% - 75% | 10% - 15% | 20% - 25% | 70% - 80% | $165 - $175 | $125 - $135 |
| aloft Hotel Fort Worth Downtown | 2018 | 180 | 60% - 65% | 10% - 15% | 30% - 35% | 65% - 75% | $170 - $180 | $120 - $130 |
| Hyatt Place Fort Worth/TCU | 2021 | 150 | 55% - 60% | 10% - 15% | 35% - 40% | 75% - 85% | $155 - $165 | $125 - $135 |
| Total/Average | 1,233 | 63% | 12% | 25% | 63.0% | $144 | $91 | |
Source: Appraisal.
| (1) | Variances between the underwriting, the appraisal and the industry report with respect to occupancy, ADR and RevPAR are attributable in part to variances in reporting methodologies and timing differences. |
Appraisal. The appraisal concluded to an “as is” value for the DoubleTree Fort Worth Property of $54,800,000 as of September 16, 2024.
Environmental Matters. According to the Phase I environmental site assessment dated September 25, 2024, there was no evidence of any recognized environmental conditions at the DoubleTree Fort Worth Property.
Operating History and Underwritten Net Cash Flow. The following table presents certain information relating to the historical operating performance and the underwritten net cash flow at the DoubleTree Fort Worth Property:
| Cash Flow Analysis(1) | |||
| TTM 11/30/2024 | UW | UW per Room | |
| Occupancy(2) | 64.0% | 64.0% | |
| ADR(2) | $112.52 | $112.52 | |
| RevPAR(2) | $71.97 | $71.97 | |
| Room Revenue | $6,110,723 | $6,094,027 | $26,267 |
| Food & Beverage | $1,775,664 | $1,770,813 | $7,633 |
| Other Departmental Income | $712,956 | $711,008 | $3,065 |
| Total Revenue | $8,599,343 | $8,575,848 | $36,965 |
| Room Expense | $1,226,066 | $1,222,716 | $5,270 |
| Food & Beverage Expense | $1,240,878 | $1,237,487 | $5,334 |
| Management Fee | $172,391 | $257,275 | $1,109 |
| Undistributed Expenses | $1,877,959 | $1,896,610 | $8,175 |
| Real Estate Taxes | $195,008 | $259,415 | $1,118 |
| Insurance | $193,452 | $211,358 | $911 |
| Total Expenses | $4,905,754 | $5,084,862 | $21,918 |
| Net Operating Income | $3,693,589 | $3,490,986 | $15,047 |
| FF&E | $333,146 | $428,792 | $1,848 |
| Net Cash Flow | $3,360,443 | $3,062,193 | $13,199 |
| NOI DSCR | 1.85x | 1.75x | |
| NCF DSCR | 1.69x | 1.54x | |
| NOI Debt Yield | 15.7% | 14.8% | |
| NCF Debt Yield | 14.3% | 13.0% | |
| (1) | The DoubleTree Fort Worth Property completed a conversion to a Holiday Inn in 2021 and subsequently to a DoubleTree hotel in 2023. As such, historical cash flows and occupancies are unavailable. |
| (2) | Variances between the underwriting, the appraisal and the industry report with respect to occupancy, ADR and RevPAR are attributable in part to variances in reporting methodologies and timing differences. |
| THE INFORMATION IN THIS STRUCTURAL AND COLLATERAL TERM SHEET IS NOT COMPLETE AND MAY BE AMENDED PRIOR TO THE TIME OF SALE. THIS TERM SHEET IS NOT AN OFFER TO SELL THESE SECURITIES AND IT IS NOT A SOLICITATION OF AN OFFER TO BUY THESE SECURITIES IN ANY JURISDICTION WHERE THE OFFER OR SALE IS NOT PERMITTED. | ||
| 124 | ||
| Mortgage Loan No. 14 – University Courtyard |
| Mortgage Loan Information | Property Information | ||||||
| Mortgage Loan Seller: | CREFI | Single Asset/Portfolio: | Single Asset | ||||
| Credit Assessment (KBRA/Fitch/Moody’s): | NR/NR/NR | Location: | Athens, OH 45701 | ||||
| Original Balance: | $21,400,000 | General Property Type: | Multifamily | ||||
| Cut-off Date Balance: | $21,400,000 | Detailed Property Type: | Student Housing | ||||
| % of Initial Pool Balance: | 2.6% | Title Vesting: | Fee | ||||
| Loan Purpose: | Refinance | Year Built/Renovated: | 2001/NAP | ||||
| Borrower Sponsors: | Michael Colman, David Colman and Evan Ross | Size: | 586 Beds | ||||
| Guarantors: | Michael Colman, David Colman and Evan Ross | Cut-off Date Balance per Bed: | $36,519 | ||||
| Mortgage Rate: | 7.0400% | Maturity Date Balance per Bed: | $36,519 | ||||
| Note Date: | 12/4/2024 | Property Manager: | ACME Residential LLC (Borrower Affiliated) | ||||
| Maturity Date: | 12/6/2034 | Underwriting and Financial Information | |||||
| Term to Maturity: | 120 months | UW NOI(1): | $2,456,482 | ||||
| Amortization Term: | 0 months | UW NCF: | $2,368,582 | ||||
| IO Period: | 120 months | UW NOI Debt Yield: | 11.5% | ||||
| Seasoning: | 2 months | UW NCF Debt Yield: | 11.1% | ||||
| Prepayment Provisions: | L(26),D(87),O(7) | UW NOI Debt Yield at Maturity: | 11.5% | ||||
| Lockbox/Cash Mgmt Status: | Springing/Springing | UW NCF DSCR: | 1.55x | ||||
| Additional Debt Type: | NAP | Most Recent NOI(1): | $1,925,970 (10/31/2024 TTM) | ||||
| Additional Debt Balance: | NAP | 2nd Most Recent NOI(1): | $855,130 (12/31/2023) | ||||
| Future Debt Permitted (Type): | No (NAP) | 3rd Most Recent NOI: | NAV | ||||
| Most Recent Occupancy: | 99.8% (11/8/2024) | ||||||
| Reserves | 2nd Most Recent Occupancy: | NAV | |||||
| Type | Initial | Monthly | Cap | 3rd Most Recent Occupancy: | NAV | ||
| RE Taxes: | $197,189 | $32,865 | NAP | Appraised Value (as of): | $42,500,000 (10/9/2024) | ||
| Insurance: | $48,946 | $16,315 | NAP | Appraised Value per Bed: | $72,526 | ||
| Replacement Reserve: | $0 | $7,325 | NAP | Cut-off Date LTV Ratio: | 50.4% | ||
| Deferred Maintenance: | $64,694 | $0 | NAP | Maturity Date LTV Ratio: | 50.4% | ||
| Sources and Uses | ||||||
| Sources | Proceeds | % of Total | Uses | Proceeds | % of Total | |
| Loan Amount: | $21,400,000 | 91.5% | Loan Payoff: | $22,852,096 | 97.7% | |
| Sponsor Equity: | $1,990,579 | 8.5% | Upfront Reserves: | $310,829 | 1.3% | |
| Closing Costs: | $227,654 | 1.0% | ||||
| Total Sources: | $23,390,579 | 100.0% | Total Uses: | $23,390,579 | 100.0% | |
| (1) | The increase from 2nd Most Recent to Most Recent NOI and Most Recent NOI to UW NOI is primarily attributable to the recovery from the COVID-19 pandemic. |
The Mortgage Loan. The 14th largest mortgage loan (the “University Courtyard Mortgage Loan”) is evidenced by a promissory note in the original principal amount of $21,400,000 and secured by a first priority fee mortgage encumbering a 586-bed, garden-style student housing property located in Athens, Ohio (the “University Courtyard Property”).
The Borrower and the Borrower Sponsors. The borrower is Athens Ohio Properties I, LLLP, a Georgia limited liability limited partnership and single purpose entity with one independent director. The borrower sponsors and non-recourse carveout guarantors are Michael Colman, David Colman and Evan Ross of ROCO Real Estate. Founded in 2012, ROCO is a privately owned and operated full service real estate investment and management company headquartered in Bloomfield Hills, Michigan. ROCO Real Estate has a portfolio of 21 apartment complexes in Michigan, two in Ohio and one in Mississippi.
See “Description of the Mortgage Pool—Litigation and Other Considerations” in the Preliminary Prospectus.
| THE INFORMATION IN THIS STRUCTURAL AND COLLATERAL TERM SHEET IS NOT COMPLETE AND MAY BE AMENDED PRIOR TO THE TIME OF SALE. THIS TERM SHEET IS NOT AN OFFER TO SELL THESE SECURITIES AND IT IS NOT A SOLICITATION OF AN OFFER TO BUY THESE SECURITIES IN ANY JURISDICTION WHERE THE OFFER OR SALE IS NOT PERMITTED. | ||
| 125 | ||
| Multifamily – Student Housing | Loan #14 | Cut-off Date Balance: | $21,400,000 | |
| 366 Richland Avenue | University Courtyard | Cut-off Date LTV: | 50.4% | |
| Athens, OH 45701 | UW NCF DSCR: | 1.55x | ||
| UW NOI Debt Yield: | 11.5% |
The Property. The University Courtyard Property is a 188 unit, 586-bed, garden style student housing complex located in Athens, Ohio, 0.7 miles south of Ohio University’s Campus. The University Courtyard Property is comprised of five buildings ranging from one to four stories in height. The University Courtyard Property was originally constructed in 2001 and is situated on a 22.6-acre site. The University Courtyard Property features 586 surface parking spaces resulting in a parking ratio of 1.0 spaces per bed. The University Courtyard Property’s current leases are generally for 12 months and require parental guarantees unless the applicant has adequate financials. As of November 8, 2024, the University Courtyard Property was 99.8% leased.
The University Courtyard Property unit mix is comprised of 4 studio beds, ten one bedroom / one-bathroom beds, 84 two-bedroom / two-bathroom deluxe beds, 40 two-bedroom / two-bathroom standard beds, 224 four-bedroom / two-bathroom beds, and 224 four-bedroom / four-bathroom beds. Amenities at the University Courtyard Property include a clubhouse, swimming pool, fitness center, business center and onsite management. Unit amenities include full furniture packages, TVs, individually keyed bedrooms, full bathrooms for select units, washer/dryers and balconies/patios for select units.
The following table presents certain information relating to the unit mix at the University Courtyard Property:
| University Courtyard Unit Mix(1) | ||||||
Unit Mix / Type |
Beds |
Occupied Beds |
% Occupied | Average SF per Bed | Monthly Average Rent per Bed(2) | Monthly Average Market Rent per Bed |
| Studio | 4 | 4 | 100.0% | 348 | $1,154 | $1,250 |
| 1 BR / 1 BA | 10 | 10 | 100.0% | 649 | $1,687 | $1,725 |
| 2 BR / 2 BA Deluxe | 84 | 84 | 100.0% | 229 | $927 | $965 |
| 2 BR / 2 BA Standard | 40 | 40 | 100.0% | 219 | $863 | $945 |
| 4 BR / 2 BA | 224 | 224 | 100.0% | 78 | $603 | $650 |
| 4 BR / 4 BA | 224 | 223 | 99.6% | 88 | $676 | $730 |
| Total/Wtd. Avg. | 586 | 585 | 99.8% | 124 | $717 | $768 |
| (1) | Based on the underwritten rent roll dated November 8, 2024. |
| (2) | Monthly Average Rent per Bed is based on occupied beds. |
The Market. The University Courtyard Property is located at 366 Richland Avenue in Athens, Ohio, approximately 0.7 miles south of Ohio University’s campus. Ohio University is a four-year public university and is the oldest university in Ohio. The school’s full-time student population of 17,610 students consists of a mix of 14,672 undergraduate and 2,938 graduate students. Ohio University has a dormitory capacity of about 7,300 beds with the balance of full-time students living off-campus. Access to the University Courtyard Property is provided by US Route 33 which circles the city of Athens and Richland Avenue which connects the University Courtyard Property to the Ohio University Campus.
According to a third-party market research report the University Courtyard Property is located in the Ohio University student housing submarket. As of January 21, 2025, the Ohio University student housing submarket had inventory of 3,883 beds with average rent per bed of $685.
The following table presents information regarding certain competitive properties to the University Courtyard Property:
| Competitive Rental Properties Summary(1) | |||||||
| Property Name / Address | Distance from Subject | Year Built / Renovated | Occupancy | Number of Beds | Unit Type | Average Bed Size | Average Rent Per Bed |
University Courtyard(2)
| -
| 2001 / NAP
| 99.8%
| 586
| Studio | 348 SF | $1,154 |
| 1 BR / 1 BA | 649 SF | $1,687 | |||||
| 2 BR / 2 BA Deluxe | 229 SF | $927 | |||||
| 2 BR / 2 BA Standard | 219 SF | $863 | |||||
| 4 BR / 2 BA | 78 SF | $603 | |||||
| 4 BR / 4 BA | 88 SF | $676 | |||||
The Summit at Coates Run 363 Richland Avenue Athens, OH
| 0.5 mi
| 2009 / NAP
| 100.0%
| 241
| 1 BR / 1 BA | 793 SF | $1,500 |
| 2 BR / 2BA | 461 SF | $1,250 | |||||
| 3 BR / 3 BA | 393 SF | $823 | |||||
| 4 BR / 4 BA | 371 SF | $814 | |||||
Rivergate Apartments 10 Rufus Street Athens, OH | 1.6 mi
| 2016 / NAP
| 100.0%
| 70
| 2 BR / 2 BA | 429 SF | $1,033 |
| 3 BR / 3 BA | 376 SF | $925 | |||||
| 4 BR / 4 BA | 373 SF | $838 | |||||
| Plamer Place | 1.7 mi | 2008 / NAP | 100.0% | 64 | 3 BR / 1 BA | 400 SF | $700 |
| 25 Kurtz Street | 4 BR / 2 BA | 350 SF | $700 | ||||
| Athens, OH | 5 BR / 3 BA | 320 SF | $700 | ||||
| 6 BR / 3 BA | 300 SF | $700 | |||||
| River Park & Rivers Edge | 1.8 mi | 1966 / NAP | 100.0% | 526 | Studio | 306 SF | $980 |
| 36 North McKinley Avenue | 1 BR / 1 BA | 562 SF | $1,039 | ||||
| Athens, OH | 2 BR / 2 BA | 352 SF | $680 | ||||
| 3 BR / 2 BA | 325 SF | $556 | |||||
| 4 BR / 2 BA | 309 SF | $470 | |||||
| (1) | Source: Appraisal. |
| (2) | Based on the underwritten rent roll dated November 8, 2024. |
Appraisal. The appraisal concluded to an “as-is” value for the University Courtyard Property of $42,500,000 as of October 9, 2024.
| THE INFORMATION IN THIS STRUCTURAL AND COLLATERAL TERM SHEET IS NOT COMPLETE AND MAY BE AMENDED PRIOR TO THE TIME OF SALE. THIS TERM SHEET IS NOT AN OFFER TO SELL THESE SECURITIES AND IT IS NOT A SOLICITATION OF AN OFFER TO BUY THESE SECURITIES IN ANY JURISDICTION WHERE THE OFFER OR SALE IS NOT PERMITTED. | ||
| 126 | ||
| Multifamily – Student Housing | Loan #14 | Cut-off Date Balance: | $21,400,000 | |
| 366 Richland Avenue | University Courtyard | Cut-off Date LTV: | 50.4% | |
| Athens, OH 45701 | UW NCF DSCR: | 1.55x | ||
| UW NOI Debt Yield: | 11.5% |
Environmental Matters. According to the Phase I environmental site assessment dated May 15, 2024, there was no evidence of any recognized environmental conditions at the University Courtyard Property.
Operating History and Underwritten Net Cash Flow. The following table presents certain information relating to the historical operating performance and Underwritten Net Cash Flow at the University Courtyard Property:
| Cash Flow Analysis(1) | ||||
| 2023 | 10/31/2024 TTM | UW | UW Per Bed | |
| Base Rent | $4,734,375 | $4,757,939 | $5,034,636 | $8,592 |
| Potential Income from Vacant Units | $0 | $0 | $8,760 | $15 |
| Gross Potential Rent | $4,734,375 | $4,757,939 | $5,043,396 | $8,606 |
| Vacancy/Credit Loss | ($1,411,430) | ($441,031) | ($252,170) | ($430) |
| Other Income(2) | $238,723 | $225,052 | $225,052 | $384 |
| Effective Gross Income | $3,561,668 | $4,541,960 | $5,016,278 | $8,560 |
| Real Estate Taxes | $394,378 | $394,081 | $394,378 | $673 |
| Insurance | $138,045 | $147,908 | $186,460 | $318 |
| Management Fee | $106,850 | $136,259 | $150,488 | $257 |
| Other Operating Expenses(3) | $2,067,264 | $1,937,741 | $1,828,469 | $3,120 |
| Total Operating Expenses | $2,706,538 | $2,615,990 | $2,559,796 | $4,368 |
| Net Operating Income | $855,130 | $1,925,970 | $2,456,482 | $4,192 |
| Replacement Reserves | $0 | $0 | $87,900 | $150 |
| Net Cash Flow | $855,130 | $1,925,970 | $2,368,582 | $4,042 |
| Occupancy | NAV | NAV | 95.0%(4) | |
| NOI DSCR | 0.56x | 1.26x | 1.61x | |
| NCF DSCR | 0.56x | 1.26x | 1.55x | |
| NOI Debt Yield | 4.0% | 9.0% | 11.5% | |
| NCF Debt Yield | 4.0% | 9.0% | 11.1% | |
| (1) | Historical periods prior to 2023 are not available as student housing performance was impacted by the COVID-19 pandemic and it wasn’t until the 2022-2023 school year that the university offered full time in person classes. The increase in Net Operating Income from 2023 to 10/31/2024 TTM and from 10/31/2024 TTM to UW is primarily attributable to the recovery from the COVID-19 pandemic. |
| (2) | Other Income includes net expense reimbursements such as water and sewer, gas, and electric as well as net other income such as late fees, termination fees, and administration fees. |
| (3) | Other Operating Expenses represents payroll and benefits, repairs and maintenance, utilities, advertising and marketing, and general and administrative expenses. |
| (4) | Represents Economic Occupancy. |
| THE INFORMATION IN THIS STRUCTURAL AND COLLATERAL TERM SHEET IS NOT COMPLETE AND MAY BE AMENDED PRIOR TO THE TIME OF SALE. THIS TERM SHEET IS NOT AN OFFER TO SELL THESE SECURITIES AND IT IS NOT A SOLICITATION OF AN OFFER TO BUY THESE SECURITIES IN ANY JURISDICTION WHERE THE OFFER OR SALE IS NOT PERMITTED. | ||
| 127 | ||
| Mortgage Loan No. 15 – Elevation MHC Portfolio |
| Mortgage Loan Information | Property Information | ||||||
| Mortgage Loan Seller: | CREFI | Single Asset/Portfolio: | Portfolio | ||||
| Credit Assessment (KBRA/Fitch/Moody’s): | NR/NR/NR | Location(1): | Various, Various | ||||
| Original Balance: | $21,200,000 | General Property Type: | Manufactured Housing | ||||
| Cut-off Date Balance: | $21,200,000 | Detailed Property Type: | Manufactured Housing | ||||
| % of Initial Pool Balance: | 2.6% | Title Vesting: | Fee | ||||
| Loan Purpose: | Refinance | Year Built/Renovated(1): | Various/Various | ||||
| Borrower Sponsor: | MHC America Fund, LLC | Size: | 1,139 Pads | ||||
| Guarantor: | MHC America Fund, LLC | Cut-off Date Balance per Pad: | $18,613 | ||||
| Mortgage Rate: | 6.9500% | Maturity Date Balance per Pad: | $18,613 | ||||
| Note Date: | 1/24/2025 | Property Manager: | Endeavor MHC Management, LLC (Borrower Affiliated) | ||||
| Maturity Date: | 2/6/2030 | Underwriting and Financial Information | |||||
| Term to Maturity: | 60 months | UW NOI: | $2,202,690 | ||||
| Amortization Term: | 0 months | UW NCF: | $2,145,740 | ||||
| IO Period: | 60 months | UW NOI Debt Yield: | 10.4% | ||||
| Seasoning: | 0 months | UW NCF Debt Yield: | 10.1% | ||||
| Prepayment Provisions: | L(24),D(29),O(7) | UW NOI Debt Yield at Maturity: | 10.4% | ||||
| Lockbox/Cash Mgmt Status: | Springing/Springing | UW NCF DSCR: | 1.44x | ||||
| Additional Debt Type: | NAP | Most Recent NOI: | $2,246,495 (9/30/2024 TTM) | ||||
| Additional Debt Balance: | NAP | 2nd Most Recent NOI: | $2,093,950 (12/31/2023) | ||||
| Future Debt Permitted (Type): | No (NAP) | 3rd Most Recent NOI: | NAV | ||||
| Most Recent Occupancy: | 61.0% (11/1/2024) | ||||||
| Reserves | 2nd Most Recent Occupancy: | 63.4% (12/31/2023) | |||||
| Type | Initial | Monthly | Cap | 3rd Most Recent Occupancy: | NAV | ||
| RE Taxes: | $30,976 | $30,976 | NAP | Appraised Value (as of)(2): | $52,300,000 (Various) | ||
| Insurance: | $15,802 | $15,802 | NAP | Appraised Value per Pad: | $45,917 | ||
| Replacement Reserve: | $1,095,000 | $4,716 | NAP | Cut-off Date LTV Ratio: | 40.5% | ||
| Deferred Maintenance: | $173,237 | $0 | NAP | Maturity Date LTV Ratio: | 40.5% | ||
| Sources and Uses | ||||||
| Sources | Proceeds | % of Total | Uses | Proceeds | % of Total | |
| Mortgage Loan: | $21,200,000 | 100.0% | Loan Payoff: | $15,063,758 | 71.1% | |
| Return of Equity: | $3,065,896 | 14.5% | ||||
| Closing Costs: | $1,755,332 | 8.3% | ||||
| Upfront Reserves: | $1,315,014 | 6.2% | ||||
| Total Sources: | $21,200,000 | 100.0% | Total Uses: | $21,200,000 | 100.0% | |
| (1) | See “Portfolio Summary” below. |
| (2) | The As-Is Appraisal Valuation Dates are between October 9, 2024 and October 14, 2024. |
The Mortgage Loan. The 15th largest mortgage loan (the “Elevation MHC Portfolio Mortgage Loan”) is secured by the borrowers’ fee interest in 11 manufactured housing communities totaling 1,139 pads located in Illinois, Minnesota, Wisconsin, North Dakota and Colorado (the “Elevation MHC Portfolio Properties”). The Elevation MHC Portfolio Mortgage Loan has a 5-year term, is interest-only for the full term and accrues interest at a rate of 6.9500% per annum on an actual/360 basis.
| THE INFORMATION IN THIS STRUCTURAL AND COLLATERAL TERM SHEET IS NOT COMPLETE AND MAY BE AMENDED PRIOR TO THE TIME OF SALE. THIS TERM SHEET IS NOT AN OFFER TO SELL THESE SECURITIES AND IT IS NOT A SOLICITATION OF AN OFFER TO BUY THESE SECURITIES IN ANY JURISDICTION WHERE THE OFFER OR SALE IS NOT PERMITTED. | ||
| 128 | ||
| Manufactured Housing – Manufactured Housing | Loan #15 | Cut-off Date Balance: | $21,200,000 | |
| Various | Elevation MHC Portfolio | Cut-off Date LTV: | 40.5% | |
| Various | UW NCF DSCR: | 1.44x | ||
| UW NOI Debt Yield: | 10.4% |
The Borrowers and the Borrower Sponsor. The borrowers are ILCV Candle MHP, LLC, COCA Central MHP, LLC, Decatur MHP, LLC, Minot MHP, LLC, MNAU Audubon MHP, LLC, MNDU Pleasant MHP, LLC, Nichols MHP Property, LLC, Tuckaway Peoria, LLC, WIPA Tuscobia MHP, LLC, WITO Deerfield MHP, LLC and WIVR Redgranite MHP, LLC, each a Delaware limited liability company and single purpose entity with no independent directors in its organizational structure. The borrower sponsor and non-recourse carveout guarantor is MHC America Fund, LLC. MHC America Fund, LLC is an affiliate of Elevation Capital Group. Elevation Capital Group focuses on niche property types such as manufactured housing communities and self storage. Elevation Capital Group, and its affiliates, have launched more than eight investment vehicles comprising over 175 assets across 30 states.
The Properties. The Elevation MHC Portfolio Properties are comprised of 11 manufactured housing communities totaling 1,139 pads located in Illinois, Minnesota, Wisconsin, North Dakota and Colorado. The Elevation MHC Portfolio Properties were built between 1950 and 1979 and are situated on sites ranging from approximately 4.1 acres to 56.5 acres. The Elevation MHC Portfolio Properties range in size from 27 pad sites to 459 pad sites, with monthly rents ranging from $353 to $549 per pad. As of November 1, 2024, the Elevation MHC Portfolio Properties were 61.0% leased.
As of origination, there were 51 manufactured homes at the Elevation MHC Portfolio Properties that were owned by an affiliate of the borrowers (“Owned Mobile Homes”). The Owned Mobile Homes are not collateral for the Elevation MHC Portfolio Mortgage Loan, and income from rental of such Owned Mobile Homes is not underwritten. Pad rents for the pads on which the Owned Mobile Homes are located are paid by the occupants of such Owned Mobile Homes, and are underwritten. The Elevation MHC Portfolio loan documents permit up to 20% of the manufactured homes at the Elevation MHC Portfolio Properties (in the aggregate) to be Owned Mobile Homes.
The following table presents detailed information with respect to the Elevation MHC Portfolio Properties:
| Portfolio Summary | |||||||||||
Property Name |
City, State(1) |
Year Built/Year Renovated(1) |
# of Pads(2) |
Occ.(2) |
Allocated Cut-off Date Loan Amounts | % of Allocated Cut-off Date Loan Amount |
UW NCF(2) |
% of UW NCF(2) |
UW NCF per Pad(2) |
Avg Monthly Rent per Pad(2) |
Appraised Value(1) |
| Candle Light MHP | Coal Valley, IL | 1965 / 2024 | 459 | 47.7% | $6,560,000 | 30.9% | $578,682 | 27.0% | $1,261 | $457 | $20,700,000 |
| Decatur Estates MHC | Decatur, IL | 1970 / 2024 | 199 | 55.8% | $3,280,000 | 15.5% | $306,965 | 14.3% | $1,543 | $435 | $9,000,000 |
| Pleasant View MHP | Duluth, MN | 1965 / NAP | 89 | 75.3% | $2,370,000 | 11.2% | $228,366 | 10.6% | $2,566 | $528 | $4,400,000 |
| Tuckaway Village MHP | Germantown Hills, IL | 1970 / 2024 | 103 | 75.7% | $2,150,000 | 10.1% | $232,399 | 10.8% | $2,256 | $463 | $4,550,000 |
| Minot MHP | Minot, ND | 1950 / NAP | 92 | 60.9% | $2,020,000 | 9.5% | $197,328 | 9.2% | $2,145 | $481 | $4,900,000 |
| Deerfield Estates MHP | Tomah, WI | 1970 / NAP | 27 | 96.3% | $1,010,000 | 4.8% | $98,944 | 4.6% | $3,665 | $393 | $1,600,000 |
| Nichols MHC | Nichols, WI | 1970 / NAP | 29 | 96.6% | $970,000 | 4.6% | $102,336 | 4.8% | $3,529 | $353 | $1,500,000 |
| Central MHC | Canon City, CO | 1979 / NAP | 39 | 97.4% | $880,000 | 4.2% | $179,663 | 8.4% | $4,607 | $549 | $1,400,000 |
| Audubon MHP | Audubon, MN | 1970 / NAP | 30 | 83.3% | $810,000 | 3.8% | $80,531 | 3.8% | $2,684 | $498 | $1,300,000 |
| Redgranite MHP | Redgranite, WI | 1970 / NAP | 40 | 60.0% | $680,000 | 3.2% | $75,597 | 3.5% | $1,890 | $393 | $1,750,000 |
| Tuscobia Terrace Estates MHP | Park Falls, WI | 1970 / NAP | 32 | 71.9% | $470,000 | 2.2% | $64,929 | 3.0% | $2,029 | $374 | $1,200,000 |
| Total/Wtd. Avg. | 1,139 | 61.0% | $21,200,000 | 100.0% | $2,145,740 | 100.0% | $1,884 | $458 | $52,300,000 | ||
| (1) | Source: Appraisals. |
| (2) | Based on the underwritten rent rolls dated November 1, 2024. |
| THE INFORMATION IN THIS STRUCTURAL AND COLLATERAL TERM SHEET IS NOT COMPLETE AND MAY BE AMENDED PRIOR TO THE TIME OF SALE. THIS TERM SHEET IS NOT AN OFFER TO SELL THESE SECURITIES AND IT IS NOT A SOLICITATION OF AN OFFER TO BUY THESE SECURITIES IN ANY JURISDICTION WHERE THE OFFER OR SALE IS NOT PERMITTED. | ||
| 129 | ||
| Manufactured Housing – Manufactured Housing | Loan #15 | Cut-off Date Balance: | $21,200,000 | |
| Various | Elevation MHC Portfolio | Cut-off Date LTV: | 40.5% | |
| Various | UW NCF DSCR: | 1.44x | ||
| UW NOI Debt Yield: | 10.4% |
The Market. The Elevation MHC Portfolio Properties are located across five states: Illinois (three properties, 52.5% of underwritten NOI), Wisconsin (four properties, 15.8% of underwritten NOI), Minnesota (two properties, 14.3% of underwritten NOI), North Dakota (one property, 9.2% of underwritten NOI), and Colorado (one property, 8.2% of underwritten NOI).
The following table presents certain information relating to the geographic concentration of the Elevation MHC Portfolio Properties:
| Geographic Concentration(1) | ||||||||
| State | # of Properties | # of Pads(2) | % of Total Pads(2) | Allocated Cut-off Date Loan Amount | % of Allocated Cut-off Date Loan Amount | Appraised Value | Underwritten NOI(2) | % of Underwritten NOI(2) |
| Illinois | 3 | 761 | 66.8% | $11,990,000 | 56.6% | $34,250,000 | $1,156,096 | 52.5% |
| Minnesota | 2 | 119 | 10.4% | $3,180,000 | 15.0% | $5,700,000 | $314,847 | 14.3% |
| North Dakota | 1 | 92 | 8.1% | $2,020,000 | 9.5% | $4,900,000 | $201,928 | 9.2% |
| Colorado | 1 | 39 | 3.4% | $880,000 | 4.2% | $1,400,000 | $181,613 | 8.2% |
| Wisconsin | 4 | 128 | 11.2% | $3,130,000 | 14.8% | $6,050,000 | $348,207 | 15.8% |
| Total/Wtd. Avg. | 11 | 1139 | 100.0% | $21,200,000 | 100.0% | $52,300,000 | $2,202,690 | 100.0% |
| (1) | Source: Appraisal unless indicated otherwise. |
| (2) | Based on the underwritten rent roll as of November 1, 2024. |
The following table presents certain information relating to the submarkets at the Elevation MHC Portfolio Properties:
| Market Analysis(1) | |||||||
| Property Name / Address | Market | Submarket | Submarket Inventory | Submarket Occupancy | Property Occupancy(2) | Submarket Rent per Unit | UW Base Rent per Unit(2) |
Candle Light MHP 1503 West 1st Avenue Coal Valley, IL 61240 | Davenport-Moline-Rock Island | Outer West Outlying Rock Island County | 782 | 93.7% | 47.7% | $903 | $457 |
Decatur Estates MHC 2397 North Illinois Street Decatur, IL 62526 | Springfield/Decatur | Decatur MSA | 6,245 | 88.5% | 55.8% | $742 | $435 |
Pleasant View MHP 9428 Grand Avenue Duluth, MN 55808 | Duluth | Fond Du Lac/Gary-New Duluth | 439 | 97.3% | 75.3% | $1,391 | $528 |
Tuckaway Village MHP 212 Anker Lane Germantown Hills, IL 61548 | Peoria | Woodford County | 579 | 96.7% | 75.7% | $500 | $463 |
Minot MHP 2101 3rd Street Northwest Minot, ND 58703 | 30 Miles | 10 Miles | 6,845 | 95.0% | 60.9% | $1,040 | $481 |
Deerfield Estates MHP 13875 Graphite Road Tomah, WI 54660 | Monroe County | Tomah City | 829 | 94.4% | 96.3% | $983 | $393 |
Nichols MHC 4646 Fahrenkrug Street Nichols, WI 54152 | Green Bay | Outer Outagamie County | 3,907 | 97.8% | 96.6% | $1,180 | $353 |
Central MHC 2401 Central Avenue Canon City, CO 81212 | Fremont, Pueblo, El Paso | Fremont | 350 | 96.5% | 97.4% | $419 | $549 |
Audubon MHP 770 5th Street Audubon, MN 56511 | Fargo-Valley City, ND-MN | Becker County | 1,019 | 96.7% | 83.3% | $869 | $498 |
Redgranite MHP 103 Courtney Lane Redgranite, WI 54970 | Green Bay-Appleton, WI-MI | Waushara County | 349 | 96.2% | 60.0% | $601 | $393 |
Tuscobia Terrace Estates MHP 100 7th Avenue South Park Falls, WI 54552 | Wausau-Rhinelander, WI | Price County | 247 | 97.1% | 71.9% | $542 | $374 |
| (1) | Source: Appraisals unless indicated otherwise. Submarket data is as of the trailing four quarters ending the third quarter of 2024. |
| (2) | Based on the underwritten rent roll dated November 1, 2024. |
| THE INFORMATION IN THIS STRUCTURAL AND COLLATERAL TERM SHEET IS NOT COMPLETE AND MAY BE AMENDED PRIOR TO THE TIME OF SALE. THIS TERM SHEET IS NOT AN OFFER TO SELL THESE SECURITIES AND IT IS NOT A SOLICITATION OF AN OFFER TO BUY THESE SECURITIES IN ANY JURISDICTION WHERE THE OFFER OR SALE IS NOT PERMITTED. | ||
| 130 | ||
| Manufactured Housing – Manufactured Housing | Loan #15 | Cut-off Date Balance: | $21,200,000 | |
| Various | Elevation MHC Portfolio | Cut-off Date LTV: | 40.5% | |
| Various | UW NCF DSCR: | 1.44x | ||
| UW NOI Debt Yield: | 10.4% |
The following table presents certain information relating to demographics surrounding the Elevation MHC Portfolio Properties:
| Demographic Summary(1) | |||||||
| 2024 Population | 2024 Median Household Income | ||||||
| Property Name | Location | 1-Mile | 3-Mile | 5-Mile | 1-Mile | 3-Mile | 5-Mile |
| Candle Light MHP | Coal Valley, IL | 1,947 | 25,460 | 86,578 | $48,957 | $76,640 | $66,754 |
| Decatur Estates MHC | Decatur, IL | 5,495 | 50,859 | 74,790 | $31,725 | $43,956 | $53,869 |
| Pleasant View MHP | Duluth, MN | 2,724 | 8,201 | 24,830 | $50,558 | $56,379 | $61,242 |
| Tuckaway Village MHP | Germantown Hills, IL | 3,352 | 9,381 | 27,316 | $134,043 | $121,747 | $101,323 |
| Minot MHP | Minot, ND | 7,740 | 33,667 | 52,181 | $78,685 | $79,560 | $78,032 |
| Deerfield Estates MHP | Tomah, WI | 169 | 7,550 | 13,131 | $78,219 | $52,776 | $61,109 |
| Nichols MHC | Nichols, WI | 335 | 1,238 | 2,808 | $83,127 | $84,654 | $85,329 |
| Central MHC | Canon City, CO | 5,284 | 25,021 | 30,724 | $57,043 | $58,213 | $59,326 |
| Audubon MHP | Audubon, MN | 589 | 898 | 2,037 | $69,131 | $75,853 | $84,004 |
| Redgranite MHP | Redgranite, WI | 2,159 | 3,354 | 4,651 | $56,366 | $59,230 | $62,165 |
| Tuscobia Terrace Estates MHP | Park Falls, WI | 2,123 | 3,141 | 4,215 | $48,955 | $51,929 | $54,623 |
| Wtd. Avg. (based on UW NOI) | 3,303 | 21,948 | 48,392 | $63,170 | $71,311 | $69,200 | |
| (1) | Source: Appraisals. |
Appraisal. According to the appraisals dated from October 9, 2024 to October 14, 2024, the Elevation MHC Portfolio Properties had an aggregate “as is” appraised value of $52,300,000.
Environmental Matters. According to the Phase I environmental reports dated October 28, 2024, there are no recognized environmental conditions at the Elevation MHC Portfolio Properties.
| THE INFORMATION IN THIS STRUCTURAL AND COLLATERAL TERM SHEET IS NOT COMPLETE AND MAY BE AMENDED PRIOR TO THE TIME OF SALE. THIS TERM SHEET IS NOT AN OFFER TO SELL THESE SECURITIES AND IT IS NOT A SOLICITATION OF AN OFFER TO BUY THESE SECURITIES IN ANY JURISDICTION WHERE THE OFFER OR SALE IS NOT PERMITTED. | ||
| 131 | ||
| Manufactured Housing – Manufactured Housing | Loan #15 | Cut-off Date Balance: | $21,200,000 | |
| Various | Elevation MHC Portfolio | Cut-off Date LTV: | 40.5% | |
| Various | UW NCF DSCR: | 1.44x | ||
| UW NOI Debt Yield: | 10.4% |
Operating History and Underwritten Net Cash Flow. The following table presents certain information relating to the operating history and underwritten net cash flow at the Elevation MHC Portfolio Properties:
| Cash Flow Analysis(1) | ||||
| 2023 | TTM 9/30/2024 | U/W | U/W $ per Pad | |
| Base Rent | $3,765,744 | $3,884,312 | $3,819,504 | $3,353 |
| Potential Income from Vacant Units | $0 | $0 | $2,680,752 | $2,354 |
| Gross Potential Rent | $3,765,744 | $3,884,312 | $6,500,256 | $5,707 |
| Other Income(2) | $687,412 | $850,927 | $850,927 | $747 |
| Net Rental Income | $4,453,156 | $4,735,239 | $7,351,183 | $6,454 |
| (Vacancy) | $0 | ($20,086) | ($2,680,752) | ($2,354) |
| Effective Gross Income | $4,453,156 | $4,715,153 | $4,670,431 | $4,100 |
| Real Estate Taxes | $344,740 | $330,498 | $349,263 | $307 |
| Insurance | $54,155 | $142,500 | $180,589 | $159 |
| Management Fee | $133,595 | $141,455 | $140,113 | $123 |
| Other Expenses(3) | $1,826,716 | $1,854,205 | $1,797,776 | $1,578 |
| Total Expenses | $2,359,206 | $2,468,658 | $2,467,741 | $2,167 |
| Net Operating Income | $2,093,950 | $2,246,495 | $2,202,690 | $1,934 |
| Replacement Reserves | $0 | $0 | $56,950 | $50 |
| Net Cash Flow | $2,093,950 | $2,246,495 | $2,145,740 | $1,884 |
| Occupancy | 63.4% | 61.0%(4) | 62.8%(5) | |
| NOI DSCR | 1.40x | 1.50x | 1.47x | |
| NCF DSCR | 1.40x | 1.50x | 1.44x | |
| NOI Debt Yield | 9.9% | 10.6% | 10.4% | |
| NCF Debt Yield | 9.9% | 10.6% | 10.1% | |
| (1) | Historical financial information prior to 2023 is not available because the properties were acquired by the borrower sponsor between 2016 and 2021 and have undergone material renovations from 2022-2024. |
| (2) | Other Income includes storage and apartment income as well as income from the properties’ RUBS program (Ratio Utility Billing System), whereby a portion of the utility expense is shared by tenants and reimbursed to the landlord on a pro rata basis. |
| (3) | Other Expenses include payroll and benefits, repairs and maintenance, utilities, general and administrative expenses, and all other miscellaneous expenses. |
| (4) | Based on the underwritten rent roll as of November 1, 2024. |
| (5) | Represents economic occupancy. |
| THE INFORMATION IN THIS STRUCTURAL AND COLLATERAL TERM SHEET IS NOT COMPLETE AND MAY BE AMENDED PRIOR TO THE TIME OF SALE. THIS TERM SHEET IS NOT AN OFFER TO SELL THESE SECURITIES AND IT IS NOT A SOLICITATION OF AN OFFER TO BUY THESE SECURITIES IN ANY JURISDICTION WHERE THE OFFER OR SALE IS NOT PERMITTED. | ||
| 132 | ||
| Wells Fargo Commercial Mortgage Trust 2025-C64 | Transaction Contact Information |
| VI. | Transaction Contact Information |
Questions regarding this Structural and Collateral Term Sheet may be directed to any of the following individuals:
| Wells Fargo Securities, LLC | |
| A.J. Sfarra | Tel. (212) 214-5613 |
| Brigid Mattingly | Tel. (312) 269-3062 |
| Sean Duffy | Tel. (312) 827-1518 |
| Daniel Thomas | Tel. (212) 214-2813 |
| BMO Capital Markets Corp. | |
| Paul Vanderslice | Tel. (917) 996-4514 |
| David Schell | Tel. (347) 996-0721 |
| Andrew Noonan | Tel. (347) 446-3147 |
| Citigroup Global Markets Inc. | |
| Raul Orozco | Tel. (212) 723-1295 |
| Rick Simpson | Tel. (212) 816-5343 |
| Jay Mercandetti | Tel. (212) 816-6384 |
| Goldman Sachs & Co. LLC | |
| Scott Epperson | Tel. (212) 934-2882 |
| Justin Peterson | Tel. (212) 902-4283 |
| J.P. Morgan Securities LLC | |
| Kunal Singh | Tel. (212) 834-5467 |
| Harris Rendelstein | Tel. (212) 834-6737 |
| Derrick Fetzer | Tel. (212) 834-3111 |
| Avinash Sharma | Tel. (212) 834-3111 |
| SG Americas Securities, LLC | |
| Jim Barnard | Tel. (212) 278-6263 |
| Justin Cappuccino | Tel. (212) 278-6393 |
| Mark Lacerenza | Tel. (212) 278-5243 |
| Claire Weiss | Tel. (212) 278-6570 |
| UBS Securities LLC | |
| Nicholas Galeone | Tel. (212) 713-8832 |
| Siho Ham | Tel. (212) 713-1278 |
| Michael Barbieri | Tel. (212) 713-1181 |
| THE INFORMATION IN THIS STRUCTURAL AND COLLATERAL TERM SHEET IS NOT COMPLETE AND MAY BE AMENDED PRIOR TO THE TIME OF SALE. THIS TERM SHEET IS NOT AN OFFER TO SELL THESE SECURITIES AND IT IS NOT A SOLICITATION OF AN OFFER TO BUY THESE SECURITIES IN ANY JURISDICTION WHERE THE OFFER OR SALE IS NOT PERMITTED. | ||
| 133 | ||