UNITED STATES
SECURITIES AND EXCHANGE COMMISSION Washington, D.C. 20549
FORM N-CSR
CERTIFIED SHAREHOLDER REPORT OF REGISTERED MANAGEMENT INVESTMENT COMPANIES
Investment Company Act file number 811-05822
MFS CHARTER INCOME TRUST
(Exact name of registrant as specified in charter)
111 Huntington Avenue, Boston, Massachusetts 02199 (Address of principal executive offices) (Zip code)
Christopher R. Bohane
Massachusetts Financial Services Company
111 Huntington Avenue
Boston, Massachusetts 02199
(Name and address of agents for service)
Registrant's telephone number, including area code: (617) 954-5000
Date of fiscal year end: November 30
Date of reporting period: November 30, 2022
ITEM 1. REPORTS TO STOCKHOLDERS.
Item 1(a):


| 1 | |
| 2 | |
| 5 | |
| 8 | |
| 11 | |
| 21 | |
| 22 | |
| 23 | |
| 24 | |
| 62 | |
| 64 | |
| 66 | |
| 67 | |
| 68 | |
| 70 | |
| 87 | |
| 89 | |
| 90 | |
| 95 | |
| 99 | |
| 99 | |
| 99 | |
| 99 | |
| 99 | |
| 100 |
| back cover |


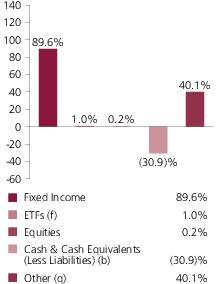
| High Yield Corporates | 62.5% |
| Emerging Markets Bonds | 24.4% |
| Investment Grade Corporates | 9.4% |
| Mortgage-Backed Securities | 2.9% |
| Commercial Mortgage-Backed Securities | 2.0% |
| Collateralized Debt Obligations | 1.9% |
| Municipal Bonds | 0.7% |
| Asset-Backed Securities | 0.6% |
| U.S. Treasury Securities | (5.9)% |
| Non-U.S. Government Bonds | (8.9)% |
| Average Duration (d) | 6.3 |
| Average Effective Maturity (m) | 9.0 yrs. |
| AAA | 6.0% |
| AA | 5.8% |
| A | 7.0% |
| BBB | 13.9% |
| BB | 41.2% |
| B | 26.8% |
| CCC | 8.8% |
| CC (o) | 0.0% |
| C | 0.1% |
| D (o) | 0.0% |
| U.S. Government | 16.5% |
| Federal Agencies | 2.9% |
| Not Rated | (39.4)% |
| Non-Fixed Income | 1.2% |
| Cash & Cash Equivalents (Less Liabilities) (b) | (30.9)% |
| Other (q) | 40.1% |
| (a) | For all securities other than those specifically described below, ratings are assigned to underlying securities utilizing ratings from Moody’s, Fitch, and Standard & Poor’s rating agencies and applying the following hierarchy: If all three agencies provide a rating, the middle rating (after dropping the highest and lowest ratings) is assigned; if two of the three agencies rate a security, the lower of the two is assigned. If none of the 3 rating agencies above assign a rating, but the security is rated by DBRS Morningstar, then the DBRS Morningstar rating is assigned. If none of the 4 rating agencies listed above rate the security, but the security is rated by the Kroll Bond Rating Agency (KBRA), then the KBRA rating is assigned. Ratings are shown in the S&P and Fitch scale (e.g., AAA). Securities rated BBB or higher are considered investment grade. All ratings are subject to change. U.S. Government includes securities issued by the U.S. Department of the Treasury. Federal Agencies includes rated and unrated U.S. Agency fixed-income securities, U.S. Agency mortgage-backed securities, and collateralized mortgage obligations of U.S. Agency mortgage-backed securities. |
| (b) | Cash & Cash Equivalents (Less Liabilities) includes any cash, investments in money market funds, short-term securities, and other assets less liabilities. Liabilities include the value of outstanding borrowings made by the fund for leverage transactions. Cash & Cash Equivalents (Less Liabilities) is negative due to these borrowings. Please see the Statement of Assets and Liabilities for additional information related to the fund’s cash position and other assets and liabilities. Please see Note 6 in the Notes to Financial Statements for more information on the fund's outstanding borrowings. |
| (d) | Duration is a measure of how much a bond’s price is likely to fluctuate with general changes in interest rates, e.g., if rates rise 1.00%, a bond with a 5-year duration is likely to lose about 5.00% of its value due to the interest rate move. The Average Duration calculation reflects the impact of the equivalent exposure of derivative positions, if any. |
| (f) | The fund invests a portion of its assets in Exchange-Traded Funds (ETFs) to gain fixed income exposure. Percentages include the direct exposure from investing in ETFs and not the indirect exposure to the underlying holdings. |
| (i) | For purposes of this presentation, the components include the value of securities, and reflect the impact of the equivalent exposure of derivative positions, if any. These amounts may be negative from time to time. Equivalent exposure is a calculated amount that translates the derivative position into a reasonable approximation of the amount of the underlying asset that the portfolio would have to hold at a given point in time to have the same price sensitivity that results from the portfolio’s ownership of the derivative contract. When dealing with derivatives, equivalent exposure is a more representative measure of the potential impact of a position on portfolio performance than value. The bond component will include any accrued interest amounts. |
| (m) | In determining each instrument’s effective maturity for purposes of calculating the fund’s dollar-weighted average effective maturity, MFS uses the instrument’s stated maturity or, if applicable, an earlier date on which MFS believes it is probable that a maturity-shortening device (such as a put, pre-refunding or prepayment) will cause the instrument to be repaid. Such an earlier date can be substantially shorter than the instrument’s stated maturity. |
| (o) | Less than 0.1%. |
| (p) | For purposes of the presentation of Portfolio structure at value, Other includes equivalent exposure from currency derivatives and may be negative. |
| (q) | For purposes of this presentation, Other includes equivalent exposure from currency derivatives and/or any offsets to derivative positions and may be negative. |
| (v) | For purposes of this presentation, market value of fixed income and/or equity derivatives, if any, is included in Cash & Cash Equivalents. |
Robert Spector, Ward Brown, Philipp Burgener, David Cole, Pilar Gomez-Bravo, Andy Li, Henry Peabody, Matt Ryan, Michael Skatrud, and Erik Weisman
| (r) | Securities rated ”BBB“, ”Baa“, or higher are considered investment grade; securities rated ”BB“, ”Ba“, or below are considered non-investment grade. Ratings are assigned to underlying securities utilizing ratings from Moody's, Fitch, and Standard & Poor's and applying the following hierarchy: If all three agencies provide a rating, the middle rating (after dropping the highest and lowest ratings) is assigned; if two of the three agencies rate a security, the lower of the two is assigned. If none of the 3 rating agencies above assign a rating, but the security is rated by DBRS Morningstar, then the DBRS Morningstar rating is assigned. If none |
| (y) | A yield curve graphically depicts the yields of different maturity bonds of the same credit quality and type; a normal yield curve is upward sloping, with short-term rates lower than long-term rates. |
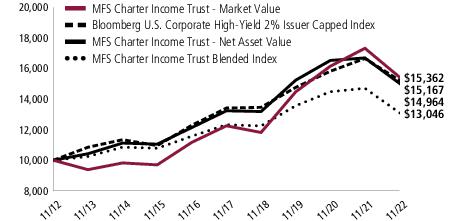
| Inception Date | 1-yr | 5-yr | 10-yr | |
| Market Value (r) | 7/20/89 | (11.33)% | 4.62% | 4.39% |
| Net Asset Value (r) | 7/20/89 | (10.36)% | 2.48% | 4.11% |
| Bloomberg U.S. Corporate High-Yield 2% Issuer Capped Index (f) | (8.95)% | 2.49% | 4.25% |
| MFS Charter Income Trust Blended Index (f)(w) | (11.31)% | 1.14% | 2.69% |
| Bloomberg U.S. Government/Mortgage Index (f) | (11.99)% | (0.08)% | 0.71% |
| FTSE World Government Bond Non-Dollar Hedged Index (f) | (11.33)% | 0.47% | 2.22% |
| JPMorgan Emerging Markets Bond Index Global (f) | (15.58)% | (0.95)% | 1.40% |
| Bloomberg U.S. Credit Index (f) | (14.96)% | 0.67% | 1.85% |
| (f) | Source: FactSet Research Systems Inc. |
| (r) | Includes reinvestment of all distributions. Market value references New York Stock Exchange Price. |
| (w) | The MFS Charter Income Trust Blended Index (a custom index) was comprised of the following at the beginning and at the end of the reporting period: |
| 11/30/22 | |
| Bloomberg U.S. Corporate High-Yield 2% Issuer Capped Index | 42.0% |
| Bloomberg U.S. Government/Mortgage Index | 20.0% |
| FTSE World Government Bond Non-Dollar Hedged Index | 15.2% |
| JPMorgan Emerging Markets Bond Index Global | 12.8% |
| Bloomberg U.S. Credit Index | 10.0% |
| (a) | Source: Bloomberg Index Services Limited. BLOOMBERG® is a trademark and service mark of Bloomberg Finance L.P. and its affiliates (collectively “Bloomberg”). Bloomberg or Bloomberg's licensors own all proprietary rights in the Bloomberg Indices. Bloomberg neither approves or endorses this material, or guarantees the accuracy or completeness of any information herein, or makes any warranty, express or implied, as to the results to be obtained therefrom and, to the maximum extent allowed by law, neither shall have any liability or responsibility for injury or damages arising in connection therewith. |
| (b) | ©2018 FTSE Fixed Income LLC. All rights reserved. |
| (1) | borrow money except to the extent not prohibited by the 1940 Act and exemptive orders granted under such Act. |
| (2) | underwrite securities issued by other persons, except that all or any portion of the assets of the Fund may be invested in one or more investment companies, to the extent not prohibited by the 1940 Act and exemptive orders granted under such Act, and except insofar as the Fund may technically be deemed an underwriter under the Securities Act of 1933, as amended, in selling a portfolio security. |
| (3) | issue any senior securities except to the extent not prohibited by the 1940 Act and exemptive orders granted under such Act. For purposes of this restriction, collateral arrangements with respect to any type of swap, option, Forward Contracts and Futures Contracts and collateral arrangements with respect to initial and variation margin are not deemed to be the issuance of a senior security. |
| (4) | make loans except to the extent not prohibited by the 1940 Act and exemptive orders granted under such Act. |
| (5) | purchase or sell real estate (excluding securities secured by real estate or interests therein and securities of companies, such as real estate investment trusts, which deal in real estate or interests therein), interests in oil, gas or mineral leases, commodities or commodity contacts (excluding currencies and any type of option, Futures Contracts and Forward Contracts) in the ordinary course of its business. The Fund reserves the freedom of action to hold and to sell real estate, mineral leases, commodities or commodity contracts (including currencies and any type of option, Futures Contracts and Forward Contracts) acquired as a result of the ownership of securities. |
| (6) | purchase any securities of an issuer in a particular industry if as a result 25% or more of its total assets (taken at market value at the time of purchase) would be invested in securities of issuers whose principal business activities are in the same industry, except that the Fund may invest up to 40% of the value of its assets in each of the electric utility and telephone industries. |
| Line of Credit Borrowings as a Percentage of Total Assets (Including Assets Attributable to Leverage) | 24.96% | ||||
| Estimated Annual Effective Rate of Interest Expense on Line of Credit Borrowings | 4.69% | ||||
| Annual Return Fund Portfolio Must Experience (net of expenses) to Cover Estimated Annual Effective Interest Expense on Line of Credit Borrowings | 1.17% | ||||
| Assumed Return on Portfolio (Net of Expenses) | -10.00% | -5.00% | 0.00% | 5.00% | 10.00% |
| Corresponding Return to Shareholder | -14.89% | -8.22% | -1.56% | 5.10% | 11.77% |
| Portfolio Manager | Primary Role | Since | Title and Five Year History |
| Robert Spector | Lead and Debt Instruments Portfolio Manager | 2015 | Investment Officer of MFS; employed in the investment management area of MFS since 2011. |
| Ward Brown | Emerging Markets Debt Instruments Portfolio Manager | 2012 | Investment Officer of MFS; employed in the investment management area of MFS since 2005. |
| Philipp Burgener | Structured Securities Portfolio Manager | 2019 | Investment Officer of MFS; employed in the investment management area of MFS since 2003. |
| David Cole | Below Investment Grade Debt Instruments Portfolio Manager | 2006 | Investment Officer of MFS; employed in the investment management area of MFS since 2004. |
| Pilar Gomez-Bravo | Debt Instruments Portfolio Manager | 2013 | Investment Officer of MFS; employed in the investment management area of MFS since 2013. |
| Andy Li | Investment Grade Debt Instruments Portfolio Manager | 2019 | Investment Officer of MFS; employed in the investment management area of MFS since 2018; Portfolio Manager of Man GLG from 2014 to 2018. |
| Henry Peabody | Investment Grade Debt Instruments Portfolio Manager | 2019 | Investment Officer of MFS; employed in the investment management area of MFS since 2019; Portfolio Manager and Analyst at Eaton Vance Management from 2014 to 2019. |
| Matt Ryan | Emerging Markets Debt Instruments Portfolio Manager | 2004 | Investment Officer of MFS; employed in the investment management area of MFS since 1997. |
| Michael Skatrud | Below Investment Grade Debt Instruments Portfolio Manager | 2018 | Investment Officer of MFS; employed in the investment management area of MFS since 2013. |
| Erik Weisman | Sovereign Debt Instruments Portfolio Manager | 2012 | Investment Officer of MFS; employed in the investment management area of MFS since 2002. |
| Issuer | Shares/Par | Value ($) | ||
| Bonds – 129.7% | ||||
| Aerospace & Defense – 1.6% | ||||
| Boeing Co., 5.805%, 5/01/2050 | $ | 151,000 | $142,462 | |
| Bombardier, Inc., 7.5%, 3/15/2025 (n) | 301,000 | 301,451 | ||
| Bombardier, Inc., 7.125%, 6/15/2026 (n) | 427,000 | 419,523 | ||
| F-Brasile S.p.A./F-Brasile U.S. LLC, 7.375%, 8/15/2026 (n) | 725,000 | 589,062 | ||
| Moog, Inc., 4.25%, 12/15/2027 (n) | 885,000 | 794,287 | ||
| Raytheon Technologies Corp., 2.82%, 9/01/2051 | 166,000 | 113,810 | ||
| TransDigm, Inc., 6.25%, 3/15/2026 (n) | 275,000 | 273,664 | ||
| TransDigm, Inc., 6.375%, 6/15/2026 | 535,000 | 525,440 | ||
| TransDigm, Inc., 5.5%, 11/15/2027 | 1,235,000 | 1,163,987 | ||
| TransDigm, Inc., 4.625%, 1/15/2029 | 510,000 | 448,734 | ||
| $4,772,420 | ||||
| Airlines – 0.0% | ||||
| EasyJet Finco B.V., 1.875%, 3/03/2028 | EUR | 140,000 | $122,437 | |
| Alcoholic Beverages – 0.0% | ||||
| Pernod Ricard S.A., 3.75%, 11/02/2032 | EUR | 100,000 | $107,467 | |
| Apparel Manufacturers – 0.0% | ||||
| Tapestry, Inc., 3.05%, 3/15/2032 | $ | 157,000 | $121,485 | |
| Asset-Backed & Securitized – 4.4% | ||||
| 3650R Commercial Mortgage Trust, 2021-PF1, “XA”, 1.142%, 11/15/2054 (i) | $ | 3,789,104 | $225,914 | |
| AA Bond Co. Ltd., 3.25%, 7/31/2028 | GBP | 100,000 | 90,871 | |
| ACREC 2021-FL1 Ltd., “C”, FLR, 6.061% (LIBOR - 1mo. + 2.15%), 10/16/2036 (n) | $ | 229,500 | 215,007 | |
| ACRES 2021-FL2 Issuer Ltd., “AS”, FLR, 5.66% (LIBOR - 1mo. + 1.75%), 1/15/2037 (n) | 154,500 | 145,569 | ||
| ACRES 2021-FL2 Issuer Ltd., “B”, FLR, 6.161% (LIBOR - 1mo. + 2.25%), 1/15/2037 (n) | 261,500 | 247,455 | ||
| Allegro CLO Ltd., 2016-1A, “BR2”, FLR, 5.629% (LIBOR - 3mo. + 1.55%), 1/15/2030 (n) | 250,000 | 242,516 | ||
| Arbor Realty Trust, Inc., CLO, 2020-FL1, “C”, FLR, 5.958% (LIBOR - 1mo. + 2.05%), 2/15/2035 (n) | 300,000 | 286,296 | ||
| Arbor Realty Trust, Inc., CLO, 2021-FL1, “C”, FLR, 5.879% (LIBOR - 1mo. + 2%), 12/15/2035 (n) | 200,000 | 186,247 | ||
| Arbor Realty Trust, Inc., CLO, 2021-FL2, “B”, FLR, 5.475% (LIBOR - 1mo. + 1.6%), 5/15/2036 (n) | 100,000 | 93,535 | ||
| Arbor Realty Trust, Inc., CLO, 2021-FL2, “C”, FLR, 5.825% (LIBOR - 1mo. + 1.95%), 5/15/2036 (n) | 275,500 | 255,140 | ||
| Issuer | Shares/Par | Value ($) | ||
| Bonds – continued | ||||
| Asset-Backed & Securitized – continued | ||||
| Arbor Realty Trust, Inc., CLO, 2022-FL1, “C”, FLR, 5.518% (SOFR - 30 day + 2.3%), 1/15/2037 (n) | $ | 327,000 | $314,135 | |
| Arbor Realty Trust, Inc., CLO, 2022-FL1, “D”, FLR, 6.217% (SOFR - 30 day + 3%), 1/15/2037 (n) | 208,000 | 190,710 | ||
| AREIT 2022-CRE6 Trust, “C”, FLR, 5.542% (SOFR - 30 day + 2.15%), 1/16/2037 (n) | 100,000 | 92,777 | ||
| AREIT 2022-CRE6 Trust, “D”, FLR, 6.242% (SOFR - 30 day + 2.85%), 12/17/2024 (n) | 100,000 | 92,200 | ||
| Bayview Financial Revolving Mortgage Loan Trust, FLR, 5.629% (LIBOR - 1mo. + 1.6%), 12/28/2040 (n) | 130,711 | 158,991 | ||
| BBCMS Mortgage Trust, 2020-C7, “XA”, 1.736%, 4/15/2053 (i) | 1,981,939 | 146,133 | ||
| BBCMS Mortgage Trust, 2021-C10, “XA”, 1.422%, 7/15/2054 (i) | 992,301 | 73,006 | ||
| BBCMS Mortgage Trust, 2021-C9, “XA”, 1.751%, 2/15/2054 (i) | 2,280,686 | 209,758 | ||
| BBCMS Mortgage Trust, 2022-C18, “AS”, 6.148%, 12/15/2055 (w) | 118,289 | 124,356 | ||
| Benchmark 2020-B18 Mortgage Trust, “XA”, 1.79%, 7/15/2053 (i) | 3,382,974 | 270,552 | ||
| Benchmark 2021-B23 Mortgage Trust, “XA”, 1.379%, 2/15/2054 (i) | 3,620,101 | 248,248 | ||
| Benchmark 2021-B24 Mortgage Trust, “XA”, 1.15%, 3/15/2054 (i) | 1,995,239 | 123,608 | ||
| Benchmark 2021-B26 Mortgage Trust, “XA”, 0.998%, 6/15/2054 (i) | 5,527,378 | 275,796 | ||
| Benchmark 2021-B27 Mortgage Trust, “XA”, 1.383%, 7/15/2054 (i) | 6,958,584 | 498,387 | ||
| Benchmark 2021-B28 Mortgage Trust, “XA”, 1.396%, 8/15/2054 (i) | 2,340,836 | 167,638 | ||
| Benchmark 2022-B36 Mortgage Trust, “XA”, 0.809%, 7/15/2055 (i) | 8,926,377 | 441,244 | ||
| Benchmark 2022-B37 Mortgage Trust, “AS”, 5.943%, 11/15/2055 | 46,000 | 46,198 | ||
| BSPRT 2021-FL7 Issuer Ltd., “B”, FLR, 5.925% (LIBOR - 1mo. + 2.05%), 12/15/2038 (n) | 100,000 | 92,678 | ||
| BSPRT 2021-FL7 Issuer Ltd., “C”, FLR, 6.175% (LIBOR - 1mo. + 2.3%), 12/15/2038 (n) | 100,000 | 91,922 | ||
| Business Jet Securities LLC, 2020-1A, “A”, 2.981%, 11/15/2035 (n) | 229,481 | 207,987 | ||
| Business Jet Securities LLC, 2021-1A, “A”, 2.162%, 4/15/2036 (n) | 86,884 | 75,626 | ||
| Issuer | Shares/Par | Value ($) | ||
| Bonds – continued | ||||
| Asset-Backed & Securitized – continued | ||||
| Business Jet Securities LLC, 2021-1A, “B”, 2.918%, 4/15/2036 (n) | $ | 75,501 | $61,316 | |
| BXMT 2021-FL4 Ltd., “B”, FLR, 5.425% (LIBOR - 1mo. + 1.55%), 5/15/2038 (n) | 549,000 | 512,970 | ||
| Capital Automotive, 2020-1A, “A4”, REIT, 3.19%, 2/15/2050 (n) | 144,389 | 134,986 | ||
| Capital Automotive, 2020-1A, “B1”, REIT, 4.17%, 2/15/2050 (n) | 437,500 | 398,753 | ||
| CarMax Auto Owner Trust, 2022-2, “A4”, 3.62%, 9/15/2027 | 155,000 | 148,596 | ||
| CF Hippolyta Issuer LLC, 2020-1, “A1”, 1.69%, 7/15/2060 (n) | 91,436 | 80,932 | ||
| CF Hippolyta Issuer LLC, 2020-1, “B1”, 2.28%, 7/15/2060 (n) | 91,436 | 79,793 | ||
| Commercial Mortgage Pass-Through Certificates, 2021-BN32, “XA”, 0.78%, 4/15/2054 (i) | 1,577,616 | 69,593 | ||
| Commercial Mortgage Pass-Through Certificates, 2021-BN34, “XA”, 0.98%, 6/15/2063 (i) | 998,253 | 56,760 | ||
| Commercial Mortgage Pass-Through Certificates, 2021-BN35, “XA”, 1.152%, 6/15/2064 (i) | 1,303,287 | 78,062 | ||
| Commercial Mortgage Pass-Through Certificates, 2022-BNK41, “AS”, 3.916%, 4/15/2065 | 257,000 | 218,950 | ||
| Crest Ltd., CDO, 7%, (0.001% cash or 7% PIK) 1/28/2040 (a)(p) | 4,324,931 | 43 | ||
| Fortress CBO Investments Ltd., 2022-FL3, “AS”, FLR, 5.745% (SOFR - 30 day + 2.25%), 2/23/2039 (n) | 114,000 | 108,905 | ||
| FS Rialto 2021-FL2 Issuer Ltd., “AS”, FLR, 5.436% (LIBOR - 1mo. + 1.6%), 5/16/2038 (n) | 297,500 | 282,990 | ||
| HarbourView CLO VII Ltd., 7RA, “B”, FLR, 5.894% (LIBOR - 3mo. + 1.7%), 7/18/2031 (n) | 440,000 | 412,994 | ||
| LoanCore 2021-CRE5 Ltd., “AS”, FLR, 5.625% (LIBOR - 1mo. + 1.75%), 7/15/2036 (n) | 375,000 | 347,704 | ||
| LoanCore 2021-CRE5 Ltd., “B”, FLR, 5.875% (LIBOR - 1mo. + 2%), 7/15/2036 (n) | 258,000 | 238,369 | ||
| MF1 2020-FL4 Ltd., “AS”, FLR, 6.078% (LIBOR - 1mo. + 2.1%), 11/15/2035 (n) | 154,000 | 147,636 | ||
| MF1 2021-FL5 Ltd., “B”, FLR, 5.428% (LIBOR - 1mo. + 1.45%), 7/15/2036 (n) | 423,500 | 400,258 | ||
| MF1 2021-FL5 Ltd., “C”, FLR, 5.678% (LIBOR - 1mo. + 1.7%), 7/15/2036 (n) | 213,000 | 198,036 | ||
| MF1 2021-FL5 Ltd., “D”, FLR, 6.478% (LIBOR - 1mo. + 2.5%), 7/15/2036 (n) | 755,000 | 703,896 | ||
| Issuer | Shares/Par | Value ($) | ||
| Bonds – continued | ||||
| Asset-Backed & Securitized – continued | ||||
| MF1 2021-FL6 Ltd., “B”, FLR, 5.56% (LIBOR - 1mo. + 1.65%), 7/16/2036 (n) | $ | 450,000 | $423,538 | |
| MF1 2022-FL8 Ltd., “C”, FLR, 5.617% (SOFR - 30 day + 2.2%), 2/19/2037 (n) | 110,841 | 104,152 | ||
| Morgan Stanley Capital I Trust, 2021-L5, “XA”, 1.419%, 5/15/2054 (i) | 1,032,272 | 72,441 | ||
| Morgan Stanley Capital I Trust, 2021-L6, “XA”, 1.345%, 6/15/2054 (i) | 3,116,012 | 200,764 | ||
| Navistar Financial Dealer Note Master Owner Trust, 2022-1, “A”, FLR, 4.642% (SOFR - 30 day + 1.25%), 5/25/2027 (n) | 103,000 | 103,135 | ||
| PFP III 2021-7 Ltd., “B”, FLR, 5.303% (LIBOR - 1mo. + 1.4%), 4/14/2038 (n) | 212,489 | 198,023 | ||
| PFP III 2021-7 Ltd., “C”, FLR, 5.554% (LIBOR - 1mo. + 1.65%), 4/14/2038 (n) | 199,990 | 185,172 | ||
| PFP III 2021-8 Ltd., “B”, FLR, 5.403% (LIBOR - 1mo. + 1.5%), 8/09/2037 (n) | 105,000 | 94,360 | ||
| RAC Bond Co. PLC, 4.87%, 5/06/2026 | GBP | 100,000 | 109,819 | |
| Securitized Term Auto Receivable Trust, 2019-CRTA, “C”, 2.849%, 3/25/2026 (n) | $ | 74,210 | 73,712 | |
| Shelter Growth CRE 2021-FL3 Ltd., “C”, FLR, 6.025% (LIBOR - 1mo. + 2.15%), 9/15/2036 (n) | 157,500 | 147,632 | ||
| Starwood Commercial Mortgage, 2021-FL2, “B”, FLR, 5.711% (LIBOR - 1mo. + 1.8%), 4/18/2038 (n) | 190,000 | 181,689 | ||
| Starwood Commercial Mortgage, 2021-FL2, “C”, FLR, 6.01% (LIBOR - 1mo. + 2.1%), 4/18/2038 (n) | 100,000 | 92,554 | ||
| TPG Real Estate Finance, 2021-FL4, “AS”, FLR, 5.31% (LIBOR - 1mo. + 1.4%), 3/15/2038 (n) | 150,000 | 142,517 | ||
| TPG Real Estate Finance, 2021-FL4, “B”, FLR, 5.76% (LIBOR - 1mo. + 1.85%), 3/15/2038 (n) | 310,000 | 292,993 | ||
| Wells Fargo Commercial Mortgage Trust, 2021-C60, “XA”, 1.672%, 8/15/2054 (i) | 1,984,971 | 177,948 | ||
| $13,212,491 | ||||
| Automotive – 2.0% | ||||
| Clarios Global LP/Clarios U.S. Finance Co., 8.5%, 5/15/2027 (n) | $ | 1,115,000 | $1,091,147 | |
| Dana, Inc., 5.375%, 11/15/2027 | 544,000 | 498,478 | ||
| Dana, Inc., 4.25%, 9/01/2030 | 315,000 | 252,006 | ||
| Dornoch Debt Merger Sub, Inc., 6.625%, 10/15/2029 (n) | 704,000 | 468,489 | ||
| Ford Motor Co., 5.113%, 5/03/2029 | 885,000 | 825,077 | ||
| Ford Motor Credit Co. LLC, 4.134%, 8/04/2025 | 1,370,000 | 1,296,362 | ||
| Hyundai Capital America, 6.375%, 4/08/2030 (n) | 177,000 | 180,773 | ||
| Mercedes-Benz Financial Services (Canada), 3%, 2/23/2027 | EUR | 60,000 | 62,258 | |
| Issuer | Shares/Par | Value ($) | ||
| Bonds – continued | ||||
| Automotive – continued | ||||
| RAC Bond Co. PLC, 5.25%, 11/04/2027 (n) | GBP | 250,000 | $232,851 | |
| Real Hero Merger Sub 2, Inc., 6.25%, 2/01/2029 (n) | $ | 560,000 | 386,400 | |
| Stellantis N.V., 2.75%, 4/01/2032 | EUR | 100,000 | 91,567 | |
| TI Automotive Finance PLC, 3.75%, 4/15/2029 (n) | 380,000 | 305,468 | ||
| Volkswagen International Finance N.V., 4.375% to 3/28/2031, FLR (EUR Swap Rate - 9yr. + 3.36%) to 3/28/2032, FLR (EUR Swap Rate - 9yr. + 3.61%) to 3/28/2051, FLR (EUR Swap Rate - 9yr. + 4.11%) to 3/28/2168 | 100,000 | 86,878 | ||
| Wheel Pros, Inc., 6.5%, 5/15/2029 (n) | $ | 318,000 | 117,029 | |
| $5,894,783 | ||||
| Broadcasting – 2.1% | ||||
| Advantage Sales & Marketing, Inc., 6.5%, 11/15/2028 (n) | $ | 587,000 | $459,515 | |
| Discovery, Inc., 4.125%, 5/15/2029 | 78,000 | 68,669 | ||
| Gray Escrow II, Inc., 5.375%, 11/15/2031 (n) | 1,161,000 | 885,808 | ||
| iHeartCommunications, Inc., 8.375%, 5/01/2027 | 781,000 | 695,090 | ||
| Prosus N.V., 1.539%, 8/03/2028 | EUR | 150,000 | 122,612 | |
| Prosus N.V., 2.085%, 1/19/2030 | 100,000 | 78,436 | ||
| Prosus N.V., 3.061%, 7/13/2031 (n) | $ | 329,000 | 245,603 | |
| Prosus N.V., 2.031%, 8/03/2032 | EUR | 100,000 | 71,283 | |
| Scripps Escrow II, Inc., 5.875%, 7/15/2027 (n) | $ | 790,000 | 703,100 | |
| Summer (BC) Bidco B LLC, 5.5%, 10/31/2026 (n) | 740,000 | 595,700 | ||
| Summer (BC) Holdco S.à r.l., “A”, 9.25%, 10/31/2027 | EUR | 423,495 | 341,569 | |
| Ubisoft Entertainment S.A., 0.878%, 11/24/2027 | 100,000 | 79,406 | ||
| Univision Communications, Inc., 4.5%, 5/01/2029 (n) | $ | 508,000 | 432,435 | |
| Warnermedia Holdings, Inc., 4.279%, 3/15/2032 (n) | 200,000 | 169,800 | ||
| WMG Acquisition Corp., 3.875%, 7/15/2030 (n) | 1,129,000 | 978,470 | ||
| WMG Acquisition Corp., 2.25%, 8/31/2031 (n) | EUR | 242,000 | 194,283 | |
| WMG Acquisition Corp., 2.25%, 8/31/2031 | 140,000 | 112,395 | ||
| $6,234,174 | ||||
| Brokerage & Asset Managers – 1.6% | ||||
| AG TTMT Escrow Issuer LLC, 8.625%, 9/30/2027 (n) | $ | 686,000 | $693,059 | |
| Ameriprise Financial, Inc., 4.5%, 5/13/2032 | 59,000 | 57,731 | ||
| Aretec Escrow Issuer, Inc., 7.5%, 4/01/2029 (n) | 650,000 | 527,058 | ||
| Banco BTG Pactual S.A. (Cayman Islands Branch), 4.5%, 1/10/2025 (n) | 906,000 | 875,196 | ||
| LPL Holdings, Inc., 4.625%, 11/15/2027 (n) | 860,000 | 794,476 | ||
| LPL Holdings, Inc., 4%, 3/15/2029 (n) | 559,000 | 487,635 | ||
| LPL Holdings, Inc., 4.375%, 5/15/2031 (n) | 260,000 | 223,526 | ||
| NFP Corp., 4.875%, 8/15/2028 (n) | 540,000 | 467,873 | ||
| Issuer | Shares/Par | Value ($) | ||
| Bonds – continued | ||||
| Brokerage & Asset Managers – continued | ||||
| NFP Corp., 6.875%, 8/15/2028 (n) | $ | 730,000 | $617,456 | |
| $4,744,010 | ||||
| Building – 3.0% | ||||
| ABC Supply Co., Inc., 4%, 1/15/2028 (n) | $ | 1,475,000 | $1,334,890 | |
| Foundation Building Materials LLC, 6%, 3/01/2029 (n) | 593,000 | 442,587 | ||
| GYP Holding III Corp., 4.625%, 5/01/2029 (n) | 1,050,000 | 850,468 | ||
| Holcim Sterling Finance (Netherlands) B.V., 2.25%, 4/04/2034 | GBP | 100,000 | 85,088 | |
| Imerys S.A., 1%, 7/15/2031 | EUR | 100,000 | 73,128 | |
| Interface, Inc., 5.5%, 12/01/2028 (n) | $ | 995,000 | 803,223 | |
| MIWD Holdco II LLC/MIWD Finance Co., 5.5%, 2/01/2030 (n) | 500,000 | 410,000 | ||
| New Enterprise Stone & Lime Co., Inc., 5.25%, 7/15/2028 (n) | 260,000 | 235,300 | ||
| New Enterprise Stone & Lime Co., Inc., 9.75%, 7/15/2028 (n) | 556,000 | 512,454 | ||
| Patrick Industries, Inc., 7.5%, 10/15/2027 (n) | 830,000 | 790,027 | ||
| SRM Escrow Issuer LLC, 6%, 11/01/2028 (n) | 550,000 | 489,500 | ||
| SRS Distribution, Inc., 6.125%, 7/01/2029 (n) | 685,000 | 568,152 | ||
| Standard Industries, Inc., 2.25%, 11/21/2026 | EUR | 225,000 | 196,156 | |
| Standard Industries, Inc., 4.75%, 1/15/2028 (n) | $ | 731,000 | 662,516 | |
| Standard Industries, Inc., 4.375%, 7/15/2030 (n) | 880,000 | 721,600 | ||
| Standard Industries, Inc., 3.375%, 1/15/2031 (n) | 160,000 | 122,662 | ||
| Vulcan Materials Co., 3.5%, 6/01/2030 | 137,000 | 122,052 | ||
| White Cap Buyer LLC, 6.875%, 10/15/2028 (n) | 625,000 | 538,724 | ||
| $8,958,527 | ||||
| Business Services – 1.6% | ||||
| Entegris Escrow Corp., 5.95%, 6/15/2030 (n) | $ | 550,000 | $513,727 | |
| Euronet Worldwide, Inc., 1.375%, 5/22/2026 | EUR | 200,000 | 187,079 | |
| Fiserv, Inc., 4.4%, 7/01/2049 | $ | 95,000 | 78,300 | |
| HealthEquity, Inc., 4.5%, 10/01/2029 (n) | 630,000 | 551,943 | ||
| Iron Mountain, Inc., 4.875%, 9/15/2027 (n) | 520,000 | 488,951 | ||
| Iron Mountain, Inc., 5.25%, 3/15/2028 (n) | 570,000 | 532,950 | ||
| Mastercard, Inc., 3.3%, 3/26/2027 | 212,000 | 204,151 | ||
| Mastercard, Inc., 3.85%, 3/26/2050 | 77,000 | 67,172 | ||
| Switch Ltd., 3.75%, 9/15/2028 (n) | 601,000 | 605,870 | ||
| Tencent Holdings Ltd., 3.8%, 2/11/2025 | 700,000 | 674,595 | ||
| Verscend Escrow Corp., 9.75%, 8/15/2026 (n) | 700,000 | 700,161 | ||
| Visa, Inc., 3.65%, 9/15/2047 | 118,000 | 100,410 | ||
| $4,705,309 | ||||
| Issuer | Shares/Par | Value ($) | ||
| Bonds – continued | ||||
| Cable TV – 5.7% | ||||
| Cable One, Inc., 4%, 11/15/2030 (n) | $ | 679,000 | $547,077 | |
| CCO Holdings LLC/CCO Holdings Capital Corp., 5.125%, 5/01/2027 (n) | 425,000 | 402,258 | ||
| CCO Holdings LLC/CCO Holdings Capital Corp., 4.75%, 3/01/2030 (n) | 1,960,000 | 1,685,057 | ||
| CCO Holdings LLC/CCO Holdings Capital Corp., 4.5%, 8/15/2030 (n) | 1,425,000 | 1,200,562 | ||
| CCO Holdings LLC/CCO Holdings Capital Corp., 4.25%, 2/01/2031 (n) | 820,000 | 665,676 | ||
| CCO Holdings LLC/CCO Holdings Capital Corp., 4.25%, 1/15/2034 (n) | 450,000 | 350,550 | ||
| Charter Communications Operating LLC/Charter Communications Operating Capital Corp., 4.8%, 3/01/2050 | 101,000 | 75,780 | ||
| Comcast Corp., 3.75%, 4/01/2040 | 143,000 | 119,491 | ||
| CSC Holdings LLC, 5.375%, 2/01/2028 (n) | 200,000 | 179,029 | ||
| CSC Holdings LLC, 5.75%, 1/15/2030 (n) | 1,350,000 | 919,350 | ||
| CSC Holdings LLC, 4.125%, 12/01/2030 (n) | 605,000 | 464,338 | ||
| DISH DBS Corp., 7.75%, 7/01/2026 | 470,000 | 393,672 | ||
| DISH DBS Corp., 5.25%, 12/01/2026 (n) | 650,000 | 558,025 | ||
| DISH DBS Corp., 5.125%, 6/01/2029 | 450,000 | 296,460 | ||
| LCPR Senior Secured Financing DAC, 6.75%, 10/15/2027 (n) | 893,000 | 844,715 | ||
| LCPR Senior Secured Financing DAC, 5.125%, 7/15/2029 (n) | 210,000 | 173,573 | ||
| SES S.A., 3.5%, 1/14/2029 | EUR | 100,000 | 96,810 | |
| Sirius XM Holdings, Inc., 3.875%, 9/01/2031 (n) | $ | 815,000 | 666,263 | |
| Sirius XM Radio, Inc., 4%, 7/15/2028 (n) | 642,000 | 567,412 | ||
| Sirius XM Radio, Inc., 5.5%, 7/01/2029 (n) | 1,395,000 | 1,298,884 | ||
| Telenet Finance Luxembourg S.A., 5.5%, 3/01/2028 (n) | 1,400,000 | 1,253,700 | ||
| Videotron Ltd., 5.125%, 4/15/2027 (n) | 473,000 | 452,188 | ||
| Videotron Ltd., 3.625%, 6/15/2029 (n) | 283,000 | 239,066 | ||
| Virgin Media Finance PLC, 3.75%, 7/15/2030 | EUR | 255,000 | 210,637 | |
| Virgin Media Finance PLC, 5%, 7/15/2030 (n) | $ | 1,000,000 | 832,100 | |
| Virgin Media Vendor Financing Notes IV DAC, 5%, 7/15/2028 (n) | 1,200,000 | 1,028,712 | ||
| VTR Comunicaciones S.p.A., 5.125%, 1/15/2028 | 267,000 | 152,190 | ||
| Ziggo Bond Finance B.V., 3.375%, 2/28/2030 | EUR | 370,000 | 294,061 | |
| Ziggo Bond Finance B.V., 5.125%, 2/28/2030 (n) | $ | 1,315,000 | 1,066,820 | |
| $17,034,456 | ||||
| Chemicals – 2.0% | ||||
| Axalta Coating Systems Ltd., 4.75%, 6/15/2027 (n) | $ | 540,000 | $495,108 | |
| Axalta Coating Systems Ltd., 3.375%, 2/15/2029 (n) | 1,340,000 | 1,096,850 | ||
| Consolidated Energy Finance S.A., 5.625%, 10/15/2028 (n) | 700,000 | 611,625 | ||
| Element Solutions, Inc., 3.875%, 9/01/2028 (n) | 925,000 | 790,561 | ||
| Issuer | Shares/Par | Value ($) | ||
| Bonds – continued | ||||
| Chemicals – continued | ||||
| Herens Holdco S.à r.l., 4.75%, 5/15/2028 (n) | $ | 500,000 | $400,000 | |
| Ingevity Corp., 3.875%, 11/01/2028 (n) | 923,000 | 786,858 | ||
| LSF11 A5 HoldCo LLC, 6.625%, 10/15/2029 (n) | 678,000 | 558,204 | ||
| LYB International Finance III, LLC, 4.2%, 5/01/2050 | 139,000 | 104,148 | ||
| S.P.C.M. S.A., 3.375%, 3/15/2030 (n) | 705,000 | 561,356 | ||
| Sasol Financing (USA) LLC, 5.5%, 3/18/2031 | 550,000 | 456,398 | ||
| Sherwin-Williams Co., 3.8%, 8/15/2049 | 38,000 | 28,844 | ||
| $5,889,952 | ||||
| Computer Software – 1.0% | ||||
| Camelot Finance S.A., 4.5%, 11/01/2026 (n) | $ | 410,000 | $388,565 | |
| Clarivate Science Holdings Corp., 3.875%, 7/01/2028 (n) | 200,000 | 179,756 | ||
| Clarivate Science Holdings Corp., 4.875%, 7/01/2029 (n) | 770,000 | 659,313 | ||
| Dun & Bradstreet Corp., 5%, 12/15/2029 (n) | 705,000 | 606,547 | ||
| Microsoft Corp., 3.3%, 2/06/2027 | 145,000 | 140,249 | ||
| Microsoft Corp., 2.525%, 6/01/2050 | 214,000 | 147,379 | ||
| Neptune Bidco U.S., Inc., 9.29%, 4/15/2029 (n) | 467,000 | 449,735 | ||
| PTC, Inc., 3.625%, 2/15/2025 (n) | 305,000 | 290,745 | ||
| $2,862,289 | ||||
| Computer Software - Systems – 1.3% | ||||
| Fair Isaac Corp., 5.25%, 5/15/2026 (n) | $ | 1,330,000 | $1,318,236 | |
| Fair Isaac Corp., 4%, 6/15/2028 (n) | 131,000 | 119,865 | ||
| Sabre GLBL, Inc., 11.25%, 12/15/2027 (n) | 292,000 | 299,300 | ||
| SS&C Technologies Holdings, Inc., 5.5%, 9/30/2027 (n) | 1,055,000 | 1,008,334 | ||
| Viavi Solutions, Inc., 3.75%, 10/01/2029 (n) | 830,000 | 684,750 | ||
| Virtusa Corp., 7.125%, 12/15/2028 (n) | 525,000 | 393,750 | ||
| $3,824,235 | ||||
| Conglomerates – 2.0% | ||||
| BWX Technologies, Inc., 4.125%, 6/30/2028 (n) | $ | 500,000 | $445,000 | |
| BWX Technologies, Inc., 4.125%, 4/15/2029 (n) | 1,265,000 | 1,113,200 | ||
| Gates Global LLC, 6.25%, 1/15/2026 (n) | 805,000 | 776,189 | ||
| Griffon Corp., 5.75%, 3/01/2028 | 751,000 | 698,543 | ||
| Madison IAQ LLC, 5.875%, 6/30/2029 (n) | 882,000 | 652,442 | ||
| Stevens Holding Co., Inc., 6.125%, 10/01/2026 (n) | 520,000 | 524,373 | ||
| TriMas Corp., 4.125%, 4/15/2029 (n) | 1,926,000 | 1,641,915 | ||
| Westinghouse Air Brake Technologies Corp., 4.95%, 9/15/2028 | 207,000 | 198,835 | ||
| $6,050,497 | ||||
| Issuer | Shares/Par | Value ($) | ||
| Bonds – continued | ||||
| Construction – 1.0% | ||||
| Empire Communities Corp., 7%, 12/15/2025 (n) | $ | 545,000 | $479,291 | |
| Mattamy Group Corp., 5.25%, 12/15/2027 (n) | 280,000 | 251,272 | ||
| Mattamy Group Corp., 4.625%, 3/01/2030 (n) | 615,000 | 506,443 | ||
| Meritage Homes Corp., 3.875%, 4/15/2029 (n) | 620,000 | 525,450 | ||
| Taylor Morrison Communities, Inc., 5.75%, 1/15/2028 (n) | 821,000 | 762,783 | ||
| Weekley Homes LLC/Weekley Finance Corp., 4.875%, 9/15/2028 (n) | 543,000 | 440,091 | ||
| $2,965,330 | ||||
| Consumer Products – 1.4% | ||||
| Energizer Gamma Acquisition B.V., 3.5%, 6/30/2029 | EUR | 340,000 | $282,218 | |
| Energizer Holdings, Inc., 4.375%, 3/31/2029 (n) | $ | 472,000 | 401,540 | |
| JAB Holdings B.V., 2.25%, 12/19/2039 | EUR | 100,000 | 74,311 | |
| Mattel, Inc., 3.375%, 4/01/2026 (n) | $ | 572,000 | 525,273 | |
| Mattel, Inc., 5.875%, 12/15/2027 (n) | 304,000 | 297,264 | ||
| Mattel, Inc., 6.2%, 10/01/2040 | 135,000 | 115,536 | ||
| Mattel, Inc., 5.45%, 11/01/2041 | 210,000 | 165,375 | ||
| Newell Brands, Inc., 6.375%, 9/15/2027 | 392,000 | 388,609 | ||
| Newell Brands, Inc., 6.625%, 9/15/2029 | 474,000 | 465,705 | ||
| Prestige Consumer Healthcare, Inc., 5.125%, 1/15/2028 (n) | 630,000 | 593,775 | ||
| Prestige Consumer Healthcare, Inc., 3.75%, 4/01/2031 (n) | 250,000 | 211,230 | ||
| Spectrum Brands, Inc., 3.875%, 3/15/2031 (n) | 295,000 | 220,513 | ||
| SWF Escrow Issuer Corp., 6.5%, 10/01/2029 (n) | 575,000 | 338,531 | ||
| $4,079,880 | ||||
| Consumer Services – 2.9% | ||||
| Allied Universal Holdco LLC, 6.625%, 7/15/2026 (n) | $ | 216,000 | $205,200 | |
| Allied Universal Holdco LLC, 9.75%, 7/15/2027 (n) | 670,000 | 604,608 | ||
| Allied Universal Holdco LLC, 6%, 6/01/2029 (n) | 400,000 | 286,726 | ||
| ANGI Group LLC, 3.875%, 8/15/2028 (n) | 891,000 | 669,364 | ||
| Arches Buyer, Inc., 6.125%, 12/01/2028 (n) | 830,000 | 666,980 | ||
| Booking Holdings, Inc., 4.75%, 11/15/2034 | EUR | 100,000 | 110,699 | |
| GoDaddy, Inc., 3.5%, 3/01/2029 (n) | $ | 1,263,000 | 1,067,334 | |
| GW B-CR Security Corp., 9.5%, 11/01/2027 (n) | 522,000 | 482,899 | ||
| Match Group Holdings II LLC, 5%, 12/15/2027 (n) | 660,000 | 613,320 | ||
| Match Group Holdings II LLC, 4.625%, 6/01/2028 (n) | 910,000 | 813,903 | ||
| Match Group Holdings II LLC, 4.125%, 8/01/2030 (n) | 275,000 | 229,625 | ||
| Match Group Holdings II LLC, 3.625%, 10/01/2031 (n) | 55,000 | 42,029 | ||
| Realogy Group LLC/Realogy Co-Issuer Corp., 5.75%, 1/15/2029 (n) | 570,000 | 436,004 | ||
| Realogy Group LLC/Realogy Co-Issuer Corp., 5.25%, 4/15/2030 (n) | 430,000 | 316,050 | ||
| Toll Road Investors Partnership II LP, Capital Appreciation, NPFG, 0%, 2/15/2043 (n) | 1,968,329 | 481,038 | ||
| Issuer | Shares/Par | Value ($) | ||
| Bonds – continued | ||||
| Consumer Services – continued | ||||
| TriNet Group, Inc., 3.5%, 3/01/2029 (n) | $ | 1,575,000 | $1,309,219 | |
| WASH Multi-Family Acquisition, Inc., 5.75%, 4/15/2026 (n) | 458,000 | 429,293 | ||
| $8,764,291 | ||||
| Containers – 2.3% | ||||
| ARD Finance S.A., 5%, (5% cash or 5.75% PIK) 6/30/2027 (p) | EUR | 235,000 | $171,528 | |
| ARD Finance S.A., 6.5% (6.5% cash or 7.25% PIK), 6/30/2027 (n)(p) | $ | 655,000 | 484,700 | |
| Ardagh Metal Packaging Finance USA LLC, 3.25%, 9/01/2028 (n) | 565,000 | 476,455 | ||
| Ardagh Metal Packaging Finance USA LLC, 3%, 9/01/2029 (n) | EUR | 220,000 | 170,554 | |
| Ardagh Metal Packaging Finance USA LLC, 4%, 9/01/2029 (n) | $ | 646,000 | 516,800 | |
| Ardagh Packaging Finance PLC/Ardagh MP Holdings USA, Inc., 5.25%, 8/15/2027 (n) | 1,080,000 | 816,804 | ||
| Ball Corp., 3.125%, 9/15/2031 | 590,000 | 468,755 | ||
| Can-Pack S.A./Eastern PA Land Investment Holding LLC, 3.125%, 11/01/2025 (n) | 350,000 | 301,000 | ||
| Can-Pack S.A./Eastern PA Land Investment Holding LLC, 3.875%, 11/15/2029 (n) | 1,176,000 | 926,100 | ||
| Crown Americas LLC, 5.25%, 4/01/2030 (n) | 550,000 | 508,750 | ||
| Crown Americas LLC/Crown Americas Capital Corp. V, 4.25%, 9/30/2026 | 920,000 | 879,437 | ||
| Crown Americas LLC/Crown Americas Capital Corp. VI, 4.75%, 2/01/2026 | 490,000 | 474,521 | ||
| Trivium Packaging Finance B.V., 8.5%, 8/15/2027 (n) | 625,000 | 585,140 | ||
| $6,780,544 | ||||
| Electrical Equipment – 0.4% | ||||
| Arrow Electronics, Inc., 2.95%, 2/15/2032 | $ | 182,000 | $145,105 | |
| CommScope Technologies LLC, 5%, 3/15/2027 (n) | 937,000 | 714,762 | ||
| Telefonaktiebolaget LM Ericsson, 1.125%, 2/08/2027 | EUR | 140,000 | 125,796 | |
| Telefonaktiebolaget LM Ericsson, 1%, 5/26/2029 | 140,000 | 110,852 | ||
| $1,096,515 | ||||
| Electronics – 1.2% | ||||
| Broadcom, Inc., 3.419%, 4/15/2033 (n) | $ | 133,000 | $108,067 | |
| Broadcom, Inc., 3.137%, 11/15/2035 (n) | 168,000 | 124,501 | ||
| Broadcom, Inc., 3.187%, 11/15/2036 (n) | 4,000 | 2,913 | ||
| Entegris, Inc., 4.375%, 4/15/2028 (n) | 290,000 | 256,270 | ||
| Entegris, Inc., 3.625%, 5/01/2029 (n) | 480,000 | 398,400 | ||
| Sensata Technologies B.V., 5.625%, 11/01/2024 (n) | 350,000 | 349,244 | ||
| Issuer | Shares/Par | Value ($) | ||
| Bonds – continued | ||||
| Electronics – continued | ||||
| Sensata Technologies B.V., 5%, 10/01/2025 (n) | $ | 1,160,000 | $1,133,494 | |
| Sensata Technologies B.V., 5.875%, 9/01/2030 (n) | 385,000 | 365,609 | ||
| Sensata Technologies, Inc., 4.375%, 2/15/2030 (n) | 410,000 | 363,098 | ||
| Synaptics, Inc., 4%, 6/15/2029 (n) | 710,000 | 591,578 | ||
| $3,693,174 | ||||
| Emerging Market Quasi-Sovereign – 4.5% | ||||
| Banco de Reservas de la Republica Dominicana, 7%, 2/01/2023 | $ | 1,074,000 | $1,071,315 | |
| CEZ A.S. (Czech Republic), 2.375%, 4/06/2027 | EUR | 100,000 | 95,433 | |
| China Construction Bank Corp., Hong Kong Branch, 4.25% to 2/27/2024, FLR (CMT - 5yr. + 1.88%) to 2/27/2029 | $ | 960,000 | 946,313 | |
| Comision Federal de Electricidad (United Mexican States), 3.348%, 2/09/2031 (n) | 202,000 | 155,239 | ||
| Dua Capital Ltd. (Federation of Malaysia), 2.78%, 5/11/2031 | 404,000 | 319,976 | ||
| Emirates NBD Bank PJSC, 6.125% to 7/09/2026, FLR (Swap Rate - 6yr. + 5.702%) to 1/09/2170 | 238,000 | 228,065 | ||
| Empresa Nacional del Petroleo (Republic of Chile), 3.75%, 8/05/2026 | 600,000 | 563,619 | ||
| EQUATE Petrochemical B.V. (State of Kuwait), 4.25%, 11/03/2026 | 1,022,000 | 966,563 | ||
| Eskom Holdings SOC Ltd. (Republic of South Africa), 6.35%, 8/10/2028 | 624,000 | 584,220 | ||
| Export-Import Bank of India, 2.25%, 1/13/2031 (n) | 300,000 | 238,878 | ||
| Indian Railway Finance Corp., 2.8%, 2/10/2031 (n) | 299,000 | 245,816 | ||
| Indian Railway Finance Corp., 2.8%, 2/10/2031 | 800,000 | 657,700 | ||
| Ipoteka Bank (Republic of Uzbekistan), 5.5%, 11/19/2025 | 700,000 | 598,500 | ||
| Korea Development Bank, 4.25%, 9/08/2032 | 531,000 | 510,599 | ||
| MDGH - GMTN RSC Ltd. (United Arab Emirates), 2.875%, 11/07/2029 (n) | 1,086,000 | 969,255 | ||
| NAK Naftogaz Ukraine via Standard Bank London Holdings PLC, 7.625%, 11/08/2026 (a)(n) | 1,116,000 | 200,880 | ||
| Office Cherifien des Phosphates S.A. (Kingdom of Morocco), 3.75%, 6/23/2031 (n) | 200,000 | 163,398 | ||
| Office Cherifien des Phosphates S.A. (Kingdom of Morocco), 5.125%, 6/23/2051 (n) | 650,000 | 469,162 | ||
| Oryx Funding Ltd. (Sultanate of Oman), 5.8%, 2/03/2031 (n) | 200,000 | 188,600 | ||
| Petroleos Mexicanos, 6.49%, 1/23/2027 | 904,000 | 819,024 | ||
| Petroleos Mexicanos, 5.95%, 1/28/2031 | 200,000 | 149,793 | ||
| Petroleos Mexicanos, 6.75%, 9/21/2047 | 980,000 | 622,067 | ||
| Petroleos Mexicanos, 7.69%, 1/23/2050 | 200,000 | 137,632 | ||
| PT Freeport Indonesia, 5.315%, 4/14/2032 (n) | 200,000 | 185,000 | ||
| Issuer | Shares/Par | Value ($) | ||
| Bonds – continued | ||||
| Emerging Market Quasi-Sovereign – continued | ||||
| PT Pertamina (Persero) (Republic of Indonesia), 5.625%, 5/20/2043 | $ | 200,000 | $187,845 | |
| QNB Finance Ltd. (State of Qatar), 2.75%, 2/12/2027 | 554,000 | 501,813 | ||
| Southern Gas Corridor CJSC (Republic of Azerbaijan), 6.875%, 3/24/2026 | 1,265,000 | 1,293,336 | ||
| SPP-Distribucia A.S. (Republic of Slovakia), 1%, 6/09/2031 | EUR | 150,000 | 101,855 | |
| State Oil Company of the Azerbaijan Republic, 6.95%, 3/18/2030 | $ | 500,000 | 505,904 | |
| $13,677,800 | ||||
| Emerging Market Sovereign – 12.0% | ||||
| Arab Republic of Egypt, 7.052%, 1/15/2032 (n) | $ | 320,000 | $237,056 | |
| Arab Republic of Egypt, 8.5%, 1/31/2047 | 1,265,000 | 844,084 | ||
| Dominican Republic, 5.5%, 2/22/2029 (n) | 761,000 | 696,914 | ||
| Dominican Republic, 5.3%, 1/21/2041 (n) | 181,000 | 137,906 | ||
| Dominican Republic, 5.875%, 1/30/2060 (n) | 2,249,000 | 1,667,071 | ||
| Federal Republic of Nigeria, 8.747%, 1/21/2031 (n) | 519,000 | 431,367 | ||
| Federative Republic of Brazil, 3.875%, 6/12/2030 | 500,000 | 435,989 | ||
| Hellenic Republic (Republic of Greece), 0%, 2/12/2026 | EUR | 885,000 | 829,061 | |
| Hellenic Republic (Republic of Greece), 2%, 4/22/2027 (n) | 1,470,000 | 1,452,569 | ||
| Hellenic Republic (Republic of Greece), 1.75%, 6/18/2032 (n) | 2,912,000 | 2,463,029 | ||
| Hellenic Republic (Republic of Greece), 1.875%, 1/24/2052 | 245,000 | 157,460 | ||
| Kingdom of Morocco, 1.375%, 3/30/2026 | 428,000 | 403,522 | ||
| Kingdom of Morocco, 2%, 9/30/2030 | 100,000 | 81,000 | ||
| Kingdom of Morocco, 3%, 12/15/2032 (n) | $ | 459,000 | 363,611 | |
| Oriental Republic of Uruguay, 8.25%, 5/21/2031 | UYU | 49,975,000 | 1,084,388 | |
| People's Republic of China, 3.03%, 3/11/2026 | CNY | 13,370,000 | 1,903,790 | |
| People's Republic of China, 3.13%, 11/21/2029 | 8,280,000 | 1,184,893 | ||
| Republic of Angola, 9.375%, 5/08/2048 | $ | 670,000 | 558,277 | |
| Republic of Argentina, 1.5%, 7/09/2035 | 627,494 | 146,684 | ||
| Republic of Benin, 6.875%, 1/19/2052 (n) | EUR | 214,000 | 161,543 | |
| Republic of Benin, 6.875%, 1/19/2052 | 400,000 | 301,949 | ||
| Republic of Cote d'Ivoire, 5.25%, 3/22/2030 | 929,000 | 813,299 | ||
| Republic of Cote d'Ivoire, 6.875%, 10/17/2040 | 300,000 | 238,043 | ||
| Republic of Croatia, 1.125%, 3/04/2033 | 344,000 | 280,876 | ||
| Republic of Ghana, 8.125%, 3/26/2032 (n) | $ | 305,000 | 107,592 | |
| Republic of Guatemala, 6.125%, 6/01/2050 (n) | 777,000 | 713,350 | ||
| Republic of Guatemala, 6.125%, 6/01/2050 | 300,000 | 275,425 | ||
| Republic of Hungary, 5.5%, 6/16/2034 (n) | 850,000 | 812,430 | ||
| Republic of Indonesia, 4.65%, 9/20/2032 | 796,000 | 781,564 | ||
| Republic of Indonesia, 4.35%, 1/11/2048 | 400,000 | 341,883 | ||
| Republic of Kenya, 8%, 5/22/2032 (n) | 478,000 | 417,198 | ||
| Issuer | Shares/Par | Value ($) | ||
| Bonds – continued | ||||
| Emerging Market Sovereign – continued | ||||
| Republic of Korea, 2.125%, 6/10/2027 | KRW | 970,000,000 | $688,383 | |
| Republic of Korea, 1.875%, 6/10/2029 | 4,549,250,000 | 3,113,073 | ||
| Republic of Korea, 1.375%, 6/10/2030 | 3,343,670,000 | 2,166,976 | ||
| Republic of Paraguay, 5.6%, 3/13/2048 | $ | 200,000 | 170,400 | |
| Republic of Paraguay, 5.4%, 3/30/2050 (n) | 1,150,000 | 966,000 | ||
| Republic of Philippines, 3.556%, 9/29/2032 | 334,000 | 300,957 | ||
| Republic of Poland, 5.75%, 11/16/2032 | 72,000 | 75,917 | ||
| Republic of Romania, 1.75%, 7/13/2030 (n) | EUR | 247,000 | 186,423 | |
| Republic of Romania, 2%, 4/14/2033 | 250,000 | 175,616 | ||
| Republic of Senegal, 6.25%, 5/23/2033 | $ | 247,000 | 206,245 | |
| Republic of Serbia, 2.05%, 9/23/2036 (n) | EUR | 647,000 | 406,024 | |
| Republic of South Africa, 5.875%, 4/20/2032 | $ | 200,000 | 184,725 | |
| Republic of Sri Lanka, 7.55%, 3/28/2030 (a)(n) | 446,000 | 136,832 | ||
| State of Qatar, 4.817%, 3/14/2049 (n) | 683,000 | 662,510 | ||
| Sultanate of Oman, 7%, 1/25/2051 | 800,000 | 746,082 | ||
| United Arab Emirates, 4.951%, 7/07/2052 (n) | 579,000 | 572,650 | ||
| United Mexican States, 7.5%, 6/03/2027 | MXN | 67,100,000 | 3,235,956 | |
| United Mexican States, 4.75%, 4/27/2032 | $ | 727,000 | 697,579 | |
| United Mexican States, 4.875%, 5/19/2033 | 641,000 | 602,054 | ||
| United Mexican States, 3.771%, 5/24/2061 | 774,000 | 521,421 | ||
| $36,139,646 | ||||
| Energy - Independent – 2.6% | ||||
| Antero Resources Corp., 7.625%, 2/01/2029 (n) | $ | 500,000 | $510,171 | |
| CNX Resources Corp., 6%, 1/15/2029 (n) | 572,000 | 540,672 | ||
| CNX Resources Corp., 7.375%, 1/15/2031 (n) | 192,000 | 192,104 | ||
| Colgate Energy Partners III LLC, 7.75%, 2/15/2026 (n) | 110,000 | 109,045 | ||
| Colgate Energy Partners III LLC, 5.875%, 7/01/2029 (n) | 574,000 | 528,080 | ||
| Comstock Resources, Inc., 6.75%, 3/01/2029 (n) | 750,000 | 732,487 | ||
| CrownRock LP/CrownRock Finance, Inc., “F”, 5%, 5/01/2029 (n) | 630,000 | 580,010 | ||
| Encino Acquisition Partners Holdings LLC, 8.5%, 5/01/2028 (n) | 430,000 | 411,480 | ||
| Energean Israel Finance Ltd., 5.875%, 3/30/2031 | 500,000 | 443,750 | ||
| Leviathan Bond Ltd., 6.125%, 6/30/2025 (n) | 679,000 | 666,271 | ||
| Medco Bell Pte. Ltd., 6.375%, 1/30/2027 (n) | 492,000 | 437,038 | ||
| Moss Creek Resources Holdings, Inc., 7.5%, 1/15/2026 (n) | 400,000 | 372,160 | ||
| SM Energy Co., 6.5%, 7/15/2028 | 410,000 | 400,943 | ||
| Southwestern Energy Co., 5.7%, 1/23/2025 | 44,200 | 43,758 | ||
| Southwestern Energy Co., 8.375%, 9/15/2028 | 305,000 | 316,722 | ||
| Southwestern Energy Co., 5.375%, 3/15/2030 | 630,000 | 592,326 | ||
| Tengizchevroil Finance Co. International Ltd., 4%, 8/15/2026 | 987,000 | 838,950 | ||
| Issuer | Shares/Par | Value ($) | ||
| Bonds – continued | ||||
| Energy - Independent – continued | ||||
| Tengizchevroil Finance Co. International Ltd., 3.25%, 8/15/2030 (n) | $ | 323,000 | $226,100 | |
| $7,942,067 | ||||
| Energy - Integrated – 0.2% | ||||
| BP Capital Markets PLC, 3.625% to 6/22/2029, FLR (EUR Swap Rate - 5yr. + 4.12%) to 6/22/2034, FLR (EUR Swap Rate - 5yr. + 4.37%) to 6/22/2049, FLR (EUR Swap Rate - 5yr. + 5.12%) to 6/22/2170 | EUR | 400,000 | $357,612 | |
| Eni S.p.A., 4.25%, 5/09/2029 (n) | $ | 200,000 | 185,609 | |
| Galp Energia SGPS S.A., 2%, 1/15/2026 | EUR | 100,000 | 96,697 | |
| MOL PLC, 1.5%, 10/08/2027 | 110,000 | 94,572 | ||
| $734,490 | ||||
| Engineering - Construction – 0.0% | ||||
| Bouygues S.A., 4.625%, 6/07/2032 | EUR | 100,000 | $110,336 | |
| Entertainment – 1.5% | ||||
| Carnival Corp. PLC, 7.625%, 3/01/2026 (n) | $ | 1,244,000 | $1,048,070 | |
| Carnival Corp. PLC, 5.75%, 3/01/2027 (n) | 530,000 | 394,100 | ||
| Life Time, Inc., 5.75%, 1/15/2026 (n) | 565,000 | 543,287 | ||
| Life Time, Inc., 8%, 4/15/2026 (n) | 170,000 | 153,518 | ||
| Motion Bondco DAC, 6.625%, 11/15/2027 (n) | 630,000 | 542,183 | ||
| NCL Corp. Ltd., 5.875%, 3/15/2026 (n) | 539,000 | 442,132 | ||
| Royal Caribbean Cruises Ltd., 5.375%, 7/15/2027 (n) | 340,000 | 281,724 | ||
| Royal Caribbean Cruises Ltd., 5.5%, 4/01/2028 (n) | 690,000 | 563,213 | ||
| SeaWorld Parks & Entertainment, 5.25%, 8/15/2029 (n) | 495,000 | 426,566 | ||
| $4,394,793 | ||||
| Financial Institutions – 2.5% | ||||
| AerCap Ireland Capital DAC/AerCap Global Aviation Trust, 3.3%, 1/30/2032 | $ | 150,000 | $119,545 | |
| AerCap Ireland Capital DAC/AerCap Global Aviation Trust, 3.85%, 10/29/2041 | 150,000 | 110,034 | ||
| Avation Capital S.A., 8.25% (8.25% cash or 9% PIK), 10/31/2026 (n)(p) | 360,050 | 288,040 | ||
| Avolon Holdings Funding Ltd., 3.95%, 7/01/2024 (n) | 77,000 | 73,331 | ||
| Avolon Holdings Funding Ltd., 4.375%, 5/01/2026 (n) | 134,000 | 121,807 | ||
| Credit Acceptance Corp., 5.125%, 12/31/2024 (n) | 640,000 | 602,297 | ||
| Crédit Logement S.A., 1.081%, 2/15/2034 | EUR | 100,000 | 84,112 | |
| CTP N.V., 1.5%, 9/27/2031 | 100,000 | 62,506 | ||
| EXOR N.V., 2.25%, 4/29/2030 | 100,000 | 90,858 | ||
| Global Aircraft Leasing Co. Ltd., 6.5% (6.5% cash or 7.25% PIK), 9/15/2024 (n)(p) | $ | 2,167,693 | 1,809,947 | |
| Issuer | Shares/Par | Value ($) | ||
| Bonds – continued | ||||
| Financial Institutions – continued | ||||
| Grand City Properties S.A., 1.5% to 6/9/2026, FLR (EUR Swap Rate - 5yr. + 2.184%) to 6/9/2031, FLR (EUR Swap Rate - 5yr. + 2.434%) to 6/9/2046, FLR (EUR Swap Rate - 5yr. + 3.184%) to 12/09/2069 | EUR | 100,000 | $45,795 | |
| Howard Hughes Corp., 4.125%, 2/01/2029 (n) | $ | 939,000 | 774,328 | |
| Logicor Financing S.à r.l., 1.625%, 1/17/2030 | EUR | 110,000 | 87,038 | |
| Logicor Financing S.à r.l., 0.875%, 1/14/2031 | 100,000 | 71,987 | ||
| Nationstar Mortgage Holdings, Inc., 6%, 1/15/2027 (n) | $ | 1,180,000 | 1,072,750 | |
| OneMain Finance Corp., 6.875%, 3/15/2025 | 430,000 | 417,657 | ||
| OneMain Finance Corp., 7.125%, 3/15/2026 | 580,000 | 561,901 | ||
| P3 Group S.à r.l., 0.875%, 1/26/2026 | EUR | 130,000 | 111,686 | |
| Rocket Mortgage Co-Issuer, Inc., 3.625%, 3/01/2029 (n) | $ | 880,000 | 708,400 | |
| Samhallsbyggnadsbolaget i Norden AB, 1.75%, 1/14/2025 | EUR | 100,000 | 87,132 | |
| Samhallsbyggnadsbolaget i Norden AB, 2.875%, 1/30/2171 | 280,000 | 114,420 | ||
| SBB Treasury Oyj, 1.125%, 11/26/2029 | 100,000 | 62,734 | ||
| SLM Corp., 3.125%, 11/02/2026 | $ | 35,000 | 30,100 | |
| VGP N.V., 1.5%, 4/08/2029 | EUR | 100,000 | 69,245 | |
| Vonovia SE, REIT, 1.625%, 9/01/2051 | 100,000 | 58,025 | ||
| $7,635,675 | ||||
| Food & Beverages – 2.7% | ||||
| Anheuser-Busch InBev Worldwide, Inc., 4.375%, 4/15/2038 | $ | 189,000 | $173,043 | |
| Anheuser-Busch InBev Worldwide, Inc., 5.55%, 1/23/2049 | 60,000 | 61,430 | ||
| B&G Foods, Inc., 5.25%, 4/01/2025 | 470,000 | 414,686 | ||
| BellRing Brands, Inc., 7%, 3/15/2030 (n) | 870,000 | 840,498 | ||
| Central America Bottling Co., 5.25%, 4/27/2029 (n) | 755,000 | 680,678 | ||
| Constellation Brands, Inc., 4.75%, 12/01/2025 | 44,000 | 44,028 | ||
| Constellation Brands, Inc., 3.15%, 8/01/2029 | 72,000 | 63,823 | ||
| Constellation Brands, Inc., 2.25%, 8/01/2031 | 104,000 | 83,218 | ||
| JBS USA Lux S.A./JBS USA Food Co./JBS USA Finance, Inc., 3.625%, 1/15/2032 (n) | 781,000 | 644,325 | ||
| Kraft Heinz Foods Co., 3.875%, 5/15/2027 | 137,000 | 132,117 | ||
| Lamb Weston Holdings, Inc., 4.125%, 1/31/2030 (n) | 1,080,000 | 955,130 | ||
| Performance Food Group Co., 5.5%, 10/15/2027 (n) | 850,000 | 820,250 | ||
| Post Holdings, Inc., 5.625%, 1/15/2028 (n) | 788,000 | 751,776 | ||
| Post Holdings, Inc., 4.625%, 4/15/2030 (n) | 1,000,000 | 877,350 | ||
| Primo Water Holding, Inc., 4.375%, 4/30/2029 (n) | 912,000 | 788,114 | ||
| U.S. Foods Holding Corp., 4.75%, 2/15/2029 (n) | 855,000 | 761,908 | ||
| $8,092,374 | ||||
| Gaming & Lodging – 4.3% | ||||
| Boyd Gaming Corp., 4.75%, 12/01/2027 | $ | 395,000 | $367,350 | |
| Boyd Gaming Corp., 4.75%, 6/15/2031 (n) | 270,000 | 235,575 | ||
| Caesars Entertainment, Inc., 4.625%, 10/15/2029 (n) | 545,000 | 456,437 | ||
| Issuer | Shares/Par | Value ($) | ||
| Bonds – continued | ||||
| Gaming & Lodging – continued | ||||
| Caesars Resort Collection LLC/CRC Finco, Inc., 8.125%, 7/01/2027 (n) | $ | 689,000 | $691,618 | |
| CCM Merger, Inc., 6.375%, 5/01/2026 (n) | 541,000 | 500,820 | ||
| Hilton Domestic Operating Co., Inc., 3.75%, 5/01/2029 (n) | 989,000 | 877,648 | ||
| Hilton Domestic Operating Co., Inc., 3.625%, 2/15/2032 (n) | 921,000 | 758,269 | ||
| International Game Technology PLC, 4.125%, 4/15/2026 (n) | 1,000,000 | 941,210 | ||
| International Game Technology PLC, 6.25%, 1/15/2027 (n) | 225,000 | 223,594 | ||
| Las Vegas Sands Corp., 3.9%, 8/08/2029 | 119,000 | 102,196 | ||
| Marriott International, Inc., 2.85%, 4/15/2031 | 90,000 | 73,536 | ||
| Marriott Ownership Resorts, Inc., 4.5%, 6/15/2029 (n) | 365,000 | 307,506 | ||
| MGM China Holdings Ltd., 5.375%, 5/15/2024 (n) | 420,000 | 411,600 | ||
| MGM China Holdings Ltd., 4.75%, 2/01/2027 (n) | 234,000 | 204,820 | ||
| Sands China Ltd., 4.3%, 1/08/2026 | 600,000 | 549,978 | ||
| Sands China Ltd., 4.875%, 6/18/2030 | 505,000 | 435,563 | ||
| Scientific Games Holdings LP/Scientific Games US Finco, Inc., 6.625%, 3/01/2030 (n) | 596,000 | 501,369 | ||
| VICI Properties LP / VICI Note Co., Inc., 4.625%, 6/15/2025 (n) | 685,000 | 655,519 | ||
| VICI Properties LP / VICI Note Co., Inc., 4.25%, 12/01/2026 (n) | 855,000 | 795,305 | ||
| VICI Properties LP / VICI Note Co., Inc., 5.75%, 2/01/2027 (n) | 285,000 | 276,170 | ||
| VICI Properties LP / VICI Note Co., Inc., 3.875%, 2/15/2029 (n) | 389,000 | 341,436 | ||
| VICI Properties LP / VICI Note Co., Inc., 4.125%, 8/15/2030 (n) | 155,000 | 134,301 | ||
| VICI Properties LP, REIT, 3.75%, 2/15/2027 (n) | 515,000 | 464,566 | ||
| VICI Properties LP, REIT, 4.95%, 2/15/2030 | 192,000 | 181,508 | ||
| Wyndham Hotels & Resorts, Inc., 4.375%, 8/15/2028 (n) | 813,000 | 727,035 | ||
| Wynn Macau Ltd., 5.5%, 1/15/2026 (n) | 375,000 | 337,500 | ||
| Wynn Macau Ltd., 5.625%, 8/26/2028 (n) | 788,000 | 652,653 | ||
| Wynn Resorts Finance LLC/Wynn Resorts Capital Corp., 5.125%, 10/01/2029 (n) | 800,000 | 695,286 | ||
| $12,900,368 | ||||
| Industrial – 1.2% | ||||
| Albion Financing 1 S.à r.l., 5.25%, 10/15/2026 | EUR | 250,000 | $231,887 | |
| Albion Financing 1 S.à r.l., 6.125%, 10/15/2026 (n) | $ | 200,000 | 177,310 | |
| Albion Financing 2 S.à r.l., 8.75%, 4/15/2027 (n) | 635,000 | 539,677 | ||
| APi Escrow Corp., 4.75%, 10/15/2029 (n) | 1,010,000 | 866,830 | ||
| Dar Al-Arkan Sukuk Co. Ltd., 6.875%, 2/26/2027 | 850,000 | 791,136 | ||
| Peach Property Group, 4.375%, 11/15/2025 (n) | EUR | 225,000 | 168,816 | |
| Issuer | Shares/Par | Value ($) | ||
| Bonds – continued | ||||
| Industrial – continued | ||||
| Trustees of the University of Pennsylvania, 2.396%, 10/01/2050 | $ | 35,000 | $22,380 | |
| Williams Scotsman International, Inc., 4.625%, 8/15/2028 (n) | 1,013,000 | 921,019 | ||
| $3,719,055 | ||||
| Insurance – 0.5% | ||||
| AIA Group Ltd., 0.88% to 9/09/2028, FLR (EUR Swap Rate - 5yr. + 1.1%) to 9/09/2033 | EUR | 320,000 | $258,011 | |
| Allianz SE, 3.5% to 4/30/2026, FLR (CMT - 5yr. + 2.973%) to 4/30/2171 (n) | $ | 200,000 | 169,750 | |
| Argentum Netherlands B.V., 5.125%, 6/01/2048 | 200,000 | 178,446 | ||
| Argentum Zurich Insurance, 2.75% to 2/19/2029, FLR (EURIBOR - 3mo. + 3.2%) to 2/19/2049 | EUR | 100,000 | 91,799 | |
| ASR Nederland N.V., 7% to 12/07/2033, FLR (EUR Swap Rate - 5yr. + 5.3%) to 12/07/2043 | 100,000 | 108,455 | ||
| Aviva PLC, 4% to 6/03/2035, FLR (GBP Government Yield - 5yr. + 4.7%) to 6/03/2055 | GBP | 175,000 | 164,426 | |
| Corebridge Financial, Inc., 4.35%, 4/05/2042 (n) | $ | 30,000 | 24,562 | |
| Credit Agricole Assurances S.A., 2%, 7/17/2030 | EUR | 200,000 | 169,243 | |
| NN Group N.V., 4.625%, 1/13/2048 | 200,000 | 199,575 | ||
| $1,364,267 | ||||
| Insurance - Health – 0.0% | ||||
| UnitedHealth Group, Inc., 3.5%, 8/15/2039 | $ | 38,000 | $31,459 | |
| UnitedHealth Group, Inc., 3.25%, 5/15/2051 | 108,000 | 79,251 | ||
| $110,710 | ||||
| Insurance - Property & Casualty – 0.9% | ||||
| Alliant Holdings Intermediate LLC, 6.75%, 10/15/2027 (n) | $ | 465,000 | $428,309 | |
| Aon Corp./Aon Global Holdings PLC, 2.6%, 12/02/2031 | 25,000 | 20,465 | ||
| AssuredPartners, Inc., 5.625%, 1/15/2029 (n) | 500,000 | 425,000 | ||
| GTCR (AP) Finance, Inc., 8%, 5/15/2027 (n) | 360,000 | 347,349 | ||
| Hub International Ltd., 5.625%, 12/01/2029 (n) | 1,316,000 | 1,152,329 | ||
| QBE Insurance Group Ltd., 2.5% to 9/13/2028, FLR (GBP Government Yield - 5yr. + 2.061%) to 9/13/2038 | GBP | 100,000 | 91,692 | |
| Ryan Specialty Group, 4.375%, 2/01/2030 (n) | $ | 361,000 | 308,655 | |
| $2,773,799 | ||||
| Issuer | Shares/Par | Value ($) | ||
| Bonds – continued | ||||
| International Market Quasi-Sovereign – 0.5% | ||||
| Caixa Geral de Depositos S.A. (Republic of Portugal), 5.75%, 10/31/2028 | EUR | 100,000 | $106,293 | |
| Electricite de France S.A., 2.875% to 3/15/2027, FLR (EUR Swap Rate - 5yr. + 3.373%) to 3/15/2031, FLR (EUR Swap Rate - 5yr. + 3.623%) to 3/15/2047, FLR (EUR Swap Rate - 5yr. + 4.373%) to 3/15/2070 | 200,000 | 172,740 | ||
| Electricite de France S.A., 5.875% to 1/22/2029, FLR (GBP Swap Rate - 15yr. + 3.046%) to 1/22/2049, FLR (GBP Swap Rate - 15yr. + 3.796%) to 12/31/2165 | GBP | 100,000 | 98,831 | |
| EnBW International Finance B.V., 4.049%, 11/22/2029 | EUR | 30,000 | 31,831 | |
| ESB Finance DAC, 1%, 7/19/2034 | 100,000 | 78,764 | ||
| Islandsbanki, 0.75%, 3/25/2025 | 100,000 | 89,024 | ||
| KFW German Government Development Bank, 1.125%, 3/31/2037 | 748,000 | 631,106 | ||
| La Banque Postale S.A., 5.5% to 3/05/2029, FLR (EUR Swap Rate - 5yr. + 2.85%) to 3/05/2034 (w) | 100,000 | 104,390 | ||
| Landsbankinn Bank (Republic of Iceland), 0.375%, 5/23/2025 | 100,000 | 89,063 | ||
| RTE Reseau de Transport d'Electricite, 0.75%, 1/12/2034 | 100,000 | 78,154 | ||
| $1,480,196 | ||||
| International Market Sovereign – 8.3% | ||||
| Commonwealth of Australia, 3.25%, 6/21/2039 | AUD | 14,241,000 | $8,946,994 | |
| Federal Republic of Germany, 1.7%, 8/15/2032 | EUR | 1,879,000 | 1,913,601 | |
| Federal Republic of Germany, 0%, 8/15/2052 | 942,449 | 587,555 | ||
| Government of Bermuda, 2.375%, 8/20/2030 (n) | $ | 200,000 | 162,875 | |
| Government of Bermuda, 5%, 7/15/2032 (n) | 560,000 | 539,033 | ||
| Government of France, 0.75%, 5/25/2053 | EUR | 691,500 | 445,768 | |
| Government of Japan, 1.7%, 6/20/2033 | JPY | 127,600,000 | 1,044,307 | |
| Government of Japan, 1.7%, 6/20/2044 | 337,300,000 | 2,671,678 | ||
| Government of Japan, 0.3%, 6/20/2046 | 150,100,000 | 870,241 | ||
| Kingdom of Belgium, 0.4%, 6/22/2040 | EUR | 1,240,000 | 872,291 | |
| Kingdom of Spain, 2.55%, 10/31/2032 | 569,000 | 571,824 | ||
| Kingdom of Spain, 1%, 10/31/2050 | 951,000 | 592,781 | ||
| Republic of Cyprus, 0.625%, 1/21/2030 | 353,000 | 291,368 | ||
| Republic of France, 0%, 5/25/2032 | 1,280,000 | 1,066,461 | ||
| United Kingdom Treasury, 1.25%, 7/22/2027 | GBP | 3,214,000 | 3,537,750 | |
| United Kingdom Treasury, 1.25%, 10/22/2041 | 497,000 | 413,932 | ||
| United Kingdom Treasury, 1.25%, 7/31/2051 | 538,000 | 391,862 | ||
| $24,920,321 | ||||
| Issuer | Shares/Par | Value ($) | ||
| Bonds – continued | ||||
| Local Authorities – 0.8% | ||||
| Oslo kommune, 2.17%, 5/18/2029 | NOK | 3,000,000 | $273,283 | |
| Province of Alberta, 4.5%, 12/01/2040 | CAD | 125,000 | 97,784 | |
| Province of British Columbia, 2.95%, 6/18/2050 | 115,000 | 70,531 | ||
| Province of Ontario, 1.9%, 12/02/2051 | 4,346,000 | 2,068,724 | ||
| $2,510,322 | ||||
| Machinery & Tools – 0.3% | ||||
| Sarens Finance Co. N.V., 5.75%, 2/21/2027 | EUR | 210,000 | $165,075 | |
| Terex Corp., 5%, 5/15/2029 (n) | $ | 960,000 | 868,022 | |
| $1,033,097 | ||||
| Major Banks – 1.8% | ||||
| Australia and New Zealand Banking Group Ltd., 2.57% to 11/25/2030, FLR (CMT - 5yr. + 1.7%) to 11/25/2035 (n) | $ | 152,000 | $110,862 | |
| Bank of America Corp., 3.5%, 4/19/2026 | 301,000 | 288,608 | ||
| Bank of America Corp., 0.694% to 3/22/2030, FLR (EURIBOR - 3mo. + 0.79%) to 3/22/2031 | EUR | 110,000 | 90,500 | |
| Bank of America Corp., 2.687% to 4/22/2031, FLR (SOFR - 1 day + 1.32%) to 4/22/2032 | $ | 236,000 | 191,193 | |
| Barclays Bank PLC, 8.407% to 11/14/2027, FLR (GBP Swap Rate - 5yr. + 4.75%) to 11/14/2032 | GBP | 100,000 | 124,721 | |
| BNP Paribas S.A., 4.625% to 1/12/2027, FLR (CMT - 5yr. + 3.196%) to 1/12/2027 (n) | $ | 200,000 | 162,223 | |
| Commonwealth Bank of Australia, 2.688%, 3/11/2031 (n) | 221,000 | 168,530 | ||
| Crédit Agricole Group, 3.875%, 11/28/2034 | EUR | 100,000 | 105,380 | |
| Credit Suisse AG (London), 2.125%, 5/31/2024 | 100,000 | 99,057 | ||
| Credit Suisse Group AG, 7.75% to 3/01/2028, FLR (EUR ICE Swap Rate - 1yr. + 4.95%) to 3/01/2029 | 100,000 | 102,551 | ||
| Deutsche Bank AG, 3.729% to 1/14/2031, FLR (SOFR - 1 day + 2.757%) to 1/14/2032 | $ | 290,000 | 213,205 | |
| Deutsche Bank AG (New York), 3.742%, 1/07/2033 | 306,000 | 218,444 | ||
| Goldman Sachs Group, Inc., 2.383% to 7/21/2031, FLR (SOFR - 1 day + 1.248%) to 7/21/2032 | 80,000 | 63,191 | ||
| Goldman Sachs Group, Inc., 3.436% to 2/24/2042, FLR (SOFR - 1 day + 1.632%) to 2/24/2043 | 111,000 | 84,087 | ||
| HSBC Holdings PLC, 4.375%, 11/23/2026 | 269,000 | 258,117 | ||
| HSBC Holdings PLC, 6.364% to 11/16/2027, FLR (EUR Swap Rate - 5yr. + 3.3%) to 11/16/2032 | EUR | 100,000 | 107,330 | |
| JPMorgan Chase & Co., 1.47%, 9/22/2027 | $ | 455,000 | 394,945 | |
| JPMorgan Chase & Co., 3.328% to 4/22/2051, FLR (SOFR - 1 day + 1.58%) to 4/22/2052 | 218,000 | 157,680 | ||
| Morgan Stanley, 1.593% to 5/04/2026, FLR (SOFR - 1 day + 0.879%) to 5/04/2027 | 183,000 | 161,220 | ||
| Issuer | Shares/Par | Value ($) | ||
| Bonds – continued | ||||
| Major Banks – continued | ||||
| Morgan Stanley, 3.622% to 4/01/2030, FLR (SOFR - 1 day + 3.12%) to 4/01/2031 | $ | 214,000 | $190,708 | |
| Nationwide Building Society, 6.18% to 12/07/2026, FLR (SONIA + 2.213%) to 12/07/2027 (w) | GBP | 100,000 | 120,883 | |
| NatWest Group PLC, 7.42%, 6/06/2033 (w) | �� | 100,000 | 120,775 | |
| Société Générale S.A., 4%, 11/16/2027 | EUR | 100,000 | 105,797 | |
| Standard Chartered PLC, 0.8% to 11/17/2028, FLR (EUR Swap Rate - 1yr. + 0.85%) to 11/17/2029 | 100,000 | 83,428 | ||
| Toronto Dominion Bank, 4.108%, 6/08/2027 | $ | 153,000 | 147,743 | |
| Toronto Dominion Bank, 8.125% to 10/31/2027, FLR (CMT - 5yr. + 4.075%) to 10/31/2082 | 585,000 | 599,625 | ||
| Unicaja Banco S.A., 1% to 12/01/2025, FLR (EUR ICE Swap Rate - 1yr. + 1.15%) to 12/01/2026 | EUR | 100,000 | 91,547 | |
| UniCredit S.p.A., 5.85% to 11/15/2026, FLR (EURIBOR - 3mo. + 2.85%) to 11/15/2027 | 150,000 | 160,364 | ||
| UniCredit S.p.A., 0.925% to 1/28/2027, FLR (EURIBOR - 3mo. + 0.85%) to 1/18/2028 | 180,000 | 162,162 | ||
| Wells Fargo & Co., 3.526% to 3/24/2027, FLR (SOFR - 1 day + 1.51%) to 3/24/2028 | $ | 293,000 | 272,167 | |
| Wells Fargo & Co., 2.572% to 2/11/2030, FLR (LIBOR - 3mo. +1%) to 2/11/2031 | 69,000 | 57,732 | ||
| Wells Fargo & Co., 3.35% to 3/02/2032, FLR (SOFR - 1 day + 1.5%) to 3/02/2033 | 139,000 | 118,904 | ||
| $5,333,679 | ||||
| Medical & Health Technology & Services – 4.4% | ||||
| 180 Medical, Inc., 3.875%, 10/15/2029 (n) | $ | 765,000 | $650,179 | |
| Avantor Funding, Inc., 4.625%, 7/15/2028 (n) | 1,006,000 | 925,520 | ||
| Becton, Dickinson and Co., 4.298%, 8/22/2032 | 45,000 | 42,844 | ||
| Catalent Pharma Solutions, Inc., 2.375%, 3/01/2028 | EUR | 220,000 | 189,460 | |
| Catalent, Inc., 3.125%, 2/15/2029 (n) | $ | 1,643,000 | 1,343,152 | |
| Charles River Laboratories International, Inc., 3.75%, 3/15/2029 (n) | 1,381,000 | 1,201,637 | ||
| CHS/Community Health Systems, Inc., 8%, 12/15/2027 (n) | 485,000 | 429,567 | ||
| CHS/Community Health Systems, Inc., 6.125%, 4/01/2030 (n) | 965,000 | 492,150 | ||
| CHS/Community Health Systems, Inc., 5.25%, 5/15/2030 (n) | 460,000 | 350,796 | ||
| DaVita, Inc., 4.625%, 6/01/2030 (n) | 805,000 | 651,631 | ||
| Encompass Health Corp., 5.75%, 9/15/2025 | 445,000 | 440,309 | ||
| Encompass Health Corp., 4.75%, 2/01/2030 | 555,000 | 492,563 | ||
| Encompass Health Corp., 4.625%, 4/01/2031 | 120,000 | 103,563 | ||
| HCA, Inc., 5.125%, 6/15/2039 | 103,000 | 91,807 | ||
| IQVIA Holdings, Inc., 5%, 10/15/2026 (n) | 455,000 | 437,938 | ||
| Issuer | Shares/Par | Value ($) | ||
| Bonds – continued | ||||
| Medical & Health Technology & Services – continued | ||||
| IQVIA Holdings, Inc., 5%, 5/15/2027 (n) | $ | 1,010,000 | $964,458 | |
| Legacy LifePoint Health LLC, 4.375%, 2/15/2027 (n) | 255,000 | 211,384 | ||
| New York Society for the Relief of the Ruptured & Crippled, 2.667%, 10/01/2050 | 179,000 | 111,317 | ||
| ProMedica Toledo Hospital, “B”, AGM, 6.015%, 11/15/2048 | 142,000 | 137,300 | ||
| Regional Care/LifePoint Health, Inc., 9.75%, 12/01/2026 (n) | 485,000 | 390,444 | ||
| Syneos Health, Inc., 3.625%, 1/15/2029 (n) | 1,131,000 | 894,191 | ||
| Tenet Healthcare Corp., 6.125%, 10/01/2028 (n) | 1,278,000 | 1,127,835 | ||
| Tenet Healthcare Corp., 4.375%, 1/15/2030 (n) | 226,000 | 196,862 | ||
| Tenet Healthcare Corp., 6.125%, 6/15/2030 (n) | 360,000 | 341,129 | ||
| Thermo Fisher Scientific (Finance I) Co., 2%, 10/18/2051 | EUR | 100,000 | 73,977 | |
| Thermo Fisher Scientific, Inc., 1.75%, 10/15/2028 | $ | 137,000 | 117,186 | |
| U.S. Acute Care Solutions LLC, 6.375%, 3/01/2026 (n) | 535,000 | 485,164 | ||
| U.S. Renal Care, Inc., 10.625%, 7/15/2027 (n) | 480,000 | 191,112 | ||
| $13,085,475 | ||||
| Medical Equipment – 0.5% | ||||
| Garden SpinCo Corp., 8.625%, 7/20/2030 (n) | $ | 453,000 | $480,924 | |
| Teleflex, Inc., 4.625%, 11/15/2027 | 995,000 | 940,613 | ||
| $1,421,537 | ||||
| Metals & Mining – 3.0% | ||||
| Anglo American Capital PLC, 5.625%, 4/01/2030 (n) | $ | 209,000 | $207,874 | |
| Anglo American Capital PLC, 4.75%, 9/21/2032 | EUR | 100,000 | 105,948 | |
| Baffinland Iron Mines Corp./Baffinland Iron Mines LP, 8.75%, 7/15/2026 (n) | $ | 655,000 | 610,269 | |
| Coeur Mining, Inc., 5.125%, 2/15/2029 (n) | 1,150,000 | 895,540 | ||
| Compass Minerals International, Inc., 6.75%, 12/01/2027 (n) | 695,000 | 655,406 | ||
| Eldorado Gold Corp., 6.25%, 9/01/2029 (n) | 550,000 | 449,064 | ||
| Ero Copper Corp., 6.5%, 2/15/2030 (n) | 333,000 | 255,025 | ||
| First Quantum Minerals Ltd., 6.875%, 10/15/2027 (n) | 314,000 | 299,092 | ||
| First Quantum Minerals Ltd., 6.875%, 10/15/2027 | 350,000 | 333,382 | ||
| FMG Resources Ltd., 4.375%, 4/01/2031 (n) | 1,255,000 | 1,057,337 | ||
| Glencore Capital Finance DAC, 1.125%, 3/10/2028 | EUR | 140,000 | 125,571 | |
| Glencore Funding LLC, 2.85%, 4/27/2031 (n) | $ | 144,000 | 118,589 | |
| GrafTech Finance, Inc., 4.625%, 12/15/2028 (n) | 838,000 | 698,683 | ||
| Kaiser Aluminum Corp., 4.625%, 3/01/2028 (n) | 928,000 | 816,092 | ||
| Kaiser Aluminum Corp., 4.5%, 6/01/2031 (n) | 455,000 | 384,188 | ||
| Novelis Corp., 3.25%, 11/15/2026 (n) | 520,000 | 464,653 | ||
| Novelis Corp., 4.75%, 1/30/2030 (n) | 735,000 | 653,487 | ||
| Novelis Corp., 3.875%, 8/15/2031 (n) | 380,000 | 311,600 | ||
| Novelis Sheet Ingot GmbH, 3.375%, 4/15/2029 | EUR | 250,000 | 225,444 | |
| Issuer | Shares/Par | Value ($) | ||
| Bonds – continued | ||||
| Metals & Mining – continued | ||||
| Petra Diamonds US$ Treasury PLC, 10.5% PIK to 12/31/2022, 10.5% PIK/9.75% Cash to 6/30/2023, 9.75% Cash to 3/08/2026 (n)(p) | $ | 347,660 | $347,660 | |
| TMS International Corp., 6.25%, 4/15/2029 (n) | 170,000 | 121,617 | ||
| $9,136,521 | ||||
| Midstream – 3.8% | ||||
| Cheniere Energy Partners LP, 4.5%, 10/01/2029 | $ | 515,000 | $472,770 | |
| Cheniere Energy Partners LP, 4%, 3/01/2031 | 975,000 | 851,906 | ||
| DT Midstream, Inc., 4.125%, 6/15/2029 (n) | 1,064,000 | 937,490 | ||
| DT Midstream, Inc., 4.375%, 6/15/2031 (n) | 949,000 | 818,712 | ||
| Energy Transfer LP, 5%, 5/15/2050 | 31,000 | 25,549 | ||
| EnLink Midstream LLC, 6.5%, 9/01/2030 (n) | 790,000 | 802,340 | ||
| EQM Midstream Partners LP, 6%, 7/01/2025 (n) | 62,000 | 60,760 | ||
| EQM Midstream Partners LP, 6.5%, 7/01/2027 (n) | 111,000 | 107,670 | ||
| EQM Midstream Partners LP, 5.5%, 7/15/2028 | 1,585,000 | 1,468,629 | ||
| EQM Midstream Partners LP, 4.5%, 1/15/2029 (n) | 560,000 | 492,184 | ||
| Kinetik Holdings, Inc., 5.875%, 6/15/2030 (n) | 803,000 | 754,587 | ||
| Peru LNG, 5.375%, 3/22/2030 | 518,000 | 427,998 | ||
| Plains All American Pipeline LP/PAA Finance Corp., 3.55%, 12/15/2029 | 227,000 | 197,820 | ||
| Sabine Pass Liquefaction LLC, 4.5%, 5/15/2030 | 193,000 | 182,361 | ||
| Tallgrass Energy Partners LP, 5.5%, 1/15/2028 (n) | 1,080,000 | 980,100 | ||
| Targa Resources Corp., 4.2%, 2/01/2033 | 13,000 | 11,368 | ||
| Targa Resources Corp., 4.95%, 4/15/2052 | 79,000 | 64,213 | ||
| Targa Resources Partners LP/Targa Resources Finance Corp., 6.875%, 1/15/2029 | 785,000 | 806,478 | ||
| Targa Resources Partners LP/Targa Resources Finance Corp., 4.875%, 2/01/2031 | 721,000 | 656,701 | ||
| Venture Global Calcasieu Pass LLC, 3.875%, 8/15/2029 (n) | 870,000 | 751,463 | ||
| Venture Global Calcasieu Pass LLC, 4.125%, 8/15/2031 (n) | 625,000 | 539,063 | ||
| $11,410,162 | ||||
| Mortgage-Backed – 2.8% | ||||
| Fannie Mae, 6.5%, 4/01/2032 - 1/01/2033 | $ | 14,899 | $15,434 | |
| Fannie Mae, 5.5%, 7/01/2033 - 7/01/2035 | 58,007 | 60,130 | ||
| Fannie Mae, 6%, 8/01/2034 - 2/01/2037 | 32,773 | 34,431 | ||
| Fannie Mae, 3.5%, 12/01/2047 | 42,358 | 39,625 | ||
| Fannie Mae, 2.5%, 2/01/2052 - 10/01/2052 | 299,307 | 256,245 | ||
| Fannie Mae, UMBS, 2%, 4/01/2042 - 5/01/2052 | 888,903 | 738,193 | ||
| Fannie Mae, UMBS, 3.5%, 5/01/2049 - 6/01/2052 | 595,387 | 550,058 | ||
| Fannie Mae, UMBS, 2.5%, 7/01/2050 - 7/01/2052 | 1,251,088 | 1,072,452 | ||
| Fannie Mae, UMBS, 3%, 12/01/2051 - 6/01/2052 | 661,381 | 585,474 | ||
| Fannie Mae, UMBS, 4%, 6/01/2052 | 124,999 | 118,268 | ||
| Issuer | Shares/Par | Value ($) | ||
| Bonds – continued | ||||
| Mortgage-Backed – continued | ||||
| Freddie Mac, 0.276%, 2/25/2025 (i) | $ | 38,000,000 | $142,758 | |
| Freddie Mac, 1.482%, 3/25/2027 (i) | 448,000 | 22,453 | ||
| Freddie Mac, 0.263%, 2/25/2028 (i) | 36,576,000 | 275,706 | ||
| Freddie Mac, 0.467%, 2/25/2028 (i) | 15,572,000 | 233,628 | ||
| Freddie Mac, 0.251%, 4/25/2028 (i) | 15,983,000 | 114,990 | ||
| Freddie Mac, 1.22%, 7/25/2029 (i) | 1,884,347 | 109,139 | ||
| Freddie Mac, 1.917%, 4/25/2030 (i) | 845,640 | 90,537 | ||
| Freddie Mac, 1.985%, 4/25/2030 (i) | 731,897 | 79,262 | ||
| Freddie Mac, 1.768%, 5/25/2030 (i) | 896,340 | 89,788 | ||
| Freddie Mac, 1.907%, 5/25/2030 (i) | 2,034,877 | 219,337 | ||
| Freddie Mac, 1.436%, 6/25/2030 (i) | 821,458 | 67,523 | ||
| Freddie Mac, 1.704%, 8/25/2030 (i) | 719,995 | 71,655 | ||
| Freddie Mac, 1.263%, 9/25/2030 (i) | 455,646 | 33,347 | ||
| Freddie Mac, 1.172%, 11/25/2030 (i) | 901,677 | 62,275 | ||
| Freddie Mac, 0.422%, 1/25/2031 (i) | 3,186,249 | 64,603 | ||
| Freddie Mac, 0.613%, 3/25/2031 (i) | 3,739,954 | 122,312 | ||
| Freddie Mac, 1.039%, 7/25/2031 (i) | 670,491 | 43,122 | ||
| Freddie Mac, 0.632%, 9/25/2031 (i) | 2,699,427 | 104,259 | ||
| Freddie Mac, 0.664%, 12/25/2031 (i) | 659,754 | 26,406 | ||
| Freddie Mac, 6%, 8/01/2034 | 23,870 | 24,708 | ||
| Freddie Mac, UMBS, 2.5%, 11/01/2051 - 9/01/2052 | 656,520 | 562,062 | ||
| Freddie Mac, UMBS, 2%, 1/01/2052 - 3/01/2052 | 73,376 | 60,540 | ||
| Freddie Mac, UMBS, 3%, 4/01/2052 | 24,311 | 21,584 | ||
| Freddie Mac, UMBS, 4%, 8/01/2052 | 299,999 | 283,874 | ||
| Freddie Mac, UMBS, 5%, 9/01/2052 | 49,069 | 48,864 | ||
| Ginnie Mae, 2.5%, 8/20/2051 - 5/20/2052 | 230,226 | 202,723 | ||
| Ginnie Mae, 3%, 5/20/2052 - 11/20/2052 | 124,307 | 112,329 | ||
| Ginnie Mae, 4.5%, 8/20/2052 - 9/20/2052 | 223,874 | 219,393 | ||
| Ginnie Mae, 5%, 9/20/2052 - 11/20/2052 | 199,890 | 199,833 | ||
| Ginnie Mae, 4%, 10/20/2052 - 11/20/2052 | 99,872 | 95,377 | ||
| Ginnie Mae, TBA, 5.5%, 12/15/2052 | 100,000 | 101,186 | ||
| Ginnie Mae, TBA, 2%, 12/20/2052 | 100,000 | 85,094 | ||
| UMBS, TBA, 4.5%, 12/13/2052 | 300,000 | 291,984 | ||
| UMBS, TBA, 5.5%, 12/25/2052 | 650,000 | 657,379 | ||
| UMBS, TBA, 6%, 12/25/2052 | 150,000 | 153,362 | ||
| $8,563,702 | ||||
| Issuer | Shares/Par | Value ($) | ||
| Bonds – continued | ||||
| Municipals – 0.7% | ||||
| Iowa Student Loan Liquidity Corp. Rev., Taxable, “A”, 5.08%, 12/01/2039 | $ | 200,000 | $184,690 | |
| Massachusetts Educational Financing Authority, Education Loan Rev., Taxable, “A”, 4.949%, 7/01/2038 | 290,000 | 279,228 | ||
| Massachusetts Educational Financing Authority, Education Loan Subordinate Rev., Taxable, “A”, 2.641%, 7/01/2037 | 150,000 | 136,255 | ||
| Massachusetts Housing Finance Agency, Single Family Housing Rev., Taxable, “226”, 5.562%, 12/01/2052 (w) | 190,000 | 191,501 | ||
| Michigan Finance Authority Hospital Rev., Taxable (Trinity Health Credit Group), 3.384%, 12/01/2040 | 215,000 | 170,813 | ||
| Minnesota Housing Finance Agency, Residential Housing, Taxable, “G”, 4.337%, 1/01/2047 | 195,000 | 186,887 | ||
| New Jersey Economic Development Authority State Pension Funding Rev., Taxable, “A”, NPFG, 7.425%, 2/15/2029 | 499,000 | 539,300 | ||
| Oklahoma Development Finance Authority, Health System Rev., Taxable (OU Medicine Project), “C”, 5.45%, 8/15/2028 | 346,000 | 303,838 | ||
| Oklahoma Development Finance Authority, Health System Rev., Taxable (OU Medicine Project), “C”, AGM, 4.65%, 8/15/2030 | 221,000 | 196,257 | ||
| $2,188,769 | ||||
| Natural Gas - Distribution – 0.1% | ||||
| Boston Gas Co., 3.15%, 8/01/2027 (n) | $ | 198,000 | $178,946 | |
| NiSource, Inc., 3.6%, 5/01/2030 | 92,000 | 82,709 | ||
| $261,655 | ||||
| Natural Gas - Pipeline – 0.1% | ||||
| APT Pipelines Ltd., 0.75%, 3/15/2029 | EUR | 110,000 | $93,633 | |
| APT Pipelines Ltd., 2.5%, 3/15/2036 | GBP | 100,000 | 80,722 | |
| $174,355 | ||||
| Network & Telecom – 0.4% | ||||
| AT&T, Inc., 3.5%, 9/15/2053 | $ | 84,000 | $59,314 | |
| Iliad Holding S.A.S., 7%, 10/15/2028 (n) | 1,012,000 | 955,338 | ||
| Verizon Communications, Inc., 2.1%, 3/22/2028 | 86,000 | 75,244 | ||
| Verizon Communications, Inc., 2.355%, 3/15/2032 | 36,000 | 28,898 | ||
| Verizon Communications, Inc., 3.875%, 3/01/2052 | 149,000 | 115,668 | ||
| $1,234,462 | ||||
| Oil Services – 0.4% | ||||
| Guara Norte S.à r.l., 5.198%, 6/15/2034 (n) | $ | 187,230 | $154,933 | |
| MV24 Capital B.V., 6.748%, 6/01/2034 | 502,229 | 445,260 | ||
| Nabors Industries Ltd., 7.25%, 1/15/2026 (n) | 234,000 | 224,932 | ||
| Issuer | Shares/Par | Value ($) | ||
| Bonds – continued | ||||
| Oil Services – continued | ||||
| Solaris Midstream Holding LLC, 7.625%, 4/01/2026 (n) | $ | 420,000 | $413,700 | |
| $1,238,825 | ||||
| Oils – 0.7% | ||||
| Neste Oyj, 0.75%, 3/25/2028 | EUR | 100,000 | $89,819 | |
| Parkland Corp., 4.625%, 5/01/2030 (n) | $ | 1,535,000 | 1,287,098 | |
| PBF Holding Co. LLC/PBF Finance Corp., 6%, 2/15/2028 | 355,000 | 324,030 | ||
| Thaioil Treasury Center Co. Ltd., 5.375%, 11/20/2048 (n) | 355,000 | 283,764 | ||
| $1,984,711 | ||||
| Other Banks & Diversified Financials – 1.5% | ||||
| AIB Group PLC, 5.75% to 2/16/2028, FLR (EUR Swap Rate - 1yr. + 2.85%) to 2/16/2029 | EUR | 100,000 | $107,594 | |
| Arion Banki HF, 4.875%, 12/21/2024 | 140,000 | 140,787 | ||
| Bangkok Bank Public Co. Ltd., 3.733% to 9/25/2029, FLR (CMT - 5yr. + 1.9%) to 9/25/2034 | $ | 750,000 | 608,845 | |
| Bank Hapoalim B.M., 3.255% to 1/21/2027, FLR (CMT - 5yr. + 2.155%) to 1/21/2032 (n) | 200,000 | 170,644 | ||
| Bank Leumi le-Israel B.M., 5.125%, 7/27/2027 (n) | 846,000 | 836,457 | ||
| Belfius Bank S.A., 1.25% to 4/06/2029, FLR (EUR Swap Rate - 5yr. + 1.3%) to 4/06/2034 | EUR | 200,000 | 163,828 | |
| BPCE S.A., 2.277% to 1/20/2031, FLR (SOFR - 1 day + 1.312%) to 1/20/2032 (n) | $ | 250,000 | 186,411 | |
| CaixaBank S.A., 5.375% to 11/14/2029, FLR (EURIBOR - 3mo. + 2.4%) to 11/14/2030 | EUR | 100,000 | 107,740 | |
| CaixaBank S.A., 6.25%, 2/23/2033 | 100,000 | 105,774 | ||
| Commercial Bank P.S.Q.C., 4.5% to 9/03/2026, FLR (CMT - 5yr. + 3.874%) to 9/03/2169 | $ | 272,000 | 242,434 | |
| Commerzbank AG, 4.625% to 3/21/2027, FLR (EURIBOR - 3mo. + 2.2%) to 3/21/2027 | EUR | 200,000 | 204,522 | |
| Deutsche Bank AG, 1.875% to 2/23/2027, FLR (EURIBOR - 3mo. + 1.38%) to 2/23/2028 | 100,000 | 91,306 | ||
| Deutsche Bank AG, 3.25% to 5/24/2027, FLR (EURIBOR - 3mo. + 1.93%) to 5/24/2028 | 100,000 | 96,443 | ||
| Deutsche Bank AG, 1.375% to 2/17/2031, FLR (EURIBOR - 3mo. + 1.5%) to 2/17/2032 | 100,000 | 76,403 | ||
| Deutsche Bank AG, 4% to 6/24/2027, FLR (EUR ICE Swap Rate - 5yr. + 3.3%) to 6/24/2032 | 100,000 | 93,956 | ||
| Groupe BPCE S.A., 4.5%, 3/15/2025 (n) | $ | 250,000 | 239,506 | |
| Groupe des Assurances du Credit Mutuel, 1.85% to 4/21/2032, FLR (EURIBOR - 3mo. + 2.65%) to 4/21/2042 | EUR | 200,000 | 154,658 | |
| Intesa Sanpaolo S.p.A., 2.625%, 3/11/2036 | GBP | 150,000 | 118,027 | |
| Macquarie Group Ltd., 4.08%, 5/31/2029 | 130,000 | 140,726 | ||
| Shinhan Bank Co., Ltd., 4.375%, 4/13/2032 (n) | $ | 227,000 | 201,889 | |
| Issuer | Shares/Par | Value ($) | ||
| Bonds – continued | ||||
| Other Banks & Diversified Financials – continued | ||||
| Uzbek Industrial and Construction Bank, 5.75%, 12/02/2024 | $ | 269,000 | $246,807 | |
| Virgin Money UK PLC, 5.125% to 12/11/2025, FLR (GBP Government Yield - 5yr. + 5.25%) to 12/11/2030 | GBP | 100,000 | 111,239 | |
| $4,445,996 | ||||
| Personal Computers & Peripherals – 0.3% | ||||
| NCR Corp., 5%, 10/01/2028 (n) | $ | 790,000 | $687,300 | |
| NCR Corp., 5.125%, 4/15/2029 (n) | 410,000 | 352,686 | ||
| $1,039,986 | ||||
| Pharmaceuticals – 1.0% | ||||
| 13752090 BC Ltd., 9%, 1/30/2028 (n) | $ | 255,000 | $250,537 | |
| Bausch Health Co., Inc., 11%, 9/30/2028 (n) | 454,000 | 348,445 | ||
| Bausch Health Co., Inc., 14%, 10/15/2030 (n) | 90,000 | 49,932 | ||
| Jazz Securities DAC, 4.375%, 1/15/2029 (n) | 1,160,000 | 1,052,723 | ||
| Organon Finance 1 LLC, 4.125%, 4/30/2028 (n) | 955,000 | 859,481 | ||
| Organon Finance 1 LLC, 5.125%, 4/30/2031 (n) | 675,000 | 599,002 | ||
| $3,160,120 | ||||
| Pollution Control – 0.8% | ||||
| GFL Environmental, Inc., 4.25%, 6/01/2025 (n) | $ | 215,000 | $204,763 | |
| GFL Environmental, Inc., 4%, 8/01/2028 (n) | 985,000 | 845,036 | ||
| GFL Environmental, Inc., 4.75%, 6/15/2029 (n) | 255,000 | 223,337 | ||
| GFL Environmental, Inc., 4.375%, 8/15/2029 (n) | 345,000 | 296,045 | ||
| Stericycle, Inc., 3.875%, 1/15/2029 (n) | 757,000 | 658,590 | ||
| Waste Connections, Inc., 4.2%, 1/15/2033 | 49,000 | 46,276 | ||
| $2,274,047 | ||||
| Precious Metals & Minerals – 0.3% | ||||
| IAMGOLD Corp., 5.75%, 10/15/2028 (n) | $ | 565,000 | $400,688 | |
| Taseko Mines Ltd., 7%, 2/15/2026 (n) | 510,000 | 427,892 | ||
| $828,580 | ||||
| Printing & Publishing – 0.2% | ||||
| Cimpress N.V., 7%, 6/15/2026 (n) | $ | 890,000 | $621,069 | |
| Informa PLC, 3.125%, 7/05/2026 | GBP | 110,000 | 120,424 | |
| $741,493 | ||||
| Railroad & Shipping – 0.1% | ||||
| Canadian Pacific Railway Co., 2.45%, 12/02/2031 | $ | 111,000 | $92,505 | |
| Wabtec Transportation Netherlands B.V., 1.25%, 12/03/2027 | EUR | 100,000 | 90,126 | |
| $182,631 | ||||
| Issuer | Shares/Par | Value ($) | ||
| Bonds – continued | ||||
| Real Estate - Healthcare – 0.2% | ||||
| MPT Operating Partnership LP/MPT Finance Corp., 0.993%, 10/15/2026 | EUR | 225,000 | $176,732 | |
| MPT Operating Partnership LP/MPT Financial Co., REIT, 5%, 10/15/2027 | $ | 624,000 | 532,771 | |
| $709,503 | ||||
| Real Estate - Office – 0.1% | ||||
| Corporate Office Property LP, REIT, 2.25%, 3/15/2026 | $ | 149,000 | $130,866 | |
| Corporate Office Property LP, REIT, 2%, 1/15/2029 | 52,000 | 40,243 | ||
| $171,109 | ||||
| Real Estate - Other – 0.4% | ||||
| EPR Properties, REIT, 3.6%, 11/15/2031 | $ | 89,000 | $65,254 | |
| Lexington Realty Trust Co., 2.7%, 9/15/2030 | 195,000 | 156,036 | ||
| SEGRO Capital S.a.r.l. , 0.5%, 9/22/2031 | EUR | 100,000 | 75,345 | |
| W.P. Carey, Inc., REIT, 2.4%, 2/01/2031 | $ | 282,000 | 224,226 | |
| XHR LP, REIT, 4.875%, 6/01/2029 (n) | 655,000 | 559,848 | ||
| $1,080,709 | ||||
| Real Estate - Retail – 0.2% | ||||
| Brixmor Operating Partnership LP, REIT, 4.05%, 7/01/2030 | $ | 3,000 | $2,622 | |
| Hammerson Ireland Finance DAC, 1.75%, 6/03/2027 | EUR | 100,000 | 81,905 | |
| Regency Centers Corp., 3.7%, 6/15/2030 | $ | 71,000 | 62,062 | |
| STORE Capital Corp., REIT, 2.75%, 11/18/2030 | 313,000 | 244,079 | ||
| Unibail-Rodamco-Westfield SE, REIT, 2.125% to 10/25/2023, FLR (EUR Swap Rate - 5yr. + 1.675%) to 10/25/2028, FLR (EUR Swap Rate - 5yr. + 1.925%) to 10/25/2043, FLR (EUR Swap Rate - 5yr. + 2.675%) to 10/25/2070 | EUR | 100,000 | 89,502 | |
| $480,170 | ||||
| Restaurants – 0.2% | ||||
| Fertitta Entertainment LLC, 6.75%, 1/15/2030 (n) | $ | 645,000 | $543,284 | |
| Retailers – 1.0% | ||||
| Asbury Automotive Group, Inc., 4.5%, 3/01/2028 | $ | 65,000 | $58,806 | |
| Asbury Automotive Group, Inc., 4.625%, 11/15/2029 (n) | 939,000 | 819,278 | ||
| AutoZone, Inc., 4.75%, 8/01/2032 | 48,000 | 47,075 | ||
| Bath & Body Works, Inc., 5.25%, 2/01/2028 | 1,580,000 | 1,454,076 | ||
| Nordstrom, Inc., 4.25%, 8/01/2031 | 106,000 | 82,313 | ||
| Victoria's Secret & Co., 4.625%, 7/15/2029 (n) | 650,000 | 548,600 | ||
| $3,010,148 | ||||
| Issuer | Shares/Par | Value ($) | ||
| Bonds – continued | ||||
| Specialty Chemicals – 0.2% | ||||
| Covestro AG, 4.75%, 11/15/2028 | EUR | 100,000 | $105,470 | |
| Ctec II GmbH, 5.25%, 2/15/2030 (n) | 200,000 | 173,728 | ||
| International Flavors & Fragrances, Inc., 1.832%, 10/15/2027 (n) | $ | 96,000 | 80,229 | |
| Univar Solutions USA, Inc., 5.125%, 12/01/2027 (n) | 342,000 | 328,905 | ||
| $688,332 | ||||
| Specialty Stores – 0.7% | ||||
| DICK'S Sporting Goods, 3.15%, 1/15/2032 | $ | 124,000 | $98,691 | |
| Group 1 Automotive, Inc., 4%, 8/15/2028 (n) | 719,000 | 609,891 | ||
| Michael Cos., Inc., 5.25%, 5/01/2028 (n) | 410,000 | 300,298 | ||
| Michael Cos., Inc., 7.875%, 5/01/2029 (n) | 755,000 | 446,394 | ||
| Penske Automotive Group Co., 3.75%, 6/15/2029 | 726,000 | 610,907 | ||
| $2,066,181 | ||||
| Supermarkets – 0.5% | ||||
| Albertsons Cos. LLC/Safeway, Inc., 4.625%, 1/15/2027 (n) | $ | 690,000 | $638,312 | |
| Albertsons Cos. LLC/Safeway, Inc., 3.5%, 3/15/2029 (n) | 540,000 | 449,832 | ||
| Auchan Holding S.A., 3.25%, 7/23/2027 | EUR | 100,000 | 97,847 | |
| Iceland Bondco PLC, 4.625%, 3/15/2025 | GBP | 190,000 | 189,496 | |
| $1,375,487 | ||||
| Supranational – 0.5% | ||||
| European Stability Mechanism, 0.01%, 10/15/2031 | EUR | 548,000 | $454,705 | |
| European Stability Mechanism, 3.375%, 4/03/2037 | 143,000 | 158,572 | ||
| International Bank for Reconstruction and Development, 4.25%, 6/24/2025 | AUD | 210,000 | 144,033 | |
| West African Development Bank, 4.7%, 10/22/2031 (n) | $ | 1,055,000 | 865,628 | |
| $1,622,938 | ||||
| Telecommunications - Wireless – 2.0% | ||||
| Altice France S.A., 6%, 2/15/2028 (n) | $ | 1,255,000 | $841,591 | |
| American Tower Corp., REIT, 2.75%, 1/15/2027 | 81,000 | 73,318 | ||
| Cellnex Finance Co. S.A., 2%, 2/15/2033 | EUR | 400,000 | 318,324 | |
| Crown Castle, Inc., REIT, 3.7%, 6/15/2026 | $ | 220,000 | 209,548 | |
| Millicom International Cellular S.A., 5.125%, 1/15/2028 | 635,400 | 574,586 | ||
| Rogers Communications, Inc., 3.8%, 3/15/2032 (n) | 92,000 | 81,447 | ||
| Rogers Communications, Inc., 3.7%, 11/15/2049 | 106,000 | 75,006 | ||
| SBA Communications Corp., 3.875%, 2/15/2027 | 753,000 | 695,201 | ||
| SBA Communications Corp., 3.125%, 2/01/2029 | 1,060,000 | 884,948 | ||
| Sprint Capital Corp., 6.875%, 11/15/2028 | 1,065,000 | 1,128,485 | ||
| Sprint Corp., 7.625%, 3/01/2026 | 838,000 | 881,351 | ||
| T-Mobile USA, Inc., 3.875%, 4/15/2030 | 181,000 | 166,237 | ||
| $5,930,042 | ||||
| Issuer | Shares/Par | Value ($) | ||
| Bonds – continued | ||||
| Telephone Services – 0.0% | ||||
| TELUS Corp., 2.85%, 11/13/2031 | CAD | 225,000 | $142,878 | |
| Tobacco – 0.2% | ||||
| B.A.T. Capital Corp., 2.125%, 8/15/2025 | GBP | 110,000 | $121,029 | |
| Philip Morris International, Inc., 5.125%, 11/17/2027 | $ | 49,000 | 49,104 | |
| Vector Group Ltd., 5.75%, 2/01/2029 (n) | 425,000 | 369,142 | ||
| $539,275 | ||||
| Transportation - Services – 0.2% | ||||
| ERAC USA Finance LLC, 7%, 10/15/2037 (n) | $ | 120,000 | $130,531 | |
| Holding d'Infrastructures de Transport, 1.475%, 1/18/2031 | EUR | 100,000 | 83,324 | |
| Q-Park Holding I B.V., 2%, 3/01/2027 | 380,000 | 332,852 | ||
| Triton International Ltd., 3.15%, 6/15/2031 (n) | $ | 104,000 | 82,022 | |
| $628,729 | ||||
| U.S. Treasury Obligations – 16.4% | ||||
| U.S. Treasury Bill, 0%, 8/10/2023 | $ | 555,000 | $537,921 | |
| U.S. Treasury Bonds, 1.125%, 8/15/2040 (f) | 28,088,000 | 17,839,172 | ||
| U.S. Treasury Bonds, 2.25%, 8/15/2049 | 115,500 | 83,913 | ||
| U.S. Treasury Bonds, 2.375%, 11/15/2049 (f) | 26,583,000 | 19,868,716 | ||
| U.S. Treasury Notes, 2.375%, 5/15/2029 | 12,006,000 | 11,045,989 | ||
| $49,375,711 | ||||
| Utilities - Electric Power – 3.7% | ||||
| Adani Green Energy (UP) Ltd./Prayatna Developers Private Ltd., 6.25%, 12/10/2024 (n) | $ | 1,081,000 | $1,033,760 | |
| American Transmission Systems, Inc., 2.65%, 1/15/2032 (n) | 146,000 | 119,225 | ||
| Bruce Power LP, 2.68%, 12/21/2028 | CAD | 200,000 | 133,893 | |
| Calpine Corp., 4.5%, 2/15/2028 (n) | $ | 927,000 | 847,976 | |
| Calpine Corp., 5.125%, 3/15/2028 (n) | 890,000 | 797,129 | ||
| Clearway Energy Operating LLC, 4.75%, 3/15/2028 (n) | 455,000 | 420,313 | ||
| Clearway Energy Operating LLC, 3.75%, 2/15/2031 (n) | 1,830,000 | 1,550,358 | ||
| ContourGlobal Power Holdings S.A., 2.75%, 1/01/2026 (n) | EUR | 280,000 | 254,947 | |
| Duke Energy Corp., 2.55%, 6/15/2031 | $ | 204,000 | 167,783 | |
| E.CL S.A., 4.5%, 1/29/2025 | 300,000 | 287,250 | ||
| Enel Finance International N.V., 3.5%, 4/06/2028 (n) | 200,000 | 176,126 | ||
| Enel Finance International N.V., 2.25%, 7/12/2031 (n) | 200,000 | 149,129 | ||
| Enel S.p.A., 2.25% to 3/10/2027, FLR (EUR Swap Rate - 5yr. + 2.679%) to 3/10/2032, FLR (EUR Swap Rate - 5yr. + 2.929%) to 3/10/2047, FLR (EUR Swap Rate - 5yr. + 3.679%) to 3/10/2070 | EUR | 100,000 | 89,407 | |
| Issuer | Shares/Par | Value ($) | ||
| Bonds – continued | ||||
| Utilities - Electric Power – continued | ||||
| Enel S.p.A., 1.875% to 9/08/2030, FLR (EUR Swap Rate - 5yr. + 2.011%) to 9/08/2035, FLR (EUR Swap Rate - 5yr. + 2.261%) to 9/08/2050, FLR (EUR Swap Rate - 5yr. + 3.011%) to 3/08/2170 | EUR | 150,000 | $111,809 | |
| Jersey Central Power & Light Co., 2.75%, 3/01/2032 (n) | $ | 98,000 | 79,694 | |
| Listrindo Capital B.V., 4.95%, 9/14/2026 | 200,000 | 184,307 | ||
| Mong Duong Finance Holdings B.V., 5.125%, 5/07/2029 (n) | 280,000 | 238,000 | ||
| Mong Duong Finance Holdings B.V., 5.125%, 5/07/2029 | 592,000 | 503,200 | ||
| National Grid Electricity Transmission PLC, 2%, 4/17/2040 | GBP | 100,000 | 76,652 | |
| NextEra Energy, Inc., 4.25%, 7/15/2024 (n) | $ | 528,000 | 510,202 | |
| NextEra Energy, Inc., 4.25%, 9/15/2024 (n) | 102,000 | 95,985 | ||
| NextEra Energy, Inc., 4.5%, 9/15/2027 (n) | 490,000 | 461,212 | ||
| Southern California Edison Co., 3.65%, 2/01/2050 | 104,000 | 77,601 | ||
| Star Energy Geothermal (Wayang Windu) Ltd., 6.75%, 4/24/2033 (n) | 732,963 | 686,595 | ||
| TerraForm Global Operating LLC, 6.125%, 3/01/2026 (n) | 545,000 | 509,973 | ||
| TerraForm Power Operating LLC, 5%, 1/31/2028 (n) | 1,060,000 | 983,150 | ||
| TerraForm Power Operating LLC, 4.75%, 1/15/2030 (n) | 445,000 | 400,500 | ||
| Virginia Electric & Power Co., 3.5%, 3/15/2027 | 200,000 | 190,167 | ||
| WEC Energy Group, Inc., 1.8%, 10/15/2030 | 37,000 | 29,216 | ||
| Xcel Energy, Inc., 4.6%, 6/01/2032 | 46,000 | 44,218 | ||
| $11,209,777 | ||||
| Total Bonds (Identified Cost, $440,534,443) | $389,734,561 | |||
| Exchange-Traded Funds – 1.0% | ||||
| Fixed Income ETFs – 1.0% | ||||
| iShares iBoxx $ Investment Grade Corporate Bond ETF (Identified Cost, $2,878,165) | 28,549 | $3,076,440 | ||
| Common Stocks – 0.2% | ||||
| Cable TV – 0.1% | ||||
| Intelsat Emergence S.A. (a) | 7,057 | $155,254 | ||
| Construction – 0.0% | ||||
| ICA Tenedora, S.A. de C.V. (u) | 110,829 | $97,652 | ||
| Oil Services – 0.1% | ||||
| LTRI Holdings LP (a)(u) | 615 | $252,931 | ||
| Total Common Stocks (Identified Cost, $815,792) | $505,837 | |||
| Issuer | Shares/Par | Value ($) | ||
| Contingent Value Rights – 0.0% | ||||
| Cable TV – 0.0% | ||||
| Intelsat Jackson Holdings S.A. - Series A, 12/05/2025 (a) | 738 | $4,797 | ||
| Intelsat Jackson Holdings S.A. - Series B, 12/05/2025 (a) | 738 | 4,244 | ||
| Total Contingent Value Rights (Identified Cost, $0) | $9,041 | |||
| Strike Price | First Exercise | |||
| Warrants – 0.0% | ||||
| Other Banks & Diversified Financials – 0.0% | ||||
| Avation Capital S.A. (1 share for 1 warrant, Expiration 10/31/26) (a) (Identified Cost, $0) | GBP 1.14 | 3/16/21 | 6,125 | $1,476 |
| Investment Companies (h) – 2.2% | ||||
| Money Market Funds – 2.2% | ||||
| MFS Institutional Money Market Portfolio, 3.67% (v) (Identified Cost, $6,670,045) | 6,670,335 | $6,670,335 | ||
| Underlying/Expiration Date/Exercise Price | Put/Call | Counterparty | Notional Amount | Par Amount/ Number of Contracts | |
| Purchased Options – 0.0% | |||||
| Market Index Securities – 0.0% | |||||
| iTraxx Europe Crossover Series 38 Index Credit Default Swap-Fund pays 5%, Fund receives notional amount upon a defined credit event of an index constituent – February 2023 @ EUR 90 (Premiums Paid, $18,224) | Call | Merrill Lynch International | $ 12,593,441 | EUR 12,030,000 | $36,143 |
| Other Assets, Less Liabilities – (33.1)% | (99,455,938) | |||
| Net Assets – 100.0% | $300,577,895 | |||
| (a) | Non-income producing security. | |||
| (f) | All or a portion of the security has been segregated as collateral for open futures contracts and cleared swap agreements. | |||
| (h) | An affiliated issuer, which may be considered one in which the fund owns 5% or more of the outstanding voting securities, or a company which is under common control. At period end, the aggregate values of the fund's investments in affiliated issuers and in unaffiliated issuers were $6,670,335 and $393,363,498, respectively. | |||
| (i) | Interest only security for which the fund receives interest on notional principal (Par amount). Par amount shown is the notional principal and does not reflect the cost of the security. |
| (n) | Securities exempt from registration under Rule 144A of the Securities Act of 1933. These securities may be sold in the ordinary course of business in transactions exempt from registration, normally to qualified institutional buyers. At period end, the aggregate value of these securities was $204,321,503, representing 68.0% of net assets. | |||
| (p) | Payment-in-kind (PIK) security for which interest income may be received in additional securities and/or cash. | |||
| (u) | The security was valued using significant unobservable inputs and is considered level 3 under the fair value hierarchy. For further information about the fund’s level 3 holdings, please see Note 2 in the Notes to Financial Statements. | |||
| (v) | Affiliated issuer that is available only to investment companies managed by MFS. The rate quoted for the MFS Institutional Money Market Portfolio is the annualized seven-day yield of the fund at period end. | |||
| (w) | When-issued security. |
| The following abbreviations are used in this report and are defined: | |
| AGM | Assured Guaranty Municipal |
| CDO | Collateralized Debt Obligation |
| CLO | Collateralized Loan Obligation |
| CMT | Constant Maturity Treasury |
| ETF | Exchange-Traded Fund |
| EURIBOR | Euro Interbank Offered Rate |
| FLR | Floating Rate. Interest rate resets periodically based on the parenthetically disclosed reference rate plus a spread (if any). The period-end rate reported may not be the current rate. All reference rates are USD unless otherwise noted. |
| ICE | Intercontinental Exchange |
| LIBOR | London Interbank Offered Rate |
| NPFG | National Public Finance Guarantee Corp. |
| REIT | Real Estate Investment Trust |
| SOFR | Secured Overnight Financing Rate |
| SONIA | Sterling Overnight Index Average |
| TBA | To Be Announced |
| UMBS | Uniform Mortgage-Backed Security |
| Abbreviations indicate amounts shown in currencies other than the U.S. dollar. All amounts are stated in U.S. dollars unless otherwise indicated. A list of abbreviations is shown below: | |
| AUD | Australian Dollar |
| BRL | Brazilian Real |
| CAD | Canadian Dollar |
| CNH | Chinese Yuan Renminbi (Offshore) |
| CNY | China Yuan Renminbi |
| CZK | Czech Koruna |
| EUR | Euro |
| GBP | British Pound |
| JPY | Japanese Yen |
| KRW | South Korean Won |
| MXN | Mexican Peso |
| NOK | Norwegian Krone |
| NZD | New Zealand Dollar |
| SEK | Swedish Krona |
| SGD | Singapore Dollar |
| THB | Thai Baht |
| TWD | Taiwan Dollar |
| UYU | Uruguayan Peso |
| Forward Foreign Currency Exchange Contracts | ||||||
| Currency Purchased | Currency Sold | Counterparty | Settlement Date | Unrealized Appreciation (Depreciation) | ||
| Asset Derivatives | ||||||
| AUD | 5,919,770 | USD | 3,854,291 | Brown Brothers Harriman | 1/20/2023 | $172,177 |
| AUD | 784,833 | USD | 514,290 | Goldman Sachs International | 1/20/2023 | 19,533 |
| AUD | 1,615,537 | USD | 1,048,374 | Merrill Lynch International | 1/20/2023 | 50,470 |
| AUD | 1,033,178 | USD | 650,378 | State Street Bank Corp. | 1/20/2023 | 52,361 |
| BRL | 3,082,312 | USD | 567,840 | Goldman Sachs International | 2/02/2023 | 19,105 |
| BRL | 18,009,919 | USD | 3,412,446 | JPMorgan Chase Bank N.A. | 2/02/2023 | 17,068 |
| CAD | 2,001,130 | USD | 1,457,038 | Deutsche Bank AG | 1/20/2023 | 31,801 |
| CAD | 3,523,374 | USD | 2,559,097 | HSBC Bank | 1/20/2023 | 62,290 |
| CAD | 407,231 | USD | 302,561 | JPMorgan Chase Bank N.A. | 1/20/2023 | 418 |
| CNH | 4,197,000 | USD | 585,356 | Citibank N.A. | 1/20/2023 | 12,610 |
| CNH | 2,510,663 | USD | 348,994 | HSBC Bank | 1/20/2023 | 8,712 |
| CNH | 4,271,685 | USD | 608,463 | State Street Bank Corp. | 1/20/2023 | 143 |
| CZK | 2,916,543 | USD | 117,938 | Brown Brothers Harriman | 1/20/2023 | 6,433 |
| CZK | 13,424,119 | USD | 549,182 | Goldman Sachs International | 1/20/2023 | 23,267 |
| CZK | 23,886,067 | USD | 1,012,700 | JPMorgan Chase Bank N.A. | 1/20/2023 | 5,882 |
| EUR | 152,485 | USD | 154,486 | Brown Brothers Harriman | 1/20/2023 | 4,828 |
| EUR | 1,265,437 | USD | 1,283,896 | Deutsche Bank AG | 1/20/2023 | 38,201 |
| EUR | 5,907,493 | USD | 5,952,660 | HSBC Bank | 1/20/2023 | 219,337 |
| EUR | 515,788 | USD | 505,158 | HSBC Bank | 1/30/2023 | 34,096 |
| EUR | 4,234,567 | USD | 4,302,727 | JPMorgan Chase Bank N.A. | 1/20/2023 | 121,441 |
| EUR | 618,935 | USD | 644,582 | NatWest Markets PLC | 1/20/2023 | 2,065 |
| EUR | 2,421,533 | USD | 2,466,483 | State Street Bank Corp. | 1/20/2023 | 63,472 |
| EUR | 734,432 | USD | 745,224 | UBS AG | 1/20/2023 | 22,094 |
| GBP | 1,346,185 | USD | 1,531,128 | Goldman Sachs International | 1/20/2023 | 94,115 |
| GBP | 524,954 | USD | 618,573 | HSBC Bank | 1/20/2023 | 15,201 |
| GBP | 4,878,686 | USD | 5,591,127 | JPMorgan Chase Bank N.A. | 1/20/2023 | 298,890 |
| GBP | 85,280 | USD | 95,988 | NatWest Markets PLC | 1/20/2023 | 6,971 |
| GBP | 686,547 | USD | 801,475 | State Street Bank Corp. | 1/20/2023 | 27,391 |
| GBP | 173,852 | USD | 199,843 | UBS AG | 1/20/2023 | 10,048 |
| JPY | 18,750,216 | USD | 129,282 | Citibank N.A. | 1/20/2023 | 7,385 |
| JPY | 56,254,746 | USD | 380,268 | Deutsche Bank AG | 1/20/2023 | 29,763 |
| JPY | 3,599,460 | USD | 24,558 | HSBC Bank | 1/20/2023 | 1,678 |
| JPY | 235,301,782 | USD | 1,673,188 | JPMorgan Chase Bank N.A. | 1/20/2023 | 41,884 |
| KRW | 411,370,733 | USD | 289,317 | Barclays Bank PLC | 1/20/2023 | 22,943 |
| KRW | 744,800,030 | USD | 545,881 | Citibank N.A. | 1/13/2023 | 19,325 |
| KRW | 1,734,733,335 | USD | 1,296,318 | JPMorgan Chase Bank N.A. | 1/25/2023 | 20,717 |
| MXN | 8,728,201 | USD | 428,763 | Goldman Sachs International | 1/20/2023 | 19,781 |
| MXN | 7,552,909 | USD | 371,029 | HSBC Bank | 1/20/2023 | 17,117 |
| MXN | 1,631,642 | USD | 79,170 | JPMorgan Chase Bank N.A. | 3/15/2023 | 3,861 |
| NZD | 4,599,167 | USD | 2,608,562 | BNP Paribas S.A. | 1/20/2023 | 291,609 |
| NZD | 952,182 | USD | 567,235 | Brown Brothers Harriman | 1/20/2023 | 33,197 |
| NZD | 6,696,853 | USD | 3,833,085 | Citibank N.A. | 1/20/2023 | 389,859 |
| NZD | 12,816,397 | USD | 7,472,634 | Goldman Sachs International | 1/20/2023 | 609,212 |
| NZD | 1,828,107 | USD | 1,064,153 | HSBC Bank | 1/20/2023 | 88,626 |
| Forward Foreign Currency Exchange Contracts - continued | ||||||
| Currency Purchased | Currency Sold | Counterparty | Settlement Date | Unrealized Appreciation (Depreciation) | ||
| Asset Derivatives - continued | ||||||
| NZD | 2,285,657 | USD | 1,320,657 | NatWest Markets PLC | 1/20/2023 | $120,647 |
| NZD | 9,607,145 | USD | 5,442,735 | State Street Bank Corp. | 1/20/2023 | 615,399 |
| SEK | 8,231,142 | USD | 730,831 | Citibank N.A. | 1/20/2023 | 55,735 |
| SEK | 448,000 | USD | 40,210 | Deutsche Bank AG | 1/20/2023 | 2,601 |
| SGD | 8,415,117 | USD | 5,903,971 | State Street Bank Corp. | 1/20/2023 | 282,147 |
| THB | 53,022,322 | USD | 1,500,764 | Barclays Bank PLC | 2/21/2023 | 15,514 |
| USD | 213,196 | AUD | 312,903 | UBS AG | 1/20/2023 | 368 |
| USD | 148,828 | CAD | 197,805 | Brown Brothers Harriman | 1/20/2023 | 1,661 |
| USD | 149,333 | CAD | 199,419 | State Street Bank Corp. | 1/20/2023 | 966 |
| USD | 242,140 | CAD | 324,930 | UBS AG | 1/20/2023 | 392 |
| USD | 135,307 | EUR | 129,227 | Deutsche Bank AG | 1/20/2023 | 294 |
| USD | 167,086 | EUR | 159,715 | HSBC Bank | 1/20/2023 | 220 |
| USD | 74,774 | KRW | 98,499,000 | Barclays Bank PLC | 1/13/2023 | 25 |
| USD | 1,814,505 | SGD | 2,467,469 | Brown Brothers Harriman | 1/20/2023 | 620 |
| USD | 466,992 | TWD | 14,215,246 | Merrill Lynch International | 3/01/2023 | 3,061 |
| $4,137,027 | ||||||
| Liability Derivatives | ||||||
| CAD | 4,243,303 | USD | 3,172,063 | State Street Bank Corp. | 1/20/2023 | $(15,050) |
| CNH | 5,954,593 | USD | 848,851 | JPMorgan Chase Bank N.A. | 1/20/2023 | (474) |
| EUR | 19,881 | USD | 20,781 | Brown Brothers Harriman | 1/20/2023 | (10) |
| EUR | 231,598 | USD | 242,400 | State Street Bank Corp. | 1/20/2023 | (432) |
| GBP | 500,487 | USD | 605,484 | Merrill Lynch International | 1/20/2023 | (1,248) |
| KRW | 1,298,204,605 | USD | 987,228 | Citibank N.A. | 1/13/2023 | (2,060) |
| THB | 52,960,302 | USD | 1,524,915 | Barclays Bank PLC | 2/21/2023 | (10,411) |
| USD | 987,991 | AUD | 1,479,524 | Citibank N.A. | 1/20/2023 | (18,342) |
| USD | 4,739,991 | AUD | 7,500,307 | Deutsche Bank AG | 1/20/2023 | (361,516) |
| USD | 478,404 | AUD | 712,173 | Goldman Sachs International | 1/20/2023 | (5,997) |
| USD | 119,336 | AUD | 185,805 | HSBC Bank | 1/20/2023 | (7,044) |
| USD | 902,340 | AUD | 1,342,071 | NatWest Markets PLC | 1/20/2023 | (10,500) |
| USD | 8,509,090 | AUD | 13,580,019 | State Street Bank Corp. | 1/20/2023 | (727,672) |
| USD | 554,928 | BRL | 3,026,021 | Citibank N.A. | 2/02/2023 | (21,298) |
| USD | 2,326,265 | BRL | 12,581,603 | JPMorgan Chase Bank N.A. | 2/02/2023 | (69,569) |
| USD | 1,022,925 | BRL | 5,527,169 | Merrill Lynch International | 2/02/2023 | (29,579) |
| USD | 5,896,196 | CAD | 7,987,827 | Citibank N.A. | 1/20/2023 | (46,741) |
| USD | 59,567 | CAD | 81,605 | Deutsche Bank AG | 1/20/2023 | (1,147) |
| USD | 2,893,042 | CAD | 3,936,176 | Goldman Sachs International | 1/20/2023 | (35,470) |
| USD | 634,117 | CAD | 869,201 | HSBC Bank | 1/20/2023 | (12,567) |
| USD | 2,874,909 | CAD | 3,963,104 | JPMorgan Chase Bank N.A. | 1/20/2023 | (73,637) |
| USD | 117,467 | CAD | 161,823 | UBS AG | 1/20/2023 | (2,929) |
| USD | 147,880 | CNH | 1,077,618 | Brown Brothers Harriman | 1/20/2023 | (5,653) |
| USD | 7,852,070 | CNH | 56,235,739 | JPMorgan Chase Bank N.A. | 1/20/2023 | (160,085) |
| USD | 1,289,549 | CNH | 9,200,511 | State Street Bank Corp. | 1/20/2023 | (21,289) |
| USD | 1,605,030 | CZK | 40,302,299 | Deutsche Bank AG | 1/20/2023 | (113,595) |
| USD | 597,069 | EUR | 575,659 | Barclays Bank PLC | 1/20/2023 | (4,365) |
| USD | 571,835 | EUR | 564,247 | Brown Brothers Harriman | 1/20/2023 | (17,675) |
| Forward Foreign Currency Exchange Contracts - continued | ||||||
| Currency Purchased | Currency Sold | Counterparty | Settlement Date | Unrealized Appreciation (Depreciation) | ||
| Liability Derivatives - continued | ||||||
| USD | 57,949 | EUR | 55,506 | Citibank N.A. | 1/20/2023 | $(42) |
| USD | 118,531 | EUR | 118,288 | Deutsche Bank AG | 1/20/2023 | (5,053) |
| USD | 36,388,361 | EUR | 36,925,871 | HSBC Bank | 1/20/2023 | (2,190,855) |
| USD | 678,764 | EUR | 663,216 | JPMorgan Chase Bank N.A. | 1/20/2023 | (14,147) |
| USD | 4,390,612 | EUR | 4,442,331 | State Street Bank Corp. | 1/20/2023 | (250,623) |
| USD | 645,209 | EUR | 647,588 | UBS AG | 1/20/2023 | (31,374) |
| USD | 1,769,210 | GBP | 1,554,747 | Brown Brothers Harriman | 1/20/2023 | (107,830) |
| USD | 108,656 | GBP | 91,702 | Deutsche Bank AG | 1/20/2023 | (2,055) |
| USD | 56,015 | GBP | 50,095 | Deutsche Bank AG | 1/30/2023 | (4,479) |
| USD | 2,261,438 | GBP | 1,987,307 | HSBC Bank | 1/20/2023 | (137,830) |
| USD | 730,457 | GBP | 640,099 | JPMorgan Chase Bank N.A. | 1/20/2023 | (42,331) |
| USD | 96,730 | GBP | 86,345 | NatWest Markets PLC | 1/20/2023 | (7,513) |
| USD | 15,329,952 | GBP | 13,635,951 | State Street Bank Corp. | 1/20/2023 | (1,132,677) |
| USD | 491,616 | GBP | 428,246 | State Street Bank Corp. | 1/30/2023 | (25,535) |
| USD | 229,978 | GBP | 199,813 | UBS AG | 1/20/2023 | (11,256) |
| USD | 495,957 | JPY | 71,472,726 | Citibank N.A. | 1/20/2023 | (24,994) |
| USD | 4,411,770 | JPY | 652,521,756 | Deutsche Bank AG | 1/20/2023 | (344,343) |
| USD | 397,191 | KRW | 564,607,000 | Barclays Bank PLC | 1/13/2023 | (31,272) |
| USD | 78,557 | KRW | 105,738,337 | Citibank N.A. | 1/13/2023 | (1,684) |
| USD | 5,557,211 | KRW | 7,914,413,068 | Citibank N.A. | 2/02/2023 | (453,355) |
| USD | 2,258,227 | KRW | 3,205,937,069 | Merrill Lynch International | 1/25/2023 | (175,768) |
| USD | 117,731 | KRW | 167,390,596 | Merrill Lynch International | 2/02/2023 | (9,393) |
| USD | 691,444 | MXN | 14,131,067 | Citibank N.A. | 1/20/2023 | (34,755) |
| USD | 171,166 | MXN | 3,484,054 | Deutsche Bank AG | 1/20/2023 | (7,880) |
| USD | 251,119 | NOK | 2,659,305 | Citibank N.A. | 1/20/2023 | (19,397) |
| USD | 15,936,092 | NZD | 28,057,328 | State Street Bank Corp. | 1/20/2023 | (1,756,476) |
| USD | 13,278 | NZD | 22,807 | UBS AG | 1/20/2023 | (1,104) |
| USD | 793,631 | SEK | 8,842,242 | Deutsche Bank AG | 1/20/2023 | (51,332) |
| USD | 999,909 | SGD | 1,375,020 | Brown Brothers Harriman | 1/20/2023 | (10,895) |
| USD | 278,123 | SGD | 380,771 | State Street Bank Corp. | 1/20/2023 | (1,789) |
| USD | 809,329 | TWD | 25,348,171 | Barclays Bank PLC | 1/13/2023 | (13,909) |
| USD | 581,123 | TWD | 18,550,834 | BNP Paribas S.A. | 1/13/2023 | (21,356) |
| USD | 1,633,196 | TWD | 52,259,021 | Merrill Lynch International | 2/03/2023 | (67,493) |
| $(8,767,150) | ||||||
| Futures Contracts | ||||||
| Description | Long/ Short | Currency | Contracts | Notional Amount | Expiration Date | Value/Unrealized Appreciation (Depreciation) |
| Asset Derivatives | ||||||
| Interest Rate Futures | ||||||
| Canadian Treasury Bond 10 yr | Long | CAD | 121 | $11,310,664 | March – 2023 | $70,764 |
| Euro-Bobl 5 yr | Short | EUR | 187 | 23,356,902 | December – 2022 | 291,326 |
| Euro-Bund 10 yr | Long | EUR | 68 | 9,968,781 | December – 2022 | 194,824 |
| Futures Contracts - continued | ||||||
| Description | Long/ Short | Currency | Contracts | Notional Amount | Expiration Date | Value/Unrealized Appreciation (Depreciation) |
| Asset Derivatives - continued | ||||||
| Interest Rate Futures - continued | ||||||
| Euro-Bund 10 yr | Short | EUR | 1 | $145,923 | March – 2023 | $29 |
| Euro-Buxl 30 yr | Long | EUR | 40 | 6,589,079 | December – 2022 | 122,703 |
| Euro-Schatz 2 yr | Short | EUR | 202 | 22,445,284 | December – 2022 | 229,277 |
| Long Gilt 10 yr | Long | GBP | 9 | 1,138,853 | March – 2023 | 1,925 |
| U.S. Treasury Bond | Long | USD | 15 | 1,905,000 | March – 2023 | 7,210 |
| U.S. Treasury Note 2 yr | Long | USD | 63 | 12,937,641 | March – 2023 | 27,047 |
| $945,105 | ||||||
| Liability Derivatives | ||||||
| Interest Rate Futures | ||||||
| Australian Bond 10 yr | Short | AUD | 142 | $11,629,471 | December – 2022 | $(111,009) |
| Canadian Treasury Bond 5 yr | Short | CAD | 174 | 14,544,519 | March – 2023 | (52,155) |
| Euro-BTP 10 yr | Short | EUR | 36 | 4,469,169 | December – 2022 | (119,292) |
| Euro-Buxl 30 yr | Short | EUR | 13 | 2,126,841 | March – 2023 | (23,746) |
| Japan Government Bond 10 yr | Short | JPY | 6 | 6,461,872 | December – 2022 | (14,838) |
| U.S. Treasury Note 10 yr | Short | USD | 145 | 16,457,500 | March – 2023 | (52,197) |
| U.S. Treasury Note 5 yr | Short | USD | 466 | 50,593,766 | March – 2023 | (252,458) |
| U.S. Treasury Ultra Bond | Short | USD | 143 | 19,488,219 | March – 2023 | (78,088) |
| U.S. Treasury Ultra Note 10 yr | Long | USD | 36 | 4,307,625 | March – 2023 | (6,318) |
| $(710,101) | ||||||
| Cleared Swap Agreements | ||||||||||
| Maturity Date | Notional Amount | Counterparty | Cash Flows to Receive/ Frequency | Cash Flows to Pay/ Frequency | Unrealized Appreciation (Depreciation) | Net Unamortized Upfront Payments (Receipts) | Value | |||
| Liability Derivatives | ||||||||||
| Credit Default Swaps | ||||||||||
| 12/20/27 | EUR | 6,390,000 | centrally cleared | (1) | 1.00%/Quarterly | $(16,636) | $(23,093) | $(39,729) | ||
| Uncleared Swap Agreements | ||||||||||
| Maturity Date | Notional Amount | Counterparty | Cash Flows to Receive/ Frequency | Cash Flows to Pay/ Frequency | Unrealized Appreciation (Depreciation) | Net Unamortized Upfront Payments (Receipts) | Value | |||
| Asset Derivatives | ||||||||||
| Credit Default Swaps | ||||||||||
| 12/20/27 | EUR | 110,000 | Barclays Bank PLC | 1.00%/Quarterly | (2) | $2,993 | $(2,675) | $318 | ||
| Liability Derivatives | ||||||||||
| Credit Default Swaps | ||||||||||
| 12/20/31 | EUR | 150,000 | Barclays Bank PLC | 1.00%/Quarterly | (3) | $(3,377) | $1,496 | $(1,881) | ||
| (1) | Fund, as protection buyer, to receive notional amount upon a defined credit event by a reference obligation specified in the iTraxx Europe Crossover Series 38 Index. |
| (2) | Fund, as protection seller, to pay notional amount upon a defined credit event by Airbus SE, 2.375%, 4/02/24, an A rated bond. The fund entered into the contract to gain issuer exposure. |
| (3) | Fund, as protection seller, to pay notional amount upon a defined credit event by Mercedes-Benz Group AG, 1.4%, 1/12/24, an A- rated bond. The fund entered into the contract to gain issuer exposure. |
| Assets | |
| Investments in unaffiliated issuers, at value (identified cost, $444,246,624) | $393,363,498 |
| Investments in affiliated issuers, at value (identified cost, $6,670,045) | 6,670,335 |
| Cash | 568,013 |
| Foreign currency, at value (identified cost, $121,343) | 121,433 |
| Restricted cash for | |
| Forward foreign currency exchange contracts | 990,000 |
| Receivables for | |
| Forward foreign currency exchange contracts | 4,137,027 |
| Investments sold | 2,808,234 |
| TBA sale commitments | 101,136 |
| Interest | 5,102,253 |
| Uncleared swaps, at value (net of unamortized premiums received, $2,675) | 318 |
| Other assets | 3,689 |
| Total assets | $413,865,936 |
| Liabilities | |
| Notes payable | $100,000,000 |
| Payables for | |
| Distributions | 345 |
| Net daily variation margin on open cleared swap agreements | 46 |
| Forward foreign currency exchange contracts | 8,767,150 |
| Net daily variation margin on open futures contracts | 229,936 |
| Investments purchased | 1,849,096 |
| TBA purchase commitments | 1,357,620 |
| When-issued investments purchased | 653,996 |
| Uncleared swaps, at value (net of unamortized premiums paid, $1,496) | 1,881 |
| Payable to affiliates | |
| Investment adviser | 9,334 |
| Administrative services fee | 298 |
| Transfer agent and dividend disbursing costs | 2,418 |
| Payable for independent Trustees' compensation | 10 |
| Accrued interest expense | 130,156 |
| Deferred country tax expense payable | 133,406 |
| Accrued expenses and other liabilities | 152,349 |
| Total liabilities | $113,288,041 |
| Net assets | $300,577,895 |
| Net assets consist of | |
| Paid-in capital | $371,087,585 |
| Total distributable earnings (loss) | (70,509,690) |
| Net assets | $300,577,895 |
| Shares of beneficial interest outstanding | 44,008,380 |
| Net asset value per share (net assets of $300,577,895 / 44,008,380 shares of beneficial interest outstanding) | $6.83 |
| Net investment income (loss) | |
| Income | |
| Interest | $19,072,819 |
| Dividends from affiliated issuers | 167,912 |
| Dividends | 41,082 |
| Other | 12,562 |
| Foreign taxes withheld | (6,405) |
| Total investment income | $19,287,970 |
| Expenses | |
| Management fee | $1,873,016 |
| Transfer agent and dividend disbursing costs | 45,621 |
| Administrative services fee | 59,453 |
| Independent Trustees' compensation | 8,104 |
| Stock exchange fee | 43,315 |
| Custodian fee | 57,466 |
| Shareholder communications | 143,759 |
| Audit and tax fees | 98,020 |
| Legal fees | 730 |
| Interest expense and fees | 2,057,231 |
| Miscellaneous | 63,143 |
| Total expenses | $4,449,858 |
| Net investment income (loss) | $14,838,112 |
| Realized and unrealized gain (loss) | |
| Realized gain (loss) (identified cost basis) | |
| Unaffiliated issuers (net of $37,413 country tax) | $(32,406,299) |
| Affiliated issuers | (287) |
| Written options | 90,456 |
| Futures contracts | 15,068,263 |
| Swap agreements | (466,954) |
| Forward foreign currency exchange contracts | 12,592,847 |
| Foreign currency | 1,976,483 |
| Net realized gain (loss) | $(3,145,491) |
| Change in unrealized appreciation or depreciation | |
| Unaffiliated issuers (net of $4,002 increase in deferred country tax) | $(46,418,416) |
| Affiliated issuers | 290 |
| Futures contracts | 1,642,736 |
| Swap agreements | (15,838) |
| Forward foreign currency exchange contracts | (5,792,323) |
| Translation of assets and liabilities in foreign currencies | 33,584 |
| Net unrealized gain (loss) | $(50,549,967) |
| Net realized and unrealized gain (loss) | $(53,695,458) |
| Change in net assets from operations | $(38,857,346) |
| Year ended | ||
| 11/30/22 | 11/30/21 | |
| Change in net assets | ||
| From operations | ||
| Net investment income (loss) | $14,838,112 | $15,604,143 |
| Net realized gain (loss) | (3,145,491) | 12,111,890 |
| Net unrealized gain (loss) | (50,549,967) | (23,871,339) |
| Change in net assets from operations | $(38,857,346) | $3,844,694 |
| Distributions to shareholders | $(18,849,582) | $(18,569,733) |
| Tax return of capital distributions to shareholders | $(7,693,993) | $(12,344,248) |
| Change in net assets from fund share transactions | $(2,988,186) | $1,498,406 |
| Total change in net assets | $(68,389,107) | $(25,570,881) |
| Net assets | ||
| At beginning of period | 368,967,002 | 394,537,883 |
| At end of period | $300,577,895 | $368,967,002 |
| Cash flows from operating activities: | |
| Change in net assets from operations | $(38,857,346) |
| Adjustments to reconcile change in net assets from operations to net cash provided by operating activities: | |
| Purchase of investment securities | (347,701,541) |
| Proceeds from disposition of investment securities | 333,329,066 |
| Proceeds from disposition of short-term investments, net | 201,305 |
| Realized gain/loss on investments | 32,368,886 |
| Unrealized appreciation/depreciation on investments | 46,414,124 |
| Unrealized appreciation/depreciation on foreign currency contracts | 5,792,323 |
| Unrealized appreciation/depreciation on swaps | 15,838 |
| Net amortization/accretion of income | (216,597) |
| Decrease in interest receivable | 34,958 |
| Increase in accrued expenses and other liabilities | 15,748 |
| Decrease in payable for net daily variation margin on open futures contracts | (302,329) |
| Increase in other assets | (29) |
| Increase in interest payable | 71,994 |
| Net cash provided by operating activities | $31,166,400 |
| Cash flows from financing activities: | |
| Distributions paid in cash | $(26,023,345) |
| Repurchase of shares of beneficial interest | (3,508,071) |
| Net cash used by financing activities | $(29,531,416) |
| Net increase in cash and restricted cash | $1,634,984 |
| Cash and restricted cash: | |
| Beginning of period (including foreign currency of $40,055) | $44,462 |
| End of period (including foreign currency of $121,433) | $1,679,446 |
| Year ended | |||||
| 11/30/22 | 11/30/21 | 11/30/20 | 11/30/19 | 11/30/18 | |
| Net asset value, beginning of period | $8.29 | $8.90 | $8.94 | $8.44 | $9.26 |
| Income (loss) from investment operations | |||||
| Net investment income (loss) (d) | $0.33 | $0.35 | $0.37 | $0.36 | $0.35 |
| Net realized and unrealized gain (loss) | (1.20) | (0.26) | 0.27 | 0.80 | (0.50) |
| Total from investment operations | $(0.87) | $0.09 | $0.64 | $1.16 | $(0.15) |
| Less distributions declared to shareholders | |||||
| From net investment income | $(0.42) | $(0.42) | $(0.40) | $(0.44) | $(0.43) |
| From tax return of capital | (0.18) | (0.28) | (0.30) | (0.26) | (0.28) |
| Total distributions declared to shareholders | $(0.60) | $(0.70) | $(0.70) | $(0.70) | $(0.71) |
| Net increase from repurchase of capital shares | $0.01 | $— | $0.02 | $0.04 | $0.04 |
| Net asset value, end of period (x) | $6.83 | $8.29 | $8.90 | $8.94 | $8.44 |
| Market value, end of period | $6.87 | $8.44 | $8.53 | $8.32 | $7.41 |
| Total return at market value (%) | (11.33) | 7.27 | 11.58 | 22.47 | (3.56) |
| Total return at net asset value (%) (j)(r)(s)(x) | (10.26) | 0.99 | 8.35 | 15.54 | (0.36) |
| Ratios (%) (to average net assets) and Supplemental data: | |||||
| Expenses | 1.37 | 0.91 | 1.02 | 1.40 | 1.26 |
| Net investment income (loss) | 4.56 | 4.06 | 4.20 | 4.11 | 4.00 |
| Portfolio turnover | 81 | 112 | 129 | 94 | 96 |
| Net assets at end of period (000 omitted) | $300,578 | $368,967 | $394,538 | $403,245 | $396,451 |
| Supplemental Ratios (%): | |||||
| Ratios of expenses to average net assets excluding interest expense and fees | 0.74 | 0.71 | 0.72 | 0.70 | 0.70 |
| Senior Securities: | |||||
| Total notes payable outstanding (000 omitted) | $100,000 | $100,000 | $100,000 | $100,000 | $100,000 |
| Asset coverage per $1,000 of indebtedness (k) | $4,006 | $4,690 | $4,945 | $5,032 | $4,965 |
| (d) | Per share data is based on average shares outstanding. |
| (j) | Total return at net asset value is calculated using the net asset value of the fund, not the publicly traded price and therefore may be different than the total return at market value. |
| (k) | Calculated by subtracting the fund's total liabilities (not including notes payable) from the fund's total assets and dividing this number by the notes payable outstanding and then multiplying by 1,000. |
| (r) | Certain expenses have been reduced without which performance would have been lower. |
| (s) | From time to time the fund may receive proceeds from litigation settlements, without which performance would be lower. |
| (x) | The net asset values and total returns at net asset value have been calculated on net assets which include adjustments made in accordance with U.S. generally accepted accounting principles required at period end for financial reporting purposes. |
| Financial Instruments | Level 1 | Level 2 | Level 3 | Total |
| Equity Securities: | ||||
| United States | $3,076,440 | $— | $252,931 | $3,329,371 |
| Luxembourg | — | 164,295 | — | 164,295 |
| Mexico | — | — | 97,652 | 97,652 |
| United Kingdom | — | 1,476 | — | 1,476 |
| U.S. Treasury Bonds & U.S. Government Agencies & Equivalents | — | 49,375,711 | — | 49,375,711 |
| Non - U.S. Sovereign Debt | — | 77,840,901 | — | 77,840,901 |
| Municipal Bonds | — | 2,188,769 | — | 2,188,769 |
| U.S. Corporate Bonds | — | 176,274,331 | — | 176,274,331 |
| Residential Mortgage-Backed Securities | — | 8,563,702 | — | 8,563,702 |
| Commercial Mortgage-Backed Securities | — | 5,849,570 | — | 5,849,570 |
| Asset-Backed Securities (including CDOs) | — | 7,362,921 | — | 7,362,921 |
| Foreign Bonds | — | 62,314,799 | — | 62,314,799 |
| Mutual Funds | 6,670,335 | — | — | 6,670,335 |
| Total | $9,746,775 | $389,936,475 | $350,583 | $400,033,833 |
| Other Financial Instruments | ||||
| Futures Contracts – Assets | $945,105 | $— | $— | $945,105 |
| Futures Contracts – Liabilities | (710,101) | — | — | (710,101) |
| Forward Foreign Currency Exchange Contracts – Assets | — | 4,137,027 | — | 4,137,027 |
| Forward Foreign Currency Exchange Contracts – Liabilities | — | (8,767,150) | — | (8,767,150) |
| Swap Agreements – Assets | — | 318 | — | 318 |
| Swap Agreements – Liabilities | — | (41,610) | — | (41,610) |
| Equity Securities | |
| Balance as of 11/30/21 | $265,542 |
| Change in unrealized appreciation or depreciation | 86,517 |
| Transfers out of level 3 | (1,476) |
| Balance as of 11/30/22 | $350,583 |
| Fair Value (a) | |||
| Risk | Derivative Contracts | Asset Derivatives | Liability Derivatives |
| Credit | Purchased Option Contracts | $36,143 | $— |
| Interest Rate | Futures Contracts | 945,105 | (710,101) |
| Foreign Exchange | Forward Foreign Currency Exchange Contracts | 4,137,027 | (8,767,150) |
| Credit | Cleared Swap Agreements | — | (39,729) |
| Credit | Uncleared Swap Agreements | 318 | (1,881) |
| Total | $5,118,593 | $(9,518,861) | |
| (a) | The value of purchased options outstanding is included in investments in unaffiliated issuers, at value, within the Statement of Assets and Liabilities. Values presented in this table for futures contracts and cleared swap agreements correspond to the values reported in the Portfolio of Investments. Only the current day net variation margin for futures contracts and cleared swap agreements is reported separately within the Statement of Assets and Liabilities. |
| Risk | Futures Contracts | Swap Agreements | Forward Foreign Currency Exchange Contracts | Unaffiliated Issuers (Purchased Options) | Written Options |
| Interest Rate | $15,068,263 | $— | $— | $487,928 | $— |
| Foreign Exchange | — | — | 12,592,847 | (62,097) | — |
| Credit | — | (466,954) | — | 25,972 | 90,456 |
| Total | $15,068,263 | $(466,954) | $12,592,847 | $451,803 | $90,456 |
| Risk | Futures Contracts | Swap Agreements | Forward Foreign Currency Exchange Contracts | Unaffiliated Issuers (Purchased Options) |
| Interest Rate | $1,642,736 | $— | $— | $(295,075) |
| Foreign Exchange | — | — | (5,792,323) | — |
| Credit | — | (15,838) | — | 17,919 |
| Total | $1,642,736 | $(15,838) | $(5,792,323) | $(277,156) |
| 11/30/22 | |
| Cash | $689,446 |
| Restricted cash | 990,000 |
| Restricted cash included in deposits with brokers | — |
| Total cash and restricted cash in the Statement of Cash Flows | $1,679,446 |
| Year ended 11/30/22 | Year ended 11/30/21 | |
| Ordinary income (including any short-term capital gains) | $18,849,582 | $18,569,733 |
| Tax return of capital (b) | 7,693,993 | 12,344,248 |
| Total distributions | $26,543,575 | $30,913,981 |
| (b) | Distributions in excess of tax basis earnings and profits are reported in the financial statements as a tax return of capital. |
| As of 11/30/22 | |
| Cost of investments | $454,746,553 |
| Gross appreciation | 9,472,011 |
| Gross depreciation | (68,621,142) |
| Net unrealized appreciation (depreciation) | $(59,149,131) |
| Capital loss carryforwards | (11,237,028) |
| Other temporary differences | (123,531) |
| Total distributable earnings (loss) | $(70,509,690) |
| Short-Term | $(5,913,761) |
| Long-Term | (5,323,267) |
| Total | $(11,237,028) |
| Purchases | Sales | |
| U.S. Government securities | $100,970,299 | $76,576,145 |
| Non-U.S. Government securities | 245,272,830 | 255,938,456 |
| Year ended 11/30/22 | Year ended 11/30/21 | ||||
| Shares | Amount | Shares | Amount | ||
| Shares issued to shareholders in reinvestment of distributions | 67,141 | $519,885 | 174,940 | $1,498,406 | |
| Capital shares repurchased | (548,673) | (3,508,071) | — | — | |
| Net change | (481,532) | $(2,988,186) | 174,940 | $1,498,406 | |
| Affiliated Issuers | Beginning Value | Purchases | Sales Proceeds | Realized Gain (Loss) | Change in Unrealized Appreciation or Depreciation | Ending Value |
| MFS Institutional Money Market Portfolio | $6,871,350 | $244,317,338 | $244,518,356 | $(287) | $290 | $6,670,335 |
| Affiliated Issuers | Dividend Income | Capital Gain Distributions |
| MFS Institutional Money Market Portfolio | $167,912 | $— |

January 13, 2023
| Number of Shares | ||||
| Nominee | For | Against/Withheld | ||
| Maureen R. Goldfarb | 36,594,165.589 | 813,442.614 | ||
| Maryanne L. Roepke | 35,853,686.589 | 1,553,921.614 | ||
| Laurie J. Thomsen | 36,595,404.271 | 812,203.932 | ||
| Name, Age | Position(s) Held with Fund | Trustee/Officer Since(h) | Term Expiring | Number of MFS Funds overseen by the Trustee | Principal Occupations During the Past Five Years | Other Directorships During the Past Five Years (j) | ||||||
| INTERESTED TRUSTEE | ||||||||||||
| Michael W. Roberge (k) (age 56) | Trustee | January 2021 | 2023 | 136 | Massachusetts Financial Services Company, Chairman (since January 2021); Chief Executive Officer (since January 2017); Director; Chairman of the Board (since January 2022); President (until December 2018); Chief Investment Officer (until December 2018) | N/A | ||||||
| INDEPENDENT TRUSTEES | ||||||||||||
| John P. Kavanaugh (age 68) | Trustee and Chair of Trustees | January 2009 | 2023 | 136 | Private investor | N/A | ||||||
| Steven E. Buller (age 71) | Trustee | February 2014 | 2023 | 136 | Private investor | N/A | ||||||
| John A. Caroselli (age 68) | Trustee | March 2017 | 2024 | 136 | Private investor; JC Global Advisors, LLC (management consulting), President (since 2015) | N/A | ||||||
| Maureen R. Goldfarb (age 67) | Trustee | January 2009 | 2025 | 136 | Private investor | N/A | ||||||
| Peter D. Jones (age 67) | Trustee | January 2019 | 2023 | 136 | Private investor | N/A | ||||||
| James W. Kilman, Jr. (age 61) | Trustee | January 2019 | 2024 | 136 | Burford Capital Limited (finance and investment management), Senior Advisor (since May 3, 2021), Chief Financial Officer (2019 - May 2, 2021); KielStrand Capital LLC (family office), Chief Executive Officer (since 2016) | Alpha-En Corporation, Director (2016-2019) |
| Name, Age | Position(s) Held with Fund | Trustee/Officer Since(h) | Term Expiring | Number of MFS Funds overseen by the Trustee | Principal Occupations During the Past Five Years | Other Directorships During the Past Five Years (j) | ||||||
| Clarence Otis, Jr. (age 66) | Trustee | March 2017 | 2024 | 136 | Private investor | VF Corporation, Director; Verizon Communications, Inc., Director; The Travelers Companies, Director | ||||||
| Maryanne L. Roepke (age 66) | Trustee | May 2014 | 2025 | 136 | Private investor | N/A | ||||||
| Laurie J. Thomsen (age 65) | Trustee | March 2005 | 2025 | 136 | Private investor | The Travelers Companies, Director; Dycom Industries, Inc., Director |
| Name, Age | Position(s) Held with Fund | Trustee/Officer Since(h) | Term Expiring | Number of MFS Funds overseen by the Trustee | Principal Occupations During the Past Five Years | |||||
| OFFICERS | ||||||||||
| Christopher R. Bohane (k) (age 48) | Assistant Secretary and Assistant Clerk | July 2005 | N/A | 136 | Massachusetts Financial Services Company, Senior Vice President and Senior Managing Counsel | |||||
| Kino Clark (k) (age 54) | Assistant Treasurer | January 2012 | N/A | 136 | Massachusetts Financial Services Company, Vice President | |||||
| John W. Clark, Jr. (k) (age 55) | Assistant Treasurer | April 2017 | N/A | 136 | Massachusetts Financial Services Company, Vice President | |||||
| David L. DiLorenzo (k) (age 54) | President | July 2005 | N/A | 136 | Massachusetts Financial Services Company, Senior Vice President | |||||
| Heidi W. Hardin (k) (age 55) | Secretary and Clerk | April 2017 | N/A | 136 | Massachusetts Financial Services Company, Executive Vice President and General Counsel | |||||
| Brian E. Langenfeld (k) (age 49) | Assistant Secretary and Assistant Clerk | June 2006 | N/A | 136 | Massachusetts Financial Services Company, Vice President and Managing Counsel | |||||
| Name, Age | Position(s) Held with Fund | Trustee/Officer Since(h) | Term Expiring | Number of MFS Funds overseen by the Trustee | Principal Occupations During the Past Five Years | |||||
| Rosa E. Licea-Mailloux (k) (age 46) | Chief Compliance Officer | March 2022 | N/A | 136 | Massachusetts Financial Services Company, Vice President (since 2018); Director of Corporate Compliance (2018-2021), Senior Director Compliance (2021-2022), Senior Managing Director of North American Compliance & Chief Compliance Officer (since March 2022); Natixis Investment Managers (investment management), Funds Chief Compliance Officer, Deputy General Counsel & Senior Vice President (until 2018) | |||||
| Amanda S. Mooradian (k) (age 43) | Assistant Secretary and Assistant Clerk | September 2018 | N/A | 136 | Massachusetts Financial Services Company, Assistant Vice President and Senior Counsel | |||||
| Susan A. Pereira (k) (age 52) | Assistant Secretary and Assistant Clerk | July 2005 | N/A | 136 | Massachusetts Financial Services Company, Vice President and Managing Counsel | |||||
| Kasey L. Phillips (k) (age 52) | Assistant Treasurer | September 2012 | N/A | 136 | Massachusetts Financial Services Company, Vice President | |||||
| Matthew A. Stowe (k) (age 48) | Assistant Secretary and Assistant Clerk | October 2014 | N/A | 136 | Massachusetts Financial Services Company, Senior Vice President and Senior Managing Counsel | |||||
| William B. Wilson (k) (age 40) | Assistant Secretary and Assistant Clerk | October 2022 | N/A | 136 | Massachusetts Financial Services Company, Assistant Vice President and Counsel |
| Name, Age | Position(s) Held with Fund | Trustee/Officer Since(h) | Term Expiring | Number of MFS Funds overseen by the Trustee | Principal Occupations During the Past Five Years | |||||
| James O. Yost (k) (age 62) | Treasurer | September 1990 | N/A | 136 | Massachusetts Financial Services Company, Senior Vice President |
| (h) | Date first appointed to serve as Trustee/Officer of an MFS Fund. Each Trustee has served continuously since appointment unless indicated otherwise. From January 2012 through December 2016, Messrs. DiLorenzo and Yost served as Treasurer and Deputy Treasurer of the Funds, respectively. |
| (j) | Directorships or trusteeships of companies required to report to the Securities and Exchange Commission (i.e., “public companies”). |
| (k) | “Interested person” of the Trust within the meaning of the Investment Company Act of 1940 (referred to as the 1940 Act), which is the principal federal law governing investment companies like the fund, as a result of a position with MFS. The address of MFS is 111 Huntington Avenue, Boston, Massachusetts 02199-7618. |
| Investment Adviser | Custodian |
| Massachusetts Financial Services Company 111 Huntington Avenue Boston, MA 02199-7618 | State Street Bank and Trust Company 1 Lincoln Street Boston, MA 02111-2900 |
| Portfolio Manager(s) | Independent Registered Public Accounting Firm |
| Robert Spector Ward Brown Philipp Burgener David Cole Pilar Gomez-Bravo Andy Li Henry Peabody Matt Ryan Michael Skatrud Erik Weisman | Ernst & Young LLP 200 Clarendon Street Boston, MA 02116 |
| FACTS | WHAT DOES MFS DO WITH YOUR PERSONAL INFORMATION? |
| Why? | Financial companies choose how they share your personal information. Federal law gives consumers the right to limit some but not all sharing. Federal law also requires us to tell you how we collect, share, and protect your personal information. Please read this notice carefully to understand what we do. |
| What? | The types of personal information we collect and share depend on the product or service you have with us. This information can include: |
| • Social Security number and account balances | |
| • Account transactions and transaction history | |
| • Checking account information and wire transfer instructions | |
| When you are no longer our customer, we continue to share your information as described in this notice. |
| How? | All financial companies need to share customers' personal information to run their everyday business. In the section below, we list the reasons financial companies can share their customers' personal information; the reasons MFS chooses to share; and whether you can limit this sharing. |
| Reasons we can share your personal information | Does MFS share? | Can you limit this sharing? |
| For our everyday business purposes – such as to process your transactions, maintain your account(s), respond to court orders and legal investigations, or report to credit bureaus | Yes | No |
| For our marketing purposes – to offer our products and services to you | No | We don't share |
| For joint marketing with other financial companies | No | We don't share |
| For our affiliates' everyday business purposes – information about your transactions and experiences | No | We don't share |
| For our affiliates' everyday business purposes – information about your creditworthiness | No | We don't share |
| For nonaffiliates to market to you | No | We don't share |
| Questions? | Call 800-225-2606 or go to mfs.com. |

| Who we are | |
| Who is providing this notice? | MFS Funds, MFS Investment Management, MFS Institutional Advisors, Inc., and MFS Heritage Trust Company. |
| What we do | |
| How does MFS protect my personal information? | To protect your personal information from unauthorized access and use, we use security measures that comply with federal law. These measures include procedural, electronic, and physical safeguards for the protection of the personal information we collect about you. |
| How does MFS collect my personal information? | We collect your personal information, for example, when you |
| • open an account or provide account information | |
| • direct us to buy securities or direct us to sell your securities | |
| • make a wire transfer | |
| We also collect your personal information from others, such as credit bureaus, affiliates, or other companies. | |
| Why can't I limit all sharing? | Federal law gives you the right to limit only |
| • sharing for affiliates' everyday business purposes – information about your creditworthiness | |
| • affiliates from using your information to market to you | |
| • sharing for nonaffiliates to market to you | |
| State laws and individual companies may give you additional rights to limit sharing. | |
| Definitions | |
| Affiliates | Companies related by common ownership or control. They can be financial and nonfinancial companies. |
| • MFS does not share personal information with affiliates, except for everyday business purposes as described on page one of this notice. | |
| Nonaffiliates | Companies not related by common ownership or control. They can be financial and nonfinancial companies. |
| • MFS does not share with nonaffiliates so they can market to you. | |
| Joint marketing | A formal agreement between nonaffiliated financial companies that together market financial products or services to you. |
| • MFS doesn't jointly market. | |
| Other important information |
| If you own an MFS product or receive an MFS service in the name of a third party such as a bank or broker-dealer, their privacy policy may apply to you instead of ours. |

DIVIDEND DISBURSING AGENT
Item 1(b):
A copy of the notice transmitted to the Registrant's shareholders in reliance on Rule 30e-3 of the Investment Company Act of 1940, as amended that contains disclosure specified by paragraph (c)(3) of Rule 30e-3 is attached hereto as EX-99.30e-3Notice.
ITEM 2. CODE OF ETHICS.
The Registrant has adopted a Code of Ethics (the "Code") pursuant to Section 406 of the Sarbanes-Oxley Act and as defined in Form N-CSR that applies to the Registrant's principal executive officer and principal financial and accounting officer. During the period covered by this report, the Registrant has not amended any provision in the Code that relates to an element of the Code's definition enumerated in paragraph (b) of Item 2 of this Form N-CSR. During the period covered by this report, the Registrant did not grant a waiver, including an implicit waiver, from any provision of the Code.
A copy of the Code is attached hereto as EX-99.COE.
ITEM 3. AUDIT COMMITTEE FINANCIAL EXPERT.
Messrs. Steven E. Buller, James Kilman, and Clarence Otis, Jr. and Ms. Maryanne L. Roepke, members of the Audit Committee, have been determined by the Board of Trustees in their reasonable business judgment to meet the definition of "audit committee financial expert" as such term is defined in Form N-CSR. In addition, Messrs. Buller, Kilman, and Otis and Ms. Roepke are "independent" members of the Audit Committee (as such term has been defined by the Securities and Exchange Commission in regulations implementing Section 407 of the Sarbanes-Oxley Act of 2002). The Securities and Exchange Commission has stated that the designation of a person as an audit committee financial expert pursuant to this Item 3 on the Form N-CSR does not impose on such a person any duties, obligations or liability that are greater than the duties, obligations or liability imposed on such person as a member of the Audit Committee and the Board of Trustees in the absence of such designation or identification.
ITEM 4. PRINCIPAL ACCOUNTANT FEES AND SERVICES.
Items 4(a) through 4(d) and 4(g):
The Board of Trustees has appointed Ernst & Young LLP ("E&Y") to serve as independent accountants to the Registrant (hereinafter the "Registrant" or the "Fund"). The tables below set forth the audit fees billed to the Fund as well as fees for non-audit services provided to the Fund and/or to the Fund's investment adviser, Massachusetts Financial Services Company ("MFS"), and to various entities either controlling, controlled by, or under common control with MFS that provide ongoing services to the Fund ("MFS Related Entities").
For the fiscal years ended November 30, 2022 and 2021, audit fees billed to the Fund by E&Y were as follows:
Fees billed by E&Y: |
| Audit Fees |
| 2022 | 2021 |
MFS Charter Income Trust | 64,305 | 61,052 |
For the fiscal years ended November 30, 2022 and 2021, fees billed by E&Y for audit-related, tax and other services provided to the Fund and for audit-related, tax and other services provided to MFS and MFS Related Entities were as follows:
Fees billed by E&Y: | Audit-Related Fees1 |
| Tax Fees2 | All Other Fees3 | ||||||
| 2022 | 2021 |
| 2022 | 2021 | 2022 |
| 2021 | ||
To MFS Charter Income Trust | 12,907 | 12,246 |
| 255 | 11,255 | 64 |
| 1,010 | ||
|
|
|
|
|
|
|
|
|
| |
|
|
|
|
|
|
|
| |||
Fees billed by E&Y: | Audit-Related Fees1 |
| Tax Fees2 | All Other Fees3 | ||||||
| 2022 | 2021 |
| 2022 | 2021 | 2022 |
| 2021 | ||
To MFS and MFS Related | 520,036 | 1,275,054 |
| 0 | 0 |
| 111,415 |
| 110,620 | |
Entities of MFS Charter Income |
|
|
|
|
|
|
|
|
|
|
Trust* |
|
|
|
|
|
|
|
|
|
|
|
|
|
|
|
|
| ||||
`Fees Billed by E&Y: |
|
|
| Aggregate Fees for Non-audit Services |
| |||||
|
|
|
| 2022 |
|
| 2021 |
| ||
To MFS Charter Income Trust, MFS and |
|
| 895,107 |
|
| 1,576,885 | ||||
MFS Related Entities# |
|
|
|
|
|
|
|
|
|
|
*This amount reflects the fees billed to MFS and MFS Related Entities for non-audit services relating directly to the operations and financial reporting of the Fund (portions of which services also related to the operations and financial reporting of other funds within
the MFS Funds complex).
#This amount reflects the aggregate fees billed by E&Y for non-audit services rendered to the Fund and for non-audit services rendered to MFS and the MFS Related Entities.
1 The fees included under "Audit-Related Fees" are fees related to assurance and related services that are reasonably related to the performance of the audit or review of financial statements, but not reported under ''Audit Fees,'' including accounting consultations, agreed-upon procedure reports, attestation reports, comfort letters and internal control reviews.
2 The fees included under "Tax Fees" are fees associated with tax compliance, tax advice and tax planning, including services relating to the filing or amendment of federal, state or local income tax returns, regulated investment company qualification reviews and tax distribution and analysis.
3 The fees included under "All Other Fees" are fees for products and services provided by E&Y other than those reported under "Audit Fees," "Audit-Related Fees" and "Tax Fees," including fees for services related to review of internal controls and review of Rule 38a-1 compliance program.
Item 4(e)(1):
Set forth below are the policies and procedures established by the Audit Committee of the Board of Trustees relating to the pre- approval of audit and non-audit related services:
To the extent required by applicable law, pre-approval by the Audit Committee of the Board is needed for all audit and permissible non-audit services rendered to the Fund and all permissible non-audit services rendered to MFS or MFS Related Entities if the services relate directly to the operations and financial reporting of the Registrant. Pre-approval is currently on an engagement-by-engagement basis. In the event pre-approval of such services is necessary between regular meetings of the Audit Committee and it is not practical to wait to seek pre-approval at the next regular meeting of the Audit Committee, pre-approval of such services may be referred to the Chair of the Audit Committee for approval; provided that the Chair may not pre-approve any individual engagement for such services exceeding $50,000 or multiple engagements for such services in the aggregate exceeding $100,000 between such regular meetings of the Audit Committee. Any engagement pre-approved by the Chair between regular meetings of the Audit Committee shall be presented for ratification by the entire Audit Committee at its next regularly scheduled meeting.
Item 4(e)(2):
None, or 0%, of the services relating to the Audit-Related Fees, Tax Fees and All Other Fees paid by the Fund and MFS and MFS Related Entities relating directly to the operations and financial reporting of the Registrant disclosed above were approved by the audit committee pursuant to paragraphs (c)(7)(i)(C) of Rule 2-01 of Regulation S-X (which permits audit committee approval after the start of the engagement with respect to services other than audit, review or attest services, if certain conditions are satisfied).
Item 4(f):
Not applicable.
Item 4(h):
The Registrant's Audit Committee has considered whether the provision by a Registrant's independent registered public accounting firm of non-audit services to MFS and MFS Related Entities that were not pre-approved by the Committee (because such services were provided prior to the effectiveness of SEC rules requiring pre-approval or because such services did not relate directly to the operations and financial reporting of the Registrant) was compatible with maintaining the independence of the independent registered public accounting firm as the Registrant's principal auditors.
ITEM 5. AUDIT COMMITTEE OF LISTED REGISTRANTS.
The Registrant has an Audit Committee established in accordance with Section 3(a)(58)(A) of the Securities Exchange Act of 1934. The members of the Audit Committee are Messrs. Steven E. Buller, James Kilman, and Clarence Otis, Jr. and Ms. Maryanne L. Roepke.
ITEM 6. INVESTMENTS
A schedule of investments of the Registrant is included as part of the report to shareholders of the Registrant under Item 1(a) of this Form N-CSR.
ITEM 7. DISCLOSURE OF PROXY VOTING POLICIES AND PROCEDURES FOR CLOSED-END MANAGEMENT INVESTMENT COMPANIES.
A copy of the proxy voting policies and procedures are attached hereto as Ex-99.PROXYPOL.
ITEM 8. PORTFOLIO MANAGERS OF CLOSED-END MANAGEMENT INVESTMENT COMPANIES.
Portfolio Manager(s)
Information regarding the portfolio manager(s) of the MFS Charter Income Trust (the "Fund"), is set forth below. Each portfolio manager is primarily responsible for the day-to-day management of the Fund.
Portfolio Manager | Primary Role | Since | Title and Five Year History |
Robert Spector | Lead and Debt Instruments Portfolio Manager | 2015 | Investment Office of MFS; employed in the investment area of |
|
|
| MFS since 2011. |
Ward Brown | Emerging Markets Debt Instruments Portfolio | 2012 | Investment Officer of MFS; Employed in the investment area of |
| Manager |
| MFS since 2005. |
Philipp Burgener | Structured Securities Portfolio Manager | 2019 | Investment Officer of MFS; employed in the investment |
|
|
| management area of MFS since 2003. |
David Cole | Below Investment Grade Debt Instruments Portfolio | 2006 | Investment Officer of MFS; employed in the investment area of |
| Manager |
| MFS since 2004. |
Pilar Gomez-Bravo | Debt Instruments Portfolio Manager | 2013 | Investment Officer of MFS; employed in the investment area of |
|
|
| MFS since 2013. |
Andy Li | Investment Grade Debt Instruments Portfolio | 2019 | Employed in the investment area of MFS since 2018, Portfolio |
| Manager |
| Manager at Man GLG from 2014 to 2018. |
Henry Peabody | Investment Grade Debt Instruments Portfolio | 2019 | Investment Officer of MFS; employed in the investment area of |
| Manager |
| MFS since July 2019; Portfolio Manager and Analyst at Eaton |
|
|
| Vance Management from 2014 to June 2019. |
Matt Ryan | Emerging Markets Debt Instruments Portfolio | 2004 | Investment Officer of MFS; employed in the investment area of |
| Manager |
| MFS since 1997. |
|
|
|
|
Michael Skatrud | Below Investment Grade Debt Instruments Portfolio | 2018 | Investment Officer of MFS; employed in the investment area of |
| Manager |
| MFS since 2013. |
Erik Weisman | Sovereign Debt Instruments Portfolio Manager | 2012 | Investment Officer of MFS; Employed in the investment area of |
|
|
| MFS since 2002. |
Compensation
MFS' philosophy is to align portfolio manager compensation with the goal to provide shareholders with long-term value through a collaborative investment process. Therefore, MFS uses long-term investment performance as well as contribution to the overall investment process and collaborative culture as key factors in determining portfolio manager compensation. In addition, MFS seeks to maintain total compensation programs that are competitive in the asset management industry in each geographic market where it has employees. MFS uses competitive compensation data to ensure that compensation practices are aligned with its goals of attracting, retaining, and motivating the highest-quality professionals.
MFS reviews portfolio manager compensation annually. In determining portfolio manager compensation, MFS uses quantitative means and qualitative means to help ensure a durable investment process. As of December 31, 2021, portfolio manager total cash compensation is a combination of base salary and performance bonus:
Base Salary – Base salary generally represents a smaller percentage of portfolio manager total cash compensation than performance bonus. Performance Bonus – Generally, the performance bonus represents more than a majority of portfolio manager total cash compensation.
The performance bonus is based on a combination of quantitative and qualitative factors, generally with more weight given to the former and less weight given to the latter.
The quantitative portion is primarily based on the pre-tax performance of accounts managed by the portfolio manager over a range of fixed- length time periods, intended to provide the ability to assess performance over time periods consistent with a full market cycle and a strategy's investment horizon. The fixed-length time periods include the portfolio manager's full tenure on each fund and, when available, 10-, 5-, and 3- year periods. For portfolio managers who have served for less than three years, shorter-term periods, including the one-year period, will also be considered, as will performance in previous roles, if any, held at the firm. Emphasis is generally placed on longer performance periods when multiple performance periods are available. Performance is evaluated across the full set of strategies and portfolios managed by a given portfolio manager, relative to appropriate peer group universes and/or representative indices ("benchmarks"). As of December 31, 2021, the following benchmarks were used to measure the following portfolio manager's performance for the Fund:
Fund | Portfolio Manager | Benchmark(s) |
MFS Charter Income Trust | Ward Brown | JPMorgan Emerging Markets Bond Index Global |
| Philipp Burgener | Bloomberg U.S. Government/Mortgage Index |
| David Cole | Bloomberg U.S. Corporate High-Yield Bond 2% Issuer Capped Index |
| Pilar Gomez-Bravo | FTSE World Government Bond Non-Dollar Hedged Index |
|
| JPMorgan Emerging Markets Bond Index Global |
|
| Bloomberg U.S. Corporate High-Yield Bond 2% Issuer Capped Index |
|
| Bloomberg U.S. Credit Index |
|
| Bloomberg U.S. Government/Mortgage Bond Index |
| Andy Li | Bloomberg Global Aggregate Credit Bond Index |
| Henry Peabody | Bloomberg Global Aggregate Credit Bond Index |
| Matt Ryan | JPMorgan Emerging Markets Bond Index Global |
| Michael Skatrud | Bloomberg U.S. Corporate High-Yield Bond 2% Issuer Capped Index |
| Robert Spector | FTSE World Government Bond Non-Dollar Hedged Index |
|
| JPMorgan Emerging Markets Bond Index Global |
|
| Bloomberg U.S. Corporate High-Yield Bond 2% Issuer Capped Index |
|
| Bloomberg U.S. Credit Index |
|
| Bloomberg U.S. Government/Mortgage Bond Index |
| Erik Weisman | FTSE World Government Bond Non-Dollar Hedged Index |
Benchmarks may include versions and components of indices, custom indices, and linked indices that combine performance of different indices for different portions of the time period, where appropriate.
The qualitative portion is based on the results of an annual internal peer review process (where portfolio managers are evaluated by other portfolio managers, analysts, and traders) and management's assessment of overall portfolio manager contribution to the MFS investment process and the client experience (distinct from fund and other account performance).
The performance bonus is generally a combination of cash and a deferred cash award. A deferred cash award is issued for a cash value and becomes payable over a three-year vesting period if the portfolio manager remains in the continuous employ of MFS or its affiliates. During the vesting period, the value of the unfunded deferred cash award will fluctuate as though the portfolio manager had invested the cash value of the award in an MFS Fund(s) selected by the portfolio manager.
MFS Equity Plan – Portfolio managers also typically benefit from the opportunity to participate in the MFS Equity Plan. Equity interests are awarded by management, on a discretionary basis, taking into account tenure at MFS, contribution to the investment process, and other factors.
Finally, portfolio managers also participate in benefit plans (including a defined contribution plan and health and other insurance plans) and programs available generally to other employees of MFS. The percentage such benefits represent of any portfolio manager's compensation depends upon the length of the individual's tenure at MFS and salary level, as well as other factors.
Ownership of Fund Shares
The following table shows the dollar range of equity securities of the Fund beneficially owned by the Fund's portfolio manager(s) as of the Fund's fiscal year ended November 30, 2022. The following dollar ranges apply:
N. None
A. $1 – $10,000
B. $10,001 – $50,000
C. $50,001 – $100,000
D. $100,001 – $500,000
E. $500,001 – $1,000,000
F. Over $1,000,000
Name of Portfolio Manager | Dollar Range of Equity Securities in Fund |
Ward Brown | N |
Philipp Burgener | N |
David Cole | N |
Pilar Gomez-Bravo | N |
Andy Li | N |
Henry Peabody | N |
Matt Ryan | N |
Michael Skatrud | N |
Robert Spector | N |
Erik Weisman | N |
Other Accounts
In addition to the Fund, each portfolio manager of the Fund is named as a portfolio manager of certain other accounts managed or sub-advised by MFS or an affiliate. The number and assets of these accounts were as follows as of the Fund's fiscal year ended November 30, 2022:
| Registered Investment Companies* | Other Pooled Investment Vehicles | Other Accounts | |||
|
| Total |
|
| Number of |
|
Name | Number of Accounts | Assets | Number of Accounts | Total Assets | Accounts | Total Assets |
Ward Brown | 7 | $9.6 billion | 8 | $2.8 billion | 7 | $1.9 billion |
|
|
|
|
|
|
|
Philipp Burgener | 7 | $6.6 billion | 5 | $1.3 billion | 2 | $92.2 million |
|
|
|
|
|
|
|
David Cole | 14 | $8.6 billion | 9 | $4.8 billion | 8 | $738.0 million |
|
|
|
|
|
|
|
Pilar Bravo-Gomez | 5 | $3.4 billion | 8 | $2.4 billion | 5 | $965.3 million |
|
|
|
|
|
|
|
Andy Li | 5 | $3.4 billion | 8 | $2.4 billion | 5 | $965.3 million |
|
|
|
|
|
|
|
Henry Peabody | 12 | $21.6 billion | 9 | $2.8 billion | 7 | $1.1 billion |
|
|
|
|
|
|
|
Matt Ryan | 9 | $12.5 billion | 10 | $3.1 billion | 8 | $2.1 billion |
|
|
|
|
|
|
|
Michael Skatrud | 12 | $8.5 billion | 8 | $836.5 million | 5 | $398.4 million |
|
|
|
|
|
|
|
Robert Spector | 7 | $3.7 billion | 12 | $4.4 billion | 47 | $2.6 billion |
|
|
|
|
|
|
|
Erik Weisman | 7 | $5.0 billion | 7 | $2.4 billion | 4 | $854.6 million |
|
|
|
|
|
|
|
* Includes the Fund. |
|
|
|
|
|
|
Advisory fees are not based upon performance of any of the accounts identified in the table above.
Potential Conflicts of Interest
MFS seeks to identify potential conflicts of interest resulting from a portfolio manager's management of both the Fund and other accounts, and has adopted policies and procedures designed to address such potential conflicts. There is no guarantee that MFS will be successful in identifying or mitigating conflicts of interest.
The management of multiple funds and accounts (including accounts in which MFS or an affiliate has an interest) gives rise to conflicts of interest if the funds and accounts have different objectives and strategies, benchmarks, time horizons, and fees, as a portfolio manager must allocate his or her time and investment ideas across multiple funds and accounts. In certain instances, there are securities which are suitable for the Fund's portfolio as well as for one or more other accounts advised by MFS or its subsidiaries (including accounts in which MFS or an affiliate has an interest) with similar investment objectives. MFS' trade allocation policies could have a detrimental effect on the Fund if the Fund's orders do not get fully executed or are delayed in getting executed due to being aggregated with those of other accounts advised by MFS or its subsidiaries. A portfolio manager may execute transactions for another fund or account that may adversely affect the value of the Fund's investments. Investments selected for funds or accounts other than the Fund may outperform investments selected for the Fund.
When two or more accounts are simultaneously engaged in the purchase or sale of the same security, the securities are allocated among clients in a manner believed by MFS to be fair and equitable to each over time. Allocations may be based on many factors and may not always be pro rata based on assets managed. The allocation methodology could have a detrimental effect on the price or availability of a security with respect to the Fund.
MFS and/or a portfolio manager may have a financial incentive to allocate favorable or limited opportunity investments or structure the timing of investments to favor accounts other than the Fund; for instance, those that pay a higher advisory fee and/or have a performance adjustment, those that include an investment by the portfolio manager, and/or those in which MFS, its officers and/or employees, and/or its affiliates own or have an interest.
To the extent permitted by applicable law, certain accounts may invest their assets in other accounts advised by MFS or its affiliates, including accounts that are advised by one or more of the same portfolio manager(s), which could result in conflicts of interest relating to asset allocation, timing of purchases and redemptions, and increased profitability for MFS, its affiliates, and/or its personnel, including portfolio managers.

ITEM 9. PURCHASES OF EQUITY SECURITIES BY CLOSED-END MANAGEMENT INVESTMENT COMPANY AND AFFILIATED PURCHASERS.
MFS Charter Income Trust
|
|
|
| (c) Total Number of | (d) Maximum Number |
|
|
|
| Shares Purchased as | (or Approximate |
|
| (a) Total number of | (b) Average | Part of Publicly | Dollar Value) of |
| Period | Shares Purchased | Price Paid | Announced Plans or | Shares that May Yet |
|
|
| per Share | Programs | Be Purchased under |
|
|
|
|
| the Plans or Programs |
|
|
|
|
|
|
| 12/01/21-12/31/21 | 0 | N/A | 0 | 4,444,570 |
| 1/01/22-1/31/22 | 0 | N/A | 0 | 4,444,570 |
| 2/01/22-2/28/22 | 0 | N/A | 0 | 4,444,570 |
| 3/01/22-3/31/22 | 0 | N/A | 0 | 4,444,570 |
| 4/01/22-4/30/22 | 31,801 | 6.85 | 31,801 | 4,412,769 |
| 5/01/22-5/31/22 | 196,736 | 6.60 | 196,736 | 4,216,033 |
| 6/01/22-6/30/22 | 179,804 | 6.30 | 179,804 | 4,036,229 |
| 7/01/22-7/31/22 | 9,383 | 6.36 | 9,383 | 4,026,846 |
| 8/01/22-8/31/22 | 0 | N/A | 0 | 4,026,846 |
| 9/01/22-9/30/22 | 79,967 | 6.16 | 79,967 | 3,946,879 |
| 10/1/22-10/31/22 | 50,982 | 6.02 | 50,982 | 4,354,319 |
| 11/1/22-11/30/22 | 0 | N/A | 0 | 4,354,319 |
| Total | 548,673 | 6.39 | 548,673 |
|
|
|
|
|
|
|
Note: The Board approved procedures to repurchase shares and reviews the results periodically. The notification to shareholders of the program is part of the semi-annual and annual reports sent to shareholders. These annual programs begin on October 1st of each year. The programs conform to the conditions of Rule 10b-18 of the Securities Exchange Act of 1934 and limit the aggregate number of shares that may be purchased in each annual period (October 1 through the following September 30) to 10% of the Registrant's outstanding shares as of the first day of the plan year (October 1). The aggregate number of shares available for purchase for the October 1, 2022 plan year is 4,405,301.
ITEM 10. SUBMISSION OF MATTERS TO A VOTE OF SECURITY HOLDERS.
There were no material changes to the procedures by which shareholders may send recommendations to the Board for nominees to the Registrant's Board since the Registrant last provided disclosure as to such procedures in response to the requirements of Item 407 (c)(2)(iv) of Regulation S-K or this Item.
ITEM 11. CONTROLS AND PROCEDURES.
(a)Based upon their evaluation of the effectiveness of the registrant's disclosure controls and procedures (as defined in Rule 30a-3(c) under the Investment Company Act of 1940 (the "Act")) as conducted within 90 days of the filing date of this report on Form N-CSR, the registrant's principal financial officer and principal executive officer have concluded that those disclosure controls and procedures provide reasonable assurance that the material information required to be disclosed by the registrant on this report is recorded, processed, summarized and reported within the time periods specified in the Securities and Exchange Commission's rules and forms.
(b)There were no changes in the registrant's internal controls over financial reporting (as defined in Rule 30a-3(d) under the Act) that occurred during the period covered by the report that have materially affected, or are reasonably likely to materially affect, the registrant's internal control over financial reporting.
ITEM 12. DISCLOSURE OF SECURITIES LENDING ACTIVITIES FOR CLOSED-END MANAGEMENT INVESTMENT COMPANIES.
During the fiscal year ended November 30, 2022, there were no fees or income related to securities lending activities of the Registrant.
ITEM 13. EXHIBITS.
(a)(1) Any code of ethics, or amendment thereto, that is the subject of the disclosure required by Item 2, to the extent that the
registrant intends to satisfy the Item 2 requirements through filing of an exhibit: Attached hereto as EX-99.COE.
(2)A separate certification for each principal executive officer and principal financial officer of the registrant as required by Rule 30a-2(a) under the Act (17 CFR 270.30a-2): Attached hereto as EX-99.302CERT.
(3)Any written solicitation to purchase securities under Rule 23c-1 under the Act (17 CFR 270.23c-1) sent or given during the period covered by the report by or on behalf of the registrant to 10 or more persons. Not applicable.
(4)Change in the registrant's independent public accountant. Not applicable.
(b)If the report is filed under Section 13(a) or 15(d) of the Exchange Act, provide the certifications required by Rule 30a-2(b) under the Act (17 CFR 270.30a-2(b)), Rule 13a-14(b) or Rule 15d-14(b) under the Exchange Act (17 CFR 240.13a-14(b) or
240.15d-14(b)) and Section 1350 of Chapter 63 of Title 18 of the United States Code (18 U.S.C. 1350) as an exhibit. A certification furnished pursuant to this paragraph will not be deemed "filed" for the purposes of Section 18 of the Exchange Act (15 U.S.C. 78r), or otherwise subject to the liability of that section. Such certification will not be deemed to be incorporated by reference into any filing under the Securities Act of 1933 or the Exchange Act, except to the extent that the registrant specifically incorporates it by reference. Attached hereto as EX-99.906CERT.
(c)Registrant's Rule 30e-3 Notice pursuant to Item 1(b) of Form N-CSR. Attached hereto as EX-99.30e-3Notice.
(d)Proxy Voting Policies and Procedures pursuant to Item 7 of Form N-CSR. Attached hereto as EX-99.PROXYPOL.
(e)Notices to Trust's common shareholders in accordance with Investment Company Act Section 19(a) and Rule 19a-1. Attached hereto as EX-99.19a-1.
Notice
A copy of the Amended and Restated Declaration of Trust, as amended, of the Registrant is on file with the Secretary of State of The Commonwealth of Massachusetts and notice is hereby given that this instrument is executed on behalf of the Registrant by an officer of the Registrant as an officer and not individually and the obligations of or arising out of this instrument are not binding upon any of the Trustees or shareholders individually, but are binding only upon the assets and property of the respective constituent series of the Registrant.
SIGNATURES
Pursuant to the requirements of the Securities Exchange Act of 1934 and the Investment Company Act of 1940, the registrant has duly caused this report to be signed on its behalf by the undersigned, thereunto duly authorized.
(Registrant) MFS CHARTER INCOME TRUST
By (Signature and Title)*
/S/ DAVID L. DILORENZO
David L. DiLorenzo, President
Date: January 13, 2023
Pursuant to the requirements of the Securities Exchange Act of 1934 and the Investment Company Act of 1940, this report has been signed below by the following persons on behalf of the registrant and in the capacities and on the dates indicated.
By (Signature and Title)*
/S/ DAVID L. DILORENZO
David L. DiLorenzo, President (Principal Executive Officer)
Date: January 13, 2023
By (Signature and Title)*
/S/ JAMES O. YOST
James O. Yost, Treasurer (Principal Financial Officer and Accounting Officer) Date: January 13, 2023
* Print name and title of each signing officer under his or her signature.