UNITED STATES
SECURITIES AND EXCHANGE COMMISSION
Washington, D.C. 20549
FORM 10-K
(Mark One)
☒ Annual report pursuant to Section 13 or 15(d) of the Securities Exchange Act of 1934 for the fiscal year ended December 31, 2024 or
☐ Transition report pursuant to Section 13 or 15(d) of the Securities Exchange Act of 1934 for the transition period from to .
Commission File Number 001-34218
COGNEX CORPORATION
(Exact name of registrant as specified in its charter)
| | | | | | | | | | | | | | |
| Massachusetts | | 04-2713778 | |
| (State or other jurisdiction of
incorporation or organization) | | (I.R.S. Employer
Identification No.) | |
One Vision Drive
Natick, Massachusetts 01760-2059
(508) 650-3000
| | | | | | | | | | | | | | |
| (Address, including zip code, and telephone number,
including area code, of principal executive offices) | |
Securities registered pursuant to Section 12(b) of the Act:
| | | | | | | | |
| Title of Each Class | Trading Symbol(s) | Name of Exchange on Which Registered |
| Common Stock, par value $.002 per share | CGNX | The NASDAQ Stock Market LLC |
| | |
Securities registered pursuant to Section 12(g) of the Act: None
Indicate by check mark if the registrant is a well-known seasoned issuer, as defined in Rule 405 of the Securities Act.
Indicate by check mark if the registrant is not required to file reports pursuant to Section 13 or Section 15(d) of the Act.
Indicate by check mark whether the registrant (1) has filed all reports required to be filed by Section 13 or 15(d) of the Securities Exchange Act of 1934 during the preceding 12 months (or for such shorter period that the registrant was required to file such reports), and (2) has been subject to such filing requirements for the past 90 days.
Indicate by check mark whether the registrant has submitted electronically every Interactive Data File required to be submitted pursuant to Rule 405 of Regulation S-T during the preceding 12 months (or for such shorter period that the registrant was required to submit such files).
Indicate by check mark whether the registrant is a large accelerated filer, an accelerated filer, a non-accelerated filer, a smaller reporting company, or emerging growth company. See the definitions of “large accelerated filer,” “accelerated filer,” “smaller reporting company” and "emerging growth company" in Rule 12b-2 of the Exchange Act. (Check one):
| | | | | | | | | | | | | | |
| ☒ | Large accelerated filer | | ☐ | Accelerated filer |
| ☐ | Non-accelerated filer | | ☐ | Smaller reporting company |
| | | ☐ | Emerging growth company |
If an emerging growth company, indicate by check mark if the registrant has elected not to use the extended transition period for complying with any new or revised financial accounting standards provided pursuant to Section 13(a) of the Exchange Act. o
Indicate by check mark whether the registrant has filed a report on and attestation to its management’s assessment of the effectiveness of its internal control over financial reporting under Section 404(b) of the Sarbanes-Oxley Act (15 U.S.C. 7262(b)) by the registered public accounting firm that prepared or issued its audit report.
If securities are registered pursuant to Section 12(b) of the Act, indicate by check mark whether the financial statements of the registrant included in the filing reflect the correction of an error to previously issued financial statements. o
Indicate by check mark whether any of those error corrections are restatements that required a recovery analysis of incentive-based compensation received by any of the registrant’s executive officers during the relevant recovery period pursuant to §240.10D-1(b). o
Indicate by check mark whether the registrant is a shell company (as defined in Rule 12b-2 of the Exchange Act).
Aggregate market value of voting stock held by non-affiliates of the registrant as of June 28, 2024: $8,001,170,186
Common stock, par value $.002 per share, outstanding as of January 26, 2025: 169,865,714 shares
DOCUMENTS INCORPORATED BY REFERENCE:
The registrant intends to file a Definitive Proxy Statement pursuant to Regulation 14A within 120 days of the end of the fiscal year ended December 31, 2024. Portions of such Proxy Statement are incorporated by reference in Part III of this report.
COGNEX CORPORATION
ANNUAL REPORT ON FORM 10-K
FOR THE YEAR ENDED DECEMBER 31, 2024
INDEX
| | | | | | | | |
| | |
| ITEM 1. | | |
| ITEM 1A. | | |
| ITEM 1B. | | |
| ITEM 1C. | | |
| ITEM 2. | | |
| ITEM 3. | | |
| ITEM 4. | | |
| | |
| | |
| ITEM 5. | | |
| ITEM 6. | | |
| ITEM 7. | | |
| ITEM 7A. | | |
| ITEM 8. | | |
| ITEM 9. | | |
| ITEM 9A. | | |
| ITEM 9B. | | |
| ITEM 9C. | | |
| | |
| | |
| ITEM 10. | | |
| ITEM 11. | | |
| ITEM 12. | | |
| ITEM 13. | | |
| ITEM 14. | | |
| | |
| | |
| ITEM 15. | | |
| ITEM 16. | | |
PART I
This Annual Report on Form 10-K contains forward-looking statements within the meaning of the federal securities laws. Readers can identify these forward-looking statements by our use of the words “expects,” “anticipates,” “estimates,” “believes,” “projects,” “intends,” “plans,” “will,” “may,” “shall,” “could,” “should,” and similar words and other statements of a similar sense. Our future results may differ materially from current results and from those projected in the forward-looking statements as a result of known and unknown risks and uncertainties. Readers should pay particular attention to considerations described in the section captioned “Risk Factors,” appearing in Part I - Item 1A of this Annual Report on Form 10-K. We caution readers not to place undue reliance upon any such forward-looking statements, which speak only as of the date made. We disclaim any obligation to subsequently revise forward-looking statements to reflect the occurrence of anticipated or unanticipated events or circumstances after the date such statements are made.
Unless the context otherwise requires, the words “Cognex®,” the “Company,” “we,” “our,” “us,” and “our company” refer to Cognex Corporation and its consolidated subsidiaries.
ITEM 1: BUSINESS
Our Company
Founded in 1981, Cognex Corporation (“the Company” or “Cognex”) invents and commercializes technologies that address some of the most critical manufacturing and distribution challenges. We are a leading global provider of machine vision products and solutions that improve efficiency and quality in a wide range of businesses across attractive industrial end markets. Our solutions blend physical products and software to capture and analyze visual information, allowing for the automation of manufacturing and distribution tasks for customers worldwide. Machine vision products are used to automate the manufacturing or distribution and tracking of discrete items, such as mobile phones, automotive components, and e-commerce packages, by locating, identifying, inspecting, and measuring them. Machine vision is particularly valuable for applications in which human vision is inadequate to meet requirements for size, accuracy, or speed, or in instances where substantial cost savings are obtained through the reduction of labor or improved product quality.
Cognex sells to customers in nearly all industries in which discrete items are manufactured on an assembly line or moved through a distribution center or warehouse. Our largest industries by revenue are the logistics, automotive, and consumer electronics industries, which combined represented approximately 60% of our total revenue in 2024.
Our Industry and Market Opportunity
Machine vision is used in a variety of industries where technology is widely recognized as an important component of automated production, distribution, and quality assurance. Virtually every manufacturer or logistics provider can achieve better quality and efficiency by using machine vision. This results in a broad base of customers across a variety of industries, including logistics, automotive, consumer electronics, semiconductor, consumer products, medical-related, and food and beverage.
Our End Markets
Logistics
The logistics industry demands high-speed, efficient throughput combined with end-to-end supply chain traceability. Consumers expect fast and cost-effective fulfillment. Retail distributors, e-commerce platforms, and parcel processing customers face an ongoing tight labor market, increased demand, and increased costs. To address these challenges, organizations are increasingly deploying automated traceability, dimensioning, and detection solutions featuring Cognex machine vision, including barcode reading and AI-enabled vision technology, either directly or with the help of partners, such as an original equipment manufacturer ("OEM"), machine builder, or system integrator. We believe our e-commerce logistics business is differentiated by the high performance of our barcode reading and that potential growth will be driven by retailers investing in online fulfillment.
From an automation perspective, the logistics industry is still in its early stages with a large reliance on human labor and a low rate of robotic automation. Today, most applications in logistics are centered around barcode reading. Beyond barcode reading, we expect vision applications in logistics to grow quickly and become a more substantial part of our business. Vision applications include tasks such as inspecting packages for damage, object and symbol recognition, and dimensioning. Geographically, our logistics business started primarily in the United States, but has diversified into Europe and Asia, where we believe customers are beginning to catch up with the United States in logistics automation technology and are reducing share with local incumbent suppliers. Leading e-commerce players invested significantly in late 2020 through early 2022, then took a post-pandemic “time out” to absorb
excess capacity from early 2022 into 2023, and began investing at a steadier pace in 2024. We believe that logistics has the potential to be our highest-growth end market over the mid to long-term.
Automotive
The automotive market has been one of our largest markets for the past twenty years. Machine vision is used in almost every step of vehicle manufacturing, from measuring inbound parts, to guiding robot assembly, to inspecting the stitching on leather seats. We currently expect the proliferation of electronics in automobiles to be a significant growth driver in both electric vehicles and internal combustion engine vehicles. For example, innovations in safety, driver assist, and entertainment features increase the number of items to be placed, tracked, measured, and inspected by machine vision.
We also anticipate a multi-year wave of investment in hybrid and electric vehicle (“EV”) manufacturing equipment, particularly related to battery manufacturing and inspection. Cognex works closely with the major EV battery manufacturers who we believe produce the majority of the world’s automotive batteries. We believe that these manufacturers are positioned to grow within Asia, and to expand both independently and through partnerships in the Americas and Europe. We expect our existing relationships and proven offerings to position us to capture a significant share of this growth. We are also well positioned to continue to support traditional powertrain investments on internal combustion engine vehicles, supporting long-term growth in the automotive market.
Consumer Electronics
Today, electronic components and devices are difficult to manufacture without machine vision. Machine vision has made it possible to achieve the density of today’s integrated circuits and to manufacture them cost-effectively. Electronics producers and leading OEMs rely on Cognex machine vision, including AI-enabled vision technology, 3D vision, and barcode reading, to build, inspect, and track semiconductors, printed circuit boards, electronic hardware, and consumer devices.
We anticipate major investments in new generations of consumer electronics. A significant amount of visual inspection in consumer electronics is still performed manually by humans. As labor becomes more costly and scarce, these customers are looking for productivity initiatives to automate their processes. We also expect leading companies in this space to continue to grow based on new technologies and the devices that incorporate them. We believe new devices will be difficult to manufacture on a large scale, and therefore will require more innovative vision products in that process. Cognex has close relationships with the largest and most sophisticated companies in the consumer electronics market, and we expect to be a partner of choice as they bring new products to market.
Semiconductor
Machine vision has made it possible to achieve the density in today’s integrated circuits and to manufacture them cost-effectively. Semiconductor manufacturers rely on Cognex machine vision, including AI-based technology, to ensure precise alignment of wafers during masking and etching processes, increase traceability of wafers and die as they move through the front and back-end processes, and improve product quality through advanced inspection procedures.
As AI continues to drive demand for high-end logic process chips with our OEM customers, the overall semiconductor market has the potential for outsized growth in the coming years.
Other
The number of end markets that can benefit from machine vision applications is expanding. Other end market uses of Cognex machine vision include regulated manufacturers reducing counterfeiting, food producers improving food safety, and manufacturers using 3D measurement for robotic guidance.
Our Business Strategies
Historically, Cognex has been a leader in providing the most powerful machine vision technology to the most sophisticated customers and solving their most challenging automation problems. There are thousands of such customers and we believe our market share with these customers is high. There is also a much larger segment of customers with less complex applications and less automation engineering capacity who are looking for more standardized products that are easy to implement and easy to use. Our goal is to expand our business with these customers by offering tailored products and increasing our sales coverage.
Growth through innovation
We invest heavily in research and development to maintain our position as a technology leader in machine vision. We continue to introduce products embedded with artificial intelligence ("AI") technology that augments rule-based machine vision with image-based analysis. We invest in technology that makes vision easier to use and more affordable, and therefore, available to a broader base of customers, such as our edge learning products that enable customers with less technical capabilities to use machine vision while minimizing installation and applications support. We also continue to invest in technology that addresses the most challenging vision applications, such as our deep learning vision software that solves complex applications with unpredictable defects and deviations.
Increase of sales coverage
We reach a broad base of customers through our worldwide direct sales force that sells primarily to large customers, as well as through our network of distributors and integrators that sell primarily to smaller customers who may be more geographically remote or may require integration assistance or supplemental technical support. In 2023, we began investing more aggressively to expand our direct sales force to reach customers new to factory automation or new to Cognex, who have yet to fully benefit from all that machine vision can offer. We are doing so by adding a new sales engineer profile to our team, ambitious recent college graduates, and are investing in their onboarding and training. These entry-level sales personnel are enabling us to broaden and deepen our sales coverage, make many more, shorter sales calls, and reach more customers. We expect this sales investment to expand our reach, increase penetration, and further diversify our customer base.
Expansion of market position
We continue to invest in our core markets, such as logistics, automotive, and consumer electronics, where we are a leading provider of vision and ID products for warehouse and factory automation. Within these markets, we are making significant investments to focus on what we believe to be the fastest-growing applications and use cases. In the logistics market for example, we are moving beyond barcode reading into more complex applications in distribution centers and parcel and post warehouses.
Inorganic growth
We plan to drive inorganic growth through deeper penetration of our served machine vision market and expansion in adjacent markets. We are focusing specifically on markets in which we expect our products and solutions, application expertise, and customer and industry relationships to enable us to provide significant value to end users.
We seek out selective opportunities in new applications and markets through the acquisition of businesses and technologies that are synergistic with our core markets. We are selective in choosing businesses and technologies that we believe will enhance long-term growth and profitability. In the fourth quarter of 2023, we acquired Moritex Corporation, a global provider of premium optical components based in Japan. With an enterprise value of approximately $270 million, this was Cognex's largest acquisition to-date. We plan to continue to seek high-return, EPS-accretive acquisition opportunities to expand our product lines, customer base, distribution network, and technical talent.
Culture
Our strong and unique corporate culture reinforces our values of customer first and innovation, and enables us to attract and retain smart, enthusiastic, and creative talent who are motivated to solve the most challenging vision tasks for customers.
Products and Technology
Cognex offers a full range of machine vision systems and sensors, vision software, and barcode readers designed to meet customer needs at different performance and price points. Our products range from deep learning solutions that solve complex applications with unpredictable defects and deviations, to lower-cost vision sensors that conduct simple presence/absence inspections. Our products have a variety of physical forms, depending on the user's needs. For example, customers can purchase vision software to use with their own camera and processor, or they can purchase a standalone system that combines imager, processor, and software into a single package.
Vision Systems and Sensors
Vision systems combine smart cameras and software to perform a wide range of tasks, including part location, identification, measurement, assembly verification, and robotic guidance. Vision sensors can deliver an easy-to-use, low-cost, reliable solution for simple pass/fail inspections, such as checking the presence and size of parts. In-Sight® vision systems and sensors include our 2D and 3D vision systems, as well as our In-Sight SnAPP™ sensor. These products leverage various forms of AI, including rule-based coding, as well as deep learning and edge learning technology leveraging pre-trained models powered by neural networks. Our product portfolio meets the
varying price and performance requirements of our broad base of industrial customers. Our deep learning-based systems automate and solve complex inline inspections that typically require human judgment for defect detection, optical character recognition ("OCR"), assembly verification, or classification. Similar to our deep learning-based systems, our edge learning-based systems use pre-trained models, but on simpler applications that prioritize ease of use and have a broader appeal with easier and faster implementation and training.
Vision Software
Vision software offers customers the flexibility of the Cognex vision tools library to use with the cameras, frame grabbers, and peripheral equipment of their choice. Cognex VisionPro® software offers an extensive suite of patented vision tools, including both traditional rule-based tools and deep learning-enabled tools, for advanced programming. Its QuickBuild™ prototyping environment allows customers to build complete vision applications with the simplicity of a graphical flowchart-based programming interface.
Barcode Readers
Cognex industrial image-based barcode readers quickly and reliably read 1D, 2D, label-based, and direct part mark ("DPM") codes found in nearly every industry including logistics, automotive, consumer products, and medical-related. The DataMan® product line, which includes fixed-mount and handheld models, as well as barcode verifiers, help organizations optimize performance, increase throughput, and control traceability.
Vision Accessories
Cognex vision accessories are designed for easy integration with Cognex products and applications. Cameras are available in both area scan and line scan formats to address a wide variety of applications. Lenses and lighting are also available in both embedded and component formats to provide high-quality image acquisition, including a range of premium optical components that were added to the Company's vision accessory portfolio with the acquisition of Moritex Corporation in the fourth quarter of 2023. From value solutions to high-performance hardware, Cognex offers industrial cameras, lenses, lighting, vision controllers, frame grabbers, and I/O cards to meet customer requirements.
Research, Development, and Engineering
Cognex engages in research, development, and engineering (RD&E) to enhance our existing products and to develop new products and functionality to address market opportunities. We believe that a continued commitment to RD&E activities is essential to maintain or achieve product leadership with our existing products and to provide innovative new product offerings, as well as to provide engineering support for large customers. In addition, we consider our ability to accelerate time to market for new products to be critical to our revenue growth. We incurred RD&E costs of approximately $140 million (15% of revenue), $139 million (17% of revenue), and $141 million (14% of revenue), for the years ended December 31, 2024, 2023, and 2022, respectively. We expect to continue our commitment to RD&E, even during periods of lower revenue levels, to introduce new platforms, products, and solutions throughout economic cycles.
Intellectual Property
We rely on the technical expertise, creativity, and knowledge of our personnel, and therefore, we utilize patent, trademark, copyright, and trade secret protection to maintain our competitive position and protect our proprietary rights in our products and technology. While our intellectual property rights are important to our success, we believe that our business as a whole is not materially dependent on any particular patent, trademark, copyright, or other intellectual property right.
Operations
Most of Cognex’s hardware products, including our vision systems, vision sensors, and barcode readers, are manufactured utilizing third-party contractors, whereby the majority of component procurement, system assembly, and initial testing are performed by electronics manufacturing services suppliers. Cognex’s primary contract manufacturers are located in Indonesia and Malaysia. We purchase assembled goods from our contract manufacturers, who use specified components sourced from vendor lists approved by Cognex and assembly/test processes created and controlled by Cognex. After the completion of initial testing, assembled products from our contract manufacturers are routed to our distribution centers where trained Cognex personnel load Cognex software onto the products, provide additional assembly and image alignment as needed, and perform quality control procedures. Cognex manufactures optical components, including our lenses and lighting, at our in-house production plants located in China and Vietnam that are then stocked in our distribution centers. Cognex ships finished products for customers located in the Americas from our Southborough, Massachusetts distribution center, for
customers located in Europe from our Cork, Ireland distribution center, and for customers located in Asia from our Singapore distribution center.
Sales Channels and Support Services
Cognex sells its products through a worldwide direct sales force that primarily focuses on the development of strategic accounts that generate or are expected to generate significant sales volume, as well as through a global network of distribution and integration partners. Our distribution partners provide sales and local support to help Cognex reach the many prospects for our products in factories around the world, and our integration partners are experts in vision and complementary technologies that can provide turnkey solutions for complex automation projects using vision. Through each of these channels, sales engineers call directly on targeted accounts, with the assistance of application engineers, and manage the activities of our distribution and integration partners within their territories in order to provide an advantageous sales model for our products. In 2023, we began investing more aggressively to expand our direct sales force to include entry-level sales personnel to sell our easier-to-deploy and easier-to-use products.
Sales to customers based outside of the United States represented approximately 67% of our total revenue in 2024, with approximately 24% from customers based in Europe, approximately 18% from customers based in Greater China, and approximately 25% from customers based in other regions outside the United States. Sales to customers based in Europe are denominated in Euros and U.S. Dollars, sales to customers based in Greater China are denominated in Renminbi for sales within Mainland China and U.S. Dollars in other territories, and sales to customers based in other regions are denominated in U.S. Dollars, Japanese Yen, Korean Won, Indian Rupee, and Mexican Pesos.
Cognex’s service offerings represent less than 10% of our total revenue and include maintenance and support, consulting, and training services. Maintenance and support programs include hardware support programs that entitle customers to have products repaired, as well as software support programs that provide customers with application support and software updates to the latest software releases. Application support is provided by technical support personnel located at Cognex regional offices, as well as by field service engineers that provide support at the customer’s production site. We provide consulting services that range from a specific area of functionality to a completely integrated installed application. Training services include a variety of product courses that are available at our offices worldwide, at customer facilities, and online.
Competition
Cognex is one of the leading machine vision companies in the world. Our competitors include other vendors of machine vision systems, controllers, and components; manufacturers of image processing systems, sensors, and components; and system integrators. We also compete with internal engineering departments of current or prospective customers, as well as open-source tools available for free from various companies, including tools using AI.
Human Capital
Our employees are our most valuable asset and are critical to our success. We create and maintain an environment where “Cognoids,” a unique name for our employees, can engage with each other, perform their best work, develop their careers, and be creative. As of December 31, 2024, Cognex employed 2,914 Cognoids globally, including 1,586 in sales, marketing, and service activities; 653 in research, development, and engineering; 435 in manufacturing and quality assurance; and 240 in information technology, finance, and administration. Of our 2,914 Cognoids, 1,949 are based outside of the United States.
We pride ourselves on having a unique culture that exemplifies our motto of Work Hard, Play Hard, Move Fast. Our culture guides the actions and behaviors of our Cognoids and is defined by our ten values - Customer First, Excellence, Perseverance, Enthusiasm, Creativity, Pride, Integrity, Recognition, Sharing, and Fun. We are committed to finding the very best talent to be part of our growing technology company. We believe our culture enables us to attract and retain smart, energetic, and creative talent, and is central to our ability to execute our operating plans and strategic initiatives. To preserve and enhance our corporate culture, while recognizing differences across and within regions, we have a global team of Cognoids who serve as Ministers of Culture, led by our Chief Culture Officer.
We believe in investing in tools and resources that support employees’ learning and development and setting a compensation structure that reflects the Company’s commitment to a pay-for-performance philosophy. We believe these efforts align with our stockholders’ long-term interests and better position Cognex to continue to operate as a leader in the machine vision industry.
Regulatory Compliance
Cognex’s capital expenditures, earnings, and competitive position are not materially affected by compliance with federal, state, and local environmental provisions, which have been enacted or adopted to regulate the distribution of materials into the environment.
Available Information
Cognex maintains a website at www.cognex.com. We make available, free of charge, on our website in the “Company” section under the caption “Investor Information” followed by “Financial Reports” and then “SEC FiIings,” our Annual Report on Form 10-K, Quarterly Reports on Form 10-Q, and Current Reports on Form 8-K, including exhibits, and amendments to those reports filed or furnished pursuant to Section 13(a) or 15(d) of the Securities Exchange Act of 1934, as amended (the "Exchange Act"), as soon as reasonably practicable after such reports are electronically filed with, or furnished to, the SEC. Cognex’s reports filed with, or furnished to, the SEC are also available at the SEC’s website at www.sec.gov. Cognex has used, and intends to continue to use, its investor relations website as a means of disclosing material non-public information and for complying with our disclosure obligations under Regulation FD. Information contained on our website is not a part of, or incorporated by reference into, this Annual Report on Form 10-K or in any other document or report that Cognex files with the SEC, and any references to Cognex's website are intended to be inactive textual references only.
ITEM 1A: RISK FACTORS
The risks and uncertainties described below are not the only ones that we face. Additional risks and uncertainties that we are unaware of, or that we currently deem immaterial, also may become important factors that affect our company in the future. If any of these risks were to occur, our business, financial condition, or results of operations could be materially and adversely affected. This section includes or refers to certain forward-looking statements. We refer you to the explanation of the qualifications and limitations of such forward-looking statements, appearing under the heading "Forward-Looking Statements" in Part II - Item 7 of this Annual Report on Form 10-K.
Risks Related to Execution of our Business Strategy
Our failure to introduce new products in a successful and timely manner could result in the loss of our market share and a decrease in our revenues and profits.
The market for our products is characterized by rapidly changing technology and increasingly capable competitors. Accordingly, we believe that our future success will depend on our ability to accelerate time-to-market for new products with improved functionality, ease-of-use, performance, and price. This includes continuing to introduce products embedded with artificial intelligence ("AI") technology that augments rule-based machine vision with image-based analysis. There can be no assurance that we will be able to introduce new products in accordance with scheduled release dates or that new products will achieve market acceptance. Our inability to keep pace with the rapid rate of technological change and customer demands in the high-technology marketplace could have a material adverse effect on our operating results. In addition, we may not achieve significant revenue from new product investments for several years, if at all. Moreover, new products, if introduced, may not generate the gross margins that we have experienced historically.
Increased competition may result in decreased demand or prices for our products and services and may harm our operating results.
The machine vision market continues to be fragmented and competitive. Our competitors include primarily other vendors of machine vision systems, controllers, and components; manufacturers of image processing systems, sensors, and components; and system integrators. We also compete with internal engineering departments of current or prospective customers, as well as open-source tools available for free from various companies, including tools using AI.
In recent years, advancements in AI, particularly the availability of sophisticated AI algorithms and open-source machine vision platforms, have lowered the barriers to entry in our market. These tools enable new entrants and low-cost providers, particularly in China, to produce vision systems that may perform comparably to our offerings. This commoditization trend intensifies pricing pressures and challenges our ability to differentiate our products solely on performance or features. Additionally, large technology companies and other competitors with substantial financial and technological resources may continue to develop and distribute free or low-cost solutions, further eroding market prices. If we fail to effectively respond to these trends through innovation, cost management, or other strategies, our competitive position could weaken. This could result in decreased market share, reduced pricing power, and a material adverse effect on our revenue, gross margins, and operating results.
Further, in recent years, we have seen some examples of industry consolidation in our markets. This trend may continue as companies attempt to strengthen or hold their market positions in an evolving industry and as
companies are acquired or are unable to continue operations. We believe that industry consolidation may result in stronger competition and may be accompanied by pressure from customers for lower prices. This could have a material adverse effect on our revenue, gross margins, and operating results.
If we fail to attract and retain key talent, effectively plan for succession, and maintain our unique corporate culture, our business and operating results could suffer.
To support our growth and execute our operating plans and strategic initiatives, we must effectively attract, train, develop, motivate, and retain skilled employees, while maintaining our unique corporate culture. Technical personnel with experience in machine vision, and more recently AI and transformer-based models, are in high demand and competition for their talents is intense. We rely on attracting and retaining talent with these skills to execute our product development plans. We use time-based and performance-based equity awards, including stock options and restricted stock units ("RSUs"), including performance restricted stock units ("PRSUs"), as a key component of compensation for our more senior employees to align employee interests with the interests of our shareholders, provide competitive compensation packages, and encourage employee retention. Our stock price volatility may cause periods of time during which option exercise prices might be less than the sale price of our common stock or the value of RSUs might be less competitive, which may lessen the retentive attributes of these awards. We are limited as to the number of stock options and RSUs that we may grant under our stock plans, and we are unsure how effective different stock-based awards with different vesting schedules will be to retain key talent. Accordingly, we may find it difficult to attract and retain employees, and any such difficulty could materially adversely affect our business.
Our success significantly depends on the continued contributions of our executive officers and other key management personnel. The loss of any of these individuals could materially adversely affect our business, operating results, and financial condition. Effective succession planning is crucial to ensure smooth transitions and maintain business continuity. Failure to attract and retain executive officers and other key management personnel or to implement effective succession planning could have a material adverse effect on our business, reputation, and financial performance.
Our failure to properly manage the distribution of our products and services could result in the loss of revenues and profits.
We utilize a direct sales force, as well as a network of distribution and integration partners, to sell our products and services. We are continually reviewing our go-to-market strategy to help ensure that we are reaching the most customers that we can and with the highest level of service. At times, this may require strategic changes to our sales organization or enlisting or dropping various partners in certain regions, which could result in additional costs or operational challenges. In 2023, we began investing more aggressively to expand our direct sales force to include entry-level sales personnel to sell our easier-to-deploy and easier-to-use products.
To support the expansion of our business internationally, we may decide to make changes to our operating structure in other countries when we believe these changes will make us more competitive by reaching additional customers, offering faster delivery, importation services, and/or local currency sales. These new operating models may require changes in legal structures, business systems, and business processes that may result in significant business disruption and negatively impact our customers’ experience, resulting in loss of sales. Furthermore, as we assume more responsibility for the importation of our products into other countries, we face higher compliance risk to adhere to local regulatory and trade requirements. Finally, the local stocking of finished products in countries outside of our primary distribution centers may result in higher costs and increased risk of excess or obsolete inventory associated with maintaining the appropriate level and mix of products in multiple inventory locations, resulting in lower gross margins.
Our go-to-market strategy has distinct risks and costs, and therefore, our failure to implement the most advantageous balance in the sales and operating model for our products and services could have a material adverse effect on our revenue and profitability.
Economic, political, and other risks associated with international sales and operations could adversely affect our business and operating results.
In 2024, approximately 67% of our revenue was derived from customers located outside of the United States. In addition, we source components from suppliers located outside of the United States, including China, utilize third-party contract manufacturers, primarily located in Indonesia and Malaysia, to assemble certain of our products, and manufacture optical components at in-house production plants located in China and Vietnam. We intend to continue to expand our sales and operations outside of the United States and expand our presence in international emerging markets. As a result, our business is subject to the risks inherent in international sales and operations, including, among other things:
•various regulatory and statutory requirements,
•export and import restrictions, including trade sanctions,
•trade tariffs,
•transportation delays,
•product certification requirements,
•employment regulations and local labor conditions,
•corruption,
•difficulties protecting intellectual property,
•varying data protection and privacy laws,
•business systems connectivity issues,
•gains and losses associated with foreign currency exposures,
•difficulties injecting and repatriating cash, and
•potentially adverse tax consequences.
Any of these factors could have a material adverse effect on our business, operating results, or financial condition.
We face several risks related to conducting business in China. In recent years, trade tariffs imposed by the United States on certain components imported from Chinese suppliers resulted in higher costs for our products, which, to date, have not been material to our total cost of revenue. In addition to trade tariffs, U.S. export controls that place restrictions on the exportation of our products or a subset of our products, including applicable regulations promulgated by the U.S. Commerce Department’s Bureau of Industry and Security, have had a negative impact on our revenue from customers based in China.
The recent expansion of U.S. sanctions on Chinese companies, including expanded restrictions with respect to Chinese semi-conductor companies, has heightened the risks and complexities for U.S. companies conducting business in China. These sanctions have led to increased scrutiny and operational challenges, which may result in costly supply chain shifts and loss of customers and business opportunities. Adjusting our business and supply chain to comply with new or amended international trade restrictions, sanctions, or tariffs can be expensive, time-consuming, and operationally challenging and may cause our customers to find alternative providers of machine vision products and services. Such restrictions are often implemented with little or no advance notice, creating uncertainty and limiting our ability to mitigate their impact effectively. Furthermore, customers in China may perceive heightened risks in doing business with U.S. companies, which may reduce demand for our products. To date, the impact of these restrictions has been immaterial to our total revenue and costs; however, if disputes and conflicts continue or further escalate, actions by governments in response could be significantly more severe and restrictive and could materially adversely affect our operating results.
An escalation of the China-Taiwan conflict could lead to challenges procuring integrated circuit chips from Taiwan-based vendors that are fundamental to the design of our products. Although we are taking steps to mitigate this risk, including purchasing chips in advance of demand, there can be no assurance that these steps will be successful in securing an adequate supply of chips at our current cost structure. Furthermore, purchasing inventory in advance of demand may expose us to increased risk of excess and obsolete inventory and resulting charges.
Implementation of our acquisition strategy may not be successful, which could affect our ability to increase our revenue or profitability and may otherwise adversely affect our business.
We have acquired, and may continue to acquire, new businesses and technologies. During the fourth quarter of 2023, we completed our largest acquisition to date by acquiring Moritex Corporation, a global provider of premium optical components based in Japan, for an enterprise value of approximately $270 million. The Moritex acquisition, and acquisitions in general, may involve significant risks and uncertainties, which could include, among others:
•the diversion of management's attention from other operational matters,
•the inability to realize expected synergies or other benefits resulting from the acquisition, including the failure to achieve projected sales of acquired products,
•difficulties or delays integrating personnel, operations, technologies, products, processes, and systems of the acquired business, particularly in locations far from the Company's headquarters,
•the failure to retain key talent and difficulties integrating corporate cultures,
•entry into markets in which we may have limited prior experience and where competitors have stronger market positions,
•the inability to protect and secure acquired intellectual property or confidential information,
•difficulties or delays completing the development of acquired in-process technology,
•the failure to retain key customers,
•the impairment of acquired intangible assets resulting from lower-than-expected cash flows from the acquired assets,
•acquisition-related charges, which could adversely impact operating results and cash flows in any given period and could be substantially different from period to period,
•difficulties with implementing internal controls and accounting systems necessary to be compliant with requirements applicable to public companies subject to SEC reporting, and
•difficulties with closing a transaction due to regulatory approvals, employment matters, required consents, litigation, or other challenges, which could increase costs and prevent the acquisition from being completed within the expected timeframe, or from being completed at all.
Acquisitions are inherently risky and the inability to effectively manage these risks could have a material adverse effect on our operating results.
Our future capital needs are uncertain and may be influenced by various factors, including strategic initiatives, which could impact our financial condition and operating results.
Our future capital needs are uncertain and may be affected by various factors, including strategic initiatives. We may need to raise additional capital in the future for a variety of reasons, such as to acquire businesses or fund growth opportunities. Raising capital may involve issuing debt, which could increase our leverage and limit our financial flexibility, or equity, which could result in dilution to our existing shareholders. There can be no assurance that such capital will be available on favorable terms, or at all. Challenges in obtaining favorable funding may delay, reduce, or eliminate certain business activities or growth initiatives, which could adversely affect our financial condition and operating results.
Risks Related to Information Technology and Intellectual Property
Information security breaches may adversely affect our business.
We rely on our information technology systems, including third-party services, to effectively run our business. We may be subject to information security failures or breaches caused by hacking, malicious software, acts of vandalism or terrorism, or other events. The risk of a cyberattack continues to increase given rapid advancements in technologies, as well as the proliferation of diplomatic and armed conflict throughout the world. Our security measures or those of our third-party service providers may not detect or prevent such breaches.
Cybersecurity threats are becoming increasingly sophisticated and frequent, with attackers employing new and varied methods such as ransomware, phishing, and advanced persistent threats. These threats pose significant risks to our operations, including:
•disruption of operations, system outages, data corruption, and other disruptions, impacting our ability to deliver products and services to our customers,
•the distraction of management and diversion of information technology resources,
•theft of our intellectual property, including software source code, trade secrets, and other confidential business or proprietary information,
•financial losses through fraud, theft of assets, or the costs associated with responding to and mitigating the effects of an attack,
•reputation damage and loss of trust among stakeholders as a result of breaches of customer, vendor, or employee data,
•litigation, regulatory penalties, and increased compliance costs as a result of data breaches and cybersecurity incidents.
We have experienced cybersecurity incidents in the past, however, to date, these incidents have not had a material impact on our operations or financial results. Future cybersecurity incidents could have a material adverse effect on our business, reputation, financial condition, or operating results. We continuously invest in and enhance our
cybersecurity measures, including employee training, incident response planning, and collaboration with third-party experts, to mitigate these risks.
Changes in laws or regulations relating to data privacy or data protection, or any actual or perceived failure by us to comply with such laws and regulations, could harm our business.
We are subject to a variety of United States and international laws, rules, policies, and other obligations regarding data protection and security breaches. Privacy and data security have become significant issues in the United States, Europe, and in many other jurisdictions where we conduct or may in the future conduct our operations. The regulatory framework for the collection, use, safeguarding, sharing, and transfer of information worldwide is rapidly evolving and is likely to remain uncertain for the foreseeable future. New regulations may require us to further modify certain of our information practices and could subject us to additional compliance costs. These laws continue to develop and may be inconsistent from jurisdiction to jurisdiction.
The adoption of AI technologies is subject to increasing regulatory scrutiny, with emerging laws such as the European Union's AI Act and U.S. initiatives potentially imposing requirements for transparency, bias mitigation, and ethical deployment. Compliance with these evolving standards may increase costs, delay product launches, or require significant changes to our technologies. AI-related concerns, including data privacy, intellectual property, and cybersecurity, add further complexity, while inconsistent global regulations heighten operational challenges.
Complying with emerging and changing requirements may be costly and require us to change certain business practices. Noncompliance could result in significant fines, penalties, claims, or legal liability. Any inability to adequately address privacy and data security concerns or comply with applicable privacy or data security laws, regulations, and policies could result in additional cost, damage our reputation, inhibit sales, and adversely affect our business, financial condition, and operating results.
If we fail to successfully protect our intellectual property, our competitive position and operating results could suffer.
We rely on our proprietary software technology and hardware designs, as well as the technical expertise, creativity, and knowledge of our personnel, to maintain our position as a leading provider of machine vision products. Software piracy and reverse engineering may result in counterfeit products that are misrepresented in the market as Cognex products or pirated products that contain stolen technology, such as software. Although we use a variety of methods to protect our intellectual property, we rely most heavily on patent, trademark, copyright, and trade secret protection, as well as non-disclosure agreements with customers, suppliers, employees, and consultants. We also attempt to protect our intellectual property by restricting access to our proprietary information by a combination of technical and internal security measures. These measures, however, may not be adequate to:
•protect our proprietary technology,
•protect our patents from challenge, invalidation, or circumvention, or
•ensure that our intellectual property will provide us with competitive advantages.
Our pending and future patent applications may not issue as patents or, if issued, may not issue in a form that will provide us with any meaningful protection or any competitive advantage. Even if issued, existing or future patents may be challenged, narrowed, invalidated, or circumvented, which could limit our ability to stop competitors from developing and marketing similar products, increase costs, or limit the length of patent protection we may have for our products. Furthermore, other companies may design around technologies we have patented, licensed, or developed. Moreover, changes in patent laws or their interpretation in the United States and other countries could also diminish the value of our intellectual property or narrow the scope of our patent protection. In addition, the legal systems of certain countries do not favor the aggressive enforcement of patents and the laws of foreign countries may not protect our rights to the same extent as the laws of the United States. As a result, our patent portfolio may not provide us with sufficient rights to exclude others from commercializing products similar to ours. Any of these adverse circumstances could have a material adverse effect on our operating results.
Risks Related to our Supply Chain
The failure to manufacture and deliver products in a timely manner could negatively affect customer satisfaction and our operating results.
A significant portion of our products is manufactured by a third-party contractor located in Indonesia. Since 2022, we have been scaling up an additional contract manufacturer located in Malaysia, which has further mitigated risk, diversified our supply chain, and expanded our production capacity. With the acquisition of Moritex Corporation in the fourth quarter of 2023, we began in-house manufacturing of optical components, such as lenses and lighting, in production plants located in China and Vietnam. In-house manufacturing exposes us to various risks that could
adversely impact our business operations and financial condition, including, but not limited to, (i) the health and safety of our employees engaged in manufacturing; (ii) the storage, use, and transportation of hazardous materials utilized in the manufacturing process; and (iii) legal risks related to environmental protection and health and safety laws in all applicable jurisdictions. Although our third-party and in-house manufacturers have the ability to shift production to plants in other regions when operations in their primary plant are disrupted, production and test equipment located at the plant that is unique to the manufacture of Cognex products creates practical challenges to doing so in a timely manner. Furthermore, the loss of a key supplier, or failure of a key supplier to access necessary credit to operate its business or otherwise remain in business, could have a material adverse impact on our operating results. Changes and additions to our supply chain require considerable time and resources and involve significant risks and uncertainties, and we can provide no assurance of return on, or success of, such investments.
We also rely on our third-party and in-house manufacturers to meet delivery schedules. We have experienced, and may continue to experience, delays in the delivery of our products from our suppliers due to the impact of global supply chain challenges or other factors. For example, on June 7, 2022, our primary contract manufacturer experienced a fire at its plant in Indonesia which destroyed a significant amount of Cognex inventories. The fire resulted in delayed shipments, loss of sales, and higher-than-normal purchase costs to replenish component inventories, which adversely impacted our business, financial condition, and results of operations through the first half of 2023. Challenges in obtaining components and maintaining production have resulted in delays, and may continue to result in delays, in meeting our delivery schedules that, as a result, delay deliveries to our customers past their requested delivery date. Delays in customer orders also can result in delayed revenue recognition or loss of business which can impact our operating results in a particular reporting period.
Our inability to obtain components for our products could adversely affect our operating results.
Certain key electronic and mechanical components, such as integrated circuit chips, are fundamental to the design of Cognex products. Due to the impact of global supply chain challenges and other factors, we have experienced, and may continue to experience, disruptions to the supply of components for our products that have resulted, and may continue to result, in higher purchase costs, higher delivery costs, and manufacturing delays.
If components purchased by our contract manufacturers have not been consumed in our production of finished goods within a certain period of time, we have been required, and may continue to be required, to purchase these components from our contract manufacturers and later sell them back when they are needed to meet our demand. While we typically expect these components to be consumed in the production of our finished goods, this arrangement may expose us to an increased risk of excess or obsolete inventory and resulting charges.
We source components from preferred vendors that are selected based on price, quality and performance considerations. In the event of a supply disruption from a preferred vendor, these components typically may be purchased from alternative vendors, which may result in higher purchase costs and manufacturing delays based on the time required to identify and obtain sufficient quantities from an alternative source. Certain Cognex products utilize components that are available from only one source. If we are unable to secure adequate supply from these sources, we may have to redesign our products, which may lead to higher costs, delays in manufacturing, and loss of sales.
Although we are taking certain actions to mitigate supply risk and have entered into agreements for the supply of many components, there can be no assurance that Cognex will be able to extend or renew these agreements on similar terms, such as purchase prices, or at all. Component suppliers may suffer from poor financial conditions, which can lead to business failure for the supplier, further limiting our ability to obtain sufficient quantities of components on reasonable terms, or at all. Therefore, Cognex remains subject to risks of supply shortages and price increases that can adversely affect our business, gross margins, and operating results.
Our products may contain design or manufacturing defects, which could result in reduced demand, significant delays, substantial costs, or customer dissatisfaction and/or loss of sales.
If flaws in either the design or manufacture of our products were to occur, we could experience a rate of failure in our products that could result in significant delays in shipment and material repair or replacement costs. Due, in part, to our focus on releasing new products as quickly as possible to satisfy customer demands, our release-to-market process may not be robust enough to detect significant design flaws or software bugs. While we engage in product quality programs and processes, including actively monitoring and evaluating the quality of our component suppliers and contract manufacturers, these actions may not be sufficient to avoid a product failure rate that results in:
•substantial delays in shipment,
•significant repair or replacement costs,
•product liability claims or lawsuits, particularly in connection with life sciences customers, electric vehicle battery manufacturers, or other high-risk end-user industries,
•customer dissatisfaction and/or loss of sales, or
•potential damage to our reputation.
Any of these results could have a material adverse effect on our operating results.
Risks Related to Financial Performance
The loss of, or significant curtailment of purchases by, large customers could have an adverse effect on our business.
Over the past few years, we had two customers that represented 10% or more of our total revenue. Large customers may divert management’s attention from other operational matters and pull resources from other areas of the business, resulting in potential loss of sales from other customers. In addition, large customers may receive preferred pricing and a higher level of support, which may lower our gross margin. Furthermore, in certain instances, due to long supplier lead times, we may purchase inventory in advance of receipt of a large customer purchase order, which exposes us to an increased risk of excess or obsolete inventory and resulting charges. The loss of, or curtailment of purchases by, any one or more of our large customers, has had, and could in the future have a material adverse effect on our operating results.
Our financial performance varies quarterly due to seasonal and cyclical purchasing patterns and the timing of large customer orders, which can lead to challenges in accurately forecasting our financial results.
Our business experiences significant seasonal variations, with certain quarters typically generating higher revenues due to industry cycles and customer purchasing patterns, which can significantly impact quarterly results depending on their timing. The sale of our products and services is dependent on customers whose industries are subject to seasonal or cyclical trends in the demand for their products. For example, the consumer electronics industry is particularly volatile, making demand difficult to anticipate, which exposes us to increased risk of excess and obsolete inventory and resulting charges. This volatility can also lead to challenges in forecasting our financial results. Failing to meet quarterly revenue and earnings expectations due to these seasonal and cyclical trends could negatively impact investor confidence, resulting in stock price volatility and potential reputational damage.
We are at risk for impairment charges with respect to our investments or acquired intangible assets, which could have a material adverse effect on our operating results.
As of December 31, 2024, we had approximately $401 million of debt securities in our investment portfolio. These debt securities are reported at fair value, with unrealized gains and losses, net of tax, included in shareholders’ equity as other comprehensive income (loss). As of December 31, 2024, our portfolio of debt securities had a net unrealized loss of $4,904,000. Included in this net loss, were gross unrealized losses totaling $5,317,000, of which $2,118,000 related to debt securities in a loss position for greater than twelve months. Management monitors its debt securities that are in an unrealized loss position to determine whether a loss exists related to the credit quality of the issuer that would be reported in current operations. While management currently intends to hold these securities to full value recovery at maturity, we may determine to sell these securities prior to maturity to fund our operations, complete acquisitions, or for other purposes, which may result in a loss. It is our policy to invest in investment-grade debt securities that minimize our exposure to credit losses; however, no assurances can be made that we will not incur credit losses with respect to our securities portfolio.
As of December 31, 2024, we had approximately $91 million in acquired intangible assets, consisting primarily of customer relationships and completed technologies. The majority of these intangible assets were recorded in the fourth quarter of 2023 when Cognex acquired Moritex Corporation. These assets are susceptible to changes in fair value due to a decrease in the historical or projected cash flows from the use of these assets, which may be negatively impacted by economic trends. We evaluate long-lived assets for impairment annually each fourth quarter and whenever events or changes in circumstances, referred to as "triggering events," indicate the carrying value may not be recoverable. If we determine that any of these investments or intangible assets are impaired, we will be required to take a related charge that could have a material adverse effect on our operating results.
We may have additional tax liabilities and our effective tax rate may increase or fluctuate, which could adversely affect our operating results and financial condition.
As a multinational corporation, we are subject to income taxes, as well as non-income based taxes, in the United States and numerous foreign jurisdictions. Our effective income tax rate is dependent on the geographic distribution of our worldwide earnings or losses and the tax laws and regulations in each geographic region in which we operate. Significant judgment is required in determining our worldwide provision for income and other taxes. The
application of tax laws and regulations is subject to legal and factual interpretation, judgment, and uncertainty, and tax laws themselves are subject to change. For example, many countries have adopted, or are considering the adoption of, revisions to their respective tax laws based on the Organization for Economic Co-operation and Development’s (“OECD”) Inclusive Framework, which could impact our tax liability due to our organizational structure and significant operations outside of the United States. Furthermore, we are subject to regular review and audit by both domestic and foreign tax authorities and may be assessed additional taxes, penalties, fees, or interest. Although we believe our tax positions are reasonable, the final determination of tax audits or any related litigation could be different from what is reflected in our financial statements and could have a material adverse effect on our income tax provision or liquidity in the period in which the determination is made.
Fluctuations in foreign currency exchange rates and the use of derivative instruments to hedge these exposures could adversely affect our reported results, liquidity, and competitive position.
We face exposure to foreign currency exchange rate fluctuations, as a significant portion of our revenues, expenses, assets, and liabilities are denominated in currencies other than the functional currencies of our subsidiaries or the reporting currency of our company, which is the U.S. Dollar. In certain instances, we utilize forward contracts to hedge against foreign currency fluctuations. These contracts are used to minimize foreign currency gains or losses, as the gains or losses on the derivative are intended to offset the losses or gains on the underlying exposure. We do not engage in foreign currency speculation. If the counterparty to any of our hedging arrangements experiences financial difficulties, or is otherwise unable to honor the terms of the contract, we may experience material losses. We may enter into other types of financial instruments in the future to mitigate our foreign currency risk as we deem appropriate.
The success of our foreign currency risk management program depends on forecasts of transaction activity denominated in various currencies. To the extent that these forecasts are overstated or understated during periods of currency volatility, we could experience unanticipated foreign currency gains or losses that could have a material impact on our results of operations. In addition, our failure to identify new exposures and hedge them in an effective manner may result in material foreign currency gains or losses.
General Risk Factors
Unfavorable global economic conditions may negatively impact our operating results.
Our revenue levels are impacted by global economic conditions, as we have a significant business presence in many countries throughout the world. Unfavorable economic conditions, such as inflation, slower growth or recession, higher interest rates, tighter credit, and labor shortages, may cause companies to delay or reduce spending for automation projects, including those with machine vision, amid weaker general manufacturing confidence and heightened uncertainty around global trade. Furthermore, customer confidence and capital investment can be materially adversely impacted as a result of financial market volatility, negative financial news, declines in income or asset values, energy shortages and cost increases, labor and healthcare costs, and other global economic conditions. When global economic conditions are unfavorable, our revenue and our ability to generate operating profits could be materially adversely affected.
As a result of global economic conditions, our business is subject to the following risks, among others:
•our customers may not have sufficient cash flow or access to financing to purchase our products and services,
•our customers may not pay us within agreed upon terms or may default on their payments altogether,
•our suppliers may be unable to fulfill their delivery obligations to us in a timely manner,
•lower demand for our products may result in charges for excess and obsolete inventory if we are unable to sell inventory that is either already on hand or that we are committed to purchase,
•lower cash flows may result in impairment charges for acquired intangible assets or goodwill,
•a decline in our stock price may make stock-based awards a less attractive form of compensation and a less effective incentive for retention for our employees, and
•the trading price of our common stock may be volatile.
As of December 31, 2024, we had approximately $587 million in cash and investments. In addition, we have no long-term debt. We believe that our strong cash position puts us in a relatively good position to weather economic downturns. Nevertheless, our operating results have been materially adversely affected in the past, and could be materially adversely affected in the future, as a result of unfavorable economic conditions and reduced capital spending by manufacturers and logistics companies worldwide.
Natural disasters, widespread public health crises, and man-made disasters could result in business disruptions that may adversely affect our business and operating results.
Our business, and the businesses of our customers, suppliers, and third-party service providers, could be disrupted by natural disasters, such as extreme weather events and earthquakes, public health crises, such as pandemics and epidemics, man-made disasters, such as terrorism and industrial accidents, or other events outside of our control. Certain facets of our business operations, such as our third-party primary contractor manufacturers in Indonesia and Malaysia, are in locations that may be more prone to earthquakes and other natural disasters. Following a business disruption, the Company could be subject to production downtimes, operational delays, substantial recovery time, customer claims, significant expenditures to resume operations, the diversion of management’s attention and resources, or loss of business, any of which could have a material adverse effect on our competitive position, financial condition, or operating results.
While we maintain insurance coverage for certain types of losses, such insurance coverage may be insufficient to cover all losses that may arise. The impact of any such business disruption on the Company is difficult to predict and will depend on the severity of the event and resulting governmental, community, and business actions.
Expectations relating to environmental, social, and governance considerations expose the Company to potential liabilities, increased costs, reputational harm, and other adverse effects on our business.
Governments, regulators, investors, employees, customers, suppliers, and other stakeholders are increasingly focused on environmental, social, and governance disclosures relating to businesses activities. Performance in this area is driven by transparency, goal setting, and third-party opinion. Any failure, or perceived failure, to further our initiatives, adhere to our public statements, comply with federal, state, or international environmental, social, and governance laws and regulations, or meet evolving and varied stakeholder expectations and standards could result in legal and regulatory proceedings against the Company and adversely affect our business, reputation, financial condition, operating results, stock price, and ability to operate in certain geographic regions.
Responding to environmental, social, and governance disclosure requests and the implementation of associated initiatives involves risks and uncertainties, requires investments, and depends in part on third-party performance or data that is outside of our control. Initiatives related to climate performance may be dependent upon the availability of alternative energy sources and evolving procurement practices. Stakeholder expectations and priorities continue to change. We cannot guarantee that we will achieve our environmental, social, and governance goals or commitments.
The price of the Company’s stock is subject to volatility.
We have experienced substantial stock price volatility in the past and may continue to do so in the future. The price of our stock may be affected by factors such as our financial performance, announcements of technological innovations or new products by us or our competitors, market conditions, and other factors. Additionally, the Company, the technology industry, and the overall stock market have, from time to time, experienced extreme stock price and volume fluctuations that have affected stock prices in ways that may have been unrelated to these companies’ operating performance. We believe the price of our stock should reflect expectations for future growth and profitability. If we fail to meet expectations related to future growth, profitability, dividends, share repurchases, or other market expectations, the price of our stock may decline significantly, which could have a material adverse impact on investor confidence and employee retention.
Our Company may be subject to time-consuming and costly litigation or activist shareholder activities.
From time to time, we may be subject to various claims, demands, and lawsuits by competitors, shareholders, customers, distributors, patent trolls, former employees, or other parties arising in the ordinary course of business, including lawsuits charging patent infringement, or claims and lawsuits instituted by us to protect our intellectual property and confidential information, or for other reasons. These matters can be time-consuming, divert management’s attention and resources, and cause us to incur significant expenses. Furthermore, the results of any of these actions may have a material adverse effect on our operating results.
ITEM 1B: UNRESOLVED STAFF COMMENTS
None
ITEM 1C: CYBERSECURITY
Cybersecurity Risk Management
As part of our overall “Enterprise Risk Management” program, the Company has implemented a cybersecurity risk management program that is informed by recognized industry standards and frameworks. Our cybersecurity risk
management program includes a number of components, including information security program assessments, penetration testing, and threat simulation exercises that are conducted periodically by both internal and external resources, as well as continuous monitoring of critical risks from cybersecurity threats using automated tools. During onboarding and periodically thereafter, we conduct trainings for the Company’s employees and contractors about cybersecurity risks, including sending test phishing emails for training purposes to all users of the Company’s email system.
As part of our cybersecurity risk management program, we maintain processes to assess and review the cybersecurity practices of third-party vendors and service providers, including utilization of software to evaluate, assess, and monitor cybersecurity risks posed by third parties that provide critical services or handle confidential information. Additionally, prior to engaging a critical third-party vendor or service provider, and periodically thereafter, we conduct security audits of such third parties, and, as appropriate, include security requirements in contracts.
We, like other companies in our industry, face a number of cybersecurity risks in connection with our business. Although such risks have not materially affected us, including our business strategy, results of operations, or financial condition, to date, we have, from time to time, experienced threats and security incidents related to our data and systems, including denial of service and phishing attacks. For more information about the cybersecurity risks we face, see the risk factor entitled “Information security breaches may adversely affect our business” in Item 1A- Risk Factors.
Governance
Our cybersecurity risk management program and related operations and processes are managed by our Information Security team (the “IS Team”), which is led by the Senior Director of Information Security. The Senior Director of Information Security role is currently held by an individual who has over fifteen years of experience managing information security programs. The IS Team is responsible for assessing risks from cybersecurity threats, including their potential business impact and likelihood of occurrence, as well as implementing risk mitigations and remediations.
The IS Team provides reports on cybersecurity risk management processes to the Chief Financial Officer and other leaders of the Company on a quarterly basis, or as potentially critical risks from cybersecurity threats or incidents arise.
The IS Team provides reports on a semi-annual basis to the Audit Committee, which oversees cybersecurity risks pursuant to the Audit Committee Charter. The Audit Committee periodically reports on cybersecurity risk management to the full Board of Directors. The Board of Directors, as a whole and through its committees, has responsibility for the oversight of risk management.
ITEM 2: PROPERTIES
In 1994, Cognex purchased and renovated a 100,000 square-foot building located in Natick, Massachusetts that serves as our corporate headquarters and is occupied by employees primarily in research, development, and engineering, manufacturing and quality assurance, and administration functions. In 1997, Cognex completed construction of a 50,000 square-foot addition to this building.
In 1995, Cognex purchased an 83,000 square-foot office building adjacent to our corporate headquarters that is occupied by employees primarily in marketing, service, information technology, and finance functions.
In 1997, Cognex purchased a three and one-half acre parcel of land adjacent to our corporate headquarters. This land is being held for future expansion and is currently used as an Ultimate Frisbee Field for our Cognoids.
In 2007, Cognex purchased a 19,000 square-foot building adjacent to our corporate headquarters that is currently used as a training center for our sales function.
In 2014, Cognex purchased a 50,000 square-foot building in Cork, Ireland that serves as the distribution center for customers located in Europe.
In 2021, Cognex entered into a lease for a 65,000 square-foot building in Southborough, Massachusetts for a term of 10 years that serves as the distribution center for customers located in the Americas.
In 2023, Cognex entered into a lease for a 115,000 square-foot building in Singapore for a term of 10 years and 6 months that serves as the distribution center for customers located in Asia.
In connection with the acquisition of Moritex Corporation in the fourth quarter of 2023, the Company acquired a 162,000 square-foot building in Shenzhen, China and assumed a lease agreement for a 22,000 square-foot building in Bac Ninh, Vietnam, both of which serve as production plants for optical components.
Cognex conducts certain of its operations in other leased facilities, predominantly research, development, and engineering, sales, and administration functions. These lease agreements expire at various dates through 2033. Certain of these leases contain renewal options, leasehold improvement incentives, retirement obligations, escalation clauses, rent holidays, and variable payments tied to a consumer price index.
ITEM 3: LEGAL PROCEEDINGS
Various claims and legal proceedings generally incidental to the normal course of business are pending or threatened on behalf of or against the Company. While we cannot predict the outcome of these matters, we believe that any liability arising from them will not have a material adverse effect on our financial position, liquidity, or results of operations.
ITEM 4: MINE SAFETY DISCLOSURES
Not applicable.
PART II
ITEM 5: MARKET FOR REGISTRANT’S COMMON EQUITY, RELATED STOCKHOLDER MATTERS, AND ISSUER PURCHASES OF EQUITY SECURITIES
The Company’s common stock is traded on The NASDAQ Stock Market LLC, under the symbol CGNX. As of January 26, 2025, there were approximately 600 shareholders of record of the Company’s common stock. The Company believes the number of beneficial owners of the Company’s common stock on that date was substantially greater.
In March 2020, the Company's Board of Directors authorized the repurchase of $200,000,000 of the Company's common stock. Under this March 2020 program, in addition to repurchases made in prior years, the Company repurchased 1,677,000 shares at a cost of $117,000,000 in 2022, which completed purchases under the March 2020 program.
In March 2022, the Company's Board of Directors authorized the repurchase of an additional $500,000,000 of the Company's common stock. Under this March 2022 program, the Company repurchased 1,682,000 shares at a cost of $87,314,000 in 2022, 1,723,000 shares at a cost of $79,794,000 in 2023, and 1,711,000 shares at a cost of $67,085,000 in 2024, leaving a remaining balance of $265,807,000 as of December 31, 2024. The 2023 repurchase included $446,000 of buyback Excise Tax in accordance with the Inflation Reduction Act of 2022.
The Company may repurchase shares under this program in future periods depending on a variety of factors, including, among other things, the impact of dilution from employee stock awards, stock price, share availability, and cash requirements. The Company is authorized to make repurchases of its common stock through open market purchases, pursuant to Rule 10b5-1 trading plans, or in privately negotiated transactions.
The following table sets forth information with respect to purchases by the Company of shares of its common stock during each fiscal month of the fourth quarter of 2024:
| | | | | | | | | | | | | | | | | | | | | | | | | | |
| Total Number of
Shares Purchased | | Average
Price Paid
per Share | | Total Number of
Shares Purchased as
Part of Publicly
Announced Plans or
Programs | | Approximate Dollar
Value of Shares that
May Yet Be
Purchased Under the
Plans or Programs | |
| September 30 - October 27, 2024 | 119,000 | | | $ | 39.45 | | | 119,000 | | | $ | 304,355,000 | | |
| October 28 - November 24, 2024 | 109,000 | | | 39.71 | | | 109,000 | | | 300,007,000 | | |
| November 25 - December 31, 2024 | 928,000 | | | 36.87 | | | 928,000 | | | 265,807,000 | | |
| Total | 1,156,000 | | | $ | 37.40 | | | 1,156,000 | | | $ | 265,807,000 | | |
The information required by Item 5 of Form 10-K regarding equity compensation plans is incorporated herein by reference to Item 12 of Part III of this Annual Report.
The Company’s Board of Directors declared and paid cash dividends of $0.065 per share in the first, second, and third quarters of 2022, $0.070 per share in the fourth quarter of 2022 and in the first, second, and third quarters of 2023, and $0.075 per share in the fourth quarter of 2023 and in the first, second, and third quarters of 2024. The dividend was increased to $0.080 per share in the fourth quarter of 2024.
Total dividends paid were $52,329,000 in 2024, $49,079,000 in 2023, and $45,921,000 in 2022. Future dividends will be declared at the discretion of the Company's Board of Directors and will depend on such factors as the Board deems relevant, including, among other things, the Company's ability to generate positive cash flow from operations.
Set forth below is a line graph comparing the annual percentage change in the cumulative total shareholder return on the Company’s common stock, based on the market price of the Company’s common stock, with the total return on companies within the Nasdaq Composite Index and the Nasdaq Lab Apparatus & Analytical, Optical, Measuring & Controlling Instrument (SIC 3820-3829 US Companies) Index (the “Nasdaq Lab Apparatus Index”). The performance graph assumes an investment of $100 in each of the Company and the two indices, and the reinvestment of any dividends. The historical information set forth below is not necessarily indicative of future performance. Data for the Nasdaq Composite Index and the Nasdaq Lab Apparatus Index was provided to the Company by Research Data Group, Inc.
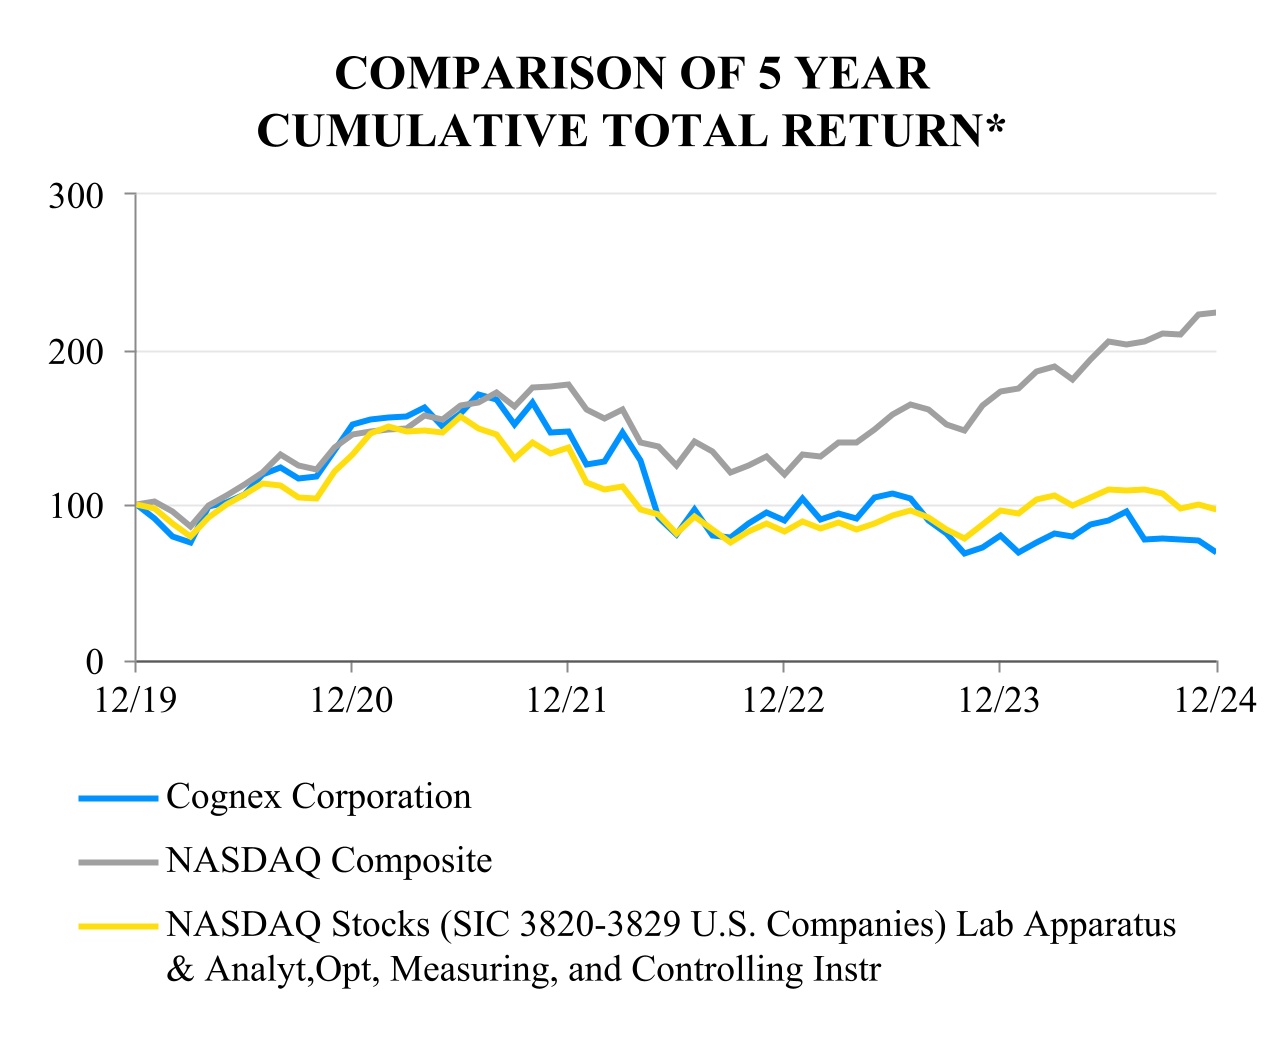
| | | | | | | | | | | | | | | | | | | | | | | | | | | | | | | | | | | |
| *$100 invested on 12/31/2019 in stock or index, including reinvestment of dividends. Fiscal year ended December 31. |
| 12/19 | | 12/20 | | 12/21 | | 12/22 | | 12/23 | | 12/24 |
| Cognex Corporation | 100.00 | | | 151.56 | | | 147.25 | | | 89.67 | | | 79.95 | | | 69.20 | |
| NASDAQ Composite | 100.00 | | | 144.92 | | | 177.06 | | | 119.45 | | | 172.77 | | | 223.87 | |
| NASDAQ Stocks | 100.00 | | | 132.07 | | | 136.90 | | | 82.82 | | | 96.36 | | | 97.07 | |
| (SIC 3820-3829 U.S. Companies) Lab Apparatus & Analyt,Opt, Measuring, and Controlling Instrument) | | |
ITEM 7: MANAGEMENT’S DISCUSSION AND ANALYSIS OF FINANCIAL CONDITION AND RESULTS OF OPERATIONS
FORWARD-LOOKING STATEMENTS
Certain statements made in this report, as well as oral statements made by the Company from time to time, constitute forward-looking statements within the meaning of Section 27A of the Securities Act of 1933, as amended, and Section 21E of the Exchange Act. Readers can identify these forward-looking statements by our use of the words “expects,” “anticipates,” “estimates,” "potential," “believes,” “projects,” “intends,” “plans,” “will,” “may,” “shall,” “could,” “should,” "opportunity," "goal" and similar words and other statements of a similar sense. These statements are based on our current estimates and expectations as to prospective events and circumstances, which may or may not be in our control and as to which there can be no firm assurances given. These forward-looking statements, which include statements regarding business and market trends, future financial performance and financial targets, customer demand and order rates and timing of related revenue, future product or revenue mix, research and development activities, sales and marketing activities, new product offerings, innovation and product development activities, customer acceptance of our products, capital expenditures, cost and working capital management activities, investments, liquidity, dividends and stock repurchases, strategic and growth plans and opportunities, acquisitions, and estimated tax benefits and expenses and other tax matters, involve known and unknown risks and uncertainties that could cause actual results to differ materially from those projected. Such risks and uncertainties include: (1) the technological obsolescence of current products and the inability to develop new products; (2) the impact of competitive pressures; (3) the inability to attract and retain skilled employees, effectively plan for succession, and maintain our unique corporate culture; (4) the failure to properly manage the distribution of products and services; (5) economic, political, and other risks associated with international sales and operations, including the impact of trade disputes on the economic climate in China; (6) the challenges in integrating and achieving expected results from acquired businesses; (7) uncertainty surrounding our future capital needs; (8) information security breaches; (9) the failure to comply with laws or regulations relating to data privacy or data protection; (10) the inability to protect our proprietary technology and intellectual property; (11) the failure to manufacture and deliver products in a timely manner; (12) the inability to obtain, or the delay in obtaining, components for our products at reasonable prices; (13) the inability to design and manufacture high-quality products; (14) the loss of, or curtailment of purchases by, large customers in the logistics, consumer electronics, or automotive industries; (15) challenges in accurately forecasting our financial results due to seasonal and cyclical variations in customer purchasing patterns; (16) potential impairment charges with respect to our investments or acquired intangible assets; (17) exposure to additional tax liabilities, increases and fluctuations in our effective tax rate, and other tax matters; (18) fluctuations in foreign currency exchange rates and the use of derivative instruments; (19) unfavorable global economic conditions, including increases in interest rates and elevated inflation rates; (20) business disruptions from natural or man-made disasters, public health crises, or other events outside our control; (21) exposure to potential liabilities, increased costs, reputational harm, and other adverse effects associated with expectations relating to environmental, social, and governance considerations; (22) stock price volatility; and (23) our involvement in time-consuming and costly litigation or activist shareholder activities. The foregoing list should not be construed as exhaustive and we encourage readers to refer to the detailed discussion of risk factors included in Part I - Item 1A of this Annual Report on Form 10-K. The Company cautions readers not to place undue reliance upon any such forward-looking statements, which speak only as of the date made. The Company disclaims any obligation to subsequently revise forward-looking statements to reflect the occurrence of anticipated or unanticipated events or circumstances after the date such statements are made.
EXECUTIVE OVERVIEW
Cognex Corporation (“the Company”) invents and commercializes technologies that address some of the most critical manufacturing and distribution challenges. We are a leading global provider of machine vision products and solutions that seek to improve efficiency and quality in a wide range of businesses across attractive industrial end markets. In addition to product revenue derived from the sale of machine vision products, the Company also generates revenue by providing maintenance and support, consulting, and training services to its customers; however, service revenue accounted for less than 10% of total revenue for all periods presented.
Machine vision is used in a variety of industries where technology is widely recognized as an important component of automated production, distribution, and quality assurance. Virtually every manufacturer or distributor can achieve better quality and efficiency by using machine vision. This results in a broad base of potential customers across a
variety of industries, including logistics, automotive, consumer electronics, semiconductor, consumer products, medical-related, and food and beverage.
Revenue was $914,515,000 in 2024, representing an increase of 9% over the prior year. The increase was due to incremental revenue arising from the acquisition of Moritex Corporation (“Moritex”) that closed in the fourth quarter of 2023, as well as higher revenue from customers in the logistics and semiconductor industries. These increases were partially offset by lower revenue from customers in the automotive industry and softness across our broader factory automation business.
Gross margin was 68% in 2024 compared to 72% in 2023. The decrease was primarily due to a less favorable revenue mix related to the contribution of Moritex and higher logistics revenue, and to a lesser extent, the impact of pricing pressures.
Operating expenses increased 9% over the prior year. Investments intended to expand our sales coverage, incremental costs related to the acquisition of Moritex, and higher incentive compensation expenses were partially offset by disciplined cost management and lower total headcount. Cost recoveries recorded in 2023 related to the 2022 fire at the Company’s contract manufacturer also contributed to the increase.
Operating income decreased to 13% of revenue in 2024 compared to 16% of revenue in 2023 driven by the lower gross margin percentage. Net income decreased to 12% of revenue, or $0.62 per share, in 2024 compared to 14% of revenue, or $0.65 per share, in 2023.
The following table sets forth certain consolidated financial data as a percentage of revenue:
| | | | | | | | | | | | | | | | | |
| | Year Ended December 31, |
| 2024 (1) | | 2023 (1) | | 2022 (1) |
| Revenue | 100 | % | | 100 | % | | 100 | % |
| Cost of revenue | 32 | | | 28 | | | 28 | |
| Gross profit | 68 | | | 72 | | | 72 | |
| Research, development, and engineering expenses | 15 | | | 17 | | | 14 | |
| Selling, general, and administrative expenses | 41 | | | 40 | | | 31 | |
| Loss (recovery) from fire | — | | | (1) | | | 2 | |
| | | | | |
| | | | | |
| Operating income | 13 | | | 16 | | | 24 | |
| Non-operating income | 2 | | | 1 | | | — | |
| Income before income tax expense | 14 | | | 16 | | | 24 | |
| Income tax expense | 3 | | | 3 | | | 3 | |
| Net income | 12 | % | | 14 | % | | 21 | % |
(1) Amounts may not total properly due to rounding.
RESULTS OF OPERATIONS
Year Ended December 31, 2024 Compared to Year Ended December 31, 2023
Revenue
Revenue was $914,515,000 in 2024 compared to $837,547,000 in 2023, representing an increase of 9%. Revenue from the acquisition of Moritex that closed in the fourth quarter of 2023 represented approximately 8% of total revenue in 2024 and 1% of total revenue in 2023. Excluding the contribution of Moritex, revenue increased by 1% in 2024 over the prior year due to higher revenue from customers in the logistics and semiconductor industries, partially offset by lower revenue from customers in the automotive industry and softness across our broader factory automation business.
Changes in revenue from an end-market perspective, including Moritex, were as follows:
•Revenue from the logistics industry represented approximately 23% of total revenue in 2024 and increased by 20% from the prior year due to investment by e-commerce customers.
•Revenue from the automotive industry represented approximately 22% of total revenue in 2024 and decreased by 12% from the prior year due to continued weakness in this industry, including lower investment related to electric vehicles.
•Revenue from the consumer electronics industry represented approximately 17% of total revenue in 2024 and increased by 3% from the prior year due to the contribution of Moritex, as well as higher large customer demand.
•Revenue from the semiconductor industry represented approximately 11% of total revenue in 2024 and grew by 80% from the prior year due to the contribution of Moritex, as well as higher global demand for computing chips.
The following table sets forth our disaggregated revenue information by geographic area based on the customers' country of domicile (in thousands) for the years ended December 31, 2024 and 2023.
| | | | | | | | | | | | | | | | | | | | | | | | | | |
| | Twelve-months Ended |
| | December 31, 2024 | | December 31, 2023 | | $ Change | | % Change |
| | | | | | |
| Americas | | $ | 350,155 | | | $ | 330,415 | | | $ | 19,740 | | | 6 | % |
| Percentage of total revenue | | 38 | % | | 39 | % | | | | |
| Europe | | $ | 217,880 | | | $ | 220,665 | | | $ | (2,785) | | | (1) | % |
| Percentage of total revenue | | 24 | % | | 26 | % | | | | |
| Greater China | | $ | 164,147 | | | $ | 164,115 | | | $ | 32 | | | — | % |
| Percentage of total revenue | | 18 | % | | 20 | % | | | | |
| Other Asia | | $ | 182,333 | | | $ | 122,352 | | | $ | 59,981 | | | 49 | % |
| Percentage of total revenue | | 20 | % | | 15 | % | | | | |
| Total revenue | | $ | 914,515 | | | $ | 837,547 | | | $ | 76,968 | | | 9 | % |
Changes in revenue from a geographic perspective, including Moritex, were as follows:
•Revenue from customers based in the Americas increased by 6% from the prior year. Strong growth in logistics was partially offset by weakness in the automotive industry.
•Revenue from customers based in Europe decreased by 1% from the prior year. Growth in logistics was offset by declines in factory automation, most notably in the automotive industry.
•Revenue from customers based in Greater China was flat compared to the prior year. The Moritex contribution, higher semiconductor revenue, and higher large customer consumer electronics revenue was offset by declines in other factory automation industries, most notably in the automotive industry.
•Revenue from other countries in Asia increased by 49% from the prior year due to the Moritex contribution, higher semiconductor revenue, and growth in logistics.
Gross Profit
The following table sets forth our gross profit (in thousands) for the years ended December 31, 2024 and 2023.
| | | | | | | | | | | | | | | | | | | | | | | | | | |
| | Twelve-months Ended |
| | December 31, 2024 | | December 31, 2023 | | $ Change | | % Change |
| | | | | | |
| Gross profit | | $ | 625,794 | | | $ | 601,241 | | | $ | 24,553 | | | 4 | % |
| Percentage of total revenue | | 68 | % | | 72 | % | | | | |
| | | | | | | | |
Gross margin decreased to 68% in 2024 compared to 72% in 2023. The decrease was due to a less favorable revenue mix in 2024 that included higher logistics revenue and products with relatively lower gross margins from the Moritex acquisition that closed in the fourth quarter of 2023, as well as the amortization of Moritex acquired technologies. Lower average selling prices due to pricing pressures also contributed to the lower margin in 2024.
Operating Expenses
The following table sets forth our operating expenses (in thousands) for the years ended December 31, 2024 and 2023.
| | | | | | | | | | | | | | | | | | | | | | | | | | |
| | Twelve-months Ended |
| | December 31, 2024 | | December 31, 2023 | | $ Change | | % Change |
| | | | | | |
| Research, development, and engineering expenses | | $ | 139,815 | | | $ | 139,400 | | | $ | 415 | | | — | % |
| Percentage of total revenue | | 15 | % | | 17 | % | | | | |
| Selling, general, and administrative expenses | | $ | 370,914 | | | $ | 339,139 | | | $ | 31,775 | | | 9 | % |
| Percentage of total revenue | | 41 | % | | 40 | % | | | | |
| | | | | | | | |
| | | | | | | | |
| Loss (recovery) from fire | | $ | — | | | $ | (8,000) | | | $ | 8,000 | | | (100) | % |
| Percentage of total revenue | | — | % | | (1) | % | | | | |
| Total operating expenses | | $ | 510,729 | | | $ | 470,539 | | | $ | 40,190 | | | 9 | % |
| Percentage of total revenue | | 56 | % | | 56 | % | | | | |
| | | | | | | | |
Research, Development, and Engineering Expenses
Research, development, and engineering (RD&E) expenses in 2024 were relatively flat compared to the prior year. Higher incentive compensation expenses and the additional cost associated with a new team of optical engineers that joined Cognex with the acquisition of Moritex in the fourth quarter of 2023 was offset by a reduction in RD&E headcount outside of Moritex, lower deferred compensation costs related to the 2019 acquisition of Sualab Co, Ltd. that were fully paid in the fourth quarter of 2023, and disciplined cost management.
RD&E expenses as a percentage of revenue were 15% in 2024 compared to 17% in 2023. We believe that a continued commitment to RD&E activities is essential to maintain or achieve product leadership with our existing products and to provide innovative new product offerings, as well as to provide engineering support for large customers. In addition, we consider our ability to accelerate the time to market for new products to be critical to our revenue growth and competitive position. This annual percentage is impacted by revenue levels and investment cycles.
Selling, General, and Administrative Expenses
Selling, general, and administrative (SG&A) expenses in 2024 increased by 9% from the prior year. The increase was due primarily to investments in entry-level sales personnel hired over the past few years intended to transform our sales model, allowing us to broaden and deepen our sales coverage. Costs related to the acquisition of Moritex that closed in the fourth quarter of 2023 also contributed to the higher SG&A expenses in 2024, including additional sales and support personnel-related costs, the amortization of acquired customer relationship and trademarks, and integration costs. In addition, incentive compensation expenses were higher in 2024. These increases were partially offset by Moritex transaction costs incurred in the fourth quarter of 2023, a reduction in SG&A headcount outside of Moritex and entry-level sales, and disciplined cost management.
Loss (Recovery) from Fire
On June 7, 2022, the Company’s primary contract manufacturer experienced a fire at its plant in Indonesia, destroying a significant amount of Cognex inventories. In 2023, the Company recorded recoveries related to the fire totaling $8,000,000, including $5,500,000 for proceeds received from a financial settlement and $2,500,000, for proceeds received from business interruption insurance.
Non-operating Income (Expense)
The following table sets forth our non-operating income (expense) (in thousands) for the years ended December 31, 2024 and 2023.
| | | | | | | | | | | | | | | | | | | | | | | | | | |
| | Twelve-months Ended |
| | December 31, 2024 | | December 31, 2023 | | $ Change | | % Change |
| | | | | | |
| Foreign currency gain (loss) | | $ | 1,531 | | | $ | (10,039) | | | $ | 11,570 | | | (115) | % |
| Investment income | | $ | 13,971 | | | $ | 14,093 | | | $ | (122) | | | (1) | % |
| Other income (expense) | | $ | 922 | | | $ | 592 | | | $ | 330 | | | 56 | % |
| Total non-operating income (expense) | | $ | 16,424 | | | $ | 4,646 | | | $ | 11,778 | | | 254 | % |
In the third quarter of 2023, the Company recorded a foreign currency loss of $8,456,000 on the settlement of a foreign currency forward contract entered into to hedge the Japanese Yen purchase price of the acquisition of Moritex Corporation. Remaining foreign currency gains and losses in each year resulted primarily from the revaluation and settlement of assets and liabilities that are denominated in currencies other than the functional currency of the Company, which is the U.S. Dollar, or its subsidiaries.
Investment income decreased by $122,000, or 1%, from the prior year. The decrease was due to lower average investment balances, partially offset by higher yields on the Company's portfolio of debt securities. During the fourth quarter of 2023, net cash payments related to the acquisition of Moritex reduced cash available to invest by approximately $257 million, which resulted in lower investment income for 2024.
Income Tax Expense
The following table sets forth income tax information (in thousands) for the years ended December 31, 2024 and December 31, 2023.
| | | | | | | | | | | | | | | | | | | | | | | | | | |
| | Twelve-months Ended |
| | December 31, 2024 | | December 31, 2023 | | $ Change | | % Change |
| | | | | | |
| Income before income tax expense | | $ | 131,489 | | | $ | 135,348 | | | $ | (3,859) | | | (3) | % |
| Income tax expense | | $ | 25,318 | | | $ | 22,114 | | | $ | 3,204 | | | 14 | % |
| Effective income tax rate | | 19 | % | | 16 | % | | | | |
The Company’s effective tax rate was 19% in 2024 and 16% in 2023. The Company recorded discrete tax net expenses of $5,731,000 in 2024 and $2,338,000 in 2023. Excluding the impact of these discrete tax items, the Company’s effective tax rate was 15% in both years.
Year Ended December 31, 2023 Compared to Year Ended December 31, 2022
For a discussion of the Company’s fiscal 2023 results compared to fiscal 2022, refer to "Management's Discussion and Analysis of Financial Condition and Results of Operations" in the Company’s Annual Report on Form 10-K for the year ended December 31, 2023, filed with the Securities and Exchange Commission on February 15, 2024.
LIQUIDITY AND CAPITAL RESOURCES
The Company has historically been able to generate positive cash flow from operations, which has funded its operating activities and other cash requirements and resulted in an accumulated cash and investment balance of $586,948,000 as of December 31, 2024. The Company has established guidelines relative to credit ratings, diversification, and maturities of its investments to maintain liquidity and safety of its investment portfolio.
Operating Activities
Net cash provided by operating activities totaled $149,081,000 in 2024. Significant uses of cash consisted of an increase in accounts receivable related to growth in logistics revenue and in support of sales initiatives.
Investing Activities
Net cash used in investing activities totaled $38,969,000 in 2024. Investing activities included capital expenditures, that totaled $15,043,000 and consisted primarily of continued investments in business systems, manufacturing equipment related to new product introductions, and building and leasehold improvements.
Financing Activities
Net cash used in financing activities totaled $118,420,000 in 2024.
In March 2022, the Company's Board of Directors authorized the repurchase of $500,000,000 of the Company's common stock. Under this program, the Company repurchased 1,711,000 shares at a cost of $67,085,000 in 2024, leaving a remaining balance of $265,807,000 as of December 31, 2024. The Company may repurchase shares under this program in future periods depending on a variety of factors, including, among other things, the impact of dilution from employee stock awards, stock price, share availability, and cash requirements. The Company is authorized to make repurchases of its common stock through open market purchases, pursuant to Rule 10b5-1 trading plans, or in privately negotiated transactions.
The Company’s Board of Directors declared and paid cash dividends of $0.075 per share in the first, second, and third quarters of 2024 and $0.080 per share in the fourth quarter of 2024, totaling $52,329,000 in 2024. Future dividends will be declared at the discretion of the Company's Board of Directors and will depend on such factors as the Board deems relevant, including, among other things, the Company's ability to generate positive cash flow from operations.
Future Cash Requirements
As of December 31, 2024, the Company had inventory purchase commitments of $44,269,000, with the majority payable within twelve months, and lease payment obligations of $115,200,000, with $13,177,000 payable within twelve months. As of December 31, 2024, the Company had a remaining balance of $18,338,000 payable in the second quarter of 2025 related to a one-time transition tax on unrepatriated foreign earnings arising from the Tax Cuts and Jobs Act of 2017.
We believe that the Company's existing cash and investment balances, together with cash flow from operations, will be sufficient to meet its operating, investing, and financing activities for the next twelve months. In addition, the Company has no long-term debt. We believe that our strong cash position has put us in a relatively good position with respect to anticipated longer-term liquidity needs.
CRITICAL ACCOUNTING ESTIMATES
Our discussion and analysis of the Company’s financial condition and results of operations are based on the consolidated financial statements included in this Annual Report on Form 10-K, which have been prepared in accordance with accounting principles generally accepted in the United States. The preparation of these financial statements requires management to make estimates and judgments that affect the reported amounts of assets, liabilities, revenue, and expenses, and related disclosure of contingent assets and liabilities. We base our estimates on historical experience and various other assumptions believed to be reasonable under the circumstances, the results of which form the basis for making judgments about the carrying values of assets and liabilities that are not readily apparent from other sources. Changes in accounting estimates are reasonably likely to occur from period to period. Accordingly, actual results could differ from these estimates under different assumptions or circumstances resulting in charges that could be material in future reporting periods. We believe the following critical accounting policies require the use of significant estimates and judgments in the preparation of our consolidated financial statements.
Revenue Recognition
The Company recognizes revenue in a manner that depicts the transfer of promised goods or services to customers in an amount that reflects the consideration to which the Company expects to be entitled in exchange for those goods or services.
Management uses significant judgment when determining the amount of revenue to be recognized each period for application-specific customer solutions. Accounting for application-specific customer solutions requires management to monitor and evaluate customer contracts to determine the point in time at which the solution is validated. The Company’s application-specific customer solutions are comprised of a combination of products and services which are accounted for as one performance obligation to deliver a total solution to the customer.
Revenue for application-specific customer solutions is recognized at the point in time when the solution is validated, which is the point in time when the Company can reasonably determine that the agreed-upon specifications in the contract have been met and the customer should reasonably accept the performance obligations in the arrangement. Although the customer may have taken legal title and physical possession of the goods when they arrived at the customer’s designated site, the significant risks and rewards of ownership transfer to the customer only upon validation.
Income Taxes
Significant judgment is required in determining worldwide income tax expense based on tax laws in the various jurisdictions in which the Company operates. The Company has established reserves for income taxes by applying the “more likely than not” criteria, under which the recognition threshold is met when an entity concludes that a tax position, based solely on its technical merits, is more likely than not to be sustained upon examination by the relevant tax authority. All tax positions are analyzed periodically and adjustments are made as events occur that warrant modification, such as the completion of audits or the expiration of statutes of limitations, which may result in future charges or credits to income tax expense.
As part of the process of preparing consolidated financial statements, management is required to estimate income taxes in each of the jurisdictions in which the Company operates. These estimates occur in the calculation of income tax credits, benefits, and deductions, and in the calculation of certain tax assets and liabilities, which arise
from differences in the timing of the recognition of certain expenses for tax and financial statement purposes. We assess the likelihood of the realization of deferred tax assets and record a corresponding valuation allowance as necessary if we determine those deferred tax assets may not be realized due to the uncertainty of the timing and amount to be realized of certain federal, state, and international tax credit carryovers.
The Company accounts for the impact of the Global Intangible Low-Taxed Income (GILTI) minimum tax in deferred taxes.
NEW PRONOUNCEMENTS
Refer to Part II, Item 8 - Note 2 within this Form 10-K, for a full description of recently issued accounting pronouncements including the expected dates of adoption and expected impact on the financial position and results of operations of the Company.
ITEM 7A: QUANTITATIVE AND QUALITATIVE DISCLOSURES ABOUT MARKET RISK
The Company is exposed to certain risks relating to its ongoing business operations, including foreign currency exchange rate risk and interest rate risk. The Company currently mitigates certain foreign currency exchange rate risks with derivative instruments. The Company does not currently manage its interest rate risk with derivative instruments.
Foreign Currency Risk
The Company faces exposure to foreign currency exchange rate fluctuations, as a significant portion of its revenues, expenses, assets, and liabilities are denominated in currencies other than the functional currencies of the Company’s subsidiaries or the reporting currency of the Company, which is the U.S. Dollar. In certain instances, we utilize forward contracts to hedge against foreign currency fluctuations. These contracts are used to minimize foreign currency gains or losses, as the gains or losses on the derivative are intended to offset the losses or gains on the underlying exposure. We do not engage in foreign currency speculation.
The Company enters into economic hedges utilizing foreign currency forward contracts with maturities of up to three months to manage the exposure to fluctuations in foreign currency exchange rates arising primarily from foreign-denominated receivables and payables.
The Company had the following outstanding forward contracts as of December 31, 2024 and 2023 (in thousands):
| | | | | | | | | | | | | | | | | | | | | | | | | | | | | |
| December 31, 2024 | | December 31, 2023 |
| Currency | Notional Value | USD Equivalent | High Rate | Low Rate | | Notional Value | USD Equivalent | High Rate | Low Rate |
| | | | | | | | | |
| | | | | | |
| | | | | | | | | |
| | | | | | | | | |
| | | | | | | | | |
| | | | | | | | | |
| | | | | | | | | |
| | | | | | | | | |
| | | | | | | | | |
| | | | | | | | | |
| | | | | | | | | |
| | | | | | | | | |
| | | | | | | | | |
| Derivatives Not Designated as Hedging Instruments: | | |
| Singapore Dollar | 40,000 | | $ | 29,457 | | 1.36 | | 1.36 | | | 39,700 | | $ | 30,136 | | 1.32 | | 1.32 | |
| Euro | 25,000 | | 26,029 | | 0.9605 | | 0.9605 | | | 40,000 | | 44,302 | | 0.9029 | | 0.9029 | |
| Chinese Renminbi | 95,000 | | 12,990 | | 7.31 | 7.31 | | | 50,000 | | 7,025 | | 7.12 | 7.12 | |
| Mexican Peso | 220,000 | | 10,701 | | 20.56 | | 20.56 | | | 145,000 | | 8,505 | | 17.05 | | 17.05 | |
| Hungarian Forint | 2,360,000 | | 5,951 | | 396.59 | | 396.59 | | | 2,240,000 | | 6,466 | | 346.45 | | 346.45 | |
| British Pound | 3,200 | | 4,008 | | 0.7983 | | 0.7983 | | | 3,345 | | 4,258 | | 0.7855 | | 0.7855 | |
| Japanese Yen | 2,000,000 | | 3,750 | | 156.52 | | 156.52 | | | 600,000 | | 4,255 | | 141.02 | | 141.02 | |
| Swiss Franc | 2,200 | | 2,432 | | 0.9047 | 0.9047 | | — | | — | | — | | — | |
| | | | | | | | | |
| | | | | | | | | |
| Canadian Dollar | 2,000 | | 1,390 | | 1.44 | | 1.44 | | | 1,470 | | 1,112 | | 1.32 | | 1.32 | |
| | | | | | | | | |
| | | | | | | | | |
| | | | | | | | | |
A change in foreign currency exchange rates could materially impact the fair value of these contracts; however, if this occurred, the fair value of the underlying exposures hedged by the contracts would change by a similar amount. Accordingly, management does not believe that a material change in foreign currency exchange rates used in the fair value of our derivative instruments would materially impact operations or cash flows.
The success of our foreign currency risk management program depends on forecasts of transaction activity denominated in various currencies. To the extent that these forecasts are overstated or understated during periods of currency volatility, we could experience unanticipated foreign currency gains or losses that could have a material impact on our results of operations. Furthermore, our failure to identify new exposures and hedge them in an effective manner may result in material foreign currency gains or losses.
The Company’s functional currency/reporting currency exchange rate exposures result from revenues and expenses that are denominated in currencies other than the U.S. Dollar. In addition to the U.S. Dollar, a significant portion of our revenues and expenses are denominated in the Euro and Chinese Renminbi, and to a lesser extent the Japanese Yen, Korean Won, Indian Rupee, and Mexican Peso. We estimate that approximately 55% of our sales in 2024 were invoiced in currencies other than the U.S. Dollar, and we expect sales denominated in foreign currencies to continue to represent a significant portion of our total revenue. While we also have expenses denominated in these same foreign currencies, the impact on revenues has historically been, and is expected to continue to be, greater than the offsetting impact on expenses. Therefore, in times when the U.S. Dollar strengthens in relation to these foreign currencies, we would expect to report a net decrease in operating income. Conversely, in times when the U.S. Dollar weakens in relation to these foreign currencies, we would expect to report a net increase in operating income. Thus, changes in the relative strength of the U.S. Dollar may have a material impact on our operating results.
Interest Rate Risk
The Company’s investment portfolio of debt securities includes corporate bonds, treasury notes, asset-backed securities, and sovereign bonds. Debt securities with original maturities greater than three months are designated as available-for-sale and are reported at fair value. As of December 31, 2024, the fair value of the Company’s portfolio of debt securities amounted to $400,854,000, with amortized cost amounts totaling $405,758,000, maturities that do not exceed six years, and a yield to maturity of 3.8%. Differences between the fair value and principal amounts of the Company’s portfolio of debt securities are primarily attributable to discounts and premiums arising at the acquisition date, as well as unrealized gains and losses as of the balance sheet date. Management currently intends to hold these securities to full value recovery at maturity.
In July 2023, the Company’s investment policy was modified to reduce effective maturities of newly-purchased securities to up to five years. As of December 31, 2024, the Company held investments with maturities in excess of the five-year limit that were approved as pre-existing exceptions to the new policy. As of December 31, 2024, 63% of the investment portfolio had effective maturity dates of less than three years. Given the relatively short maturities and investment-grade quality of the Company’s portfolio of debt securities as of December 31, 2024, we do not expect a sharp rise in interest rates to have a material adverse effect on the fair value of these instruments. As a result, the Company does not currently hedge these interest rate exposures.
The following table presents the hypothetical change in the fair value of the Company’s portfolio of debt securities arising from selected potential changes in interest rates (in thousands). This modeling technique measures the change in fair value that would result from a parallel shift in the yield curve plus or minus 50 and 100 basis points (BP) over a twelve-month time horizon.
| | | | | | | | | | | | | | | | | | | | | | | | | | | | | | | | |
| Type of security | | Valuation of securities given
an interest rate decrease | | No change in
interest rates | | Valuation of securities given
an interest rate increase |
| | (100 BP) | | (50 BP) | | | | 50 BP | | 100 BP |
| Corporate bonds | | $ | 348,034 | | | $ | 344,475 | | | $ | 340,916 | | | $ | 337,357 | | | $ | 333,798 | |
| Treasury notes | | 46,586 | | | 46,109 | | | 45,634 | | | 45,157 | | | 44,680 | |
| Asset-backed securities | | 13,592 | | | 13,453 | | | 13,314 | | | 13,175 | | | 13,036 | |
| | | | | | | | | | |
| | | | | | | | | | |
| Sovereign bonds | | 1,011 | | | 1,000 | | | 990 | | | 980 | | | 969 | |
| | | | | | | | | | |
| | | | | | | | | | |
| | $ | 409,223 | | | $ | 405,037 | | | $ | 400,854 | | | $ | 396,669 | | | $ | 392,483 | |
ITEM 8: FINANCIAL STATEMENTS AND SUPPLEMENTARY DATA
INDEX TO FINANCIAL STATEMENTS AND SUPPLEMENTARY DATA
| | | | | |
| Consolidated Financial Statements: | |
| |
| |
| |
| |
| |
| |
| |
| |
| Financial Statement Schedule: | |
| |
REPORT OF INDEPENDENT REGISTERED PUBLIC ACCOUNTING FIRM
Board of Directors and Shareholders
Cognex Corporation
Opinion on the financial statements
We have audited the accompanying consolidated balance sheets of Cognex Corporation (a Massachusetts corporation) and subsidiaries (the “Company”) as of December 31, 2024 and 2023, the related consolidated statements of operations, comprehensive income, shareholders’ equity, and cash flows for each of the three years in the period ended December 31, 2024, and the related notes and financial statement schedule included under Item 15(a) (collectively referred to as the “financial statements”). In our opinion, the financial statements present fairly, in all material respects, the financial position of the Company as of December 31, 2024 and 2023, and the results of its operations and its cash flows for each of the three years in the period ended December 31, 2024, in conformity with accounting principles generally accepted in the United States of America.
We also have audited, in accordance with the standards of the Public Company Accounting Oversight Board (United States) (“PCAOB”), the Company’s internal control over financial reporting as of December 31, 2024, based on criteria established in the 2013 Internal Control—Integrated Framework issued by the Committee of Sponsoring Organizations of the Treadway Commission (“COSO”), and our report dated February 13, 2025 expressed an unqualified opinion.
Change in accounting principle
As discussed in Note 20 to the consolidated financial statements, the Company has adopted new accounting guidance in 2024 related to the disclosure of segment information in accordance with ASU 2023-07, Segment Reporting (Topic 280). The adoption was retrospectively applied to 2023 and 2022.
Basis for opinion
These financial statements are the responsibility of the Company’s management. Our responsibility is to express an opinion on the Company’s financial statements based on our audits. We are a public accounting firm registered with the PCAOB and are required to be independent with respect to the Company in accordance with the U.S. federal securities laws and the applicable rules and regulations of the Securities and Exchange Commission and the PCAOB.
We conducted our audits in accordance with the standards of the PCAOB. Those standards require that we plan and perform the audit to obtain reasonable assurance about whether the financial statements are free of material misstatement, whether due to error or fraud. Our audits included performing procedures to assess the risks of material misstatement of the financial statements, whether due to error or fraud, and performing procedures that respond to those risks. Such procedures included examining, on a test basis, evidence regarding the amounts and disclosures in the financial statements. Our audits also included evaluating the accounting principles used and significant estimates made by management, as well as evaluating the overall presentation of the financial statements. We believe that our audits provide a reasonable basis for our opinion.
Critical audit matter
The critical audit matter communicated below is a matter arising from the current period audit of the financial statements that was communicated or required to be communicated to the audit committee and that: (1) relates to accounts or disclosures that are material to the financial statements and (2) involved our especially challenging, subjective, or complex judgments. The communication of critical audit matters does not alter in any way our opinion on the financial statements, taken as a whole, and we are not, by communicating the critical audit matter below, providing a separate opinion on the critical audit matter or on the accounts or disclosures to which it relates.
Revenue Recognition – Application-Specific Customer Solutions
As described further in Notes 1 and 14 to the consolidated financial statements, the Company recognizes revenue from application-specific customer solutions. For these transactions, revenue is recognized at the point in time when the solution is validated, which is when the Company can reasonably determine that the agreed-upon specifications in the contract have been met and the customer will accept the performance obligation in the contract. We identified revenue recognition related to application-specific customer solutions as a critical audit matter.
The principal considerations for our determination that revenue recognition related to application-specific customer solutions is a critical audit matter are that evaluating the performance obligations and determining the timing of
validation and that the agreed-upon specifications in the contract have been met rely on the use of management judgements and require a higher degree of auditor judgment in designing, executing and evaluating the results of audit procedures. Accounting for application-specific customer solutions requires the Company to monitor and evaluate customer contracts on an ongoing basis to determine the point in time at which the solution is validated, the agreed-upon specifications in the contract have been met and revenue is recognized.
Our audit procedures related to the revenue recognition of application-specific customer solutions included the following, among others.
•We tested the design and operating effectiveness of internal controls related to the monitoring of application-specific customer solution contracts, determination of validation and the timing of revenue recognition.
•We evaluated management’s significant accounting policies related to these customer contracts, including the determination of the performance obligation, for appropriate revenue recognition based on the key terms and provisions.
•For a sample of contracts, we inspected source documents, including the customer contract or purchase order, third-party shipping information, invoice, and evidence of validation or acceptance to evaluate the identification of performance obligations and timing of revenue recognition.
/s/ GRANT THORNTON LLP
We have served as the Company’s auditor since 2007.
Boston, Massachusetts
February 13, 2025
COGNEX CORPORATION – CONSOLIDATED STATEMENTS OF OPERATIONS
| | | | | | | | | | | | | | | | | |
| | Year Ended December 31, |
| 2024 | | 2023 | | 2022 |
| | (In thousands, except per share amounts) |
| | | | | |
| Revenue | $ | 914,515 | | | $ | 837,547 | | | $ | 1,006,090 | |
| Cost of revenue | 288,721 | | | 236,306 | | | 284,185 | |
| Gross profit | 625,794 | | | 601,241 | | | 721,905 | |
| Research, development, and engineering expenses | 139,815 | | | 139,400 | | | 141,133 | |
| Selling, general, and administrative expenses | 370,914 | | | 339,139 | | | 312,107 | |
| Loss (recovery) from fire (Note 22) | — | | | (8,000) | | | 20,779 | |
| Restructuring charges | — | | | — | | | 1,657 | |
| | | | | |
| Operating income | 115,065 | | | 130,702 | | | 246,229 | |
| Foreign currency gain (loss) | 1,531 | | | (10,039) | | | (1,837) | |
| Investment income | 13,971 | | | 14,093 | | | 6,715 | |
| Other income (expense) | 922 | | | 592 | | | (412) | |
| Income before income tax expense | 131,489 | | | 135,348 | | | 250,695 | |
| Income tax expense | 25,318 | | | 22,114 | | | 35,170 | |
| | | | | |
| | | | | |
| Net income | $ | 106,171 | | | $ | 113,234 | | | $ | 215,525 | |
| | | | | |
| Net Income per weighted-average common and common-equivalent share: | | | | | |
| | | | | |
| | | | | |
| Basic | $ | 0.62 | | | $ | 0.66 | | | $ | 1.24 | |
| | | | | |
| | | | | |
| Diluted | $ | 0.62 | | | $ | 0.65 | | | $ | 1.23 | |
| | | | | |
| Weighted-average common and common-equivalent shares outstanding: | | | | | |
| Basic | 171,438 | | | 172,249 | | | 173,407 | |
| Diluted | 172,611 | | | 173,399 | | | 174,869 | |
| | | | | |
| Cash dividends per common share | $ | 0.305 | | | $ | 0.286 | | | $ | 0.265 | |
| | | | | |
|
The accompanying notes are an integral part of these consolidated financial statements.
COGNEX CORPORATION – CONSOLIDATED STATEMENTS OF COMPREHENSIVE INCOME
| | | | | | | | | | | | | | | | | |
| | Year Ended December 31, |
| 2024 | | 2023 | | 2022 |
| | (In thousands) |
| Net income | $ | 106,171 | | | $ | 113,234 | | | $ | 215,525 | |
| Other comprehensive income (loss), net of tax: | | | | | |
| | | | | |
| | | | | |
| | | | | |
| | | | | |
| | | | | |
| Available-for-sale investments: | | | | | |
| Net unrealized gain (loss), net of tax of $1,245, $4,389, and $(5,943) in 2024, 2023, and 2022, respectively | 3,809 | | | 10,507 | | | (17,152) | |
| | | | | |
| Reclassification of net realized (gain) loss into current operations | 8 | | | 1,954 | | | 182 | |
| Net change related to available-for-sale investments | 3,817 | | | 12,461 | | | (16,970) | |
| | | | | |
| Foreign currency translation adjustments: | | | | | |
| Foreign currency translation gain (loss) | (31,258) | | | 11,500 | | | (4,385) | |
| Net change related to foreign currency translation adjustments | (31,258) | | | 11,500 | | | (4,385) | |
| | | | | |
| Other comprehensive income (loss), net of tax | (27,441) | | | 23,961 | | | (21,355) | |
| Total comprehensive income | $ | 78,730 | | | $ | 137,195 | | | $ | 194,170 | |
The accompanying notes are an integral part of these consolidated financial statements.
COGNEX CORPORATION – CONSOLIDATED BALANCE SHEETS
| | | | | | | | | | | |
| | December 31, |
| 2024 | | 2023 |
| | (In thousands) |
| ASSETS | | | |
| Current assets: | | | |
| Cash and cash equivalents | $ | 186,094 | | | $ | 202,655 | |
| Current investments, amortized cost of $60,725 and $132,799 in 2024 and 2023, respectively, allowance for credit losses of $0 in 2024 and 2023 | 59,956 | | | 129,392 | |
| Accounts receivable, allowance for credit losses of $827 and $583 in 2024 and 2023, respectively | 143,359 | | | 114,164 | |
| Unbilled revenue | 3,055 | | | 2,402 | |
| Inventories | 157,527 | | | 162,285 | |
| Prepaid expenses and other current assets | 63,376 | | | 68,099 | |
| Total current assets | 613,367 | | | 678,997 | |
| Non-current investments, amortized cost of $345,033 and $250,790 in 2024 and 2023, respectively, allowance for credit losses of $0 in 2024 and 2023 | 340,898 | | | 244,230 | |
| Property, plant, and equipment, net | 98,445 | | | 105,849 | |
| Operating lease assets | 67,326 | | | 75,115 | |
| Goodwill | 384,937 | | | 393,181 | |
| Intangible assets, net | 90,684 | | | 112,952 | |
| Deferred income taxes | 392,166 | | | 400,400 | |
| Other assets | 5,027 | | | 7,088 | |
| Total assets | $ | 1,992,850 | | | $ | 2,017,812 | |
| | | |
| LIABILITIES AND SHAREHOLDERS’ EQUITY | | | |
| Current liabilities: | | | |
| Accounts payable | $ | 38,046 | | | $ | 21,454 | |
| Accrued expenses | 71,760 | | | 72,374 | |
| Accrued income taxes | 25,685 | | | 16,907 | |
| Deferred revenue and customer deposits | 25,035 | | | 31,525 | |
| Operating lease liabilities | 8,854 | | | 9,624 | |
| Total current liabilities | 169,380 | | | 151,884 | |
| Non-current operating lease liabilities | 61,363 | | | 68,977 | |
| Deferred income taxes | 217,155 | | | 246,877 | |
| Reserve for income taxes | 26,365 | | | 26,685 | |
| Non-current accrued income taxes | — | | | 18,338 | |
| Other liabilities | 1,082 | | | 299 | |
| Total liabilities | 475,345 | | | 513,060 | |
| | | |
| Commitments and contingencies (Note 11) | | | |
| Shareholders’ equity: | | | |
| Preferred stock, $0.01 par value - Authorized: 400 shares in 2024 and 2023, respectively, no shares issued and outstanding | — | | | — | |
| Common stock, $0.002 par value – Authorized: 300,000 shares in 2024 and 2023, respectively, issued and outstanding: 170,434 and 171,599 shares in 2024 and 2023, respectively | 341 | | | 343 | |
| Additional paid-in capital | 1,090,638 | | | 1,037,202 | |
| Retained earnings | 499,303 | | | 512,543 | |
| Accumulated other comprehensive loss, net of tax | (72,777) | | | (45,336) | |
| Total shareholders’ equity | 1,517,505 | | | 1,504,752 | |
| Total liabilities and shareholders' equity | $ | 1,992,850 | | | $ | 2,017,812 | |
The accompanying notes are an integral part of these consolidated financial statements.
COGNEX CORPORATION – CONSOLIDATED STATEMENTS OF CASH FLOWS
| | | | | | | | | | | | | | | | | |
| | Year Ended December 31, |
| 2024 | | 2023 | | 2022 |
| | (In thousands) |
| Cash flows from operating activities: | | | | | |
| Net income | $ | 106,171 | | | $ | 113,234 | | | $ | 215,525 | |
| Adjustments to reconcile net income to net cash provided by operating activities: | | | | | |
| | | | | |
| Stock-based compensation expense | 52,443 | | | 54,768 | | | 54,505 | |
| Depreciation of property, plant, and equipment | 21,271 | | | 17,270 | | | 16,347 | |
| Loss (gain) on disposal of property, plant, and equipment | 88 | | | 229 | | | 19 | |
| Amortization of intangible assets | 11,418 | | | 4,610 | | | 3,274 | |
| | | | | |
| Non-cash impact of charges related to fire (Note 22) | — | | | — | | | 46,372 | |
| Excess and obsolete inventory charges | 2,505 | | | 3,775 | | | 3,084 | |
| Fair value adjustment on acquired inventories (Note 21) | 1,224 | | | 2,829 | | | — | |
| | | | | |
| Amortization of discounts or premiums on investments | 306 | | | 1,745 | | | 4,968 | |
| Realized (gain) loss on sale of investments | 8 | | | 1,954 | | | 182 | |
| | | | | |
| Change in deferred income taxes | (21,507) | | | (19,779) | | | (27,338) | |
| Changes in operating assets and liabilities: | | | | | |
| Accounts receivable | (32,128) | | | 23,346 | | | 3,454 | |
| Unbilled revenue | (693) | | | (255) | | | 1,806 | |
| Inventories | (1,253) | | | (22,591) | | | (48,934) | |
| Prepaid expenses and other current assets | 1,514 | | | 2,469 | | | (6,998) | |
| Accounts payable | 18,352 | | | (13,744) | | | (17,277) | |
| Accrued expenses | 2,916 | | | (35,309) | | | 2,056 | |
| Accrued income taxes | (9,278) | | | (16,745) | | | (444) | |
| Deferred revenue and customer deposits | (6,216) | | | (9,122) | | | 4,886 | |
| Other | 1,940 | | | 4,232 | | | (12,081) | |
| Net cash provided by operating activities | 149,081 | | | 112,916 | | | 243,406 | |
| Cash flows from investing activities: | | | | | |
| Purchases of investments | (850,852) | | | (184,056) | | | (233,720) | |
| Maturities and sales of investments | 828,370 | | | 496,462 | | | 253,983 | |
| Purchases of property, plant, and equipment | (15,043) | | | (23,077) | | | (19,667) | |
| Net payments related to business acquisitions (Note 21) | (1,444) | | | (257,056) | | | (5,050) | |
| | | | | |
| | | | | |
| Net cash provided by (used in) investing activities | (38,969) | | | 32,273 | | | (4,454) | |
| Cash flows from financing activities: | | | | | |
| Net payments from issuance of common stock under stock plans | 994 | | | 3,268 | | | 9,861 | |
| Repurchase of common stock | (67,085) | | | (79,794) | | | (204,314) | |
| Payment of dividends | (52,329) | | | (49,079) | | | (45,921) | |
| | | | | |
| Net cash used in financing activities | (118,420) | | | (125,605) | | | (240,374) | |
| Effect of foreign exchange rate changes on cash and cash equivalents | (8,253) | | | 1,697 | | | (3,365) | |
| Net change in cash and cash equivalents | (16,561) | | | 21,281 | | | (4,787) | |
| Cash and cash equivalents at beginning of year | 202,655 | | | 181,374 | | | 186,161 | |
| Cash and cash equivalents at end of year | $ | 186,094 | | | $ | 202,655 | | | $ | 181,374 | |
| | | | | |
| | | | | |
| | | | | |
| | | | | |
The accompanying notes are an integral part of these consolidated financial statements.
COGNEX CORPORATION – CONSOLIDATED STATEMENTS OF SHAREHOLDERS’ EQUITY
| | | | | | | | | | | | | | | | | | | | | | | | | | | | | | | | | | | | | | |
| | | Common Stock | | Additional
Paid-in
Capital | | Retained
Earnings | | Accumulated
Other
Comprehensive
Loss | | Total
Shareholders’
Equity |
| (In thousands) | | Shares | | Par Value | |
| Balance as of December 31, 2021 | | 175,481 | | | $ | 351 | | | $ | 914,802 | | | $ | 562,882 | | | $ | (47,942) | | | $ | 1,430,093 | |
| Net issuance of common stock under stock plans | | 514 | | | 1 | | | 9,860 | | | — | | | — | | | 9,861 | |
| Repurchase of common stock | | (3,364) | | | (7) | | | — | | | (204,307) | | | — | | | (204,314) | |
| Stock-based compensation expense | | — | | | — | | | 54,505 | | | — | | | — | | | 54,505 | |
| Payment of dividends ($0.265 per common share) | | — | | | — | | | — | | | (45,921) | | | — | | | (45,921) | |
| Net income | | — | | | — | | | — | | | 215,525 | | | — | | | 215,525 | |
| | | | | | | | | | | | |
| | | | | | | | | | | | |
| Net unrealized gain (loss) on available-for-sale investments, net of tax of ($5,943) | | — | | | — | | | — | | | — | | | (17,152) | | | (17,152) | |
| Reclassification of net realized (gain) loss on the sale of available-for-sale investments | | — | | | — | | | — | | | — | | | 182 | | | 182 | |
| Foreign currency translation adjustment | | — | | | — | | | — | | | — | | | (4,385) | | | (4,385) | |
| Balance as of December 31, 2022 | | 172,631 | | | $ | 345 | | | $ | 979,167 | | | $ | 528,179 | | | $ | (69,297) | | | $ | 1,438,394 | |
| Net issuance of common stock under stock plans | | 691 | | | 1 | | | 3,267 | | | — | | | — | | | 3,268 | |
| Repurchase of common stock | | (1,723) | | | (3) | | | — | | | (79,791) | | | — | | | (79,794) | |
| Stock-based compensation expense | | — | | | — | | | 54,768 | | | — | | | — | | | 54,768 | |
| Payment of dividends ($0.286 per common share) | | — | | | — | | | — | | | (49,079) | | | — | | | (49,079) | |
| Net income | | — | | | — | | | — | | | 113,234 | | | — | | | 113,234 | |
| | | | | | | | | | | | |
| | | | | | | | | | | | |
| Net unrealized gain (loss) on available-for-sale investments, net of tax of $4,389 | | — | | | — | | | — | | | — | | | 10,507 | | | 10,507 | |
| Reclassification of net realized (gain) loss on the sale of available-for-sale investments | | — | | | — | | | — | | | — | | | 1,954 | | | 1,954 | |
| Foreign currency translation adjustment | | — | | | — | | | — | | | — | | | 11,500 | | | 11,500 | |
| Balance as of December 31, 2023 | | 171,599 | | | $ | 343 | | | $ | 1,037,202 | | | $ | 512,543 | | | $ | (45,336) | | | $ | 1,504,752 | |
| Net issuance of common stock under stock plans | | 546 | | | 1 | | | 993 | | | — | | | — | | | 994 | |
| Repurchase of common stock | | (1,711) | | | (3) | | | — | | | (67,082) | | | — | | | (67,085) | |
| Stock-based compensation expense | | — | | | — | | | 52,443 | | | — | | | — | | | 52,443 | |
| Payment of dividends ($0.305 per common share) | | — | | | — | | | — | | | (52,329) | | | — | | | (52,329) | |
| Net income | | — | | | — | | | — | | | 106,171 | | | — | | | 106,171 | |
| | | | | | | | | | | | |
| | | | | | | | | | | | |
| Net unrealized gain (loss) on available-for-sale investments, net of tax of $1,245 | | — | | | — | | | — | | | — | | | 3,809 | | | 3,809 | |
| | | | | | | | | | | | |
| Reclassification of net realized (gain) loss on the sale of available-for-sale investments | | — | | | — | | | — | | | — | | | 8 | | | 8 | |
| Foreign currency translation adjustment | | — | | | — | | | — | | | — | | | (31,258) | | | (31,258) | |
| Balance as of December 31, 2024 | | 170,434 | | | $ | 341 | | | $ | 1,090,638 | | | $ | 499,303 | | | $ | (72,777) | | | $ | 1,517,505 | |
| | | | | | | | | | | | |
|
The accompanying notes are an integral part of these consolidated financial statements.
COGNEX CORPORATION - NOTES TO CONSOLIDATED FINANCIAL STATEMENTS
NOTE 1: Summary of Significant Accounting Policies
The accompanying consolidated financial statements reflect the application of the significant accounting policies described below.
Nature of Operations
Cognex Corporation ("the Company" or "Cognex") is a leading global provider of machine vision products and solutions that improve efficiency and quality and address some of the most critical manufacturing and distribution challenges.
Use of Estimates in the Preparation of Financial Statements
The preparation of financial statements in conformity with accounting principles generally accepted in the United States of America (U.S. GAAP) requires management to make estimates and judgments that affect the reported amounts of assets and liabilities and the disclosure of contingent liabilities as of the balance sheet date, and the reported amounts of revenues and expenses during the year. Actual results could differ from those estimates. Significant estimates and judgments include those related to revenue recognition and income taxes.
Basis of Consolidation
The consolidated financial statements include the accounts of Cognex Corporation and its subsidiaries, all of which are wholly owned. All intercompany accounts and transactions have been eliminated.
Foreign Currency Translation
The financial statements of the Company’s foreign subsidiaries, where the local currency is the functional currency, are translated using exchange rates in effect at the end of the year for assets and liabilities and average exchange rates during the year for results of operations. The resulting foreign currency translation adjustment, net of tax, is included in shareholders’ equity as accumulated other comprehensive loss.
Fair Value Measurements
The Company applies a three-level valuation hierarchy for fair value measurements. The categorization of assets and liabilities within the valuation hierarchy is based on the lowest level of input that is significant to the measurement of fair value. Level 1 inputs to the valuation methodology utilize unadjusted quoted market prices in active markets for identical assets and liabilities. Level 2 inputs to the valuation methodology are other observable inputs, including quoted market prices for similar assets and liabilities, quoted prices for identical and similar assets and liabilities in markets that are not active, or other inputs that are observable or can be corroborated by observable market data. Level 3 inputs to the valuation methodology are unobservable inputs based on management’s best estimate of the inputs that market participants would use in pricing the asset or liability at the measurement date, including assumptions about risk. A change to the level of an asset or liability within the fair value hierarchy is determined at the end of a reporting period.
Cash, Cash Equivalents, and Investments
Money market instruments, as well as debt securities with original maturities of three months or less, are classified as cash equivalents and are stated at amortized cost. Debt securities with original maturities greater than three months and remaining maturities of one year or less are classified as current investments. Debt securities with remaining maturities greater than one year are classified as non-current investments. In July 2023, the Company’s investment policy was modified to reduce effective maturities of newly purchased securities to up to five years. As of December 31, 2024, the Company held investments with maturities in excess of the five-year limit that were approved as pre-existing exceptions to the new policy.
Debt securities with original maturities greater than three months are designated as available-for-sale and are reported at fair value, with unrealized gains and losses, net of tax, included in shareholders’ equity as accumulated other comprehensive loss. Realized gains and losses are calculated using the specific identification method. Realized gains and losses, interest income, and the amortization of the discount or premium on debt securities arising at acquisition, are included in "Investment income" on the Consolidated Statements of Operations.
Management monitors its debt securities to determine whether a loss exists related to the credit quality of the issuer. If the present value of the cash flows expected to be collected from the security is less than the amortized cost basis of the security, then a credit loss exists and an allowance against the security for credit losses is recorded. The allowance is limited to the amount by which fair value is below amortized cost, recognizing that the investment could
COGNEX CORPORATION - NOTES TO CONSOLIDATED FINANCIAL STATEMENTS
be sold at fair value. Credit losses continue to be remeasured in subsequent reporting periods. Credit losses and recoveries related to debt securities are included in “Other income (expense)” on the Consolidated Statements of Operations. When developing an estimate of expected credit losses, management considers all relevant information including historical experience, current conditions, and reasonable forecasts of expected future cash flows.
Accounts Receivable
The Company extends credit with various payment terms to customers based on an evaluation of their financial condition. Accounts that are outstanding longer than the payment terms are considered to be past due. The Company establishes an allowance against accounts receivable for credit losses when it determines receivables are at risk for collection based on the length of time the receivable has been outstanding, the customer’s current ability to pay its obligations to the Company, and general economic and industry conditions, as well as various other factors. Receivables are written off against this allowance in the period they are determined to be uncollectible and payments subsequently received on previously written-off receivables are recorded as a recovery of the credit loss. Credit losses and recoveries related to accounts receivable are included in "Selling, general, and administrative expenses" on the Consolidated Statements of Operations.
Inventories
Inventories are stated at the lower of cost and net realizable value. Cost is determined using standard costs, which approximates actual costs under the first-in, first-out (FIFO) method. Net realizable value is the estimated selling price in the ordinary course of business, less reasonably predictable costs of completion, disposal, and transportation.
Purchase price variances are incurred when actual costs are different than standard costs due to favorable or unfavorable market prices. Management applies judgment to recognize purchase price variances in the same period that the associated standard costs of the finished goods that consume these components are sold.
The Company’s inventory is subject to technological change or obsolescence. The Company reviews inventory quantities on hand and estimates excess and obsolescence exposures based on assumptions about future demand, product transitions, general economic and industry conditions, and other circumstances, and records reserves to reduce the carrying value of inventories to their net realizable value. If actual future demand is less than estimated, additional inventory write-downs would be required.
The Company generally disposes of obsolete inventory upon determination of obsolescence. The Company does not dispose of excess inventory immediately, due to the possibility that some of this inventory could be sold to customers as a result of differences between actual and forecasted demand. When inventory has been written down below cost, such reduced amount is considered the new cost basis for subsequent accounting purposes. As a result, the Company could recognize a higher-than-normal gross margin if the reserved inventory were subsequently sold.
In accordance with the accounting principles applied in business combinations, acquired inventories are recorded at fair value on the acquisition date. This valuation policy typically results in the write-up of inventories above the acquired company’s pre-acquisition carrying value, which results in a lower-than-normal gross margin when these acquired inventories are sold.
Property, Plant, and Equipment
Property, plant, and equipment are stated at cost and depreciated using the straight-line method over the assets’ estimated useful lives. Buildings’ original useful lives are 39 years, building improvements’ useful lives range from five to ten years, and the useful lives of computer hardware and software, manufacturing test equipment, and furniture and fixtures range from two to ten years. Land that is leased or granted, as well as leasehold improvements, are depreciated over the shorter of the estimated useful lives or the remaining terms of the leases. Maintenance and repairs are expensed when incurred; additions and improvements are capitalized. Upon retirement or disposition, the cost and related accumulated depreciation of the disposed assets are removed from the accounts, with any resulting gain or loss included in current operations.
In accordance with the accounting principles applied in business combinations, acquired property, plant, and equipment are recorded at fair value on the acquisition date. This valuation policy typically results in the write-up of property, plant, and equipment above the acquired company’s pre-acquisition carrying value, which results in a higher depreciation expense over the estimated lives of the assets.
COGNEX CORPORATION - NOTES TO CONSOLIDATED FINANCIAL STATEMENTS
Internal-use Software
Internal-use software is software acquired, internally developed, or modified solely to meet the Company's internal needs, and during the software's development no substantive plan exists to sell the software. The accounting treatment for computer software developed for internal use depends on the nature of activities performed at each stage of development. The preliminary project stage includes conceptual formulation of design alternatives, determination of system requirements, vendor demonstrations, and final selection of vendors, and during this stage costs are expensed as incurred. The application development stage includes software configuration, coding, hardware installation, and testing. During this stage, certain costs are capitalized, including external direct costs of materials and services, as well as payroll and payroll-related costs for employees who are directly associated with the project, while certain costs are expensed as incurred, including training and data conversion costs. The post-implementation stage includes support and maintenance, and during this stage costs are expensed as incurred.
Capitalization begins when both the preliminary project stage is completed and management commits to funding the project. Capitalization ceases at the point the project is substantially complete and ready for its intended use, that is, after all substantial testing is completed. Costs of specified upgrades and enhancements to internal-use software are capitalized if it is probable that those expenditures result in additional functionality. Capitalized costs are amortized on a straight-line basis over the estimated useful life.
Leases
At inception of a contract, the Company determines whether that contract is or contains a lease by assessing whether there is an identified asset and whether the contract conveys the right to control the use of the identified asset for a period of time in exchange for consideration. The Company has control of the asset if it has the right to direct the use of the asset and obtains substantially all of the economic benefits from the use of the asset throughout the period of use.
As a practical expedient, the Company does not recognize a lease asset or lease liability for leases with a lease term of twelve months or less. In the determination of the lease term, the Company considers the existence of extension or termination options and the probability of those options being exercised.
Lease contracts may include fixed lease components and non-lease components, such as common area maintenance and utilities for property leases. As a practical expedient, the Company accounts for the non-lease components together with the lease components as a single lease component for all of its leases.
The Company classifies a lease as a finance lease when it meets any of the following criteria at the lease commencement date: (1) the lease transfers ownership of the underlying asset to the Company by the end of the lease term; (2) the lease grants the Company an option to purchase the underlying asset that the Company is reasonably certain to exercise; (3) the lease term is for the major part of the remaining economic life of the underlying asset (the Company considers a major part to be 75% or more of the remaining economic life of the underlying asset); (4) the present value of the sum of the lease payments and any residual value guaranteed by the Company equals or exceeds substantially all of the fair value of the underlying asset (the Company considers substantially all the fair value to be 90% or more of the fair value of the underlying asset amount); or (5) the underlying asset is of such a specialized nature that it is expected to have no alternative use to the lessor at the end of the lease term. When none of the criteria above are met, the Company classifies the lease as an operating lease.
On the lease commencement date, the Company records a lease asset and lease liability on the balance sheet. The lease asset consists of: (1) the amount of the initial lease liability; (2) any lease payments made to the lessor at or before the lease commencement date, minus any lease incentives received; and (3) any initial direct cost incurred by the Company. Initial direct costs are incremental costs of a lease that would not have been incurred if the lease had not been obtained and are capitalized as part of the lease asset. The lease liability equals the present value of the future cash payments discounted using the Company's incremental borrowing rate. The Company’s incremental borrowing rate is the rate of interest that the Company would have to pay to borrow an amount equal to the lease payments over a similar term which was estimated using the Secured Overnight Financing Rate (SOFR) plus a 2% credit risk spread.
Operating lease expense equals the total cash payments recognized on a straight-line basis over the lease term. The amortization of the lease asset is calculated as the straight-line lease expense less the accretion of the interest on the lease liability each period. The lease liability is reduced by the cash payment less the interest each period.
Goodwill
Goodwill is stated at cost. The Company evaluates the potential impairment of goodwill annually each fourth quarter
COGNEX CORPORATION - NOTES TO CONSOLIDATED FINANCIAL STATEMENTS
and whenever events or circumstances indicate the carrying value of the goodwill may not be recoverable. The Company performs a qualitative assessment of goodwill to determine whether further impairment testing is necessary. Factors that management considers in this assessment include general economic and industry conditions, overall financial performance (both current and projected), changes in strategy, changes in the composition or carrying amount of net assets, and market capitalization. If this qualitative assessment indicates that it is more likely than not that the fair value of a reporting unit is less than its carrying value, the Company proceeds to perform a quantitative impairment test. Under this quantitative analysis, the fair value of the reporting unit is compared with its carrying value, including goodwill. If the carrying value exceeds the fair value of the reporting unit, the Company recognizes an impairment charge. The Company estimates the fair value of its reporting unit using the income approach based on a discounted cash flow model. In addition, the Company uses the market approach, which compares the reporting unit to publicly traded companies and transactions involving similar businesses, to support the conclusions based on the income approach.
Intangible Assets
Intangible assets are stated at cost and amortized over the assets’ estimated useful lives. Intangible assets are either amortized in relation to the relative cash flows anticipated from the intangible asset or using the straight-line method, depending on facts and circumstances. The useful lives of customer relationships range from five to fifteen years, completed technologies from five to nine years, non-compete agreements from six to seven years, and trademarks for three years. In-process technology is an indefinite-lived intangible asset until the technology is completed, at which point it is amortized over its estimated useful life.
The Company evaluates the potential impairment of intangible assets whenever events or circumstances indicate the carrying value of the assets may not be recoverable. For finite-lived intangible assets that are subject to amortization, the Company follows a two-step process for impairment testing. In step one, known as the recoverability test, the carrying value of the asset is compared to the sum of the undiscounted cash flows expected to result from the use and eventual disposition of the asset. If the sum of the undiscounted future cash flows is less than the carrying value, the asset is not recoverable and step two is performed. In step two, the impairment charge is measured as the amount by which the carrying value of the asset exceeds its fair value.
Warranty Obligations
The Company warrants its products to be free from defects in material and workmanship for periods primarily ranging from one to three years from the time of sale based on the product being purchased and the terms of the customer arrangement. Warranty obligations are evaluated and recorded at the time of sale since it is probable that customers will make claims under warranties related to products that have been sold and the amount of these claims can be reasonably estimated based on historical costs to fulfill claims. Obligations may also be recorded subsequent to the time of sale whenever specific events or circumstances impacting product quality become known that would not have been taken into account using historical data.
Contingencies
Loss contingencies are accrued if the loss is probable and the amount of the loss can be reasonably estimated. Legal costs associated with potential loss contingencies are expensed as incurred.
Derivative Instruments
Derivative instruments are recorded on the Consolidated Balance Sheets at fair value. Changes in the fair value of the Company’s economic hedges utilizing foreign currency forward contracts are included in "Foreign currency gain (loss)" on the Consolidated Statements of Operations. When the Company is engaged in more than one outstanding derivative contract with the same counterparty and also has a legally enforceable master netting agreement with that counterparty, the “net” mark-to-market exposure represents the netting of the positive and negative exposures with that counterparty. The cash flows from derivative instruments are presented in the same category on the Consolidated Statements of Cash Flows as the category for the cash flows from the hedged item. Generally, this accounting policy election results in cash flows related to derivative instruments being classified as an operating activity on the Consolidated Statements of Cash Flows.
Revenue Recognition
The Company recognizes revenue in accordance with Accounting Standards Codification (ASC) 606, “Revenue from Contracts with Customers.” The core principle of ASC 606 is to recognize revenue in a manner that depicts the transfer of promised goods or services to customers in an amount that reflects the consideration to which the
COGNEX CORPORATION - NOTES TO CONSOLIDATED FINANCIAL STATEMENTS
Company expects to be entitled in exchange for those goods or services. The framework in support of this core principle includes: (1) identifying the contract with the customer; (2) identifying the performance obligations in the contract; (3) determining the transaction price; (4) allocating the transaction price to the performance obligations; and (5) recognizing revenue when (or as) the performance obligations are satisfied.
Identifying the Contract with the Customer
The Company identifies contracts with customers as agreements that create enforceable rights and obligations, which typically take the form of customer contracts or purchase orders. The Company accounts for a contract when it has approval and commitment from both parties, the rights of the parties are identified, payment terms are identified, the contract has commercial substance, and collectability of consideration is probable.
Identifying the Performance Obligations in the Contract
The Company identifies performance obligations as promises in contracts to transfer distinct goods or services. Standard products and services that the Company regularly sells separately, which customers can benefit from either on their own or with other readily available resources and are distinct within the context of the customer contract, are accounted for as distinct performance obligations. Application-specific customer solutions that are comprised of a combination of products and services are accounted for as one performance obligation to deliver a total solution to the customer. On-site support services that are provided to the customer after the solution is deployed are accounted for as a separate performance obligation.
Shipping and handling activities for which the Company is responsible under the terms and conditions of the sale are not accounted for as performance obligations but as fulfillment costs. These activities are required to fulfill the Company’s promise to transfer the goods and are expensed when revenue is recognized.
The Company does not assess whether promised goods or services are performance obligations if they are immaterial in the context of the contract. If revenue is recognized before immaterial promises have been completed, then the costs related to such immaterial promises are accrued at the time of sale.
Determining the Transaction Price
The Company determines the transaction price as the amount of consideration it expects to receive in exchange for transferring promised goods or services to the customer. Amounts collected from customers for sales taxes are excluded from the transaction price.
If a contract includes a variable amount, such as a rebate, then the Company estimates the transaction price using either the expected value or the most likely amount of consideration to be received, depending on the specific facts and circumstances. The Company includes estimated variable consideration in the transaction price only to the extent it is probable that a significant reversal of revenue will not occur when the uncertainty is resolved. The Company updates its estimate of variable consideration at the end of each reporting period to reflect changes in facts and circumstances.
The Company records revenue net of estimated returns. As a practical expedient, the Company estimates the transaction price using the expected value based on its history of return experience using a portfolio approach in which the Company’s total revenue is reduced by an estimate of total customer returns. Management reasonably expects that the effect of applying a portfolio approach to a group of contracts would not differ materially from considering each contract separately.
Allocating the Transaction Price to the Performance Obligations
The Company allocates the transaction price to each performance obligation at contract inception based on a relative stand-alone selling price basis, or the price at which the Company would sell the good or service separately to similar customers in similar circumstances.
Recognizing Revenue When (or As) the Performance Obligations are Satisfied
The Company recognizes revenue when it transfers the promised goods or services to the customer. Revenue for standard products is recognized at the point in time when the customer obtains control of the goods, which is typically upon shipment or delivery when the customer has legal title, physical possession, the risks and rewards of ownership, and an enforceable obligation to pay for the products. Revenue for services, which are not material, is typically recognized over the time the service is provided.
Revenue for application-specific customer solutions is recognized at the point in time when the solution is validated, which is the point in time when the Company can reasonably determine that the agreed-upon specifications in the contract have been met and the customer should reasonably accept the performance obligations in the
COGNEX CORPORATION - NOTES TO CONSOLIDATED FINANCIAL STATEMENTS
arrangement. Although the customer may have taken legal title and physical possession of the goods when they arrived at the customer’s designated site, the significant risks and rewards of ownership transfer to the customer only upon validation. Revenue for on-site support services related to these solutions is recognized over the time the service is provided.
In certain instances, an arrangement may include customer-specified acceptance provisions or performance guarantees that allow the customer to accept or reject delivered products that do not meet the customer’s requirements. If the Company can reasonably determine that control of a good or service has been transferred to the customer in accordance with the agreed-upon requirements in the contract, then customer acceptance is a formality. If acceptance provisions are presumed to be substantive, then revenue is deferred until customer acceptance.
For the Company’s standard products and services, revenue recognition and billing typically occur at the same time. For application-specific customer solutions, however, the agreement with the customer may provide for billing terms which differ from the timing of revenue recognition, resulting in either deferred revenue or unbilled revenue. Credit assessments are performed to determine payment terms, which vary by region, industry, and customer. Prepayment terms result in contract liabilities for customer deposits. When credit is granted to customers, payment is typically due 30 to 90 days from billing. The Company's contracts typically have an original expected duration of less than one year, and therefore as a practical expedient, the Company has elected to ignore the impact of the time value of money on such contracts and to expense sales commissions. The Company recognizes an asset for costs to fulfill a contract if the costs relate directly to the contract and to future performance, and the costs are expected to be recovered.
Management exercises judgment when determining the amount of revenue to be recognized each period. Such judgments include, but are not limited to, assessing the customer’s ability and intention to pay substantially all of the contract consideration when due, determining when two or more contracts should be combined and accounted for as a single contract, determining whether a contract modification has occurred, assessing whether promises are immaterial in the context of the contract, determining whether material promises in a contract represent distinct performance obligations, estimating the transaction price for a contract that contains variable consideration, determining the stand-alone selling price of each performance obligation, determining whether control is transferred over time or at a point in time for performance obligations, and assessing whether formal customer acceptance provisions are substantive.
Research and Development
Research and development costs primarily include costs related to personnel, prototyping materials and equipment, and outside services. Research and development costs are expensed when incurred until technological feasibility has been established for the product. Thereafter, all software costs may be capitalized until the product is available for general release to customers. The Company determines technological feasibility at the time the product reaches beta in its stage of development. Historically, the time incurred between beta and general release to customers has been short, and therefore, the costs have been insignificant.
Advertising Costs
Advertising costs are expensed as incurred and totaled $1,286,000 in 2024, $1,190,000 in 2023, and $1,257,000 in 2022.
Stock-Based Compensation
The Company’s stock-based awards that result in compensation expense consist of stock options and restricted stock units ("RSUs"), including performance restricted stock units ("PRSUs"). The Company has reserved a specific number of shares of its authorized but unissued shares for issuance upon the exercise of stock options or the settlement of RSUs. When a stock option is exercised or an RSU is settled, the Company issues new shares from this pool. Management is responsible for determining the appropriate valuation model and estimating the fair value of stock-based awards, and in doing so, considers a number of factors, including information provided by an outside valuation advisor and the observable market price of the Company's common stock on the grant date. The fair value of RSUs is determined based on the observable market price of the Company's common stock on the grant date less the present value of expected future dividends. The fair value of PRSUs where the performance goal includes service and market conditions is calculated using a Monte Carlo simulation model to estimate the probability of satisfying the service and market conditions stipulated in the award grant. When determining the grant-date fair value of stock-based awards, management further considers whether an adjustment is required to the observable
COGNEX CORPORATION - NOTES TO CONSOLIDATED FINANCIAL STATEMENTS
market price or volatility of the Company's common stock that is used in the valuation as a result of material non-public information if that information is expected to result in a material increase in share price.
The Company recognizes compensation expense related to stock-based awards using the graded attribution method, in which expense is recognized on a straight-line basis over the service period for each separately vesting portion of the stock option or RSU as if the award was, in substance, multiple awards. The amount of compensation expense recognized at the end of the vesting period is based on the number of awards for which the requisite service has been completed. No compensation expense is recognized for awards that are forfeited for which the employee does not render the requisite service. The term “forfeitures” is distinct from “expirations” and represents only the unvested portion of the surrendered award. The Company applies estimated forfeiture rates to its unvested awards to arrive at the amount of compensation expense that is expected to be recognized over the requisite service period. At the end of each separately vesting portion of an award, the expense that was recognized by applying the estimated forfeiture rate is compared to the expense that should be recognized based on the employee’s service, and an increase or decrease to compensation expense is recorded to true up the final expense.
Taxes
The Company recognizes a tax position in its financial statements when that tax position, based solely upon its technical merits, is more likely than not to be sustained upon examination by the relevant taxing authority. Those tax positions failing to qualify for initial recognition are recognized in the first interim period in which they meet the more likely than not standard, are resolved through negotiation or litigation with the taxing authority, or upon expiration of the statutes of limitations. Derecognition of a tax position that was previously recognized occurs when an entity subsequently determines that a tax position no longer meets the more likely than not threshold of being sustained.
The portion of the liability that is expected to be paid within one year is classified as a current liability. As a result, liabilities expected to be resolved without the payment of cash (e.g., resolution due to the expiration of the statutes of limitations) or are not expected to be paid within one year are classified as a non-current liability. It is the Company’s policy to record estimated interest and penalties as income tax expense and tax credits as a reduction in income tax expense.
Deferred tax assets and liabilities are determined based on the differences between the financial statement and tax bases of assets and liabilities as measured by the enacted tax rates that will be in effect when these differences reverse. Valuation allowances are provided if, based on the weight of available evidence, it is more likely than not that some or all of the deferred tax assets will not be realized. The Company accounts for the impact of Global Intangible Low-Taxed Income (GILTI) tax in deferred taxes.
Sales tax in the United States and similar taxes in other jurisdictions that are collected from customers and remitted to government authorities are presented on a gross basis (i.e., a receivable from the customer with a corresponding payable to the government). Amounts collected from customers and retained by the Company during tax holidays are recognized as non-operating income when earned.
Net Income Per Share
Basic net income per share is computed by dividing net income available to common shareholders by the weighted-average number of common shares outstanding for the period. Diluted net income per share is computed by dividing net income available to common shareholders by the weighted-average number of common shares outstanding for the period plus potential dilutive common shares. Dilutive common equivalent shares consist of stock options and restricted stock units and are calculated using the treasury stock method. Common equivalent shares do not qualify as participating securities. In periods where the Company records a net loss, potential common stock equivalents are not included in the calculation of diluted net loss per share as their effect would be anti-dilutive.
Comprehensive Income
Comprehensive income is defined as the change in equity of a company during a period from transactions and other events and circumstances, excluding transactions resulting from investments by owners and distributions to owners. Accumulated other comprehensive loss, net of tax, consists of foreign currency translation adjustment losses of $67,808,000 and $36,550,000, as of December 31, 2024 and December 31, 2023, respectively; net unrealized losses on available-for-sale investments of $3,698,000 and $7,515,000 as of December 31, 2024 and December 31, 2023, respectively; and losses on currency swaps, net of gains on long-term intercompany loans of $1,271,000 at each year end.
COGNEX CORPORATION - NOTES TO CONSOLIDATED FINANCIAL STATEMENTS
Concentrations of Risk
Financial instruments that potentially subject the Company to concentrations of credit risk consist primarily of cash, cash equivalents, investments, and accounts receivable. The Company has certain domestic and foreign cash balances that exceed the insured limits set by the Federal Deposit Insurance Corporation (FDIC) in the United States and equivalent regulatory agencies in foreign countries. The Company primarily invests in investment-grade debt securities and has established guidelines relative to credit ratings, diversification, and maturities of its debt securities that maintain liquidity and safety. The Company has historically not experienced any significant realized losses on its debt securities. The Company performs ongoing credit evaluations of its customers and maintains allowances for potential credit losses. The Company has historically not experienced any significant losses related to the collection of its accounts receivable.
A significant portion of the Company's products is presently manufactured by a third-party contractor located in Indonesia. This contract manufacturer has agreed to provide the Company with termination notification periods and last-time-buy rights, if and when that may be applicable.
Certain key electronic and mechanical components, such as integrated circuit chips, are fundamental to the design of Cognex products. Due to the impact of global supply chain challenges or other factors, we have experienced, and may continue to experience, disruptions to the supply of components for our products that have resulted, and may continue to result, in higher purchase costs, delivery costs, and manufacturing delays.
The Company sources components from preferred vendors that are selected based on price and performance considerations. In the event of a supply disruption from a preferred vendor, these components may typically be purchased from alternative vendors, which may result in higher purchase costs and manufacturing delays based on the time required to identify and obtain sufficient quantities from an alternative source. Certain of the Company’s products utilize components that are available from only one source. If we are unable to secure adequate supply from these sources, we may have to redesign our products, which may lead to higher costs, delays in manufacturing, and possible loss of sales.
Business Combinations
The Company determines whether a transaction qualifies as a business combination by applying the definition of a business, which requires the assets acquired and liabilities assumed to be inputs and processes that have the ability to contribute to the creation of outputs. The Company accounts for business combinations under the acquisition method of accounting, which requires the following steps: (1) identifying the acquirer, (2) determining the acquisition date, (3) recognizing and measuring the identifiable assets acquired and the liabilities assumed, and (4) recognizing and measuring goodwill. The Company measures the identifiable assets acquired and liabilities assumed at their estimated fair values as of the acquisition date. Management is responsible for determining the appropriate valuation model and estimated fair values, and in doing so, considers a number of factors, including information provided by an outside valuation advisor. Management bases the fair value of assets, including identifiable intangible assets acquired, on detailed valuations that use information and assumptions provided by management, which consider management’s best estimates of inputs and assumptions that a market participant would use. Goodwill is recognized as of the acquisition date as the excess of the consideration transferred over the net amount of assets acquired and liabilities assumed. Transaction costs are expensed as incurred.
NOTE 2: New Pronouncements
Accounting Standards Update (ASU) 2023-07, Segment Reporting (Topic 280): Improvements to Reportable Segment Disclosures
The amendments in this ASU apply to all public entities, including public entities with a single reportable segment, that are required to report segment information in accordance with Topic 280, Segment Reporting. The amendments require public business entities to provide in interim and annual periods one or more measures of segment profit or loss used by the chief operating decision maker to allocate resources and assess performance. Additionally, the amendments require disclosure of significant segment expenses and other segment items, as well as incremental qualitative disclosures. The amendments in this ASU are effective for fiscal years beginning after December 15, 2023 and should be applied on a retrospective basis. The Company adopted ASU 2023-07 in 2024. Refer to Note 20 for related disclosures.
COGNEX CORPORATION - NOTES TO CONSOLIDATED FINANCIAL STATEMENTS
Accounting Standards Update (ASU) 2023-09, Income Taxes (Topic 740): Improvements to Income Tax Disclosures
The amendments in this ASU apply to all entities that are subject to Topic 740, Income Taxes. The amendments require public business entities to disclose specific categories in their rate reconciliation and provide additional information for reconciling items that meet a quantitative threshold. They also require all entities to disclose income taxes paid, net of refund received, disaggregated by federal, state, and foreign taxes and by individual jurisdictions in which income taxes paid, net of refunds received, is equal to or greater than five percent of total income taxes paid. For public business entities, the amendments in this ASU are effective for annual periods beginning after December 15, 2024. The amendments in this ASU should be applied on a prospective basis. Management does not expect ASU 2023-09 to have a material impact on the Company's financial statements and disclosures.
Accounting Standards Update (ASU) 2024-03, Income Statement—Reporting Comprehensive Income—Expense Disaggregation Disclosures (Subtopic 220-40)
ASU 2024-03 aims to enhance transparency for users of financial statements by requiring public business entities to disaggregate specific expense categories. ASU 2024-03 mandates disclosures in the notes to financial statements detailing the composition and trends of key expense categories within major income statement captions. These enhanced disclosures are intended to help investors more effectively assess the entity’s performance, understand its cost structure, and make more accurate forecasts of future cash flows. For public business entities, ASU 2024-03 is effective for annual periods beginning after December 15, 2026, and interim periods within annual reporting periods beginning after December 15, 2027. The adoption will result in disclosure changes only.
NOTE 3: Fair Value Measurements
Financial Assets and Liabilities that are Measured at Fair Value on a Recurring Basis
The following table summarizes the financial assets and liabilities measured at fair value on a recurring basis as of December 31, 2024 (in thousands):
| | | | | | | | | | | | | | | | | |
| Quoted Prices in
Active Markets
for Identical
Assets (Level 1) | | Significant Other
Observable
Inputs (Level 2) | | Unobservable Inputs (Level 3) |
| Assets: | | | | | |
| | | | | |
| Money market instruments | $ | 15,242 | | | $ | — | | | $ | — | |
| Corporate bonds | — | | | 340,916 | | | — | |
| Treasury notes | — | | | 45,634 | | | — | |
| Asset-backed securities | — | | | 13,314 | | | — | |
| | | | | |
| | | | | |
| Sovereign bonds | — | | | 990 | | | — | |
| | | | | |
| | | | | |
| | | | | |
| Economic hedge forward contracts | — | | | 324 | | | — | |
| Liabilities: | | | | | |
| | | | | |
| Economic hedge forward contracts | — | | | 211 | | | — | |
| | | | | |
The Company’s money market instruments are reported at fair value based on the daily market price for identical assets in active markets, and are therefore classified as Level 1.
The Company’s debt securities and forward contracts are reported at fair value based on model-driven valuations in which all significant inputs are observable or can be derived from or corroborated by observable market data for substantially the full term of the asset or liability, and are therefore classified as Level 2. Management is responsible for estimating the fair value of these financial assets and liabilities, and in doing so, considers valuations provided by a large, third-party pricing service. For debt securities, this service maintains regular contact with market makers, brokers, dealers, and analysts to gather information on market movement, direction, trends, and other specific data. They use this information to structure yield curves for various types of debt securities and arrive at the daily valuations. The Company's forward contracts are typically traded or executed in over-the-counter markets with a high degree of pricing transparency. The market participants are generally large commercial banks.
COGNEX CORPORATION - NOTES TO CONSOLIDATED FINANCIAL STATEMENTS
Non-financial Assets that are Measured at Fair Value on a Non-recurring Basis
Non-financial assets, such as property, plant and equipment, operating lease assets, goodwill, and intangible assets, are required to be measured at fair value only when an impairment loss is recognized. The Company evaluates these long-lived assets for impairment whenever events or changes in circumstances, referred to as "triggering events," indicate the carrying value may not be recoverable. The Company did not record impairment charges related to non-financial assets in 2024, 2023, or 2022.
NOTE 4: Cash, Cash Equivalents, and Investments
Cash, cash equivalents, and investments consisted of the following (in thousands):
| | | | | | | | | | | |
| | December 31, |
| | 2024 | | 2023 |
| Cash | $ | 170,852 | | | $ | 183,242 | |
| | | |
| Money market instruments | 15,242 | | | 19,413 | |
| Cash and cash equivalents | 186,094 | | | 202,655 | |
| Corporate bonds | 55,742 | | | 124,851 | |
| Treasury notes | 2,487 | | | — | |
| Sovereign bonds | 990 | | | 990 | |
| Asset-backed securities | 737 | | | 3,551 | |
| | | |
| | | |
| | | |
| | | |
| | | |
| Current investments | 59,956 | | | 129,392 | |
| Corporate bonds | 285,174 | | | 183,965 | |
| Treasury notes | 43,147 | | | 43,523 | |
| Asset-backed securities | 12,577 | | | 15,763 | |
| Sovereign bonds | — | | | 979 | |
| | | |
| | | |
| Non-current investments | 340,898 | | | 244,230 | |
| $ | 586,948 | | | $ | 576,277 | |
Corporate bonds consist of debt securities issued by both domestic and foreign companies; treasury notes consist of debt securities issued by the U.S. government; sovereign bonds consist of direct debt issued by foreign governments; and asset-backed securities consist of debt securities collateralized by pools of receivables or loans with credit enhancement. All of the Company's securities as of December 31, 2024 and 2023 were denominated in U.S. Dollars.
The Company’s cash balance included foreign bank balances totaling $156,027,000 and $173,614,000 as of December 31, 2024 and 2023, respectively.
Accrued interest receivable is included in "Prepaid expenses and other current assets" on the Consolidated Balance Sheets and amounted to $4,144,000 and $3,169,000 as of December 31, 2024 and 2023, respectively.
The following table summarizes the Company’s available-for-sale investments as of December 31, 2024 (in thousands):
| | | | | | | | | | | | | | | | | | | | | | | | |
| Amortized
Cost | | Gross
Unrealized
Gains | | Gross
Unrealized
Losses | | Fair Value | |
| Current: | | | | | | | | |
| Corporate bonds | $ | 56,472 | | | $ | 3 | | | $ | (733) | | | $ | 55,742 | | |
| Treasury notes | 2,501 | | | — | | | (14) | | | 2,487 | | |
| Sovereign bonds | 1,013 | | | — | | | (23) | | | 990 | | |
| | | | | | | | |
| Asset-backed securities | 739 | | | — | | | (2) | | | 737 | | |
| | | | | | | | |
| | | | | | | | |
| | | | | | | | |
| Non-current: | | | | | | | | |
| Corporate bonds | 288,332 | | | 408 | | | (3,566) | | | 285,174 | | |
| Treasury notes | 43,570 | | | 2 | | | (425) | | | 43,147 | | |
| Asset-backed securities | 13,131 | | | — | | | (554) | | | 12,577 | | |
| | | | | | | | |
| | | | | | | | |
| | | | | | | | |
| $ | 405,758 | | | $ | 413 | | | $ | (5,317) | | | $ | 400,854 | | |
COGNEX CORPORATION - NOTES TO CONSOLIDATED FINANCIAL STATEMENTS
The following table summarizes the Company’s available-for-sale investments as of December 31, 2023 (in thousands):
| | | | | | | | | | | | | | | | | | | | | | | | |
| Amortized
Cost | | Gross
Unrealized
Gains | | Gross
Unrealized
Losses | | Fair Value | |
| Current: | | | | | | | | |
| Corporate bonds | $ | 128,150 | | | $ | — | | | $ | (3,299) | | | $ | 124,851 | | |
| Asset-backed securities | 3,637 | | | — | | | (86) | | | 3,551 | | |
| Sovereign bonds | 1,012 | | | — | | | (22) | | | 990 | | |
| | | | | | | | |
| | | | | | | | |
| | | | | | | | |
| Non-current: | | | | | | | | |
| Corporate bonds | 189,326 | | | 506 | | | (5,867) | | | 183,965 | | |
| Treasury notes | 43,654 | | | 82 | | | (213) | | | 43,523 | | |
| Asset-backed securities | 16,773 | | | — | | | (1,010) | | | 15,763 | | |
| Sovereign bonds | 1,037 | | | — | | | (58) | | | 979 | | |
| | | | | | | | |
| | | | | | | | |
| $ | 383,589 | | | $ | 588 | | | $ | (10,555) | | | $ | 373,622 | | |
The following table summarizes the Company’s gross unrealized losses and fair values for available-for-sale investments in an unrealized loss position as of December 31, 2024 (in thousands):
| | | | | | | | | | | | | | | | | | | | | | | | | | | | | | | | | | | |
| | | | | | | | | | | |
| | Unrealized Loss
Position For Less than
12 Months | | Unrealized Loss
Position For Greater than
12 Months | | Total |
| | Fair Value | | Unrealized
Losses | | Fair Value | | Unrealized
Losses | | Fair Value | | Unrealized
Losses |
| Corporate bonds | $ | 172,049 | | | $ | (2,227) | | | $ | 87,815 | | | $ | (2,071) | | | $ | 259,864 | | | $ | (4,298) | |
| Treasury notes | 42,149 | | | (425) | | | 2,487 | | | (14) | | | 44,636 | | | (439) | |
| Asset-backed securities | 11,024 | | | (547) | | | 2,290 | | | (10) | | | 13,314 | | | (557) | |
| | | | | | | | | | | |
| Sovereign bonds | — | | | — | | | 990 | | | (23) | | | 990 | | | (23) | |
| | | | | | | | | | | |
| $ | 225,222 | | | $ | (3,199) | | | $ | 93,582 | | | $ | (2,118) | | | $ | 318,804 | | | $ | (5,317) | |
The following table summarizes the Company’s gross unrealized losses and fair values for available-for-sale investments in an unrealized loss position as of December 31, 2023 (in thousands):
| | | | | | | | | | | | | | | | | | | | | | | | | | | | | | | | | | | |
| | | | | | | | | | | |
| | Unrealized Loss
Position For Less than
12 Months | | Unrealized Loss
Position For Greater than
12 Months | | Total |
| | Fair Value | | Unrealized
Losses | | Fair Value | | Unrealized
Losses | | Fair Value | | Unrealized
Losses |
| Corporate bonds | $ | 30,770 | | | $ | (359) | | | $ | 226,643 | | | $ | (8,807) | | | $ | 257,413 | | | $ | (9,166) | |
| Treasury notes | 20,725 | | | (153) | | | 2,441 | | | (60) | | | 23,166 | | | (213) | |
| Asset-backed securities | 17,062 | | | (1,049) | | | 2,252 | | | (47) | | | 19,314 | | | (1,096) | |
| | | | | | | | | | | |
| Sovereign bonds | — | | | — | | | 1,968 | | | (80) | | | 1,968 | | | (80) | |
| | | | | | | | | | | |
| $ | 68,557 | | | $ | (1,561) | | | $ | 233,304 | | | $ | (8,994) | | | $ | 301,861 | | | $ | (10,555) | |
Management monitors debt securities that are in an unrealized loss position to determine whether a loss exists related to the credit quality of the issuer. When developing an estimate of expected credit losses, management considers all relevant information including historical experience, current conditions, and reasonable forecasts of expected future cash flows. Based on this evaluation, no allowance for credit losses on debt securities was recorded as of December 31, 2024, 2023, or 2022. Management currently intends to hold these securities to full value recovery at maturity.
COGNEX CORPORATION - NOTES TO CONSOLIDATED FINANCIAL STATEMENTS
The following table summarizes the Company's gross realized gains and losses on the sale of debt securities (in thousands):
| | | | | | | | | | | | | | | | | | | | |
| | Year Ended December 31, |
| | 2024 | | 2023 | | 2022 |
| Gross realized gains | | $ | 8 | | | $ | 111 | | | $ | 133 | |
| Gross realized losses | | (16) | | | (2,065) | | | (315) | |
| Net realized gains (losses) | | $ | (8) | | | $ | (1,954) | | | $ | (182) | |
Realized gains and losses are included in "Investment income" on the Consolidated Statements of Operations. Prior to the sale of these securities, unrealized gains and losses for these debt securities, net of tax, were recorded in shareholders’ equity as accumulated other comprehensive loss.
The following table summarizes the effective maturity dates of the Company’s available-for-sale investments as of December 31, 2024 (in thousands):
| | | | | | | | | | | | | | | | | | | | | | | | | | | | | | | | | | | | | | | | | |
| <1 Year | | 1-2 Years | | 2-3 Years | | 3-4 Years | | 4-5 Years | | 5-7 Years | | Total |
| Corporate bonds | $ | 55,742 | | | $ | 62,324 | | | $ | 92,207 | | | $ | 68,029 | | | $ | 62,614 | | | $ | — | | | $ | 340,916 | |
| Treasury notes | 2,487 | | | 9,177 | | | 21,365 | | | 12,605 | | | — | | | — | | | 45,634 | |
| Asset-backed securities | 737 | | | 5,911 | | | — | | | 1,296 | | | 1,982 | | | 3,388 | | | 13,314 | |
| | | | | | | | | | | | | |
| | | | | | | | | | | | | |
| Sovereign bonds | 990 | | | — | | | — | | | — | | | — | | | — | | | 990 | |
| | | | | | | | | | | | | |
| $ | 59,956 | | | $ | 77,412 | | | $ | 113,572 | | | $ | 81,930 | | | $ | 64,596 | | | $ | 3,388 | | | $ | 400,854 | |
NOTE 5: Inventories
Inventories consisted of the following (in thousands):
| | | | | | | | | | | |
| December 31, |
| | 2024 | | 2023 |
| Raw materials | $ | 86,917 | | | $ | 93,201 | |
| Work-in-process | 5,544 | | | 5,747 | |
| Finished goods | 65,066 | | | 63,337 | |
| $ | 157,527 | | | $ | 162,285 | |
NOTE 6: Property, Plant, and Equipment
Property, plant, and equipment consisted of the following (in thousands):
| | | | | | | | | | | |
| | December 31, |
| | 2024 | | 2023 |
| Land | $ | 8,711 | | | $ | 8,805 | |
| Buildings | 38,878 | | | 34,117 | |
| Building improvements | 46,496 | | | 44,992 | |
| Leasehold improvements | 21,642 | | | 19,611 | |
| Computer hardware and software | 57,791 | | | 55,154 | |
| Manufacturing test equipment | 45,523 | | | 36,182 | |
| Furniture and fixtures | 6,468 | | | 7,361 | |
| 225,509 | | | 206,222 | |
| Less: accumulated depreciation | (127,064) | | | (100,373) | |
| $ | 98,445 | | | $ | 105,849 | |
The Company disposed of property, plant, and equipment with a cost basis of $9,580,000 and accumulated depreciation of $9,492,000 in 2024, resulting in a loss of $88,000. The Company disposed of property, plant, and equipment with a cost basis of $12,421,000 and accumulated depreciation of $12,184,000 in 2023, net of proceeds of $8,000, resulting in a loss of $229,000.
COGNEX CORPORATION - NOTES TO CONSOLIDATED FINANCIAL STATEMENTS
NOTE 7: Leases
The Company's leases are primarily leased properties across different worldwide locations where the Company conducts its business. All of these leases are classified as operating leases. Certain leases may contain options to extend or terminate the lease at the Company's sole discretion. As of December 31, 2024, there were no options to terminate and twenty options to extend that were accounted for in the determination of the lease term for the Company's outstanding leases. Certain leases contain leasehold improvement incentives, retirement obligations, escalating clauses, rent holidays, and variable payments tied to a consumer price index. There were no restrictions or covenants for the outstanding leases as of December 31, 2024. The Company did not have any leases that had not yet commenced but that created significant rights and/or obligations as of December 31, 2024.
The total operating lease expense was $14,131,000 in 2024, $11,598,000 in 2023, and $8,939,000 in 2022. The total operating lease cash payments were $13,683,000 in 2024, $10,148,000 in 2023, and $8,548,000 in 2022. The total lease expense for leases with a term of twelve months or less for which the Company elected not to recognize a lease asset or lease liability was $407,000 in 2024, $427,000 in 2023, and $144,000 in 2022.
Future operating lease cash payments are as follows (in thousands):
| | | | | | | | |
| Year Ended December 31, | | Amount |
| 2025 | | $ | 12,534 | |
| 2026 | | 10,543 | |
| 2027 | | 9,496 | |
| 2028 | | 8,820 | |
| 2029 | | 8,242 | |
| Thereafter | | 43,657 | |
| | $ | 93,292 | |
The discounted present value of the future lease cash payments resulted in a lease liability of $70,217,000 and $78,601,000 as of December 31, 2024 and 2023, respectively.
The Company leases a building in Singapore that serves as a distribution center for customers in Asia. The lease contains two components: an 88,000 square-foot premises that had a commencement date in June of 2023 and a second 27,000 square-foot premises that does not commence until the fourth quarter of 2025. Accordingly, the second component of the lease has not yet been recorded on the Consolidated Balance Sheets, nor has it created any significant rights and obligations as of December 31, 2024. This second lease component has an original term of eight years and the Company has the right and option to extend this term by an additional five years, commencing upon the expiration of the original term. Future payment obligations associated with this lease component total $13,145,000, $160,000 of which is payable in 2025 and which reflects an estimated extension period of five years. Future payment obligations related to this lease component are not included in the future operating lease cash payments table above.
The Company has entered into a lease for a 6,500 square-foot building in Aachen, Germany for a term of ten years. The commencement date for this lease is expected to be in the second quarter of 2025, and therefore it has not yet been recorded on the Consolidated Balance Sheets, nor has it created any significant rights and obligations as of December 31, 2024. The Company has the right and option to extend the term of this lease for an additional period of five years, commencing upon the expiration of the original term. Future payment obligations associated with this lease total $8,763,000, $483,000 of which is payable in 2025. Future payment obligations related to this lease are not included in the future operating lease cash payments table above.
The weighted-average discount rate was 5.9% and 5.7% for the leases outstanding as of December 31, 2024 and December 31, 2023, respectively. The weighted-average remaining lease term was 9.9 years and 10.5 years for the leases outstanding as of December 31, 2024 and 2023, respectively.
COGNEX CORPORATION - NOTES TO CONSOLIDATED FINANCIAL STATEMENTS
NOTE 8: Goodwill
The changes in the carrying value of goodwill were as follows (in thousands):
| | | | | | | | |
| | Amount |
| Balance as of December 31, 2022 | | $ | 242,630 | |
| | |
| Acquisition of Moritex Corporation (refer to Note 21) | | 145,047 | |
| Foreign exchange rate changes | | 5,504 | |
| Balance as of December 31, 2023 | | 393,181 | |
| Moritex Corporation measurement period adjustments (refer to Note 21) | | 6,478 | |
| Foreign exchange rate changes | | (14,722) | |
| Balance as of December 31, 2024 | | $ | 384,937 | |
For its 2024 annual analysis of goodwill, management elected to perform a qualitative assessment. Based on this assessment, management believes it is more likely than not that the fair value of the reporting unit exceeds its carrying value. The Company did not record impairment charges related to goodwill in 2024, 2023, or 2022.
NOTE 9: Intangible Assets
Intangible assets consisted of the following (in thousands):
| | | | | | | | | | | | | | | | | |
| Gross
Carrying
Value | | Accumulated
Amortization | | Net
Carrying
Value |
| Customer relationships | $ | 67,781 | | | $ | (10,229) | | | $ | 57,552 | |
| | | | | |
| Completed technologies | 58,373 | | | (25,766) | | | 32,607 | |
| Trademarks | 810 | | | (337) | | | 473 | |
| Non-compete agreements | 340 | | | (288) | | | 52 | |
| | | | | |
| Balance as of December 31, 2024 | $ | 127,304 | | | $ | (36,620) | | | $ | 90,684 | |
| | | | | |
| | Gross
Carrying
Value | | Accumulated
Amortization | | Net
Carrying
Value |
| Customer relationships | $ | 75,965 | | | $ | (5,352) | | | $ | 70,613 | |
| Completed technologies | 62,123 | | | (20,745) | | | 41,378 | |
| | | | | |
| Trademarks | 903 | | | (50) | | | 853 | |
| Non-compete agreements | 340 | | | (232) | | | 108 | |
| | | | | |
| Balance as of December 31, 2023 | $ | 139,331 | | | $ | (26,379) | | | $ | 112,952 | |
The Company did not record impairment charges related to intangible assets in 2024, 2023, or 2022.
Estimated amortization expense for each of the five succeeding fiscal years and thereafter is as follows (in thousands):
| | | | | | | | |
| Year Ended December 31, | | Amount |
| 2025 | | $ | 10,147 | |
| 2026 | | 9,775 | |
| 2027 | | 8,850 | |
| 2028 | | 8,120 | |
| 2029 | | 8,120 | |
| Thereafter | | 45,672 | |
| | $ | 90,684 | |
COGNEX CORPORATION - NOTES TO CONSOLIDATED FINANCIAL STATEMENTS
NOTE 10: Accrued Expenses
Accrued expenses consisted of the following (in thousands):
| | | | | | | | | | | |
| | December 31, |
| 2024 | | 2023 |
| Incentive compensation | $ | 18,735 | | | $ | 10,645 | |
| Foreign retirement obligations | 10,445 | | | 12,835 | |
| Warranty obligations | 5,140 | | | 4,244 | |
| Salaries and payroll taxes | 5,123 | | | 8,774 | |
| Vacation | 3,945 | | | 5,827 | |
| Other | 28,372 | | | 30,049 | |
| $ | 71,760 | | | $ | 72,374 | |
The changes in the warranty obligation were as follows (in thousands):
| | | | | |
| Balance as of December 31, 2021 | $ | 5,427 | |
| Provisions for warranties issued during the period | 1,876 | |
| Fulfillment of warranty obligations | (2,928) | |
| Balance as of December 31, 2022 | 4,375 | |
| Provisions for warranties issued during the period | 2,940 | |
| Fulfillment of warranty obligations | (3,078) | |
| Foreign exchange rate changes | 7 | |
| Balance as of December 31, 2023 | 4,244 | |
| Provisions for warranties issued during the period | 4,794 | |
| Fulfillment of warranty obligations | (3,883) | |
| Foreign exchange rate changes | (15) | |
| Balance as of December 31, 2024 | $ | 5,140 | |
NOTE 11: Commitments and Contingencies
As of December 31, 2024, the Company had outstanding purchase orders totaling $44,269,000 to procure inventory from various vendors. Certain of these purchase orders may be canceled by the Company, subject to cancellation penalties. These purchase commitments relate primarily to expected sales in 2025.
A significant portion of the Company's outstanding inventory purchase orders as of December 31, 2024, as well as additional preauthorized commitments to procure strategic components based on the Company's expected customer demand, are placed with the Company's primary contract manufacturer for the Company's assembled products. The Company purchased $17,461,000, $10,616,000, and $5,269,000 in 2024, 2023, and 2022, respectively, of inventories as a result of the Company's obligation to purchase any non-cancelable and non-returnable components that have been purchased by the contract manufacturer with the Company's preauthorization, when these components have not been consumed within the period defined in the terms of the Company's agreement with this contract manufacturer. While the Company typically expects such purchased components to be used in future production of Cognex finished goods, these components are considered in the Company's reserve estimate for excess and obsolete inventory. Furthermore, the Company accrues for losses on commitments for the future purchase of non-cancelable and non-returnable components from this contract manufacturer at the time that circumstances, such as changes in demand, indicate that the value of the components may not be recoverable, the loss is probable, and management has the ability to reasonably estimate the amount of the loss.
Various claims and legal proceedings generally incidental to the normal course of business are pending or threatened on behalf of or against the Company. While we cannot predict the outcome of these matters, we believe that any liability arising from them will not have a material adverse effect on our financial position, liquidity, or results of operations.
COGNEX CORPORATION - NOTES TO CONSOLIDATED FINANCIAL STATEMENTS
NOTE 12: Indemnification Provisions
Except as limited by Massachusetts law, the by-laws of the Company require it to indemnify certain current or former directors, officers, and employees of the Company against expenses incurred by them in connection with each proceeding in which he or she is involved as a result of serving or having served in certain capacities. Indemnification is not available with respect to a proceeding as to which it has been adjudicated that the person did not act in good faith in the reasonable belief that the action was in the best interests of the Company. The maximum potential amount of future payments the Company could be required to make under these provisions is unlimited. The Company has never incurred significant costs related to these indemnification provisions. As a result, the Company believes the estimated fair value of these provisions is not material.
In the ordinary course of business, the Company may accept standard limited indemnification provisions in connection with the sale of its products, whereby it indemnifies its customers for certain direct damages incurred in connection with third-party patent or other intellectual property infringement claims with respect to the use of the Company’s products. The maximum potential amount of future payments the Company could be required to make under these provisions is, in many, but not all instances, subject to fixed monetary limits. The Company has never incurred significant costs to defend lawsuits or settle claims related to these indemnification provisions. As a result, the Company believes the estimated fair value of these provisions is not material.
In the ordinary course of business, the Company also accepts limited indemnification provisions from time to time, whereby it indemnifies customers for certain direct damages incurred in connection with bodily injury and property damage arising from the use of the Company’s products. Future payments the Company could be required to make under these provisions is generally recoverable under the Company’s insurance policies. As a result of this coverage, and the fact that the Company has never incurred significant costs to defend lawsuits or settle claims related to these indemnification provisions, the Company believes the estimated fair value of these provisions is not material.
NOTE 13: Derivative Instruments
The Company’s foreign currency risk management strategy is designed to mitigate the potential financial impact of changes in the value of transactions and balances denominated in foreign currencies resulting from changes in foreign currency exchange rates. The Company enters into economic hedges utilizing foreign currency forward contracts with maturities that do not exceed approximately three months to manage the exposure to fluctuations in foreign currency exchange rates arising primarily from foreign-denominated receivables and payables. The gains and losses on these derivatives are intended to be offset by the changes in the fair value of the assets and liabilities being hedged. These economic hedges are not designated as hedging instruments for hedge accounting treatment.
The Company had the following outstanding forward contracts (in thousands):
| | | | | | | | | | | | | | | | | |
| December 31, 2024 | | December 31, 2023 |
| Currency | Notional Value | USD Equivalent | | Notional Value | USD Equivalent |
| | | | | |
| | | | |
| | | | | |
| | | | | |
| | | | | |
| | | | | |
| | | | | |
| | | | | |
| Derivatives Not Designated as Hedging Instruments: |
| Singapore Dollar | 40,000 | | $ | 29,457 | | | 39,700 | | $ | 30,136 | |
| Euro | 25,000 | | 26,029 | | | 40,000 | | 44,302 | |
| Chinese Renminbi | 95,000 | | 12,990 | | | 50,000 | | 7,025 | |
| Mexican Peso | 220,000 | | 10,701 | | | 145,000 | | 8,505 | |
| Hungarian Forint | 2,360,000 | | 5,951 | | | 2,240,000 | | 6,466 | |
| British Pound | 3,200 | | 4,008 | | | 3,345 | | 4,258 | |
| Japanese Yen | 2,000,000 | | 3,750 | | | 600,000 | | 4,255 | |
| Swiss Franc | 2,200 | | 2,432 | | | — | | — | |
| Canadian Dollar | 2,000 | | 1,390 | | | 1,470 | | 1,112 | |
| | | | | |
| | | | | |
| | | | | |
| | | | | |
| | | | | |
COGNEX CORPORATION - NOTES TO CONSOLIDATED FINANCIAL STATEMENTS
Information regarding the fair value of the outstanding forward contracts was as follows (in thousands):
| | | | | | | | | | | | | | | | | | | | | | | | | | | | | | | | | | | |
| | Asset Derivatives | | Liability Derivatives |
| Balance
Sheet Location | | Fair Value | | Balance
Sheet Location | | Fair Value |
| | December 31, 2024 | | December 31, 2023 | | | December 31, 2024 | | December 31, 2023 |
|
| | | | | | | | | | | |
| Derivatives Not Designated as Hedging Instruments: |
| Economic hedge forward contracts | Prepaid expenses and other current assets | | $ | 324 | | | $ | 151 | | | Accrued expenses | | $ | 211 | | | $ | 106 | |
The following table summarizes the gross activity for all derivative assets and liabilities which were presented on a net basis on the Consolidated Balance Sheets due to the right of offset with each counterparty (in thousands):
| | | | | | | | | | | | | | | | | | | | | | | | | | | | | | | | |
| Asset Derivatives | | Liability Derivatives |
| | December 31, 2024 | | December 31, 2023 | | | | December 31, 2024 | | December 31, 2023 |
| Gross amounts of recognized assets | | $ | 324 | | | $ | 151 | | | Gross amounts of recognized liabilities | | $ | 211 | | | $ | 106 | |
| Gross amounts offset | | — | | | — | | | Gross amounts offset | | — | | | — | |
| Net amount of assets presented | | $ | 324 | | | $ | 151 | | | Net amount of liabilities presented | | $ | 211 | | | $ | 106 | |
Information regarding the effect of derivative instruments, net of the underlying exposure, on the consolidated financial statements was as follows (in thousands):
| | | | | | | | | | | | | | | | | | | | | | | |
| | Location in Financial Statements | | Year Ended December 31, |
| 2024 | | 2023 | | 2022 |
|
| | | | | | | |
| | | | | | | |
| | | | | | | |
| | | | | | | |
| | | | | | | |
| | | | | | | |
| | | | | | | |
| Derivatives Not Designated as Hedging Instruments: |
| Gains (losses) recognized in current operations | Foreign currency gain (loss) | | $ | 1,945 | | | $ | (10,023) | | | $ | 9,823 | |
COGNEX CORPORATION - NOTES TO CONSOLIDATED FINANCIAL STATEMENTS
NOTE 14: Revenue Recognition
The following table summarizes disaggregated revenue information by geographic area based on the customer's country of domicile (in thousands):
| | | | | | | | | | | | | | | | | | | | | | |
| | Year Ended December 31, |
| | 2024 | | 2023 | | 2022 | | |
| Americas | | $ | 350,155 | | | $ | 330,415 | | | $ | 390,573 | | | |
| Europe | | 217,880 | | | 220,665 | | | 234,643 | | | |
| Greater China | | 164,147 | | | 164,115 | | | 227,447 | | | |
| Other Asia | | 182,333 | | | 122,352 | | | 153,427 | | | |
| | $ | 914,515 | | | $ | 837,547 | | | $ | 1,006,090 | | | |
The following table summarizes disaggregated revenue information by revenue type (in thousands):
| | | | | | | | | | | | | | | | | | | | |
| | Year Ended December 31, |
| | 2024 | | 2023 | | 2022 |
| Standard products and services | | $ | 795,319 | | | $ | 734,140 | | | $ | 848,153 | |
| Application-specific customer solutions | | 119,196 | | | 103,407 | | | 157,937 | |
| | $ | 914,515 | | | $ | 837,547 | | | $ | 1,006,090 | |
Costs to Fulfill a Contract
Costs to fulfill a contract are included in "Prepaid expenses and other current assets" on the Consolidated Balance Sheets and amounted to $10,705,000 and $13,265,000 as of December 31, 2024 and 2023, respectively. The amount of amortization during 2024 related to costs deferred as of December 31, 2023 amounted to $12,512,000
Accounts Receivable, Contract Assets, and Contract Liabilities
Accounts receivable represent amounts billed and currently due from customers which are reported at their net estimated realizable value. The Company maintains an allowance against its accounts receivable for credit losses. Contract assets consist of unbilled revenue which arises when revenue is recognized in advance of billing primarily for certain application-specific customer solutions contracts. Contract liabilities consist of deferred revenue and customer deposits which arise when amounts are billed to or collected from customers in advance of revenue recognition.
The following table summarizes changes in the allowance for credit losses (in thousands):
| | | | | |
| Amount |
| Balance as of December 31, 2022 | $ | 730 | |
| Increases to the allowance for credit losses | 500 | |
| Write-offs, net of recoveries | (645) | |
| Foreign exchange rate changes | (2) | |
| Balance as of December 31, 2023 | 583 | |
| Increases to the allowance for credit losses | 459 | |
| Write-offs, net of recoveries | (222) | |
| Foreign exchange rate changes | 7 | |
| Balance as of December 31, 2024 | $ | 827 | |
COGNEX CORPORATION - NOTES TO CONSOLIDATED FINANCIAL STATEMENTS
The following table summarizes the deferred revenue and customer deposits activity (in thousands):
| | | | | |
| Amount |
| Balance as of December 31, 2022 | $ | 40,787 | |
| Deferral of revenue billed in the current period, net of recognition | 21,538 | |
| Recognition of revenue deferred in prior period | (20,987) | |
| Returned customer deposit | (9,205) | |
| Foreign exchange rate changes | (608) | |
| Balance as of December 31, 2023 | 31,525 | |
| Deferral of revenue billed in the current period, net of recognition | 21,998 | |
| Recognition of revenue deferred in prior period | (28,108) | |
| |
| Foreign exchange rate changes | (380) | |
| Balance as of December 31, 2024 | $ | 25,035 | |
As a practical expedient, the Company has elected not to disclose the aggregate amount of the transaction price allocated to unsatisfied performance obligations for contracts that have an original expected duration of less than one year. The remaining unsatisfied performance obligations for contracts that have an original expected duration of more than one year, primarily related to extended hardware warranties, are not material.
NOTE 15: Shareholders’ Equity
Preferred Stock
The Company has 400,000 shares of authorized but unissued $.01 par value preferred stock.
Common Stock
The Company has 300,000,000 shares of authorized $.002 par value common stock.
Each outstanding share of common stock entitles the record holder to one vote on all matters submitted to a vote of the Company’s shareholders. Common shareholders are also entitled to dividends when and if declared by the Company’s Board of Directors.
Stock Repurchases
In March 2020, the Company's Board of Directors authorized the repurchase of $200,000,000 of the Company's common stock. Under this March 2020 program, in addition to repurchases made in prior years, the Company repurchased 1,677,000 shares at a cost of $117,000,000 in 2022, which completed purchases under the March 2020 program.
In March 2022, the Company's Board of Directors authorized the repurchase of an additional $500,000,000 of the Company's common stock. Under this March 2022 program, the Company repurchased 1,682,000 shares at a cost of $87,314,000 in 2022, 1,723,000 shares at a cost of $79,794,000 in 2023, and 1,711,000 shares at a cost of $67,085,000 in 2024, leaving a remaining balance of $265,807,000 as of December 31, 2024. The 2023 repurchase included $446,000 of buyback Excise Tax in accordance with the Inflation Reduction Act of 2022.
The Company may repurchase shares under this program in future periods depending on a variety of factors, including, among other things, the impact of dilution from employee stock awards, stock price, share availability, and cash requirements. The Company is authorized to make repurchases of its common stock through open market purchases, pursuant to Rule 10b5-1 trading plans, or in privately negotiated transactions.
Dividends
The Company’s Board of Directors declared and paid cash dividends of $0.065 per share in the first, second, and third quarters of 2022, $0.070 per share in the fourth quarter of 2022 and in the first, second, and third quarters of 2023, and $0.075 per share in the fourth quarter of 2023 and in the first, second, and third quarters of 2024. The dividend was increased to $0.080 per share in the fourth quarter of 2024.
Future dividends will be declared at the discretion of the Company's Board of Directors and will depend on such factors as the Board deems relevant, including, among other things, the Company's ability to generate positive cash flow from operations.
COGNEX CORPORATION - NOTES TO CONSOLIDATED FINANCIAL STATEMENTS
NOTE 16: Stock-Based Compensation
Stock Plans
The Company’s stock-based awards that result in compensation expense consist of stock options, restricted stock units ("RSUs"), and performance restricted stock units ("PRSUs"). In May 2023, the shareholders of the Company approved the Cognex Corporation 2023 Stock Option and Incentive Plan (the “2023 Plan”). The 2023 Plan permits awards of stock options (both incentive and non-qualified options), stock appreciation rights, RSUs, and PRSUs. Up to 8,100,000 shares of common stock (subject to adjustment in the event of stock splits and other similar events) may be issued pursuant to awards granted under the 2023 Plan. In connection with the approval of the 2023 Plan, no further awards will be made under the Cognex Corporation 2001 General Stock Option Plan, as amended and restated (the “2001 Plan”), and the Cognex Corporation 2007 Stock Option and Incentive Plan, as amended and restated (the “2007 Plan”). With the approval of the 2023 Plan, the 10,610,800 shares of common stock subject to awards granted under the 2001 Plan and the 2007 Plan that were outstanding as of May 3, 2023 may become eligible for issuance under the 2023 Plan if such awards are forfeited, cancelled, or otherwise terminated (other than by exercise) (the “Carryover Shares”). As of December 31, 2024, forfeitures, cancellations, and other terminations from the 2001 Plan and the 2007 Plan have resulted in 1,142,995 Carryover Shares, raising the authorized total shares that may be issued under the 2023 Plan to 9,242,995.
As of December 31, 2024, the Company had 6,458,000 shares available for issuance under its stock plans. Stock options are granted with an exercise price equal to the market value of the Company’s common stock at the grant date and generally vest over four or five years based on continuous employment and expire ten years from the grant date. RSUs generally vest upon three or four years of continuous employment or incrementally over such three or four year periods. PRSUs generally vest upon three years of continuous employment and achievement of performance criteria established by the Compensation Committee of our Board of Directors on or prior to the grant date. Participants are not entitled to dividends on stock options, RSUs, or PRSUs.
Stock Options
The following table summarizes the Company’s stock option activity:
| | | | | | | | | | | | | | | | | | | | | | | |
| Shares
(in thousands) | | Weighted-
Average
Exercise
Price | | Weighted-
Average
Remaining
Contractual
Term
(in years) | | Aggregate
Intrinsic Value
(in thousands) |
| Outstanding as of December 31, 2023 | 9,008 | | | $ | 50.87 | | | | | |
| Granted | 1,641 | | | 39.72 | | | | | |
| Exercised | (242) | | | 24.83 | | | | | |
| Forfeited or expired | (864) | | | 53.18 | | | | | |
| Outstanding as of December 31, 2024 | 9,543 | | | $ | 49.40 | | | 5.62 | | $ | 6,898 | |
| Exercisable as of December 31, 2024 | 5,659 | | | $ | 49.75 | | | 3.90 | | $ | 6,814 | |
Options vested or expected to vest as of December 31, 2024 (1) | 9,019 | | | $ | 49.62 | | | 5.45 | | $ | 6,875 | |
(1) In addition to the vested options, the Company expects a portion of the unvested options to vest at some point in the future. Options expected to vest are calculated by applying an estimated forfeiture rate to the unvested options.
The total cash received as a result of stock option exercises was $6,011,000 in 2024, $11,104,000 in 2023, and $12,267,000 in 2022. In connection with these exercises, the tax benefit (expense) realized by the Company was $(4,021,000) in 2024, $(4,691,000) in 2023, and $2,548,000 in 2022.
COGNEX CORPORATION - NOTES TO CONSOLIDATED FINANCIAL STATEMENTS
The fair values of stock options granted in each period presented were estimated using the following weighted-average assumptions:
| | | | | | | | | | | | | | | | | |
| | Year Ended December 31, |
| | 2024 | | 2023 | | 2022 |
| Risk-free rate | 4.3 | % | | 4.0 | % | | 2.2 | % |
| Expected dividend yield | 0.76 | % | | 0.61 | % | | 0.44 | % |
| Expected volatility | 39 | % | | 39 | % | | 37 | % |
| Expected term (in years) | 4.7 | | 5.0 | | 5.5 |
Risk-free rate
The risk-free rate was based on a treasury instrument whose term was consistent with the contractual term of the option.
Expected dividend yield
The current dividend yield was calculated by annualizing the cash dividend declared by the Company’s Board of Directors and dividing that result by the closing stock price on the grant date.
Expected volatility
The expected volatility was based on a combination of historical volatility of the Company’s common stock over the contractual term of the option and implied volatility for traded options of the Company’s stock.
Expected term
The expected term was derived from the binomial lattice model from the impact of events that trigger exercises over time.
The weighted-average grant-date fair value of stock options granted was $14.89 in 2024, $17.76 in 2023, and $21.39 in 2022.
The total intrinsic value of stock options exercised was $4,626,000 in 2024, $6,227,000 in 2023, and $8,424,000 in 2022. The total fair value of stock options vested was $29,309,000 in 2024, $34,751,000 in 2023, and $41,497,000 in 2022.
Restricted Stock Units (RSUs)
The following table summarizes the Company's RSUs activity:
| | | | | | | | | | | |
| Shares
(in thousands) | | Weighted-Average
Grant Date Fair Value |
| Nonvested as of December 31, 2023 | 1,429 | | | $ | 54.22 | |
| Granted | 844 | | | 38.90 | |
| Vested | (429) | | | 64.07 | |
| Forfeited or expired | (154) | | | 46.61 | |
| Nonvested as of December 31, 2024 | 1,690 | | | $ | 44.75 | |
The fair value of RSUs was determined based on the observable market price of the Company's stock on the grant date less the present value of expected future dividends. The weighted-average grant-date fair value of RSUs granted was $38.90 in 2024, $46.14 in 2023, and $58.06 in 2022. There were 429,000, 521,000, and 192,000 RSUs that vested in 2024, 2023, and 2022, respectively.
Tax obligations for vested RSUs are settled by withholding a portion of the shares prior to distribution to the shareholder. The total cash used by the Company to fund the tax payments was $5,017,000 in 2024, $7,836,000 in 2023, and $2,406,000 in 2022. In connection with these vested RSUs, the tax benefit (expense) realized by the Company was $(7,401,000) in 2024, $(3,229,000) in 2023, and $(1,049,000) in 2022.
COGNEX CORPORATION - NOTES TO CONSOLIDATED FINANCIAL STATEMENTS
Performance Restricted Stock Units (PRSUs)
The following table summarizes the Company's PRSUs activity:
| | | | | | | | | | | |
| Shares
(in thousands) | | Weighted-Average
Grant Date Fair Value |
| Nonvested as of December 31, 2023 | 79 | | | $ | 52.23 | |
| Granted | 55 | | | 39.05 | |
| Vested | — | | | — | |
| Forfeited or expired | — | | | — | |
| Nonvested as of December 31, 2024 | 134 | | | $ | 46.82 | |
The fair value of PRSUs was calculated using a Monte Carlo simulation model to estimate the probability of satisfying the service and market conditions stipulated in the award grant. The weighted average grant-date fair value of PRSUs granted was $39.05 in 2024, $44.86 in 2023, and $62.49 in 2022. No PRSUs vested in 2024, 2023, and 2022.
Stock-Based Compensation Expense
The Company stratifies its employee population into three groups: one consisting of the CEO, another consisting of senior management, and another consisting of all other employees. The Company currently applies an estimated annual forfeiture rate of 0% to all stock-based awards for the CEO, 8% to all stock-based awards for senior management, and 13% for all other employees. Each year during the first quarter, the Company revises its forfeiture rate based on updated estimates of employee turnover. This resulted in a decrease to compensation expense of $1,832,000 in 2024, a decrease to compensation expense of $234,000 in 2023, and an increase to compensation expense of $1,536,000 in 2022.
As of December 31, 2024, total unrecognized compensation expense, net of estimated forfeitures, related to non-vested stock-based awards, including stock options, RSUs, and PRSUs, was $51,147,000, which is expected to be recognized over a weighted-average period of 1.5 years.
The total stock-based compensation expense and the related income tax benefit recognized was $52,443,000 and $8,387,000, respectively, in 2024, $54,768,000 and $8,442,000, respectively, in 2023, and $54,505,000 and $9,540,000, respectively, in 2022. No compensation expense was capitalized in 2024, 2023, or 2022.
The following table presents the stock-based compensation expense by caption for each period presented on the Consolidated Statements of Operations (in thousands):
| | | | | | | | | | | | | | | | | |
| | Year Ended December 31, |
| | 2024 | | 2023 | | 2022 |
| Cost of revenue | $ | 1,966 | | | $ | 1,979 | | | $ | 2,016 | |
| Research, development, and engineering | 14,628 | | | 16,480 | | | 17,693 | |
| Selling, general, and administrative | 35,849 | | | 36,309 | | | 34,796 | |
| | | | | |
| $ | 52,443 | | | $ | 54,768 | | | $ | 54,505 | |
NOTE 17: Employee Savings Plan
Under the Company's Employee Savings Plan, a defined contribution plan, all U.S. employees who have attained age 21 may contribute up to 100% of their pay on a pre-tax basis under the Company's Employee Savings Plan, subject to the annual dollar limitations established by the Internal Revenue Service ("IRS"). The Company matches 50% of the first 6% of pay an employee contributes. Company contributions vest 25%, 50%, 75%, and 100% after one, two, three, and four years of continuous employment with the Company, respectively. Company contributions totaled $3,535,000 in 2024, $3,392,000 in 2023, and $3,284,000 in 2022. Cognex stock is not an investment alternative and Company contributions are not made in the form of Cognex stock.
NOTE 18: Income Taxes
Domestic income before taxes was $35,253,000 in 2024, $16,039,000 in 2023, and $48,546,000 in 2022. Foreign income before taxes was $96,236,000 in 2024, $119,309,000 in 2023, and $202,149,000 in 2022.
COGNEX CORPORATION - NOTES TO CONSOLIDATED FINANCIAL STATEMENTS
Income tax expense consisted of the following (in thousands):
| | | | | | | | | | | | | | | | | |
| | Year Ended December 31, |
| | 2024 | | 2023 | | 2022 |
| Current: | |
| Federal | $ | 28,009 | | | $ | 29,084 | | | $ | 48,355 | |
| State | 4,524 | | | 3,544 | | | 5,689 | |
| Foreign | 12,795 | | | 9,207 | | | 10,243 | |
| 45,328 | | | 41,835 | | | 64,287 | |
| Deferred: | | | | | |
| Federal | (22,273) | | | (24,731) | | | (40,772) | |
| State | (1,324) | | | (5,877) | | | (8,354) | |
| Foreign | 3,587 | | | 10,887 | | | 20,009 | |
| (20,010) | | | (19,721) | | | (29,117) | |
| $ | 25,318 | | | $ | 22,114 | | | $ | 35,170 | |
A reconciliation of the U.S. federal statutory corporate tax rate to the Company’s income tax expense, or effective tax rate, was as follows:
| | | | | | | | | | | | | | | | | |
| | Year Ended December 31, |
| | 2024 | | 2023 | | 2022 |
| Income tax expense at U.S. federal statutory corporate tax rate | 21 | % | | 21 | % | | 21 | % |
| State income taxes, net of federal benefit | 2 | | | 1 | | | 2 | |
| Foreign tax rate differential | (4) | | | (6) | | | (7) | |
| Tax credits | (3) | | | (3) | | | (1) | |
| Taxation on multinational operations | (5) | | | (3) | | | — | |
| Tax reserves | 1 | | | 3 | | | 1 | |
| Limitation on deduction for executive compensation | 1 | | | 2 | | | 1 | |
| Discrete tax expense related to employee stock-based compensation | 2 | | | 1 | | | — | |
| Discrete tax benefit for audit settlements | 1 | | | — | | | (1) | |
| Discrete tax expense for foreign earnings not indefinitely reinvested | 1 | | | — | | | — | |
| Discrete tax expense related to tax return filings | — | | | 2 | | | 2 | |
| Discrete tax expense related to rate revaluation on state tax assets | — | | | 2 | | | (2) | |
| Discrete tax benefit related to GILTI adjustments | — | | | (2) | | | (3) | |
| | | | | |
| | | | | |
| Discrete tax benefit for release of valuation allowance | — | | | (4) | | | (1) | |
| | | | | |
| | | | | |
| Other | 2 | | | 2 | | | 2 | |
| Income tax expense | 19 | % | | 16 | % | | 14 | % |
COGNEX CORPORATION - NOTES TO CONSOLIDATED FINANCIAL STATEMENTS
Tax Reserves
The changes in gross amounts of unrecognized tax benefits, excluding interest and penalties, were as follows (in thousands):
| | | | | |
| Balance of reserve for income taxes as of December 31, 2021 | $ | 13,812 | |
| Reductions as a result of tax positions taken in prior periods | (119) | |
| Additions as a result of tax positions taken in prior periods | 2,850 | |
| Additions as a result of tax positions taken in the current period | 505 | |
| Reductions relating to settlements with taxing authorities | (2,329) | |
| Reductions as a result of the expiration of the applicable statutes of limitations | (1,072) | |
| Balance of reserve for income taxes as of December 31, 2022 | 13,647 | |
| Reductions as a result of tax positions taken in prior periods | (242) | |
| Additions as a result of tax positions taken in prior periods | 12,556 | |
| Additions as a result of tax positions taken in the current period | 1,877 | |
| Reductions relating to settlements with taxing authorities | (1,230) | |
| Reductions as a result of the expiration of the applicable statutes of limitations | (894) | |
| Balance of reserve for income taxes as of December 31, 2023 | 25,714 | |
| Reductions as a result of tax positions taken in prior periods | (39) | |
| Additions as a result of tax positions taken in prior periods | 208 | |
| Additions as a result of tax positions taken in the current period | 1,935 | |
| Reductions relating to settlements with taxing authorities | (2,751) | |
| Reductions as a result of the expiration of the applicable statutes of limitations | (1,331) | |
| Balance of reserve for income taxes as of December 31, 2024 | $ | 23,736 | |
The Company’s reserve for income taxes, including gross interest and penalties, was $28,733,000 as of December 31, 2024, of which $26,365,000 was classified as a non-current liability and $2,368,000 was classified as an offset to deferred tax assets. The Company's reserve for income taxes, including gross interest and penalties, was $29,053,000 as of December 31, 2023, of which $26,685,000 was classified as a non-current liability and $2,368,000 was classified as an offset to deferred tax assets. The amount of gross interest and penalties included in these balances was $4,997,000 and $3,339,000 as of December 31, 2024 and 2023, respectively. If the Company’s tax positions were sustained or the statutes of limitations related to certain positions expired, these reserves would be released and income tax expense would be reduced in a future period. As a result of the expiration of certain statutes of limitations, there is a potential that a portion of these reserves could be released, which would decrease income tax expense by approximately $2,000,000 to $4,000,000 over the next twelve months.
The Company has defined its major tax jurisdictions as the United States, Ireland, China, Japan, and Korea and within the United States, Massachusetts. The statutory tax rate is 12.5% in Ireland, 25% in China, 34.6% in Japan, and 21% in Korea, compared to the U.S. federal statutory corporate tax rate of 21%. These differences resulted in a favorable impact to the effective tax rate of 4 percentage points for 2024, 6 percentage points for 2023, and 7 percentage points for 2022. Management has determined that earnings from its legal entities in China will be indefinitely reinvested to provide local funding for growth, and that earnings from all other jurisdictions will not be indefinitely reinvested. In 2024, the Company recorded a non-current deferred tax liability of $1,400,000 with respect to earnings that are not indefinitely reinvested. In 2023, the Company qualified for a tax holiday in China, which is renewed every three years. The tax effect of this benefit on basic and diluted earnings per share for 2024 was not material.
Within the United States, the tax years 2020 through 2023 remain open to examination by the Internal Revenue Service ("IRS") and various state taxing authorities. The tax years 2013 through 2023 remain open to examination by various taxing authorities in foreign jurisdictions in which the Company operates. Management believes the Company is adequately reserved for these audits. The final determination of tax audits could result in favorable or unfavorable changes in our estimates. Any reserves associated with this audit period will not be released until the issue is settled or the audit is concluded.
Interest and penalties included in income tax expense were $2,145,000 in 2024, $1,032,000 in 2023, and $229,000 in 2022.
COGNEX CORPORATION - NOTES TO CONSOLIDATED FINANCIAL STATEMENTS
Cash paid for income taxes totaled $59,849,000 in 2024, $56,618,000 in 2023, and $57,016,000 in 2022.
Deferred Tax Assets and Liabilities
The tax effects of temporary differences and attributes that give rise to deferred income tax assets and liabilities as of December 31, 2024 and December 31, 2023 were as follows (in thousands):
| | | | | | | | | | | |
| December 31, |
| | 2024 | | 2023 |
| Deferred tax assets: | | | |
| Intangible asset in connection with change in tax structure | $ | 369,474 | | | $ | 375,360 | |
| Capitalization of R&D expenses | 35,948 | | | 28,521 | |
| Stock-based compensation expense | 22,428 | | | 20,916 | |
| Tax credit carryforwards | 10,186 | | | 7,848 | |
| Inventory and revenue related | 8,355 | | | 10,897 | |
| Bonuses, commissions, and other compensation | 6,949 | | | 6,243 | |
| Depreciation | 2,877 | | | 1,840 | |
| Foreign net operating losses | 1,306 | | | 339 | |
| Other | 4,624 | | | 5,514 | |
| Total deferred tax assets | 462,147 | | | 457,478 | |
| Valuation allowance | (2,515) | | | (943) | |
| $ | 459,632 | | | $ | 456,535 | |
| | | |
| Deferred tax liabilities: | | | |
| GILTI tax basis differences in connection with change in tax structure | $ | (254,213) | | | $ | (274,327) | |
| Amortization | (29,008) | | | (28,685) | |
| Reserve for unremitted foreign earnings | (1,400) | | | — | |
| $ | (284,621) | | | $ | (303,012) | |
| | | |
| Net deferred taxes | $ | 175,011 | | | $ | 153,523 | |
Change in Tax Structure and Global Intangible Low-Taxed Income Tax
In 2019, the Company made changes to its international tax structure due to legislation by the European Union regarding low tax structures that resulted in an intercompany sale of intellectual property. As a result, the Company recorded an associated deferred tax asset of $437,500,000 in Ireland based on the fair value of the intellectual property that is being realized over fifteen years as future tax deductions. From a United States perspective, the sale was disregarded, and any future deductions claimed in Ireland are added back to taxable income as part of Global Intangible Low-Taxed Income ("GILTI") minimum tax. The Company recorded an associated deferred tax liability of $350,000,000, representing the GILTI minimum tax related to the fair value of the intellectual property.
Other Deferred Tax Assets and Liabilities
Beginning in 2022, the Tax Cuts and Jobs Act eliminates the option to deduct research and development expenditures in the period incurred and requires taxpayers to capitalize and amortize such expenditures over five or fifteen years, as applicable, pursuant to Section 174 of the Internal Revenue Code. Accordingly, the Company recorded deferred tax assets resulting from the capitalization of research and development expenditures.
As of December 31, 2024, the Company had foreign net operating loss carryforwards of $1,306,000, state tax credit carryforwards of $7,619,000 that will begin to expire for the 2031 tax return, and foreign tax credit carryforwards of $2,567,000. As of December 31, 2023, the Company had foreign net operating loss carryforwards of $1,720,000, state tax credit carryforwards of $8,740,000, and foreign tax credit carryforwards of $943,000.
As of December 31, 2024, the Company had a valuation allowance for foreign net operation loss carryforwards of $599,000 and a valuation allowance for foreign tax credits of $1,916,000 that were not considered to be realized. As of December 31, 2023, the Company had a valuation allowance for foreign tax credits of $943,000 that was not considered to be realized. Should these credits be utilized in a future period, the reserve associated with these
COGNEX CORPORATION - NOTES TO CONSOLIDATED FINANCIAL STATEMENTS
credits would be reversed in the period when it is determined that the credits can be utilized to offset future income tax liabilities.
While the deferred tax assets, net of valuation allowance, are not assured of realization, management has evaluated the realizability of these deferred tax as sets and has determined that it is more likely than not that these assets will be realized. In reaching this conclusion, we have evaluated certain relevant criteria including the Company’s historical profitability, current projections of future profitability, and the lives of tax credits, net operating losses, and other carryforwards. Should the Company fail to generate sufficient pre-tax profits in future periods, we may be required to establish valuation allowances against these deferred tax assets, resulting in a charge to current operations in the period of determination.
NOTE 19: Weighted Average Shares
Weighted-average shares were calculated as follows (in thousands):
| | | | | | | | | | | | | | | | | |
| | Year Ended December 31, |
| 2024 | | 2023 | | 2022 |
| Basic weighted-average common shares outstanding | 171,438 | | | 172,249 | | | 173,407 | |
| Effect of dilutive stock awards | 1,173 | | | 1,150 | | | 1,462 | |
| Diluted weighted-average common and common-equivalent shares outstanding | 172,611 | | | 173,399 | | | 174,869 | |
Stock options to purchase 8,496,599, 6,854,092, and 4,715,104 shares of common stock, on a weighted-average basis, were outstanding in 2024, 2023, and 2022, respectively, but were not included in the calculation of dilutive net income per share because they were anti-dilutive. Restricted stock units totaling 365 and 26,079 that will be settled in shares of common stock to the extent they vest, on a weighted-average basis, were outstanding in 2023 and 2022, respectively, but were not included in the calculation of dilutive net income per share because they were anti-dilutive. No restricted stock units were excluded in the calculation of dilutive net income per share in 2024. No PRSUs were excluded in the calculation of dilutive net income per share in 2024, 2023, and 2022 as PRSUs were not anti-dilutive on a weighted-average basis.
NOTE 20: Segment and Geographic Information
The Company operates in one segment, machine vision technology. The Company has a single, company-wide management team that administers operations as a whole rather than as discrete operating segments. The Company’s chief operating decision maker is the chief executive officer, who assesses performance and allocates resources at the corporate level, as compared to the geography, product line, or end market levels. The Company offers a variety of machine vision products that have similar economic characteristics and are distributed by the same sales channels to the same types of customers.
The following table summarizes information about geographic areas (in thousands):
| | | | | | | | | | | | | | | | | | | | | | | | | | | | | |
| United States | | Europe | | Greater China | | Other | | Total |
| Year Ended December 31, 2024 | | | | | | | | | |
| Revenue | $ | 306,766 | | | $ | 217,880 | | | $ | 164,147 | | | $ | 225,722 | | | $ | 914,515 | |
| Long-lived assets | 56,948 | | | 15,655 | | | 14,844 | | | 16,025 | | | $ | 103,472 | |
| Year Ended December 31, 2023 | | | | | | | | | |
| Revenue | $ | 288,324 | | | $ | 220,665 | | | $ | 164,115 | | | $ | 164,443 | | | $ | 837,547 | |
| Long-lived assets | 62,946 | | | 17,005 | | | 17,028 | | | 15,958 | | | $ | 112,937 | |
| Year Ended December 31, 2022 | | | | | | | | | |
| Revenue | $ | 343,835 | | | $ | 234,643 | | | $ | 227,447 | | | $ | 200,165 | | | $ | 1,006,090 | |
| Long-lived assets | 66,928 | | | 14,725 | | | 1,334 | | | 3,370 | | | $ | 86,357 | |
Revenue is presented geographically based on the customer’s country of domicile.
Revenue from a single customer accounted for 10% and 11% of total revenue in 2024 and 2022, respectively. Revenue from this customer was not greater than 10% of total revenue in 2023. Accounts receivable from this customer was 10% of total accounts receivable as of December 31, 2024 and was not greater than 10% of total accounts receivable as of December 31, 2023.
COGNEX CORPORATION - NOTES TO CONSOLIDATED FINANCIAL STATEMENTS
Revenue from a second customer accounted for 11% of total revenue in 2022. Revenue from this customer was not greater than 10% of total revenue in 2024 or 2023. Accounts receivable from this customer was not greater than 10% of total accounts receivable as of December 31, 2024 or December 31, 2023.
The measure of segment profit or loss for the Company's single segment is net income. Segment expenses were disaggregated based on the information the chief operating decision maker uses to assess performance and allocate resources considering both quantitative and qualitative factors. The following table summarizes significant segment expenses, which represents the difference between segment revenue and segment net income, (in thousands):
| | | | | | | | | | | | | | | | | |
| Year Ended December 31, |
| 2024 | | 2023 | | 2022 |
| Revenue | $ | 914,515 | | | $ | 837,547 | | | $ | 1,006,090 | |
| Less: | | | | | |
| Cost of revenue (1) | 288,721 | | | 236,306 | | | 284,185 | |
| Gross profit | 625,794 | | | 601,241 | | | 721,905 | |
| Less: | | | | | |
| Research, development, and engineering expenses | | | | | |
| Salaries and fringe benefits | 79,544 | | | 78,762 | | | 76,448 | |
| Incentive compensation (2) | 4,711 | | | 1,446 | | | 3,447 | |
| Stock-based compensation | 14,628 | | | 16,480 | | | 17,693 | |
| Depreciation and amortization | 3,229 | | | 3,056 | | | 2,649 | |
| Other segment expenses (3) | 37,703 | | | 39,656 | | | 40,896 | |
| Total research, development, and engineering expenses | 139,815 | | | 139,400 | | | 141,133 | |
| Selling, general, and administrative expenses | | | | | |
| Salaries and fringe benefits | 179,898 | | | 166,612 | | | 150,696 | |
| Incentive compensation (2) | 45,565 | | | 35,513 | | | 40,716 | |
| Stock-based compensation | 35,849 | | | 36,309 | | | 34,796 | |
| Depreciation and amortization | 16,936 | | | 11,759 | | | 10,702 | |
| Other segment expenses (3) | 92,666 | | | 88,946 | | | 75,197 | |
| Total selling, general, and administrative expenses | 370,914 | | | 339,139 | | | 312,107 | |
| Loss (recovery) from fire | — | | | (8,000) | | | 20,779 | |
| Restructuring charges | — | | | — | | | 1,657 | |
| Operating income | 115,065 | | | 130,702 | | | 246,229 | |
| Foreign currency gain (loss) | 1,531 | | | (10,039) | | | (1,837) | |
| Investment income | 13,971 | | | 14,093 | | | 6,715 | |
| Other income (expense) | 922 | | | 592 | | | (412) | |
| Income before income tax expense | 131,489 | | | 135,348 | | | 250,695 | |
| Income tax expense | 25,318 | | | 22,114 | | | 35,170 | |
| Net income | $ | 106,171 | | | $ | 113,234 | | | $ | 215,525 | |
(1) Cost of revenue includes depreciation and amortization expense (including amortization of acquired technologies) of $12,524,000, $7,065,000, and $6,270,000 for 2024, 2023, and 2022, respectively.
(2) Incentive compensation includes company bonus and sales commissions.
(3) Other segment expenses include outside services, prototyping materials, sales demonstration equipment, travel and entertainment, marketing programs, and rent, among other less significant expenses.
COGNEX CORPORATION - NOTES TO CONSOLIDATED FINANCIAL STATEMENTS
NOTE 21: Business Combinations
Moritex Corporation
On October 18, 2023, the Company acquired all the outstanding shares of Moritex Corporation ("Moritex"), a global provider of premium optical components based in Japan, for an enterprise value of ¥40 billion Japanese Yen, or approximately $270 million U.S. Dollars based on the closing date foreign exchange rate.
The cash-free, debt-free enterprise value was adjusted by cash acquired, debt assumed, and final working capital balances to arrive at total consideration to be allocated to assets acquired and liabilities assumed of ¥44,376,245,000 ($296,138,000 based on the closing date foreign exchange rate), of which ¥44,227,414,000 ($295,144,000) was paid in cash on the closing date and ¥148,831,000 ($994,000) was paid during the first quarter of 2024 as a purchase price adjustment based on the closing balance sheet. The Company acquired cash balances totaling $38,088,000 as part of this transaction, to arrive at a net cash outflow of $257,056,000 on the closing date. There was no contingent consideration as part of this transaction.
In the fourth quarter of 2024, the Company recorded measurement-period adjustments that increased goodwill by $6,478,000 and are reflected in the final purchase price allocation below. The adjustments consisted primarily of changes to deferred income tax liabilities based on the final push-down accounting for intangible assets to legal-entity jurisdictions, a reduction in customer relationships based on a methodology refinement, and changes to provisional assets and liabilities based on new information obtained within the one-year measurement period that refined initial estimates.
The portfolio of Moritex optical components allows us to expand our served market to include high-end lenses and lighting and provide our customers with a more complete product offering by replacing third-party components with Cognex-manufactured optical components. Moritex also provides the Company with a more substantial presence in Japan, which is an important machine vision market where we believe we can increase our share through a stronger local presence.
This transaction was accounted for as a business combination. Identifiable assets acquired and liabilities assumed were recorded at their estimated fair values as of the acquisition date, which were valued using level 3 inputs for intangible assets, inventories, and property, plant and equipment. Pro-forma information, as well as revenue and earnings from the date of the acquisition, are not presented because they are not material to the Company’s consolidated financial statements. Transaction costs were approximately $5,800,000 and were expensed as incurred as part of SG&A expenses on the Consolidated Statement of Operations.
COGNEX CORPORATION - NOTES TO CONSOLIDATED FINANCIAL STATEMENTS
The purchase price was allocated as follows (in thousands):
| | | | | |
| Cash and cash equivalents | $ | 38,088 | |
| Accounts receivable | 11,543 | |
| Inventories | 21,882 | |
| Property, plant and equipment | 19,805 | |
| Goodwill | 151,525 | |
| Customer relationships | 64,800 | |
| Completed technologies | 32,300 | |
| Trademarks | 850 | |
| Deferred income tax assets | 4,162 | |
| Other assets | 3,363 | |
| Accounts payable | (6,639) | |
| Accrued expenses | (14,718) | |
| Deferred income tax liabilities | (22,665) | |
| Reserve for income taxes | (5,864) | |
| Other liabilities | (2,294) | |
| Purchase price | $ | 296,138 | |
The customer relationships, completed technologies, and trademarks are included in "Intangible assets" on the Consolidated Balance Sheet. The customer relationships are being amortized to SG&A expenses over fifteen years, the completed technologies are being amortized to cost of revenue over nine years, and the trademarks are being amortized to SG&A expenses over three years. None of the acquired goodwill is deductible for tax purposes.
NOTE 22: Loss (Recovery) from Fire
On June 7, 2022, the Company’s primary contract manufacturer experienced a fire at its plant in Indonesia, destroying a significant amount of Cognex inventories.
In 2022, the Company recorded a net loss related to the fire of $20,779,000, consisting primarily of losses of inventories and other assets of $48,339,000, partially offset by insurance proceeds received from the Company's insurance carrier of $27,560,000. In 2023, the Company recorded recoveries related to the fire of $8,000,000, consisting of $2,500,000 for proceeds received from the Company's insurance carrier in relation to a business interruption claim and $5,500,000 for proceeds received as part of a financial settlement for lost inventory and other losses incurred as a result of the fire.
NOTE 23: Subsequent Events
On February 12, 2025, the Company's Board of Directors declared a cash dividend of $0.080 per share. The dividend is payable March 13, 2025 to all shareholders of record as of the close of business on February 27, 2025.
COGNEX CORPORATION – SCHEDULE II – VALUATION AND QUALIFYING ACCOUNTS
| | | | | | | | | | | | | | | | | | | | | | | | | | | | | | | | | | | | | | |
| | | | | Additions | | | | | | |
| Description | | Balance at
Beginning
of Period | | Charged to
Costs and
Expenses | | Charged
to Other
Accounts | | Deductions | | Other | | Balance at
End of
Period |
| | (In thousands) |
| Allowance for Credit Losses on Accounts Receivable: | | | | | | | | | | | | |
| 2024 | | $ | 583 | | | $ | 459 | | | $ | — | | | $ | (222) | | (1) | $ | 7 | | (2) | $ | 827 | |
| 2023 | | $ | 730 | | | $ | 500 | | | $ | — | | | $ | (645) | | (1) | $ | (2) | | (2) | $ | 583 | |
| 2022 | | $ | 776 | | | $ | 191 | | | $ | — | | | $ | (237) | | (1) | $ | — | | (2) | $ | 730 | |
| Reserve for Sales Returns: | | | | | | | | | | | | |
| 2024 | | $ | 2,018 | | | $ | 500 | | | $ | — | | | $ | — | | (1) | $ | — | | (2) | $ | 2,518 | |
| 2023 | | $ | 1,518 | | | $ | 500 | | | $ | — | | | $ | — | | (1) | $ | — | | (2) | $ | 2,018 | |
| 2022 | | $ | 1,518 | | | $ | — | | | $ | — | | | $ | — | | (1) | $ | — | | (2) | $ | 1,518 | |
| Deferred Tax Valuation Allowance: | | | | | | | | | | | | |
| 2024 | | $ | 943 | | | $ | 1,572 | | | $ | — | | | $ | — | | | $ | — | | | $ | 2,515 | |
| 2023 | | $ | 7,661 | | | $ | — | | | $ | — | | | $ | (6,718) | | | $ | — | | | $ | 943 | |
| 2022 | | $ | 8,188 | | | $ | 2,234 | | | $ | 3,889 | | | $ | (6,650) | | | $ | — | | | $ | 7,661 | |
(1)Specific write-offs
(2)Foreign currency exchange rate changes
ITEM 9: CHANGES IN AND DISAGREEMENTS WITH ACCOUNTANTS ON ACCOUNTING AND FINANCIAL DISCLOSURE
There were no disagreements with accountants on accounting or financial disclosure during 2024 or 2023.
ITEM 9A: CONTROLS AND PROCEDURES
Disclosure Controls and Procedures
As required by Rules 13a-15 and 15d-15 of the Exchange Act, the Company has evaluated, with the participation of management, including the Chief Executive Officer and the Chief Financial Officer, the effectiveness of its disclosure controls and procedures (as defined in such rules) as of the end of the period covered by this report. Based on such evaluation, the Chief Executive Officer and Chief Financial Officer concluded that such disclosure controls and procedures were effective as of that date.
Management’s Report on Internal Control over Financial Reporting
Management is responsible for establishing and maintaining adequate internal control over financial reporting. Management has evaluated the effectiveness of the Company’s internal control over financial reporting based on the framework in Internal Control – Integrated Framework issued in 2013 by the Committee of Sponsoring Organizations of the Treadway Commission (COSO).
Based on our evaluation, management has concluded that the Company’s internal control over financial reporting was effective as of December 31, 2024.
Attestation Report of the Registered Public Accounting Firm on Internal Control over Financial Reporting
The Company’s internal control over financial reporting as of December 31, 2024 has been audited by Grant Thornton LLP, an independent registered public accounting firm, as stated in their report which is included herein.
Changes in Internal Control over Financial Reporting
There have been no changes in the Company's internal control over financial reporting that occurred during the fourth quarter of the year ended December 31, 2024 that have materially affected, or are reasonably likely to materially affect, the Company’s internal control over financial reporting. The Company continues to review its disclosure controls and procedures, including its internal control over financial reporting, and may from time to time make changes aimed at enhancing their effectiveness and to ensure that the Company’s systems evolve with its business.
REPORT OF INDEPENDENT REGISTERED PUBLIC ACCOUNTING FIRM
Board of Directors and Shareholders
Cognex Corporation
Opinion on internal control over financial reporting
We have audited the internal control over financial reporting of Cognex Corporation (a Massachusetts corporation) and subsidiaries (the “Company”) as of December 31, 2024, based on criteria established in the 2013 Internal Control—Integrated Framework issued by the Committee of Sponsoring Organizations of the Treadway Commission (“COSO”). In our opinion, the Company maintained, in all material respects, effective internal control over financial reporting as of December 31, 2024, based on criteria established in the 2013 Internal Control—Integrated Framework issued by COSO.
We also have audited, in accordance with the standards of the Public Company Accounting Oversight Board (United States) (“PCAOB”), the consolidated financial statements of the Company as of and for the year ended December 31, 2024, and our report dated February 13, 2025 expressed an unqualified opinion on those financial statements.
Basis for opinion
The Company’s management is responsible for maintaining effective internal control over financial reporting and for its assessment of the effectiveness of internal control over financial reporting, included in the accompanying Management’s Report on Internal Control Over Financial Reporting ("Management's Report"). Our responsibility is to express an opinion on the Company’s internal control over financial reporting based on our audit. We are a public accounting firm registered with the PCAOB and are required to be independent with respect to the Company in accordance with the U.S. federal securities laws and the applicable rules and regulations of the Securities and Exchange Commission and the PCAOB.
We conducted our audit in accordance with the standards of the PCAOB. Those standards require that we plan and perform the audit to obtain reasonable assurance about whether effective internal control over financial reporting was maintained in all material respects. Our audit included obtaining an understanding of internal control over financial reporting, assessing the risk that a material weakness exists, testing and evaluating the design and operating effectiveness of internal control based on the assessed risk, and performing such other procedures as we considered necessary in the circumstances. We believe that our audit provides a reasonable basis for our opinion.
Definition and limitations of internal control over financial reporting
A company’s internal control over financial reporting is a process designed to provide reasonable assurance regarding the reliability of financial reporting and the preparation of financial statements for external purposes in accordance with generally accepted accounting principles. A company’s internal control over financial reporting includes those policies and procedures that (1) pertain to the maintenance of records that, in reasonable detail, accurately and fairly reflect the transactions and dispositions of the assets of the company; (2) provide reasonable assurance that transactions are recorded as necessary to permit preparation of financial statements in accordance with generally accepted accounting principles, and that receipts and expenditures of the company are being made only in accordance with authorizations of management and directors of the company; and (3) provide reasonable assurance regarding prevention or timely detection of unauthorized acquisition, use, or disposition of the company’s assets that could have a material effect on the financial statements.
Because of its inherent limitations, internal control over financial reporting may not prevent or detect misstatements. Also, projections of any evaluation of effectiveness to future periods are subject to the risk that controls may become inadequate because of changes in conditions, or that the degree of compliance with the policies or procedures may deteriorate.
/s/ GRANT THORNTON LLP
Boston, Massachusetts
February 13, 2025
ITEM 9B: OTHER INFORMATION
During the quarter ended December 31, 2024, the following Section 16 officer adopted a Rule 10b5-1 trading arrangement, as defined in Item 408 of Regulation S-K, that is intended to satisfy the affirmative defense conditions of Exchange Act Rule 10b5-1(c):
•On December 10, 2024, Joerg Kuechen, the Chief Technology Officer of the Company, adopted a trading arrangement for the sale of shares of the Company’s common stock (a “Rule 10b5-1 Trading Plan”). Mr. Kuechen’s Rule 10b5-1 Trading Plan, which has a term ending on December 10, 2025, provides for the exercise of vested stock options to acquire up to 265,732 shares of common stock and the sale of up to 277,342 shares of common stock pursuant to the terms of such Rule 10b5-1 Trading Plan.
During the quarter ended December 31, 2024, no 10b5-1 trading arrangements were modified or terminated, and no director or officer of the Company adopted or terminated a “non-Rule 10b5-1 trading arrangement,” as defined in Item 408 of Regulation S-K.
ITEM 9C: DISCLOSURE REGARDING FOREIGN JURISDICTIONS THAT PREVENT INSPECTIONS
Not Applicable
PART III
ITEM 10: DIRECTORS, EXECUTIVE OFFICERS, AND CORPORATE GOVERNANCE
Information with respect to Directors and Executive Officers of the Company and the other matters required by Item 10 shall be included in the Company’s definitive Proxy Statement for the Annual Meeting of Shareholders to be held on April 30, 2025 and is incorporated herein by reference.
The Company has adopted a Code of Business Conduct and Ethics covering all employees, which is available, free of charge, on the Company’s website, www.cognex.com under "Company-Investor Information-Governance Documents". The Company intends to disclose on its website any amendments to or waivers of the Code of Business Conduct and Ethics on behalf of the Company’s directors and executive officers that would otherwise be required to be disclosed under the rules of the SEC or The NASDAQ Stock Market LLC.
With respect to Item 408(b) of Regulation S-K, the Company has an insider trading policy governing the purchase, sale and other dispositions of the Company’s securities that applies to the Company's personnel, including its officers, directors, employees of the Company and its subsidiaries, and other covered persons. The Company believes that its insider trading policy is reasonably designed to promote compliance with insider trading laws, rules and regulations, and listing standards applicable to the Company. A copy of the Company’s insider trading policy is filed as Exhibit 19 to this Form 10-K.
ITEM 11: EXECUTIVE COMPENSATION
Information with respect to executive compensation and the other matters required by Item 11 shall be included in the Company’s definitive Proxy Statement for the Annual Meeting of Shareholders to be held on April 30, 2025 and is incorporated herein by reference.
ITEM 12: SECURITY OWNERSHIP OF CERTAIN BENEFICIAL OWNERS AND MANAGEMENT AND RELATED STOCKHOLDER MATTERS
Information with respect to security ownership and the other matters required by Item 12 shall be included in the Company’s definitive Proxy Statement for the Annual Meeting of Shareholders to be held on April 30, 2025 and is incorporated herein by reference.
The following table provides information as of December 31, 2024 regarding shares of common stock that may be issued under the Company’s existing equity compensation plans:
| | | | | | | | | | | | | | | | | | | | |
| Plan Category | Number of securities to be
issued upon exercise of
outstanding options, warrants and rights, and vesting of restricted stock units | | Weighted-average exercise
price of outstanding options, restricted stock units, warrants, and rights | | Number of securities
remaining available for future
issuance under equity
compensation plans
(excluding securities reflected
in column (a)) | |
| | (a) | | | | | |
| Equity compensation plans approved by shareholders (3) | 11,366,000 | | (1) | $ | 49.03 | | | 6,458,000 | | (2) |
| Equity compensation plans not approved by shareholders (3) | — | | | — | | | — | | |
| 11,366,000 | | | $ | 51.22 | | | 6,458,000 | | |
(1)Includes shares to be issued upon exercise of outstanding options under the Company’s 2023 Stock Option and Incentive Plan, the 2007 Stock Option and Incentive Plan, and subsequent to shareholder approval, the 2001 General Stock Option Plan, as amended and restated.
(2)Includes shares remaining available for future issuance under the Company’s 2023 Stock Option and Incentive Plan. This amount is subject to adjustment from "Carryover Shares" as defined in Note 16: Stock-Based Compensation.
(3)All references made to share or per share amounts have been adjusted to reflect the two-for-one stock split which occurred in the fourth quarter of 2017.
The 2001 General Stock Option Plan was originally adopted by the Board of Directors in December 2001 without shareholder approval. In December 2011, this plan received shareholder approval for an amendment and restatement of the plan. This plan provided for the granting of nonqualified stock options and incentive stock options to any employee who was actively employed by the Company and was not an officer or director of the Company. The maximum number of shares of common stock that were available for grant under this plan was 38,440,000 shares. All option grants had an exercise price per share that was no less than the fair market value per share of the Company’s common stock on the grant date and had a term that was no longer than ten years from the grant date. 32,544,411 stock options were granted under the 2001 General Stock Option Plan. With shareholder approval of the 2023 Stock Option and Incentive Plan in May 2023, no further shares may be granted from the 2001 General Stock Option Plan.
ITEM 13: CERTAIN RELATIONSHIPS AND RELATED TRANSACTIONS, AND DIRECTOR INDEPENDENCE
Information with respect to certain relationships and related transactions and the other matters required by Item 13 shall be included in the Company’s definitive Proxy Statement for the Annual Meeting of Shareholders to be held on April 30, 2025 and is incorporated herein by reference.
ITEM 14: PRINCIPAL ACCOUNTING FEES AND SERVICES
Information with respect to principal accounting fees and services and the other matters required by Item 14 shall be included in the Company’s definitive Proxy Statement for the Annual Meeting of Shareholders to be held on April 30, 2025 and is incorporated herein by reference.
PART IV
ITEM 15: EXHIBITS AND FINANCIAL STATEMENT SCHEDULES
(1)Financial Statements
The financial statements are included in Part II – Item 8 of this Annual Report on Form 10-K.
(2)Financial Statement Schedule
Financial Statement Schedule II is included in Part II – Item 8 of this Annual Report on Form 10-K.
Other schedules are omitted because of the absence of conditions under which they are required or because the required information is provided in the consolidated financial statements or notes thereto.
(3)Exhibits
The Exhibits filed as part of this Annual Report on Form 10-K are listed in the Exhibit Index, immediately preceding the signature page hereto.
ITEM 16: FORM 10-K SUMMARY
Not applicable
EXHIBIT INDEX
| | | | | | | | |
| EXHIBIT NUMBER | | |
| 3A | | |
| 3B | | |
| 3C | | |
| 3D | | |
| 3E | | |
| 4A | | Specimen Certificate for Shares of Common Stock (incorporated by reference to Exhibit 4 to Cognex's Registration Statement on Form S-1 [Registration No. 33-29020]) |
| 4B | | |
| 10A * | | |
| 10B * | | |
| 10C * | | |
| 10D * | | |
| 10E * | | |
| 10F * | | |
| 10G * | | |
| 10H * | | |
10J *
| | |
| 10K * | | |
| 10L * | | |
| 10M * | | |
| | | | | | | | |
| 10N * | | |
| 10O * | | |
| 10P * | | |
| 10Q * | | |
| 10R * | | |
| 19 | | |
| 21 | | |
| 23.1 | | |
| 31.1 | | |
| 31.2 | | |
| 32.1 | | |
| 32.2 | | |
| 97 | | |
| 101.SCH | | Inline XBRL Taxonomy Extension Schema Document (filed herewith) |
| 101.CAL | | Inline XBRL Taxonomy Extension Calculation Linkbase Document (filed herewith) |
| 101.LAB | | Inline XBRL Taxonomy Extension Label Linkbase Document (filed herewith) |
| 101.PRE | | Inline XBRL Taxonomy Extension Presentation Linkbase Document (filed herewith) |
| 101.DEF | | Inline XBRL Taxonomy Extension Schema Document (filed herewith)
|
| 104 | | Cover Page Interactive Data File (formatted as Inline XBRL with applicable taxonomy extension information contained in Exhibits 101*.) (filed herewith) |
| | * Indicated management contract or compensatory plan or arrangement |
SIGNATURES
Pursuant to the requirements of Section 13 or 15(d) of the Securities Exchange Act of 1934, the registrant has duly caused this report to be signed on its behalf by the undersigned, thereunto duly authorized on the 13th day of February 2025.
| | | | | | | | |
| | COGNEX CORPORATION |
| |
| By: | | /s/ Robert J. Willett |
| | Robert J. Willett |
| | President and Chief Executive Officer |
Pursuant to the requirements of the Securities Exchange Act of 1934, this report has been signed below by the following persons on behalf of the registrant and in the capacities and on the dates indicated.
| | | | | | | | | | | | | | |
| Signature | | Title | | Date |
| | |
| | |
| /s/ Robert J. Willett | | President, Chief Executive Officer, and Director (principal executive officer) | | February 13, 2025 |
| Robert J. Willett | | | |
| | |
| /s/ Dennis Fehr | | Senior Vice President of Finance and Chief Financial Officer (principal financial officer) | | February 13, 2025 |
| Dennis Fehr | | | |
| | | | |
| /s/ Laura MacDonald | | Vice President of Finance and Principal Accounting Officer (principal accounting officer) | | February 13, 2025 |
| Laura MacDonald | | | |
| | | | |
| /s/ Sachin Lawande | | Director | | February 13, 2025 |
| Sachin Lawande | | | |
| | | | |
| /s/ John Lee | | Director | | February 13, 2025 |
| John Lee | | | |
| | |
| /s/ Angelos Papadimitriou | | Director | | February 13, 2025 |
| Angelos Papadimitriou | | | |
| | |
| /s/ Dianne Parrotte | | Director | | February 13, 2025 |
| Dianne Parrotte | | | |
| | |
| /s/ Marjorie Sennett | | Director | | February 13, 2025 |
| Marjorie Sennett | | | |
| | | | |
| /s/ Anthony Sun | | Director | | February 13, 2025 |
| Anthony Sun | | | |
| | |