| UNITED STATES |
| SECURITIES AND EXCHANGE COMMISSION |
| Washington, D.C. 20549 |
FORM N-CSR |
CERTIFIED SHAREHOLDER REPORT OF REGISTERED |
MANAGEMENT INVESTMENT COMPANIES |
| Investment Company Act File Number: 811-5833 |
| T. Rowe Price Institutional International Funds, Inc. |
| (Exact name of registrant as specified in charter) |
| 100 East Pratt Street, Baltimore, MD 21202 |
| (Address of principal executive offices) |
| David Oestreicher |
| 100 East Pratt Street, Baltimore, MD 21202 |
| (Name and address of agent for service) |
| Registrant’s telephone number, including area code: (410) 345-2000 |
| Date of fiscal year end: October 31 |
| Date of reporting period: October 31, 2008 |
Item 1: Report to Shareholders
 |
| Institutional Global Large-Cap Equity Fund | October 31, 2008 |
The views and opinions in this report were current as of October 31, 2008. They are not guarantees of performance or investment results and should not be taken as investment advice. Investment decisions reflect a variety of factors, and the managers reserve the right to change their views about individual stocks, sectors, and the markets at any time. As a result, the views expressed should not be relied upon as a forecast of the fund’s future investment intent. The report is certified under the Sarbanes-Oxley Act, which requires mutual funds and other public companies to affirm that, to the best of their knowledge, the information in their financial reports is fairly and accurately stated in all material respects.
Manager’s Letter
T. Rowe Price Institutional Global Large-Cap Equity Fund
Dear Investor
This is our first report since the fund’s inception on October 27, 2008, and we would like to welcome all shareholders. The inception of the fund would seem to come at an inauspicious time. Stock markets around the globe have been roiled by the credit crisis that has infected financial institutions and filtered down to other businesses. Growth has slowed—in some cases dramatically. Unemployment is up. In the midst of this global slowdown, the immediate future is uncertain. But for long-term investors, this period may represent one of the greatest opportunities in years. Large-cap companies that this fund targets are trading at attractive valuations. Many have clean balance sheets and considerable cash on hand. They have sound business models and expansion plans. To be sure, many of these fine companies have seen their share prices tumble in recent months, as they have been pulled down by a recessionary climate. Our task is to utilize our risk-aware, analytic, and disciplined approach to identify the healthiest companies that are able to withstand the current thrashing and whose business practices will enable them to gain traction as the economy improves. (Please see the Investment Approach section for additional details on our management of the fund.)
| Highlights |
• The fund’s inception was October 27, 2008. Its objective is to seek long-term growth of capital through investments primarily in the stocks of large-cap companies throughout the world, including the U.S.
• The fund employs a diversified global strategy by leveraging the entire T. Rowe Price platform of more than 100 analysts from around the world.
• In the same way that stocks peaked before the economic downturn, they are likely to bottom out before an economic recovery, and we are positioning the portfolio in preparation for that turning point.
• We are buying high-quality growth companies that are trading at highly attractive valuations.
Performance Review
| A Word From Our Chairman |
Dear Shareholder,
The past year has seen a substantial and painful decline in the broad stock and bond markets, both domestically and internationally, and our funds have not been immune to the turmoil. Being an investor in these times can be unsettling because there seem to be few safe havens. Prudent risk-management strategies, such as diversification, may have helped to reduce losses, but they did not avoid them.
At times like these, taking a step back to gain perspective can help. Since Thomas Rowe Price, Jr., founded our company in 1937—in the heart of the Great Depression—the firm has witnessed many market downturns, including the long, slow 1973–1974 bear market, the October 1987 crash, and the bursting of the technology bubble in the early 2000s and the subsequent broad market decline. Although the magnitude and duration of the declines have varied, one thing has held true: The markets have always bounced back.
We also know from experience that emotional responses to financial downturns do not produce good results. Now is the time for investors to remain focused on the fundamentals and to maintain a long-term perspective. That’s what we are doing at T. Rowe Price. Our experienced team of analysts and portfolio managers continually examines our portfolios to make sure each fund’s holdings still make sense in the ever-changing environment. And as painful as market downturns are, the indiscriminate selling that accompanies a panic creates opportunities for investors who can see beyond the fear. We are using our rigorous in-house research to position our portfolios for the next upturn.
As always, we remain focused on serving our shareholders. Managing our clients’ assets is our only business, and our long-term success is tied to our clients’ success. We know this period has been difficult for investors, and we thank you for your confidence in T. Rowe Price.
Sincerely,

Edward C. Bernard
Chairman, T. Rowe Price Mutual Funds
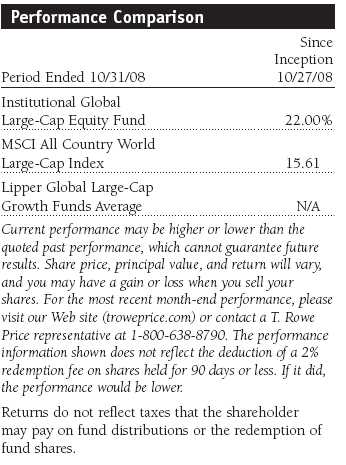
While your fund was in existence for just one week prior to the end of the reporting period, it surpassed the returns of the MSCI All Country World Large-Cap Index. Performance returns for the benchmark Lipper Global Large-Cap Growth Funds Average were not available for this abbreviated period.
Market Review
We want to take this opportunity to inform you about the markets over the past 12 months, with particular emphasis on the last six months. Over the past year, growing defaults in the subprime mortgage market sparked a crisis in the credit markets as financial institutions had taken billions of dollars in toxic assets onto their balance sheets. Consequently, liquidity seized up, and ordinary lending ground to a halt. Last summer, the problems accelerated, and a widespread sell-off infected developed and emerging markets across the globe.
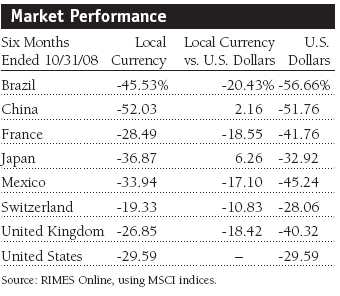
In the U.S., the broad S&P 500 Index declined a breathtaking 29.28% in the last six months and was down 36.10% for the last 12 months. In just six months, the financial crisis has laid waste to iconic investment banks. It has seen the government takeover of housing giants Freddie Mac and Fannie Mae. The U.S. government stepped in to bail out American International Group, the giant insurer, in an attempt to forestall further economic calamity. The Federal Reserve cut the federal funds rate—the overnight lending rate between banks—to just 1%. The government has also made a portion of the $700 billion rescue fund available to financial institutions in an attempt to repair the credit system, save weakened banks, and prime the economic pump. We have seen credit markets improve somewhat since then, although they have a long way to go before returning to what might be described as normal operations. Markets have been volatile, particularly in September and October. But mostly they have been down sharply, and October’s decline in the Dow Jones represented its fifth worst month in history.
The slowdown is evident nearly everywhere. Oil prices that had shot up to spectacular levels just last summer—to more than $140 per barrel—have skidded to below $60. Unemployment has risen steadily and is expected to continue climbing. U.S. gross domestic product declined nearly 0.3% in the third quarter of 2008.
European economic conditions deteriorated as well. The U.K., burdened with a weak housing market and growing unemployment, experienced several bank failures. Spain and Ireland, which had their own housing bubbles, were coping with contracting labor markets. Italy and France experienced a marked slowdown in domestic consumption. Germany’s economy, which had been profiting from strong exports, slowed in response to the dramatic weakening in Asian and Eastern European emerging markets.
For most of this year, the European Central Bank (ECB) remained more concerned about rising inflationary pressures and resisted calls to lower interest rates to reignite the region’s economy. However, in early October, the ECB moved to cut rates by half a percentage point in tandem with six other central banks. Shortly after the end of our reporting period, the ECB cut its short-term target interest rate by another half of a percent, to 3.25%, and ECB President Jean-Claude Trichet said the bank would consider another cut in December. In the U.K., the Bank of England slashed its target lending rate by 1.5 percentage points to 3.00%, its lowest rate in 54 years. While lending has been constrained, we expect credit to become more readily available through 2009.
Japan’s economy slowed considerably in response to a strengthening yen and slumping exports. Deflation that has bedeviled Japan for more than a decade suppressed domestic demand. In mid-October, shares on the Tokyo Stock Exchange dropped to their lowest level in 26 years. Australia’s business conditions deteriorated and market sentiment soured, despite reaping the benefits from China’s seemingly insatiable demand for energy and raw materials. Hong Kong, Singapore, and New Zealand markets also experienced significant declines.
Emerging markets saw steep declines, particularly in the past six months, as investors became risk averse. Emerging markets in Latin America, which had been more resilient earlier in the year, succumbed to the global sell-off and dropped sharply. Emerging Asian markets plummeted, with many markets losing half their value in the last six months.
The market deterioration has been severe and swift. But we should keep in mind that markets typically move in advance of economic conditions. With valuations at very attractive levels, we believe that the fiscal and monetary policies that have been enacted will set the stage for much improved results in the years to come.
Investment Approach
The Institutional Global Large-Cap Equity Fund takes a growth approach to investing, and expects to invest substantially all of its assets (at least 80% of net assets) in stocks of large-cap companies. The fund defines a large-cap company as one whose market capitalization falls within or above the applicable range for companies included in the MSCI All Country World Large-Cap Index. Under normal conditions, the fund will invest in at least five countries, and at least 40% of its net assets will be in large-cap companies outside the U.S. If market conditions are not favorable, however, the fund will invest at least 30% of net assets in large-cap companies outside the U.S.
The fund leverages the entire T. Rowe Price platform of more than 100 analysts from around the world, drawing on their sector and geographical expertise in an effort to identify companies capable of achieving and sustaining above-average, long-term earnings growth. We seek to purchase stocks of companies at reasonable prices in relation to present or anticipated earnings, cash flow, or book value, and valuation factors often influence allocations.
In selecting stocks, we generally favor companies with one or more of the following characteristics:
• Leading or improving market position.
• Attractive business niche.
• Attractive or improving franchise or industry position.
• Competent and trustworthy management.
• Growth in earnings and cash flow.
• A sound balance sheet.
While the fund invests primarily in common stocks, it may also purchase other securities and use futures and options in keeping with the fund’s objectives. The fund may sell securities for a variety of reasons, such as to secure gains, limit losses, or redeploy assets into more promising opportunities.
Portfolio Positioning and Strategy
In terms of positioning, we are intent on constructing a focused portfolio of our highest-quality long-term investment opportunities from around the world. As we launch this fund in a period of widespread market turmoil, our priority is to add holdings that have experienced overly punitive price declines. One of the great benefits of opening our fund in this bear market is that we have been able to buy shares of quality companies on considerable weakness. We expect this trend to continue for some time.
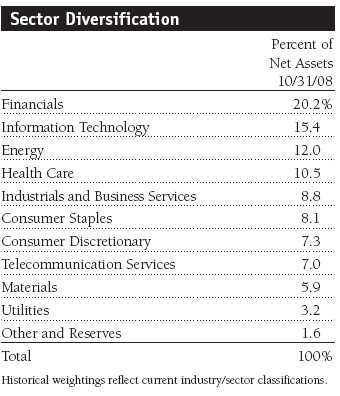
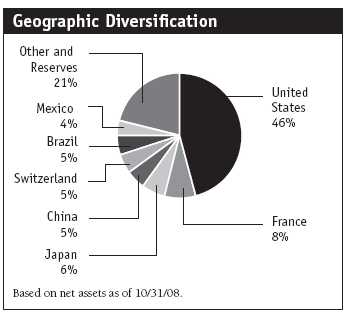
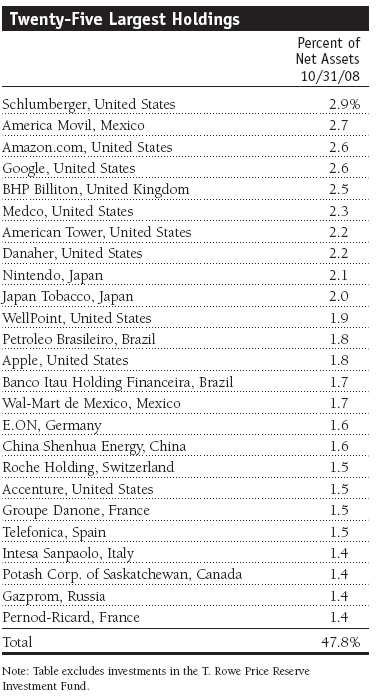
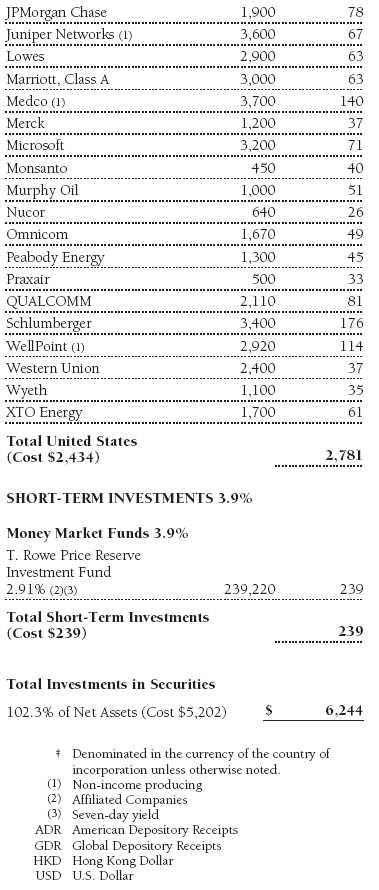
In the energy sector, for example, we bought shares of equipment and services company Schlumberger, which saw its share price plummet in response to the dramatic drop in oil prices and slackening demand. The U.S. company is the fund’s top holding, and we believe its growth prospects are strong, particularly as the long-term supply-and-demand fundamentals for oil and gas look far more attractive. Our second-largest position is in the Mexican telecom company America Movil. It is the region’s largest telecom concern and is enjoying benefits of scale. The company has 165 million subscribers, and penetration levels have increased. But there is still strong growth in subscribers and upside to revenues. Search engine giant Google is well positioned, we believe, to continue taking market share and generate extraordinary profitability. We think Google has excellent long-term growth prospects in video through YouTube, as well as in mobile and display advertising. It should continue to dominate in the Internet search area. While the steep slowdown has slashed the share price of Amazon.com, we believe the online retailer is poised for future growth. It has a strong business model that is attracting a growing number of higher-income customers. What’s more, it stands to benefit over time from struggling retailers or those that have completely disappeared. In the materials sector, we own mining company BHP Billiton. While the immediate outlook for many of the commodities that it produces has deteriorated, we believe Billiton is well positioned for strong growth as demand from emerging countries picks up. (Please refer to the portfolio of investments for a complete listing of holdings and the amount each represents in the portfolio.)
Outlook
Having peaked last year, equities acted as lead indicators of the poor economic outlook with their subsequent declines. Over the next 12 months, we foresee continued stock market volatility against a backdrop of a sharp slowdown in the global economy, with fundamentals continuing to be weak. Stocks are now attractively valued in comparison with their historical range and relative to other asset classes. However, this positive is offset by near-term uncertainty about the impact on corporate earnings and upheavals in the banking system. Several developed economies are in recession, as demand has weakened among consumers and companies amid continuing negative sentiment. This should ease inflationary pressures, particularly given recent declines in energy prices, and encourage further monetary responses from central banks. Such a step would likely help reduce the length and depth of any downturn.
Emerging markets will continue to be affected by the events in developed economies and have already slowed considerably from their peak growth rates. But growth will remain at a premium to developed markets. The increased cost of capital will delay some of the previously planned capital expenditures on infrastructure, which tends to boost overall demand. However, we maintain our belief that the underlying drivers of industrialization and burgeoning consumer demand in these markets will reassert themselves over the medium term. The current environment could offer attractive investment opportunities among superior companies in emerging markets, as they will be well placed to benefit from these secular growth drivers once confidence improves.
In the current environment, we continue to invest in high-quality companies with robust franchises, significant cash flows, solid balance sheets, and management teams that we trust. The tougher economic environment is likely to provide market share and consolidation opportunities for these stronger players as their weaker peers fall away. In the same way that stock markets peaked a long time before the economic downturn, they are likely to rebound well ahead of an economic recovery, and we are therefore positioning the portfolio in preparation for that turning point.
Respectfully submitted,

R. Scott Berg
Chairman of the fund’s Investment Advisory Committee
November 17, 2008
The committee chairman has day-to-day responsibility for managing the portfolio and works with committee members in developing and executing the fund’s investment program.
| Risks of International Investing |
Funds that invest overseas generally carry more risk than funds that invest strictly in U.S. assets. Funds investing in a single country or in a limited geographic region tend to be riskier than more diversified funds. Risks can result from varying stages of economic and political development; differing regulatory environments, trading days, and accounting standards; and higher transaction costs of non-U.S. markets. Non-U.S. investments are also subject to currency risk, or a decline in the value of a foreign currency versus the U.S. dollar, which reduces the dollar value of securities denominated in that currency.
| Glossary |
Gross domestic product (GDP): GDP is the total market value of all goods and services produced in a country in a given year.
Lipper averages: The averages of available mutual fund performance returns for specified periods in defined categories as tracked by Lipper Inc.
MSCI All Country World Large-Cap Index: A capitalization-weighted index of stocks from developed and emerging markets worldwide.
Price/earnings (P/E) ratio: Calculated by dividing a stock’s market value per share by the company’s earnings per share for the past 12 months or by expected earnings for the coming year.
Performance and Expenses
T. Rowe Price Institutional Global Large-Cap Equity Fund
Portfolio Highlights
Fund Expense Example
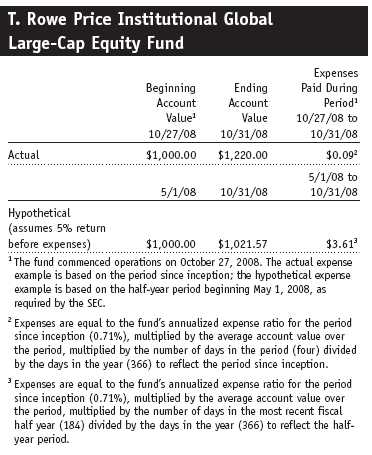
As a mutual fund shareholder, you may incur two types of costs: (1) transaction costs, such as redemption fees or sales loads, and (2) ongoing costs, including management fees, distribution and service (12b-1) fees, and other fund expenses. The following example is intended to help you understand your ongoing costs (in dollars) of investing in the fund and to compare these costs with the ongoing costs of investing in other mutual funds. The example is based on an investment of $1,000 invested at the beginning of the most recent six-month period and held for the entire period.
Actual Expenses
The first line of the following table (“Actual”) provides information about actual account values and actual expenses. You may use the information in this line, together with your account balance, to estimate the expenses that you paid over the period. Simply divide your account value by $1,000 (for example, an $8,600 account value divided by $1,000 = 8.6), then multiply the result by the number in the first line under the heading “Expenses Paid During Period” to estimate the expenses you paid on your account during this period.
Hypothetical Example for Comparison Purposes
The information on the second line of the table (“Hypothetical”) is based on hypothetical account values and expenses derived from the fund’s actual expense ratio and an assumed 5% per year rate of return before expenses (not the fund’s actual return). You may compare the ongoing costs of investing in the fund with other funds by contrasting this 5% hypothetical example and the 5% hypothetical examples that appear in the shareholder reports of the other funds. The hypothetical account values and expenses may not be used to estimate the actual ending account balance or expenses you paid for the period.
You should also be aware that the expenses shown in the table highlight only your ongoing costs and do not reflect any transaction costs, such as redemption fees or sales loads. Therefore, the second line of the table is useful in comparing ongoing costs only and will not help you determine the relative total costs of owning different funds. To the extent a fund charges transaction costs, however, the total cost of owning that fund is higher.
Financial Highlights
T. Rowe Price Institutional Global Large-Cap Equity Fund
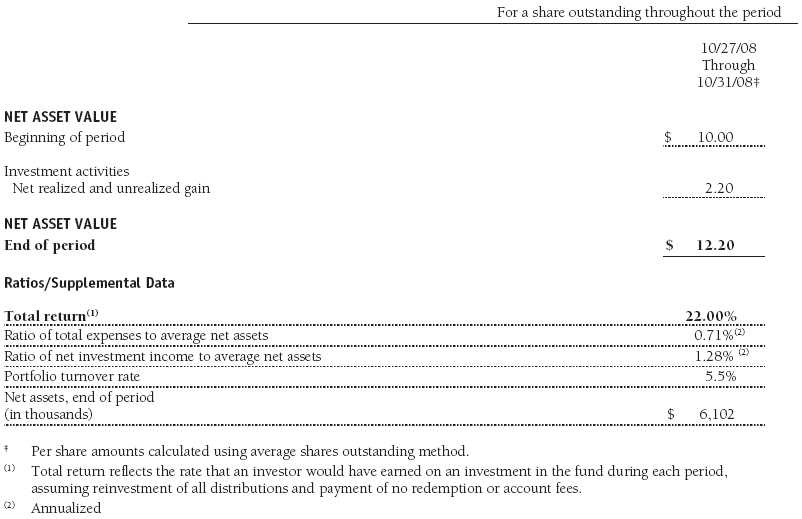
The accompanying notes are an integral part of these financial statements.
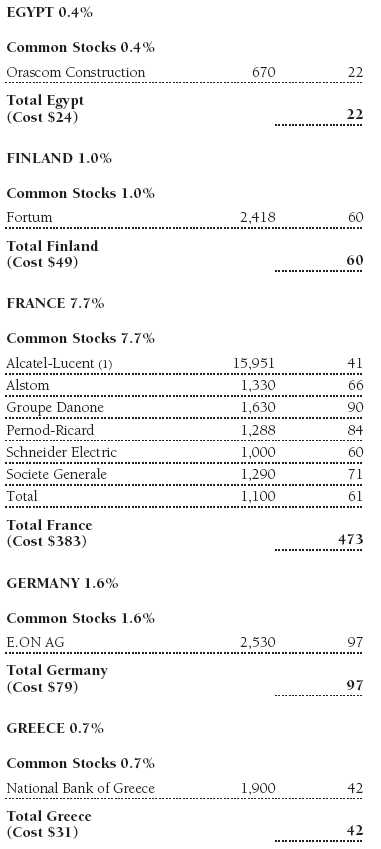
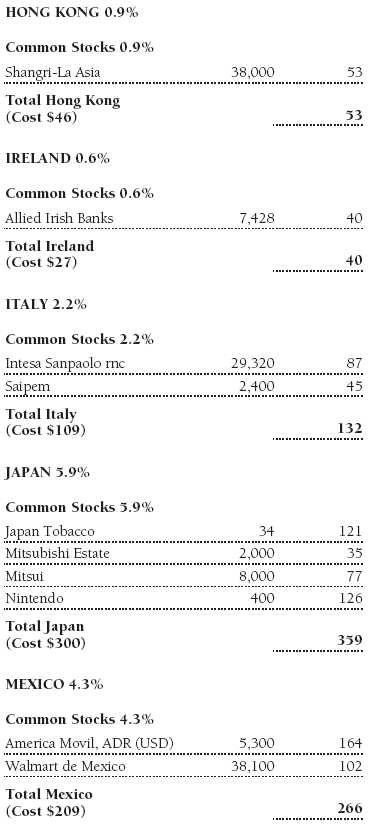
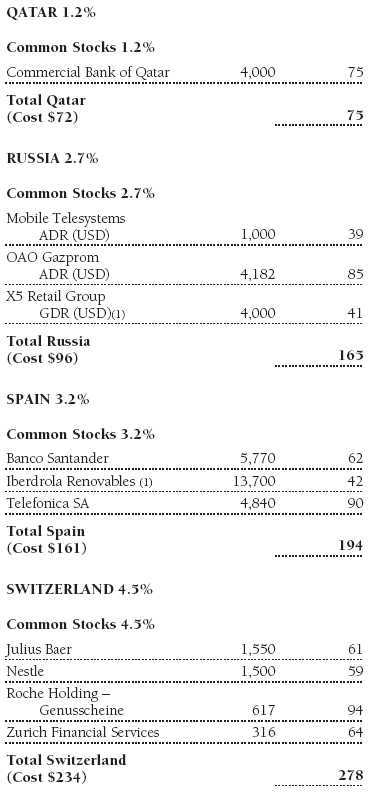
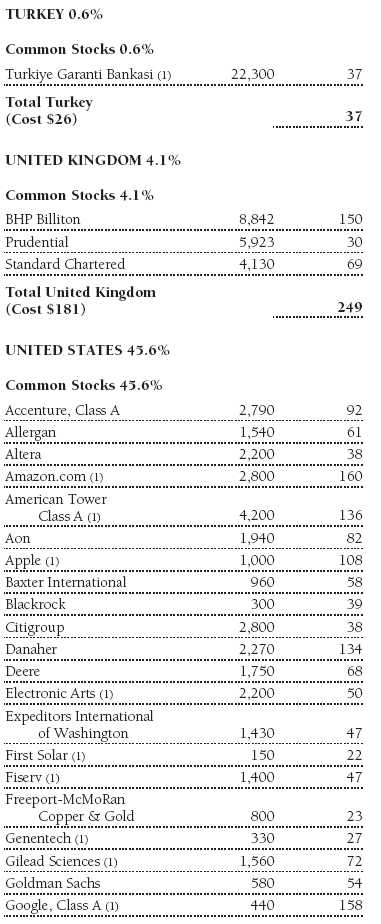
Portfolio of Investments ‡
T. Rowe Price Institutional Global Large-Cap Equity Fund
October 31, 2008
The accompanying notes are an integral part of these financial statements.
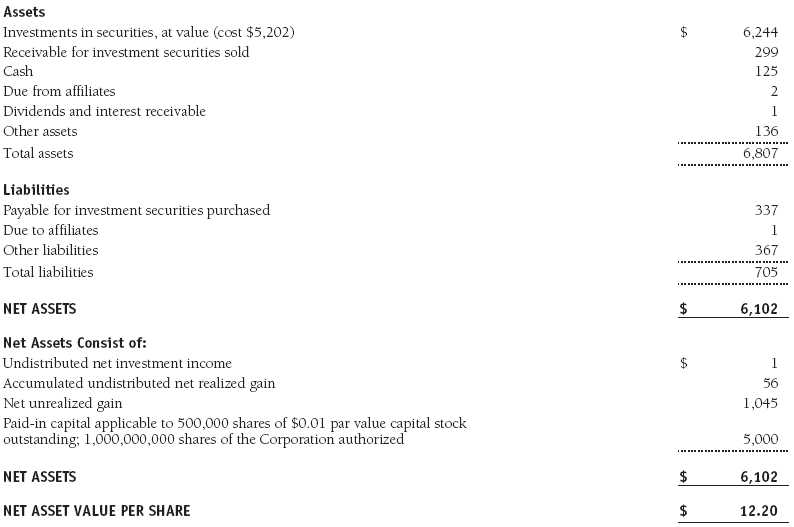
Statement of Assets and Liabilities
T. Rowe Price Institutional Global Large-Cap Equity Fund
October 31, 2008
($000s, except shares and per share amounts)
The accompanying notes are an integral part of these financial statements.
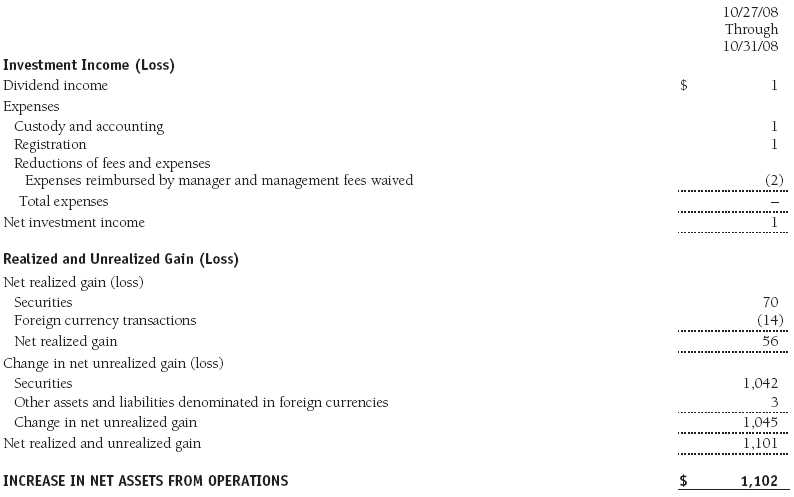
Statement of Operations
T. Rowe Price Institutional Global Large-Cap Equity Fund
($000s)
The accompanying notes are an integral part of these financial statements.
Statement of Changes in Net Assets
T. Rowe Price Institutional Global Large-Cap Equity Fund
($000s)
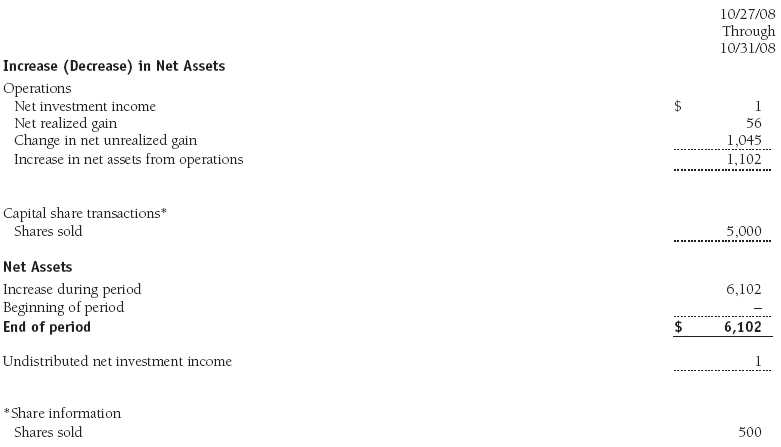
The accompanying notes are an integral part of these financial statements.
Notes to Financial Statements
T. Rowe Price Institutional Global Large-Cap Equity Fund
October 31, 2008
T. Rowe Price Institutional International Fund Inc. (the corporation), is registered under the Investment Company Act of 1940 (the 1940 Act). The Institutional Global Large-Cap Equity Fund (the fund), a diversified, open-end management investment company, is one portfolio established by the corporation. The fund commenced operations on October 27, 2008. The fund seeks long-term growth of capital through investments primarily in the common stocks of large-cap companies throughout the world, including the U.S.
NOTE 1 - SIGNIFICANT ACCOUNTING POLICIES
Basis of Preparation The accompanying financial statements were prepared in accordance with accounting principles generally accepted in the United States of America, which require the use of estimates made by fund management. Fund management believes that estimates and security valuations are appropriate; however, actual results may differ from those estimates, and the security valuations reflected in the financial statements may differ from the value the fund ultimately realizes upon sale of the securities.
Investment Transactions, Investment Income, and Distributions Income and expenses are recorded on the accrual basis. Dividends received from mutual fund investments are reflected as dividend income; capital gain distributions are reflected as realized gain/loss. Dividend income and capital gain distributions are recorded on the ex-dividend date. Income tax-related interest and penalties, if incurred, would be recorded as income tax expense. Investment transactions are accounted for on the trade date. Realized gains and losses are reported on the identified cost basis. Distributions to shareholders are recorded on the ex-dividend date. Income distributions are declared and paid on a an annual basis. Capital gain distributions, if any, are declared and paid by the fund, typically on an annual basis.
Currency Translation Assets, including investments, and liabilities denominated in foreign currencies are translated into U.S. dollar values each day at the prevailing exchange rate, using the mean of the bid and asked prices of such currencies against U.S. dollars as quoted by a major bank. Purchases and sales of securities, income, and expenses are translated into U.S. dollars at the prevailing exchange rate on the date of the transaction. The effect of changes in foreign currency exchange rates on realized and unrealized security gains and losses is reflected as a component of security gains and losses.
Redemption Fees A 2% fee is assessed on redemptions of fund shares held for 90 days or less to deter short-term trading and to protect the interests of long-term shareholders. Redemption fees are withheld from proceeds that shareholders receive from the sale or exchange of fund shares. The fees are paid to the fund, and are recorded as an increase to paid-in capital. The fees may cause the redemption price per share to differ from the net asset value per share.
New Accounting Pronouncements The fund adopted Financial Accounting Standards Board (FASB) Interpretation No. 48 (FIN 48), Accounting for Uncertainty in Income Taxes, a clarification of FASB Statement No. 109, Accounting for Income Taxes. FIN 48 establishes financial accounting and disclosure requirements for recognition and measurement of tax positions taken or expected to be taken on an income tax return. The adoption of FIN 48 had no impact on the fund’s net assets or results of operations.
In September 2006, the Financial Accounting Standards Board (FASB) released Statement of Financial Accounting Standards No. 157 (FAS 157), Fair Value Measurements. FAS 157 defines fair value, establishes the framework for measuring fair value, and expands the disclosure of fair value measurements in the financial statements. It is effective for the fund’s fiscal year beginning November 1, 2008. Management expects adoption of FAS 157 will have no material impact on the fund’s net assets or results of operations.
In March 2008, the Financial Accounting Standards Board issued Statement of Financial Accounting Standards No. 161 (FAS 161), Disclosures about Derivative Instruments and Hedging Activities, which is effective for fiscal years and interim periods beginning after November 15, 2008. FAS 161 requires enhanced disclosures about derivative and hedging activities, including how such activities are accounted for and their effect on financial position, performance and cash flows. Management is currently evaluating the impact the adoption of FAS 161 will have on the fund’s financial statements and related disclosures.
NOTE 2 - VALUATION
The fund values its investments and computes its net asset value per share at the close of the New York Stock Exchange (NYSE), normally 4 p.m. ET, each day that the NYSE is open for business.
Equity securities listed or regularly traded on a securities exchange or in the over-the-counter (OTC) market are valued at the last quoted sale price or, for certain markets, the official closing price at the time the valuations are made, except for OTC Bulletin Board securities, which are valued at the mean of the latest bid and asked prices. A security that is listed or traded on more than one exchange is valued at the quotation on the exchange determined to be the primary market for such security. Listed securities not traded on a particular day are valued at the mean of the latest bid and asked prices for domestic securities and the last quoted sale price for international securities.
Investments in mutual funds are valued at the mutual fund’s closing net asset value per share on the day of valuation.
Other investments, including restricted securities, and those for which the above valuation procedures are inappropriate or are deemed not to reflect fair value are stated at fair value as determined in good faith by the T. Rowe Price Valuation Committee, established by the fund’s Board of Directors.
For valuation purposes, the last quoted prices of non-U.S. equity securities may be adjusted under the circumstances described below. If the fund determines that developments between the close of a foreign market and the close of the NYSE will, in its judgment, materially affect the value of some or all of its portfolio securities, the fund will adjust the previous closing prices to reflect what it believes to be the fair value of the securities as of the close of the NYSE. In deciding whether it is necessary to adjust closing prices to reflect fair value, the fund reviews a variety of factors, including developments in foreign markets, the performance of U.S. securities markets, and the performance of instruments trading in U.S. markets that represent foreign securities and baskets of foreign securities. A fund may also fair value securities in other situations, such as when a particular foreign market is closed but the fund is open. The fund uses outside pricing services to provide it with closing prices and information to evaluate and/or adjust those prices. The fund cannot predict how often it will use closing prices and how often it will determine it necessary to adjust those prices to reflect fair value. As a means of evaluating its security valuation process, the fund routinely compares closing prices, the next day’s opening prices in the same markets, and adjusted prices.
NOTE 3 - INVESTMENT TRANSACTIONS
Consistent with its investment objective, the fund engages in the following practices to manage exposure to certain risks or to enhance performance. The investment objective, policies, program, and risk factors of the fund are described more fully in the fund’s prospectus and Statement of Additional Information.
Emerging Markets At October 31, 2008, approximately 19% of the fund’s net assets were invested, directly or through its investments in T. Rowe Price institutional funds, in securities of companies located in emerging markets or denominated in or linked to the currencies of emerging market countries. Future economic or political developments could adversely affect the liquidity or value, or both, of such securities.
Other Purchases and sales of portfolio securities, other than short-term securities, aggregated $5,201,000 and $308,000, respectively, for the year ended October 31, 2008.
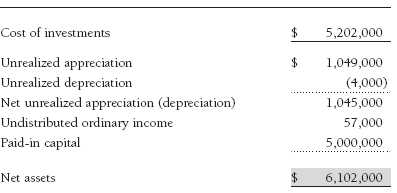
NOTE 4 - FEDERAL INCOME TAXES
No provision for federal income taxes is required since the fund intends to continue to qualify as a regulated investment company under Subchapter M of the Internal Revenue Code and distribute to shareholders all of its taxable income and gains. Distributions are determined in accordance with Federal income tax regulations, which differ from generally accepted accounting principles, and, therefore, may differ significantly in amount or character from net investment income and realized gains for financial reporting purposes. Financial reporting records are adjusted for permanent book/tax differences to reflect tax character but are not adjusted for temporary differences.
There were no distributions in the period ended October 31, 2008. At October 31, 2008, the tax-basis cost of investments and components of net assets were as follows:
NOTE 5 - RELATED PARTY TRANSACTIONS
The fund is managed by T. Rowe Price International, Inc. (the manager), a wholly owned subsidiary of T. Rowe Price Associates, Inc. (Price Associates), which is wholly owned by T. Rowe Price Group, Inc. The investment management agreement between the fund and the manager provides for an annual investment management fee equal to 0.65% of the fund’s average daily net assets. The fee is computed daily and paid monthly.
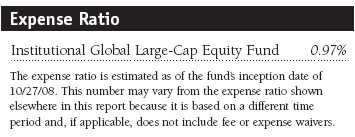
The fund is also subject to a contractual expense limitation through February 28, 2011. During the limitation period, the manager is required to waive its management fee and reimburse the fund for any expenses, excluding interest, taxes, brokerage commissions, and extraordinary expenses, that would otherwise cause the fund’s ratio of annualized total expenses to average net assets (expense ratio) to exceed its expense limitation of 0.75% . For a period of three years after the date of any reimbursement or waiver, the fund is required to repay the manager for expenses previously reimbursed and management fees waived to the extent its net assets have grown or expenses have declined sufficiently to allow repayment without causing the fund’s expense ratio to exceed its expense limitation. Pursuant to this agreement, management fees in the amount of $400 were waived and expenses in the amount of $1,800 were reimbursed by the manager during the period ended October 31, 2008. Including these amounts, management fees waived and expenses previously reimbursed by the manager in the amount of $2,200 remain subject to repayment by the fund at February 28, 2014.
In addition, the fund has entered into service agreements with Price Associates and a wholly owned subsidiary of Price Associates (collectively, Price). Price Associates computes the daily share price and provides certain other administrative services to the fund. T. Rowe Price Services, Inc., provides shareholder and administrative services in its capacity as the fund’s transfer and dividend disbursing agent. For the period ended October 31, 2008, expenses incurred pursuant to these service agreements were $1,000 for Price Associates. The total amount payable at period-end pursuant to these service agreements is reflected as Due to Affiliates in the accompanying financial statements.
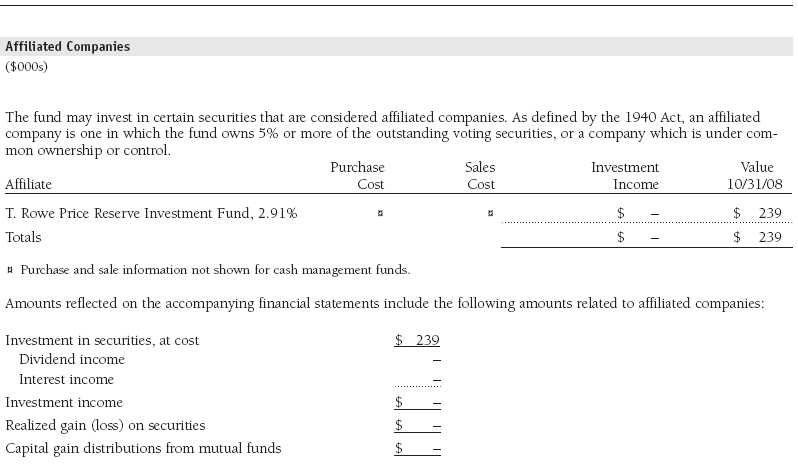
The fund may invest in the T. Rowe Price Reserve Investment Fund and the T. Rowe Price Government Reserve Investment Fund (collectively, the T. Rowe Price Reserve Investment Funds), open-end management investment companies managed by Price Associates and considered affiliates of the fund. The T. Rowe Price Reserve Investment Funds are offered as cash management options to mutual funds, trusts, and other accounts managed by Price Associates and/or its affiliates and are not available for direct purchase by members of the public. The T. Rowe Price Reserve Investment Funds pay no investment management fees.
As of October 31, 2008, T. Rowe Price Group, Inc., and/or its wholly owned subsidiaries owned 500,000 shares of the fund, representing 100% of the fund’s net assets.
Report of Independent Registered Public Accounting Firm
To the Board of Directors of T. Rowe Price Institutional International Funds, Inc. and
Shareholders of T. Rowe Price Institutional Global Large-Cap Equity Fund
In our opinion, the accompanying statement of assets and liabilities, including the schedule of investments, and the related statements of operations and of changes in net assets and the financial highlights present fairly, in all material respects, the financial position of T. Rowe Price Institutional Global Large Cap Equity Fund (one of the portfolios comprising T. Rowe Price Institutional International Funds, Inc., hereafter referred to as the “Fund”) at October 31, 2008, the results of its operations, the changes in its net assets and the financial highlights for the period October 27, 2008 (commencement of operations) through October 31, 2008, in conformity with accounting principles generally accepted in the United States of America. These financial statements and financial highlights (hereafter referred to as “financial statements”) are the responsibility of the Fund’s management; our responsibility is to express an opinion on these financial statements based on our audit. We conducted our audit of these financial statements in accordance with the standards of the Public Company Accounting Oversight Board (United States). Those standards require that we plan and perform the audit to obtain reasonable assurance about whether the financial statements are free of material misstatement. An audit includes examining, on a test basis, evidence supporting the amounts and disclosures in the financial statements, assessing the accounting principles used and significant estimates made by management, and evaluating the overall financial statement presentation. We believe that our audit, which included confirmation of securities at October 31, 2008, by correspondence with the custodian, and confirmation of the underlying fund by correspondence with the transfer agent, provides a reasonable basis for our opinion.
PricewaterhouseCoopers LLP
Baltimore, Maryland
December 12, 2008
| Tax Information (Unaudited) for the Tax Year Ended 10/31/08 |
We are providing this information as required by the Internal Revenue Code. The amounts shown may differ from those elsewhere in this report because of differences between tax and financial reporting requirements.
For taxable non-corporate shareholders, $1,000 of the fund’s income represents qualified dividend income subject to the 15% rate category.
For corporate shareholders, $1,000 of the fund’s income qualifies for the dividends-received deduction.
| Information on Proxy Voting Policies, Procedures, and Records |
A description of the policies and procedures used by T. Rowe Price funds and portfolios to determine how to vote proxies relating to portfolio securities is available in each fund’s Statement of Additional Information, which you may request by calling 1-800-225-5132 or by accessing the SEC’s Web site, www.sec.gov. The description of our proxy voting policies and procedures is also available on our Web site, www.troweprice.com. To access it, click on the words “Our Company” at the top of our corporate homepage. Then, when the next page appears, click on the words “Proxy Voting Policies” on the left side of the page.
Each fund’s most recent annual proxy voting record is available on our Web site and through the SEC’s Web site. To access it through our Web site, follow the directions above, then click on the words “Proxy Voting Records” on the right side of the Proxy Voting Policies page.
| How to Obtain Quarterly Portfolio Holdings |
The fund files a complete schedule of portfolio holdings with the Securities and Exchange Commission for the first and third quarters of each fiscal year on Form N-Q. The fund’s Form N-Q is available electronically on the SEC’s Web site (www.sec.gov); hard copies may be reviewed and copied at the SEC’s Public Reference Room, 450 Fifth St. N.W., Washington, DC 20549. For more information on the Public Reference Room, call 1-800-SEC-0330.
| About the Fund’s Directors and Officers |
Your fund is governed by a Board of Directors (Board) that meets regularly to review a wide variety of matters affecting the fund, including performance, investment programs, compliance matters, advisory fees and expenses, service providers, and other business affairs. The Board elects the fund’s officers, who are listed in the final table. At least 75% of Board members are independent of T. Rowe Price Associates, Inc. (T. Rowe Price), and T. Rowe Price International, Inc. (T. Rowe Price International); “inside” or “interested” directors are employees or officers of T. Rowe Price. The business address of each director and officer is 100 East Pratt Street, Baltimore, Maryland 21202. The Statement of Additional Information includes additional information about the fund directors and is available without charge by calling a T. Rowe Price representative at 1-800-225-5132.
| Independent Directors | |
| Name (Year of Birth) | |
| Year Elected* | Principal Occupation(s) During Past Five Years and Directorships of Other Public Companies |
| Jeremiah E. Casey (1940) | Director, National Life Insurance (2001 to 2005); Director, The Rouse Company, real estate developers (1990 to 2004) |
| 2006 | |
| Anthony W. Deering (1945) | Chairman, Exeter Capital, LLC, a private investment firm (2004 to present); Director, Under Armour (8/08 to present); |
| 1991 | Director, Vornado Real Estate Investment Trust (3/04 to present); Director, Mercantile Bankshares (2002 to 2007); |
| Member, Advisory Board, Deutsche Bank North America (2004 to present); Director, Chairman of the Board, and Chief | |
| Executive Officer, The Rouse Company, real estate developers (1997 to 2004) | |
| Donald W. Dick, Jr. (1943) | Principal, EuroCapital Advisors, LLC, an acquisition and management advisory firm (10/95 to present); Chairman, |
| 1989 | The Haven Group, a custom manufacturer of modular homes (1/04 to present) |
| David K. Fagin (1938) | Chairman and President, Nye Corporation (6/88 to present); Director, Golden Star Resources Ltd. (5/92 to present); |
| 2001 | Director, Pacific Rim Mining Corp. (2/02 to present); Director, B.C. Corporation (3/08 to present); Chairman, Canyon |
| Resources Corp. (8/07 to 3/08); Director, Atna Resources Ltd. (3/08 to present) | |
| Karen N. Horn (1943) | Director, Eli Lilly and Company (1987 to present); Director, Simon Property Group (2004 to present); Director, Federal |
| 2003 | National Mortgage Association (9/06 to present); Director, Norfolk Southern (2/08 to present); Director, Georgia |
| Pacific (5/04 to 12/05); Managing Director and President, Global Private Client Services, Marsh Inc. (1999 to 2003) | |
| Theo C. Rodgers (1941) | President, A&R Development Corporation (1977 to present) |
| 2006 | |
| John G. Schreiber (1946) | Owner/President, Centaur Capital Partners, Inc., a real estate investment company (1991 to present); Partner, |
| 2001 | Blackstone Real Estate Advisors, L.P. (10/92 to present) |
| *Each independent director oversees 126 T. Rowe Price portfolios and serves until retirement, resignation, or election of a successor. | |
| Inside Directors | |
| Name | |
| (Year of Birth) | |
| Year Elected* | |
| [Number of T. Rowe Price | |
| Portfolios Overseen] | Principal Occupation(s) During Past Five Years and Other Directorships of Public Companies |
| Edward C. Bernard | Director and Vice President, T. Rowe Price; Vice Chairman of the Board, Director, and Vice President, T. Rowe Price |
| (1956) | Group, Inc.; Chairman of the Board, Director, and President, T. Rowe Price Investment Services, Inc.; Chairman of |
| 2006 | the Board and Director, T. Rowe Price Global Asset Management Limited, T. Rowe Price Global Investment Services |
| [126] | Limited, T. Rowe Price Retirement Plan Services, Inc., T. Rowe Price Savings Bank, and T. Rowe Price Services, Inc.; |
| Director, T. Rowe Price International, Inc.; Chief Executive Officer, Chairman of the Board, Director, and President, | |
| T. Rowe Price Trust Company; Chairman of the Board, all funds | |
| Brian C. Rogers, CFA, CIC | Chief Investment Officer, Director, and Vice President, T. Rowe Price; Chairman of the Board, Chief Investment Officer, |
| (1955) | Director, and Vice President, T. Rowe Price Group, Inc.; Vice President, T. Rowe Price Trust Company |
| 2006 | |
| [72] | |
| *Each inside director serves until retirement, resignation, or election of a successor. | |
| Officers | |
| Name (Year of Birth) | |
| Title and Fund(s) Served | Principal Occupation(s) |
| Christopher D. Alderson (1962) | Vice President, T. Rowe Price Group, Inc., and T. Rowe Price |
| Executive Vice President, Institutional International Funds | International, Inc. |
| Jeffrey W. Arricale, CPA (1971) | Vice President, T. Rowe Price and T. Rowe Price Group, Inc. |
| Vice President, Institutional International Funds | |
| R. Scott Berg, CFA (1972) | Vice President, T. Rowe Price and T. Rowe Price Group, Inc. |
| Executive Vice President, Institutional International Funds | |
| Mark C.J. Bickford-Smith (1962) | Vice President, T. Rowe Price Group, Inc., and T. Rowe Price |
| Vice President, Institutional International Funds | International, Inc. |
| Richard N. Clattenburg, CFA (1979) | Vice President, T. Rowe Price; formerly Financial Analyst, Goldman Sachs |
| Vice President, Institutional International Funds | (to 2005) |
| Michael J. Conelius, CFA (1964) | Vice President, T. Rowe Price, T. Rowe Price Group, Inc., T. Rowe Price |
| Executive Vice President, Institutional International Funds | International, Inc., and T. Rowe Price Trust Company |
| Frances Dydasco (1966) | Vice President, T. Rowe Price Group, Inc., and T. Rowe Price |
| Vice President, Institutional International Funds | International, Inc. |
| Mark J.T. Edwards (1957) | Vice President, T. Rowe Price Group, Inc., and T. Rowe Price |
| Vice President, Institutional International Funds | International, Inc. |
| Henry M. Ellenbogen (1973) | Vice President, T. Rowe Price and T. Rowe Price Group, Inc. |
| Vice President, Institutional International Funds | |
| Roger L. Fiery III, CPA (1959) | Vice President, T. Rowe Price, T. Rowe Price Group, Inc., T. Rowe Price |
| Vice President, Institutional International Funds | International, Inc., and T. Rowe Price Trust Company |
| Niall P. Gallagher, CFA (1972) | Vice President, T. Rowe Price Group, Inc., and T. Rowe Price International, |
| Vice President, Institutional International Funds | Inc.; formerly European Analyst and Portfolio Manager, Merrill Lynch |
| (London) (to 2006) | |
| Robert N. Gensler (1957) | Vice President, T. Rowe Price, T. Rowe Price Group, Inc., and T. Rowe Price |
| Executive Vice President, Institutional International Funds | International, Inc. |
| John R. Gilner (1961) | Chief Compliance Officer and Vice President, T. Rowe Price; Vice President, |
| Chief Compliance Officer, Institutional International Funds | T. Rowe Price Group, Inc., and T. Rowe Price Investment Services, Inc. |
| Gregory S. Golczewski (1966) | Vice President, T. Rowe Price and T. Rowe Price Trust Company |
| Vice President, Institutional International Funds | |
| M. Campbell Gunn (1956) | Vice President, T. Rowe Price Global Investment Services Limited, |
| Vice President, Institutional International Funds | T. Rowe Price Group, Inc., and T. Rowe Price International, Inc. |
| Gregory K. Hinkle, CPA (1958) | Vice President, T. Rowe Price, T. Rowe Price Group, Inc., T. Rowe Price |
| Treasurer, Institutional International Funds | Investment Services, Inc., and T. Rowe Price Trust Company; formerly |
| Partner, PricewaterhouseCoopers LLP (to 2007) | |
| Kris H. Jenner, M.D., D. Phil. (1962) | Vice President, T. Rowe Price and T. Rowe Price Group, Inc. |
| Vice President, Institutional International Funds | |
| Ian D. Kelson (1956) | Vice President, T. Rowe Price, T. Rowe Price Group, Inc., and T. Rowe Price |
| Executive Vice President, Institutional International Funds | International, Inc. |
| Patricia B. Lippert (1953) | Assistant Vice President, T. Rowe Price and T. Rowe Price Investment |
| Secretary, Institutional International Funds | Services, Inc. |
| Charles M. Ober, CFA (1950) | Vice President, T. Rowe Price and T. Rowe Price Group, Inc. |
| Vice President, Institutional International Funds | |
| David Oestreicher (1967) | Director and Vice President, T. Rowe Price Investment Services, Inc., |
| Vice President, Institutional International Funds | T. Rowe Price Trust Company, and T. Rowe Price Services, Inc.; Vice |
| President, T. Rowe Price, T. Rowe Price Global Asset Management Limited, | |
| T. Rowe Price Global Investment Services Limited, T. Rowe Price Group, | |
| Inc., T. Rowe Price International, Inc., and T. Rowe Price Retirement Plan | |
| Services, Inc. | |
| Gonzalo Pángaro, CFA (1968) | Vice President, T. Rowe Price Group, Inc., and T. Rowe Price |
| Vice President, Institutional International Funds | International, Inc. |
| Jeffrey Rottinghaus, CPA (1970) | Vice President, T. Rowe Price and T. Rowe Price Group, Inc. |
| Vice President, Institutional International Funds | |
| Robert W. Sharps, CFA, CPA (1971) | Vice President, T. Rowe Price, T. Rowe Price Group, Inc., and T. Rowe Price |
| Vice President, Institutional International Funds | Trust Company |
| Robert W. Smith (1961) | Vice President, T. Rowe Price, T. Rowe Price Group, Inc., and T. Rowe Price |
| Executive Vice President, Institutional International Funds | Trust Company |
| Dean Tenerelli (1964) | Vice President, T. Rowe Price Group, Inc., and T. Rowe Price |
| Vice President, Institutional International Funds | International, Inc. |
| Julie L. Waples (1970) | Vice President, T. Rowe Price |
| Vice President, Institutional International Funds | |
| David J.L. Warren (1957) | Director, T. Rowe Price, T. Rowe Price Global Asset Management Limited, |
| President, Institutional International Funds | and T. Rowe Price Global Investment Services Limited; Vice President, |
| T. Rowe Price Group, Inc.; Chief Executive Officer, Director, and President, | |
| T. Rowe Price International, Inc. | |
| Unless otherwise noted, officers have been employees of T. Rowe Price or T. Rowe Price International for at least five years. | |
Item 2. Code of Ethics.
The registrant has adopted a code of ethics, as defined in Item 2 of Form N-CSR, applicable to its principal executive officer, principal financial officer, principal accounting officer or controller, or persons performing similar functions. A copy of this code of ethics is filed as an exhibit to this Form N-CSR. No substantive amendments were approved or waivers were granted to this code of ethics during the period covered by this report.
Item 3. Audit Committee Financial Expert.
The registrant’s Board of Directors/Trustees has determined that Ms. Karen N. Horn qualifies as an audit committee financial expert, as defined in Item 3 of Form N-CSR. Ms. Horn is considered independent for purposes of Item 3 of Form N-CSR.
Item 4. Principal Accountant Fees and Services.
(a) – (d) Aggregate fees billed to the registrant for the last two fiscal years for professional services rendered by the registrant’s principal accountant were as follows:
Audit fees include amounts related to the audit of the registrant’s annual financial statements and services normally provided by the accountant in connection with statutory and regulatory filings. Audit-related fees include amounts reasonably related to the performance of the audit of the registrant’s financial statements and specifically include the issuance of a report on internal controls and, if applicable, agreed-upon procedures related to fund acquisitions. Tax fees include amounts related to services for tax compliance, tax planning, and tax advice. The nature of these services specifically includes the review of distribution calculations and the preparation of Federal, state, and excise tax returns. All other fees include the registrant’s pro-rata share of amounts for agreed-upon procedures in conjunction with service contract approvals by the registrant’s Board of Directors/Trustees.
(e)(1) The registrant’s audit committee has adopted a policy whereby audit and non-audit services performed by the registrant’s principal accountant for the registrant, its investment adviser, and any entity controlling, controlled by, or under common control with the investment adviser that provides ongoing services to the registrant require pre-approval in advance at regularly scheduled audit committee meetings. If such a service is required between regularly scheduled audit committee meetings, pre-approval may be authorized by one audit committee member with ratification at the next scheduled audit committee meeting. Waiver of pre-approval for audit or non-audit services requiring fees of a de minimis amount is not permitted.
(2) No services included in (b) – (d) above were approved pursuant to paragraph (c)(7)(i)(C) of Rule 2-01 of Regulation S-X.
(f) Less than 50 percent of the hours expended on the principal accountant’s engagement to audit the registrant’s financial statements for the most recent fiscal year were attributed to work performed by persons other than the principal accountant’s full-time, permanent employees.
(g) The aggregate fees billed for the most recent fiscal year and the preceding fiscal year by the registrant’s principal accountant for non-audit services rendered to the registrant, its investment adviser, and any entity controlling, controlled by, or under common control with the investment adviser that provides ongoing services to the registrant were $2,174,000 and $1,531,000, respectively.
(h) All non-audit services rendered in (g) above were pre-approved by the registrant’s audit committee. Accordingly, these services were considered by the registrant’s audit committee in maintaining the principal accountant’s independence.
Item 5. Audit Committee of Listed Registrants.
Not applicable.
Item 6. Investments.
(a) Not applicable. The complete schedule of investments is included in Item 1 of this Form N-CSR.
(b) Not applicable.
Item 7. Disclosure of Proxy Voting Policies and Procedures for Closed-End Management Investment Companies.
Not applicable.
Item 8. Portfolio Managers of Closed-End Management Investment Companies.
Not applicable.
Item 9. Purchases of Equity Securities by Closed-End Management Investment Company and Affiliated Purchasers.
Not applicable.
Item 10. Submission of Matters to a Vote of Security Holders.
Not applicable.
Item 11. Controls and Procedures.
(a) The registrant’s principal executive officer and principal financial officer have evaluated the registrant’s disclosure controls and procedures within 90 days of this filing and have concluded that the registrant’s disclosure controls and procedures were effective, as of that date, in ensuring that information required to be disclosed by the registrant in this Form N-CSR was recorded, processed, summarized, and reported timely.
(b) The registrant’s principal executive officer and principal financial officer are aware of no change in the registrant’s internal control over financial reporting that occurred during the registrant’s second fiscal quarter covered by this report that has materially affected, or is reasonably likely to materially affect, the registrant’s internal control over financial reporting.
Item 12. Exhibits.
(a)(1) The registrant’s code of ethics pursuant to Item 2 of Form N-CSR is attached.
(2) Separate certifications by the registrant's principal executive officer and principal financial officer, pursuant to Section 302 of the Sarbanes-Oxley Act of 2002 and required by Rule 30a-2(a) under the Investment Company Act of 1940, are attached.
(3) Written solicitation to repurchase securities issued by closed-end companies: not applicable.
(b) A certification by the registrant's principal executive officer and principal financial officer, pursuant to Section 906 of the Sarbanes-Oxley Act of 2002 and required by Rule 30a-2(b) under the Investment Company Act of 1940, is attached.
SIGNATURES | |
| Pursuant to the requirements of the Securities Exchange Act of 1934 and the Investment | |
| Company Act of 1940, the registrant has duly caused this report to be signed on its behalf by the | |
| undersigned, thereunto duly authorized. | |
| T. Rowe Price Institutional International Funds, Inc. | |
| By | /s/ Edward C. Bernard |
| Edward C. Bernard | |
| Principal Executive Officer | |
| Date | December 19, 2008 |
| Pursuant to the requirements of the Securities Exchange Act of 1934 and the Investment | |
| Company Act of 1940, this report has been signed below by the following persons on behalf of | |
| the registrant and in the capacities and on the dates indicated. | |
| By | /s/ Edward C. Bernard |
| Edward C. Bernard | |
| Principal Executive Officer | |
| Date | December 19, 2008 |
| By | /s/ Gregory K. Hinkle |
| Gregory K. Hinkle | |
| Principal Financial Officer | |
| Date | December 19, 2008 |