UNITED STATES
SECURITIES AND EXCHANGE COMMISSION
Washington, D.C. 20549
FORM N-CSR
CERTIFIED SHAREHOLDER REPORT OF REGISTERED
MANAGEMENT INVESTMENT COMPANIES
Investment Company Act File Number: 811-5833
| T. Rowe Price Institutional International Funds, Inc. |
| (Exact name of registrant as specified in charter) |
| 100 East Pratt Street, Baltimore, MD 21202 |
| (Address of principal executive offices) |
| David Oestreicher |
| 100 East Pratt Street, Baltimore, MD 21202 |
| (Name and address of agent for service) |
Registrant’s telephone number, including area code: (410) 345-2000
Date of fiscal year end: October 31
Date of reporting period: October 31, 2011
Item 1. Report to Shareholders
 |
| Institutional International Core Equity Fund | October 31, 2011 |
| Highlights |
• After solid performance in the first half of our 12-month reporting period, non-U.S. stocks declined sharply over the closing six months as investors turned increasingly risk averse.
• The Institutional International Core Equity Fund performed in line with the MSCI EAFE Index and outpaced its Lipper peer group average over the six-month period, while outperforming both benchmarks for the fiscal year.
• Every sector lost ground for the portfolio in absolute terms for the six-month period. Materials and financials experienced the biggest declines, while the health care and consumer staples sectors posted more modest losses.
• Corporate fundamentals appear strong and stock valuations are attractive, but we expect continued volatility until the political and economic issues weighing on the markets become more settled.
The views and opinions in this report were current as of October 31, 2011. They are not guarantees of performance or investment results and should not be taken as investment advice. Investment decisions reflect a variety of factors, and the managers reserve the right to change their views about individual stocks, sectors, and the markets at any time. As a result, the views expressed should not be relied upon as a forecast of the fund’s future investment intent. The report is certified under the Sarbanes-Oxley Act, which requires mutual funds and other public companies to affirm that, to the best of their knowledge, the information in their financial reports is fairly and accurately stated in all material respects.
Manager’s Letter
T. Rowe Price Institutional International Core Equity Fund
Fellow Shareholders
After solid performance in the first half of our 12-month reporting period, non-U.S. stock markets fell sharply in the closing six months as investors turned increasingly risk averse. The European debt crisis, a sluggish U.S. economy, and decelerating growth in key emerging markets weighed heavily on investor confidence. Developed markets generally outpaced emerging markets, although European shares plummeted as the Continent’s debt troubles worsened. The Institutional International Core Equity Fund declined in this volatile environment, performing roughly in line with the MSCI EAFE Index and outpacing its Lipper peer group average for the six-month period. The portfolio outperformed both the MSCI index and its Lipper average for the full year.
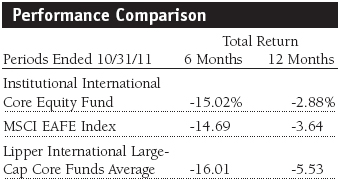
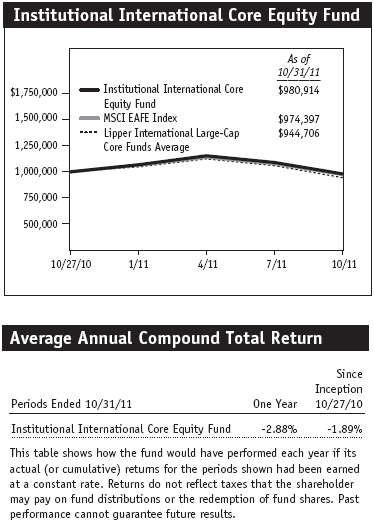
As shown in the Performance Comparison table, the Institutional International Core Equity Fund returned -15.02% during the six-month period ended October 31, 2011, versus -14.69% for the MSCI EAFE Index and -16.01% for the Lipper International Large-Cap Core Funds Average of similarly managed funds. Weakness in the second half of the period pulled one-year performance into negative territory as the portfolio returned -2.88% versus -3.64% and -5.53%, respectively, for the MSCI index and Lipper average. Every sector lost ground for the portfolio in absolute terms over the six-month period. The economically sensitive financials and materials sectors were among the weakest performers, while traditionally defensive health care and consumer staples shares posted more modest losses. Our energy holdings generated double-digit gains for the full year due to exceptionally strong performance in the first six months. Financials and materials remained among the portfolio’s weakest sectors in absolute terms for the 12-month period. Stock selection boosted performance versus the benchmark MSCI index over both periods, particularly in the information technology and consumer discretionary sectors.
Market Environment
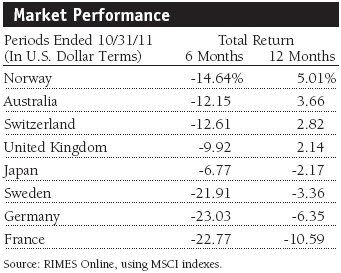
Non-U.S. stock markets declined sharply over the past six months as a stream of negative news caused investors to become increasingly risk averse. An intensifying European debt crisis, political wrangling over the U.S. debt ceiling, and slowing growth in China and other emerging markets all served to undermine investor confidence. European shares were punished as the Continent’s sovereign debt crisis continued to worsen. Greece appeared to be headed toward eventual default as policymakers struggled to prevent the contagion from spreading to Italy and beyond.
Although the latest approach to the debt crisis—a “voluntary” 50% haircut for Greek bondholders combined with a beefed-up rescue fund and more austerity measures—appeared to stabilize the situation, leaders have so far failed to summon the political will necessary to address Europe’s long-term structural problems. The political and economic difficulties include managing a monetary union without integrated fiscal policies. In addition, tax and regulatory regimes can vary considerably, particularly with regard to employment laws. These differences limit Europe’s competitiveness while the rest of the world, especially emerging markets, becomes more competitive. Although northern European economies—Scandinavia and Germany, in particular—appear relatively healthy and are in better fiscal shape than the U.S., southern Europe is struggling. Although the lack of fiscal integration in Europe appears to have worked tolerably well in a time of growth, the faults are showing now that growth has slowed and the bill has come due.
Japan outpaced most of the world’s other developed markets for the six-month period as its economy and markets rebounded from the devastating earthquake, tsunami, and nuclear disaster earlier in the year. Other developed Asian markets, such as Hong Kong, Singapore, and Australia, recorded double-digit declines.
Emerging market stock performance generally trailed developed markets for the 6- and 12-month periods. While emerging economies have made great strides in promoting domestic demand, they still rely heavily on trade with Europe and the U.S., which are both slowing. Among the key developing markets, Chinese stocks suffered from concerns that government policies intended to tame inflation would slow the economy too rapidly and result in a so-called hard landing. Similar concerns weighed on Brazil, as did slackening global commodity demand. Domestic demand in emerging markets held steady during the period, which provided some support to export-oriented developed markets.
After uniformly positive returns in the first half of the period, sector performance was negative across the board over the closing six months. Consumer staples and health care—two sectors that tend to fare relatively well during periods of economic uncertainty—posted modest losses. Telecommunication services, energy, consumer discretionary, and information technology lagged the leaders but still outpaced the broader market. The economically sensitive industrials and business services, financials, and materials sectors fell sharply and underperformed the market. For the 12-month period, energy, consumer staples, and health care shares posted solid gains, while utilities and financials recorded double-digit losses.
Portfolio Highlights and Positioning
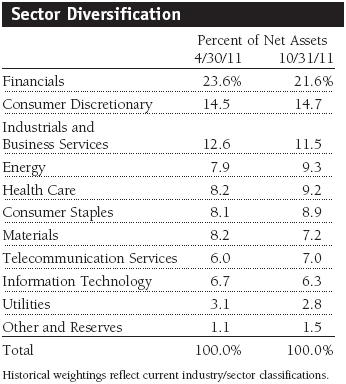
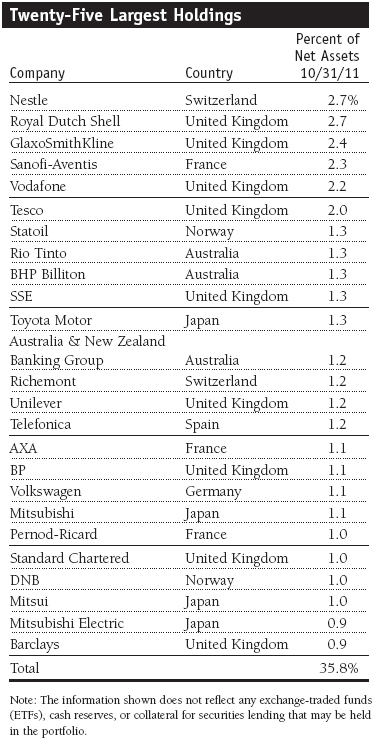
Financials continues to be our largest sector allocation, which is not unexpected given that it is the largest sector in our investable universe. Financials came under intense selling pressure amid the European debt crisis, slowing global economic growth, and the prospect of increased regulation. Although our holdings were not immune to the broader sell-off, a modest underweight position boosted returns relative to the benchmark. European banks, in particular, tumbled due to their exposure to troubled sovereign debt, punishing portfolio holdings Barclays, Societe Generale, and DNB Holdings. The portfolio’s European exposure is focused on northern Europe, especially Scandinavia, where the sovereign debt crisis has less impact and where valuations for many high-quality stocks have been very attractive. We established a new position in Swedish bank Svenska Handelsbanken, which is one of the best banks in the world, with excellent management, a low tolerance for credit risk, and an intense focus on cost control. Given our preference for insurers over traditional banks, we added to French multiline insurer AXA as valuations appeared oversold. We pared our position in Italian bank Intesa Sanpaolo due to concerns about its exposure to Italian sovereign debt and used the proceeds to increase positions in financials stocks with less exposure to the troubled European periphery. (Please refer to the portfolio of investments for a complete list of holdings and the amount each represents in the portfolio.)
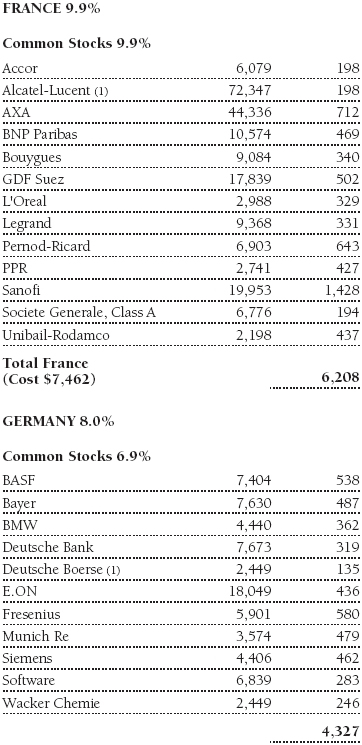
The slowing global economy weighed heavily on materials stocks, and the sector was among our weakest performers in absolute terms. Portfolio holdings in the metals and mining and chemical industries generated some of our biggest losses. Swedish steel maker SSAB declined amid falling demand expectations, while German chemical manufacturer Wacker Chemie was hit hard by falling polysilicon prices. A substantial underweight position versus the benchmark boosted relative returns, however. Although we have had a hard time justifying the high prices assigned to many materials stocks over the past 18 months, valuations are beginning to appear more reasonable after the recent sell-off. We took advantage of the volatility to increase our existing positions in mining companies BHP Billiton and Rio Tinto.
Health care was the portfolio’s top sector in absolute terms over the six-month period, and stock selection benefited relative returns. Pharmaceutical firms GlaxoSmithKline and Bayer were strong performers. GlaxoSmithKline has a good consumer franchise, and management has been aggressively trimming costs and rationalizing its research and development operations. Germany’s Bayer, a recently established position, owns an attractive portfolio of existing and future drugs. With a diverse business model that includes crop protection as well as pharmaceutical and material sciences, and with a majority of revenues coming from outside Europe, we believe Bayer is less vulnerable to a regional economic slowdown. We also took advantage of share price weakness to increase our holdings in French pharmaceuticals firm Sanofi-Aventis, which provides access to growth in emerging markets.
The consumer staples sector was close behind health care in terms of its absolute contribution. Japanese convenience retailer FamilyMart was a strong performer, benefiting from industry consolidation and good growth in Asian markets. We added to a number of high-quality, defensive positions as valuations became more reasonable, including Nestle and UK retailer Tesco. Nestle is the largest food and beverage company in the world and the portfolio’s largest holding. We continue to like the company’s potential for margin expansion, premium brands, and global distribution network with growing exposure to emerging markets. Despite modest growth in the UK, we expect Tesco to benefit from good international growth and its new CEO’s emphasis on back-to-basics retailing.
The consumer discretionary sector accounts for our second-largest allocation and a large overweight versus the MSCI benchmark. Positive stock selection helped our sector portfolio outpace the benchmark, but it declined in absolute terms. Shares in Japan’s Nikon performed well amid improving profit margins coming from digital cameras and the limited impact on procurement from the earthquake in March. Homebuilder Persimmon also boosted portfolio performance as the UK housing market has fared better than expected, and the company continues its exceptional execution. A small position in clothing brand Esprit Holdings weighed on returns as management struggled with brand and product positioning amid a deteriorating economic backdrop in its core European market.
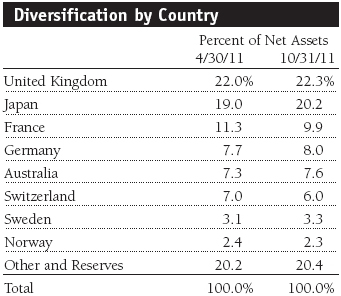
In terms of geographic positioning, European stocks continue to account for the bulk of the portfolio, in large part due to the high number of well-established, large-cap companies in the region. Although we remain underweight Europe versus the benchmark MSCI index amid heightened political and economic uncertainty, the risk-averse atmosphere has resulted in opportunities to purchase high-quality shares selling at compelling valuations.
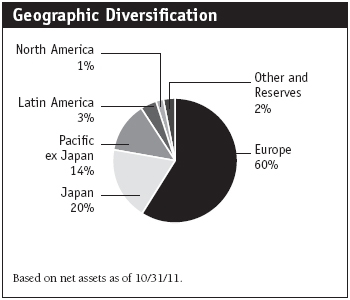
Japan is our second-largest geographic allocation, but we remain modestly underweight relative to the index. The Japanese economy and markets suffered a severe shock in the first half of the period in the wake of a massive earthquake, which resulted in a devastating tsunami and subsequent nuclear crisis. Amid depressed valuations, we added to some existing positions that should perform well as the economy recovers.
The Pacific ex Japan region is our third-largest allocation, and we have a modest overweight versus the portfolio’s primary benchmark. The region’s economies continue to expand rapidly, driven by long-term trends, such as rising levels of urbanization, industrialization, and domestic consumption. Some attractive buying opportunities opened up over the latter half of the reporting period as skittish investors turned increasingly risk averse. We have significant exposure to Australia, which should continue to benefit from growing trade with China and Southeast Asia.
Our Latin American holdings modestly underperformed the broader markets over the 6- and 12-month periods amid slowing economic growth rates and heightened risk aversion. Although economic growth is slowing, it remains strong, especially in comparison to the developed world. Deleveraging is not an issue in many of these economies, employment levels are healthy, wages are on the rise, and the “wealth effect” has the potential to create robust consumer demand for years to come. As in other regions, we found a number of opportunities amid the market sell-off.
Investment Outlook
We expect continued market volatility in the face of ongoing uncertainties in developed and emerging markets alike. In the developed world, leaders are using all of the policy levers at their disposal—tax, regulatory, fiscal, and monetary—as they struggle to solve burdensome government debt problems without driving their economies back into recession. Although a “growth recession,” characterized by weak economic growth and persistent unemployment, appears more likely in the U.S., Europe may already have lapsed into a “double dip” recession. At the same time, policymakers in emerging markets are walking a fine line as they try to contain inflationary pressures while continuing to promote economic growth. On the corporate side, executives are reluctant to make significant business investments in such an uncertain political, regulatory, and economic environment. However, given the underlying strength of corporate balance sheets and already low stock valuations, we expect markets to benefit once we achieve some clarity on viable long-term resolutions to these various issues.
While the current environment is challenging, we think the problems are more political than financial. We believe Europe must move away from a purely monetary union and work to integrate the fiscal policies of individual countries and restructure the economic constraints weighing on southern Europe. In the U.S., policymakers must find viable solutions to long- and short-term debt issues and chart a sustainable fiscal path. On the plus side, banks are better capitalized, liquidity has improved, and the overall financial system is on firmer ground than in the recent past. Importantly, downside support is compelling given low valuations that include appealing dividend yields, which are higher in many instances than government bond rates—a historically reliable indicator of equity value relative to other asset classes. In addition, corporate balance sheets are strong and are a source of potential return through share buybacks for companies with excess cash and high free cash flow. Stronger balance sheets may act as a cushion should hard times prevail for longer than anticipated.
As we move through this volatile and uncertain environment, we encourage shareholders to bear in mind our portfolio’s focus on attractive valuations and sound business models—essential elements of a fundamental investment process that should serve us well over time.
Respectfully submitted,

Raymond A. Mills
Chairman of the fund’s Investment Advisory Committee
November 21, 2011
The committee chairman has day-to-day responsibility for managing the portfolio and works with committee members in developing and executing the fund’s investment program.
| Risks of International Investing |
Funds that invest overseas generally carry more risk than funds that invest strictly in U.S. assets. Funds investing in a single country or in a limited geographic region tend to be riskier than more diversified funds. Risks can result from varying stages of economic and political development; differing regulatory environments, trading days, and accounting standards; and higher transaction costs of non-U.S. markets. Non-U.S. investments are also subject to currency risk, or a decline in the value of a foreign currency versus the U.S. dollar, which reduces the dollar value of securities denominated in that currency.
| Glossary |
Lipper averages: The averages of available mutual fund performance returns for specified time periods in defined categories by Lipper Inc.
MSCI EAFE Index: Widely accepted as the benchmark for international stock performance (EAFE refers to Europe, Australasia, and Far East). The index represents the major markets of the world.
Portfolio Highlights
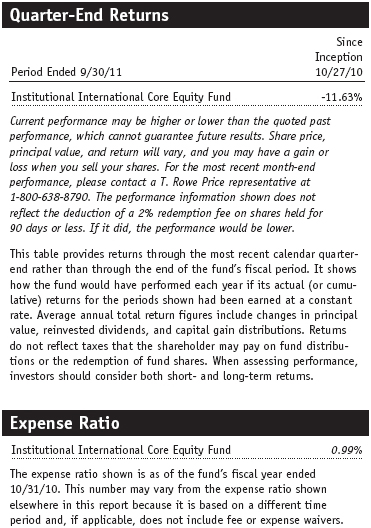
Performance and Expenses
T. Rowe Price Institutional International Core Equity Fund
| Performance Comparison |
This chart shows the value of a hypothetical $1 million investment in the fund over the past 10 fiscal year periods or since inception (for funds lacking 10-year records). The result is compared with benchmarks, which may include a broad-based market index and a peer group average or index. Market indexes do not include expenses, which are deducted from fund returns as well as mutual fund averages and indexes.
Fund Expense Example
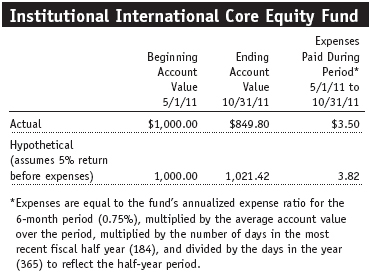
As a mutual fund shareholder, you may incur two types of costs: (1) transaction costs, such as redemption fees or sales loads, and (2) ongoing costs, including management fees, distribution and service (12b-1) fees, and other fund expenses. The following example is intended to help you understand your ongoing costs (in dollars) of investing in the fund and to compare these costs with the ongoing costs of investing in other mutual funds. The example is based on an investment of $1,000 invested at the beginning of the most recent six-month period and held for the entire period.
Actual Expenses
The first line of the following table (“Actual”) provides information about actual account values and actual expenses. You may use the information on this line, together with your account balance, to estimate the expenses that you paid over the period. Simply divide your account value by $1,000 (for example, an $8,600 account value divided by $1,000 = 8.6), then multiply the result by the number on the first line under the heading “Expenses Paid During Period” to estimate the expenses you paid on your account during this period.
Hypothetical Example for Comparison Purposes
The information on the second line of the table (“Hypothetical”) is based on hypothetical account values and expenses derived from the fund’s actual expense ratio and an assumed 5% per year rate of return before expenses (not the fund’s actual return). You may compare the ongoing costs of investing in the fund with other funds by contrasting this 5% hypothetical example and the 5% hypothetical examples that appear in the shareholder reports of the other funds. The hypothetical account values and expenses may not be used to estimate the actual ending account balance or expenses you paid for the period.
You should also be aware that the expenses shown in the table highlight only your ongoing costs and do not reflect any transaction costs, such as redemption fees or sales loads. Therefore, the second line of the table is useful in comparing ongoing costs only and will not help you determine the relative total costs of owning different funds. To the extent a fund charges transaction costs, however, the total cost of owning that fund is higher.
Financial Highlights
T. Rowe Price Institutional International Core Equity Fund
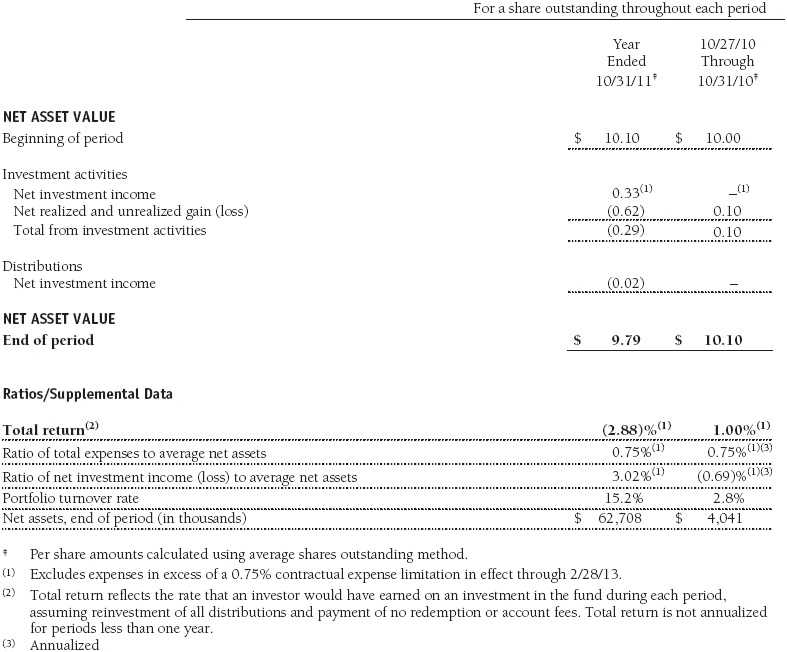
The accompanying notes are an integral part of these financial statements.
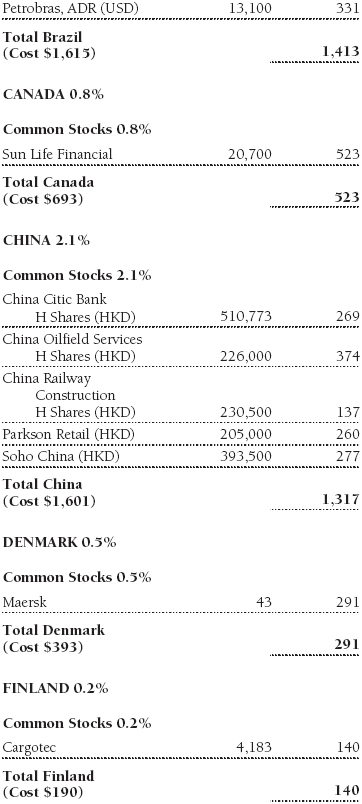
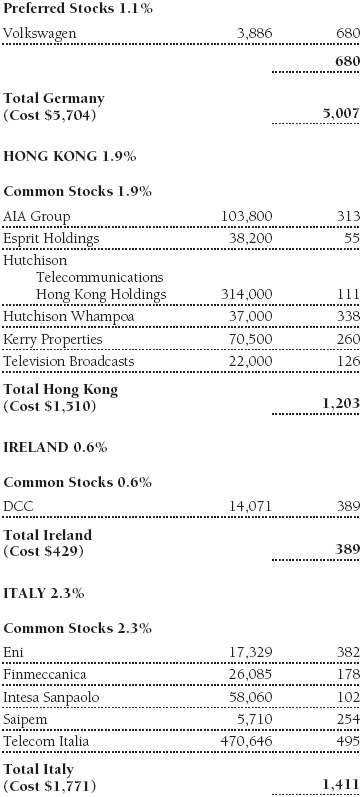
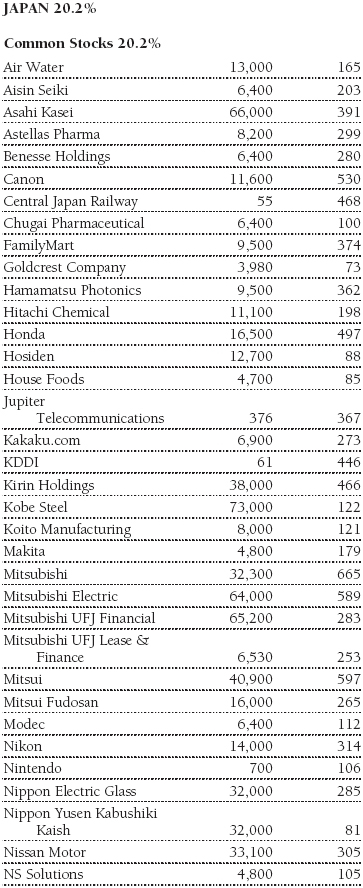
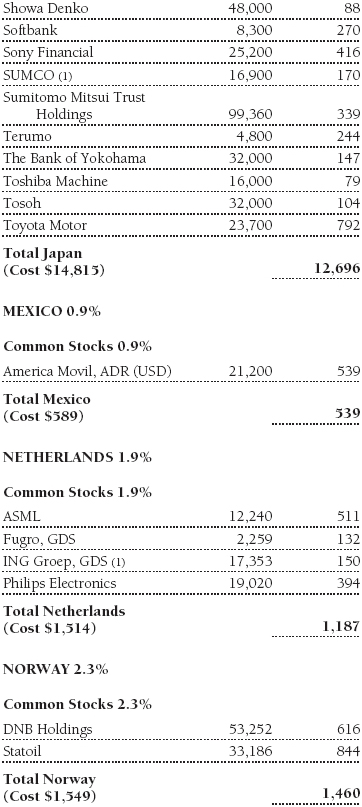
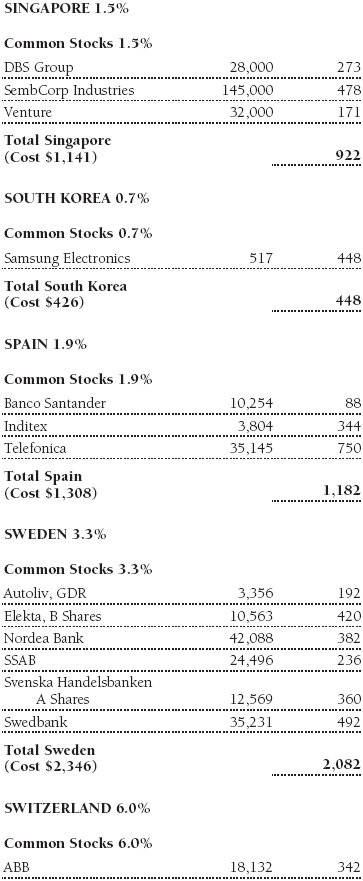
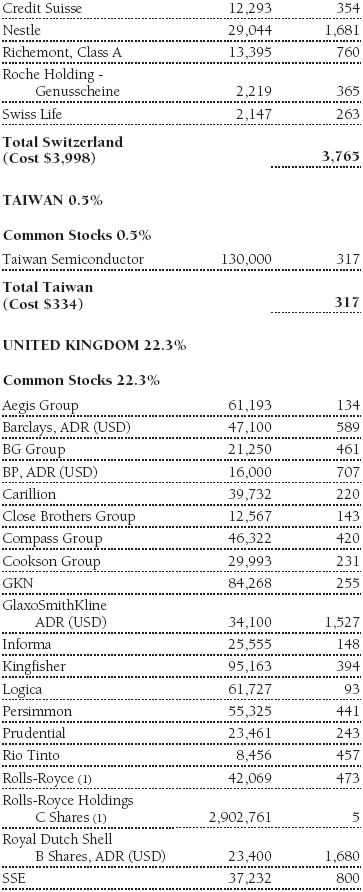
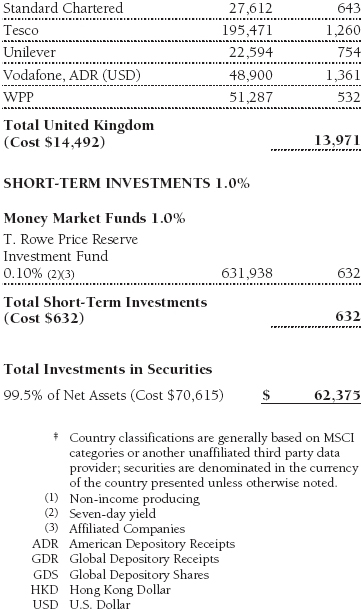
Portfolio of Investments‡
T. Rowe Price Institutional International Core Equity Fund
October 31, 2011
The accompanying notes are an integral part of these financial statements.
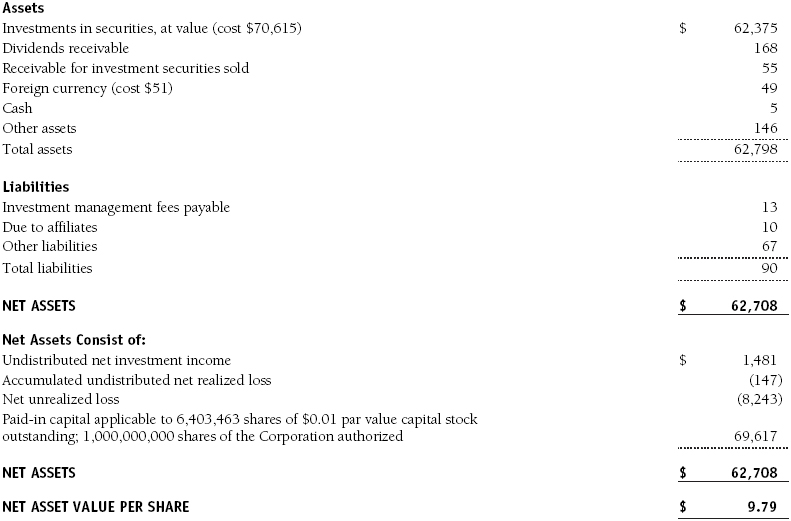
Statement of Assets and Liabilities
T. Rowe Price Institutional International Core Equity Fund
October 31, 2011
($000s, except shares and per share amounts)
The accompanying notes are an integral part of these financial statements.
Statement of Operations
T. Rowe Price Institutional International Core Equity Fund
($000s)
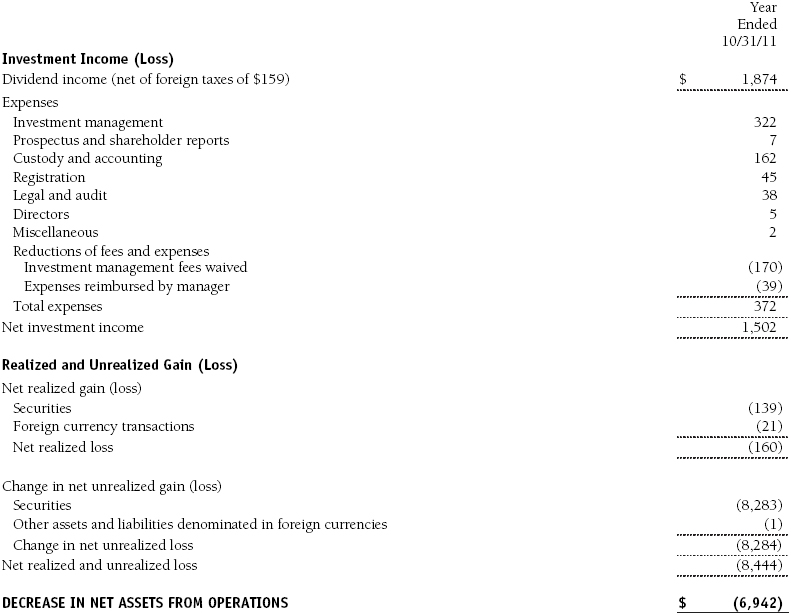
The accompanying notes are an integral part of these financial statements.
Statement of Changes in Net Assets
T. Rowe Price Institutional International Core Equity Fund
($000s)
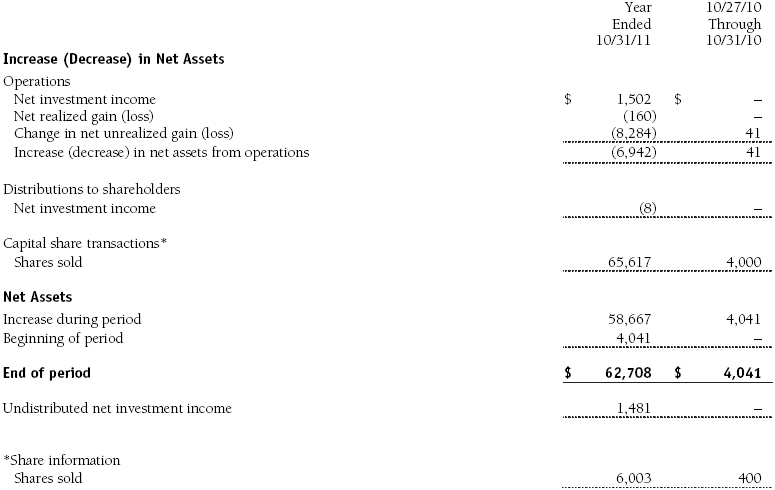
The accompanying notes are an integral part of these financial statements.
Notes to Financial Statements
T. Rowe Price Institutional International Core Equity Fund
October 31, 2011
T. Rowe Price Institutional International Funds, Inc. (the corporation), is registered under the Investment Company Act of 1940 (the 1940 Act). The Institutional International Core Equity Fund (the fund), a diversified, open-end management investment company, is one portfolio established by the corporation. The fund commenced operations on October 27, 2010. The fund seeks long-term growth of capital through investments in the common stocks of non-U.S. companies.
NOTE 1 - SIGNIFICANT ACCOUNTING POLICIES
Basis of Preparation The accompanying financial statements were prepared in accordance with accounting principles generally accepted in the United States of America (GAAP), which require the use of estimates made by management. Management believes that estimates and valuations are appropriate; however, actual results may differ from those estimates, and the valuations reflected in the accompanying financial statements may differ from the value ultimately realized upon sale or maturity.
Investment Transactions, Investment Income, and Distributions Income and expenses are recorded on the accrual basis. Dividends received from mutual fund investments are reflected as dividend income; capital gain distributions are reflected as realized gain/loss. Dividend income and capital gain distributions are recorded on the ex-dividend date. Income tax-related interest and penalties, if incurred, would be recorded as income tax expense. Investment transactions are accounted for on the trade date. Realized gains and losses are reported on the identified cost basis. Distributions to shareholders are recorded on the ex-dividend date. Income distributions are declared and paid annually. Capital gain distributions, if any, are generally declared and paid by the fund annually.
Currency Translation Assets, including investments, and liabilities denominated in foreign currencies are translated into U.S. dollar values each day at the prevailing exchange rate, using the mean of the bid and asked prices of such currencies against U.S. dollars as quoted by a major bank. Purchases and sales of securities, income, and expenses are translated into U.S. dollars at the prevailing exchange rate on the date of the transaction. The effect of changes in foreign currency exchange rates on realized and unrealized security gains and losses is reflected as a component of security gains and losses.
Credits The fund earns credits on temporarily uninvested cash balances held at the custodian, which reduce the fund’s custody charges. Custody expense in the accompanying financial statements is presented before reduction for credits.
Redemption Fees A 2% fee is assessed on redemptions of fund shares held for 90 days or less to deter short-term trading and to protect the interests of long-term shareholders. Redemption fees are withheld from proceeds that shareholders receive from the sale or exchange of fund shares. The fees are paid to the fund and are recorded as an increase to paid-in capital. The fees may cause the redemption price per share to differ from the net asset value per share.
In-Kind Subscriptions Under certain circumstances, and when considered to be in the best interest of the fund, the fund may accept portfolio securities rather than cash as payment for the purchase of fund shares (in-kind subscription). For financial reporting and tax purposes, the cost basis of contributed securities is equal to the market value of the securities on the date of contribution. In-kind subscriptions result in no gain or loss and no tax consequences for the fund. During the year ended October 31, 2011, the fund accepted $65,617,000 of in-kind subscriptions, including $63,202,000 from other T. Rowe Price funds.
NOTE 2 - VALUATION
The fund’s financial instruments are reported at fair value as defined by GAAP. The fund determines the values of its assets and liabilities and computes its net asset value per share at the close of the New York Stock Exchange (NYSE), normally 4 p.m. ET, each day that the NYSE is open for business.
Valuation Methods Equity securities listed or regularly traded on a securities exchange or in the over-the-counter (OTC) market are valued at the last quoted sale price or, for certain markets, the official closing price at the time the valuations are made, except for OTC Bulletin Board securities, which are valued at the mean of the latest bid and asked prices. A security that is listed or traded on more than one exchange is valued at the quotation on the exchange determined to be the primary market for such security. Listed securities not traded on a particular day are valued at the mean of the latest bid and asked prices for domestic securities and the last quoted sale price for international securities.
Investments in mutual funds are valued at the mutual fund’s closing net asset value per share on the day of valuation.
Other investments, including restricted securities and private placements, and those financial instruments for which the above valuation procedures are inappropriate or are deemed not to reflect fair value, are stated at fair value as determined in good faith by the T. Rowe Price Valuation Committee, established by the fund’s Board of Directors (the Board). Subject to oversight by the Board, the Valuation Committee develops pricing-related policies and procedures and approves all fair-value determinations. The Valuation Committee regularly makes good faith judgments, using a wide variety of sources and information, to establish and adjust valuations of certain securities as events occur and circumstances warrant. For instance, in determining the fair value of private-equity instruments, the Valuation Committee considers a variety of factors, including the company’s business prospects, its financial performance, strategic events impacting the company, relevant valuations of similar companies, new rounds of financing, and any negotiated transactions of significant size between other investors in the company. Because any fair-value determination involves a significant amount of judgment, there is a degree of subjectivity inherent in such pricing decisions.
For valuation purposes, the last quoted prices of non-U.S. equity securities may be adjusted under the circumstances described below. If the fund determines that developments between the close of a foreign market and the close of the NYSE will, in its judgment, materially affect the value of some or all of its portfolio securities, the fund will adjust the previous closing prices to reflect what it believes to be the fair value of the securities as of the close of the NYSE. In deciding whether it is necessary to adjust closing prices to reflect fair value, the fund reviews a variety of factors, including developments in foreign markets, the performance of U.S. securities markets, and the performance of instruments trading in U.S. markets that represent foreign securities and baskets of foreign securities. A fund may also fair value securities in other situations, such as when a particular foreign market is closed but the fund is open. The fund uses outside pricing services to provide it with closing prices and information to evaluate and/or adjust those prices. The fund cannot predict how often it will use closing prices and how often it will determine it necessary to adjust those prices to reflect fair value. As a means of evaluating its security valuation process, the fund routinely compares closing prices, the next day’s opening prices in the same markets, and adjusted prices. Additionally, trading in the underlying securities of the fund may take place in various foreign markets on certain days when the fund is not open for business and does not calculate a net asset value. As a result, net asset values may be significantly affected on days when shareholders cannot make transactions.
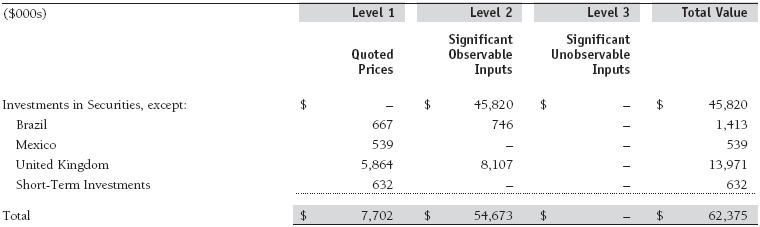
Valuation Inputs Various inputs are used to determine the value of the fund’s financial instruments. These inputs are summarized in the three broad levels listed below:
Level 1 – quoted prices in active markets for identical financial instruments
Level 2 – observable inputs other than Level 1 quoted prices (including, but not limited to, quoted prices for similar financial instruments, interest rates, prepayment speeds, and credit risk)
Level 3 – unobservable inputs
Observable inputs are those based on market data obtained from sources independent of the fund, and unobservable inputs reflect the fund’s own assumptions based on the best information available. The input levels are not necessarily an indication of the risk or liquidity associated with financial instruments at that level. For example, non-U.S. equity securities actively traded in foreign markets generally are reflected in Level 2 despite the availability of closing prices because the fund evaluates and determines whether those closing prices reflect fair value at the close of the NYSE or require adjustment, as described above. The following table summarizes the fund’s financial instruments, based on the inputs used to determine their values on October 31, 2011:
NOTE 3 - OTHER INVESTMENT TRANSACTIONS
Purchases and sales of portfolio securities other than short-term securities aggregated $73,350,000 and $7,213,000, respectively, for the year ended October 31, 2011.
NOTE 4 - FEDERAL INCOME TAXES
No provision for federal income taxes is required since the fund intends to continue to qualify as a regulated investment company under Subchapter M of the Internal Revenue Code and distribute to shareholders all of its taxable income and gains. Distributions determined in accordance with federal income tax regulations may differ in amount or character from net investment income and realized gains for financial reporting purposes. Financial reporting records are adjusted for permanent book/tax differences to reflect tax character but are not adjusted for temporary differences.
The fund files U.S. federal, state, and local tax returns as required. The fund’s tax returns are subject to examination by the relevant tax authorities until expiration of the applicable statute of limitations, which is generally three years after the filing of the tax return but which can be extended to six years in certain circumstances. Tax returns for open years have incorporated no uncertain tax positions that require a provision for income taxes.
Reclassifications between income and gain relate primarily to the character of net currency losses. For the year ended October 31, 2011, the following reclassifications were recorded to reflect tax character (there was no impact on results of operations or net assets):

Distributions during the periods ended October 31, 2011 and October 31, 2010 totaled $8,000 and $0, respectively, and were characterized as ordinary income for tax purposes. At October 31, 2011, the tax-basis cost of investments and components of net assets were as follows:
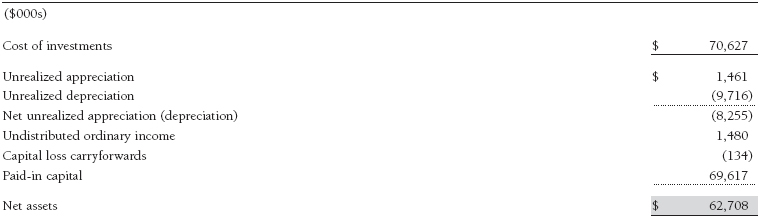
The fund intends to retain realized gains to the extent of available capital loss carryforwards. The fund’s available capital loss carryforwards as of October 31, 2011, all expire in fiscal 2019. As a result of the Regulated Investment Company Modernization Act of 2010, net capital losses realized in future fiscal years may be carried forward for an unlimited period of time but must be used before capital loss carryforwards with expiration dates. Accordingly, it is possible that a substantial portion of the fund’s current capital loss carryforwards could expire unused.
NOTE 5 - FOREIGN TAXES
The fund is subject to foreign income taxes imposed by certain countries in which it invests. Acquisition of certain foreign currencies related to security transactions are also subject to tax. Additionally, capital gains realized by the fund upon disposition of securities issued in or by certain foreign countries are subject to capital gains tax imposed by those countries. All taxes are computed in accordance with the applicable foreign tax law, and, to the extent permitted, capital losses are used to offset capital gains. Taxes attributable to income are accrued by the fund as a reduction of income. Taxes incurred on the purchase of foreign currencies are recorded as realized loss on foreign currency transactions. Current and deferred tax expense attributable to net capital gains is reflected as a component of realized and/or change in unrealized gain/loss on securities in the accompanying financial statements. At October 31, 2011, the fund had no deferred tax liability attributable to foreign securities and no foreign capital loss carryforwards.
NOTE 6 - RELATED PARTY TRANSACTIONS
The fund is managed by T. Rowe Price Associates, Inc. (Price Associates), a wholly owned subsidiary of T. Rowe Price Group, Inc. (Price Group). The investment management agreement between the fund and Price Associates provides for an annual investment management fee equal to 0.65% of the fund’s average daily net assets. The fee is computed daily and paid monthly.
The fund is also subject to a contractual expense limitation through February 28, 2013. During the limitation period, Price Associates is required to waive its management fee and reimburse the fund for any expenses, excluding interest, taxes, brokerage commissions, and extraordinary expenses, that would otherwise cause the fund’s ratio of annualized total expenses to average net assets (expense ratio) to exceed its expense limitation of 0.75%. For a period of three years after the date of any reimbursement or waiver, the fund is required to repay Price Associates for expenses previously reimbursed and management fees waived to the extent its net assets have grown or expenses have declined sufficiently to allow repayment without causing the fund’s expense ratio to exceed its expense limitation. Pursuant to this agreement, management fees in the amount of $170,000 were waived and expenses in the amount of $39,000 were reimbursed by Price Associates during the year ended October 31, 2011. Including these amounts, management fees waived and expenses previously reimbursed by Price Associates in the amount of $211,000 remain subject to repayment at October 31, 2011.
In addition, the fund has entered into service agreements with Price Associates and a wholly owned subsidiary of Price Associates (collectively, Price). Price Associates computes the daily share price and provides certain other administrative services to the fund. T. Rowe Price Services, Inc., provides shareholder and administrative services in its capacity as the fund’s transfer and dividend disbursing agent. For the year ended October 31, 2011, expenses incurred pursuant to these service agreements were $127,000 for Price Associates and less than $1,000 for T. Rowe Price Services, Inc. The total amount payable at period-end pursuant to these service agreements is reflected as Due to Affiliates in the accompanying financial statements.
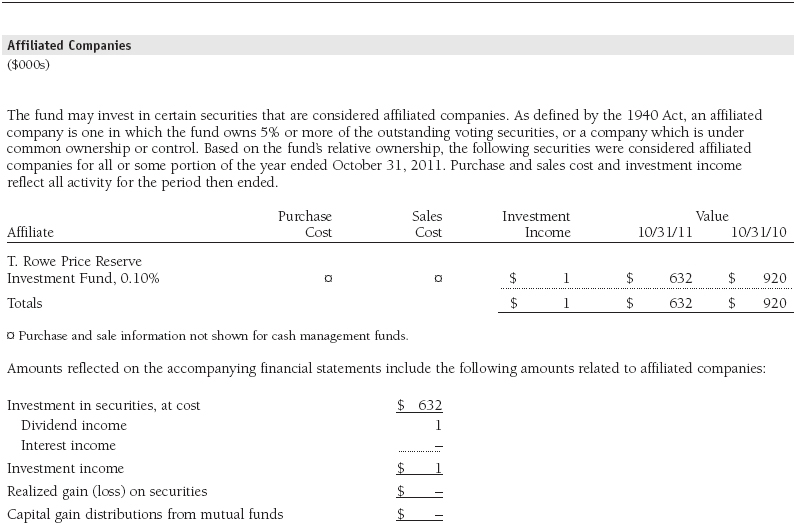
The fund may invest in the T. Rowe Price Reserve Investment Fund and the T. Rowe Price Government Reserve Investment Fund (collectively, the T. Rowe Price Reserve Investment Funds), open-end management investment companies managed by Price Associates and considered affiliates of the fund. The T. Rowe Price Reserve Investment Funds are offered as cash management options to mutual funds, trusts, and other accounts managed by Price Associates and/or its affiliates and are not available for direct purchase by members of the public. The T. Rowe Price Reserve Investment Funds pay no investment management fees.
As of October 31, 2011, T. Rowe Price Group, Inc., and/or its wholly owned subsidiaries owned 400,000 shares of the fund, representing 6% of the fund’s net assets.
Report of Independent Registered Public Accounting Firm
To the Board of Directors of T. Rowe Price Institutional International Funds, Inc. and Shareholders of T. Rowe Price Institutional International Core Equity Fund
In our opinion, the accompanying statement of assets and liabilities, including the portfolio of investments, and the related statements of operations and of changes in net assets and the financial highlights present fairly, in all material respects, the financial position of T. Rowe Price Institutional International Core Equity Fund (one of the portfolios comprising T. Rowe Price Institutional International Funds, Inc., hereafter referred to as the “Fund”) at October 31, 2011, the results of its operations for the year then ended, the changes in its net assets and the financial highlights for each of the fiscal periods presented, in conformity with accounting principles generally accepted in the United States of America. These financial statements and financial highlights (hereafter referred to as “financial statements”) are the responsibility of the Fund’s management; our responsibility is to express an opinion on these financial statements based on our audits. We conducted our audits of these financial statements in accordance with the standards of the Public Company Accounting Oversight Board (United States). Those standards require that we plan and perform the audit to obtain reasonable assurance about whether the financial statements are free of material misstatement. An audit includes examining, on a test basis, evidence supporting the amounts and disclosures in the financial statements, assessing the accounting principles used and significant estimates made by management, and evaluating the overall financial statement presentation. We believe that our audits, which included confirmation of securities at October 31, 2011 by correspondence with the custodian, and confirmation of the underlying funds by correspondence with the transfer agent, provide a reasonable basis for our opinion.
PricewaterhouseCoopers LLP
Baltimore, Maryland
December 16, 2011
| Tax Information (Unaudited) for the Tax Year Ended 10/31/11 |
We are providing this information as required by the Internal Revenue Code. The amounts shown may differ from those elsewhere in this report because of differences between tax and financial reporting requirements.
For taxable non-corporate shareholders, $1,648,000 of the fund’s income represents qualified dividend income subject to the 15% rate category.
For corporate shareholders, $3,000 of the fund’s income qualifies for the dividends-received deduction.
The fund will pass through foreign source income of $1,648,000 and foreign taxes paid of $159,000.
| Information on Proxy Voting Policies, Procedures, and Records |
A description of the policies and procedures used by T. Rowe Price funds and portfolios to determine how to vote proxies relating to portfolio securities is available in each fund’s Statement of Additional Information, which you may request by calling 1-800-225-5132 or by accessing the SEC’s website, sec.gov. The description of our proxy voting policies and procedures is also available on our website, troweprice.com. To access it, click on the words “Our Company” at the top of our corporate homepage. Then, when the next page appears, click on the words “Proxy Voting Policies” on the left side of the page.
Each fund’s most recent annual proxy voting record is available on our website and through the SEC’s website. To access it through our website, follow the directions above, then click on the words “Proxy Voting Records” on the right side of the Proxy Voting Policies page.
| How to Obtain Quarterly Portfolio Holdings |
The fund files a complete schedule of portfolio holdings with the Securities and Exchange Commission for the first and third quarters of each fiscal year on Form N-Q. The fund’s Form N-Q is available electronically on the SEC’s website (sec.gov); hard copies may be reviewed and copied at the SEC’s Public Reference Room, 450 Fifth St. N.W., Washington, DC 20549. For more information on the Public Reference Room, call 1-800-SEC-0330.
| About the Fund’s Directors and Officers |
Your fund is overseen by a Board of Directors (Board) that meets regularly to review a wide variety of matters affecting the fund, including performance, investment programs, compliance matters, advisory fees and expenses, service providers, and other business affairs. The Board elects the fund’s officers, who are listed in the final table. At least 75% of the Board’s members are independent of T. Rowe Price Associates, Inc. (T. Rowe Price), and its affiliates; “inside” or “interested” directors are employees or officers of T. Rowe Price. The business address of each director and officer is 100 East Pratt Street, Baltimore, Maryland 21202. The Statement of Additional Information includes additional information about the fund directors and is available without charge by calling a T. Rowe Price representative at 1-800-638-5660.
| Independent Directors | ||
| Name (Year of Birth) | Principal Occupation(s) and Directorships of Public Companies and Other Investment Companies During | |
| Year Elected | the Past Five Years | |
| William R. Brody (1944) | President and Trustee, Salk Institute for Biological Studies (2009 to present); Director, Novartis, Inc. (2009 | |
| 2009 | to present); Director, IBM (2007 to present); President and Trustee, Johns Hopkins University (1996 to 2009); | |
| Chairman of Executive Committee and Trustee, Johns Hopkins Health System (1996 to 2009) | ||
| Jeremiah E. Casey (1940) | Retired | |
| 2006 | ||
| Anthony W. Deering (1945) | Chairman, Exeter Capital, LLC, a private investment firm (2004 to present); Director, Under Armour (2008 to | |
| 1991 | present); Director, Vornado Real Estate Investment Trust (2004 to present); Director, Mercantile Bankshares | |
| (2002 to 2007); Director and Member of the Advisory Board, Deutsche Bank North America (2004 to present) | ||
| Donald W. Dick, Jr. (1943) | Principal, EuroCapital Partners, LLC, an acquisition and management advisory firm (1995 to present) | |
| 1989 | ||
| Karen N. Horn (1943) | Senior Managing Director, Brock Capital Group, an advisory and investment banking firm (2004 to present); | |
| 2003 | Director, Eli Lilly and Company (1987 to present); Director, Simon Property Group (2004 to present); Director, | |
| Norfolk Southern (2008 to present); Director, Fannie Mae (2006 to 2008) | ||
| Theo C. Rodgers (1941) | President, A&R Development Corporation (1977 to present) | |
| 2006 | ||
| John G. Schreiber (1946) | Owner/President, Centaur Capital Partners, Inc., a real estate investment company (1991 to present); Cofounder | |
| 2001 | and Partner, Blackstone Real Estate Advisors, L.P. (1992 to present); Director, General Growth Properties, Inc. | |
| (2010 to present) | ||
| Mark R. Tercek (1957) | President and Chief Executive Officer, The Nature Conservancy (2008 to present); Managing Director, The Goldman | |
| 2009 | Sachs Group, Inc. (1984 to 2008) | |
| *Each independent director oversees 130 T. Rowe Price portfolios and serves until retirement, resignation, or election of a successor. | ||
| Inside Directors | ||
| Name (Year of Birth) | ||
| Year Elected* [Number of T. Rowe | Principal Occupation(s) and Directorships of Public Companies and Other Investment Companies During | |
| Price Portfolios Overseen] | the Past Five Years | |
| Edward C. Bernard (1956) | Director and Vice President, T. Rowe Price; Vice Chairman of the Board, Director, and Vice President, T. Rowe Price | |
| 2006 [130] | Group, Inc.; Chairman of the Board, Director, and President, T. Rowe Price Investment Services, Inc.; Chairman | |
| of the Board and Director, T. Rowe Price Retirement Plan Services, Inc., T. Rowe Price Savings Bank, and T. Rowe | ||
| Price Services, Inc.; Chairman of the Board, Chief Executive Officer, and Director, T. Rowe Price International; | ||
| Chief Executive Officer, Chairman of the Board, Director, and President, T. Rowe Price Trust Company; Chairman | ||
| of the Board, all funds | ||
| Brian C. Rogers, CFA, CIC (1955) | Chief Investment Officer, Director, and Vice President, T. Rowe Price; Chairman of the Board, Chief Investment | |
| 2006 [74] | Officer, Director, and Vice President, T. Rowe Price Group, Inc.; Vice President, T. Rowe Price Trust Company | |
| *Each inside director serves until retirement, resignation, or election of a successor. | ||
| Officers | ||
| Name (Year of Birth) | ||
| Position Held With Institutional International Funds | Principal Occupation(s) | |
| Ulle Adamson, CFA (1979) | Vice President, T. Rowe Price Group, Inc., and T. Rowe Price International, | |
| Vice President | Inc. | |
| Christopher D. Alderson (1962) | Director and President–International Equity, T. Rowe Price International; | |
| President | Company’s Representative, Director, and Vice President, Price Hong Kong; | |
| Director and Vice President, Price Singapore; Vice President, T. Rowe Price | ||
| Group, Inc. | ||
| Paulina Amieva (1981) | Vice President, T. Rowe Price Group, Inc., and T. Rowe Price International | |
| Vice President | ||
| Oliver Bell, IMC (1969) | Vice President, T. Rowe Price International; formerly Head of Global | |
| Executive Vice President | Emerging Markets Research, Pictet Asset Management Ltd. (to 2011); | |
| Portfolio Manager of Africa and Middle East portfolios and other emerging | ||
| markets strategies, Pictet Asset Management Ltd. (to 2009) | ||
| R. Scott Berg, CFA (1972) | Vice President, T. Rowe Price and T. Rowe Price Group, Inc. | |
| Executive Vice President | ||
| Mark C.J. Bickford-Smith (1962) | Vice President, T. Rowe Price Group, Inc., and T. Rowe Price International | |
| Executive Vice President | ||
| José Costa Buck (1972) | Vice President, T. Rowe Price Group, Inc., and T. Rowe Price International | |
| Vice President | ||
| Richard N. Clattenburg, CFA (1979) | Vice President, T. Rowe Price, T. Rowe Price Group, Inc., and T. Rowe Price | |
| Executive Vice President | International | |
| Michael J. Conelius, CFA (1964) | Vice President, T. Rowe Price, T. Rowe Price Group, Inc., T. Rowe Price | |
| Executive Vice President | International, and T. Rowe Price Trust Company | |
| Richard de los Reyes (1975) | Vice President, T. Rowe Price and T. Rowe Price Group, Inc.; formerly | |
| Vice President | Analyst, Soros Fund Management (to 2006) | |
| Mark J.T. Edwards (1957) | Vice President, T. Rowe Price Group, Inc., and T. Rowe Price International | |
| Executive Vice President | ||
| David J. Eiswert, CFA (1972) | Vice President, T. Rowe Price, T. Rowe Price Group, Inc., and T. Rowe Price | |
| Vice President | International | |
| Roger L. Fiery III, CPA (1959) | Vice President, Price Hong Kong, Price Singapore, T. Rowe Price, T. Rowe | |
| Vice President | Price Group, Inc., T. Rowe Price International, and T. Rowe Price Trust | |
| Company | ||
| Robert N. Gensler (1957) | Vice President, T. Rowe Price, T. Rowe Price Group, Inc., and T. Rowe Price | |
| Executive Vice President | International | |
| John R. Gilner (1961) | Chief Compliance Officer and Vice President, T. Rowe Price; Vice President, | |
| Chief Compliance Officer | T. Rowe Price Group, Inc., and T. Rowe Price Investment Services, Inc. | |
| Gregory S. Golczewski (1966) | Vice President, T. Rowe Price and T. Rowe Price Trust Company | |
| Vice President | ||
| M. Campbell Gunn (1956) | Vice President, T. Rowe Price Group, Inc., and T. Rowe Price International | |
| Vice President | ||
| Gregory K. Hinkle, CPA (1958) | Vice President, T. Rowe Price, T. Rowe Price Group, Inc., and T. Rowe Price | |
| Treasurer | Trust Company; formerly Partner, PricewaterhouseCoopers LLP (to 2007) | |
| Leigh Innes, CFA (1976) | Vice President, T. Rowe Price Group, Inc., and T. Rowe Price International | |
| Vice President | ||
| Randal Spero Jenneke (1971) | Vice President, T. Rowe Price Group, Inc., and T. Rowe Price International; | |
| Vice President | formerly Senior Portfolio Manager, Australian Equities (to 2010) | |
| Kris H. Jenner, M.D., D.Phil. (1962) | Vice President, T. Rowe Price, T. Rowe Price Group, Inc., and T. Rowe Price | |
| Vice President | International | |
| Yoichiro Kai (1973) | Vice President, T. Rowe Price Group, Inc., and T. Rowe Price International; | |
| Vice President | formerly Japanese Financial/Real Estate Sector Analyst/Portfolio Manager, | |
| Citadel Investment Group, Asia Limited (to 2009); Research Analyst, | ||
| Japanese Equities & Sector Fund Portfolio Manager, Fidelity Investments | ||
| Japan Limited (to 2007) | ||
| Andrew J. Keirle (1974) | Vice President, T. Rowe Price Group, Inc., and T. Rowe Price International | |
| Executive Vice President | ||
| Ian D. Kelson (1956) | President–International Fixed Income, T. Rowe Price International; Vice | |
| Executive Vice President | President, T. Rowe Price and T. Rowe Price Group, Inc. | |
| Mark J. Lawrence (1970) | Vice President, T. Rowe Price Group, Inc., and T. Rowe Price International | |
| Vice President | ||
| David M. Lee, CFA (1962) | Vice President, T. Rowe Price and T. Rowe Price Group, Inc. | |
| Vice President | ||
| Patricia B. Lippert (1953) | Assistant Vice President, T. Rowe Price and T. Rowe Price Investment | |
| Secretary | Services, Inc. | |
| Anh Lu (1968) | Vice President, Price Hong Kong and T. Rowe Price Group, Inc. | |
| Vice President | ||
| Daniel Martino, CFA (1974) | Vice President, T. Rowe Price and T. Rowe Price Group, Inc.; formerly | |
| Vice President | Research Analyst and Co-portfolio Manager, Taurus Asset Management | |
| (to 2006) and Onex Public Markets Group (to 2006) | ||
| Jonathan H.W. Matthews, CFA (1975) | Vice President, T. Rowe Price Group, Inc., and T. Rowe Price International; | |
| Vice President | formerly Analyst, Pioneer Investments (to 2008) | |
| Susanta Mazumdar (1968) | Vice President, Price Singapore and T. Rowe Price Group, Inc. | |
| Vice President | ||
| Raymond A. Mills, Ph.D., CFA (1960) | Vice President, T. Rowe Price, T. Rowe Price Group, Inc., T. Rowe Price | |
| Executive Vice President | International, and T. Rowe Price Trust Company | |
| Joshua Nelson (1977) | Vice President, T. Rowe Price and T. Rowe Price Group, Inc. | |
| Executive Vice President | ||
| Jason Nogueira, CFA (1974) | Vice President, T. Rowe Price and T. Rowe Price Group, Inc. | |
| Executive Vice President | ||
| David Oestreicher (1967) | Director and Vice President, T. Rowe Price Investment Services, Inc., | |
| Vice President | T. Rowe Price Retirement Plan Services, Inc., T. Rowe Price Services, Inc., | |
| and T. Rowe Price Trust Company; Vice President, Price Hong Kong, Price | ||
| Singapore, T. Rowe Price, T. Rowe Price Group, Inc., and T. Rowe Price | ||
| International | ||
| Gonzalo Pángaro, CFA (1968) | Vice President, T. Rowe Price Group, Inc., and T. Rowe Price International | |
| Executive Vice President | ||
| Timothy E. Parker, CFA (1974) | Vice President, T. Rowe Price and T. Rowe Price Group, Inc. | |
| Vice President | ||
| Frederick A. Rizzo (1969) | Vice President, T. Rowe Price Group, Inc., and T. Rowe Price International; | |
| Vice President | formerly Analyst, F&C Asset Management (London) (to 2006) | |
| Christopher J. Rothery (1963) | Vice President, T. Rowe Price Group, Inc., and T. Rowe Price International | |
| Executive Vice President | ||
| Federico Santilli, CFA (1974) | Vice President, T. Rowe Price Group, Inc., and T. Rowe Price International | |
| Executive Vice President | ||
| Sebastian Schrott (1977) | Vice President, T. Rowe Price Group, Inc., and T. Rowe Price International | |
| Vice President | ||
| Deborah D. Seidel (1962) | Vice President, T. Rowe Price, T. Rowe Price Group, Inc., and T. Rowe Price | |
| Vice President | Investment Services, Inc.; Assistant Treasurer and Vice President, T. Rowe | |
| Price Services, Inc. | ||
| Robert W. Sharps, CFA, CPA (1971) | Vice President, T. Rowe Price, T. Rowe Price Group, Inc., and T. Rowe Price | |
| Vice President | Trust Company | |
| Robert W. Smith (1961) | Vice President, T. Rowe Price, and T. Rowe Price Group, Inc., and T. Rowe | |
| Executive Vice President | Price Trust Company | |
| Jonty Starbuck, Ph.D. (1975) | Vice President, T. Rowe Price Group, Inc., and T. Rowe Price International | |
| Vice President | ||
| Dean Tenerelli (1964) | Vice President, T. Rowe Price Group, Inc., and T. Rowe Price International | |
| Vice President | ||
| Eric L. Veiel, CFA (1972) | Vice President, T. Rowe Price and T. Rowe Price Group, Inc. | |
| Vice President | ||
| Julie L. Waples (1970) | Vice President, T. Rowe Price | |
| Vice President | ||
| Christopher S. Whitehouse (1972) | Vice President, T. Rowe Price Group, Inc., and T. Rowe Price International | |
| Vice President | ||
| Unless otherwise noted, officers have been employees of T. Rowe Price or T. Rowe Price International for at least 5 years. | ||
Item 2. Code of Ethics.
The registrant has adopted a code of ethics, as defined in Item 2 of Form N-CSR, applicable to its principal executive officer, principal financial officer, principal accounting officer or controller, or persons performing similar functions. A copy of this code of ethics is filed as an exhibit to this Form N-CSR. No substantive amendments were approved or waivers were granted to this code of ethics during the period covered by this report.
Item 3. Audit Committee Financial Expert.
The registrant’s Board of Directors/Trustees has determined that Mr. Anthony W. Deering qualifies as an audit committee financial expert, as defined in Item 3 of Form N-CSR. Mr. Deering is considered independent for purposes of Item 3 of Form N-CSR.
Item 4. Principal Accountant Fees and Services.
(a) – (d) Aggregate fees billed to the registrant for the last two fiscal years for professional services rendered by the registrant’s principal accountant were as follows:
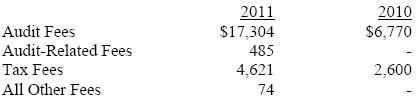
Audit fees include amounts related to the audit of the registrant’s annual financial statements and services normally provided by the accountant in connection with statutory and regulatory filings. Audit-related fees include amounts reasonably related to the performance of the audit of the registrant’s financial statements and specifically include the issuance of a report on internal controls and, if applicable, agreed-upon procedures related to fund acquisitions. Tax fees include amounts related to services for tax compliance, tax planning, and tax advice. The nature of these services specifically includes the review of distribution calculations and the preparation of Federal, state, and excise tax returns. All other fees include the registrant’s pro-rata share of amounts for agreed-upon procedures in conjunction with service contract approvals by the registrant’s Board of Directors/Trustees.
(e)(1) The registrant’s audit committee has adopted a policy whereby audit and non-audit services performed by the registrant’s principal accountant for the registrant, its investment adviser, and any entity controlling, controlled by, or under common control with the investment adviser that provides ongoing services to the registrant require pre-approval in advance at regularly scheduled audit committee meetings. If such a service is required between regularly scheduled audit committee meetings, pre-approval may be authorized by one audit committee member with ratification at the next scheduled audit committee meeting. Waiver of pre-approval for audit or non-audit services requiring fees of a de minimis amount is not permitted.
(2) No services included in (b) – (d) above were approved pursuant to paragraph (c)(7)(i)(C) of Rule 2-01 of Regulation S-X.
(f) Less than 50 percent of the hours expended on the principal accountant’s engagement to audit the registrant’s financial statements for the most recent fiscal year were attributed to work performed by persons other than the principal accountant’s full-time, permanent employees.
(g) The aggregate fees billed for the most recent fiscal year and the preceding fiscal year by the registrant’s principal accountant for non-audit services rendered to the registrant, its investment adviser, and any entity controlling, controlled by, or under common control with the investment adviser that provides ongoing services to the registrant were $1,632,000 and $1,429,000, respectively.
(h) All non-audit services rendered in (g) above were pre-approved by the registrant’s audit committee. Accordingly, these services were considered by the registrant’s audit committee in maintaining the principal accountant’s independence.
Item 5. Audit Committee of Listed Registrants.
Not applicable.
Item 6. Investments.
(a) Not applicable. The complete schedule of investments is included in Item 1 of this Form N-CSR.
(b) Not applicable.
Item 7. Disclosure of Proxy Voting Policies and Procedures for Closed-End Management Investment Companies.
Not applicable.
Item 8. Portfolio Managers of Closed-End Management Investment Companies.
Not applicable.
Item 9. Purchases of Equity Securities by Closed-End Management Investment Company and Affiliated Purchasers.
Not applicable.
Item 10. Submission of Matters to a Vote of Security Holders.
Not applicable.
Item 11. Controls and Procedures.
(a) The registrant’s principal executive officer and principal financial officer have evaluated the registrant’s disclosure controls and procedures within 90 days of this filing and have concluded that the registrant’s disclosure controls and procedures were effective, as of that date, in ensuring that information required to be disclosed by the registrant in this Form N-CSR was recorded, processed, summarized, and reported timely.
(b) The registrant’s principal executive officer and principal financial officer are aware of no change in the registrant’s internal control over financial reporting that occurred during the registrant’s second fiscal quarter covered by this report that has materially affected, or is reasonably likely to materially affect, the registrant’s internal control over financial reporting.
Item 12. Exhibits.
(a)(1) The registrant’s code of ethics pursuant to Item 2 of Form N-CSR is attached.
(b) A certification by the registrant's principal executive officer and principal financial officer, pursuant to Section 906 of the Sarbanes-Oxley Act of 2002 and required by Rule 30a-2(b) under the Investment Company Act of 1940, is attached.
SIGNATURES
Pursuant to the requirements of the Securities Exchange Act of 1934 and the Investment Company Act of 1940, the registrant has duly caused this report to be signed on its behalf by the undersigned, thereunto duly authorized.
T. Rowe Price Institutional International Funds, Inc.
| By | /s/ Edward C. Bernard |
| Edward C. Bernard | |
| Principal Executive Officer | |
| Date | December 16, 2011 |
Pursuant to the requirements of the Securities Exchange Act of 1934 and the Investment Company Act of 1940, this report has been signed below by the following persons on behalf of the registrant and in the capacities and on the dates indicated.
| By | /s/ Edward C. Bernard |
| Edward C. Bernard | |
| Principal Executive Officer | |
| Date | December 16, 2011 |
| By | /s/ Gregory K. Hinkle |
| Gregory K. Hinkle | |
| Principal Financial Officer | |
| Date | December 16, 2011 |