UNITED STATES
SECURITIES AND EXCHANGE COMMISSION
Washington, D.C. 20549
FORM N-CSR
CERTIFIED SHAREHOLDER REPORT OF REGISTERED
MANAGEMENT INVESTMENT COMPANIES
Investment Company Act File Number: 811-05833
| T. Rowe Price Institutional International Funds, Inc. |
|
| (Exact name of registrant as specified in charter) |
| |
| 100 East Pratt Street, Baltimore, MD 21202 |
|
| (Address of principal executive offices) |
| |
| David Oestreicher |
| 100 East Pratt Street, Baltimore, MD 21202 |
|
| (Name and address of agent for service) |
Registrant’s telephone number, including area code: (410) 345-2000
Date of fiscal year end: October 31
Date of reporting period: April 30, 2012
Item 1. Report to Shareholders
Institutional International Growth
Equity Fund | April 30, 2012 |
- International stock markets posted positive returns in the six months ended April 30, 2012.
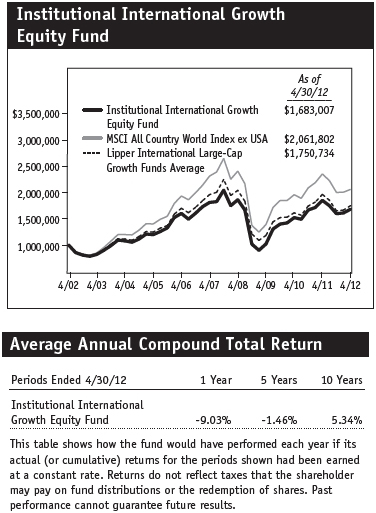
- Your fund gained 5.42% and outperformed its benchmark index.
- We continue to focus on buying companies with durable global franchises that can grow their earnings and cash flow at a double-digit rate over the long term.
- Our research is uncovering attractive growth opportunities across a broad array of international stock markets, and we remain especially encouraged by the long-term prospects for emerging markets.
The views and opinions in this report were current as of April 30, 2012. They are not guarantees of performance or investment results and should not be taken as investment advice. Investment decisions reflect a variety of factors, and the managers reserve the right to change their views about individual stocks, sectors, and the markets at any time. As a result, the views expressed should not be relied upon as a forecast of the fund’s future investment intent. The report is certified under the Sarbanes-Oxley Act, which requires mutual funds and other public companies to affirm that, to the best of their knowledge, the information in their financial reports is fairly and accurately stated in all material respects.
Manager’s Letter
T. Rowe Price Institutional International Growth Equity Fund
Dear Investor
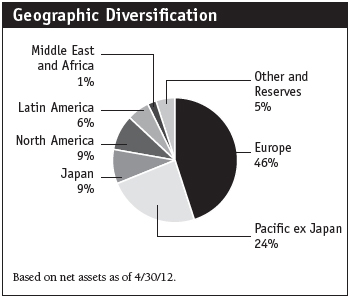
We are pleased to report positive results for the six months ended April 30, 2012. Despite a tumultuous ride for investors, we adhered to our disciplined stock selection process and maintained our focus on generating long-term outperformance. We continue to favor emerging economies where we see strong growth prospects over the intermediate and longer terms. The portfolio remains broadly diversified across regions, countries, and sectors and focused on companies with the best long-term growth prospects.
Performance Review
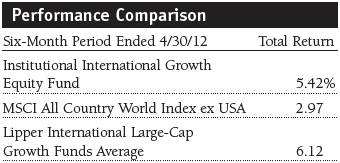
The Institutional International Growth Equity Fund returned 5.42% for the six months ended April 30, 2012. As shown in the Performance Comparison table, the fund outperformed the benchmark MSCI All Country World Index ex USA but trailed the Lipper International Large-Cap Growth Funds Average. Performance versus the MSCI index benefited from stock selection in the industrials and business services and consumer staples sectors. However, stock picking in the financials and consumer discretionary sectors hurt our relative results. Overall, our sector allocation decisions generated strong positive contributions, although underweight allocations in health care and financials detracted modestly from our comparison with the MSCI benchmark. We did a good job selecting stocks in the UK and continental Europe, but stock selection in Latin America and the Pacific ex Japan region hurt the fund’s comparison with the benchmark.
Portfolio Strategy
Through the market malaise in the back half of 2011 and the subsequent rally in 2012, we stayed with our core investment philosophy—buying high-quality growth companies that have a competitive advantage in their respective markets. Since the bear market low in early 2009, the fund has delivered unusually strong absolute results. The portfolio focuses on long-term performance and shuns fad investments and momentum trading. We believe that over the long term, stock prices move with earnings and cash flow growth, meaning simply that if a company grows free cash flow by 15% a year, its stock should appreciate at roughly the same rate. We search for companies that have the potential to generate double-digit earnings growth over time by participating in expanding markets, taking market share, or improving profitability faster than sales. We think that if we can find those companies and pay a fair price for their stock, we can compound absolute returns at double-digit levels and provide solid long-term relative returns.
With this objective in mind, our industry analysts, as well as other T. Rowe Price portfolio managers, attempt to find companies that fit these criteria. We look for the best stocks wherever we may find them rather than employing a regional, country, or sector focus. While we take note of the broad economic conditions in regions and countries, the portfolio’s composition is primarily determined by individual stock considerations.
As I write this letter, my investment decisions are being shaped by the following views:
- Growth in Europe and Japan will likely be subdued for a while.
- Growth in the larger emerging markets should accelerate from below-average levels.
- Consumer spending in emerging markets should continue to be a strong global growth driver.
- The European debt crisis will take longer to resolve than I previously expected.
- Government policy continues to be onerous for corporations.
At the end of the day, we are stock pickers. The portfolio’s overweight to developing countries is primarily due to their attractive valuations and greater growth opportunities over the intermediate- and longer-term horizons. For example, I expect China to ease monetary policy, which should cause its growth to accelerate. At the same time, Brazil has experienced three consecutive quarters of 1% gross domestic product growth. I underestimated the volatility of the Brazilian economy, and it hurt our financial holdings and the portfolio’s recent results. Though global growth may be slowing, emerging economies face fewer headwinds due to their stronger fiscal positions compared with mature markets, and they have more flexibility to respond to challenges that may arise.
Market Environment

Overall, non-U.S. stock markets posted solid returns for the six-month period ended April 30, 2012. Results in the period were largely driven by investor optimism about progress in resolving the European debt crisis in January and February. While most agree that the eurozone financial crisis is not over, the European Central Bank’s infusion of liquidity to its banking system (through the long-term refinancing operation, known as the LTRO) and a regional agreement to slash deficits have reduced borrowing costs and, at least for the time being, assured investors about the safety of the euro. The LTRO reduced the tail risk of a liquidity event for European sovereign financing over the next two or three years as banks bought sovereign bonds, which helped to drive yields down to more sustainable (but still elevated) levels.
What Keeps Me Awake at Night
Many years back, when my daughter was young she asked me what I did at work. My reply to her was, “I worry, so that other people don’t have to worry.” Worrying is still a big part of my job. Fund shareholders have trusted me to invest their hard-earned money, and I take that fiduciary responsibility very seriously. While there is always plenty to worry about in an ever-changing investment landscape, in the past few years the scope of my concern has widened in part because there is a higher-than-normal likelihood that some unanticipated event could derail the markets and our portfolio holdings. So while my daughter counts sheep, I toss and turn, worrying about government actions and the rationale for each investment thesis because I have learned that good investment returns are often the result of misplaced or mispriced worry.
My first significant concern, government intervention, has the potential to hurt portfolio returns anywhere in the world. In Brazil, for example, the government forced its largest oil company to commit capital to lower-return and long-dated projects. The company subsequently issued equity, which diluted value for existing shareholders and hurt stock performance. In India, several portfolio holdings were hamstrung by ineffective government policies relating to oversight on power projects. The result has been massive delays and subpar returns for these companies. In Europe, our financials were hammered by government actions, including lowering rates and imposing higher capital requirements. European stocks and currencies have been hurt by governments’ desires to hold the euro together without taking the needed actions to accomplish the task.
My second concern—monitoring the “why” I own a stock—is usually what I worry about the most, although lately it has been overshadowed by the previous worry. I’ve spent many a sleepless night pondering whether my investment thesis on a particular stock will play out the way I anticipated. I realize that not all investment theses will be successful, but regularly reviewing the holdings and rationalizing the potential and pitfalls allows me to respond to changing events and forces me to regularly ask what if.
Finally, incessant worry and attempts to completely avoid risk can hurt results. I’ve written before about my contrarian bent, and that’s because I believe that worry is regularly misplaced, and it often leads to opportunity in mispriced stocks. For example, a muddy track might make a bettor worry about wagering on the fastest horse. However, if the odds on that horse increase substantially due to the conditions, the worry may be more than factored in and present great opportunity. In summary, there is a lot that keeps me awake at night, but I hope that in the morning it leads me to ask the right questions and take the proper actions.
Portfolio Review
Our holdings in the industrials and business services sector were the top contributors in the past six months. The portfolio is focused on companies that can generate durable growth in industries that display positive secular attributes, such as trading companies, professional services, and construction and engineering firms. Germany-based industrial and specialty chemicals distributor Brenntag was among our best contributors. It buys bulk chemicals and repackages them for sale to smaller companies. The company has a large global footprint and markets products in 160 countries in Asia, Europe, and the Americas. It has done a good job of taking market share and exploiting the “middleman” role. Brenntag also adds value to its products by combining chemicals for resale. In addition, it has grown through acquisitions, buying companies and then cutting costs and improving margins. Investors have rewarded this well-managed company for generating steady growth and improving margins. (Please refer to the fund’s portfolio of investments for a complete list of holdings and the amount each represents in the portfolio.)
Experian, another strong contributor, provides credit services and ratings. The UK-based company has U.S. operations and also conducts a rapidly growing business in Brazil. Its business is not overly sensitive to the economy, but in mid-2011 the company’s revenues slowed substantially. Business has picked up significantly this year, margins have steadily widened, and the company generates steady free cash flow. Experian has expanded its services in Brazil and is building market share. Sarana Menara Nusantara is an Indonesian tower company operating more than 5,000 sites for lease to wireless communications companies. The management team, formerly with American Tower, is growing revenues organically and through several strategic acquisitions. The company generates double-digit income growth and consistent cash flow.
Indian industrial conglomerate Jaiprakash Associates continued to perform poorly, and we eliminated it from the portfolio. The Indian road and power project management firm faces significant headwinds. In addition to taking on a lot of debt, its cement business has suffered as prices compressed. Although Jaiprakash was not implicated in any of the recently publicized Indian corruption issues, concern about widespread graft hurt the valuations for many Indian equities. Kuehne & Nagel, another significant detractor in the industrials space, is a freight-forwarding and logistics company that specializes in international transport. It contracts with air, sea, and ground transportation companies and resells their services to its customers. The stock has been an excellent long-term performer but sold off in the last six months as global trade slowed. The company generates a high return on invested capital, and we continue to like its profit prospects.
Consumer discretionary was the fund’s second-best sector contributor. Media holdings were the top industry group, led by the exceptionally strong stock returns for WPP. In the first few months of 2012, we locked in some of our gains in UK-listed WPP, which is a holding company for hundreds of advertising and marketing firms with operations around the world. After a tough stretch in 2011, the stock rebounded handsomely in 2012, and as the risk/reward trade-off became less compelling, we took some profits. However, even after trimming the position, it remains the portfolio’s largest holding. The firm has improved its margins through aggressive cost-cutting, and it continues to take market share. The stock trades for about 11 times 2012’s forecast earnings, and we believe that it can grow earnings at a double-digit clip for several years. Liberty Global, another top six-month performer, is a leading European cable company that bundles cable, phone, and Internet for its customers. The firm’s management team has consistently generated mid-single-digit revenue growth and is producing steadily improving profit margins as its capital spending needs abate. Management has been deploying the company’s solid cash flow to repurchase shares and make selected acquisitions. We believe that Liberty Global can continue to create value over time, and it remains among the fund’s largest holdings.
Among our acquisitions in the past six months, Priceline.com was a standout performer, while Eutelsat declined. Priceline.com is an online travel company, offering hotel room reservations and travel services, including airline tickets, car rentals, and vacation packages. The company has diverse geographic exposure and is growing rapidly across its key markets—Asia, Latin America, and North America. We believe that Priceline can continue to take market share and generate solid long-term growth. Paris-based Eutelsat is Europe’s leading satellite operator, broadcasting more than 4,000 television stations and 1,100 radio stations in Africa, Asia, Europe, and the Americas. The company reported decent operating results in the second half of 2011, but issues with renewing contracts hurt the company’s near-term prospects.
Our largest elimination and a significant detractor in the consumer discretionary sector during the past six months was Ctrip.com International. Ctrip is the dominant travel services company in China through a combination of agency and Internet sales, generating the majority of its revenues from packaging air travel and hotel accommodations. While the stock had been a good performer in prior periods, market and economic weakness produced poor results in the current period, and we believe the company may face several tough quarters ahead. In addition, the company’s leading position in Internet travel sales is now being challenged by aggressive competitors, which could crimp margins. We also eliminated BMW, one the world’s leading luxury vehicle manufacturers. We added the stock in the third quarter of 2011 after a steep sell-off because we thought the market was pricing in an overly bearish scenario for its future growth prospects. The shares surged early in the fourth quarter, but the stock was a modest detractor in the six-month reporting period.
Samsung Electronics and Tencent Holdings were among the best performers in the information technology sector. We added to our position in Baidu, the leading Chinese Internet search company, on weakness. Although it was a modest detractor for the period, it is now the portfolio’s second-largest holding. In the consumer staples sector, Anheuser-Busch InBev and Danish beer maker Carlsberg were strong contributors following weakness in prior reporting periods. Our financial holdings generated mixed performance. Large positions in Hong Kong-based AIA Group and UK-based Standard Chartered posted solid results. However, Credit Suisse, Banco Santander (Spain), and Brazil’s Banco Itau and Banco Santander Brasil were among our largest detractors for the past six months.
Investment Outlook
It appears that the market is placing a very high price on safety and perceived certainty. Investors are unwilling to pay for “other side of the valley” riskier assets. In other words, the market is focused on the short term and is shunning most investments that have any degree of economic or country-specific risk. It seems that the highest-quality defensive companies in Europe are now somewhat overpriced, and there are better long-term opportunities in stocks that have a bit more economic risk.
European stock markets are likely to face a period of fits and starts as investors assess and respond to the uncertain macroeconomic landscape. The economic outlook for the region is for modest growth with many countries facing recession in the first half of 2012. We believe that Greece’s ability to remain a euro member is becoming more challenging. We hope that Spain and Italy can significantly improve their fiscal positions before Greece leaves (or is asked to leave) the eurozone.
Emerging markets could continue to experience heightened volatility over the next year, but they should outperform developed markets because of their better growth prospects. If we are right, those markets could recoup much of their multiyear underperformance. We believe that China will engineer a soft landing, growth will begin to accelerate in Asia, and Europe will not implode. This conviction has led us to add to positions in stocks that have performed poorly in the consumer discretionary, health care, and industrials and business services sectors. These could be viewed as contrarian shifts, but our talented research team is finding great opportunities to take additional financial risk and add to companies that have solid growth prospects at what we think are discount prices.
As part of our stock selection process, we review and assess the financial, economic, and political risks for each holding. In our opinion, the uncertainty surrounding most financial companies was more than discounted in their stock prices. At the end of the period, we modestly added to several well-positioned financials that appeared to be oversold. Emerging markets performance has been disappointing, but our view is that Brazil, for example, is taking the right actions and its economy should improve in the coming quarters. Similarly, we think China will ease monetary policy through the third quarter, and we could see the economy improve in the fourth quarter and into 2013. We will attempt to identify and invest in what we believe are the most attractive companies for long-term investors while maintaining a broadly diversified portfolio across sectors and countries.
Respectfully submitted,

Robert W. Smith
Chairman of the Investment Advisory Committee
May 18, 2012
The committee chairman has day-to-day responsibility for managing the portfolio and works with committee members in developing and executing the fund’s investment program.
| Risks of International Investing |
Funds that invest overseas generally carry more risk than funds that invest strictly in U.S. assets. Funds investing in a single country or in a limited geographic region tend to be riskier than more diversified funds. Risks can result from varying stages of economic and political development; differing regulatory environments, trading days, and accounting standards; and higher transaction costs of non-U.S. markets. Non-U.S. investments are also subject to currency risk, or a decline in the value of a foreign currency versus the U.S. dollar, which reduces the dollar value of securities denominated in that currency.
Lipper averages: The averages of available mutual fund performance returns for specified time periods in categories defined by Lipper Inc.
MSCI All Country World Index ex USA: An index that measures equity market performance of developed and emerging countries, excluding the U.S.
Portfolio Highlights
Performance and Expenses
T. Rowe Price Institutional International Growth Equity Fund
This chart shows the value of a hypothetical $1 million investment in the fund over the past 10 fiscal year periods or since inception (for funds lacking 10-year records). The result is compared with benchmarks, which may include a broad-based market index and a peer group average or index. Market indexes do not include expenses, which are deducted from fund returns as well as mutual fund averages and indexes.
Fund Expense Example
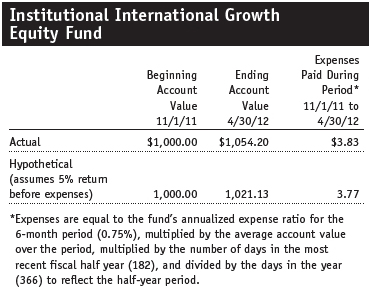
As a mutual fund shareholder, you may incur two types of costs: (1) transaction costs, such as redemption fees or sales loads, and (2) ongoing costs, including management fees, distribution and service (12b-1) fees, and other fund expenses. The following example is intended to help you understand your ongoing costs (in dollars) of investing in the fund and to compare these costs with the ongoing costs of investing in other mutual funds. The example is based on an investment of $1,000 invested at the beginning of the most recent six-month period and held for the entire period.
Actual Expenses
The first line of the following table (“Actual”) provides information about actual account values and actual expenses. You may use the information on this line, together with your account balance, to estimate the expenses that you paid over the period. Simply divide your account value by $1,000 (for example, an $8,600 account value divided by $1,000 = 8.6), then multiply the result by the number on the first line under the heading “Expenses Paid During Period” to estimate the expenses you paid on your account during this period.
Hypothetical Example for Comparison Purposes
The information on the second line of the table (“Hypothetical”) is based on hypothetical account values and expenses derived from the fund’s actual expense ratio and an assumed 5% per year rate of return before expenses (not the fund’s actual return). You may compare the ongoing costs of investing in the fund with other funds by contrasting this 5% hypothetical example and the 5% hypothetical examples that appear in the shareholder reports of the other funds. The hypothetical account values and expenses may not be used to estimate the actual ending account balance or expenses you paid for the period.
You should also be aware that the expenses shown in the table highlight only your ongoing costs and do not reflect any transaction costs, such as redemption fees or sales loads. Therefore, the second line of the table is useful in comparing ongoing costs only and will not help you determine the relative total costs of owning different funds. To the extent a fund charges transaction costs, however, the total cost of owning that fund is higher.
Financial Highlights
T. Rowe Price Institutional International Growth Equity Fund
(Unaudited)
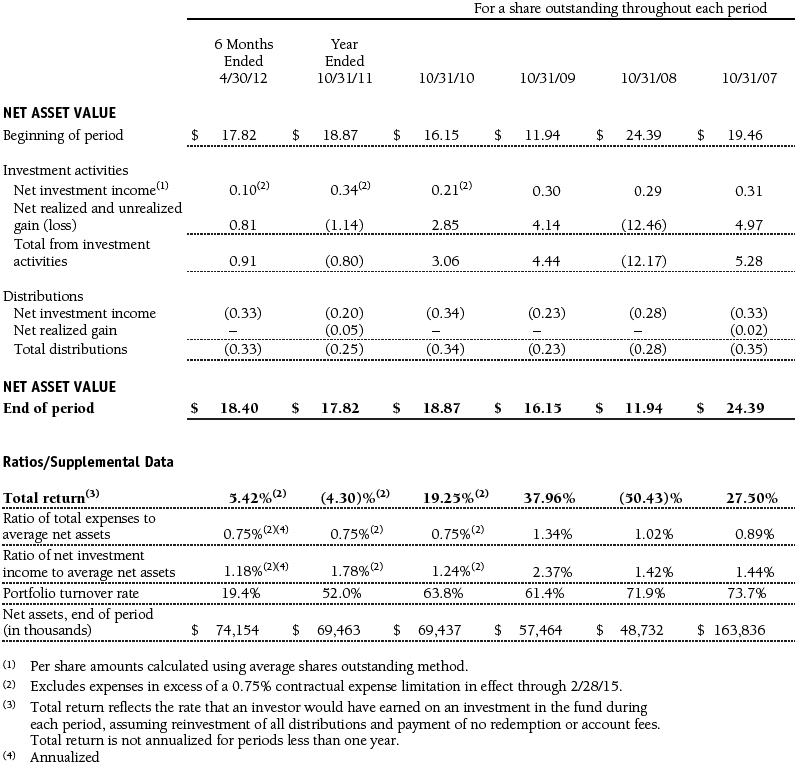
The accompanying notes are an integral part of these financial statements.
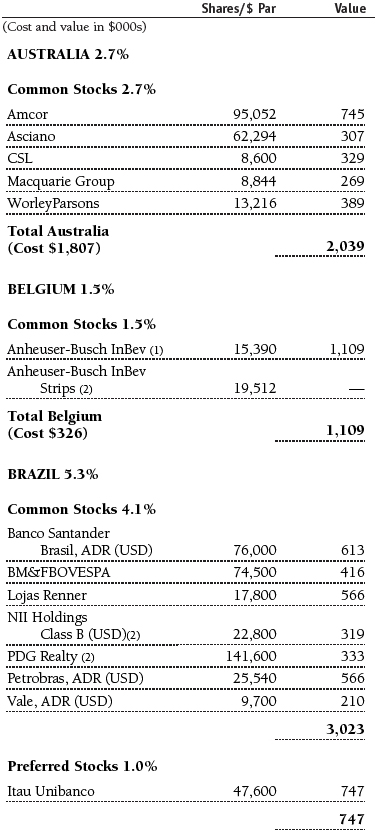
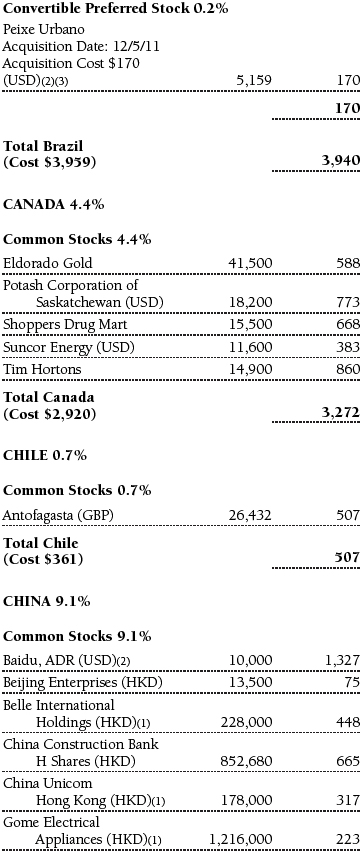
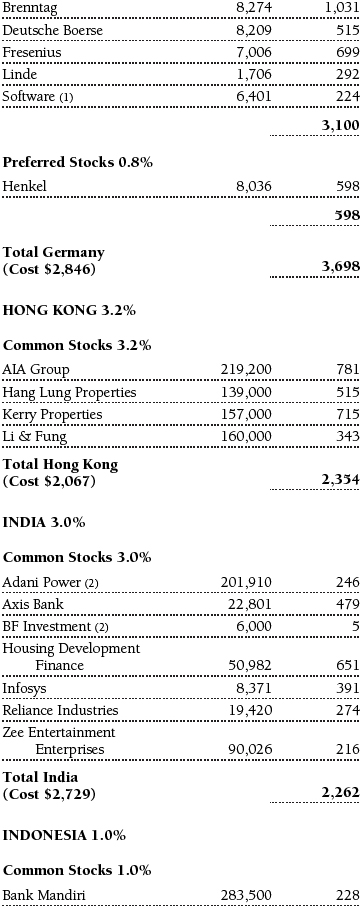
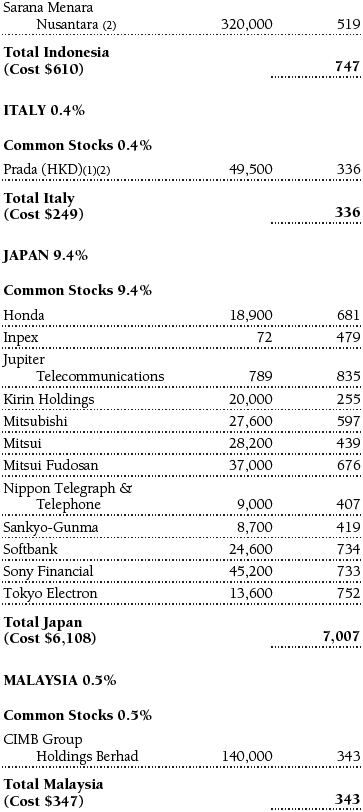
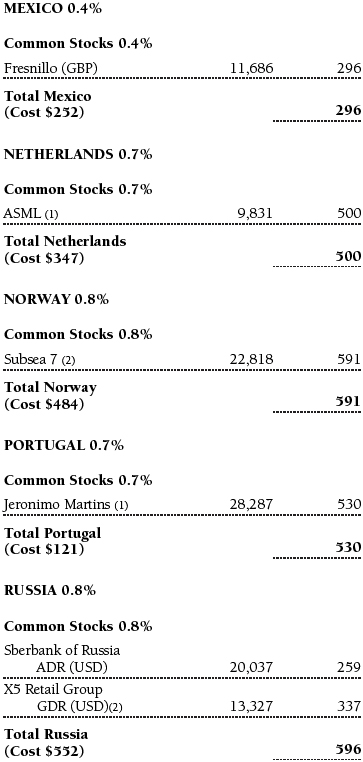
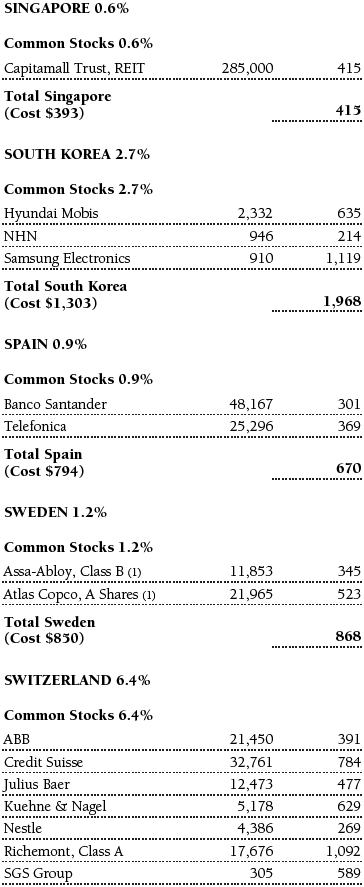
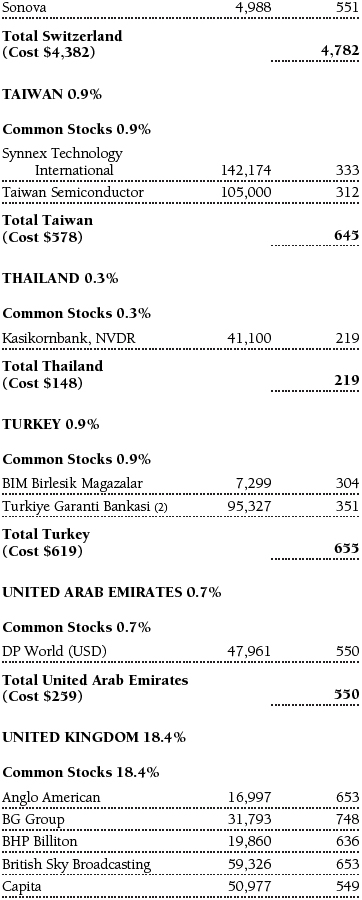
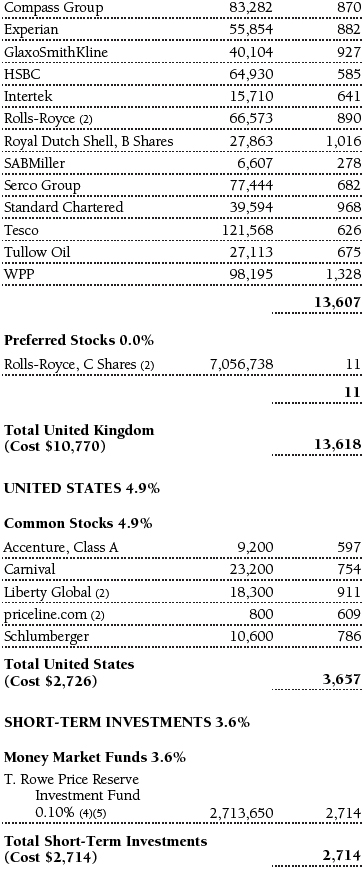
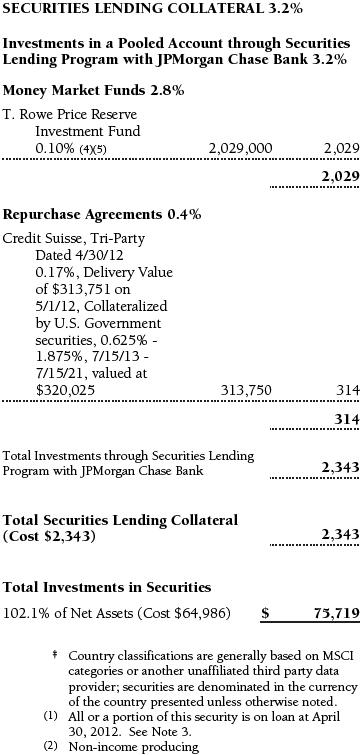
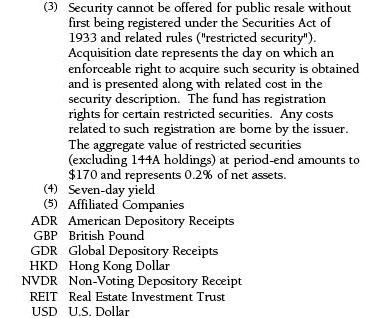
Portfolio of Investments‡
T. Rowe Price Institutional International Growth Equity Fund
April 30, 2012 (Unaudited)


The accompanying notes are an integral part of these financial statements.
Statement of Assets and Liabilities
T. Rowe Price Institutional International Growth Equity Fund
April 30, 2012 (Unaudited)
($000s, except shares and per share amounts)
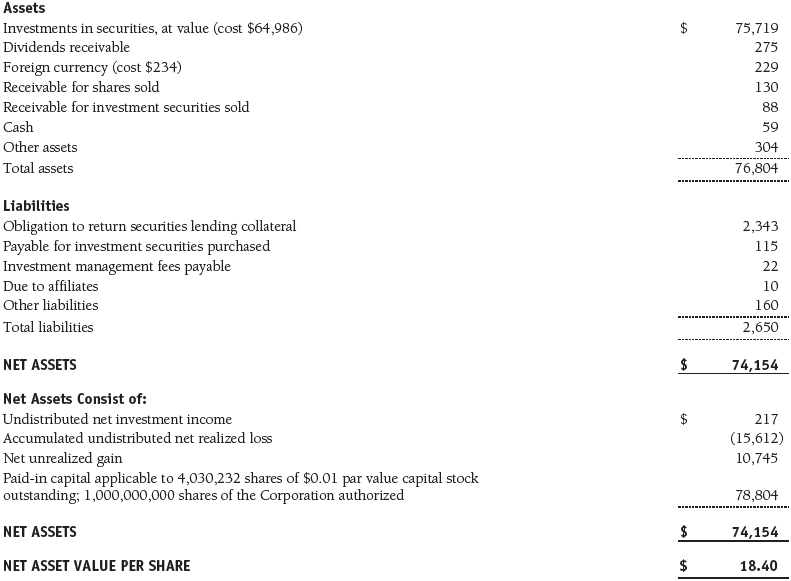
The accompanying notes are an integral part of these financial statements.
Statement of Operations
T. Rowe Price Institutional International Growth Equity Fund
(Unaudited)
($000s)
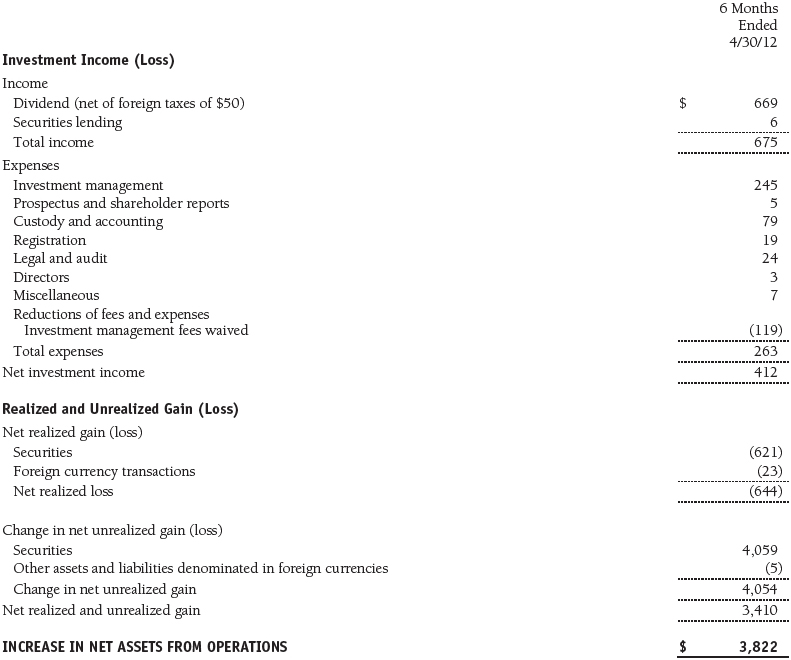
The accompanying notes are an integral part of these financial statements.
Statement of Changes in Net Assets
T. Rowe Price Institutional International Growth Equity Fund
(Unaudited)
($000s)
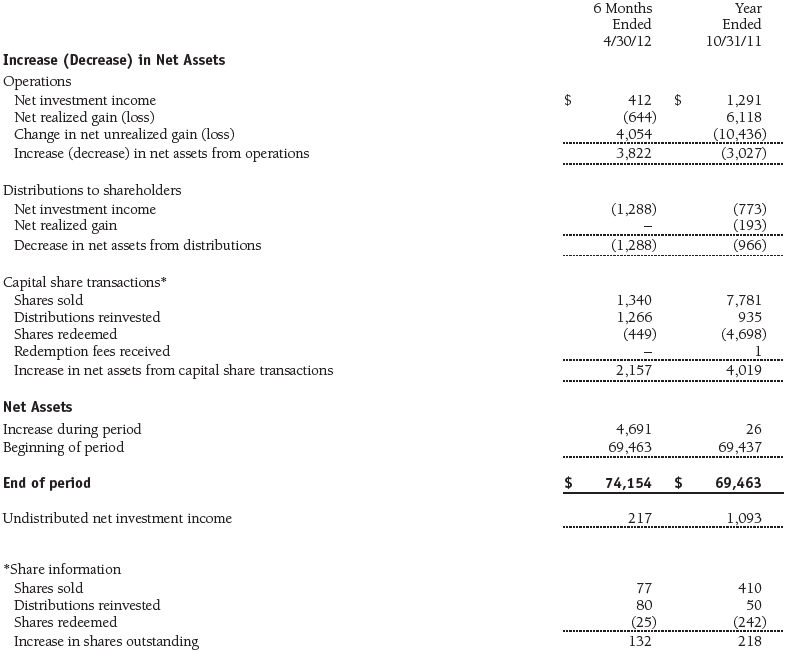
The accompanying notes are an integral part of these financial statements.
Notes to Financial Statements
T. Rowe Price Institutional International Growth Equity Fund
April 30, 2012 (Unaudited)
T. Rowe Price Institutional International Funds, Inc. (the corporation), is registered under the Investment Company Act of 1940 (the 1940 Act). The Institutional International Growth Equity Fund (the fund) is a diversified, open-end management investment company established by the corporation. The fund commenced operations on September 7, 1989. The fund seeks long-term growth of capital through investments primarily in the common stocks of established, non-U.S. companies.
NOTE 1 - SIGNIFICANT ACCOUNTING POLICIES
Basis of Preparation The accompanying financial statements were prepared in accordance with accounting principles generally accepted in the United States of America (GAAP), which require the use of estimates made by management. Management believes that estimates and valuations are appropriate; however, actual results may differ from those estimates, and the valuations reflected in the accompanying financial statements may differ from the value ultimately realized upon sale or maturity.
Investment Transactions, Investment Income, and Distributions Income and expenses are recorded on the accrual basis. Premiums and discounts on debt securities are amortized for financial reporting purposes. Dividends received from mutual fund investments are reflected as dividend income; capital gain distributions are reflected as realized gain/loss. Dividend income and capital gain distributions are recorded on the ex-dividend date. Income tax-related interest and penalties, if incurred, would be recorded as income tax expense. Investment transactions are accounted for on the trade date. Realized gains and losses are reported on the identified cost basis. Distributions to shareholders are recorded on the ex-dividend date. Income distributions are declared and paid annually. Capital gain distributions, if any, are generally declared and paid by the fund annually.
Currency Translation Assets, including investments, and liabilities denominated in foreign currencies are translated into U.S. dollar values each day at the prevailing exchange rate, using the mean of the bid and asked prices of such currencies against U.S. dollars as quoted by a major bank. Purchases and sales of securities, income, and expenses are translated into U.S. dollars at the prevailing exchange rate on the date of the transaction. The effect of changes in foreign currency exchange rates on realized and unrealized security gains and losses is reflected as a component of security gains and losses.
Credits The fund earns credits on temporarily uninvested cash balances held at the custodian, which reduce the fund’s custody charges. Custody expense in the accompanying financial statements is presented before reduction for credits.
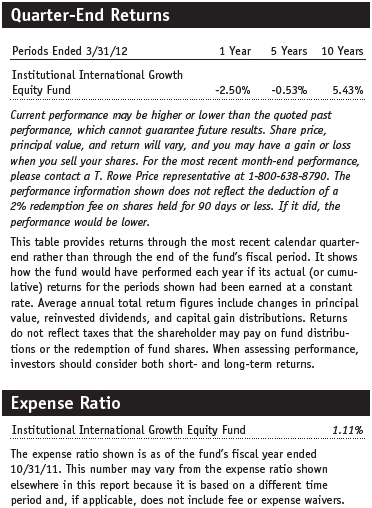
Redemption Fees A 2% fee is assessed on redemptions of fund shares held for 90 days or less to deter short-term trading and to protect the interests of long-term shareholders. Redemption fees are withheld from proceeds that shareholders receive from the sale or exchange of fund shares. The fees are paid to the fund and are recorded as an increase to paid-in capital. The fees may cause the redemption price per share to differ from the net asset value per share.
New Accounting Pronouncements In May 2011, the Financial Accounting Standards Board (FASB) issued amended guidance to align fair value measurement and disclosure requirements in U.S. GAAP with International Financial Reporting Standards. The guidance is effective for fiscal years and interim periods beginning on or after December 15, 2011. Adoption will have no effect on net assets or results of operations.
In December 2011, the FASB issued amended guidance to enhance disclosure for offsetting assets and liabilities. The guidance is effective for fiscal years and interim periods beginning on or after January 1, 2013; adoption will have no effect on the fund’s net assets or results of operations.
NOTE 2 - VALUATION
The fund’s financial instruments are reported at fair value as defined by GAAP. The fund determines the values of its assets and liabilities and computes its net asset value per share at the close of the New York Stock Exchange (NYSE), normally 4 p.m. ET, each day that the NYSE is open for business.
Valuation Methods Equity securities listed or regularly traded on a securities exchange or in the over-the-counter (OTC) market are valued at the last quoted sale price or, for certain markets, the official closing price at the time the valuations are made, except for OTC Bulletin Board securities, which are valued at the mean of the latest bid and asked prices. A security that is listed or traded on more than one exchange is valued at the quotation on the exchange determined to be the primary market for such security. Listed securities not traded on a particular day are valued at the mean of the latest bid and asked prices for domestic securities and the last quoted sale price for international securities. Debt securities with remaining maturities of less than one year at the time of acquisition generally use amortized cost in local currency to approximate fair value. However, if amortized cost is deemed not to reflect fair value or the fund holds a significant amount of such securities with remaining maturities of more than 60 days, the securities are valued at prices furnished by dealers who make markets in such securities or by an independent pricing service.
Investments in mutual funds are valued at the mutual fund’s closing net asset value per share on the day of valuation.
Other investments, including restricted securities and private placements, and those financial instruments for which the above valuation procedures are inappropriate or are deemed not to reflect fair value, are stated at fair value as determined in good faith by the T. Rowe Price Valuation Committee, established by the fund’s Board of Directors (the Board). Subject to oversight by the Board, the Valuation Committee develops pricing-related policies and procedures and approves all fair-value determinations. The Valuation Committee regularly makes good faith judgments, using a wide variety of sources and information, to establish and adjust valuations of certain securities as events occur and circumstances warrant. For instance, in determining the fair value of private-equity instruments, the Valuation Committee considers a variety of factors, including the company’s business prospects, its financial performance, strategic events impacting the company, relevant valuations of similar companies, new rounds of financing, and any negotiated transactions of significant size between other investors in the company. Because any fair-value determination involves a significant amount of judgment, there is a degree of subjectivity inherent in such pricing decisions.
For valuation purposes, the last quoted prices of non-U.S. equity securities may be adjusted under the circumstances described below. If the fund determines that developments between the close of a foreign market and the close of the NYSE will, in its judgment, materially affect the value of some or all of its portfolio securities, the fund will adjust the previous closing prices to reflect what it believes to be the fair value of the securities as of the close of the NYSE. In deciding whether it is necessary to adjust closing prices to reflect fair value, the fund reviews a variety of factors, including developments in foreign markets, the performance of U.S. securities markets, and the performance of instruments trading in U.S. markets that represent foreign securities and baskets of foreign securities. A fund may also fair value securities in other situations, such as when a particular foreign market is closed but the fund is open. The fund uses outside pricing services to provide it with closing prices and information to evaluate and/or adjust those prices. The fund cannot predict how often it will use closing prices and how often it will determine it necessary to adjust those prices to reflect fair value. As a means of evaluating its security valuation process, the fund routinely compares closing prices, the next day’s opening prices in the same markets, and adjusted prices. Additionally, trading in the underlying securities of the fund may take place in various foreign markets on certain days when the fund is not open for business and does not calculate a net asset value. As a result, net asset values may be significantly affected on days when shareholders cannot make transactions.
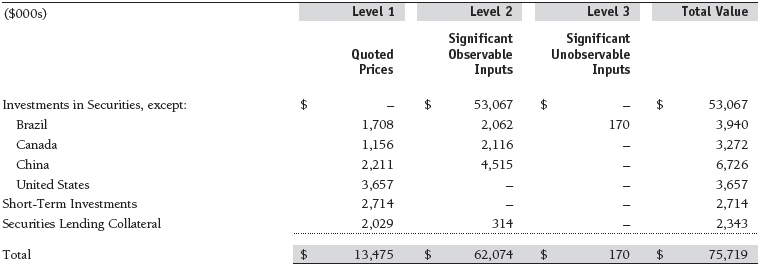
Valuation Inputs Various inputs are used to determine the value of the fund’s financial instruments. These inputs are summarized in the three broad levels listed below:
Level 1 – quoted prices in active markets for identical financial instruments
Level 2 – observable inputs other than Level 1 quoted prices (including, but not limited to, quoted prices for similar financial instruments, interest rates, prepayment speeds, and credit risk)
Level 3 – unobservable inputs
Observable inputs are those based on market data obtained from sources independent of the fund, and unobservable inputs reflect the fund’s own assumptions based on the best information available. The input levels are not necessarily an indication of the risk or liquidity associated with financial instruments at that level. For example, non-U.S. equity securities actively traded in foreign markets generally are reflected in Level 2 despite the availability of closing prices because the fund evaluates and determines whether those closing prices reflect fair value at the close of the NYSE or require adjustment, as described above. The following table summarizes the fund’s financial instruments, based on the inputs used to determine their values on April 30, 2012:
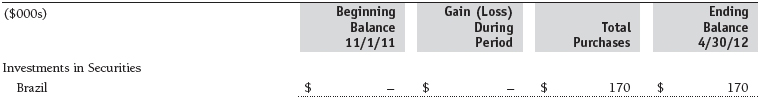
Following is a reconciliation of the fund’s Level 3 holdings for the six months ended April 30, 2012. Gain (loss) reflects both realized and change in unrealized gain (loss) on Level 3 holdings during the period, if any, and is included on the accompanying Statement of Operations. The change in unrealized gain (loss) on Level 3 instruments held at April 30, 2012, totaled $0 for the six months ended April 30, 2012.
NOTE 3 - OTHER INVESTMENT TRANSACTIONS
Consistent with its investment objective, the fund engages in the following practices to manage exposure to certain risks and/or to enhance performance. The investment objective, policies, program, and risk factors of the fund are described more fully in the fund’s prospectus and Statement of Additional Information.
Emerging Markets At April 30, 2012, approximately 27% of the fund’s net assets were invested, either directly or through investments in T. Rowe Price institutional funds, in securities of companies located in emerging markets, securities issued by governments of emerging market countries, and/or securities denominated in or linked to the currencies of emerging market countries. Emerging market securities are often subject to greater price volatility, less liquidity, and higher rates of inflation than U.S. securities. In addition, emerging markets may be subject to greater political, economic, and social uncertainty, and differing regulatory environments that may potentially impact the fund’s ability to buy or sell certain securities or repatriate proceeds to U.S. dollars.
Restricted Securities The fund may invest in securities that are subject to legal or contractual restrictions on resale. Prompt sale of such securities at an acceptable price may be difficult and may involve substantial delays and additional costs.
Repurchase Agreements All repurchase agreements are fully collateralized by U.S. government securities. Collateral is in the possession of the fund’s custodian or, for tri-party agreements, the custodian designated by the agreement. Although risk is mitigated by the collateral, the fund could experience a delay in recovering its value and a possible loss of income or value if the counterparty fails to perform in accordance with the terms of the agreement.
Securities Lending The fund lends its securities to approved brokers to earn additional income. It receives as collateral cash and U.S. government securities valued at 102% to 105% of the value of the securities on loan. Collateral is maintained over the life of the loan in an amount not less than the value of loaned securities as determined at the close of fund business each day; any additional collateral required due to changes in security values is delivered to the fund the next business day. Cash collateral is invested by the fund’s lending agent(s) in accordance with investment guidelines approved by management. Although risk is mitigated by the collateral, the fund could experience a delay in recovering its securities and a possible loss of income or value if the borrower fails to return the securities or if collateral investments decline in value. Securities lending revenue recognized by the fund consists of earnings on invested collateral and borrowing fees, net of any rebates to the borrower and compensation to the lending agent. In accordance with GAAP, investments made with cash collateral are reflected in the accompanying financial statements, but collateral received in the form of securities are not. On April 30, 2012, the value of cash collateral investments was $2,343,000, and the value of loaned securities was $2,217,000.
Other Purchases and sales of portfolio securities other than short-term securities aggregated $13,543,000 and $13,322,000, respectively, for the six months ended April 30, 2012.
NOTE 4 - FEDERAL INCOME TAXES
No provision for federal income taxes is required since the fund intends to continue to qualify as a regulated investment company under Subchapter M of the Internal Revenue Code and distribute to shareholders all of its taxable income and gains. Distributions determined in accordance with federal income tax regulations may differ in amount or character from net investment income and realized gains for financial reporting purposes. Financial reporting records are adjusted for permanent book/tax differences to reflect tax character but are not adjusted for temporary differences. The amount and character of tax-basis distributions and composition of net assets are finalized at fiscal year-end; accordingly, tax-basis balances have not been determined as of the date of this report.
As a result of the Regulated Investment Company Modernization Act of 2010, net capital losses realized on or after November 1, 2011 (effective date) may be carried forward indefinitely to offset future realized capital gains; however, post-effective losses must be used before pre-effective capital loss carryforwards with expiration dates. Accordingly, it is possible that all or a portion of the fund’s pre-effective capital loss carryforwards could expire unused. The fund intends to retain realized gains to the extent of available capital loss carryforwards. As of October 31, 2011, the fund had $13,879,000 of available capital loss carryforwards, which all expire in fiscal 2017.
At April 30, 2012, the cost of investments for federal income tax purposes was $65,909,000. Net unrealized gain aggregated $9,822,000 at period-end, of which $14,366,000 related to appreciated investments and $4,544,000 related to depreciated investments.
NOTE 5 - FOREIGN TAXES
The fund is subject to foreign income taxes imposed by certain countries in which it invests. Acquisition of certain foreign currencies related to security transactions are also subject to tax. Additionally, capital gains realized by the fund upon disposition of securities issued in or by certain foreign countries are subject to capital gains tax imposed by those countries. All taxes are computed in accordance with the applicable foreign tax law, and, to the extent permitted, capital losses are used to offset capital gains. Taxes attributable to income are accrued by the fund as a reduction of income. Taxes incurred on the purchase of foreign currencies are recorded as realized loss on foreign currency transactions. Current and deferred tax expense attributable to net capital gains is reflected as a component of realized and/or change in unrealized gain/loss on securities in the accompanying financial statements. At April 30, 2012, the fund had no deferred tax liability attributable to foreign securities and $479,000 of foreign capital loss carryforwards, including $32,000 that expire in 2013, $30,000 that expire in 2016, $182,000 that expire in 2017, $112,000 that expire in 2018, $58,000 that expire in 2019, and $65,000 that expire in 2020.
NOTE 6 - RELATED PARTY TRANSACTIONS
The fund is managed by T. Rowe Price Associates, Inc. (Price Associates), a wholly owned subsidiary of T. Rowe Price Group, Inc. (Price Group). Price Associates has entered into subadvisory agreements with T. Rowe Price International Ltd and T. Rowe Price Singapore Private Ltd., wholly owned subsidiaries of Price Associates, to provide investment advisory services to the fund; the subadvisory agreements provide that Price Associates may pay the subadvisors up to 60% of the management fee that Price Associates receives from the fund.
The investment management agreement between the fund and Price Associates provides for an annual investment management fee equal to 0.70% of the fund’s average daily net assets. The fee is computed daily and paid monthly.
The fund is also subject to a contractual expense limitation through February 28, 2015. During the limitation period, Price Associates is required to waive its management fee and reimburse the fund for any expenses, excluding interest, taxes, brokerage commissions, and extraordinary expenses, that would otherwise cause the fund’s ratio of annualized total expenses to average net assets (expense ratio) to exceed its expense limitation of 0.75%. The fund is required to repay Price Associates for expenses previously reimbursed and management fees waived to the extent the fund’s net assets have grown or expenses have declined sufficiently to allow repayment without causing the fund’s expense ratio to exceed its expense limitation. However, no repayment will be made more than three years after the date of any reimbursement or waiver or later than February 28, 2017. Pursuant to this agreement, management fees in the amount of $119,000 were waived during the six months ended April 30, 2012. Including these amounts, management fees waived in the amount of $635,000 remain subject to repayment by the fund at April 30, 2012.
In addition, the fund has entered into service agreements with Price Associates and a wholly owned subsidiary of Price Associates (collectively, Price). Price Associates computes the daily share price and provides certain other administrative services to the fund. T. Rowe Price Services, Inc., provides shareholder and administrative services in its capacity as the fund’s transfer and dividend disbursing agent. For the six months ended April 30, 2012, expenses incurred pursuant to these service agreements were $61,000 for Price Associates and less than $1,000 for T. Rowe Price Services, Inc. The total amount payable at period-end pursuant to these service agreements is reflected as Due to Affiliates in the accompanying financial statements.
The fund may invest in the T. Rowe Price Reserve Investment Fund and the T. Rowe Price Government Reserve Investment Fund (collectively, the T. Rowe Price Reserve Investment Funds), open-end management investment companies managed by Price Associates and considered affiliates of the fund. The T. Rowe Price Reserve Investment Funds are offered as cash management options to mutual funds, trusts, and other accounts managed by Price Associates and/or its affiliates and are not available for direct purchase by members of the public. The T. Rowe Price Reserve Investment Funds pay no investment management fees.
| Information on Proxy Voting Policies, Procedures, and Records |
A description of the policies and procedures used by T. Rowe Price funds and portfolios to determine how to vote proxies relating to portfolio securities is available in each fund’s Statement of Additional Information, which you may request by calling 1-800-225-5132 or by accessing the SEC’s website, sec.gov. The description of our proxy voting policies and procedures is also available on our website, troweprice.com. To access it, click on the words “Our Company” at the top of our corporate homepage. Then, when the next page appears, click on the words “Proxy Voting Policies” on the left side of the page.
Each fund’s most recent annual proxy voting record is available on our website and through the SEC’s website. To access it through our website, follow the directions above, then click on the words “Proxy Voting Records” on the right side of the Proxy Voting Policies page.
| How to Obtain Quarterly Portfolio Holdings |
The fund files a complete schedule of portfolio holdings with the Securities and Exchange Commission for the first and third quarters of each fiscal year on Form N-Q. The fund’s Form N-Q is available electronically on the SEC’s website (sec.gov); hard copies may be reviewed and copied at the SEC’s Public Reference Room, 100 F St. N.W., Washington, DC 20549. For more information on the Public Reference Room, call 1-800-SEC-0330.
| Approval of Investment Management Agreement |
On March 6, 2012, the fund’s Board of Directors (Board) unanimously approved the continuation of the investment advisory agreement (Advisory Contract) between the fund and its investment advisor, T. Rowe Price Associates, Inc. (Advisor). The Board also unanimously approved the continuation of the investment subadvisory agreement and investment management subdelegation agreement (Subadvisory Contracts) that the Advisor has entered into with T. Rowe Price International Ltd and T. Rowe Price Singapore Private Ltd. (Subadvisors) on behalf of the fund. The Board considered a variety of factors in connection with its review of the Advisory Contract and Subadvisory Contracts, also taking into account information provided by the Advisor during the course of the year, as discussed below:
Services Provided by the Advisor and Subadvisors
The Board considered the nature, quality, and extent of the services provided to the fund by the Advisor and Subadvisors. These services included, but were not limited to, directing the fund’s investments in accordance with its investment program and the overall management of the fund’s portfolio, as well as a variety of related activities, such as financial, accounting, and administrative services; maintaining the fund’s records and registrations; and shareholder communications. The Board also reviewed the background and experience of the Advisor’s and Subadvisors’ senior management teams and investment personnel involved in the management of the fund. The Board noted that, effective August 1, 2011, the fund was removed from an investment management subdelegation agreement between the Advisor and T. Rowe Price International Ltd, Tokyo Branch, and was added to an investment management subdelegation agreement between the Advisor and T. Rowe Price Singapore Private Ltd. The Board concluded, at a meeting in July 2011, that this change, which resulted in T. Rowe Price Singapore Private Ltd. replacing T. Rowe Price International Ltd, Tokyo Branch, as one of the fund’s investment subadvisors, will not change the advisory fee paid by the fund; will not diminish the nature, quality, or level of services provided to the fund; and will not materially change the resources available to the fund or the manner in which advisory services are provided. The Board concluded that it was satisfied with the nature, quality, and extent of the services provided by the Advisor and Subadvisors.
Investment Performance of the Fund
The Board reviewed the fund’s average annual total returns over the three-month and 1-, 3-, 5-, and 10-year periods, as well as the fund’s year-by-year returns, and compared these returns with a wide variety of previously agreed upon comparable performance measures and market data, including those supplied by Lipper and Morningstar, which are independent providers of mutual fund data. On the basis of this evaluation and the Board’s ongoing review of investment results, and factoring in the relative market conditions during certain of the performance periods, the Board concluded that the fund’s performance was satisfactory.
Costs, Benefits, Profits, and Economies of Scale
The Board reviewed detailed information regarding the revenues received by the Advisor under the Advisory Contract and other benefits that the Advisor (and its affiliates, including the Subadvisors) may have realized from its relationship with the fund, including research received under “soft dollar” agreements and commission-sharing arrangements with broker-dealers. The Board considered that the Advisor and Subadvisors may receive some benefit from soft-dollar arrangements pursuant to which research is received from broker-dealers that execute the applicable fund’s portfolio transactions. The Board received information on the estimated costs incurred and profits realized by the Advisor from managing T. Rowe Price mutual funds. While the Board did not review information regarding profits realized from managing the fund in particular because the fund had not achieved sufficient scale to produce meaningful profit margin percentages, the Board concluded that the Advisor’s profits were reasonable in light of the services provided to the funds.
The Board also considered whether the fund or other funds benefit under the fee levels set forth in the Advisory Contract from any economies of scale realized by the Advisor. Under the Advisory Contract, the fund pays a fee to the Advisor for investment management services based on the fund’s average daily net assets and the fund pays its own expenses of operations (subject to an expense limitation agreed to by the Advisor). Under the Subadvisory Contracts, the Advisor may pay each Subadvisor up to 60% of the advisory fee that the Advisor receives from the fund. The Board concluded that, based on the profitability data it reviewed, the advisory fee structure for the fund continued to provide for a reasonable sharing of benefits from any economies of scale with the fund’s investors.
Fees
The Board was provided with information regarding industry trends in management fees and expenses and the Board reviewed the fund’s management fee rate, operating expenses, and total expense ratio in comparison with fees and expenses of other comparable funds based on information and data supplied by Lipper. The information provided to the Board indicated that the fund’s management fee rate (after including reductions of the management fee that resulted from fee waivers and/or expenses paid by the Advisor) and the fund’s total expense ratio were below the median for comparable funds.
The Board also reviewed the fee schedules for institutional accounts and private accounts with similar mandates that are advised or subadvised by the Advisor and its affiliates. Management provided the Board with information about the Advisor’s responsibilities and services provided to institutional account clients that illustrated how the requirements and economies of the institutional business are fundamentally different from those of the mutual fund business. The information showed that the Advisor’s responsibilities for its institutional account business are more limited than its responsibilities for the fund and other T. Rowe Price mutual funds that it advises and that the Advisor performs significant additional services and assumes greater risk for the fund and other T. Rowe Price mutual funds than it does for institutional account clients. On the basis of the information provided, the Board concluded that the fees paid by the fund under the Advisory Contract were reasonable.
Approval of the Advisory Contract and Subadvisory Contracts
As noted, the Board approved the continuation of the Advisory Contract and Subadvisory Contracts. No single factor was considered in isolation or to be determinative to the decision. Rather, the Board was assisted by the advice of independent legal counsel and concluded, in light of a weighting and balancing of all factors considered, that it was in the best interests of the fund and its shareholders for the Board to approve the continuation of the Advisory Contract and Subadvisory Contracts (including the fees to be charged for services thereunder).
Item 2. Code of Ethics.
A code of ethics, as defined in Item 2 of Form N-CSR, applicable to its principal executive officer, principal financial officer, principal accounting officer or controller, or persons performing similar functions is filed as an exhibit to the registrant’s annual Form N-CSR. No substantive amendments were approved or waivers were granted to this code of ethics during the registrant’s most recent fiscal half-year.
Item 3. Audit Committee Financial Expert.
Disclosure required in registrant’s annual Form N-CSR.
Item 4. Principal Accountant Fees and Services.
Disclosure required in registrant’s annual Form N-CSR.
Item 5. Audit Committee of Listed Registrants.
Not applicable.
Item 6. Investments.
(a) Not applicable. The complete schedule of investments is included in Item 1 of this Form N-CSR.
(b) Not applicable.
Item 7. Disclosure of Proxy Voting Policies and Procedures for Closed-End Management Investment Companies.
Not applicable.
Item 8. Portfolio Managers of Closed-End Management Investment Companies.
Not applicable.
Item 9. Purchases of Equity Securities by Closed-End Management Investment Company and Affiliated Purchasers.
Not applicable.
Item 10. Submission of Matters to a Vote of Security Holders.
Not applicable.
Item 11. Controls and Procedures.
(a) The registrant’s principal executive officer and principal financial officer have evaluated the registrant’s disclosure controls and procedures within 90 days of this filing and have concluded that the registrant’s disclosure controls and procedures were effective, as of that date, in ensuring that information required to be disclosed by the registrant in this Form N-CSR was recorded, processed, summarized, and reported timely.
(b) The registrant’s principal executive officer and principal financial officer are aware of no change in the registrant’s internal control over financial reporting that occurred during the registrant’s second fiscal quarter covered by this report that has materially affected, or is reasonably likely to materially affect, the registrant’s internal control over financial reporting.
Item 12. Exhibits.
(a)(1) The registrant’s code of ethics pursuant to Item 2 of Form N-CSR is filed with the registrant’s annual Form N-CSR.
(2) Separate certifications by the registrant's principal executive officer and principal financial officer, pursuant to Section 302 of the Sarbanes-Oxley Act of 2002 and required by Rule 30a-2(a) under the Investment Company Act of 1940, are attached.
(3) Written solicitation to repurchase securities issued by closed-end companies: not applicable.
(b) A certification by the registrant's principal executive officer and principal financial officer, pursuant to Section 906 of the Sarbanes-Oxley Act of 2002 and required by Rule 30a-2(b) under the Investment Company Act of 1940, is attached.
SIGNATURES
Pursuant to the requirements of the Securities Exchange Act of 1934 and the Investment Company Act of 1940, the registrant has duly caused this report to be signed on its behalf by the undersigned, thereunto duly authorized.
T. Rowe Price Institutional International Funds, Inc.
| | By | /s/ Edward C. Bernard |
| | Edward C. Bernard |
| | Principal Executive Officer |
| |
| Date June 14, 2012 | | |
Pursuant to the requirements of the Securities Exchange Act of 1934 and the Investment Company Act of 1940, this report has been signed below by the following persons on behalf of the registrant and in the capacities and on the dates indicated.
| | By | /s/ Edward C. Bernard |
| | Edward C. Bernard |
| | Principal Executive Officer |
| |
| Date June 14, 2012 | | |
| |
| |
| By | /s/ Gregory K. Hinkle |
| | Gregory K. Hinkle |
| | Principal Financial Officer |
| |
| Date June 14, 2012 | | |