UNITED STATES
SECURITIES AND EXCHANGE COMMISSION
Washington, D.C. 20549
FORM N-CSR
CERTIFIED SHAREHOLDER REPORT OF REGISTERED
MANAGEMENT INVESTMENT COMPANIES
Investment Company Act File Number: 811-05833
| T. Rowe Price Institutional International Funds, Inc. |
|
| (Exact name of registrant as specified in charter) |
| |
| 100 East Pratt Street, Baltimore, MD 21202 |
|
| (Address of principal executive offices) |
| |
| David Oestreicher |
| 100 East Pratt Street, Baltimore, MD 21202 |
|
| (Name and address of agent for service) |
Registrant’s telephone number, including area code: (410) 345-2000
Date of fiscal year end: October 31
Date of reporting period: April 30, 2012
Item 1. Report to Shareholders
Institutional International Core
Equity Fund | April 30, 2012 |
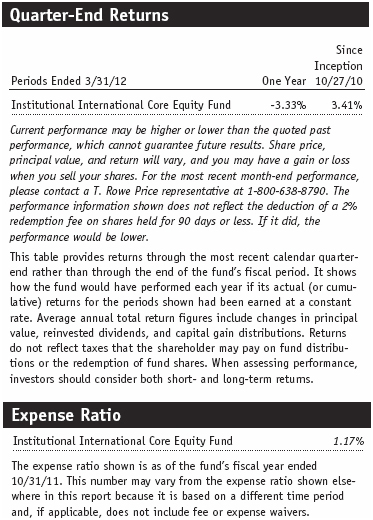
- Non-U.S. stocks posted modest gains over the past six months despite a challenging environment characterized by ongoing turmoil in Europe, sluggish growth in the U.S., and slowing growth in key emerging markets.
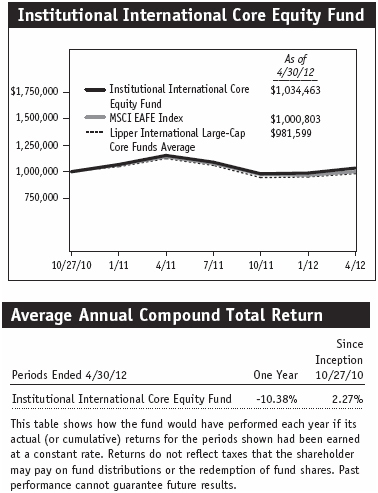
- The Institutional International Core Equity Fund returned 5.46% over the period, outpacing the MSCI EAFE Index and its Lipper peer group average.
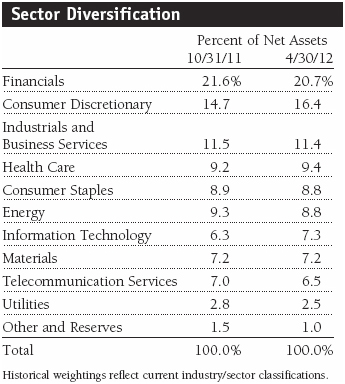
- The portfolio’s consumer discretionary holdings fared particularly well, and health care, information technology, and energy also generated good gains. Telecommunication services and a small position in utilities declined.
- Corporate fundamentals appear strong, and stock valuations are attractive, but we expect continued volatility until the political and economic issues weighing on the markets become more settled.
The views and opinions in this report were current as of April 30, 2012. They are not guarantees of performance or investment results and should not be taken as investment advice. Investment decisions reflect a variety of factors, and the managers reserve the right to change their views about individual stocks, sectors, and the markets at any time. As a result, the views expressed should not be relied upon as a forecast of the fund’s future investment intent. The report is certified under the Sarbanes-Oxley Act, which requires mutual funds and other public companies to affirm that, to the best of their knowledge, the information in their financial reports is fairly and accurately stated in all material respects.
Manager’s Letter
T. Rowe Price Institutional International Core Equity Fund
Dear Investor
Non-U.S. stock markets were modestly positive over the past six months despite a challenging environment. The relatively strong results occurred against the backdrop of ongoing political and economic turmoil in Europe, sluggish economic growth in the U.S., and decelerating growth in key developing economies such as China, Brazil, and India. Emerging markets generally outpaced developed markets, but both lagged the U.S. by a wide margin. The Institutional International Core Equity Fund posted a solid gain in this volatile environment, outpacing the MSCI EAFE Index and its Lipper peer group average for the six-month period.
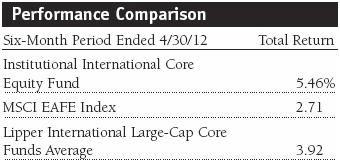
As shown in the Performance Comparison table, the Institutional International Core Equity Fund gained 5.46% for the six months ended April 30, 2012, versus 2.71% for the MSCI EAFE Index and 3.92% for the Lipper International Large-Cap Core Funds Average. Consumer discretionary was the portfolio’s top-performing sector in absolute terms, posting a solid double-digit gain. Our health care holdings also performed very well, while information technology, energy, and financials generated more modest gains. Telecommunication services and a small position in utilities were the only sectors to decline for the period. Stock selection boosted performance versus the MSCI index, particularly in the consumer discretionary, information technology, and energy sectors. The portfolio’s sector allocations were modestly positive overall, with a significant overweight position to consumer discretionary providing the largest benefit.
Investment Strategy
The Institutional International Core Equity Fund seeks long-term growth of capital through investments in the common stocks of non-U.S. companies. We take a core approach to investing, meaning that we search for companies possessing a combination of growth potential and valuation among non-U.S. stocks in the world’s developed and, to a lesser extent, emerging markets. Securities will be selected that, in our view, have the most favorable mix of company fundamentals, earnings potential, and valuation. Our approach generally looks for companies with the following characteristics:
- Operate in a business niche with favorable prospects for earnings growth;
- Possess attractive valuation relative to the company’s peers or its own historical norm;
- Have meaningful barriers to entry;
- Employ experienced and capable management;
- Maintain healthy balance sheets; and
- Offer the potential to grow dividends or conduct share repurchases.
Our investment approach offers the flexibility to search for particularly promising investment opportunities. Although the majority of the investments (at least 65%) will be made in established, large-capitalization companies, we may also purchase mid-cap stocks that meet our rigorous investment criteria. We expect to find select investment opportunities in emerging markets as well as in developed markets. We will focus on stocks where we believe the valuation underestimates the company’s potential for earnings and cash flow growth. Such stocks may or may not appear inexpensive on an absolute basis or relative to the rest of the market.
The portfolio has a relatively moderate risk profile due to its broadly diversified mix of established companies, and its diversification across countries and sectors should help reduce volatility. Of course, investing overseas holds special risks—political uncertainty, potentially unfavorable currency exchange rate changes, and, to a lesser degree, market illiquidity—that could cause the value of this portfolio to fluctuate more than a similar domestic portfolio. However, we believe the portfolio’s flexibility to invest throughout the international marketplace can help reduce volatility relative to portfolios that concentrate on a particular region or country.
Market Environment
Developed non-U.S. stock markets posted modest overall gains for the first half of our fiscal year. Following a sell-off in the summer and fall of 2011, optimism about resolving the European debt crisis contributed to a rebound in world markets in early 2012. Investors welcomed a massive infusion of liquidity into the European banking system through the European Central Bank’s two long-term refinancing operations (LTROs), as well as a regional agreement imposing greater fiscal discipline in the coming years.
The advance stalled in March, however, as worries grew that bond yields would rise in heavily indebted European countries such as Spain and Italy once funds from the LTROs were exhausted. In addition, several European economies, including Spain and the UK, slipped back into recession. Tax increases and spending cuts weighed on growth and called into question the popular will for further austerity measures. Debt and growth concerns hampered southern European markets, with Spain, Italy, Portugal, and Greece falling sharply.
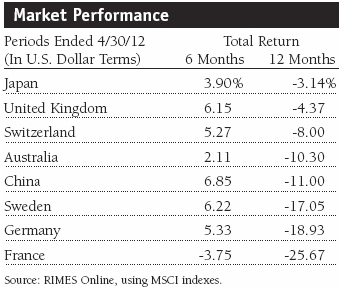
Developed markets elsewhere generally saw modest gains. In a reversal from 2011, investors warmed to Japan early in the year, attracted by cheap valuations and improving prospects for exporters. Hong Kong and Singapore also performed well, but Australia lagged amid declining commodity prices.
Emerging markets stocks rallied early in 2012, due in part to encouraging signs from Europe and other key export markets in the developed world. However, investor sentiment took a hit, and markets gave back some of the gains after China reduced its official growth target on March 5. The move signaled that China’s leaders are willing to sacrifice the torrid pace of growth of the past three decades in exchange for slower but more sustainable development by shifting its economic balance toward domestic consumption rather than fixed-asset investments. However, it also raised fears of weaker earnings prospects for the vast number of companies that depend on the world’s second-largest economy for growth.
Portfolio Highlights and Positioning
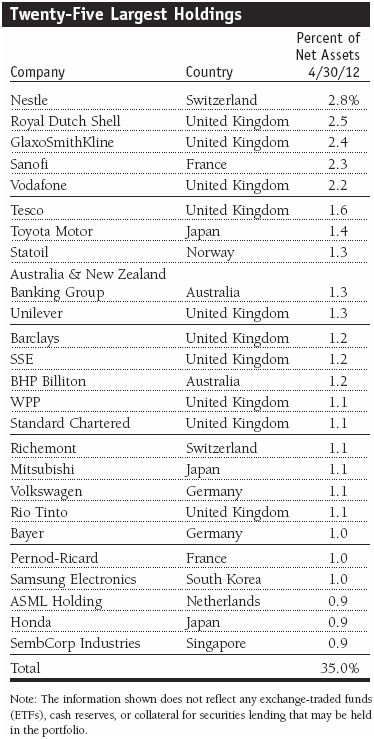
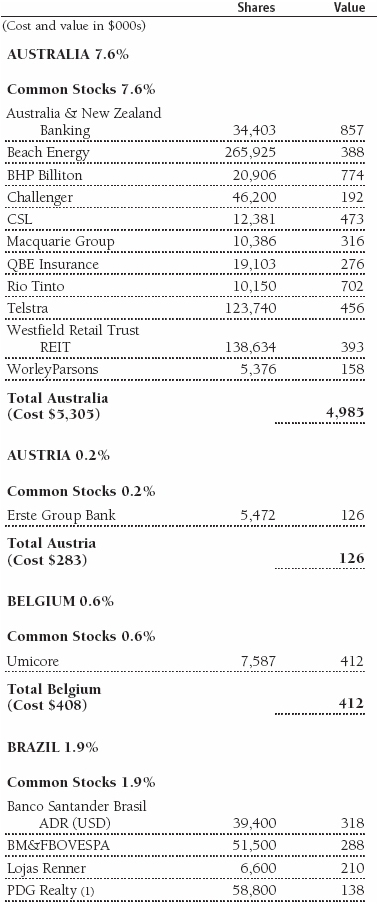
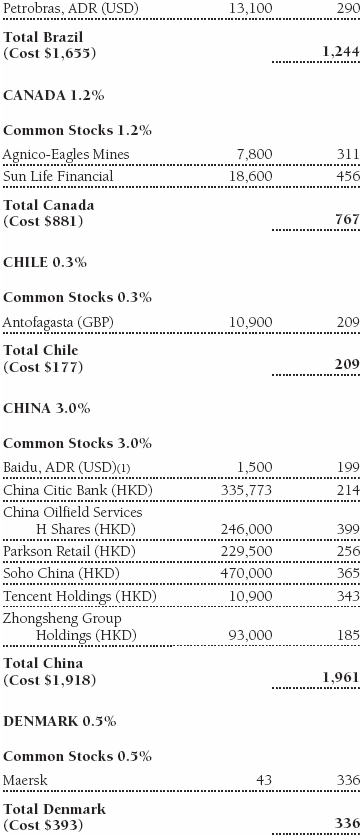
As mentioned previously, consumer discretionary was the portfolio’s best-performing sector in absolute terms and accounts for our second-largest sector allocation. Stock selection and a significant overweight allocation versus the MSCI benchmark helped relative returns over the period. Our automobile stocks were particularly strong as emerging market demand grew and pent-up U.S. demand recovered from the depressed levels of the 2008–2009 financial crisis. Shares of Toyota Motor rose nicely as production disruptions resulting from the Fukushima disaster receded. Toyota’s class-leading hybrid models are selling well, and the company continues to improve on its already legendary reputation for quality and efficiency. The recovery in U.S. demand and strong sales in Southeast Asia boosted Honda shares, as did the upcoming debut of a new suite of technologically advanced fuel-efficient engines. BMW enjoyed strong sales in its U.S. and European core markets and is making gains in China. The high-end German carmaker has some of the industry’s best profit margins and continues to offer superior products, a world-class brand, and superior execution. Advertising, marketing, and public relations holding company WPP was another standout performer as the global economic recovery drove expectations for improved advertising expenditures. Investors were also attracted by the company’s exposure to high-growth markets and its expanding presence in the digital arena. Shares of Brazilian homebuilder PDG Realty fell to a multiyear low after the company reported unexpectedly disappointing earnings, which resulted largely from a 2010 acquisition. However, we believe management has taken appropriate steps to address the problems, and the company remains well positioned to benefit over the long term from growing demand for housing in Brazil. (Please refer to the portfolio of investments for a complete list of holdings and the amount each represents in the portfolio.)
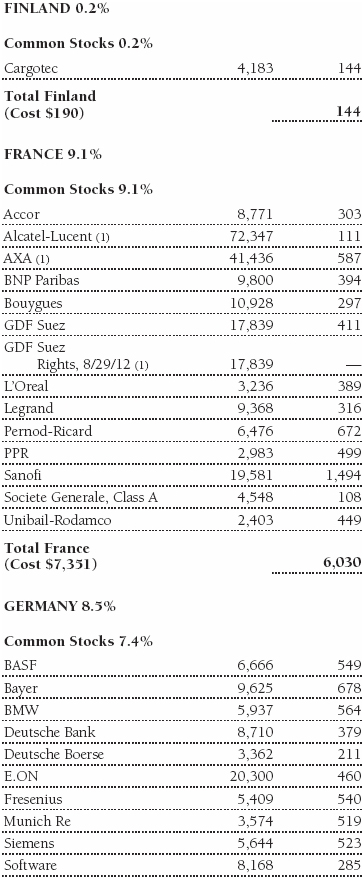
Health care stocks boosted our absolute returns, and stock selection modestly helped performance versus the MSCI index. Pharmaceuticals were particularly strong. GlaxoSmithKline and Sanofi are good companies with excellent management teams, and their shares performed well as patent issues receded and investors recognized their attractive valuations. Germany’s Bayer was another good performer. The company has a strong product pipeline and increasingly is being managed with an eye toward profitability, especially in its crop sciences unit, which has good exposure to fast-growing emerging markets. Sweden’s Elekta was another top performer. A leading supplier of radiation therapy, software, and services for the treatment of cancer and neurological diseases, the company has benefited from rising emerging markets demand, a new product cycle, and the ability to sell higher-margin service agreements. We eliminated our position in Japanese medical supply company Terumo because we believe its decreasing growth potential no longer justifies its elevated valuation.
The portfolio’s information technology holdings performed well, and stock selection boosted results relative to the benchmark. The sector represents our second-largest overweight position after consumer discretionary, and we continue to look for opportunities in mobile computing and companies leveraged to the increasing use of technology in emerging markets. Samsung Electronics was among the portfolio’s best overall performers. The company is firing on all cylinders as it transitions from production of low-margin, commodity-type products to higher-end, higher-margin goods such as smartphones. We initiated a position in Tencent Holdings, which is the largest online community in China with over 80% penetration among Chinese Internet users. The company enjoys strong growth in its core social platform, which includes online entertainment and gaming, Web portal and search, e-commerce, and mobile value-added services. We also established a position in Baidu based on its attractive valuation. Slower economic growth in China has dampened revenues somewhat, but we believe this is more of a short-term cyclical issue than a structural problem. Baidu remains the dominant Web search company in the growing Chinese market, with over 350 million users conducting 230 billion searches in 2010. Alcatel-Lucent continued to struggle amid weak capital expenditures in its core European market. However, the company maintains an exceptional suite of patents, many of which are critical to the world’s growing telecommunication networks. We expect the company to benefit once capital spending returns to more normalized levels.
Our telecommunication services stocks weighed on overall returns, as did a small position in utilities. Among the former, Telecom Italia and Spain’s Telefonica dipped as investors became concerned about weakness in their mature European markets. However, both companies have good exposure to higher-growth emerging markets, especially Brazil, which should help to offset tepid growth in legacy markets. Our European utilities, including E.ON and GDF Suez, faced a tough operating environment marked by slow industrial activity and mounting government pressure to reduce reliance on nuclear energy.
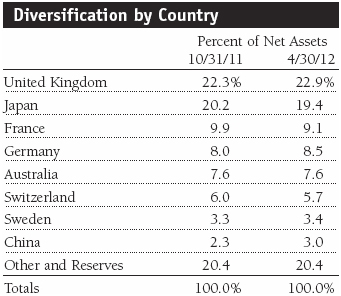
In terms of geographic positioning, European stocks continue to account for the bulk of the portfolio, in large part due to the high number of well-established, large-cap companies in the region. Although we remain underweight Europe versus the MSCI index amid heightened political and economic uncertainty, the risk-averse atmosphere has resulted in opportunities to purchase high-quality companies selling at compelling valuations. Throughout most of the European debt crisis, we have focused on the economically healthier northern regions of Europe, with only selective exposure to southern Europe and the periphery. Our allocation to the UK remains in line with the benchmark. We trimmed some energy and consumer discretionary holdings on strength and added selectively to a few financial and telecommunication stocks with good valuations and growth potential.
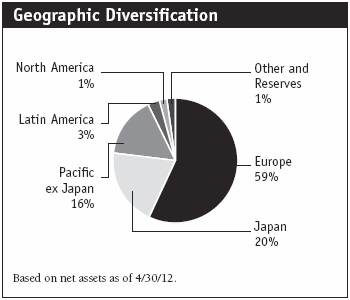
Japan is our second-largest geographic allocation, but we reduced our exposure relative to the index during the period. Although the Japanese economy and markets are beginning to put the Fukushima disaster behind them, growth continues to be sluggish. The Pacific ex Japan region is our third-largest allocation, and we have a modest overweight versus our benchmark. Growth has slowed somewhat, but the region’s economies continue to expand, driven by such long-term trends as rising levels of urbanization, industrialization, and domestic consumption. We identified some attractive buying opportunities over the latter half of the reporting period as skittish investors turned increasingly risk averse. We have significant exposure to Australia, which should continue to benefit from growing trade with China and southeast Asia.
Elsewhere among emerging markets, we maintain a sizable allocation to Latin America. Although economic growth is slowing, particularly in Brazil, it remains strong in comparison with much of the developed world. Deleveraging is not an issue in many of these economies, employment levels are healthy, wages are on the rise, and the “wealth effect” has the potential to create robust consumer demand for years to come.
Investment Outlook
We expect continued market volatility in the face of ongoing uncertainties in developed and emerging markets alike. In the U.S., a contentious and potentially polarizing political environment in the lead-up to the November elections could hinder any substantive efforts to deal with sluggish economic growth and long-term fiscal imbalances. In Europe, the political, social, and economic turmoil roiling the region has only highlighted the stark contrast between the stronger economies of northern Europe and their weaker counterparts in the south. Policymakers are struggling to keep the eurozone intact as they try to simultaneously implement much-needed fiscal discipline and structural reforms without strangling economic growth. At the same time, growth in key emerging markets clearly is slowing. Although China appears to have averted a hard economic landing, there are a number of significant structural challenges looming over the economy and markets. So far, the Chinese people have been willing to trade social and political freedoms for economic progress. How long an increasingly wealthy and educated populace will tolerate the limitations of one-party rule remains an open question, especially if economic growth is less robust.
While the current environment is challenging, we do not think the problems are insurmountable. Europe must move away from a purely monetary union and work to integrate the fiscal policies of individual countries and restructure the economic constraints weighing on southern Europe. It is too early to tell whether Greece will stay in the monetary union or not. Whatever the outcome, we believe the Greek crisis serves as a wake-up call for policymakers across Europe—north, south, core, and periphery—to craft workable solutions to the economic and fiscal troubles plaguing the Continent. The U.S. economic recovery, while not particularly strong, has proven remarkably resilient. Corporate balance sheets are healthy and are a source of potential return through growing dividends and share repurchases for companies with excess cash. Growth certainly is slowing in emerging markets, but it remains robust relative to developed markets. In addition, domestic consumption is accounting for a larger share of growth, reducing reliance on exports to slower-growing developed markets.
As we move through this uncertain environment, we encourage investors to bear in mind our focus on attractive valuations and sound business models—essential elements of a fundamental investment process that should serve us well over time.
Respectfully submitted,

Raymond A. Mills
Chairman of the fund’s Investment Advisory Committee
May 14, 2012
The committee chairman has day-to-day responsibility for managing the portfolio and works with committee members in developing and executing the fund’s investment program.
| Risks of International Investing |
Funds that invest overseas generally carry more risk than funds that invest strictly in U.S. assets. Funds investing in a single country or in a limited geographic region tend to be riskier than more diversified funds. Risks can result from varying stages of economic and political development; differing regulatory environments, trading days, and accounting standards; and higher transaction costs of non-U.S. markets. Non-U.S. investments are also subject to currency risk, or a decline in the value of a foreign currency versus the U.S. dollar, which reduces the dollar value of securities denominated in that currency.
Lipper averages: The averages of available mutual fund performance returns for specified time periods in categories defined by Lipper Inc.
MSCI EAFE Index: An index that measures equity market performance of developed countries in the Europe, Australasia, and Far East regions.
Portfolio Highlights
Performance and Expenses
T. Rowe Price Institutional International Core Equity Fund
This chart shows the value of a hypothetical $1 million investment in the fund over the past 10 fiscal year periods or since inception (for funds lacking 10-year records). The result is compared with benchmarks, which may include a broad-based market index and a peer group average or index. Market indexes do not include expenses, which are deducted from fund returns as well as mutual fund averages and indexes.
Fund Expense Example
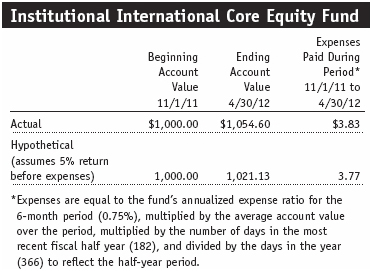
As a mutual fund shareholder, you may incur two types of costs: (1) transaction costs, such as redemption fees or sales loads, and (2) ongoing costs, including management fees, distribution and service (12b-1) fees, and other fund expenses. The following example is intended to help you understand your ongoing costs (in dollars) of investing in the fund and to compare these costs with the ongoing costs of investing in other mutual funds. The example is based on an investment of $1,000 invested at the beginning of the most recent six-month period and held for the entire period.
Actual Expenses
The first line of the following table (“Actual”) provides information about actual account values and actual expenses. You may use the information on this line, together with your account balance, to estimate the expenses that you paid over the period. Simply divide your account value by $1,000 (for example, an $8,600 account value divided by $1,000 = 8.6), then multiply the result by the number on the first line under the heading “Expenses Paid During Period” to estimate the expenses you paid on your account during this period.
Hypothetical Example for Comparison Purposes
The information on the second line of the table (“Hypothetical”) is based on hypothetical account values and expenses derived from the fund’s actual expense ratio and an assumed 5% per year rate of return before expenses (not the fund’s actual return). You may compare the ongoing costs of investing in the fund with other funds by contrasting this 5% hypothetical example and the 5% hypothetical examples that appear in the shareholder reports of the other funds. The hypothetical account values and expenses may not be used to estimate the actual ending account balance or expenses you paid for the period.
You should also be aware that the expenses shown in the table highlight only your ongoing costs and do not reflect any transaction costs, such as redemption fees or sales loads. Therefore, the second line of the table is useful in comparing ongoing costs only and will not help you determine the relative total costs of owning different funds. To the extent a fund charges transaction costs, however, the total cost of owning that fund is higher.
Financial Highlights
T. Rowe Price Institutional International Core Equity Fund
(Unaudited)

The accompanying notes are an integral part of these financial statements.
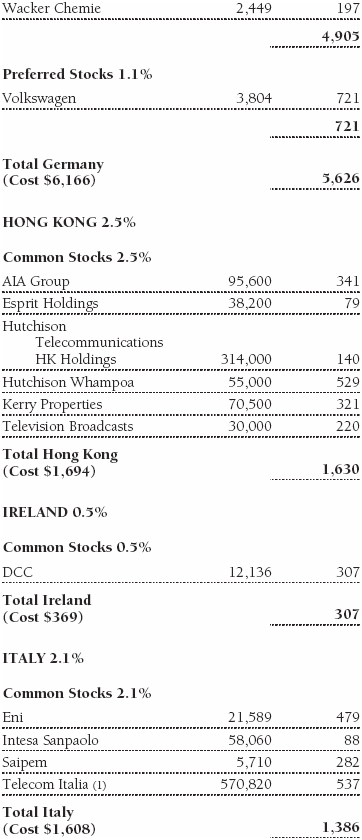
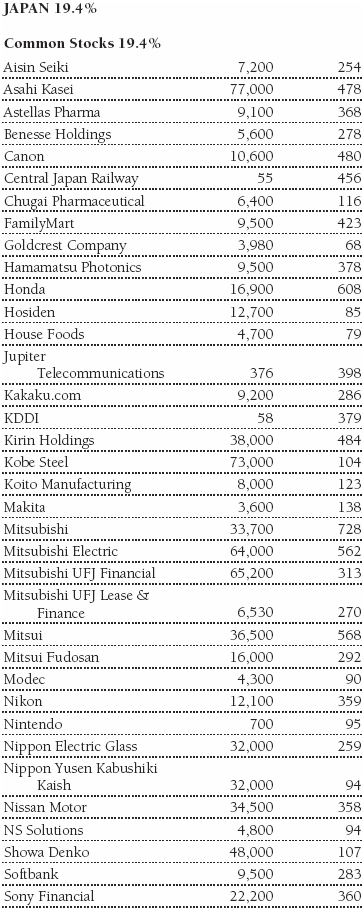
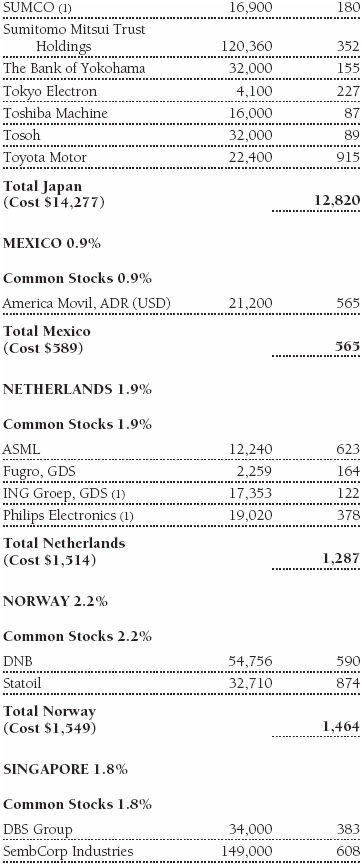
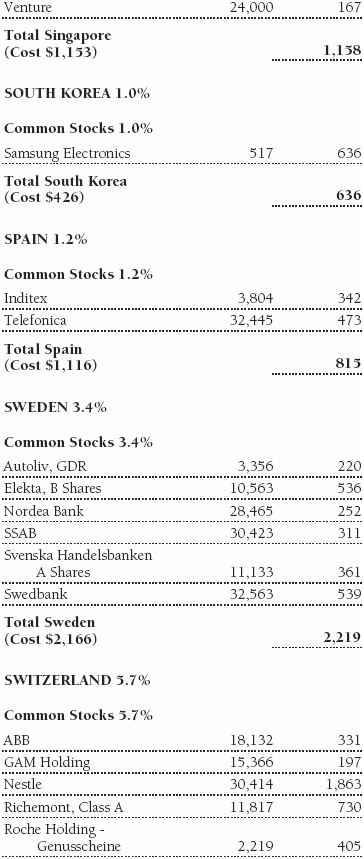
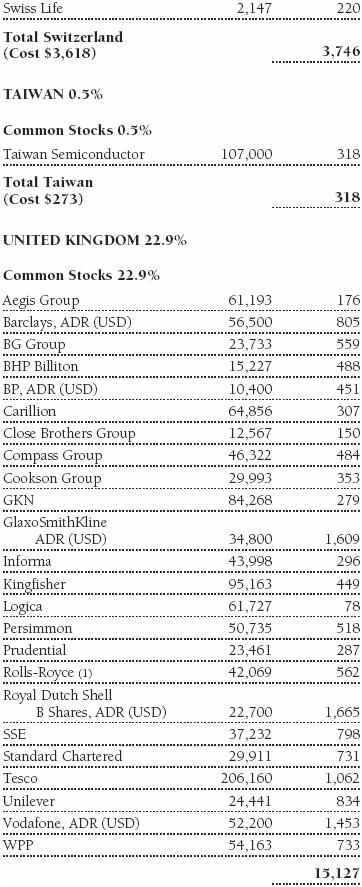
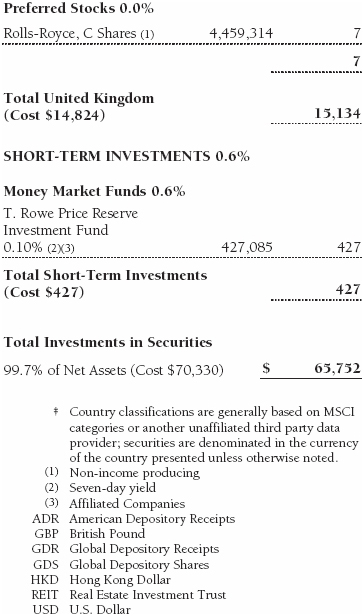
Portfolio of Investments‡
T. Rowe Price Institutional International Core Equity Fund
April 30, 2012 (Unaudited)
The accompanying notes are an integral part of these financial statements.
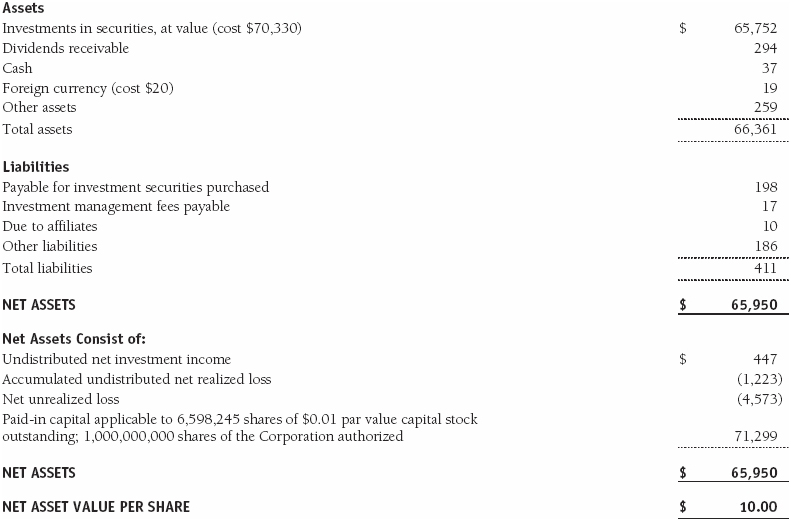
Statement of Assets and Liabilities
T. Rowe Price Institutional International Core Equity Fund
April 30, 2012 (Unaudited)
($000s, except shares and per share amounts)
The accompanying notes are an integral part of these financial statements.
Statement of Operations
T. Rowe Price Institutional International Core Equity Fund
(Unaudited)
($000s)
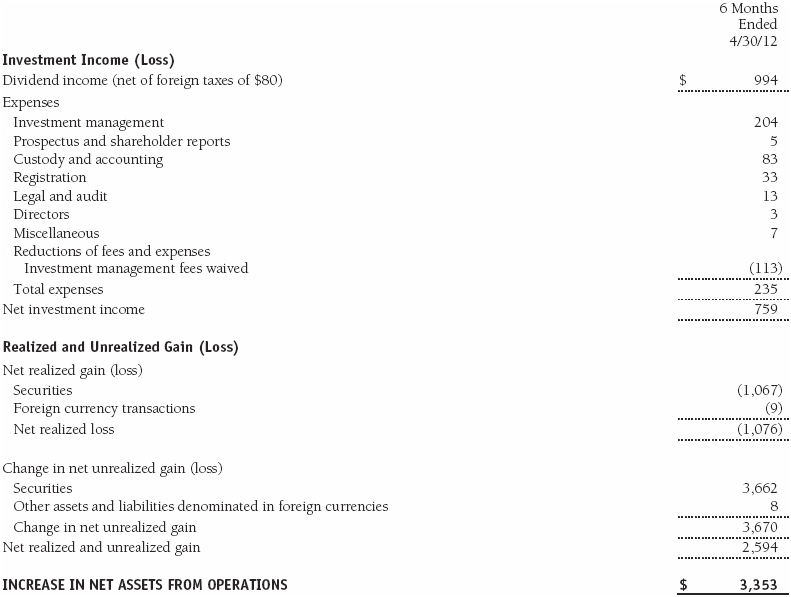
The accompanying notes are an integral part of these financial statements.
Statement of Changes in Net Assets
T. Rowe Price Institutional International Core Equity Fund
(Unaudited)
($000s)
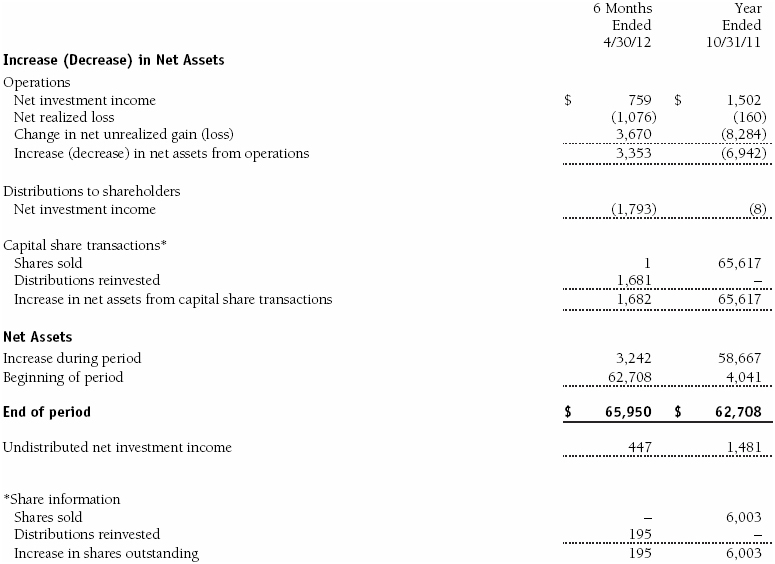
The accompanying notes are an integral part of these financial statements.
Notes to Financial Statements
T. Rowe Price Institutional International Core Equity Fund
April 30, 2012 (Unaudited)
T. Rowe Price Institutional International Funds, Inc. (the corporation), is registered under the Investment Company Act of 1940 (the 1940 Act). The Institutional International Core Equity Fund (the fund) is a diversified, open-end management investment company established by the corporation. The fund commenced operations on October 27, 2010. The fund seeks long-term growth of capital through investments in the common stocks of non-U.S. companies.
NOTE 1 - SIGNIFICANT ACCOUNTING POLICIES
Basis of Preparation The accompanying financial statements were prepared in accordance with accounting principles generally accepted in the United States of America (GAAP), which require the use of estimates made by management. Management believes that estimates and valuations are appropriate; however, actual results may differ from those estimates, and the valuations reflected in the accompanying financial statements may differ from the value ultimately realized upon sale or maturity.
Investment Transactions, Investment Income, and Distributions Income and expenses are recorded on the accrual basis. Dividends received from mutual fund investments are reflected as dividend income; capital gain distributions are reflected as realized gain/loss. Dividend income and capital gain distributions are recorded on the ex-dividend date. Income tax-related interest and penalties, if incurred, would be recorded as income tax expense. Investment transactions are accounted for on the trade date. Realized gains and losses are reported on the identified cost basis. Distributions to shareholders are recorded on the ex-dividend date. Income distributions are declared and paid annually. Capital gain distributions, if any, are generally declared and paid by the fund annually.
Currency Translation Assets, including investments, and liabilities denominated in foreign currencies are translated into U.S. dollar values each day at the prevailing exchange rate, using the mean of the bid and asked prices of such currencies against U.S. dollars as quoted by a major bank. Purchases and sales of securities, income, and expenses are translated into U.S. dollars at the prevailing exchange rate on the date of the transaction. The effect of changes in foreign currency exchange rates on realized and unrealized security gains and losses is reflected as a component of security gains and losses.
Credits The fund earns credits on temporarily uninvested cash balances held at the custodian, which reduce the fund’s custody charges. Custody expense in the accompanying financial statements is presented before reduction for credits.
Redemption Fees A 2% fee is assessed on redemptions of fund shares held for 90 days or less to deter short-term trading and to protect the interests of long-term shareholders. Redemption fees are withheld from proceeds that shareholders receive from the sale or exchange of fund shares. The fees are paid to the fund and are recorded as an increase to paid-in capital. The fees may cause the redemption price per share to differ from the net asset value per share.
New Accounting Pronouncements In May 2011, the Financial Accounting Standards Board (FASB) issued amended guidance to align fair value measurement and disclosure requirements in U.S. GAAP with International Financial Reporting Standards. The guidance is effective for fiscal years and interim periods beginning on or after December 15, 2011. Adoption will have no effect on net assets or results of operations.
In December 2011, the FASB issued amended guidance to enhance disclosure for offsetting assets and liabilities. The guidance is effective for fiscal years and interim periods beginning on or after January 1, 2013; adoption will have no effect on the fund’s net assets or results of operations.
NOTE 2 - VALUATION
The fund’s financial instruments are reported at fair value as defined by GAAP. The fund determines the values of its assets and liabilities and computes its net asset value per share at the close of the New York Stock Exchange (NYSE), normally 4 p.m. ET, each day that the NYSE is open for business.
Valuation Methods Equity securities listed or regularly traded on a securities exchange or in the over-the-counter (OTC) market are valued at the last quoted sale price or, for certain markets, the official closing price at the time the valuations are made, except for OTC Bulletin Board securities, which are valued at the mean of the latest bid and asked prices. A security that is listed or traded on more than one exchange is valued at the quotation on the exchange determined to be the primary market for such security. Listed securities not traded on a particular day are valued at the mean of the latest bid and asked prices for domestic securities and the last quoted sale price for international securities.
Investments in mutual funds are valued at the mutual fund’s closing net asset value per share on the day of valuation.
Other investments, including restricted securities and private placements, and those financial instruments for which the above valuation procedures are inappropriate or are deemed not to reflect fair value, are stated at fair value as determined in good faith by the T. Rowe Price Valuation Committee, established by the fund’s Board of Directors (the Board). Subject to oversight by the Board, the Valuation Committee develops pricing-related policies and procedures and approves all fair-value determinations. The Valuation Committee regularly makes good faith judgments, using a wide variety of sources and information, to establish and adjust valuations of certain securities as events occur and circumstances warrant. For instance, in determining the fair value of private-equity instruments, the Valuation Committee considers a variety of factors, including the company’s business prospects, its financial performance, strategic events impacting the company, relevant valuations of similar companies, new rounds of financing, and any negotiated transactions of significant size between other investors in the company. Because any fair-value determination involves a significant amount of judgment, there is a degree of subjectivity inherent in such pricing decisions.
For valuation purposes, the last quoted prices of non-U.S. equity securities may be adjusted under the circumstances described below. If the fund determines that developments between the close of a foreign market and the close of the NYSE will, in its judgment, materially affect the value of some or all of its portfolio securities, the fund will adjust the previous closing prices to reflect what it believes to be the fair value of the securities as of the close of the NYSE. In deciding whether it is necessary to adjust closing prices to reflect fair value, the fund reviews a variety of factors, including developments in foreign markets, the performance of U.S. securities markets, and the performance of instruments trading in U.S. markets that represent foreign securities and baskets of foreign securities. A fund may also fair value securities in other situations, such as when a particular foreign market is closed but the fund is open. The fund uses outside pricing services to provide it with closing prices and information to evaluate and/or adjust those prices. The fund cannot predict how often it will use closing prices and how often it will determine it necessary to adjust those prices to reflect fair value. As a means of evaluating its security valuation process, the fund routinely compares closing prices, the next day’s opening prices in the same markets, and adjusted prices. Additionally, trading in the underlying securities of the fund may take place in various foreign markets on certain days when the fund is not open for business and does not calculate a net asset value. As a result, net asset values may be significantly affected on days when shareholders cannot make transactions.
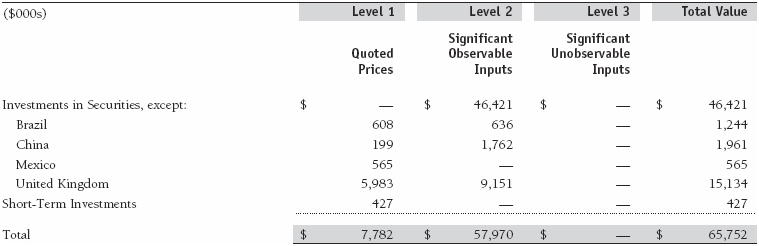
Valuation Inputs Various inputs are used to determine the value of the fund’s financial instruments. These inputs are summarized in the three broad levels listed below:
Level 1 – quoted prices in active markets for identical financial instruments
Level 2 – observable inputs other than Level 1 quoted prices (including, but not limited to, quoted prices for similar financial instruments, interest rates, prepayment speeds, and credit risk)
Level 3 – unobservable inputs
Observable inputs are those based on market data obtained from sources independent of the fund, and unobservable inputs reflect the fund’s own assumptions based on the best information available. The input levels are not necessarily an indication of the risk or liquidity associated with financial instruments at that level. For example, non-U.S. equity securities actively traded in foreign markets generally are reflected in Level 2 despite the availability of closing prices because the fund evaluates and determines whether those closing prices reflect fair value at the close of the NYSE or require adjustment, as described above. The following table summarizes the fund’s financial instruments, based on the inputs used to determine their values on April 30, 2012:
NOTE 3 - OTHER INVESTMENT TRANSACTIONS
Purchases and sales of portfolio securities other than short-term securities aggregated $4,928,000 and $3,941,000, respectively, for the six months ended April 30, 2012.
NOTE 4 - FEDERAL INCOME TAXES
No provision for federal income taxes is required since the fund intends to continue to qualify as a regulated investment company under Subchapter M of the Internal Revenue Code and distribute to shareholders all of its taxable income and gains. Distributions determined in accordance with federal income tax regulations may differ in amount or character from net investment income and realized gains for financial reporting purposes. Financial reporting records are adjusted for permanent book/tax differences to reflect tax character but are not adjusted for temporary differences. The amount and character of tax-basis distributions and composition of net assets are finalized at fiscal year-end; accordingly, tax-basis balances have not been determined as of the date of this report.
As a result of the Regulated Investment Company Modernization Act of 2010, net capital losses realized on or after November 1, 2011 (effective date) may be carried forward indefinitely to offset future realized capital gains; however, post-effective losses must be used before pre-effective capital loss carryforwards with expiration dates. Accordingly, it is possible that all or a portion of the fund’s pre-effective capital loss carryforwards could expire unused. The fund intends to retain realized gains to the extent of available capital loss carryforwards. As of October 31, 2011, the fund had $134,000 of available capital loss carryforwards, which all expire in fiscal 2019.
At April 30, 2012, the cost of investments for federal income tax purposes was $70,334,000. Net unrealized loss aggregated $4,577,000 at period-end, of which $3,778,000 related to appreciated investments and $8,355,000 related to depreciated investments.
NOTE 5 - FOREIGN TAXES
The fund is subject to foreign income taxes imposed by certain countries in which it invests. Acquisition of certain foreign currencies related to security transactions are also subject to tax. Additionally, capital gains realized by the fund upon disposition of securities issued in or by certain foreign countries are subject to capital gains tax imposed by those countries. All taxes are computed in accordance with the applicable foreign tax law, and, to the extent permitted, capital losses are used to offset capital gains. Taxes attributable to income are accrued by the fund as a reduction of income. Taxes incurred on the purchase of foreign currencies are recorded as realized loss on foreign currency transactions. Current and deferred tax expense attributable to net capital gains is reflected as a component of realized and/or change in unrealized gain/loss on securities in the accompanying financial statements. At April 30, 2012, the fund had no deferred tax liability attributable to foreign securities and no foreign capital loss carryforwards.
NOTE 6 - RELATED PARTY TRANSACTIONS
The fund is managed by T. Rowe Price Associates, Inc. (Price Associates), a wholly owned subsidiary of T. Rowe Price Group, Inc. (Price Group). The investment management agreement between the fund and Price Associates provides for an annual investment management fee equal to 0.65% of the fund’s average daily net assets. The fee is computed daily and paid monthly.
The fund is also subject to a contractual expense limitation through February 28, 2013. During the limitation period, Price Associates is required to waive its management fee and reimburse the fund for any expenses, excluding interest, taxes, brokerage commissions, and extraordinary expenses, that would otherwise cause the fund’s ratio of annualized total expenses to average net assets (expense ratio) to exceed its expense limitation of 0.75%. For a period of three years after the date of any reimbursement or waiver, the fund is required to repay Price Associates for expenses previously reimbursed and management fees waived to the extent its net assets have grown or expenses have declined sufficiently to allow repayment without causing the fund’s expense ratio to exceed its expense limitation. Pursuant to this agreement, management fees in the amount of $113,000 were waived during the six months ended April 30, 2012. Including these amounts, management fees waived and expenses previously reimbursed by Price Associates in the amount of $324,000 remain subject to repayment at April 30, 2012.
In addition, the fund has entered into service agreements with Price Associates and a wholly owned subsidiary of Price Associates (collectively, Price). Price Associates computes the daily share price and provides certain other administrative services to the fund. T. Rowe Price Services, Inc., provides shareholder and administrative services in its capacity as the fund’s transfer and dividend disbursing agent. For the six months ended April 30, 2012, expenses incurred pursuant to these service agreements were $61,000 for Price Associates and less than $1,000 for T. Rowe Price Services, Inc. The total amount payable at period-end pursuant to these service agreements is reflected as Due to Affiliates in the accompanying financial statements.
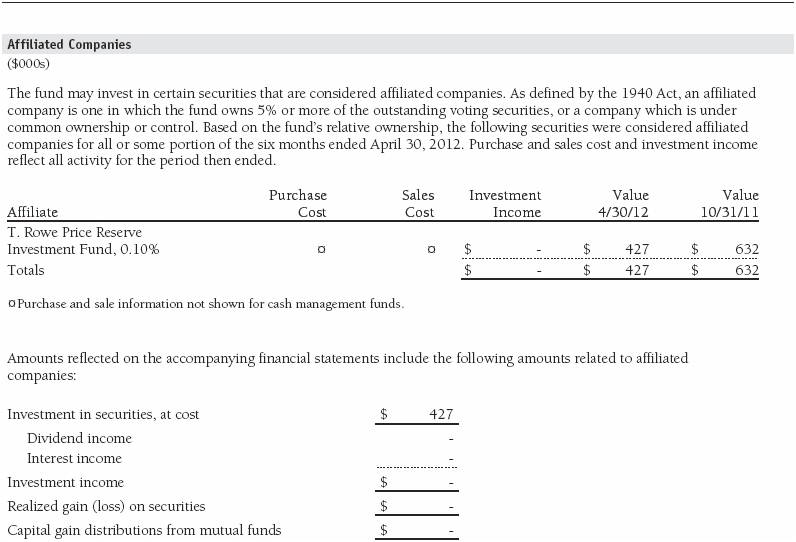
The fund may invest in the T. Rowe Price Reserve Investment Fund and the T. Rowe Price Government Reserve Investment Fund (collectively, the T. Rowe Price Reserve Investment Funds), open-end management investment companies managed by Price Associates and considered affiliates of the fund. The T. Rowe Price Reserve Investment Funds are offered as cash management options to mutual funds, trusts, and other accounts managed by Price Associates and/or its affiliates and are not available for direct purchase by members of the public. The T. Rowe Price Reserve Investment Funds pay no investment management fees.
As of April 30, 2012, T. Rowe Price Group, Inc., and/or its wholly owned subsidiaries owned 4,000,000 shares of the fund, representing 6% of the fund’s net assets.
| Information on Proxy Voting Policies, Procedures, and Records |
A description of the policies and procedures used by T. Rowe Price funds and portfolios to determine how to vote proxies relating to portfolio securities is available in each fund’s Statement of Additional Information, which you may request by calling 1-800-225-5132 or by accessing the SEC’s website, sec.gov. The description of our proxy voting policies and procedures is also available on our website, troweprice.com. To access it, click on the words “Our Company” at the top of our corporate homepage. Then, when the next page appears, click on the words “Proxy Voting Policies” on the left side of the page.
Each fund’s most recent annual proxy voting record is available on our website and through the SEC’s website. To access it through our website, follow the directions above, then click on the words “Proxy Voting Records” on the right side of the Proxy Voting Policies page.
| How to Obtain Quarterly Portfolio Holdings |
The fund files a complete schedule of portfolio holdings with the Securities and Exchange Commission for the first and third quarters of each fiscal year on Form N-Q. The fund’s Form N-Q is available electronically on the SEC’s website (sec.gov); hard copies may be reviewed and copied at the SEC’s Public Reference Room, 100 F St. N.W., Washington, DC 20549. For more information on the Public Reference Room, call 1-800-SEC-0330.
| Approval of Investment Management Agreement |
On March 6, 2012, the fund’s Board of Directors (Board) unanimously approved the continuation of the investment advisory agreement (Advisory Contract) between the fund and its investment advisor, T. Rowe Price Associates, Inc. (Advisor). The Board considered a variety of factors in connection with its review of the Advisory Contract, also taking into account information provided by the Advisor during the course of the year, as discussed below:
Services Provided by the Advisor
The Board considered the nature, quality, and extent of the services provided to the fund by the Advisor. These services included, but were not limited to, directing the fund’s investments in accordance with its investment program and the overall management of the fund’s portfolio, as well as a variety of related activities such as financial, accounting, and administrative services; maintaining the fund’s records and registrations; and shareholder communications. The Board also reviewed the background and experience of the Advisor’s senior management team and investment personnel involved in the management of the fund. The Board concluded that it was satisfied with the nature, quality, and extent of the services provided by the Advisor.
Investment Performance of the Fund
The Board reviewed the fund’s average annual total returns over the three-month, one-year, and since-inception periods, as well as the fund’s return from its inception on October 27, 2010, through the end of 2010, and compared these returns with a wide variety of previously agreed upon comparable performance measures and market data, including those supplied by Lipper and Morningstar, which are independent providers of mutual fund data. On the basis of this evaluation and the Board’s ongoing review of investment results, and factoring in the fund’s limited operating history and relative market conditions during certain of the performance periods, the Board concluded that the fund’s performance was satisfactory.
Costs, Benefits, Profits, and Economies of Scale
The Board reviewed detailed information regarding the revenues received by the Advisor under the Advisory Contract and other benefits that the Advisor (and its affiliates) may have realized from its relationship with the fund, including research received under “soft dollar” agreements and commission-sharing arrangements with broker-dealers. The Board considered that the Advisor may receive some benefit from soft-dollar arrangements pursuant to which research is received from broker-dealers that execute the applicable fund’s portfolio transactions. The Board received information on the estimated costs incurred and profits realized by the Advisor from managing T. Rowe Price mutual funds. While the Board did not review information regarding profits realized from managing the fund in particular because the fund had not achieved sufficient scale to produce meaningful profit margin percentages, the Board concluded that the Advisor’s profits were reasonable in light of the services provided to the funds.
The Board also considered whether the fund or other funds benefit under the fee levels set forth in the Advisory Contract from any economies of scale realized by the Advisor. Under the Advisory Contract, the fund pays a fee to the Advisor for investment management services based on the fund’s average daily net assets, and the fund pays its own expenses of operations (subject to an expense limitation agreed to by the Advisor). The Board concluded that, based on the profitability data it reviewed, the advisory fee structure for the fund continued to provide for a reasonable sharing of benefits from any economies of scale with the fund’s investors.
Fees
The Board was provided with information regarding industry trends in management fees and expenses, and the Board reviewed the fund’s management fee rate, operating expenses, and total expense ratio in comparison with fees and expenses of other comparable funds based on information and data supplied by Lipper. The information provided to the Board indicated that the fund’s management fee rate (after including reductions of the management fee that resulted from fee waivers and/or expenses paid by the Advisor) and the fund’s total expense ratio were below the median for comparable funds.
The Board also reviewed the fee schedules for institutional accounts and private accounts with similar mandates that are advised or subadvised by the Advisor and its affiliates. Management provided the Board with information about the Advisor’s responsibilities and services provided to institutional account clients that illustrated how the requirements and economies of the institutional business are fundamentally different from those of the mutual fund business. The information showed that the Advisor’s responsibilities for its institutional account business are more limited than its responsibilities for the fund and other T. Rowe Price mutual funds that it advises and that the Advisor performs significant additional services and assumes greater risk for the fund and other T. Rowe Price mutual funds than it does for institutional account clients. On the basis of the information provided, the Board concluded that the fees paid by the fund under the Advisory Contract were reasonable.
Approval of the Advisory Contract
As noted, the Board approved the continuation of the Advisory Contract. No single factor was considered in isolation or to be determinative to the decision. Rather, the Board was assisted by the advice of independent legal counsel and concluded, in light of a weighting and balancing of all factors considered, that it was in the best interests of the fund and its shareholders for the Board to approve the continuation of the Advisory Contract (including the fees to be charged for services thereunder).
Item 2. Code of Ethics.
A code of ethics, as defined in Item 2 of Form N-CSR, applicable to its principal executive officer, principal financial officer, principal accounting officer or controller, or persons performing similar functions is filed as an exhibit to the registrant’s annual Form N-CSR. No substantive amendments were approved or waivers were granted to this code of ethics during the registrant’s most recent fiscal half-year.
Item 3. Audit Committee Financial Expert.
Disclosure required in registrant’s annual Form N-CSR.
Item 4. Principal Accountant Fees and Services.
Disclosure required in registrant’s annual Form N-CSR.
Item 5. Audit Committee of Listed Registrants.
Not applicable.
Item 6. Investments.
(a) Not applicable. The complete schedule of investments is included in Item 1 of this Form N-CSR.
(b) Not applicable.
Item 7. Disclosure of Proxy Voting Policies and Procedures for Closed-End Management Investment Companies.
Not applicable.
Item 8. Portfolio Managers of Closed-End Management Investment Companies.
Not applicable.
Item 9. Purchases of Equity Securities by Closed-End Management Investment Company and Affiliated Purchasers.
Not applicable.
Item 10. Submission of Matters to a Vote of Security Holders.
Not applicable.
Item 11. Controls and Procedures.
(a) The registrant’s principal executive officer and principal financial officer have evaluated the registrant’s disclosure controls and procedures within 90 days of this filing and have concluded that the registrant’s disclosure controls and procedures were effective, as of that date, in ensuring that information required to be disclosed by the registrant in this Form N-CSR was recorded, processed, summarized, and reported timely.
(b) The registrant’s principal executive officer and principal financial officer are aware of no change in the registrant’s internal control over financial reporting that occurred during the registrant’s second fiscal quarter covered by this report that has materially affected, or is reasonably likely to materially affect, the registrant’s internal control over financial reporting.
Item 12. Exhibits.
(a)(1) The registrant’s code of ethics pursuant to Item 2 of Form N-CSR is filed with the registrant’s annual Form N-CSR.
(2) Separate certifications by the registrant's principal executive officer and principal financial officer, pursuant to Section 302 of the Sarbanes-Oxley Act of 2002 and required by Rule 30a-2(a) under the Investment Company Act of 1940, are attached.
(3) Written solicitation to repurchase securities issued by closed-end companies: not applicable.
(b) A certification by the registrant's principal executive officer and principal financial officer, pursuant to Section 906 of the Sarbanes-Oxley Act of 2002 and required by Rule 30a-2(b) under the Investment Company Act of 1940, is attached.
SIGNATURES
Pursuant to the requirements of the Securities Exchange Act of 1934 and the Investment Company Act of 1940, the registrant has duly caused this report to be signed on its behalf by the undersigned, thereunto duly authorized.
T. Rowe Price Institutional International Funds, Inc.
| By | /s/ Edward C. Bernard |
| | Edward C. Bernard |
| | Principal Executive Officer |
| | |
| Date June 14, 2012 | | |
Pursuant to the requirements of the Securities Exchange Act of 1934 and the Investment Company Act of 1940, this report has been signed below by the following persons on behalf of the registrant and in the capacities and on the dates indicated.
| By | /s/ Edward C. Bernard |
| | Edward C. Bernard |
| | Principal Executive Officer |
| | |
| Date June 14, 2012 | | |
| | |
| | |
| By | /s/ Gregory K. Hinkle |
| | Gregory K. Hinkle |
| | Principal Financial Officer |
| | |
| Date June 14, 2012 | | |