UNITED STATES
SECURITIES AND EXCHANGE COMMISSION
Washington, D.C. 20549
FORM N-CSR
CERTIFIED SHAREHOLDER REPORT OF REGISTERED
MANAGEMENT INVESTMENT COMPANIES
Investment Company Act File Number: 811-05833
| T. Rowe Price Institutional International Funds, Inc. |
|
| (Exact name of registrant as specified in charter) |
| |
| 100 East Pratt Street, Baltimore, MD 21202 |
|
| (Address of principal executive offices) |
| |
| David Oestreicher |
| 100 East Pratt Street, Baltimore, MD 21202 |
|
| (Name and address of agent for service) |
Registrant’s telephone number, including area code: (410) 345-2000
Date of fiscal year end: October 31
Date of reporting period: April 30, 2012
Item 1. Report to Shareholders
Institutional Global Large-Cap
Equity Fund | April 30, 2012 |
- Global equities delivered positive returns during the past six months despite the persistent challenges facing the global economy.
- The Institutional Global Large-Cap Equity Fund generated a good gain over the period and outperformed its benchmark index.
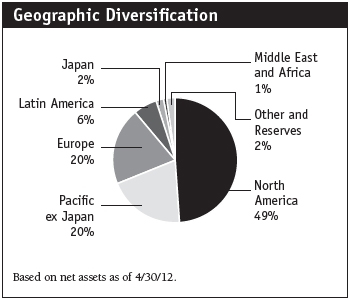
- During the period, we further decreased our allocation to Europe and bought shares of financials and consumer staples companies that should benefit from emerging markets growth.
- Despite an economic slowdown and formidable fiscal challenges in Europe and the U.S., valuations remain attractive. We are employing our bottom-up stock approach to invest in the most promising global companies.
The views and opinions in this report were current as of April 30, 2012. They are not guarantees of performance or investment results and should not be taken as investment advice. Investment decisions reflect a variety of factors, and the managers reserve the right to change their views about individual stocks, sectors, and the markets at any time. As a result, the views expressed should not be relied upon as a forecast of the fund’s future investment intent. The report is certified under the Sarbanes-Oxley Act, which requires mutual funds and other public companies to affirm that, to the best of their knowledge, the information in their financial reports is fairly and accurately stated in all material respects.
Manager’s Letter
T. Rowe Price Institutional Global Large-Cap Equity Fund
Dear Investor
Despite the significant challenges still facing the global economy, global stocks offered decent returns in the first half of our fiscal year. U.S. stocks led the way, as corporate profits were up and the economy continued to improve, albeit at a tepid pace. But the U.S. looked a lot healthier than Europe, where markets registered caution and gains were meager. Emerging markets generated decent returns despite concerns about whether China would suffer a “hard landing,” while Japan also advanced. Your fund enjoyed good gains and outperformed its benchmark index.
Performance Review
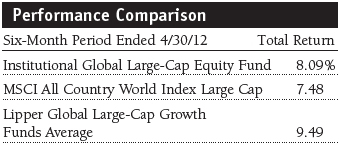
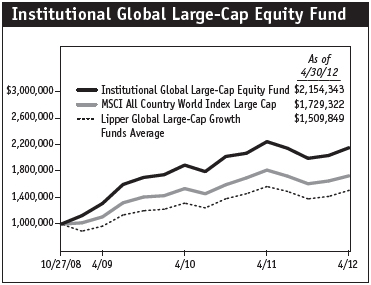
Your fund returned 8.09% for the six-month period ended April 30, 2012, outperforming the MSCI All Country World Index Large Cap, but lagging the Lipper Global Large-Cap Growth Funds Average, as shown in the Performance Comparison table. Our underweight in the struggling materials and energy sectors helped our comparison to the MSCI All Country World Index Large Cap, though this was largely offset by stock selection in the consumer discretionary sector, as several of our holdings faced headwinds from the European economic crisis. Meanwhile, our large underweight to developed European markets helped relative performance, though our large exposure to emerging markets weighed on performance. The fund’s long-term relative performance was strong. Based on cumulative total return, Lipper ranked the Institutional Global Large-Cap Equity Fund 63 of 102, 9 of 86, and 1 of 86 global large-cap growth funds for the one- and three-year and since-inception periods ended April 30, 2012, respectively. (Results will vary for other periods. Past performance cannot guarantee future results.)
Market Review
Global markets posted decent gains over the past six months. Increased optimism early in 2012 about resolving the European debt crisis helped drive a rebound in world markets following a sell-off last summer and fall. In particular, investors welcomed the massive infusion of liquidity into the European banking system through the European Central Bank’s two long-term refinancing operations (LTROs). A regional agreement to impose greater fiscal discipline in coming years also boosted sentiment.
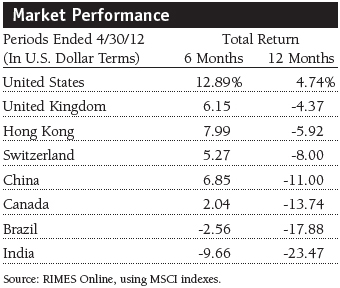
The world markets’ advance stalled in March, however, as worries grew that bond yields were bound to rise in heavily indebted countries such as Spain and Italy once funds from the LTROs were exhausted. European banks have used funds from the program to purchase sovereign debt, and it is not clear whether other buyers will be willing to step in. Also, several European countries, including Spain and the UK, slipped back into recession, as tax increases and spending cuts designed to reduce deficits also weighed on growth and called into question the political will for further austerity measures. Debt and growth concerns weighed particularly on southern European markets, with Spain and Italy suffering substantial declines in the period. The smaller Portuguese and Greek markets also fell sharply.
Developed markets elsewhere generally saw moderate gains. In a reversal from 2011, investors warmed to Japan early in the year, attracted by cheap valuations and improving prospects for exporters. Japanese policymakers have been counting on reconstruction spending to drive growth after last year’s tsunami and earthquake. The central bank has intervened to weaken the yen, which benefited exporters but also hurt returns for investors in U.S. dollar terms. Hong Kong and Singapore also performed well. Australia lagged a bit due to declining commodity prices.
Emerging markets stocks rallied early in 2012, thanks largely to more encouraging signs from Europe and other export markets in the developed world. The benchmark MSCI Emerging Markets Index hit a seven-month high on March 2 but surrendered some of its gains after China reduced its official growth target on March 5. The move signaled that China’s leaders are willing to sacrifice the torrid pace of growth of the past three decades for slower but more sustainable development. However, it also raised fears of weaker earnings prospects for the vast number of companies that depend on the world’s second-largest economy for growth.
Portfolio Review and Strategy

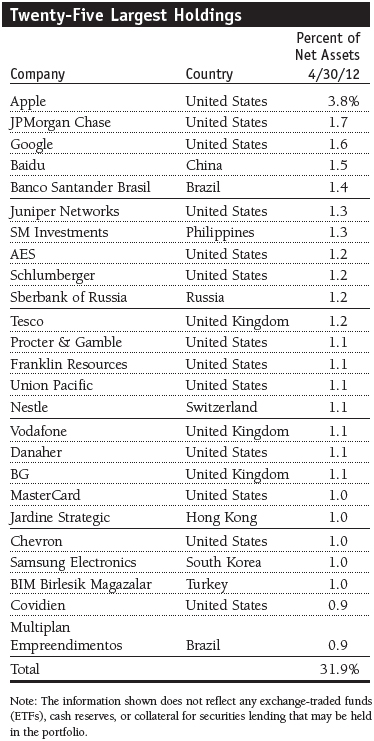
Financials continue to represent the largest share of the portfolio, as we hold a significant weight in emerging markets banks. We believe this exposure is an attractive way to benefit from the superior growth in developing countries, particularly compared with developed markets. Our holdings in the Philippines, Indonesia, Peru, Chile, and Turkey are tilted toward healthy economies with durable economic growth rates. Following a visit to India, we added several Indian banks that feature institutions with strong lending practices. We purchased Kotak Mahindra Bank (India), which focuses on high-net-worth clients and should benefit from recent changes in regulations that allow greater competition on savings rates. We also hold Indian banks HDFC Bank and Axis Bank, which feature strong management teams and a solid book of loans. We continue to have no holdings in beleaguered southern Europe. During the period we parted ways with Skandinaviska Enskilda Banken in order to lock in profits. We also initiated a position in Bank of America (U.S.), as we believe the bank will improve its cost base. Also, given the stirring U.S. housing market and growing economy, the bank’s earnings could improve meaningfully. Following the close of our reporting period, JPMorgan Chase disclosed that it had incurred a $2 billion trading loss on a hedging strategy. We are concerned about the possibility of further losses and are monitoring the situation closely. However, the bank continues to feature an attractive balance sheet, a strong global presence, and a wide array of profitable financial services that we believe offer strong long-term prospects. (Please refer to the portfolio of investments for a detailed list of holdings and the amount each represents in the portfolio.)
We continue to hold an overweight in information technology versus the index but have reduced our allocation somewhat, as we have taken profits in strong performers. We have also reduced our position sizes in several holdings, such as Apple (U.S). While the company remains our top holding, we sold some shares to manage our position size. We believe that the company’s growth prospects remain strong and that the launch of the iPhone 5 could boost share price. We bought shares of U.S. semiconductor company Altera, which has a positive revenue stream and serves customers in the telecommunication services, wireless, and automation industries. We sold semiconductor equipment maker ASML (Netherlands) following its strong performance and growing concerns about near-term weakness in Europe and China. We bought shares of MasterCard (U.S.) due to the company’s strong inroads in consumer loans. Professional social networking leader LinkedIn (U.S.) is a new position that trades at high valuation multiples but that we find appealing. We believe the company will continue to benefit from its already large base of members and become a leading solutions provider for human resource departments. LinkedIn also has a compelling opportunity to build substantial revenue streams on the strength of the value it offers members and advertisers. We think it could become one of the next large Internet businesses. Like Baidu (China), LinkedIn appears to have many years of rapid growth ahead, which should help bring down the valuation multiple to a reasonable level as growth is delivered.
We trimmed our allocation to the consumer discretionary sector on strength during the period but have a larger allocation than our benchmark as a result of our heavier exposure to companies whose fortunes are tied to consumers in emerging markets. We have a number of holdings in the hotel and gaming industry. Las Vegas Sands operates in the U.S., Macau, and Singapore, and its exposure to emerging markets is favorable, in our view. Shangri-La Asia is a Hong Kong investment holding company that operates hotels and real estate properties. During the period, we sold Wynn Macau, as we believe it is richly valued. We exited our position in Accor, a French hotel company that manages a wide range of accommodations, as it failed to gain traction due to the economic strains in southern Europe. Likewise, we were disappointed with General Motors. The company has continued to improve since the U.S. auto bailout, but it faces headwinds from lagging sales in Europe and the U.S., and we sold our position.
During the period, we increased our position in consumer staples as valuations in the sector became more appealing, particularly after the runup in consumer discretionary stocks. We initiated positions in Hengan International Group (Hong Kong), the largest producer of feminine hygiene products in China, and Reckitt Benckiser (UK), the world’s largest producer of household cleaning products, as both companies have exposure to emerging markets consumers. We also added to Tesco (UK) on weakness. The company underinvested in stores and missed earnings projections. However, the third-largest retailer in the world has expanded to 14 countries and diversified its product line and is an attractively valued business. We also bought Anheuser-Busch InBev (Belgium), as we believe it has a strong growth profile, particularly in Latin America.
Our reduced exposure to the energy sector reflects our view that energy prices will continue to decline in the near term. Our holdings are tilted more toward oil services than large integrated oil companies. We prefer companies that offer exposure to production growth, particularly North American shale oil. We recently added to several energy names that we believe will benefit from an uptick in North American shale oil production. These include Pioneer Natural Resources (U.S.), which operates in the Permian Basin; Lyondellbasell Industries (Netherlands), a petrochemical company; and Williams Companies, a U.S. pipeline operator.
Outlook
Following the close of our reporting period, France elected a Socialist president who vowed to turn back the clock on harsh austerity measures, while Greece had parliamentary elections that raised fresh doubts over whether the country would remain in the eurozone. Such is the rapid pace of change these days that assessing economic outcomes—uncertain at the best of times—has become increasingly difficult. What is clear, however, is that Europe is in recession, and further austerity measures may compound growth issues in the near term and lead to ongoing political uncertainty. Chinese economic growth is clearly slowing, though we do not believe the country faces a prolonged slump given the tools at the government’s disposal. The U.S. is growing, albeit at a tepid pace, while Japan has faced a multitude of headwinds in recent years but has continued to demonstrate remarkable resilience. However, a prolonged recovery will require a reversal in the trend of U.S. dollar weakness.
On the corporate side, finances are healthier than they have been in many years, with companies holding record amounts of cash and having relatively low debt-to-equity ratios, in stark contrast to their positions in 2008. The global marketplace continues to invite many solid opportunities, whether in technology and consumer products in developed markets or financial institutions in emerging market countries. With growth slowing throughout most of the world, many companies, having already cut costs and improved productivity, are mining new opportunities for their products or returning capital to shareholders through dividends and share buybacks. We will continue to focus on high-quality companies with growing franchises, strong cash flows, and solid balance sheets as we strive to identify businesses that we believe can prosper during these turbulent times.
As always, thank you for investing with T. Rowe Price.
Respectfully submitted,

R. Scott Berg
Chairman of the fund’s Investment Advisory Committee
May 15, 2012
The committee chairman has day-to-day responsibility for managing the portfolio and works with committee members in developing and executing the fund’s investment program.
| Risks of International Investing |
Funds that invest overseas generally carry more risk than funds that invest strictly in U.S. assets. Funds investing in a single country or in a limited geographic region tend to be riskier than more diversified funds. Risks can result from varying stages of economic and political development; differing regulatory environments, trading days, and accounting standards; and higher transaction costs of non-U.S. markets. Non-U.S. investments are also subject to currency risk, or a decline in the value of a foreign currency versus the U.S. dollar, which reduces the dollar value of securities denominated in that currency.
Lipper averages: The average of available mutual fund performance returns in categories defined by Lipper Inc.
MSCI All Country World Index Large Cap: A capitalization-weighted index of stocks from developed and emerging markets worldwide.
Portfolio Highlights
This chart shows the value of a hypothetical $1 million investment in the fund over the past 10 fiscal year periods or since inception (for funds lacking 10-year records). The result is compared with benchmarks, which may include a broad-based market index and a peer group average or index. Market indexes do not include expenses, which are deducted from fund returns as well as mutual fund averages and indexes.
Fund Expense Example
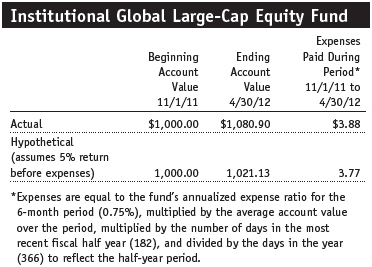
As a mutual fund shareholder, you may incur two types of costs: (1) transaction costs, such as redemption fees or sales loads, and (2) ongoing costs, including management fees, distribution and service (12b-1) fees, and other fund expenses. The following example is intended to help you understand your ongoing costs (in dollars) of investing in the fund and to compare these costs with the ongoing costs of investing in other mutual funds. The example is based on an investment of $1,000 invested at the beginning of the most recent six-month period and held for the entire period.
Actual Expenses
The first line of the following table (“Actual”) provides information about actual account values and actual expenses. You may use the information on this line, together with your account balance, to estimate the expenses that you paid over the period. Simply divide your account value by $1,000 (for example, an $8,600 account value divided by $1,000 = 8.6), then multiply the result by the number on the first line under the heading “Expenses Paid During Period” to estimate the expenses you paid on your account during this period.
Hypothetical Example for Comparison Purposes
The information on the second line of the table (“Hypothetical”) is based on hypothetical account values and expenses derived from the fund’s actual expense ratio and an assumed 5% per year rate of return before expenses (not the fund’s actual return). You may compare the ongoing costs of investing in the fund with other funds by contrasting this 5% hypothetical example and the 5% hypothetical examples that appear in the shareholder reports of the other funds. The hypothetical account values and expenses may not be used to estimate the actual ending account balance or expenses you paid for the period.
You should also be aware that the expenses shown in the table highlight only your ongoing costs and do not reflect any transaction costs, such as redemption fees or sales loads. Therefore, the second line of the table is useful in comparing ongoing costs only and will not help you determine the relative total costs of owning different funds. To the extent a fund charges transaction costs, however, the total cost of owning that fund is higher.
Financial Highlights
T. Rowe Price Institutional Global Large-Cap Equity Fund
(Unaudited)
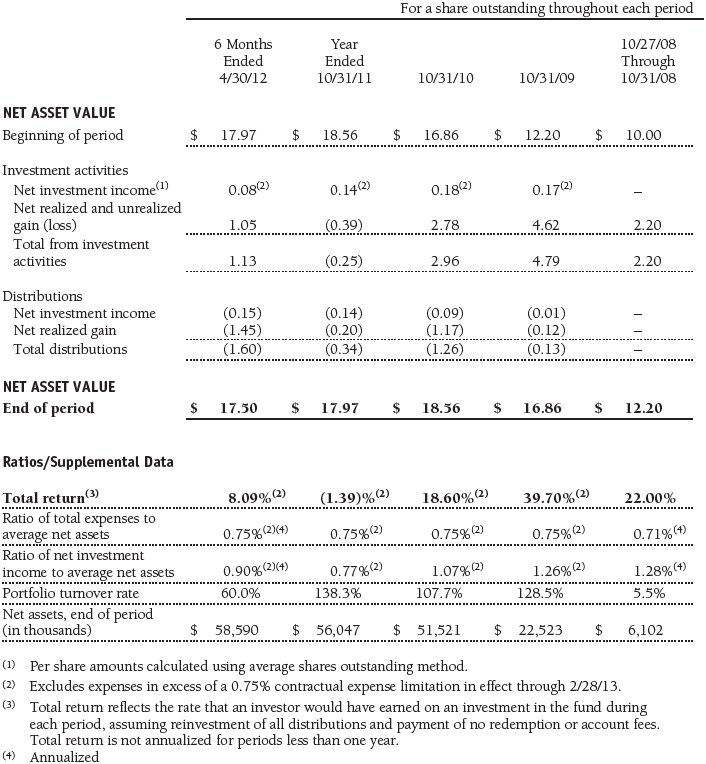
The accompanying notes are an integral part of these financial statements.
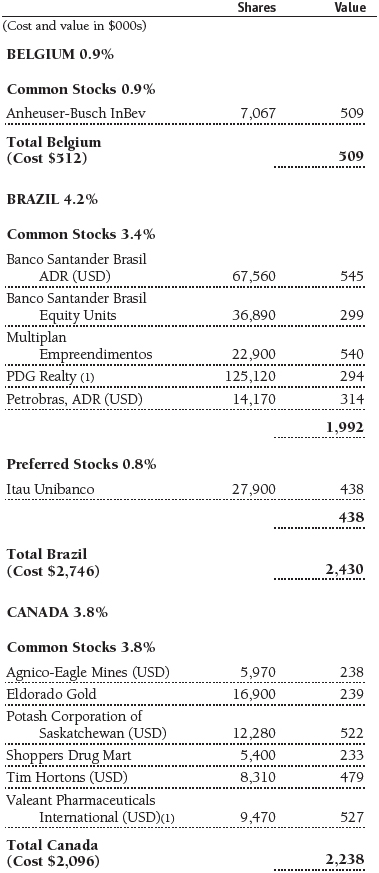
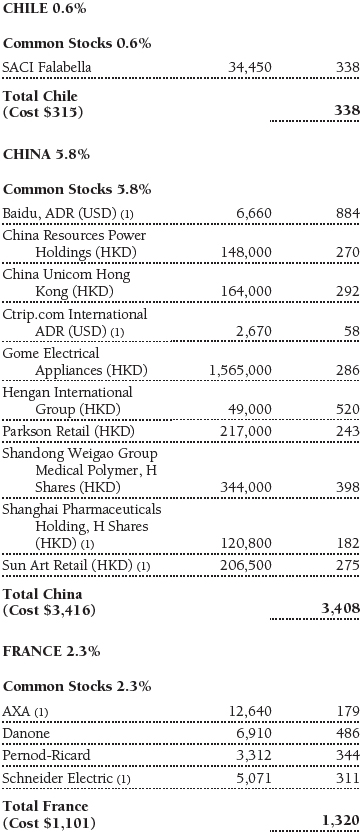
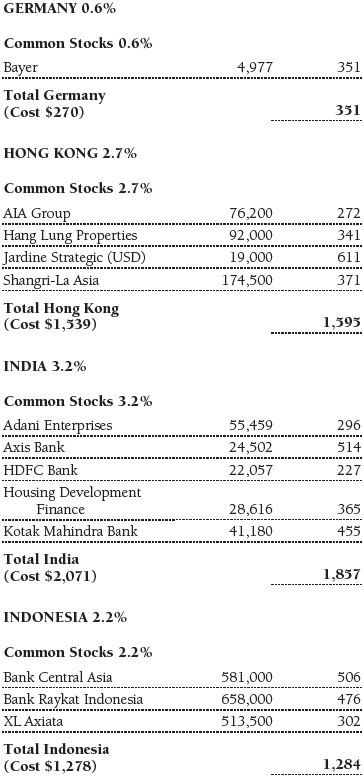
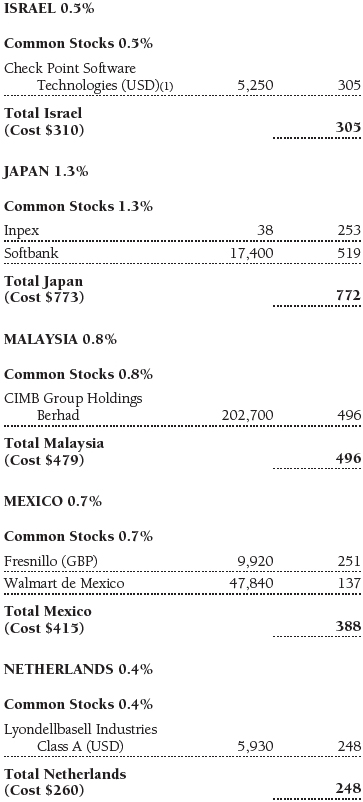
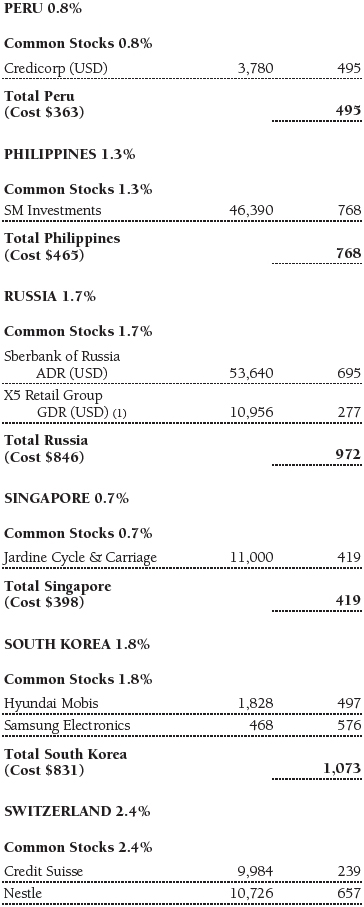
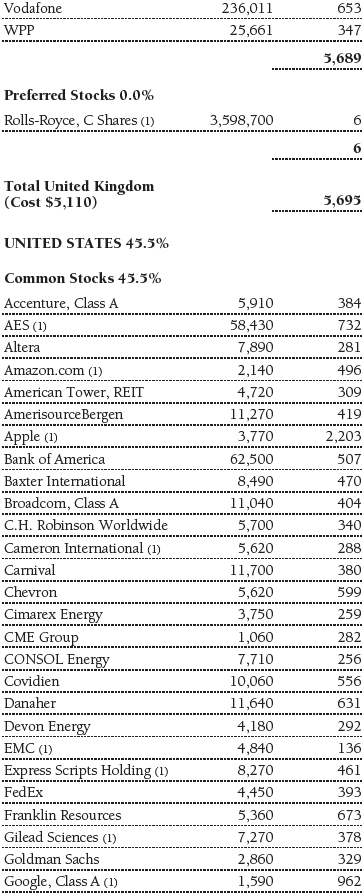
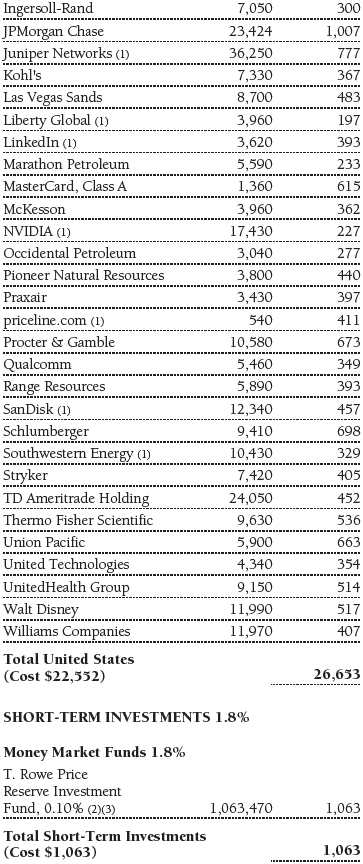
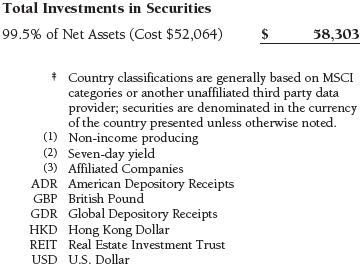
Portfolio of Investments‡
T. Rowe Price Institutional Global Large-Cap Equity Fund
April 30, 2012 (Unaudited)

The accompanying notes are an integral part of these financial statements.
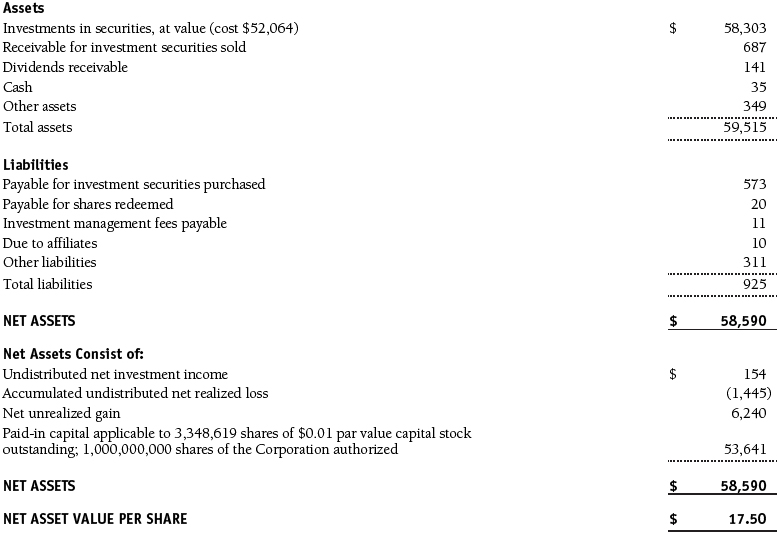
Statement of Assets and Liabilities
T. Rowe Price Institutional Global Large-Cap Equity Fund
April 30, 2012 (Unaudited)
($000s, except shares and per share amounts)
The accompanying notes are an integral part of these financial statements.
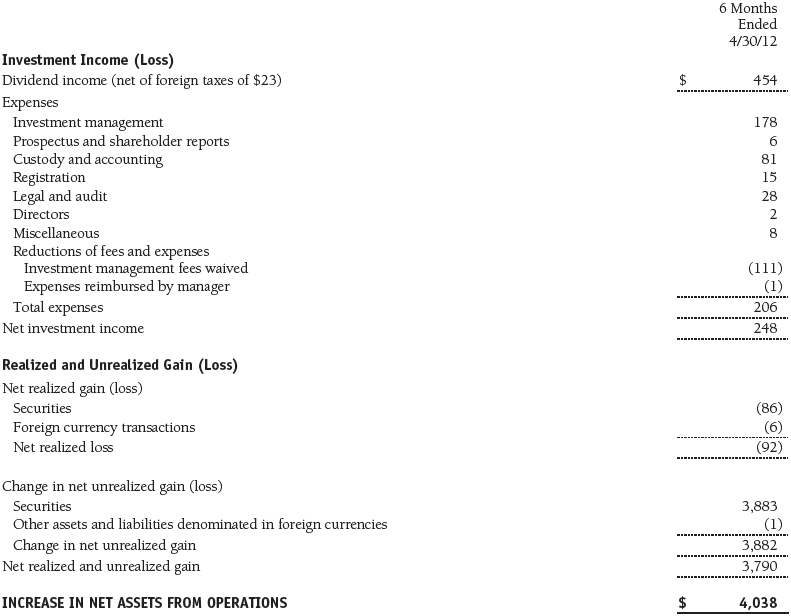
Statement of Operations
T. Rowe Price Institutional Global Large-Cap Equity Fund
(Unaudited)
($000s)
The accompanying notes are an integral part of these financial statements.
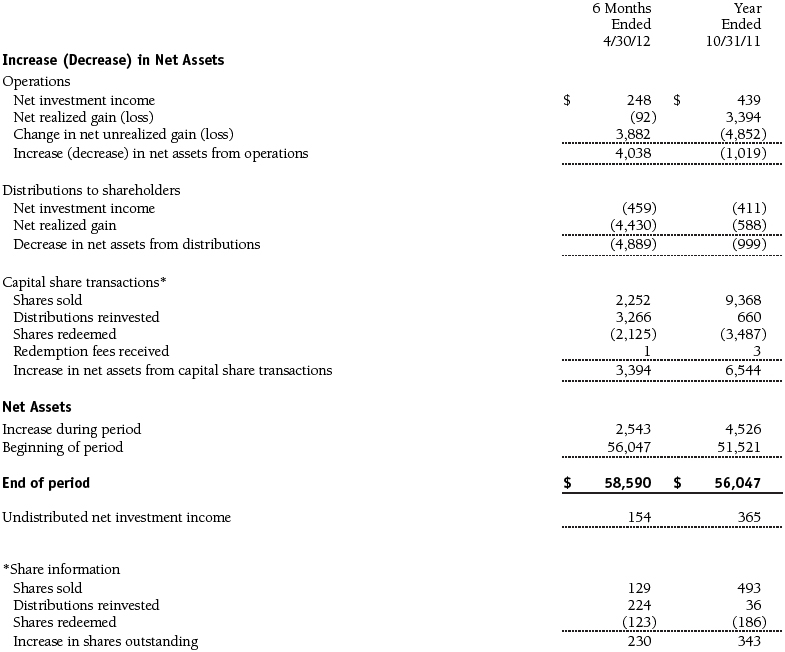
Statement of Changes in Net Assets
T. Rowe Price Institutional Global Large-Cap Equity Fund
(Unaudited)
($000s)
The accompanying notes are an integral part of these financial statements.
Notes to Financial Statements
T. Rowe Price Institutional Global Large-Cap Equity Fund
April 30, 2012 (Unaudited)
T. Rowe Price Institutional International Funds, Inc. (the corporation), is registered under the Investment Company Act of 1940 (the 1940 Act). The Institutional Global Large-Cap Equity Fund (the fund) is a diversified, open-end management investment company established by the corporation. The fund commenced operations on October 27, 2008. The fund seeks long-term growth of capital through investments primarily in the common stocks of large-cap companies throughout the world, including the U.S.
NOTE 1 - SIGNIFICANT ACCOUNTING POLICIES
Basis of Preparation The accompanying financial statements were prepared in accordance with accounting principles generally accepted in the United States of America (GAAP), which require the use of estimates made by management. Management believes that estimates and valuations are appropriate; however, actual results may differ from those estimates, and the valuations reflected in the accompanying financial statements may differ from the value ultimately realized upon sale or maturity.
Investment Transactions, Investment Income, and Distributions Income and expenses are recorded on the accrual basis. Dividends received from mutual fund investments are reflected as dividend income; capital gain distributions are reflected as realized gain/loss. Dividend income and capital gain distributions are recorded on the ex-dividend date. Income tax-related interest and penalties, if incurred, would be recorded as income tax expense. Investment transactions are accounted for on the trade date. Realized gains and losses are reported on the identified cost basis. Distributions to shareholders are recorded on the ex-dividend date. Income distributions are declared and paid annually. Capital gain distributions, if any, are generally declared and paid by the fund annually.
Currency Translation Assets, including investments, and liabilities denominated in foreign currencies are translated into U.S. dollar values each day at the prevailing exchange rate, using the mean of the bid and asked prices of such currencies against U.S. dollars as quoted by a major bank. Purchases and sales of securities, income, and expenses are translated into U.S. dollars at the prevailing exchange rate on the date of the transaction. The effect of changes in foreign currency exchange rates on realized and unrealized security gains and losses is reflected as a component of security gains and losses.
Credits The fund earns credits on temporarily uninvested cash balances held at the custodian, which reduce the fund’s custody charges. Custody expense in the accompanying financial statements is presented before reduction for credits.
Redemption Fees A 2% fee is assessed on redemptions of fund shares held for 90 days or less to deter short-term trading and to protect the interests of long-term shareholders. Redemption fees are withheld from proceeds that shareholders receive from the sale or exchange of fund shares. The fees are paid to the fund and are recorded as an increase to paid-in capital. The fees may cause the redemption price per share to differ from the net asset value per share.
New Accounting Pronouncements In May 2011, the Financial Accounting Standards Board (FASB) issued amended guidance to align fair value measurement and disclosure requirements in U.S. GAAP with International Financial Reporting Standards. The guidance is effective for fiscal years and interim periods beginning on or after December 15, 2011. Adoption will have no effect on net assets or results of operations.
In December 2011, the FASB issued amended guidance to enhance disclosure for offsetting assets and liabilities. The guidance is effective for fiscal years and interim periods beginning on or after January 1, 2013; adoption will have no effect on the fund’s net assets or results of operations.
NOTE 2 - VALUATION
The fund’s financial instruments are reported at fair value as defined by GAAP. The fund determines the values of its assets and liabilities and computes its net asset value per share at the close of the New York Stock Exchange (NYSE), normally 4 p.m. ET, each day that the NYSE is open for business.
Valuation Methods Equity securities listed or regularly traded on a securities exchange or in the over-the-counter (OTC) market are valued at the last quoted sale price or, for certain markets, the official closing price at the time the valuations are made, except for OTC Bulletin Board securities, which are valued at the mean of the latest bid and asked prices. A security that is listed or traded on more than one exchange is valued at the quotation on the exchange determined to be the primary market for such security. Listed securities not traded on a particular day are valued at the mean of the latest bid and asked prices for domestic securities and the last quoted sale price for international securities.
Investments in mutual funds are valued at the mutual fund’s closing net asset value per share on the day of valuation.
Other investments, including restricted securities and private placements, and those financial instruments for which the above valuation procedures are inappropriate or are deemed not to reflect fair value, are stated at fair value as determined in good faith by the T. Rowe Price Valuation Committee, established by the fund’s Board of Directors (the Board). Subject to oversight by the Board, the Valuation Committee develops pricing-related policies and procedures and approves all fair-value determinations. The Valuation Committee regularly makes good faith judgments, using a wide variety of sources and information, to establish and adjust valuations of certain securities as events occur and circumstances warrant. For instance, in determining the fair value of private-equity instruments, the Valuation Committee considers a variety of factors, including the company’s business prospects, its financial performance, strategic events impacting the company, relevant valuations of similar companies, new rounds of financing, and any negotiated transactions of significant size between other investors in the company. Because any fair-value determination involves a significant amount of judgment, there is a degree of subjectivity inherent in such pricing decisions.
For valuation purposes, the last quoted prices of non-U.S. equity securities may be adjusted under the circumstances described below. If the fund determines that developments between the close of a foreign market and the close of the NYSE will, in its judgment, materially affect the value of some or all of its portfolio securities, the fund will adjust the previous closing prices to reflect what it believes to be the fair value of the securities as of the close of the NYSE. In deciding whether it is necessary to adjust closing prices to reflect fair value, the fund reviews a variety of factors, including developments in foreign markets, the performance of U.S. securities markets, and the performance of instruments trading in U.S. markets that represent foreign securities and baskets of foreign securities. A fund may also fair value securities in other situations, such as when a particular foreign market is closed but the fund is open. The fund uses outside pricing services to provide it with closing prices and information to evaluate and/or adjust those prices. The fund cannot predict how often it will use closing prices and how often it will determine it necessary to adjust those prices to reflect fair value. As a means of evaluating its security valuation process, the fund routinely compares closing prices, the next day’s opening prices in the same markets, and adjusted prices. Additionally, trading in the underlying securities of the fund may take place in various foreign markets on certain days when the fund is not open for business and does not calculate a net asset value. As a result, net asset values may be significantly affected on days when shareholders cannot make transactions.
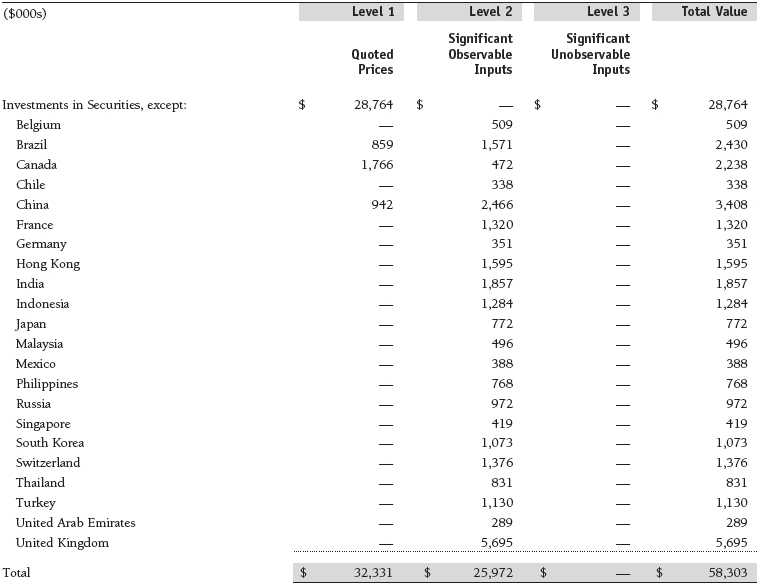
Valuation Inputs Various inputs are used to determine the value of the fund’s financial instruments. These inputs are summarized in the three broad levels listed below:
Level 1 – quoted prices in active markets for identical financial instruments
Level 2 – observable inputs other than Level 1 quoted prices (including, but not limited to, quoted prices for similar financial instruments, interest rates, prepayment speeds, and credit risk)
Level 3 – unobservable inputs
Observable inputs are those based on market data obtained from sources independent of the fund, and unobservable inputs reflect the fund’s own assumptions based on the best information available. The input levels are not necessarily an indication of the risk or liquidity associated with financial instruments at that level. For example, non-U.S. equity securities actively traded in foreign markets generally are reflected in Level 2 despite the availability of closing prices because the fund evaluates and determines whether those closing prices reflect fair value at the close of the NYSE or require adjustment, as described above. The following table summarizes the fund’s financial instruments, based on the inputs used to determine their values on April 30, 2012:
NOTE 3 - OTHER INVESTMENT TRANSACTIONS
Consistent with its investment objective, the fund engages in the following practices to manage exposure to certain risks and/or to enhance performance. The investment objective, policies, program, and risk factors of the fund are described more fully in the fund’s prospectus and Statement of Additional Information.
Emerging Markets At April 30, 2012, approximately 27% of the fund’s net assets were invested, either directly or through investments in T. Rowe Price institutional funds, in securities of companies located in emerging markets, securities issued by governments of emerging market countries, and/or securities denominated in or linked to the currencies of emerging market countries. Emerging market securities are often subject to greater price volatility, less liquidity, and higher rates of inflation than U.S. securities. In addition, emerging markets may be subject to greater political, economic, and social uncertainty, and differing regulatory environments that may potentially impact the fund’s ability to buy or sell certain securities or repatriate proceeds to U.S. dollars.
Other Purchases and sales of portfolio securities other than short-term securities aggregated $32,706,000 and $33,418,000, respectively, for the six months ended April 30, 2012.
NOTE 4 - FEDERAL INCOME TAXES
No provision for federal income taxes is required since the fund intends to continue to qualify as a regulated investment company under Subchapter M of the Internal Revenue Code and distribute to shareholders all of its taxable income and gains. Distributions determined in accordance with federal income tax regulations may differ in amount or character from net investment income and realized gains for financial reporting purposes. Financial reporting records are adjusted for permanent book/tax differences to reflect tax character but are not adjusted for temporary differences. The amount and character of tax-basis distributions and composition of net assets are finalized at fiscal year-end; accordingly, tax-basis balances have not been determined as of the date of this report.
At April 30, 2012, the cost of investments for federal income tax purposes was $53,006,000. Net unrealized gain aggregated $5,298,000 at period-end, of which $7,840,000 related to appreciated investments and $2,542,000 related to depreciated investments.
NOTE 5 - FOREIGN TAXES
The fund is subject to foreign income taxes imposed by certain countries in which it invests. Acquisition of certain foreign currencies related to security transactions are also subject to tax. Additionally, capital gains realized by the fund upon disposition of securities issued in or by certain foreign countries are subject to capital gains tax imposed by those countries. All taxes are computed in accordance with the applicable foreign tax law, and, to the extent permitted, capital losses are used to offset capital gains. Taxes attributable to income are accrued by the fund as a reduction of income. Taxes incurred on the purchase of foreign currencies are recorded as realized loss on foreign currency transactions. Current and deferred tax expense attributable to net capital gains is reflected as a component of realized and/or change in unrealized gain/loss on securities in the accompanying financial statements. At April 30, 2012, the fund had no deferred tax liability attributable to foreign securities and $148,000 of foreign capital loss carryforwards that expire in 2020.
NOTE 6 - RELATED PARTY TRANSACTIONS
The fund is managed by T. Rowe Price Associates, Inc. (Price Associates), a wholly owned subsidiary of T. Rowe Price Group, Inc. (Price Group). The investment management agreement between the fund and Price Associates provides for an annual investment management fee equal to 0.65% of the fund’s average daily net assets. The fee is computed daily and paid monthly.
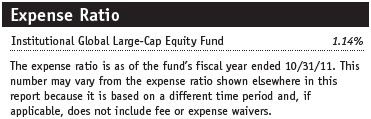
The fund is also subject to a contractual expense limitation through February 28, 2013. During the limitation period, Price Associates is required to waive its management fee and reimburse the fund for any expenses, excluding interest, taxes, brokerage commissions, and extraordinary expenses, that would otherwise cause the fund’s ratio of annualized total expenses to average net assets (expense ratio) to exceed its expense limitation of 0.75%. The fund is required to repay Price Associates for expenses previously reimbursed and management fees waived to the extent the fund’s net assets have grown or expenses have declined sufficiently to allow repayment without causing the fund’s expense ratio to exceed its expense limitation. However, no repayment will be made more than three years after the date of any reimbursement or waiver or later than February 29, 2016. Pursuant to this agreement, management fees in the amount of $111,000 were waived and expenses in the amount of $1,000 were reimbursed by Price Associates during the six months ended April 30, 2012. Including these amounts, management fees waived and expenses previously reimbursed by Price Associates in the amount of $675,000 remain subject to repayment at April 30, 2012.
In addition, the fund has entered into service agreements with Price Associates and a wholly owned subsidiary of Price Associates (collectively, Price). Price Associates computes the daily share price and provides certain other administrative services to the fund. T. Rowe Price Services, Inc., provides shareholder and administrative services in its capacity as the fund’s transfer and dividend disbursing agent. For the six months ended April 30, 2012, expenses incurred pursuant to these service agreements were $61,000 for Price Associates and less than $1,000 for T. Rowe Price Services, Inc. The total amount payable at period-end pursuant to these service agreements is reflected as Due to Affiliates in the accompanying financial statements.
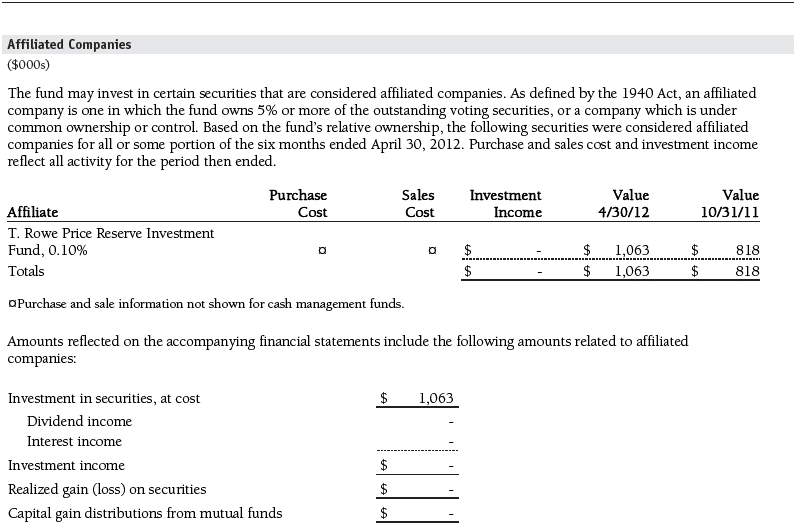
The fund may invest in the T. Rowe Price Reserve Investment Fund and the T. Rowe Price Government Reserve Investment Fund (collectively, the T. Rowe Price Reserve Investment Funds), open-end management investment companies managed by Price Associates and considered affiliates of the fund. The T. Rowe Price Reserve Investment Funds are offered as cash management options to mutual funds, trusts, and other accounts managed by Price Associates and/or its affiliates and are not available for direct purchase by members of the public. The T. Rowe Price Reserve Investment Funds pay no investment management fees.
As of April 30, 2012, T. Rowe Price Group, Inc., and/or its wholly owned subsidiaries owned 500,000 shares of the fund, representing 15% of the fund’s net assets.
| Information on Proxy Voting Policies, Procedures, and Records |
A description of the policies and procedures used by T. Rowe Price funds and portfolios to determine how to vote proxies relating to portfolio securities is available in each fund’s Statement of Additional Information, which you may request by calling 1-800-225-5132 or by accessing the SEC’s website, sec.gov. The description of our proxy voting policies and procedures is also available on our website, troweprice.com. To access it, click on the words “Our Company” at the top of our corporate homepage. Then, when the next page appears, click on the words “Proxy Voting Policies” on the left side of the page.
Each fund’s most recent annual proxy voting record is available on our website and through the SEC’s website. To access it through our website, follow the directions above, then click on the words “Proxy Voting Records” on the right side of the Proxy Voting Policies page.
| How to Obtain Quarterly Portfolio Holdings |
The fund files a complete schedule of portfolio holdings with the Securities and Exchange Commission for the first and third quarters of each fiscal year on Form N-Q. The fund’s Form N-Q is available electronically on the SEC’s website (sec.gov); hard copies may be reviewed and copied at the SEC’s Public Reference Room, 100 F St. N.W., Washington, DC 20549. For more information on the Public Reference Room, call 1-800-SEC-0330.
| Approval of Investment Management Agreement |
On March 6, 2012, the fund’s Board of Directors (Board) unanimously approved the continuation of the investment advisory agreement (Advisory Contract) between the fund and its investment advisor, T. Rowe Price Associates, Inc. (Advisor). The Board considered a variety of factors in connection with its review of the Advisory Contract, also taking into account information provided by the Advisor during the course of the year, as discussed below:
Services Provided by the Advisor
The Board considered the nature, quality, and extent of the services provided to the fund by the Advisor. These services included, but were not limited to, directing the fund’s investments in accordance with its investment program and the overall management of the fund’s portfolio, as well as a variety of related activities, such as financial, accounting, and administrative services; maintaining the fund’s records and registrations; and shareholder communications. The Board also reviewed the background and experience of the Advisor’s senior management team and investment personnel involved in the management of the fund. The Board concluded that it was satisfied with the nature, quality, and extent of the services provided by the Advisor.
Investment Performance of the Fund
The Board reviewed the fund’s average annual total returns over the three-month, the one- and three-year, and the since-inception periods, as well as the fund’s year-by-year returns, and compared these returns with a wide variety of previously agreed upon comparable performance measures and market data, including those supplied by Lipper and Morningstar, which are independent providers of mutual fund data. On the basis of this evaluation and the Board’s ongoing review of investment results, and factoring in the relative market conditions during certain of the performance periods, the Board concluded that the fund’s performance was satisfactory.
Costs, Benefits, Profits, and Economies of Scale
The Board reviewed detailed information regarding the revenues received by the Advisor under the Advisory Contract and other benefits that the Advisor (and its affiliates) may have realized from its relationship with the fund, including research received under “soft dollar” agreements and commission-sharing arrangements with broker-dealers. The Board considered that the Advisor may receive some benefit from soft-dollar arrangements pursuant to which research is received from broker-dealers that execute the applicable fund’s portfolio transactions. The Board received information on the estimated costs incurred and profits realized by the Advisor from managing T. Rowe Price mutual funds. While the Board did not review information regarding profits realized from managing the fund in particular because the fund had not achieved sufficient scale to produce meaningful profit margin percentages, the Board concluded that the Advisor’s profits were reasonable in light of the services provided to the funds.
The Board also considered whether the fund or other funds benefit under the fee levels set forth in the Advisory Contract from any economies of scale realized by the Advisor. Under the Advisory Contract, the fund pays a fee to the Advisor for investment management services based on the fund’s average daily net assets and the fund pays its own expenses of operations (subject to an expense limitation agreed to by the Advisor). The Board concluded that, based on the profitability data it reviewed, the advisory fee structure for the fund continued to provide for a reasonable sharing of benefits from any economies of scale with the fund’s investors.
Fees
The Board was provided with information regarding industry trends in management fees and expenses, and the Board reviewed the fund’s management fee rate, operating expenses, and total expense ratio in comparison with fees and expenses of other comparable funds based on information and data supplied by Lipper. The information provided to the Board indicated that the fund’s management fee rate (after including reductions of the management fee that resulted from fee waivers and/or expenses paid by the Advisor) and the fund’s total expense ratio were below the median for comparable funds.
The Board also reviewed the fee schedules for institutional accounts and private accounts with similar mandates that are advised or subadvised by the Advisor and its affiliates. Management provided the Board with information about the Advisor’s responsibilities and services provided to institutional account clients that illustrated how the requirements and economies of the institutional business are fundamentally different from those of the mutual fund business. The information showed that the Advisor’s responsibilities for its institutional account business are more limited than its responsibilities for the fund and other T. Rowe Price mutual funds that it advises, and that the Advisor performs significant additional services and assumes greater risk for the fund and other T. Rowe Price mutual funds than it does for institutional account clients. On the basis of the information provided, the Board concluded that the fees paid by the fund under the Advisory Contract were reasonable.
Approval of the Advisory Contract
As noted, the Board approved the continuation of the Advisory Contract. No single factor was considered in isolation or to be determinative to the decision. Rather, the Board was assisted by the advice of independent legal counsel and concluded, in light of a weighting and balancing of all factors considered, that it was in the best interests of the fund and its shareholders for the Board to approve the continuation of the Advisory Contract (including the fees to be charged for services thereunder).
Item 2. Code of Ethics.
A code of ethics, as defined in Item 2 of Form N-CSR, applicable to its principal executive officer, principal financial officer, principal accounting officer or controller, or persons performing similar functions is filed as an exhibit to the registrant’s annual Form N-CSR. No substantive amendments were approved or waivers were granted to this code of ethics during the registrant’s most recent fiscal half-year.
Item 3. Audit Committee Financial Expert.
Disclosure required in registrant’s annual Form N-CSR.
Item 4. Principal Accountant Fees and Services.
Disclosure required in registrant’s annual Form N-CSR.
Item 5. Audit Committee of Listed Registrants.
Not applicable.
Item 6. Investments.
(a) Not applicable. The complete schedule of investments is included in Item 1 of this Form N-CSR.
(b) Not applicable.
Item 7. Disclosure of Proxy Voting Policies and Procedures for Closed-End Management Investment Companies.
Not applicable.
Item 8. Portfolio Managers of Closed-End Management Investment Companies.
Not applicable.
Item 9. Purchases of Equity Securities by Closed-End Management Investment Company and Affiliated Purchasers.
Not applicable.
Item 10. Submission of Matters to a Vote of Security Holders.
Not applicable.
Item 11. Controls and Procedures.
(a) The registrant’s principal executive officer and principal financial officer have evaluated the registrant’s disclosure controls and procedures within 90 days of this filing and have concluded that the registrant’s disclosure controls and procedures were effective, as of that date, in ensuring that information required to be disclosed by the registrant in this Form N-CSR was recorded, processed, summarized, and reported timely.
(b) The registrant’s principal executive officer and principal financial officer are aware of no change in the registrant’s internal control over financial reporting that occurred during the registrant’s second fiscal quarter covered by this report that has materially affected, or is reasonably likely to materially affect, the registrant’s internal control over financial reporting.
Item 12. Exhibits.
(a)(1) The registrant’s code of ethics pursuant to Item 2 of Form N-CSR is filed with the registrant’s annual Form N-CSR.
(2) Separate certifications by the registrant's principal executive officer and principal financial officer, pursuant to Section 302 of the Sarbanes-Oxley Act of 2002 and required by Rule 30a-2(a) under the Investment Company Act of 1940, are attached.
(3) Written solicitation to repurchase securities issued by closed-end companies: not applicable.
(b) A certification by the registrant's principal executive officer and principal financial officer, pursuant to Section 906 of the Sarbanes-Oxley Act of 2002 and required by Rule 30a-2(b) under the Investment Company Act of 1940, is attached.
SIGNATURES
Pursuant to the requirements of the Securities Exchange Act of 1934 and the Investment Company Act of 1940, the registrant has duly caused this report to be signed on its behalf by the undersigned, thereunto duly authorized.
T. Rowe Price Institutional International Funds, Inc.
| By | /s/ Edward C. Bernard |
| | Edward C. Bernard |
| | Principal Executive Officer |
| | |
| Date June 14, 2012 | | |
Pursuant to the requirements of the Securities Exchange Act of 1934 and the Investment Company Act of 1940, this report has been signed below by the following persons on behalf of the registrant and in the capacities and on the dates indicated.
| By | /s/ Edward C. Bernard |
| | Edward C. Bernard |
| | Principal Executive Officer |
| | |
| Date June 14, 2012 | | |
| | |
| | |
| By | /s/ Gregory K. Hinkle |
| | Gregory K. Hinkle |
| | Principal Financial Officer |
| | |
| Date June 14, 2012 | | |