UNITED STATES
SECURITIES AND EXCHANGE COMMISSION
Washington, D.C. 20549
FORM N-CSR
CERTIFIED SHAREHOLDER REPORT OF REGISTERED
MANAGEMENT INVESTMENT COMPANIES
Investment Company Act File Number: 811-05833
| T. Rowe Price Institutional International Funds, Inc. |
| (Exact name of registrant as specified in charter) |
| 100 East Pratt Street, Baltimore, MD 21202 |
| (Address of principal executive offices) |
| David Oestreicher |
| 100 East Pratt Street, Baltimore, MD 21202 |
| (Name and address of agent for service) |
Registrant’s telephone number, including area code: (410) 345-2000
Date of fiscal year end: December 31
Date of reporting period: December 31, 2013
Item 1. Report to Shareholders
 |
| Institutional International Bond Fund | December 31, 2013 |
| Highlights |
- International bonds declined in U.S. dollar terms in 2013 as anticipation of Federal Reserve tapering boosted the U.S. dollar and triggered a sell-off in emerging markets debt.
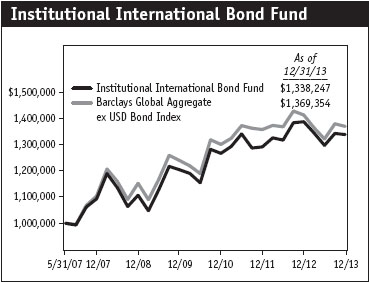
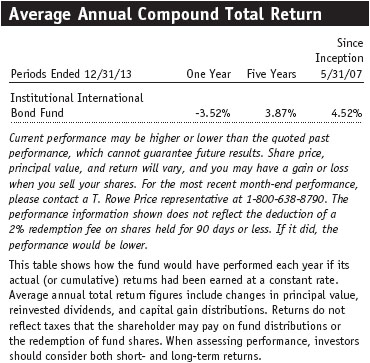
- The Institutional International Bond Fund returned -3.52% for 2013, slightly underperforming the Barclays Global Aggregate ex USD Bond Index.
- Overweight allocations to emerging markets bonds denominated in local currencies weighed on relative performance, although our positioning in European corporates and sovereigns was a positive performance factor.
- Effective security selection is critically important as the international bond market grows in size, complexity, and maturity, highlighting the importance of T. Rowe Price’s global credit and equity research platforms.
The views and opinions in this report were current as of December 31, 2013. They are not guarantees of performance or investment results and should not be taken as investment advice. Investment decisions reflect a variety of factors, and the managers reserve the right to change their views about individual stocks, sectors, and the markets at any time. As a result, the views expressed should not be relied upon as a forecast of the fund’s future investment intent. The report is certified under the Sarbanes-Oxley Act, which requires mutual funds and other public companies to affirm that, to the best of their knowledge, the information in their financial reports is fairly and accurately stated in all material respects.
Manager’s Letter
T. Rowe Price Institutional International Bond Fund
Dear Investor
International bonds declined as uncertainty about the timing of the U.S. Federal Reserve’s tapering began in May and led to meaningful increases in bond yields in Germany, Japan, and the UK, bringing a lengthy period of relatively stable, low long-term rates to an end. The U.S. dollar gained against many major currencies as investors anticipated higher U.S. interest rates as a result of the Fed reducing the pace of its asset purchases. In emerging markets, the concern about Fed tapering triggered a major summer sell-off in currencies and bonds of developing economies.
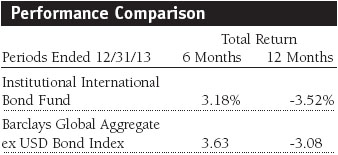
The Institutional International Bond Fund returned -3.52% for the 12-month period ended December 31, 2013. The fund slightly underperformed the Barclays Global Aggregate ex USD Bond Index. The fund’s overweight positions in emerging markets local currency bonds accounted for the majority of the relative underperformance.
Market Environment
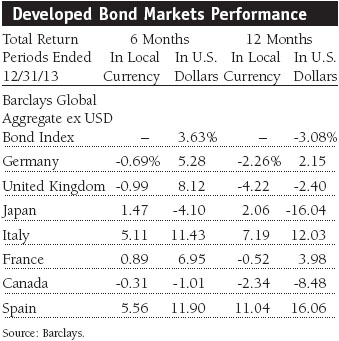
The central banks of developed economies around the world maintained their accommodative monetary policies in an effort to shake off the lingering effects of the financial crisis. The eurozone continued to slowly recover, with Germany providing the largest contribution to growth. Many fiscal and structural challenges remain, including elevated levels of debt and high unemployment in periphery countries. The European Central Bank cut its main lending rate by 25 basis points to 0.50% in May and again in November to 0.25% in an effort to stimulate growth. Compared with 2011 and 2012, financial stress in the eurozone remained at a low level.
In Japan, the force of “Abenomics,” the Japanese prime minister’s policies to stimulate growth that include the Bank of Japan’s massive quantitative easing effort, contributed to a weaker yen and, importantly, may serve to stoke some inflation. Japan’s economic performance was surprisingly strong, as domestic demand showed signs of recovery on an improving labor market and currency weakness boosted exports.
The worries that began in May about Fed tapering prompted outflows across many fixed income sectors, including corporate debt and emerging markets bonds, amid anxieties about rising rates and the resulting negative price impacts. Despite this, corporate debt in non-U.S. developed economies was modestly positive for the year. High yield corporate bonds performed particularly well.
Concerns about deteriorating growth and accelerating inflation in developing economies, as well as global liquidity worries tied to potential Fed tapering, impacted emerging markets debt, both sovereign and corporate. On the fundamental side, economic growth in many emerging countries slowed while inflation fears persisted, contributing to the outflows. Countries with large current account deficits, such as the “fragile five”—India, Indonesia, Turkey, Brazil, and South Africa—suffered as a result of these outflows and were viewed as primary examples of the challenges facing emerging economies. All of these countries also have upcoming elections, making it politically difficult to implement the necessary policy and structural reforms. With the September delay in Fed tapering, stability returned to emerging markets, though we expect that, as tapering begins in the new year, emerging markets could see some volatility as markets adapt to an era of less abundantly available liquidity.
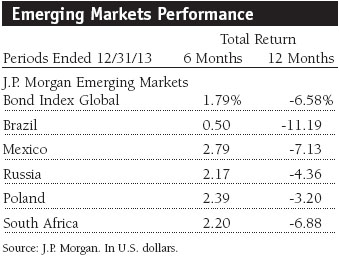
Many currencies lost ground against the U.S. dollar in 2013, although the euro gained more than 4%. The Japanese yen fell about 17% for the year; however, the weakness of the yen was a specific goal of Japan’s economic reforms. Emerging markets currencies—particularly of the fragile five—were hard hit by liquidity fears related to the Fed tapering during the summer, although some regained lost ground before the end of the year. The South African rand, for example, finished 2013 down 19% against the dollar, and the Brazilian real fell more than 13%.
Portfolio Review and Positioning
Our overweight allocation to emerging markets debt denominated in local currencies was the primary source of the portfolio’s underperformance relative to the benchmark. The portfolio’s overweights to Russian sovereign bonds denominated in rubles and to Brazilian government debt denominated in reals weighed on performance. We continue to believe that Brazil’s local currency debt has sold off to levels that now make it an attractive relative value. In addition, our holdings of Indonesian and Turkish local currency bonds hurt returns, as did our underweight to European securitized bonds.
On the positive side, our overweight to European investment-grade corporates boosted relative returns. Within eurozone sovereign debt, our overweight allocations to Italy and Ireland, both of which enjoyed improving economic conditions, helped. We plan to maintain these overweights to Italian and Irish sovereigns, which appear poised to enjoy further outperformance relative to German government bonds. In a positive sign for Ireland, it became the first eurozone country to exit its financial bailout program from the European Union, International Monetary Fund, and European Central Bank.
High yield bonds were standout performers in 2013, so our allocation to high yield bonds issued by eurozone and UK companies gave our performance a significant boost. Although we have slightly reduced the size of our allocation to European high yield bonds, we believe that they will continue to benefit from narrowing credit spreads over time. We have also maintained our small position in sub-investment-grade emerging markets corporates denominated in U.S. dollars. Although they underperformed in 2013, these high yield emerging markets corporate bonds offer attractive yields and strong relative value.
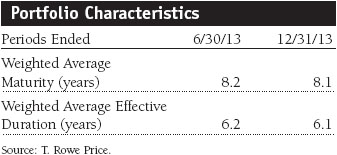
Since global interest rates are still quite low by historical standards, we kept the duration of the portfolio shorter than that of the benchmark to help lessen the negative price effects of an increase in rates. This duration positioning helped the portfolio’s relative performance in the rising-rate environment that began in May and generally persisted through the end of the year. We anticipate maintaining a conservative duration positioning going forward but may adjust it depending on the future path of interest rates.
In terms of our currency positioning, the portfolio’s underweight to the yen provided a significant contribution to relative performance as Japanese Prime Minister Shinzo Abe’s economic reforms drove the value of the yen lower. We were underweight other key developed market currencies, including the British pound and the Canadian dollar, since the U.S. dollar strengthened through the end of the year as the Fed prepared to taper its asset purchases in January 2014. Our overweight to the Mexican peso also contributed to the portfolio’s relative return. We think that the peso will continue to outperform because Mexico’s central bank has cut rates, and the Mexican government has implemented structural changes that bode well for long-term economic health. In particular, the Mexican government plans to allow private-sector investment in the country’s energy sector as well as implement reforms that broaden Mexico’s tax base.
However, our overweight to the Norwegian krone funded by an underweight to the euro detracted from relative performance as the euro gained value as a result of increasingly positive eurozone economic data. Going forward, we hold overweights to Eastern European currencies such as the Polish zloty. In addition, we opened a modest underweight allocation to the Turkish lira after a political corruption scandal in Turkey erupted in December.
Outlook
The persistently low inflation levels in Europe are likely to drive returns for high-quality eurozone government bonds and could lead to a reversal in some of their recent yield increases. At the same time, the sovereign bonds of the peripheral eurozone nations should also benefit from improving economic conditions. We expect Japanese government debt yields to undergo a degree of increases over the next one to two years.
In emerging markets, investment success will increasingly depend on being able to distinguish between winners and losers. Country-specific factors will continue to become more important, with those nations that are able to implement credible economic policies and reforms being rewarded with foreign investment and currency appreciation. Conversely, the emerging countries with particularly high funding needs will likely suffer amid current account deficits, investor outflows, and depreciating currencies.
Our view on European corporate bonds is quite positive, as both investment-grade and high yield European corporates continue to enjoy vigorous demand. Even as new European corporate issues come to market, secondary market pricing remains stable as investor demand offsets the increasing supply. We expect credit spreads on European corporate bonds to remain relatively stable throughout 2014, with most of the return on these securities coming from interest payments.
We believe that the extended reach of T. Rowe Price’s global credit and equity research platforms, combined with our emphasis on collaboration across those platforms, gives us a critical edge in analyzing both risks and opportunities in non-U.S. developed and emerging fixed income markets.
Respectfully submitted,
Arif Husain
President of the International Fixed Income Division,
co-portfolio manager, and cochairman of the portfolio’s
Investment Advisory Committee

Christopher J. Rothery
Co-portfolio manager and cochairman of the portfolio’s
Investment Advisory Committee
January 29, 2014
The committee chairmen have day-to-day responsibility for the portfolio and work with committee members in developing and executing the fund’s investment programs.
| Risk of International Bond Investing |
Funds that invest overseas generally carry more risk than funds that invest strictly in U.S. assets, including unpredictable changes in currency values. Investments in emerging markets are subject to abrupt and severe price declines and should be regarded as speculative. The economic and political structures of developing nations, in most cases, do not compare favorably with the U.S. or other developed countries in terms of wealth and stability, and their financial markets often lack liquidity. Some countries also have legacies of hyperinflation, currency devaluations, and governmental interference in markets.
International investments are subject to currency risk, a decline in the value of a foreign currency versus the U.S. dollar, which reduces the dollar value of securities denominated in that currency. The overall impact on a fund’s holdings can be significant and long-lasting depending on the currencies represented in the portfolio, how each one appreciates or depreciates in relation to the U.S. dollar, and whether currency positions are hedged. Further, exchange rate movements are unpredictable, and it is not possible to effectively hedge the currency risks of many developing countries.
Bonds are also subject to interest rate risk, the decline in bond prices that usually accompanies a rise in interest rates, and credit risk, the chance that any fund holding could have its credit rating downgraded or that a bond issuer will default (fail to make timely payments of interest or principal), potentially reducing the fund’s income level and share price.
| Glossary |
Barclays Global Aggregate ex USD Bond Index: An unmanaged index that tracks an international basket of bonds that contains government, corporate, agency, and mortgage-related bonds.
Credit spread: Measures the additional yield that investors demand as compensation for holding a bond with credit risk versus a similar-maturity Treasury security or other type of low-risk bond.
Duration: A measure of a bond or bond fund’s sensitivity to changes in interest rates. For example, a fund with a duration of six years would fall about 6% in response to a one-percentage-point rise in rates and vice versa.
J.P. Morgan Emerging Markets Bond Index Global: Tracks U.S. dollar government bonds of 31 foreign countries.
Weighted average maturity: A measure of a fund’s sensitivity to interest rates. In general, the longer the average maturity, the greater the fund’s sensitivity to interest rate changes. The weighted average maturity may take into account the interest rate readjustment dates for certain securities. Money funds must maintain a weighted average maturity of less than 60 days.
Portfolio Highlights
Performance and Expenses
T. Rowe Price Institutional International Bond Fund
| Performance Comparison |
This chart shows the value of a hypothetical $1 million investment in the fund over the past 10 fiscal year periods or since inception (for funds lacking 10-year records). The result is compared with benchmarks, which may include a broad-based market index and a peer group average or index. Market indexes do not include expenses, which are deducted from fund returns as well as mutual fund averages and indexes.
Fund Expense Example
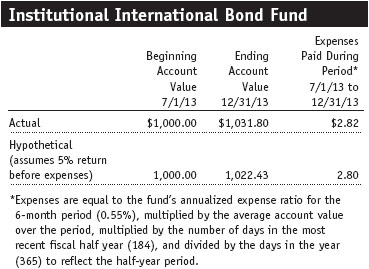
As a mutual fund shareholder, you may incur two types of costs: (1) transaction costs, such as redemption fees or sales loads, and (2) ongoing costs, including management fees, distribution and service (12b-1) fees, and other fund expenses. The following example is intended to help you understand your ongoing costs (in dollars) of investing in the fund and to compare these costs with the ongoing costs of investing in other mutual funds. The example is based on an investment of $1,000 invested at the beginning of the most recent six-month period and held for the entire period.
Actual Expenses
The first line of the following table (Actual) provides information about actual account values and actual expenses. You may use the information on this line, together with your account balance, to estimate the expenses that you paid over the period. Simply divide your account value by $1,000 (for example, an $8,600 account value divided by $1,000 = 8.6), then multiply the result by the number on the first line under the heading “Expenses Paid During Period” to estimate the expenses you paid on your account during this period.
Hypothetical Example for Comparison Purposes
The information on the second line of the table (Hypothetical) is based on hypothetical account values and expenses derived from the fund’s actual expense ratio and an assumed 5% per year rate of return before expenses (not the fund’s actual return). You may compare the ongoing costs of investing in the fund with other funds by contrasting this 5% hypothetical example and the 5% hypothetical examples that appear in the shareholder reports of the other funds. The hypothetical account values and expenses may not be used to estimate the actual ending account balance or expenses you paid for the period.
You should also be aware that the expenses shown in the table highlight only your ongoing costs and do not reflect any transaction costs, such as redemption fees or sales loads. Therefore, the second line of the table is useful in comparing ongoing costs only and will not help you determine the relative total costs of owning different funds. To the extent a fund charges transaction costs, however, the total cost of owning that fund is higher.
Financial Highlights
T. Rowe Price Institutional International Bond Fund
The accompanying notes are an integral part of these financial statements.
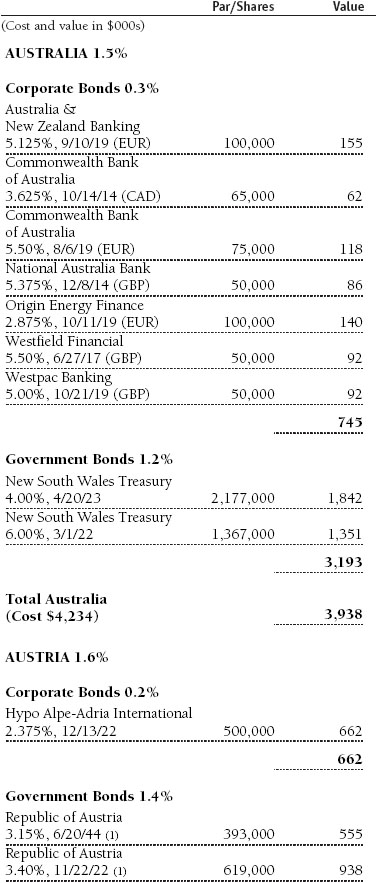
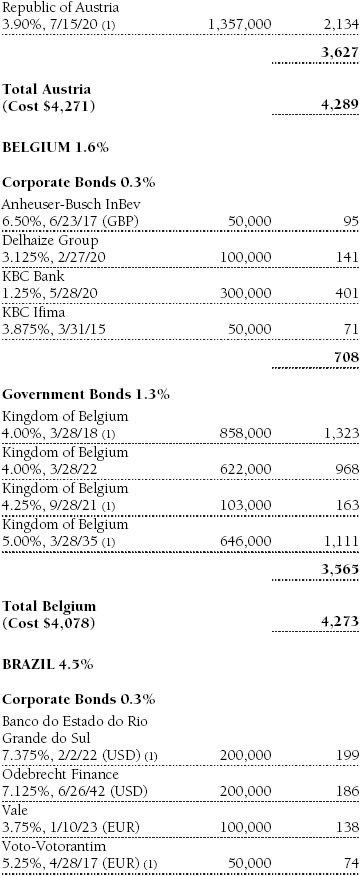
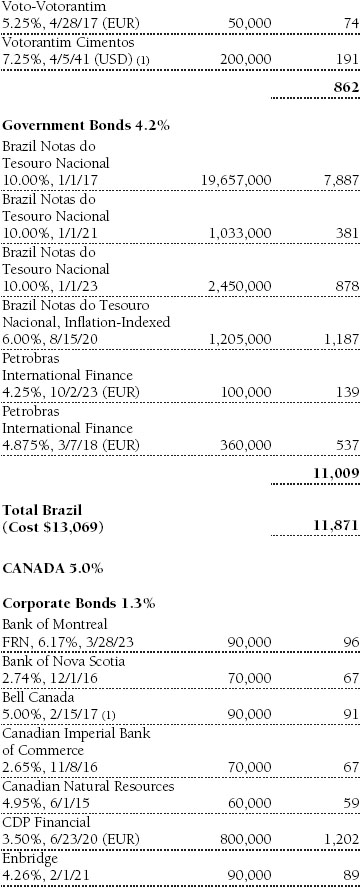
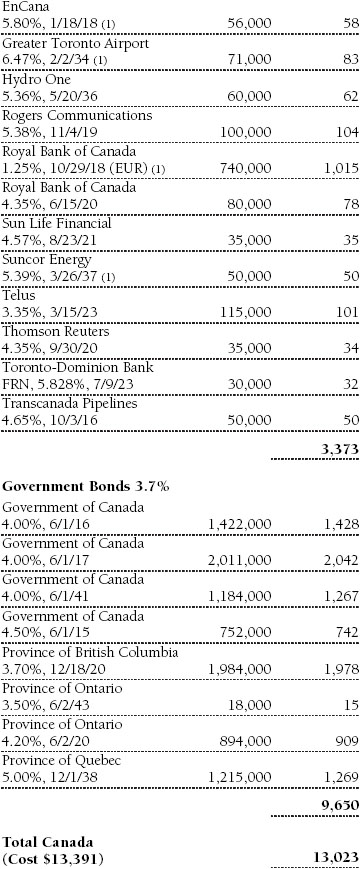
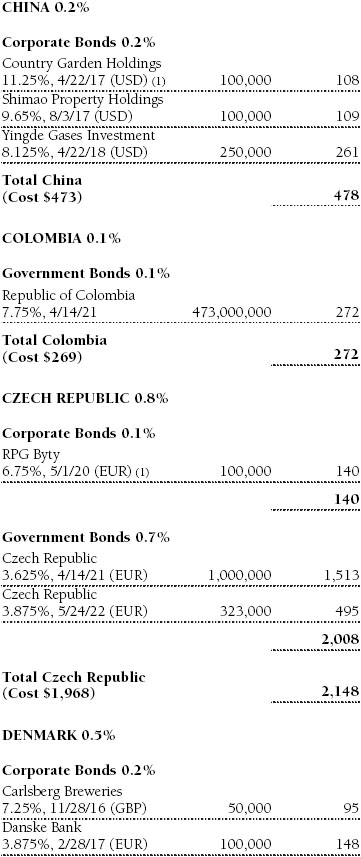
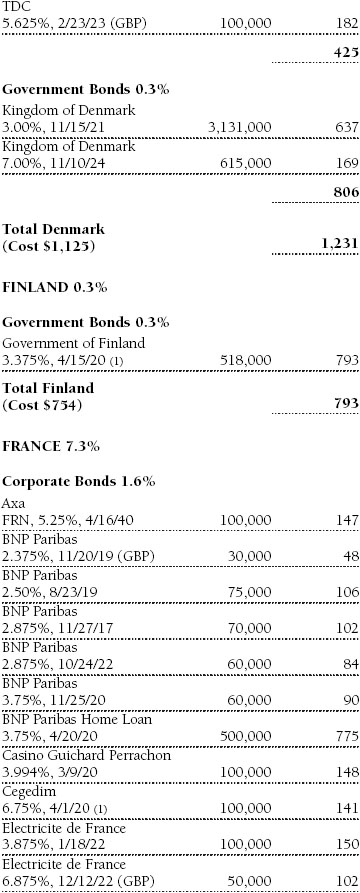
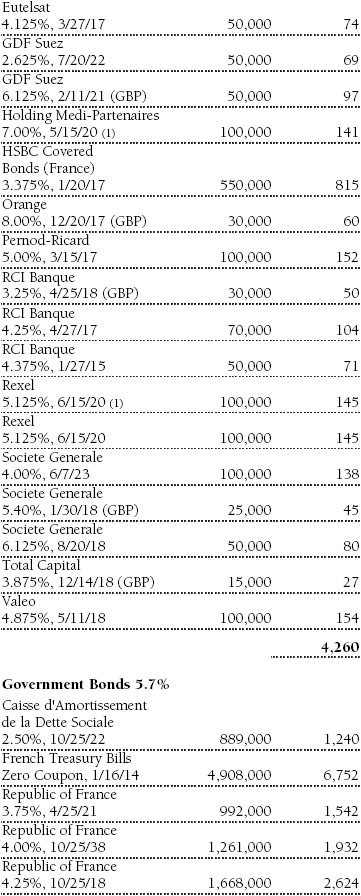
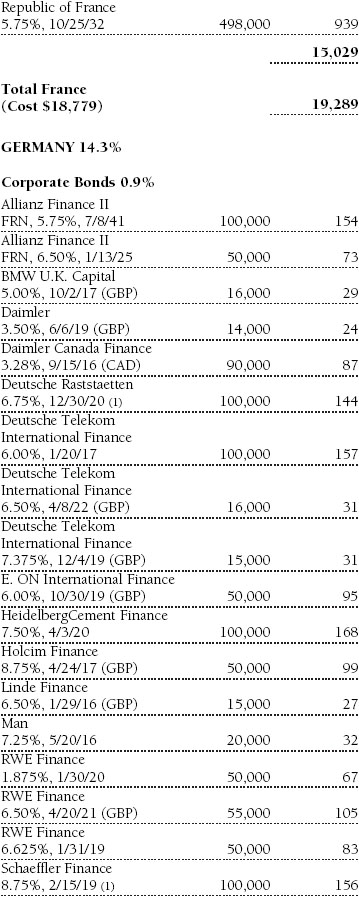
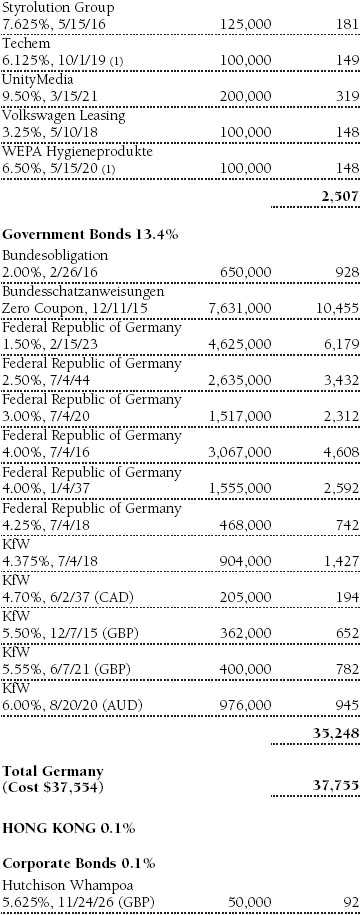
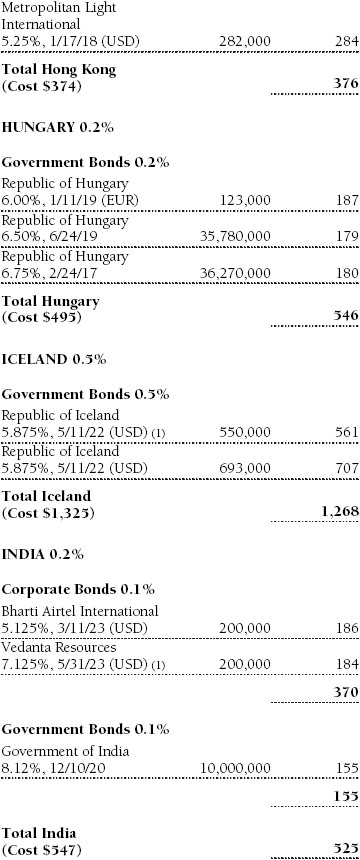
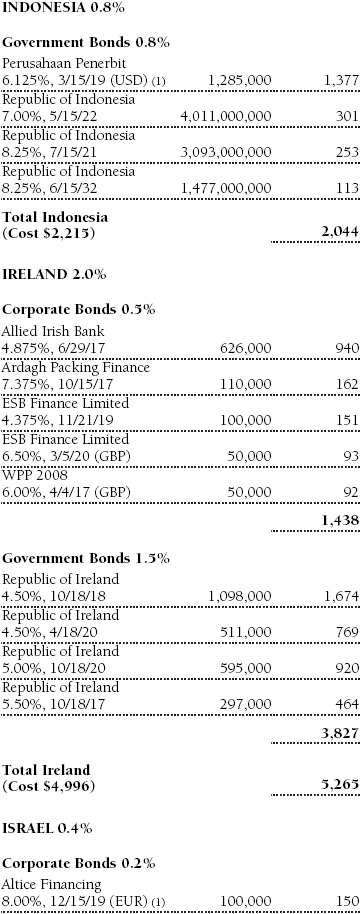
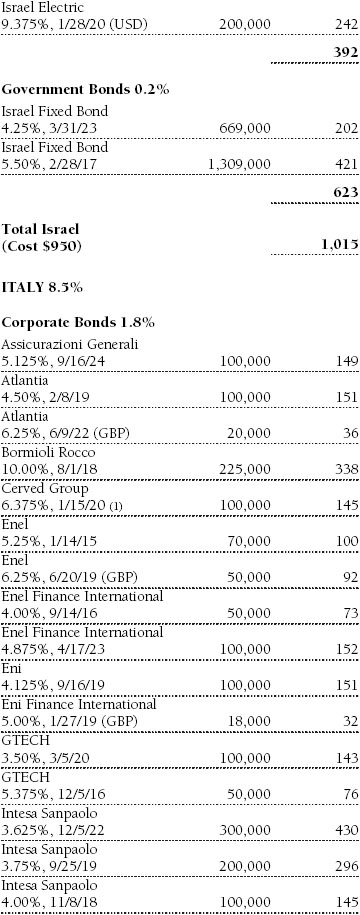
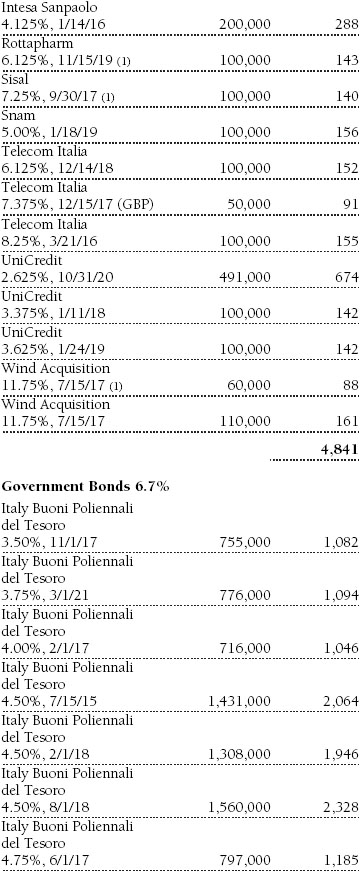
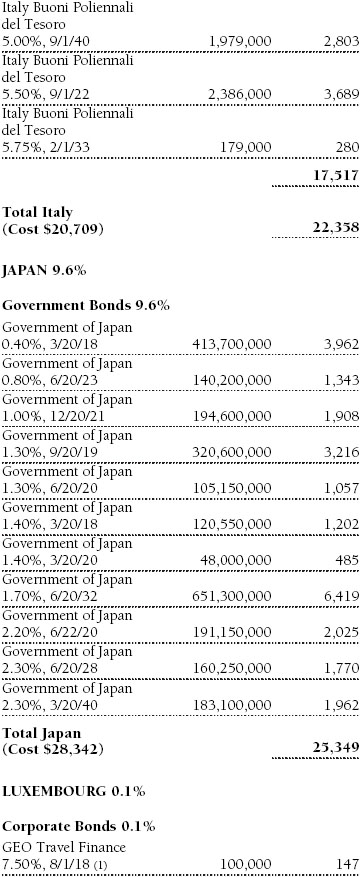
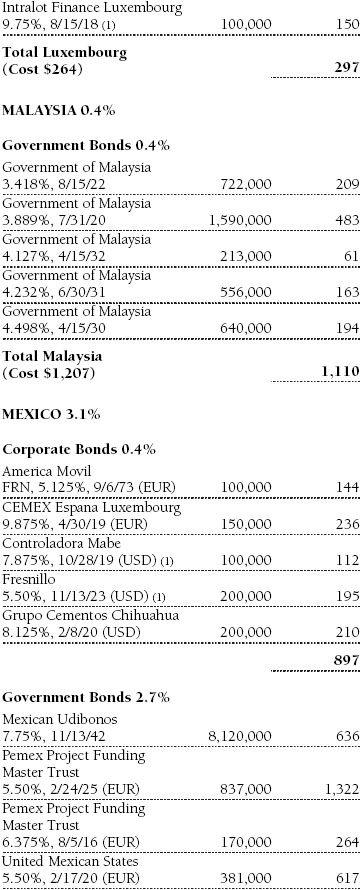
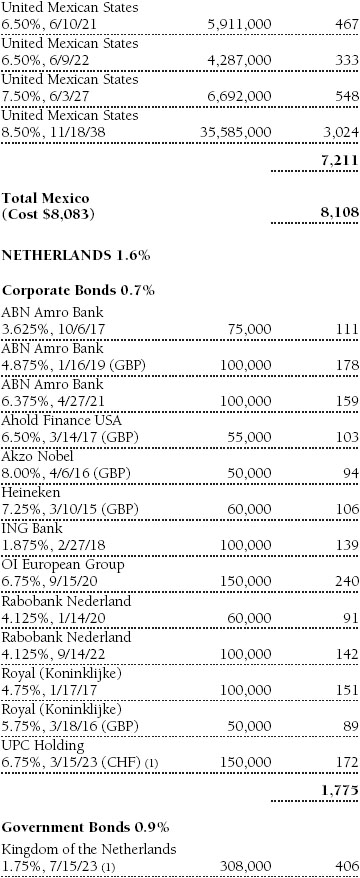
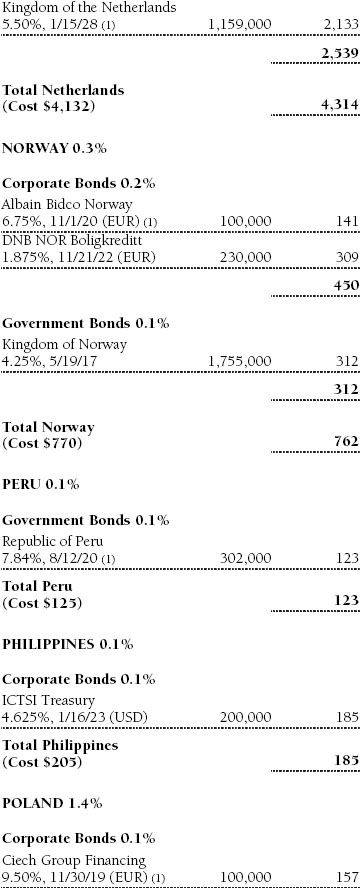
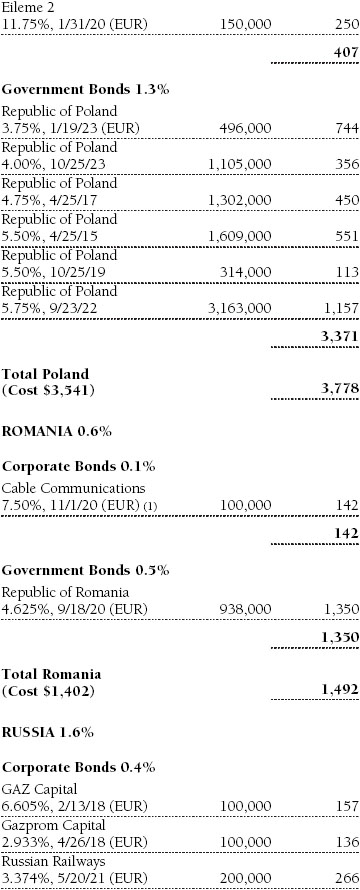
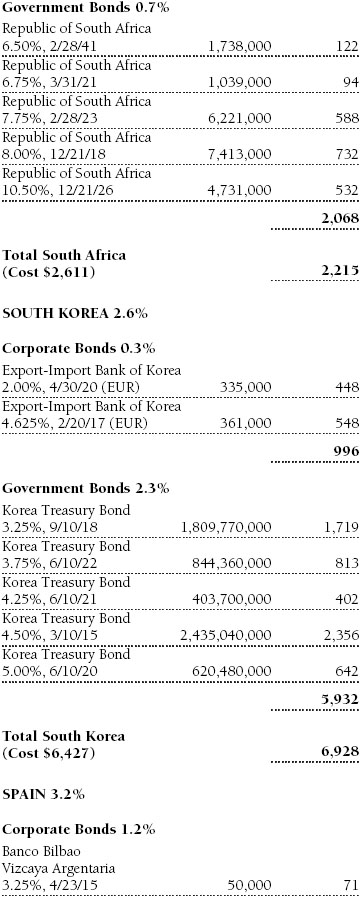
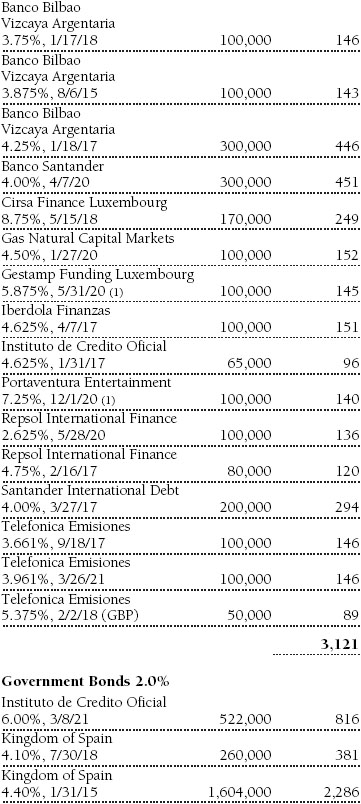
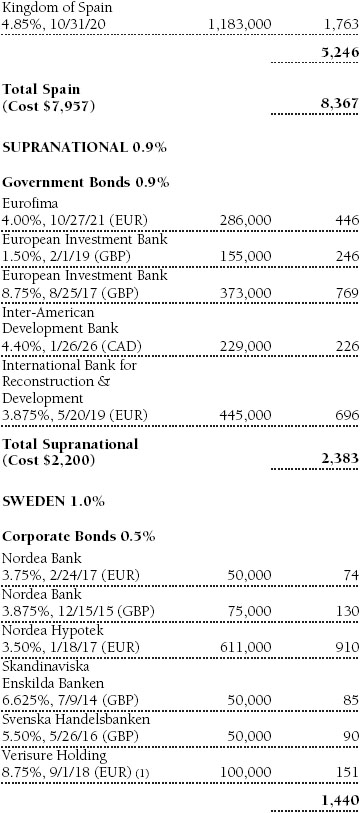
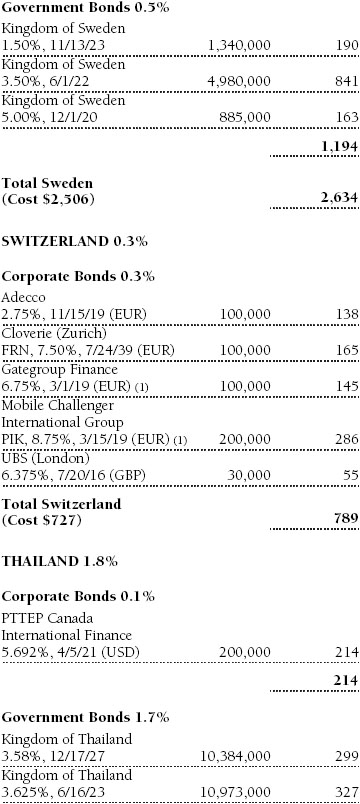
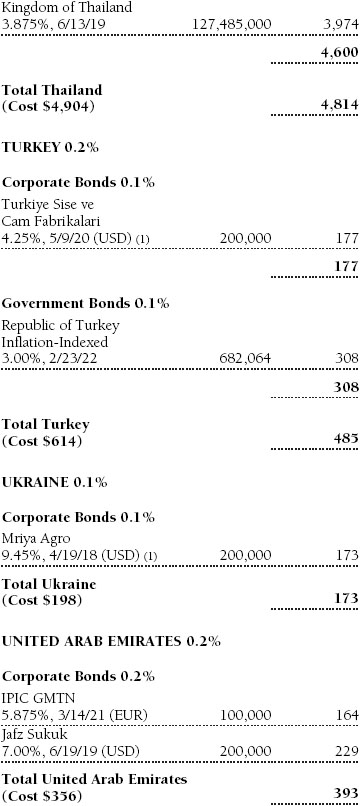
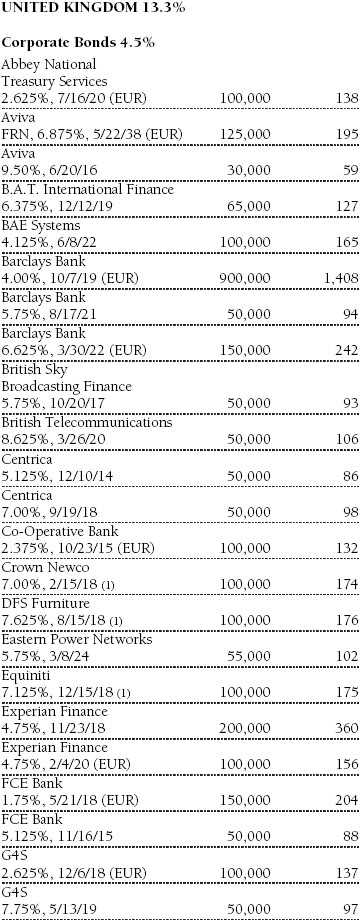
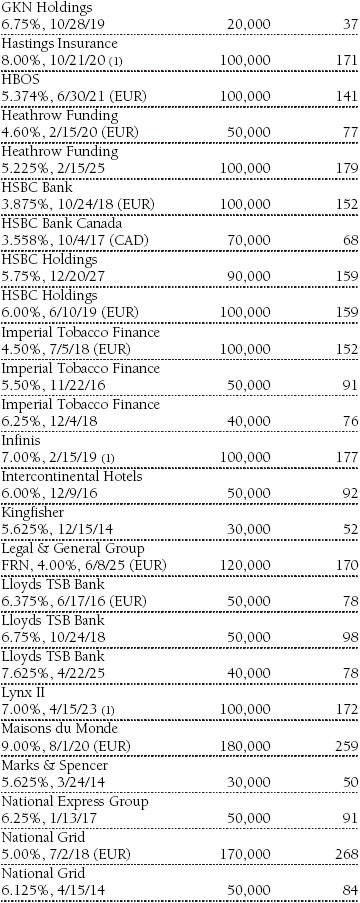
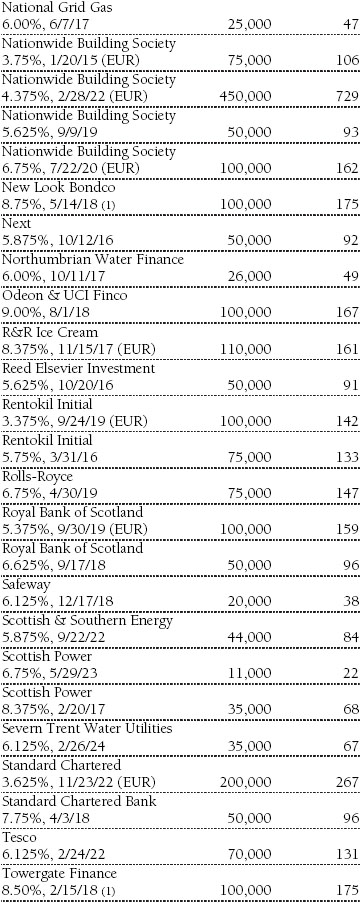
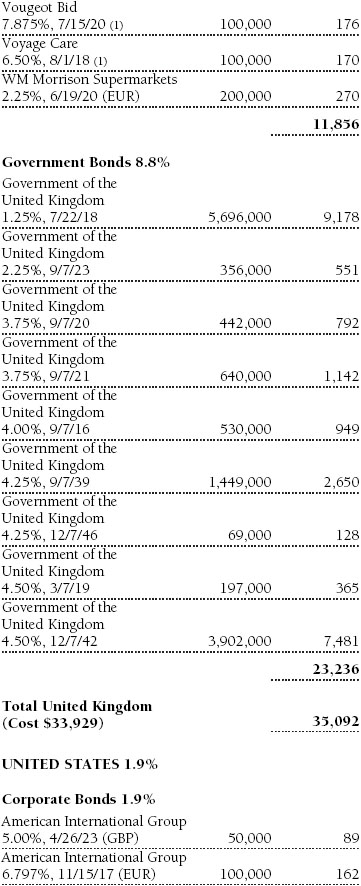
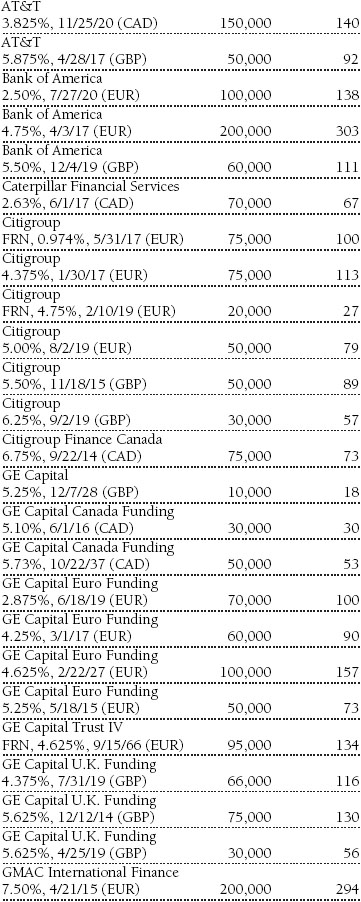
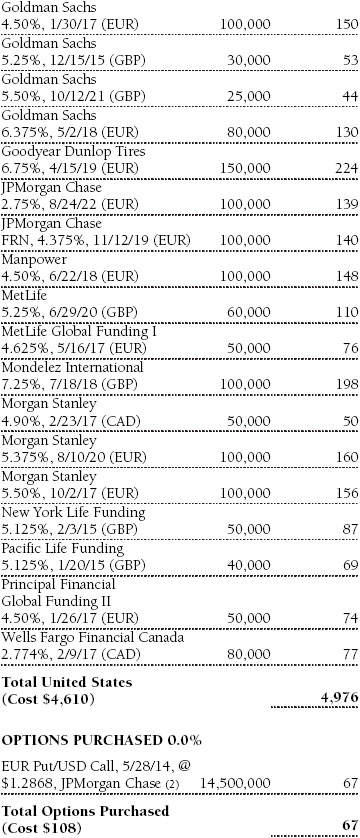
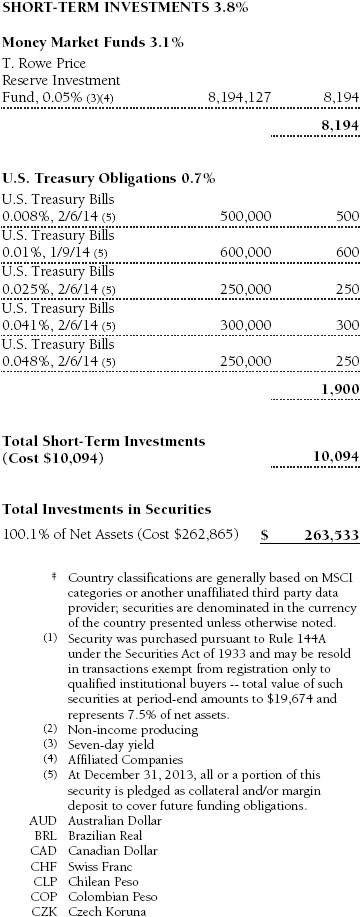
Portfolio of Investments‡
T. Rowe Price Institutional International Bond Fund
December 31, 2013

The accompanying notes are an integral part of these financial statements.
Statement of Assets and Liabilities
T. Rowe Price Institutional International Bond Fund
December 31, 2013
($000s, except shares and per share amounts)
The accompanying notes are an integral part of these financial statements.
Statement of Operations
T. Rowe Price Institutional International Bond Fund
($000s)
The accompanying notes are an integral part of these financial statements.
Statement of Changes in Net Assets
T. Rowe Price Institutional International Bond Fund
($000s)
The accompanying notes are an integral part of these financial statements.
Notes to Financial Statements
T. Rowe Price Institutional International Bond Fund
December 31, 2013
T. Rowe Price Institutional International Funds, Inc. (the corporation), is registered under the Investment Company Act of 1940 (the 1940 Act). The Institutional International Bond Fund (the fund) is a nondiversified, open-end management investment company established by the corporation. The fund commenced operations on May 31, 2007. The fund seeks to provide high current income and capital appreciation.
NOTE 1 - SIGNIFICANT ACCOUNTING POLICIES
Basis of Preparation The fund is an investment company and follows accounting and reporting guidance in the Financial Accounting Standards Board Accounting Standards Codification Topic 946 (ASC 946). The accompanying financial statements were prepared in accordance with accounting principles generally accepted in the United States of America (GAAP), including but not limited to ASC 946. GAAP requires the use of estimates made by management. Management believes that estimates and valuations are appropriate; however, actual results may differ from those estimates, and the valuations reflected in the accompanying financial statements may differ from the value ultimately realized upon sale or maturity.
Investment Transactions, Investment Income, and Distributions Income and expenses are recorded on the accrual basis. Premiums and discounts on debt securities are amortized for financial reporting purposes. Paydown gains and losses are recorded as an adjustment to interest income. Inflation adjustments to the principal amount of inflation-indexed bonds are reflected as interest income. Dividends received from mutual fund investments are reflected as dividend income; capital gain distributions are reflected as realized gain/loss. Dividend income and capital gain distributions are recorded on the ex-dividend date. Income tax-related interest and penalties, if incurred, would be recorded as income tax expense. Investment transactions are accounted for on the trade date. Realized gains and losses are reported on the identified cost basis. Distributions to shareholders are recorded on the ex-dividend date. Income distributions are declared daily and paid monthly. Capital gain distributions, if any, are generally declared and paid by the fund annually.
Currency Translation Assets, including investments, and liabilities denominated in foreign currencies are translated into U.S. dollar values each day at the prevailing exchange rate, using the mean of the bid and asked prices of such currencies against U.S. dollars as quoted by a major bank. Purchases and sales of securities, income, and expenses are translated into U.S. dollars at the prevailing exchange rate on the date of the transaction. The effect of changes in foreign currency exchange rates on realized and unrealized security gains and losses is reflected as a component of security gains and losses.
Credits Credits are earned on the fund’s temporarily uninvested cash balances held at the custodian and such credits reduce the amount paid by the manager for custody of the fund’s assets. In order to pass the benefit of custody credits to the fund, the manager has voluntarily reduced its investment management and administrative expense in the accompanying financial statements.
Redemption Fees A 2% fee is assessed on redemptions of fund shares held for 90 days or less to deter short-term trading and to protect the interests of long-term shareholders. Redemption fees are withheld from proceeds that shareholders receive from the sale or exchange of fund shares. The fees are paid to the fund and are recorded as an increase to paid-in capital. The fees may cause the redemption price per share to differ from the net asset value per share.
New Accounting Guidance On January 1, 2013, the fund adopted new accounting guidance, issued by the Financial Accounting Standards Board, that requires an entity to disclose information about offsetting and related arrangements to enable users of its financial statements to understand the effect of those arrangements on its financial position. Adoption had no effect on the fund’s net assets or results of operations.
NOTE 2 - VALUATION
The fund’s financial instruments are valued, and its net asset value (NAV) per share is computed at the close of the New York Stock Exchange (NYSE), normally 4 p.m. ET, each day the NYSE is open for business.
Fair Value The fund’s financial instruments are reported at fair value, which GAAP defines as the price that would be received to sell an asset or paid to transfer a liability in an orderly transaction between market participants at the measurement date. The T. Rowe Price Valuation Committee (the Valuation Committee) has been established by the fund’s Board of Directors (the Board) to ensure that financial instruments are appropriately priced at fair value in accordance with GAAP and the 1940 Act. Subject to oversight by the Board, the Valuation Committee develops and oversees pricing-related policies and procedures and approves all fair value determinations. Specifically, the Valuation Committee establishes procedures to value securities; determines pricing techniques, sources, and persons eligible to effect fair value pricing actions; oversees the selection, services, and performance of pricing vendors; oversees valuation-related business continuity practices; and provides guidance on internal controls and valuation-related matters. The Valuation Committee reports to the fund’s Board; is chaired by the fund’s treasurer; and has representation from legal, portfolio management and trading, operations, and risk management.
Various valuation techniques and inputs are used to determine the fair value of financial instruments. GAAP establishes the following fair value hierarchy that categorizes the inputs used to measure fair value:
Level 1 – quoted prices (unadjusted) in active markets for identical financial instruments that the fund can access at the reporting date
Level 2 – inputs other than Level 1 quoted prices that are observable, either directly or indirectly (including, but not limited to, quoted prices for similar financial instruments in active markets, quoted prices for identical or similar financial instruments in inactive markets, interest rates and yield curves, implied volatilities, and credit spreads)
Level 3 – unobservable inputs
Observable inputs are developed using market data, such as publicly available information about actual events or transactions, and reflect the assumptions that market participants would use to price the financial instrument. Unobservable inputs are those for which market data are not available and are developed using the best information available about the assumptions that market participants would use to price the financial instrument. GAAP requires valuation techniques to maximize the use of relevant observable inputs and minimize the use of unobservable inputs. When multiple inputs are used to derive fair value, the financial instrument is assigned to the level within the fair value hierarchy based on the lowest-level input that is significant to the fair value of the financial instrument. Input levels are not necessarily an indication of the risk or liquidity associated with financial instruments at that level but rather the degree of judgment used in determining those values.
Valuation Techniques Debt securities generally are traded in the over-the-counter (OTC) market. Securities with remaining maturities of one year or more at the time of acquisition are valued at prices furnished by dealers who make markets in such securities or by an independent pricing service, which considers the yield or price of bonds of comparable quality, coupon, maturity, and type, as well as prices quoted by dealers who make markets in such securities. Securities with remaining maturities of less than one year at the time of acquisition generally use amortized cost in local currency to approximate fair value. However, if amortized cost is deemed not to reflect fair value or the fund holds a significant amount of such securities with remaining maturities of more than 60 days, the securities are valued at prices furnished by dealers who make markets in such securities or by an independent pricing service. Generally, debt securities are categorized in Level 2 of the fair value hierarchy; however, to the extent the valuations include significant unobservable inputs, the securities would be categorized in Level 3.
Investments in mutual funds are valued at the mutual fund’s closing NAV per share on the day of valuation and are categorized in Level 1 of the fair value hierarchy. Listed options, and OTC options with a listed equivalent, are valued at the mean of the closing bid and asked prices and generally are categorized in Level 2 of the fair value hierarchy. Financial futures contracts are valued at closing settlement prices and are categorized in Level 1 of the fair value hierarchy. Forward currency exchange contracts are valued using the prevailing forward exchange rate and are categorized in Level 2 of the fair value hierarchy. Swaps are valued at prices furnished by independent swap dealers or by an independent pricing service and generally are categorized in Level 2 of the fair value hierarchy; however, if unobservable inputs are significant to the valuation, the swap would be categorized in Level 3. Assets and liabilities other than financial instruments, including short-term receivables and payables, are carried at cost, or estimated realizable value, if less, which approximates fair value.
Thinly traded financial instruments and those for which the above valuation procedures are inappropriate or are deemed not to reflect fair value are stated at fair value as determined in good faith by the Valuation Committee. The objective of any fair value pricing determination is to arrive at a price that could reasonably be expected from a current sale. Financial instruments fair valued by the Valuation Committee are primarily private placements, restricted securities, warrants, rights, and other securities that are not publicly traded.
Subject to oversight by the Board, the Valuation Committee regularly makes good faith judgments to establish and adjust the fair valuations of certain securities as events occur and circumstances warrant. For instance, in determining the fair value of troubled or thinly traded debt instruments, the Valuation Committee considers a variety of factors, which may include, but are not limited to, the issuer’s business prospects, its financial standing and performance, recent investment transactions in the issuer, strategic events affecting the company, market liquidity for the issuer, and general economic conditions and events. In consultation with the investment and pricing teams, the Valuation Committee will determine an appropriate valuation technique based on available information, which may include both observable and unobservable inputs. The Valuation Committee typically will afford greatest weight to actual prices in arm’s length transactions, to the extent they represent orderly transactions between market participants; transaction information can be reliably obtained; and prices are deemed representative of fair value. However, the Valuation Committee may also consider other valuation methods such as a discount or premium from market value of a similar, freely traded security of the same issuer; discounted cash flows; yield to maturity; or some combination. Fair value determinations are reviewed on a regular basis and updated as information becomes available, including actual purchase and sale transactions of the issue. Because any fair value determination involves a significant amount of judgment, there is a degree of subjectivity inherent in such pricing decisions and fair value prices determined by the Valuation Committee could differ from those of other market participants. Depending on the relative significance of unobservable inputs, including the valuation technique(s) used, fair valued securities may be categorized in Level 2 or 3 of the fair value hierarchy.
Valuation Inputs The following table summarizes the fund’s financial instruments, based on the inputs used to determine their fair values on December 31, 2013:
There were no material transfers between Levels 1 and 2 during the year.
NOTE 3 - DERIVATIVE INSTRUMENTS
During the year ended December 31, 2013, the fund invested in derivative instruments. As defined by GAAP, a derivative is a financial instrument whose value is derived from an underlying security price, foreign exchange rate, interest rate, index of prices or rates, or other variable; it requires little or no initial investment and permits or requires net settlement. The fund invests in derivatives only if the expected risks and rewards are consistent with its investment objectives, policies, and overall risk profile, as described in its prospectus and Statement of Additional Information. The fund may use derivatives for a variety of purposes, such as seeking to hedge against declines in principal value, increase yield, invest in an asset with greater efficiency and at a lower cost than is possible through direct investment, or to adjust portfolio duration and credit exposure. The risks associated with the use of derivatives are different from, and potentially much greater than, the risks associated with investing directly in the instruments on which the derivatives are based. The fund at all times maintains sufficient cash reserves, liquid assets, or other SEC-permitted asset types to cover its settlement obligations under open derivative contracts.
The fund values its derivatives at fair value, as described in Note 2, and recognizes changes in fair value currently in its results of operations. Accordingly, the fund does not follow hedge accounting, even for derivatives employed as economic hedges. Generally, the fund accounts for its derivatives on a gross basis. It does not offset the fair value of derivative liabilities against the fair value of derivative assets on its financial statements, nor does it offset the fair value of derivative instruments against the right to reclaim or obligation to return collateral.
The following table summarizes the fair value of the fund’s derivative instruments held as of December 31, 2013, and the related location on the accompanying Statement of Assets and Liabilities, presented by primary underlying risk exposure:
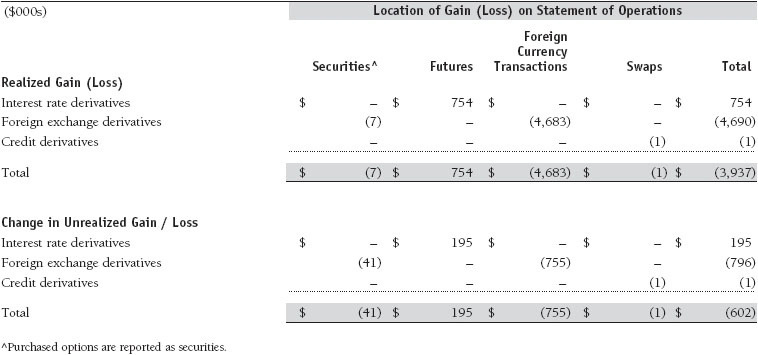
Additionally, the amount of gains and losses on derivative instruments recognized in fund earnings during the year ended December 31, 2013, and the related location on the accompanying Statement of Operations is summarized in the following table by primary underlying risk exposure:
Counterparty Risk and Collateral The fund invests in derivatives in various markets, which expose it to differing levels of counterparty risk. Counterparty risk on exchange-traded and centrally cleared derivative contracts, such as futures, exchange-traded options, and centrally cleared swaps, is minimal because the clearinghouse provides protection against counterparty defaults. For futures and centrally cleared swaps, the fund is required to deposit collateral in an amount equal to a certain percentage of the contract value (margin requirement), and the margin requirement must be maintained over the life of the contract. Each clearing broker, in its sole discretion, may adjust the margin requirements applicable to the fund.
Derivatives, such as bilateral swaps, forward currency exchange contracts, and options, that are transacted and settle directly with a counterparty (bilateral derivatives) expose the fund to greater counterparty risk. To mitigate this risk, the fund has entered into master netting arrangements (MNAs) with certain counterparties that permit net settlement under specified conditions and, for certain counterparties, also provide collateral agreements. MNAs may be in the form of International Swaps and Derivatives Association master agreements (ISDAs) or foreign exchange letter agreements (FX letters).
MNAs govern the ability to offset amounts the fund owes a counterparty against amounts the counterparty owes the fund (net settlement). Both ISDAs and FX letters generally allow net settlement in the event of contract termination and permit termination by either party prior to maturity upon the occurrence of certain stated events, such as failure to pay or bankruptcy. In addition, ISDAs specify other events, the occurrence of which would allow one of the parties to terminate. For example, a downgrade in credit rating of a counterparty would allow the fund to terminate while a decline in the fund’s net assets of more than a certain percentage would allow the counterparty to terminate. Upon termination, all bilateral derivatives with that counterparty would be liquidated and a net amount settled. ISDAs typically include collateral agreements whereas FX letters do not. Collateral requirements are determined based on the net aggregate unrealized gain or loss on all bilateral derivatives with each counterparty, subject to minimum transfer amounts that typically range from $100,000 to $250,000. Any additional collateral required due to changes in security values is transferred the next business day.
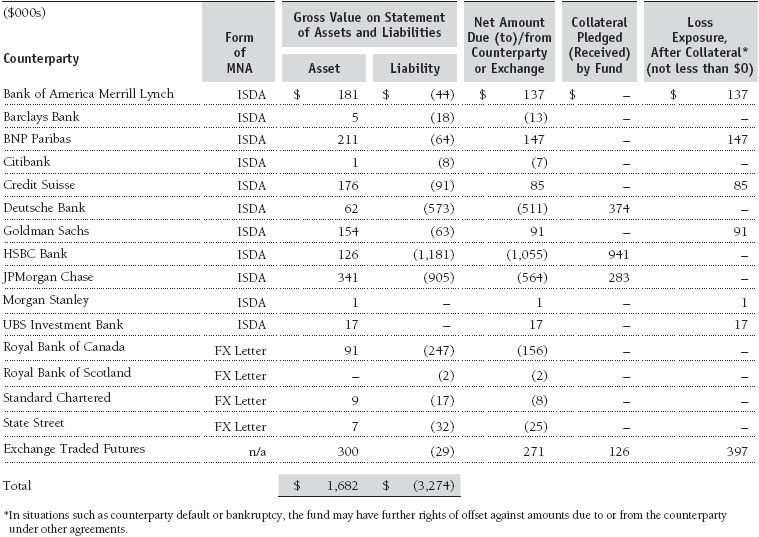
The following table summarizes the fund’s derivatives at the reporting date by loss exposure to each counterparty or clearinghouse after consideration of collateral, if any. Exchange-traded and centrally cleared derivatives that settle variation margin daily are presented at the variation margin receivable or payable on the reporting date, and exchange-traded options are presented at value.
Collateral may be in the form of cash or debt securities issued by the U.S. government or related agencies. Cash and currencies posted by the fund are reflected as cash deposits in the accompanying financial statements and generally are restricted from withdrawal by the fund; securities posted by the fund are so noted in the accompanying Portfolio of Investments; both remain in the fund’s assets. Collateral pledged by counterparties is not included in the fund’s assets because the fund does not obtain effective control over those assets. For bilateral derivatives, collateral posted by the fund is held in a segregated account by the fund’s custodian.
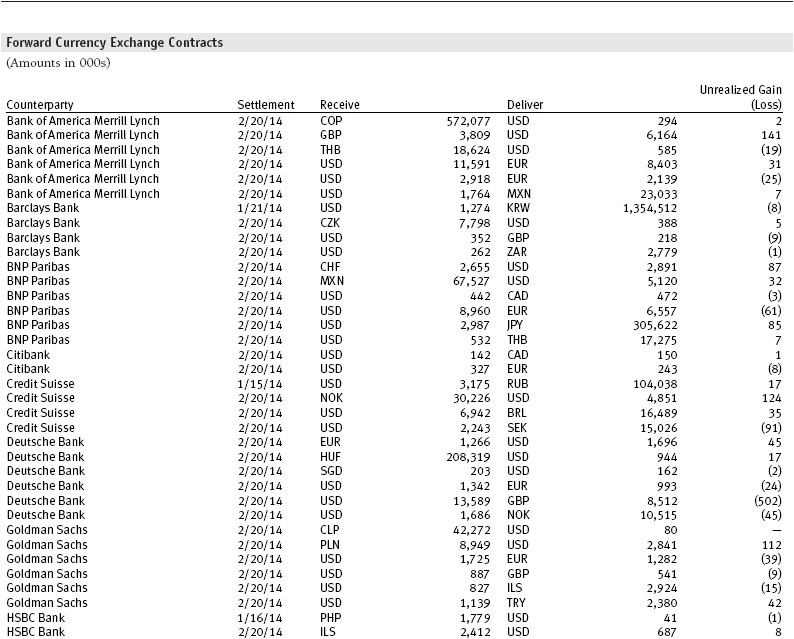
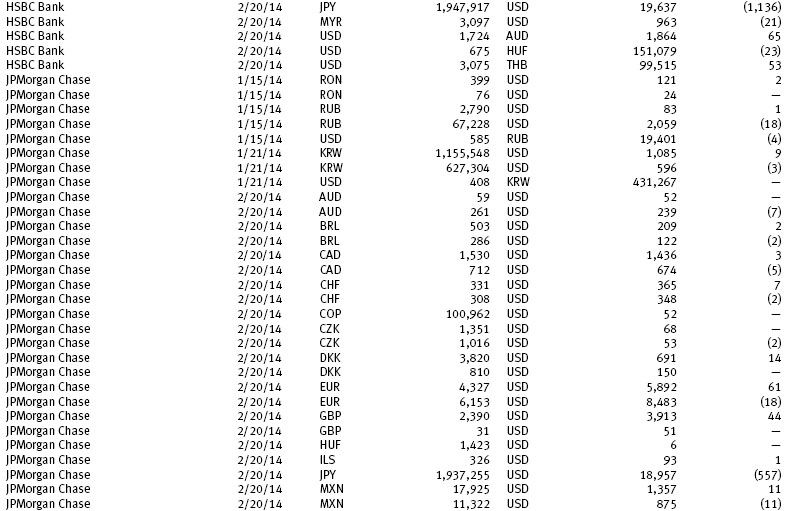
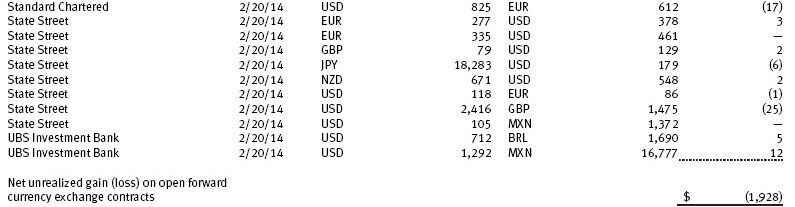
Forward Currency Exchange Contracts The fund is subject to foreign currency exchange rate risk in the normal course of pursuing its investment objectives. It uses forward currency exchange contracts (forwards) primarily to protect its non-U.S. dollar-denominated securities from adverse currency movements and to gain exposure to currencies for the purposes of risk management or enhanced return. A forward involves an obligation to purchase or sell a fixed amount of a specific currency on a future date at a price set at the time of the contract. Although certain forwards may be settled by exchanging only the net gain or loss on the contract, most forwards are settled with the exchange of the underlying currencies in accordance with the specified terms. Forwards are valued at the unrealized gain or loss on the contract, which reflects the net amount the fund either is entitled to receive or obligated to deliver, as measured by the difference between the forward exchange rates at the date of entry into the contract and the forward rates at the reporting date. Appreciated forwards are reflected as assets, and depreciated forwards are reflected as liabilities on the accompanying Statement of Assets and Liabilities. Risks related to the use of forwards include the possible failure of counterparties to meet the terms of the agreements; that anticipated currency movements will not occur, thereby reducing the fund’s total return; and the potential for losses in excess of the fund’s initial investment. During the year ended December 31, 2013, the fund’s exposure to forwards, based on underlying notional amounts, was generally between 31% and 43% of net assets.
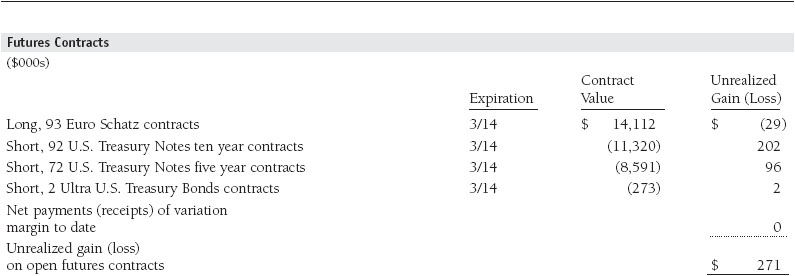
Futures Contracts The fund is subject to interest rate risk in the normal course of pursuing its investment objectives and uses futures contracts to help manage such risk. The fund may enter into futures contracts to manage exposure to interest rate and yield curve movements, security prices, foreign currencies, credit quality, and mortgage prepayments; as an efficient means of adjusting exposure to all or part of a target market; to enhance income; as a cash management tool; or to adjust portfolio duration and credit exposure. A futures contract provides for the future sale by one party and purchase by another of a specified amount of a particular underlying financial instrument at an agreed-upon price, date, time, and place. The fund currently invests only in exchange-traded futures, which generally are standardized as to maturity date, underlying financial instrument, and other contract terms. Fluctuations in the value of a futures contract reflect changes in the value of the underlying financial instrument and are recorded as unrealized gain or loss until the contract is closed. The value of a futures contract included in net assets is the cumulative amount of unrealized gain or loss; appreciated contracts are reflected as assets and depreciated contracts are reflected as liabilities on the accompanying Statement of Assets and Liabilities. Risks related to the use of futures contracts include possible illiquidity of the futures markets, contract prices that can be highly volatile and imperfectly correlated to movements in hedged security values and/or interest rates, and potential losses in excess of the fund’s initial investment. During the year ended December 31, 2013, the fund’s exposure to futures, based on underlying notional amounts, was generally between 5% and 15% of net assets.
Options The fund is subject to foreign currency exchange rate risk in the normal course of pursuing its investment objectives and uses options to help manage such risk. The fund may use call and put options to manage exposure to interest rates, security prices, foreign currencies, and credit quality; as an efficient means of adjusting exposure to all or a part of a target market; to enhance income; as a cash management tool; or to adjust portfolio duration and credit exposure. In return for a premium paid, call and put options give the holder the right, but not the obligation, to purchase or sell, respectively, a security and/or currency at a specified exercise price. Options are included in net assets at fair value; purchased options are included in Investments in Securities; and written options are separately reflected as a liability on the accompanying Statement of Assets and Liabilities. Premiums on unexercised, expired options are recorded as realized gains or losses; premiums on exercised options are recorded as an adjustment to the proceeds from the sale or cost of the purchase. The difference between the premium and the amount received or paid in a closing transaction is also treated as realized gain or loss. Risks related to the use of options include possible illiquidity of the options markets; trading restrictions imposed by an exchange; movements in underlying security values and/or currency values; and, for written options, potential losses in excess of the fund’s initial investment. During the year ended December 31, 2013, the fund’s exposure to options, based on underlying notional amounts, was generally between 0% and 6% of net assets.
Swaps The fund is subject to credit risk in the normal course of pursuing its investment objectives and uses swap contracts to help manage such risks. The fund may use swaps in an effort to manage exposure to changes in interest rates, inflation rates, and credit quality; to adjust overall exposure to certain markets; to enhance total return or protect the value of portfolio securities; to serve as a cash management tool; or to adjust portfolio duration and credit exposure. Swap agreements are executed in the OTC market and can be settled either directly with the counterparty (bilateral swap) or through a central clearinghouse (centrally cleared swap). Fluctuations in the fair value of a contract are reflected in unrealized gain or loss and are reclassified to realized gain or loss upon contract termination or cash settlement. Net periodic receipts or payments required by a contract increase or decrease, respectively, the value of the contract until the contractual payment date, at which time such amounts are reclassified from unrealized to realized gain or loss. For bilateral swaps, cash payments are made or received by the fund on a periodic basis in accordance with contract terms; unrealized gain on contracts and premiums paid are reflected as assets, and unrealized loss on contracts and premiums received are reflected as liabilities on the accompanying Statement of Assets and Liabilities. For centrally cleared swaps, payments are made or received by the fund each day to settle the daily fluctuation in the value of the contract (variation margin). Accordingly, the value of a centrally cleared swap included in net assets is the unsettled variation margin; net variation margin receivable is reflected as an asset and net variation margin payable is reflected as a liability on the accompanying Statement of Assets and Liabilities.
Credit default swaps are agreements where one party (the protection buyer) agrees to make periodic payments to another party (the protection seller) in exchange for protection against specified credit events, such as certain defaults and bankruptcies related to an underlying credit instrument, or issuer or index of such instruments. Upon occurrence of a specified credit event, the protection seller is required to pay the buyer the difference between the notional amount of the swap and the value of the underlying credit, either in the form of a net cash settlement or by paying the gross notional amount and accepting delivery of the relevant underlying credit. For credit default swaps where the underlying credit is an index, a specified credit event may affect all or individual underlying securities included in the index and will be settled based upon the relative weighting of the affected underlying security(s) within the index. Risks related to the use of credit default swaps include the possible inability of the fund to accurately assess the current and future creditworthiness of underlying issuers, the possible failure of a counterparty to perform in accordance with the terms of the swap agreements, potential government regulation that could adversely affect the fund’s swap investments, and potential losses in excess of the fund’s initial investment. During the year ended December 31, 2013, the fund’s exposure to swaps, based on underlying notional amounts, was generally less than 1% of net assets.
NOTE 4 - OTHER INVESTMENT TRANSACTIONS
Consistent with its investment objective, the fund engages in the following practices to manage exposure to certain risks and/or to enhance performance. The investment objective, policies, program, and risk factors of the fund are described more fully in the fund’s prospectus and Statement of Additional Information.
Emerging Markets At December 31, 2013, approximately 22% of the fund’s net assets were invested, either directly or through investments in T. Rowe Price institutional funds, in securities of companies located in emerging markets, securities issued by governments of emerging market countries, or securities denominated in or linked to the currencies of emerging market countries. Emerging market securities are often subject to greater price volatility, less liquidity, and higher rates of inflation than U.S. securities. In addition, emerging markets may be subject to greater political, economic, and social uncertainty, and differing regulatory environments that may potentially impact the fund’s ability to buy or sell certain securities or repatriate proceeds to U.S. dollars.
Restricted Securities The fund may invest in securities that are subject to legal or contractual restrictions on resale. Prompt sale of such securities at an acceptable price may be difficult and may involve substantial delays and additional costs.
Mortgage-Backed Securities The fund may invest in mortgage-backed securities (MBS or pass-through certificates) that represent an interest in a pool of specific underlying mortgage loans and entitle the fund to the periodic payments of principal and interest from those mortgages. MBS may be issued by government agencies or corporations, or private issuers. Most MBS issued by government agencies are guaranteed; however, the degree of protection differs based on the issuer. MBS are sensitive to changes in economic conditions that affect the rate of prepayments and defaults on the underlying mortgages; accordingly, the value, income, and related cash flows from MBS may be more volatile than other debt instruments.
Other Purchases and sales of portfolio securities other than short-term securities aggregated $238,945,000 and $158,893,000, respectively, for the year ended December 31, 2013.
NOTE 5 - FEDERAL INCOME TAXES
No provision for federal income taxes is required since the fund intends to continue to qualify as a regulated investment company under Subchapter M of the Internal Revenue Code and distribute to shareholders all of its taxable income and gains. Distributions determined in accordance with federal income tax regulations may differ in amount or character from net investment income and realized gains for financial reporting purposes. Financial reporting records are adjusted for permanent book/tax differences to reflect tax character but are not adjusted for temporary differences.
The fund files U.S. federal, state, and local tax returns as required. The fund’s tax returns are subject to examination by the relevant tax authorities until expiration of the applicable statute of limitations, which is generally three years after the filing of the tax return but which can be extended to six years in certain circumstances. Tax returns for open years have incorporated no uncertain tax positions that require a provision for income taxes.
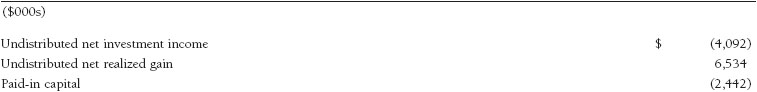
Reclassifications to paid-in capital relate primarily to the current net operating loss. For the year ended December 31, 2013, the following reclassifications were recorded to reflect tax character (there was no impact on results of operations or net assets):
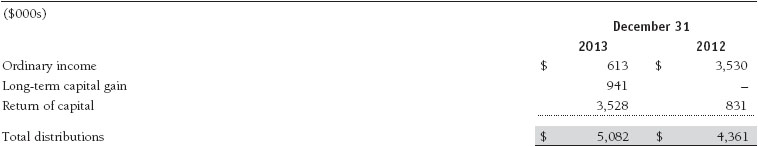
Distributions during the years ended December 31, 2013 and December 31, 2012, were characterized for tax purposes as follows:
At December 31, 2013, the tax-basis cost of investments and components of net assets were as follows:
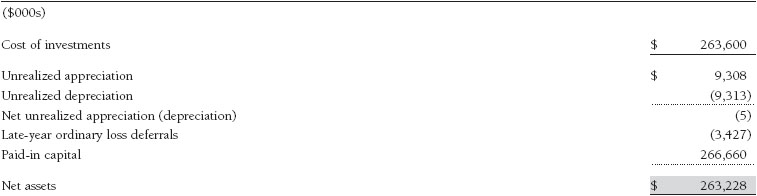
The difference between book-basis and tax-basis net unrealized appreciation (depreciation) is attributable to the deferral of losses from wash sales, and the realization of gains/losses on certain open derivative contracts for tax purposes. The fund intends to retain realized gains to the extent of available capital loss carryforwards. Net realized capital losses may be carried forward indefinitely to offset future realized capital gains. During the year ended December 31, 2013, the fund utilized $1,043,000 of capital loss carryforwards. In accordance with federal tax laws applicable to investment companies, specified net losses realized between November 1 and December 31 are not recognized for tax purposes until the subsequent year (late-year ordinary loss deferrals); however, such losses are recognized for financial reporting purposes in the year realized.
NOTE 6 - RELATED PARTY TRANSACTIONS
The fund is managed by T. Rowe Price Associates, Inc. (Price Associates), a wholly owned subsidiary of T. Rowe Price Group, Inc. (Price Group). Price Associates has entered into a subadvisory agreement(s) with one or more of its wholly owned subsidiaries, to provide investment advisory services to the fund. The investment management and administrative agreement between the fund and Price Associates provides for an all-inclusive annual fee equal to 0.55% of the fund’s average daily net assets. The fee is computed daily and paid monthly. The all-inclusive fee covers investment management, shareholder servicing, transfer agency, accounting, and custody services provided to the fund, as well as fund directors’ fees and expenses. Interest, taxes, brokerage commissions, and extraordinary expenses are paid directly by the fund.
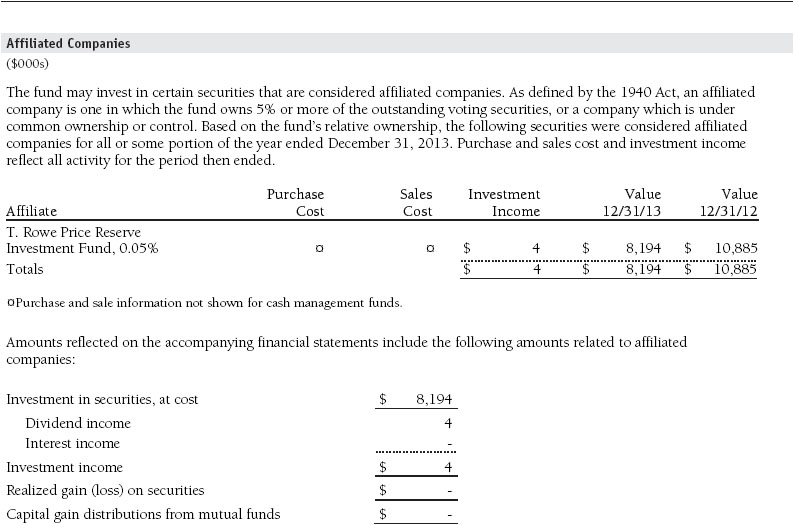
The fund may invest in the T. Rowe Price Reserve Investment Fund, the T. Rowe Price Government Reserve Investment Fund, or the T. Rowe Price Short-Term Reserve Fund (collectively, the Price Reserve Investment Funds), open-end management investment companies managed by Price Associates and considered affiliates of the fund. The Price Reserve Investment Funds are offered as short-term investment options to mutual funds, trusts, and other accounts managed by Price Associates or its affiliates and are not available for direct purchase by members of the public. The Price Reserve Investment Funds pay no investment management fees.
Mutual funds and other accounts managed by T. Rowe Price and its affiliates (collectively, T. Rowe Price funds) may invest in the fund; however, no T. Rowe Price fund may invest for the purpose of exercising management or control over the fund. At December 31, 2013, approximately 61% of the fund’s outstanding shares were held by T. Rowe Price funds.
Report of Independent Registered Public Accounting Firm
To the Board of Directors of T. Rowe Price Institutional International Funds, Inc. and
Shareholders of T. Rowe Price Institutional International Bond Fund
In our opinion, the accompanying statement of assets and liabilities, including the portfolio of investments, and the related statements of operations and of changes in net assets and the financial highlights present fairly, in all material respects, the financial position of T. Rowe Price Institutional International Bond Fund (one of the portfolios comprising T. Rowe Price Institutional International Funds, Inc., hereafter referred to as the “Fund”) at December 31, 2013, and the results of its operations, the changes in its net assets and the financial highlights for each of the periods indicated therein, in conformity with accounting principles generally accepted in the United States of America. These financial statements and financial highlights (hereafter referred to as “financial statements”) are the responsibility of the Fund’s management; our responsibility is to express an opinion on these financial statements based on our audits. We conducted our audits of these financial statements in accordance with the standards of the Public Company Accounting Oversight Board (United States). Those standards require that we plan and perform the audit to obtain reasonable assurance about whether the financial statements are free of material misstatement. An audit includes examining, on a test basis, evidence supporting the amounts and disclosures in the financial statements, assessing the accounting principles used and significant estimates made by management, and evaluating the overall financial statement presentation. We believe that our audits, which included confirmation of securities at December 31, 2013 by correspondence with the custodian and brokers, and confirmation of the underlying funds by correspondence with the transfer agent, provide a reasonable basis for our opinion.
PricewaterhouseCoopers LLP
Baltimore, Maryland
February 14, 2014
| Tax Information (Unaudited) for the Tax Year Ended 12/31/13 |
We are providing this information as required by the Internal Revenue Code. The amounts shown may differ from those elsewhere in this report because of differences between tax and financial reporting requirements.
The fund’s distributions to shareholders included $941,000 from long-term capital gains, subject to the 15% rate gains category.
| Information on Proxy Voting Policies, Procedures, and Records |
A description of the policies and procedures used by T. Rowe Price funds and portfolios to determine how to vote proxies relating to portfolio securities is available in each fund’s Statement of Additional Information. You may request this document by calling 1-800-225-5132 or by accessing the SEC’s website, sec.gov.
The description of our proxy voting policies and procedures is also available on our website, troweprice.com. To access it, click on the words “Social Responsibility” at the top of our corporate homepage. Next, click on the words “Conducting Business Responsibly” on the left side of the page that appears. Finally, click on the words “Proxy Voting Policies” on the left side of the page that appears.
Each fund’s most recent annual proxy voting record is available on our website and through the SEC’s website. To access it through our website, follow the directions above to reach the “Conducting Business Responsibly” page. Click on the words “Proxy Voting Records” on the left side of that page, and then click on the “View Proxy Voting Records” link at the bottom of the page that appears.
| How to Obtain Quarterly Portfolio Holdings |
The fund files a complete schedule of portfolio holdings with the Securities and Exchange Commission for the first and third quarters of each fiscal year on Form N-Q. The fund’s Form N-Q is available electronically on the SEC’s website (sec.gov); hard copies may be reviewed and copied at the SEC’s Public Reference Room, 100 F St. N.E., Washington, DC 20549. For more information on the Public Reference Room, call 1-800-SEC-0330.
| About the Fund’s Directors and Officers |
Your fund is overseen by a Board of Directors (Board) that meets regularly to review a wide variety of matters affecting or potentially affecting the fund, including performance, investment programs, compliance matters, advisory fees and expenses, service providers, and business and regulatory affairs. The Board elects the fund’s officers, who are listed in the final table. At least 75% of the Board’s members are independent of T. Rowe Price Associates, Inc. (T. Rowe Price), and its affiliates; “inside” or “interested” directors are employees or officers of T. Rowe Price. The business address of each director and officer is 100 East Pratt Street, Baltimore, Maryland 21202. The Statement of Additional Information includes additional information about the fund directors and is available without charge by calling a T. Rowe Price representative at 1-800-638-5660.
| Independent Directors | ||
| Name (Year of Birth) Year Elected* [Number of T. Rowe Price Portfolios Overseen] | Principal Occupation(s) and Directorships of Public Companies and Other Investment Companies During the Past Five Years | |
| William R. Brody (1944) 2009 [157] | President and Trustee, Salk Institute for Biological Studies (2009 to present); Director, Novartis, Inc. (2009 to present); Director, IBM (2007 to present); President and Trustee, Johns Hopkins University (1996 to 2009); Chairman of Executive Committee and Trustee, Johns Hopkins Health System (1996 to 2009) | |
| Anthony W. Deering (1945) 1991 [157] | Chairman, Exeter Capital, LLC, a private investment firm (2004 to present); Director and Member of the Advisory Board, Deutsche Bank North America (2004 to present); Director, Under Armour (2008 to present); Director, Vornado Real Estate Investment Trust (2004 to 2012) | |
| Donald W. Dick, Jr. (1943) 1989 [157] | Principal, EuroCapital Partners, LLC, an acquisition and management advisory firm (1995 to present) | |
| Bruce W. Duncan (1951) 2013 [157] | President, Chief Executive Officer, and Director, First Industrial Realty Trust, owner and operator of industrial properties (2009 to present); Chairman of the Board (2005 to present), Interim Chief Executive Officer (2007), and Director (1999 to present), Starwood Hotels & Resorts, a hotel and leisure company; Senior Advisor, Kohlberg, Kravis, Roberts & Co. LP, a global investment firm (2008 to 2009); Trustee, Starwood Lodging Trust, a real estate investment trust and former subsidiary of Starwood (1995 to 2006) | |
| Robert J. Gerrard, Jr. (1952) 2012 [157] | Advisory Board Member, Pipeline Crisis/Winning Strategies (1997 to present); Chairman of Compensation Committee and Director, Syniverse Holdings, Inc. (2008 to 2011); Executive Vice President and General Counsel, Scripps Networks, LLC (1997 to 2009) | |
| Karen N. Horn (1943) 2003 [157] | Limited Partner and Senior Managing Director, Brock Capital Group, an advisory and investment banking firm (2004 to present); Director, Eli Lilly and Company (1987 to present); Director, Simon Property Group (2004 to present); Director, Norfolk Southern (2008 to present); Director, Fannie Mae (2006 to 2008) | |
| Paul F. McBride (1956) 2013 [157] | Former Company Officer and Senior Vice President, Human Resources and Corporate Initiatives (2004 to 2010) | |
| Cecilia E. Rouse, Ph.D. (1963) 2012 [157] | Dean, Woodrow Wilson School (2012 to present); Professor and Researcher, Princeton University (1992 to present); Director, MDRC (2011 to present); Member, National Academy of Education (2010 to present); Research Associate, National Bureau of Economic Research’s Labor Studies Program (1998 to 2009 and 2011 to present); Member, President’s Council of Economic Advisors (2009 to 2011); Member, The MacArthur Foundation Network on the Transition to Adulthood and Public Policy (2000 to 2008); Member, National Advisory Committee for the Robert Wood Johnson Foundation’s Scholars in Health Policy Research Program (2008); Director and Member, National Economic Association (2006 to 2008); Member, Association of Public Policy Analysis and Management Policy Council (2006 to 2008); Member, Hamilton Project’s Advisory Board at The Brookings Institute (2006 to 2008); Chair of Committee on the Status of Minority Groups in the Economic Profession, American Economic Association (2006 to 2008 and 2012 to present) | |
| John G. Schreiber (1946) 2001 [157] | Owner/President, Centaur Capital Partners, Inc., a real estate investment company (1991 to present); Cofounder and Partner, Blackstone Real Estate Advisors, L.P. (1992 to present); Director, General Growth Properties, Inc. (2010 to present); Director, BXMT (formerly Capital Trust, Inc.), a real estate investment company (2012 to present); Director and Chairman of the Board, Brixmor Property Group, Inc. (2013 to present) | |
| Mark R. Tercek (1957) 2009 [157] | President and Chief Executive Officer, The Nature Conservancy (2008 to present); Managing Director, The Goldman Sachs Group, Inc. (1984 to 2008) | |
| *Each independent director serves until retirement, resignation, or election of a successor. | ||
| Inside Directors | ||
| Name (Year of Birth) Year Elected* [Number of T. Rowe Price Portfolios Overseen] | Principal Occupation(s) and Directorships of Public Companies and Other Investment Companies During the Past Five Years | |
| Edward C. Bernard (1956) 2006 [157] | Director and Vice President, T. Rowe Price; Vice Chairman of the Board, Director, and Vice President, T. Rowe Price Group, Inc.; Chairman of the Board, Director, and President, T. Rowe Price Investment Services, Inc.; Chairman of the Board and Director, T. Rowe Price Retirement Plan Services, Inc., and T. Rowe Price Services, Inc.; Chairman of the Board, Chief Executive Officer, and Director, T. Rowe Price International; Chairman of the Board, Chief Executive Officer, Director, and President, T. Rowe Price Trust Company; Chairman of the Board, all funds | |
| Brian C. Rogers, CFA, CIC (1955) 2006 [105] | Chief Investment Officer, Director, and Vice President, T. Rowe Price; Chairman of the Board, Chief Investment Officer, Director, and Vice President, T. Rowe Price Group, Inc.; Vice President, T. Rowe Price Trust Company | |
| *Each inside director serves until retirement, resignation, or election of a successor. | ||
| Officers | ||
| Name (Year of Birth) Position Held With Institutional International Funds | Principal Occupation(s) | |
| Ulle Adamson, CFA (1979) Vice President | Vice President, T. Rowe Price Group, Inc., and T. Rowe Price International | |
| Roy H. Adkins (1970) Vice President | Vice President, T. Rowe Price Group, Inc., and T. Rowe Price International | |
| Christopher D. Alderson (1962) President | Director and President–International Equity, T. Rowe Price International; Company’s Representative, Director, and Vice President, Price Hong Kong; Director and Vice President, Price Singapore; Vice President, T. Rowe Price Group, Inc. | |
| Paulina Amieva (1981) Vice President | Vice President, T. Rowe Price Group, Inc., and T. Rowe Price International | |
| Malik S. Asif (1981) Vice President | Vice President, T. Rowe Price International; formerly student, The University of Chicago Booth School of Business (to 2012); Investment Consultant–Middle East and North Africa Investment Team, International Finance Corporation–The World Bank Group (to 2010); Equity Research Associate, Keefe, Bruyette & Woods, Inc. (to 2009) | |
| Peter J. Bates, CFA (1974) Vice President | Vice President, T. Rowe Price and T. Rowe Price Group, Inc. | |
| Oliver D.M. Bell, IMC (1969) Executive Vice President | Vice President, T. Rowe Price Group, Inc., and T. Rowe Price International; formerly Head of Global Emerging Markets Research, Pictet Asset Management Ltd. (to 2011) and Portfolio Manager of Africa and Middle East portfolios and other emerging markets strategies, Pictet Asset Management Ltd. (to 2009) | |
| R. Scott Berg, CFA (1972) Executive Vice President | Vice President, T. Rowe Price and T. Rowe Price Group, Inc. | |
| Peter I. Botoucharov (1965) Vice President | Vice President, T. Rowe Price Group, Inc., and T. Rowe Price International; formerly Director–EMEA Macroeconomic Research and Strategy (to 2012); Independent Financial Advisor, Global Source (to 2010) | |
| Brian J. Brennan, CFA (1964) Vice President | Vice President, T. Rowe Price, T. Rowe Price Group, Inc., T. Rowe Price International, and T. Rowe Price Trust Company | |
| Carolyn Hoi Che Chu (1974) Vice President | Vice President, Price Hong Kong and T. Rowe Price Group, Inc.; formerly Director, Bank of America Merrill Lynch and Co-head of credit and convertibles research team in Hong Kong (to 2010) | |
| Archibald Ciganer Albeniz, CFA (1976) Vice President | Vice President, T. Rowe Price Group, Inc., and T. Rowe Price International | |
| Richard N. Clattenburg, CFA (1979) Executive Vice President | Vice President, Price Singapore, T. Rowe Price, T. Rowe Price Group, Inc., and T. Rowe Price International | |
| Michael J. Conelius, CFA (1964) Executive Vice President | Vice President, T. Rowe Price, T. Rowe Price Group, Inc., T. Rowe Price International, and T. Rowe Price Trust Company | |
| José Costa Buck (1972) Vice President | Vice President, T. Rowe Price Group, Inc., and T. Rowe Price International | |
| Richard de los Reyes (1975) Vice President | Vice President, T. Rowe Price and T. Rowe Price Group, Inc. | |
| Michael Della Vedova (1969) Vice President | Vice President, T. Rowe Price Group, Inc., and T. Rowe Price International; formerly Cofounder and Partner, Four Quarter Capital (to 2009) | |
| Shawn T. Driscoll (1975) Vice President | Vice President, T. Rowe Price and T. Rowe Price Group, Inc. | |
| Bridget A. Ebner (1970) Vice President | Vice President, T. Rowe Price and T. Rowe Price Group, Inc. | |
| Mark J.T. Edwards (1957) Executive Vice President | Vice President, T. Rowe Price Group, Inc., and T. Rowe Price International | |
| David J. Eiswert, CFA (1972) Executive Vice President | Vice President, T. Rowe Price, T. Rowe Price Group, Inc., and T. Rowe Price International | |
| Roger L. Fiery III, CPA (1959) Vice President | Vice President, Price Hong Kong, Price Singapore, T. Rowe Price, T. Rowe Price Group, Inc., T. Rowe Price International, and T. Rowe Price Trust Company | |
| Mark S. Finn, CFA, CPA (1963) Vice President | Vice President, T. Rowe Price, T. Rowe Price Group, Inc., and T. Rowe Price Trust Company | |
| John R. Gilner (1961) Chief Compliance Officer | Chief Compliance Officer and Vice President, T. Rowe Price; Vice President, T. Rowe Price Group, Inc., and T. Rowe Price Investment Services, Inc. | |
| Gregory S. Golczewski (1966) Vice President | Vice President, T. Rowe Price and T. Rowe Price Trust Company | |
| Paul D. Greene II (1978) Vice President | Vice President, T. Rowe Price and T. Rowe Price Group, Inc. | |
| Gregory K. Hinkle, CPA (1958) Treasurer | Vice President, T. Rowe Price, T. Rowe Price Group, Inc., and T. Rowe Price Trust Company | |
| Stefan Hubrich, Ph.D., CFA (1974) Vice President | Vice President, T. Rowe Price and T. Rowe Price Group, Inc. | |
| Leigh Innes, CFA (1976) Vice President | Vice President, T. Rowe Price Group, Inc., and T. Rowe Price International | |
| Randal S. Jenneke (1971) Vice President | Vice President, T. Rowe Price Group, Inc., and T. Rowe Price International; formerly Senior Portfolio Manager, Australian Equities (to 2010) | |
| Yoichiro Kai (1973) Vice President | Vice President, T. Rowe Price Group, Inc., and T. Rowe Price International; formerly Japanese Financial/Real Estate Sector Analyst/Portfolio Manager, Citadel Investment Group, Asia Limited (to 2009) | |
| Andrew J. Keirle (1974) Executive Vice President | Vice President, T. Rowe Price Group, Inc., and T. Rowe Price International | |
| Ian D. Kelson (1956) Executive Vice President | Director and President–International Fixed Income, T. Rowe Price International; Vice President, T. Rowe Price and T. Rowe Price Group, Inc. | |
| Christopher J. Kushlis, CFA (1976) Vice President | Vice President, T. Rowe Price Group, Inc., and T. Rowe Price International | |
| Mark J. Lawrence (1970) Vice President | Vice President, T. Rowe Price Group, Inc., and T. Rowe Price International | |
| David M. Lee, CFA (1962) Vice President | Vice President, T. Rowe Price and T. Rowe Price Group, Inc. | |
| Patricia B. Lippert (1953) Secretary | Assistant Vice President, T. Rowe Price and T. Rowe Price Investment Services, Inc. | |
| Christopher C. Loop, CFA (1966) Vice President | Vice President, T. Rowe Price, T. Rowe Price Group, Inc., and T. Rowe Price International | |
| Anh Lu (1968) Vice President | Vice President, Price Hong Kong and T. Rowe Price Group, Inc. | |
| Sebastien Mallet (1974) Executive Vice President | Vice President, T. Rowe Price Group, Inc., and T. Rowe Price International | |
| Daniel Martino, CFA (1974) Vice President | Vice President, T. Rowe Price and T. Rowe Price Group, Inc. | |
| Jonathan H.W. Matthews, CFA (1975) Vice President | Vice President, T. Rowe Price Group, Inc., and T. Rowe Price International | |
| Raymond A. Mills, Ph.D., CFA (1960) Executive Vice President | Vice President, T. Rowe Price, T. Rowe Price Group, Inc., T. Rowe Price International, and T. Rowe Price Trust Company | |
| Sudhir Nanda, Ph.D., CFA (1959) Vice President | Vice President, T. Rowe Price and T. Rowe Price Group, Inc. | |
| Joshua Nelson (1977) Executive Vice President | Vice President, T. Rowe Price and T. Rowe Price Group, Inc. | |
| Jason Nogueira, CFA (1974) Executive Vice President | Vice President, T. Rowe Price and T. Rowe Price Group, Inc. | |
| David Oestreicher (1967) Vice President | Director, Vice President, and Secretary, T. Rowe Price Investment Services, Inc., T. Rowe Price Retirement Plan Services, Inc., T. Rowe Price Services, Inc., and T. Rowe Price Trust Company; Chief Legal Officer, Vice President, and Secretary, T. Rowe Price Group, Inc.; Vice President and Secretary, T. Rowe Price and T. Rowe Price International; Vice President, Price Hong Kong and Price Singapore | |
| Michael D. Oh, CFA (1974) Vice President | Vice President, T. Rowe Price and T. Rowe Price Group, Inc. | |
| Kenneth A. Orchard (1975) Vice President | Vice President, T. Rowe Price Group, Inc., and T. Rowe Price International; formerly Vice President, Moody’s Investors Service (to 2010) | |
| Gonzalo Pángaro, CFA (1968) Executive Vice President | Vice President, T. Rowe Price Group, Inc., and T. Rowe Price International | |
| Timothy E. Parker, CFA (1974) Vice President | Vice President, T. Rowe Price and T. Rowe Price Group, Inc. | |
| Craig J. Pennington, CFA (1971) Vice President | Vice President, T. Rowe Price Group, Inc., and T. Rowe Price International; formerly Global Energy Analyst, Insight Investment (to 2010) | |
| Frederick A. Rizzo (1969) Vice President | Vice President, T. Rowe Price Group, Inc., and T. Rowe Price International | |
| Christopher J. Rothery (1963) Executive Vice President | Vice President, T. Rowe Price Group, Inc., and T. Rowe Price International | |
| Federico Santilli, CFA (1974) Executive Vice President | Vice President, T. Rowe Price Group, Inc., and T. Rowe Price International | |
| Sebastian Schrott (1977) Vice President | Vice President, T. Rowe Price Group, Inc., and T. Rowe Price International | |
| Deborah D. Seidel (1962) Vice President | Vice President, T. Rowe Price, T. Rowe Price Group, Inc., T. Rowe Price Investment Services, Inc., and T. Rowe Price Services, Inc. | |
| Robert W. Sharps, CFA, CPA (1971) Vice President | Vice President, T. Rowe Price, T. Rowe Price Group, Inc., and T. Rowe Price Trust Company | |
| John C.A. Sherman (1969) Vice President | Vice President, T. Rowe Price Group, Inc., and T. Rowe Price International | |
| Robert W. Smith (1961) Executive Vice President | Vice President, T. Rowe Price, T. Rowe Price Group, Inc., and T. Rowe Price Trust Company | |
| Joshua K. Spencer, CFA (1973) Vice President | Vice President, T. Rowe Price and T. Rowe Price Group, Inc. | |
| David A. Stanley (1963) Vice President | Vice President, T. Rowe Price Group, Inc., and T. Rowe Price International | |
| Jonty Starbuck, Ph.D. (1975) Vice President | Vice President, T. Rowe Price Group, Inc., and T. Rowe Price International | |
| Taymour R. Tamaddon, CFA (1976) Vice President | Vice President, T. Rowe Price and T. Rowe Price Group, Inc. | |
| Ju Yen Tan (1972) Vice President | Vice President, T. Rowe Price Group, Inc., and T. Rowe Price International | |
| Dean Tenerelli (1964) Vice President | Vice President, T. Rowe Price Group, Inc., and T. Rowe Price International | |
| Eric L. Veiel, CFA (1972) Vice President | Vice President, T. Rowe Price and T. Rowe Price Group, Inc. | |
| Julie L. Waples (1970) Vice President | Vice President, T. Rowe Price | |
| Christopher S. Whitehouse (1972) Vice President | Vice President, T. Rowe Price Group, Inc., and T. Rowe Price International | |
| J. Howard Woodward, CFA (1974) Vice President | Vice President, T. Rowe Price Group, Inc., and T. Rowe Price International | |
| Ernest C. Yeung (1979) Vice President | Vice President, Price Hong Kong and T. Rowe Price Group, Inc. | |
| Unless otherwise noted, officers have been employees of T. Rowe Price or T. Rowe Price International for at least 5 years. | ||
Item 2. Code of Ethics.
The registrant has adopted a code of ethics, as defined in Item 2 of Form N-CSR, applicable to its principal executive officer, principal financial officer, principal accounting officer or controller, or persons performing similar functions. A copy of this code of ethics is filed as an exhibit to this Form N-CSR. No substantive amendments were approved or waivers were granted to this code of ethics during the period covered by this report.
Item 3. Audit Committee Financial Expert.
The registrant’s Board of Directors/Trustees has determined that Mr. Anthony W. Deering qualifies as an audit committee financial expert, as defined in Item 3 of Form N-CSR. Mr. Deering is considered independent for purposes of Item 3 of Form N-CSR.
Item 4. Principal Accountant Fees and Services.
(a) – (d) Aggregate fees billed for the last two fiscal years for professional services rendered to, or on behalf of, the registrant by the registrant’s principal accountant were as follows:
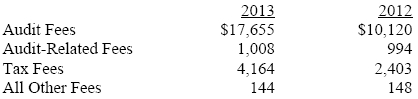
Audit fees include amounts related to the audit of the registrant’s annual financial statements and services normally provided by the accountant in connection with statutory and regulatory filings. Audit-related fees include amounts reasonably related to the performance of the audit of the registrant’s financial statements and specifically include the issuance of a report on internal controls and, if applicable, agreed-upon procedures related to fund acquisitions. Tax fees include amounts related to services for tax compliance, tax planning, and tax advice. The nature of these services specifically includes the review of distribution calculations and the preparation of Federal, state, and excise tax returns. All other fees include the registrant’s pro-rata share of amounts for agreed-upon procedures in conjunction with service contract approvals by the registrant’s Board of Directors/Trustees.
(e)(1) The registrant’s audit committee has adopted a policy whereby audit and non-audit services performed by the registrant’s principal accountant for the registrant, its investment adviser, and any entity controlling, controlled by, or under common control with the investment adviser that provides ongoing services to the registrant require pre-approval in advance at regularly scheduled audit committee meetings. If such a service is required between regularly scheduled audit committee meetings, pre-approval may be authorized by one audit committee member with ratification at the next scheduled audit committee meeting. Waiver of pre-approval for audit or non-audit services requiring fees of a de minimis amount is not permitted.
(2) No services included in (b) – (d) above were approved pursuant to paragraph (c)(7)(i)(C) of Rule 2-01 of Regulation S-X.
(f) Less than 50 percent of the hours expended on the principal accountant’s engagement to audit the registrant’s financial statements for the most recent fiscal year were attributed to work performed by persons other than the principal accountant’s full-time, permanent employees.
(g) The aggregate fees billed for the most recent fiscal year and the preceding fiscal year by the registrant’s principal accountant for non-audit services rendered to the registrant, its investment adviser, and any entity controlling, controlled by, or under common control with the investment adviser that provides ongoing services to the registrant were $1,691,000 and $1,802,000, respectively.
(h) All non-audit services rendered in (g) above were pre-approved by the registrant’s audit committee. Accordingly, these services were considered by the registrant’s audit committee in maintaining the principal accountant’s independence.
Item 5. Audit Committee of Listed Registrants.
Not applicable.
Item 6. Investments.
(a) Not applicable. The complete schedule of investments is included in Item 1 of this Form N-CSR.
(b) Not applicable.
Item 7. Disclosure of Proxy Voting Policies and Procedures for Closed-End Management Investment Companies.
Not applicable.
Item 8. Portfolio Managers of Closed-End Management Investment Companies.
Not applicable.
Item 9. Purchases of Equity Securities by Closed-End Management Investment Company and Affiliated Purchasers.
Not applicable.
Item 10. Submission of Matters to a Vote of Security Holders.
Not applicable.
Item 11. Controls and Procedures.
(a) The registrant’s principal executive officer and principal financial officer have evaluated the registrant’s disclosure controls and procedures within 90 days of this filing and have concluded that the registrant’s disclosure controls and procedures were effective, as of that date, in ensuring that information required to be disclosed by the registrant in this Form N-CSR was recorded, processed, summarized, and reported timely.
(b) The registrant’s principal executive officer and principal financial officer are aware of no change in the registrant’s internal control over financial reporting that occurred during the registrant’s second fiscal quarter covered by this report that has materially affected, or is reasonably likely to materially affect, the registrant’s internal control over financial reporting.
Item 12. Exhibits.
(a)(1) The registrant’s code of ethics pursuant to Item 2 of Form N-CSR is attached.
(2) Separate certifications by the registrant's principal executive officer and principal financial officer, pursuant to Section 302 of the Sarbanes-Oxley Act of 2002 and required by Rule 30a-2(a) under the Investment Company Act of 1940, are attached.
(3) Written solicitation to repurchase securities issued by closed-end companies: not applicable.
(b) A certification by the registrant's principal executive officer and principal financial officer, pursuant to Section 906 of the Sarbanes-Oxley Act of 2002 and required by Rule 30a-2(b) under the Investment Company Act of 1940, is attached.
SIGNATURES
Pursuant to the requirements of the Securities Exchange Act of 1934 and the Investment Company Act of 1940, the registrant has duly caused this report to be signed on its behalf by the undersigned, thereunto duly authorized.
T. Rowe Price Institutional International Funds, Inc.
| By | /s/ Edward C. Bernard | |
| Edward C. Bernard | ||
| Principal Executive Officer | ||
| Date February 14, 2014 | ||
Pursuant to the requirements of the Securities Exchange Act of 1934 and the Investment Company Act of 1940, this report has been signed below by the following persons on behalf of the registrant and in the capacities and on the dates indicated.
| By | /s/ Edward C. Bernard | |
| Edward C. Bernard | ||
| Principal Executive Officer | ||
| Date February 14, 2014 | ||
| By | /s/ Gregory K. Hinkle | |
| Gregory K. Hinkle | ||
| Principal Financial Officer | ||
| Date February 14, 2014 | ||