UNITED STATES
SECURITIES AND EXCHANGE COMMISSION
Washington, D.C. 20549
FORM N-CSR
CERTIFIED SHAREHOLDER REPORT OF REGISTERED
MANAGEMENT INVESTMENT COMPANIES
Investment Company Act File Number: 811-05833
| T. Rowe Price Institutional International Funds, Inc. |
|
| (Exact name of registrant as specified in charter) |
| |
| 100 East Pratt Street, Baltimore, MD 21202 |
|
| (Address of principal executive offices) |
| |
| David Oestreicher |
| 100 East Pratt Street, Baltimore, MD 21202 |
|
| (Name and address of agent for service) |
Registrant’s telephone number, including area code: (410) 345-2000
Date of fiscal year end: October 31
Date of reporting period: April 30, 2015
Item 1. Report to Shareholders
| Institutional Frontier Markets Equity Fund | April 30, 2015 |
| ● | Frontier equity markets generally fell in the six months ended April 30, 2015, as a significant strengthening of the U.S. dollar reduced local returns in dollar terms.
|
| ● | Your fund returned -7.15% in the last six months but marginally outperformed its benchmark, the MSCI Frontier Markets Index.
|
| ● | Country allocations are driven by our stock selection, which is the result of rigorous fundamental research by our equity analysts. Roughly half of the fund is invested in the Middle East and Africa, but Asia represents our largest regional overweight.
|
| ● | We believe that the macro fundamentals and demographics in many frontier markets are favorable and, in some cases, resemble those of many emerging countries approximately 15 to 20 years ago. |
The views and opinions in this report were current as of April 30, 2015. They are not guarantees of performance or investment results and should not be taken as investment advice. Investment decisions reflect a variety of factors, and the managers reserve the right to change their views about individual stocks, sectors, and the markets at any time. As a result, the views expressed should not be relied upon as a forecast of the fund’s future investment intent. The report is certified under the Sarbanes-Oxley Act, which requires mutual funds and other public companies to affirm that, to the best of their knowledge, the information in their financial reports is fairly and accurately stated in all material respects.
Manager’s Letter
T. Rowe Price Institutional Frontier Markets Equity Fund
Dear Investor
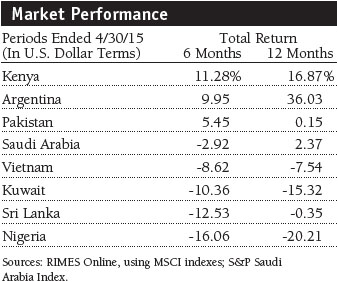
Frontier equity markets generally fell in the six months ended April 30, 2015, as a significant strengthening of the U.S. dollar—in anticipation of rising short-term U.S. interest rates—versus most non-U.S. currencies reduced returns in dollar terms. Stocks in oil-exporting Middle Eastern and African countries struggled as last year’s steep decline in oil prices weighed on their economies. While economies in Asia are benefiting from lower oil import costs, equities in Sri Lanka and Bangladesh struggled in the last six months due to domestic political concerns. Frontier markets in Eastern Europe declined amid economic and currency weakness in regional heavyweight Russia. In Latin America, Argentine stocks rose about 10%, outperforming other markets in the region.
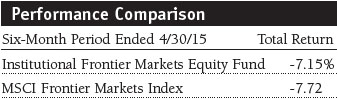
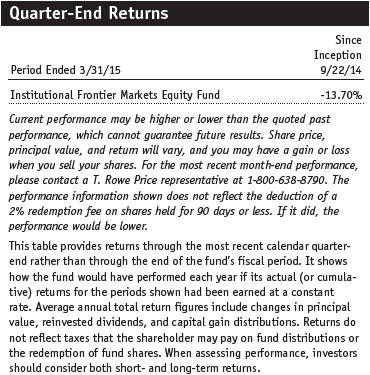
Your fund returned -7.15% in the six-month period ended April 30, 2015. As shown in the Performance Comparison table, the fund marginally outperformed its benchmark, the MSCI Frontier Markets Index. Good stock selection in Sri Lanka and underweighting Kuwait helped our performance, but our underweight position in Argentina, which we gradually reduced during our reporting period, detracted from our results.
Portfolio Review
Before we review the portfolio’s holdings and allocations, we would like to welcome new shareholders and briefly discuss our approach to frontier markets investing. While there are many possible definitions of frontier markets, we consider them to be any markets that are not considered by MSCI to be developed or emerging. This is a purposefully broad definition, and it includes countries that are not classified at all, such as Saudi Arabia. We may also invest in companies that are domiciled in developed and emerging countries but which derive more than 50% of their revenues or earnings from frontier markets.
To be sure, country allocations do not determine our equity investments; rather, country allocations are driven by our stock selection, which is the result of rigorous fundamental research by our equity analysts. We also have a strong fixed income team that analyzes the macroeconomic picture for various frontier markets, providing us with a “weather forecast” before we make investment decisions. This risk awareness can help us avoid countries where unfavorable currency, inflation, or interest rate trends could negate the benefits of investing in companies that we like fundamentally.
Middle East and Africa
As of April 30, 2015, we had approximately 48% of the fund’s assets in Middle Eastern and African markets. Most of our holdings are companies that we believe will benefit from the development of a domestic consumer economy, such as banks, telecommunication services companies, and infrastructure-related businesses.
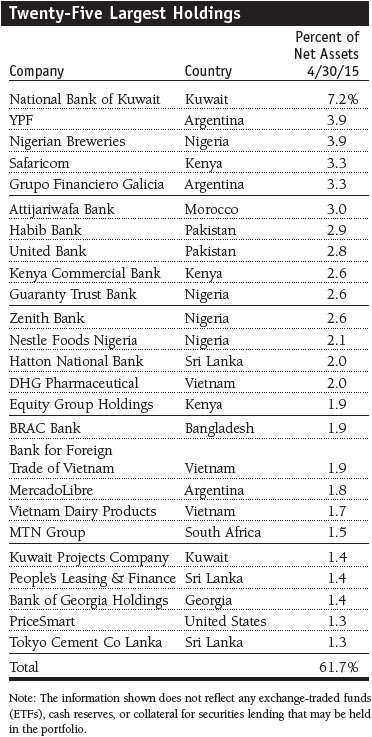
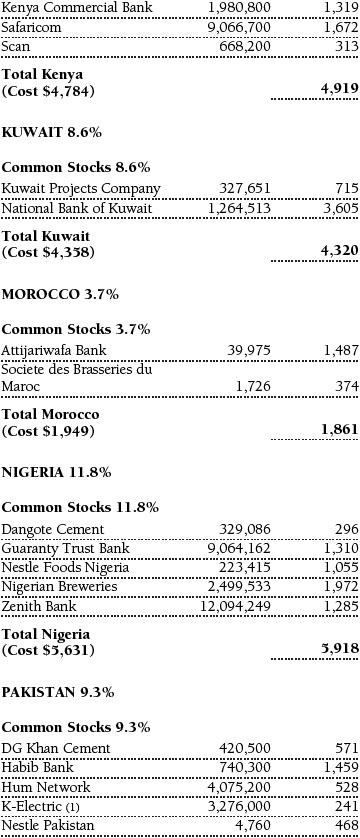
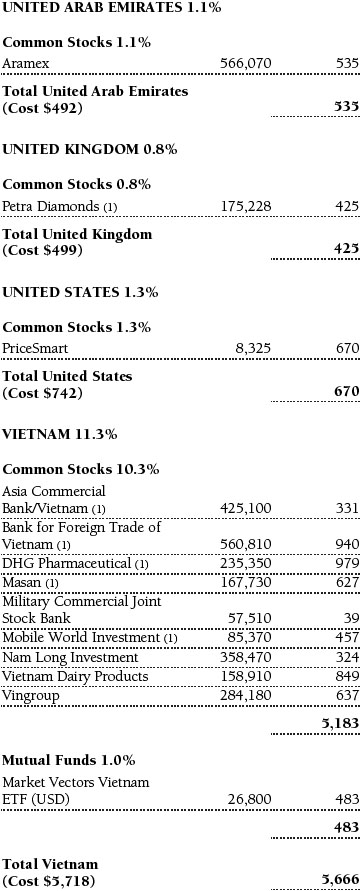
The plunge in oil prices in the second half of 2014 is having a material effect on Gulf Cooperation Council countries. Kuwait, for example, is a major oil producer, and its economy will struggle due to lower oil prices, as well as cutbacks in government spending. Although Oman’s oil production is less significant, lower oil prices and reduced government spending are also likely to weigh on its economy. Our two investments in Kuwait—conglomerate Kuwait Projects Company and National Bank of Kuwait—detracted from our results in the last six months. Bank Muscat in Oman also declined, and we eliminated it in favor of better investment opportunities elsewhere. On the plus side, air freight and logistics company Aramex in the United Arab Emirates (UAE) performed very well in the last six months. Aramex recently reported a 10% increase in first-quarter profits, raised its dividend, and is considering acquisitions. (Please refer to the fund’s portfolio of investments for a complete list of holdings and the amount each represents in the portfolio.)
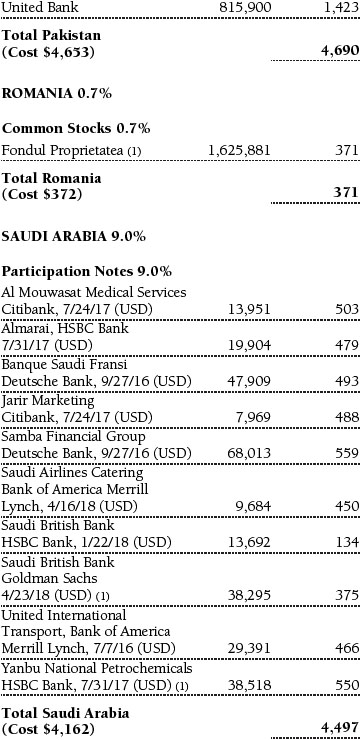
During our reporting period, Saudi Arabia announced that its stock market will open directly to foreign investors on June 15, 2015. At present, such investors, including your fund, may only own participation notes that are linked to common stocks. Final rules for allowing foreign participation in the market were published shortly after our reporting period ended.
In the last six months, Samba Financial performed very well, although corporate lending is moderating. Banque Saudi Fransi also produced gains for the fund, but Saudi British Bank was lackluster. We believe Saudi banks will benefit from rising U.S. interest rates, to which Saudi rates are tied. Electronics retailer Jarir Marketing performed very well, in part because the new Saudi king decreed that government employees and others should receive bonuses equivalent to two months’ salary. Jarir reported a 23% increase in first-quarter profits and raised its dividend. We established a position in Yanbu National Petrochemicals in the last six months because its valuation became attractive as oil prices plunged, and we believe that its ability to generate cash flow in the medium term is intact.
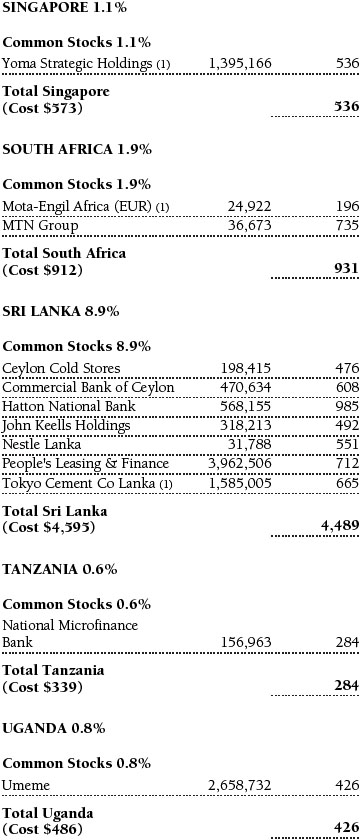
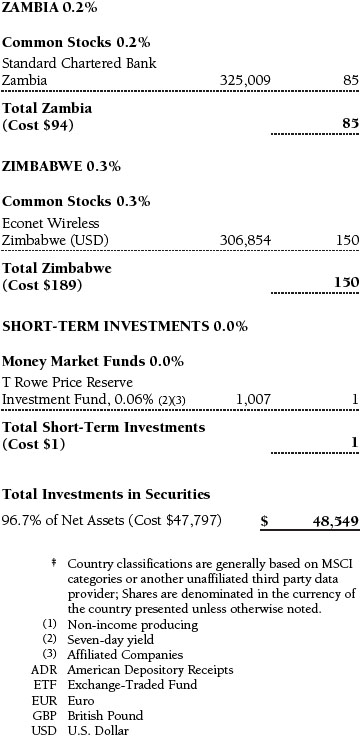
In Africa, we have a few small investments in various sub-Saharan countries, such as Ugandan utility Umeme and Standard Chartered Bank Zambia. However, most of our assets in this region are in Kenya and Nigeria.
The environment in Nigeria has been challenging, as evidenced by declining oil prices, election-related uncertainty, slowing economic activity, and a nearly 17% decrease in the value of the naira versus the dollar in the last six months. While the election of challenger Muhammadu Buhari removed a major source of uncertainty, we are cautious about the country’s near-term prospects, as further currency weakness is likely and the inflationary effect of the naira’s devaluation is yet to be fully reflected in consumer prices. Rising interest rates in response to inflation would further squeeze the consumer. During the period, our investments in Guaranty Trust Bank and Zenith Bank added value, as did Nestle Foods Nigeria. However, Heineken-owned Nigerian Breweries was one of our largest detractors.
In Kenya, which has had strong economic growth for the last couple of years, the market rose more than 11% in our reporting period. With stock valuations generally full, interest rates likely to rise because of inflation, and a poor rainy season affecting the economically important agricultural sector, our near-term outlook for Kenya is less bullish. Mobile telecom company Safaricom continued its remarkable ascent and was one of our largest absolute contributors to performance. The government’s sale of its 25% stake in the company was well received by local investors. ARM Cement was disappointing, but we believe the company’s new plant in Tanzania will generate strong revenues in the years ahead. Banks were mixed: Kenya Commercial Bank appreciated, but Equity Group Holdings Kenya and Diamond Trust Bank Kenya declined.

Asia
Asian investments represented about 34% of the fund’s assets at the end of April—a significant overweight versus the MSCI benchmark. This reflects our belief that the composition and weightings of the Asian portion of the index do not appropriately represent the opportunities we are finding in these markets. We believe Asian frontier markets have some quality companies trading at very attractive valuations. Many of these economies are still recovering from the 2008 global financial crisis. Macro fundamentals have troughed across most, and we believe fundamentals will improve.
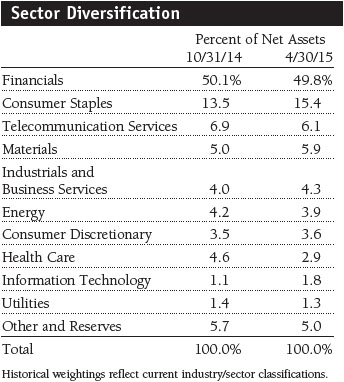
Our investments are primarily in Sri Lanka, Vietnam, Pakistan, and Bangladesh, where positive demographics, low penetration levels in consumer sectors, pension reforms, and underdeveloped banking systems are providing, in our opinion, a robust backdrop for investing. The opportunities in Asia, as with other frontier markets, are largely focused on the financials sector, which is why we have half of the fund’s assets in the sector.
In the last six months, Sri Lanka’s Hatton National Bank, the country’s largest private retail-focused bank, was one of our top absolute performance contributors, helped by increasing loan growth. Management intends to grow the bank following a two-year banking industry slowdown. Despite the stock’s strong recent performance, its valuation is still cheap. Bank for Foreign Trade of Vietnam and Pakistan’s largest bank, United Bank, were also good performers. Shares of Pakistan’s Habib Bank edged higher for the period, and we expect better performance going forward. The company reported strong first-quarter earnings, and loan growth is expected to pick up in the medium term. In addition, the Pakistani government recently completed its privatization of the bank by selling its remaining stake, removing a major overhang.
Sri Lanka’s Commercial Bank of Ceylon and auto leasing company People’s Leasing & Finance declined during our reporting period. Both stocks had performed well going into 2015 as loan growth raised expectations for strong earnings, but uncertainty ahead of parliamentary elections in June prompted some profit taking. We are maintaining our positions, as we expect their returns on equity to rise to more normal levels this year. In Bangladesh, the investment environment has become challenging due to an impasse between a prime minister who refuses to step down and an opposition party demanding new elections while disrupting transportation with blockades. We eliminated Eastern Bank but maintained our position in BRAC Bank, which is attractively valued and has good profit margins.
We own a few consumer staples companies that we believe will benefit from the development of consumer economies. Sri Lankan beverage company Ceylon Cold Stores was a solid performer in the last six months, whereas Nestle Pakistan and Vietnamese food products company Masan declined. We established a position in Vietnam Dairy Products, which has a strong cash-generating business and a strong outlook.
We also like construction materials companies Tokyo Cement Co Lanka in Sri Lanka and DG Khan Cement in Pakistan because we believe they will benefit from infrastructure development. The former plunged in the last six months, in part because the new Sri Lankan prime minister’s pursuit of new tax revenues—including a proposed one-time “windfall” tax on profits above a certain level for individuals and corporations to help pay for campaign promises—is weighing on growth. The latter performed well in anticipation of stronger growth because of several economic tailwinds in Pakistan, including lower oil prices, falling inflation, and central bank interest rate cuts.
Emerging Europe
As of April 30, 2015, we had only 2% of the fund’s assets in emerging Europe. In the last six months, we eliminated our three investments in Kazakhstan—Steppe Cement, Halyk Savings Bank of Kazakhstan, and mobile phone carrier KCell—due to concerns that economic and currency weakness in neighboring Russia would have a negative impact on the Kazakh economy and exports, and that there may be a further devaluation of the tenge. We also eliminated Georgian bank TBC Bank, which issued poor financial results in February, amid concerns that the Georgian economy would weaken and that the currency would continue to decline this year. Although Bank of Georgia Holdings detracted from our results, we maintained our position because the company offers a high return on equity, impressive loan growth, and a strong balance sheet. We added a position in Fondul Proprietatea, a Romanian investment company with general exposure to the economy and an attractive dividend yield.
Latin America
At the end of April, Latin America represented 10% of the fund’s assets. Argentina remains the only Latin American country represented in the portfolio, but we are watching for new opportunities on the continent and in the Caribbean. The Argentine market climbed about 10% in the last six months, lifted by hopes for a business-friendly candidate to win presidential elections in October as well as strong fourth-quarter earnings reports from banks. We own four Argentine companies: integrated oil giant YPF; e-commerce company MercadoLibre, which operates in several Latin American countries; real estate management company Irsa Inversiones Y Representaciones; and Grupo Financiero Galacia, a high-quality bank that we added to the portfolio during our reporting period. All of these holdings were among the fund’s top absolute contributors to performance.
We also own PriceSmart, a U.S. shopping warehouse club operator that derives the majority of its revenue from Costa Rica but is expanding in Colombia. Shares declined as the company’s earnings were weaker than expected due to its exposure to Colombia, whose currency fell 14% versus the dollar in the last six months. We are maintaining our position because we believe that the company’s underlying business performance remains very strong in Colombia and that the negative currency effects will be a short-term phenomenon.
Outlook
We believe that some frontier markets have the potential to become emerging markets over the long term. The strong performance of frontier markets in the last few years and MSCI’s recent upgrade of Qatar and the UAE to the emerging markets universe have brought much attention to what had been largely overlooked investment opportunities, and the low correlation of frontier markets with other asset classes around the world makes them a valuable source of diversification. We believe frontier markets have a place—albeit a small one due to the heightened risks and potential for volatility—in an investor’s global portfolio.
We believe that the macro fundamentals and demographics in many frontier markets are favorable and, in some cases, resemble those of many emerging countries approximately 15 to 20 years ago. For example, economic growth for many frontier markets is likely to range from about 6% to 9% in the years ahead, which is much stronger than in the developed and emerging markets universes. Also, nearly 60% of the aggregate population in the frontier universe is below age 30—a young workforce that should drive economic growth and develop into a solid middle class of consumers in many countries.
Of course, conditions and investment opportunities will vary widely among frontier markets, even those within the same region. While stock valuations are still reasonable and the long-term growth outlook of many corporations remains underpriced, we acknowledge that there will be individual winners and losers. This underscores the need for rigorous fundamental research, which is the backbone of the T. Rowe Price investment approach.
Thank you for your confidence in our investment management capabilities.
Respectfully submitted,

Oliver Bell
Portfolio manager
May 22, 2015
The portfolio manager has day-to-day responsibility for managing the portfolio and works with committee members in developing and executing the fund’s investment program.
| Risks of International Investing |
Funds that invest overseas generally carry more risk than funds that invest strictly in U.S. assets. Funds investing in a single country, limited geographic region, or emerging markets tend to be riskier than more diversified funds. Risks can result from varying stages of economic and political development; differing regulatory environments, trading days, and accounting standards; and higher transaction costs of non-U.S. markets. Non-U.S. investments are also subject to currency risk, or a decline in the value of a foreign currency versus the U.S. dollar, which reduces the dollar value of securities denominated in that currency.
The risks of international investing are heightened for investments in emerging market and frontier market countries. Emerging and frontier market countries tend to have economic structures that are less diverse and mature, and political systems that are less stable, than those of developed market countries. In addition to all of the risks of investing in international developed markets, emerging and frontier markets tend to have less liquid and less efficient trading markets and are more susceptible to governmental interference, local taxes being imposed on international investments, and restrictions on gaining access to sales proceeds.
Frontier markets generally have smaller economies or less mature capital markets than emerging markets, and as a result, the risks typically associated with investing in emerging market countries are magnified in frontier countries. Adverse changes in currency values of frontier market countries may be severe, and settlement procedures and custody services may prove inadequate in certain markets. The markets of frontier countries typically have low trading volumes and the potential for extreme price volatility and illiquidity. This volatility may be further increased by the actions of a few major investors.
MSCI Frontier Markets Index: An index that measures the performance of stocks in various frontier market countries.
Note: MSCI makes no express or implied warranties or representations and shall have no liability whatsoever with respect to any MSCI data contained herein. The MSCI data may not be further redistributed or used as a basis for other indices or any securities or financial products. This report is not approved, reviewed, or produced by MSCI.
Portfolio Highlights
Performance and Expenses
T. Rowe Price Institutional Frontier Markets Equity Fund
Fund Expense Example
As a mutual fund shareholder, you may incur two types of costs: (1) transaction costs, such as redemption fees or sales loads, and (2) ongoing costs, including management fees, distribution and service (12b-1) fees, and other fund expenses. The following example is intended to help you understand your ongoing costs (in dollars) of investing in the fund and to compare these costs with the ongoing costs of investing in other mutual funds. The example is based on an investment of $1,000 invested at the beginning of the most recent six-month period and held for the entire period.
Actual Expenses
The first line of the following table (Actual) provides information about actual account values and actual expenses. You may use the information on this line, together with your account balance, to estimate the expenses that you paid over the period. Simply divide your account value by $1,000 (for example, an $8,600 account value divided by $1,000 = 8.6), then multiply the result by the number on the first line under the heading “Expenses Paid During Period” to estimate the expenses you paid on your account during this period.
Hypothetical Example for Comparison Purposes
The information on the second line of the table (Hypothetical) is based on hypothetical account values and expenses derived from the fund’s actual expense ratio and an assumed 5% per year rate of return before expenses (not the fund’s actual return). You may compare the ongoing costs of investing in the fund with other funds by contrasting this 5% hypothetical example and the 5% hypothetical examples that appear in the shareholder reports of the other funds. The hypothetical account values and expenses may not be used to estimate the actual ending account balance or expenses you paid for the period.
You should also be aware that the expenses shown in the table highlight only your ongoing costs and do not reflect any transaction costs, such as redemption fees or sales loads. Therefore, the second line of the table is useful in comparing ongoing costs only and will not help you determine the relative total costs of owning different funds. To the extent a fund charges transaction costs, however, the total cost of owning that fund is higher.

Financial Highlights
T. Rowe Price Institutional Frontier Markets Equity Fund
(Unaudited)

The accompanying notes are an integral part of these financial statements.
Portfolio of Investments‡
T. Rowe Price Institutional Frontier Markets Equity Fund
April 30, 2015 (Unaudited)


The accompanying notes are an integral part of these financial statements.
Statement of Assets and Liabilities
T. Rowe Price Institutional Frontier Markets Equity Fund
April 30, 2015 (Unaudited)
($000s, except shares and per share amounts)
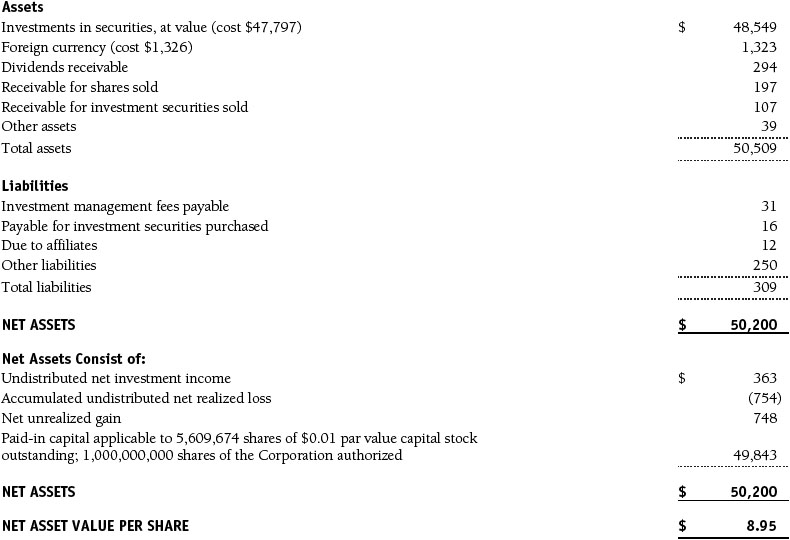
The accompanying notes are an integral part of these financial statements.
Statement of Operations
T. Rowe Price Institutional Frontier Markets Equity Fund
(Unaudited)
($000s)
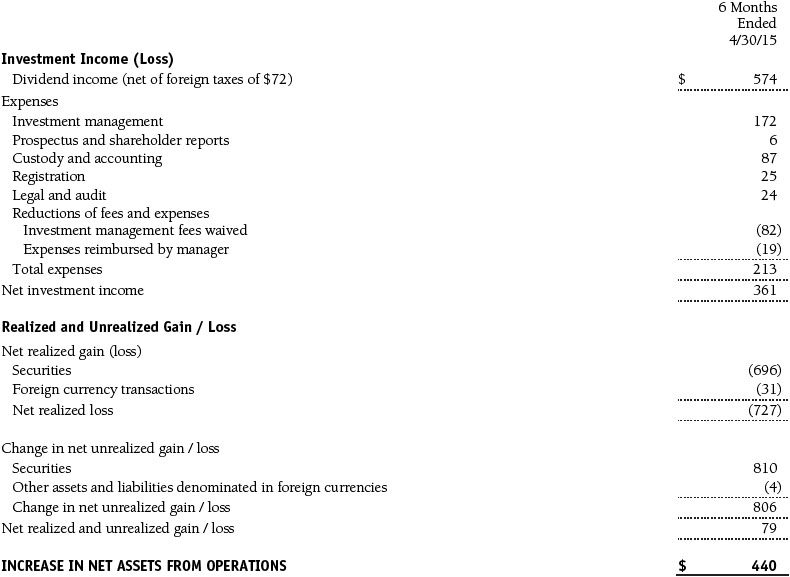
The accompanying notes are an integral part of these financial statements.
Statement of Changes in Net Assets
T. Rowe Price Institutional Frontier Markets Equity Fund
(Unaudited)
($000s)
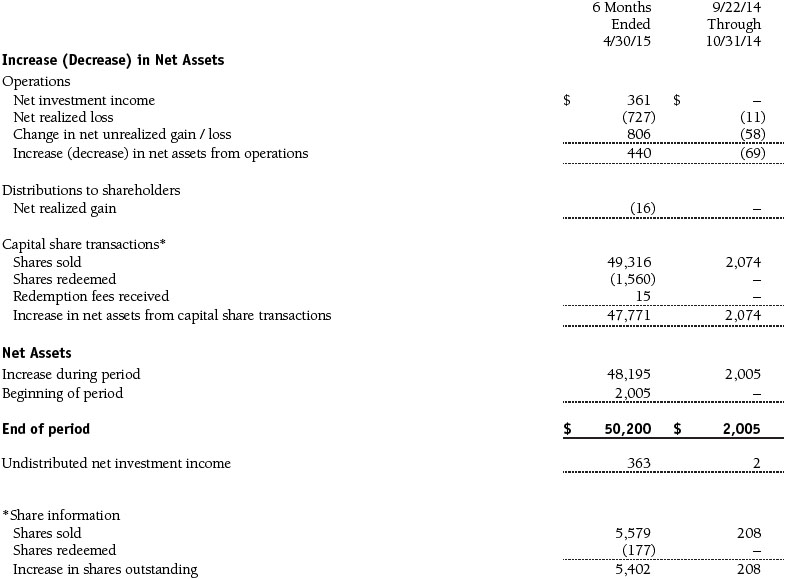
The accompanying notes are an integral part of these financial statements.
Notes to Financial Statements
T. Rowe Price Institutional Frontier Markets Equity Fund
April 30, 2015 (Unaudited)
T. Rowe Price Institutional International Funds, Inc. (the corporation), is registered under the Investment Company Act of 1940 (the 1940 Act). The Institutional Frontier Markets Equity Fund (the fund) is a nondiversified, open-end management investment company established by the corporation. The fund commenced operations on September 22, 2014. The fund seeks long-term growth of capital.
NOTE 1 - SIGNIFICANT ACCOUNTING POLICIES
Basis of Preparation The fund is an investment company and follows accounting and reporting guidance in the Financial Accounting Standards Board (FASB) Accounting Standards Codification Topic 946 (ASC 946). The accompanying financial statements were prepared in accordance with accounting principles generally accepted in the United States of America (GAAP), including but not limited to ASC 946. GAAP requires the use of estimates made by management. Management believes that estimates and valuations are appropriate; however, actual results may differ from those estimates, and the valuations reflected in the accompanying financial statements may differ from the value ultimately realized upon sale or maturity.
Investment Transactions, Investment Income, and Distributions Income and expenses are recorded on the accrual basis. Dividends received from mutual fund investments are reflected as dividend income; capital gain distributions are reflected as realized gain/loss. Dividend income and capital gain distributions are recorded on the ex-dividend date. Income tax-related interest and penalties, if incurred, would be recorded as income tax expense. Investment transactions are accounted for on the trade date. Realized gains and losses are reported on the identified cost basis. Distributions to shareholders are recorded on the ex-dividend date. Income distributions are declared and paid annually. Capital gain distributions, if any, are generally declared and paid by the fund annually.
Currency Translation Assets, including investments, and liabilities denominated in foreign currencies are translated into U.S. dollar values each day at the prevailing exchange rate, using the mean of the bid and asked prices of such currencies against U.S. dollars as quoted by a major bank. Purchases and sales of securities, income, and expenses are translated into U.S. dollars at the prevailing exchange rate on the date of the transaction. The effect of changes in foreign currency exchange rates on realized and unrealized security gains and losses is reflected as a component of security gains and losses.
Redemption Fees A 2% fee is assessed on redemptions of fund shares held for 90 days or less to deter short-term trading and to protect the interests of long-term shareholders. Redemption fees are withheld from proceeds that shareholders receive from the sale or exchange of fund shares. The fees are paid to the fund and are recorded as an increase to paid-in capital. The fees may cause the redemption price per share to differ from the net asset value per share.
New Accounting Guidance In June 2014, FASB issued Accounting Standards Update (ASU) No. 2014-11, Transfers and Servicing (Topic 860), Repurchase-to-Maturity Transactions, Repurchase Financings, and Disclosures. The ASU changes the accounting for certain repurchase agreements and expands disclosure requirements related to repurchase agreements, securities lending, repurchase-to-maturity and similar transactions. The ASU is effective for interim and annual reporting periods beginning after December 15, 2014. Adoption will have no effect on the fund’s net assets or results of operations.
In May 2015, FASB issued ASU No. 2015-07, Fair Value Measurement (Topic 820), Disclosures for Investments in Certain Entities That Calculate Net Asset Value per Share (or Its Equivalent). The ASU removes the requirement to categorize within the fair value hierarchy all investments for which fair value is measured using the net asset value per share practical expedient and amends certain disclosure requirements for such investments. The ASU is effective for interim and annual reporting periods beginning after December 15, 2015. Adoption will have no effect on the fund’s net assets or results of operations.
NOTE 2 - VALUATION
The fund’s financial instruments are valued and its net asset value (NAV) per share is computed at the close of the New York Stock Exchange (NYSE), normally 4 p.m. ET, each day the NYSE is open for business.
Fair Value The fund’s financial instruments are reported at fair value, which GAAP defines as the price that would be received to sell an asset or paid to transfer a liability in an orderly transaction between market participants at the measurement date. The T. Rowe Price Valuation Committee (the Valuation Committee) has been established by the fund’s Board of Directors (the Board) to ensure that financial instruments are appropriately priced at fair value in accordance with GAAP and the 1940 Act. Subject to oversight by the Board, the Valuation Committee develops and oversees pricing-related policies and procedures and approves all fair value determinations. Specifically, the Valuation Committee establishes procedures to value securities; determines pricing techniques, sources, and persons eligible to effect fair value pricing actions; oversees the selection, services, and performance of pricing vendors; oversees valuation-related business continuity practices; and provides guidance on internal controls and valuation-related matters. The Valuation Committee reports to the Board; is chaired by the fund’s treasurer; and has representation from legal, portfolio management and trading, operations, and risk management.
Various valuation techniques and inputs are used to determine the fair value of financial instruments. GAAP establishes the following fair value hierarchy that categorizes the inputs used to measure fair value:
Level 1 – quoted prices (unadjusted) in active markets for identical financial instruments that the fund can access at the reporting date
Level 2 –inputs other than Level 1 quoted prices that are observable, either directly or indirectly (including, but not limited to, quoted prices for similar financial instruments in active markets, quoted prices for identical or similar financial instruments in inactive markets, interest rates and yield curves, implied volatilities, and credit spreads)
Level 3 – unobservable inputs
Observable inputs are developed using market data, such as publicly available information about actual events or transactions, and reflect the assumptions that market participants would use to price the financial instrument. Unobservable inputs are those for which market data are not available and are developed using the best information available about the assumptions that market participants would use to price the financial instrument. GAAP requires valuation techniques to maximize the use of relevant observable inputs and minimize the use of unobservable inputs. When multiple inputs are used to derive fair value, the financial instrument is assigned to the level within the fair value hierarchy based on the lowest-level input that is significant to the fair value of the financial instrument. Input levels are not necessarily an indication of the risk or liquidity associated with financial instruments at that level but rather the degree of judgment used in determining those values.
Valuation Techniques Equity securities listed or regularly traded on a securities exchange or in the over-the-counter (OTC) market are valued at the last quoted sale price or, for certain markets, the official closing price at the time the valuations are made. OTC Bulletin Board securities are valued at the mean of the closing bid and asked prices. A security that is listed or traded on more than one exchange is valued at the quotation on the exchange determined to be the primary market for such security. Listed securities not traded on a particular day are valued at the mean of the closing bid and asked prices for domestic securities and the last quoted sale or closing price for international securities.
For valuation purposes, the last quoted prices of non-U.S. equity securities may be adjusted to reflect the fair value of such securities at the close of the NYSE. If the fund determines that developments between the close of a foreign market and the close of the NYSE will, in its judgment, materially affect the value of some or all of its portfolio securities, the fund will adjust the previous quoted prices to reflect what it believes to be the fair value of the securities as of the close of the NYSE. In deciding whether it is necessary to adjust quoted prices to reflect fair value, the fund reviews a variety of factors, including developments in foreign markets, the performance of U.S. securities markets, and the performance of instruments trading in U.S. markets that represent foreign securities and baskets of foreign securities. The fund may also fair value securities in other situations, such as when a particular foreign market is closed but the fund is open. The fund uses outside pricing services to provide it with quoted prices and information to evaluate or adjust those prices. The fund cannot predict how often it will use quoted prices and how often it will determine it necessary to adjust those prices to reflect fair value. As a means of evaluating its security valuation process, the fund routinely compares quoted prices, the next day’s opening prices in the same markets, and adjusted prices.
Actively traded domestic equity securities generally are categorized in Level 1 of the fair value hierarchy. Non-U.S. equity securities generally are categorized in Level 2 of the fair value hierarchy despite the availability of quoted prices because, as described above, the fund evaluates and determines whether those quoted prices reflect fair value at the close of the NYSE or require adjustment. OTC Bulletin Board securities, certain preferred securities, and equity securities traded in inactive markets generally are categorized in Level 2 of the fair value hierarchy.
Investments in mutual funds are valued at the mutual fund’s closing NAV per share on the day of valuation and are categorized in Level 1 of the fair value hierarchy. Assets and liabilities other than financial instruments, including short-term receivables and payables, are carried at cost, or estimated realizable value, if less, which approximates fair value.
Thinly traded financial instruments and those for which the above valuation procedures are inappropriate or are deemed not to reflect fair value are stated at fair value as determined in good faith by the Valuation Committee. The objective of any fair value pricing determination is to arrive at a price that could reasonably be expected from a current sale. Financial instruments fair valued by the Valuation Committee are primarily private placements, restricted securities, warrants, rights, and other securities that are not publicly traded.
Subject to oversight by the Board, the Valuation Committee regularly makes good faith judgments to establish and adjust the fair valuations of certain securities as events occur and circumstances warrant. For instance, in determining the fair value of an equity investment with limited market activity, such as a private placement or a thinly traded public company stock, the Valuation Committee considers a variety of factors, which may include, but are not limited to, the issuer’s business prospects, its financial standing and performance, recent investment transactions in the issuer, new rounds of financing, negotiated transactions of significant size between other investors in the company, relevant market valuations of peer companies, strategic events affecting the company, market liquidity for the issuer, and general economic conditions and events. In consultation with the investment and pricing teams, the Valuation Committee will determine an appropriate valuation technique based on available information, which may include both observable and unobservable inputs. The Valuation Committee typically will afford greatest weight to actual prices in arm’s length transactions, to the extent they represent orderly transactions between market participants; transaction information can be reliably obtained; and prices are deemed representative of fair value. However, the Valuation Committee may also consider other valuation methods such as market-based valuation multiples; a discount or premium from market value of a similar, freely traded security of the same issuer; or some combination. Fair value determinations are reviewed on a regular basis and updated as information becomes available, including actual purchase and sale transactions of the issue. Because any fair value determination involves a significant amount of judgment, there is a degree of subjectivity inherent in such pricing decisions, and fair value prices determined by the Valuation Committee could differ from those of other market participants. Depending on the relative significance of unobservable inputs, including the valuation technique(s) used, fair valued securities may be categorized in Level 2 or 3 of the fair value hierarchy.
Valuation Inputs The following table summarizes the fund’s financial instruments, based on the inputs used to determine their fair values on April 30, 2015:
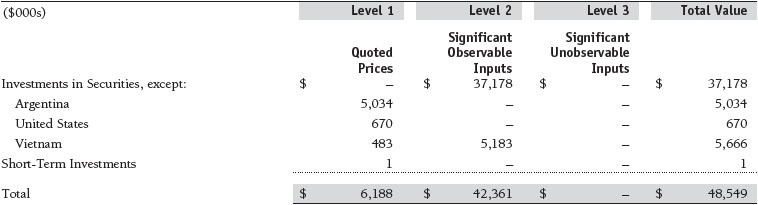
There were no material transfers between Levels 1 and 2 during the six months ended April 30, 2015.
NOTE 3 - OTHER INVESTMENT TRANSACTIONS
Consistent with its investment objective, the fund engages in the following practices to manage exposure to certain risks and/or to enhance performance. The investment objective, policies, program, and risk factors of the fund are described more fully in the fund’s prospectus and Statement of Additional Information.
Frontier and Emerging Markets The fund may invest, either directly or through investments in T. Rowe Price institutional funds, in securities of companies located in, issued by governments of, or denominated in or linked to the currencies of frontier and emerging market countries; at period-end, approximately 88% of the fund’s net assets were invested in frontier markets and 6% in emerging markets. Frontier markets generally have economic structures that are less diverse and mature, and political systems that are less stable, than developed countries and emerging markets. These markets may be subject to greater political, economic, and social uncertainty and differing regulatory environments that may potentially impact the fund’s ability to buy or sell certain securities or repatriate proceeds to U.S. dollars. Such securities are often subject to greater price volatility, less liquidity, and higher rates of inflation than U.S. securities. Investing in frontier markets is significantly riskier than investing in other countries, including emerging markets.
Participation Notes The fund may invest in participation notes, through which a counterparty provides exposure to common stock, in the form of an unsecured interest, in markets where direct investment by the fund is not possible. Participation notes provide the economic benefit of common stock ownership to the fund, while legal ownership and voting rights are retained by the counterparty. Although participation notes are usually structured with a defined maturity or termination date, early redemption may be possible. Risks associated with participation notes include the possible failure of a counterparty to perform in accordance with the terms of the agreement, inability to transfer or liquidate the notes, potential delays or an inability to redeem before maturity under certain market conditions, and limited legal recourse against the issuer of the underlying common stock.
Other Purchases and sales of portfolio securities other than short-term securities aggregated $54,037,000 and $7,491,000, respectively, for the six months ended April 30, 2015.
NOTE 4 - FEDERAL INCOME TAXES
No provision for federal income taxes is required since the fund intends to continue to qualify as a regulated investment company under Subchapter M of the Internal Revenue Code and distribute to shareholders all of its taxable income and gains. Distributions determined in accordance with federal income tax regulations may differ in amount or character from net investment income and realized gains for financial reporting purposes. Financial reporting records are adjusted for permanent book/tax differences to reflect tax character but are not adjusted for temporary differences. The amount and character of tax-basis distributions and composition of net assets are finalized at fiscal year-end; accordingly, tax-basis balances have not been determined as of the date of this report.
The fund intends to retain realized gains to the extent of available capital loss carryforwards. Net realized capital losses may be carried forward indefinitely to offset future realized capital gains. As of October 31, 2014, the fund had $11,000 of available capital loss carryforwards.
At April 30, 2015, the cost of investments for federal income tax purposes was $47,904,000. Net unrealized gain aggregated $641,000 at period-end, of which $2,354,000 related to appreciated investments and $1,713,000 related to depreciated investments.
NOTE 5 - FOREIGN TAXES
The fund is subject to foreign income taxes imposed by certain countries in which it invests. Additionally, certain foreign currency transactions are subject to tax and capital gains realized upon disposition of securities issued in or by certain foreign countries and are subject to capital gains tax imposed by those countries. All taxes are computed in accordance with the applicable foreign tax law and, to the extent permitted, capital losses are used to offset capital gains. Taxes attributable to income are accrued by the fund as a reduction of income. Taxes incurred on the purchase of foreign currencies are recorded as realized loss on foreign currency transactions. Current and deferred tax expense attributable to capital gains is reflected as a component of realized or change in unrealized gain/loss on securities in the accompanying financial statements. At April 30, 2015, the fund had no deferred tax liability attributable to foreign securities and no foreign capital loss carryforwards.
NOTE 6 - RELATED PARTY TRANSACTIONS
The fund is managed by T. Rowe Price Associates, Inc. (Price Associates), a wholly owned subsidiary of T. Rowe Price Group, Inc. (Price Group). Price Associates has entered into a subadvisory agreement(s) with one or more of its wholly owned subsidiaries, to provide investment advisory services to the fund. The investment management agreement between the fund and Price Associates provides for an annual investment management fee equal to 1.10% of the fund’s average daily net assets. The fee is computed daily and paid monthly.
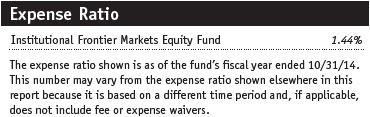
The fund is also subject to a contractual expense limitation through February 28, 2017. During the limitation period, Price Associates is required to waive its management fee and reimburse the fund for any expenses, excluding interest, taxes, brokerage commissions, and extraordinary expenses, that would otherwise cause the fund’s ratio of annualized total expenses to average net assets (expense ratio) to exceed its expense limitation of 1.35%. The fund is required to repay Price Associates for expenses previously reimbursed and management fees waived to the extent its net assets grow or expenses decline sufficiently to allow repayment without causing the fund’s expense ratio to exceed its expense limitation. However, no repayment will be made more than three years after the date of a reimbursement or waiver. Pursuant to this agreement, management fees in the amount of $82,000 were waived and expenses in the amount of $19,000 were reimbursed by Price Associates during the six months ended April 30, 2015. Including these amounts, management fees waived and expenses previously reimbursed by Price Associates in the amount of $145,000 remain subject to repayment by the fund at April 30, 2015.
In addition, the fund has entered into service agreements with Price Associates and a wholly owned subsidiary of Price Associates (collectively, Price). Price Associates computes the daily share price and provides certain other administrative services to the fund. T. Rowe Price Services, Inc., provides shareholder and administrative services in its capacity as the fund’s transfer and dividend-disbursing agent. For the six months ended April 30, 2015, expenses incurred pursuant to these service agreements were $73,000 for Price Associates and less than $1,000 for T. Rowe Price Services, Inc. The total amount payable at period-end pursuant to these service agreements is reflected as Due to Affiliates in the accompanying financial statements.
The fund may invest in the T. Rowe Price Reserve Investment Fund, the T. Rowe Price Government Reserve Investment Fund, or the T. Rowe Price Short-Term Reserve Fund (collectively, the Price Reserve Investment Funds), open-end management investment companies managed by Price Associates and considered affiliates of the fund. The Price Reserve Investment Funds are offered as short-term investment options to mutual funds, trusts, and other accounts managed by Price Associates or its affiliates and are not available for direct purchase by members of the public. The Price Reserve Investment Funds pay no investment management fees.
As of April 30, 2015, T. Rowe Price Group, Inc., or its wholly owned subsidiaries owned 2,520,186 shares of the fund, representing 45% of the fund’s net assets.
| Information on Proxy Voting Policies, Procedures, and Records |
A description of the policies and procedures used by T. Rowe Price funds and portfolios to determine how to vote proxies relating to portfolio securities is available in each fund’s Statement of Additional Information. You may request this document by calling 1-800-225-5132 or by accessing the SEC’s website, sec.gov.
The description of our proxy voting policies and procedures is also available on our website, troweprice.com. To access it, click on the words “Social Responsibility” at the top of our corporate homepage. Next, click on the words “Conducting Business Responsibly” on the left side of the page that appears. Finally, click on the words “Proxy Voting Policies” on the left side of the page that appears.
Each fund’s most recent annual proxy voting record is available on our website and through the SEC’s website. To access it through our website, follow the directions above to reach the “Conducting Business Responsibly” page. Click on the words “Proxy Voting Records” on the left side of that page, and then click on the “View Proxy Voting Records” link at the bottom of the page that appears.
| How to Obtain Quarterly Portfolio Holdings |
The fund files a complete schedule of portfolio holdings with the Securities and Exchange Commission for the first and third quarters of each fiscal year on Form N-Q. The fund’s Form N-Q is available electronically on the SEC’s website (sec.gov); hard copies may be reviewed and copied at the SEC’s Public Reference Room, 100 F St. N.E., Washington, DC 20549. For more information on the Public Reference Room, call 1-800-SEC-0330.
| Approval of Investment Management Agreement and Subadvisory Agreement |
On March 13, 2015, the fund’s Board of Directors (Board), including a majority of the fund’s independent directors, approved the continuation of the investment management agreement (Advisory Contract) between the fund and its investment advisor, T. Rowe Price Associates, Inc. (Advisor), as well as the continuation of the investment subadvisory agreement (Subadvisory Contract) that the Advisor has entered into with T. Rowe Price International Ltd (Subadvisor) on behalf of the fund. In connection with its deliberations, the Board requested, and the Advisor provided, such information as the Board (with advice from independent legal counsel) deemed reasonably necessary. The Board considered a variety of factors in connection with its review of the Advisory Contract and Subadvisory Contract, also taking into account information provided by the Advisor during the course of the year, as discussed below:
Services Provided by the Advisor and Subadvisor
The Board considered the nature, quality, and extent of the services provided to the fund by the Advisor and Subadvisor. These services included, but were not limited to, directing the fund’s investments in accordance with its investment program and the overall management of the fund’s portfolio, as well as a variety of related activities such as financial, investment operations, and administrative services; compliance; maintaining the fund’s records and registrations; and shareholder communications. The Board also reviewed the background and experience of the Advisor’s and Subadvisor’s senior management teams and investment personnel involved in the management of the fund, as well as the Advisor’s compliance record. The Board concluded that it was satisfied with the nature, quality, and extent of the services provided by the Advisor and Subadvisor.
Investment Performance of the Fund
The Board reviewed the fund’s three-month and since-inception returns and compared these returns with a wide variety of previously agreed-upon comparable performance measures and market data, including those supplied by Lipper and Morningstar, which are independent providers of mutual fund data.
On the basis of this evaluation and the Board’s ongoing review of investment results, and in light of the fund’s extremely limited operating history, the Board concluded that the fund’s performance was satisfactory.
Costs, Benefits, Profits, and Economies of Scale
The Board reviewed detailed information regarding the revenues received by the Advisor under the Advisory Contract and other benefits that the Advisor (and its affiliates, including the Subadvisor) may have realized from its relationship with the fund, including any research received under “soft dollar” agreements and commission-sharing arrangements with broker-dealers. The Board considered that the Advisor and Subadvisor may receive some benefit from soft-dollar arrangements pursuant to which research is received from broker-dealers that execute the applicable fund’s portfolio transactions. The Board received information on the estimated costs incurred and profits realized by the Advisor from managing T. Rowe Price mutual funds. While the Board did not review information regarding profits realized from managing the fund, in particular because the fund had not achieved sufficient scale to produce meaningful profit margin percentages, the Board concluded that the Advisor’s profits were reasonable in light of the services provided to the funds.
The Board also considered whether the fund benefits under the fee levels set forth in the Advisory Contract from any economies of scale realized by the Advisor. Under the Advisory Contract, the fund pays a fee to the Advisor for investment management services based on the fund’s average daily net assets, and the fund pays its own expenses of operations (subject to an expense limitation agreed to by the Advisor). Under the Subadvisory Contract, the Advisor may pay the Subadvisor up to 60% of the advisory fee that the Advisor receives from the fund. The Board concluded that the advisory fee structure for the fund continued to be appropriate.
Fees
The Board was provided with information regarding industry trends in management fees and expenses, and the Board reviewed the fund’s management fee rate, operating expenses, and total expense ratio in comparison with fees and expenses of other comparable funds based on information and data supplied by Lipper. The information provided to the Board indicated that the fund’s management fee rate and total expense ratio (after including management fee waivers and/or expenses paid by the Advisor pursuant to the expense limitation) were at or below the median for comparable funds.
The Board also reviewed the fee schedules for institutional accounts and private accounts with similar mandates that are advised or subadvised by the Advisor and its affiliates. Management provided the Board with information about the Advisor’s responsibilities and services provided to institutional account clients, including information about how the requirements and economics of the institutional business are fundamentally different from those of the mutual fund business. The Board considered information showing that the mutual fund business is generally more complex from a business and compliance perspective than the institutional business and that the Advisor generally performs significant additional services and assumes greater risk in managing the fund and other T. Rowe Price mutual funds than it does for institutional account clients.
On the basis of the information provided and the factors considered, the Board concluded that the fees paid by the fund under the Advisory Contract are reasonable.
Approval of the Advisory Contract and Subadvisory Contract
As noted, the Board approved the continuation of the Advisory Contract and Subadvisory Contract. No single factor was considered in isolation or to be determinative to the decision. Rather, the Board concluded, in light of a weighting and balancing of all factors considered, that it was in the best interests of the fund and its shareholders for the Board to approve the continuation of the Advisory Contract and Subadvisory Contract (including the fees to be charged for services thereunder). The independent directors were advised throughout the process by independent legal counsel.
Item 2. Code of Ethics.
A code of ethics, as defined in Item 2 of Form N-CSR, applicable to its principal executive officer, principal financial officer, principal accounting officer or controller, or persons performing similar functions is filed as an exhibit to the registrant’s annual Form N-CSR. No substantive amendments were approved or waivers were granted to this code of ethics during the registrant’s most recent fiscal half-year.
Item 3. Audit Committee Financial Expert.
Disclosure required in registrant’s annual Form N-CSR.
Item 4. Principal Accountant Fees and Services.
Disclosure required in registrant’s annual Form N-CSR.
Item 5. Audit Committee of Listed Registrants.
Not applicable.
Item 6. Investments.
(a) Not applicable. The complete schedule of investments is included in Item 1 of this Form N-CSR.
(b) Not applicable.
Item 7. Disclosure of Proxy Voting Policies and Procedures for Closed-End Management Investment Companies.
Not applicable.
Item 8. Portfolio Managers of Closed-End Management Investment Companies.
Not applicable.
Item 9. Purchases of Equity Securities by Closed-End Management Investment Company and Affiliated Purchasers.
Not applicable.
Item 10. Submission of Matters to a Vote of Security Holders.
Not applicable.
Item 11. Controls and Procedures.
(a) The registrant’s principal executive officer and principal financial officer have evaluated the registrant’s disclosure controls and procedures within 90 days of this filing and have concluded that the registrant’s disclosure controls and procedures were effective, as of that date, in ensuring that information required to be disclosed by the registrant in this Form N-CSR was recorded, processed, summarized, and reported timely.
(b) The registrant’s principal executive officer and principal financial officer are aware of no change in the registrant’s internal control over financial reporting that occurred during the registrant’s second fiscal quarter covered by this report that has materially affected, or is reasonably likely to materially affect, the registrant’s internal control over financial reporting.
Item 12. Exhibits.
(a)(1) The registrant’s code of ethics pursuant to Item 2 of Form N-CSR is filed with the registrant’s annual Form N-CSR.
(2) Separate certifications by the registrant's principal executive officer and principal financial officer, pursuant to Section 302 of the Sarbanes-Oxley Act of 2002 and required by Rule 30a-2(a) under the Investment Company Act of 1940, are attached.
(3) Written solicitation to repurchase securities issued by closed-end companies: not applicable.
(b) A certification by the registrant's principal executive officer and principal financial officer, pursuant to Section 906 of the Sarbanes-Oxley Act of 2002 and required by Rule 30a-2(b) under the Investment Company Act of 1940, is attached.
SIGNATURES
Pursuant to the requirements of the Securities Exchange Act of 1934 and the Investment Company Act of 1940, the registrant has duly caused this report to be signed on its behalf by the undersigned, thereunto duly authorized.
T. Rowe Price Institutional International Funds, Inc.
| By | /s/ Edward C. Bernard |
| | Edward C. Bernard |
| | Principal Executive Officer |
| | |
| Date June 16, 2015 | | |
Pursuant to the requirements of the Securities Exchange Act of 1934 and the Investment Company Act of 1940, this report has been signed below by the following persons on behalf of the registrant and in the capacities and on the dates indicated.
| By | /s/ Edward C. Bernard |
| | Edward C. Bernard |
| | Principal Executive Officer |
| | |
| Date June 16, 2015 | | |
| | |
| | |
| By | /s/ Gregory K. Hinkle |
| | Gregory K. Hinkle |
| | Principal Financial Officer |
| | |
| Date June 16, 2015 | | |