UNITED STATES
SECURITIES AND EXCHANGE COMMISSION
Washington, D.C. 20549
FORM N-CSR
CERTIFIED SHAREHOLDER REPORT OF REGISTERED
MANAGEMENT INVESTMENT COMPANIES
Investment Company Act File Number: 811-05833
| T. Rowe Price Institutional International Funds, Inc. |
|
| (Exact name of registrant as specified in charter) |
| |
| 100 East Pratt Street, Baltimore, MD 21202 |
|
| (Address of principal executive offices) |
| |
| David Oestreicher |
| 100 East Pratt Street, Baltimore, MD 21202 |
|
| (Name and address of agent for service) |
Registrant’s telephone number, including area code: (410) 345-2000
Date of fiscal year end: October 31
Date of reporting period: April 30, 2016
Item 1. Report to Shareholders
Institutional International Growth
Equity Fund | April 30, 2016 |
| ● | International stocks were volatile and posted losses in the past six months. |
| |
| ● | The Institutional International Growth Equity Fund declined 1.42% during the six-month period ended April 30, 2016, performing in line with its MSCI benchmark. |
| |
| ● | We are focused on buying and holding growth companies with durable franchises that can generate stable earnings and cash flow at a double-digit rate over the long term. |
| |
| ● | We are finding high-quality companies with attractive growth prospects, although economic growth in many markets remains modest. |
The views and opinions in this report were current as of April 30, 2016. They are not guarantees of performance or investment results and should not be taken as investment advice. Investment decisions reflect a variety of factors, and the managers reserve the right to change their views about individual stocks, sectors, and the markets at any time. As a result, the views expressed should not be relied upon as a forecast of the fund’s future investment intent. The report is certified under the Sarbanes-Oxley Act, which requires mutual funds and other public companies to affirm that, to the best of their knowledge, the information in their financial reports is fairly and accurately stated in all material respects.
Manager’s Letter
T. Rowe Price Institutional International Growth Equity Fund
Dear Investor
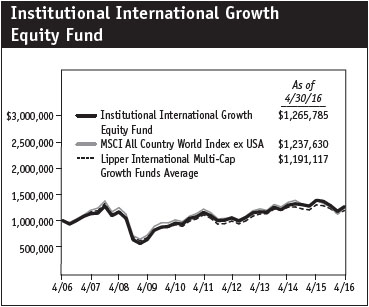
International stocks were volatile in the six months ended April 30, 2016. Equities produced mixed performance across regions, countries, and sectors. For the period, the portfolio generated about the same return as our benchmark, the MSCI All Country World Index ex USA, and outperformed its Lipper peer group average. We continue to identify high-quality growth companies with superior products or services that are taking market share. Ideally, we want to buy these businesses when they are out of favor in the market for short-term cyclical reasons.
Performance Review
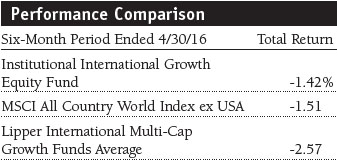
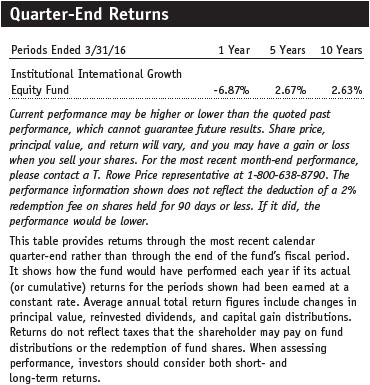
The Institutional International Growth Equity Fund returned -1.42% for the six-month period ended April 30, 2016. As shown in the Performance Comparison table, the portfolio performed in line with the MSCI All Country World Index ex USA and outperformed its Lipper peer group average. The portfolio’s results versus the MSCI index benefited from stock selection, especially in the information technology and consumer staples sectors. However, stock selection in the industrials and business services and financials sectors hurt relative results. Sector allocation decisions detracted from relative performance almost entirely because of our underweight allocations in the energy and materials sectors. We have been challenged to find stable growth companies that generate above-average cash flow in these areas. Your fund has generated positive excess returns versus the benchmark in the past 1-, 5-, and 10-year periods.
Market Environment
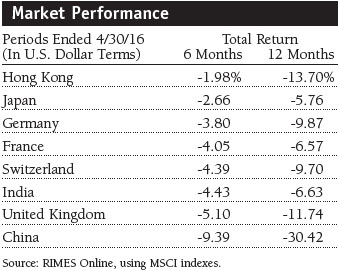
International equity markets endured a punishing sell-off in the first six weeks of 2016, and some markets dipped into correction territory in mid-February. Investors worried about a possible global recession, in part due to slowing growth in China. Those concerns were exacerbated by the struggling energy and commodity markets and weak growth in Europe and Japan. However, as the period progressed, economic data in the U.S., China, and Europe improved; the likelihood of a global recession dissipated; and most markets staged a strong recovery.
Emerging markets equities (which represented about 21% of the portfolio at the end of the period) held up better than developed markets over the past six months, helped by rebounding oil and commodity prices, U.S. dollar weakness, and subsiding worries surrounding China. The MSCI Emerging Markets Index was basically unchanged during the past six months.
Portfolio Review
Stock selection in the information technology sector generated a strong contribution to absolute and relative performance. Over the reporting period, we modestly added to our overweight allocation as we found solid growth companies at prices that we felt were overly punished in the early 2016 sell-off. Sweden-based Hexagon was among the portfolio’s top contributors. The precision measurement and visualization systems manufacturer has executed well by focusing on enhancing productivity for its customers and entering new markets such as automotive and electronics. One of the aspects we view as most positive is Hexagon’s ability to grow by offering compelling productivity solutions that are attractive to customers even in an environment of subdued economic growth. (Please refer to the portfolio of investments for a complete list of holdings and the amount each represents in the portfolio.)
Taiwan Semiconductor Manufacturing also produced strong gains. The stock rallied after the company announced that it would hike its dividend and on the subsequent good earnings and higher revenue guidance. We believe that the company will continue to increase its dividend as its capital needs decline. Our only addition to the IT sector in the period was Mobileye (Israel), which is an automotive supplier of active safety semiautonomous driving control capabilities. We took advantage of the sell-off early in the year to buy the stock near its low in January, and the shares rallied through the end of April. While the industry is rapidly evolving, we believe Mobileye is well positioned to capture the growth of the shift toward autonomous driving.
As with the energy and materials sectors, we have long maintained an underweight allocation to the consumer staples sector—because, like energy and materials, it lacks the growth characteristics we prize. Although our position size hurt relative performance as the group rallied, our holdings performed well in aggregate against the benchmark. Japan Tobacco and Philip Morris International (U.S.) recorded solid gains as did food and staples retailer FamilyMart (Japan), which we eliminated at a good profit as our conviction in the company’s longer-term prospects waned. FamilyMart is embarking on a complex merger with a struggling competitor in Japan. This diversification will lead the company away from its focus on convenience stores and into the very competitive general merchandise business. While the merger could ultimately succeed, we felt the risk/reward metrics on this long-held investment had meaningfully changed, especially in the context of the strong share price performance.
We effectively swapped the proceeds from the sale of FamilyMart into Seven & I Holdings, another Japanese convenience store chain operator that has posted strong same-store sales and is taking market share. We built our position in Seven near its 52-week low. If Japan’s inflation rate rises, the company should benefit from topline growth. We think that improvements in corporate governance and cost efficiencies can drive rising returns over time.
Although financials represents the largest allocation in the fund and the benchmark, we have been challenged to find great growth companies. The sector has been hindered by the low interest rate environment, which crimps net interest margins, while regulatory concerns cast a shadow over investment banking profits. Stock selection in the banking, capital markets, and insurance industries hurt our absolute and relative performance. Our underweight allocation to the sector is largely driven by our minimal exposure to Japanese, Canadian, and Australian financials, where we have struggled to find attractive risk/reward opportunities.
Although we had a few gainers in the banking segment, including emerging markets holdings Itau Unibanco (Brazil) and Turkiye Garanti Bankasi (Turkey), the punishing losses in Royal Bank of Scotland, Barclays (UK), Standard Chartered (UK), and others swamped our winners. Despite the recent losses, we added to the sector in the back half of the reporting period. We took a stake in Netherlands-based ING Groep, which is supported by its healthy capital position and boasts one of the highest yields (approximately 6.5%) among all European banks. The fundamentally sound bank reported fiscal 2015 results in February that showed improved asset quality, which has bolstered the bank’s capital position. We believe that ING has one of the stronger outlooks for sustainable growth among European banks, even in a low interest rate environment, via its low-cost ING Direct business in several large markets, such as Germany. We made smaller additions to Grupo Financiero Santander Mexico, Banco Bilbao Vizcaya Argentaria, and Royal Bank of Scotland. Late in the reporting period, we eliminated Sberbank (Russia) at a loss. We also trimmed our stake in Toronto-Dominion Bank, at a small profit, because of its ties to Canada’s resource-dependent economy.
We believe that the health care sector offers solid relative value, and we made several additions to our overweight position. Our recent purchases include LivaNova (UK), which was recently created through the merger of U.S.-based Cyberonics and Italy-based Sorin, and Shire (UK) shortly after it announced a deal to acquire Baxalta in January. We believe LivaNova offers attractive growth, driven by the company’s leading position in devices for epilepsy and synergies resulting from the merger. In our view, Shire should also benefit from merger synergies and several exciting pipeline opportunities and should post robust earnings and revenue growth after the Baxalta acquisition is completed. The shares have been pressured, in part, by technical factors related to the acquisition. As time passes, these will fade and the market will once again focus on the fundamental value.
However, we lost confidence (and money) in our investment thesis for South Africa-based Aspen Pharmacare Holdings. We eliminated the holding because we became concerned about our ability to assess how much of the stock’s performance was being driven by the pharmaceutical business versus the increasingly complex non-drug business, the impact of foreign currency exchange, and leverage. Valeant Pharmaceuticals International (Canada) weighed significantly on performance. Its stock tumbled after management announced a delay in reporting fourth-quarter earnings and scrapped its previous financial guidance, as well as on concerns about an investigation by the Securities and Exchange Commission. The stock continued to slide after management released weaker-than-expected fourth-quarter results and lowered its revenue and earnings targets for 2016.
We are finding solid growth companies in the industrials and business services sector. Equipment suppliers Mitsubishi Electric (Japan) and Schneider Electric (France) performed well, as did Brambles (Australia), a logistics company that specializes in pallets, crates, and containers. However, we endured large losses in UK business process outsourcing company Capita. Its stock fell after the release of year-end results that led to concerns about the quality of its earnings, cash flow generation ability, and organic growth. British low-cost airline operator easyJet declined sharply due to lower bookings after the terrorist attacks in Paris and Egypt. Investors turned lukewarm on the stock because of the uncertain summer air travel outlook, questions about the company’s ability to cut expenses given potentially lower passenger bookings, and concerns about Britain’s June 23 vote on whether to remain in the European Union. In both Capita and easyJet, we believe the headwinds are temporary and that the management teams are pursuing a sound strategy that will become evident with time.
Outlook
We are confident that global economic growth will remain modestly positive and that stock prices are currently pricing in less growth than we envision. Within this volatile environment, we remain focused on finding high-quality growth companies that we feel are “mispriced” by the market. Given the swings of the past six months, this approach has allowed us to add to both cyclical sectors, such as financials, and defensive sectors, such as health care, as the market’s view of global growth oscillated between concern and complacency. Most recently, with the current rhetoric from the U.S. election campaigns damaging sentiment, we have used the underperformance of the health care sector to add to positions in some of our favorite long-term holdings.
European economic growth forecasts remain tepid, which could crimp corporate revenues and earnings. We remain focused on companies in the region that can generate steady revenue, earnings, and cash flow growth. Often these opportunities present themselves in companies where the management teams have a strong history of capital allocation to drive growth—through acquisitions or share repurchases—which helps in periods of slower economic growth. In our view, the macroeconomic environment in Japan is similarly challenging, and the lack of growth and ineffectiveness of structural reform are worrisome. Although the stimulus efforts spawned under Prime Minister Shinzo Abe appear to be losing effectiveness, we continue to find select Japanese companies with above-average growth prospects trading at attractive valuations.
Emerging markets remain a disparate asset class in terms of economic performance, as some have suffered from the commodity downturn while others have benefited. Despite the difficult backdrop and poor longer-term performance, we continue to find good opportunities at the individual stock level, and, in general, we are pleased with how the companies we own are navigating the turbulence. However, the sharp bounceback in several emerging markets, such as Brazil, has reduced the attractive opportunity set we found a year ago. Many of our emerging markets holdings generated solid growth and among the highest returns on capital in the entire portfolio. Despite the difficult market environment, we believe that there are good long-term opportunities for stock pickers in emerging markets.
At the end of the day, we are bottom-up investors, focused on finding the best companies that we believe can continue to post durable growth over the coming years. We utilize a top-down overlay to complement our stock selection process, but we are convinced that our best insights will come at the company level, rather than trying to anticipate headline events.
As always, we will continue to work diligently on your behalf. Thank you for your support and confidence in T. Rowe Price.
Respectfully submitted,

Richard N. Clattenburg
Chairman of the Investment Advisory Committee
May 16, 2016
The committee chairman has day-to-day responsibility for managing the portfolio and works with committee members in developing and executing the fund’s investment program.
| Risks of International Investing |
Funds that invest overseas generally carry more risk than funds that invest strictly in U.S. assets. Funds investing in a single country or in a limited geographic region tend to be riskier than more diversified funds. Risks can result from varying stages of economic and political development; differing regulatory environments, trading days, and accounting standards; and higher transaction costs of non-U.S. markets. Non-U.S. investments are also subject to currency risk, or a decline in the value of a foreign currency versus the U.S. dollar, which reduces the dollar value of securities denominated in that currency.
Lipper averages: The averages of available mutual fund performance returns for specified periods in categories defined by Lipper Inc.
MSCI All Country World Index ex USA: An index that measures equity market performance of developed and emerging countries, excluding the U.S.
MSCI Emerging Markets Index: A capitalization-weighted index of stocks from 26 emerging market countries that only includes securities that may be traded by foreign investors.
Note: MSCI makes no express or implied warranties or representations and shall have no liability whatsoever with respect to any MSCI data contained herein. The MSCI data may not be further redistributed or used as a basis for other indices or any securities or financial products. This report is not approved, reviewed, or produced by MSCI.
Portfolio Highlights

Performance and Expenses
T. Rowe Price Institutional International Growth Equity Fund
This chart shows the value of a hypothetical $1 million investment in the fund over the past 10 fiscal year periods or since inception (for funds lacking 10-year records). The result is compared with benchmarks, which may include a broad-based market index and a peer group average or index. Market indexes do not include expenses, which are deducted from fund returns as well as mutual fund averages and indexes.

Fund Expense Example
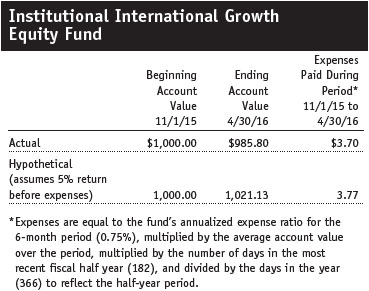
As a mutual fund shareholder, you may incur two types of costs: (1) transaction costs, such as redemption fees or sales loads, and (2) ongoing costs, including management fees, distribution and service (12b-1) fees, and other fund expenses. The following example is intended to help you understand your ongoing costs (in dollars) of investing in the fund and to compare these costs with the ongoing costs of investing in other mutual funds. The example is based on an investment of $1,000 invested at the beginning of the most recent six-month period and held for the entire period.
Actual Expenses
The first line of the following table (Actual) provides information about actual account values and actual expenses. You may use the information on this line, together with your account balance, to estimate the expenses that you paid over the period. Simply divide your account value by $1,000 (for example, an $8,600 account value divided by $1,000 = 8.6), then multiply the result by the number on the first line under the heading “Expenses Paid During Period” to estimate the expenses you paid on your account during this period.
Hypothetical Example for Comparison Purposes
The information on the second line of the table (Hypothetical) is based on hypothetical account values and expenses derived from the fund’s actual expense ratio and an assumed 5% per year rate of return before expenses (not the fund’s actual return). You may compare the ongoing costs of investing in the fund with other funds by contrasting this 5% hypothetical example and the 5% hypothetical examples that appear in the shareholder reports of the other funds. The hypothetical account values and expenses may not be used to estimate the actual ending account balance or expenses you paid for the period.
You should also be aware that the expenses shown in the table highlight only your ongoing costs and do not reflect any transaction costs, such as redemption fees or sales loads. Therefore, the second line of the table is useful in comparing ongoing costs only and will not help you determine the relative total costs of owning different funds. To the extent a fund charges transaction costs, however, the total cost of owning that fund is higher.

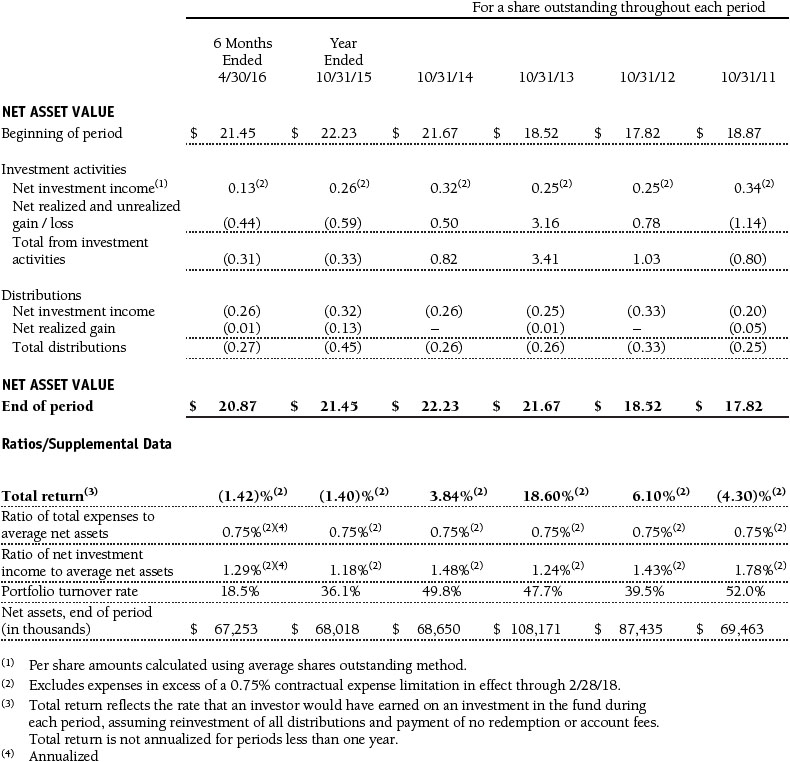
Financial Highlights
T. Rowe Price Institutional International Growth Equity Fund
(Unaudited)
The accompanying notes are an integral part of these financial statements.
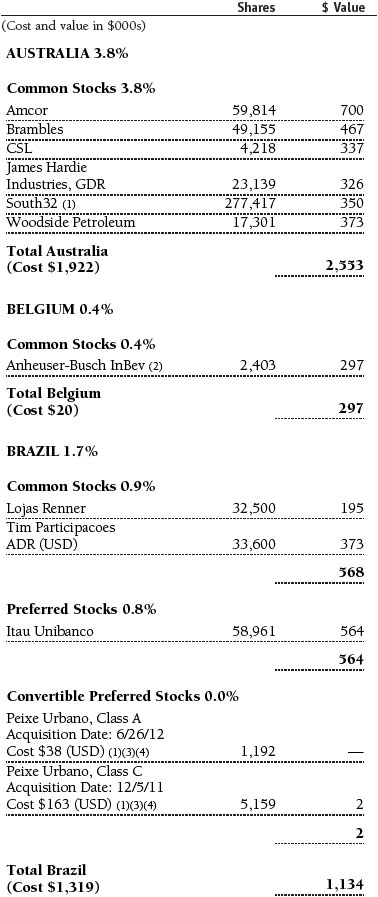
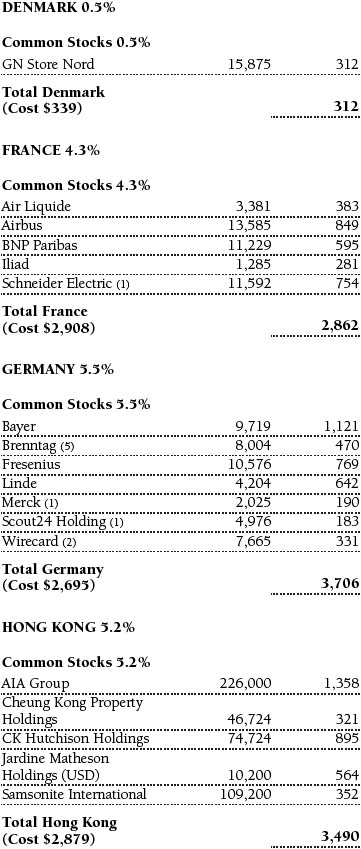
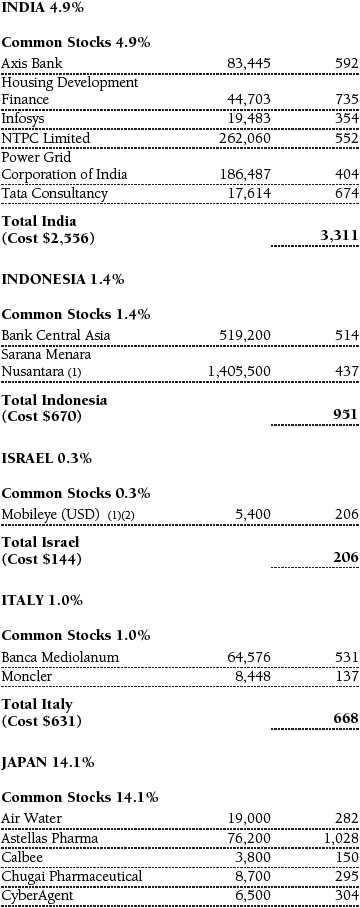
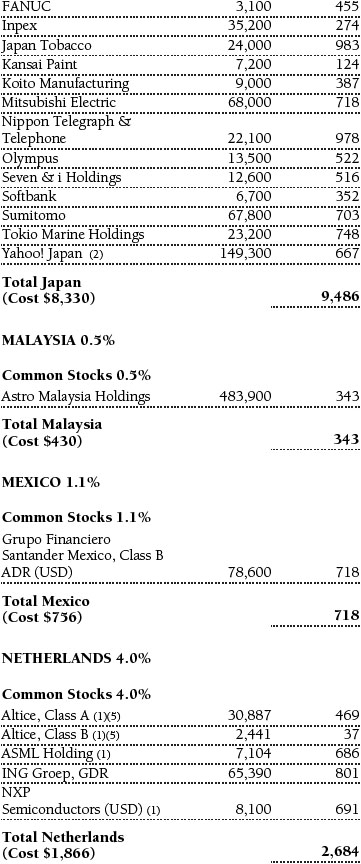
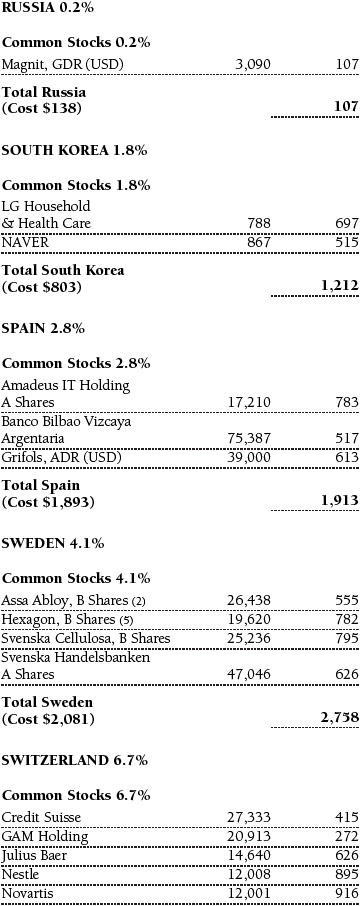
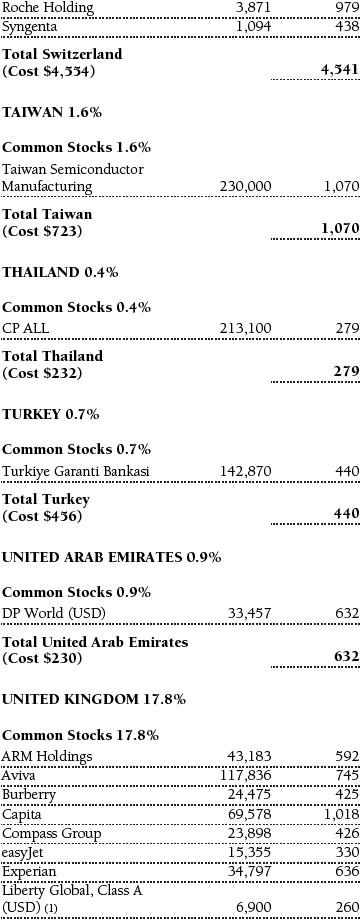
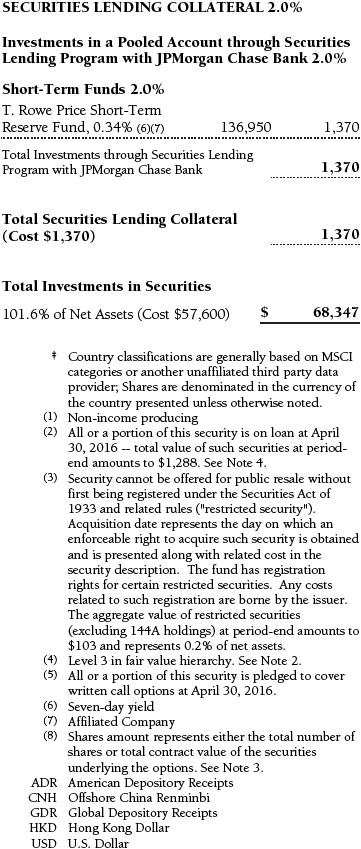
Portfolio of Investments‡
T. Rowe Price Institutional International Growth Equity Fund
April 30, 2016 (Unaudited)


The accompanying notes are an integral part of these financial statements.
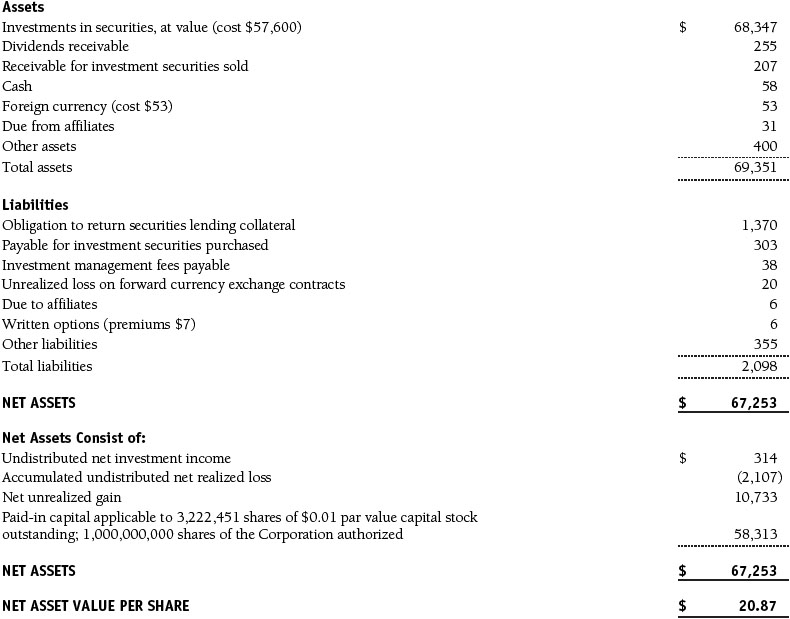
Statement of Assets and Liabilities
T. Rowe Price Institutional International Growth Equity Fund
April 30, 2016 (Unaudited)
($000s, except shares and per share amounts)
The accompanying notes are an integral part of these financial statements.
Statement of Operations
T. Rowe Price Institutional International Growth Equity Fund
(Unaudited)
($000s)

The accompanying notes are an integral part of these financial statements.
Statement of Changes in Net Assets
T. Rowe Price Institutional International Growth Equity Fund
(Unaudited)
($000s)

The accompanying notes are an integral part of these financial statements.
Notes to Financial Statements
T. Rowe Price Institutional International Growth Equity Fund
April 30, 2016 (Unaudited)
T. Rowe Price Institutional International Funds, Inc. (the corporation), is registered under the Investment Company Act of 1940 (the 1940 Act). The Institutional International Growth Equity Fund (the fund) is a diversified, open-end management investment company established by the corporation. The fund incepted on September 7, 1989. The fund seeks long-term growth of capital through investments primarily in the common stocks of established, non-U.S. companies.
NOTE 1 - SIGNIFICANT ACCOUNTING POLICIES
Basis of Preparation The fund is an investment company and follows accounting and reporting guidance in the Financial Accounting Standards Board (FASB) Accounting Standards Codification Topic 946 (ASC 946). The accompanying financial statements were prepared in accordance with accounting principles generally accepted in the United States of America (GAAP), including, but not limited to, ASC 946. GAAP requires the use of estimates made by management. Management believes that estimates and valuations are appropriate; however, actual results may differ from those estimates, and the valuations reflected in the accompanying financial statements may differ from the value ultimately realized upon sale or maturity.
Investment Transactions, Investment Income, and Distributions Income and expenses are recorded on the accrual basis. Dividends received from mutual fund investments are reflected as dividend income; capital gain distributions, if any, are reflected as realized gain/loss. Dividend income and capital gain distributions are recorded on the ex-dividend date. Income tax-related interest and penalties, if incurred, would be recorded as income tax expense. Investment transactions are accounted for on the trade date. Realized gains and losses are reported on the identified cost basis. Income distributions are declared and paid annually. Distribution to shareholders are recorded on the ex-dividend date. Capital gain distributions, if any, are generally declared and paid by the fund annually.
Currency Translation Assets, including investments, and liabilities denominated in foreign currencies are translated into U.S. dollar values each day at the prevailing exchange rate, using the mean of the bid and asked prices of such currencies against U.S. dollars as quoted by a major bank. Purchases and sales of securities, income, and expenses are translated into U.S. dollars at the prevailing exchange rate on the date of the transaction. The effect of changes in foreign currency exchange rates on realized and unrealized security gains and losses is reflected as a component of security gains and losses.
Redemption Fees A 2% fee is assessed on redemptions of fund shares held for 90 days or less to deter short-term trading and to protect the interests of long-term shareholders. Redemption fees are withheld from proceeds that shareholders receive from the sale or exchange of fund shares. The fees are paid to the fund and are recorded as an increase to paid-in capital. The fees may cause the redemption price per share to differ from the net asset value per share.
New Accounting Guidance In May 2015, FASB issued ASU No. 2015-07, Fair Value Measurement (Topic 820), Disclosures for Investments in Certain Entities That Calculate Net Asset Value per Share (or Its Equivalent). The ASU removes the requirement to categorize within the fair value hierarchy all investments for which fair value is measured using the net asset value per share practical expedient and amends certain disclosure requirements for such investments. The ASU is effective for interim and annual reporting periods beginning after December 15, 2015. Adoption will have no effect on the fund’s net assets or results of operations.
NOTE 2 - VALUATION
The fund’s financial instruments are valued and its net asset value (NAV) per share is computed at the close of the New York Stock Exchange (NYSE), normally 4 p.m. ET, each day the NYSE is open for business.
Fair Value The fund’s financial instruments are reported at fair value, which GAAP defines as the price that would be received to sell an asset or paid to transfer a liability in an orderly transaction between market participants at the measurement date. The T. Rowe Price Valuation Committee (the Valuation Committee) has been established by the fund’s Board of Directors (the Board) to ensure that financial instruments are appropriately priced at fair value in accordance with GAAP and the 1940 Act. Subject to oversight by the Board, the Valuation Committee develops and oversees pricing-related policies and procedures and approves all fair value determinations. Specifically, the Valuation Committee establishes procedures to value securities; determines pricing techniques, sources, and persons eligible to effect fair value pricing actions; oversees the selection, services, and performance of pricing vendors; oversees valuation-related business continuity practices; and provides guidance on internal controls and valuation-related matters. The Valuation Committee reports to the Board and has representation from legal, portfolio management and trading, operations, risk management, and the fund’s treasurer.
Various valuation techniques and inputs are used to determine the fair value of financial instruments. GAAP establishes the following fair value hierarchy that categorizes the inputs used to measure fair value:
Level 1 – quoted prices (unadjusted) in active markets for identical financial instruments that the fund can access at the reporting date
Level 2 – inputs other than Level 1 quoted prices that are observable, either directly or indirectly (including, but not limited to, quoted prices for similar financial instruments in active markets, quoted prices for identical or similar financial instruments in inactive markets, interest rates and yield curves, implied volatilities, and credit spreads)
Level 3 – unobservable inputs
Observable inputs are developed using market data, such as publicly available information about actual events or transactions, and reflect the assumptions that market participants would use to price the financial instrument. Unobservable inputs are those for which market data are not available and are developed using the best information available about the assumptions that market participants would use to price the financial instrument. GAAP requires valuation techniques to maximize the use of relevant observable inputs and minimize the use of unobservable inputs. When multiple inputs are used to derive fair value, the financial instrument is assigned to the level within the fair value hierarchy based on the lowest-level input that is significant to the fair value of the financial instrument. Input levels are not necessarily an indication of the risk or liquidity associated with financial instruments at that level but rather the degree of judgment used in determining those values.
Valuation Techniques Equity securities listed or regularly traded on a securities exchange or in the over-the-counter (OTC) market are valued at the last quoted sale price or, for certain markets, the official closing price at the time the valuations are made. OTC Bulletin Board securities are valued at the mean of the closing bid and asked prices. A security that is listed or traded on more than one exchange is valued at the quotation on the exchange determined to be the primary market for such security. Listed securities not traded on a particular day are valued at the mean of the closing bid and asked prices for domestic securities and the last quoted sale or closing price for international securities.
For valuation purposes, the last quoted prices of non-U.S. equity securities may be adjusted to reflect the fair value of such securities at the close of the NYSE. If the fund determines that developments between the close of a foreign market and the close of the NYSE will, in its judgment, materially affect the value of some or all of its portfolio securities, the fund will adjust the previous quoted prices to reflect what it believes to be the fair value of the securities as of the close of the NYSE. In deciding whether it is necessary to adjust quoted prices to reflect fair value, the fund reviews a variety of factors, including developments in foreign markets, the performance of U.S. securities markets, and the performance of instruments trading in U.S. markets that represent foreign securities and baskets of foreign securities. The fund may also fair value securities in other situations, such as when a particular foreign market is closed but the fund is open. The fund uses outside pricing services to provide it with quoted prices and information to evaluate or adjust those prices. The fund cannot predict how often it will use quoted prices and how often it will determine it necessary to adjust those prices to reflect fair value. As a means of evaluating its security valuation process, the fund routinely compares quoted prices, the next day’s opening prices in the same markets, and adjusted prices.
Actively traded equity securities listed on a domestic exchange generally are categorized in Level 1 of the fair value hierarchy. Non-U.S. equity securities generally are categorized in Level 2 of the fair value hierarchy despite the availability of quoted prices because, as described above, the fund evaluates and determines whether those quoted prices reflect fair value at the close of the NYSE or require adjustment. OTC Bulletin Board securities, certain preferred securities, and equity securities traded in inactive markets generally are categorized in Level 2 of the fair value hierarchy.
Investments in mutual funds are valued at the mutual fund’s closing NAV per share on the day of valuation and are categorized in Level 1 of the fair value hierarchy. Listed options, and OTC options with a listed equivalent, are valued at the mean of the closing bid and asked prices and generally are categorized in Level 2 of the fair value hierarchy. Forward currency exchange contracts are valued using the prevailing forward exchange rate and are categorized in Level 2 of the fair value hierarchy. Assets and liabilities other than financial instruments, including short-term receivables and payables, are carried at cost, or estimated realizable value, if less, which approximates fair value.
Thinly traded financial instruments and those for which the above valuation procedures are inappropriate or are deemed not to reflect fair value are stated at fair value as determined in good faith by the Valuation Committee. The objective of any fair value pricing determination is to arrive at a price that could reasonably be expected from a current sale. Financial instruments fair valued by the Valuation Committee are primarily private placements, restricted securities, warrants, rights, and other securities that are not publicly traded.
Subject to oversight by the Board, the Valuation Committee regularly makes good faith judgments to establish and adjust the fair valuations of certain securities as events occur and circumstances warrant. For instance, in determining the fair value of an equity investment with limited market activity, such as a private placement or a thinly traded public company stock, the Valuation Committee considers a variety of factors, which may include, but are not limited to, the issuer’s business prospects, its financial standing and performance, recent investment transactions in the issuer, new rounds of financing, negotiated transactions of significant size between other investors in the company, relevant market valuations of peer companies, strategic events affecting the company, market liquidity for the issuer, and general economic conditions and events. In consultation with the investment and pricing teams, the Valuation Committee will determine an appropriate valuation technique based on available information, which may include both observable and unobservable inputs. The Valuation Committee typically will afford greatest weight to actual prices in arm’s length transactions, to the extent they represent orderly transactions between market participants, transaction information can be reliably obtained, and prices are deemed representative of fair value. However, the Valuation Committee may also consider other valuation methods such as market-based valuation multiples; a discount or premium from market value of a similar, freely traded security of the same issuer; or some combination. Fair value determinations are reviewed on a regular basis and updated as information becomes available, including actual purchase and sale transactions of the issue. Because any fair value determination involves a significant amount of judgment, there is a degree of subjectivity inherent in such pricing decisions, and fair value prices determined by the Valuation Committee could differ from those of other market participants. Depending on the relative significance of unobservable inputs, including the valuation technique(s) used, fair valued securities may be categorized in Level 2 or 3 of the fair value hierarchy.
Valuation Inputs The following table summarizes the fund’s financial instruments, based on the inputs used to determine their fair values on April 30, 2016:

There were no material transfers between Levels 1 and 2 during the six months ended April 30, 2016.
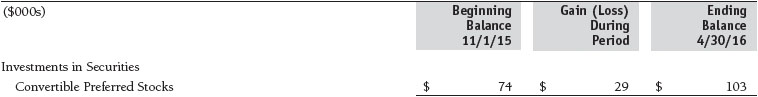
Following is a reconciliation of the fund’s Level 3 holdings for the six months ended April 30, 2016. Gain (loss) reflects both realized and change in unrealized gain/loss on Level 3 holdings during the period, if any, and is included on the accompanying Statement of Operations. The change in unrealized gain/loss on Level 3 instruments held at April 30, 2016, totaled $29,000 for the six months ended April 30, 2016.
NOTE 3 - DERIVATIVE INSTRUMENTS
During the six months ended April 30, 2016, the fund invested in derivative instruments. As defined by GAAP, a derivative is a financial instrument whose value is derived from an underlying security price, foreign exchange rate, interest rate, index of prices or rates, or other variable; it requires little or no initial investment and permits or requires net settlement. The fund invests in derivatives only if the expected risks and rewards are consistent with its investment objectives, policies, and overall risk profile, as described in its prospectus and Statement of Additional Information. The fund may use derivatives for a variety of purposes, such as seeking to hedge against declines in principal value, increase yield, invest in an asset with greater efficiency and at a lower cost than is possible through direct investment, or to adjust credit exposure. The risks associated with the use of derivatives are different from, and potentially much greater than, the risks associated with investing directly in the instruments on which the derivatives are based. The fund at all times maintains sufficient cash reserves, liquid assets, or other SEC-permitted asset types to cover its settlement obligations under open derivative contracts.
The fund values its derivatives at fair value and recognizes changes in fair value currently in its results of operations. Accordingly, the fund does not follow hedge accounting, even for derivatives employed as economic hedges. Generally, the fund accounts for its derivatives on a gross basis. It does not offset the fair value of derivative liabilities against the fair value of derivative assets on its financial statements, nor does it offset the fair value of derivative instruments against the right to reclaim or obligation to return collateral.
The following table summarizes the fair value of the fund’s derivative instruments held as of April 30, 2016, and the related location on the accompanying Statement of Assets and Liabilities, presented by primary underlying risk exposure:

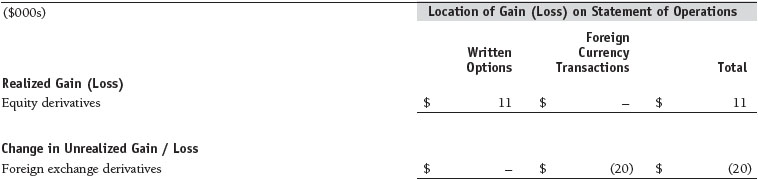
Additionally, the amount of gains and losses on derivative instruments recognized in fund earnings during the six months ended April 30, 2016, and the related location on the accompanying Statement of Operations is summarized in the following table by primary underlying risk exposure:
Counterparty Risk and Collateral The fund invests in derivatives, such as bilateral swaps, forward currency exchange contracts, or OTC options, that are transacted and settle directly with a counterparty (bilateral derivatives), and thereby expose the fund to counterparty risk. To mitigate this risk, the fund has entered into master netting arrangements (MNAs) with certain counterparties that permit net settlement under specified conditions and, for certain counterparties, also provide collateral agreements. MNAs may be in the form of International Swaps and Derivatives Association master agreements (ISDAs) or foreign exchange letter agreements (FX letters).
MNAs govern the ability to offset amounts the fund owes a counterparty against amounts the counterparty owes the fund (net settlement). Both ISDAs and FX letters generally allow net settlement in the event of contract termination and permit termination by either party prior to maturity upon the occurrence of certain stated events, such as failure to pay or bankruptcy. In addition, ISDAs specify other events, the occurrence of which would allow one of the parties to terminate. For example, a downgrade in credit rating of a counterparty would allow the fund to terminate while a decline in the fund’s net assets of more than a certain percentage would allow the counterparty to terminate. Upon termination, all bilateral derivatives with that counterparty would be liquidated and a net amount settled. ISDAs typically include collateral agreements whereas FX letters do not. Collateral requirements are determined based on the net aggregate unrealized gain or loss on all bilateral derivatives with each counterparty, subject to minimum transfer amounts that typically range from $100,000 to $250,000. Any additional collateral required due to changes in security values is transferred the next business day.
Collateral may be in the form of cash or debt securities issued by the U.S. government or related agencies. Cash and currencies posted by the fund are reflected as cash deposits in the accompanying financial statements and generally are restricted from withdrawal by the fund; securities posted by the fund are so noted in the accompanying Portfolio of Investments; both remain in the fund’s assets. Collateral pledged by counterparties is not included in the fund’s assets because the fund does not obtain effective control over those assets. For bilateral derivatives, collateral posted or received by the fund is held in a segregated account by the fund’s custodian. As of April 30, 2016, no collateral was pledged by either the fund or counterparties for bilateral derivatives.
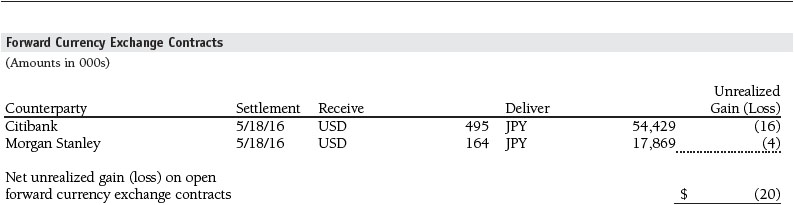
Forward Currency Exchange Contracts The fund is subject to foreign currency exchange rate risk in the normal course of pursuing its investment objectives. It uses forward currency exchange contracts (forwards) primarily to protect its non-U.S. dollar-denominated securities from adverse currency movements relative to the U.S. dollar. A forward involves an obligation to purchase or sell a fixed amount of a specific currency on a future date at a price set at the time of the contract. Although certain forwards may be settled by exchanging only the net gain or loss on the contract, most forwards are settled with the exchange of the underlying currencies in accordance with the specified terms. Forwards are valued at the unrealized gain or loss on the contract, which reflects the net amount the fund either is entitled to receive or obligated to deliver, as measured by the difference between the forward exchange rates at the date of entry into the contract and the forward rates at the reporting date. Appreciated forwards are reflected as assets and depreciated forwards are reflected as liabilities on the accompanying Statement of Assets and Liabilities. Risks related to the use of forwards include the possible failure of counterparties to meet the terms of the agreements; that anticipated currency movements will not occur, thereby reducing the fund’s total return; and the potential for losses in excess of the fund’s initial investment. During the six months ended April 30, 2016, the volume of the fund’s activity in forwards, based on underlying notional amounts, was generally between 0% and 2% of net assets.
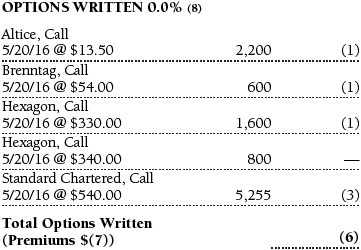
Options The fund is subject to equity price risk in the normal course of pursuing its investment objectives and uses options to help manage such risk. The fund may use options to manage exposure to security prices, interest rates, foreign currencies, and credit quality; as an efficient means of adjusting exposure to all or a part of a target market; to enhance income; as a cash management tool; or to adjust credit exposure. Options are included in net assets at fair value, purchased options are included in Investments in Securities, and written options are separately reflected as a liability on the accompanying Statement of Assets and Liabilities. Premiums on unexercised, expired options are recorded as realized gains or losses; premiums on exercised options are recorded as an adjustment to the proceeds from the sale or cost of the purchase. The difference between the premium and the amount received or paid in a closing transaction is also treated as realized gain or loss. In return for a premium paid, call and put options give the holder the right, but not the obligation, to purchase or sell, respectively, a security at a specified exercise price. Risks related to the use of options include possible illiquidity of the options markets; trading restrictions imposed by an exchange or counterparty; movements in the underlying asset values and, for written options, potential losses in excess of the fund’s initial investment. During the six months ended April 30, 2016, the volume of the fund’s activity in options, based on underlying notional amounts, was generally less than 1% of net assets. Transactions in written options and related premiums received during the six months ended April 30, 2016, were as follows:

NOTE 4 - OTHER INVESTMENT TRANSACTIONS
Consistent with its investment objective, the fund engages in the following practices to manage exposure to certain risks and/or to enhance performance. The investment objective, policies, program, and risk factors of the fund are described more fully in the fund’s prospectus and Statement of Additional Information.
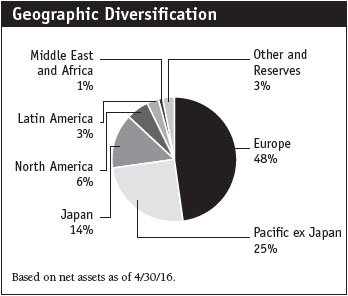
Emerging Markets The fund may invest, either directly or through investments in T. Rowe Price institutional funds, in securities of companies located in, issued by governments of, or denominated in or linked to the currencies of emerging market countries; at period-end, approximately 21% of the fund’s net assets were invested in emerging markets. Emerging markets generally have economic structures that are less diverse and mature, and political systems that are less stable, than developed countries. These markets may be subject to greater political, economic, and social uncertainty and differing regulatory environments that may potentially impact the fund’s ability to buy or sell certain securities or repatriate proceeds to U.S. dollars. Such securities are often subject to greater price volatility, less liquidity, and higher rates of inflation than U.S. securities.
Restricted Securities The fund may invest in securities that are subject to legal or contractual restrictions on resale. Prompt sale of such securities at an acceptable price may be difficult and may involve substantial delays and additional costs.
Securities Lending The fund may lend its securities to approved brokers to earn additional income. Its securities lending activities are administered by a lending agent in accordance with a securities lending agreement. Security loans generally do not have stated maturity dates, and the fund may recall a security at any time. The fund receives collateral in the form of cash or U.S. government securities, valued at 102% to 105% of the value of the securities on loan. Collateral is maintained over the life of the loan in an amount not less than the value of loaned securities; any additional collateral required due to changes in security values is delivered to the fund the next business day. Cash collateral is invested by the lending agent(s) in accordance with investment guidelines approved by fund management. Additionally, the lending agent indemnifies the fund against losses resulting from borrower default. Although risk is mitigated by the collateral and indemnification, the fund could experience a delay in recovering its securities and a possible loss of income or value if the borrower fails to return the securities, collateral investments decline in value, and the lending agent fails to perform. Securities lending revenue consists of earnings on invested collateral and borrowing fees, net of any rebates to the borrower, compensation to the lending agent, and other administrative costs. In accordance with GAAP, investments made with cash collateral are reflected in the accompanying financial statements, but collateral received in the form of securities is not. At April 30, 2016, the value of loaned securities was $1,288,000; the value of cash collateral and related investments was $1,370,000.
Other Purchases and sales of portfolio securities other than short-term securities aggregated $12,409,000 and $11,910,000, respectively, for the six months ended April 30, 2016.
NOTE 5 - FEDERAL INCOME TAXES
No provision for federal income taxes is required since the fund intends to continue to qualify as a regulated investment company under Subchapter M of the Internal Revenue Code and distribute to shareholders all of its taxable income and gains. Distributions determined in accordance with federal income tax regulations may differ in amount or character from net investment income and realized gains for financial reporting purposes. Financial reporting records are adjusted for permanent book/tax differences to reflect tax character but are not adjusted for temporary differences. The amount and character of tax-basis distributions and composition of net assets are finalized at fiscal year-end; accordingly, tax-basis balances have not been determined as of the date of this report.
The fund intends to retain realized gains to the extent of available capital loss carryforwards. Because the fund is required to use capital loss carryforwards that do not expire before those with expiration dates, all or a portion of its capital loss carryforwards subject to expiration could ultimately go unused. As of October 31, 2015, the fund had $1,725,000 of available capital loss carryforwards, which all expire in fiscal 2017.
At April 30, 2016, the cost of investments for federal income tax purposes was $57,930,000. Net unrealized gain aggregated $10,403,000 at period-end, of which $13,471,000 related to appreciated investments and $3,068,000 related to depreciated investments.
NOTE 6 - FOREIGN TAXES
The fund is subject to foreign income taxes imposed by certain countries in which it invests. Additionally, certain foreign currency transactions are subject to tax, and capital gains realized upon disposition of securities issued in or by certain foreign countries are subject to capital gains tax imposed by those countries. All taxes are computed in accordance with the applicable foreign tax law, and, to the extent permitted, capital losses are used to offset capital gains. Taxes attributable to income are accrued by the fund as a reduction of income. Taxes incurred on the purchase of foreign currencies are recorded as realized loss on foreign currency transactions. Current and deferred tax expense attributable to capital gains is reflected as a component of realized or change in unrealized gain/loss on securities in the accompanying financial statements. At April 30, 2016, the fund had no deferred tax liability attributable to foreign securities and $347,000 of foreign capital loss carryforwards, including $145,000 that expire in 2017, $89,000 that expire in 2018, $46,000 that expire in 2019, $52,000 that expire in 2020, $11,000 that expire in 2021 and $4,000 that expire in 2022.
NOTE 7 - RELATED PARTY TRANSACTIONS
The fund is managed by T. Rowe Price Associates, Inc. (Price Associates), a wholly owned subsidiary of T. Rowe Price Group, Inc. (Price Group). Price Associates has entered into a subadvisory agreement(s) with one or more of its wholly owned subsidiaries, to provide investment advisory services to the fund. The investment management agreement between the fund and Price Associates provides for an annual investment management fee equal to 70% of the fund’s average daily net assets. The fee is computed daily and paid monthly.
The fund is also subject to a contractual expense limitation through February 28, 2018. During the limitation period, Price Associates is required to waive its management fee and pay the fund for any expenses, excluding interest, taxes, brokerage commissions, and extraordinary expenses, that would otherwise cause the fund’s ratio of annualized total expenses to average net assets (expense ratio) to exceed its expense limitation of 0.75%. The fund is required to repay Price Associates for expenses previously waived/paid to the extent its net assets grow or expenses decline sufficiently to allow repayment without causing the fund’s expense ratio to exceed its expense limitation. However, no repayment will be made more than three years after the date of a payment or waiver. Pursuant to this agreement, $148,000 of expenses were waived/paid by Price Associates during the six months ended April 30, 2016. Including these amounts, expenses previously waived/paid by Price Associates in the amount of $546,000 remain subject to repayment by the fund at April 30, 2016.
In addition, the fund has entered into service agreements with Price Associates and a wholly owned subsidiary of Price Associates (collectively, Price). Price Associates provides certain accounting and administrative services to the fund. T. Rowe Price Services, Inc., provides shareholder and administrative services in its capacity as the fund’s transfer and dividend-disbursing agent. For the six months ended April 30, 2016, expenses incurred pursuant to these service agreements were $24,000 for Price Associates and less than $1,000 for T. Rowe Price Services, Inc. The total amount payable at period-end pursuant to these service agreements is reflected as Due to Affiliates in the accompanying financial statements.
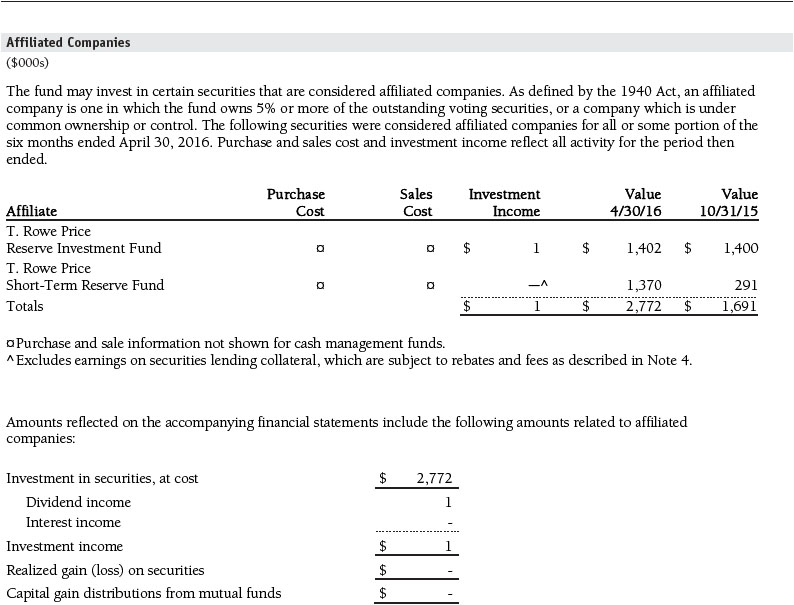
The fund may invest in the T. Rowe Price Reserve Investment Fund, the T. Rowe Price Government Reserve Investment Fund, or the T. Rowe Price Short-Term Reserve Fund (collectively, the Price Reserve Investment Funds), open-end management investment companies managed by Price Associates and considered affiliates of the fund. The Price Reserve Investment Funds are offered as short-term investment options to mutual funds, trusts, and other accounts managed by Price Associates or its affiliates and are not available for direct purchase by members of the public. The Price Reserve Investment Funds pay no investment management fees.
The fund may participate in securities purchase and sale transactions with other funds or accounts advised by Price Associates (cross trades), in accordance with procedures adopted by the fund’s Board and Securities and Exchange Commission rules, which require, among other things, that such purchase and sale cross trades be effected at the independent current market price of the security. During the six months ended April 30, 2016, the fund had no purchases or sales cross trades with other funds or accounts advised by Price Associates.
| Information on Proxy Voting Policies, Procedures, and Records |
A description of the policies and procedures used by T. Rowe Price funds and portfolios to determine how to vote proxies relating to portfolio securities is available in each fund’s Statement of Additional Information. You may request this document by calling 1-800-225-5132 or by accessing the SEC’s website, sec.gov.The description of our proxy voting policies and procedures is also available on our website, troweprice.com. To access it, click on the words “Social Responsibility” at the top of our corporate homepage. Next, click on the words “Conducting Business Responsibly” on the left side of the page that appears. Finally, click on the words “Proxy Voting Policies” on the left side of the page that appears.
Each fund’s most recent annual proxy voting record is available on our website and through the SEC’s website. To access it through our website, follow the directions above to reach the “Conducting Business Responsibly” page. Click on the words “Proxy Voting Records” on the left side of that page, and then click on the “View Proxy Voting Records” link at the bottom of the page that appears.
| How to Obtain Quarterly Portfolio Holdings |
The fund files a complete schedule of portfolio holdings with the Securities and Exchange Commission for the first and third quarters of each fiscal year on Form N-Q. The fund’s Form N-Q is available electronically on the SEC’s website (sec.gov); hard copies may be reviewed and copied at the SEC’s Public Reference Room, 100 F St. N.E., Washington, DC 20549. For more information on the Public Reference Room, call 1-800-SEC-0330.
| Approval of Investment Management Agreement and Subadvisory Agreement |
On March 11, 2016, the fund’s Board of Directors (Board), including a majority of the fund’s independent directors, approved the continuation of the investment management agreement (Advisory Contract) between the fund and its investment advisor, T. Rowe Price Associates, Inc. (Advisor), as well as the continuation of the investment subadvisory agreement (Subadvisory Contract) that the Advisor has entered into with T. Rowe Price International Ltd (Subadvisor) on behalf of the fund. In connection with its deliberations, the Board requested, and the Advisor provided, such information as the Board (with advice from independent legal counsel) deemed reasonably necessary. The Board considered a variety of factors in connection with its review of the Advisory Contract and Subadvisory Contract, also taking into account information provided by the Advisor during the course of the year, as discussed below:
Services Provided by the Advisor and Subadvisor
The Board considered the nature, quality, and extent of the services provided to the fund by the Advisor and Subadvisor. These services included, but were not limited to, directing the fund’s investments in accordance with its investment program and the overall management of the fund’s portfolio, as well as a variety of related activities such as financial, investment operations, and administrative services; compliance; maintaining the fund’s records and registrations; and shareholder communications. The Board also reviewed the background and experience of the Advisor’s and Subadvisor’s senior management teams and investment personnel involved in the management of the fund, as well as the Advisor’s compliance record. The Board concluded that it was satisfied with the nature, quality, and extent of the services provided by the Advisor and Subadvisor.
Investment Performance of the Fund
The Board reviewed the fund’s three-month, one-year, and year-by-year returns, as well as the fund’s average annualized total returns over the 3-, 5-, and 10-year periods, and compared these returns with a wide variety of previously agreed-upon comparable performance measures and market data, including those supplied by Lipper and Morningstar, which are independent providers of mutual fund data.
On the basis of this evaluation and the Board’s ongoing review of investment results, and factoring in the relative market conditions during certain of the performance periods, the Board concluded that the fund’s performance was satisfactory.
Costs, Benefits, Profits, and Economies of Scale
The Board reviewed detailed information regarding the revenues received by the Advisor under the Advisory Contract and other benefits that the Advisor (and its affiliates, including the Subadvisor) may have realized from its relationship with the fund, including any research received under “soft dollar” agreements and commission-sharing arrangements with broker-dealers. The Board considered that the Advisor and Subadvisor may receive some benefit from soft-dollar arrangements pursuant to which research is received from broker-dealers that execute the applicable fund’s portfolio transactions. The Board received information on the estimated costs incurred and profits realized by the Advisor from managing T. Rowe Price mutual funds. While the Board did not review information regarding profits realized from managing the fund in particular because the fund had not achieved sufficient scale to produce meaningful profit margin percentages, the Board concluded that the Advisor’s profits were reasonable in light of the services provided to the funds.
The Board also considered whether the fund benefits under the fee levels set forth in the Advisory Contract from any economies of scale realized by the Advisor. Under the Advisory Contract, the fund pays a fee to the Advisor for investment management services based on the fund’s average daily net assets and the fund pays its own expenses of operations (subject to an expense limitation agreed to by the Advisor). Under the Subadvisory Contract, the Advisor may pay the Subadvisor up to 60% of the advisory fee that the Advisor receives from the fund. The Board concluded that the advisory fee structure for the fund continued to be appropriate.
Fees
The Board was provided with information regarding industry trends in management fees and expenses, and the Board reviewed the fund’s management fee rate, operating expenses, and total expense ratio in comparison with fees and expenses of other comparable funds based on information and data supplied by Lipper. The information provided to the Board (after including fee waivers and/or expenses paid by the Advisor pursuant to the contractual expense limitation) indicated that the fund’s management fee rate and total expense ratio were below the median for comparable funds.
The Board also reviewed the fee schedules for institutional accounts and private accounts with similar mandates that are advised or subadvised by the Advisor and its affiliates. Management provided the Board with information about the Advisor’s responsibilities and services provided to subadvisory and other institutional account clients, including information about how the requirements and economics of the institutional business are fundamentally different from those of the mutual fund business. The Board considered information showing that the Advisor’s mutual fund business is generally more complex from a business and compliance perspective than its institutional account business, and considered various relevant factors, such as the broader scope of operations and oversight, more extensive shareholder communication infrastructure, greater asset flows, heightened business risks, and differences in applicable laws and regulations associated with the Advisor’s proprietary mutual fund business. In assessing the reasonableness of the fund’s management fee rate, the Board considered the differences in the nature of the services required for the Advisor to manage its mutual fund business versus managing a discrete pool of assets as a subadvisor to another institution’s mutual fund or for an institutional account, and that the Advisor generally performs significant additional services and assumes greater risk in managing the fund and other T. Rowe Price mutual funds than it does for institutional account clients.
On the basis of the information provided and the factors considered, the Board concluded that the fees paid by the fund under the Advisory Contract are reasonable.
Approval of the Advisory Contract and Subadvisory Contract
As noted, the Board approved the continuation of the Advisory Contract and Subadvisory Contract. No single factor was considered in isolation or to be determinative to the decision. Rather, the Board concluded, in light of a weighting and balancing of all factors considered, that it was in the best interests of the fund and its shareholders for the Board to approve the continuation of the Advisory Contract and Subadvisory Contract (including the fees to be charged for services thereunder). The independent directors were advised throughout the process by independent legal counsel.
Item 2. Code of Ethics.
A code of ethics, as defined in Item 2 of Form N-CSR, applicable to its principal executive officer, principal financial officer, principal accounting officer or controller, or persons performing similar functions is filed as an exhibit to the registrant’s annual Form N-CSR. No substantive amendments were approved or waivers were granted to this code of ethics during the registrant’s most recent fiscal half-year.
Item 3. Audit Committee Financial Expert.
Disclosure required in registrant’s annual Form N-CSR.
Item 4. Principal Accountant Fees and Services.
Disclosure required in registrant’s annual Form N-CSR.
Item 5. Audit Committee of Listed Registrants.
Not applicable.
Item 6. Investments.
(a) Not applicable. The complete schedule of investments is included in Item 1 of this Form N-CSR.
(b) Not applicable.
Item 7. Disclosure of Proxy Voting Policies and Procedures for Closed-End Management Investment Companies.
Not applicable.
Item 8. Portfolio Managers of Closed-End Management Investment Companies.
Not applicable.
Item 9. Purchases of Equity Securities by Closed-End Management Investment Company and Affiliated Purchasers.
Not applicable.
Item 10. Submission of Matters to a Vote of Security Holders.
Not applicable.
Item 11. Controls and Procedures.
(a) The registrant’s principal executive officer and principal financial officer have evaluated the registrant’s disclosure controls and procedures within 90 days of this filing and have concluded that the registrant’s disclosure controls and procedures were effective, as of that date, in ensuring that information required to be disclosed by the registrant in this Form N-CSR was recorded, processed, summarized, and reported timely.
(b) The registrant’s principal executive officer and principal financial officer are aware of no change in the registrant’s internal control over financial reporting that occurred during the registrant’s second fiscal quarter covered by this report that has materially affected, or is reasonably likely to materially affect, the registrant’s internal control over financial reporting.
Item 12. Exhibits.
(a)(1) The registrant’s code of ethics pursuant to Item 2 of Form N-CSR is filed with the registrant’s annual Form N-CSR.
(2) Separate certifications by the registrant's principal executive officer and principal financial officer, pursuant to Section 302 of the Sarbanes-Oxley Act of 2002 and required by Rule 30a-2(a) under the Investment Company Act of 1940, are attached.
(3) Written solicitation to repurchase securities issued by closed-end companies: not applicable.
(b) A certification by the registrant's principal executive officer and principal financial officer, pursuant to Section 906 of the Sarbanes-Oxley Act of 2002 and required by Rule 30a-2(b) under the Investment Company Act of 1940, is attached.
SIGNATURES
Pursuant to the requirements of the Securities Exchange Act of 1934 and the Investment Company Act of 1940, the registrant has duly caused this report to be signed on its behalf by the undersigned, thereunto duly authorized.
T. Rowe Price Institutional International Funds, Inc.
| By | /s/ Edward C. Bernard |
| | Edward C. Bernard |
| | Principal Executive Officer |
| | |
| Date June 16, 2016 | | |
Pursuant to the requirements of the Securities Exchange Act of 1934 and the Investment Company Act of 1940, this report has been signed below by the following persons on behalf of the registrant and in the capacities and on the dates indicated.
| By | /s/ Edward C. Bernard |
| | Edward C. Bernard |
| | Principal Executive Officer |
| | |
| Date June 16, 2016 | | |
| | |
| | |
| By | /s/ Catherine D. Mathews |
| | Catherine D. Mathews |
| | Principal Financial Officer |
| | |
| Date June 16, 2016 | | |