UNITED STATES
SECURITIES AND EXCHANGE COMMISSION
Washington, D.C. 20549
FORM N-CSR
CERTIFIED SHAREHOLDER REPORT OF REGISTERED
MANAGEMENT INVESTMENT COMPANIES
Investment Company Act File Number: 811-05833
| T. Rowe Price Institutional International Funds, Inc. |
|
| (Exact name of registrant as specified in charter) |
| |
| 100 East Pratt Street, Baltimore, MD 21202 |
|
| (Address of principal executive offices) |
| |
| David Oestreicher |
| 100 East Pratt Street, Baltimore, MD 21202 |
|
| (Name and address of agent for service) |
Registrant’s telephone number, including area code: (410) 345-2000
Date of fiscal year end: October 31
Date of reporting period: April 30, 2017
Item 1. Report to Shareholders
Institutional Frontier Markets
Equity Fund | April 30, 2017 |
| ● | Frontier equity markets produced strong returns in the six-month period ended April 30, 2017. |
| | |
| ● | Your fund outperformed the MSCI Frontier Markets Index by a solid margin, thanks to favorable stock selection in several countries, especially Kuwait, Vietnam, and Sri Lanka. |
| | |
| ● | Asia is our largest regional overweight versus the index; in contrast, we are underweighting the Middle East and Africa. Elsewhere, we like investment opportunities in Argentina, Romania, and Georgia. |
| | |
| ● | We have a positive near-term and long-term outlook for the frontier universe. Pakistan’s imminent move from the frontier to the emerging markets universe is a timely reminder of the great longer-term growth potential we see in many frontier countries. |
The views and opinions in this report were current as of April 30, 2017. They are not guarantees of performance or investment results and should not be taken as investment advice. Investment decisions reflect a variety of factors, and the managers reserve the right to change their views about individual stocks, sectors, and the markets at any time. As a result, the views expressed should not be relied upon as a forecast of the fund’s future investment intent. The report is certified under the Sarbanes-Oxley Act, which requires mutual funds and other public companies to affirm that, to the best of their knowledge, the information in their financial reports is fairly and accurately stated in all material respects.
Manager’s Letter
T. Rowe Price Institutional Frontier Markets Equity Fund
Dear Investor
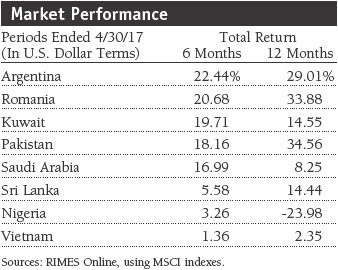
Frontier equity markets, as measured by the MSCI Frontier Markets Index, produced strong returns in the six-month period ended April 30, 2017. Asian frontier markets were led by Pakistan, where shares surged 18% ahead of the country’s return to the emerging markets universe on June 1, 2017. In the Middle East, Saudi Arabia and Kuwait climbed more than 16% as oil prices stabilized around $50 per barrel, helped by an OPEC production cut that took effect at the beginning of 2017. In frontier Europe, Romanian shares surged more than 20%, helped by one of the fastest-growing economies in the region. In Latin America, Argentine stocks advanced more than 22% as the economy showed signs of a recovery due to President Mauricio Macri’s ongoing reform efforts.
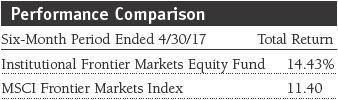
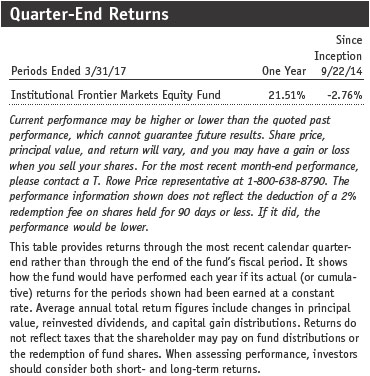
Your fund returned 14.43% in the first half of our fiscal year. As shown in the Performance Comparison table, the fund outperformed the MSCI Frontier Markets Index by a solid margin. Favorable stock selection in several countries, especially Kuwait, Vietnam, and Sri Lanka, contributed significantly to the fund’s outperformance.
Asia
Asia is our largest regional overweight versus the index, and we are emphasizing Vietnam, Pakistan, and Sri Lanka significantly versus the benchmark. We also own a few companies in Bangladesh, where BRAC Bank, whose mobile banking services are very popular, was a major contributor. We like Asian frontier markets because they offer strong economic growth, a growing consumer class, and quality companies with attractive valuations. (Please refer to the portfolio of investments for a list of holdings and the amount each represents in the portfolio.)
The Pakistani market surged 18% in the last six months. The country is returning to the emerging markets universe—for the first time since 2008—for all the right reasons. Significant improvements in its economic, political, and security backdrop in the last few years mean that a relatively volatile environment has evolved into a more stable one in which well-managed companies should be able to thrive. The more favorable business climate has been especially beneficial for Pakistani banks, and two of our strongest contributors to performance were Habib Bank and United Bank.
We decided to eliminate Hub Power and K-Electric: The former was hurt by reduced government subsidies that forced it to halt a number of utility projects, the latter received an offer from a Chinese firm to take a controlling stake. Although Pakistan is leaving the frontier universe, we expect to retain our remaining holdings until the investment thesis for each stock either runs its course or is fully reflected in valuation.
The Sri Lankan stock market rose more than 5% in the last six months. The economy is going through a period of adjustment as the government—which requested and received International Monetary Fund financial assistance in 2016—drives reforms in an attempt to reduce its fiscal deficit. Inflation has been pressing higher amid tax increases, a drought, and currency weakness, forcing the central bank to raise interest rates. On the plus side, tourism has been strong. The longer-term challenge is for Sri Lanka to shift its growth model so that the private sector leads, rather than the public sector through infrastructure spending.
Sri Lankan stocks are generally cheap, as the market has been out of favor with investors. While many of our holdings were lackluster, two of them produced noteworthy returns: Ceylon Cold Stores and John Keells Holdings. The former is a fast-growing grocery store operator and leading producer of ice cream and soft drinks. Earnings have been consistently strong, and we believe the company’s plans for increasing store openings, automation, and product innovation will bear fruit. We trimmed our Ceylon stake on strength in favor of its parent company, John Keells Holdings. This conglomerate, which also has assets in the property construction, insurance, and hotel industries, has a compelling growth trajectory but a cheap valuation. In addition, we believe a couple of new executives and future leaders will make better capital allocation decisions and act to unlock shareholder value with greater urgency.
The Vietnamese market returned slightly more than 1% in the last six months. Economic growth has been strong for several years, though it was a little weaker last year due to a drought that hurt the agricultural sector. The country has a current account surplus and does not seem to have suffered from any fallout from U.S. President Donald Trump’s decision to abandon the Trans-Pacific Partnership. Domestically, consumers are benefiting from rising wages and increased access to credit, but inflation is rising and the property market is showing signs of oversupply. We are watching these trends closely, with help from our emerging markets fixed income team, who are like weather forecasters when they warn us about approaching economic storm clouds. Several of our Vietnamese holdings should benefit over time from strong consumer activity, such as electronics retailer Mobile World Investment and Vietnam Dairy Products—both of which produced gains in the last six months.
Our Vietnamese bank stocks were mixed: Asia Commercial Bank/Vietnam did well, but Bank for Foreign Trade of Vietnam declined. Banks have underperformed the market in the last couple of years, but their earnings outlook is improving, so we anticipate better performance in the period ahead. Our highest-conviction Vietnamese bank is Military Commercial Joint Stock Bank, which recently reported better-than-expected earnings and edged higher in the last six months. This is one of the cheapest banks in the country, with perhaps the best liquidity and capital buffers in an industry where many banks are undercapitalized.
Middle East and Africa
While we have about one-third of the fund’s assets in the Middle East and Africa, we are underweighting this region versus the benchmark. Much of our exposure is in Kuwait and Saudi Arabia, with smaller allocations to various African countries.
At 11% of assets, Kuwait is not only one of our largest absolute country allocations, but also one of our largest underweights versus the index, as we are having difficulty finding well-managed companies there. Our position in National Bank of Kuwait, the country’s largest bank, continues to grow steadily and was one of our top contributors; the company has a strong capital position and an attractive valuation and dividend yield. We eliminated our stake in Kuwait Projects Company but added Humansoft Holding Company to the portfolio, and it was a solid contributor. The company owns and operates two educational institutions that are affiliated with Purdue University in the U.S. and should benefit from growth in private education. While the company partly depends on the Kuwaiti government, public education is sacrosanct in Kuwait, so cuts in education spending are unlikely, even in a weak oil price environment.
Saudi Arabia, which is not represented in our benchmark, accounted for about 8% of fund assets at the end of April. Banks are important investments, and we are encouraged by trends in the industry, such as balance sheet deleveraging, improving liquidity, and better-than-expected first-quarter earnings. Cheap valuations, attractive dividend yields, and rising U.S. interest rates—to which Saudi rates are tied—are additional positives. We particularly like Banque Saudi Fransi, which we added to the fund in the last six months, and we also have a stake in Samba Financial.
Hospital operator Al Mouwasat Medical Services was a good performer. The Saudi health ministry is planning to privatize all state-run hospitals by creating new companies to own and operate the medical facilities. In addition, there are plans for all Saudi nationals to be covered by health insurance prior to the privatizations. We believe this will be a positive catalyst for Bupa Arabia for Cooperative Insurance. A significant contributor to our six-month performance was food and dairy company Almarai, which was helped by expectations for an improving Saudi economy and a better outlook for its poultry operations. We took some profits from our Almarai stake and started a position in Savola, a food manufacturer and grocery store operator that has a sizable stake in Almarai and seemed more attractively valued. We also added Saudi Arabian Mining to the portfolio. The company focuses on gold, phosphate, and aluminum, and we believe it could benefit from the rising price of aluminum, especially as China seeks to reduce aluminum production in an effort to control pollution.
In sub-Saharan Africa, Nigeria’s economy continues to struggle due in part to capital controls and reduced liquidity, and we are unlikely to make additional investments at least until the central bank adjusts the currency exchange rate further (last year’s devaluation stopped just short of a fully free float). While we eliminated SEPLAT Petroleum Development, we maintained small positions in several companies, including Nigerian Breweries and Nestle Foods Nigeria, both of which declined. Meanwhile, Kenya’s economy and banks are struggling with the unintended consequences of last year’s decision to cap interest rates. At the end of April, we only owned shares of Safaricom, which we trimmed, and ARM Cement.

Latin America
Stocks in Argentina soared more than 22% in the last six months, in part because of speculation that the country could be reclassified as an emerging market in the next couple of years. The economy is playing out as we hoped: A recovery began in the second half of 2016, and growth is expected to approach 3% in 2017. However, inflation remains high in the wake of a massive currency devaluation following President Mauricio Macri’s late-2015 election. Still, Macri has pressed ahead with his reform efforts, and if his party gains legislative seats in the October elections, it could pave the way for additional reforms. We are encouraged by Argentina’s continuing turnaround, and we are overweighting it versus the benchmark.
One of our top contributors in the entire portfolio was Grupo Financiero Galicia, a high-quality bank that is benefiting from the improving economic environment and increasing credit growth. Shares of Grupo Supervielle, a large private bank, also benefited from the same trends. Energy giant YPF contributed significantly, benefiting from last year’s oil price rebound and from Macri’s support for the country to boost its shale gas production. Other good performers included cable operator Grupo Clarin and retail mall operator Irsa Propiedades Comerciales.
We continued to own shares of U.S.-based company PriceSmart, a warehouse shopping club with stores in several Caribbean and Latin American countries. Although the stock declined in the last six months, we are encouraged by improving operating conditions in Colombia, Costa Rica, and Trinidad, so we are maintaining our position.
Frontier Europe
Our frontier markets exposure in this region is currently focused on Romania and Georgia. We eliminated Halyk Savings Bank of Kazakhstan in the last six months. Although the bank has a solid capital position, its plans to merge with another bank could hurt its earnings outlook and balance sheet and is unlikely to benefit Halyk’s shareholders.
Romania has one of the fastest-growing economies in the region—around 4% on an annualized basis. We are watching Romania carefully, however, as there may be some signs of overheating. Still, we like prospects for leading financial companies such as Banca Transilvania, which produced good returns in the last six months, and BRD—Groupe Societe Generale. A new portfolio holding is MedLife, which we bought at the time of its initial public offering in late 2016. As the largest private health care provider in a country with a poorly managed public health care system, the company is well positioned, with strong competitive advantages and direct exposure to the country’s rising consumer class. We maintained stakes in investment fund Fondul Proprietatea and real estate company New Europe Property Investments.
We also like the Georgian market: The economy is likely to grow at a 4% annualized rate this year, the government is pro-business, and tax reforms are providing incentives to invest. Our two Georgian investments are Bgeo (formerly Bank of Georgia Holdings) and Georgia Healthcare, both of which produced gains. We trimmed our Georgia Healthcare position because its valuation looked fairly full following strong performance over the last year.
Outlook
The performance of frontier markets, though they tend to have a low correlation with developed and emerging markets, has improved with global equity markets in the last few months as various countries are making meaningful domestic economic and political changes that are independent of broad global trends. We continue to have a positive long-term outlook for the frontier universe and believe that recent currency weakness in several frontier countries results in more competitive exchange rates that bode well for their near-term economic prospects.
Growth prospects in frontier Asia remain intact given consistently healthy macro backdrops and relatively low fiscal imbalances. Vietnam, one of the most promising markets in the region, is steadily growing its exports to levels that are consistent with many developed economies, especially with regard to mobile phones and other tech devices. Also, Pakistan’s imminent return to the emerging markets universe is a timely reminder of the great longer-term growth potential we see in many frontier countries.
In the Middle East, Saudi Arabia is ramping up its Vision 2030 plans to diversify the kingdom away from oil. New bond issuance, privatization of state-owned assets, and structural reforms are likely to be more visible in the next few years. In sub-Saharan Africa, we are seeing signs of a growth uptick in several countries that could accelerate in 2018. Nigeria remains in a challenging state, but a recent reform plan, if carried out, could lead to the sale of some state assets and a more flexible exchange rate—both of which could help jump-start the economy.
In frontier Europe, the strong Romanian economy is underpinned by solid domestic demand, which has picked up on the back of wage growth, low interest rates, and value-added tax cuts in 2016 and 2017. In Latin America, Argentine President Macri’s reform agenda has rebooted the economy and helped attract significant foreign direct investment. To maintain momentum and investors’ confidence going into the October midterm elections, Macri needs to address high inflation and the country’s fiscal deficit.
We continue to believe that frontier markets have a place in an investor’s global portfolio, albeit a small one due to the heightened risks of the asset class. Macro fundamentals and demographics in many frontier countries are favorable and, in some cases, resemble those of emerging countries about 15 to 20 years ago. Economic growth in the frontier universe generally remains superior to that of most developed and many emerging countries, and stock valuations in many cases are fairly cheap. Of course, conditions and investment opportunities vary widely by country, and there will be individual winners and losers, even in the same country and region. Therefore, we believe our rigorous research efforts are key to harnessing the long-term potential of investing in frontier equity markets.
Thank you for your confidence in our investment management capabilities.
Respectfully submitted,

Oliver Bell
Portfolio manager
May 19, 2017
The portfolio manager has day-to-day responsibility for managing the portfolio and works with committee members in developing and executing the fund’s investment program.
| Risks of International Investing |
Funds that invest overseas generally carry more risk than funds that invest strictly in U.S. assets. Funds investing in a single country, limited geographic region, or emerging markets tend to be riskier than more diversified funds. Risks can result from varying stages of economic and political development; differing regulatory environments, trading days, and accounting standards; and higher transaction costs of non-U.S. markets. Non-U.S. investments are also subject to currency risk, or a decline in the value of a foreign currency versus the U.S. dollar, which reduces the dollar value of securities denominated in that currency.
The risks of international investing are heightened for investments in emerging market and frontier market countries. Emerging and frontier market countries tend to have economic structures that are less diverse and mature, and political systems that are less stable, than those of developed market countries. In addition to all of the risks of investing in international developed markets, emerging and frontier markets tend to have less liquid and less efficient trading markets and are more susceptible to governmental interference, local taxes being imposed on international investments, and restrictions on gaining access to sales proceeds.
Frontier markets generally have smaller economies or less mature capital markets than emerging markets and, as a result, the risks typically associated with investing in emerging market countries are magnified in frontier countries. Adverse changes in currency values of frontier market countries may be severe and settlement procedures and custody services may prove inadequate in certain markets. The markets of frontier countries typically have low trading volumes and the potential for extreme price volatility and illiquidity. This volatility may be further increased by the actions of a few major investors.
MSCI Frontier Markets Index: An index that measures the performance of stocks in various frontier market countries.
Note: MSCI makes no express or implied warranties or representations and shall have no liability whatsoever with respect to any MSCI data contained herein. The MSCI data may not be further redistributed or used as a basis for other indices or any securities or financial products. This report is not approved, reviewed, or produced by MSCI.
Portfolio Highlights
Performance and Expenses
T. Rowe Price Institutional Frontier Markets Equity Fund
This chart shows the value of a hypothetical $1 million investment in the fund over the past 10 fiscal year periods or since inception (for funds lacking 10-year records). The result is compared with benchmarks, which may include a broad-based market index and a peer group average or index. Market indexes do not include expenses, which are deducted from fund returns as well as mutual fund averages and indexes.


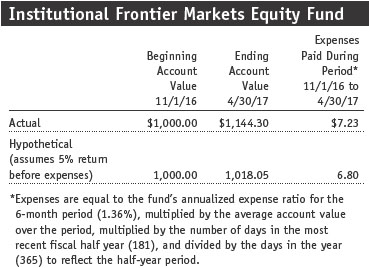
Fund Expense Example
As a mutual fund shareholder, you may incur two types of costs: (1) transaction costs, such as redemption fees or sales loads, and (2) ongoing costs, including management fees, distribution and service (12b-1) fees, and other fund expenses. The following example is intended to help you understand your ongoing costs (in dollars) of investing in the fund and to compare these costs with the ongoing costs of investing in other mutual funds. The example is based on an investment of $1,000 invested at the beginning of the most recent six-month period and held for the entire period.
Actual Expenses
The first line of the following table (Actual) provides information about actual account values and actual expenses. You may use the information on this line, together with your account balance, to estimate the expenses that you paid over the period. Simply divide your account value by $1,000 (for example, an $8,600 account value divided by $1,000 = 8.6), then multiply the result by the number on the first line under the heading “Expenses Paid During Period” to estimate the expenses you paid on your account during this period.
Hypothetical Example for Comparison Purposes
The information on the second line of the table (Hypothetical) is based on hypothetical account values and expenses derived from the fund’s actual expense ratio and an assumed 5% per year rate of return before expenses (not the fund’s actual return). You may compare the ongoing costs of investing in the fund with other funds by contrasting this 5% hypothetical example and the 5% hypothetical examples that appear in the shareholder reports of the other funds. The hypothetical account values and expenses may not be used to estimate the actual ending account balance or expenses you paid for the period.
You should also be aware that the expenses shown in the table highlight only your ongoing costs and do not reflect any transaction costs, such as redemption fees or sales loads. Therefore, the second line of the table is useful in comparing ongoing costs only and will not help you determine the relative total costs of owning different funds. To the extent a fund charges transaction costs, however, the total cost of owning that fund is higher.
Financial Highlights
T. Rowe Price Institutional Frontier Markets Equity Fund
(Unaudited)
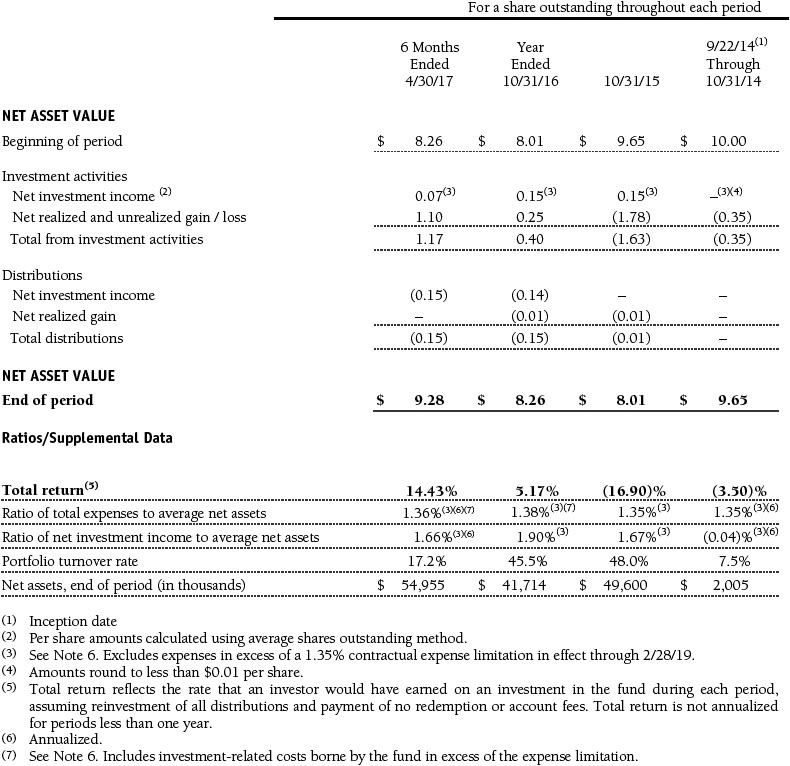
The accompanying notes are an integral part of these financial statements.
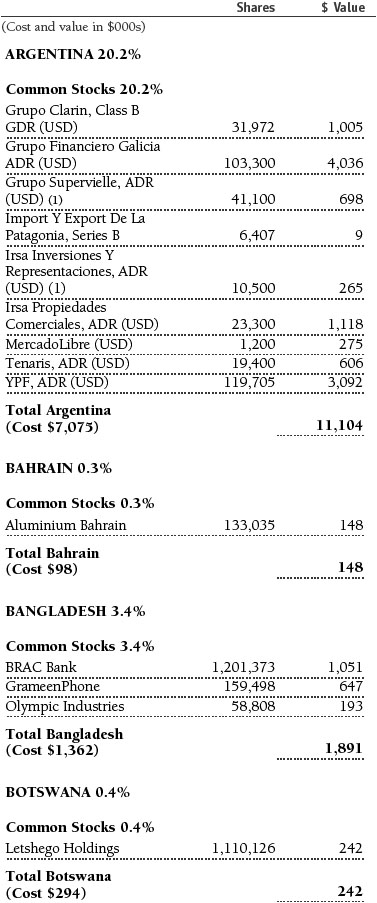
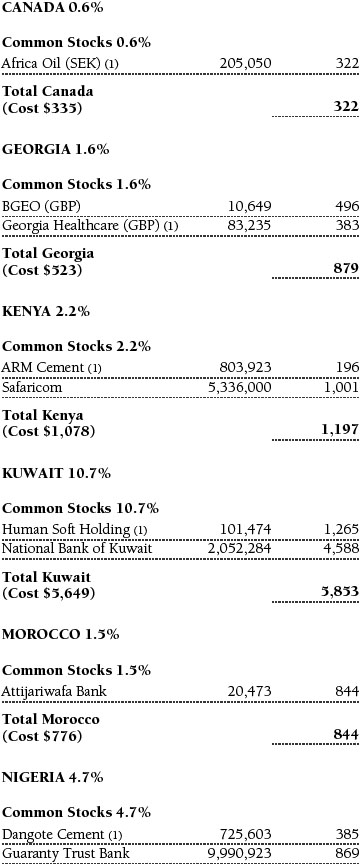
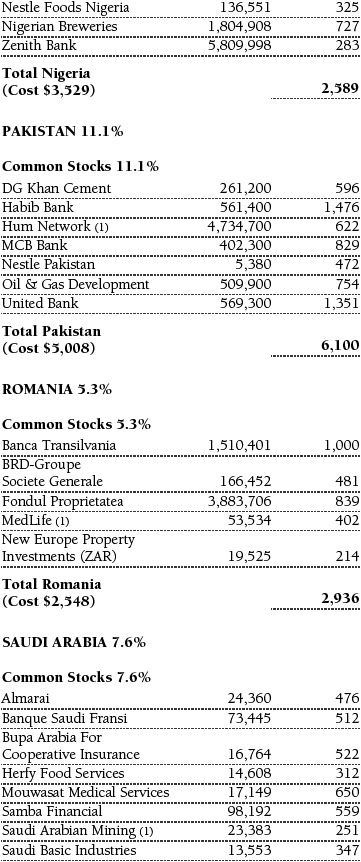
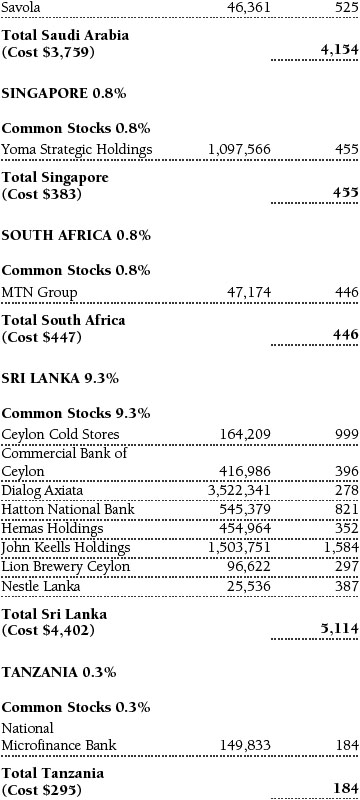
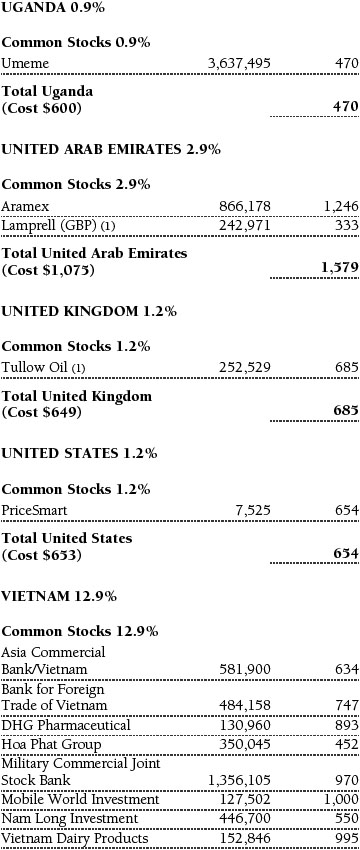
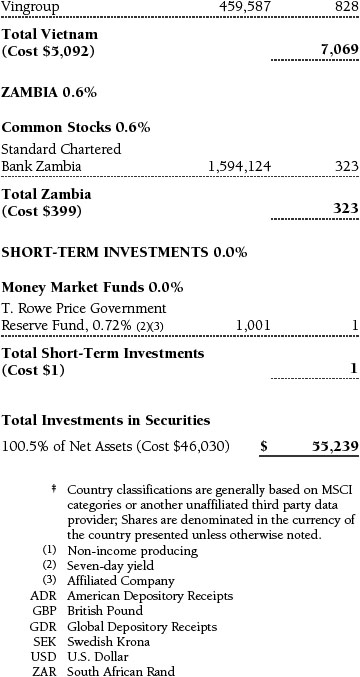
Portfolio of Investments‡
T. Rowe Price Institutional Frontier Markets Equity Fund
April 30, 2017 (Unaudited)

The accompanying notes are an integral part of these financial statements.
Statement of Assets and Liabilities
T. Rowe Price Institutional Frontier Markets Equity Fund
April 30, 2017 (Unaudited)
($000s, except shares and per share amounts)
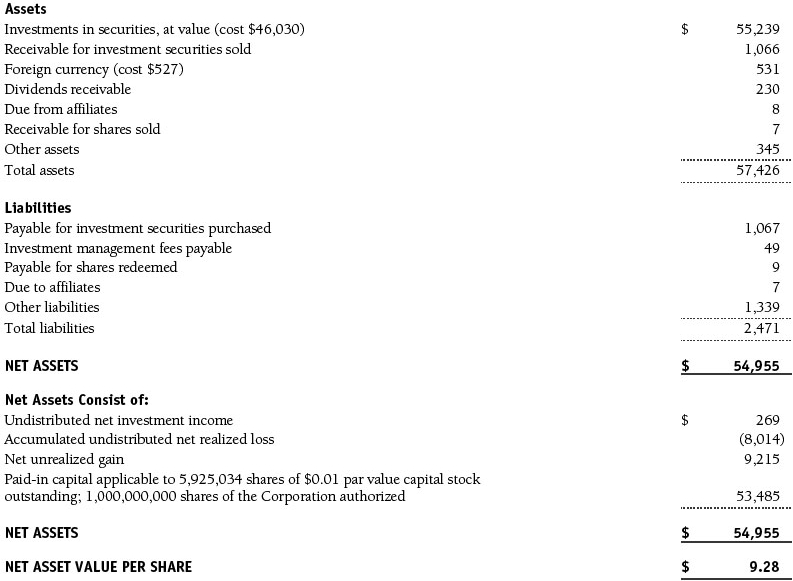
The accompanying notes are an integral part of these financial statements.
Statement of Operations
T. Rowe Price Institutional Frontier Markets Equity Fund
(Unaudited)
($000s)
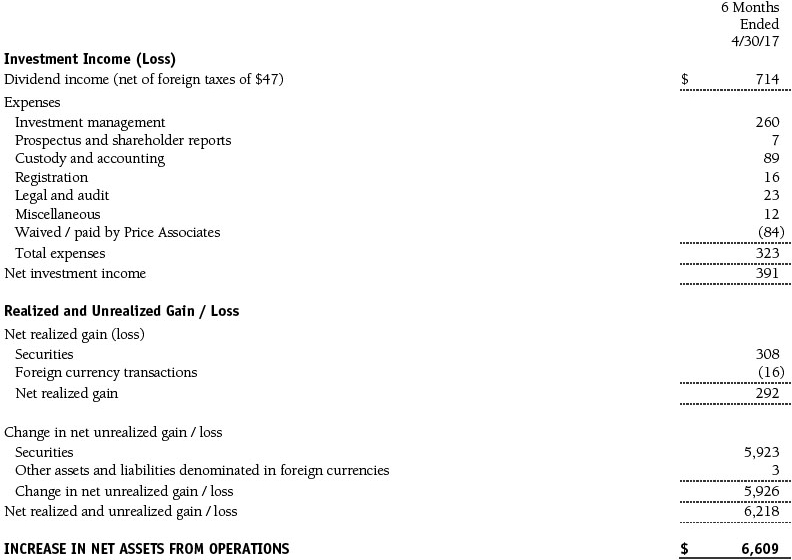
The accompanying notes are an integral part of these financial statements.
Statement of Changes in Net Assets
T. Rowe Price Institutional Frontier Markets Equity Fund
(Unaudited)
($000s)
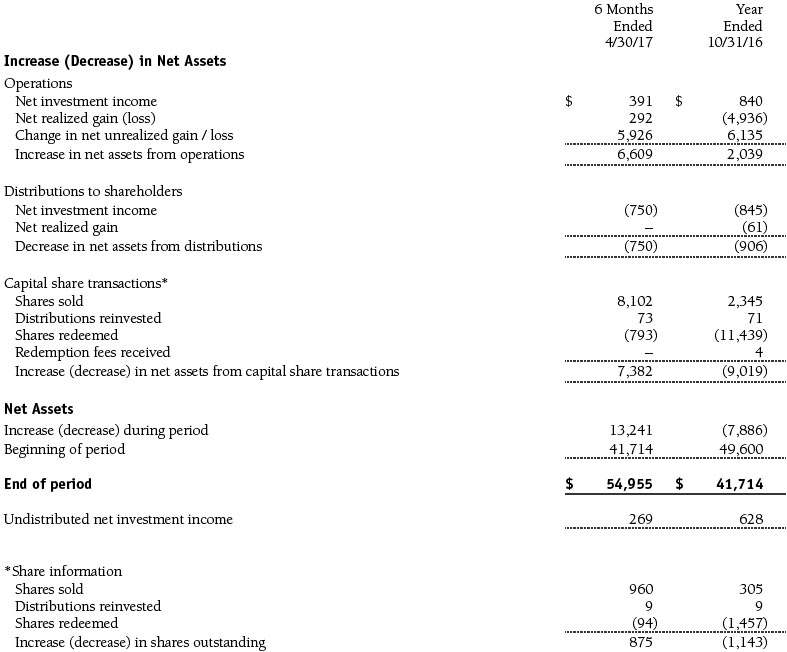
The accompanying notes are an integral part of these financial statements.
Notes to Financial Statements
T. Rowe Price Institutional Frontier Markets Equity Fund
April 30, 2017 (Unaudited)
T. Rowe Price Institutional International Funds, Inc. (the corporation), is registered under the Investment Company Act of 1940 (the 1940 Act). The Institutional Frontier Markets Equity Fund (the fund) is a nondiversified, open-end management investment company established by the corporation. The fund seeks long-term growth of capital.
NOTE 1 - SIGNIFICANT ACCOUNTING POLICIES
Basis of Preparation The fund is an investment company and follows accounting and reporting guidance in the Financial Accounting Standards Board (FASB) Accounting Standards Codification Topic 946 (ASC 946). The accompanying financial statements were prepared in accordance with accounting principles generally accepted in the United States of America (GAAP), including, but not limited to, ASC 946. GAAP requires the use of estimates made by management. Management believes that estimates and valuations are appropriate; however, actual results may differ from those estimates, and the valuations reflected in the accompanying financial statements may differ from the value ultimately realized upon sale or maturity.
Investment Transactions, Investment Income, and Distributions Income and expenses are recorded on the accrual basis. Dividends received from mutual fund investments are reflected as dividend income; capital gain distributions are reflected as realized gain/loss. Dividend income and capital gain distributions are recorded on the ex-dividend date. Income tax-related interest and penalties, if incurred, would be recorded as income tax expense. Investment transactions are accounted for on the trade date. Realized gains and losses are reported on the identified cost basis. Income distributions are declared and paid annually. Distributions to shareholders are recorded on the ex-dividend date. Capital gain distributions are generally declared and paid by the fund annually.
Currency Translation Assets, including investments, and liabilities denominated in foreign currencies are translated into U.S. dollar values each day at the prevailing exchange rate, using the mean of the bid and asked prices of such currencies against U.S. dollars as quoted by a major bank. Purchases and sales of securities, income, and expenses are translated into U.S. dollars at the prevailing exchange rate on the date of the transaction. The effect of changes in foreign currency exchange rates on realized and unrealized security gains and losses is reflected as a component of security gains and losses.
Redemption Fees A 2% fee is assessed on redemptions of fund shares held for 90 days or less to deter short-term trading and to protect the interests of long-term shareholders. Redemption fees are withheld from proceeds that shareholders receive from the sale or exchange of fund shares. The fees are paid to the fund and are recorded as an increase to paid-in capital. The fees may cause the redemption price per share to differ from the net asset value per share.
New Accounting Guidance In October 2016, the Securities and Exchange Commission (SEC) issued a new rule, Investment Company Reporting Modernization, which, among other provisions, amends Regulation S-X to require standardized, enhanced disclosures, particularly related to derivatives, in investment company financial statements. Compliance with the guidance is effective for financial statements filed with the SEC on or after August 1, 2017; adoption will have no effect on the fund’s net assets or results of operations.
NOTE 2 - VALUATION
The fund’s financial instruments are valued and its net asset value (NAV) per share is computed at the close of the New York Stock Exchange (NYSE), normally 4 p.m. ET, each day the NYSE is open for business. However, the NAV per share may be calculated at a time other than the normal close of the NYSE if trading on the NYSE is restricted, if the NYSE closes earlier, or as may be permitted by the SEC.
Fair Value The fund’s financial instruments are reported at fair value, which GAAP defines as the price that would be received to sell an asset or paid to transfer a liability in an orderly transaction between market participants at the measurement date. The T. Rowe Price Valuation Committee (the Valuation Committee) is an internal committee that has been delegated certain responsibilities by the fund’s Board of Directors (the Board) to ensure that financial instruments are appropriately priced at fair value in accordance with GAAP and the 1940 Act. Subject to oversight by the Board, the Valuation Committee develops and oversees pricing-related policies and procedures and approves all fair value determinations. Specifically, the Valuation Committee establishes procedures to value securities; determines pricing techniques, sources, and persons eligible to effect fair value pricing actions; oversees the selection, services, and performance of pricing vendors; oversees valuation-related business continuity practices; and provides guidance on internal controls and valuation-related matters. The Valuation Committee reports to the Board and has representation from legal, portfolio management and trading, operations, risk management, and the fund’s treasurer.
Various valuation techniques and inputs are used to determine the fair value of financial instruments. GAAP establishes the following fair value hierarchy that categorizes the inputs used to measure fair value:
Level 1 – quoted prices (unadjusted) in active markets for identical financial instruments that the fund can access at the reporting date
Level 2 – inputs other than Level 1 quoted prices that are observable, either directly or indirectly (including, but not limited to, quoted prices for similar financial instruments in active markets, quoted prices for identical or similar financial instruments in inactive markets, interest rates and yield curves, implied volatilities, and credit spreads)
Level 3 – unobservable inputs
Observable inputs are developed using market data, such as publicly available information about actual events or transactions, and reflect the assumptions that market participants would use to price the financial instrument. Unobservable inputs are those for which market data are not available and are developed using the best information available about the assumptions that market participants would use to price the financial instrument. GAAP requires valuation techniques to maximize the use of relevant observable inputs and minimize the use of unobservable inputs. When multiple inputs are used to derive fair value, the financial instrument is assigned to the level within the fair value hierarchy based on the lowest-level input that is significant to the fair value of the financial instrument. Input levels are not necessarily an indication of the risk or liquidity associated with financial instruments at that level but rather the degree of judgment used in determining those values.
Valuation Techniques Equity securities listed or regularly traded on a securities exchange or in the over-the-counter (OTC) market are valued at the last quoted sale price or, for certain markets, the official closing price at the time the valuations are made. OTC Bulletin Board securities are valued at the mean of the closing bid and asked prices. A security that is listed or traded on more than one exchange is valued at the quotation on the exchange determined to be the primary market for such security. Listed securities not traded on a particular day are valued at the mean of the closing bid and asked prices for domestic securities and the last quoted sale or closing price for international securities.
For valuation purposes, the last quoted prices of non-U.S. equity securities may be adjusted to reflect the fair value of such securities at the close of the NYSE. If the fund determines that developments between the close of a foreign market and the close of the NYSE will, in its judgment, materially affect the value of some or all of its portfolio securities, the fund will adjust the previous quoted prices to reflect what it believes to be the fair value of the securities as of the close of the NYSE. In deciding whether it is necessary to adjust quoted prices to reflect fair value, the fund reviews a variety of factors, including developments in foreign markets, the performance of U.S. securities markets, and the performance of instruments trading in U.S. markets that represent foreign securities and baskets of foreign securities. The fund may also fair value securities in other situations, such as when a particular foreign market is closed but the fund is open. The fund uses outside pricing services to provide it with quoted prices and information to evaluate or adjust those prices. The fund cannot predict how often it will use quoted prices and how often it will determine it necessary to adjust those prices to reflect fair value. As a means of evaluating its security valuation process, the fund routinely compares quoted prices, the next day’s opening prices in the same markets, and adjusted prices.
Actively traded equity securities listed on a domestic exchange generally are categorized in Level 1 of the fair value hierarchy. Non-U.S. equity securities generally are categorized in Level 2 of the fair value hierarchy despite the availability of quoted prices because, as described above, the fund evaluates and determines whether those quoted prices reflect fair value at the close of the NYSE or require adjustment. OTC Bulletin Board securities, certain preferred securities, and equity securities traded in inactive markets generally are categorized in Level 2 of the fair value hierarchy.
Investments in mutual funds are valued at the mutual fund’s closing NAV per share on the day of valuation and are categorized in Level 1 of the fair value hierarchy. Assets and liabilities other than financial instruments, including short-term receivables and payables, are carried at cost, or estimated realizable value, if less, which approximates fair value.
Thinly traded financial instruments and those for which the above valuation procedures are inappropriate or are deemed not to reflect fair value are stated at fair value as determined in good faith by the Valuation Committee. The objective of any fair value pricing determination is to arrive at a price that could reasonably be expected from a current sale. Financial instruments fair valued by the Valuation Committee are primarily private placements, restricted securities, warrants, rights, and other securities that are not publicly traded.
Subject to oversight by the Board, the Valuation Committee regularly makes good faith judgments to establish and adjust the fair valuations of certain securities as events occur and circumstances warrant. For instance, in determining the fair value of an equity investment with limited market activity, such as a private placement or a thinly traded public company stock, the Valuation Committee considers a variety of factors, which may include, but are not limited to, the issuer’s business prospects, its financial standing and performance, recent investment transactions in the issuer, new rounds of financing, negotiated transactions of significant size between other investors in the company, relevant market valuations of peer companies, strategic events affecting the company, market liquidity for the issuer, and general economic conditions and events. In consultation with the investment and pricing teams, the Valuation Committee will determine an appropriate valuation technique based on available information, which may include both observable and unobservable inputs. The Valuation Committee typically will afford greatest weight to actual prices in arm’s length transactions, to the extent they represent orderly transactions between market participants, transaction information can be reliably obtained, and prices are deemed representative of fair value. However, the Valuation Committee may also consider other valuation methods such as market-based valuation multiples; a discount or premium from market value of a similar, freely traded security of the same issuer; or some combination. Fair value determinations are reviewed on a regular basis and updated as information becomes available, including actual purchase and sale transactions of the issue. Because any fair value determination involves a significant amount of judgment, there is a degree of subjectivity inherent in such pricing decisions, and fair value prices determined by the Valuation Committee could differ from those of other market participants. Depending on the relative significance of unobservable inputs, including the valuation technique(s) used, fair valued securities may be categorized in Level 2 or 3 of the fair value hierarchy.
Valuation Inputs The following table summarizes the fund’s financial instruments, based on the inputs used to determine their fair values on April 30, 2017:
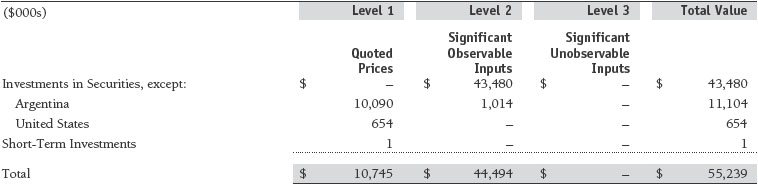
There were no material transfers between Levels 1 and 2 during the six months ended April 30, 2017.
NOTE 3 - OTHER INVESTMENT TRANSACTIONS
Consistent with its investment objective, the fund engages in the following practices to manage exposure to certain risks and/or to enhance performance. The investment objective, policies, program, and risk factors of the fund are described more fully in the fund’s prospectus and Statement of Additional Information.
Emerging and Frontier Markets The fund may invest, either directly or through investments in T. Rowe Price institutional funds, in securities of companies located in, issued by governments of, or denominated in or linked to the currencies of emerging and frontier market countries; at period-end, approximately 90% of the fund’s net assets were invested in frontier markets and 7% in emerging markets. Emerging markets, and to a greater extent frontier markets, generally have economic structures that are less diverse and mature, and political systems that are less stable, than developed countries. These markets may be subject to greater political, economic, and social uncertainty and differing regulatory environments that may potentially impact the fund’s ability to buy or sell certain securities or repatriate proceeds to U.S. dollars. Such securities are often subject to greater price volatility, less liquidity, and higher rates of inflation than U.S. securities. Investing in frontier markets is significantly riskier than investing in other countries, including emerging markets.
Other Purchases and sales of portfolio securities other than short-term securities aggregated $15,456,000 and $8,128,000, respectively, for the six months ended April 30, 2017.
NOTE 4 - FEDERAL INCOME TAXES
No provision for federal income taxes is required since the fund intends to continue to qualify as a regulated investment company under Subchapter M of the Internal Revenue Code and distribute to shareholders all of its taxable income and gains. Distributions determined in accordance with federal income tax regulations may differ in amount or character from net investment income and realized gains for financial reporting purposes. Financial reporting records are adjusted for permanent book/tax differences to reflect tax character but are not adjusted for temporary differences. The amount and character of tax-basis distributions and composition of net assets are finalized at fiscal year-end; accordingly, tax-basis balances have not been determined as of the date of this report.
The fund intends to retain realized gains to the extent of available capital loss carryforwards. Net realized capital losses may be carried forward indefinitely to offset future realized capital gains. As of October 31, 2016, the fund had $7,711,000 of available capital loss carryforwards.
At April 30, 2017, the cost of investments for federal income tax purposes was $46,583,000. Net unrealized gain aggregated $8,662,000 at period-end, of which $11,058,000 related to appreciated investments and $2,396,000 related to depreciated investments.
NOTE 5 - FOREIGN TAXES
The fund is subject to foreign income taxes imposed by certain countries in which it invests. Additionally, certain foreign currency transactions are subject to tax, and capital gains realized upon disposition of securities issued in or by certain foreign countries are subject to capital gains tax imposed by those countries. All taxes are computed in accordance with the applicable foreign tax law, and, to the extent permitted, capital losses are used to offset capital gains. Taxes attributable to income are accrued by the fund as a reduction of income. Taxes incurred on the purchase of foreign currencies are recorded as realized loss on foreign currency transactions. Current and deferred tax expense attributable to capital gains is reflected as a component of realized or change in unrealized gain/loss on securities in the accompanying financial statements. At April 30, 2017, the fund had no deferred tax liability attributable to foreign securities and no foreign capital loss carryforwards.
NOTE 6 - RELATED PARTY TRANSACTIONS
The fund is managed by T. Rowe Price Associates, Inc. (Price Associates), a wholly owned subsidiary of T. Rowe Price Group, Inc. (Price Group). Price Associates has entered into a sub-advisory agreement(s) with one or more of its wholly owned subsidiaries, to provide investment advisory services to the fund. The investment management agreement between the fund and Price Associates provides for an annual investment management fee equal to 1.10% of the fund’s average daily net assets. The fee is computed daily and paid monthly.
The fund is also subject to a contractual expense limitation through February 28, 2019. During the limitation period, Price Associates is required to waive its management fee and pay the fund for any expenses (excluding interest, expenses related to borrowings, taxes, brokerage, and other non-recurring expenses permitted by the investment management agreement) that would otherwise cause the fund’s ratio of annualized total expenses to average net assets (expense ratio) to exceed its expense limitation of 1.35%. The fund is required to repay Price Associates for expenses previously waived/paid to the extent its net assets grow or expenses decline sufficiently to allow repayment without causing the fund’s expense ratio to exceed its expense limitation in effect at the time of the waiver. However, no repayment will be made more than three years after the date of a payment or waiver. Pursuant to this agreement, $84,000 of expenses were waived/paid by Price Associates during the six months ended April 30, 2017. Including these amounts, expenses previously waived/paid by Price Associates in the amount of $499,000 remain subject to repayment by the fund at April 30, 2017.
In addition, the fund has entered into service agreements with Price Associates and a wholly owned subsidiary of Price Associates (collectively, Price). Price Associates provides certain accounting and administrative services to the fund. T. Rowe Price Services, Inc., provides shareholder and administrative services in its capacity as the fund’s transfer and dividend-disbursing agent. For the six months ended April 30, 2017, expenses incurred pursuant to these service agreements were $42,000 for Price Associates and less than $1,000 for T. Rowe Price Services, Inc. The total amount payable at period-end pursuant to these service agreements is reflected as Due to Affiliates in the accompanying financial statements.
The fund may invest in the T. Rowe Price Government Reserve Fund, the T. Rowe Price Treasury Reserve Fund, or the T. Rowe Price Short-Term Fund (collectively, the Price Reserve Funds), open-end management investment companies managed by Price Associates and considered affiliates of the fund. The Price Reserve Funds are offered as short-term investment options to mutual funds, trusts, and other accounts managed by Price Associates or its affiliates and are not available for direct purchase by members of the public. The Price Reserve Funds pay no investment management fees.
As of April 30, 2017, T. Rowe Price Group, Inc., or its wholly owned subsidiaries owned 2,520,186 shares of the fund, representing 43% of the fund’s net assets.
The fund may participate in securities purchase and sale transactions with other funds or accounts advised by Price Associates (cross trades), in accordance with procedures adopted by the fund’s Board and Securities and Exchange Commission rules, which require, among other things, that such purchase and sale cross trades be effected at the independent current market price of the security. During the six months ended April 30, 2017, the fund had no purchases or sales cross trades with other funds or accounts advised by Price Associates.
| Information on Proxy Voting Policies, Procedures, and Records |
A description of the policies and procedures used by T. Rowe Price funds and portfolios to determine how to vote proxies relating to portfolio securities is available in each fund’s Statement of Additional Information. You may request this document by calling 1-800-225-5132 or by accessing the SEC’s website, sec.gov.
The description of our proxy voting policies and procedures is also available on our corporate website. To access it, please visit the following Web page:
https://www3.troweprice.com/usis/corporate/en/utility/policies.html
Scroll down to the section near the bottom of the page that says, “Proxy Voting Policies.” Click on the Proxy Voting Policies link in the shaded box.
Each fund’s most recent annual proxy voting record is available on our website and through the SEC’s website. To access it through T. Rowe Price, visit the website location shown above, and scroll down to the section near the bottom of the page that says, “Proxy Voting Records.” Click on the Proxy Voting Records link in the shaded box.
| How to Obtain Quarterly Portfolio Holdings |
The fund files a complete schedule of portfolio holdings with the Securities and Exchange Commission for the first and third quarters of each fiscal year on Form N-Q. The fund’s Form N-Q is available electronically on the SEC’s website (sec.gov); hard copies may be reviewed and copied at the SEC’s Public Reference Room, 100 F St. N.E., Washington, DC 20549. For more information on the Public Reference Room, call 1-800-SEC-0330.
| Approval of Investment Management Agreement and Subadvisory Agreement |
Each year, the fund’s Board of Directors (Board) considers the continuation of the investment management agreement (Advisory Contract) between the fund and its investment advisor, T. Rowe Price Associates, Inc. (Advisor), as well as the continuation of the investment subadvisory agreement (Subadvisory Contract) that the Advisor has entered into with T. Rowe Price International Ltd (Subadvisor) on behalf of the fund. In that regard, at an in-person meeting held on March 6–7, 2017 (Meeting), the Board, including a majority of the fund’s independent directors, approved the continuation of the fund’s Advisory Contract and Subadvisory Contract. At the Meeting, the Board considered the factors and reached the conclusions described below relating to the selection of the Advisor and Subadvisor and the approval of the Advisory Contract and Subadvisory Contract. The independent directors were assisted in their evaluation of the Advisory Contract and Subadvisory Contract by independent legal counsel from whom they received separate legal advice and with whom they met separately.
In providing information to the Board, the Advisor was guided by a detailed set of requests for information submitted by independent legal counsel on behalf of the independent directors. In considering and approving the Advisory Contract and Subadvisory Contract, the Board considered the information it believed was relevant, including, but not limited to, the information discussed below. The Board considered not only the specific information presented in connection with the Meeting but also the knowledge gained over time through interaction with the Advisor and Subadvisor about various topics. The Board meets regularly and, at each of its meetings, covers an extensive agenda of topics and materials and considers factors that are relevant to its annual consideration of the renewal of the T. Rowe Price funds’ advisory contracts, including performance and the services and support provided to the funds and their shareholders.
Services Provided by the Advisor and Subadvisor
The Board considered the nature, quality, and extent of the services provided to the fund by the Advisor and Subadvisor. These services included, but were not limited to, directing the fund’s investments in accordance with its investment program and the overall management of the fund’s portfolio, as well as a variety of related activities such as financial, investment operations, and administrative services; compliance; maintaining the fund’s records and registrations; and shareholder communications. The Board also reviewed the background and experience of the Advisor’s and Subadvisor’s senior management teams and investment personnel involved in the management of the fund, as well as the Advisor’s compliance record. The Board concluded that it was satisfied with the nature, quality, and extent of the services provided by the Advisor and Subadvisor.
Investment Performance of the Fund
The Board took into account discussions with the Advisor and reports that it receives throughout the year relating to fund performance. In connection with the Meeting, the Board reviewed the fund’s net annualized total returns for the one- and two-year periods as of September 30, 2016, and compared these returns with the performance of a peer group of funds with similar investment programs and a wide variety of other previously agreed-upon comparable performance measures and market data, including those supplied by Broadridge, which is an independent provider of mutual fund data.
On the basis of this evaluation and the Board’s ongoing review of investment results, and factoring in the relative market conditions during certain of the performance periods, the Board concluded that the fund’s performance was satisfactory.
Costs, Benefits, Profits, and Economies of Scale
The Board reviewed detailed information regarding the revenues received by the Advisor under the Advisory Contract and other benefits that the Advisor (and its affiliates, including the Subadvisor) may have realized from its relationship with the fund, including any research received under “soft dollar” agreements and commission-sharing arrangements with broker-dealers. The Board considered that the Advisor and Subadvisor may receive some benefit from soft-dollar arrangements pursuant to which research is received from broker-dealers that execute the fund’s portfolio transactions. The Board received information on the estimated costs incurred and profits realized by the Advisor from managing the T. Rowe Price funds. The Board also reviewed estimates of the profits realized from managing the fund in particular, and the Board concluded that the Advisor’s profits were reasonable in light of the services provided to the fund.
The Board also considered whether the fund benefits under the fee levels set forth in the Advisory Contract from any economies of scale realized by the Advisor. Under the Advisory Contract, the fund pays a fee to the Advisor for investment management services based on the fund’s average daily net assets and the fund pays its own expenses of operations (subject to an expense limitation agreed to by the Advisor). Under the Subadvisory Contract, the Advisor may pay the Subadvisor up to 60% of the advisory fee that the Advisor receives from the fund. Although the fund’s management fee does not consist of a group fee component, the assets of the fund are still included toward the calculation of a group fee rate, which declines at certain asset levels and is based on the combined average net assets of most of the T. Rowe Price funds. In addition, the fund’s shareholders benefit from economies of scale in the form of declining operating expenses as the fund grows in size and the fund has a contractual expense limitation in place to reduce the burden of higher operating costs to shareholders until the fund reaches greater scale. The Board concluded that the advisory fee structure for the fund continued to be appropriate and provide for a reasonable sharing of benefits from any economies of scale with the fund’s investors.
Fees and Expenses
The Board was provided with information regarding industry trends in management fees and expenses. Among other things, the Board reviewed data for peer groups that were compiled by Broadridge, which compared: (i) contractual management fees, total expenses, actual management fees, and non-management expenses of the fund to a group of competitor funds selected by Broadridge (Expense Group) and (ii) total expenses, actual management fees, and non-management expenses of the fund to a broader set of funds within the Lipper investment classification (Expense Universe). The Board considered the fund’s contractual management fee rate, actual management fee rate (which reflects the management fees actually received from the fund by the Advisor after any applicable waivers, reductions, or reimbursements), operating expenses, and total expenses (which reflects the net total expense ratio of the fund after any waivers, reductions, or reimbursements) in comparison with the information for the Broadridge peer groups. Broadridge generally constructed the peer groups by seeking the most comparable funds based on similar investment classifications and objectives, expense structure, asset size, and operating components and attributes and ranked funds into quintiles, with the first quintile representing the funds with the lowest relative expenses and the fifth quintile representing the funds with the highest relative expenses. The information provided to the Board indicated that the fund’s contractual management fee ranked in the third quintile (Expense Group), the fund’s actual management fee rate ranked in the first quintile (Expense Group and Expense Universe), and the fund’s total expenses ranked in the third quintile (Expense Group) and fourth quintile (Expense Universe).
The Board also reviewed the fee schedules for institutional accounts and private accounts with similar mandates that are advised or subadvised by the Advisor and its affiliates. Management provided the Board with information about the Advisor’s responsibilities and services provided to subadvisory and other institutional account clients, including information about how the requirements and economics of the institutional business are fundamentally different from those of the mutual fund business. The Board considered information showing that the Advisor’s mutual fund business is generally more complex from a business and compliance perspective than its institutional account business and considered various relevant factors, such as the broader scope of operations and oversight, more extensive shareholder communication infrastructure, greater asset flows, heightened business risks, and differences in applicable laws and regulations associated with the Advisor’s proprietary mutual fund business. In assessing the reasonableness of the fund’s management fee rate, the Board considered the differences in the nature of the services required for the Advisor to manage its mutual fund business versus managing a discrete pool of assets as a subadvisor to another institution’s mutual fund or for an institutional account and that the Advisor generally performs significant additional services and assumes greater risk in managing the fund and other T. Rowe Price funds than it does for institutional account clients.
On the basis of the information provided and the factors considered, the Board concluded that the fees paid by the fund under the Advisory Contract are reasonable.
Approval of the Advisory Contract and Subadvisory Contract
As noted, the Board approved the continuation of the Advisory Contract and Subadvisory Contract. No single factor was considered in isolation or to be determinative to the decision. Rather, the Board concluded, in light of a weighting and balancing of all factors considered, that it was in the best interests of the fund and its shareholders for the Board to approve the continuation of the Advisory Contract and Subadvisory Contract (including the fees to be charged for services thereunder).
Item 2. Code of Ethics.
A code of ethics, as defined in Item 2 of Form N-CSR, applicable to its principal executive officer, principal financial officer, principal accounting officer or controller, or persons performing similar functions is filed as an exhibit to the registrant’s annual Form N-CSR. No substantive amendments were approved or waivers were granted to this code of ethics during the registrant’s most recent fiscal half-year.
Item 3. Audit Committee Financial Expert.
Disclosure required in registrant’s annual Form N-CSR.
Item 4. Principal Accountant Fees and Services.
Disclosure required in registrant’s annual Form N-CSR.
Item 5. Audit Committee of Listed Registrants.
Not applicable.
Item 6. Investments.
(a) Not applicable. The complete schedule of investments is included in Item 1 of this Form N-CSR.
(b) Not applicable.
Item 7. Disclosure of Proxy Voting Policies and Procedures for Closed-End Management Investment Companies.
Not applicable.
Item 8. Portfolio Managers of Closed-End Management Investment Companies.
Not applicable.
Item 9. Purchases of Equity Securities by Closed-End Management Investment Company and Affiliated Purchasers.
Not applicable.
Item 10. Submission of Matters to a Vote of Security Holders.
Not applicable.
Item 11. Controls and Procedures.
(a) The registrant’s principal executive officer and principal financial officer have evaluated the registrant’s disclosure controls and procedures within 90 days of this filing and have concluded that the registrant’s disclosure controls and procedures were effective, as of that date, in ensuring that information required to be disclosed by the registrant in this Form N-CSR was recorded, processed, summarized, and reported timely.
(b) The registrant’s principal executive officer and principal financial officer are aware of no change in the registrant’s internal control over financial reporting that occurred during the registrant’s second fiscal quarter covered by this report that has materially affected, or is reasonably likely to materially affect, the registrant’s internal control over financial reporting.
Item 12. Exhibits.
(a)(1) The registrant’s code of ethics pursuant to Item 2 of Form N-CSR is filed with the registrant’s annual Form N-CSR.
(2) Separate certifications by the registrant's principal executive officer and principal financial officer, pursuant to Section 302 of the Sarbanes-Oxley Act of 2002 and required by Rule 30a-2(a) under the Investment Company Act of 1940, are attached.
(3) Written solicitation to repurchase securities issued by closed-end companies: not applicable.
(b) A certification by the registrant's principal executive officer and principal financial officer, pursuant to Section 906 of the Sarbanes-Oxley Act of 2002 and required by Rule 30a-2(b) under the Investment Company Act of 1940, is attached.
SIGNATURES
Pursuant to the requirements of the Securities Exchange Act of 1934 and the Investment Company Act of 1940, the registrant has duly caused this report to be signed on its behalf by the undersigned, thereunto duly authorized.
T. Rowe Price Institutional International Funds, Inc.
| By | /s/ Edward C. Bernard |
| | Edward C. Bernard |
| | Principal Executive Officer |
| | |
| Date June 15, 2017 | | |
Pursuant to the requirements of the Securities Exchange Act of 1934 and the Investment Company Act of 1940, this report has been signed below by the following persons on behalf of the registrant and in the capacities and on the dates indicated.
| By | /s/ Edward C. Bernard |
| | Edward C. Bernard |
| | Principal Executive Officer |
| | |
| Date June 15, 2017 | | |
| | |
| | |
| By | /s/ Catherine D. Mathews |
| | Catherine D. Mathews |
| | Principal Financial Officer |
| | |
| Date June 15, 2017 | | |