UNITED STATES
SECURITIES AND EXCHANGE COMMISSION
Washington, D.C. 20549
FORM N-CSR
CERTIFIED SHAREHOLDER REPORT OF REGISTERED
MANAGEMENT INVESTMENT COMPANIES
Investment Company Act File Number: 811-05833
| T. Rowe Price Institutional International Funds, Inc. |
| (Exact name of registrant as specified in charter) |
| 100 East Pratt Street, Baltimore, MD 21202 |
| (Address of principal executive offices) |
| David Oestreicher |
| 100 East Pratt Street, Baltimore, MD 21202 |
| (Name and address of agent for service) |
Registrant’s telephone number, including area code: (410) 345-2000
Date of fiscal year end: October 31
Date of reporting period: October 31, 2018
 |
| Institutional Emerging Markets Equity Fund | October 31, 2018 |
| T. ROWE PRICE INSTITUTIONAL EMERGING MARKETS EQUITY FUND |
HIGHLIGHTS
| ■ | Emerging markets stocks fell during the period under pressure from trade tensions, worries about slowing Chinese growth, rising U.S. interest rates, a stronger U.S. dollar, and election uncertainty and policy missteps in certain countries. |
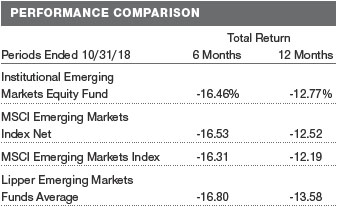
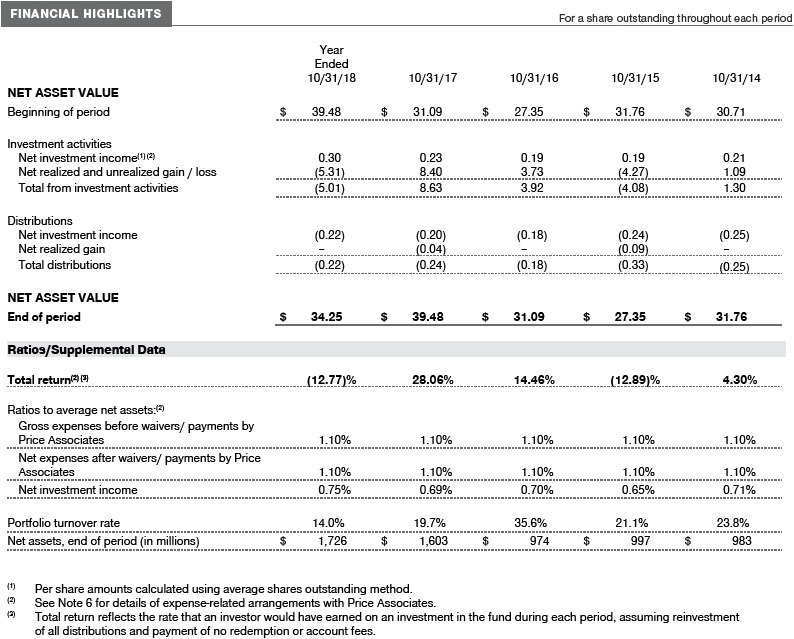
| ■ | Your fund returned -12.77%, underperforming the MSCI Emerging Markets Index Net and the MSCI Emerging Markets Index but outperforming our Lipper peer group average for the period ended October 31, 2018. The underperformance versus the benchmark was largely the result of stock selection in Russia and Brazil and our underweight to the energy and materials sectors. |
| ■ | Amid the uncertainty created by elections and geopolitical risks, we have consolidated into our highest-conviction holdings, seeking companies that stand to benefit from secular growth trends, such as the buying habits of the growing consumer class. |
| ■ | While investors’ risk appetite toward the asset class has wilted, we are optimistic about the outlook for these emerging countries and their markets. |
Log in to your account at troweprice.com for more information.
*Certain mutual fund accounts that are assessed an annual account service fee can also save money by switching to e-delivery.
CIO Market Commentary
Dear Investor
Global financial markets generated widely divergent returns in your fund’s fiscal year ended October 31, 2018. International equities declined during a volatile period marked by slowing growth in Europe, a growing trade conflict between the U.S. and China, and struggling currencies versus the U.S. dollar. Relatively high interest rates and the stronger U.S. economy resulted in asset flows to the U.S., where equities moved higher, particularly large-cap growth stocks. Both taxable and tax-exempt domestic bonds recorded losses, and non-U.S. bond prices declined considerably.
Several factors contributed to the significant performance gap between U.S. stocks and other assets. U.S. equities benefited from the strong domestic economy and the tax cuts passed in late 2017, which helped corporate earnings expand at their fastest pace since the recovery from the financial crisis nearly a decade ago. Less welcome was a sharp rise in long-term interest rates, a result of improved economic conditions and early signs of higher inflation. Bond prices fell as yields rose, leaving only the riskier high yield and asset-backed sectors—which are typically more resilient when rates increase—with gains for the period.
In Europe, slowing growth buffeted equities, while interest rates remained low due to continued monetary accommodation by the European Central Bank. Bank stocks, which make up a significant portion of major indexes, were particularly weak in this environment. Stocks slipped in Japan, but exceptionally aggressive monetary stimulus from the Bank of Japan failed to spark inflation or a convincing rebound in the country’s sluggish growth rate.
Higher rates and the strengthening U.S. economy bolstered the U.S. dollar versus other currencies but reduced returns of non-U.S. assets in dollar terms. The strong dollar also weighed heavily on emerging market countries with large current account deficits and external financing needs. A broad crisis in emerging markets debt has yet to materialize, however.
Chinese stocks dropped sharply, reflecting a manufacturing sector slowdown brought about by efforts to reduce pollution and the government’s continued clampdown on financial excesses. New regulations on gaming and online activities also weighed on the widely traded shares of the country’s Internet giants. Heightened trade tensions with the U.S. took a further toll on investor sentiment toward China and other markets and may well have drained enthusiasm about healthy corporate profits and economic growth.
The actual impact of trade tensions on the U.S. economy appears muted to date, although the reprieve may prove temporary. The Chinese yuan has cheapened considerably, largely offsetting the 10% U.S. tariff on many Chinese imports by making them less expensive in dollar terms. If the yuan stabilizes and the Trump administration increases the tariff rate to 25% in 2019, as it has threatened, the U.S. could face meaningfully higher import costs. A continued decline in the yuan, on the other hand, would likely draw the ire of U.S. trade negotiators and further heighten tensions.
Other uncertainties await investors in 2019. In the U.S., our investment professionals will be assessing the impact of a new era of divided government and keeping a close eye on earnings growth, which will most certainly slow in the coming year as the effect of the corporate tax cut on year-over-year earnings comparisons fades. By late in the year, the impact of fiscal stimulus will have peaked, while the U.S. economy will be without easy money for the first time in this economic cycle—assuming the Fed stays on its current path of raising short-term rates gradually. In Europe, the Brexit deadline looms in March, and investors are keeping a close eye on whether populist movements in Italy and elsewhere will challenge the stability of the European Union.
Nonetheless, our investment professionals continue to see opportunities for careful and patient investors. For example, sharp declines have created attractive valuations in some emerging markets, and corporate fundamentals in the U.S. generally remain excellent. Many innovative companies around the globe are using technology to seize market share from others, allowing them to continue growing at a healthy pace even if economic growth slows.
In the search for these opportunities, your portfolio manager is drawing on the extensive resources of T. Rowe Price’s global research platform, and I am confident that our uniquely collaborative culture will continue to serve our shareholders well.
Thank you for your continued confidence in T. Rowe Price.
Sincerely,

Robert Sharps
Group Chief Investment Officer
Management’s Discussion of Fund Performance
INVESTMENT OBJECTIVE
The fund seeks long-term growth of capital through investments primarily in the common stocks of companies located (or with primary operations) in emerging markets.
FUND COMMENTARY
How did the fund perform in the past 12 months?
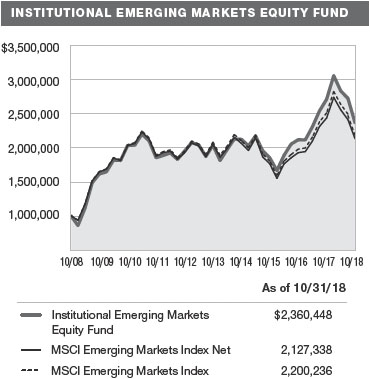
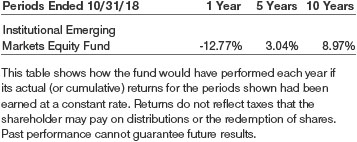
The Institutional Emerging Markets Equity Fund returned -12.77% in the 12 months ended October 31, 2018, underperforming the MSCI Emerging Markets Index Net and the MSCI Emerging Markets Index but outperforming our Lipper peer group average. Effective July 1, 2018, the MSCI Emerging Markets Index Net replaced the MSCI Emerging Markets Index as the fund’s primary benchmark. The new index assumes the reinvestment of dividends after the deduction of withholding taxes applicable to the country where the dividend is paid; as such, the returns of the new benchmark are more representative of the returns experienced by investors in foreign issuers. (Past performance cannot guarantee future results.)
What factors influenced the fund’s performance?
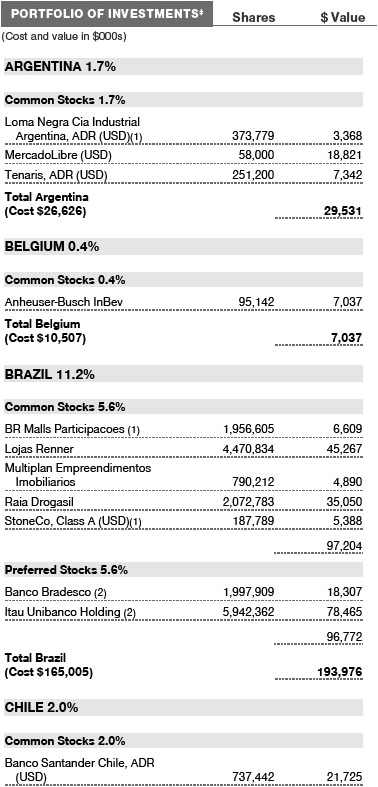
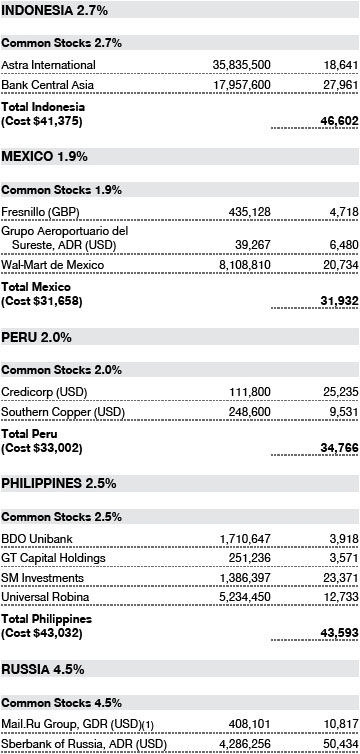
Emerging markets stocks sold off during the 12-month period, as trade tensions, concerns of slowing global demand, election uncertainty, and economic missteps in certain countries combined to spark waves of selling. Our reluctance to invest in energy and other commodity stocks—whose fortunes depend on commodity prices—detracted during the period, as the price of oil rose 20% over the last year. While our underweight hurt the portfolio’s relative performance, we do not believe in chasing the rally as we continue to believe that the medium- to long-term outlook for oil is for lower prices. In Brazil, not owning state oil company Petroleo Brasileiro and leading iron ore producer Vale detracted. Similarly, our decision not to invest in Russian oil producers Lukoil and Rosneft and China National Offshore Oil Corporation (CNOOC) weighed on results, as these companies reaped the rewards of the runup in oil prices. However, we believe that these cyclical companies are earning at unsustainable levels, and we find better opportunities in other areas. (Please refer to the portfolio of investments for a complete list of holdings and the amount each represents in the portfolio.)
Our preference for high-quality financial companies paid off, as these companies were some of the fund’s best absolute and relative performers, getting a boost from rising interest rates and increased disposable income. In the United Arab Emirates, First Abu Dhabi Bank performed very well as management was successful in cutting costs after the merger between First Gulf Bank and National Bank of Abu Dhabi. Brazilian private bank Itau Unibanco also performed well thanks to increased loan growth and a decline in nonperforming loans. China’s largest insurer, Ping An Insurance, benefited from its earnings resilience from its life insurance business and an increase in customers. In Hong Kong, leading insurance company AIA Group also boosted returns. AIA has a unique footprint across Southeast Asia, and we expect it will continue to expand its reach across the region.
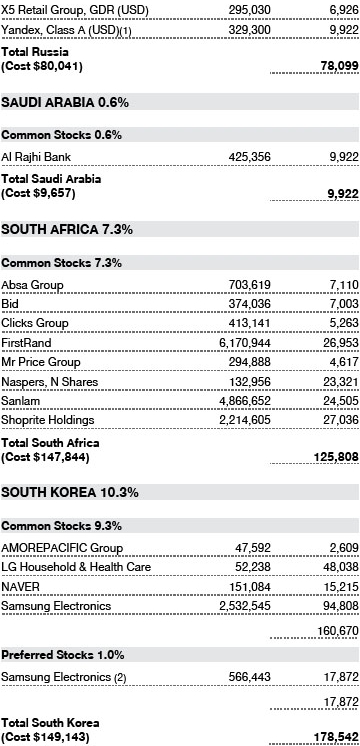
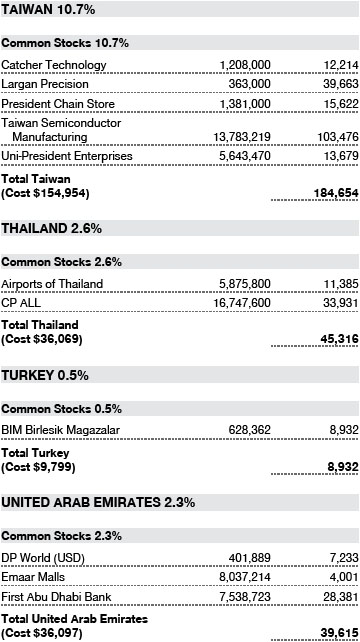
While our overweight in consumer discretionary stocks hurt results, stock selection contributed, led by our non-benchmark position in Argentina’s online trading platform, MercadoLibre, which generated strong earnings and sales gains that consistently beat consensus expectations. We believe the company can become the leading digital provider of financial services in an underserved region. South African retailer Mr Price Group also posted solid returns among our consumer discretionary names. Several longtime consumer staples companies, including Taiwan’s 7-Eleven convenience store chain operator, President Chain Store; Mexico’s leading retailer, Wal-Mart de Mexico; and China’s largest dairy producer, China Mengniu Dairy, were also top contributors.
How is the fund positioned?
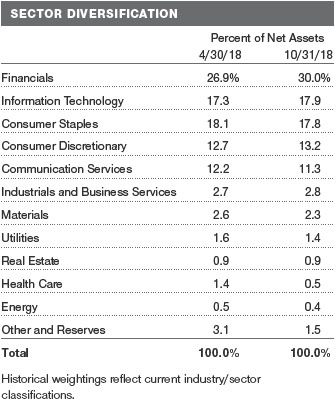
There were a few minor shifts to the portfolio’s country and sector positioning during the period. Most notably, we increased our overweight position in financials and increased our underweights to real estate and health care. We maintained our largest overweight country allocations to Brazil and South Africa. Given myriad geopolitical risks, trade tensions, and leadership changes in key countries, we continued to focus on our highest-conviction holdings—those that we believe present the best prospects for long-term secular growth.
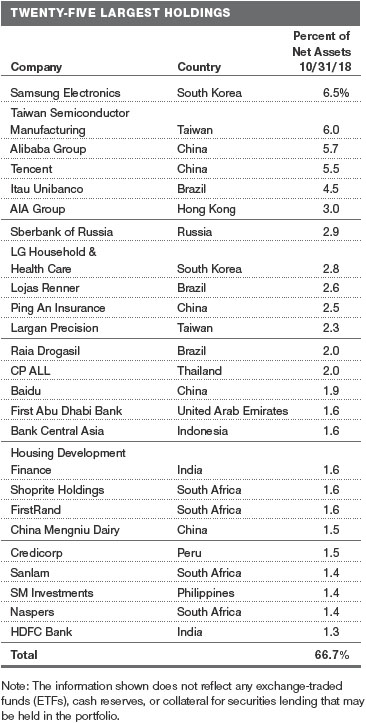
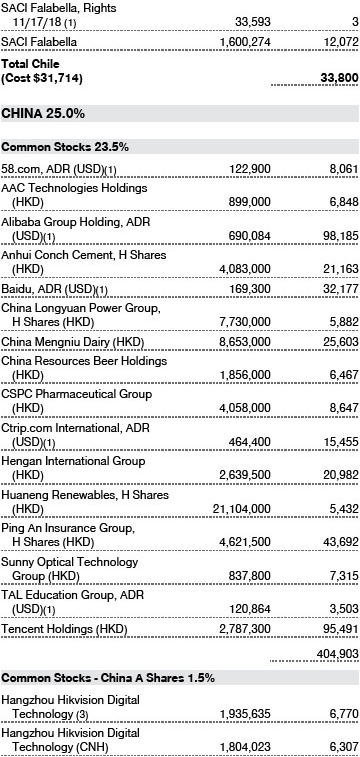
In China, we like companies with exposure to growing domestic demand and rising disposable income, such as Internet, consumer products, clean energy, and insurance companies. Our largest overweight positions include Alibaba Group and Tencent, the dominant social platform on both PC and mobile. We also have significant positions in several high-quality consumer companies that have strong management teams and a record of product innovation. Hengan International, a leading consumer paper company, and China Mengniu Dairy are two examples.
Brazil is our largest overweight allocation in Latin America. We believe the current government has made meaningful reforms, but we will be closely watching what policy moves President-elect Jair Bolsonaro makes after he takes office in January. We have significant stakes in financial companies, such as Itau Unibanco and Banco Bradesco. Brazil has a consolidated and, on average, well-capitalized banking system, and private banks are taking share from the still struggling public banks. We expect the private banks will further benefit from a pickup in loan growth as the economy improves. We are also overweight Raia Drogasil, a growing drug store operator, and Lojas Renner, a well-run Brazilian apparel retailer that benefits from an increasingly wealthy middle class. Lojas Renner should also benefit from consolidation in the apparel space.
In South Africa, we believe the new government of Cyril Ramaphosa is on track to boost economic growth. We increased our exposure to South Africa during the period, seizing on the positive political change to add to some of the well-run companies that offer exposure to faster-growing sub-Saharan African markets.
What is portfolio management’s outlook?
We remain optimistic on the outlook for emerging markets. The fundamentals for the economies remain strong and robust. Currencies have significantly depreciated—which is a plus for export-oriented countries—and, in some cases, they look very cheap. Valuations for emerging market equities are attractive relative to developed markets and to history, particularly after many emerging countries have slipped into a bear market—down more than 20% from previous highs—this year. We acknowledge that significant risks remain for the asset class, including escalating trade tensions and a further slowdown in China. Any surprises in the pace of Federal Reserve interest rate hikes or a stronger-than-expected U.S. dollar could also create headwinds.
We expect that countries that push forward with reforms should do well over time. The past 12 months have shown how these markets are better positioned to withstand challenges than in previous downturns, thanks to their improved current accounts, greater foreign exchange reserves, and higher real interest rates. Our long-term focus and deep research allow us to step into this uncertainty and add to companies that we believe will grow and be successful over the coming three to five years. This discipline has served our investors well over the long term.
The views expressed reflect the opinions of T. Rowe Price as of the date of this report and are subject to change based on changes in market, economic, or other conditions. These views are not intended to be a forecast of future events and are no guarantee of future results.
RISKS OF INTERNATIONAL INVESTING
Funds that invest overseas generally carry more risk than funds that invest strictly in U.S. assets. Funds investing in a single country or limited geographic region tend to be riskier than more diversified funds. Risks can result from varying stages of economic and political development; differing regulatory environments, trading days, and accounting standards; and higher transaction costs of non-U.S. markets. Non-U.S. investments are also subject to currency risk, or a decline in the value of a foreign currency versus the U.S. dollar, which reduces the dollar value of securities denominated in that currency.
The risks of international investing are heightened for securities of issuers in emerging market countries. Emerging market countries tend to have economic structures that are less diverse and mature, and political systems that are less stable, than those of developed countries. In addition to all of the risks of investing in international developed markets, emerging markets are more susceptible to governmental interference, local taxes being imposed on international investments, restrictions on gaining access to sales proceeds, and less liquid and less efficient trading markets.
BENCHMARK INFORMATION
Note: MSCI makes no express or implied warranties or representations and shall have no liability whatsoever with respect to any MSCI data contained herein. The MSCI data may not be further redistributed or used as a basis for other indices or any securities or financial products. This report is not approved, reviewed, or produced by MSCI.
GROWTH OF $1 MILLION
This chart shows the value of a hypothetical $1 million investment in the fund over the past 10 fiscal year periods or since inception (for funds lacking 10-year records). The result is compared with benchmarks, which include a broad-based market index and may also include a peer group average or index. Market indexes do not include expenses, which are deducted from fund returns as well as mutual fund averages and indexes.
AVERAGE ANNUAL COMPOUND TOTAL RETURN
FUND EXPENSE EXAMPLE
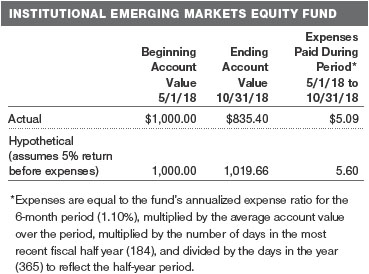
As a mutual fund shareholder, you may incur two types of costs: (1) transaction costs, such as redemption fees or sales loads, and (2) ongoing costs, including management fees, distribution and service (12b-1) fees, and other fund expenses. The following example is intended to help you understand your ongoing costs (in dollars) of investing in the fund and to compare these costs with the ongoing costs of investing in other mutual funds. The example is based on an investment of $1,000 invested at the beginning of the most recent six-month period and held for the entire period.
Actual Expenses
The first line of the following table (Actual) provides information about actual account values and actual expenses. You may use the information on this line, together with your account balance, to estimate the expenses that you paid over the period. Simply divide your account value by $1,000 (for example, an $8,600 account value divided by $1,000 = 8.6), then multiply the result by the number on the first line under the heading “Expenses Paid During Period” to estimate the expenses you paid on your account during this period.
Hypothetical Example for Comparison Purposes
The information on the second line of the table (Hypothetical) is based on hypothetical account values and expenses derived from the fund’s actual expense ratio and an assumed 5% per year rate of return before expenses (not the fund’s actual return). You may compare the ongoing costs of investing in the fund with other funds by contrasting this 5% hypothetical example and the 5% hypothetical examples that appear in the shareholder reports of the other funds. The hypothetical account values and expenses may not be used to estimate the actual ending account balance or expenses you paid for the period.
You should also be aware that the expenses shown in the table highlight only your ongoing costs and do not reflect any transaction costs, such as redemption fees or sales loads. Therefore, the second line of the table is useful in comparing ongoing costs only and will not help you determine the relative total costs of owning different funds. To the extent a fund charges transaction costs, however, the total cost of owning that fund is higher.
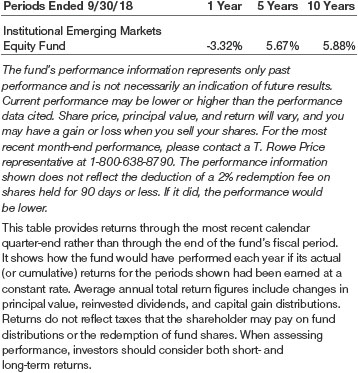
QUARTER-END RETURNS
The accompanying notes are an integral part of these financial statements.
The accompanying notes are an integral part of these financial statements.
The accompanying notes are an integral part of these financial statements.
The accompanying notes are an integral part of these financial statements.
The accompanying notes are an integral part of these financial statements.
| NOTES TO FINANCIAL STATEMENTS |
T. Rowe Price Institutional International Funds, Inc. (the corporation) is registered under the Investment Company Act of 1940 (the 1940 Act). The Institutional Emerging Markets Equity Fund (the fund) is a diversified, open-end management investment company established by the corporation. The fund seeks long-term growth of capital through investments primarily in the common stocks of companies located (or with primary operations) in emerging markets.
NOTE 1 - SIGNIFICANT ACCOUNTING POLICIES
Basis of Preparation The fund is an investment company and follows accounting and reporting guidance in the Financial Accounting Standards Board (FASB) Accounting Standards Codification Topic 946 (ASC 946). The accompanying financial statements were prepared in accordance with accounting principles generally accepted in the United States of America (GAAP), including, but not limited to, ASC 946. GAAP requires the use of estimates made by management. Management believes that estimates and valuations are appropriate; however, actual results may differ from those estimates, and the valuations reflected in the accompanying financial statements may differ from the value ultimately realized upon sale or maturity.
Investment Transactions, Investment Income, and Distributions Investment transactions are accounted for on the trade date basis. Income and expenses are recorded on the accrual basis. Realized gains and losses are reported on the identified cost basis. Income tax-related interest and penalties, if incurred, are recorded as income tax expense. Dividends received from mutual fund investments are reflected as dividend income; capital gain distributions are reflected as realized gain/loss. Dividend income and capital gain distributions are recorded on the ex-dividend date. Distributions to shareholders are recorded on the ex-dividend date. Income distributions, if any, are declared and paid annually. A capital gain distribution may also be declared and paid by the fund annually.
Currency Translation Assets, including investments, and liabilities denominated in foreign currencies are translated into U.S. dollar values each day at the prevailing exchange rate, using the mean of the bid and asked prices of such currencies against U.S. dollars as quoted by a major bank. Purchases and sales of securities, income, and expenses are translated into U.S. dollars at the prevailing exchange rate on the respective date of such transaction. The effect of changes in foreign currency exchange rates on realized and unrealized security gains and losses is not bifurcated from the portion attributable to changes in market prices.
Redemption Fees A 2% fee is assessed on redemptions of fund shares held for 90 days or less to deter short-term trading and to protect the interests of long-term shareholders. Redemption fees are withheld from proceeds that shareholders receive from the sale or exchange of fund shares. The fees are paid to the fund and are recorded as an increase to paid-in capital. The fees may cause the redemption price per share to differ from the net asset value per share.
New Accounting Guidance In March 2017, the FASB issued amended guidance to shorten the amortization period for certain callable debt securities held at a premium. The guidance is effective for fiscal years and interim periods beginning after December 15, 2018. Adoption will have no effect on the fund’s net assets or results of operations.
Indemnification In the normal course of business, the fund may provide indemnification in connection with its officers and directors, service providers, and/or private company investments. The fund’s maximum exposure under these arrangements is unknown; however, the risk of material loss is currently considered to be remote.
NOTE 2 - VALUATION
The fund’s financial instruments are valued and its net asset value (NAV) per share is computed at the close of the New York Stock Exchange (NYSE), normally 4 p.m. ET, each day the NYSE is open for business. However, the NAV per share may be calculated at a time other than the normal close of the NYSE if trading on the NYSE is restricted, if the NYSE closes earlier, or as may be permitted by the SEC.
Fair Value The fund’s financial instruments are reported at fair value, which GAAP defines as the price that would be received to sell an asset or paid to transfer a liability in an orderly transaction between market participants at the measurement date. The T. Rowe Price Valuation Committee (the Valuation Committee) is an internal committee that has been delegated certain responsibilities by the fund’s Board of Directors (the Board) to ensure that financial instruments are appropriately priced at fair value in accordance with GAAP and the 1940 Act. Subject to oversight by the Board, the Valuation Committee develops and oversees pricing-related policies and procedures and approves all fair value determinations. Specifically, the Valuation Committee establishes procedures to value securities; determines pricing techniques, sources, and persons eligible to effect fair value pricing actions; oversees the selection, services, and performance of pricing vendors; oversees valuation-related business continuity practices; and provides guidance on internal controls and valuation-related matters. The Valuation Committee reports to the Board and has representation from legal, portfolio management and trading, operations, risk management, and the fund’s treasurer.
Various valuation techniques and inputs are used to determine the fair value of financial instruments. GAAP establishes the following fair value hierarchy that categorizes the inputs used to measure fair value:
Level 1 – quoted prices (unadjusted) in active markets for identical financial instruments that the fund can access at the reporting date
Level 2 – inputs other than Level 1 quoted prices that are observable, either directly or indirectly (including, but not limited to, quoted prices for similar financial instruments in active markets, quoted prices for identical or similar financial instruments in inactive markets, interest rates and yield curves, implied volatilities, and credit spreads)
Level 3 – unobservable inputs
Observable inputs are developed using market data, such as publicly available information about actual events or transactions, and reflect the assumptions that market participants would use to price the financial instrument. Unobservable inputs are those for which market data are not available and are developed using the best information available about the assumptions that market participants would use to price the financial instrument. GAAP requires valuation techniques to maximize the use of relevant observable inputs and minimize the use of unobservable inputs. When multiple inputs are used to derive fair value, the financial instrument is assigned to the level within the fair value hierarchy based on the lowest-level input that is significant to the fair value of the financial instrument. Input levels are not necessarily an indication of the risk or liquidity associated with financial instruments at that level but rather the degree of judgment used in determining those values.
Valuation Techniques Equity securities listed or regularly traded on a securities exchange or in the over-the-counter (OTC) market are valued at the last quoted sale price or, for certain markets, the official closing price at the time the valuations are made. OTC Bulletin Board securities are valued at the mean of the closing bid and asked prices. A security that is listed or traded on more than one exchange is valued at the quotation on the exchange determined to be the primary market for such security. Listed securities not traded on a particular day are valued at the mean of the closing bid and asked prices for domestic securities and the last quoted sale or closing price for international securities.
For valuation purposes, the last quoted prices of non-U.S. equity securities may be adjusted to reflect the fair value of such securities at the close of the NYSE. If the fund determines that developments between the close of a foreign market and the close of the NYSE will affect the value of some or all of its portfolio securities, the fund will adjust the previous quoted prices to reflect what it believes to be the fair value of the securities as of the close of the NYSE. In deciding whether it is necessary to adjust quoted prices to reflect fair value, the fund reviews a variety of factors, including developments in foreign markets, the performance of U.S. securities markets, and the performance of instruments trading in U.S. markets that represent foreign securities and baskets of foreign securities. The fund may also fair value securities in other situations, such as when a particular foreign market is closed but the fund is open. The fund uses outside pricing services to provide it with quoted prices and information to evaluate or adjust those prices. The fund cannot predict how often it will use quoted prices and how often it will determine it necessary to adjust those prices to reflect fair value. As a means of evaluating its security valuation process, the fund routinely compares quoted prices, the next day’s opening prices in the same markets, and adjusted prices.
Actively traded equity securities listed on a domestic exchange generally are categorized in Level 1 of the fair value hierarchy. Non-U.S. equity securities generally are categorized in Level 2 of the fair value hierarchy despite the availability of quoted prices because, as described above, the fund evaluates and determines whether those quoted prices reflect fair value at the close of the NYSE or require adjustment. OTC Bulletin Board securities, certain preferred securities, and equity securities traded in inactive markets generally are categorized in Level 2 of the fair value hierarchy.
Investments in mutual funds are valued at the mutual fund’s closing NAV per share on the day of valuation and are categorized in Level 1 of the fair value hierarchy. Assets and liabilities other than financial instruments, including short-term receivables and payables, are carried at cost, or estimated realizable value, if less, which approximates fair value.
Thinly traded financial instruments and those for which the above valuation procedures are inappropriate or are deemed not to reflect fair value are stated at fair value as determined in good faith by the Valuation Committee. The objective of any fair value pricing determination is to arrive at a price that could reasonably be expected from a current sale. Financial instruments fair valued by the Valuation Committee are primarily private placements, restricted securities, warrants, rights, and other securities that are not publicly traded.
Subject to oversight by the Board, the Valuation Committee regularly makes good faith judgments to establish and adjust the fair valuations of certain securities as events occur and circumstances warrant. For instance, in determining the fair value of an equity investment with limited market activity, such as a private placement or a thinly traded public company stock, the Valuation Committee considers a variety of factors, which may include, but are not limited to, the issuer’s business prospects, its financial standing and performance, recent investment transactions in the issuer, new rounds of financing, negotiated transactions of significant size between other investors in the company, relevant market valuations of peer companies, strategic events affecting the company, market liquidity for the issuer, and general economic conditions and events. In consultation with the investment and pricing teams, the Valuation Committee will determine an appropriate valuation technique based on available information, which may include both observable and unobservable inputs. The Valuation Committee typically will afford greatest weight to actual prices in arm’s length transactions, to the extent they represent orderly transactions between market participants; transaction information can be reliably obtained, and prices are deemed representative of fair value. However, the Valuation Committee may also consider other valuation methods such as market-based valuation multiples; a discount or premium from market value of a similar, freely traded security of the same issuer; or some combination. Fair value determinations are reviewed on a regular basis and updated as information becomes available, including actual purchase and sale transactions of the issue. Because any fair value determination involves a significant amount of judgment, there is a degree of subjectivity inherent in such pricing decisions, and fair value prices determined by the Valuation Committee could differ from those of other market participants. Depending on the relative significance of unobservable inputs, including the valuation technique(s) used, fair valued securities may be categorized in Level 2 or 3 of the fair value hierarchy.
Valuation Inputs The following table summarizes the fund’s financial instruments, based on the inputs used to determine their fair values on October 31, 2018 (for further detail by category, please refer to the accompanying Portfolio of Investments):
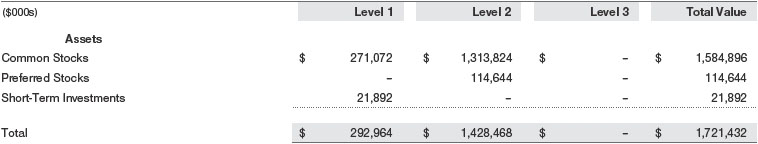
There were no material transfers between Levels 1 and 2 during the year ended October 31, 2018.
NOTE 3 - OTHER INVESTMENT TRANSACTIONS
Consistent with its investment objective, the fund engages in the following practices to manage exposure to certain risks and/or to enhance performance. The investment objective, policies, program, and risk factors of the fund are described more fully in the fund’s prospectus and Statement of Additional Information.
Emerging and Frontier Markets The fund may invest, either directly or through investments in T. Rowe Price institutional funds, in securities of companies located in, issued by governments of, or denominated in or linked to the currencies of emerging and frontier market countries; at period-end, approximately 93% of the fund’s net assets were invested in emerging markets and 2% in frontier markets. Emerging markets, and to a greater extent frontier markets, generally have economic structures that are less diverse and mature, and political systems that are less stable, than developed countries. These markets may be subject to greater political, economic, and social uncertainty and differing regulatory environments that may potentially impact the fund’s ability to buy or sell certain securities or repatriate proceeds to U.S. dollars. Such securities are often subject to greater price volatility, less liquidity, and higher rates of inflation than U.S. securities. Investing in frontier markets is significantly riskier than investing in other countries, including emerging markets.
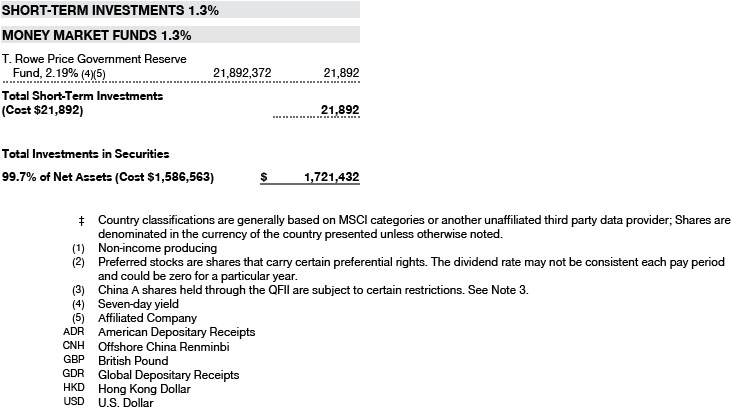
China A Shares The fund invests in certain Chinese equity securities (A shares) that have limited availability to investors outside of China. The fund gains access to the A share market through the Shanghai-Hong Kong Stock Connect program (Shanghai Stock Connect), through the Shenzhen-Hong Kong Stock Connect program (Shenzhen Stock Connect), or through a wholly owned subsidiary of Price Associates, which serves as the registered Qualified Foreign Institutional Investor (QFII) for all participating T. Rowe Price-sponsored products (each a participating account). Related to A shares held through the QFII, investment decisions are specific to each participating account, and each account bears the economic consequences of its holdings and transactions in A shares. Further, the fund’s ability to repatriate cash associated with its A shares held through the QFII is subject to certain restrictions and administrative processes involving the Chinese government; consequently, the fund may experience substantial delays in gaining access to its assets or incur a loss of value in the event of noncompliance with governmental requirements. A shares acquired through the QFII are valued using the onshore renminbi exchange rate (CNY), and those acquired through the Shanghai Stock Connect and the Shenzhen Stock Connect are valued using the offshore renminbi exchange rate (CNH). CNY and CNH exchange rates may differ; accordingly, A shares of the same issue purchased through different channels may not have the same U.S. dollar value. Generally, the fund is not subject to capital gains tax related to its A share investments.
Other Purchases and sales of portfolio securities other than short-term securities aggregated $672,761,000 and $246,330,000, respectively, for the year ended October 31, 2018.
NOTE 4 - FEDERAL INCOME TAXES
No provision for federal income taxes is required since the fund intends to continue to qualify as a regulated investment company under Subchapter M of the Internal Revenue Code and distribute to shareholders all of its taxable income and gains. Distributions determined in accordance with federal income tax regulations may differ in amount or character from net investment income and realized gains for financial reporting purposes. Financial reporting records are adjusted for permanent book/tax differences to reflect tax character but are not adjusted for temporary differences.
The fund files U.S. federal, state, and local tax returns as required. The fund’s tax returns are subject to examination by the relevant tax authorities until expiration of the applicable statute of limitations, which is generally three years after the filing of the tax return but which can be extended to six years in certain circumstances. Tax returns for open years have incorporated no uncertain tax positions that require a provision for income taxes.
Reclassifications between income and gain relate primarily to the character of net currency losses. For the year ended October 31, 2018, the following reclassifications were recorded to reflect tax character (there was no impact on results of operations or net assets):
Distributions during the years ended October 31, 2018 and October 31, 2017, totaled $9,264,000 and $7,696,000, respectively, and were characterized as ordinary income for tax purposes. At October 31, 2018, the tax-basis cost of investments and components of net assets were as follows:
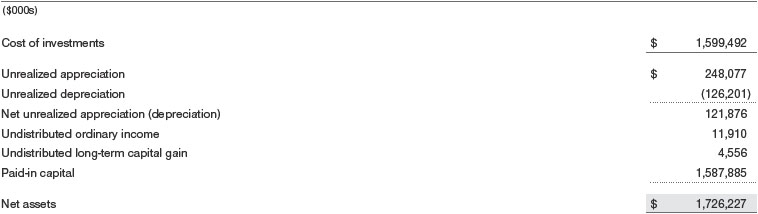
The difference between book-basis and tax-basis net unrealized appreciation (depreciation) is attributable to the deferral of losses from wash sales, and the realization of gains/losses on passive foreign investment companies for tax purposes.
The fund intends to retain realized gains to the extent of available capital loss carryforwards. Because the fund is required to use capital loss carryforwards that do not expire before those with expiration dates, all or a portion of its capital loss carryforwards subject to expiration could ultimately go unused. During the year ended October 31, 2018, the fund utilized $4,711,000 of capital loss carryforwards.
NOTE 5 - FOREIGN TAXES
The fund is subject to foreign income taxes imposed by certain countries in which it invests. Additionally, certain foreign currency transactions are subject to tax, and capital gains realized upon disposition of securities issued in or by certain foreign countries are subject to capital gains tax imposed by those countries. All taxes are computed in accordance with the applicable foreign tax law, and, to the extent permitted, capital losses are used to offset capital gains. Taxes attributable to income are accrued by the fund as a reduction of income. Taxes incurred on the purchase of foreign currencies are recorded as realized loss on foreign currency transactions. Current and deferred tax expense attributable to capital gains is reflected as a component of realized or change in unrealized gain/loss on securities in the accompanying financial statements. At October 31, 2018, the fund had no deferred tax liability attributable to foreign securities and $3,793,000 of foreign capital loss carryforwards, including $710,000 that expire in 2020, $548,000 that expire in 2022, $1,082,000 that expire in 2024, $126,000 that expire in 2026, and $1,327,000 that expire in 2027.
NOTE 6 - RELATED PARTY TRANSACTIONS
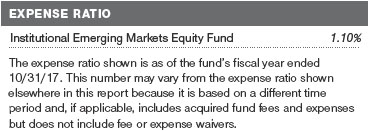
The fund is managed by T. Rowe Price Associates, Inc. (Price Associates), a wholly owned subsidiary of T. Rowe Price Group, Inc. (Price Group). Price Associates has entered into a sub-advisory agreement(s) with one or more of its wholly owned subsidiaries, to provide investment advisory services to the fund. The investment management and administrative agreement between the fund and Price Associates provides for an all-inclusive annual fee equal to 1.10% of the fund’s average daily net assets. The fee is computed daily and paid monthly. The all-inclusive fee covers investment management, shareholder servicing, transfer agency, accounting, and custody services provided to the fund, as well as fund directors’ fees and expenses. Interest, taxes, brokerage commissions, and other non-recurring expenses permitted by the investment management agreement are paid directly by the fund.
Mutual funds, trusts, and other accounts managed by Price Associates or its affiliates (collectively, Price Funds and accounts) may invest in the fund. No Price fund or account may invest for the purpose of exercising management or control over the fund. At October 31, 2018, approximately 13% of the fund’s outstanding shares were held by Price Funds and accounts.
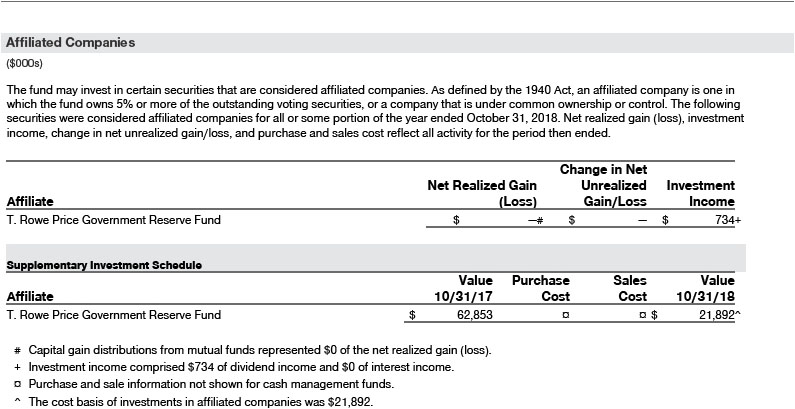
The fund may invest its cash reserves in certain open-end management investment companies managed by Price Associates and considered affiliates of the fund: the T. Rowe Price Government Reserve Fund or the T. Rowe Price Treasury Reserve Fund, organized as money market funds, or the T. Rowe Price Short-Term Fund, a short-term bond fund (collectively, the Price Reserve Funds). The Price Reserve Funds are offered as short-term investment options to mutual funds, trusts, and other accounts managed by Price Associates or its affiliates and are not available for direct purchase by members of the public. Cash collateral from securities lending is invested in the T. Rowe Price Short-Term Fund. The Price Reserve Funds pay no investment management fees.
The fund may participate in securities purchase and sale transactions with other funds or accounts advised by Price Associates (cross trades), in accordance with procedures adopted by the fund’s Board and Securities and Exchange Commission rules, which require, among other things, that such purchase and sale cross trades be effected at the independent current market price of the security. During the year ended October 31, 2018, the fund had no purchases or sales cross trades with other funds or accounts advised by Price Associates.
Report of Independent Registered Public Accounting Firm
To the Board of Directors of T. Rowe Price Institutional International Funds, Inc. and
Shareholders of T. Rowe Price Institutional Emerging Markets Equity Fund
Opinion on the Financial Statements
We have audited the accompanying statement of assets and liabilities, including the portfolio of investments, of T. Rowe Price Institutional Emerging Markets Equity Fund (one of the funds constituting T. Rowe Price Institutional International Funds, Inc., hereafter referred to as the “Fund”) as of October 31, 2018, the related statement of operations for the year ended October 31, 2018, the statement of changes in net assets for each of the two years in the period ended October 31, 2018, including the related notes, and the financial highlights for each of the five years in the period ended October 31, 2018 (collectively referred to as the “financial statements”). In our opinion, the financial statements present fairly, in all material respects, the financial position of the Fund as of October 31, 2018, the results of its operations for the year then ended, the changes in its net assets for each of the two years in the period ended October 31, 2018 and the financial highlights for each of the five years in the period ended October 31, 2018 in conformity with accounting principles generally accepted in the United States of America.
Basis for Opinion
These financial statements are the responsibility of the Fund’s management. Our responsibility is to express an opinion on the Fund’s financial statements based on our audits. We are a public accounting firm registered with the Public Company Accounting Oversight Board (United States) (“PCAOB”) and are required to be independent with respect to the Fund in accordance with the U.S. federal securities laws and the applicable rules and regulations of the Securities and Exchange Commission and the PCAOB.
We conducted our audits of these financial statements in accordance with the standards of the PCAOB. Those standards require that we plan and perform the audit to obtain reasonable assurance about whether the financial statements are free of material misstatement, whether due to error or fraud.
Our audits included performing procedures to assess the risks of material misstatement of the financial statements, whether due to error or fraud, and performing procedures that respond to those risks. Such procedures included examining, on a test basis, evidence regarding the amounts and disclosures in the financial statements. Our audits also included evaluating the accounting principles used and significant estimates made by management, as well as evaluating the overall presentation of the financial statements. Our procedures included confirmation of securities owned as of October 31, 2018 by correspondence with the custodian, transfer agent and brokers; when replies were not received from brokers, we performed other auditing procedures. We believe that our audits provide a reasonable basis for our opinion.
PricewaterhouseCoopers LLP
Baltimore, Maryland
December 17, 2018
We have served as the auditor of one or more investment companies in the T. Rowe Price group of investment companies since 1973.
TAX INFORMATION (UNAUDITED) FOR THE TAX YEAR ENDED 10/31/18
We are providing this information as required by the Internal Revenue Code. The amounts shown may differ from those elsewhere in this report because of differences between tax and financial reporting requirements.
For taxable non-corporate shareholders, $17,870,000 of the fund’s income represents qualified dividend income subject to a long-term capital gains tax rate of not greater than 20%.
For corporate shareholders, $202,000 of the fund’s income qualifies for the dividends received deduction.
The fund will pass through foreign source income of $17,620,000 and foreign taxes paid of $4,487,000.
INFORMATION ON PROXY VOTING POLICIES, PROCEDURES, AND RECORDS
A description of the policies and procedures used by T. Rowe Price funds and portfolios to determine how to vote proxies relating to portfolio securities is available in each fund’s Statement of Additional Information. You may request this document by calling 1-800-225-5132 or by accessing the SEC’s website, sec.gov.
The description of our proxy voting policies and procedures is also available on our corporate website. To access it, please visit the following Web page:
https://www3.troweprice.com/usis/corporate/en/utility/policies.html
Scroll down to the section near the bottom of the page that says, “Proxy Voting Policies.” Click on the Proxy Voting Policies link in the shaded box.
Each fund’s most recent annual proxy voting record is available on our website and through the SEC’s website. To access it through T. Rowe Price, visit the website location shown above, and scroll down to the section near the bottom of the page that says, “Proxy Voting Records.” Click on the Proxy Voting Records link in the shaded box.
HOW TO OBTAIN QUARTERLY PORTFOLIO HOLDINGS
The fund files a complete schedule of portfolio holdings with the Securities and Exchange Commission for the first and third quarters of each fiscal year on Form N-Q. The fund’s Form N-Q is available electronically on the SEC’s website (sec.gov); hard copies may be reviewed and copied at the SEC’s Public Reference Room, 100 F St. N.E., Washington, DC 20549. For more information on the Public Reference Room, call 1-800-SEC-0330.
ABOUT THE FUND’S DIRECTORS AND OFFICERS
Your fund is overseen by a Board of Directors (Board) that meets regularly to review a wide variety of matters affecting or potentially affecting the fund, including performance, investment programs, compliance matters, advisory fees and expenses, service providers, and business and regulatory affairs. The Board elects the fund’s officers, who are listed in the final table. At least 75% of the Board’s members are independent of T. Rowe Price Associates, Inc. (T. Rowe Price), and its affiliates; “inside” or “interested” directors are employees or officers of T. Rowe Price. The business address of each director and officer is 100 East Pratt Street, Baltimore, Maryland 21202. The Statement of Additional Information includes additional information about the fund directors and is available without charge by calling a T. Rowe Price representative at 1-800-638-5660.
| INDEPENDENT DIRECTORS(a) | ||
| Name (Year of Birth) Year Elected [Number of T. Rowe Price Portfolios Overseen] | Principal Occupation(s) and Directorships of Public Companies and Other Investment Companies During the Past Five Years | |
| Teresa Bryce Bazemore(b) (1959) 2018 [189] | President, Radian Guaranty (2008 to 2017); Member, Bazemore Consulting LLC (2018 to present); Member, Chimera Investment Corporation (2017 to present); Member, Federal Home Loan Bank of Pittsburgh (2017 to present) | |
| Ronald J. Daniels(b) (1959) 2018 [189] | President, The Johns Hopkins University(c) and Professor, Political Science Department, The Johns Hopkins University (2009 to present); Director, Lyndhurst Holdings (2015 to present) | |
| Bruce W. Duncan (1951) 2013 [189] | Chief Executive Officer and Director (January 2009 to December 2016), Chairman of the Board (January 2016 to present), and President (January 2009 to September 2016), First Industrial Realty Trust, an owner and operator of industrial properties; Chairman of the Board (2005 to September 2016) and Director (1999 to September 2016), Starwood Hotels & Resorts, a hotel and leisure company; Director, Boston Properties (May 2016 to present); Director, Marriott International, Inc. (September 2016 to present) | |
| Robert J. Gerrard, Jr. (1952) 2012 [189] | Advisory Board Member, Pipeline Crisis/Winning Strategies, a collaborative working to improve opportunities for young African Americans (1997 to present); Chairman of the Board, all funds (since July 2018) | |
| Paul F. McBride (1956) 2013 [189] | Advisory Board Member, Vizzia Technologies (2015 to present); Board Member, Dunbar Armored (2012 to present) | |
| Cecilia E. Rouse, Ph.D. (1963) 2012 [189] | Dean, Woodrow Wilson School (2012 to present); Professor and Researcher, Princeton University (1992 to present); Member of National Academy of Education (2010 to present); Director, MDRC, a nonprofit education and social policy research organization (2011 to present); Research Associate of Labor Studies Program at the National Bureau of Economic Research (2011 to 2015); Board Member of the National Bureau of Economic Research (2011 to present); Chair of Committee on the Status of Minority Groups in the Economic Profession of the American Economic Association (2012 to 2017); Vice President (2015 to 2016), American Economic Association | |
| John G. Schreiber (1946) 2001 [189] | Owner/President, Centaur Capital Partners, Inc., a real estate investment company (1991 to present); Cofounder, Partner, and Cochairman of the Investment Committee, Blackstone Real Estate Advisors, L.P. (1992 to 2015); Director, General Growth Properties, Inc. (2010 to 2013); Director, Blackstone Mortgage Trust, a real estate finance company (2012 to 2016); Director and Chairman of the Board, Brixmor Property Group, Inc. (2013 to present); Director, Hilton Worldwide (2013 to present); Director, Hudson Pacific Properties (2014 to 2016); Director, Invitation Homes (2014 to present) | |
| Mark R. Tercek (1957) 2009 [189] | President and Chief Executive Officer, The Nature Conservancy (2008 to present) | |
| (a)All information about the independent directors was current as of December 31, 2017, except for the information provided for Ms. Bazemore and Mr. Daniels, which is current as of January 1, 2018. | ||
| (b)Effective January 1, 2018, Ms. Bazemore and Mr. Daniels were elected as independent directors of the Price Funds. | ||
| (c)William J. Stromberg, president and chief executive officer of T. Rowe Price Group, Inc., the parent company of the Price Funds’ investment advisor, has served on the Board of Trustees of Johns Hopkins University since 2014 and is a member of the Johns Hopkins University Board’s Compensation Committee. | ||
| INSIDE DIRECTORS | ||
| Name (Year of Birth) Year Elected* [Number of T. Rowe Price Portfolios Overseen] | Principal Occupation(s) and Directorships of Public Companies and Other Investment Companies During the Past Five Years | |
| Edward C. Bernard** (1956) 2006 [0] | Director and Vice President, T. Rowe Price; Vice Chairman of the Board, Director, and Vice President, T. Rowe Price Group, Inc.; Chairman of the Board, Director, and Vice President, T. Rowe Price Investment Services, Inc., and T. Rowe Price Services, Inc.; Chairman of the Board and Director, T. Rowe Price Retirement Plan Services, Inc.; Chairman of the Board, Chief Executive Officer, Director, and President, T. Rowe Price International and T. Rowe Price Trust Company; Chairman of the Board, all funds (2006 to July 2018) | |
| David Oestreicher (1967) 2018 [189] | Chief Legal Officer, Vice President, and Secretary, T. Rowe Price Group, Inc.; Director, Vice President, and Secretary, T. Rowe Price Investment Services, Inc., T. Rowe Price Retirement Plan Services, Inc., T. Rowe Price Services, Inc., and T. Rowe Price Trust Company; Vice President and Secretary, T. Rowe Price, T. Rowe Price Hong Kong, and T. Rowe Price International; Vice President, T. Rowe Price Japan and T. Rowe Price Singapore; Principal Executive Officer and Executive Vice President, all funds | |
| Robert W. Sharps, CFA, CPA (1971) 2017 [135] | Vice President, T. Rowe Price, T. Rowe Price Group, Inc., and T. Rowe Price Trust Company; Vice President Institutional International Funds | |
| *Each inside director serves until retirement, resignation, or election of a successor. | ||
| **Effective at the conclusion of a meeting of the Boards of the Price Funds held on July 25, 2018, Mr. Bernard resigned from his role as a director and chairman of the Boards of all the Price Funds. | ||
| OFFICERS | ||
| Name (Year of Birth) Position Held With Institutional International Funds | Principal Occupation(s) | |
| Ulle Adamson, CFA (1979) Vice President | Vice President, T. Rowe Price Group, Inc., and T. Rowe Price International | |
| Roy H. Adkins (1970) Vice President | Vice President, T. Rowe Price Group, Inc., and T. Rowe Price International | |
| Christopher D. Alderson (1962) President | Director and Vice President, T. Rowe Price International; Vice President, Price Hong Kong, Price Singapore, and T. Rowe Price Group, Inc. | |
| Kennard W. Allen (1977) Vice President | Vice President, T. Rowe Price and T. Rowe Price Group, Inc. | |
| Paulina Amieva (1981) Vice President | Vice President, T. Rowe Price and T. Rowe Price Group, Inc. | |
| Malik S. Asif (1981) Vice President | Vice President, T. Rowe Price Group, Inc., and T. Rowe Price International | |
| Ziad Bakri, M.D., CFA (1980) Vice President | Vice President, T. Rowe Price and T. Rowe Price Group, Inc. | |
| Harishankar Balkrishna (1983) Vice President | Vice President, T. Rowe Price Group, Inc., and T. Rowe Price International | |
| Sheena L. Barbosa (1983) Vice President | Vice President, Price Hong Kong and T. Rowe Price Group, Inc. | |
| Peter J. Bates, CFA (1974) Vice President | Vice President, T. Rowe Price and T. Rowe Price Group, Inc. | |
| Oliver D.M. Bell (1969) Executive Vice President | Vice President, T. Rowe Price Group, Inc., and T. Rowe Price International | |
| R. Scott Berg, CFA (1972) Executive Vice President | Vice President, T. Rowe Price and T. Rowe Price Group, Inc. | |
| Steven E. Boothe, CFA (1977) Vice President | Vice President, T. Rowe Price and T. Rowe Price Group, Inc. | |
| Peter I. Botoucharov (1965) Vice President | Vice President, T. Rowe Price Group, Inc., and T. Rowe Price International | |
| Tala Boulos (1984) Vice President | Vice President, T. Rowe Price Group, Inc., and T. Rowe Price International | |
| Darrell N. Braman (1963) Vice President and Secretary | Vice President, Price Hong Kong, Price Singapore, T. Rowe Price, T. Rowe Price Group, Inc., T. Rowe Price International, T. Rowe Price Investment Services, Inc., and T. Rowe Price Services, Inc. | |
| Carolyn Hoi Che Chu (1974) Vice President | Vice President, Price Hong Kong and T. Rowe Price Group, Inc. | |
| Archibald Ciganer Albeniz, CFA (1976) Vice President | Vice President, T. Rowe Price Group, Inc., and T. Rowe Price International | |
| Richard N. Clattenburg, CFA (1979) Executive Vice President | Vice President, Price Singapore, T. Rowe Price, T. Rowe Price Group, Inc., and T. Rowe Price International | |
| Michael J. Conelius, CFA (1964) Executive Vice President | Vice President, T. Rowe Price, T. Rowe Price Group, Inc., T. Rowe Price International, and T. Rowe Price Trust Company | |
| Michael Della Vedova (1969) Vice President | Vice President, T. Rowe Price Group, Inc., and T. Rowe Price International | |
| Richard de los Reyes (1975) Vice President | Vice President, T. Rowe Price, T. Rowe Price Group, Inc., and T. Rowe Price Trust Company | |
| Shawn T. Driscoll (1975) Vice President | Vice President, T. Rowe Price, T. Rowe Price Group, Inc., and T. Rowe Price Trust Company | |
| Bridget A. Ebner (1970) Vice President | Vice President, T. Rowe Price and T. Rowe Price Group, Inc. | |
| David J. Eiswert, CFA (1972) Executive Vice President | Vice President, T. Rowe Price, T. Rowe Price Group, Inc., and T. Rowe Price International | |
| Mark S. Finn, CFA, CPA (1963) Vice President | Vice President, T. Rowe Price, T. Rowe Price Group, Inc., and T. Rowe Price Trust Company | |
| Quentin S. Fitzsimmons (1968) Vice President | Vice President, T. Rowe Price Group, Inc., and T. Rowe Price International; formerly, Portfolio Manager, Royal Bank of Scotland Group (to 2015) | |
| Aaron Gifford, CFA (1987) Vice President | Vice President, T. Rowe Price; formerly, Strategist, Morgan Stanley & Co. LLC (to 2017); formerly, Strategist, HSBC Securities (to 2013) | |
| John R. Gilner (1961) Chief Compliance Officer | Chief Compliance Officer and Vice President, T. Rowe Price; Vice President, T. Rowe Price Group, Inc., and T. Rowe Price Investment Services, Inc. | |
| Gary J. Greb (1961) Vice President | Vice President, T. Rowe Price, T. Rowe Price International, and T. Rowe Price Trust Company | |
| Paul D. Greene II (1978) Vice President | Vice President, T. Rowe Price and T. Rowe Price Group, Inc. | |
| Benjamin Griffiths, CFA (1977) Vice President | Vice President, T. Rowe Price Group, Inc., and T. Rowe Price International | |
| Amanda B. Hall, CFA (1985) Vice President | Vice President, T. Rowe Price Group, Inc., and T. Rowe Price International; formerly, student, Stanford Graduate School of Business (to 2014) | |
| Richard L. Hall (1979) Vice President | Vice President, T. Rowe Price and T. Rowe Price Group, Inc. | |
| Nabil Hanano, CFA (1984) Vice President | Vice President, T. Rowe Price International | |
| Steven C. Huber, CFA, FSA (1958) Vice President | Vice President, T. Rowe Price, T. Rowe Price Group, Inc., and T. Rowe Price International | |
| Stefan Hubrich, Ph.D., CFA (1974) Vice President | Vice President, T. Rowe Price and T. Rowe Price Group, Inc. | |
| Arif Husain, CFA (1972) Executive Vice President | Vice President, T. Rowe Price Group, Inc., and T. Rowe Price International | |
| Tetsuji Inoue (1971) Vice President | Vice President, T. Rowe Price Group, Inc., and T. Rowe Price International | |
| Randal S. Jenneke (1971) Vice President | Vice President, T. Rowe Price Group, Inc., and T. Rowe Price International | |
| Nina P. Jones, CPA (1980) Vice President | Vice President, T. Rowe Price and T. Rowe Price Group, Inc. | |
| Yoichiro Kai (1973) Vice President | Vice President, T. Rowe Price Group, Inc., and T. Rowe Price International | |
| Jai Kapadia (1982) Vice President | Vice President, Price Hong Kong and T. Rowe Price Group, Inc. | |
| Andrew J. Keirle (1974) Executive Vice President | Vice President, T. Rowe Price Group, Inc., and T. Rowe Price International | |
| Paul J. Krug, CPA (1964) Vice President | Vice President, T. Rowe Price, T. Rowe Price Group, Inc., and T. Rowe Price Trust Company | |
| Christopher J. Kushlis, CFA (1976) Vice President | Vice President, T. Rowe Price Group, Inc., and T. Rowe Price International | |
| Mark J. Lawrence (1970) Vice President | Vice President, T. Rowe Price Group, Inc., and T. Rowe Price International | |
| Johannes Loefstrand (1988) Vice President | Employee, T. Rowe Price; formerly, Investment Analyst, Arisaig Partners (to 2013) | |
| Anh Lu (1968) Vice President | Vice President, Price Hong Kong and T. Rowe Price Group, Inc. | |
| Sebastien Mallet (1974) Executive Vice President | Vice President, T. Rowe Price Group, Inc., and T. Rowe Price International | |
| Daniel Martino, CFA (1974) Vice President | Vice President, T. Rowe Price and T. Rowe Price Group, Inc. | |
| Catherine D. Mathews (1963) Treasurer and Vice President | Vice President, T. Rowe Price, T. Rowe Price Group, Inc., and T. Rowe Price Trust Company | |
| Raymond A. Mills, Ph.D., CFA (1960) Executive Vice President | Vice President, T. Rowe Price, T. Rowe Price Group, Inc., T. Rowe Price International, and T. Rowe Price Trust Company | |
| Eric C. Moffett (1974) Vice President | Vice President, Price Hong Kong and T. Rowe Price Group, Inc. | |
| Tobias F. Mueller (1980) Vice President | Vice President, T. Rowe Price Group, Inc., and T. Rowe Price International | |
| Sudhir Nanda, Ph.D., CFA (1959) Vice President | Vice President, T. Rowe Price and T. Rowe Price Group, Inc. | |
| Thibault Nardin (1983) Vice President | Vice President, T. Rowe Price Group, Inc., and T. Rowe Price International | |
| Joshua Nelson (1977) Executive Vice President | Vice President, T. Rowe Price, T. Rowe Price Group, Inc., and T. Rowe Price International | |
| Jason Nogueira, CFA (1974) Executive Vice President | Vice President, T. Rowe Price and T. Rowe Price Group, Inc. | |
| Kenneth A. Orchard (1975) Executive Vice President | Vice President, T. Rowe Price Group, Inc., and T. Rowe Price International | |
| Oluwaseun A. Oyegunle, CFA (1984) Vice President | Vice President, T. Rowe Price Group, Inc., and T. Rowe Price International | |
| Gonzalo Pángaro, CFA (1968) Executive Vice President | Vice President, T. Rowe Price Group, Inc., and T. Rowe Price International | |
| John W. Ratzesberger (1975) Vice President | Vice President, T. Rowe Price, T. Rowe Price Group, Inc., and T. Rowe Price Trust Company; formerly, North American Head of Listed Derivatives Operation, Morgan Stanley (to 2013) | |
| Shannon H. Rauser (1987) Assistant Secretary | Employee, T. Rowe Price | |
| Federico Santilli, CFA (1974) Executive Vice President | Vice President, T. Rowe Price Group, Inc., and T. Rowe Price International | |
| Sebastian Schrott (1977) Vice President | Vice President, T. Rowe Price Group, Inc., and T. Rowe Price International | |
| John C.A. Sherman (1969) Vice President | Vice President, T. Rowe Price Group, Inc., and T. Rowe Price International | |
| Gabriel Solomon (1977) Vice President | Vice President, T. Rowe Price and T. Rowe Price Group, Inc. | |
| Joshua K. Spencer, CFA (1973) Vice President | Vice President, T. Rowe Price and T. Rowe Price Group, Inc. | |
| David A. Stanley (1963) Vice President | Vice President, T. Rowe Price Group, Inc., and T. Rowe Price International | |
| Taymour R. Tamaddon, CFA (1976) Vice President | Vice President, T. Rowe Price and T. Rowe Price Group, Inc. | |
| Ju Yen Tan (1972) Vice President | Vice President, T. Rowe Price Group, Inc., and T. Rowe Price International | |
| Dean Tenerelli (1964) Vice President | Vice President, T. Rowe Price Group, Inc., and T. Rowe Price International | |
| Eric L. Veiel, CFA (1972) Vice President | Vice President, T. Rowe Price, T. Rowe Price Group, Inc., and T. Rowe Price Trust Company | |
| Rupinder Vig (1979) Vice President | Vice President, T. Rowe Price Group, Inc., and T. Rowe Price International; formerly, Partner, Egerton Capital (to 2016); formerly, Executive Director, Morgan Stanley (to 2014) | |
| Zenon Voyiatzis (1971) Vice President | Vice President, T. Rowe Price Group, Inc., and T. Rowe Price International; formerly, Managing Director, UBS Global Asset Management (to 2015) | |
| Verena Wachnitz, CFA (1978) Vice President | Vice President, T. Rowe Price Group, Inc., and T. Rowe Price International | |
| Dai Wang (1989) Vice President | Vice President, Price Hong Kong and T. Rowe Price Group, Inc.; formerly, student, Harvard Business School (to 2014) | |
| Megan Warren (1968) Vice President | Vice President, T. Rowe Price, T. Rowe Price Group, Inc., T. Rowe Price Retirement Plan Services, Inc., T. Rowe Price Services, Inc., and T. Rowe Price Trust Company; formerly, Executive Director, JP Morgan Chase (to 2017) | |
| Christopher S. Whitehouse (1972) Vice President | Vice President, T. Rowe Price Group, Inc., and T. Rowe Price International | |
| J. Howard Woodward, CFA (1974) Vice President | Vice President, T. Rowe Price Group, Inc., and T. Rowe Price International | |
| Ernest C. Yeung, CFA (1979) Vice President | Director, Responsible Officer, and Vice President, Price Hong Kong; Vice President, T. Rowe Price Group, Inc. | |
| Unless otherwise noted, officers have been employees of T. Rowe Price or T. Rowe Price International for at least 5 years. | ||
Item 2. Code of Ethics.
The registrant has adopted a code of ethics, as defined in Item 2 of Form N-CSR, applicable to its principal executive officer, principal financial officer, principal accounting officer or controller, or persons performing similar functions. A copy of this code of ethics is filed as an exhibit to this Form N-CSR. No substantive amendments were approved or waivers were granted to this code of ethics during the period covered by this report.
Item 3. Audit Committee Financial Expert.
The registrant’s Board of Directors/Trustees has determined that Mr. Bruce W. Duncan qualifies as an audit committee financial expert, as defined in Item 3 of Form N-CSR. Mr. Duncan is considered independent for purposes of Item 3 of Form N-CSR.
Item 4. Principal Accountant Fees and Services.
(a) – (d) Aggregate fees billed for the last two fiscal years for professional services rendered to, or on behalf of, the registrant by the registrant’s principal accountant were as follows:
Audit fees include amounts related to the audit of the registrant’s annual financial statements and services normally provided by the accountant in connection with statutory and regulatory filings. Audit-related fees include amounts reasonably related to the performance of the audit of the registrant’s financial statements and specifically include the issuance of a report on internal controls and, if applicable, agreed-upon procedures related to fund acquisitions. Tax fees include amounts related to services for tax compliance, tax planning, and tax advice. The nature of these services specifically includes the review of distribution calculations and the preparation of Federal, state, and excise tax returns. All other fees include the registrant’s pro-rata share of amounts for agreed-upon procedures in conjunction with service contract approvals by the registrant’s Board of Directors/Trustees.
(e)(1) The registrant’s audit committee has adopted a policy whereby audit and non-audit services performed by the registrant’s principal accountant for the registrant, its investment adviser, and any entity controlling, controlled by, or under common control with the investment adviser that provides ongoing services to the registrant require pre-approval in advance at regularly scheduled audit committee meetings. If such a service is required between regularly scheduled audit committee meetings, pre-approval may be authorized by one audit committee member with ratification at the next scheduled audit committee meeting. Waiver of pre-approval for audit or non-audit services requiring fees of a de minimis amount is not permitted.
(2) No services included in (b) – (d) above were approved pursuant to paragraph (c)(7)(i)(C) of Rule 2-01 of Regulation S-X.
(f) Less than 50 percent of the hours expended on the principal accountant’s engagement to audit the registrant’s financial statements for the most recent fiscal year were attributed to work performed by persons other than the principal accountant’s full-time, permanent employees.
(g) The aggregate fees billed for the most recent fiscal year and the preceding fiscal year by the registrant’s principal accountant for non-audit services rendered to the registrant, its investment adviser, and any entity controlling, controlled by, or under common control with the investment adviser that provides ongoing services to the registrant were $2,767,000 and $1,432,000, respectively.
(h) All non-audit services rendered in (g) above were pre-approved by the registrant’s audit committee. Accordingly, these services were considered by the registrant’s audit committee in maintaining the principal accountant’s independence.
Item 5. Audit Committee of Listed Registrants.
Not applicable.
Item 6. Investments.
(a) Not applicable. The complete schedule of investments is included in Item 1 of this Form N-CSR.
(b) Not applicable.
Item 7. Disclosure of Proxy Voting Policies and Procedures for Closed-End Management Investment Companies.
Not applicable.
Item 8. Portfolio Managers of Closed-End Management Investment Companies.
Not applicable.
Item 9. Purchases of Equity Securities by Closed-End Management Investment Company and Affiliated Purchasers.
Not applicable.
Item 10. Submission of Matters to a Vote of Security Holders.
Not applicable.
Item 11. Controls and Procedures.
(a) The registrant’s principal executive officer and principal financial officer have evaluated the registrant’s disclosure controls and procedures within 90 days of this filing and have concluded that the registrant’s disclosure controls and procedures were effective, as of that date, in ensuring that information required to be disclosed by the registrant in this Form N-CSR was recorded, processed, summarized, and reported timely.
(b) During the period, the Price Funds’ accounting agent, The Bank of New York Mellon (BNYM), converted the fund’s books and records from a legacy fund accounting system / operating model to a BNYM fund accounting system / operating model.
Item 12. Exhibits.
(a)(1) The registrant’s code of ethics pursuant to Item 2 of Form N-CSR is attached.
(2) Separate certifications by the registrant's principal executive officer and principal financial officer, pursuant to Section 302 of the Sarbanes-Oxley Act of 2002 and required by Rule 30a-2(a) under the Investment Company Act of 1940, are attached.
(3) Written solicitation to repurchase securities issued by closed-end companies: not applicable.
(b) A certification by the registrant’s principal executive officer and principal financial officer, pursuant to Section 906 of the Sarbanes-Oxley Act of 2002 and required by Rule 30a-2(b) under the Investment Company Act of 1940, is attached.
SIGNATURES
Pursuant to the requirements of the Securities Exchange Act of 1934 and the Investment Company Act of 1940, the registrant has duly caused this report to be signed on its behalf by the undersigned, thereunto duly authorized.
T. Rowe Price Institutional International Funds, Inc.
| By | /s/ David Oestreicher | |||||
| David Oestreicher | ||||||
| Principal Executive Officer | ||||||
| Date | December 17, 2018 | |||||
Pursuant to the requirements of the Securities Exchange Act of 1934 and the Investment Company Act of 1940, this report has been signed below by the following persons on behalf of the registrant and in the capacities and on the dates indicated.
| By | /s/ David Oestreicher | |||||
| David Oestreicher | ||||||
| Principal Executive Officer | ||||||
| Date | December 17, 2018 | |||||
| By | /s/ Catherine D. Mathews | |||||
| Catherine D. Mathews | ||||||
| Principal Financial Officer | ||||||
| Date | December 17, 2018 | |||||