UNITED STATES
SECURITIES AND EXCHANGE COMMISSION
Washington, D.C. 20549
FORM N-CSR
CERTIFIED SHAREHOLDER REPORT OF REGISTERED
MANAGEMENT INVESTMENT COMPANIES
Investment Company Act File Number: 811-05833
| T. Rowe Price Global Funds, Inc. |
|
| (Exact name of registrant as specified in charter) |
| |
| 100 East Pratt Street, Baltimore, MD 21202 |
|
| (Address of principal executive offices) |
| |
| David Oestreicher |
| 100 East Pratt Street, Baltimore, MD 21202 |
|
| (Name and address of agent for service) |
Registrant’s telephone number, including area code: (410) 345-2000
Date of fiscal year end: October 31
Date of reporting period: April 30, 2020
Item 1. Reports to Shareholders
(a) Report pursuant to Rule 30e-1.
| Institutional Africa & Middle East Fund | April 30, 2020 |
Beginning on January 1, 2021, as permitted by SEC regulations, paper copies of the T. Rowe Price funds’ annual and semiannual shareholder reports will no longer be mailed, unless you specifically request them. Instead, shareholder reports will be made available on the funds’ website (troweprice.com/prospectus), and you will be notified by mail with a website link to access the reports each time a report is posted to the site.
If you already elected to receive reports electronically, you will not be affected by this change and need not take any action. At any time, shareholders who invest directly in T. Rowe Price funds may generally elect to receive reports or other communications electronically by enrolling attroweprice.com/paperlessor, if you are a retirement plan sponsor or invest in the funds through a financial intermediary (such as an investment advisor, broker-dealer, insurance company, or bank), by contacting your representative or your financial intermediary.
You may elect to continue receiving paper copies of future shareholder reports free of charge. To do so, if you invest directly with T. Rowe Price, please call T. Rowe Price as follows: IRA, nonretirement account holders, and institutional investors,1-800-225-5132; small business retirement accounts,1-800-492-7670. If you are a retirement plan sponsor or invest in the T. Rowe Price funds through a financial intermediary, please contact your representative or financial intermediary or follow additional instructions if included with this document. Your election to receive paper copies of reports will apply to all funds held in your account with your financial intermediary or, if you invest directly in the T. Rowe Price funds, with T. Rowe Price. Your election can be changed at any time in the future.
| T. ROWE PRICE INSTITUTIONAL AFRICA & MIDDLE EAST FUND |
|
HIGHLIGHTS
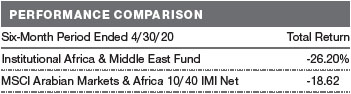
| ■ | The Institutional Africa & Middle East Fund returned -26.20% for the six-month period ended April 30, 2020, underperforming the MSCI Arabian Markets & Africa 10/40 Investable Market Index Net. |
| |
| ■ | Saudi Arabia was the greatest area of weakness, while positive contributors to relative returns included our overweight in the Netherlands, where a South African internet company’s international assets are listed. |
| |
| ■ | After the review period, effective May 8, 2020, the fund liquidated and closed. Prior to the liquidation date, nearly all of the fund’s assets were systematically sold at the discretion of the portfolio manager. |
| |
| ■ | Middle Eastern and African markets, along with the rest of the world, have been hit hard by the double impact of the global spread of the coronavirus and the plummeting price of oil. The outlook has become increasingly uncertain. Over the longer term, the region is likely to be bolstered by a recovery in regional growth and meaningful country-specific improvements, including economic reform. |

Log in to your account attroweprice.comfor more information.
*Certain mutual fund accounts that are assessed an annual account service fee can also save money by switching to e-delivery.
CIO Market Commentary
Dear Investor
Global markets experienced extraordinary volatility during the first half of your fund’s fiscal year, the six-month period ended April 30, 2020, as the spread of the coronavirus led to the shutdown of significant portions of most major economies. After reaching record highs, stocks recorded their steepest declines since the global financial crisis a decade ago, while demand for safe-haven securities sent Treasury yields to all-time lows.
As a result of the improving trade situation between the U.S. and China and central bank stimulus, the outlook for 2020 appeared promising. However, market sentiment began to shift in January amid news of the coronavirus outbreak in China’s Hubei province.
Although the effect was initially muted, with the S&P 500 Index advancing to a record high on February 19, stocks began falling amid reports of major outbreaks in South Korea, Iran, and Italy and scattered infections in dozens of other countries. The major indexes continued their slide as cases mounted in the U.S. and New York City became the epicenter of the pandemic.
The economic toll of the virus became evident as governments throughout the world issued stay-at-home orders to contain the virus, and some sectors, such as travel, restaurants, and shopping malls, came to a virtual halt. In the last six weeks of the period, over 30 million Americans—almost one-fifth of the workforce—filed unemployment claims.
In response to the rapid contraction in economic activity, global central banks took firmly accommodative steps, and many governments around the world passed emergency spending packages. In the U.S., the Federal Reserve cut its short-term lending rate to near zero and began purchasing government and corporate bonds to stimulate the economy and supply liquidity in the fixed income market. The federal government also provided trillions in fiscal support in the form of direct payments to many Americans, expanded unemployment insurance, and subsidies to sectors such as transportation and health care that had been directly impacted by the pandemic.
Boosted by the support, market volatility calmed somewhat by the end of March, and most sectors recouped some of their losses with a strong rally that started in late March and continued throughout April.
Global equity returns for the six-month period were broadly negative, but U.S. large-cap growth stocks finished with positive results. Sector returns were mixed. Energy shares fared the worst as a supply glut and shrinking demand briefly sent the price of oil into negative territory. Health care and information technology shares were the strongest performers.
As a result of the drop in yields, U.S. Treasuries were the top performers in the fixed income universe. Other U.S. investment-grade bonds were also generally positive, but municipal debt was pressured as state and local governments grappled with the loss of tax revenue and mounting expenses as a result of the pandemic. Riskier fixed income sectors such as high yield and emerging markets bonds tumbled during the March sell-off but regained some ground in April.
Looking ahead, the range of possible economic outcomes is especially broad as a result of the unprecedented nature of this crisis—simply stated, we are in uncharted territory. Volatility is likely as investors react to both hopeful and disappointing news in the fight against the virus. We are early in the journey toward recovery, and there is certainly a possibility we could give back some of April’s gains.
In the meantime, our team of investment professionals is focusing on what the postcrisis world will look like. Certain consumer behaviors have been altered, and it is also possible that this crisis will accelerate trends that were already in place. In particular, the pandemic seems to have given a boost to the digitization of the economy, or the shift to online purchases for a widening array of goods and services.
Your fund’s portfolio manager will be carefully monitoring developments, and I believe that our disciplined fundamental research and strategic investing approach will continue to serve our shareholders well in this uncertain environment.
Thank you for your continued confidence in T. Rowe Price.
Sincerely,

Robert Sharps
Group Chief Investment Officer
Management’s Discussion of Fund Performance
INVESTMENT OBJECTIVE
The fund seeks long-term growth of capital by investing primarily in the common stocks of companies located (or with primary operations) in Africa and the Middle East.
FUND COMMENTARY
How did the fund perform in the past six months?
The Institutional Africa & Middle East Fund returned -26.20% for the six-month period ended April 30, 2020. As shown in the Performance Comparison table, the fund underperformed the MSCI Arabian Markets & Africa 10/40 Investable Market Index (IMI) Net. (Past performance cannot guarantee future results.)
What factors influenced the fund’s performance?
Saudi Arabia was the greatest area of weakness, while stock selection in South Africa also held back relative performance. Positive contributors to relative returns included our overweight in the Netherlands, where a South African internet company’s international assets are listed, as well as stock selection in Morocco.
In Saudi Arabia,Saudi British BankandNational Commercial Bankwere among the biggest laggards. Both banks suffered as they are fundamentally sensitive to both lower U.S. interest rates and the sluggish price of oil. We believe there are downside risks to both earnings and valuations from here. (Please refer to the fund’s portfolio of investments for a complete list of holdings and the amount each represents in the portfolio.)
Our overweight holding in South Africa’sNaspers, a global internet group and one of the largest technology investors in the world, detracted, although the stock outperformed over the period on the strength of Chinese internet company Tencent, in which it is the largest shareholder. Naspers’ share price was volatile in March, and we reduced our position, locking in some losses. However, these were more than offset by our overweight in the company’s international listing,Prosus. As well as benefiting from the gains in Tencent, Prosus fared well on its e-commerce offering as most consumers were homebound during the coronavirus pandemic. Its portfolio has stakes in various providers of food delivery services and payments technology.
In Morocco, overweight exposure to supermarket operatorLabel’Viewas beneficial. The retailer saw a significant increase in traffic ahead of the imposition of lockdown measures in the country. Since then, traffic has dropped, but the volumes purchased by customers have increased, implying a double-digit progression in sales. Label’Vie has been gaining market share, and it is able to offer relatively stable prices as it buys directly from farmers.
How is the fund positioned?
After the review period, effective May 8, 2020, the fund liquidated and closed. Prior to the liquidation date, nearly all of the fund’s assets were systematically sold at the discretion of the portfolio manager.
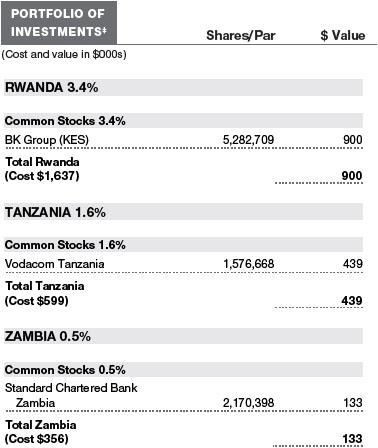
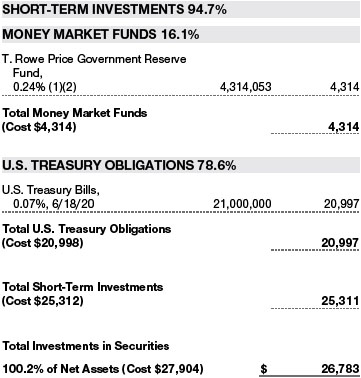
As of April 30, 2020, the remaining holdings of the fund were three illiquid securities:Standard Chartered Bank Zambia, Bank of Kigali(Rwanda), andVodacom Tanzania. In addition, the fund held some short-term investments, including U.S. Treasury bills.
What is portfolio management’s outlook?
Middle Eastern and African markets, along with the rest of the world, have been hit hard by the double impact of the global spread of the coronavirus and the plummeting price of oil. The outlook has become increasingly uncertain. Over the longer term, the region is likely to be bolstered by a recovery in regional growth and meaningful country-specific improvements, including economic reform. In recent years, we have been encouraged by policymakers’ attempts to cut subsidies to fuel, electricity, and gas as part of fiscal consolidation plans.
In South Africa, we had concerns regarding the disappointingly slow path to reform. Markets were shaken over the period by a deteriorating fiscal position due to weak growth and costly bailouts for struggling state companies, such as utility operator Eskom. This was even before the country went into lockdown in an attempt to contain the spread of the coronavirus, and Moody’s—the only remaining major credit rating agency to deem South Africa investment grade—downgraded the sovereign debt to junk status.
In West Africa, sentiment in Nigeria has deteriorated due to a lack of reform leadership from President Muhammadu Buhari, which had been hoped for after his win of a second term in office. Economic growth has been struggling to outpace population growth. More recently, this situation has been exacerbated by the decline in the price of oil and increasing concerns that capital controls may be introduced. In Kenya, the removal of the interest rate cap late last year was a positive catalyst for the market.
Egypt completed an International Monetary Fund-backed reform agenda and loan program in 2019. If the political situation remains stable, this should drive a material improvement to the country’s economic backdrop. While challenges still exist, including those to the tourism sector during the current crisis, we are starting to see signs of easing inflation, an improving budget deficit, and currency stability.
In the Middle East, oil-exporting nations have been hurt by the plummeting price of oil on account of reduced demand and oversupply. In Kuwait, structural domestic improvement and a government push on infrastructure projects had been key positives coming into 2020. In Saudi Arabia, the initial public offering of Saudi Aramco, the world’s largest integrated oil and gas company, late last year brought increasing attention to the market.
Overall, the long-term outlook for the Middle East and Africa region remains robust, despite the current global slowdown. Looking beyond the current crisis, growth in the region is likely to be driven by some of the world’s most attractive demographics, rising urbanization and levels of infrastructure investment, and a strong asset base in natural resources. There is much scope for economic improvement, driven by reform implementation and growing structural domestic demand. This should translate into strong corporate earnings growth that we believe can be sustained by various businesses in the years ahead. We believe that the fundamentals generally remain strong and that growth will resume on the other side of the crisis.
The Institutional Africa & Middle East Fund closed on May 8, 2020.
The views expressed reflect the opinions of T. Rowe Price as of the date of this report and are subject to change based on changes in market, economic, or other conditions. These views are not intended to be a forecast of future events and are no guarantee of future results.
RISKS OF INVESTING IN THE INSTITUTIONAL AFRICA & MIDDLE EAST FUND
Stocks generally fluctuate in value more than bonds and may decline significantly over short time periods. There is a chance that stock prices overall will decline because stock markets tend to move in cycles, with periods of rising and falling prices. The value of a stock in which the fund invests may decline due to general weakness in the stock market or because of factors that affect a particular company or industry.
Investing in the securities of non-U.S. issuers involves special risks not typically associated with investing in U.S. issuers. International securities tend to be more volatile and less liquid than investments in U.S. securities and may lose value because of adverse local, political, social, or economic developments overseas or due to changes in the exchange rates between foreign currencies and the U.S. dollar. In addition, international investments are subject to settlement practices and regulatory and financial reporting standards that differ from those of the U.S.
The risks of international investing are heightened for securities of issuers in emerging market countries. Emerging market countries tend to have economic structures that are less diverse and mature, and political systems that are less stable, than those of developed countries. In addition to all of the risks of investing in international developed markets, emerging markets are more susceptible to governmental interference, local taxes being imposed on international investments, restrictions on gaining access to sales proceeds, and less liquid and less efficient trading markets. Frontier markets generally have smaller economies and less mature capital markets than emerging markets. As a result, the risks of investing in emerging market countries are magnified in frontier market countries.
Because the fund concentrates its investments in a particular geographic region, the fund’s performance is closely tied to the social, political, and economic conditions within that region. Political developments and changes in regulatory, tax, or economic policy in particular countries within the region could significantly affect the markets in those countries as well as the entire region. As a result, the fund is likely to be more volatile than more geographically diverse international funds.
BENCHMARK INFORMATION
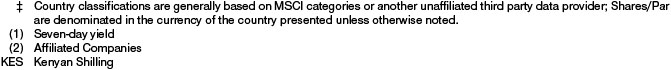
Note: MSCI makes no express or implied warranties or representations and shall have no liability whatsoever with respect to any MSCI data contained herein. The MSCI data may not be further redistributed or used as a basis for other indices or any securities or financial products. This report is not approved, reviewed, or produced by MSCI.
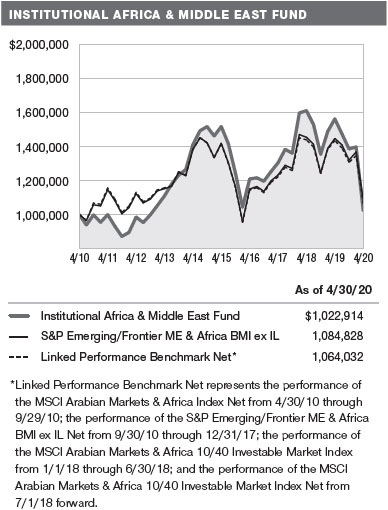
GROWTH OF $1 MILLION
This chart shows the value of a hypothetical $1 million investment in the fund over the past 10 fiscal year periods or since inception (for funds lacking 10-year records). The result is compared with benchmarks, which include a broad-based market index and may also include a peer group average or index. Market indexes do not include expenses, which are deducted from fund returns as well as mutual fund averages and indexes.
AVERAGE ANNUAL COMPOUND TOTAL RETURN

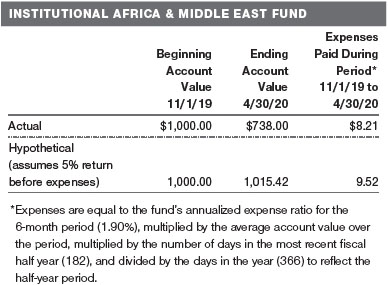
FUND EXPENSE EXAMPLE
As a mutual fund shareholder, you may incur two types of costs: (1) transaction costs, such as redemption fees or sales loads, and (2) ongoing costs, including management fees, distribution and service (12b-1) fees, and other fund expenses. The following example is intended to help you understand your ongoing costs (in dollars) of investing in the fund and to compare these costs with the ongoing costs of investing in other mutual funds. The example is based on an investment of $1,000 invested at the beginning of the most recent six-month period and held for the entire period.
Actual Expenses
The first line of the following table (Actual) provides information about actual account values and actual expenses. You may use the information on this line, together with your account balance, to estimate the expenses that you paid over the period. Simply divide your account value by $1,000 (for example, an $8,600 account value divided by $1,000 = 8.6), then multiply the result by the number on the first line under the heading “Expenses Paid During Period” to estimate the expenses you paid on your account during this period.
Hypothetical Example for Comparison Purposes
The information on the second line of the table (Hypothetical) is based on hypothetical account values and expenses derived from the fund’s actual expense ratio and an assumed 5% per year rate of return before expenses (not the fund’s actual return). You may compare the ongoing costs of investing in the fund with other funds by contrasting this 5% hypothetical example and the 5% hypothetical examples that appear in the shareholder reports of the other funds. The hypothetical account values and expenses may not be used to estimate the actual ending account balance or expenses you paid for the period.
You should also be aware that the expenses shown in the table highlight only your ongoing costs and do not reflect any transaction costs, such as redemption fees or sales loads. Therefore, the second line of the table is useful in comparing ongoing costs only and will not help you determine the relative total costs of owning different funds. To the extent a fund charges transaction costs, however, the total cost of owning that fund is higher.
QUARTER-END RETURNS
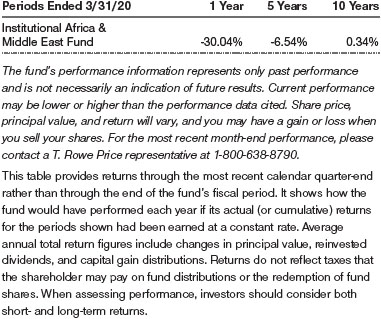
Unaudited

The accompanying notes are an integral part of these financial statements.
April 30, 2020 (Unaudited)
The accompanying notes are an integral part of these financial statements.
April 30, 2020 (Unaudited)
The accompanying notes are an integral part of these financial statements.
Unaudited

The accompanying notes are an integral part of these financial statements.
Unaudited
The accompanying notes are an integral part of these financial statements.
Unaudited
| NOTES TO FINANCIAL STATEMENTS |
T. Rowe Price Global Funds, Inc. (the corporation), formerly the T. Rowe Price Institutional International Funds, Inc., is registered under the Investment Company Act of 1940 (the 1940 Act). The Institutional Africa & Middle East Fund (the fund) is a nondiversified, open-end management investment company established by the corporation. The fund seeks long-term growth of capital by investing primarily in the common stocks of companies located (or with primary operations) in Africa and the Middle East.
NOTE 1 - SIGNIFICANT ACCOUNTING POLICIES
Basis of PreparationThe fund is an investment company and follows accounting and reporting guidance in the Financial Accounting Standards Board (FASB)Accounting Standards CodificationTopic 946 (ASC 946). The accompanying financial statements were prepared in accordance with accounting principles generally accepted in the United States of America (GAAP), including, but not limited to, ASC 946. GAAP requires the use of estimates made by management. Management believes that estimates and valuations are appropriate; however, actual results may differ from those estimates, and the valuations reflected in the accompanying financial statements may differ from the value ultimately realized upon sale or maturity.
Investment Transactions, Investment Income, and DistributionsInvestment transactions are accounted for on the trade date basis. Income and expenses are recorded on the accrual basis. Realized gains and losses are reported on the identified cost basis. Premiums and discounts on debt securities are amortized for financial reporting purposes. Income tax-related interest and penalties, if incurred, are recorded as income tax expense. Dividends received from mutual fund investments are reflected as dividend income; capital gain distributions are reflected as realized gain/loss. Dividend income and capital gain distributions are recorded on the ex-dividend date. Non-cash dividends, if any, are recorded at the fair market value of the asset received. Distributions to shareholders are recorded on the ex-dividend date. Income distributions, if any, are declared and paid annually. A capital gain distribution may also be declared and paid by the fund annually.
Currency TranslationAssets, including investments, and liabilities denominated in foreign currencies are translated into U.S. dollar values each day at the prevailing exchange rate, using the mean of the bid and asked prices of such currencies against U.S. dollars as quoted by a major bank. Purchases and sales of securities, income, and expenses are translated into U.S. dollars at the prevailing exchange rate on the respective date of such transaction. The effect of changes in foreign currency exchange rates on realized and unrealized security gains and losses is not bifurcated from the portion attributable to changes in market prices.
New Accounting GuidanceEffective November 1, 2019, the fund adopted FASB guidance that shortened the amortization period for certain callable debt securities held at a premium. Adoption had no effect on the fund’s net assets or results of operations.
IndemnificationIn the normal course of business, the fund may provide indemnification in connection with its officers and directors, service providers, and/or private company investments. The fund’s maximum exposure under these arrangements is unknown; however, the risk of material loss is currently considered to be remote.
NOTE 2 - VALUATION
The fund’s financial instruments are valued and its net asset value (NAV) per share is computed at the close of the New York Stock Exchange (NYSE), normally 4 p.m. ET, each day the NYSE is open for business. However, the NAV per share may be calculated at a time other than the normal close of the NYSE if trading on the NYSE is restricted, if the NYSE closes earlier, or as may be permitted by the SEC.
Fair ValueThe fund’s financial instruments are reported at fair value, which GAAP defines as the price that would be received to sell an asset or paid to transfer a liability in an orderly transaction between market participants at the measurement date. The T. Rowe Price Valuation Committee (the Valuation Committee) is an internal committee that has been delegated certain responsibilities by the fund’s Board of Directors (the Board) to ensure that financial instruments are appropriately priced at fair value in accordance with GAAP and the 1940 Act. Subject to oversight by the Board, the Valuation Committee develops and oversees pricing-related policies and procedures and approves all fair value determinations. Specifically, the Valuation Committee establishes procedures to value securities; determines pricing techniques, sources, and persons eligible to effect fair value pricing actions; oversees the selection, services, and performance of pricing vendors; oversees valuation-related business continuity practices; and provides guidance on internal controls and valuation-related matters. The Valuation Committee reports to the Board and has representation from legal, portfolio management and trading, operations, risk management, and the fund’s treasurer.
Various valuation techniques and inputs are used to determine the fair value of financial instruments. GAAP establishes the following fair value hierarchy that categorizes the inputs used to measure fair value:
Level 1 – quoted prices (unadjusted) in active markets for identical financial instruments that the fund can access at the reporting date
Level 2 – inputs other than Level 1 quoted prices that are observable, either directly or indirectly (including, but not limited to, quoted prices for similar financial instruments in active markets, quoted prices for identical or similar financial instruments in inactive markets, interest rates and yield curves, implied volatilities, and credit spreads)
Level 3 – unobservable inputs
Observable inputs are developed using market data, such as publicly available information about actual events or transactions, and reflect the assumptions that market participants would use to price the financial instrument. Unobservable inputs are those for which market data are not available and are developed using the best information available about the assumptions that market participants would use to price the financial instrument. GAAP requires valuation techniques to maximize the use of relevant observable inputs and minimize the use of unobservable inputs. When multiple inputs are used to derive fair value, the financial instrument is assigned to the level within the fair value hierarchy based on the lowest-level input that is significant to the fair value of the financial instrument. Input levels are not necessarily an indication of the risk or liquidity associated with financial instruments at that level but rather the degree of judgment used in determining those values.
Valuation TechniquesEquity securities listed or regularly traded on a securities exchange or in the over-the-counter (OTC) market are valued at the last quoted sale price or, for certain markets, the official closing price at the time the valuations are made. OTC Bulletin Board securities are valued at the mean of the closing bid and asked prices. A security that is listed or traded on more than one exchange is valued at the quotation on the exchange determined to be the primary market for such security. Listed securities not traded on a particular day are valued at the mean of the closing bid and asked prices for domestic securities and the last quoted sale or closing price for international securities.
For valuation purposes, the last quoted prices of non-U.S. equity securities may be adjusted to reflect the fair value of such securities at the close of the NYSE. If the fund determines that developments between the close of a foreign market and the close of the NYSE will affect the value of some or all of its portfolio securities, the fund will adjust the previous quoted prices to reflect what it believes to be the fair value of the securities as of the close of the NYSE. In deciding whether it is necessary to adjust quoted prices to reflect fair value, the fund reviews a variety of factors, including developments in foreign markets, the performance of U.S. securities markets, and the performance of instruments trading in U.S. markets that represent foreign securities and baskets of foreign securities. The fund may also fair value securities in other situations, such as when a particular foreign market is closed but the fund is open. The fund uses outside pricing services to provide it with quoted prices and information to evaluate or adjust those prices. The fund cannot predict how often it will use quoted prices and how often it will determine it necessary to adjust those prices to reflect fair value. As a means of evaluating its security valuation process, the fund routinely compares quoted prices, the next day’s opening prices in the same markets, and adjusted prices.
Actively traded equity securities listed on a domestic exchange generally are categorized in Level 1 of the fair value hierarchy. Non-U.S. equity securities generally are categorized in Level 2 of the fair value hierarchy despite the availability of quoted prices because, as described above, the fund evaluates and determines whether those quoted prices reflect fair value at the close of the NYSE or require adjustment. OTC Bulletin Board securities, certain preferred securities, and equity securities traded in inactive markets generally are categorized in Level 2 of the fair value hierarchy.
Debt securities generally are traded in the OTC market and are valued at prices furnished by independent pricing services or by broker dealers who make markets in such securities. When valuing securities, the independent pricing services consider the yield or price of bonds of comparable quality, coupon, maturity, and type, as well as prices quoted by dealers who make markets in such securities. Generally, debt securities are categorized in Level 2 of the fair value hierarchy; however, to the extent the valuations include significant unobservable inputs, the securities would be categorized in Level 3.
Investments in mutual funds are valued at the mutual fund’s closing NAV per share on the day of valuation and are categorized in Level 1 of the fair value hierarchy. Assets and liabilities other than financial instruments, including short-term receivables and payables, are carried at cost, or estimated realizable value, if less, which approximates fair value.
Thinly traded financial instruments and those for which the above valuation procedures are inappropriate or are deemed not to reflect fair value are stated at fair value as determined in good faith by the Valuation Committee. The objective of any fair value pricing determination is to arrive at a price that could reasonably be expected from a current sale. Financial instruments fair valued by the Valuation Committee are primarily private placements, restricted securities, warrants, rights, and other securities that are not publicly traded.
Subject to oversight by the Board, the Valuation Committee regularly makes good faith judgments to establish and adjust the fair valuations of certain securities as events occur and circumstances warrant. For instance, in determining the fair value of an equity investment with limited market activity, such as a private placement or a thinly traded public company stock, the Valuation Committee considers a variety of factors, which may include, but are not limited to, the issuer’s business prospects, its financial standing and performance, recent investment transactions in the issuer, new rounds of financing, negotiated transactions of significant size between other investors in the company, relevant market valuations of peer companies, strategic events affecting the company, market liquidity for the issuer, and general economic conditions and events. In consultation with the investment and pricing teams, the Valuation Committee will determine an appropriate valuation technique based on available information, which may include both observable and unobservable inputs. The Valuation Committee typically will afford greatest weight to actual prices in arm’s length transactions, to the extent they represent orderly transactions between market participants, transaction information can be reliably obtained, and prices are deemed representative of fair value. However, the Valuation Committee may also consider other valuation methods such as market-based valuation multiples; a discount or premium from market value of a similar, freely traded security of the same issuer; or some combination. Fair value determinations are reviewed on a regular basis and updated as information becomes available, including actual purchase and sale transactions of the issue. Because any fair value determination involves a significant amount of judgment, there is a degree of subjectivity inherent in such pricing decisions, and fair value prices determined by the Valuation Committee could differ from those of other market participants. Depending on the relative significance of unobservable inputs, including the valuation technique(s) used, fair valued securities may be categorized in Level 2 or 3 of the fair value hierarchy.
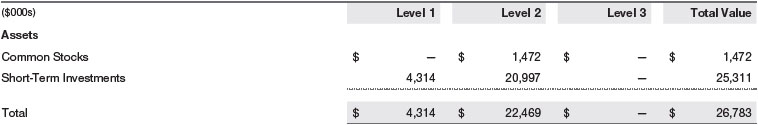
Valuation InputsThe following table summarizes the fund’s financial instruments, based on the inputs used to determine their fair values on April 30, 2020 (for further detail by category, please refer to the accompanying Portfolio of Investments):
NOTE 3 - OTHER INVESTMENT TRANSACTIONS
Consistent with its investment objective, the fund engages in the following practices to manage exposure to certain risks and/or to enhance performance. The investment objective, policies, program, and risk factors of the fund are described more fully in the fund’s prospectus and Statement of Additional Information.
Emerging and Frontier MarketsThe fund invests, either directly or through investments in other T. Rowe Price funds, in securities of companies located in, issued by governments of, or denominated in or linked to the currencies of emerging and frontier market countries. Emerging markets, and to a greater extent frontier markets, generally have economic structures that are less diverse and mature, and political systems that are less stable, than developed countries. These markets may be subject to greater political, economic, and social uncertainty and differing regulatory environments that may potentially impact the fund’s ability to buy or sell certain securities or repatriate proceeds to U.S. dollars. Such securities are often subject to greater price volatility, less liquidity, and higher rates of inflation than U.S. securities. Investing in frontier markets is significantly riskier than investing in other countries, including emerging markets.
OtherPurchases and sales of portfolio securities other than short-term securities aggregated $10,000,000 and $41,223,000, respectively, for the six months ended April 30, 2020.
NOTE 4 - FEDERAL INCOME TAXES
No provision for federal income taxes is required since the fund intends to continue to qualify as a regulated investment company under Subchapter M of the Internal Revenue Code and distribute to shareholders all of its taxable income and gains. Distributions determined in accordance with federal income tax regulations may differ in amount or character from net investment income and realized gains for financial reporting purposes. Financial reporting records are adjusted for permanent book/tax differences to reflect tax character but are not adjusted for temporary differences. The amount and character of tax-basis distributions and composition of net assets are finalized at fiscal year-end; accordingly, tax-basis balances have not been determined as of the date of this report.
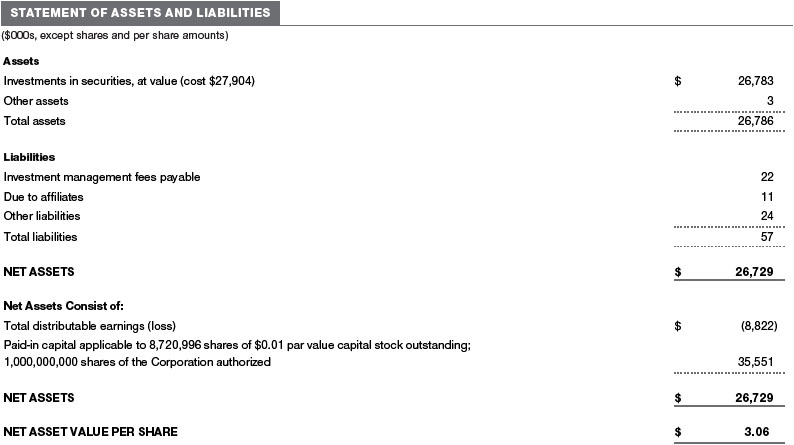
At April 30, 2020, the cost of investments for federal income tax purposes was $27,904,000. Net unrealized loss aggregated $1,121,000 at period-end, of which $0 related to appreciated investments and $1,121,000 related to depreciated investments.
NOTE 5 - FOREIGN TAXES
The fund is subject to foreign income taxes imposed by certain countries in which it invests. Additionally, capital gains realized upon disposition of securities issued in or by certain foreign countries are subject to capital gains tax imposed by those countries. All taxes are computed in accordance with the applicable foreign tax law, and, to the extent permitted, capital losses are used to offset capital gains. Taxes attributable to income are accrued by the fund as a reduction of income. Current and deferred tax expense attributable to capital gains is reflected as a component of realized or change in unrealized gain/loss on securities in the accompanying financial statements. To the extent that the fund has country specific capital loss carryforwards, such carryforwards are applied against net unrealized gains when determining the deferred tax liability. Any deferred tax liability incurred by the fund is included in either Other liabilities or Deferred tax liability on the accompanying Statement of Assets and Liabilities.
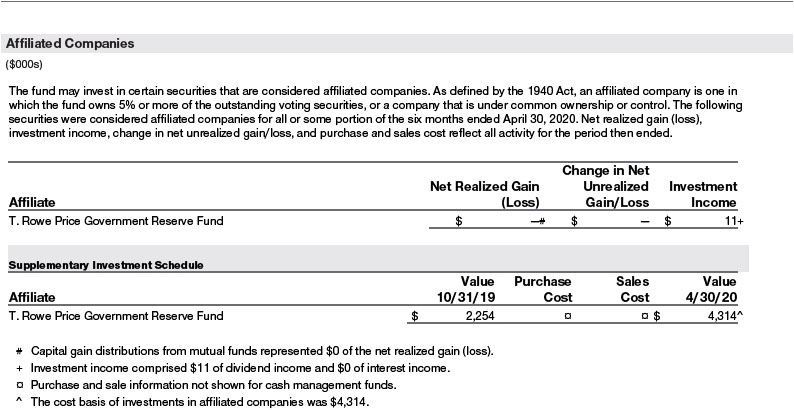
NOTE 6 - RELATED PARTY TRANSACTIONS
The fund is managed by T. Rowe Price Associates, Inc. (Price Associates), a wholly owned subsidiary of T. Rowe Price Group, Inc. (Price Group). Price Associates has entered into a sub-advisory agreement(s) with one or more of its wholly owned subsidiaries, to provide investment advisory services to the fund. The investment management agreement between the fund and Price Associates provides for an annual investment management fee equal to 1.00% of the fund’s average daily net assets. The fee is computed daily and paid monthly.
In addition, the fund has entered into service agreements with Price Associates and a wholly owned subsidiary of Price Associates, each an affiliate of the fund (collectively, Price). Price Associates provides certain accounting and administrative services to the fund. T. Rowe Price Services, Inc. provides shareholder and administrative services in its capacity as the fund’s transfer and dividend-disbursing agent. For the six months ended April 30, 2020, expenses incurred pursuant to these service agreements were $35,000 for Price Associates and less than $1,000 for T. Rowe Price Services, Inc. All amounts due to and due from Price, exclusive of investment management fees payable, are presented net on the accompanying Statement of Assets and Liabilities.
The fund may invest its cash reserves in certain open-end management investment companies managed by Price Associates and considered affiliates of the fund: the T. Rowe Price Government Reserve Fund or the T. Rowe Price Treasury Reserve Fund, organized as money market funds, or the T. Rowe Price Short-Term Fund, a short-term bond fund (collectively, the Price Reserve Funds). The Price Reserve Funds are offered as short-term investment options to mutual funds, trusts, and other accounts managed by Price Associates or its affiliates and are not available for direct purchase by members of the public. Cash collateral from securities lending is invested in the T. Rowe Price Short-Term Fund. The Price Reserve Funds pay no investment management fees.
As of April 30, 2020, T. Rowe Price Group, Inc., or its wholly owned subsidiaries owned 744,000 shares of the fund, representing 9% of the fund’s net assets.
The fund may participate in securities purchase and sale transactions with other funds or accounts advised by Price Associates (cross trades), in accordance with procedures adopted by the fund’s Board and Securities and Exchange Commission rules, which require, among other things, that such purchase and sale cross trades be effected at the independent current market price of the security. During the six months ended April 30, 2020, the fund had no purchases or sales cross trades with other funds or accounts advised by Price Associates.
NOTE 7 - OTHER MATTERS
Unpredictable events such as environmental or natural disasters, war, terrorism, pandemics, outbreaks of infectious diseases, and similar public health threats may significantly affect the economy and the markets and issuers in which a fund invests. Certain events may cause instability across global markets, including reduced liquidity and disruptions in trading markets, while some events may affect certain geographic regions, countries, sectors, and industries more significantly than others, and exacerbate other pre-existing political, social, and economic risks.
These types of events may also cause widespread fear and uncertainty, and result in, among other things: quarantines and travel restrictions, including border closings; disruptions to business operations and supply chains; exchange trading suspensions and closures, and overall reduced liquidity of securities, derivatives, and commodities trading markets; reductions in consumer demand and economic output; and significant challenges in healthcare service preparation and delivery. The funds could be negatively impacted if the value of a portfolio holding were harmed by such political or economic conditions or events. In addition, the operations of the funds, their investment advisers, and the funds’ service providers may be significantly impacted, or even temporarily halted, as a result of extensive employee illnesses or unavailability, government quarantine measures, and restrictions on travel or meetings and other factors related to public emergencies. Recently, a novel strain of coronavirus (COVID-19) has resulted in disruptions to global business activity and caused significant volatility and declines in global financial markets.
Governmental and quasi-governmental authorities and regulators have in the past responded to major economic disruptions with a variety of significant fiscal and monetary policy changes, including but not limited to, direct capital infusions into companies, new monetary programs, and dramatically lower interest rates. An unexpected or quick reversal of these policies, or the ineffectiveness of these policies, could negatively impact overall investor sentiment and further increase volatility in securities markets.
NOTE 8 - SUBSEQUENT EVENT
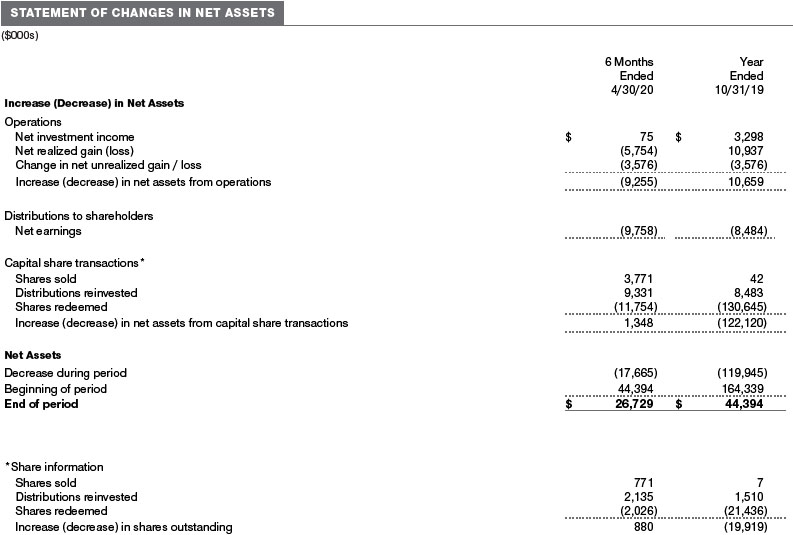
At a Board meeting held on March 9, 2020, the Board approved the closure and liquidation of the fund. On May 8, 2020, the fund liquidated, distributing all proceeds to shareholders, and ceased operations. A portion of the liquidating proceeds, in the amount of $1,547,000, was distributed in-kind to an affiliate of the fund, in accordance with guidelines described in the fund’s registration statement. The fund realized $1,045,000 of net loss from this in-kind distribution.
INFORMATION ON PROXY VOTING POLICIES, PROCEDURES, AND RECORDS
A description of the policies and procedures used by T. Rowe Price funds and portfolios to determine how to vote proxies relating to portfolio securities is available in each fund’s Statement of Additional Information. You may request this document by calling 1-800-225-5132 or by accessing the SEC’s website, sec.gov.
The description of our proxy voting policies and procedures is also available on our corporate website. To access it, please visit the following Web page:
https://www.troweprice.com/corporate/en/utility/policies.html
Scroll down to the section near the bottom of the page that says, “Proxy Voting Policies.” Click on the Proxy Voting Policies link in the shaded box.
Each fund’s most recent annual proxy voting record is available on our website and through the SEC’s website. To access it through T. Rowe Price, visit the website location shown above, and scroll down to the section near the bottom of the page that says, “Proxy Voting Records.” Click on the Proxy Voting Records link in the shaded box.
HOW TO OBTAIN QUARTERLY PORTFOLIO HOLDINGS
Effective for reporting periods on or after March 1, 2019, a fund, except a money market fund, files a complete schedule of portfolio holdings with the Securities and Exchange Commission (SEC) for the first and third quarters of each fiscal year as an exhibit to its reports on Form N-PORT. Prior to March 1, 2019, a fund, including a money market fund, filed a complete schedule of portfolio holdings with the SEC for the first and third quarters of each fiscal year on Form N-Q. A money market fund files detailed month-end portfolio holdings information on Form N-MFP with the SEC each month and posts a complete schedule of portfolio holdings on its website (troweprice.com) as of each month-end for the previous six months. A fund’s Forms N-PORT, N-MFP, and N-Q are available electronically on the SEC’s website (sec.gov).
APPROVAL OF INVESTMENT MANAGEMENT AGREEMENT AND SUBADVISORY AGREEMENT
Each year, the fund’s Board of Directors (Board) considers the continuation of the investment management agreement (Advisory Contract) between the fund and its investment advisor, T. Rowe Price Associates, Inc. (Advisor), as well as the continuation of the investment subadvisory agreement (Subadvisory Contract) that the Advisor has entered into with T. Rowe Price International Ltd (Subadvisor) on behalf of the fund. In that regard, at a meeting held on March 9–10, 2020 (Meeting), the Board, including all of the fund’s independent directors, approved the continuation of the fund’s Advisory Contract and Subadvisory Contract. At the Meeting, the Board considered the factors and reached the conclusions described below relating to the selection of the Advisor and Subadvisor and the approval of the Advisory Contract and Subadvisory Contract. The independent directors were assisted in their evaluation of the Advisory Contract and Subadvisory Contract by independent legal counsel from whom they received separate legal advice and with whom they met separately.
In providing information to the Board, the Advisor was guided by a detailed set of requests for information submitted by independent legal counsel on behalf of the independent directors. In considering and approving the Advisory Contract and Subadvisory Contract, the Board considered the information it believed was relevant, including, but not limited to, the information discussed below. The Board considered not only the specific information presented in connection with the Meeting, but also the knowledge gained over time through interaction with the Advisor and Subadvisor about various topics. The Board meets regularly and, at each of its meetings, covers an extensive agenda of topics and materials and considers factors that are relevant to its annual consideration of the renewal of the T. Rowe Price funds’ advisory contracts, including performance and the services and support provided to the funds and their shareholders.
Services Provided by the Advisor and Subadvisor
The Board considered the nature, quality, and extent of the services provided to the fund by the Advisor and Subadvisor. These services included, but were not limited to, directing the fund’s investments in accordance with its investment program and the overall management of the fund’s portfolio, as well as a variety of related activities such as financial, investment operations, and administrative services; compliance; maintaining the fund’s records and registrations; and shareholder communications. The Board also reviewed the background and experience of the Advisor’s and Subadvisor’s senior management teams and investment personnel involved in the management of the fund, as well as the Advisor’s compliance record. The Board concluded that it was satisfied with the nature, quality, and extent of the services provided by the Advisor and Subadvisor.
Investment Performance of the Fund
The Board took into account discussions with the Advisor and reports that it receives throughout the year relating to fund performance. In connection with the Meeting, the Board reviewed the fund’s net annualized total returns for the 1-, 2-, 3-, 4-, 5-, and 10-year periods as of September 30, 2019, and compared these returns with the performance of a peer group of funds with similar investment programs and a wide variety of other previously agreed-upon comparable performance measures and market data, including those supplied by Broadridge, which is an independent provider of mutual fund data.
On the basis of this evaluation and the Board’s ongoing review of investment results, and factoring in the relative market conditions during certain of the performance periods, the Board concluded that the fund’s performance was satisfactory.
Costs, Benefits, Profits, and Economies of Scale
The Board reviewed detailed information regarding the revenues received by the Advisor under the Advisory Contract and other benefits that the Advisor (and its affiliates, including the Subadvisor) may have realized from its relationship with the fund, including any research received under “soft dollar” agreements and commission-sharing arrangements with broker-dealers. The Board considered that the Advisor and Subadvisor may have received some benefit from soft-dollar arrangements pursuant to which research was received from broker-dealers that executed the fund’s portfolio transactions. However, the Board also considered that, effective January 2020, the Advisor began bearing the cost of research services for all client accounts that it advises, including the T. Rowe Price funds. The Board received information on the estimated costs incurred and profits realized by the Advisor from managing the T. Rowe Price funds. The Board also reviewed estimates of the profits realized from managing the fund in particular, and the Board concluded that the Advisor’s profits were reasonable in light of the services provided to the fund.
The Board also considered whether the fund benefits under the fee levels set forth in the Advisory Contract from any economies of scale realized by the Advisor. Under the Advisory Contract, the fund pays a fee to the Advisor for investment management services based on the fund’s average daily net assets and the fund pays its own expenses of operations. Assets of the fund are included in the calculation of the group fee rate, which serves as a component of the management fee for many other T. Rowe Price funds and declines at certain asset levels based on the combined average net assets of most of the T. Rowe Price funds (including the fund). Although the fund does not have a group fee component to its management fee, its assets are included in the calculation because the primary investment resources utilized to managethe fund are shared with other actively managed funds. The fund’s shareholders also benefit from potential economies of scale through a decline in certain operating expenses as the fund grows in size. The Board concluded that the advisory fee structure for the fund provided for a reasonable sharing of benefits from any economies of scale and that the advisory fee structure continued to be appropriate.
Fees and Expenses
The Board was provided with information regarding industry trends in management fees and expenses. Among other things, the Board reviewed data for peer groups that were compiled by Broadridge, which compared: (i) contractual management fees, total expenses, actual management fees, and nonmanagement expenses of the fund with a group of competitor funds selected by Broadridge (Expense Group) and (ii) total expenses, actual management fees, and nonmanagement expenses of the fund with a broader set of funds within the Lipper investment classification (Expense Universe). The Board considered the fund’s contractual management fee rate, actual management fee rate (which reflects the management fees actually received from the fund by the Advisor after any applicable waivers, reductions, or reimbursements), operating expenses, and total expenses (which reflect the net total expense ratio of the fund after any waivers, reductions, or reimbursements) in comparison with the information for the Broadridge peer groups. Broadridge generally constructed the peer groups by seeking the most comparable funds based on similar investment classifications and objectives, expense structure, asset size, and operating components and attributes and ranked funds into quintiles, with the first quintile representing the funds with the lowest relative expenses and the fifth quintile representing the funds with the highest relative expenses. The information provided to the Board indicated that the fund’s contractual management fee ranked in the second quintile (Expense Group), the fund’s actual management fee rate ranked in the fourth quintile (Expense Group and Expense Universe), and the fund’s total expenses ranked in the fifth quintile (Expense Group) and third and fourth quintiles (Expense Universe).
The Board requested additional information from management with respect to the fund’s relative management fee and total expenses ranking in the fourth and fifth quintiles, and reviewed and considered the information provided relating to the fund, other funds in the peer groups, and other factors that the Board determined to be relevant. The Board also considered that the fund is expected to cease operations and be liquidated on or about May 8, 2020.
The Board also reviewed the fee schedules for other investment portfolios with similar mandates that are advised or subadvised by the Advisor and its affiliates, including separately managed accounts for institutional and individual investors, subadvised funds, and other sponsored investment portfolios, including collective investment trusts and pooled vehicles organized and offered to investors outside the U.S. Management provided the Board with information about the Advisor’s responsibilities and services provided to subadvisory and other institutional account clients, including information about how the requirements and economics of the institutional business are fundamentally different from those of the mutual fund business. The Board considered information showing that the Advisor’s mutual fund business is generally more complex from a business and compliance perspective than its institutional account business and considered various relevant factors, such as the broader scope of operations and oversight, more extensive shareholder communication infrastructure, greater asset flows, heightened business risks, and differences in applicable laws and regulations associated with the Advisor’s proprietary mutual fund business. In assessing the reasonableness of the fund’s management fee rate, the Board considered the differences in the nature of the services required for the Advisor to manage its mutual fund business versus managing a discrete pool of assets as a subadvisor to another institution’s mutual fund or for an institutional account and that the Advisor generally performs significant additional services and assumes greater risk in managing the fund and other T. Rowe Price funds than it does for institutional account clients.
On the basis of the information provided and the factors considered, the Board concluded that the fees paid by the fund under the Advisory Contract are reasonable.
Approval of the Advisory Contract and Subadvisory Contract
As noted, the Board approved the continuation of the Advisory Contract and Subadvisory Contract. No single factor was considered in isolation or to be determinative to the decision. Rather, the Board concluded, in light of a weighting and balancing of all factors considered, that it was in the best interests of the fund and its shareholders for the Board to approve the continuation of the Advisory Contract and Subadvisory Contract (including the fees to be charged for services thereunder). The Board also considered that the Advisory Contract and Subadvisory Contract will ultimately be terminated since the fund is expected to cease operations and be liquidated on or about May 8, 2020.
Item 1. (b) Notice pursuant to Rule 30e-3.
Not applicable.
Item 2. Code of Ethics.
A code of ethics, as defined in Item 2 of Form N-CSR, applicable to its principal executive officer, principal financial officer, principal accounting officer or controller, or persons performing similar functions is filed as an exhibit to the registrant’s annual Form N-CSR. No substantive amendments were approved or waivers were granted to this code of ethics during the registrant’s most recent fiscal half-year.
Item 3. Audit Committee Financial Expert.
Disclosure required in registrant’s annual Form N-CSR.
Item 4. Principal Accountant Fees and Services.
Disclosure required in registrant’s annual Form N-CSR.
Item 5. Audit Committee of Listed Registrants.
Not applicable.
Item 6. Investments.
(a) Not applicable. The complete schedule of investments is included in Item 1 of this Form N-CSR.
(b) Not applicable.
Item 7. Disclosure of Proxy Voting Policies and Procedures for Closed-End Management Investment Companies.
Not applicable.
Item 8. Portfolio Managers of Closed-End Management Investment Companies.
Not applicable.
Item 9. Purchases of Equity Securities by Closed-End Management Investment Company and Affiliated Purchasers.
Not applicable.
Item 10. Submission of Matters to a Vote of Security Holders.
There has been no change to the procedures by which shareholders may recommend nominees to the registrant’s board of directors.
Item 11. Controls and Procedures.
(a) The registrant’s principal executive officer and principal financial officer have evaluated the registrant’s disclosure controls and procedures within 90 days of this filing and have concluded that the registrant’s disclosure controls and procedures were effective, as of that date, in ensuring that information required to be disclosed by the registrant in this Form N-CSR was recorded, processed, summarized, and reported timely.
(b) The registrant’s principal executive officer and principal financial officer are aware of no change in the registrant’s internal control over financial reporting that occurred during the period covered by this report that has materially affected, or is reasonably likely to materially affect, the registrant’s internal control over financial reporting.
Item 12. Disclosure of Securities Lending Activities for Closed-End Management Investment Companies.
Not applicable.
Item 13. Exhibits.
(a)(1) The registrant’s code of ethics pursuant to Item 2 of Form N-CSR is filed with the registrant’s annual Form N-CSR.
(2) Separate certifications by the registrant's principal executive officer and principal financial officer, pursuant to Section 302 of the Sarbanes-Oxley Act of 2002 and required by Rule 30a-2(a) under the Investment Company Act of 1940, are attached.
(3) Written solicitation to repurchase securities issued by closed-end companies: not applicable.
(b) A certification by the registrant's principal executive officer and principal financial officer, pursuant to Section 906 of the Sarbanes-Oxley Act of 2002 and required by Rule 30a-2(b) under the Investment Company Act of 1940, is attached.
SIGNATURES
Pursuant to the requirements of the Securities Exchange Act of 1934 and the Investment Company Act of 1940, the registrant has duly caused this report to be signed on its behalf by the undersigned, thereunto duly authorized.
T. Rowe Price Global Funds, Inc.
| By | | /s/ David Oestreicher |
| | | David Oestreicher |
| | | Principal Executive Officer |
| |
| Date | | June 16, 2020 | | | | |
Pursuant to the requirements of the Securities Exchange Act of 1934 and the Investment Company Act of 1940, this report has been signed below by the following persons on behalf of the registrant and in the capacities and on the dates indicated.
| By | | /s/ David Oestreicher |
| | | David Oestreicher |
| | | Principal Executive Officer |
| |
| Date | | June 16, 2020 | | | | |
| |
| |
| By | | /s/ Alan S. Dupski |
| | | Alan S. Dupski |
| | | Principal Financial Officer |
| |
| Date | | June 16, 2020 | | | | |