EXHIBIT (c)(viii)
Report Entitled “State Budget 2008-09: Economic and Fiscal Update.”

STATE BUDGET
2008-09
ECONOMIC AND FISCAL UPDATE
20 February 2009
INTRODUCTION
Given the sharp deterioration in economic conditions, it has become necessary for the Government to update the economic and fiscal forecasts released in the Major Economic Statement in December 2008.
This document, the Economic and Fiscal Update, provides an update of key economic indicators for the State and is based on currently available data. The key fiscal aggregates have been updated for the Budget and forward estimates years for the General Government Sector. An update of the Public Non-financial Corporations Sector has not been undertaken at this time.
OVERVIEW
The Queensland Government released a Major Economic Statement in December 2008. Since that time, economic conditions have deteriorated significantly necessitating an update of the State’s economic and fiscal position.
Almost all major advanced economies are in recession with growth in China and India now expected to slow markedly. The Australian economy is also weaker than previously anticipated.
The Australian Government’s recently released Updated Economic and Fiscal Outlook illustrates a worsening in most of the economy’s major indicators with economic growth expected to slow to 1% in 2008-09 and 3/4% in 2009-10. As a result, employment is forecast to decline in 2009-10, causing the unemployment rate to rise to 7% by June quarter 2010. While Queensland is still forecast to grow at a stronger rate than the national economy, Queensland’s economic indicators for 2008-09 are expected to be weaker than forecast in the Major Economic Statement. Economic growth in Queensland is also forecast to slow further into 2009-10.
As a result, Queensland’s revenues are expected to be significantly below that forecast in the Major Economic Statement and, therefore, the Queensland Budget is now expected to move into deficit in 2008-09 and 2011-12 and further into deficit in 2009-10 and 2010-11. The forward estimates presented in this Economic and Fiscal Update indicate that the Government will not meet all fiscal principles under its Charter of Social and Fiscal Responsibility. Future Budgets will aim to return the State to a surplus operating position.
ECONOMIC OUTLOOK
Global Economic Conditions
The world economy has experienced a sharper downturn as a result of the global financial crisis than previously anticipated. Data released in late January 2009 indicate that the UK and US economies contracted 1.5% and 1.0% respectively in December quarter 2008.
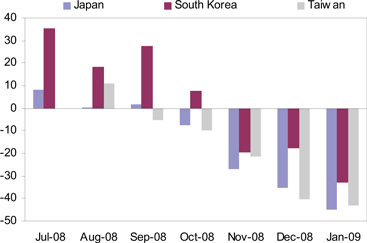
Queensland’s two largest trading partners, Japan and South Korea, recorded a 3.3% and 5.6% fall in GDP respectively in the December quarter, while annual growth in China eased by more than two percentage points to 6.8%. In annualised terms, this is the sharpest contraction in Japanese GDP since the early 1970s oil crisis and only the second double-digit decline since official GDP statistics began in the late 1950s. As a whole, Queensland’s major trading partner economies are now expected to contract by 0.7% in 2009, compared with 2% growth expected during the preparation of the Major Economic Statement in November 2008 (see Chart 1). This outlook represents the poorest since the series began and the first time our trading partners, in aggregate, have been forecast to contract.
| | | | |
| 1 | | 2008-09 Economic and Fiscal Update | | |
Chart 1
Queensland’s major trading partner GDP growth forecasts, 20091
(annual percentage change)

| | 1. | Non-Japan Asia includes New Zealand. Europe includes the United Kingdom |
Source: Queensland Treasury and Consensus Economics
The recent collapse in world trade flows has also been much sharper than expected, with economic downturns in the US and Europe flowing to Asia. Merchandise exports from Japan fell at an annual rate of 35.0% in December 2008 and are estimated to have deteriorated further in January 2009, while Taiwan and South Korea’s merchandise exports plummeted by 42.9% and 32.8% in January. Exports from emerging Asia have also weakened significantly, with exports from China declining 17.5% over the year to January 2009 (see Chart 2).
| | | | |
| 2 | | 2008-09 Economic and Fiscal Update | | |
Chart 2
Asian merchandise exports1,2
(annual percentage change)
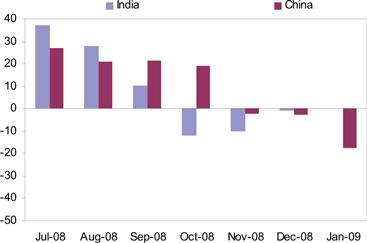
| 1. | Merchandise exports from South Korea, China and India are measured in US$ terms. |
| 2. | January 2009 data from Japan is provisional data for the first 20 days of the month. Data for all of January is expected to be available on 25 February for Japan and 2 March for India. |
Domestic Economic Outlook
Reflecting the deterioration in the world economic outlook and continued tight credit conditions, economic growth in Queensland is now forecast to be 2 1/2% in 2008-09, below the 3% forecast at the time of the Major Economic Statement (see Table 1). This is mainly due to a weaker outlook for exports, with a sharp deterioration in global steel production expected to suppress coal exports in 2009 (refer Charts 3 and 4), as well as a scaling back in metals production due to low base metal prices.
| | | | |
| 3 | | 2008-09 Economic and Fiscal Update | | |
Chart 3
Global steel production
(metric tonnes, millions)
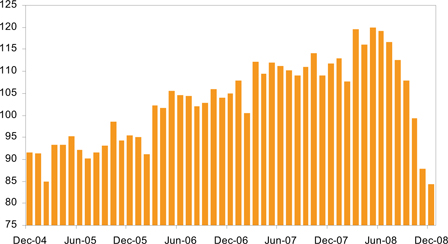
Chart 4
Queensland coal exports
(tonnes, millions)
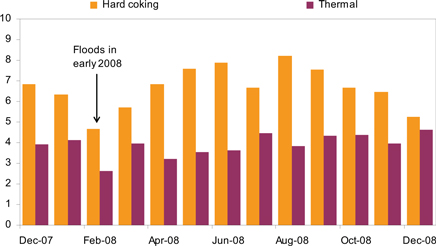
| | Source: | ABS unpublished trade data |
Dwelling investment is expected to fall by a larger amount than anticipated in the Major Economic Statement. Approvals for the construction of new houses and medium-to-high density dwellings continued to fall in December quarter 2008. However, housing finance approvals for existing dwellings have shown signs of recovery in recent months, following changes in transfer duty concessions by the Queensland Government announced in the 2008-09 Budget, the extension of the First Home Owner Grant (FHOG) in October 2008, and cuts in official interest rates of 400 basis points between September 2008 and February 2009. These factors, as well as continued population growth, are expected to translate into a recovery in new construction activity in 2009-10.
With equity prices remaining subdued and house prices falling in late 2008, growth in consumer spending is forecast to be slightly weaker than at the time of the Major Economic Statement (see Chart 5). While lower variable mortgage rates and the Australian Government’s Nation Building and Jobs Plan will support disposable incomes, households are likely to increase savings until consumer confidence improves.
| | | | |
| 4 | | 2008-09 Economic and Fiscal Update | | |
Chart 5
Consumer spending1 and household wealth
(annual percentage change)
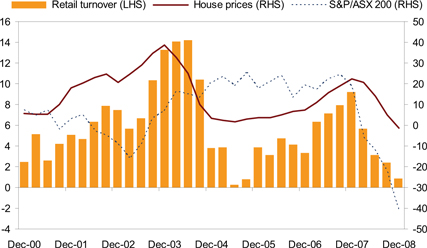
| | 1. | Chain volume measure, seasonally adjusted. |
| | Source: | ABS 6416.0 and 8502.0; RBA. |
Employment growth is forecast to slow and unemployment forecast to rise over the remainder of the financial year. The near term outlook for the labour market in 2008-09 is similar to that in the Major Economic Statement. The recent deterioration in the domestic economic outlook has largely been concentrated in the more capital intensive export sector. Employment growth is still forecast to slow to 2 1/4% and the unemployment rate is expected to rise to 4 1/4% in year-average terms. However, this forecast implies a rise in the monthly unemployment rate through the second half of the financial year, with the trend unemployment rate already rising from 3.7% in July 2008 to 4.1% in January 2009. As outlined below, this deterioration will continue into 2009-10.
Due to a sharper than expected decline in oil prices, inflation is forecast to be 4% in year-average terms in 2008-09, compared with 4 1/4% in the Major Economic Statement. This is expected to ease wage pressures, with the Wage Price Index forecast to rise by 4%, compared with 4 1/4% in the Major Economic Statement.
| | | | | | | | | | | | |
| Table 1 |
| Major Economic Parameters1 |
| | | Outcome 2007-08 | | MES Forecast 2008-09 | | EFU
Forecast | | UEFO National
Forecast |
| | | | | 2008-09 | | 2009-10 | | 2008-09 | | 2009-10 |
| | | | | | |
Gross state / domestic product2 | | 5.0 | | 3 | | 2 1/2 | | 1 | | 1 | | 3/4 |
| | | | | | |
Employment | | 2.8 | | 2 1/4 | | 2 1/4 | | - 1/2 | | 1 | | - 3/4 |
| | | | | | |
Unemployment rate3 | | 3.7 | | 4 1/4 | | 4 1/4 | | 6 1/4 | | 5 1/2 | | 7 |
| | | | | | |
Inflation3 | | 4.1 | | 4 1/4 | | 4 | | 2 1/4 | | 2 | | 2 |
| | | | | | |
Wage Price Index | | 4.5 | | 4 1/4 | | 4 | | 3 1/4 | | 4 | | 3 1/2 |
| | | | | | |
Population4 | | 2.3 | | 2 1/4 | | 2 1/4 | | 2 1/4 | | 1 1/2 | | 1 1/2 |
Notes:
| 1. | Figures not quoted as a fraction are an actual outcome. All figures and growth rates are in year-average terms unless otherwise specified. |
| 3. | Nationally, unemployment rate is estimate for June quarter and inflation is estimate for over the year to June quarter. |
| 4. | National population forecasts are taken from 2008-09 Australian Government Budget Papers. |
| Source: | Queensland Treasury and Australian Treasury Updated Economic and Fiscal Outlook (UEFO) |
| | | | |
| 5 | | 2008-09 Economic and Fiscal Update | | |
Overall economic growth is forecast to slow to 1% in 2009-10, largely reflecting a softening in business investment and a cautious household sector. After doubling over the previous five years, business investment is expected to have peaked, with construction activity related to the mining, commercial property and retail sectors expected to fall next year (see Chart 6). The depreciation in the A$ is also anticipated to reduce imports of machinery and equipment. Growth in consumption is also expected to weaken further in 2009-10, largely reflecting higher unemployment and the lagged impact of lower dwelling investment in 2008-09.
Chart 6
Business conditions1 and investment2

| | 1. | NAB Business Conditions Index, seasonally adjusted by Queensland Treasury, advanced one quarter. |
| | 2. | Chain volume measure, four quarter rolling sum. |
| | Sources: | National Australia Bank; ABS 5206.0 and Queensland Treasury |
Exports are expected to recover slightly in 2009-10. However, this largely reflects a turnaround in rural exports, which are less sensitive to changes in global incomes and where good rainfall has improved growing conditions.
Dwelling investment is also forecast to recover in 2009-10, due to the lagged impact of lower interest rates and the $21,000 FHOG for new home contracts signed before 1 July 2009. Recent falls in house prices, combined with lower interest rates, have improved housing affordability and should encourage housing demand. Furthermore, annual population growth is forecast to remain around 2 1/4% over the forecast period, reflecting ongoing high interstate and overseas migration. As a result, underlying demand for dwellings is also expected to support a recovery in construction activity.
Employment is expected to decline by 1/2% in 2009-10, consistent with slower growth in consumer spending and the outlook for business investment. As a result, the year-average unemployment rate is forecast to rise to 6 1/4% in 2009-10. Weaker labour market conditions are anticipated to slow growth in the Wage Price Index to 3 1/4% next financial year. Headline inflation is forecast to ease to 2 1/4% in 2009-10, reflecting weaker growth in domestic economic activity and an easing in capacity constraints.
Assumptions on which the economic forecasts for 2009-10 are based include a bottoming out in the global economic downturn in the second half of 2009, no further deterioration in credit conditions, a further monetary easing in the first half of 2009, steady population growth and an exchange rate that remains near current levels. Oil prices are expected to rise slightly. The forecasts also assume a timely implementation of income payments and infrastructure initiatives contained within the Australian Government’s Nation Building and Jobs Plan.
| | | | |
| 6 | | 2008-09 Economic and Fiscal Update | | |
While there is considerable uncertainty about the timing of recovery, the Queensland economy is projected to return toward long-run rates of growth over 2010-11 and 2011-12 (Table 2), in concert with national projections. Economic growth is projected to average 4% per annum, while employment growth is projected to average 2 1/4% over this period. These projections assume a return to average growth in the world economy and the effective functioning of the global financial system.
Table 2
Projections for Major Economic Parameters
(average annual percentage change)
| | | | |
| | | 2010-11 to 2011-12 |
| | | Queensland | | Australia |
Gross state / domestic product1 | | 4 | | 3 |
| | |
Employment | | 2 1/4 | | 1 1/4 |
| | |
Inflation | | 2 1/2 | | 2 1/2 |
| | |
Wage Price Index | | 3 3/4 | | 4 |
| | |
Population2 | | 2 1/4 | | 1 1/2 |
Notes:
| 2. | National population forecasts are taken from 2008-09 Australian Government Budget Papers. |
Source: Queensland Treasury and Australian Treasury UEFO
| | | | |
| 7 | | 2008-09 Economic and Fiscal Update | | |
FISCAL OUTLOOK
The deterioration in economic conditions has led to significant revisions in revenue (including taxation, royalty and GST revenue) resulting in a decline in the forecast net operating balance.
Table 3
General Government sector net operating balance
| | | | | | | | | | | | | | | | |
| | | 2008-09
Budget
$ million | | 2008-09
MES
$ million | | 2008-09
EFU
$ million | | | 2009-10
Projection
$ million | | | 2010-11
Projection
$ million | | | 2011-12
Projection
$ million | |
Net operating balance | | 809 | | 54 | | (1,573 | ) | | (3,166 | ) | | (3,204 | ) | | (2,910 | ) |
Table 4
General Government sector – other key financial aggregates
| | | | | | | | | | | | | | | | | | |
| | | 2008-09
Budget
$ million | | | 2008-09
MES
$ million | | | 2008-09
EFU
$ million | | | 2009-10
Projection
$ million | | | 2010-11
Projection
$ million | | | 2011-12
Projection
$ million | |
Cash surplus/(deficit) | | (1,970 | ) | | (3,013 | ) | | (4,647 | ) | | (6,134 | ) | | (5,304 | ) | | (4,826 | ) |
| | | | | | |
Capital purchases | | 6,651 | | | 7,094 | | | 7,068 | | | 6,987 | | | 6,257 | | | 5,598 | |
| | | | | | |
Net borrowing | | 2,915 | | | 3,424 | | | 4,852 | | | 7,963 | | | 6,759 | | | 6,327 | |
| | | | | | |
Borrowing | | 8,781 | | | 9,859 | | | 11,287 | | | 19,298 | | | 26,122 | | | 32,460 | |
Operating Balance
The General Government sector is expected to record an operating deficit of $1.573 billion in 2008-09 compared to the $54 million surplus anticipated at the time of the Major Economic Statement and $809 million surplus at the time of the 2008-09 Budget. The outyear estimates have also worsened significantly since this time, with net operating deficits anticipated each year across the forward estimates. This downward revision since the Major Economic Statement is primarily due to:
| • | | lower than expected taxation revenue in 2008-09, particularly transfer duty and motor vehicle duty, and downward revisions to growth forecasts for a range of taxes in the outyears |
| • | | forecast reductions in royalty revenue since the Major Economic Statement as a result of lower forecast prices and tonnages for thermal and coking coal |
| • | | reduced GST revenue from the Australian Government |
| • | | increased grant expenses particularly the First Home Owner Grant and Fuel Subsidy |
| • | | revisions to superannuation expense as a result of negative investment returns |
| • | | increased borrowing costs as a result of the deterioration in the net operating balance. |
The fiscal position has not been updated for the Australian Government’s recently announced Nation Building and Jobs Plan due to insufficient information. This package is likely to increase capital purchases but be neutral in terms of other key financial aggregates.
Table 5 provides a reconciliation of the current General Government sector net operating balance for 2008-09 to the Major Economic Statement estimate. Chart 7 illustrates the key components of the movement between the Budgeted net operating balance of $809 million and the current estimate of a deficit of $1.573 billion.
| | | | |
| 8 | | 2008-09 Economic and Fiscal Update | | |
Table 5
Reconciliation of 2008-09 net operating balance from Major Economic Statement
to Economic and Fiscal Update
| | | | |
| | $ | M | |
| 2008-09 MES net operating balance | | | 54 | |
| |
| Taxation revisions1 | | | (498 | ) |
| Royalty revisions2 | | | (427 | ) |
| GST revisions3 | | | (334 | ) |
| Technical revisions to revenue and expenses4 | | | (146 | ) |
| Superannuation adjustments for negative investment returns5 | | | (86 | ) |
| Fuel Subsidy and First Home Owner Grant revisions6 | | | (71 | ) |
| Additional borrowing costs7 | | | (35 | ) |
| Expenditure policy decisions8 | | | (31 | ) |
| |
| 2008-09 Economic and Fiscal Update net operating balance | | | (1,573 | ) |
Notes:
| 1. | Reflects changes in taxation including downward revisions of $500 million in transfer duty, $30 million in vehicle registration duty, and $8 million in other duties and an upward revision of $40 million for insurance duty. |
| 2. | Reflects changes in royalty revenue as outlined below. |
| 3. | Represents updated GST revenue data as advised by the Australian Government. |
| 4. | Mainly reflects adjustments to interest earned by statutory bodies which has been negatively impacted by investment returns on financial assets and lower title registration fees reflecting a deterioration in the housing market. |
| 5. | Represents the impact of negative investment returns. |
| 6. | Represents increases to grant programs as a result of increased demand. |
| 7. | Reflects the impact on borrowing costs as a result of the reduction in the net operating balance, partially offset by lower borrowing rates. |
| 8. | Primarily represents the Government’s decision to bring forward spending from the Sustainable Resource Communities fund, for the firefighter job evaluation and works at the Kangaroo Point TAFE site given the decision not to dispose of the land. |
Chart 7
Breakdown of change in 2008-09 net operating balance since 2008-09 Budget

| | | | |
| 9 | | 2008-09 Economic and Fiscal Update | | |
Taxation Revenue
Estimates of taxation revenue were revised down significantly in the Major Economic Statement ($884 million), primarily transfer duty across the Budget and forward estimate years and payroll tax in the latter years. This took into account actual revenue collections and economic indicators available at the time. However, collections and economic releases since that time indicate a more significant weakening of the housing and motor vehicle markets with no immediate sign of improvement.
Chart 8 shows the strong relationship between investment activity in residential property and transfer duty collections. In recent months, both transfer duty and investor finance levels have continued to deteriorate beyond the levels anticipated at the time of the Major Economic Statement. The latest level of investor finance was the lowest experienced in almost five years, with no evidence of the property market having bottomed.
House price data released by the Australian Bureau of Statistics since the Major Economic Statement shows Brisbane house prices fell in the year to December 2008, which may also reduce the confidence of potential investors. In addition, approvals for the construction of new houses and medium-to-high density dwellings continued to fall in the December quarter of 2008. As a result, the forecast for transfer duty has been revised down to reflect further weakness in the property market in the remainder of 2008-09.
Chart 8
Growth in transfer duty and investor finance, 12-month rolling averages, trend
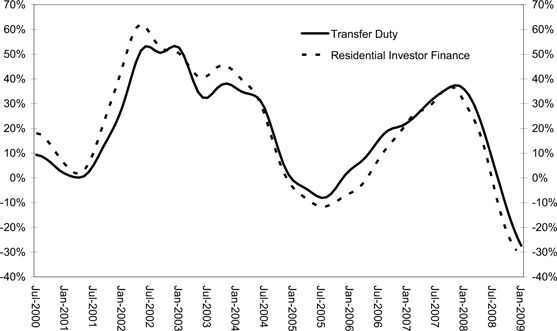
Source: ABS and Queensland Treasury
Reductions in mortgage interest rates, the Australian Government’s First Home Owner Boost and the increase in Queensland’s first home owner transfer duty concession have seen increased first home buyer activity. However, there is currently no sign of this flowing to increased activity in the rest of the market, noting that the changes to transfer duty announced in the 2008-09 Budget mean that the majority of first home owners pay no duty.
Transfer duty collections are now estimated at $1.75 billion in 2008-09, a downward revision of $500 million since the Major Economic Statement. Since the 2008-09 Budget, the transfer duty estimate has been revised down by $1.391 billion.
Current estimates are for a slow recovery of transfer duty beyond 2008-09.
| | | | |
| 10 | | 2008-09 Economic and Fiscal Update | | |
Revenue from duty on motor vehicle transfers, which was revised down significantly in the Major Economic Statement, has been revised down again to reflect further weakness in motor vehicle sales. Duty collections on motor vehicle transfers have been revised down by a further $30 million in 2008-09 to $435 million. So far in 2008-09, motor vehicle sales are more than 20% lower than in the corresponding period in 2007-08.
Payroll tax collections and labour market outcomes have shown resilience at this stage. However, it is widely accepted that employment is a lagging indicator of economic activity, suggesting that the impacts of the global financial crisis on payroll tax will be felt in the outyears, rather than in 2008-09. Therefore, the payroll tax estimate for 2008-09 has not been revised.
While the growth rates for payroll tax in forward estimate years had been revised down in the Major Economic Statement, the forecast weakening in employment in 2009-10 has necessitated further downward revisions to payroll tax growth rates.
Royalty Revenue
The estimates for coal royalty revenue included in the Major Economic Statement assumed a faster fall in prices than anticipated at Budget, more moderate growth in tonnages and a reduction in the AUD-USD exchange rate. With contract prices locked in until April 2009, the depreciation in the AUD compared with the USD represented a significant benefit to Queensland and was expected to result in increased royalty revenue, particularly in 2008-09 and 2009-10.
However, the worsening global growth outlook and the scale of cuts to global steel production is putting downward pressure on coal prices and is limiting the scope of growth in coal exports. Current market expectations are for coking coal prices to fall by at least 50% and thermal by around 40% in the next round of contract negotiations for the Japanese fiscal year commencing April 2009. Nevertheless, coal prices are expected to remain slightly above pre-2008 boom levels.
Chart 9
Contract coal prices, US dollars
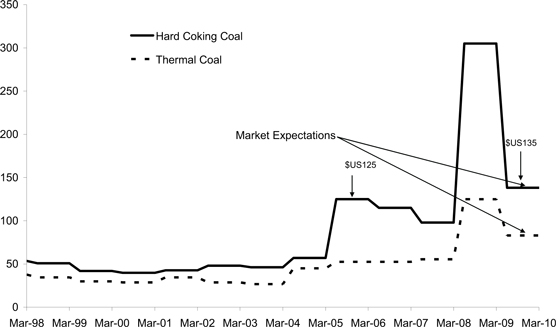
Source: Market expectations reflect the mean Consensus Forecast
| | | | |
| 11 | | 2008-09 Economic and Fiscal Update | | |
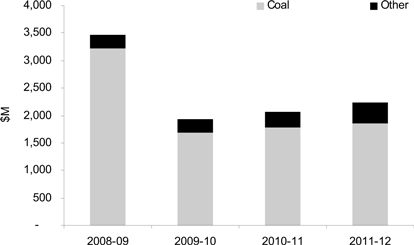
As a result, Queensland is expected to see reductions in its royalty revenue across the forward estimates (refer Chart 10). Royalty revenue in 2008-09 is now expected to be $3.476 billion ($3.605 billion including land rent) of which coal accounts for $3.215 billion, similar to the estimate included in the 2008-09 Budget, with the depreciation of the Australian Dollar being offset by reductions in export coal volumes in the second half of 2008-09 and lower coal prices in the June 2009 quarter.
Chart 10
Royalty revenue forecasts
2008-09 to 2011-12
| | | | |
| 12 | | 2008-09 Economic and Fiscal Update | | |
Table 6 outlines changes in taxation and royalty estimates since the 2008-09 Budget.
Table 6
Taxation and Royalty Estimates1
| | | | | | | | | |
| | | 2008-09
Budget
$ million | | 2008-09
MES
$ million | | 2008-09
EFU
$ million | | Change since
2008-09
Budget
$ million | |
Payroll tax | | 2,702 | | 2,766 | | 2,766 | | 64 | |
| | | | |
Duties | | | | | | | | | |
Transfer | | 3,141 | | 2,250 | | 1,750 | | (1,391 | ) |
Vehicle registration | | 518 | | 465 | | 435 | | (83 | ) |
Insurance2 | | 403 | | 386 | | 426 | | 23 | |
Other duties3 | | 29 | | 46 | | 38 | | 9 | |
Total duties | | 4,091 | | 3,147 | | 2,649 | | (1,442 | ) |
| | | | |
Gambling taxes and levies | | | | | | | | | |
Gaming machine tax | | 578 | | 553 | | 553 | | (25 | ) |
Health Services Levy | | 47 | | 41 | | 41 | | (6 | ) |
Lotteries taxes | | 210 | | 221 | | 221 | | 11 | |
Wagering taxes | | 38 | | 39 | | 39 | | 1 | |
Casino taxes and levies4 | | 61 | | 61 | | 61 | | | |
Keno tax | | 17 | | 17 | | 17 | | | |
Total gambling taxes and levies | | 950 | | 931 | | 931 | | (19 | ) |
| | | | |
Other taxes | | | | | | | | | |
Land tax | | 797 | | 797 | | 797 | | | |
Motor vehicle registration | | 991 | | 1,003 | | 1,003 | | 12 | |
Fire levy | | 279 | | 281 | | 281 | | 2 | |
Community Ambulance Cover | | 133 | | 136 | | 136 | | 3 | |
Guarantee fees | | 98 | | 98 | | 98 | | | |
Other taxes | | 65 | | 65 | | 65 | | | |
| | | | |
Total taxation revenue | | 10,106 | | 9,222 | | 8,724 | | (1,382 | ) |
| | | | |
Royalties | | | | | | | | | |
Coal | | 3,213 | | 3,649 | | 3,215 | | 2 | |
Other royalties and land rents | | 432 | | 383 | | 390 | | (42 | ) |
Total royalties | | 3,644 | | 4,032 | | 3,605 | | (39 | ) |
Notes:
| 1. | Numbers may not add due to rounding. |
| 2. | Includes duty on accident insurance premiums. |
| 3. | Includes mortgage duty and duty on life insurance. |
| 4. | Includes community benefit levies. |
GST Revenue
In its Updated Economic and Fiscal Outlook, the Australian Government further revised down its estimates of GST payments to states by around $1.7 billion in 2008-09 and around $2.8 billion in 2009-10 following downward revisions to forecasts of consumption and new dwelling investment and an expected increase in the level of unpaid GST liabilities. Queensland’s share of this is $334 million in 2008-09, growing to $533 million in 2009-10 and remaining around this level for the remainder of the forward estimates. The total reduction in GST revenue since the Major Economic Statement is just under $2 billion from 2008-09 to 2011-12. This is in addition to a $1.322 billion reduction in Queensland’s share of GST revenue included in the Major Economic Statement.
| | | | |
| 13 | | 2008-09 Economic and Fiscal Update | | |
Queensland’s share of GST revenue in 2008-09 is now estimated at $8.170 billion, which is $379 million less than Queensland’s share of GST revenue in 2007-08 and $516 million less than forecast at the time of its 2008-09 Budget. By comparison, Queensland Health’s budget is $8.35 billion in 2008-09, an increase of $1.2 billion or 16.8% on the 2007-08 Queensland Health budget.
Superannuation Expense
As announced in the 2008-09 Budget, the Queensland Government decided to reduce investment return volatility in the General Government net operating balance by transferring certain Consolidated Fund superannuation and other long term assets to the Queensland Treasury Corporation (QTC) in exchange for a debt instrument that earns the General Government sector 7.5% per annum.
As of early December 2008, these assets had returned approximately negative 13%. As a result, QTC recorded a loss for the first six months of 2008-09 of $3.483 billion, of which the long term assets contributed $3.557 billion.
Fluctuations in investment returns on these long term assets are restricted to market value adjustments. There is no impact on QTC’s activities or its capacity to meet its obligations. Over the long run, QTC is anticipated to recover this position as investment returns are expected to average 7.5% which is equivalent to the rate of return payable by QTC on the debt instrument.
Legacy issues arising from the transfer mean that the negative returns have increased the State’s superannuation expense by around $86 million per annum from 2009-10.
Borrowing Costs
The State is now forecast to borrow $10.790 billion more across the forward estimates than forecast at the time of the Major Economic Statement (see discussion on borrowings below). This increase in borrowings is the result of the deterioration in the net operating balance in each of the Budget and forward estimates years.
The increase in the amount of borrowings to finance the deficit leads to an increase in borrowing costs of $35 million in 2008-09 growing to over $450 million by 2011-12.
Cash Surplus/(Deficit)
The General Government sector is now expected to have cash deficits of $4.647 billion in 2008-09, $6.134 billion in 2009-10, $5.304 billion in 2010-11 and $4.826 billion in 2011-12. At the time of the Major Economic Statement, a cash deficit of $3.013 billion was expected for 2008-09 with deficits of between $1.8 billion and $3.3 billion across the forward estimates.
The larger than expected cash deficit is predominantly the result of the cash impact of the reduction in the net operating balances of $10.790 billion, reflecting the deficit position across the Budget and forward estimates.
Capital Purchases
Purchases of non-financial assets (i.e. capital expenditure) in 2008-09 are expected to be roughly equivalent to that forecast in the Major Economic Statement. The minor movement reflects the revised cash flows of Specific Purpose and National Partnership Payments from the Australian Government.
| | | | |
| 14 | | 2008-09 Economic and Fiscal Update | | |
These projected numbers have not been updated for the Australian Government’s recently announced Nation Building and Jobs Plan due to insufficient information. However, it is expected that the package will increase capital purchases across the forward estimates.
Borrowing
Net borrowings of $4.852 billion are expected in 2008-09, an increase of $1.428 billion over the Major Economic Statement estimates largely due to the negative operating position. The deterioration in the net operating balance has resulted in increased borrowings of $10.790 billion across the Budget and forward estimates.
Given an update of the Public Non-financial Corporations Sector has not been undertaken, it is not possible to determine a borrowing for the State as a whole. However, assuming no change in the Public Non-financial Corporations Sector, Table 7 provides an indicative view of borrowing as a result of the latest General Government estimates.
Table 7
Preliminary Estimate of Borrowing
Non-financial Public Sector
| | | | | | | | | | | | |
| | | 2008-09
Budget
$ million | | 2008-09
MES
$ million | | 2008-09
EFU
$ million | | 2009-10
Projection
$ million | | 2010-11
Projection
$ million | | 2011-12
Projection
$ million |
Borrowing | | 41,587 | | 42,473 | | 43,901 | | 56,650 | | 66,452 | | 74,032 |
| | | | |
| 15 | | 2008-09 Economic and Fiscal Update | | |
APPENDIX – SENSITIVITY OF REVENUE ESTIMATES
The rate of growth in tax revenues is dependent on a range of factors that are linked to the rate of growth in economic activity in the State. Some taxes are closely related to activity in specific sectors of the economy, whilst others are broadly related to the general rate of economic growth, employment, inflation and wages. A change in the level of economic activity, resulting from economic growth differing from forecast levels, would impact upon a broad range of taxation receipts.
Other revenue items are influenced by external variables such as the exchange rate, and global commodity prices.
Exchange rate and commodity prices and volumes – royalties estimates
Estimates of mining royalties are sensitive to movements in the Australian dollar-US dollar exchange rate and commodity prices and volumes.
Contracts for the supply of commodities are generally written in US dollars. Accordingly, a change in the exchange rate impacts on the Australian dollar price of commodities and therefore expected royalties collections.
A one cent variation in the Australian dollar-US dollar exchange rate would lead to a change in royalty revenue of approximately $23 million in the second half of 2008-09.
Also impacting on royalty estimates are volume effects. A large component of Queensland’s royalty collections is derived from coal. A 1% variation in export coking and thermal coal volumes in the second half of 2008-09 would lead to a change in royalty revenue of approximately $12 million.
The 2008-09 assumptions for export coal prices are based on existing contract prices until 1 April 2009, while price assumptions for the June quarter 2009 are broadly consistent with current spot prices and consensus forecasts. A 1% variation in the price of export coal achieved in June quarter 2009 would lead to a change in royalty revenue of approximately $5 million in 2008-09.
Property values and volumes – transfer duty estimates
Until recently, high levels of activity in the property market had resulted in strong growth in revenue collections through transfer duty receipts. The level of transfer duty receipts flowing from property market activity has a number of elements. The key elements are the value and volume of properties changing hands.
For the remainder of 2008-09, the property market is generally expected to remain flat, with the exception of the first home buyer segment, which is benefiting from substantial reductions in mortgage interest rates, the Australian Government’s First Home Owners Boost and the Queensland Government’s increased transfer duty exemption. However, the increased activity in the first home buyer segment is not expected to have a significant flow-on impact on the rest of the property market in the remainder of 2008-09.
A 1% variation in the average value of property transactions would change transfer duty collections by approximately $8 million in the second half of 2008-09.
A 1% variation in the volume of transactions would change transfer duty revenues by approximately $7 million in 2008-09.
| | | | |
| 16 | | 2008-09 Economic and Fiscal Update | | |
Wages and employment growth – payroll tax collections
Wages and employment growth have a direct impact on payroll tax collections. The Economic and Fiscal Update assumptions are for an increase in the Wage Price Index of 4% and employment growth of 2 1/4% in 2008-09.
A one percentage point variation in wages growth would change payroll tax collections by approximately $28 million across 2008-09. Similarly, a one percentage point variation in employment growth would change payroll tax collections by $28 million.
Parameters influencing Australian Government GST payments to Queensland
Estimates of Australian Government GST revenue grants to states and territories are dependent on total GST revenue collected, which tends to be closely correlated with the general level of economic activity. The Australian Government has provided estimates of total GST collections in its Updated Economic and Fiscal Outlook. Queensland continues to bear the risks of fluctuations in GST revenues and the other components of the package, such as the First Home Owner Grant Scheme, administrative costs associated with the GST and taxes foregone.
The Australian Government’s estimate of GST revenue in 2008-09 is based on its forecast of key parameters such as household consumption growing by 1 3/4% and dwelling investment falling by 2%. As with all other tax estimates, there is a risk of lower collections than estimated by the Australian Government if economic growth and consumption is weaker than expected.
Queensland’s share of GST funding (relativity) has declined and is below a population share for the first time in 2008-09. It is expected that Queensland’s relativity and therefore share of GST funding will decline further.
Due to the complexities associated with the GST base, the information provided in the Australian Government Budget Papers is not sufficient to prepare indicative forecasts of the sensitivity of GST estimates to key economic variables.
| | | | |
| 17 | | 2008-09 Economic and Fiscal Update | | |