EXHIBIT (c)(xvi)
Queensland’s Budget Papers for 2009-10
Exhibit (c)(xvi)
APPROPRIATION BILL 2009
(Second Reading Speech, 16 June 2009)
TREASURER
The Honourable Andrew Fraser MP
Treasurer and Minister for Employment
and Economic Development
APPROPRIATION BILL 2009
(Second Reading Speech, 16 June 2009)
TREASURER
The Honourable Andrew Fraser MP
Treasurer and Minister for Employment
and Economic Development
Mr Speaker,
I move that the bill be now read a second time.
“The scope and need for … development are obvious to all. In addition to creating assets of value to the community, the utilisation of funds for these purposes relieves unemployment in a most effective manner. Business is stimulated by the circulation of increased purchasing power which, in turn, augments demand for consumable goods.”
This statement in Treasurer Forgan Smith’s 1933 Budget Speech rings true more than 75 years later as the 2009–10 State Budget is introduced.
This is a Budget about the future.
It is not about tomorrow, but the future beyond.
It is the first Budget of a newly constituted government.
It is delivered at a time of immediate upheaval and uncertainty, but delivered with a focus on sustainability in the decades ahead.
It is a Budget that has a dual task—to support the economy during this time of need, and to chart a course for a new future beyond these dark hours.
ECONOMIC AND FISCAL OUTLOOK
Mr Speaker, there is almost universal acceptance that the globe is experiencing the most severe financial crisis since the 1930s.
The synchronised and rapid deterioration that swept the globe will see global output contract for the first time since the Second World War.
Twelve months ago Queensland’s major trading partners were forecast to grow by 3 1/2%, today they are forecast to contract by 3% in 2009.
Our major trading partner, Japan, has recorded four consecutive quarters of negative growth.
South Korea, Taiwan, the United States, the United Kingdom, the Netherlands and Brazil are all in our top ten trading nations … and all are in recession.
1
The International Monetary Fund (IMF) forecasts the average unemployment rate of advanced economies will reach 9.2% in 2010.
The synchronicity of the collapse in global demand has been countered by a synchronicity of effort by governments and central banks alike.
Significant fiscal stimulus in concert with monetary policy easing has sought to inject and invite demand.
Australia has been a stand out performer amongst our peers—before and since the global recession.
And Queensland has stayed ahead of the nation.
We have been out in front for 12 years, growing ahead of the nation and we are set to close off this most tumultuous of years with positive—albeit marginal—growth of 1/2%.
Just as the nation expects to enter into a sustained period of contraction next year, we expect to see the Queensland economy also experiencing negative growth.
The Queensland economy is forecast to contract by 1/4% in 2009–10. Once again, this forecast would see our economy outperforming the nation.
Our modern, diversified economy has provided capacity to absorb the full effects. Western Australia, which is more reliant on resources, is forecast to contract by 1 1/4%.
Growth in Queensland is forecast to return the following year, but remain below trend.
Our economy has been buffeted by the global recession, and the roughest seas remain ahead.
After tripling over the last eight years, business investment is expected to fall by 17% in 2009–10. The last echoes of the boom that have sustained the economy through most of this financial year are now fading.
Apart from our agricultural sector, which has experienced the natural disaster and the natural wonder of flooding rains, our export outlook is challenging.
By far the starkest numbers in our economic outlook are those on forecast unemployment. The economy continues to shed jobs.
While our unemployment rate remains half a per cent better than the nation, unemployment is expected to rise, relentlessly and remorselessly … as it has through this year, as it will through next year.
Unemployment for 2008–09 is expected to remain in line with the forecast at February’s Economic and Fiscal Update of 4 1/4% for the year, and is now forecast to be 6 1/2% in 2009–10.
Unemployment is now expected to reach 7 1/4% the year after next, and is forecast to be at that rate through most of 2010–11.
2
In starker, human terms, we will see Queensland’s unemployment queue stretch to 175,000 people. That’s 175,000 individual tragedies … with impacts that extend beyond the individual to their families, their children.
It is our society that bears the human and financial cost, and we must fight against it.
These are the 175,000 reasons the Government does not resile from its commitment to funding a building program to generate demand and generate jobs—and build for the future.
Fiscal Outlook
At the centre of this Budget and at the centre of the Government’s immediate economic strategy, is a massive $18.2 billion capital works program.
The program will be maintained against the colossal drop in forecast revenue of more than $15 billion across the forward estimates.
Our revenues from transfer duty, GST and royalties have taken a battering.
Royalty revenue, never forecast to stay at record highs, has been written down further as contracts have settled and the Australian dollar has appreciated.
As private sector investment evaporates it is this public investment, undertaken in partnership with the Federal Government that will provide support to the economy.
This is a deliberate strategy by the Government to support the economy and generate jobs. It is a deliberate strategy that recognises current economic circumstances.
The budgeted injection of $18.2 billion—when the economy needs it most—necessarily means we need to make longer-term decisions to provide stability to the State’s finances.
Our capital program will need to adjust in the future to match the economic circumstances of the future.
The Government is also adopting a deliberate strategy to return the budget to surplus.
It is Labor in government that has delivered surplus budgets, Labor in government that has overseen our economy outperform the nation, Labor in government that has driven unemployment down and kept it below the national rate.
With the revenue wipe-out, the Budget has been forced into deficit through the forward estimates.
The 2008–09 estimated actual balance is a deficit of $574 million, which is almost $1 billion better than forecast in February. The Budget forecasts a negative operating balance of $1.954 billion for the year ahead, around $1 billion better than that forecast in February.
3
Mr Speaker,
The 2009–10 Budget provides for $5.4 billion of measures that commence the turnaround of the State’s finances.
The abolition of the fuel subsidy contributes $2.4 billion.
While some measures have immediate impact, others are about long-term structural reform that will deliver benefits beyond the forward estimates and for years to come.
Under the new Financial Accountability Act 2009, the Government is required to adopt a Charter of Fiscal Responsibility, including the need to have Fiscal Principles.
This Budget not only adopts immediate measures, it sets out the framework that will return the Budget to surplus into the future.
Our 5-year Renewing Queensland Plan is central to our medium-term fiscal strategy.
The current and future balance sheet of the State will benefit from the proposed transactions.
Under the plan, whole-of-state balance sheet debt will be reduced, and the net proceeds will be applied in the General Government sector to assist in the future funding of service delivery infrastructure.
For the advancements in lifesaving medical treatments not yet imagined, for the educational technology not yet created and for the clean energy sources not yet developed, we need to look to the future and to move forward.
We need to move forward, beyond those things government currently does because it always has, to fund the priorities of the future.
The plan is central to our commitment to stabilise the State’s balance sheet, and the Government will move forward to legislate the plan with this Budget.
As part of our resolve, we also are adopting a commitment to contain future expenditure growth to real per capita levels. This is a fiscal discipline necessary to build the path back to balance and means expenditure growth beyond inflation and population growth will not be adopted.
The maintenance of a competitive tax regime is important in encouraging investment and in encouraging future growth and the Government reaffirms that commitment for the future.
We affirm this with our commitment to maintain the lowest payroll tax rate in the nation.
We affirm this with our commitment to exclude apprentice and trainee wages from payroll tax and extend a rebate of a further 25% on these wages. This measure will provide relief for the year ahead and assist businesses to keep apprentices and trainees during the tough times ahead.
4
I also announce further relief for business with the extension of the terms for land tax payments for 2009–10, paving the way for the introduction of an instalment payments regime the following year.
We are committed to returning the Budget to surplus by 2015–16. This Budget begins the task of delivering on that commitment.
It begins, but does not complete that task. This will be an ongoing quest.
The Budget also includes other important structural reforms.
An overhaul of local government subsidy programs will see future subsidies targeted at councils most in need. An additional $127 million is provided over the next two years to fund a program of significant works with a new capped scheme to be introduced from 1 July 2011.
Our farsighted local government reforms were implemented to make councils stronger, and this reform aligns future funding with future need.
As essential service providers, state governments around the nation expend half their entire budget on employee costs: on teachers and school cleaners, nurses and orderlies, police and court wardens and land titles clerks.
$18.6 billion of the $39 billion allocated is required for wages, superannuation and other costs of the workforce that serves Queensland.
We are a Labor government—a government that will honour the agreements it has with its employees. We will honour wage agreements, reached in good faith.
We will also honour our commitment to lead by example in superannuation, because it is the right thing to do for the long term sustainability of our nation as we strive as a nation to fund secure retirement incomes for all Australians.
We will honour those commitments provided in the past, but it must be recognised that the future landscape has changed.
The Government will provide that for current year negotiations not agreed by 1 September, a new wages policy of 2.5% will apply—the mid-point of the Reserve Bank’s target band for inflation.
The policy will be resolutely applied and effective on 1 July for all senior public servants. The wages freeze for Members of Parliament remains in force.
Visiting a renewed discipline upon government is important in charting a course for budget sustainability.
5
The 2008–09 Budget set a $60 million efficiency dividend, due to rise to $180 million for 2009–10. The Budget I present today sees the Government bring forward a planned additional $100 million in targeted savings originally planned to commence from 2010–11.
Total savings of $280 million form part of the 2009–10 Budget—to garner the benefits from our overhaul of the Public Service structure. The savings are set across the board and represent a bringing forward of our target for 2010–11.
The reforms in this Budget set a course. It is a course that will require vigilance and further actions in the future. The reforms begin the task of returning the Budget to balance and improve our credit rating.
The immediate priority must be on funding a building program to support jobs and support our economy, when it needs it most.
$18.2 BILLION BUILDING PROGRAM
Our capital program is doing the heavy lifting on infrastructure investment. It alone is more than the combined total of the infrastructure spend planned by Victoria, South Australia and Tasmania.
The Budget proposes a building program that will support 127,000 jobs across Queensland.
It is a building program that will create jobs, support demand and deliver the platform for future growth.
The program’s breadth is aimed at the full force of the downturn delivered unto us from the global recession.
Health and Hospitals
It’s an $18.2 billion program that continues, not cuts, our hospital building program.
Investment in hospital and health facilities accounts for about $1.3 billion of capital works spend this year.
$155 million will be spent on the Gold Coast University Hospital as construction works will see it begin to take shape through the year, and an additional $80 million is allocated for a research facility to be built as part of the new Queensland Children’s Hospital.
The development of the Sunshine Coast University Hospital, proposed for development in partnership with the private sector, will commence with more public beds provided sooner than originally planned.
6
The new Mackay Hospital will begin to take shape this year with a spend of $61 million. We will move ahead on the upgrades of the Cairns and Mount Isa hospitals. The expansions of Townsville and Rockhampton hospitals are funded—and funded in partnership with a federal government that puts money into building hospitals.
Health capital works are underway across the State, including the expansions of Bundaberg Hospital and Robina Hospital, projects nearing completion at Ingham and Yeppoon hospitals and work commencing this year on the birthing centre at Toowoomba Hospital.
Roads and Transport
Our massive program of transport infrastructure capital works will also continue. The expansion of the coal terminal at Abbot Point continues under our commitment to business as usual with another $305 million in this Budget.
The Cairns cruise terminal facility has $11 million allocated by this Budget, as we deliver on our commitment to the people of Cairns and the tourism industry upon which they rely.
The long awaited Port Access Road—which will benefit Townsville residents and their economy alike—has $47.3 million allocated in 2009–10.
The Townsville Ring Road to Shaw Road has been finished and the Douglas Arterial duplication is to begin.
The $100 million Bundaberg Ring Road will be completed.
The State Budget will contribute $464 million to build the Gold Coast Rapid Transit project, with the Commonwealth providing $365 million and the Gold Coast City Council contributing $120 million.
We will also provide funding towards the Cooroy to Curra upgrade on the Bruce Highway—a notorious blackspot on the national highway.
The $315 million new Houghton Highway Bridge goes $125 million further across the bay this year, and the second Gateway Bridge goes $259 million higher above the river.
Roadworks on the Roma–Taroom Road, on the Aramac–Torrens Creek Road and on the Carnarvon Highway will be completed and $4.4 million is allocated to the widening of the Flinders Highway west of Charters Towers.
The realignment of the Dawson Highway at Calliope goes $36 million further and the widening of the Maryborough–Hervey Bay Road has $16 million allocated.
Fittingly, the duplication of the Forgan Bridge in Mackay has $37 million allocated as part of our record building program.
7
Construction of the $466 million Eastern Busway from Buranda to Coorparoo and the $735 million Northern Busway from Enoggera Creek to Kedron will continue as we build the public transport infrastructure to sustain our growth.
Essential Infrastructure—Delivering More Jobs
The $600 million Supreme and District Court complex, which will support almost 5,000 jobs in total, is allocated $152 million this year.
The expansion of Lotus Glen Correctional Centre in far North Queensland, which will provide on-site jobs for about 250 construction workers, and the new Gatton women’s prison will have a combined $363 million spent on construction this year.
The Cleveland Youth Detention Centre in North Queensland will generate jobs and demand in Townsville with a $74 million spend this year.
The $348 million Wyaralong Dam kicks off in earnest with $171 million of expenditure this year, while construction will continue on the $187 million Toowoomba to Wivenhoe pipeline.
Across the board the building program is delivering jobs today, and the platform for growth for the future.
Immediate jobs for long term prosperity.
GENERATING JOBS IN HOUSING
Mr Speaker,
The single largest injection into public housing in the State’s history will be funded in this Budget including a $140 million allocation from the Future Growth Fund to support the Australian Government’s stimulus package.
This will add more than 4,000 to the housing stock in this State over the next three years.
Boosts to the First Home Owner Grant and our nation-leading reforms abolishing stamp duty for first home buyers all the way to $500,000 have supported demand at the all important entry-level of the market.
States like Victoria and South Australia have implemented sleight of hand temporary boosts to the First Home Owner Grant.
These states still take more than they receive by whacking the first home owner with tens of thousands of dollars in stamp duty.
This Government has taken the lead—and we intend to stay there.
Today I announce we will continue on our quest to help young Queenslanders into their first homes.
8
We will abolish stamp duty for vacant land for first home buyers who purchase land to build their first home up to $250,000.
And we will extend the concession to land up to a value of $400,000—ensuring Queenslanders who choose to build their first home rather than buy will benefit.
This move will bring the cost of our stamp duty abolitions for first home buyers to around $250 million in 2009–10.
That’s $250 million that could be added back to the bottom line.
First home buyers today are the fastest growing proportion of the market—at around 30% of all home purchases—our reforms are directly aimed at stimulating the housing sector. And housing construction, means jobs, apprenticeships and traineeships.
Private dwelling investment was clubbed by the high interest rates of 2008 and the global recession has made sure it has stayed on the canvas.
Along with our continued quest to stimulate the market, we will oversee the $1.45 billion budgeted for construction and upgrades of social housing.
This unprecedented program will not only provide a roof over the heads of many of Queensland’s most needy, the work generated will help keep a roof over the heads of thousands of construction workers and their families.
FRONTLINE SERVICES FOR A GROWING POPULATION
Mr Speaker,
As we pause this year to celebrate our 150th year, the rush to join us continues.
Data released this month confirmed that our population grew by more than 2,000 people per week on average over 2008.
Our population continues to swell as the State’s warm embrace captures more hearts.
These days we seek also to capture their minds. In fact, in the last decade, the number of researchers in Queensland has increased by 55%.
It is why we are investing in projects such as the Translational Research Institute at the Princess Alexandra Hospital. Our $100 million commitment, along with $140 million from the Australian Government, will establish an Australian first—a one-stop shop for the discovery, production and clinical testing of new biopharmaceuticals and treatments.
Population growth means we need more frontline workers, not fewer. It means we need more teachers, more police, more ambulance officers.
This Budget does just that—it provides for 350 more teachers and teacher aides, 203 more police and another 50 ambulance officers. It provides for 645 more doctors, nurses and health practitioners.
9
Seven new schools over the next three years are to be built to cater for growth in expanding communities, including on the Gold and Sunshine Coasts and in the booming western corridor.
We will increase teacher aide hours and dedicate $20 million to improve literacy and numeracy, with 80 dedicated coaches, summer schools and more resources for those in danger of falling behind.
A new Leadership Centre for school principals will be established, to provide our principals with the best chance to develop their skills and lift school performance.
The 203 additional police funded in this year’s Budget will expand the ranks of a police force which has grown to 10,000 to serve our growing State.
Only under Labor has our police-to-population ratio been brought to the national average and we intend to keep it there.
New stations will be completed at Carseldine, Crestmead, Reedy Creek/Robina, Sippy Downs and Springfield and works will commence or progress on replacement stations at Murgon, Lockhart River, Camp Hill/Carina, Fortitude Valley and Charleville.
As 20 ambulance stations will be constructed or redeveloped, so too will nine fire stations. One hundred and fifty new ambulance vehicles, 23 new fire trucks and 34 rural fire service vehicles are also funded.
Our rural fire service will gain more resources to improve safety as we honour our election commitment.
The Government wants to ensure the appropriate resourcing of our rural fire service in particular and will commence a review of rural fire service funding and the fire levy system this year.
We are also providing resources to some of our hardest working, and most important Queenslanders. Community sector workers who care and support some of our most vulnerable Queenslanders, the frail elderly, the disabled and the unwell, have recently had the value of their work recognised by the independent Queensland Industrial Relations Commission.
The single biggest allocation of additional resources in this Budget—some $414 million across four years—is provided to support the community sector to continue their essential work.
We will also assist older Queenslanders by increasing the subsidy available for electricity bills by 15.67% to assist with the increased cost of electricity. This increase is being funded by redirecting $6.7 million that was being paid to local governments to subsidise costs for street lighting.
Tough times mean choices have to be made. This Budget makes those choices.
10
FUNDING SET ASIDE—FOR THE FUTURE
Mr Speaker,
In recent years the Government has established a number of important funds, and prudently set aside money for priorities.
The Queensland Future Growth Fund was established with more than $3 billion and this Budget provides allocations not only to housing as outlined already, but to the development of clean coal technology vital to the future of our economy and our environment.
The Future Growth Fund will maintain a balance in excess of $1 billion as at 30 June 2010 and continues to earn interest for the benefit of future allocations.
The $50 million Renewable Energy Fund was established to support research and development for new forms of energy and today I announce a significant disbursement as we invest in the green energy solutions of the future:
| | • | | $9.3 million for a new geothermal power station at Birdsville and for mapping potential geothermal sites closer to the coast; |
| | • | | $9 million for the Mackay Sugar co-generation project; and, |
| | • | | $7.5 million for a project with CSIRO, subject to gaining an industry partner, for SolarGas One, the world’s first solar multi-tower array system using SolarGas technology. |
Along with implementing our Solar Hot Water program, these initiatives are directed firmly at providing cleaner, greener ways to power our future development.
The Climate Change Fund provides a funding stream of $30 million per annum to assist in meeting the other great challenge of our time—moving to a low carbon economy.
Today I announce a range of initiatives that will form part of our future agenda on dealing with, and adapting to, the reality of climate change.
We will build on the success of our ClimateSmart Home service with an allocation of $15 million over four years for the ClimateSmart Business Service.
The new service will be developed this year to assist small-to-medium sized Queensland businesses save energy and reduce their greenhouse gas emissions in the lead up to the planned introduction of a Carbon Pollution Reduction Scheme in 2011.
We will also invest $8 million over four years to increase the energy efficiency of government buildings and set aside $15.6 million for assisting with preparedness for natural disasters made more likely by climate change.
11
Last year I established a $70 million Prevention and Early Intervention Incentives Pool to drive innovative policy proposals aimed at preventing avoidable costs—human and financial.
Simply put, we must seek out new interventions to prevent the tragic cycles which are so unimaginably costly to individuals, families, communities and their government.
Today I announce a range of projects totalling $28.3 million over three years, which will trial, test and evaluate new ideas, new modes of service delivery and new approaches to some age-old problems.
Community-based housing for young people with a mental illness will seek to treat symptoms early before young people and their families are swept into a tragic spiral that can lead to a lifetime in and out of acute care at immense cost to the individual and to our health system.
A pilot program to intervene early in new domestic violence cases will seek to avoid the confronting reality that episodes are rarely a one-off.
Not only will families avoid the incalculable harm, we seek also to avoid the other costs—call outs with further demands on social, health and emergency services.
Two separate programs will seek to avoid the costs of the cycle of recidivism. Offenders with cognitive or developmental disorders who otherwise will likely cycle through the justice system regularly at immense cost, and without benefit, will be targeted along with juvenile offenders at risk of homelessness and a likely life of offending. Securing jobs for these young offenders will be the frontline task.
The largest allocation is for an $8.7 million program in the Logan area to improve literacy and numeracy outcomes at low socio-economic schools through new and innovative approaches, including supporting parents to improve their parenting skills and literacy and numeracy skills to help break the typical cycle.
Other projects seek to trial new ways of avoiding ongoing costs in the ambulance and health systems, in child protection and in disability services.
Not all will get the results we might hope. But through these pilots and these trials we seek not only to avoid the human costs of violence, neglect and lack of support but to avoid the inevitable cost to the public of dealing with the consequences.
If we can prevent and avoid the costs—human and financial—we will do a great service to many individuals and families but also the community that otherwise bears the costs of social intervention services.
The demands on government services have substantially increased over the last two decades in particular. This funding is about providing sustainable services for the future, not just picking up the pieces afterwards, and the bill.
12
These funds—the Future Growth Fund and the Renewable Energy Fund, the Climate Change Fund and the Prevention and Early Intervention Incentives Pool—make possible these investments at a time of fiscal rectitude.
By setting aside these funds for the future we have provided ourselves with the opportunity to fund initiatives to deal with the challenges of our future: environmentally, socially and economically.
They are the hallmark of a government determined to face up and confront our many challenges, as we look far ahead.
CONCLUSION
Mr Speaker,
The framework set down by this Budget and the bills I introduce today are the most significant structural reforms to the State’s finances since the Second World War.
Together the bills seek to address the ravages of a global recession not seen since the Great Depression.
This is a Budget that reinforces our determination to build Queensland’s future.
… our determination to build Queensland, to build the roads, the schools, the hospitals that our growing State needs.
… our determination to create jobs for Queenslanders with our record building program.
… our determination to keep pace with the essential services needed by a young and growing State with more nurses, more police, more teachers and frontline workers.
… our determination to apply fiscal discipline and make the tough decisions to put the State’s finances on the pathway to surplus.
… our determination to keep our eye firmly on the future as we deal with the immediate challenges.
This Budget lays the foundation stones for the path that lies ahead.
Paved with uncertainty, we should—indeed we must—be optimistic about the fundamental strengths of the ground on which we build.
We are building here for the future.
We are building now for the future.
Building upon our strengths.
For a time ahead, beyond the current hour, when the path is clearer and our bright future is forever the destination ahead.
I commend the Bill to the House.
13
2009–10 State Budget Papers
1. Budget Speech
2. Budget Strategy and Outlook
3. Capital Statement
4. Budget Measures
5. Service Delivery Statements
Budget Highlights
The suite of Budget Papers is similar to that published in 2008–09.
In March 2009, machinery-of-Government changes saw the creation of 13 departments reporting to 18 Ministers.
These new arrangements have required minor changes to how information is presented in some Budget Papers. In particular, Budget Paper No. 5—Service Delivery Statements is now presented on a departmental rather than a Ministerial basis.
The 2009–10 Budget Papers provide continuity of information between the previous departmental structure and the new arrangements. Future budget papers will present information, including financial statements, only from a whole-of-department point of view.
The Budget Papers are available online at www.budget.qld.gov.au or they can be purchased through The Queensland Government Bookshop, individually or as a set. Please phone (07) 3883 8700 (1800 801 123 for callers outside of Brisbane).
© Crown copyright
All rights reserved
Queensland Government 2009
Excerpts from this publication may be reproduced, with appropriate
acknowledgement, as permitted under the Copyright Act.
Budget Strategy and Outlook
Budget Paper No.2
ISSN 1445-4890 (Print)
ISSN 1445-4904 (Online)

STATE BUDGET
2009-10
BUDGET STRATEGY AND
OUTLOOK
Budget Paper No. 2
TABLE OF CONTENTS
| | | | |
| 1 | | Overview – Medium Term Fiscal Strategy | | 1 |
| | |
| | Fiscal Strategy | | 2 |
| | Path Back to Surplus | | 15 |
| | |
| 2 | | Economic Performance and Outlook | | 16 |
| | |
| | External Environment | | 17 |
| | The Queensland Economy | | 22 |
| | |
| 3 | | Budget Performance and Outlook | | 40 |
| | |
| | Summary of Key Financial Aggregates | | 41 |
| | Budget Outcomes 2008-09 | | 42 |
| | Budget 2009-10 and Outyear Projections | | 45 |
| | Reconciliation of Net Operating Balance | | 48 |
| | |
| 4 | | Economic Strategy | | 49 |
| | |
| | Framework for Sustaining Jobs and Positioning for Economic Recovery | | 49 |
| | Delivering Jobs for Queensland | | 50 |
| | Investing in Infrastructure | | 52 |
| | Investing in Skills and Innovation for the Future | | 54 |
| | Responding to Climate Change | | 57 |
| | The Smart Regulation Reform Agenda | | 61 |
| | |
| 5 | | Public Non-financial Corporations Sector | | 63 |
| | |
| | Net Flows to Government | | 65 |
| | Asset Sales Program | | 67 |
| | Capital Structure Review | | 69 |
| | Implementation of GOC Reforms | | 70 |
| | Transport Sector | | 72 |
| | Energy Sector | | 79 |
| | Water Sector | | 82 |
| | Forestry | | 84 |
| | | | |
| 6 | | Revenue | | 85 |
| | |
| | Introduction | | 86 |
| | Reductions in Revenue Since the 2008-09 Budget | | 88 |
| | Revenue by Operating Statement Category | | 92 |
| | Taxation Revenue | | 94 |
| | Queensland’s Competitive Tax Status | | 102 |
| | Grants Revenue | | 105 |
| | Sales of Goods and Services | | 107 |
| | Interest Income | | 109 |
| | Dividend and Income Tax Equivalent Income | | 110 |
| | Other Revenue | | 111 |
| | |
| 7 | | Expenses | | 113 |
| | |
| | Introduction | | 113 |
| | Expenses by Operating Statement Category | | 115 |
| | Details of Expenses | | 117 |
| | Operating Expenses by Purpose | | 120 |
| | Departmental Expenses | | 124 |
| | |
| 8 | | Balance Sheet and Cash Flows | | 127 |
| | |
| | Introduction | | 127 |
| | Balance Sheet | | 128 |
| | Cash Flows | | 134 |
| | Reconciliation of Operating Cash Flows to the Operating Statement | | 142 |
| | |
| 9 | | Intergovernmental Financial Relations | | 143 |
| | |
| | Federal Financial Arrangements | | 144 |
| | COAG Reform of Australian Government Payments | | 149 |
| | Nation Building and Jobs Plan | | 153 |
| | Payments for Specific Purposes by Function | | 153 |
| | GST Revenue Payments | | 156 |
| | Other Commonwealth Payments | | 162 |
| | Review of Australia’s Tax System | | 163 |
| | State-Local Government Financial Relations | | 164 |
| | | | |
| 10 | | Uniform Presentation Framework | | 167 |
| | |
| | Introduction | | 167 |
| | General Government Sector | | 167 |
| | Public Non-financial Corporations Sector | | 168 |
| | Uniform Presentation Framework Financial Information | | 171 |
| | Reconciliation of Net Operating Balance to Accounting Operating Result | | 181 |
| | General Government Time Series | | 182 |
| | Other General Government UPF Data | | 183 |
| | Contingent Liabilities | | 189 |
| | Background and Interpretation of Uniform Presentation Framework | | 190 |
| | Sector Classification | | 195 |
| | Reporting Entities | | 196 |
| |
Appendix A – Tax Expenditure Statement | | 199 |
| |
Appendix B – Concessions Statement | | 206 |
| 1 | OVERVIEW – MEDIUM TERM FISCAL STRATEGY |
Framing a budget in an environment of falling revenues and continuing uncertainty is challenging. Queensland, like other economies around the world and in Australia, has been significantly impacted by the global economic downturn. Since the 2008-09 Budget, this downturn has stripped $15 billion off the forward estimates of the State’s key revenue streams of royalties, taxes and GST. Understandably this has had a significantly negative impact on Queensland’s operating position, with the State
forecasting deficits across each of the Budget and forward estimate years.
While current economic conditions prevail, the Queensland Government’s objective is to continue to invest in infrastructure to sustain jobs. The 2009-10 Budget does this with a projected 2009-10 capital program of $18.2 billion which is forecast to support 127,000 full-time jobs.
However, the Government also recognises the need to ensure the health of the Queensland economy in the medium and longer term and is cognisant of the part played by sound financial management and fiscal sustainability in supporting this growth. As a result, the Government has implemented a number of measures that are aimed at improving Queensland’s fiscal position. Key initiatives in this Budget include:
| • | | revised fiscal principles including a commitment to return to surplus |
| • | | abolition of the Queensland Fuel Subsidy Scheme |
| • | | further public sector efficiency measures which leverage off savings from the recent machinery of government changes |
| • | | reform to local government grants and subsidy programs |
| • | | revision to the Government’s wages policy |
| • | | changes to procurement policy |
| • | | a comprehensive program of asset sales. |
These are in addition to the following measures, announced since the 2008-09 Budget:
| • | | Government-owned corporation reform |
| • | | closure of the defined benefits scheme |
| • | | taxation measures announced in December 2008. |
The total value of these initiatives, excluding asset sales, is around $5.4 billion over four years.
| | | | |
| | | Budget Strategy and Outlook 2009-10 | | 1 |
FISCAL STRATEGY
Revised fiscal principles
The unprecedented economic and financial conditions arising from the global financial crisis have had significant adverse effects on the State’s financial position. In this environment, the Government has adopted a new fiscal strategy, setting out how it will restore Queensland’s traditionally strong financial position, while maintaining services and continuing to deliver its commitments to the community.
To ensure the fiscal strategy is transparent and credible, the Government introduced the Financial Accountability Act 2009 which, among other things, requires the Treasurer to prepare and table in the Legislative Assembly a Charter of Fiscal Responsibility giving
details of the Government’s fiscal objectives and the fiscal principles that support those objectives.
The Treasurer must report regularly to the Legislative Assembly on progress the Government has made against the outcomes stated in the Charter. This report will be tabled and published each year in the Budget papers, Mid Year Fiscal and Economic Review and Report on State Finances.
The fiscal principles of the Queensland Government are broadly based around three themes: fiscal sustainability; a competitive tax regime; and managing the State’s balance sheet.
Since the 2008-09 Budget, the Queensland Government has taken a number of measures, totalling some $5.4 billion over four years, to improve the State’s financial position, including measures to reduce:
| • | | the operating deficit, such as abolition of the fuel subsidy scheme, improving the efficiency of public sector service delivery and increasing revenue; and |
| • | | the level of debt, such as asset sales. |
In addition to these measures, the wages policy for public sector employees will restrict expenditure growth, particularly in the years beyond the forward estimates.
| | | | |
2 | | Budget Strategy and Outlook 2009-10 | | |
Fiscal sustainability
Governments must balance the cost of their activities with the revenues raised by taxation, royalties and income from business activities. It is not sustainable for governments to borrow to fund recurrent expenses, as the resultant interest costs and repayment of debt will be borne by future taxpayers, at the expense of other government services or through higher taxes.
On the other hand, capital investment benefits users and society more generally over the life of the asset. It is therefore appropriate to borrow to fund capital investment, so that the costs of the investment are paid over the same time frame as the benefits that are
realised.
|
Principle In the General Government sector, meet all operating expenses from operating revenue (where operating revenue is defined as total revenue from transactions and operating expenses are defined as total expenses from transactions less depreciation). |
In this financial environment, fiscal discipline is important. Until it achieves an operating surplus, growth in state own purpose expenses (that is, excluding Commonwealth related expenses) will be limited to inflation and population growth. This is projected to be 4.75% in 2009-10.
|
Principle Growth in own-purpose expenses in the General Government sector to not exceed real per capita growth. |
The approach to expenses growth, together with the impact of the large asset sale program not yet factored into the forward estimates, is aimed at achieving a net operating surplus in the General Government sector by 2015-16 and, depending on the strength of the recovery, possibly sooner.
Further details on expenses projections are contained in Chapter 7.
|
Principle Achieve a General Government net operating surplus as soon as possible, but no later than 2015-16. |
| | | | |
| | | Budget Strategy and Outlook 2009-10 | | 3 |
Competitive tax regime
One of the Queensland Government’s key fiscal objectives is to maintain a competitive tax environment. While the Government will raise sufficient revenue to meet the service and infrastructure needs of the people of Queensland, it is important that business has a
low cost environment, to promote economic development and jobs growth.
|
Principle Maintain a competitive tax environment for business. |
The competitiveness of a State’s tax system is usually assessed by using one of the following measures:
| • | | taxation revenue on a per capita basis |
| • | | taxation effort as assessed by the Commonwealth Grants Commission |
| • | | taxation revenue expressed as a percentage of gross state product (GSP). |
Queensland’s competitive tax position is confirmed on all three measures:
| • | | per capita tax collections in Queensland in 2009-10 are estimated at $2,087, compared with an estimated $2,487 for the average of the other states |
| • | | Commonwealth Grants Commission data indicate that Queensland’s taxation effort ratio was 85.6% of the standard for all states in 2007-08 |
| • | | Queensland’s tax collections were 4.46% of GSP in 2007-08, compared to 4.75% for the average of the other states. |
The 2009-10 Budget and the Mid Year Fiscal and Economic Review include changes to transfer duty, payroll tax, land tax, casino taxes and motor vehicle registration fees. Details of these changes and other revenue items are provided in Chapter 6.
| | | | |
4 | | Budget Strategy and Outlook 2009-10 | | |
Managing the State’s balance sheet
The provision of adequate levels of infrastructure is an ongoing challenge for a state such as Queensland that continues to experience higher levels of economic and population growth than the national average. In meeting this challenge, the Government funds capital expenditure well above the average of the other states and territories, in per capita terms.
As discussed above, Queensland funds its capital program primarily through borrowing, recognising the interest, operating and depreciation costs on the operating statement. It will also be necessary to borrow to fund operating deficits. While the balance sheet of
the Queensland Government remains strong, the increased borrowing, coupled with a significant fall in revenue arising as a result of the global financial crisis has led to an increase in the ratio of net financial liabilities1 to revenue, which is a measure used by financial markets to assess financial sustainability.
This ratio is expected to be 117% at the end of the 2009-10 financial year and to stabilise at below 130% after completion of the asset sales program.
|
Principle Stabilise net financial liabilities as a proportion of revenue in the Non-financial Public sector. |
Queensland has a long history of setting aside funds to accumulate financial assets sufficient to meet future liabilities, the largest being for future employee entitlements, in particular superannuation. Queensland is therefore far better placed than other state governments to meet future accruing liabilities, as most other jurisdictions have substantial unfunded superannuation liabilities.
The State’s policy of setting aside funds to meet future liabilities and reinvesting all earnings provides the capacity to manage cycles in investment markets without affecting the Government’s ability to fund services to the community.
|
Principle Target full funding of long-term liabilities such as superannuation in accordance with actuarial advice. |
Further information on balance sheet aggregates can be found in Chapter 8.
| 1 | Net financial liabilities in this context is the term used by Standard & Poor’s ratings agency and differs from that used in the Uniform Presentation Framework tables in Chapter 10. |
| | | | |
| | | Budget Strategy and Outlook 2009-10 | | 5 |
Table 1.1
The fiscal principles of the Queensland Government
| | | | | | | | | |
Principle | | Indicator | |
Fiscal sustainability | | | | | | | | | |
| | | | | Operating
Revenue1
($ million) | | | Operating expenses
less depreciation
($ million) | |
In the General Government sector, meet all operating expenses from operating revenue (where operating revenue is defined as total revenue from transactions and operating expenses are defined as total expenses from transactions less depreciation) | | 2009 10 | | 37,192 | | | | 36,373 | |
| | 2010 11 | | 37,029 | | | | 37,444 | |
| | 2011 12 | | 38,100 | | | | 38,930 | |
| | 2012 13 | | 40,431 | | | | 40,327 | |
| | | |
| | | Growth in: | | Own purpose
expense2 | | | Inflation plus
population | |
| | | | |
| | | | |
| Growth in own purpose expenses in the General Government sector to not exceed real per capita growth | | 2009 10 | | 5.04 | % | | | 4.75 | % |
| | 2010 11 | | 4.63 | % | | | 4.50 | % |
| | 2011 12 | | 3.85 | % | | | 4.50 | % |
| | 2012 13 | | 3.67 | % | | | 4.75 | % |
| | Avg over FEs | | 4.30 | % | | | 4.63 | % |
| |
| | | Net operating balance ($ million) | |
| Achieve a General Government net operating surplus as soon as possible, but no later than 2015 16 | | 2009 10 | | | | | | (1,954 | ) |
| | 2010 11 | | | | | | (3,459 | ) |
| | 2011 12 | | | | | | (4,090 | ) |
| | 2012 13 | | | | | | (3,290 | ) |
| | | |
Competitive tax regime | | | | | | | | | |
| |
| | | Taxation revenue per capita, 2009 10 | |
| Maintain a competitive tax environment for business | | Queensland: | | | $ | 2,087 | |
| | Average of other states and territories: | | | $ | 2,487 | |
| | | |
Managing the State’s balance sheet | | | | | | | | | |
| |
| | | Net Financial Liabilities/Revenue
Non financial Public Sector | |
| | | | | Before asset sales | | | After asset sales | |
| Stabilise net financial liabilities as a proportion of revenue in the Non Financial Public Sector | | 2009 10 | | 117 | % | | | 116 | % |
| | 2010 11 | | 141 | % | | | 128 | % |
| | 2011 12 | | 154 | % | | | 125 | % |
| | 2012 13 | | 156 | % | | | 130 | % |
| Target full funding of long term liabilities such as superannuation in accordance with actuarial advice | | As at last actuarial review (released June 2008), accruing superannuation liabilities were fully funded. The State Actuary reviews the scheme every 3 years. | |
Notes:
| 1. | The reduction in revenue in 2010-11 reflects additional Australian Government funding in 2009-10 associated with initiatives such as the Nation Building and Jobs Plan. |
| 2. | Superannuation interest costs have been normalised to reflect the assumed long run rate of return. |
| | | | |
6 | | Budget Strategy and Outlook 2009-10 | | |
Abolition of the Queensland Fuel Subsidy Scheme
The Government has decided to cease the Queensland Fuel Subsidy Scheme from 1 July 2009, saving around $2.4 billion over the next four years.
There are several compelling reasons to now abolish the fuel subsidy.
| • | | The State’s fiscal position makes the retention of the fuel subsidy scheme unsustainable. The Government would be required to borrow to continue to fund the fuel subsidy. To borrow for this purpose would run counter to the principle of intergenerational equity, as future generations would be required to fund the services consumed today. |
| • | | The Queensland Fuel Subsidy Scheme does not represent value for money to Queensland taxpayers. The scheme currently benefits interstate consumers and businesses purchasing retail fuel in Queensland or establishing a bulk end user fuel storage site in the State. The Pincus Inquiry into the effectiveness of the scheme, found that much of the diesel sold for commercial purposes is consumed outside the State. It also found that there was no practical way of preventing interstate businesses from benefiting from the fuel subsidy other than by abolishing it. |
| • | | The Pincus Inquiry recommended that the scheme be abolished if Government could not find a way to ensure the subsidy was being passed on. Evidence given to the Inquiry and an opinion from the Solicitor-General concluded that there is no perfect system to ensure that the subsidy is fully passed on. None of the submissions to the Inquiry or during public consultation identified workable options for improvement. |
Further details on the cessation of the Queensland Fuel Subsidy Scheme can be found in Budget Paper 4 - Measures.
| | | | |
| | | Budget Strategy and Outlook 2009-10 | | 7 |
Further public sector efficiency measures
In the 2008-09 Budget, the Queensland Government announced a public sector efficiency target of $60 million in 2008-09, growing to $80 million from 2009-10. Given the savings to be derived from the recently announced machinery of government reforms as well as the savings being realised through efficiency and productivity improvements in the areas of corporate overheads, travel, publication, marketing and communication costs, these targets have been increased to a total of $280 million per year from 2009-10. These savings targets will not impact on front line service delivery.
Reform to local government grants and subsidy programs
In 2006-07, the Government announced a program of $700 million over five years for a suite of grants and subsidy programs to support local government to deliver the infrastructure for which they are responsible. To date, projects with a total subsidy value of $880.5 million have been approved for construction. Of this total, $388.5 million has already been paid to local governments.
Given the potential for efficiencies and savings being delivered through the Local Government Reform Program and the significant increase in grant and subsidy funding, the Government reviewed ongoing arrangements for funding of local government infrastructure.
As a result, the Government has decided to overhaul the current suite of local government grant and subsidy programs. The current programs will cease on 16 June 2009. Existing approved commitments will be met, subject to claims being lodged a maximum of three years from the date the application was approved.
Subsidy payments to local governments for street lighting will also cease. These funds are being redirected towards the increased funds allocated to the Pensioner Electricity Rebate Scheme.
A new $45 million per annum local government infrastructure program will be introduced which will be more targeted. Through introducing revised funding criteria, the Government will ensure that subsidies are delivered to those councils and communities that have infrastructure projects that are ready to be delivered and do not have the financial capability to deliver the projects without assistance.
The $2 million annual show subsidy scheme administered by the Department of Infrastructure and Planning will continue.
| | | | |
8 | | Budget Strategy and Outlook 2009-10 | | |
Taxation measures
As a result of tight fiscal conditions brought about by the downturn in the global economy, the Queensland Government has decided to implement a number of taxation measures to enable it to continue to fund services to the community and maintain the capital program.
Motor vehicle registration
The Government will increase motor vehicle registration fees commencing 1 July 2009. These increases were detailed in the Mid Year Fiscal and Economic Review which, in addition, stated motor vehicle registration costs from 1 July 2009 will incorporate adjustments for the Consumer Price Index and changes to Compulsory Third Party premiums.
Further detail on this initiative can be found in Budget Paper 4 – Measures and the Mid Year Fiscal and Economic Review.
Delay in abolition of transfer duty on core business assets
The Intergovernmental Agreement for the Reform of Commonwealth-State Financial Relations (IGA), agreed by the Australian Government and all state and territory governments in 1999, required the abolition and review of a number of state taxes.
Following the review of duties listed in the IGA, a timetable for the abolition of the majority of these duties was announced in the 2005-06 Budget.
To date, the Government has completed all of the duty abolitions listed in this timetable in accordance with the timeframes agreed under the scheduled.
It was intended to halve duty on the transfer of core business assets from 1 July 2010, with full abolition from 1 January 2011. The 2008-09 Mid Year Fiscal and Economic Review extended this timeframe to 1 July 2012.
In light of the tight fiscal conditions, the abolition of this duty will now occur by 1 July 2013, in accordance with the timeframe included in the new Intergovernmental Agreement on Federal Financial Relations.
| | | | |
| | | Budget Strategy and Outlook 2009-10 | | 9 |
Casino gaming machines
In order to reduce the disparity that exists between the tax rates applicable to gaming machines in casinos and those applicable to large clubs and hotels, the tax rate on gaming machine win on casino gaming machines will increase by 10% from 1 July 2009, to 20% at the Breakwater Island (Jupiters Townsville) and Reef (Cairns) casinos and from 20% to 30% at the Conrad Jupiters (Gold Coast) and Conrad International Treasury (Brisbane) casinos. At the same time, the concessional tax rate applicable to premium play at the Breakwater Island and Reef casinos will be removed. This initiative was announced in the Mid Year Fiscal and Economic Review.
Land tax
As announced in the Mid Year Fiscal and Economic Review, from 1 July 2009, a 0.5% surcharge will apply where the aggregate value of all land (for land tax purposes) exceeds $5 million. The surcharge will apply only to the portion of the value exceeding $5 million. The surcharge is estimated to apply to around 2,000 of Queensland’s 53,000 land tax payers (around 3.7%).
Further details on this initiative can be found in Budget Paper 4 – Measures and the Mid Year Fiscal and Economic Review.
Wages policy
The Government is committed to maintaining wage increases as prescribed in the Memorandum of Understanding (MOU) with unions for all agreements covered by the MOU.
All other agreements that have expired or are due to expire by 31 December 2009, will have until 1 September 2009 to reach an agreement. Where an agreement is not reached by this date, and for agreements expiring after 31 December 2009, a new Government wages policy will apply which limits wage increases to 2.5% per annum until the Budget returns to surplus. The new policy will apply to Chief Executives, Senior Executives and Senior Officers and their equivalents from 1 July 2009.
Changes to procurement policy
The Government considers a range of procurement options for delivery of major capital projects, including construct-only; design and construct; design, construct and maintain; alliance contracting; managing contractor model; public-private partnerships; and hybrid delivery models. To achieve optimal project outcomes, the procurement approach must be appropriate for the risks and issues each project is likely to face in practice.
| | | | |
10 | | Budget Strategy and Outlook 2009-10 | | |
In recent years, alliance contracting, where Government and its alliance partners share the risks and responsibilities in delivery the construction phase of a project, has featured significantly in certain areas of infrastructure delivery. While the Government will continue to consider alliance contracting where appropriate, in selecting procurement approaches for each major project, the Government will be particularly focused on driving competitive, value for money project delivery outcomes which reflect current
market conditions.
Government-owned corporation reform
As outlined in the Mid Year Fiscal and Economic Review, the Government has been working with its Government-owned corporations (GOCs) to improve their efficiency, effectiveness and accountability. The aim has been to provide GOCs with appropriate organisational structures and incentive frameworks to allow them to operate to their full commercial potential.
More information on this initiative can be found in the Mid Year Fiscal and Economic Review and in Chapter 5.
Closure of the defined benefit scheme
Earlier this financial year the Government announced the closure of QSuper’s defined benefit account to new members, effective from the date of announcement.
Before the closure of the scheme, Queensland was the only Government in Australia that still had a broad based, open defined benefit scheme. Other states and the Commonwealth all stopped offering defined benefit schemes over the past 15 years.
This action was taken to protect the current entitlements of existing defined benefit members and to ensure that the scheme’s liabilities are not exposed to risks that flow from the decline in global equity markets.
| | | | |
| | | Budget Strategy and Outlook 2009-10 | | 11 |
Asset sales
In order to protect the State’s capital program while maintaining a prudent fiscal approach, the Government announced, on 2 June 2009, a significant infrastructure assets reform and sale program.
This program will involve:
| • | | the sale of Forestry Plantations Queensland’s softwood business and possibly its hardwood plantations |
| • | | the sale of Queensland Motorways Limited’s (QML) business, incorporating a major upgrade of the Port of Brisbane Motorway |
| • | | the sale of the Port of Brisbane Corporation Limited’s (PBC) business and assets |
| • | | the sale of QR Limited’s (QR) above and below rail coal businesses and assets, along with Ports Corporation of Queensland Limited’s Abbot Point Coal Terminal |
| • | | the intention to instigate negotiations with the Australian Government over the potential sale of other parts of QR’s below rail network to the Australian Government-owned Australian Rail Track Corporation |
| • | | investigating options for the most appropriate way to offer the sale of Queensland Rail’s bulk freight, intermodal, retail and regional freight services to the market. |
In recognition of the complexity of the process and the need to undertake detailed planning in relation to appropriate sale structures, the Government envisages that the sales will be progressed in the market over the next three to five years. The sale program will deliver an estimated $15 billion in sale proceeds, and result in approximately $12 billion in required capital investment over the next five years being avoided. The staging of the asset sales will be influenced by the timing of the recovery in financial markets. The impact of the asset sales has not been factored into the Budget estimates.
Economic impact
The Government recognises the need to ensure that the Queensland economy emerges from the current economic conditions in a strong position to drive the future growth and job creation opportunities for both the State and national economies.
In this regard, the asset sales program has a strong export focus. The sale of QR’s coal businesses provides an opportunity to further integrate coal export chains. The inclusion of Abbot Point Coal Terminal in the sales package is expected to further facilitate the integration of rail-to-port networks, and ensure that the objectives of port and rail infrastructure providers are more closely aligned.
| | | | |
12 | | Budget Strategy and Outlook 2009-10 | | |
Similar opportunities exist in relation to export infrastructure in South East Queensland. The sale of PBC, in conjunction with QML, the operator of key road infrastructure servicing the Port of Brisbane and the southern Queensland road network more generally, is expected to facilitate the development of both the Port of Brisbane and surrounding infrastructure.
In combination, the asset sales package is designed to encourage the private sector to play a more active role in providing and funding the key economic infrastructure which is essential in promoting economic growth.
Financial considerations
The 2009-10 Budget focuses on supporting the continued delivery of key public infrastructure such as schools, hospitals and public transport, and the delivery of public services through these facilities.
The Government expects to forgo dividends and tax equivalent payments as a result of the asset sales. However, interest savings on sale proceeds and the additional capital expenditure of $12 billion avoided as a result of the sales will benefit the Budget.
The following chart shows, on balance, the overall favourable impact the expected sale proceeds will have on one of the key credit rating ratios (net financial liabilities to revenue), after accounting for forgone revenue. Chart 1.1 indicates that the ratio stabilises at below 130% following these asset sales.
| | | | |
| | | Budget Strategy and Outlook 2009-10 | | 13 |
Chart 1.1
Net financial liabilities to revenue ratio, before and after asset sales
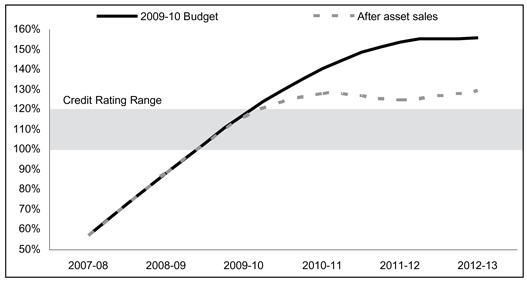
Notes:
| 1. | The figures in this chart assume the sales are completed by 2012-13. |
| 2. | Based on a broad range for AAA rated states. |
The program of asset sales will play an important role in funding the Government’s infrastructure program, reducing State debt and encouraging private sector provision of infrastructure. The sales are designed to realise value, reduce risk and obviate the need to further fund the significant ongoing capital requirements of these businesses, where the private sector can fund those requirements.
This will go a long way toward reducing the current level of indebtedness of the State and demonstrate to ratings agencies and financial markets the Government’s willingness to reduce debt and return the State to a solid fiscal position. Post the current forward estimates, when the worst of the global economic crisis has passed, the Queensland Government will reduce the capital program to levels under $10 billion per year and look at further policy measures to improve revenue and reduce expenditure to assist in bringing the net financial liabilities to revenue ratio back within a range comparable to other larger states.
Further detail about the restructuring and disposal processes is provided in Chapter 5.
| | | | |
14 | | Budget Strategy and Outlook 2009-10 | | |
PATH BACK TO SURPLUS
Returning the Budget to surplus is a key element of the Government’s revised fiscal principles. A return to surplus depends on economic and population growth in the State as well as on the policy decisions of Government.
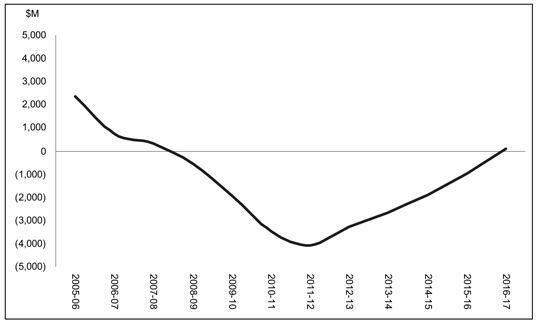
The revised fiscal principle relating to the General Government net operating balance requires the Government to achieve a General Government net operating surplus as soon as possible, but no later than 2015-16. While Chart 1.2 below notionally indicates a deficit position for Queensland until 2016-17 (a year after the Australian Government has forecast to return to surplus), it is expected that the significant program of asset sales, which are not factored into the forward estimates, will make a positive contribution to the General Government sector and will assist in meeting this fiscal principle.
There also remains a high degree of uncertainty about the pace and path of recovery. Queensland’s assumptions are for continuing deterioration in the fiscal position for a number of years before recovery in the final years of the forward estimates. While it is possible that the economy and hence fiscal position will deteriorate more dramatically than indicated in the chart below, Queensland’s revenue estimates are more conservative than those used by other Australian states. This provides Queensland with more upside should the turnaround occur earlier or more favourably than anticipated.
Chart 1.2
General Government Sector Net Operating Balance, 2005-06 to 2016-17
| | | | |
| | | Budget Strategy and Outlook 2009-10 | | 15 |
| 2 | ECONOMIC PERFORMANCE AND OUTLOOK |
FEATURES
| • | | The global economy is experiencing its most severe financial crisis since the 1930s, with global GDP now widely expected to contract in 2009 for the first time in 60 years. Economic activity in Queensland’s major trading partners is expected to decline by 3% this calendar year. |
| • | | As a result, economic growth in Queensland is estimated to slow to 1/2% in 2008-09, with the economy forecast to contract marginally, by 1/4%, in 2009-10. In addition to a decline in exports, growth in consumption is forecast to ease due to lower household wealth. High interest rates for much of 2008, as well as weak investor confidence, are also forecast to lower dwelling investment. |
| • | | The slight fall in economic activity in 2009-10 reflects a peaking in the private investment cycle. After tripling over the past eight years, business investment is forecast to fall 17% in 2009-10, largely due to a scaling back in commercial and mining construction. Partly offsetting this, public infrastructure spending is forecast to rise sharply, reflecting State and Federal Government initiatives. Growth is forecast to return in 2010-11, albeit to a modest 2 3/4%. This would represent the third successive year of below-trend growth, as a slow global recovery initially tempers an upturn in exports. Growth in consumer spending is forecast to improve, as balance sheets are strengthened, while solid population growth should eventually drive a sharp rise in housing investment. |
| • | | Benefiting from significant investment in capacity in previous years, economic growth is projected to accelerate to 4 1/2% in 2011-12 and reach its decade average of 4 3/4% in 2012-13, as the global economic recovery gathers pace. |
| • | | In line with subdued economic activity, employment is forecast to fall 3/4% in 2009-10 and recover by 1 1/4% in 2010-11. With labour force growth forecast to continue to exceed jobs growth, the year-average unemployment rate is forecast to rise to 6 1/2% in 2009-10 and peak at 7 1/4% in 2010-11. |
This chapter presents the economic context within which the 2009-10 State Budget has been prepared. It overviews developments in Queensland’s external environment in light of the financial crisis, including the contraction now expected in major trading partner economies and the national outlook. The chapter summarises the economic performance of, and outlook for, Queensland over 2008-09 to 2012-13, and provides detailed estimates for 2008-09 and forecasts for sectors of the economy in 2009-10. In line with the Australian Government, the chapter for the first time provides forecasts for an additional year, detailing the drivers of the economic recovery in 2010-11. The chapter also outlines key risks to economic growth over the forecast period.
| | | | |
16 | | Budget Strategy and Outlook 2009-10 | | |
EXTERNAL ENVIRONMENT
International conditions
The global economy is experiencing its most severe financial crisis since the 1930s. This has undermined activity throughout developed and developing economies with such severity and synchronicity that global gross domestic product (GDP) in 2009 is now widely expected to contract for the first time in 60 years. A negative feedback loop between credit markets and global economic activity is also evolving, raising considerable uncertainty regarding the depth of the recession, as well as the timing of an eventual recovery.
The global financial crisis intensified from mid-September 2008, when investment bank Lehman Brothers filed for bankruptcy. This led to a rapid escalation in perceived counterparty risk and thus a reluctance by the financial sector to lend funds. As a result, interbank interest rate spreads widened from already-elevated levels (see Chart 2.1). These developments also prompted an acute deterioration in consumer and business sentiment, as well as significant falls in equity and commodity prices.
Financial market conditions, equity values and commodity prices have all recovered somewhat since late 2008, aided by various policy responses from governments and central banks. However, ongoing concerns about further write downs across the banking sector and a deteriorating economic outlook continue to impair credit markets and overall sentiment. In its April 2009 Global Financial Stability Report, the International Monetary Fund (IMF) estimated total write downs to reach US$4.1 trillion, of which approximately US$1.9 trillion were yet to be realised by banks, while in its latest World Economic Outlook, the IMF forecast the global economy to contract 1.3% in 2009.
| | | | |
| | | Budget Strategy and Outlook 2009-10 | | 17 |
Chart 2.1
Interbank interest rate spreads¹
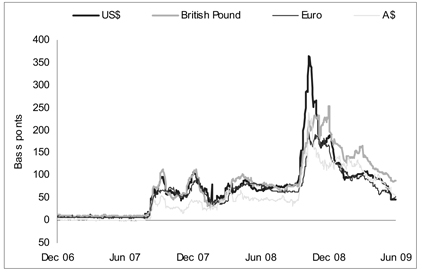
Note:
| 1. | Three month London Interbank Offered Rate less three month Overnight Indexed Swap rate. |
Sources: Reuters, Bloomberg and Queensland Treasury.
A subdued outlook, combined with funding constraints, has led businesses globally to cut investment, run down inventories and scale down operations. This has been most pronounced in advanced economies in Europe and Asia. Industrial production over the year to April 2009 fell by more than 30% in Japan, around 20% in Taiwan, Germany and Spain and around 10% in the US and Korea, while over the year to March 2009, industrial production fell more than 20% in Italy and more than 10% in the UK.
Lower industrial activity in advanced economies has also affected large commodity exporters, with reduced demand suppressing both export volumes and prices. The resulting sharp contraction in international trade is widely expected to persist this year, with the IMF forecasting export volumes from developed and developing economies to fall 13.5% and 6.4% respectively in 2009.
Household wealth has fallen in many economies due to lower equity and house prices, while a deteriorating labour market has reduced job security, undermining sentiment and spending. As at early June 2009, stock markets in the US and UK remained 40% and 35% below their 2007 highs respectively, while house prices in these countries have fallen 31% and 18% from their peak. The US unemployment rate has risen from 4.4% in early 2007 to 9.4% in May 2009, while the IMF forecasts the average unemployment rate of advanced economies to rise 2.3 percentage points to 8.1% in 2009, and to 9.2% in 2010.
| | | | |
18 | | Budget Strategy and Outlook 2009-10 | | |
Queensland’s major trading partners’ GDP is forecast to contract by 3% in 2009, larger than the fall in world GDP expected by the IMF (see Table 2.1). This is partly due to the recession in Japan, which accounts for a larger share of the State’s exports relative to its weight in global GDP. Reflecting a reliance on export-led growth, Japan’s economy contracted by a record 3.8% in March quarter 2009, or by 8.4% over the year, while the Korean economy has shrunk by 5.0% since September quarter 2008. The US economy contracted by 3.1% over the two quarters to March quarter 2009, its largest six-month fall since 1958, while Eurozone GDP declined by a record 2.5% last quarter.
Table 2.1
Queensland major trading partner GDP outlook
(annual % change)
| | | | | | | | | | | | |
| | | Actual
2008 | | Forecasts |
| | | | 2009 | | 2010 | | 2011 | | 2012 | | 2013 |
World¹ | | 3.2 | | 1.3 | | 1.9 | | 4.3 | | 4.8 | | 4.9 |
Major trading partners² | | 2 | | 3 | | 1 1/2 | | 3 3/4 | | 4 1/2 | | 4 1/2 |
Non Japan Asia³ | | 4 1/4 | | 3/4 | | 3 | | 5 3/4 | | 6 1/4 | | 6 1/4 |
Japan | | 3/4 | | 6 1/4 | | 1/2 | | 2 1/4 | | 3 1/4 | | 2 3/4 |
Europe4 | | 1 | | 4 1/4 | | 1/2 | | 1 1/2 | | 2 1/4 | | 2 1/4 |
US | | 1 | | 2 3/4 | | 0 | | 3 1/2 | | 3 3/4 | | 3 1/4 |
Notes:
| 1. | Sourced from the April 2009 IMF World Economic Outlook database. World GDP comprises 173 countries, weighted by purchasing power parity (PPP) GDP. |
| 2. | Queensland’s major trading partner output comprises 31 countries, weighted by their share of merchandise exports in the three years to 2007 08. Forecasts are sourced from IMF. |
| 4. | Includes United Kingdom. |
Sources: International Monetary Fund and Queensland Treasury.
A distinguishing characteristic of the current global recession compared with previous downturns has been the scale of wealth destruction caused by the financial crisis. This has seen a broad-based shift in consumer and business priorities toward repairing balance sheets. This de-leveraging process remains incomplete and is likely to prolong the current downturn, despite numerous monetary and fiscal policy efforts to stimulate activity and relieve credit market stresses.
| | | | |
| | | Budget Strategy and Outlook 2009-10 | | 19 |
Given a prerequisite for a sustainable economic recovery is the restoration of stability in the global financial system, substantial efforts have been made to increase liquidity, reduce borrowing costs and recapitalise the banking sector. Easing global inflation, as a result of lower commodity prices and excess capacity, has enabled central banks to loosen monetary policy considerably. Official interest rates are now at or near record lows in the US, Japan, UK and Eurozone. More unconventional efforts to promote financial stability have been adopted, including quantitative or credit easing by the US and UK central banks, as well as the US Treasury’s Troubled Asset Relief Program. Moreover, numerous governments have provided guarantees on private sector borrowing and purchased ‘toxic’ assets from the banking sector. Such efforts should help normalise financial markets, restore sentiment and stabilise economic activity by late 2009. As a result, global economic growth is forecast to re-emerge in the first half of 2010.
However, growth is forecast to be relatively more subdued compared with previous recoveries. Recoveries from recessions caused by financial crises tend to be weaker, given the protracted nature of the private sector de-leveraging process. The highly synchronised nature of the current global recession also reduces prospects for an export-led recovery. The cost of credit is likely to remain higher, and availability more restricted, than in the years preceding the crisis, reflecting a more rational pricing of risk. Further, current private sector de-leveraging will eventually transfer to the public sector. With governments globally becoming more indebted from necessary fiscal expansion and a deteriorating revenue base, public sector spending is unlikely to contribute as significantly to economic growth after the recession ends. Consequently, Queensland’s major trading partner economies are expected to expand at a below trend rate of 1 1/2% in 2010, with the peak in their combined economic output achieved in June quarter 2008 not expected to be reached again before the second half of 2011.
Australian economy
Reflecting the impact of the global recession on business confidence and export demand, the Australian Government forecasts GDP to be unchanged in 2008-09 and fall 1/2% in 2009-10. This would result in a recession of similar magnitude to that of the early 1990s (see Chart 2.2). The contraction in GDP in 2009-10 is expected to be driven by a sharp fall in business investment and exports, while a one-third decline in household net financial wealth in 2008 is forecast to drive a 1/4% fall in household consumption.
With the world economy expected to gradually recover during 2010, a turnaround in exports and strong growth in dwelling investment are anticipated to support a return to GDP growth of 2 1/4% in 2010-11. Households are forecast to continue to rebuild their balance sheets, resulting in below average consumption growth, while a modest recovery in business investment is based on an expectation that a number of high value resource projects scheduled to commence in 2010-11 will proceed.
| | | | |
20 | | Budget Strategy and Outlook 2009-10 | | |
Employment is forecast to contract 1 1/2% over the year to June quarter 2010, causing the unemployment rate to rise to 8 1/4% in the quarter. With modest jobs growth in 2010-11 insufficient to absorb growth in the labour supply, the unemployment rate is forecast to peak at 8 1/2% in June quarter 2011, before declining over the following two years.
In an effort to reduce the depth of the recession, the Australian Government has initiated significant fiscal stimulus measures. In particular, public investment is forecast to rise by its sharpest rate on record in 2009-10, partly reflecting the February 2009 Nation Building and Jobs Plan and the December 2008 Nation Building package. The Australian Government has estimated that in the absence of policy actions to stimulate the economy, the level of GDP would be 2 3/4% lower in 2009-10 and 1 1/2% lower in 2010-11, with the unemployment rate peaking at 10%, rather than 8 1/2%.
Looking further ahead, the Australian Government projects GDP to grow at 4 1/2% in each of the two projection years, 2011-12 and 2012-13, above the medium term trend rate of 3%. When combined with the forecast for 2010-11, this represents only a marginally weaker three-year recovery path compared with the early 1990s recession.
Chart 2.2
Gross domestic product1,2 and unemployment rate2,3 Australia
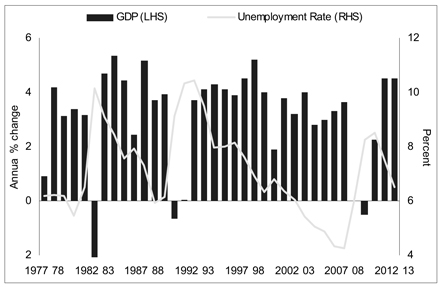
Notes:
| 1. | Chain Volume Measure (CVM), 2006 07 reference year. |
| 2. | 2008 09 is an estimated actual, 2009 10 and 2010 11 are forecasts, 2011 12 and 2012 13 are projections. |
| 3. | Unemployment rate is for the June quarter of each financial year. |
Sources: ABS 5206.0, 6202.0 and Australian Government 2009 10 Budget.
| | | | |
| | | Budget Strategy and Outlook 2009-10 | | 21 |
THE QUEENSLAND ECONOMY
External forecast assumptions
Forecasts for economic growth in Queensland are based on the following assumptions about the national economy, trading partners and financial markets:
| • | | as a whole, the economies of Queensland’s major trading partners are forecast to contract by 3% in 2009, before recovering to mild growth of 1 1/2% in 2010. Assuming some normalisation in financial markets, growth is projected to return to its long-term average of around 3 3/4% in 2011. |
| • | | in line with expectations in the futures market, the Australian official cash rate is assumed to fall slightly in September quarter 2009 from its current level of 3.0%, before gradually rising to 3.5% by the end of 2010-11. |
| • | | the A$ plunged between mid-July and late November 2008, with sudden risk aversion triggering an unwinding of A$/Yen carry trades. With some return of risk appetite, the A$ began to partly recover from early March 2009. Given the milder downturn and less aggressive monetary easing expected in Australia relative to other economies, the A$ is forecast to appreciate mildly over the forecast period. |
| • | | production cuts by OPEC and an assumed depreciation of the US$ are expected to maintain oil prices close to US$65 per barrel by June quarter 2010, before increasing to around US$70 per barrel by June quarter 2011. |
| • | | floods and other adverse weather events in early 2009 have been factored into estimates of agricultural and tourism exports in 2008-09. Seasonal conditions are assumed to return towards normal from 2009-10 onwards. |
| • | | as outlined in the Australian Government Budget delivered on 12 May 2009, the national economic forecasts and projections, as well as stimulus measures, have been adopted as the basis for national economic performance. |
A discussion of the risks and opportunities associated with some of these assumptions is contained later in this chapter.
Summary of economic outlook
Largely reflecting the impact of the financial crisis on household wealth, investment and exports, growth in Queensland’s gross state product (GSP) is estimated to slow sharply in 2008-09, after which the economy is forecast to contract marginally in 2009-10. However, a recovery in housing investment and confidence is forecast to see economic growth recover to 2 3/4% in 2010-11, which would represent the fifteenth successive year that the State economy outperforms the national average. Driven by a rebound in business investment and an acceleration in exports, State economic growth is projected to strengthen to 4 3/4% by 2012-13, as the global recovery gathers pace (see Chart 2.3).
| | | | |
22 | | Budget Strategy and Outlook 2009-10 | | |
Chart 2.3
Growth in Queensland’s gross state product1
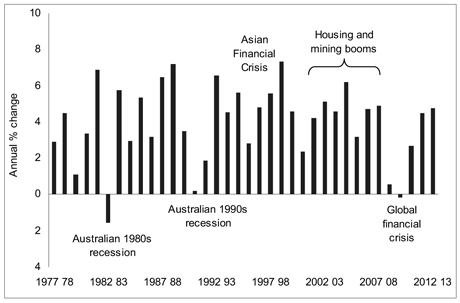
Note:
| 1. | CVM, 2006 07 reference year. 2008 09 is an estimated actual, 2009 10 and 2010 11 are forecasts and 2011 12 and 2012 13 are projections. |
Sources: Queensland Treasury and Queensland State Accounts historical data.
Economic growth is estimated to slow to 1/2% in 2008-09. While interest rate cuts from late 2008 and stimulus payments have boosted disposable incomes, a fall in wealth due to lower equity and domestic house prices has seen household saving rates rise. As a result, growth in private consumption is estimated to ease to 1 1/4% in 2008-09. The lagged effect of high interest rates in much of 2008, combined with weak investor confidence, is also estimated to drive a 7 3/4% fall in dwelling investment.
Economic growth in 2008-09 is also expected to be more modest than forecast in the February 2009 Economic and Fiscal Update (EFU), with exports now expected to fall for the first time since 1989-90. Sharp cuts in global steel and industrial production have lowered mineral exports, while tourism exports have been affected by adverse weather events, swine influenza and recessions in source countries for overseas arrivals. The weakening in the economic outlook and tighter credit conditions have also caused a sharper run-down in stocks than anticipated at EFU, with this inventory adjustment now estimated to detract 1 1/4 percentage points from growth in 2008-09 (see Chart 2.4).
While inventories have been run down, construction activity by businesses and the public sector continued to contribute to economic growth and productive capacity in 2008-09. In particular, a large amount of commercial and resource projects still to be completed is estimated to see business investment rise a further 7% in 2008-09, to exceed $38 billion in real terms, a level three times that recorded in 2000-01.
| | | | |
| | | Budget Strategy and Outlook 2009-10 | | 23 |
Chart 2.4
Contribution to growth in Queensland’s gross state product 1
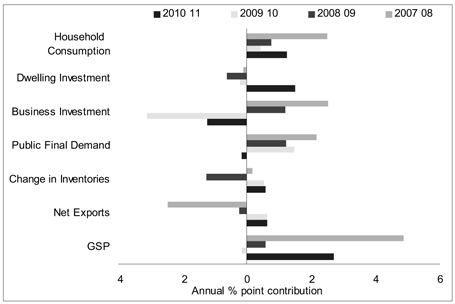
Note:
| 1. | CVM, 2006 07 reference year. 2008 09 is an estimated actual, 2009 10 and 2010 11 are forecasts. |
Source: Queensland Treasury.
However, largely reflecting a peaking in the investment cycle, the Queensland economy is forecast to contract in 2009-10. Business investment is forecast to fall 17%, as rising vacancy rates and limited access to funding weigh on commercial property, and the global recession causes a scaling back in mining construction. While lower interest rates and the First Home Owners Boost should see a recovery in new house construction in 2009-10, tight lending conditions are forecast to weigh on medium-to-high density construction. An ongoing adjustment to lower wealth, along with a decline in employment, is also forecast to further moderate growth in consumption. Exports are anticipated to fall again in 2009-10. A forecast 3% contraction in Queensland’s major trading partner economies in 2009 is forecast to lower mineral and service exports. However, improved rainfall and water storages will boost rural exports in 2009-10.
Offsetting a fall in private investment and exports, public investment in Queensland is forecast to rise sharply in 2009-10. This reflects the State Government’s own significant capital works program, in addition to spending from Australian Government infrastructure initiatives, including the Building Australia package and the Nation Building and Jobs Plan.
| | | | |
24 | | Budget Strategy and Outlook 2009-10 | | |
Economic growth in Queensland is forecast to improve in 2010-11, albeit modestly to 2 3/4%, representing the third successive year of below average growth. With the global recovery from the financial crisis expected to take longer than after previous downturns, this will act to initially temper growth in Queensland’s exports of commodities and services. The improvement in State economic growth in 2010-11 is forecast to be driven primarily by stronger growth in consumption, after household balance sheets are strengthened and confidence recovers, as well as a 20 3/4% rise in dwelling investment, in response to fast population growth and a decline in housing construction in prior years.
Economic growth is projected to accelerate to 4 1/2% in 2011-12 and strengthen further to 4 3/4% in 2012-13, matching its long-run rate over the decade prior to the forecast period (see Table 2.2). Benefiting from significant investment in capacity during the recent resources boom, exports growth is projected to improve considerably, as the recovery in the global economy gathers pace. In line with this, business investment is projected to resume an upward trend, as excess capacity in the economy is absorbed and stronger domestic demand improves investment returns.
With economic output forecast to decline in 2009-10 and stage a mild upturn in 2010-11, employment is forecast to fall 3/4% and recover 1 1/4% in these respective years. As a result, population growth is forecast to exceed jobs growth, causing the year-average unemployment rate to rise to 6 1/2% in 2009-10 and peak at 7 1/4% in 2010-11, the highest year-average rate since 2001-02. However, with jobs growth projected to strengthen to 2 1/2% and 2 3/4% over 2011-12 and 2012-13 and to exceed population growth, the unemployment rate is expected to fall over this period.
| | | | |
| | | Budget Strategy and Outlook 2009-10 | | 25 |
Table 2.2
Economic forecasts/projections1
(annual % change)
| | | | | | | | | | | | |
| | | Outcome | | Est. Act. | | Forecasts | | Projections |
| | | 2007-08 | | 2008-09 | | 2009-10 | | 2010-11 | | 2011-12 | | 2012-13 |
Queensland | | | | | | | | | | | | |
Gross state product2 | | 4.9 | | 1/2 | | - 1/4 | | 2 3/4 | | 4 1/2 | | 4 3/4 |
Employment | | 2.4 | | 2 1/4 | | - 3/4 | | 1 1/4 | | 2 1/2 | | 2 3/4 |
Unemployment rate | | 3.7 | | 4 1/4 | | 6 1/2 | | 7 1/4 | | 6 3/4 | | 6 1/2 |
Inflation | | 4.1 | | 3 3/4 | | 2 1/2 | | 2 1/2 | | 2 1/2 | | 2 3/4 |
Wage Price Index | | 4.2 | | 4 1/4 | | 3 1/2 | | 3 1/4 | | 3 1/2 | | 3 3/4 |
Population | | 2.4 | | 2 1/2 | | 2 1/4 | | 2 | | 2 | | 2 |
| | | | | | |
Australia | | | | | | | | | | | | |
Gross domestic product2 | | 3.6 | | 0 | | - 1/2 | | 2 1/4 | | 4 1/2 | | 4 1/2 |
Employment3 | | 2.4 | | - 1/4 | | -1 1/2 | | 1/2 | | 2 1/2 | | 2 1/2 |
Unemployment rate4 | | 4.2 | | 6 | | 8 1/4 | | 8 1/2 | | 7 1/2 | | 6 1/2 |
Inflation3 | | 4.5 | | 1 3/4 | | 1 3/4 | | 1 1/2 | | 2 | | 2 1/2 |
Wage Price Index3 | | 4.1 | | 4 1/4 | | 3 1/4 | | 3 1/4 | | na | | na |
Population | | 1.7 | | na | | na | | na | | na | | na |
Notes:
| 1. | Decimal point figures indicate an actual outcome. na indicates not available. |
| 2. | CVM, 2006 07 reference year. |
| 3. | Through the year growth to the June quarter. |
| 4. | Estimate for the June quarter. |
Sources: Queensland Treasury and Australian Government 2009 10 Budget.
Sectors of the Queensland economy
Household consumption
Household consumption growth is estimated to ease to 1 1/4% in 2008-09, following long run average growth of 4.6% in 2007-08. Discretionary spending has been restrained by significantly lower household wealth, with equity prices halving between late 2007 and March 2009 and house prices falling since June quarter 2008 (see Chart 2.5). Spending on cars, household furnishings, hospitality, clothing and footwear (totalling one fifth of consumption) fell 5.3% in annual terms in the first three quarters of 2008-09.
The deterioration in both the domestic and international outlook has weighed heavily on consumer confidence in 2008-09. This limited the effect of the substantial boost to household disposable incomes from lower interest rates and the Federal Government’s initial fiscal stimulus, with households more inclined than usual to use additional income to save or reduce debt, rather than for consumption, particularly in late 2008.
| | | | |
26 | | Budget Strategy and Outlook 2009-10 | | |
Consumption growth is forecast to ease further in 2009-10, to 3/4%, its lowest rate in more than two decades. This partly reflects a continued adjustment to lower wealth, as well as the lagged impact of a decline in dwelling investment in recent years on housing related expenditure. Further, a forecast decline in employment will restrain spending over the year, through its impact on both growth in incomes and consumer confidence.
An improvement in household finances and expected recovery in confidence are forecast to strengthen spending in 2010-11. However, at 2 1/4%, growth is forecast to remain below trend, partly due to the lagged impact of ongoing dwelling sector weakness in 2009-10.
Chart 2.5
Household consumption1 and wealth, Queensland
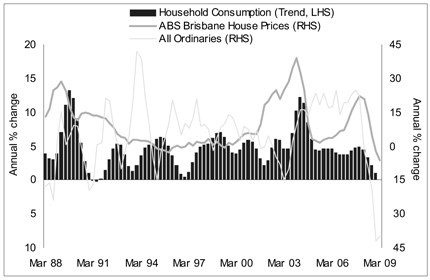
Note:
| 1. | Trend, CVM, 2006 07 reference year. |
Sources: ABS 6416.0, Datastream and Queensland Treasury.
| | | | |
| | | Budget Strategy and Outlook 2009-10 | | 27 |
Table 2.3
State and National economic forecasts1
| | | | | | | | |
| | | Outcome | | Est. Actual | | Forecasts |
| | | 2007 08
% | | 2008 09
% | | 2009 10
% | | 2010 11
% |
Queensland forecasts | | | | | | | | |
Domestic production2 | | | | | | | | |
Household consumption | | 4.6 | | 1 1/4 | | 3/4 | | 2 1/4 |
Private investment3,4 | | 9.1 | | 1/4 | | 11 1/2 | | 1 3/4 |
Dwellings | | 1.3 | | 7 3/4 | | 3 | | 20 3/4 |
Business investment4,5 | | 16.3 | | 7 | | 17 | | 8 1/4 |
Other buildings and structures4 | | 10.6 | | 14 1/4 | | 17 3/4 | | 11 |
Machinery and equipment4 | | 21.0 | | 1 1/4 | | 16 1/2 | | 6 |
Private final demand4 | | 6.1 | | 1 | | 3 1/4 | | 2 |
Public final demand4 | | 9.4 | | 5 | | 5 3/4 | | 1/2 |
Change in inventories6 | | 0.2 | | 1 1/4 | | 1/2 | | 1/2 |
Gross state expenditure7 | | 7.0 | | 3/4 | | 3/4 | | 2 |
Exports of goods and services | | 3.1 | | 2 | | 2 1/4 | | 3 |
Imports of goods and services | | 8.8 | | 1 | | 3 1/4 | | 1 |
Net exports6 | | 2.5 | | 1/4 | | 3/4 | | 3/4 |
Gross state product | | 4.9 | | 1/2 | | 1/4 | | 2 3/4 |
| | | | |
Other state economic measures | | | | | | | | |
Inflation | | 4.1 | | 3 3/4 | | 2 1/2 | | 2 1/2 |
Wage Price Index | | 4.2 | | 4 1/4 | | 3 1/2 | | 3 1/4 |
Employment | | 2.4 | | 2 1/4 | | 3/4 | | 1 1/4 |
Unemployment rate (%, year average) | | 3.7 | | 4 1/4 | | 6 1/2 | | 7 1/4 |
Labour force | | 2.1 | | 3 | | 1 3/4 | | 1 3/4 |
Participation rate (%, year average) | | 67.2 | | 67 1/2 | | 67 1/4 | | 67 |
| | | | |
National forecasts | | | | | | | | |
Domestic production2 | | | | | | | | |
Household consumption | | 3.7 | | 1 | | 1/4 | | 1 3/4 |
Private investment | | na | | na | | na | | na |
Dwellings | | 1.6 | | 2 1/2 | | 0 | | 11 1/2 |
Business investment4,5 | | 14.2 | | 2 1/2 | | 18 1/2 | | 3 1/2 |
Other buildings and structures4 | | 11.4 | | 1/2 | | 26 | | 3 |
Machinery and equipment4 | | 16.0 | | 3 | | 16 1/2 | | 4 |
Private final demand4 | | 5.5 | | 1/2 | | 4 | | 2 3/4 |
Public final demand4 | | 4.6 | | 5 | | 7 3/4 | | 1/2 |
Change in inventories6 | | 0.2 | | 1 1/2 | | 1/4 | | 3/4 |
Gross national expenditure7 | | 5.5 | | 1/4 | | 1 1/4 | | 2 1/2 |
Exports of goods and services | | 4.3 | | 1/2 | | 4 | | 4 1/2 |
Imports of goods and services | | 12.9 | | 1 1/2 | | 6 1/2 | | 6 1/2 |
Net exports6 | | 1.9 | | 1/4 | | 3/4 | | 1/2 |
Gross domestic product | | 3.6 | | 0 | | 1/2 | | 2 1/4 |
| | | | |
Other national economic measures | | | | | | | | |
Inflation8 | | 4.5 | | 1 3/4 | | 1 3/4 | | 1 1/2 |
Wage Price Index8 | | 4.1 | | 4 1/4 | | 3 1/4 | | 3 1/4 |
Employment8 | | 2.4 | | 1/4 | | 1 1/2 | | 1/2 |
Unemployment rate9 | | 4.2 | | 6 | | 8 1/4 | | 8 1/2 |
Labour force | | 2.3 | | na | | na | | na |
Participation rate9 | | 65.5 | | 65 1/4 | | 64 3/4 | | 64 1/4 |
Notes:
| 1. | Unless otherwise stated, all figures are annual % changes. Decimal point figures indicate an actual outcome. na—Indicates not available. |
| 2. | CVM, 2006-07 reference year. |
| 3. | Private investment includes livestock, intangible fixed assets and ownership transfer costs. |
| 4. | Adjusted for second-hand asset sales between the public and private sectors. |
| 5. | National calculations of business investment include investment in livestock and intangible fixed assets, which are not included in the Queensland calculations. |
| 6. | Percentage point contribution to growth in gross state or domestic product. |
| 7. | Includes statistical discrepancy and change in inventories. |
| 8. | Through-the-year growth rate to the June quarter. |
| 9. | Estimate for the June quarter. |
Sources: ABS 3101.0; 6401.0; 6345.0; 6202.0, Queensland Treasury and Australian Treasury.
| | | | |
28 | | Budget Strategy and Outlook 2009-10 | | |
Dwelling investment
Dwelling investment is forecast to decline 7 3/4% in 2008-09, driven mainly by a fall in new house construction. Approvals for the construction of new houses fell at an annual rate of 36.1% in the first ten months of 2008-09, reflecting the lagged impact of restrictive interest rates in much of 2008 and weak consumer and investor confidence following the worsening in the credit crisis since September 2008. This has also coincided with a reduction in renovation activity in 2008-09. Other dwelling construction (high-rises, townhouses and duplexes) is expected to have reached a cyclical peak in early 2008-09, with a tightening in lending standards weighing on investors in particular.
While investor activity continued to decline in early 2009, Australian and State Government initiatives have strengthened first-home buyer and owner occupier activity since late 2008 (see Chart 2.6). This reflects cuts to stamp duty in September, the First Home Owners Boost in October and a fall in variable mortgage rates from an average of 9.6% in August 2008 to 5.8% in April 2009, their lowest rate since 1968.
Increased housing activity from these policy stimuli is forecast to translate into a recovery in new home construction in 2009-10. However, limited access to funding, lower expected capital gains due to a lacklustre outlook for house prices, together with significant lags associated with larger developments, suggests investment in other dwellings, particularly high-rise complexes, will fall in 2009-10. As a result, total dwelling investment is forecast to decline by a further 3% in year-average terms.
| | | | |
| | | Budget Strategy and Outlook 2009-10 | | 29 |
Chart 2.6
Monthly value of finance approvals1 for new and existing dwellings
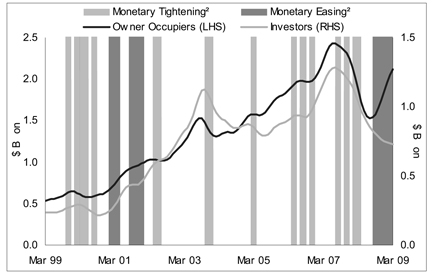
Notes:
| 1. | Seasonally adjusted and trended by Queensland Treasury. |
| 2. | Month in which the official cash rate increased (monetary tightening) or decreased (monetary easing). |
Sources: ABS 5609.0, 5671.0, RBA and Queensland Treasury.
However, dwelling investment is forecast to rebound strongly in 2010-11, rising 20 3/4%. Solid population growth, low interest rates and fast growth in rents, combined with the fall in construction in previous years, are expected to boost demand for new dwellings.
Business investment
Business investment continued to be a key driver of economic growth in 2008-09. Despite a deterioration in the outlook over the year, a large number of projects still to be completed in the commercial, resource and infrastructure sectors is expected to support estimated growth of 14 1/4% in other buildings and structures investment in 2008-09. Machinery and equipment investment is expected to rise 1 1/4%, supported by work under construction and the Federal Government’s tax incentives, but tempered by a depreciation in the A$ between mid-July and late November 2008 (which made imported equipment more expensive). Overall, the volume of business investment is estimated to rise 7% in 2008-09 to exceed $38 billion, a level three times that recorded in 2000-01.
| | | | |
30 | | Budget Strategy and Outlook 2009-10 | | |
Chart 2.7
Business conditions1 and investment 2 , Queensland
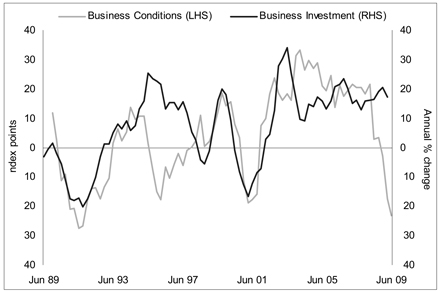
Notes:
| 1. | National Australia Bank Business Conditions Index, seasonally adjusted by Queensland Treasury, advanced one quarter. |
| 2. | CVM, 2006 07 reference year, four quarter rolling sum. Excludes private sector net purchases of second hand public sector assets. |
Sources: National Australia Bank and Queensland Treasury.
Investment is expected to peak in 2008-09, with a number of factors forecast to see businesses rein in expansion plans in 2009-10. A dramatic rise in risk aversion by both Australian and overseas lenders has limited access to funding for new projects, particularly in commercial property, while rising vacancy rates have also reduced the need for new office space. The global economic recession and decline in commodity prices has also led to the postponement or cancellation of a number of resource projects. As a result, business investment is forecast to decline 17% in 2009-10, with machinery and equipment investment anticipated to fall 16 1/2% and other buildings and structures investment to decline 17 3/4%.
In line with previous recessions, business investment is forecast to continue to unwind in 2010-11, declining a further 8 1/4%. It is expected that the additional productive capacity created during the sustained investment boom since 2001 will take time to be absorbed, given the modest economic recovery expected globally and domestically in 2010-11.
| | | | |
| | | Budget Strategy and Outlook 2009-10 | | 31 |
Public final demand
Playing a crucial role in supporting economic activity, public final demand is estimated to grow 5% in 2008-09 and forecast to rise 5 3/4% in 2009-10, helping to offset the decline in private demand anticipated in 2009-10. As a result, growth in public investment is forecast to contribute one percentage point to economic growth in 2009-10. This reflects the State’s own significant capital program as well as infrastructure initiatives in partnership with the Australian Government.
Chart 2.8
Public and Private Demand Growth, Queensland1,2
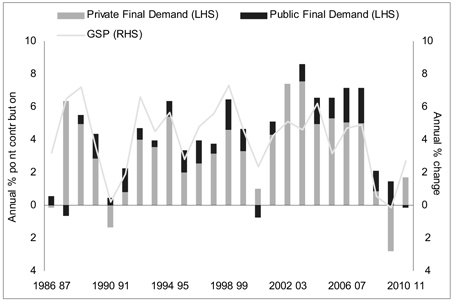
Note:
| 1. | Public final demand comprises public investment plus public consumption. |
| 2. | CVM, 2006 07 reference year. Adjusted for second hand asset sales between the public and private sectors. 2008 09 is an estimated actual, 2009 10 and 2010 11 are forecasts. |
Source: Queensland Treasury.
Net exports
Despite significant improvements to production and transport capacity in recent years, the volume of exports is forecast to contract by 2% in 2008-09 and 2 1/4% in 2009-10, largely reflecting recessions across Queensland’s major trading partners. In particular, sharp reductions in steel production in Japan, Korea, Taiwan and India have lowered hard coking coal exports since late 2008, while a scaling back in global industrial production has caused base metal exports to fall in the second half of 2008-09. These trends are forecast to continue in 2009-10.
| | | | |
32 | | Budget Strategy and Outlook 2009-10 | | |
Export incomes are also expected to unwind next financial year. Commodity earnings in A$ terms are expected to rise by more than $20 billion in 2008-09, reflecting a tripling and doubling in US$ hard coking and thermal coal export prices for Japanese Financial Year 2008-09 (JFY, April 2008—March 2009), as well as a depreciation of the A$ between July and November 2008. However, coal contract prices for JFY 2009-10 have partly unwound last year’s gains, having been negotiated 57% and 44% lower for hard coking and thermal coal respectively. Base metals are also trading at prices well below peak levels, which, along with funding difficulties associated with the global financial crisis, has exacerbated production cuts by some of Queensland’s base metal producers. As a result, commodity export earnings are expected to decline in 2009-10, but remain higher than their level in 2007-08 (see Chart 2.9).
Chart 2.9
Overseas commodity exports, Queensland
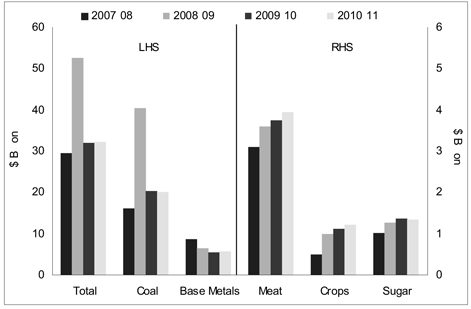
Note:
| 1. | 2008 09 is an estimated actual, 2009 10 and 2010 11 are forecasts. |
Source: ABS unpublished trade data and Queensland Treasury.
Partly offsetting lower mining exports, improved growing conditions will support a recovery in the rural sector. Despite the impact of substantial flooding in the north of the State in early 2009, beef exports are forecast to rise, reflecting above-average rainfall in non-flood affected beef producing regions, as well as strong demand from the US for lower-grade manufacturing beef. Improved water storages are forecast to boost exports of cotton and other crops over the period to 2009-10.
| | | | |
| | | Budget Strategy and Outlook 2009-10 | | 33 |
Services exports will also be affected by conditions overseas. International enrolments for education have remained strong in 2008-09, reflecting some depreciation of the A$ and continuing strong demand from emerging markets (such as India and China). However, the economic downturn in other major student-source countries is expected to weigh on overseas education in 2009-10. Tourism exports are expected to fall in 2008-09, reflecting significant recessions in major overseas markets, such as Japan, the US, UK and South Korea, as well as concerns about swine influenza. Interstate tourism exports are also likely to be adversely affected by the economic slowdown in Australia, as well as adverse events experienced in Queensland, including floods, cyclones and an oil spill. However, some recovery in interstate tourism from these transitory factors is expected in 2009-10, supported by a lower A$ relative to its recent peak and cheaper fuel prices, which have made interstate holidays more cost effective relative to overseas travel for Australians.
Queensland’s total imports are expected to fall by 1% and 3 1/4% in 2008-09 and 2009-10 respectively. Goods imports are expected to fall, as slower growth in consumer spending and a sharp decline in business investment in 2009-10 lowers demand for imported consumer and capital goods. Overseas tourism imports are also expected to fall, as Queenslanders substitute international with domestic tourism or postpone holiday plans.
Overall, net exports are expected to detract 1/4 percentage point from growth in 2008-09, with exports forecast to fall by a greater amount than imports. In 2009-10, imports are expected to decline at a faster rate than exports, resulting in net exports contributing 3/4 percentage point to growth, the first contribution since 2000-01. With the global economy expected to gradually recover over the course of 2010-11, Queensland’s exports are forecast to rise by 3% and exceed imports growth of 1% that year. As a result, net exports are forecast to contribute a further 3/4 percentage point to growth in 2010-11.
Labour Market
A weakening in domestic economic growth, combined with a sharp reduction in business confidence, has seen demand for labour weaken in 2008-09. However, previous difficulties in finding and retaining skilled workers had seen many employers reluctant to reduce staff levels in the first half of the financial year, and instead reduce hours worked. As a result, year-average employment growth is estimated to only moderate slightly, to 2 1/4% in 2008-09, representing an increase in employment of almost 50,000 persons. The labour force participation rate in Queensland is estimated to increase marginally in 2008-09, to an historic high of 67 1/2%, driven in particular by greater mature age workforce participation.
| | | | |
34 | | Budget Strategy and Outlook 2009-10 | | |
Chart 2.10
Employment growth, labour force growth and unemployment rate, Queensland1
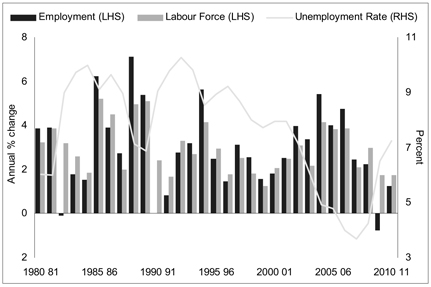
Note:
| 1. | Year average, 2008 09 is an estimated actual, 2009 10 and 2010 11 are forecasts. |
Sources: ABS 6202.0 and Queensland Treasury.
Rising participation and ongoing strong growth in the civilian population has seen labour force growth exceed jobs growth in 2008-09. Consequently, the unemployment rate is estimated to rise to 4 1/4% in 2008-09, the first year-average increase in eight years.
Due to a contraction in economic activity, the level of employment is expected to fall by 3/4%, or 16,000 persons, in 2009-10. Employment is expected to be most affected in the retail and construction sectors, in line with a more cautious household sector and a fall in business and dwelling investment next year. Mining is also expected to experience a decline in employment, after doubling over the previous five years due to the resources boom.
The labour force participation rate is forecast to fall to 67 1/4% in 2009-10, as poor job prospects see some unemployed persons leave the labour force and potential entrants remain outside of it. However, this fall in participation is likely to be less marked than in previous downturns, reflecting some postponement of retirement by mature aged workers, who have both a structurally higher participation rate than preceding generations and an incentive to rebuild savings following recent falls in asset prices. Ongoing civilian population growth will see a further rise in the labour force, despite a lower participation rate. This, combined with a fall in employment, is forecast to increase the unemployment rate to 6 1/2% in 2009-10.
| | | | |
| | | Budget Strategy and Outlook 2009-10 | | 35 |
Employment is forecast to recover in 2010-11, albeit to a below-average rate of 1 1/4%, or 26,000 persons, reflecting the lagged impact of the subdued economic activity in 2009-10 and only a modest recovery in 2010-11. With labour force growth forecast to again exceed jobs growth, the year-average unemployment rate is anticipated to peak at 7 1/4% in that year, the highest year-average rate since 2001-02.
Population
Following growth of 2.4% to 2.5% in each of the last six years, Queensland’s population growth is expected to remain at 2 1/2% in 2008-09, before easing to 2 1/4% in 2009-10 and 2% in 2010-11. However, this still translates into an increase of more than one quarter of a million persons, or over 1,800 persons per week, in these three years. Reflecting ongoing higher net interstate migration than any other State, Queensland’s population growth is expected to remain above the national rate.
Some slowing in net interstate migration is expected, contributing to an expected easing in population growth. Net inflows have eased since 2003, as relatively stronger growth in Brisbane house prices narrowed the house price gap with southern states (see Chart 2.11). Following the pattern of previous periods of weak national growth, Australian interstate flows, including those to Queensland, are forecast to ease further in 2009-10. While low unemployment and expansions in the national quota have seen overseas migration become the main driver of Queensland population growth, a reversal in these factors should also moderate overseas inflows over the forecast period.
Chart 2.11
Net migration, Queensland
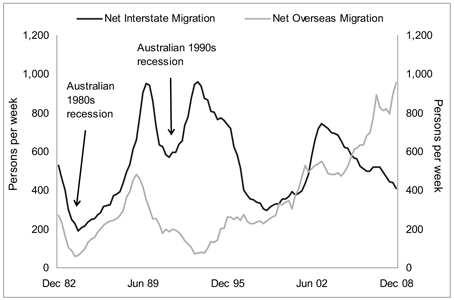
Source: ABS 3101.0.
| | | | |
36 | | Budget Strategy and Outlook 2009-10 | | |
Wages
Growth in the Wage Price Index in Queensland is estimated ease from 4 1/4% in 2008-09 to 3 1/2% and 3 1/4% in 2009-10 and 2010-11 respectively, in line with a softening in labour market conditions. However, fiscal stimulus payments, as well as cuts in both interest rates and income taxes, will boost average real disposable incomes over 2008-09 and 2009-10.
Inflation
Inflation (as measured by Brisbane’s Consumer Price Index (CPI)) peaked at 5.6% in through-the-year terms in September quarter 2008, reflecting the lagged effects of rising oil prices, buoyant global and domestic economic growth and domestic capacity constraints throughout 2007-08. However, with all of these factors unwinding in 2008-09, year-average inflation is estimated to ease to 3 3/4% in 2008-09, and forecast to moderate further to 2 1/2% in 2009-10 (see Chart 2.12).
The housing sector remained a key contributor to inflation in 2008-09. Weak construction activity combined with fast population growth has lowered rental vacancy rates and underpinned strong rental price growth. Adverse weather conditions across the country in late 2008, including flooding, cyclones and bushfires, also drove substantial, albeit transitory, increases in food prices during the year.
With a further fall in dwelling investment expected in 2009-10, rental prices are forecast to continue to grow and contribute further to inflation next year. However, several factors are expected to ease inflation in 2009-10, including discounting of clothing and footwear as well as tourism services, and a modest improvement in wholesale credit markets. Price growth for imported goods is also expected to be subdued, reflecting a sharp deceleration in global price inflation and some appreciation of the A$.
The lagged impact of subdued economic activity and softer labour market conditions are forecast to see inflation remain modest, at 2 1/2%, in 2010-11, below its average rate of 3.1% over the decade prior to the forecast period.
| | | | |
| | | Budget Strategy and Outlook 2009-10 | | 37 |
Chart 2.12
Headline Inflation1, Brisbane
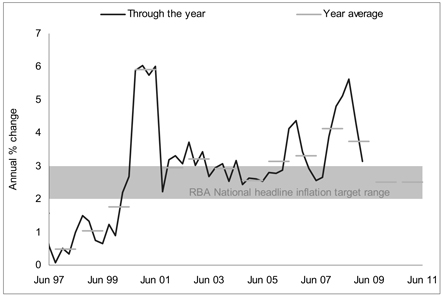
Note:
| 1. | Brisbane All Groups CPI. 2008 09 is an estimated actual, 2009 10 and 2010 11 are forecasts. |
Sources: ABS 6401.0 and Queensland Treasury.
Risks and opportunities
Future developments in the global financial crisis and the worldwide economic recession are crucial to the outlook for the Queensland and national economies:
| • | | A key risk is the development of a vicious cycle, whereby widespread corporate failures resulting from the global economic downturn further disrupt the wellbeing of the financial system. This would result in an additional tightening in credit conditions, again impacting the real economy and prolonging the global downturn. |
| • | | The extent of the geographical contagion may also not yet be fully revealed, with the impact of the downturn in industrialised economies on Asia possibly larger than currently anticipated. Based on IMF forecasts, GDP growth in 2009 for Queensland’s trading partners in non-Japan Asia has been downgraded from 5% in October 2008 to - 3/4% in April 2009. Although newly industrialised and emerging Asian economies did not heavily engage in the financial activities that led to the crisis, they have been severely affected through extensive trade and financial linkages with the US, Japan and Europe. Developing economies heavily reliant on external financing are particularly vulnerable to a reversal in foreign capital flows. Indeed, the United Nations Conference on Trade and Development revealed foreign direct investment flows into this region declined in March quarter 2009. |
| | | | |
38 | | Budget Strategy and Outlook 2009-10 | | |
| • | | The extent of the downturn in emerging Asia will also influence commodity prices. While world prices of copper, lead and zinc have experienced a sizeable recovery so far in 2009, coal prices remain depressed as demand wanes. Nevertheless, China significantly increased metallurgical coal imports from Queensland in the first four months of 2009, cushioning a fall in imports from traditional buyers such as Japan, India, South Korea, Taiwan and the UK. Current economic forecasts are based on the expectation that some of this surge in Chinese demand proves short lived. However, if this trend were to continue for all of 2009, China could replace India as Queensland’s second largest destination for metallurgical coal, and help support contract prices for JFY 2010-11. |
| • | | In an attempt to re-capitalise the financial system, governments have injected unprecedented amounts of liquidity into failing financial institutions, and have taken on a large amount of ‘toxic’ assets. While these efforts have so far tempered the financial crisis, the sustainability of these rescue programs and their long term consequences have been questioned. The sharp rise in government debt issuance may heighten sovereign risk, driving global interest rates higher in the long term. |
| • | | Aggressive monetary easing has seen policy interest rates fall to almost zero in major industrialised economies as a whole. In this near-zero interest rate environment, central banks have devised unconventional strategies aimed at further easing monetary policy. However, the effectiveness of these methods has yet to be tested, while possible unintended consequences need to be considered. Some commentators fear that this extremely loose monetary stance may lead to a surge in inflation as the global economy recovers, while others are concerned that increased liquidity may instigate asset price bubbles elsewhere in the financial system. |
Economic growth prospects could also be further jeopardised by the spread of swine influenza to the Asian region in particular, which was particularly scarred by the SARS outbreak in 2003. This could in turn affect Queensland’s overseas tourism exports in 2009-10.
Reflecting the relatively less aggressive monetary easing in Australia assumed over the forecast period, some appreciation in the A$ has been factored into economic forecasts for 2009-10 and 2010-11. However, the current trend suggests that the A$ may rise faster than assumed. Indeed, the value of the A$ averaged 76.25USc in May 2009, compared with 66.40USc in March. A larger than expected A$ appreciation will further erode export earnings and domestic incomes in 2009-10.
Domestically, a key element of the outlook for the national and Queensland economy is the proposed infrastructure initiatives announced in the 2009-10 State and Australian Budgets, with their timely implementation crucial to supporting economic activity.
| | | | |
| | | Budget Strategy and Outlook 2009-10 | | 39 |
| 3 | BUDGET PERFORMANCE AND OUTLOOK |
FEATURES
| • | | The economic conditions outlined in Chapter 2 have had a significant impact on Queensland’s fiscal outlook. |
| • | | The General Government net operating balance is expected to be a deficit of $574 million in 2008-09 compared to a forecast deficit of $1.573 billion at the time of the Economic and Fiscal Update in February 2009 and a $54 million surplus anticipated in the Mid Year Fiscal and Economic Review in December 2008. |
| • | | The decline in the forecast net operating balance since the Mid Year Fiscal and Economic Review primarily reflects the sharp deterioration in economic conditions and the resulting significant downward revisions to taxation, royalty and GST revenue. |
| • | | The General Government sector is forecast to incur a net operating deficit ($1.954 billion) in 2009-10 and across each of the forward estimate years. |
| • | | Cash deficits in the General Government sector are projected for each year across the forward estimates, reflecting the State’s significant capital program and the cash impact of the net operating deficit position. |
| • | | The State’s capital program is an estimated $18.2 billion, a 12.8% increase on 2008-09 estimated outlays. The capital outlays of Public Non-financial Corporations (commercial) sector entities constitute approximately 39% of total outlays in 2009-10. |
As outlined in both the Mid Year Fiscal and Economic Review and the Economic and Fiscal Update, Queensland’s fiscal outlook has deteriorated substantially since the publication of the 2008-09 Budget. This is due to the sharp downturn in the world economy that has significantly impacted the international and Australian economic environment. As a result, jurisdictions around the globe have suffered substantial reductions in revenue and Queensland is no exception. A temporary increase in Australian Government funding to Queensland under the Nation Building and Jobs Plan has offset some of this reduction in revenue.
This chapter provides a summary of financial aggregates for the General Government sector for the 2009-10 Budget. A discussion of the Public Non-financial Corporations (PNFC) sector can be found in Chapter 5.
| | | | |
40 | | Budget Strategy and Outlook 2009-10 | | |
SUMMARY OF KEY FINANCIAL AGGREGATES
Table 3.1 provides aggregate actual outcome information for 2007-08, estimated actual outcome information for 2008-09, forecasts for 2009-10 and projections for the outyears.
Table 3.1
General Government sector – key financial aggregates1
| | | | | | | | | | | | | | | | | | |
| | | 2007-08
Actual2
$ million | | | 2008-09
Est. Act.
$ million | | | 2009-10
Budget
$ million | | | 2010-11
Projection
$ million | | | 2011-12
Projection
$ million | | | 2012-13
Projection
$ million | |
Revenue | | 31,430 | | | 35,874 | | | 37,192 | | | 37,029 | | | 38,100 | | | 40,431 | |
Expenses | | 32,989 | | | 36,447 | | | 39,146 | | | 40,488 | | | 42,191 | | | 43,720 | |
Net operating balance | | (1,559 | )3 | | (574 | ) | | (1,954 | ) | | (3,459 | ) | | (4,090 | ) | | (3,290 | ) |
Cash surplus/(deficit) | | (4,922 | ) | | (4,144 | ) | | (6,838 | ) | | (7,516 | ) | | (5,335 | ) | | (2,924 | ) |
Capital purchases | | 5,716 | | | 7,137 | | | 9,270 | | | 8,540 | | | 6,151 | | | 4,321 | |
Net borrowing | | 4,175 | | | 4,014 | | | 7,954 | | | 9,079 | | | 6,792 | | | 4,540 | |
Gross borrowing | | 6,328 | | | 10,765 | | | 18,775 | | | 27,898 | | | 34,707 | | | 39,234 | |
Net worth | | 155,178 | | | 149,800 | | | 151,144 | | | 150,797 | | | 150,209 | | | 150,668 | |
Net debt | | (22,598 | ) | | (17,808 | ) | | (10,672 | ) | | (2,796 | ) | | 2,749 | | | 5,901 | |
Notes:
| 1. | Numbers may not add due to rounding. |
| 2. | Reflects published actuals. Does not include any recasting of data that may have occurred subsequently. |
| 3. | Reflects the Uniform Presentation Framework net operating balance. The underlying net operating result was a surplus of $339 million in 2007 08. With the transfer of superannuation and other long term assets to Queensland Treasury Corporation, the calculation of an underlying balance is no longer relevant. |
| | | | |
| | | Budget Strategy and Outlook 2009-10 | | 41 |
BUDGET OUTCOMES 2008-09
Key financial aggregates
Table 3.2
General Government sector – key financial aggregates1
| | | | | | | | | | | | |
| | | 2008-09
Budget
$ million | | | 2008-09
MYFER
$ million | | | 2008-09
EFU
$ million | | | 2008-09
Est. Act.
$ million | |
Revenue | | 36,582 | | | 37,063 | | | N/A | | | 35,874 | |
Expenses | | 35,772 | | | 37,009 | | | N/A | | | 36,447 | |
Net operating balance | | 809 | | | 54 | | | (1,573 | ) | | (574 | ) |
Cash surplus/(deficit) | | (1,970 | ) | | (3,013 | ) | | (4,647 | ) | | (4,144 | ) |
Capital purchases | | 6,651 | | | 7,094 | | | 7,068 | | | 7,137 | |
Net borrowing | �� | 2,915 | | | 3,424 | | | 4,852 | | | 4,014 | |
Gross borrowing | | 8,781 | | | 9,859 | | | 11,287 | | | 10,765 | |
Net worth | | 128,563 | | | 160,386 | | | N/A | | | 149,800 | |
Net debt | | (21,928 | ) | | (19,316 | ) | | N/A | | | (17,808 | ) |
Notes:
| 1. | Numbers may not add due to rounding. |
Operating balance
The operating balance expected for 2008-09 is a deficit of $574 million compared to a forecast deficit of $1.573 billion at the time of the Economic and Fiscal Update (EFU) and a $54 million surplus anticipated in the Mid Year Fiscal and Economic Review (MYFER). The decline in the forecast net operating balance since the Mid Year Fiscal and Economic Review primarily reflects the sharp deterioration in economic conditions and the resulting significant downward revisions to taxation, royalty and GST revenue.
Table 3.4 provides a reconciliation of the current net operating balance for 2008-09 to the Mid Year Fiscal and Economic Review estimate.
The improvement in the operating balance for 2008-09 since the Economic and Fiscal Update is a result of additional revenue from the Australian Government for use on specific purposes, including Nation Building and Jobs Plan projects, which has no offsetting operating expense in that year.
| | | | |
42 | | Budget Strategy and Outlook 2009-10 | | |
Revenue
Revenue in 2008-09 is expected to be lower than the Mid Year Fiscal and Economic Review estimate largely due to:
| • | | lower than expected taxation revenue, particularly transfer duty and motor vehicle duty reflecting weakness in property market activity and motor vehicle sales |
| • | | reductions in royalty revenue as a result of lower prices and tonnages for thermal and coking coal, as well as the recent appreciation in the AUD-USD exchange rate |
| • | | reduced GST revenue from the Australian Government. |
Expenses
Expenses are also estimated to decrease from the Mid Year Fiscal and Economic Review forecast primarily reflecting lower borrowing costs as a result of lower interest rates, lower depreciation costs and lower superannuation interest costs as a result of lower returns on the remainder of superannuation investments still held in the Consolidated Fund for former defined benefit purposes.
Further details on revenue and expenses projections are contained in Chapters 6 and 7 respectively.
Cash surplus/(deficit)
The General Government sector is now expected to record a cash deficit in 2008-09 of $4.144 billion compared to a $3.013 billion deficit forecast in the Mid Year Fiscal and Economic Review. The larger than expected cash deficit is predominantly the result of the cash impact of the reduction in the net operating balance in 2008-09 and marginally higher capital purchases.
At the time of the Economic and Fiscal Update, a cash deficit of $4.647 billion was expected in 2008-09 for the General Government sector. The improvement reflects the difference in timing between receipt of cash from the Commonwealth and the associated expense.
Capital purchases
General Government purchases of non-financial assets (that is, capital expenditure) in 2008-09 are estimated to be $7.137 billion. This is slightly more than forecast in the Economic and Fiscal Update and the Mid Year Fiscal and Economic Review due to increased spending associated with the Australian Government’s Nation Building and Jobs Plan, partially offset by a change in timing of cashflows for capital projects.
The total capital program for 2008-09, including capital grants, is expected to be $16.132 billion, $876 million lower than expected at the time of the 2008-09 Budget. For further details see Budget Paper 3 – Capital Statement.
| | | | |
| | | Budget Strategy and Outlook 2009-10 | | 43 |
Borrowing
Net borrowings (additional borrowings each year as itemised in the Cash Flow Statement) of $4.014 billion are expected in 2008-09, $590 million more than forecast in the Mid Year Fiscal and Economic Review largely due to the negative operating position.
At the time of the Economic and Fiscal Update, net borrowings of $4.852 billion were expected in 2008-09 for the General Government sector, reflecting the larger cash deficit for 2008-09 anticipated at that time.
Similarly, gross borrowings (the stock of borrowings outstanding as stated in the Balance Sheet) of $10.765 billion are forecast at 30 June 2009, $522 million less than the Economic and Fiscal Update estimate, reflecting the improvement in the 2008-09 net cash balance since that time.
Net worth
The net worth, or equity, of the State is the amount by which the State’s assets exceed its liabilities. This is the value of the investment held on behalf of the people of Queensland by public sector entities.
The net worth of the General Government sector at 30 June 2009 is estimated at $149.800 billion. This is $21.237 billion higher than the forecast in the 2008-09 Budget, primarily due to the comprehensive revaluation of road infrastructure assets by the former Department of Main Roads, as reflected in the 30 June 2008 audited actual.
Net worth is $5.378 billion lower than the 30 June 2008 audited actual and $10.586 billion lower than the net worth forecast at the time of the Mid Year Fiscal and Economic Review due to market value fluctuations, including those relating to investment returns on superannuation and other long term assets now held by Queensland Treasury Corporation and those relating to the State’s debt, actuarial adjustments to superannuation and long service leave and declines in property values on Government-owned assets as a result of revaluations.
Net debt
Net debt is the sum of advances received and borrowings less cash and deposits, advances paid and investments, loans and placements.
In 2008-09, net debt in the General Government sector is estimated to be negative $17.808 billion, compared to negative $19.316 billion estimated at the time of the Mid Year Fiscal and Economic Review. The change in net debt reflects the impact of negative investment returns and higher borrowings.
| | | | |
44 | | Budget Strategy and Outlook 2009-10 | | |
BUDGET 2009-10 AND OUTYEAR PROJECTIONS
Key financial aggregates
Table 3.3
General Government sector – key financial aggregates1
| | | | | | | | | | | | |
| | | 2009-10
Budget
$ million | | | 2010-11
Projection
$ million | | | 2011-12
Projection
$ million | | | 2012-13
Projection
$ million | |
Revenue | | 37,192 | | | 37,029 | | | 38,100 | | | 40,431 | |
Expenses | | 39,146 | | | 40,488 | | | 42,191 | | | 43,720 | |
Net operating balance | | (1,954 | ) | | (3,459 | ) | | (4,090 | ) | | (3,290 | ) |
Cash surplus/(deficit) | | (6,838 | ) | | (7,516 | ) | | (5,335 | ) | | (2,924 | ) |
Capital purchases | | 9,270 | | | 8,540 | | | 6,151 | | | 4,321 | |
Net borrowing | | 7,954 | | | 9,079 | | | 6,792 | | | 4,540 | |
Gross borrowing | | 18,775 | | | 27,898 | | | 34,707 | | | 39,234 | |
Net worth | | 151,144 | | | 150,797 | | | 150,209 | | | 150,668 | |
Net debt | | (10,672 | ) | | (2,796 | ) | | 2,749 | | | 5,901 | |
Note:
| 1. | Numbers may not add due to rounding. |
Operating balance
As outlined in the Economic and Fiscal Update, significant downward revisions to key revenues including taxation (particularly transfer duty and motor vehicle duty), royalty and GST revenue in the wake of the global economic slowdown have resulted in a substantial deterioration in the fiscal position than anticipated at the time of the Mid Year Fiscal and Economic Review. The General Government sector is now expected to record an operating deficit of $1.954 million in 2009-10, with net operating deficits anticipated each year across the forward estimate years.
The improvement in the net operating balance in 2008-09 and 2009-10 compared with that forecast in the Economic and Fiscal Update is largely due to additional revenue from the Australian Government without an offsetting expense in those years, while the larger operating deficits in 2010-11 and 2011-12 primarily reflect further downward revisions in GST revenue and royalty revenue as a result of lower forecast coal prices and tonnages and appreciation in the AUD-USD exchange rate.
The increase in expenditure relative to 2008-09 mainly relates to service enhancements in key service delivery areas including Australian Government partnerships, increases in wages and borrowing costs, and higher interest costs associated with the remainder of superannuation investments still held in the Consolidated Fund for former defined benefit purposes (as a result of interest income returning to an assumed long run rate of return).
| | | | |
| | | Budget Strategy and Outlook 2009-10 | | 45 |
Further details on revenue and expenditure projections are contained in Chapters 6 and 7 respectively.
Cash surplus/(deficit) and capital purchases
A cash deficit of $6.838 billion is expected in 2009-10 for the General Government sector. The cash deficit is forecast to be $7.516 billion in 2010-11, reducing to $2.924 billion by 2012-13. The cash deficits reflect the Government’s significant planned capital program and the cash impact of the operating deficit position across the forward estimates.
Total General Government capital purchases of $9.270 billion are budgeted for 2009-10, $2.283 billion higher than forecast in the Economic and Fiscal Update as a result of increased capital expenditure flowing from the Australian Government’s Nation Building and Jobs Plan. Budget Paper No.3 – Capital Statement provides details, by portfolio, of budgeted 2009-10 capital outlays.
Over the period 2009-10 to 2012-13, purchases of non-financial assets (capital purchases) in the General Government sector of $28.282 billion are planned.
Movements in the cash deficit and capital purchases forecasts since the Economic and Fiscal Update are largely due to the timing and distribution of funding and capital spending associated with the Australian Government’s Nation Building and Jobs Plan.
Borrowing
Net borrowings of $7.954 billion are budgeted for 2009-10, an increase of $3.034 billion on the Mid Year Fiscal and Economic Review estimate mainly due to the larger negative operating position.
Over the Budget and forward estimates period, total General Government borrowings and advances of $28.302 billion are planned. Of this amount, some $1.19 billion is to fund net equity injections to Queensland’s PNFC sector entities to support expansion of the State’s rail and water infrastructure.
The increase in the amount of borrowings to finance the deficit leads to an increase in borrowing costs of $85 million to $887 million, in 2009-10, compared to the Mid Year Fiscal and Economic Review estimate. Borrowing costs are forecast to increase to $2.299 billion in 2012-13.
Gross borrowings of $18.775 billion are expected in the General Government sector at 30 June 2010, increasing to $39.234 billion by the end of 2012-13.
| | | | |
46 | | Budget Strategy and Outlook 2009-10 | | |
Net worth
State net worth is projected to be $151.144 billion at 30 June 2010 and $150.668 billion by the end of 2012-13. The decrease in net worth is largely the result of the impact of the operating deficits on the Government’s equity.
Net debt
In 2009-10, net debt in the General Government sector is estimated to be negative $10.672 billion compared to the Mid Year Fiscal and Economic Review estimate of negative $15.467 billion. This increase in net debt primarily reflects the flow through of lower than forecast investment returns on the estimated value of investments and higher borrowings.
Net debt is expected to increase over the forward estimates to be positive $5.901 billion in 2012-13 reflecting the increase in borrowing.
More information on the State’s net worth, assets and liabilities is provided in Chapter 8.
| | | | |
| | | Budget Strategy and Outlook 2009-10 | | 47 |
RECONCILIATION OF NET OPERATING BALANCE
Table 3.4 provides a reconciliation of the current General Government sector net operating balances for 2008-09 and 2009-10 to the MYFER estimates.
Table 3.4
Reconciliation of 2008-09 and 2009-10 net operating balance to MYFER estimates1
| | | | | | |
| | | 2008-09
Est. Act.
$ million | | | 2009-10
Budget
$ million | |
MYFER net operating balance | | 54 | | | (124 | ) |
Expenditure policy decisions2 | | (161 | ) | | 126 | |
Taxation revisions3 | | (539 | ) | | (972 | ) |
Royalty revisions4 | | (636 | ) | | (1,427 | ) |
GST revisions5 | | (472 | ) | | (1,009 | ) |
Other significant variations impacting on operating balance | | | | | | |
Other Commonwealth funding revisions6 | | 1,118 | | | 2,415 | |
Net flows from PNFC sector entities | | 76 | | | (558 | ) |
Actuarial revisions7 | | (103 | ) | | (100 | ) |
Other parameter adjustments8 | | 90 | | | (305 | ) |
2009-10 Budget | | (574 | ) | | (1,954 | ) |
Notes:
| 1. | Denotes impact on net operating balance. Numbers may not add due to rounding. |
| 2. | Reflects expenditure policy decisions taken since the MYFER. Budget Paper 4 Budget Measures outlines in detail the policy decisions taken since the 2008 09 Budget. 2009 10 estimate includes the abolition of the Queensland Fuel Subsidy Scheme. |
| 3. | Reflects changes in taxation estimates across a range of state taxes as outlined in Chapter 6, as well as revisions to the First Home Owner Grant estimates and policy changes to land tax and casino taxes announced in the MYFER and detailed in Budget Paper 4 Budget Measures. |
| 4. | Reflects changes to royalty revenue as outlined in Chapter 6. |
| 5. | Represents updated GST revenue estimates as discussed in Chapter 6 and Chapter 9. |
| 6. | Represents the net impact of funding provided by the Australian Government primarily for Specific Purpose Payments, National Partnership Payments and the Nation Building and Jobs Plan. The net impact on the operating balance is the result of funding being provided as revenue but spent as capital (i.e. no offsetting expense in the operating statement) or spent in a different financial year. |
| 7. | Represents actuarial revisions to superannuation and long service leave provisions and revisions to superannuation expense as a result of negative investment returns (as outlined in the Economic and Fiscal Update). |
| 8. | Refers to adjustments of a non policy nature such as movements in expenditure and revenue relating to economic and technical parameters and expenditure lapses in 2008 09. Major contributors to increased spending include growth funding provided to support service delivery in key agencies, movements in agency net operating balances and funding for natural disaster relief. |
| | | | |
48 | | Budget Strategy and Outlook 2009-10 | | |
FEATURES
| • | | Queensland’s economic strategy focuses on positioning the Queensland economy for a strong recovery from the global recession while simultaneously supporting jobs. |
| • | | The centrepiece of the Government’s jobs agenda is continued investment in infrastructure. With a total capital program of $18.2 billion in 2009-10, new infrastructure will be created at an average rate of more than $350 million a week, sustaining employment for thousands of Queenslanders. |
| • | | In per capita terms, it is estimated that Queensland’s General Government sector capital spending in 2009-10 will be around 60% more than the average of the other states, at $2,083 per person. |
| • | | The Government is working to maximise and leverage the Australian Government’s substantial nation-building and economic stimulus programs such as the Nation Building and Jobs Plan. |
| • | | As well as supporting existing businesses and traditional strengths, the Government is driving the development of the industries and jobs of tomorrow in areas such as liquefied natural gas and renewable energy. |
| • | | Queensland’s productivity growth has outpaced the national average over the past decade and the Government is locking in future productivity gains with its substantial ongoing investment in skills, innovation, and economic infrastructure. |
FRAMEWORK FOR SUSTAINING JOBS AND POSITIONING FOR ECONOMIC RECOVERY
In the face of the global recession, the Queensland Government’s economic strategy is comprised of four key elements: jobs, infrastructure, skills and innovation, and responding to climate change. Additionally, the Government remains committed to ongoing regulatory reform. The following sections discuss the Government’s economic strategy and regulatory reform agenda.
| | | | |
| | | Budget Strategy and Outlook 2009-10 | | 49 |
DELIVERING JOBS FOR QUEENSLAND
A concerted effort is required by governments at all levels to preserve existing jobs and to create new employment and skilling opportunities for unemployed Queenslanders. The Queensland Government plans to meet this challenge with a commitment to facilitate the creation of 100,000 new jobs by March 2012.
The Government’s plan has four key planks:
| • | | Sustaining Queensland’s record building program |
| • | | Preparing for the recovery by expanding our skills base |
| • | | Supporting new industries, along with our traditional strengths |
| • | | Developing new job creation programs. |
These four planks constitute a comprehensive strategy to maintain existing jobs, create new jobs, move unemployed people back into work and mitigate the growth of long-term unemployment and its associated social costs.
Major initiatives in the Government’s jobs agenda include:
| • | | The Queensland Green Army, which will provide 3,000 work placements and traineeships to unemployed Queenslanders over three years with a Government investment of $57 million. Green Army members will work throughout Queensland to enhance our natural assets, strengthen tourism infrastructure and promote increased environmental awareness. In 2009-10, it is expected that 700 people will begin Green Work Placements while 300 people will begin Green Traineeships. |
| • | | Establishing a specialised Liquefied Natural Gas (LNG) Industry Unit within the Department of Infrastructure and Planning to provide a single point of focus for the Government’s support and encouragement for the emerging LNG industry in Gladstone, which will be based on Queensland’s extensive coal seam gas reserves. An industry viability study commissioned by the Government estimates that an LNG industry has the potential to create more than 10,000 construction jobs and 3,500 direct operational jobs. |
| • | | Skilling Queenslanders for Work – a proven existing program for helping disadvantaged Queenslanders into work. The Queensland Government will invest $320.4 million over the next three years to assist an estimated 63,000 people to gain new skills and achieve sustained employment. |
| | | | |
50 | | Budget Strategy and Outlook 2009-10 | | |
Additionally, the Queensland Government is partnering with the Australian Government in the delivery of a raft of federal stimulus and investment initiatives, the largest of which is the Nation Building and Jobs Plan (Box 4.1).
|
Box 4.1 The Australian Government’s Nation Building and Jobs Plan |
The Queensland Government is vigorously pursuing its responsibilities under the National Partnership Agreement on the Nation Building and Jobs Plan, which the Australian Government expects will boost the national economy by 1/2% in 2008-09 and 3/4 to 1% in 2009-10. Under this Agreement, which came into force in February 2009, the Queensland Government is responsible for managing the delivery of Australian Government-funded economic stimulus programs in Queensland, and for the recurrent costs of new infrastructure funded under the Agreement. Additionally, the Queensland Government is maintaining its own spending effort in the relevant areas, ensuring that the full impact of the new funding flows through to the Queensland economy. The main elements of the Nation Building and Jobs Plan are: • the Social Housing Initiative, under which Queensland will receive almost $1.3 billion for the construction of around 4,000 new dwellings between 2009 and 2012, and for repairs and maintenance of existing social housing • the Primary Schools for the 21st Century (P21) initiative which is funding up to $3 million per school over 2008-09 to 2010-11 for major primary education infrastructure. Round One has delivered $650 million to 293 Queensland schools, while Round Two will deliver a further $1.25 billion to 702 schools • the National School Pride initiative, which is funding up to $200,000 per school over 2008-09 and 2009-10 for minor infrastructure and refurbishment projects. Round One has delivered funding of $195 million to 3,096 projects in schools across Queensland, while Round Two will deliver a further $42 million across 362 schools • the Science and Language Centres for the 21st Century initiative, under which secondary schools will compete for around $1 billion nationally to fund the construction or refurbishment of science laboratories and language learning centres, to be completed in 2009-10 • the Black Spots, Boom Gates, Repairing Regional Roads and Community Infrastructure program under which Queensland will share in $890 million nationally to boost capital works in these important areas. |
| | | | |
| | | Budget Strategy and Outlook 2009-10 | | 51 |
INVESTING IN INFRASTRUCTURE
The Queensland Government is committed to maintaining a substantial infrastructure investment program. This is the centrepiece of the Government’s jobs agenda and it also ensures that the Queensland economy is ready to recover strongly when world economic growth resumes.
For the General Government sector, capital spending in 2009-10 is estimated to be $9.27 billion, an increase of 29.9% on the 2008-09 figure, with the increase largely resulting from Queensland’s partnership with the Australian Government.
Chart 4.1
General Government purchases of non-financial assets, 1991-92 to 2009-10
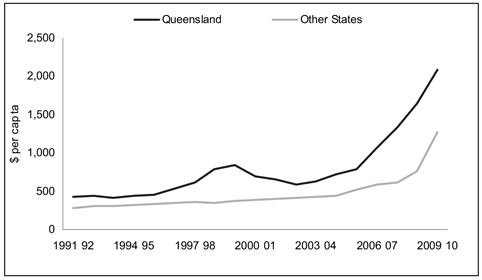
Source: Qld, Vic, SA, WA, Tas – State Budgets, NSW – Half Yearly Review, Australian Government Budget and Queensland Treasury estimates, population – ABS 3101.0 and Australian Government Budget Paper 3
In per capita terms, it is estimated that the Queensland Government’s capital spending in the General Government sector will be around 60% above the average of the other states, at $2,083 per person (Chart 4.1). Among the states, Queensland has the highest capital expenditure per person in 2009-10, 20.3% above next-highest Western Australia, which is also experiencing rapid growth in capital spending.
The State’s total capital outlays in 2009-10, including outlays by the Public Non-financial Corporations sector and capital grants, are expected to be $18.2 billion.
| | | | |
52 | | Budget Strategy and Outlook 2009-10 | | |
Major Queensland Government infrastructure initiatives for 2009-10 include:
| • | | upgrading the Queensland Rail coal network – $862 million in 2009-10 – to support the haulage of coal in central Queensland, including extensive track works and upgrading of locomotives and wagons |
| • | | continuation of works on the Abbot Point Coal Terminal X25 Expansion ($17 million in 2009-10) and X50 Expansion ($287.9 million in 2009-10) |
| • | | the SEQ Public Private Partnership Schools project, a $1.1 billion contract to build seven new schools in the rapidly-growing Sunshine Coast, Western Corridor, Gold Coast and Redland regions – $80.1 million is allocated in 2009-10 to commence construction of two schools at Thornlands and Peregian |
| • | | continuing the Gateway Upgrade Project with a further $259.2 million in 2009-10 ($1.883 billion overall) – the Project is duplicating the Gateway Bridge, refurbishing the existing bridge, and upgrading the Gateway Motorway, with improvements to be introduced progressively to 2012 |
| • | | continuing construction of the $9 billion SEQ Water Grid, including $120 million in 2009-10 for the Hinze Dam Stage 3 Project, expected to be completed in December 2010, which will increase the capacity, safety and flood mitigation ability of the Dam |
| • | | planning and development of three new tertiary hospitals – the Gold Coast University Hospital, the Sunshine Coast University Hospital, and the Queensland Children’s Hospital – will continue, with $268.4 million allocated in 2009-10 ($4.616 billion overall). |
Further, the Australian Government’s 2009-10 Budget is providing significant funding from the Nation Building Program (formerly Auslink) and the Nation Building for the Future Program for new road and rail infrastructure in Queensland, including:
| • | | the Bruce Highway Cooroy to Curra (Section B) Duplication ($488 million, and a further $125 million from the Queensland Government), which will convert this section of the Highway to four lanes, is expected to start in 2009 and is scheduled for completion in 2012 |
| • | | the Gold Coast Rapid Transit System project ($365 million, and a further $463.7 million from the Queensland Government and $120.0 million from the Gold Coast City Council), which will provide light rail transport on the Gold Coast, is expected to commence its main construction phase in 2011, to be completed by 2013 |
| | | | |
| | | Budget Strategy and Outlook 2009-10 | | 53 |
| • | | new funds for upgrading the Ipswich Motorway: $484 million in 2008-09 and $400 million in 2013-14 towards construction works on the Dinmore-Goodna and Wacol-Darra sections and planning for the Darra-Rocklea section. This is in addition to previously-committed Nation Building funding for the Ipswich Motorway, including $650 million in 2009-10 |
| • | | the Brisbane Inner City Rail Feasibility Study: $20 million to undertake a feasibility study to determine potential route alignment, construction timetables and preferred funding model. |
Further details of the State’s capital program are provided in Budget Paper 3 – Capital Statement.
Additionally, as discussed in Chapter 5, the Government has decided to open up some parts of its asset base to the private sector, under its Renewing Queensland Plan. This will allow better targeting of scarce resources to core Government investment priorities such as roads, schools, and hospitals, while at the same time facilitating significant private sector capacity-building and the commercial development of the assets concerned.
INVESTING IN SKILLS AND INNOVATION FOR THE FUTURE
Whilst the global recession is creating substantial short-term fiscal and economic issues, the Queensland Government remains committed to the long view in the ongoing task of upskilling the Queensland workforce. It is through increasing the skill base that Queensland will secure the productivity and participation outcomes necessary for economic recovery and sustained prosperity.
Productivity and innovation
In the long run, the wellbeing of Queenslanders is critically dependent on productivity growth. Productivity growth means creating more value from a given quantity of inputs. The productivity dividend can accrue as higher material living standards, increases in international competitiveness, improvements in the environmental sustainability of industry, and increases in the capacity of government and society to generate better social outcomes.
The most common measure of productivity is labour productivity, or real output per hour worked. Queensland’s labour productivity growth over the decade to 2007-08 (1.6% per annum) was superior to that of the rest of Australia (1.4% per annum), indicating that the State’s robust employment growth over that period was more than matched by strong capital investment and improvements in technical efficiency (Chart 4.2).
| | | | |
54 | | Budget Strategy and Outlook 2009-10 | | |
Chart 4.2
Employed labour, labour productivity and real output, 1997-98 to 2007-08
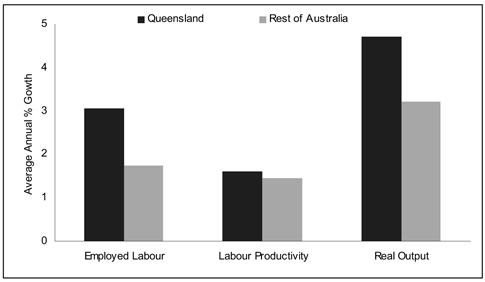
Source: Queensland State Accounts, ABS 6202.0 and Queensland Treasury estimates.
In the near term, labour productivity growth will gain in importance due to the negative impact of the global recession on labour market outcomes in 2008-09 and 2009-10.
The generation of productivity improvements relies on the successful deployment of new knowledge by skilled people, or innovation. The Queensland Government has consistently championed innovation via its Smart State Strategy. Now in its third stage, the Smart State Strategy seeks to capitalise on the State’s earlier Smart State investments by attracting, retaining, and developing more world-class researchers, clinicians and other experts in key priority areas such as health and medical research.
Further, the Government remains committed to driving innovation by supporting the development of new knowledge-intensive industries and by encouraging an innovative culture in Queensland’s traditional industries. In Toward Q2: Tomorrow’s Queensland, the Government has set a target for 2020 of increasing by 50% the proportion of Queensland businesses that undertake research and development or innovation.
Key Government initiatives in 2009-10 that are moving the State towards this goal include:
| • | | implementing the first stage of the Queensland Design Integration Program to increase the sustainability and competitiveness of Queensland businesses through the use of design |
| • | | delivering key biotechnology initiatives including the Biopharmaceuticals Australia scale-up manufacturing facility, the Biotech Commercialisation Pipeline, and the Queensland Clinical Trials Network |
| | | | |
| | | Budget Strategy and Outlook 2009-10 | | 55 |
| • | | delivering the HEAT initiative, which is promoting and developing the export potential of Queensland’s architectural services sector |
| • | | implementing the $20 million Q-Tropics Strategy to develop, commercialise and export Queensland’s tropical products and expertise. |
Labour force participation
For over a decade, Queensland’s participation rate and employment rate have been higher than those for the rest of Australia (Chart 4.3). In 2006-07 and 2007-08, Queensland’s employment rate was approximately the same as the participation rate in the rest of Australia – in other words, Queensland had proportionately more people in work than the rest of Australia had either in work or looking for work.
The impact of the global recession on labour force participation is highly uncertain. Data for the five months to May 2009 show the Queensland participation rate averaging an historically-high 67.7% in seasonally adjusted terms, driven mainly by increasing mature age participation. In normal circumstances, this boost to the State’s economic capacity would be regarded positively, however in the current downturn it also signifies a greater challenge for the Government in mitigating the rise in unemployment. In the medium term, it is expected that reduced job prospects will be a dampening influence on participation.
Chart 4.3
Labour force participation rate1 and employment rate2, 1987-88 to 2007-08
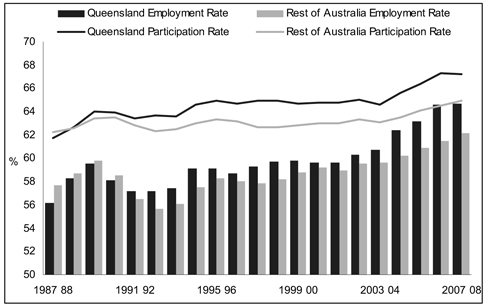
Notes:
| 1. | Labour force as a percentage of civilian population aged 15 and over. |
| 2. | Employment as a percentage of civilian population aged 15 and over. |
Source: ABS 6202.0, Queensland Treasury estimates
| | | | |
56 | | Budget Strategy and Outlook 2009-10 | | |
Existing skills programs such as the Queensland Skills Plan and Skilling Queenslanders for Work have ensured that Queensland is already on the front foot. The Government is now substantially augmenting its skills agenda with a raft of new initiatives in training and schooling, and by leveraging Australian Government assistance in these areas.
These new initiatives include:
| • | | the National Partnership Agreement on Productivity Places Program, which will provide more than 148,000 additional training places, with around 102,000 aimed at up-skilling those who are in the labour force and around 46,000 for job seekers, including new entrants to the labour market . |
| • | | the $15 million Payroll Tax Apprentice and Trainee Incentive – in addition to the existing payroll tax exemption provided for apprentice and trainee wages, Queensland businesses will also receive a 25% rebate on payroll tax for on the wages of each apprentice and trainee employed. This rebate will be offset against the tax payable on the wages of other employees. As well as directly supporting jobs, the Incentive will assist businesses to continue investing in their future workforce, in readiness for the recovery. At the same time, the Government is committed to maintaining the number of apprentices and trainees employed in the public sector |
| • | | the Masters Review of primary schooling, which reported on 1 May 2009. The Government will respond to the Review’s final report following a process of consultation and consideration of community submissions on the report . |
| • | | a range of additional COAG National Partnership agreements where the Queensland Government will work with the Australian Government in relation to quality teaching, low socio-economic status schools, literacy and numeracy and early childhood education. |
RESPONDING TO CLIMATE CHANGE
Scientific modelling shows that Queensland is particularly vulnerable to the physical impacts of climate change, particularly in the sensitive wet tropics and in the highly populated South East of the State.
The Queensland Government has recently completed a public review of ClimateSmart 2050, incorporating major changes in climate change science and policy commitments at a national and international level. The revised Climate Change Strategy, which will be released later this year, will include a range of new initiatives consistent with COAG principles for complementary measures. These include support for disaster management initiatives totalling $15.6 million over five years; $15 million for the ClimateSmart Business Service to be delivered over four years; extending the Rural Water Use Efficiency initiative with $4.5 million over four years; and $8 million over four years for the Energy Efficiency Retrofit program. The revised Queensland Climate Change Strategy will ensure Queensland remains at the forefront of the climate change response.
| | | | |
| | | Budget Strategy and Outlook 2009-10 | | 57 |
In 2009-10, funding will also continue for the ClimateSmart Home Service to improve household energy efficiency, along with $3 million over two years for the Household Carbon Reduction Program.
In Toward Q2: Tomorrow’s Queensland, the Government has set a target of cutting Queensland’s carbon footprint by a third by 2020. The main contributors to achieving this goal will be the Australian Government’s Carbon Pollution Reduction Scheme (CPRS), along with a set of substantial Queensland Government measures to facilitate and accelerate emissions abatement.
Carbon Pollution Reduction Scheme
The Queensland Government strongly supports most elements of the Carbon Pollution Reduction Scheme (CPRS), as a key platform to reduce Australia’s carbon emissions in the longer term.
Australian Treasury modelling indicates that for Australia overall, economic costs associated with implementation of the CPRS are likely to be modest but that Queensland faces disproportionate costs because of the State’s heavy reliance on coal-fired electricity, emissions-intensive industries including mining and refining, agriculture and manufacturing, and the dispersion of our population, which creates a relatively high reliance on transport. Modelling undertaken for all states and territories also shows that Queensland’s regions will be among the more heavily impacted areas compared with a business-as-usual scenario.
The Government broadly supports the reviewed design of the CPRS announced by the Australian Government in May 2009, including delaying implementation until 2011, linking emissions targets to international action and increasing assistance to energy- and emissions-intensive trade-exposed (EITE) industries to reflect the more immediate impacts of the global recession.
The Government also strongly supports the Australian Government’s intention to provide direct cash assistance to low and middle income households to meet the higher cost of living resulting from the CPRS.
The current formula for the Electricity Sector Adjustment Scheme indicates that Queensland black coal electricity generators will receive only $100 million in Australian Government assistance out of a total $3.5 billion. This compares with $2.45 billion of assistance likely to be provided to Victoria’s brown coal generators, which are considerably more carbon emissions-intensive than Queensland’s black coal generators. The Government is opposed to this disproportionate outcome and believes that it sends a perverse message about the environmental outcomes the CPRS is designed to achieve.
| | | | |
58 | | Budget Strategy and Outlook 2009-10 | | |
Clean energy
The Queensland Government is driving the uptake of energy efficiency measures and the development and deployment of renewable energy technology throughout Queensland. The increased use of renewable energy in Queensland is an important contribution to achieving the expanded Renewable Energy Target of 20% of Australia’s electricity capacity from renewable sources by 2020.
Key initiatives include the following:
| • | | the Queensland Solar Hot Water Program, beginning in 2009-10, will provide for up to 200,000 affordable solar hot water or heat pump systems to be installed over the next three years. The Program will offer fully installed, greenhouse-efficient hot water systems for $100 to eligible Queensland pensioners and low income earners, and $500 to all eligible Queensland homeowners. This Program will help Queenslanders save money and reduce greenhouse gas emissions |
| • | | the Government is continuing the investment of $15 million over five years (commenced in 2008-09) in the Geothermal Centre of Excellence, in partnership with the University of Queensland. The centre will be the biggest of its type in Australia and, through research and development, will make Queensland and Australia leading technology providers in the growing geothermal energy sector |
| • | | Australia’s only operating geothermal power station in Birdsville, western Queensland, provides approximately one quarter of the town’s energy supply, reducing diesel consumption by about 160,000 litres per year, and reducing greenhouse gas emissions by 430 tonnes. Through the Queensland Renewable Energy Fund, the Government will provide $4.3 million to Ergon Energy for a new geothermal power station (total cost $9 million) to replace the existing plant which is reaching the end of its design life |
| • | | the Queensland Government is working to secure cutting edge renewable energy solutions for Queensland and has committed $7 million towards the development of a 10MW solar thermal power station at Cloncurry. The project will trial new technology that stores renewable energy. Cloncurry is set to become the first town in Queensland to produce solar thermal power capable of supplying all of the town’s electricity needs, 24 hours a day. This project will investigate whether this technology can be replicated in other rural and remote areas of Queensland |
| | | | |
| | | Budget Strategy and Outlook 2009-10 | | 59 |
| • | | a $900 million joint investment with the State’s black coal mining industry for the accelerated development and deployment of low-emissions coal technologies in Queensland. This commitment comprises the Queensland Government’s Clean Coal Fund of $300 million and the voluntary contributions to be made by the Queensland black coal mining industry of $600 million over ten years. Projects currently being investigated include the ZeroGen project (an Integrated Gasification and Combined Cycle plant with Carbon Capture and Storage), the Callide Oxyfuel project (utilising Oxy-firing Technology) and the Tarong Energy PCC project (demonstrating post combustion using CO2 absorption solutions) |
| • | | the Government will provide funding totalling $47.7 million to ENERGEX and Ergon Energy to initiate a range of demand management and energy conservation measures in Queensland. Implementing these measures is expected to significantly reduce both greenhouse gas emissions and peak demand for electricity |
| • | | the Government will continue to support the development of renewable and low emissions technologies, and through the Queensland Renewable Energy Fund will fund key renewable energy initiatives including: |
| | • | | $9 million to Mackay Sugar Co-operative Association Ltd for the Mackay Sugar Cogeneration Project. This 36MW cogeneration project will replace the old, inefficient plant and streamline storage practices at all of its mills; |
| | • | | $7.5 million to the Commonwealth Scientific and Industrial Research Organisation for SolarGas One, the world’s first multi-tower array system using SolarGas technology (subject to a significant financial commitment from an industry partner); and |
| | • | | $5 million for the Coastal Geothermal Energy Initiative to identify possible sources of hot rocks for geothermal energy close to existing electricity transmission lines. |
| • | | the Government is also providing $5 million for Ergon Energy to trial an energy conservation program in Queensland’s isolated communities. This program will investigate ways to reduce the cost of supplying energy to these communities as well as reduce greenhouse gas emissions and electricity bills. |
| | | | |
60 | | Budget Strategy and Outlook 2009-10 | | |
THE SMART REGULATION REFORM AGENDA
Increasing the momentum on regulatory reform is an important focus of the Queensland Government. This is now occurring on two main fronts: reducing barriers to trade and commerce between Queensland and the rest of Australia; and reducing the regulatory burden on the Queensland business sector.
In December 2008, the Queensland Government, along with other Australian jurisdictions, committed to a National Partnership Agreement to Deliver a Seamless National Economy. Under this agreement, Queensland is implementing regulatory and competition reforms in 36 key areas to improve the efficiency and inter-jurisdictional harmonisation of the regulatory environment. Harmonisation of these regulations across Australian jurisdictions will contribute to reducing costs incurred by business in complying with differing and inconsistent regulation across jurisdictions.
Key initiatives in the Seamless National Economy agenda are:
| • | | establishing uniform national occupational health and safety laws – a new national entity, Safe Work Australia, has been established by the Australian Government and will now commence developing model legislation, with implementation scheduled for late 2011 |
| • | | establishing a national licensing system to allow specified tradespeople to work seamlessly across state borders – an intergovernmental agreement was signed at COAG on 30 April 2009. Development of legislation will proceed through 2009-10, working towards full implementation on 1 July 2012 |
| • | | implementing a national Standard Business Reporting framework to eliminate duplication in business-to-government reporting – a single online facility for reporting to state and federal agencies will commence on 1 July 2010 |
| • | | developing a new Australian Consumer Law to provide consistent consumer protection and enforcement of breaches, and to provide business with a single national law with which to comply, thereby reducing the compliance burden |
| • | | delivering a new national construction code, which will set nationally consistent standards for building and plumbing collectively. |
In addition to this national reform agenda, the Government is implementing an innovative five-point action plan under the Queensland Smart Regulation Reform Agenda. A key action under the reform agenda is to reduce the stock of regulation through a phased program of reviews by agencies of their existing regulation. Other actions include initiatives focussed at improving the quality of new regulation and improving the business government interface.
| | | | |
| | | Budget Strategy and Outlook 2009-10 | | 61 |
These initiatives aim to reduce unnecessary regulatory compliance burdens and improve the effectiveness and efficiency of regulations to deliver productivity benefits and real measurable savings to Queensland business, community and government.
As part of this overall regulatory improvement agenda, the Government has committed to an initial target of reducing the regulatory compliance burden to business and the administrative burden to government by $150 million each year by the end of 2012-13.
| | | | |
62 | | Budget Strategy and Outlook 2009-10 | | |
| 5 | PUBLIC NON-FINANCIAL CORPORATIONS SECTOR |
FEATURES
| • | | On 2 June 2009, the Government announced its intention to dispose of some of its asset portfolio, comprising Forestry Plantations Queensland, Queensland Motorways Limited, Port of Brisbane Corporation, Abbot Point Coal Terminal and QR Limited’s above and below rail coal business. |
| • | | The Government will continue to actively manage its shareholding in Public Non-financial Corporations with the aim of maximising value to the community. |
| • | | The Government’s return from its ownership of businesses in the Public Non-financial Corporation sector is represented by net flows to Government. In 2009-10, there is an estimated inflow of $1.119 billion, comprising dividends of $872 million and current tax equivalent payments of $247 million. |
| • | | Community service obligation payments of $1.569 billion will be paid to the sector in 2009-10, largely for public transport and electricity subsidies. |
| • | | In 2009-10, the Government-owned corporations are expected to have a rate of return of 4.7%, increasing to 6.6% by 2012-13 due mainly to an increase in dividends from the transport Government-owned corporations. |
| • | | QR Limited is continuing to implement the reforms announced as part of the 2008-09 Budget, including changes to the Regional Freight and Livestock businesses to ensure they can reach a position of recovering costs to achieve long term sustainability. |
| • | | Following the review of the structure of the Queensland port network, the Government has approved the implementation of a five port authority framework. The new framework comprises Far North Queensland Ports Corporation, Port of Townsville Limited, North Queensland Bulk Ports Corporation, Gladstone Ports Corporation and Port of Brisbane Corporation. |
With the impacts of the global financial crisis being felt around the world, the Government remains committed to the delivery of essential infrastructure and continued economic growth. In that context, and bearing in mind the capacity of the State’s balance sheet to continue to meet growing and competing demands for services and infrastructure, the Government has announced in the Renewing Queensland Plan that it will pursue a significant program of asset sales, including several Government-owned corporations (GOCs), over the next three to five years. In selling the proposed assets, the State is looking to generate proceeds of approximately $15 billion over the period of the disposal program. In the intervening period until sold, all business will continue to invest and operate as normal.
| | | | |
| | | Budget Strategy and Outlook 2009-10 | | 63 |
In the Public Non-financial Corporations (PNFC) sector, the Government will continue to invest in key infrastructure during 2009-10 and the forward years to ensure the ongoing delivery of energy, transport and water services to a growing population.
Key infrastructure projects in 2009-10 include:
| • | | QR Limited (QR) will spend $515 million to upgrade infrastructure and rollingstock on the Citytrain network and $862 million on a range of purchases and upgrades to support the haulage of coal in Central Queensland |
| • | | Ports Corporation of Queensland Limited (PCQ) has allocated $349.8 million for port expansion and development including at Abbot Point, Louisa Creek, Mourilyan and Thursday Island to improve capacity and meet market growth |
| • | | Port of Brisbane Corporation (PBC) is investing $536.5 million over five years for new wharves 11 and 12 and establishing associated land works at Fisherman Islands |
| • | | Queensland Motorways Limited’s (QML) project to introduce free-flow tolling on the Logan Motorway and existing Gateway Bridge will be implemented in July 2009, with expenditure of $43.6 million in 2009-10 |
| • | | Powerlink Queensland (Powerlink) will invest $610.4 million in transmission infrastructure and augmentation, while ENERGEX and Ergon will invest a total of $2 billion in distribution infrastructure and augmentation |
| • | | Projects arising from the Government’s reform of the water supply industry in South East Queensland, including the continued construction of the $9 billion South East Queensland Water Grid. |
QR is working with coal company customers to revise the scope of the Goonyella to Abbot Point expansion (GAPE) project, which will provide mines in the Goonyella system with access to the expanding Abbot Point Coal Terminal (APCT). This review has successfully re-scoped the project in order for it to better meet customer capacity and cost expectations. To process the increase in coal from the GAPE, PCQ is expanding APCT to 50 million tonnes per annum by 2011. However, this project is dependent upon coal companies committing to the GAPE project, which includes the Northern Missing Link.
The Government will continue to actively monitor its investment in the PNFC sector to ensure it delivers maximum value for the benefit of Queensland taxpayers, while providing quality services to the community and customers.
| | | | |
64 | | Budget Strategy and Outlook 2009-10 | | |
NET FLOWS TO GOVERNMENT
The PNFC sector comprises 14 GOCs (QIC Limited is not part of the PNFC sector as it is a Public Financial Corporation) and other entities, including the State water entities, Forestry Plantations Queensland (FPQ) and QML.
Government’s return from its ownership of PNFC sector entities is represented by the flows to Government for the financial year. These are the dividends and current tax equivalent payments (TEPs) received from PNFC sector entities. Consistent with Government Finance Statistics requirements, only current TEPs are used to calculate net flows.
In situations when the Government seeks to have a commercial business deliver a particular non-commercial product or service to the community, the Government provides a community service obligation payment (CSO) to the business.
Dividends from the PNFC sector are a function of net profit after tax and the dividend payout ratio, which is determined by shareholding Ministers after considering the circumstances of each individual entity and the advice of the boards. The dividend payout ratios recommended by the boards do not impact on the capacity and requirement of GOCs to carry out necessary maintenance, repairs and asset replacement, as dividends are paid after providing for such costs. Total dividends to be paid to Government in 2009-10 are estimated at $872 million.
Table 5.1
Dividends1
| | | | | | |
| | | 2007-08
Actual
$ million | | 2008-09
Est. Act.
$ million | | 2009-10
Budget
$ million |
Energy Sector | | 604 | | 531 | | 493 |
Transport Sector (rail and ports)2 | | 284 | | 300 | | 342 |
Other | | 6 | | 6 | | 37 |
Non-GOC | | 113 | | 7 | | — |
Total PNFC sector dividends | | 1,006 | | 845 | | 872 |
Notes:
| 1. | Numbers may not add due to rounding. |
| 2. | Transport sector increase is due to anticipated better earnings by QR Limited in 2009 10 relative to 2008 09 which was impacted by the economic downturn. |
PNFC sector entities pay TEPs in lieu of the taxes they would have to pay if they were not Government-owned, with TEPs calculated as 30 per cent of earnings before tax. Total current TEPs to be paid to Government in 2009-10 are estimated at $247 million.
| | | | |
| | | Budget Strategy and Outlook 2009-10 | | 65 |
Table 5.2
Current Tax Equivalent Payments1
| | | | | | |
| | | 2007-08
Actual
$ million | | 2008-09
Est. Act.
$ million | | 2009-10
Budget
$ million |
Energy Sector | | 137 | | 169 | | 141 |
Transport Sector (rail and ports)2 | | 58 | | 29 | | 81 |
Other | | 7 | | 27 | | 22 |
Non-GOC | | 4 | | 2 | | 2 |
Total PNFC sector current TEPs | | 207 | | 228 | | 247 |
Notes:
| 1. | Numbers may not add due to rounding |
| 2. | Transport sector increase relates to a combination of QR Limited’s improving financial position and reduced deferred income tax equivalents. |
In 2009-10, it is estimated that the Government will pay CSOs of $1.569 billion.
Table 5.3
Community Service Obligation payments1
| | | | | | |
| | | 2007-08
Actual
$ million | | 2008-09
Est. Act.
$ million | | 2009-10
Budget
$ million |
Energy Sector | | 619 | | 500 | | 333 |
Transport Sector (rail and ports) | | 1,004 | | 1,143 | | 1,220 |
Other | | 11 | | 3 | | 7 |
Non-GOC | | — | | 9 | | 8 |
Total PNFC sector CSOs | | 1,634 | | 1,654 | | 1,569 |
Notes:
| 1. | Numbers may not add due to rounding |
| 2. | The Energy sector CSO provided by Government to allow for a maximum uniform electricity tariff across Queensland is budgeted to reduce in 2009-10 as the cost disparity to supply electricity in regional areas, driven |
by greater network costs and higher loss factors, is reduced.
| 3. | Transport sector increase is due to forecast passenger train services cost increases and regulated below rail cost increases. |
| | | | |
66 | | Budget Strategy and Outlook 2009-10 | | |
ASSET SALES PROGRAM
The Government announced plans on 2 June 2009 to dispose of some of its asset portfolio including:
| • | | Queensland Motorways Limited |
| • | | Port of Brisbane Corporation Limited |
| • | | Forestry Plantations Queensland |
| • | | Abbott Point Coal Terminal |
| • | | QR Limited’s above and below rail coal business plus options to sell QR’s bulk freight, intermodal, retail and regional freight services. |
In selling the portfolio of assets proposed, the Government is looking to generate proceeds of approximately $15 billion over a three to five year asset disposal program. As well as generating these sale proceeds which will be used to retire debt, the Government will also avoid the necessity to spend as much as $12 billion in future capital expenditure that these businesses require over the next five years. While Government will have to outlay some of this additional capital expenditure up until sale, it should be fully recovered through additional sale proceeds.
In the intervening period until sold, all businesses will continue to operate as usual and customers should continue to negotiate new contracts with the businesses announced for sale. Further details on the activities of each business are in the relevant section below.
QR coal and freight businesses
The State will look to structure the coal infrastructure sale packages in a way which provides an opportunity for the efficiency of the rail-to-port network to be maximised. For instance, some sections of QR’s below rail coal network could be packaged together with PCQ’s Abbot Point Coal Terminal. Such a structure would ensure the objectives of the port and rail infrastructure providers are better aligned in relation to the important Newlands and Goonyella networks.
The coal infrastructure sales package will include the sale of QR’s above and below rail coal businesses. Opportunities to package all or parts of QR’s bulk, intermodal, retail and regional freight services are to also be investigated. QR’s passenger services business, above and below rail, will not be sold.
Abbot Point Coal Terminal
Abbot Point Coal Terminal, located north of Bowen, is Australia’s most northerly coal port. Together with rail handling and coal stockpiling areas, it comprises a shiploader facility located 2.75 kilometres offshore. Coal is supplied to Abbot Point by rail, primarily from the Newlands, Collinsville and Sonoma mines.
| | | | |
| | | Budget Strategy and Outlook 2009-10 | | 67 |
Together, the QR and Abbot Point Coal Terminal transactions are expected to facilitate increased investment by the private sector in the maintenance and expansion of this infrastructure in the future. This transaction is also expected to align rail and port ownership to assist in overcoming infrastructure development bottlenecks associated with rail and port owners historically having different views on the scope and timing of new works.
Port of Brisbane Corporation
PBC is primarily responsible for the landlord functions at the Port of Brisbane and the Port of Bundaberg, and also has a major property development function for the development of strategic port land.
The sale of the Port of Brisbane will facilitate future investment and development of export facilities. It will also avoid the need for Government investment in the future capital expansion required at the Port totalling nearly $500 million over the next five years.
The Port of Bundaberg will not be sold as part of the sale process but will be transferred to the Gladstone Ports Corporation ahead of the sale of PBC.
Queensland Motorways Limited
QML has a franchise agreement with the Government to operate and maintain the Logan Motorway, Gateway Bridge and Gateway Motorway between Nudgee Road and Mt Gravatt-Capalaba Road, and the Gateway Extension Motorway (collectively the Gateway Franchise). QML currently operates five toll plazas at the Gateway Bridge, Kuraby, Stapylton Road, Loganlea and Paradise Road interchange, with the introduction of free-flow tolling expected to occur from 1 July 2009. QML also maintains a significant section of the Port of Brisbane Motorway.
The sale of QML will also incorporate a major upgrade of the Port of Brisbane Motorway.
In conjunction with the sale of PBC, the sale of QML’s assets is expected to facilitate further development expansion of the Port of Brisbane and its surrounding infrastructure.
| | | | |
68 | | Budget Strategy and Outlook 2009-10 | | |
Forestry Plantations Queensland
The sale of FPQ will focus initially on FPQ’s softwoods business. FPQ was created on 1 May 2006 as part of significant commercial reform of State owned forestry plantation management in Queensland.
FPQ currently manages:
| • | | exotic pine plantations at Beerburrum, Passchendaele (near Stanthorpe), Pechey (near Crows Nest), Toolara (near Gympie), Tuan (near Maryborough), Byfield (near Yeppoon), Ingham, Cardwell, Atherton and Cathu (near Proserpine) |
| • | | hoop pine plantations at Imbil, Brooyar (near Kilkivan), Jimna and Gallangowan, Yarraman, Kalpower (near Monto), Palen Creek and Atherton |
| • | | hardwood plantations around Kingaroy, Wondai, Gayndah, Mundubbera, and on the coastal plan between Beerburrum and Gympie. |
Further investigations and specialist advice will determine whether the sale will also include FPQ’s hardwood plantations.
CAPITAL STRUCTURE REVIEW
The Government, through the Queensland Treasury Corporation (QTC), has assessed the capital structure of each GOC with the objective of ensuring that all GOCs maintain a private rating of investment grade (BBB- or above), recognising the need for equity injections for some GOCs over the forward estimate period. It also identified potential for equity repatriation from some other GOCs whose balance sheets had become indicative of an inefficient capital structure.
The Government has approved the following equity injections and repatriations for 2009-10:
| • | | $60 million equity injection to SunWater Limited (SunWater) |
| • | | $50 million equity injection to the Ports Corporation of Queensland |
| • | | $380 million equity repatriation from Stanwell |
| • | | $90 million equity repatriation from Gladstone Ports Corporation. |
In addition, QR is to receive an equity injection of $390 million, as part of the ongoing funding of the South East Queensland Infrastructure Plan and Program (SEQIPP) and Cairns Ports Limited (CPL) is to receive an equity injection of $11 million to design and construct a Cruise Terminal Facility at the existing heritage cargo sheds.
The surplus equity repatriations in 2009-10 will be used in following years to fund equity injections and/or capital investment by GOCs in approved major investment projects.
The Government will continue to review GOCs’ capital structures each year in the Budget context, and may elect to make further equity adjustments reflecting changing circumstances as a result of approval of major investment projects or changes in demand or financial outlook.
| | | | |
| | | Budget Strategy and Outlook 2009-10 | | 69 |
IMPLEMENTATION OF GOC REFORMS
As part of the 2008-09 Mid-year Fiscal and Economic Review, the Government announced a range of reforms to the GOC sector. In 2009-10, the Government will continue to work with the 15 GOCs (including QIC) and FPQ to improve their efficiency, effectiveness and accountability. The aim has been to provide the GOCs with appropriate organisational structures and incentive frameworks to allow the GOCs to operate at their full commercial potential providing returns akin to those expected by investors in private sector companies.
Operational efficiencies and savings targets
The Government is working with the GOCs to progressively increase their contributions to General Government revenue through dividends and tax equivalent payments to achieve an additional $100 million per annum by 2011-12. The 15 GOCs and FPQ have identified, and will continue to work towards identifying, operational efficiencies and productivity measures that will enhance financial performance without detracting from the quality and reliability of customer services.
Rate of return targets and investment hurdle rates
In addition, the GOCs have undertaken reviews of their weighted average cost of capital to accommodate the current financial and economic environment, and are looking to increase their minimum hurdle rates of return used in the assessment of new investments, consistent with the re-pricing of risk in financial markets.
The Government’s return from its ownership of GOCs includes dividends, expected to total $872 million in 2009-10. This represents an estimated rate of return of 4.7%. As a result of Government reforms, this is expected to increase to 6.6% by 2012-13, due mainly to an increase in dividends from the transport Government-owned corporations. The anticipated increase in the expected rate of return (dividends/equity) from GOCs over the forward estimates period is reflected in Chart 5.1.
| | | | |
70 | | Budget Strategy and Outlook 2009-10 | | |
Chart 5.1
Rate of Return1,2
based on dividends / average total equity, annual from 2000-01 to 2012-13
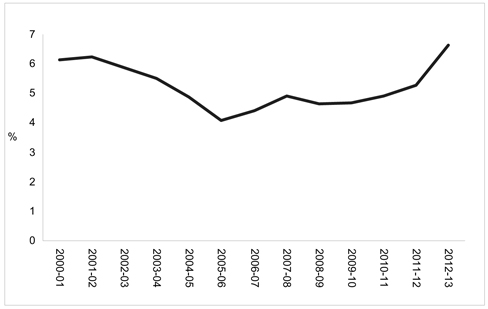
Notes:
| 1. | Calculated as (ordinary dividends / average total equity) |
| 2. | Excludes dividends associated with asset sales and special dividends |
Capital expenditure reviews
Each GOC has reviewed its capital expenditure plan to identify opportunities for optimising capital investments in light of more subdued economic activity, while ensuring the continued delivery of essential infrastructure, with the outcomes reflected in the capital expenditure forward estimates in this Budget. GOCs will continue to actively monitor their plans and more adjustments in future Budgets can be expected.
Surplus and non-core assets
All GOCs are reviewing their asset holdings to identify surplus, non-performing and non-core assets. These assets will be assessed for their potential to be more effectively managed or rationalised. Among the larger assets identified as surplus to requirements are the Glen Wilga and Haystack Road coal resources held by Tarong Energy Corporation (Tarong). Their future retention will be actively considered by the Tarong Board and Government during 2009-10. ENERGEX has also completed a review of all non-regulated businesses, commencing a process of divesting those identified as non-core. In 2008-09, ENERGEX sold ENERGEX New Zealand. During 2009-10, ENERGEX will continue this process with a number of smaller businesses and assets earmarked for sale.
This surplus GOC asset process will proceed separate to the larger asset sales program, with individual smaller assets no longer required being disposed of by the GOCs.
| | | | |
| | | Budget Strategy and Outlook 2009-10 | | 71 |
TRANSPORT SECTOR
The Government remains committed to the delivery of essential infrastructure and continued economic growth. In 2009-10, Queensland’s transport GOCs will undertake significant investments worth $2.8 billion in port and rail infrastructure to ensure the State can take advantage of the economic recovery and respond to the expected return of demand for Queensland resources. Consistent with the broader GOC reform process outlined above, the Government in collaboration with the transport GOCs is also pursuing structural and other major reforms at an individual entity level. These measures and investments will contribute to greater efficiency in Queensland’s export supply chains.
QR Limited
QR reform process
QR is implementing a significant transformation agenda to ensure it continues to grow as a leading national transport and logistics company. QR’s strategy incorporates improved safety, including the Zero Harm Strategy, customer service, commercial capability and business growth. QR is expanding its business nationally and has successfully restructured the business into separate accountable business lines for its Passenger and Network operations. The reinvigoration of QR’s leadership team and the development of a new business strategy to improve performance and provide sustainable growth with appropriate financial returns underpin QR’s transformation agenda. QR is responding to the global financial crisis by delivering improved capital productivity across its extensive capital program, maximising returns on capital through stronger capital management and by maximising supply-chain capacity.
QR’s coal business is implementing a comprehensive business improvement program to improve its overall operational performance to the satisfaction of its customers. This process includes reform to its approach to the market through continuous strategies, such as contract rate re-negotiations, improving QR’s customer service model, cost efficiency programs and renegotiation of previously uncommercial terms.
To ensure QR’s Regional Freight business model operates more commercially and turns around ongoing financial losses, QR has developed a reform program which will provide an equivalent or better service to customers in regional communities. The Regional Freight reforms will be implemented by QR in the context of continued employment growth within the wider QR Group, and with a view to its possible inclusion in a sale of above rail freight operations in the next three to five years, as announced by the Government on 2 June 2009.
| | | | |
72 | | Budget Strategy and Outlook 2009-10 | | |
QR’s regional freight services are under growing pressure from competition as these services no longer meet community needs, with, for example, QR’s rail services taking five days to move a parcel between Brisbane and Mount Isa compared to less than two days by road. QR’s Regional Freight and livestock businesses are undergoing reform to more effectively meet the needs of Queensland’s regional communities and to turn around ongoing financial losses.
Key rail infrastructure
QR is rolling out a $2.1 billion capital program in 2009-10 to increase the capacity of its coal and passenger networks by acquiring new rollingstock and upgrading infrastructure. QR expects demand growth to resume in all sectors it operates in over the forward estimate period, although it is likely to be at a slower pace than previously predicted for some of its businesses. While there is uncertainty around the strength of demand for the export of metallurgical coal and thermal coal in 2009-10, QR expects an increase in demand for these core export commodities to re-emerge as well as increased demand to continue for general freight, bulk commodities and passenger services.
QR’s capital improvement program to secure future growth prospects for Queensland’s coal industry includes expenditure of $862 million for locomotive acquisitions and overhauls, Jilalan Yard upgrade, Vermont Spur and a new wagons’ program.
QR will spend $515 million in 2009-10 to upgrade infrastructure and rollingstock on the Citytrain network as part of SEQIPP. SEQIPP projects include construction of the Springfield line and the Corinda to Darra third track, the Caboolture to Beerburrum duplication and completion of the Robina to Varsity Lakes line.
Northern Missing Link/Newlands Line
QR and coal companies are currently revising the scope and costings for the GAPE project which includes the Northern Missing Link (NML), a 69 kilometre rail link between the North Goonyella and Newlands rail systems in the Bowen Basin. The GAPE project will provide mines in the Goonyella system with access to APCT. With participation from industry QR is identifying significant cost savings for the GAPE project through project scope changes, design changes, value engineering and procurement enhancements. QR remains committed to ensuring the project is delivered well in time to effectively manage future growth in coal tonnages and utilise additional capacity at the Port of Abbot Point. It is anticipated at this stage that the project will proceed to the design and construction phase in 2009-10.
Construction of the project needs to be underpinned however by appropriate commercial arrangements with coal company customers. QR has completed early works for the GAPE project, including preliminary engineering and design. However, due to the impact of the global financial crisis on coal demand, coal tonnage forecasts for the first two years of the project are 75% lower than original forecasts, which have caused QR and the industry to rethink the scope and timing of the GAPE project.
| | | | |
| | | Budget Strategy and Outlook 2009-10 | | 73 |
Surat & Galilee Basins
The Surat Basin Railway is a key piece of rail infrastructure that if constructed, would facilitate development of the significant coal reserves in the Surat Basin by providing a link to the Port of Gladstone. The Surat Basin Railway Joint Venture (SBRJV), comprising QR, Xstrata, and the Australian Transport and Energy Corridor, has been granted an exclusive mandate to develop the project. The Government and SBRJV are currently negotiating the arrangements that will govern the construction and operating phases of the project should financial close be successfully achieved.
With regards to the Galilee Basin, Government is seeking to identify preferred options to deliver coal infrastructure to link the Basin to the Port of Abbot Point via a dedicated rail link. As such, the Government is keen to facilitate options involving private sector investment and development of this key infrastructure. This objective will be met through the provision of an integrated solution that provides equity of access to project proponents; ensures optimal supply chain solutions are facilitated from proponents singularly or collectively; and ensures any new export supply chain infrastructure provides open access to all Galilee Basin proponents.
Port GOCs
Queensland port network restructure
In 2008, following the decision to divest its investment in airport assets in Mackay and Cairns, the Queensland Government conducted a review into the structure of the Queensland port network. Based on the review the Government approved the implementation of a five port authority framework as follows:
| • | | Far North Queensland Ports Corporation, which is Cairns Ports Limited renamed, will have responsibility for ports north from Mourilyan with the exception of Weipa i.e. – Cairns, Mourilyan, Cooktown, Cape Flattery, Karumba, Skardon River, Thursday Island, Quintell Beach and Burketown |
| • | | Port of Townsville Limited (PTL) – will now also manage Port of Lucinda |
| • | | North Queensland Bulk Ports Corporation (NQBPC) – to be an amalgamation of existing Ports Corporation of Queensland Limited (PCQ) and Mackay Ports Limited (MPL) functions. NQBPC will manage the port of Mackay and all bulk commodity ports including Weipa, Hay Point and Abbot Point |
| • | | Gladstone Ports Corporation Limited (GPC) |
| • | | Port of Brisbane Corporation Limited (PBC). |
The commencement date for the new port network structure is 1 July 2009.
| | | | |
74 | | Budget Strategy and Outlook 2009-10 | | |
Subsequent to the approval of the new ports structure, the Government announced plans to dispose of some of its assets over a three to five year period, including PBC and APCT held by PCQ. However, until PBC and APCT are sold, the new ports structure will be implemented and they will continue to operate on a business as usual basis.
The new structure of the Queensland port network will provide a more regional focus for Queensland’s ports.
Key ports infrastructure
Significant growth is expected for the Port of Gladstone and Port Alma with port trade growth forecasts expected to increase from 80 million tonnes per annum (mtpa) in 2009 to 119 mtpa by 2014. To meet anticipated long term demand for coal and liquefied natural gas (LNG), significant port planning and development activities are being undertaken by GPC.
PCQ is also on course to deliver on emergent demand for Queensland commodities. PCQ’s eight trading ports handle more than half of Queensland’s exports (by tonnage) and total trade of 119 mt in 2007-08 is expected to increase to 155.5 mt in 2013-14.
Wiggins Island Coal Terminal
In response to future coal demand projections, a new coal terminal, Wiggins Island Coal Terminal (WICT), is proposed to be located north of the Calliope River and the RG Tanna Coal Terminal at the Port of Gladstone. It is expected that the terminal will be developed in three stages with the first stage creating additional capacity of approximately 25 mtpa, increasing to a total export capacity of approximately 70 mtpa.
In late 2008, a consortium of coal companies, the Wiggins Island Coal Export Terminal (WICET) Group, provided the Queensland Government with a private finance proposal (industry model) to develop WICT. Under the industry model, the WICET Group will finance and own the terminal at the Port of Gladstone, with GPC as operator.
On 26 November 2008, the Government provided ‘preferred proponent’ status to the WICET Group to proceed with the development of WICT. WICET, GPC and the Queensland Government are currently working through commercial and technical issues associated with the project and financial close is expected by mid-2010.
| | | | |
| | | Budget Strategy and Outlook 2009-10 | | 75 |
Abbot Point Coal Terminal expansions
The APCT expansion to 21 mtpa capacity (X21) was completed in November 2007. APCT is currently being expanded to 25 mtpa (X25) at a cost of $95 million, of which $17 million is allocated in 2009-10, with the majority of the expansion becoming operational by July 2009. Outloading works are to be completed in mid-2010. The expansion up to 50 mtpa (X50) was approved by Government in June 2008. Total estimated cost for the X50 expansion is estimated to be $818 million (inclusive of finance charges). Budgeted expenditure in 2009-10 is $287.9 million.
PCQ remains on schedule to deliver X50 by 2011. Expansion of the APCT beyond X25 is dependent upon coal companies’ commitment to QR’s construction of NML, which forms part of the GAPE project.
PCQ’s 2008 Master Plan details the scope, preliminary budget and project timeframes for the proposed 80 mtpa to 110 mtpa expansion (X80/X110) of the APCT. PCQ has anticipated that expansion to a capacity of X80 could be achieved by mid 2013 and to X110 by mid 2017 should the coal companies commit to additional export capacity.
In 2009-10, $23.5 million has also been allocated for renewal of stacker reclaimers at APCT, with a total cost of $68.3 million and an expected completion date of 2011.
Liquefied natural gas proposals
Curtis Island has been identified as a suitable location for large-scale LNG processing facilities to take advantage of Queensland’s coal seam gas reserves. Analysis indicates the export capacity for LNG at Gladstone could be up to 15 mtpa in the medium term, driven by forecast strong demand in Asian markets. Several LNG proponents are currently investigating the development of production facilities at the Port of Gladstone.
Development of the LNG industry in Gladstone will be guided by the preparation of a Master Plan for the LNG precinct on Curtis Island, initiated by the Department of Infrastructure and Planning. This Master Plan will guide the development of the LNG precinct, including the provision of common user infrastructure such as roads, bridges, water and power distribution networks and pipeline corridors.
As announced in the 2009 State Election, the Government will provide $30 million over two years to fund the purchase of land for a Callide to Gladstone ‘gas super-highway’. The land will create a corridor between Callide and the Gladstone State Development Area to accommodate co-location of the LNG pipelines to Curtis Island.
The Government will assist in planning, facilitating and coordinating the delivery of this infrastructure in conjunction with the development of co-located and shared facilities by LNG proponents to minimise the costs to be borne by LNG proponents from infrastructure development, in addition to ensuring the efficient usage of available land.
Investigations into channel upgrades and dredging of the Port of Gladstone, including the required funding from industry for its facilitation, will be progressed by GPC and its customers in conjunction with Government departments.
| | | | |
76 | | Budget Strategy and Outlook 2009-10 | | |
Port of Brisbane Corporation Limited
PBC is investing $536.5 million over five years for new wharves 11 and 12 and establishing associated land works at Fisherman Islands. Construction works for the new wharves continue to be ahead of schedule with the timing of the opening of the associated terminals 11 and 12 set for June 2012 and June 2014 respectively. The new wharves will increase Brisbane’s container-handling facility by 25% and take the number of dedicated container wharves at the port to nine.
Hutchison Port Holdings (HPH), one of the world’s leading port investors, developers and operators, has entered into an agreement to lease the new container wharves and will became the third stevedore operating in Brisbane. HPH will undertake and fund the development of container terminal facilities for the new wharves.
Additional ports infrastructure
In 2009-10, $108.6 million is allocated for capital works by GPC at RG Tanna coal terminal, general road rebuilding, land reclamation, mobile plant placements and modification of shiploading facilities at Auckland Point.
PCQ has allocated $1.6 million in 2009-10 to continue studies into the development of a multi-cargo facility at Abbot Point. An additional $348.2 million in 2009-10 has also been allocated for port expansion and development at locations including Abbot Point, Louisa Creek, Mourilyan and Thursday Island. This investment will improve the capacity of PCQ’s ports and meet market growth. Preliminary expenditure is allocated for investigations into the Abbot Point multi-cargo facility.
Design of the Wallace Creek Bridge at the Port of Bundaberg was completed by PBC in December 2008. The $7.7 million bridge, which will provide a link to Burnett Heads, is funded by PBC, the Australian Government and Bundaberg Regional Council. The project is expected to be completed in early 2009-10.
In 2007 the PTL completed the Port of Townsville Master Plan, a key initiative to guide the development and operation of the Port over a 25 year horizon. In 2009-10 the PTL has allocated $11 million for port development and port infrastructure.
Queensland Motorways Limited
During 2009-10 QML will continue to progress the delivery of two major projects in accordance with the requirements of the Road Franchise Agreement established in July 2006.
In February 2008, the then Minister for Main Roads and Local Government announced the Queensland Government’s decision to simultaneously introduce free-flow or cashless tolling on the Gateway and Logan Motorways in mid 2009. In response, QML, following a competitive tender process, appointed two leading international technology providers, Thales and IBM, to design, build and implement roadside and back-office systems to support free-flow tolling.
| | | | |
| | | Budget Strategy and Outlook 2009-10 | | 77 |
The project is on target to be delivered in two phases: full implementation of free-flow tolling on the Logan Motorway and existing Gateway Bridge in July 2009, with phase two to incorporate the new duplicate Gateway Bridge when it opens in mid-2010.
QML will spend a total of $43.6 million on the free-flow tolling project in 2009-10. The total cost of the project, incorporating systems design, build and implementation, gantry design and construction, and civil works will be in the order of $171.7 million.
The construction of the Gateway Upgrade Project will progress towards completion during 2009-10 and is on target for completion in early 2011.
During 2009-10 two significant components of the project will be completed and be opened to traffic: the northern deviation in July 2009, with the new Gateway Bridge expected late in the financial year. The opening of these two sections will have a significant positive impact on traffic congestion.
QML will spend $259.2 million on the Gateway Upgrade Project in 2009-10. The total project cost will be contained within the budget of $1.883 billion. A further $43.6 million is allocated towards the implementation of free-flow tolling.
| | | | |
78 | | Budget Strategy and Outlook 2009-10 | | |
ENERGY SECTOR
Impact of the Carbon Pollution Reduction Scheme
The introduction by the Australian Government of the proposed Carbon Pollution Reduction Scheme (CPRS) is likely to lead to falls in the asset values of coal-fired generators, including the black coal electricity generators owned by Queensland’s GOCs.
This result has been found in several recent modelling studies including consultancies commissioned by the Australian Treasury (ROAM Consulting and ACIL Tasman) and by the Council for Australian Federation (Access Economics).
Under the CPRS, coal fired generators will find it difficult to pass on to customers all of their carbon permit costs and will generate lower volumes. As a result their earnings are likely to decrease.
The Queensland Government will undertake specific modelling of the impact of the CPRS on Queensland’s energy market and electricity generator GOCs when the Australian Government’s CPRS legislation is passed.
The Queensland Government estimates that its State-owned generators may receive approximately $53 million (of the total estimated compensation for Queensland black coal generators outlined on page 60 of chapter 4) of the total Electricity Sector Adjustment Scheme (ESAS) compensation of $3.5 billion proposed by the Australian Government. Having regard to the losses estimated in the modelling studies referred to above, it is likely that the State’s losses will be significantly higher than the compensation offered under the ESAS.
Investment – energy
The Government will continue to invest in transmission and distribution infrastructure across the State, to ensure that demand growth and peak demand will be met. Importantly, a significant proportion of network expenditure is incurred to meet peak demand which occurs on only a few days per year. Demand growth in Queensland is being largely driven by population growth and increased consumer uptake of consumer lifestyle appliances such as air conditioning.
ENERGEX Limited (ENERGEX) and Ergon Energy Corporation Limited (Ergon) are reaching the end of their current regulatory period under the Queensland Competition Authority (QCA), and a new regulatory pricing determination will be made by the Australian Energy Regulator (AER) for the new five year regulatory period from 1 July 2010.
| | | | |
| | | Budget Strategy and Outlook 2009-10 | | 79 |
Transmission infrastructure and augmentation will be strengthened with Powerlink investing $610.4 million in 2009-10. Distribution infrastructure and augmentation will also be strengthened through ENERGEX and Ergon investing a total of $2.1 billion in 2009-10. This investment will ensure that the State maintains reliable and secure transmission and distribution electricity networks. Demand side management will be essential for reducing future pressure on transmission and distribution network expenditure, and helping to lower retail prices for customers in the long run.
The State Government-owned generators are moving to reinvigorate and improve their focus on the maintenance and efficient operation of generation assets, as reflected in their capital investment plans for 2009-10.
There has been a history of private sector participation in the State’s energy sector. The private sector currently owns and controls 30% of total generation capacity within the State, which will increase to 35% in 2009-10 with the commissioning of four new gas-fired plants currently under construction. In 2009-10, privately-developed and operated gas-fired generation will add an additional 1,055 megawatts of capacity to the State’s electricity supply. These plants will be progressively commissioned at Mt Stuart, Darling Downs, Condamine and Yarwun.
The Government is currently undertaking a review of the structure and preparedness of the GOC Generators to meet the new challenges facing these businesses particularly in respect of the impending CPRS and competition from large vertically integrated retailers.
The review will consider the GOC generators’ position as the dominant provider of electricity, particularly coal-fired base load capacity, in the Queensland market with a view to reducing the State’s share of owned and controlled generation capacity from the current 70% to around 50%.
The target of 50% will be progressively achieved primarily as a result of new capacity requirements being met by the private sector, expected to consist largely of gas-fired generation.
North West Queensland Energy Review
During 2008-09 the Government and the Queensland Resources Council jointly commissioned an independent review of energy delivery in the North West Queensland Minerals Province.
The North West Queensland Minerals Province, predominately the area centred around Mount Isa and Cloncurry, is host to a number of operating mines with production valued at $6.6 billion in 2006-07 and has a number of mining operations that have been identified to commence within the region over the next five years. The region currently sources its electricity needs from CS Energy’s gas-fired Mica Creek Power Station, Xstrata PLC’s gas-fired power station and a number of small mine-based generator units. None of these power stations are connected to the national electricity grid.
The outcomes of the Review will point to a pathway forward for the most efficient augmentation to the North-West’s power supply.
| | | | |
80 | | Budget Strategy and Outlook 2009-10 | | |
Ergon franchise load
Ergon Energy Queensland Limited (EEQ), a wholly owned subsidiary of Ergon, provides electricity retail services to around 650,000 non-market customers across regional Queensland.
The Government is committed to ensuring that Queenslanders, regardless of where they live in the State, should have access to affordable electricity supply. The Government provides a maximum uniform tariff across Queensland in order to ensure Queenslanders are not disadvantaged by the higher cost of supplying electricity in regional areas. Higher costs are driven by greater network costs due to locational distances and higher loss factors.
This policy is supported by CSO payments by the Government to EEQ, which in 2009-10 is budgeted to be $333.5 million. The Government also provides a range of concessions to eligible persons to reduce the cost of their electricity bills.
Australian Energy Regulator
Responsibility for the economic regulation of Queensland’s electricity distribution networks has transferred from the Queensland jurisdictional regulator, the QCA, to the AER. The AER will be responsible for regulatory pricing determinations following the expiry of the current pricing determinations on 30 June 2010.
As required under the National Electricity Rules, ENERGEX and Ergon are providing detailed regulatory proposals to the AER for consideration. The AER will make the distribution determination for the period from 1 July 2010 to 30 June 2015. The outcome of the AER’s distribution determination should be published by 30 April 2010. Queensland has experienced rapid growth in electricity demand in recent years, driven to a large extent by increases in population, economic activity and use of lifestyle enhancing appliances such as air conditioners.
| | | | |
| | | Budget Strategy and Outlook 2009-10 | | 81 |
WATER SECTOR
SunWater Regional Water Projects
SunWater, in conjunction with Queensland Government departments, continues to develop business cases for the Regional Water Projects. The objective of these projects is to improve regional water security to facilitate economic growth, overcome institutional impediments to development and ensure an optimal use of capital and capacity.
SunWater is also continuing to progress the investigations of the underlying Projects in accordance with the Government’s decisions relating to Connors River Dam and Pipelines, Nathan Dam and Pipelines, Fitzroy Weirs (with Gladstone Area Water Board) and Water for Bowen.
In addition to the program of works under the Regional Water Projects, SunWater is also undertaking studies for the Burdekin Falls Dam raising, Glebe Weir Raising and Bowen Basin Water Service Framework. In July 2009 SunWater will begin construction of the $42.6 million Cloncurry Supply Pipeline project that will provide long term water security for the region.
State Water Entities
The Queensland Government is currently undertaking fundamental reform of the water supply industry in South East Queensland. The key elements of this reform process include:
| • | | the construction of the $9 billion SEQ Water Grid, establishing interconnection of key supply and demand zones in the region and significant climate-resilient sources of supply, including desalination and recycled water |
| • | | the structural consolidation of the fragmented water supply industry in SEQ, which prior to the reform process included 25 different water service providers, including 21 bulk water assets owned by 12 different bodies with 17 water retailers. The future industry structure will significantly rationalise these arrangements, and better enable the new SEQ Water Grid Manager to coordinate efficient water distribution across the region |
| • | | significant regulatory reform intended to provide more transparent and effective frameworks for: |
| | • | | economic regulation and pricing to incentivise efficient demand outcomes |
| | • | | planning and development regulation, promoting economic efficiency and total water cycle management |
| | • | | asset management regulation, promoting active, whole-of-life asset management. |
| | | | |
82 | | Budget Strategy and Outlook 2009-10 | | |
The passage of the South East Queensland Water (Restructuring) Act 2007 (the Restructuring Act) in November 2007 set the framework to facilitate bulk water supply and transport business restructure. Under the new institutional arrangements, the State –via three new statutory authorities – has assumed control and operational responsibility of the larger bulk water assets that hold, manufacture and distribute bulk water in the SEQ region.
From 1 July 2008, water sources such as dams, weirs and aquifers were aggregated into the Queensland Bulk Water Supply Authority (trading as SEQWater). The Queensland Bulk Water Transport Authority (trading as LinkWater) assumed ownership of major water transport infrastructure, including that previously owned by councils and assets being constructed by the State as part of the SEQ Water Grid. The Queensland Manufactured Water Authority (trading as WaterSecure) was also established to own and operate the Western Corridor Recycled Water Scheme and the Gold Coast Desalination Plant on commissioning completion. Each of the new authorities conducts its affairs on a commercial basis.
The Restructuring Act also provided for the creation of a State-owned SEQ Water Grid Manager, established to manage contracts with the bulk supply and transport entities and the retailers, and to manage the equitable distribution of water across the SEQ Water Grid and allowing for the sharing of costs. The Water Grid Manager purchases the services of SEQWater, LinkWater and WaterSecure and sells water to retailers and power stations.
The next stage of the institutional reforms involves the functional separation of water distribution and retail activities from individual SEQ councils, and the establishment of a new structural and regulatory framework to govern the delivery of retail and distribution services in SEQ. The new arrangements will create greater regional synergy in service delivery, planning and service standards, and improved economic regulation. The businesses delivering water retail and distribution will continue to be owned by local governments.
To meet current and future water supply needs in SEQ, the Government is continuing construction of the Water Grid, ensuring climate-resilient supply arrangements and allowing water to be moved around the region to meet demand in the areas of highest need.
A total of $332.5 million will be spent on bulk transport infrastructure in 2009-10. Of this, $211.5 million is budgeted for the Northern Pipeline Interconnector Stage 2. This pipeline will extend from Landers Shute water treatment plant at Eudlo to Cooroy on the Sunshine Coast, and facilitate the integration of Sunshine Coast Regional Council into the SEQ Water Grid. Subject to the project receiving State and Federal Government approvals, construction is due to commence in the second half of 2009, to be completed in 2011-12 in line with the Water Amendment Regulation (No. 2) 2008. Longer-term planning is for the pipeline to deliver water from future northern water storages such as Traveston Crossing Dam or northern desalination sources.
| | | | |
| | | Budget Strategy and Outlook 2009-10 | | 83 |
In addition, $121 million will be spent in 2009-10 on the 38 km Toowoomba pipeline, which is forecast to be operational by January 2010. This pipeline links Wivenhoe Dam to Toowoomba’s Cressbrook Dam and is planned to provide water security to the Toowoomba region.
The Government-owned special-purpose vehicle construction company Queensland Water Infrastructure Pty Ltd (QWI) is progressing with land acquisitions and pre-construction activities relating to the $348 million Wyalarong Dam on Teviot Brook, which is scheduled for completion in 2011. The Dam will provide an additional 26,000ML per annum of water when operated with the recently completed Cedar Grove and the Bromelton Offstream Storage.
QWI has also commenced preliminary planning and design activities, including land acquisitions, relating to the $1.6 billion Traveston Crossing Dam. However, as outlined in the Mid Year Fiscal and Economic Review, a number of environmental mitigation measures are required prior to commencing construction of the Traveston Crossing Dam. These measures are designed to protect vulnerable species and minimise the impact on flora and fauna. The Government remains committed to the Dam, but it is expected that developing and proving the effectiveness of environmental measures will result in a delay in construction of several years. The Dam is now scheduled for completion in 2016-17.
Construction of the Western Corridor Recycled Water Project – the largest recycled water project in the Southern Hemisphere—will be finalised in 2009-10, with $130.7 million budgeted to complete the water supply network. The project is diversifying SEQ water resources by producing purified recycled water that meets the Australian Drinking Water Guidelines.
In addition, final commissioning of the Gold Coast Desalination Plant at Tugun is expected to be completed in late 2009, delivering drinking water directly to the SEQ Water Grid at a total project cost of $942 million (excluding network integration works). The delivery strategy for the Cedar Grove water treatment plant and connecting infrastructure will also be finalised in 2009-10, with planning work to be undertaken by SEQWater.
FORESTRY
The Government will continue the expansion of its hardwood sawlog plantations consistent with its commitment under the Western Hardwoods Region Plan to make available 20,000 hectares of hardwood sawlog. In the event the hardwood plantations are included in the divestment of FPQ, the Government will oblige the acquiring party to honour the obligations under the Western Hardwoods Region Plan.
Pending the sale, FPQ will continue to progress commercial reforms to improve operations, long term sustainability and competitiveness of the Queensland plantation timber industry.
| | | | |
84 | | Budget Strategy and Outlook 2009-10 | | |
FEATURES
| • | | Total General Government sector revenue is estimated to be $37.192 billion in 2009-10. The increase of $1.318 billion (or 3.7%) on 2008-09 estimated actual revenue primarily reflects increased Australian Government funding for specific purposes. |
| • | | Since the 2008-09 Budget, underlying estimates for taxation, royalties and Goods and Services Tax revenue have been revised down by $15 billion across the period 2008-09 to 2011-12. |
| • | | While a number of taxation measures announced in the Mid Year Fiscal and Economic Review will commence from 1 July 2009, there are no taxation or royalty increases in this Budget. |
| • | | Employers will benefit from a 25% payroll tax rebate on the eligible wages of apprentices and trainees in 2009-10, in addition to these wages being exempt from payroll tax. |
| • | | The transfer duty exemption threshold for first home buyers purchasing vacant land will increase from $150,000 to $250,000, with a partial concession available for first home buyers purchasing vacant land valued at up to $400,000. |
| • | | An instalment payment option for land tax liabilities will be introduced in 2010-11 to assist businesses and investors by spreading the tax liability over a longer period. In 2009-10, as an interim measure, the payment period for land tax assessments is increased from 30 days to 90 days, at an estimated cost to Government of $8 million. |
| • | | Queensland will retain its competitive tax status, with per capita state tax estimated at $2,087 in 2009-10, compared to an average of $2,517 for the other states and territories. |
| • | | The abolition of duty on the transfer of core business assets will be delayed until 1 July 2013, in accordance with the timeframe included in the new Intergovernmental Agreement on Federal Financial Relations. |
| | | | |
| | | Budget Strategy and Outlook 2009-10 | | 85 |
INTRODUCTION
This chapter provides an overview of General Government sector revenue for the 2008-09 estimated actual outcome, forecasts for the 2009-10 Budget year and projections for 2010-11 to 2012-13.
Table 6.1
General Government revenue1
| | | | | | | | | | | | |
| | | 2008-09
Budget
$ million | | 2008-09
Est. Act.
$ million | | 2009-10
Budget
$ million | | 2010-11
Projection
$ million | | 2011-12
Projection
$ million | | 2012-13
Projection
$ million |
Revenue | | | | | | | | | | | | |
Taxation revenue | | 10,106 | | 8,759 | | 9,287 | | 9,991 | | 10,740 | | 11,547 |
Grants revenue | | | | | | | | | | | | |
Current grants | | 14,631 | | 14,931 | | 15,025 | | 15,038 | | 15,732 | | 16,733 |
Capital grants | | 1,056 | | 2,340 | | 3,710 | | 2,350 | | 1,358 | | 991 |
Sales of goods and services | | 3,385 | | 3,466 | | 3,650 | | 3,704 | | 3,836 | | 3,899 |
Interest income | | 2,199 | | 1,261 | | 2,017 | | 2,115 | | 2,218 | | 2,282 |
Dividend and income tax equivalent income | | | | | | | | | | | | |
Dividends | | 841 | | 853 | | 884 | | 990 | | 1,121 | | 1,481 |
Income tax equivalent income | | 210 | | 245 | | 266 | | 472 | | 530 | | 789 |
Other revenue | | | | | | | | | | | | |
Royalties and land rents | | 3,644 | | 3,396 | | 1,806 | | 1,856 | | 2,058 | | 2,198 |
Other | | 509 | | 621 | | 548 | | 511 | | 506 | | 510 |
Total Revenue | | 36,582 | | 35,874 | | 37,192 | | 37,029 | | 38,100 | | 40,431 |
Notes:
| 1. | Numbers may not add due to rounding. |
The forward estimates are based on the economic projections outlined in Chapter 2 and are formulated on a no policy change basis.
General Government revenue in 2008-09 is estimated to be $35.874 billion, which is $708 million (or 1.9%) less than the 2008-09 Budget estimate.
Significant variations include:
| • | | a $1.347 billion reduction in taxation revenue, largely due to a sharp decline in transfer duty as a result of weakness in the property market reflecting a combination of tight credit conditions and the impact of the global downturn on the state economy |
| • | | a $938 million reduction in interest income associated with lower than expected returns on investments held on behalf of former defined benefit members and statutory bodies |
| • | | a $771 million reduction in GST receipts due to a decline in the national GST pool |
| • | | partly offset by a $2.338 billion increase in Australian Government grants for specific purposes, which will be directed to increases in services and capital expenditure. |
| | | | |
86 | | Budget Strategy and Outlook 2009-10 | | |
General Government revenue in 2009-10 is estimated to be $37.192 billion, 3.7% higher than the 2008-09 estimated actual revenue of $35.874 billion. This is largely due to:
| • | | a further $1.362 billion increase in Australian Government funding for capital expenditure |
| • | | interest income returning to an assumed long run rate of return |
| • | | modest growth of $528 million (6%) in taxation revenue, primarily resulting from the measures announced in the Mid Year Fiscal and Economic Review. |
Partially offsetting this increase is a $1.59 billion reduction in royalty revenue, primarily due to sharp reductions in contract coal prices.
| | | | |
| | | Budget Strategy and Outlook 2009-10 | | 87 |
REDUCTIONS IN REVENUE SINCE THE 2008-09 BUDGET
Since the release of the 2008-09 Budget, there has been a deterioration in Queensland’s economic outlook, along with, and related to, a deterioration in the economic outlook nationally and globally.
This has resulted in significant revisions to the key discretionary revenues available to the state – taxation, GST revenue and royalties. The combined impact of these revisions is estimated at $15 billion over the period 2008-09 to 2011-12 in underlying terms, that is, excluding revenue measures such as those announced in the Mid Year Fiscal and Economic Review.
Chart 6.1 identifies the reduction since the 2008-09 Budget in the estimates for each of these key revenue lines in each year.
Chart 6.1
Reductions in key revenues since 2008-09 Budget

| | | | |
88 | | Budget Strategy and Outlook 2009-10 | | |
Reductions in taxation estimates
Table 6.2 identifies the 2009-10 taxation revenue estimates that were prepared for the 2008-09 Budget and those prepared for the 2009-10 Budget. Despite the measures announced in the Mid Year Fiscal and Economic Review, taxation revenue estimates for 2009-10 are $1.556 billion lower than at the time of the 2008-09 Budget.
Table 6.2
2009-10 taxation revenue estimates, at 2008-09 Budget and 2009-10 Budget1
| | | | | | | |
| | | 2008-09
Budget
$ million | | 2009-10
Budget
$ million | | Difference | |
Payroll tax | | 2,955 | | 2,736 | | (219 | ) |
| | | |
Duties | | | | | | | |
Transfer | | 3,388 | | 1,704 | | (1,684 | ) |
Vehicle registration | | 544 | | 410 | | (134 | ) |
Insurance and other duties | | 434 | | 463 | | 29 | |
Total duties | | 4,366 | | 2,577 | | (1,789 | ) |
| | | |
Gambling taxes and levies | | 1,018 | | 1,006 | | (12 | ) |
| | | |
Other taxes | | | | | | | |
Land tax | | 862 | | 1,047 | | 185 | |
Motor vehicle registration | | 1,031 | | 1,237 | | 206 | |
Other taxes | | 611 | | 683 | | 72 | |
| | | |
Total taxation revenue | | 10,843 | | 9,287 | | (1,556 | ) |
Notes:
| 1. | Numbers may not add due to rounding. |
The largest impact is on transfer duty, with a $1.684 billion reduction as a result of a sharp decline in the number of property transactions anticipated in 2009-10. This reduction is illustrated in Chart 6.2, which shows trend growth in transfer duty alongside trend growth in residential investor finance.
There is also a notable decline in payroll tax and vehicle registration duty, along with a modest decline in gambling taxes.
Over the four year period, the underlying decline in taxation revenue estimates is approximately $7.8 billion. This does not include the decline in royalty revenue, which is not defined as taxation.
| | | | |
| | | Budget Strategy and Outlook 2009-10 | | 89 |
Chart 6.2
Growth in transfer duty and investor finance, 12-month rolling averages, trend
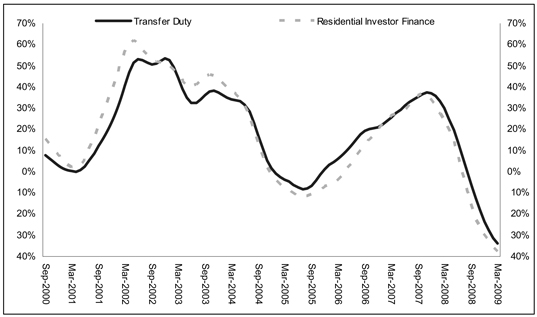
Source: derived from Australian Bureau of Statistics (5671.0)
Reductions in GST revenue estimates
In its 2009-10 Budget, the Australian Government revised down estimates of national GST collections since its 2008-09 Budget by $25.5 billion across the forward estimates.
Based on this revision, Queensland Treasury has estimated Queensland’s share of GST for all years across the forward estimates. These estimates indicate that, since the 2008-09 Australian Government Budget, there has been a $2 billion reduction in Queensland’s GST share in 2008-09 and 2009-10 combined, and a decrease of a further $3.6 billion over the period from 2010-11 to 2012-13.
Further analysis of Queensland’s share of GST revenue is provided in Chapter 9.
| | | | |
90 | | Budget Strategy and Outlook 2009-10 | | |
Reductions in royalty estimates
Royalty estimates prepared for the 2008-09 Budget were based on a number of assumptions in relation to export coal volumes and commodity prices. While these estimates were considered to be conservative at the time, relative to market expectations, the rapid deterioration in global demand has resulted in a much larger than anticipated decline in commodity prices.
The reduction in global demand and the associated impact on Queensland’s major trading partners has also led to an expectation that the volume of coal exported from Queensland will decline in 2009-10, whereas growth had been anticipated at the time of the 2008-09 Budget.
The reduction in royalty estimates is largest in 2009-10, as contract coal prices are now expected to be relatively stable at current levels in future years, following a sharper than anticipated decline in 2009-10, whereas the 2008-09 Budget estimates assumed a more gradual decline over a longer period.
The reduction in royalty estimates since the 2008-09 Budget is approximately $2.7 billion over the period 2008-09 to 2011-12.
| | | | |
| | | Budget Strategy and Outlook 2009-10 | | 91 |
REVENUE BY OPERATING STATEMENT CATEGORY
Major sources of General Government revenue in 2009-10 are grants revenue (50.4% of revenue) and taxation revenue (25%). Chart 6.3 illustrates the composition of General Government revenue.
Chart 6.3
Revenue by operating statement category 2009-10
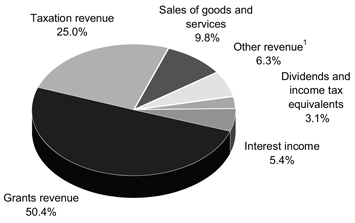
Note:
| 1. | The major component of Other revenue is royalties and land rents (4.9%). |
| | | | |
92 | | Budget Strategy and Outlook 2009-10 | | |
Chart 6.4 compares 2009-10 estimates with 2008-09 estimated actuals. The overall result primarily reflects strong growth in grants revenue, supplemented by moderate growth in taxation revenue and interest income.
Chart 6.4
Revenue by operating statement category for 2008-09 and 2009-10
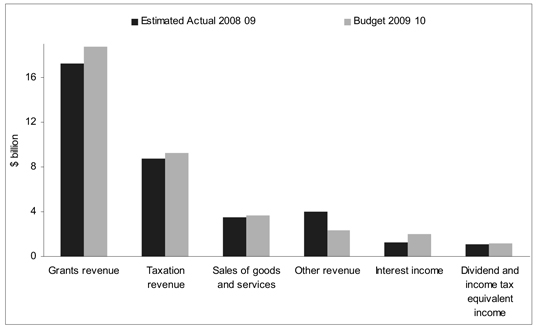
| | | | |
| | | Budget Strategy and Outlook 2009-10 | | 93 |
TAXATION REVENUE
One of the Queensland Government’s key social and fiscal objectives is to maintain a competitive tax regime promoting economic development and jobs growth, whilst raising sufficient revenue to meet the service and infrastructure needs of the people of Queensland.
Total revenue from taxation is expected to increase by 6% in 2009-10 on 2008-09 estimated actuals. This primarily reflects the expected impact of measures announced in the Mid Year Fiscal and Economic Review.
Table 6.3
Taxation revenue1
| | | | | | |
| | | 2007-08
Actual
$ million | | 2008-09
Est. Act.
$ million | | 2009-10
Budget
$ million |
Payroll tax | | 2,493 | | 2,728 | | 2,736 |
| | | |
Duties | | | | | | |
Transfer | | 2,912 | | 1,762 | | 1,704 |
Vehicle registration | | 403 | | 435 | | 410 |
Insurance2 | | 386 | | 424 | | 441 |
Other duties3 | | 344 | | 37 | | 22 |
Total duties | | 4,044 | | 2,658 | | 2,577 |
| | | |
Gambling taxes and levies | | | | | | |
Gaming machine tax | | 534 | | 553 | | 572 |
Health Services Levy | | 38 | | 41 | | 44 |
Lotteries taxes | | 206 | | 221 | | 232 |
Wagering taxes | | 37 | | 39 | | 41 |
Casino taxes and levies4 | | 56 | | 61 | | 100 |
Keno tax | | 18 | | 17 | | 18 |
Total gambling taxes and levies | | 889 | | 931 | | 1,006 |
| | | |
Other taxes | | | | | | |
Land tax | | 610 | | 807 | | 1,047 |
Motor vehicle registration | | 966 | | 1,014 | | 1,237 |
Fire levy | | 265 | | 281 | | 295 |
Community Ambulance Cover | | 130 | | 138 | | 145 |
Guarantee fees | | 87 | | 138 | | 175 |
Other taxes | | 63 | | 65 | | 69 |
| | | |
Total taxation revenue | | 9,546 | | 8,759 | | 9,287 |
Notes:
| 1. | Numbers may not add due to rounding. |
| 2. | Includes duty on accident insurance premiums. |
| 3. | Includes duty on life insurance premiums and mortgage duty. |
| 4. | Includes community benefit levies. |
| | | | |
94 | | Budget Strategy and Outlook 2009-10 | | |
Budget initiatives
Transfer duty – First home vacant land concession
Queensland currently provides a transfer duty exemption for first home buyers purchasing vacant land valued at up to $150,000. From 1 July 2009, the threshold for first home buyers purchasing vacant land will be increased from $150,000 to $250,000, providing savings of up to $5,675. In addition, a partial concession will be provided for first home buyers purchasing vacant land valued at up to $400,000.
This measure builds on the assistance provided to first home buyers in the 2008-09 Budget, which increased the transfer duty exemption threshold for homes to $500,000 and brought forward the abolition of mortgage duty to 1 July 2008.
This measure is designed to ensure that the $500,000 threshold for homes does not provide a disincentive against first home buyers purchasing vacant land for the construction of their first home.
This measure is expected to provide savings of $5.7 million to first home buyers in 2009-10 and remove or reduce the duty payable on an additional 1,850 purchases of vacant land for the construction of new homes.
Table 6.4 identifies savings for first home buyers on vacant land purchases.
Table 6.4
Transfer duty on first home vacant land purchases, from 1 July 2009
| | | | | | | | | | |
Land Value | | Current | | New | | Savings |
| $ | 150,000 | | | — | | | — | | | — |
| $ | 175,000 | | $ | 1,050 | | | — | | $ | 1,050 |
| $ | 200,000 | | $ | 2,675 | | | — | | $ | 2,675 |
| $ | 225,000 | | $ | 4,050 | | | — | | $ | 4,050 |
| $ | 250,000 | | $ | 5,675 | | | — | | $ | 5,675 |
| $ | 275,000 | | $ | 7,150 | | $ | 1,825 | | $ | 5,325 |
| $ | 300,000 | | $ | 8,925 | | $ | 4,125 | | $ | 4,800 |
Payroll tax – apprentice and trainee rebate
Queensland currently has a highly competitive payroll tax regime with a low payroll tax of 4.75% and a relatively high $1 million exemption threshold.
This Budget provides further relief for businesses that employ apprentices and trainees. In 2009-10, the Government will provide a 25% payroll tax rebate on the eligible wages of apprentices and trainees, in addition to these wages being exempt from payroll tax. This measure will save businesses approximately $15 million in 2009-10.
| | | | |
| | | Budget Strategy and Outlook 2009-10 | | 95 |
Land tax – extended payment period
The Queensland Government recognises that annual land tax liabilities may have cashflow implications for business and investors. To assist in alleviating these cashflow issues, an instalment payment option for land tax liabilities will be introduced in 2010-11 spreading the tax liability over a longer period.
In 2009-10, as an interim measure, the payment period for land tax assessments will be increased from 30 days to 90 days, with the financing cost to Government estimated at approximately $8 million.
Deferral of abolition of transfer duty on core business assets
The Intergovernmental Agreement on the Reform of Commonwealth-State Financial Relations (IGA), agreed to by the Australian Government and all state and territory governments in 1999, required the abolition and review of a number of state taxes. In accordance with the requirements of the IGA, transfer duty on quoted marketable securities and debits tax were abolished in 2001 and 2005 respectively.
Following a multi-jurisdictional review of duties listed in the IGA schedule, a timetable for the abolition of the majority of these duties was announced in the 2005-06 Budget. To date, the Government has completed the abolition of duties listed in this table within the scheduled timeframe.
Following the abolition of mortgage duty from 1 July 2008, the only duty remaining on the schedule is duty on the transfer of core business assets, which was originally scheduled to be abolished by 2011. In light of the tighter fiscal conditions, the abolition of duty on the transfer of core business assets will be delayed until 1 July 2013. The Government considers this timing to be in accordance with the timeframe included in the new Intergovernmental Agreement on Federal Financial Relations.
The savings to Queenslanders from the abolition of these taxes listed in the IGA has already risen from $290 million in 2005-06 to $750 million in 2009-10 and will rise to over $900 million per year by 2012-13.
The cumulative savings for the period 2005-06 to 2009-10, as a result of these abolitions, is estimated to exceed $2.5 billion.
| | | | |
96 | | Budget Strategy and Outlook 2009-10 | | |
Table 6.5 presents the full schedule of tax abolitions under the IGA.
Table 6.5
Abolition of state taxes under the IGA
| | | | | | |
Tax | | Description | | Abolition | | Full year
cost1
$ million |
Marketable securities duty (quoted) | | Payable on the transfer of marketable securities listed on the Australian Stock Exchange or another recognised stock exchange. | | ü July 2001 | | 35 |
Credit card duty2 | | Payable on credit card transactions. | | ü August 2004 | | 20 |
Debits tax | | Payable on debits to accounts with cheque drawing facility. | | ü July 2005 | | 190 |
Lease duty | | Payable on the lease of land or premises in Queensland. Residential leases exempted. | | ü January 2006 | | 27 |
Credit business duty | | Payable on the amount of credit provided under a loan, a discount transaction or a credit arrangement. | | ü January 2006 | | 19 |
Hire duty | | Payable on the hiring charges of the hire of goods. | | ü January 2007 | | 19 |
Marketable securities duty (unquoted) | | Payable on the transfer of marketable securities not listed on the Australian Stock Exchange or another recognised stock exchange. | | ü January 2007 | | 17 |
Mortgage duty | | Payable on entering into a mortgage over property in Queensland. | | ü July 2008 (6 months early) | | 300 |
Duty on transfer of core business assets | | Payable on the transfer of non-realty business assets. | | 1 July 2013 | | 203 |
Notes:
| 1. | Estimated revenue foregone in financial year following full abolition. |
| 2. | Credit card duty was abolished prior to its review under the IGA. |
| | | | |
| | | Budget Strategy and Outlook 2009-10 | | 97 |
Estimates of state taxation revenue
Chart 6.5 indicates the composition of estimated state taxation revenue for 2009-10.
Chart 6.5
Taxation by tax category
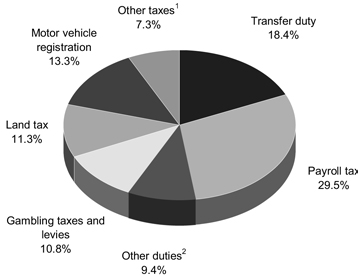
Note:
| 1. | ‘Other taxes’ includes the fire levy, community ambulance cover, guarantee fees and other minor taxes. |
| 2. | ‘Other duties’ includes vehicle registration duty, insurance duty and other minor duties. |
The largest sources of taxation revenue are payroll tax and transfer duty, which together represent 47.9% of the State’s total taxation revenue in 2009-10.
Payroll tax (29.5% of total tax revenue in 2009-10) has a stable base with growth driven by the underlying strength of the state economy. In contrast, revenue growth from transfer duty (representing 18.4% of tax revenue) can vary significantly from year to year with its base being subject to the volatile movements of the property market.
Other duties, including vehicle registration duty, insurance duty and other smaller duties, represent 9.4% of total tax revenue.
| | | | |
98 | | Budget Strategy and Outlook 2009-10 | | |
Gambling taxes and levies represent 10.8% of tax revenues in 2009-10. Motor vehicle registration, which is classified as a tax for budget purposes, represents 13.3% of total tax revenue.
Land tax represents 11.3% of total revenue in 2009-10. While also subject to the volatility of price movements in the property market, this impact is moderated by a relatively stable base and the effect of three-year averaging of land values for assessments.
Payroll tax
Payroll tax is chargeable at a rate of 4.75% when the total yearly Australian taxable wages of an employer, or those of a group of related employers, exceed the exemption threshold of $1 million.
The overall payroll tax rate of 4.75% is the lowest of any state and the exemption threshold of $1 million is amongst the highest thresholds in Australia. Queensland employers with total yearly Australian taxable wages between $1 million and $5 million also obtain a partial concession, with concession withdrawn at a rate of $1 in every $4 of taxable wages.
Payroll tax collections are estimated to be $2.736 billion in 2009-10, reflecting a decline in employment being offset by wages growth. This is $219 million lower than estimated at the time of the 2008-09 Budget.
Duties
Duties are levied on a range of financial and property transactions. Overall, revenue from duties is forecast to decrease by 3% in 2009-10. This negative growth is driven by the sharp fall in transfer duty collections and weakening of vehicle registration duty collections.
The major duties include transfer, vehicle registration and insurance duties.
| • | | Transfer duty is charged at various rates on the transfer of real and business property. The Queensland Government offers extensive concessions for the transfer of land where the property is purchased as a first or subsequent home. |
Revenue from transfer duty is expected to decrease by 3.3% in 2009-10 as a result of the sharp reduction in the number of transactions in the Queensland property market. The drop is particularly pronounced in the commercial property market, reflecting the tight credit conditions and the impact of the global economic downturn on the national and State economies
Transfer duty collections were $2.912 billion in 2007-08 and are anticipated to decline by $1.208 billion (or 41.5%) between 2007-08 and 2009-10, prior to a relatively modest recovery in the outyears.
| | | | |
| | | Budget Strategy and Outlook 2009-10 | | 99 |
| • | | Vehicle registration duty is charged at rates of between 2% and 4% of the dutiable value of a motor vehicle on the transfer or initial registration of the motor vehicle, with the rate depending on the number of cylinders of the vehicle. |
Revenue from vehicle registration duty is expected to decrease 5.7% in 2009-10, reflecting a significant decline in motor vehicle sales in the wake of the global financial crisis and resulting economic slowdown.
| • | | Insurance duty is charged on contracts of general insurance, life insurance and accident insurance. The base rate for most general insurance products is 7.5%, with certain general insurance products, life insurance and accident insurance charged at the rate of 5%. |
Revenue from insurance duty is expected to grow by 4% in 2009-10, reflecting a moderate growth in insurance premiums resulting from the higher than usual number of claims following recent natural disasters.
Gambling taxes and levies
A range of gambling activities are subject to state taxes and levies. Total gambling tax and levy collections are estimated to increase by 8.1% in 2009-10, a slightly higher rate than is estimated for 2008-09, partly associated with the Government’s gambling reforms that will take effect from 1 July 2009. Gaming machine taxes are estimated to increase by 3.4%, the Health Services Levy by 7.3%, lotteries taxes by 5%, and other gambling taxes by 36%, primarily associated with casino tax increases.
As announced in the Mid Year Fiscal and Economic Review, the Government will reduce the disparity between tax rates applicable to gaming machines in casinos compared to those in large clubs and hotels by increasing the tax rate on casino gaming machine wins by 10% and removing some concessional rates on premium play from 1 July 2009.
Land tax
Land tax is levied on the unimproved value of the landowner’s aggregated holdings of freehold land owned in Queensland as at midnight on 30 June each year. The principal place of residence is deducted from this value. A 50% cap on the annual increase in land values used for the purpose of calculating land tax liabilities commenced from 1 July 2007 and continues to apply in 2009-10.
Resident individuals are generally liable for land tax if the total unimproved value of the freehold land owned by that person as at 30 June is equal to or greater than $600,000. Companies, trustees and absentees are generally liable for land tax if the total unimproved value of the freehold land owned as at 30 June is equal to or greater than $350,000.
| | | | |
100 | | Budget Strategy and Outlook 2009-10 | | |
As announced in the Mid Year Fiscal and Economic Review, the Government will introduce a land tax surcharge of 0.5% from 1 July 2009. It will apply where the aggregate value of all land (for land tax purposes) exceeds $5 million and only to the portion of the value exceeding $5 million.
Land tax is estimated to grow by 29.7% to $1.047 billion in 2009-10. The increase of $240 million on 2008-09 estimated actuals primarily reflects the impact of three-year averaging, which has restrained growth in land tax liabilities in previous years, with $93 million of the increase attributable to the 0.5% land tax surcharge. Despite the increase in land tax liabilities in 2009-10, it is estimated that the revenue foregone as a result of three-year averaging will be approximately $142 million in 2009-10.
Motor vehicle registration fees
Motor vehicle registration fees are expected to grow by 22% in 2009-10, largely reflecting increased motor vehicle registration fees, population growth and fee adjustments related to the consumer price index (CPI).
As announced in the Mid Year Fiscal and Economic Review, the Government will increase motor vehicle registration fees, commencing 1 July 2009. As stated in the Mid Year Fiscal and Economic Review, total motor vehicle registration costs from 1 July 2009 will also incorporate the annual adjustment for CPI and changes to Compulsory Third Party premiums bid by insurance companies.
Fire levy
Fire levy revenue, which is used to fund the Queensland Fire and Rescue Authority, is expected to increase in line with the growth of the number of contributors and CPI.
Community Ambulance Cover
The Community Ambulance Cover Scheme was introduced in 2003-04 to replace the Ambulance Subscription Scheme and to provide a sustainable funding base for the Queensland Ambulance Service. It is collected through a payment on non-exempt electricity accounts. Growth in 2009-10 reflects CPI adjustments and growth in the number of non-exempt electricity accounts.
Guarantee fees
Guarantee fees are revenues collected by Queensland Treasury Corporation (QTC) on behalf of the State and comprise performance dividends, competitive neutrality fees and credit margin fees. These fees promote competitive neutrality between public sector agencies and those in the private sector and ensure that the benefits accruing from the financial backing and superior borrowing performance of the State (through QTC) are shared between the borrower and the State.
| | | | |
| | | Budget Strategy and Outlook 2009-10 | | 101 |
Other taxes
Other taxes represent revenue from taxes such as the Statutory Insurance Scheme Levy, the Nominal Defendant Levy and other sundry taxes.
Tax expenditures
Tax expenditures are reductions in tax revenue that result from the use of the tax system as a policy tool to deliver Government policy objectives. Tax expenditures are provided through a range of concessions, including tax exemptions, reduced tax rates, tax rebates, tax deductions and provisions which defer payment of a tax liability to a future period. Appendix A provides details of tax expenditure arrangements set in place by the Queensland Government.
QUEENSLAND’S COMPETITIVE TAX STATUS
Taxation can impact on business decisions regarding investment and employment and also household investment and home ownership. Maintaining the competitiveness of Queensland’s tax system provides a competitive advantage to business and moderates the tax burden for its citizens and is therefore fundamental to the Government’s commitment to job creation and sustainable development.
Recent tax changes have sought to improve the efficiency and equity of the State’s tax system, increase consistency with other jurisdictions, strengthen the funding base of essential services and reduce or eliminate taxes to the benefit of taxpayers.
In pursuit of these objectives over recent years, the Government has:
| • | | increased the transfer duty exemption for first home buyers to $500,000 |
| • | | increased the principal place of residence concession available to other homebuyers from $320,000 to $350,000 |
| • | | simplified the transfer duty and land tax rate structures |
| • | | extended the benefit of the payroll tax threshold, such that taxpayers with eligible wages of up to $5 million (previously $4 million) will benefit a partial deduction |
| • | | harmonised payroll tax provisions and definitions with other jurisdictions to reduce the compliance burden on businesses operating across state borders |
| • | | abolished mortgage duty in advance of the scheduled timeframe |
| • | | introduced a 0.5% land tax surcharge where the aggregate value of all land exceeds $5 million |
| • | | increased vehicle registration fees |
| • | | reduced the disparity between tax rates applicable to gaming machines in casinos and those applicable in large clubs and hotels. |
| | | | |
102 | | Budget Strategy and Outlook 2009-10 | | |
Consistent with this commitment to ongoing tax reform, the Government has announced in this Budget:
| • | | an increase in the threshold for first home buyers purchasing vacant land from $150,000 to $ $250,000, with a partial concession for vacant land valued up to $400,000 |
| • | | an instalment payment option for land tax liabilities from 2010-11 spreading the tax liabilities over a longer period (in 2009-10, as an interim measure, the payment period for land tax assessments is increased from 30 days to 90 days) |
| • | | a 25% rebate on the eligible wages of apprentices and trainees in 2009-10, in addition to these wages being exempt from payroll tax |
| • | | a further deferral of the abolition of duty on the transfer of core business assets to 1 July 2013. |
One of the Queensland Government’s fiscal objectives is to maintain a competitive tax environment. Table 6.6 demonstrates that this commitment is being met, with various measures of tax competitiveness all indicating the Queensland state tax system remains amongst the most competitive in Australia.
Table 6.6
Queensland’s tax competitiveness
| | | | | | | | | | | | | | | | | | |
| | | QLD | | NSW | | VIC | | WA | | SA | | TAS4 | | ACT5 | | NT4 | | Avg6 |
Taxation per capita1 ($) | | 2,087 | | 2,645 | | 2,434 | | 2,557 | | 2,164 | | 1,605 | | 2,883 | | 1,788 | | 2,487 |
Taxation effort2 (%) | | 85.6 | | 104.8 | | 101.9 | | 102.8 | | 111.8 | | 92.7 | | 107.5 | | 102.5 | | 100.0 |
Taxation % of GSP3 (%) | | 4.46 | | 5.16 | | 4.80 | | 4.04 | | 4.87 | | 3.90 | | 4.41 | | 2.53 | | 4.75 |
Notes:
| 1. | 2009 10 data. Sources: QLD, VIC, WA, ACT, NT, SA, TAS 2009 10 Budgets, NSW is a Queensland Treasury |
estimate based on revisions in other jurisdictions.
| 2. | 2007 08 data. Source: Commonwealth Grants Commission: 2009 Update. |
Revenue raising effort ratios, assessed by the Commonwealth Grants Commission, isolate policy impacts from revenue capacity impacts and are an indicator of the extent to which the governments burden their revenue bases. Queensland’s tax revenue raising effort is well below the Australian policy standard (equal to 100%).
| 3. | 2007 08 data. Sources: ABS 5506.0 and ABS 5220.0. |
| 4. | Low taxation per capita primarily reflects the lower revenue raising capacity of those jurisdictions. |
| 5. | Includes municipal rates, which are classified by the ABS as state taxation in the ACT, but are imposed by local governments in other jurisdictions. |
| 6. | Weighted average of states and territories, excluding Queensland. |
| | | | |
| | | Budget Strategy and Outlook 2009-10 | | 103 |
As Table 6.6 shows, taxation per capita in Queensland is significantly lower than the average taxation per capita in the other states and territories. The gap has widened in 2008-09 as Queensland has experienced a more severe downturn in transfer duty revenue than most other states. This is partly the result of Queensland’s $500,000 exemption threshold for first home buyers, which has been the strongest segment of the property market and has provided support to transfer duty in some other jurisdictions.
In contrast to a number of other jurisdictions, Queensland’s tax estimates are not based on an improvement in property market activity in 2009-10 and are generally less optimistic about the timing and extent of recovery in taxation revenue in the coming year.
Queensland’s tax effort, as measured by the Commonwealth Grants Commission, was more than 14% below the national average in 2007-08. However, this measure is expected to move closer to the national average in the future due to increases in vehicle registration duty (from 1 January 2008), transfer duty (from 1 July 2008), and land tax, gaming machine taxes and light vehicle registration fees (from 1 July 2009).
A third measure of competitiveness, taxation as a share of gross state product (GSP), also confirms that Queensland’s taxes are competitive with other states.
| | | | |
104 | | Budget Strategy and Outlook 2009-10 | | |
GRANTS REVENUE
Grants revenue is comprised of Australian Government grants, grants from the community and industry and other miscellaneous grants. Growth of $1.463 billion (or 8.5%) in 2009-10 is primarily due to increases in Australian Government capital grants for specific purposes under the Nation Building and Jobs Plan and the Council of Australian Government reform agreements, partly offset by a decrease in GST revenue.
Table 6.7
Grants revenue1
| | | | | | |
| | | 2007-08
Actual
$ million | | 2008-09
Est. Act.
$ million | | 2009-10
Budget
$ million |
Current grants | | | | | | |
Australian Government grants | | 14,059 | | 14,464 | | 14,614 |
Other grants and contributions | | 472 | | 467 | | 411 |
Total current grants | | 14,531 | | 14,931 | | 15,025 |
| | | |
Capital grants | | | | | | |
Australian Government grants | | 974 | | 2,331 | | 3,693 |
Other grants and contributions | | 17 | | 9 | | 17 |
Total capital grants | | 992 | | 2,340 | | 3,710 |
| | | |
Total grants revenue | | 15,523 | | 17,272 | | 18,735 |
Note:
| 1. | Numbers may not add due to rounding. |
Australian Government payments
Australian Government payments to Queensland comprise:
| • | | general purpose payments, comprised of GST revenue grants and associated payments. General purpose payments are ‘untied’ and are used for both recurrent and capital purposes |
| • | | payments for specific purposes, including grants for health, schools, skills and workforce management, disabilities and housing, which are used to meet Australian Government and shared policy objectives. |
Australian Government payments to Queensland in 2009-10 are expected to total $18.307 billion, an increase of $1.512 billion (or 9%) compared to payments in 2008-09.
| | | | |
| | | Budget Strategy and Outlook 2009-10 | | 105 |
Table 6.8
Australian Government payments1
| | | | | | |
| | | 2007-08
Actual
$ million | | 2008-09
Est. Act.
$ million | | 2009-10
Budget
$ million |
GST revenue grants and associated payments2 | | 8,549 | | 7,973 | | 7,585 |
Total payments for specific purposes3 | | 6,484 | | 8,822 | | 10,722 |
Total Australian Government payments | | 15,033 | | 16,795 | | 18,307 |
Notes:
| 1. | Numbers may not add due to rounding. |
| 2. | 2009 10 includes partial repayment of compensation for GST deferral associated with small business measures announced by the Australian Government in 2006 07. |
| 3. | Differences between SPPs in this chapter and Australian Government Budget estimates can arise and generally reflect the outcome of agency to agency discussions or the absence of state level information. |
General purpose payments
GST revenue grants and associated payments
GST revenue grants and associated payments to Queensland in 2009-10 are expected to be $7.585 billion, which represents a decrease of $388 million on 2008-09 estimated actuals. GST revenue grants in 2009-10 of $7.660 billion are expected to be $889 million (or 10.4%) less than the $8.549 billion received in 2007-08.
GST revenue projections are based on expected growth in economic parameters, such as household consumption and dwelling investment, which have a strong link to the GST base. The distribution of GST revenues is based on the recommendations of the Commonwealth Grants Commission in accordance with the application of horizontal fiscal equalisation principles.
Queensland’s share of GST funding (relativity) has declined and is below a population share again in 2009-10. It is expected that the Queensland’s relativity and therefore share of GST funding will decline further.
Payments for specific purposes
Australian Government payments for specific purposes to Queensland in 2009-10 are estimated at $10.722 billion.
Chapter 9 provides detailed background on Commonwealth-state financial arrangements, including an analysis of Queensland’s share of GST revenue and details of Australian Government payments to Queensland, including the impact of Council of Australian Government reforms and the Australian Government’s Nation Building and Jobs Plan.
| | | | |
106 | | Budget Strategy and Outlook 2009-10 | | |
Other grants and contributions
Other grants and contributions are funds received from other state and local government agencies, other bodies and individuals where there is no direct benefit to the provider. Contributions exclude Australian Government grants and user charges. The main sources of contributions are:
| • | | those received from private enterprise and community groups to fund research projects and community services, including the contributions of parents and citizens associations to state schools |
| • | | contributed assets and goods and services received for a nominal amount. |
Table 6.9
Other grants and contributions
| | | | | | |
| | | 2007-08
Actual
$ million | | 2008-09
Est. Act.
$ million | | 2009-10
Budget
$ million |
Other grants and contributions | | 489 | | 476 | | 428 |
Revenues will vary from year to year based on the number and size of research projects, assets transferred between the Government and the private sector and contributed assets and services.
SALES OF GOODS AND SERVICES
Sales of goods and services revenue comprises cost recoveries from the provision of goods or services. Revenue from this source is expected to increase by 5.3% in 2009-10.
Table 6.10
Sales of goods and services1
| | | | | | |
| | | 2007-08
Actual
$ million | | 2008-09
Est. Act.
$ million | | 2009-10
Budget
$ million |
Fee for service activities | | 1,418 | | 1,374 | | 1,338 |
TransLink | | 252 | | 277 | | 291 |
Rent revenue | | 341 | | 511 | | 605 |
Sale of land inventory | | 109 | | 52 | | 101 |
Hospital fees | | 305 | | 332 | | 349 |
Transport and traffic fees | | 224 | | 257 | | 250 |
Other sales of goods and services | | 691 | | 664 | | 717 |
Total sales of goods and services | | 3,341 | | 3,466 | | 3,650 |
Note:
| 1. | Numbers may not add due to rounding. |
| | | | |
| | | Budget Strategy and Outlook 2009-10 | | 107 |
Fee for service activities
Major items of fee for service activities across the General Government sector include:
| • | | recoverable works carried out by both the Department of Main Roads and the commercialised arm of the department |
| • | | fees charged by Technical and Further Education (TAFE) colleges |
| • | | fees charged by CITEC for information and telecommunications services to the private sector. |
The Government provides concessions in the form of discounts, rebates and subsidies to improve access to and the affordability of a range of services for individuals or families based on eligibility criteria relating to factors such as age, income and special needs or disadvantage. Appendix B provides details of the concession arrangements established by the Queensland Government.
TransLink
Revenues arise from the arrangements associated with TransLink integrated ticketing and public transport arrangements, which commenced in July 2004. The TransLink entity collects revenues from the operation of public transport services in South East Queensland to fund public transport services in the region. These revenues are estimated at $291 million in 2009-10.
Rent revenue
Rent revenue is earned on the rent or lease of Government buildings, housing, plant and equipment, motor vehicles and car parks. Major items under this category include public housing rentals and rents charged for Government buildings.
Sale of land inventory
Sale of land inventory comprises land sales undertaken by agencies, where the buying and selling of land is a core business activity of the agency, such as the Property Services Group under the Department of Infrastructure and Planning. As such, it is distinct from property disposals undertaken by most Government agencies.
Hospital fees
Hospital fees are collected by public hospitals for a range of hospital services. Fees include those received from private patients and other third party payers, as well as payments received from the Australian Government Department of Veterans’ Affairs for the treatment of veterans.
| | | | |
108 | | Budget Strategy and Outlook 2009-10 | | |
From 1 January 2010, Queensland Health will increase fees to overseas visitors and third party insurance patients for accommodation and theatre fees; and outpatient services and emergency department consultation to recover the cost of service provision. There will be no effect on Medicare eligible patients. Additionally, the fees charged to private patients electing for a single room in a public hospital will increase. Further details are provided in Budget Paper 4 – Measures.
Transport and traffic fees
This category comprises state transport fees, the Traffic Improvement Fee, drivers’ licence fees and various marine licence and registration fees.
Other sales of goods and services
Other sales of goods and services include items such as Title Registration Fees, recreational ship registrations and other licences and permits.
INTEREST INCOME
Interest income accounts for 5.4% of total General Government revenue in 2009-10.
Table 6.11
Interest income
| | | | | | | |
| | | 2007-08
Actual
$ million | | | 2008-09
Est. Act.
$ million | | 2009-10
Budget
$ million |
Interest income | | (275 | ) | | 1,261 | | 2,017 |
Interest income primarily comprises interest earned on the Treasurer’s Cash Balances, Queensland Future Growth Fund balances and investments held to finance future employee entitlements, for example superannuation and long service leave.
The Government has transferred the assets it held in the Consolidated Fund to meet future employee and other obligations to QTC in exchange for a debt instrument that earns the General Government sector 7.5% per annum. This transfer allows the State to reduce the volatility in interest income and hence the General Government net operating balance.
Some volatility in interest income remains, associated with the former defined benefit superannuation balances. However, movements in revenue associated with this group are matched by movements in the expense, such that there is not a significant impact on the operating balance. Further detail in relation to this issue is provided in Chapter 7. In addition, a number of statutory bodies hold investments that are subject to market movements.
| | | | |
| | | Budget Strategy and Outlook 2009-10 | | 109 |
DIVIDEND AND INCOME TAX EQUIVALENT INCOME
Dividend and income tax equivalent income account for 3.1% of total General Government sector revenue in 2009-10.
Table 6.12
Dividend and income tax equivalent income1
| | | | | | |
| | | 2007-08
Actual
$ million | | 2008-09
Est. Act.
$ million | | 2009-10
Budget
$ million |
Dividend | | 1,011 | | 853 | | 884 |
Income tax equivalent income | | 244 | | 245 | | 266 |
Total dividend and income tax equivalent income | | 1,255 | | 1,098 | | 1,150 |
Note:
| 1. | Numbers may not add due to rounding. |
Dividends are received from the State’s equity in Public Non-financial Corporations and Public Financial Corporations, for example, the Queensland electricity supply industry, Queensland Investment Corporation, port authorities and QR Limited.
Dividends are expected to increase by 3.6% in 2009-10, reflecting a moderate growth in dividends received from the transport sector and others, partly off-set by a reduction in dividends received from the energy sector.
Income tax equivalent income comprises payments by Government-owned corporations in lieu of state and Australian Government taxes and levies from which they are exempt. These payments arise from an agreement reached between the Australian Government and state governments in 1994 to establish a process for achieving tax uniformity and competitive neutrality between public sector and private sector trading activities.
Further detail on dividends, income tax equivalent income and other flows between the Public Non-financial Corporations Sector and the General Government sector is provided in Chapter 5.
| | | | |
110 | | Budget Strategy and Outlook 2009-10 | | |
OTHER REVENUE
Other revenue accounts for 6.3% of total General Government revenue in 2009-10, down from 11.2% in 2008-09, due to an expected decline in royalty revenue.
Table 6.13
Other revenue1
| | | | | | |
| | | 2007-08
Actual
$ million | | 2008-09
Est. Act.
$ million | | 2009-10
Budget
$ million |
Royalties and land rents | | 1,460 | | 3,396 | | 1,806 |
Fines and forfeitures | | 219 | | 266 | | 277 |
Revenue nec | | 361 | | 356 | | 271 |
Total Other Revenue | | 2,040 | | 4,017 | | 2,354 |
Note:
| 1. | Numbers may not add due to rounding. |
Royalties and land rents
Royalty estimates
The State earns royalties from the extraction of coal, base and precious metals, bauxite, petroleum, mineral sands and other minerals and land rents from pastoral holdings, mining and petroleum tenures. Royalties return some of the proceeds of the extraction of non-renewable resources to the community.
Royalty and land rent revenue is expected to decrease by $1.590 billion (or 47%) in 2009-10 due to a substantial fall in coal royalties associated with lower contract coal prices.
Table 6.14
Royalties and land rents1
| | | | | | |
| | | 2007-08
Actual
$ million | | 2008-09
Est. Act.
$ million | | 2009-10
Budget
$ million |
Coal | | 993 | | 3,026 | | 1,433 |
Other royalties2 | | 376 | | 262 | | 263 |
Land rents | | 91 | | 108 | | 110 |
Total royalties and land rents | | 1,460 | | 3,396 | | 1,806 |
Notes:
| 1. | Numbers may not add due to rounding. |
| 2. | Includes base and precious metal, petroleum and other minerals royalties. |
| | | | |
| | | Budget Strategy and Outlook 2009-10 | | 111 |
Coal royalties make up the bulk of royalty and land rent revenue, accounting for more than 79% in 2009-10. In 2009-10, the coal royalty estimate is $1.593 billion or 53% lower than in 2008-09, largely reflecting a significant reduction in coal contract prices and a slight decline in export volumes.
Chart 6.6 demonstrates the sharp decline in coal contract prices.
Chart 6.6
Contract Coal Prices, 2000 to 2010
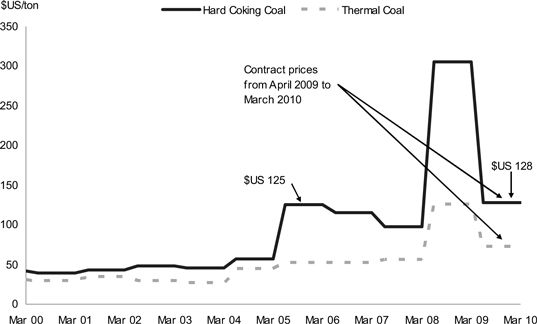
Royalties from base and precious metals are not expected to increase from 2008-09 levels reflecting subdued global demand for commodities.
There is a significant degree of uncertainty associated with estimates of commodity prices and Australian dollar-US dollar exchange rates, both of which have significant impacts on royalty revenue.
Fines and forfeitures
The major fines included in this category are traffic and court fines. There is an expected increase of 4% in collections of fines and forfeitures in 2009-10.
Revenue not elsewhere classified
The $85 million decrease in 2009-10 primarily reflects an expected decline in asset transfers from non-Queensland Government entities.
| | | | |
112 | | Budget Strategy and Outlook 2009-10 | | |
FEATURES
| • | | Total General Government sector expenses are expected to increase by $2.7 billion (or 7.4%) over the estimated actual for 2008-09, to $39.146 billion in 2009-10. |
| • | | Growth in expenses includes a range of service developments and initiatives with a particular focus on the areas of health, education and training, housing and disability services, many of which relate to partnerships with the Australian Government. |
| • | | The major areas of expenditure are health and education, which together constitute approximately 48.2% of General Government sector expenses. |
INTRODUCTION
This chapter provides an overview of General Government sector expenses for the estimated actual outcome for 2008-09, forecasts for the 2009-10 Budget year and projections for 2010-11 to 2012-13. The forward estimates are based on the economic projections outlined in Chapter 2 and are formulated on a no policy change basis.
Table 7.1
General Government sector expenses1
| | | | | | | | | | | | |
| | | 2008-09
Budget
$ million | | 2008-09
Est. Act.
$ million | | 2009-10
Budget
$ million | | 2010-11
Projection
$ million | | 2011-12
Projection
$ million | | 2012-13
Projection
$ million |
Expenses | | | | | | | | | | | | |
| | | | | | |
Employee expenses | | 13,896 | | 14,249 | | 15,006 | | 15,868 | | 16,717 | | 17,241 |
| | | | | | |
Superannuation interest cost | | 1,219 | | 760 | | 1,468 | | 1,551 | | 1,630 | | 1,704 |
| | | | | | |
Other superannuation expenses | | 1,959 | | 2,012 | | 2,093 | | 2,125 | | 2,162 | | 2,165 |
| | | | | | |
Other operating expenses | | 6,782 | | 7,446 | | 7,776 | | 8,001 | | 8,399 | | 8,635 |
| | | | | | |
Depreciation and amortisation | | 2,665 | | 2,551 | | 2,773 | | 3,044 | | 3,261 | | 3,393 |
| | | | | | |
Other interest expenses | | 539 | | 539 | | 887 | | 1,418 | | 1,932 | | 2,299 |
| | | | | | |
Grants expenses | | 8,713 | | 8,889 | | 9,143 | | 8,481 | | 8,090 | | 8,282 |
| | | | | | |
Total Expenses | | 35,772 | | 36,447 | | 39,146 | | 40,488 | | 42,191 | | 43,720 |
Note:
| 1. | Numbers may not add due to rounding. |
| | | | |
| | | Budget Strategy and Outlook 2009-10 | | 113 |
General Government expenses in 2008-09 are estimated to be $36.447 billion, an increase of $675 million over the 2008-09 Budget forecast of $35.772 billion. This increase is primarily due to:
| • | | additional expenditure related to increased Australian Government funding for Specific Purpose Payments, National Partnership payments and Nation Building and Jobs Plan projects, particularly in education and health |
| • | | increased grant expense as a result of increased demand for the First Home Owners Grant to first home buyers driven by the Australian Government’s First Home Owners Boost |
| • | | actuarial revisions to superannuation and long service leave provisions offset by a reduction in former defined benefit superannuation expense. Former defined benefit superannuation obligations represent the liabilities of defined benefit members who have elected to leave the defined benefit scheme. These liabilities are offset by Consolidated Fund investments which move with investment earnings. As a result, lower former defined benefit expense is offset by lower interest income. |
The General Government operating statement provides for aggregate expenses of $39.146 billion in 2009-10, representing an increase of $2.7 billion (or 7.4%) over the 2008-09 estimated actual. Factors influencing the growth in expenses include additional expenditure related to joint projects with the Australian Government and growth in service delivery to meet increased demand and the implementation of service enhancements, which are outlined in Budget Paper 4 – Budget Measures.
As outlined in Chapter 1, the Government recognises the importance of fiscal sustainability and expenditure restraint in supporting Queensland’s future economic growth, while maintaining services and continuing to deliver its commitments to the community. Revised fiscal principles, which must be tabled in Parliament and reported on regularly under the new Financial Accountability Act 2009, include a commitment to limit own-purpose expenses growth (that is, excluding Australian Government related expenses) to inflation and population growth.
For the forward estimates period, average growth in own-purpose expenses is estimated at 4.3%, compared with expected average growth of 4.63% in population and inflation.
The State’s capacity to restrain own-purpose expenses growth is assisted by the following policy parameters:
| • | | revised wages policy which limits wage increases to 2.5% per annum until the Budget returns to surplus |
| • | | public sector efficiency savings target of $280 million per annum from 2009-10 |
| • | | agencies, other than key front line service areas, being required to absorb non-labour cost pressures |
| | | | |
114 | | Budget Strategy and Outlook 2009-10 | | |
| • | | streamlining the Queensland Public Service from 23 departments down to 13 to exploit economies of scale and scope, together with shared services reforms |
| • | | growth in the public sector workforce being limited to front line service delivery areas and targeted policy commitments |
| • | | responding to the independent review of Queensland Government boards, committees and statutory authorities by abolishing 103 bodies and reforming a further 81 bodies |
| • | | the creation of a new Civil and Administrative Tribunal, replacing around 26 different tribunals |
| • | | changes to procurement policy to focus selection of procurement approaches on driving competition and value for money project delivery outcomes which reflect current market conditions |
| • | | the ongoing consolidation of ICT across Government |
| • | | abolition of the Queensland Fuel Subsidy Scheme. |
Government will over time, and in each Budget, review the need for additional Budget initiatives, including productivity and savings measures, to ensure this key fiscal principle is achieved.
EXPENSES BY OPERATING STATEMENT CATEGORY
This section provides a breakdown of General Government expenses in 2009-10 by category and discusses the significant variances between the 2008-09 estimated actual and 2009-10 Budget by expense category.
The Service Delivery Statements provide details of expenditure for individual departments.
Chart 7.1 indicates that the largest expense category in the General Government sector is employee and superannuation expenses (47.4%), reflecting the direct service provision nature of Government activities, followed by grants expenses (23.4%) that include community service obligation payments to Government-owned corporations (GOCs), and grants to non-government schools and to first home buyers.
| | | | |
| | | Budget Strategy and Outlook 2009-10 | | 115 |
Chart 7.1
Expenses by operating statement category, 2009-10
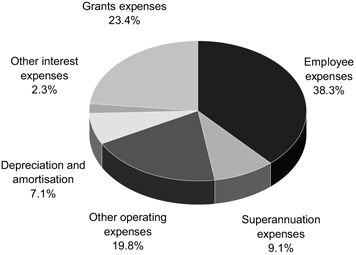
Chart 7.2 compares the 2008-09 estimated actual expenses for each operating statement category with the 2009-10 Budget.
Chart 7.2
Expenses by operating statement category
2008-09 and 2009-10
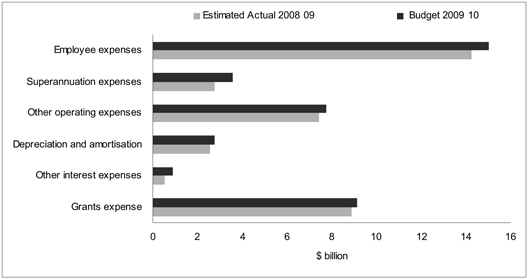
| | | | |
116 | | Budget Strategy and Outlook 2009-10 | | |
DETAILS OF EXPENSES
Employee expenses
Employee expenses include salaries and wages, annual leave and long service leave expenses.
Employee expenses are forecast to increase by $757 million or 5.3% to $15.006 billion in 2009-10. The increase reflects a combination of wage increases related to enterprise bargaining agreements and other services’ growth and enhancements.
The additional staffing provided in the 2009-10 Budget is predominantly in key service delivery areas, including 350 additional teachers and teacher aides to meet enrolment growth in Queensland state schools, 50 additional ambulance officers, 203 additional police positions, including a further 53 specialist traffic officers and 645 doctors, nurses and allied health professionals.
Growth in employee expenses across the forward estimates to 2011-12 averages 5.5% per annum before falling to 3% in 2012-13. This reduction reflects the Government’s revised wages policy which provides for wage increases of 2.5% per annum. Further details of the revised wages policy are outlined in Chapter 1.
Superannuation expenses
The superannuation interest cost represents the imputed interest on the Government’s accruing defined benefit superannuation liabilities and interest costs on former defined benefit superannuation liabilities.
In determining the State’s defined benefit superannuation liabilities, AASB 119 Employee Benefits requires the discounting of future benefit obligations using yield rates on government bonds net of investment tax, estimated at 6.2%. Offset against this expense is the revenue from plan assets based on long-term expected rates of return of 7.25% per annum.
Former defined benefit superannuation obligations represent the liabilities of defined benefit members who have elected to leave the defined benefit scheme. These liabilities are offset by Consolidated Fund investments and move with investment earnings.
In 2009-10, superannuation interest cost is estimated to increase by $708 million to $1.468 billion as earnings on former defined benefit superannuation liabilities are expected to return to the long term average rate of 7.5% per annum. The 2008-09 estimated actual return on these liabilities is negative 15%.
Other superannuation expenses represent employer superannuation contributions to accumulation superannuation and the current service cost of the State’s defined benefit obligation (or the increase in the present value of the defined benefit obligation resulting from employee service in the current period).
| | | | |
| | | Budget Strategy and Outlook 2009-10 | | 117 |
Other operating expenses
Other operating expenses comprise the non-labour costs of providing goods and services, repairs and maintenance, consultancies, contractors, electricity, communications and marketing.
Other operating expenses in 2009-10 are expected to be $7.776 billion, which represents an increase of $330 million (or 4.4%) on 2008-09. Higher spending in education under the Australian Governments’ Building the Education Revolution program is the primary contributor to this increase.
Depreciation and amortisation
Depreciation and amortisation expense is an estimate of the progressive consumption of the State’s assets through normal usage, wear and tear and obsolescence. Growth in this expense category primarily reflects asset revaluations and the size of the State’s capital program.
Other interest expense
Other interest expense includes interest paid on borrowings to acquire capital assets and infrastructure such as roads and government buildings. The growth in this expense over the forward estimates reflects growth in borrowings primarily used to fund the State’s capital program.
The General Government sector has a moderate level of debt in 2009-10 with a total debt servicing cost forecast at $887 million.
Grants expenses
Current grants include grants and subsidies to the community (such as schools, hospitals, benevolent institutions and local governments) and personal benefit payments. Funding includes support for non-government healthcare providers, organisations servicing the community in partnership with government in the family support, disability, youth and childcare sectors. Community service obligations (CSOs) are provided where GOCs are required to provide non-commercial services or services at non-commercial prices for the benefit of the community.
Current grants are estimated to decline moderately to $7.499 billion in 2009-10 (see Table 7.2). The significant increase in grants to non-government schools and non-profit organisations are offset by the abolition of the State’s fuel subsidy scheme from 1 July 2009 and lower electricity CSO payments as a result of a reduction in cost disparity to supply electricity in regional areas. CSO payments, mainly to QR Limited and Ergon Energy, total $1.569 billion in 2009-10.
| | | | |
118 | | Budget Strategy and Outlook 2009-10 | | |
The increase in grants to non-government schools is largely due to expenditure under Australian Government programs, including Building the Education Revolution. Grants to non-profit organisations grow in key service areas of disability and community services and social housing, particularly as a result of the Queensland Industrial Relations Commission’s decision to increase award rates for community service workers.
Capital transfers represent grants to GOCs, local governments, non-profit institutions and other non-government entities, such as businesses and households, including First Home Owner Grant schemes, for capital purposes. An increase in capital grants to local government and non-profit organisations predominately reflects additional expenditure in social housing.
The decrease in grants to first home buyers reflects the Australian Government’s policy of decreasing, then abolishing, the First Home Owners Boost in 2009-10.
Table 7.2 indicates the composition of grant payments by recipient.
Table 7.2
Grant expenses1
| | | | |
| | | 2008-09
Est. Act.
$ million | | 2009-10
Budget
$ million |
Current | | | | |
Fuel Subsidy Scheme | | 560 | | 28 |
Grants to local government | | 579 | | 569 |
Grants to non-government schools | | 1,775 | | 2,257 |
Grants to non-profit organisations | | 1,046 | | 1,241 |
Grants to other non-government recipients | | 1,883 | | 1,729 |
Community service obligations to PNFCs | | 1,654 | | 1,569 |
Other payments to PNFCs | | 81 | | 105 |
Total current transfers | | 7,578 | | 7,499 |
| | |
Capital | | | | |
First Home Owner Grant Scheme | | 240 | | 220 |
First Home Owners Boost Scheme | | 161 | | 142 |
Grants to local government | | 621 | | 775 |
Grants to non-profit organisations | | 66 | | 256 |
Grants to other non-government recipients | | 167 | | 176 |
Other payments to PNFCs | | 56 | | 75 |
Total capital transfers | | 1,312 | | 1,645 |
| | |
Total current and capital transfers | | 8,889 | | 9,143 |
Note:
| 1. | Numbers may not add due to rounding. |
| | | | |
| | | Budget Strategy and Outlook 2009-10 | | 119 |
OPERATING EXPENSES BY PURPOSE
Chart 7.3
General Government expenses by purpose, 2009-10
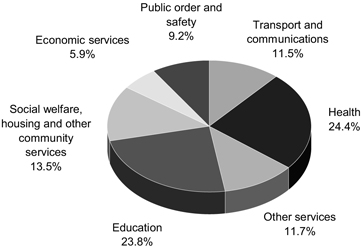
Chart 7.3 indicates the proportion of expenditure by major purpose classification for the 2009-10 Budget. Health accounts for the largest share of expenses (24.4%) followed by Education (23.8%).
| | | | |
120 | | Budget Strategy and Outlook 2009-10 | | |
Chart 7.4
General Government expenses by purpose
2008 09 and 2009-10
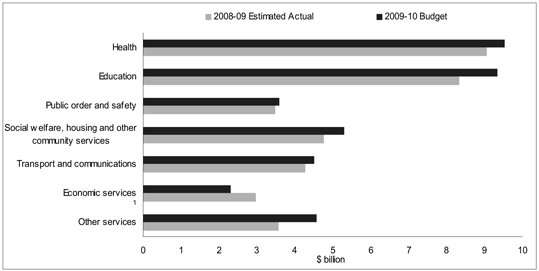
Note:
| 1. | In 2009 10, other services increase as superannuation interest costs on former defined benefit liabilities are expected to return to the long term average rate of 7.5% per annum, compared to 2008 09 estimated return of 15%. |
As evidenced in Chart 7.4, expenditure increases in all key service delivery areas from 2008-09 estimated actual to 2009-10 Budget. The decrease in economic services is due to the abolition of the fuel subsidy in 2009-10.
The Government has consistently had a clear focus on improving key service areas such as education, health, public order and safety and community services. This section provides a breakdown of General Government expenditure by purpose between the estimated actual and 2009-10 Budget.
| | | | |
| | | Budget Strategy and Outlook 2009-10 | | 121 |
Education
The State’s investment in education encompasses early childhood education and care, State and non-State education, technical and further education (TAFE) and higher education. The 2009-10 Budget for education is $9.332 billion, representing an increase of $1 billion (or 12.1%), over estimated actual expenditure.
Initiatives contributing to the growth in education expenditure in 2009-10 include:
| • | | 350 additional teachers and teacher aides to meet enrolment growth in Queensland state schools |
| • | | implementation of Commonwealth-State National Partnership Agreements, including the provision of additional training places under the Productivity Places Program and provision of universal access to quality early childhood education under the Early Childhood Reform National Partnership |
Health
In 2009-10, funding for health services within the Queensland Government will grow to $9.523 billion, an increase of 5.1% on the 2008-09 estimated actual. The health function includes expenses relating to acute hospital services, including provision of medical, surgical and obstetric services, provision of primary health care for individuals or small targeted groups providing curative, promotive, preventative and rehabilitative services, access to quality emergency medical and outpatient services, residential care services for the aged and young people with physical and intellectual disabilities and mental heath services.
The Council of Australian Governments (COAG) recently endorsed specific health funding reforms including funding under the new National Healthcare Agreement (effective from 1 July 2009) and National Partnership Agreements. These agreements direct additional State and Australian Government funds to key areas of the health system such as hospitals and health workforce reform, preventive health and health services.
In 2009-10, Queensland Health will focus spending on upgrading emergency departments, new rehabilitation and maternity services and expanding cancer treatment facilities and has committed to:
| • | | a target of employing at least 3,500 additional doctors, nurses and allied health workers over the next three years |
| • | | additional funding to the Surgery Connect program to provide an additional 20,000 elective surgery operations (including 3,300 for children) over three years |
| • | | recruit and train new nurse practitioners to work in the busiest emergency departments. |
| | | | |
122 | | Budget Strategy and Outlook 2009-10 | | |
Public order and safety
Public order and safety includes funding to police, legal services and law courts, fire protection, prisons and corrective services. Expenditure growth under this function is expected to increase 3.4% to $3.594 billion in 2009-10.
The growth in the public order and safety function is partially due to the Government’s continued support for effective delivery of policing services to the Queensland community through more police officers, including 203 additional police positions, better technology to fight crime and improvements to road safety.
Social welfare, housing and other community services
Services provided under the category of social welfare, housing and other community services include community, youth justice, child safety, disability and housing services. Expenditure under this function is estimated to increase 11.2% to $5.307 billion in 2009-10.
2009-10 sees a significant investment in improving housing and homelessness services. Underpinning this investment are the joint programs between the Queensland and Australian Governments under the Nation Building and Jobs Plan and the National Partnership Agreements for Social Housing, Remote Indigenous Housing and Homelessness.
Funding for specialist disability services, non-clinical mental health services and home and community care services will also increase in 2009-10, including additional funding to support the needs of the frail aged, people with disabilities and their carers under the Home and Community Care Program.
In recognition of the increase in award wage rates for community services workers, the Government will also provide additional funding for allocation on a prioritised basis to State supported non-Government services to dependant and vulnerable Queenslanders.
Transport and communications
The transport and communication function incorporates the State’s road network and transport systems including rail, port, freight and aviation systems. Transport and communication expenditure increases 5.7% to $4.511 billion in 2009-10.
The State Government continues to progress the implementation of the South East Queensland Infrastructure Plan and Program (SEQIPP) and the Roads Implementation Program (RIP). For 2009-10, SEQIPP funding priorities include providing for population growth and managing traffic congestion in South East Queensland and RIP initiatives include enhancing and preserving road networks and sustaining employment for people in roads and related industries.
| | | | |
| | | Budget Strategy and Outlook 2009-10 | | 123 |
DEPARTMENTAL EXPENSES
Data presented in Tables 7.3 and 7.4 provide a summary drawn from financial statements contained in Budget Paper 5—Service Delivery Statements. Further information on the composition of expenses, outputs delivered and factors influencing the movement in expenses can also be obtained from the Service Delivery Statements.
Table 7.3
Departmental Controlled Expense 1,2
| | |
| | | 2009 10
Estimate
$’000 |
Communities | | 3,799,559 |
Community Safety | | 1,573,382 |
Education and Training | | 7,217,329 |
Electoral Commission of Queensland | | 9,559 |
Employment, Economic Development and Innovation | | 974,818 |
Environment and Resource Management | | 914,586 |
Forestry Plantations Queensland Office | | 30,504 |
Health | | 9,037,031 |
Infrastructure and Planning | | 725,775 |
Justice and Attorney General | | 467,377 |
Legislative Assembly | | 73,284 |
Office of the Governor | | 5,056 |
Office of the Ombudsman | | 6,755 |
Police | | 1,705,813 |
Premier and Cabinet | | 198,297 |
Public Service Commission | | 11,332 |
Public Works | | 612,357 |
Queensland Audit Office | | 40,001 |
The Public Trustee of Queensland | | 66,167 |
Transport and Main Roads | | 3,727,279 |
Treasury | | 143,488 |
Total Expenses | | 31,339,749 |
Notes:
| 1. | Total expenses by department does not equate to total General Government expenses in Uniform Presentation Framework (UPF) terms reported elsewhere in the Budget Papers as General Government expenses include a wider range of entities including State Government statutory authorities. In addition, transactions eliminated between entities within the General Government sector (for example payroll tax payments) are excluded in the preparation of whole of Government UPF financial statements. |
| 2. | Explanation of variations in departmental controlled expenses can be found in the Service Delivery Statements. |
| | | | |
124 | | Budget Strategy and Outlook 2009-10 | | |
Table 7.4
Departmental Administered Expense 1,2
| | |
| | | 2009 10
Estimate
$’000 |
Communities | | 268,829 |
Education and Training | | 2,437,480 |
Employment, Economic Development and Innovation | | 461,012 |
Environment and Resource Management | | 36,496 |
Health | | 24,076 |
Infrastructure and Planning | | 388,784 |
Justice and Attorney General | | 215,797 |
Police | | 429 |
Premier and Cabinet | | 216,257 |
Public Works | | 68,743 |
The Public Trustee of Queensland | | 2,002 |
Transport and Main Roads | | 828,040 |
Treasury | | 4,040,487 |
Total Expenses | | 8,988,432 |
Notes:
| 1. | Total expenses by department does not equate to total General Government expenses in Uniform Presentation Framework (UPF) terms reported elsewhere in the Budget Papers as General Government expenses include a wider range of entities including State Government statutory authorities. In addition, transactions eliminated between entities within the General Government sector (for example payroll tax payments) are excluded in the preparation of whole of Government UPF financial statements. |
| 2. | Explanation of variations in departmental administered expenses can be found in the Service Delivery Statements. |
| | | | |
| | | Budget Strategy and Outlook 2009-10 | | 125 |
Table 7.5
Reconciliation of Departmental to UPF Expenses 1
| | | |
| | | 2009 10
Estimate
$ million | |
Departmental expenditure per Service Delivery Statements Controlled (Table 7.3) | | 31,340 | |
Administered (Table 7.4) | | 8,988 | |
| |
Non UPF departmental expenses and whole of Government schemes2 | | (2,082 | ) |
| |
Other General Government entities (e.g. CBUs, SSPs, Statutory Bodies) | | 4,795 | |
| | 43,042 | |
| |
Superannuation Interest cost | | 1,468 | |
| |
Eliminations and Other whole of Government adjustments | | | |
Elimination of payments to CBUs and SSPs | | (3,317 | ) |
Payroll Tax elimination | | (491 | ) |
Other eliminations and adjustments | | (1,555 | ) |
| |
Total General Government UPF Expenses | | 39,146 | |
Notes:
| 1. | Numbers may not add due to rounding. |
| 2. | Certain expenses such as asset valuation changes are excluded from UPF reporting. In addition, this item removes the effect of cash payments for whole of Government schemes such as the State’s share of superannuation beneficiary payments reported in Treasury Administered’s expenses. Costs associated with these schemes are accrued annually. |
| | | | |
126 | | Budget Strategy and Outlook 2009-10 | | |
| 8 | BALANCE SHEET AND CASH FLOWS |
FEATURES
| • | | Queensland’s balance sheet is expected to remain strong in 2009-10 with State net worth projected to rise by $1.344 billion through the year to $151.1 billion. |
| • | | Total borrowings and advances are expected to increase by $7.996 billion in 2009-10, primarily as a result of increased investment in public infrastructure assets. The increase in borrowings is the major contributor to the projected $8.141 billion decrease in net financial worth of the General Government sector in 2009-10. |
| • | | The General Government sector is forecast to record a cash deficit of $6.838 billion in 2009-10, after allowing for $9.020 billion in net asset purchases. |
INTRODUCTION
The 2009-10 balance sheet shows the projected assets, liabilities and net worth of the General Government sector as at 30 June 2010. It is important for the Government to maintain a strong balance sheet to provide it with the stability, flexibility and capacity to deal with any emerging financial and economic pressures.
The assets and liabilities in the balance sheet are defined according to the Uniform Presentation Framework (UPF).
Detailed balance sheet and cashflow information for the General Government sector and the other sectors is contained in Chapter 10.
| | | | |
| | | Budget Strategy and Outlook 2009-10 | | 127 |
BALANCE SHEET
Table 8.1 provides a summary of the key balance sheet measures for the General Government sector.
Table 8.1
General Government sector: summary of budgeted balance sheet1
| | | | | | | | | | | | | | | | | | |
| | | 2008-09
Budget 2
$ million | | | 2008-09
Est. Act.
$ million | | | 2009-10
Budget
$ million | | | 2010-11
Projection
$ million | | | 2011-12
Projection
$ million | | | 2012-13
Projection
$ million | |
Financial assets | | 54,811 | | | 47,544 | | | 49,056 | | | 51,214 | | | 53,312 | | | 56,190 | |
| | | | | | |
Non-financial assets | | 113,399 | | | 146,987 | | | 156,471 | | | 164,372 | | | 170,026 | | | 173,588 | |
| | | | | | |
Total Assets3 | | 168,209 | | | 194,531 | | | 205,527 | | | 215,586 | | | 223,337 | | | 229,778 | |
| | | | | | |
Borrowings and advances | | 9,311 | | | 11,250 | | | 19,246 | | | 28,357 | | | 35,154 | | | 39,670 | |
| | | | | | |
Superannuation liability | | 21,874 | | | 23,949 | | | 25,303 | | | 26,580 | | | 27,766 | | | 28,854 | |
| | | | | | |
Other provisions and liabilities | | 8,461 | | | 9,532 | | | 9,833 | | | 9,852 | | | 10,208 | | | 10,586 | |
| | | | | | |
Total Liabilities | | 39,646 | | | 44,731 | | | 54,382 | | | 64,789 | | | 73,128 | | | 79,110 | |
| | | | | | |
Net Worth | | 128,563 | | | 149,800 | | | 151,144 | | | 150,797 | | | 150,209 | | | 150,668 | |
| | | | | | |
Net Financial Worth | | 15,164 | | | 2,814 | | | (5,327 | ) | | (13,575 | ) | | (19,816 | ) | | (22,920 | ) |
| | | | | | |
Net Financial Liabilities | | 5,504 | | | 12,391 | | | 20,999 | | | 29,691 | | | 36,555 | | | 40,525 | |
| | | | | | |
Net Debt | | (21,928 | ) | | (17,808 | ) | | (10,672 | ) | | (2,796 | ) | | 2,749 | | | 5,901 | |
Notes:
| 1. | Numbers may not add due to rounding. |
| 2. | Numbers have been restated where subsequent changes in classification have occurred. |
| 3. | For UPF purposes, the State’s assets are classed as either financial or non financial assets. |
Financial assets
The General Government sector holds the full equity of the State’s public enterprises, principally its shareholding in Government-owned corporations (GOCs) but also Public Financial Corporations like Queensland Treasury Corporation (QTC), in much the same manner as the parent or holding company in a group of companies. The estimated net investment in public enterprises ($15.672 billion at 30 June 2010) is included in the General Government sector’s financial assets.
Financial assets of $47.544 billion are forecast for 2008-09, or $7.267 billion lower than originally budgeted, reflecting lower than forecast returns on investments held for former defined benefit members and a decline in investments in public sector entities. The reduction in the value of the Public Non-financial Corporations sector is primarily due to market value adjustments to their loans with QTC. The reduction in the value of the Public Financial Sector is due to negative returns on investments held by QTC and WorkCover.
| | | | |
128 | | Budget Strategy and Outlook 2009-10 | | |
In the year to 30 June 2010, financial assets are projected to increase by $1.512 billion, attributable principally to increased investment in assets set aside to meet future employee liabilities.
Chart 8.1 shows projected General Government sector financial assets by category at 30 June 2010. Investments held to meet future liabilities including superannuation and long service leave comprise the major part of the State’s financial assets.
Chart 8.1
Projected General Government financial assets by category at 30 June 2010
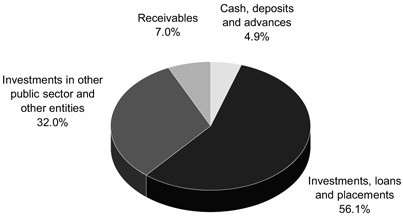
Non-financial assets
General Government non-financial assets are projected to total $156.5 billion at 30 June 2010. These assets consist primarily of land and other fixed assets of $149.9 billion, the majority of which are roads, schools, hospitals and other infrastructure used to provide services to Queenslanders. Other non-financial assets of $6.583 billion held by the State include prepayments and deferred tax assets relating to income tax equivalents collected primarily from GOCs.
| | | | |
| | | Budget Strategy and Outlook 2009-10 | | 129 |
Changes in non-financial assets occur for a number of reasons including:
| • | | construction and purchase of assets, either to replace existing assets or provide additional capacity for the State to deliver services |
| • | | revaluations of assets required under accounting standards |
| • | | depreciation and disposals of assets. |
Non-financial assets in the year ending 30 June 2010 are expected to grow by $9.484 billion over the 2008-09 estimated actual. Of this increase, $9.270 billion represents the acquisition of non-financial assets.
The Government has traditionally funded new infrastructure at levels well beyond that of the other states. General Government purchases of non-financial assets per capita have far exceeded the average of the other states and territories for well over a decade (see chart 4.1 in chapter 4).
Liabilities
The largest accruing liability in the General Government sector is currently employee entitlements (principally superannuation and long service leave) which are projected to total $29.374 billion at 30 June 2010. The other major component of liabilities is borrowings and advances received.
Total liabilities are budgeted to increase by $9.651 billion in 2009-10, largely on account of increased borrowing to support the State’s capital program and growth in the General Government superannuation liability.
State public sector superannuation liabilities include defined benefit liabilities for current employees and the balance of former scheme members (retirement, resignation, etc.) who choose to retain their funds within QSuper.
The proportion of the State’s total superannuation liability relating to former scheme members is expected to increase over the forward estimates period as these investment balances grow.
Over the Budget and forward estimates period, total additional General Government net borrowings and advances of $28.302 billion are planned to fund the $28.282 billion worth of capital projects in the General Government sector and $1.191 billion worth of equity injections to the Public Non-financial Corporations sector to support expansion of the State’s water, ports, energy and rail infrastructure.
The remainder of the liabilities balance consists of payables and other liabilities such as unearned revenue and provisions.
The composition of the General Government sector’s liabilities is illustrated in Chart 8.2.
| | | | |
130 | | Budget Strategy and Outlook 2009-10 | | |
Chart 8.2
Projected General Government liabilities by category at 30 June 2010
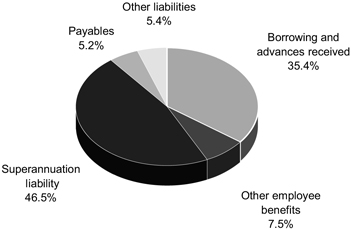
Net financial worth
The net financial worth measure is an indicator of financial strength. Net financial worth is defined as financial assets less all existing and accruing liabilities. Financial assets include cash and deposits, advances, financial investments, loans, receivables and equity in public enterprises.
The net financial worth measure is broader than the alternative measure – net debt –which measures only cash, advances and investments on the assets side and borrowings and advances on the liabilities side.
The net financial worth of the General Government sector for 2009-10 is forecast at negative $5.327 billion. Net financial worth is expected to decrease over the forward estimates period as the sector increases borrowings to fund infrastructure assets (which are not included in the calculation of net financial worth).
| | | | |
| | | Budget Strategy and Outlook 2009-10 | | 131 |
Net financial liabilities
Net financial liabilities are total liabilities less financial assets, other than equity investments in other public sector entities. This measure is broader than net debt as it includes significant liabilities, other than borrowings (for example, accrued employee liabilities such as superannuation and long service leave entitlements). The net financial liabilities of the General Government sector for 2009-10 are forecast at $20.999 billion.
Queensland’s level of liquidity continues to be in excess of the other states as illustrated in Chart 8.3.
Chart 8.3
Projected ratio of financial assets to liabilities
(excluding investments in public enterprises) at 30 June 2010
General Government sector
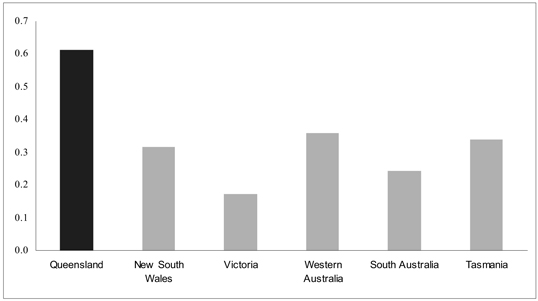
Source: State Budget Papers for QLD, Vic, WA, SA and Tas. Half Yearly Review for NSW.
Net worth
The net worth, or equity, of the State is the amount by which the State’s assets exceed its liabilities (which is equivalent to General Government net worth). This is the value of the investment held on behalf of the people of Queensland by public sector instrumentalities.
Changes in the State’s net worth occur for a number of reasons including:
| • | | operating surpluses (deficits) that increase (decrease) the Government’s equity |
| • | | revaluation of assets and liabilities as required by accounting standards. Most financial liabilities are revalued on a regular basis. For example, the Government’s accruing liabilities for employee superannuation and long service leave are determined by actuarial assessments |
| | | | |
132 | | Budget Strategy and Outlook 2009-10 | | |
| • | | movements in the net worth of the State’s investments in the Public Non-financial Corporations and Public Financial Corporations sectors |
| • | | gains or losses on disposal of assets. Government agencies routinely buy and sell assets. Where the selling price of an asset is greater (less) than its value in an agency’s accounts, the resultant profit (loss) affects net worth. |
The net worth of the General Government sector in 2008-09 is forecast to be $149.8 billion. This exceeds growth forecasts in the 2008-09 Budget by $21.237 billion primarily as a result of revaluations of major assets at 30 June 2008 as part of the State’s asset revaluation cycle.
Net worth is forecast to grow by $1.344 billion to $151.1 billion in 2009-10.
Chart 8.4 shows the State’s strong net worth compared with the other states and territories. Queensland’s per capita net worth is 72.7% greater than the average per capita net worth of the other states and territories.
Chart 8.4
Interjurisdictional comparison of projected per capita net worth at 30 June 2010
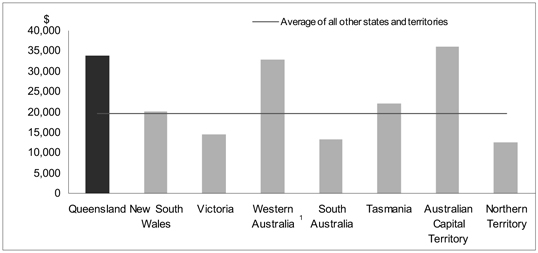
Note:
| 1. | Western Australia values land under roads as part of its overall asset base. This has been adjusted to allow comparison with other jurisdictions which do not value land under roads. |
Source: State Budget Papers for QLD, Vic, WA, SA, Tas, ACT and NT. Half Yearly Review for NSW. Population data from Australian Government Budget Paper No.3, 2009 10.
| | | | |
| | | Budget Strategy and Outlook 2009-10 | | 133 |
Net debt
Net debt is the sum of advances received and borrowings less cash and deposits, advances paid and investments, loans and placements. The extent of accumulated net debt is used to judge the overall strength of a jurisdiction’s fiscal position. High levels of net debt impose a call on future revenue flows to service that debt and meeting these payments can limit government flexibility to adjust outlays. Excessive net debt can call into question the ability of government to service that debt.
As shown in Table 8.2, the General Government sector has negative net debt, that is, a surplus of financial assets over financial liabilities.
Queensland’s negative net debt of $2,398 per capita compares to the weighted average net debt of $1,189 per capita in the other states. This indicates the strength of Queensland’s financial position relative to the other states.
Table 8.2
Projected net debt per capita at 30 June 2010
| | | | | | | | | | | | | | |
| | | QLD | | | NSW | | VIC | | WA | | SA | | TAS | |
Net debt per capita ($) | | (2,398 | ) | | 1,102 | | 1,819 | | 331 | | 1,315 | | (964 | ) |
Source: State Budget Papers for QLD, Vic, WA, SA and Tas.. Half Yearly Review for NSW. Population data from Australian Government Budget Paper No.3, 2009 10.
CASH FLOWS
The cash flow statement provides information on the Government’s estimated cash flows from its operating, financing and investing activities.
The cash flow statement records estimated cash payments and cash receipts and hence differs from accrued revenue and expenditure recorded in the operating statement. In particular, the operating statement often records revenues and expenses that do not have an associated cash flow (for example, depreciation expense). The timing of recognition of accrued revenue or expense in the operating statement may differ from the actual cash disbursement or receipt (for example, tax equivalents). A reconciliation between the cash flows from operations and the operating statement is provided later in this chapter.
| | | | |
134 | | Budget Strategy and Outlook 2009-10 | | |
The cash flow statement also records cash flows associated with investing and financing activities that are otherwise reflected in the balance sheet. For example, purchases of capital equipment are recorded in the cash flow statement and impact on the balance sheet through an increase in physical assets.
The cash flow statement provides the cash surplus (deficit) measure which is comprised of the net cash flow from operating activities plus the net cash flow from investment in non-financial assets (or physical capital).
The Australian Bureau of Statistics Government Finance Statistics (GFS) surplus (deficit) is derived by including the initial increase in liability at the beginning of finance leases in the cash surplus (deficit). This measure is also used to derive the Loan Council Allocation nomination, provided in Chapter 10.
A cash deficit of $6.838 billion is forecast in 2009-10 for the General Government sector, with the cash result forecast to remain in deficit in the outyears. Apart from the cash impact of recurrent operating deficits in outyears, the major factor contributing to lower cash results is the planned capital expansion. Total General Government capital purchases of $9.270 billion are budgeted for 2009-10.
Over the period 2009-10 to 2012-13, capital expenditure is expected to total $28.282 billion in the General Government sector. This substantial investment in capital drives the cash deficits.
Table 8.3 provides summary cash flow information for the General Government sector for 2008-09, 2009-10 and the outyears. Detailed cash flow tables are included in Chapter 10.
| | | | |
| | | Budget Strategy and Outlook 2009-10 | | 135 |
Table 8.3
General Government sector: summary of budgeted cash flows1
| | | | | | | | | | | | | | | | | | |
| | | 2008-09
Budget2
$ million | | | 2008-09
Est. Act.
$ million | | | 2009-10
Budget
$ million | | | 2010-11
Projection
$ million | | | 20011-12
Projection
$ million | | | 2012-13
Projection
$ million | |
Cash receipts from operating activities | | 37,297 | | | 36,899 | | | 38,341 | | | 37,844 | | | 39,118 | | | 41,065 | |
| | | | | | |
Cash payments for operating activities | | (32,955 | ) | | (34,250 | ) | | (36,160 | ) | | (37,086 | ) | | (38,509 | ) | | (40,027 | ) |
| | | | | | |
Net cash inflows from operating activities | | 4,341 | | | 2,649 | | | 2,181 | | | 758 | | | 609 | | | 1,038 | |
| | | | | | |
Net cash flows from investing activities | | (7,786 | ) | | (7,458 | ) | | (10,665 | ) | | (10,099 | ) | | (7,606 | ) | | (5,563 | ) |
| | | | | | |
Receipts from financing activities | | 2,897 | | | 3,989 | | | 7,937 | | | 9,063 | | | 6,777 | | | 4,525 | |
| | | | | | |
Net increase/(decrease) in cash held | | (548 | ) | | (821 | ) | | (546 | ) | | (278 | ) | | (219 | ) | | 1 | |
| | | | | | |
Derivation of cash surplus (deficit) | | | | | | | | | | | | | | | | | | |
| | | | | | |
Net cash inflows from operating activities | | 4,341 | | | 2,649 | | | 2,181 | | | 758 | | | 609 | | | 1,038 | |
| | | | | | |
Net cash flows from investments in non-financial assets | | (6,311 | ) | | (6,793 | ) | | (9,020 | ) | | (8,274 | ) | | (5,944 | ) | | (3,962 | ) |
| | | | | | |
Equals cash surplus/(deficit) | | (1,970 | ) | | (4,144 | ) | | (6,838 | ) | | (7,516 | ) | | (5,335 | ) | | (2,924 | ) |
Notes:
| 1. | Numbers may not add due to rounding. |
| 2. | Numbers have been restated where subsequent changes in classification have occurred. |
| | | | |
136 | | Budget Strategy and Outlook 2009-10 | | |
Cash flows from operating activities
Table 8.4 provides a disaggregation of operating cash flows.
Table 8.4
General Government sector: cash flows from operating activities1
| | | | | | | | | |
| | | 2008-09
Budget2
$ million | | | 2008-09
Est. Act.
$ million | | | 2009-10
Budget
$ million | |
Cash receipts from operating activities | | | | | | | | | |
| | | |
Taxes received | | 10,105 | | | 8,801 | | | 9,286 | |
Grants and subsidies received | | 15,526 | | | 17,122 | | | 18,735 | |
Sales of goods and services | | 3,749 | | | 3,910 | | | 4,050 | |
Interest receipts | | 2,197 | | | 1,257 | | | 2,010 | |
Dividend and income tax equivalents | | 1,012 | | | 1,145 | | | 1,042 | |
Other receipts | | 4,707 | | | 4,665 | | | 3,219 | |
| | | |
Total operating receipts | | 37,297 | | | 36,899 | | | 38,341 | |
| | | |
Cash payments for operating activities | | | | | | | | | |
| | | |
Payments for employees | | (15,674 | ) | | (15,992 | ) | | (16,975 | ) |
Payments for goods and services | | (7,246 | ) | | (8,067 | ) | | (8,442 | ) |
Grants and subsidies | | (8,757 | ) | | (8,898 | ) | | (9,097 | ) |
Interest paid | | (540 | ) | | (534 | ) | | (883 | ) |
Other payments | | (739 | ) | | (759 | ) | | (762 | ) |
| | | |
Total operating payments | | (32,955 | ) | | (34,250 | ) | | (36,160 | ) |
| | | |
Net cash inflows from operating activities | | 4,341 | | | 2,649 | | | 2,181 | |
Notes:
| 1. | Numbers may not add due to rounding. |
| 2. | Numbers have been restated where subsequent changes in classification have occurred. |
Cash inflows from operating activities include receipts from taxes, grants from the Australian Government, fees and charges levied on the provision of goods and services, interest receipts from investments and dividend and income tax receipts from public non-financial and financial corporations.
Taxes received by the General Government sector are forecast at $9.286 billion in 2009-10, an increase of 5.5% or $485 million on the 2008-09 estimated actual of $8.801 billion. This primarily reflects the impact of taxation measures announced in the Mid Year Fiscal and Economic Review.
| | | | |
| | | Budget Strategy and Outlook 2009-10 | | 137 |
Grants and subsidies received are forecast at $18.735 billion in 2009-10, an increase of $1.613 billion or 9.4% on the 2008-09 estimated actual of $17.122 billion primarily as a result of increased grant funding from the Commonwealth.
Sales of goods and services are forecast at $4.050 billion for 2009-10, an increase of 3.6% on the 2008-09 estimated actual of $3.910 billion, and include fines and regulatory fees, user charges and rental income.
Interest receipts are expected to increase in 2009-10 by $753 million or 60%, to $2.010 billion. This reflects earnings of 7.5% on the debt instrument issued by QTC and the return to long term expected earnings on investments held on behalf of former defined benefit members and statutory bodies.
Dividends and income tax equivalents received from public non-financial and public financial corporations are expected to decrease in 2009-10 by $103 million to $1.042 billion.
Other receipts are forecast at $3.219 billion in 2009-10 a decrease of 31% primarily as a result of decreased coal royalties.
Operating cash outflows represent payment for goods and services, wages and salaries, finance costs and grants and subsidies paid to households, businesses and other Government agencies. In 2009-10 the largest cash disbursement is payments for employees at $16.975 billion or 46.9% of total cash payments from operating activities.
In 2009-10, payments for goods and services are expected to increase 4.6% to $8.442 billion primarily as a result of expanded service delivery.
Cash payments for grants and subsidies are expected to increase by $199 million in 2009-10 to $9.097 billion. This figure includes recurrent grants paid by the Australian Government through the State to non-state schools, grants paid to industry and grants to non-profit institutions. This item also includes community service obligation payments to the energy sector and QR Limited, and capital grants which are largely paid to local government authorities to fund capital works.
Interest paid is expected to increase by $349 million reflecting higher borrowings for the capital program.
| | | | |
138 | | Budget Strategy and Outlook 2009-10 | | |
Other payments mainly comprise sundry expenditure such as insurance claims and Goods and Services Tax (GST) remitted to the Australian Taxation Office.
Cash flows from investments
Cash flows from investments include both financial and non-financial assets. Table 8.5 provides a disaggregation of investment cash flows into the different types.
Table 8.5
General Government sector: cash flows from investing activities
| | | | | | | | | |
| | | 2008-09
Budget1
$ million | | | 2008-09
Est. Act.
$ million | | | 2009-10
Budget
$ million | |
Cash flows from investments in non-financial assets | | (6,311 | ) | | (6,793 | ) | | (9,020 | ) |
| | | |
Net cash flows from investments in financial assets for policy purposes | | (389 | ) | | (229 | ) | | (307 | ) |
| | | |
Net cash flows from investments in financial assets for liquidity purposes | | (1,086 | ) | | (436 | ) | | (1,338 | ) |
| | | |
Net cash flows from investing activities | | (7,786 | ) | | (7,458 | ) | | (10,665 | ) |
Note:
| 1. | Numbers have been restated where subsequent changes in classification have occurred. |
The largest cash disbursement for the Government, outside of recurrent operations, is for investments in non-financial assets. This represents the Government’s capital works program which provides for infrastructure such as schools, hospitals and roads.
Cash outflows from investments in non-financial assets are expected to increase to $9.020 billion in 2009-10 from $6.793 billion in 2008-09, an increase of 32.8%.
The cash expenditure on investments in non-financial assets differs from the estimates of capital works expenditure in Budget Paper 3 – Capital Statement. The estimates contained in that paper are on a gross basis and incorporate both departmental agencies and the Public Non-financial Corporations sector. In addition, Budget Paper 3 only includes capital expenditure (including capital grants) within Queensland and does not offset proceeds from asset sales.
| | | | |
| | | Budget Strategy and Outlook 2009-10 | | 139 |
Apart from investing in infrastructure, governments also manage financial assets in order to finance overall expenditures. In addition, Queensland manages financial assets set aside to provide for future employee benefits (for example, superannuation and long service leave). The Government manages its financial assets through a combination of borrowing or investing funds and reducing or increasing equity in government or private sector entities. Investments in financial assets include activities relating to both policy and liquidity.
Investments in financial assets for policy purposes include net equity injections into Government and other business enterprises and the net cash flow from disposal or return of equity in Government business enterprises.
Cash outflows from investments for policy purposes in 2008-09 of $229 million reflect equity transactions by the General Government sector with public non-financial and public financial corporations. In 2008-09, this is partially offset by the return of proceeds on the long term lease of the Cairns and Mackay airports and the sale of the Port of Brisbane Corporation’s remaining share in the Brisbane Airport Corporation Pty Ltd.
Cash outflows from investments in financial assets for policy purposes for 2009-10 of $307 million reflect net equity injections into public enterprises.
Net cash flows from investments in financial assets for liquidity purposes represent net investment in financial assets to cover liabilities such as superannuation, other employee entitlements and insurance.
The 2008-09 estimated net cash outflow from investments in financial assets for liquidity purposes of $436 million is substantially lower than the forecast outflow in the 2008-09 Budget due to the lower than forecast return on investments held for former defined benefit members and their subsequent reinvestment, as well as the liquidation of investments to make beneficiary payments.
Net cash outflows from investments in financial assets for liquidity purposes are estimated to be $1.338 billion in 2009-10. The increased outflow compared to 2008-09 reflects the reinvestment of interest earnings based on the earnings at the long term rate.
| | | | |
140 | | Budget Strategy and Outlook 2009-10 | | |
Cash flows from financing activities
Cash flows generated from financing activities are outlined in Table 8.6 below.
Table 8.6
General Government sector: cash flows from financing activities1
| | | | | | | | | |
| | | 2008-09
Budget2
$ million | | | 2008-09
Est. Act.
$ million | | | 2009-10
Budget
$ million | |
Advances received (net) | | (18 | ) | | (24 | ) | | (17 | ) |
| | | |
Borrowing (net) | | 2,915 | | | 4,014 | | | 7,954 | |
| | | |
Other financing (net) | | — | | | (1 | ) | | — | |
| | | |
Net cash flows from financing activities | | 2,897 | | | 3,989 | | | 7,937 | |
Note:
| 1. | Numbers may not add due to rounding. |
| 2. | Numbers have been restated where subsequent changes in classification have occurred. |
Net cash flows from financing activities include cash flows from net borrowing (increase in borrowing less redemption), net advances (gross investment in new loans less redemption of loans issued) and other financing.
In 2008-09 net cash inflows from financing activities are estimated at $3.989 billion. This mainly represents borrowings for the State’s capital program.
Net cash inflows from financing activities for 2009-10 are estimated at $7.937 billion, reflecting borrowings to partially fund the General Government’s capital program of $9.270 billion.
| | | | |
| | | Budget Strategy and Outlook 2009-10 | | 141 |
RECONCILIATION OF OPERATING CASH FLOWS TO THE OPERATING STATEMENT
Table 8.7 provides a reconciliation of the cash flows from operating activities to the operating result for the General Government sector.
Table 8.7
General Government sector: reconciliation of cash flows
from operating activities to accrual operating activities1
| | | | | | | | | |
| | | 2008-09
Budget2
$ million | | | 2008-09
Est. Act.
$ million | | | 2009-10
Budget
$ million | |
Revenue from transactions | | 36,582 | | | 35,874 | | | 37,192 | |
Plus/(less) movement in tax equivalent and dividend receivables | | (40 | ) | | 88 | | | (109 | ) |
Plus GST receipts | | 980 | | | 1,245 | | | 1,355 | |
Plus/(less) movement in other receivables | | (226 | ) | | (308 | ) | | (97 | ) |
Equals cash receipts from operating activities | | 37,297 | | | 36,899 | | | 38,341 | |
| | | |
Expenses from transactions | | 35,772 | | | 36,447 | | | 39,146 | |
(Less) non-cash items | | | | | | | | | |
Depreciation and amortisation expense | | (2,665 | ) | | (2,551 | ) | | (2,773 | ) |
Accrued superannuation expense | | (2,030 | ) | | (2,268 | ) | | (2,381 | ) |
Accrued employee entitlements | | (422 | ) | | (462 | ) | | (471 | ) |
Other accrued costs | | (285 | ) | | 334 | | | (228 | ) |
Plus superannuation benefits paid defined benefit | | 419 | | | 339 | | | 381 | |
Plus/(less) movement in employee entitlement provisions | | 239 | | | 280 | | | 394 | |
Plus/(less) GST paid | | 1,018 | | | 1,282 | | | 1,386 | |
Plus/(less) movement in other provisions and payables | | 910 | | | 848 | | | 706 | |
Equals cash payments for operating activities | | 32,955 | | | 34,250 | | | 36,160 | |
Notes:
| 1. | Numbers may not add due to rounding. |
| 2. | Numbers have been restated where subsequent changes in classification have occurred. |
The main difference between the accrual operating statement and the cash flow relates to the timing of cash payments and receipts and their recognition in accrual terms and the inclusion of non-cash expenses and revenues. The largest difference is on the expenses (expenditure) side, with large non-cash expenses associated with depreciation and superannuation. Differences due to the timing of receipt or payment of amounts are recorded as either a receivable or payable in the balance sheet.
| | | | |
142 | | Budget Strategy and Outlook 2009-10 | | |
| 9 | INTERGOVERNMENTAL FINANCIAL RELATIONS |
FEATURES
| • | | GST revenue from the Australian Government to all States has been revised down by $4.1 billion in 2008-09 and $6.9 billion in 2009-10 since last Budget. |
| • | | Queensland, like all states, is becoming increasingly reliant on Australian Government funding, with approximately 49% of Queensland’s revenue being sourced from the Australian Government in 2009-10. |
| • | | Council of Australian Government (COAG) reforms during 2008 resulted in substantial changes to the system of Australian Government payments, including improved funding arrangements for Specific Purpose Payments (SPPs) and new National Partnership Agreements. |
| • | | $6.3 billion of additional funding has been provided to Queensland to 2012-13, including $3 billion in COAG reform agreements. The Australian Government’s Nation Building and Jobs Plan provides around $3.3 billion of additional funding for Queensland over the next three years. |
| • | | The Commonwealth Grants Commission’s 2009 Update Report on State Revenue Sharing Relativities shows that Queensland will again receive a below per capita share of GST revenue in 2009-10. Queensland’s share of GST revenue in 2009-10 will be reduced by $381.8 million in underlying terms compared with 2008-09 due to a downward revision to the State’s assessed relativity. |
| • | | Queensland’s GST receipts in 2009-10 are expected to be $7.660 billion, which is less than the $8.549 billion received in 2007-08. In per capita terms, Queensland’s share of GST in 2009-10 and 2010-11 will be similar to that received in 2003-04, with GST not expected to regain the levels of 2004-05 until after 2012-13. |
| • | | The expected reduction in Queensland’s share of GST in 2008-09 follows underlying losses experienced in recent years. It is anticipated that by the 2010 Review of Methodology, Queensland’s annual cumulative loss in GST funding since the 2004 Review of Methodology will be more than $1.2 billion. |
| • | | The Queensland Government will provide $1.3 billion in grants to Queensland local government authorities in 2009-10. |
| | | | |
| | | Budget Strategy and Outlook 2009-10 | | 143 |
FEDERAL FINANCIAL ARRANGEMENTS
Federal financial relations are characterised by a disparity between the revenue-raising capacity and the expenditure responsibilities of the Australian and state governments respectively. This mismatch is known as vertical fiscal imbalance (VFI). The Australian Government collects the major share of taxation revenues and states must rely on grants from the Australian Government to meet their expenditure requirements.
Since the introduction of the Australian Government’s national tax reforms in 2000, states’ dependence on Australian Government funding has increased further. Chart 9.1 shows all states’ funding sources for 1999-2000 and 2009-10. In 1999-2000 the states received 35% of their revenues from the Australian Government. This is estimated to increase to 51% in 2009-10 as a result of changes to intergovernmental fiscal arrangements. In contrast, the proportion of the states’ revenues from state taxes has declined from 40% in 1999-2000 to an estimated 30% in 2009-10.
Chart 9.1
Revenue sources, all states, 1999-2000 and 2009-101
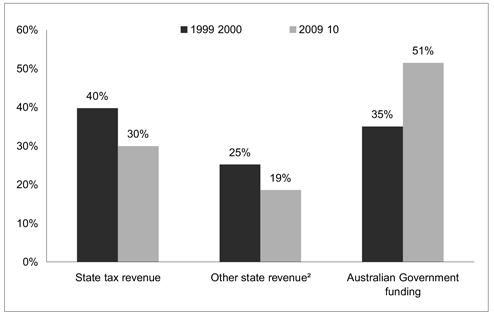
Notes:
| 1. | 2009 10 data are estimates. |
| 2. | Includes user charges, interest earnings, contributions from trading enterprises and mining revenue. |
| Sources: | ABS Government Finance Statistics Cat No. 5512.0 and state and Australian Government Budget Papers. |
| | | | |
144 | | Budget Strategy and Outlook 2009-10 | | |
The framework for federal financial arrangements has recently undergone significant reform through the Council of Australian Governments (COAG). Under the new framework, there are four categories of funding provided to the states:
| • | | National Specific Purpose Payment (SPP) funding agreements covering health, education, skills and workforce development, disability and housing |
| • | | National Partnership payments for specific purposes or reform-linked objectives |
| • | | other general revenue assistance payments. |
Australian Government funding to states
Table 9.1 shows that Australian Government payments to the states in 2009-10 are expected to total $91.9 billion, an increase of $6.8 billion or 8% compared with 2008-09.
Table 9.1
Estimated Australian Government payments to the states, 2008-09 and 2009-101
| | | | | | | | | | |
| | | 2008-09
$ million | | 2009-10
$ million | | Change
Nominal
Terms % | | Change
Real2
Terms % | | Change
Real2 Per
Capita % |
Payments for specific purposes | | | | | | | | | | |
National Partnership payments | | 13,781 | | 24,243 | | | | | | |
Specific Purpose Payments3 | | 28,279 | | 25,833 | | | | | | |
Total payments for specific purposes4 | | 42,060 | | 50,076 | | 19.1 | | 17.0 | | 15.0 |
GST revenue | | 41,189 | | 41,330 | | 0.3 | | -1.4 | | -3.1 |
Other general revenue5 | | 1,857 | | 494 | | | | | | |
Total payments | | 85,106 | | 91,901 | | 8.0 | | 6.1 | | 4.3 |
Notes:
| 1. | Numbers may not add due to rounding. |
| 2. | Deflated by the 2008 09 year average national inflation forecast of 1.75% and national population growth of 1.75%. |
| 3. | Specific Purpose Payments includes existing SPPs and new national SPPs. |
| 4. | Payments for specific purposes are not strictly comparable as some payments were reclassified as general revenue assistance from 1 January 2009. |
| 5. | Other general revenue includes NCP payments, royalties, compensation for Australian Government policy decisions and ACT municipal services. |
Source: Australian Government Budget Paper No.3, 2009 10.
Total payments for specific purposes in 2009-10 are expected to be $50.1 billion, a 15% increase from 2008-09 in real per capita terms. This largely reflects new COAG reform agreements and the impact of the Australian Government’s Nation Building and Jobs Plan.
| | | | |
| | | Budget Strategy and Outlook 2009-10 | | 145 |
GST revenue from the Australian Government to all states is expected to increase slightly from $41.2 billion in 2008-09 to $41.3 billion in 2009-10, an increase of 0.3% in nominal terms. In real per capita terms, GST is expected to decrease by 3.1%. Since the Australian Government’s 2008-09 Budget, GST revenue has been revised down by $4.1 billion in 2008-09 and $6.9 billion in 2009-10. Total downward revisions in GST revenue over the period 2008-09 to 2011-12 are estimated at $25.5 billion.
The large downward revisions of the GST pool over 2008-09 has resulted in New South Wales, South Australia, Tasmania and the Northern Territory receiving less GST than their guaranteed minimum amount, which means they require budget balancing assistance in 2008-09. This is the first time any state has received budget balancing assistance since 2003-04. Under the new Intergovernmental Agreement on Federal Financial Relations (IGA), budget balancing assistance will not be available to states after 2008-09.
State shares of Australian Government funding
Table 9.2 shows the expected shares of total Australian Government payments to each state for 2009-10 compared with each state’s population share. Queensland’s anticipated share of total Australian Government funding of 19.8% in 2009-10 will be less than its population share of 20.2%.
Table 9.2
Relative shares of payments to the states, 2009-101
| | | | | | |
| | | Share of
payments % | | Share of
population % | | Relative share2
% |
New South Wales | | 30.6 | | 32.4 | | 94.6 |
Victoria | | 22.6 | | 24.8 | | 91.1 |
Queensland | | 19.8 | | 20.2 | | 98.1 |
Western Australia | | 10.0 | | 10.3 | | 97.8 |
South Australia | | 8.7 | | 7.4 | | 116.9 |
Tasmania | | 3.0 | | 2.3 | | 132.9 |
Australian Capital Territory | | 1.7 | | 1.6 | | 108.5 |
Northern Territory | | 3.5 | | 1.0 | | 336.2 |
Notes:
| 1. | Numbers may not add due to rounding. |
| 2. | A state’s relative share is measured as its funding share as a percentage of its population share. |
Source: Australian Government Budget Paper No.3, 2009 10.
| | | | |
146 | | Budget Strategy and Outlook 2009-10 | | |
Queensland’s share of Australian Government funding
Table 9.3 details Queensland’s share of estimated Australian Government payments in 2009-10 and the difference from its population share. Queensland expects to receive $701 million less than a per capita share of GST revenue in 2009-10. In the same year, Queensland expects to receive $507 million more than a per capita share of total payments for specific purposes. In terms of total Australian Government funding, Queensland expects to receive $194 million less than a per capita share in 2009-10.
Table 9.3
Queensland’s share of estimated Australian Government payment, 2009-10
| | | | |
| | | Queensland’s
Share
% | | Difference from
Population
Share
$ million |
Payments for specific purposes | | | | |
National Partnership payments | | 24.1 | | 950.1 |
Specific Purpose Payments | | 18.5 | | -443.2 |
Total payments for specific purposes | | 21.2 | | 507.0 |
GST revenue1 | | 18.5 | | -701.1 |
Total payments | | 19.8 | | -194.1 |
Notes:
| 1. | Adjustment for GST deferral included. |
Source: Australian Government Budget Paper No.3, 2009 10.
Additional funding from COAG reform agreements is estimated to be $333 million in 2009-10, and $3 billion in total from 2008-09 to 2012-13. This includes improved funding arrangements for specific purposes payments and National Partnerships in areas such as health, education, skills and workforce development, housing, disabilities and Indigenous services. In addition, the Australian Government’s $42 billion Nation Building and Jobs Plan is expected to direct around $3.3 billion to Queensland between 2008-09 and 2012-13.
Revisions to total GST revenue, combined with changes to Queensland’s relative share of total GST funds, have had substantial impacts on the GST expected to be received by Queensland.
Queensland’s reliance on Australian Government funding, as shown in Chart 9.2, is consistent with the national trend, with the share of total funding sourced from the Australian Government increasing from 35% in 1999-2000 to an estimated 49% in 2009-10. This is partly due to increased payments for specific purposes, which are expected to peak in 2009-10, combined with reductions in Queensland’s own-source revenue, which has fallen from 65% in 1999-2000 to 51% in 2009-10.
| | | | |
| | | Budget Strategy and Outlook 2009-10 | | 147 |
Chart 9.2
Revenue sources, Queensland, 1999-2000 and 2009-101
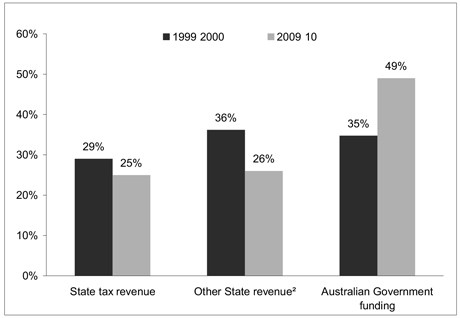
Notes:
| 1. | 2009 10 data are estimates. |
| 2. | Includes user charges, interest earnings, contributions from trading enterprises and mining revenue. |
Source: ABS Government Finance Statistics Cat No. 5512.0 and Queensland Budget estimates.
| | | | |
148 | | Budget Strategy and Outlook 2009-10 | | |
COAG REFORM OF AUSTRALIAN GOVERNMENT PAYMENTS
The Council of Australian Government (COAG) reforms during 2008 resulted in substantial changes to the system of Australian Government payments. These reforms culminated in a new IGA, which outlines the principles of Federal-State financial relations, and details a range of major reforms, including:
| • | | improved funding arrangements for Specific Purpose Payments (SPPs) |
| • | | a framework for new National Partnership agreements (NPs) |
| • | | restructuring the number and types of payments |
| • | | a new performance reporting regime for SPPs and NPs |
| • | | a new Indigenous expenditure reporting framework |
| • | | an expanded role for the COAG Reform Council (CRC). |
The package of changes has improved state funding, and gives states additional flexibility to apply the new funding to meet state priorities, but has been accompanied by commitments to meet new national performance benchmark measures.
The new funding arrangements also include reward payments to states for achieving agreed implementation milestones for a number of reform areas, including:
COAG reform agreements have resulted in $15.1 billion of additional funding for specific purposes and national partnerships. Queensland’s share of additional funding from COAG agreements is estimated at $3 billion from 2008-09 to 2012-13.
Specific purpose payments
One of COAG’s reform objectives was to reduce the number of SPPs from around 90 to less than 20. Following deliberation, COAG agreed to five new major SPPs:
| • | | a National Healthcare Agreement |
| • | | a National Schools Agreement |
| • | | a National Skills and Workforce Development Agreement |
| • | | a National Disability Agreement |
| • | | a National Housing Agreement. |
| | | | |
| | | Budget Strategy and Outlook 2009-10 | | 149 |
A large number of former SPPs have been redesignated as National Partnership payments, contingent payments or general revenue assistance, or are proposed to be cashed out. The new IGA provides for Treasurers to periodically review the adequacy of funding and indexation for the new SPPs.
In addition to these agreements there is a National Indigenous Reform Agreement (NIRA), which brings together the key Indigenous reforms in the new funding agreements.
Key characteristics of the new agreements are:
| • | | the agreements are permanent, and do not have to be renegotiated every three or four years (unlike previous SPPs) |
| • | | each agreement has improved base and escalation arrangements |
| • | | each agreement has documented objectives, outcomes and performance measures |
| • | | performance information for the new SPPs will be compiled and publicly released by the CRC. |
States have flexibility to use funding within each of the five SPP areas in accordance with state policy priorities. For example, healthcare funding is no longer restricted to public hospitals, and can be spent anywhere within the health system.
The table below outlines Queensland’s additional funding for each SPP under the new arrangements.
Table 9.4
Queensland’s additional SPP funding
2008-09 to 2012-13
| | | | | | |
SPP | | Base and escalation
$ million | | Distribution change
$ million | | Total increase
$ million |
Healthcare | | 946 | | 108 | | 1,054 |
Schools | | 203 | | 126 | | 329 |
Skills and Workforce | | 7 | | 20 | | 27 |
Disability | | 79 | | 18 | | 97 |
Housing | | 9 | | 16 | | 25 |
Total | | 1,245 | | 287 | | 1,532 |
COAG’s Public Accountability and Performance Reporting guidelines require states to provide performance information in respect of each new National Agreement, and for this information to be consolidated into a report which will be provided to COAG and publicly released. The intention of this process is to make states accountable to their electors for their performance, rather than to the Australian Government or to COAG.
| | | | |
150 | | Budget Strategy and Outlook 2009-10 | | |
The performance reporting agreement has set in train a comprehensive review of statistical reporting arrangements between the Australian Government and the states. The Ministerial Council for Federal Financial Relations (comprising Australian Government, State and Territory Treasurers) has responsibility for oversighting and maintaining an effective performance reporting regime.
National Partnership payments
National Partnership payments are intended to be for specific projects, such as election commitments, with funding being provided for limited periods. Deliverables, including objectives, timeframes and funding are specified in individual National Partnership Agreements.
National Partnerships may consist of up-front facilitation payments or have reward payments which will be made to states that achieve agreed performance benchmarks. National Partnerships may also use a mixture of facilitation and reward payments.
States may also be required to contribute funding toward achieving National Partnerships. In some cases pre-existing budget allocations may be recognised as a funding contribution, but in the majority of cases, additional state funding is required. The National Partnerships signed at the November 2008 COAG meeting include a requirement for Queensland to contribute $641 million in co-investment payments.
The following table sets out details of the National Partnership funding agreed for Queensland at the November 2008 COAG meeting.
| | | | |
| | | Budget Strategy and Outlook 2009-10 | | 151 |
Table 9.5
Queensland’s additional COAG funding
2008-09 to 2012-13
| | | | |
Funding area | | Additional funding
$ million | | Co-investment required
$ million |
Hospital and Health Workforce Reform | | 267 | | 108 |
Preventative Health | | 45 | | — |
National E-Health initiative | | — | | 22 |
Indigenous Health | | — | | 162 |
Computers in Schools | | 159 | | — |
Improving teacher quality | | 88 | | 6 |
Low SES school communities | | 171 | | 171 |
Homeless | | 136 | | 138 |
Social Housing | | 81 | | — |
Indigenous Economic Participation | | — | | 21 |
Indigenous Remote Service Delivery | | — | | 13 |
Remote Indigenous Housing | | 419 | | — |
Business regulation and competition | | 113 | | — |
Total | | 1,479 | | 641 |
Other COAG reform elements
A new Indigenous expenditure reporting framework
States have agreed to help develop and implement a new Indigenous Expenditure Reporting Framework (IERF) to help address existing deficiencies in the current availability of Indigenous expenditure data. This will be a key part of monitoring progress towards achieving COAG’s ‘Closing the Gap’ objectives.
A key issue with the IERF will be identifying expenditure on Indigenous services provided as part and parcel of ‘mainstream’ expenditure, particularly in the Health and Education areas.
Role of the CRC
In addition to its role of collating and publishing SPP performance information, the CRC will be responsible for monitoring states’ progress on reform agendas. In particular, the CRC will determine whether states have achieved the milestones required for the release of reward payments under National Partnerships which have a reward component.
| | | | |
152 | | Budget Strategy and Outlook 2009-10 | | |
NATION BUILDING AND JOBS PLAN
The Australian Government announced its $42 billion Nation Building and Jobs Plan in February 2009. The plan has several elements which require state participation, including $14.7 billion for improvements to schools, $6.6 billion for improvements for social housing, and $0.9 billion for transport infrastructure.
Final funding allocations for states are being negotiated between the Australian Government and the states. Queensland expects to receive in excess of $3 billion in additional funding under the Nation Building and Jobs Plan.
Under the plan, states have to commit to spending the additional money within nominated timeframes and maintaining current expenditure effort. Sanctions will be applied for non-compliance, including that the Australian Government may reallocate funding to other states if a state is unable to meet the expenditure guidelines, and that states’ grant funding may be reduced if states substitute Australian Government funding for own source funding.
PAYMENTS FOR SPECIFIC PURPOSES BY FUNCTION
In total, Australian Government payments to Queensland for specific purposes in 2009-10 are estimated at $10.636 billion, an increase of 14.4% from 2008-09.
Table 9.6
Queensland payments for specific purposes, 2008-09 and 2009-101,2
| | | | |
| | | 2008-09
$ million | | 2009-10
$ million |
Payments for specific purposes | | | | |
Health | | 2,410.2 | | 2,399.2 |
Education and training | | 2,605.7 | | 4,358.2 |
Disability services | | 469.4 | | 508.1 |
Housing | | 599.6 | | 1,327.2 |
Transport and main roads | | 2,413.3 | | 1,615.1 |
Local government | | 460.6 | | 283.4 |
Other | | 334.7 | | 145.1 |
Total payments for specific purposes | | 9,293.5 | | 10,636.3 |
Notes:
| 1. | Numbers may not add due to rounding. |
| 2. | Payments for specific purposes include existing SPPs, new national SPPs and National Partnerships. |
Source: Australian Government
| | | | |
| | | Budget Strategy and Outlook 2009-10 | | 153 |
Health
From 2009-10, Queensland Health will receive the majority of its Australian Government funding through the new National Healthcare Agreement (NHA) SPP. The NHA will be adjusted annually for population growth and increases in costs associated with increases in health prices and technology improvements. Queensland expects to receive $2.2 billion from Health SPP funding in 2009-10.
Queensland Health will also receive new funding for National Partnership payments in specific reform areas such as Hospital and Health Workforce Reform and Preventative Health.
Education and training
The National Schools Agreement and National Skills and Workforce Agreement support the delivery of education services in state and non-state schools, training institutions and other organisations. The Australian Government will also provide over $2 billion in 2009-10 of National Partnership payments to support the delivery of specified outputs in education and early childhood.
The Australian Government also provides funding for a range of specific vocational education and training programs. Increased funding will be provided for TAFE infrastructure improvements and productivity places as part of the Nation Building and Jobs Plan.
Disability services
The new National Disability Agreement commenced on 1 January 2009 replacing the Commonwealth State/Territory Disability Agreement (CSTDA). The funding received under the National Disability Agreement during 2009-10 will be used to continue existing service provision as well as provide increased accommodation support, respite and in-home support services for people with a disability, their families and carers.
Disability Services Queensland will also receive funding from the Australian Government for the Home and Community Care (HACC) program. The HACC Review Agreement, coupled with projected growth funding, ensures the program is a key part of the community care system and will continue to assist frail older people and those with disabilities to live as independently as possible in their own homes.
| | | | |
154 | | Budget Strategy and Outlook 2009-10 | | |
Housing
In 2009-10, the Department of Housing expects to receive over $1.3 billion in payments for specific purposes, including funding under the National Housing Agreement, and National Partnerships in the areas of homelessness, remote Indigenous housing and social housing. This funding will be used for the continued development of a core social housing sector to assist people unable to access alternative suitable housing options, through the delivery of affordable, appropriate, flexible and diverse housing assistance responses that provide people with choice and are tailored to their needs, local conditions and opportunities.
Transport and main roads
Funding is provided by the Australian Government for capital infrastructure and maintenance works on the National Network. This road funding is provided through the Nation Building program and the Building Australia Fund, which includes planning funding for a Brisbane Inner City Rail Feasibility Study and capital funding towards the Gold Coast Light Rail project in South East Queensland.
The Australian Government also contributes funding under the Nation Building program for targeted safety and other works on other state-controlled and local government roads.
Local government
Payments to local government consist of general purpose Financial Assistance Grants and untied grants for local roads.
Other
Other payments for specific purposes include funding for a range of programs including environment and water sustainability and natural disaster relief.
| | | | |
| | | Budget Strategy and Outlook 2009-10 | | 155 |
GST REVENUE PAYMENTS
Commonwealth Grants Commission
The Commonwealth Grants Commission (CGC) advises the Australian Government on the distribution of GST revenue among the states. Under its terms of reference the CGC is required to determine its recommendations on the basis of horizontal fiscal equalisation, as detailed in Box 9.1.
|
Box 9.1 Horizontal fiscal equalisation and distribution of GST |
Commonwealth Grants Commission The Commonwealth Grants Commission (CGC) advises the Australian Government on the distribution of GST revenue among the states and each year updates the financial, economic and demographic data that underpin its recommendations. Horizontal Fiscal Equalisation The Australian Government distributes GST revenue to states based on the principle of horizontal fiscal equalisation (HFE), using per capita relativities recommended by the CGC. Queensland supports the principle of HFE. The principle of HFE is that state governments should receive funding from the Australian Government such that, if each made the same effort to raise revenue from its own sources and operated at the same level of efficiency of service delivery, each would have the capacity to provide services to the same standard. A distribution based on HFE principles recognises the different financial capacities of the states, particularly that some states have inherently greater capacity to raise revenue and that some states have inherently greater costs to meet in providing services to an Australian standard. If the distribution of the GST to the states were on any basis other than HFE, some taxpayers would be forced to accept either a lower standard of state services or a higher level of state taxation than other taxpayers in similar circumstances. More information on HFE and GST distribution can be accessed through the Queensland Treasury website: www.treasury.qld.gov.au/gst-factsheets or the Commonwealth Grants Commission website: www.cgc.gov.au. |
2009 Update Report on State Revenue Sharing Relativities
At the 2009 Treasurer’s Conference, the Australian Government accepted the CGC’s 2009 Update Report on State Revenue Sharing Relativities (2009 Update) as the basis for the distribution of the GST revenue to the states in 2009-10.
In the 2009 Update, the CGC recommended an underlying decrease in Queensland’s share of GST revenue of $381.8 million in 2009-10, as shown in Table 9.7. Queensland already received a less than per capita share of the GST in 2008-09, and the result of the 2009 Update has reduced Queensland’s share even further.
| | | | |
156 | | Budget Strategy and Outlook 2009-10 | | |
New South Wales and Victoria have gained significantly from the 2009 Update with underlying increases of $613.3 million and $56.6 million respectively. In 2009-10, for the first time, New South Wales and Victoria will receive a greater per capita share of the GST than Queensland.
Table 9.7
Components of underlying change in states share of GST revenue
2008-09 to 2009-101
| | | | | | | | | | | | | | | | |
| | | NSW
$ million | | VIC
$ million | | QLD
$ million | | WA
$ million | | SA
$ million | | TAS
$ million | | ACT
$ million | | NT
$ million |
Revenue | | 545.0 | | 82.6 | | -312.2 | | -304.4 | | 1.3 | | -14.5 | | 7.5 | | -5.4 |
Expenditure | | 55.0 | | -88.2 | | -34.1 | | 6.7 | | 50.8 | | -26.3 | | -0.5 | | 36.7 |
Commonwealth | | | | | | | | | | | | | | | | |
Payments | | 14.0 | | 62.6 | | -35.1 | | -11.3 | | -0.3 | | -0.6 | | 4.3 | | -33.4 |
Total | | 613.3 | | 56.6 | | -381.8 | | -309.7 | | 52.2 | | -41.0 | | 11.4 | | -0.9 |
Note:
| 1. | Numbers may not add due to interactions between Expenditure and SPP assessments. |
Source: Commonwealth Grant Commission 2009 Update Report on State Revenue Sharing Relativities.
The decrease in Queensland’s GST revenue share follows reductions in its share of GST funding of $166.4 million in 2007 and $409.3 million in 2008. It is anticipated that by the 2010 Review of methodology, Queensland’s annual cumulative loss in GST funding since the 2004 Review of methodology will be more than $1.2 billion.
Queensland’s declining share of GST revenue reflects increases in the state’s fiscal capacity over the period 2002-03 to 2007-08, particularly from strong performances in the property market and mining sector. The change in Queensland’s GST share over the last few years demonstrates the responsiveness of the CGC’s methodology to changes in states’ revenue earning capacities and expenditure needs. However, the current methodology does not adequately account for the increases in capital expenditure required by states driven by high population growth. Queensland is working with the CGC and the other states to develop a capital assessment as a part of the 2010 Review process (see Box 9.2 for more details).
Relationship between GST distribution and economic performance
A key feature of recent Updates has been the decreasing relativities of the fast growing states of Queensland and Western Australia compared with the more established economies of New South Wales and Victoria.
There has been some criticism of the GST distribution process on the basis that periods of rapid growth, such as recently experienced by the Queensland and Western Australian economies, are not adequately taken into account. Chart 9.3 shows that Queensland’s GSP per capita has been converging with that of both New South Wales and Victoria over the period from 2002-03 to 2007-08.
| | | | |
| | | Budget Strategy and Outlook 2009-10 | | 157 |
Chart 9.3
Convergence between larger states – GSP per capita relativities
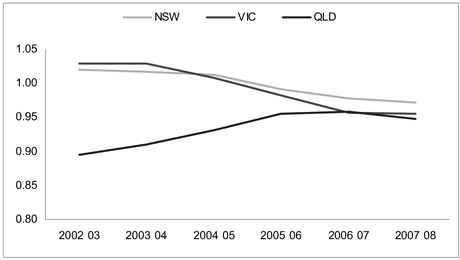
Source: Queensland Treasury calculations based on Commonwealth Grants Commission Relative Fiscal Capacities of the States 2009.
Over these years, Victoria’s GSP per capita has declined from 3% above the Australian average, while Queensland’s GSP per capita has risen substantially towards the national average.
At the same time, New South Wales’ assessed GST single year relativity, which is a key determinant of its share of the GST pool, has risen from 0.79 to 1.01. Over the same period Queensland’s single year GST relativity has fallen from 1.06 to 0.83 as shown in Chart 9.4.
| | | | |
158 | | Budget Strategy and Outlook 2009-10 | | |
Chart 9.4
Single year GST relativities – larger states
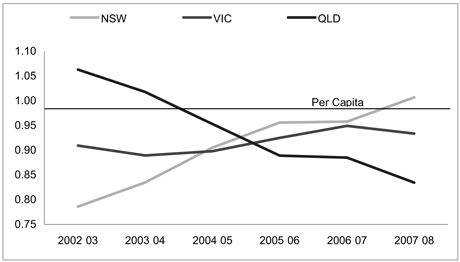
Source: Commonwealth Grants Commission 2009 Update Report on State Revenue Sharing Relativities.
The CGC’s 2009 Update data shows that in every year since 2005-06, Queensland’s assessed single year GST relativity has been lower than that for both New South Wales and Victoria, which means that for the past three years Queensland has been assessed as requiring less per capita from the GST pool than either of these states.
It is clear that as the relative economic strength of a state changes, so too does its assessed share of GST funding. Queensland recognises that this is the intended consequence of the GST assessment process. However, due to the five year averaging process used by the Commission, Queensland and Western Australia will continue to experience low relativities as a result of their earlier strong economic growth, while at the same time experiencing significant reductions in own source revenues associated with the impact the global financial crisis has had on property markets and commodity prices.
Queensland’s declining GST revenue
Total GST revenue to all states declined by 2.7% between 2007-08 and 2008-09, and in 2009-10 is expected to rise by 0.3%. This is far lower than the average growth of 8.2% between 2000-01 and 2007-08, and reflects the global financial crisis. Since the Australian Government’s 2008-09 Budget, GST revenue has been revised down by $4.1 billion in 2008-09 and $6.9 billion in 2009-10. Total GST revenue is not expected to reach 2007-08 levels until 2010-11, while Queensland’s share of GST is not expected to reach 2007-08 levels until 2012-13 due to its declining share of the GST pool.
| | | | |
| | | Budget Strategy and Outlook 2009-10 | | 159 |
Chart 9.5
Comparison of GST revenue – 2008-09 and 2009-10 Commonwealth Budget
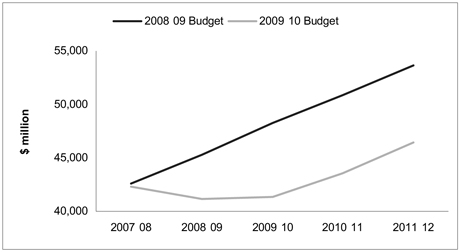
In 2009-10, Queensland will receive a share of GST well below its population share, based mainly on the CGC’s determination that Queensland has a relatively greater capacity to raise revenue from stamp duty on conveyances and royalties from mining. Changes in the characteristics of Queensland’s population, such as age and income levels, also reduced Queensland’s share of GST funding in the 2009 Update.
The CGC currently use an average of the five most recent single year relativities to reduce the volatility of the annual results. In the absence of this process for smoothing changes in state shares, the strong performance of the Queensland and Western Australian economies over 2003-04 to 2007-08 would have resulted in more GST being redistributed away from Queensland and Western Australia, and towards New South Wales and Victoria.
As GST is distributed on a per capita basis, the declines in Queensland’s total GST share have been mitigated in recent years by increased population growth. However, Queensland’s population growth has resulted in a commensurate increase in demand for services, and Queensland’s ability to meet this demand, or enhance existing services, is affected by strong per capita declines in GST. In per capita terms, Queensland’s share of GST in 2009-10 and 2010-11 will be similar to that received in 2003-04, with GST not expected to regain the levels of 2004-05 until after 2012-13.
| | | | |
160 | | Budget Strategy and Outlook 2009-10 | | |
Chart 9.6
Queensland GST per capita, 2003-04 to 2012-13
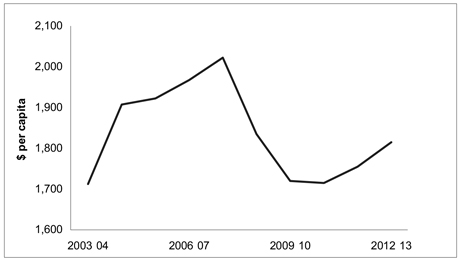
Source: Australian Government Budget Paper No.3, 2009 10 and Queensland Treasury.
A key concern that Queensland has with the Commission’s current processes is that they do not adequately take account of states’ need for increased capital expenditure that is inextricably associated with a fast growing population. Queensland is currently experiencing population growth at a much higher rate than the national average, which is underpinning an ever increasing demand for infrastructure. At the same time, Queensland is receiving an ever diminishing share of the GST funding. There is a direct link between rapid population growth and demand for infrastructure, which needs to be addressed by the Commission. Queensland supports the capital assessment proposed by the Commission for their 2010 review of methodology, which will take into account a state’s relative population growth and recognise the immediacy of the demand.
2010 Review of State Revenue Sharing Relativities - progress report
The CGC undertakes a substantive review of its methodology every five years, with the next review due to be completed in 2010. The terms of reference for the 2010 Review of State Revenue Sharing Relativities (2010 review) direct the CGC to simplify its processes and introduce a more streamlined approach to HFE, as discussed in Box 9.2. The 2010 review is different to previous reviews and can be viewed as an overhaul of the way the CGC structures its assessments.
| | | | |
| | | Budget Strategy and Outlook 2009-10 | | 161 |
|
Box 9.2 The 2010 Review |
An overhaul of how the Commission determines the distribution of the GST The CGC is currently conducting a review, due in 2010, of the processes used to determine the distribution of the GST revenue. The CGC has indicated that it intends to vigorously pursue both equalisation and simplification for the 2010 Review, and has adopted a strategy that: • starts with a clean slate when it comes to devising assessment methods • adopts a top-down approach, only disaggregating assessment categories if doing so materially improves equalisation and it can be done reliably • works toward improving the quality of data used in the assessments • establishes new assessment guidelines with stronger reliability and materiality criteria. Using this strategy, the CGC believes that simplification will improve the reliability and robustness of the processes and acceptability of the outcomes. The CGC has been providing all states with the opportunity to contribute to the development of the reviewed distribution process. Queensland has been proactively working with the Commission to identify areas for simplification of assessments in the 2010 Review. A number of alternative approaches and models have been suggested by Queensland to simplify and enhance assessments, such as road measurement, dispersion and wages input costs. Queensland has strongly supported the Commission’s proposal to include capital expenses as part of the new methodology. The proposed capital assessment recognises the immediate need for capital expenditure that is experienced by states with rapidly growing populations. Queensland believes the recognition of capital expenses will significantly improve the quality of HFE. A robust assessment of the extra costs of service provision that large or dispersed states face is essential to ensuring the 2010 Review achieves equalisation. Queensland has proposed a simplified assessment approach to assessing these extra costs and is continuing to work with the Commission to ensure that Queensland’s unique geography is not ignored. The CGC’s draft report for the 2010 Review is due to be released in early July 2009. More information is available on the CGC’s web site: www.cgc.gov.au. |
OTHER COMMONWEALTH PAYMENTS
Contingent payments
Contingent payments are a specific class of Australian Government payments which arise when the amount of funding cannot be reliably estimated. The main type of contingent payment is Natural Disaster Relief.
| | | | |
162 | | Budget Strategy and Outlook 2009-10 | | |
Other general revenue assistance
General revenue assistance payments arise when the Australian Government has an obligation to make a payment to a State, but the State has full control over how to allocate the money. Examples include offshore royalty revenue payments to Western Australia, and municipal services funding for the ACT. Queensland does not receive any general revenue assistance payments.
REVIEW OF AUSTRALIA’S TAX SYSTEM
On 11 May 2008, the Federal Treasurer announced a comprehensive review of Australia’s tax system to design a tax structure that positions Australia to deal with the demographic, social, economic and environmental challenges of the 21st century and enhance Australia’s economic and social outcomes. The review, chaired by the Secretary of the Australian Treasury, Dr Ken Henry, is due to report to the Australian Government by December 2009.
The review should have a strong reform focus as tax reform has the potential to deliver wide ranging economic, social and environmental benefits for the nation.
Tax reform should be considered an important component of national economic reform, with the potential to produce significant benefits for the Australian economy by impacting positively on economic efficiency and productivity, and thereby generating higher levels of employment and income. In this regard, the interaction of the tax system with the transfer system will be a critical area of study for the review. There are also important issues of equity and fairness that will need to be considered by the review.
The Queensland Government has demonstrated its own commitment to tax reform by abolishing eight taxes over the last eight years, reforming others and introducing a range of administrative reforms that have simplified the state tax system for taxpayers and made tax administration more efficient.
The review also offers the opportunity for a fundamental reorientation of the national taxation system to strengthen intergovernmental financial relations and, in turn, the Australian Federation.
Australia’s federal system, based on Commonwealth, state and local governments, has been an important driver of national social and economic development over the past century. However, a growing imbalance in the financial powers between the levels of government has weakened states’ fiscal autonomy and revenue capacity since federation. This has been largely the product of the erosion of state revenue bases and the placing of restrictive conditions on Australian Government grants.
| | | | |
| | | Budget Strategy and Outlook 2009-10 | | 163 |
This deterioration in state finances threatens to reduce the capacity of state governments to deal with budgetary pressures and meet the needs of their communities, particularly in the face of 21st century policy challenges such as demographic change, climate change, increasing global competition in education, and the need to provide infrastructure for sustainable economic growth. A robust national economy and vibrant community require a strong federation and therefore strong state and local governments.
Reform of existing state taxes, including administrative reform and consideration of the abolition of less efficient state taxes, the replacement of any abolished taxes with state access to alternative revenue sources, and a reduction in the states’ reliance on Australian Government grants should be considered important elements of a national tax reform agenda.
The Queensland Government looks forward to participating further in the review and with the Australian Government to deliver a bold blueprint for future national tax reform.
STATE-LOCAL GOVERNMENT FINANCIAL RELATIONS
In 2009-10, a total of $1.344 billion in grants will be provided by the Queensland Government to Queensland’s local governments, compared to $1.2 billion in 2008-09. (This includes financial assistance grants being paid by the Australian Government through the states to local government.)
Table 9.8 details Queensland Government grants to local governments.
The overall increase in total Queensland Government grants to local government authorities in 2009-10 reflects the expansion of some existing programs or the introduction of new initiatives, in particular increases in funding for Indigenous community housing and the rectification of road ‘Black Spots’.
| | | | |
164 | | Budget Strategy and Outlook 2009-10 | | |
Table 9.8
Grants to local government in Queensland 1,2
| | | | |
| | | 2008-09
Estimated
Actual
$ million | | 2009-10
Budget
Estimate
$ million |
Queensland Government grants | | | | |
Communities3 | | 163 | | 267 |
Community Safety | | 7 | | 5 |
Education and Training | | 17 | | 18 |
Employment, Economic Development and Innovation | | 19 | | 10 |
Environment and Resource Management | | 7 | | 5 |
Health | | 3 | | 3 |
Infrastructure and Planning4 | | 890 | | 919 |
Premier and Cabinet5 | | 5 | | 3 |
Transport and Main Roads | | 82 | | 114 |
Other | | 7 | | — |
Total Queensland Government grants | | 1,200 | | 1,344 |
Notes:
| 1. | For current and capital purposes to local government authorities and Aboriginal and Islander councils. Includes Australian Government grants paid through the State to local governments. |
| 2. | Data collected on different basis to previous years and therefore not directly comparable with previous Budget papers. |
| 3. | Includes grants for housing, disability services, child safety, sport and recreation. |
| 4. | Includes general purpose grants from the State and Australian Governments. |
| 5. | Includes grants for the arts. |
Grant purposes
The majority of grants to local government are for capital purposes. In 2009-10 capital grants will comprise 58% of Queensland Government grants to local government.
Significant grant purposes include:
| • | | housing and community amenities |
| • | | general public services |
| • | | capital works subsidies provided towards the costs of local public infrastructure |
| • | | road subsidies for local roads, networks and drainage. |
Chart 9.7 highlights the range of purposes for which local government grants will be provided by the Queensland Government in 2009-10.
| | | | |
| | | Budget Strategy and Outlook 2009-10 | | 165 |
Chart 9.7
State grants to local government in Queensland by purpose 2009-10
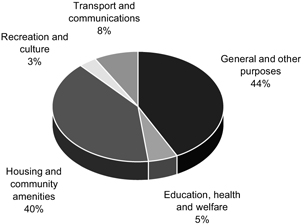
| | | | |
166 | | Budget Strategy and Outlook 2009-10 | | |
| 10 | UNIFORM PRESENTATION FRAMEWORK |
INTRODUCTION
This chapter contains detailed financial statements for the Queensland Public Sector prepared under the Uniform Presentation Framework (UPF) of reporting as required under the Australian Loan Council arrangements.
The Framework was reviewed following the release in October 2007 of the Australian Accounting Standards Board’s (AASB) new accounting standard, AASB 1049 Whole of Government and General Government Sector Financial Reporting. The standard aims to harmonise Government Finance Statistics (GFS) and Generally Accepted Accounting Principles (GAAP) with the objective of improving the clarity and transparency of government financial statements.
In addition, the chapter provides:
| • | | a reconciliation of the General Government sector net operating balance to the accounting operating result |
| • | | a time series for the General Government sector using the revised UPF |
| • | | details of General Government grant revenue and expenses |
| • | | details of General Government sector dividend and income tax equivalent income |
| • | | data on General Government expenses and purchases of non-financial assets by function |
| • | | details of taxation revenue collected by the General Government sector |
| • | | the State’s revised Loan Council Budget allocation |
| • | | details of contingent liabilities |
| • | | background information on the revised UPF and disclosure differences arising from it, including the conceptual basis, sector definitions and a list of reporting entities. |
This chapter also includes a discussion of the operations of the Public Non-Financial Corporations (PNFC) sector.
Under the UPF requirements, budgeted financial information for the Public Financial Corporations (PFC) sector is not included.
GENERAL GOVERNMENT SECTOR
A detailed analysis of the General Government sector is provided in Chapter 6 –Revenue, Chapter 7 – Expenses and Chapter 8 – Balance Sheet and Cash Flows.
| | | | |
| | | Budget Strategy and Outlook 2009-10 | | 167 |
PUBLIC NON-FINANCIAL CORPORATIONS SECTOR
The PNFC sector (which includes the GOCs, Queensland Motorways Limited and the SEQ Bulk Water entities including the Water Grid Manager) continues to perform well despite the impact of the global financial crisis. The PNFC sector has forecast total dividend payments of $872 million in 2009-10, with current tax equivalent payments of $247 million.
The Government is committed to ensuring that essential services such as electricity and public transport continue to be provided to Queenslanders at a reasonable cost through the provision of Community Service Obligation (CSO) payments. In 2009-10, a total of $1.569 billion in CSO payments will be provided, mainly to QR Limited (QR) in respect of passenger rail travel and Ergon Energy in respect of the electricity uniform tariff.
Investment in PNFC infrastructure is required to ensure PNFC entities continue to provide essential services and an appropriate return to Government. Net additional funding of approximately $307 million by way of equity injections has been budgeted for in 2009-10 to enable PNFCs to undertake such investments and remain financially sound. This includes $566 million provided to QR for significant investment in rail infrastructure, partially offset by equity repatriations identified by the Queensland Treasury Corporation as part of the recent review of GOCs’ capital structures.
PNFC operating statement
The majority of revenue generated in the PNFC sector is received through the sale of goods and services, and the receipt of current grants and subsidies.
For PNFC entities, the majority of sales of goods and services are to customer markets. These revenues are therefore heavily linked to the performance of the Queensland economy and the ability of the sector to compete in increasingly competitive markets.
The major components of PNFC sector revenues include rail freight charges, electricity sales, electricity network and distribution charges, port charges and agricultural and bulk water delivery charges. Key determinants of changes in PNFC revenue in 2009-10 will be the impact of the global financial crisis on export markets, impacting on demand for rail and port services and energy demands, which drive electricity pool prices.
Across the PNFC sector, it is anticipated that sales of goods and services will generate revenues of $8.855 billion in 2009-10, with total revenues forecast at $11.196 billion. Total revenues generated by the sector are forecast to grow to $15.757 billion in 2012-13. Again, major drivers include recovery from the global financial crisis among the PNFC sector’s major trading partners, leading to increased demand for services related to exports as well as continued demand for PNFC services and supplies in the electricity, rail, water and port sectors.
| | | | |
168 | | Budget Strategy and Outlook 2009-10 | | |
PNFC revenues are also derived from CSO payments. CSOs are provided by the Government where PNFCs are required to provide non-commercial services or services at non-commercial prices for the benefit of the community. Major CSOs include the uniform electricity tariff and QR passenger rail services.
The PNFC sector distributes dividends to the Government as shareholder. Dividends from the PNFC sector are a function of net profits and the dividend payout ratio. In general, the dividend payout ratio for the 2009-10 Budget is based on 80% of net profit after tax. In some cases, forecast net profit after tax will be adjusted to exclude any net unrealised (i.e. non-cash) forecast gains, for example, from upward revaluation of non-current assets or financial instruments.
The dividend payout ratio does not affect a PNFC’s capacity to carry out necessary maintenance and repairs, as dividends are paid after PNFCs have met their commitments to operating and maintenance expenses. Shareholding Ministers consider the circumstances of individual PNFCs and advice from their boards before arriving at a final determination of dividend payments. Dividends are forecast to increase over the forward estimates period, reaching $1.423 billion in 2012-13, as demand across a range of services recovers from the global downturn.
The PNFC sector’s performance has been negatively affected by the global financial crisis with the forecast estimated actual UPF net operating balance for the 2008-09 year being $356 million compared to the 2008-09 Budget estimate of $604 million.
PNFC balance sheet and cash flow statement
The ability of PNFCs to efficiently and effectively service their customers is reliant upon the investment in and maintenance of underlying infrastructure.
In 2009-10, the PNFC sector is expected to invest approximately $8.002 billion in capital projects. Investment in infrastructure is forecast to be $24.131 billion over the four years to 2012-13, with the size of the program declining as several large projects underway, including the Gateway Bridge duplication and South East Queensland water grid, are completed.
PNFCs undertake infrastructure investment on a commercial basis and in response to the needs of the market sectors they service.
Investment in electricity infrastructure is driven by peak demand which continues to grow, largely as a result of Queensland’s significant population and economic growth. The focus of capital expenditure in the sector during the year will be on ensuring ongoing generation plant reliability and efficiency, a secure and reliable transmission network across the State and the security and reliability of the extensive distribution network.
| | | | |
| | | Budget Strategy and Outlook 2009-10 | | 169 |
In 2009-10, capital works programs will contribute to the improved level of reliability of electricity transmission and distribution, with a focus on service quality, reliability, availability and capacity improvements. The combined capital network expenditure of Powerlink, Ergon Energy and ENERGEX in 2009-10 totals $2.661 billion.
Powerlink will invest $610 million on new transmission infrastructure and augmentation, while ENERGEX and Ergon Energy will similarly invest a total of $2.05 billion on the distribution networks to maintain reliable and secure transmission and distribution electricity networks across the State.
As one of the State’s largest industries, the coal industry continues to be a key economic driver. Proposed rail and port expansion programs reflect ongoing capital investment in coal supply chains. In 2009-10, QR is budgeting for a $2.088 billion capital program to increase the capacity of its coal and passenger networks by acquiring new rollingstock and upgrading infrastructure with expenditure on the coal network in 2009-10 forecast to be $862 million. The Ports Corporation of Queensland is continuing with the expansion of the coal export capacity of the Abbot Point terminal to 50 million tonnes per annum with investment of $288 million budgeted for 2009-10.
The PNFC capital investment also includes key South East Queensland bulk water projects, including the Western Corridor Recycled Water project, the South East Queensland (Gold Coast) Desalination Plant, stage 2 of the Northern Pipeline Interconnector and the Hinze Dam Stage 3 project.
Financing of capital projects will differ according to the individual circumstances of the relevant PNFC and the specific nature of the project. There are a number of ways in which PNFCs fund these investments, including utilising cash flows from their business, borrowings, and equity injections from shareholding Ministers.
While total borrowings for the PNFC sector are forecast to increase from $38.949 billion in 2009-10 to $46.285 billion in 2012-13, the rate of new borrowings is forecast to decrease from $5.335 billion in 2009-10 to $1.348 billion in 2012-13. The impact on the gearing ratio [borrowing/(borrowing and net worth)] will be a marginal increase from 67 per cent in 2009-10 to 68 per cent in 2012-13.
The Government is committed to PNFCs being at all times able to fund viable projects whilst at the same time retaining a sound financial position, by ensuring that all PNFCs remain sufficiently well capitalised to ensure an investment grade credit rating as determined by independent credit ratings agencies.
Reflecting the level of support for capital investment within a sound financial framework, an estimated $1.191 billion in net equity support is budgeted to be provided to the PNFC sector for the forward estimates period 2009-10 to 2012-13.
The Public Non-financial Corporations sector is discussed in more detail in Chapter 5.
| | | | |
170 | | Budget Strategy and Outlook 2009-10 | | |
UNIFORM PRESENTATION FRAMEWORK FINANCIAL INFORMATION
The tables on the following pages present operating statements, balance sheets and cash flow statements prepared on a harmonised basis for the General Government, Public Non-financial Corporations and Non-financial Public sectors.
| | | | |
| | | Budget Strategy and Outlook 2009-10 | | 171 |
Table 10.1
General Government Sector Operating Statement 1
| | | | | | | | | | | | | | | | | | | | |
| | | | | 2008-09
Budget 2
$ million | | | 2008-09
Est. Actual
$ million | | | 2009-10
Budget
$ million | | | 2010-11
Projection
$ million | | | 2011-12
Projection
$ million | | | 2012-13
Projection
$ million | |
| | Revenue from Transactions | | | | | | | | | | | | | | | | | | |
| | Taxation revenue | | 10,106 | | | 8,759 | | | 9,287 | | | 9,991 | | | 10,740 | | | 11,547 | |
| | Grants revenue | | 15,687 | | | 17,272 | | | 18,735 | | | 17,389 | | | 17,090 | | | 17,725 | |
| | Sales of goods and services | | 3,385 | | | 3,466 | | | 3,650 | | | 3,704 | | | 3,836 | | | 3,899 | |
| | Interest income | | 2,199 | | | 1,261 | | | 2,017 | | | 2,115 | | | 2,218 | | | 2,282 | |
| | Dividend and income tax equivalent income | | 1,051 | | | 1,098 | | | 1,150 | | | 1,462 | | | 1,652 | | | 2,270 | |
| | Other revenue | | 4,154 | | | 4,017 | | | 2,354 | | | 2,368 | | | 2,564 | | | 2,708 | |
| | Total Revenue from Transactions | | 36,582 | | | 35,874 | | | 37,192 | | | 37,029 | | | 38,100 | | | 40,431 | |
| | | | | | | |
| Less | | Expenses from Transactions | | | | | | | | | | | | | | | | | | |
| | Employee expenses | | 13,896 | | | 14,249 | | | 15,006 | | | 15,868 | | | 16,717 | | | 17,241 | |
| | Superannuation expenses | | | | | | | | | | | | | | | | | | |
| | Superannuation interest cost | | 1,219 | | | 760 | | | 1,468 | | | 1,551 | | | 1,630 | | | 1,704 | |
| | Other superannuation expenses | | 1,959 | | | 2,012 | | | 2,093 | | | 2,125 | | | 2,162 | | | 2,165 | |
| | Other operating expenses | | 6,782 | | | 7,446 | | | 7,776 | | | 8,001 | | | 8,399 | | | 8,635 | |
| | Depreciation and amortisation | | 2,665 | | | 2,551 | | | 2,773 | | | 3,044 | | | 3,261 | | | 3,393 | |
| | Other interest expenses | | 539 | | | 539 | | | 887 | | | 1,418 | | | 1,932 | | | 2,299 | |
| | Grants expenses | | 8,713 | | | 8,889 | | | 9,143 | | | 8,481 | | | 8,090 | | | 8,282 | |
| | Total Expenses from Transactions | | 35,772 | | | 36,447 | | | 39,146 | | | 40,488 | | | 42,191 | | | 43,720 | |
| | | | | | | |
| Equals | | Net Operating Balance | | 809 | | | (574 | ) | | (1,954 | ) | | (3,459 | ) | | (4,090 | ) | | (3,290 | ) |
| | | | | | | |
Plus | | Other economic flows - included in operating result | | 579 | | | 301 | | | 66 | | | (56 | ) | | (57 | ) | | (89 | ) |
| | | | | | | |
Equals | | Operating Result | | 1,388 | | | (273 | ) | | (1,888 | ) | | (3,515 | ) | | (4,148 | ) | | (3,378 | ) |
| | | | | | | |
Plus | | Other economic flows - other movements in equity | | 4,080 | | | (5,105 | ) | | 3,232 | | | 3,167 | | | 3,560 | | | 3,837 | |
| | | | | | | |
Equals | | Comprehensive Result - Total Change In Net Worth | | 5,468 | | | (5,378 | ) | | 1,344 | | | (348 | ) | | (587 | ) | | 459 | |
| | | | | | | |
| | KEY FISCAL AGGREGATES | | | | | | | | | | | | | | | | | | |
| | | | | | | |
| | Net Operating Balance | | 809 | | | (574 | ) | | (1,954 | ) | | (3,459 | ) | | (4,090 | ) | | (3,290 | ) |
| | | | | | | |
Less | | Net Acquisition of Non-financial Assets | | | | | | | | | | | | | | | | | | |
| | Purchases of non-financial assets | | 6,651 | | | 7,137 | | | 9,270 | | | 8,540 | | | 6,151 | | | 4,321 | |
| | Less Sales of non-financial assets | | 340 | | | 343 | | | 251 | | | 266 | | | 207 | | | 359 | |
| | Less Depreciation | | 2,665 | | | 2,551 | | | 2,773 | | | 3,044 | | | 3,261 | | | 3,393 | |
| | Plus Change in inventories | | 97 | | | 81 | | | 63 | | | 60 | | | 40 | | | 42 | |
| | Plus Other movements in non-financial assets | | 200 | | | 99 | | | 45 | | | 51 | | | 51 | | | 51 | |
| | Equals Total Net Acquisition of Non-financial Assets | | 3,944 | | | 4,422 | | | 6,354 | | | 5,341 | | | 2,773 | | | 661 | |
| | | | | | | |
Equals | | Net Lending / (Borrowing) | | (3,134 | ) | | (4,996 | ) | | (8,308 | ) | | (8,800 | ) | | (6,864 | ) | | (3,951 | ) |
Notes:
| 1. | Numbers may not add due to rounding. |
| 2. | Numbers have been restated where subsequent changes in classification have occurred. |
| | | | |
172 | | Budget Strategy and Outlook 2009-10 | | |
Table 10.2
Public Non-financial Corporations Sector Operating Statement 1
| | | | | | | | | | | | | | | | | | | | |
| | | | | 2008-09
Budget 2
$ million | | | 2008-09
Est. Actual
$ million | | | 2009-10
Budget
$ million | | | 2010-11
Projection
$ million | | | 2011-12
Projection
$ million | | | 2012-13
Projection
$ million | |
| | Revenue from Transactions | | | | | | | | | | | | | | | | | | |
| | Grants revenue | | 1,905 | | | 1,877 | | | 1,858 | | | 1,794 | | | 1,699 | | | 1,768 | |
| | Sales of goods and services | | 8,308 | | | 8,307 | | | 8,855 | | | 10,998 | | | 12,188 | | | 13,482 | |
| | Interest income | | 96 | | | 139 | | | 82 | | | 82 | | | 83 | | | 90 | |
| | Other revenue | | 251 | | | 633 | | | 401 | | | 367 | | | 529 | | | 417 | |
| | Total Revenue from Transactions | | 10,561 | | | 10,956 | | | 11,196 | | | 13,242 | | | 14,500 | | | 15,757 | |
| | | | | | | |
Less | | Expenses from Transactions | | | | | | | | | | | | | | | | | | |
| | Employee expenses | | 2,569 | | | 2,342 | | | 2,310 | | | 2,398 | | | 2,511 | | | 2,529 | |
| | Superannuation expenses | | | | | | | | | | | | | | | | | | |
| | Other superannuation expenses | | 70 | | | 78 | | | 91 | | | 98 | | | 103 | | | 115 | |
| | Other operating expenses | | 3,088 | | | 4,086 | | | 3,773 | | | 4,815 | | | 5,045 | | | 5,107 | |
| | Depreciation and amortisation | | 1,897 | | | 1,856 | | | 2,211 | | | 2,521 | | | 2,720 | | | 2,939 | |
| | Other interest expenses | | 2,136 | | | 1,946 | | | 2,206 | | | 2,690 | | | 3,013 | | | 3,244 | |
| | Grants expenses | | 3 | | | 62 | | | 14 | | | 14 | | | 14 | | | 15 | |
| | Other property expenses | | 194 | | | 230 | | | 249 | | | 454 | | | 511 | | | 750 | |
| | Total Expenses from Transactions | | 9,956 | | | 10,600 | | | 10,855 | | | 12,990 | | | 13,917 | | | 14,699 | |
| | | | | | | |
Equals | | Net Operating Balance | | 604 | | | 356 | | | 341 | | | 252 | | | 583 | | | 1,058 | |
| | | | | | | |
Plus | | Other economic flows - included in operating result | | 429 | | | (1,378 | ) | | (126 | ) | | 37 | | | 85 | | | 139 | |
| | | | | | | |
Equals | | Operating Result | | 1,034 | | | (1,022 | ) | | 215 | | | 289 | | | 668 | | | 1,197 | |
| | | | | | | |
Plus | | Other economic flows - other movements in equity | | (365 | ) | | 17 | | | 253 | | | 154 | | | (44 | ) | | (331 | ) |
| | | | | | | |
Equals | | Comprehensive Result - Total Change In Net Worth | | 668 | | | (1,006 | ) | | 467 | | | 443 | | | 624 | | | 866 | |
| | | | | | | |
| | KEY FISCAL AGGREGATES | | | | | | | | | | | | | | | | | | |
| | | | | | | |
| | Net Operating Balance | | 604 | | | 356 | | | 341 | | | 252 | | | 583 | | | 1,058 | |
| | | | | | | |
Less | | Net Acquisition of Non-financial Assets | | | | | | | | | | | | | | | | | | |
| | Purchases of non-financial assets | | 9,985 | | | 9,059 | | | 8,002 | | | 6,092 | | | 5,276 | | | 4,761 | |
| | Less Sales of non-financial assets | | 92 | | | 142 | | | 35 | | | 12 | | | 14 | | | 41 | |
| | Less Depreciation | | 1,897 | | | 1,856 | | | 2,211 | | | 2,521 | | | 2,720 | | | 2,939 | |
| | Plus Change in inventories | | 24 | | | 12 | | | (8 | ) | | 5 | | | 8 | | | 15 | |
| | Plus Other movements in non-financial assets | | 23 | | | (24 | ) | | 25 | | | 28 | | | 30 | | | 33 | |
| | Equals Total Net Acquisition of Non-financial Assets | | 8,045 | | | 7,049 | | | 5,773 | | | 3,592 | | | 2,581 | | | 1,829 | |
| | | | | | | |
Equals | | Net Lending / (Borrowing) | | (7,441 | ) | | (6,693 | ) | | (5,432 | ) | | (3,340 | ) | | (1,998 | ) | | (771 | ) |
Notes:
| 1. | Numbers may not add due to rounding. |
| 2. | Numbers have been restated where subsequent changes in classification have occurred. |
| | | | |
| | | Budget Strategy and Outlook 2009-10 | | 173 |
Table 10.3
Non-financial Public Sector Operating Statement 1
| | | | | | | | | | | | | | | | | | | | |
| | | | | 2008-09
Budget 2
$ million | | | 2008-09
Est. Actual
$ million | | | 2009-10
Budget
$ million | | | 2010-11
Projection
$ million | | | 2011-12
Projection
$ million | | | 2012-13
Projection
$ million | |
| | Revenue from Transactions | | | | | | | | | | | | | | | | | | |
| | Taxation revenue | | 9,921 | | | 8,524 | | | 8,996 | | | 9,549 | | | 10,261 | | | 11,034 | |
| | Grants revenue | | 15,755 | | | 17,350 | | | 18,836 | | | 17,492 | | | 17,162 | | | 17,801 | |
| | Sales of goods and services | | 11,494 | | | 11,570 | | | 12,299 | | | 14,485 | | | 15,802 | | | 17,159 | |
| | Interest income | | 2,295 | | | 1,397 | | | 2,098 | | | 2,196 | | | 2,301 | | | 2,370 | |
| | Dividend and income tax equivalent income | | 28 | | | 26 | | | 31 | | | 40 | | | 44 | | | 100 | |
| | Other revenue | | 4,398 | | | 4,644 | | | 2,748 | | | 2,728 | | | 3,087 | | | 3,118 | |
| | Total Revenue from Transactions | | 43,890 | | | 43,510 | | | 45,007 | | | 46,491 | | | 48,656 | | | 51,582 | |
| | | | | | | |
Less | | Expenses from Transactions | | | | | | | | | | | | | | | | | | |
| | Employee expenses | | 16,373 | | | 16,504 | | | 17,212 | | | 18,154 | | | 19,111 | | | 19,640 | |
| | Superannuation expenses | | | | | | | | | | | | | | | | | | |
| | Superannuation interest cost | | 1,219 | | | 760 | | | 1,468 | | | 1,551 | | | 1,630 | | | 1,704 | |
| | Other superannuation expenses | | 2,029 | | | 2,090 | | | 2,185 | | | 2,223 | | | 2,265 | | | 2,281 | |
| | Other operating expenses | | 9,658 | | | 11,305 | | | 11,319 | | | 12,575 | | | 13,195 | | | 13,493 | |
| | Depreciation and amortisation | | 4,561 | | | 4,407 | | | 4,984 | | | 5,565 | | | 5,980 | | | 6,332 | |
| | Other interest expenses | | 2,579 | | | 2,345 | | | 2,916 | | | 3,790 | | | 4,595 | | | 5,174 | |
| | Grants expenses | | 6,889 | | | 7,161 | | | 7,409 | | | 6,812 | | | 6,487 | | | 6,614 | |
| | Total Expenses from Transactions | | 43,307 | | | 44,572 | | | 47,493 | | | 50,670 | | | 53,263 | | | 55,236 | |
| | | | | | | |
Equals | | Net Operating Balance | | 583 | | | (1,062 | ) | | (2,485 | ) | | (4,179 | ) | | (4,607 | ) | | (3,655 | ) |
| | | | | | | |
Plus | | Other economic flows-included in operating result | | 625 | | | (1,716 | ) | | (60 | ) | | (18 | ) | | 28 | | | 51 | |
| | | | | | | |
Equals | | Operating Result | | 1,207 | | | (2,778 | ) | | (2,545 | ) | | (4,197 | ) | | (4,579 | ) | | (3,604 | ) |
| | | | | | | |
Plus | | Other economic flows-other movements in equity | | 4,261 | | | (2,599 | ) | | 3,890 | | | 3,850 | | | 3,992 | | | 4,063 | |
| | | | | | | |
Equals | | Comprehensive Result-Total Change In Net Worth | | 5,469 | | | (5,378 | ) | | 1,344 | | | (347 | ) | | (587 | ) | | 459 | |
| | | | | | | |
| | KEY FISCAL AGGREGATES | | | | | | | | | | | | | | | | | | |
| | | | | | | |
| | Net Operating Balance | | 583 | | | (1,062 | ) | | (2,485 | ) | | (4,179 | ) | | (4,607 | ) | | (3,655 | ) |
| | | | | | | |
Less | | Net Acquisition of Non-financial Assets | | | | | | | | | | | | | | | | | | |
| | Purchases of non-financial assets | | 16,637 | | | 16,195 | | | 17,272 | | | 14,632 | | | 11,427 | | | 9,081 | |
| | Less Sales of non-financial assets | | 432 | | | 486 | | | 286 | | | 278 | | | 221 | | | 399 | |
| | Less Depreciation | | 4,561 | | | 4,407 | | | 4,984 | | | 5,565 | | | 5,980 | | | 6,332 | |
| | Plus Change in inventories | | 121 | | | 93 | | | 55 | | | 65 | | | 48 | | | 57 | |
| | Plus Other movements in non-financial assets | | 224 | | | 76 | | | 70 | | | 78 | | | 81 | | | 84 | |
| | Equals Total Net Acquisition of Non-financial Assets | | 11,989 | | | 11,471 | | | 12,127 | | | 8,933 | | | 5,354 | | | 2,491 | |
| | | | | | | |
Equals | | Net Lending / (Borrowing) | | (11,406 | ) | | (12,533 | ) | | (14,612 | ) | | (13,112 | ) | | (9,961 | ) | | (6,145 | ) |
Notes:
| 1. | Numbers may not add due to rounding. |
| 2. | Numbers have been restated where subsequent changes in classification have occurred. |
| | | | |
174 | | Budget Strategy and Outlook 2009-10 | | |
Table 10.4
General Government Sector Balance Sheet 1
| | | | | | | | | | | | | | | | | | |
| | | 2008-09
Budget 2
$ million | | | 2008-09
Est. Actual
$ million | | | 2009-10
Budget
$ million | | | 2010-11
Projection
$ million | | | 2011-12
Projection
$ million | | | 2012-13
Projection
$ million | |
Assets | | | | | | | | | | | | | | | | | | |
Financial Assets | | | | | | | | | | | | | | | | | | |
Cash and deposits | | 2,204 | | | 2,298 | | | 1,751 | | | 1,473 | | | 1,254 | | | 1,255 | |
Advances paid | | 816 | | | 564 | | | 635 | | | 701 | | | 742 | | | 754 | |
Investments, loans and placements | | 28,218 | | | 26,195 | | | 27,532 | | | 28,979 | | | 30,410 | | | 31,761 | |
Receivables | | 2,864 | | | 3,244 | | | 3,427 | | | 3,908 | | | 4,129 | | | 4,777 | |
Equity | | | | | | | | | | | | | | | | | | |
Investments in other public sector entities | | 20,669 | | | 15,205 | | | 15,672 | | | 16,115 | | | 16,739 | | | 17,605 | |
Investments - other | | 39 | | | 38 | | | 38 | | | 38 | | | 38 | | | 38 | |
Total Financial Assets | | 54,811 | | | 47,544 | | | 49,056 | | | 51,214 | | | 53,312 | | | 56,190 | |
| | | | | | |
Non-financial Assets | | | | | | | | | | | | | | | | | | |
Land and other fixed assets | | 107,569 | | | 140,766 | | | 149,888 | | | 157,562 | | | 162,962 | | | 166,285 | |
Other non-financial assets | | 5,829 | | | 6,220 | | | 6,583 | | | 6,811 | | | 7,064 | | | 7,303 | |
Total Non-financial Assets | | 113,399 | | | 146,987 | | | 156,471 | | �� | 164,372 | | | 170,026 | | | 173,588 | |
| | | | | | |
Total Assets | | 168,209 | | | 194,531 | | | 205,527 | | | 215,586 | | | 223,337 | | | 229,778 | |
| | | | | | |
Liabilities | | | | | | | | | | | | | | | | | | |
Payables | | 2,388 | | | 2,536 | | | 2,839 | | | 2,647 | | | 2,750 | | | 2,848 | |
Superannuation liability | | 21,874 | | | 23,949 | | | 25,303 | | | 26,580 | | | 27,766 | | | 28,854 | |
Other employee benefits | | 3,665 | | | 4,012 | | | 4,071 | | | 4,246 | | | 4,420 | | | 4,591 | |
Advances received | | 530 | | | 485 | | | 471 | | | 459 | | | 447 | | | 436 | |
Borrowing | | 8,781 | | | 10,765 | | | 18,775 | | | 27,898 | | | 34,707 | | | 39,234 | |
Other liabilities | | 2,408 | | | 2,985 | | | 2,923 | | | 2,959 | | | 3,037 | | | 3,146 | |
Total Liabilities | | 39,646 | | | 44,731 | | | 54,382 | | | 64,789 | | | 73,128 | | | 79,110 | |
| | | | | | |
Net Worth | | 128,563 | | | 149,800 | | | 151,144 | | | 150,797 | | | 150,209 | | | 150,668 | |
Net Financial Worth | | 15,164 | | | 2,814 | | | (5,327 | ) | | (13,575 | ) | | (19,816 | ) | | (22,920 | ) |
Net Financial Liabilities | | 5,504 | | | 12,391 | | | 20,999 | | | 29,691 | | | 36,555 | | | 40,525 | |
Net Debt | | (21,928 | ) | | (17,808 | ) | | (10,672 | ) | | (2,796 | ) | | 2,749 | | | 5,901 | |
Notes:
| 1. | Numbers may not add due to rounding. |
| 2. | Numbers have been restated where subsequent changes in classification have occurred. |
| | | | |
| | | Budget Strategy and Outlook 2009-10 | | 175 |
Table 10.5
Public Non-financial Corporations Sector Balance Sheet 1
| | | | | | | | | | | | | | | | | | |
| | | 2008-09
Budget 2
$ million | | | 2008-09
Est. Actual
$ million | | | 2009-10
Budget
$ million | | | 2010-11
Projection
$ million | | | 2011-12
Projection
$ million | | | 2012-13
Projection
$ million | |
Assets | | | | | | | | | | | | | | | | | | |
Financial Assets | | | | | | | | | | | | | | | | | | |
Cash and deposits | | 1,461 | | | 1,216 | | | 869 | | | 975 | | | 852 | | | 896 | |
Advances paid | | 253 | | | 288 | | | 261 | | | 237 | | | 214 | | | 187 | |
Investments, loans and placements | | 321 | | | 442 | | | 466 | | | 456 | | | 459 | | | 459 | |
Receivables | | 1,547 | | | 1,579 | | | 1,601 | | | 1,798 | | | 1,944 | | | 2,080 | |
Equity | | | | | | | | | | | | | | | | | | |
Investments - other | | 80 | | | 81 | | | 80 | | | 98 | | | 119 | | | 129 | |
Total Financial Assets | | 3,662 | | | 3,606 | | | 3,277 | | | 3,564 | | | 3,587 | | | 3,752 | |
| | | | | | |
Non-financial Assets | | | | | | | | | | | | | | | | | | |
Land and other fixed assets | | 55,707 | | | 57,560 | | | 64,238 | | | 68,968 | | | 72,565 | | | 75,492 | |
Other non-financial assets | | 2,087 | | | 1,576 | | | 1,503 | | | 1,482 | | | 1,485 | | | 1,535 | |
Total Non-financial Assets | | 57,794 | | | 59,135 | | | 65,741 | | | 70,450 | | | 74,050 | | | 77,027 | |
| | | | | | |
Total Assets | | 61,456 | | | 62,741 | | | 69,018 | | | 74,014 | | | 77,637 | | | 80,779 | |
| | | | | | |
Liabilities | | | | | | | | | | | | | | | | | | |
Payables | | 2,234 | | | 2,159 | | | 2,167 | | | 2,736 | | | 2,913 | | | 3,449 | |
Superannuation liability | | (278 | ) | | (76 | ) | | (90 | ) | | (90 | ) | | (90 | ) | | (90 | ) |
Other employee benefits | | 729 | | | 904 | | | 973 | | | 1,037 | | | 1,133 | | | 1,218 | |
Deposits held | | 58 | | | 26 | | | 26 | | | 26 | | | 26 | | | 26 | |
Advances received | | — | | | 13 | | | 12 | | | 11 | | | 11 | | | 10 | |
Borrowing | | 32,823 | | | 33,524 | | | 38,949 | | | 42,453 | | | 44,923 | | | 46,285 | |
Other liabilities | | 7,082 | | | 7,208 | | | 7,531 | | | 7,950 | | | 8,205 | | | 8,498 | |
Total Liabilities | | 42,649 | | | 43,759 | | | 49,568 | | | 54,122 | | | 57,121 | | | 59,397 | |
| | | | | | |
Net Worth | | 18,807 | | | 18,982 | | | 19,450 | | | 19,892 | | | 20,516 | | | 21,382 | |
Net Financial Worth | | (38,987 | ) | | (40,153 | ) | | (46,291 | ) | | (50,557 | ) | | (53,533 | ) | | (55,644 | ) |
Net Debt | | 30,847 | | | 31,618 | | | 37,391 | | | 40,822 | | | 43,436 | | | 44,779 | |
Notes:
| 1. | Numbers may not add due to rounding. |
| 2. | Numbers have been restated where subsequent changes in classification have occurred. |
| | | | |
176 | | Budget Strategy and Outlook 2009-10 | | |
Table 10.6
Non-financial Public Sector Balance Sheet 1
| | | | | | | | | | | | | | | | | | |
| | | 2008-09
Budget 2
$ million | | | 2008-09
Est. Actual
$ million | | | 2009-10
Budget
$ million | | | 2010-11
Projection
$ million | | | 2011-12
Projection
$ million | | | 2012-13
Projection
$ million | |
Assets | | | | | | | | | | | | | | | | | | |
Financial Assets | | | | | | | | | | | | | | | | | | |
Cash and deposits | | 3,665 | | | 3,514 | | | 2,621 | | | 2,448 | | | 2,106 | | | 2,151 | |
Advances paid | | 1,051 | | | 838 | | | 883 | | | 926 | | | 944 | | | 931 | |
Investments, loans and placements | | 28,539 | | | 26,637 | | | 27,998 | | | 29,435 | | | 30,869 | | | 32,220 | |
Receivables | | 3,260 | | | 3,663 | | | 3,750 | | | 4,021 | | | 4,210 | | | 4,446 | |
Equity | | | | | | | | | | | | | | | | | | |
Investments in other public sector entities | | 1,896 | | | (3,713 | ) | | (3,713 | ) | | (3,713 | ) | | (3,713 | ) | | (3,714 | ) |
Investments - other | | 119 | | | 120 | | | 118 | | | 137 | | | 157 | | | 167 | |
Total Financial Assets | | 38,532 | | | 31,058 | | | 31,657 | | | 33,253 | | | 34,572 | | | 36,201 | |
| | | | | | |
Non-financial Assets | | | | | | | | | | | | | | | | | | |
Land and other fixed assets | | 163,242 | | | 198,262 | | | 214,061 | | | 226,465 | | | 235,462 | | | 241,712 | |
Other non-financial assets | | 1,275 | | | 553 | | | 578 | | | 565 | | | 547 | | | 551 | |
Total Non-financial Assets | | 164,517 | | | 198,815 | | | 214,640 | | | 227,030 | | | 236,009 | | | 242,263 | |
| | | | | | |
Total Assets | | 203,049 | | | 229,873 | | | 246,296 | | | 260,283 | | | 270,581 | | | 278,464 | |
| | | | | | |
Liabilities | | | | | | | | | | | | | | | | | | |
Payables | | 3,486 | | | 3,553 | | | 3,746 | | | 3,716 | | | 3,818 | | | 3,903 | |
Superannuation liability | | 21,595 | | | 23,873 | | | 25,213 | | | 26,489 | | | 27,676 | | | 28,764 | |
Other employee benefits | | 4,394 | | | 4,916 | | | 5,044 | | | 5,283 | | | 5,552 | | | 5,809 | |
Deposits held | | 58 | | | 30 | | | 30 | | | 30 | | | 30 | | | 30 | |
Advances received | | 530 | | | 481 | | | 467 | | | 455 | | | 443 | | | 432 | |
Borrowing | | 41,587 | | | 44,288 | | | 57,723 | | | 70,350 | | | 79,630 | | | 85,519 | |
Other liabilities | | 2,836 | | | 2,932 | | | 2,928 | | | 3,163 | | | 3,222 | | | 3,339 | |
Total Liabilities | | 74,486 | | | 80,072 | | | 95,152 | | | 109,486 | | | 120,371 | | | 127,796 | |
| | | | | | |
Net Worth | | 128,563 | | | 149,800 | | | 151,144 | | | 150,797 | | | 150,209 | | | 150,668 | |
Net Financial Worth | | (35,954 | ) | | (49,014 | ) | | (63,495 | ) | | (76,233 | ) | | (85,800 | ) | | (91,595 | ) |
Net Financial Liabilities | | 37,850 | | | 45,301 | | | 59,782 | | | 72,520 | | | 82,086 | | | 87,882 | |
Net Debt | | 8,919 | | | 13,810 | | | 26,719 | | | 38,026 | | | 46,185 | | | 50,680 | |
Notes:
| 1. | Numbers may not add due to rounding. |
| 2. | Numbers have been restated where subsequent changes in classification have occurred. |
| | | | |
| | | Budget Strategy and Outlook 2009-10 | | 177 |
Table 10.7
General Government Sector Cash Flow Statement 1
| | | | | | | | | | | | | | | | | | |
| | | 2008-09
Budget 2
$ million | | | 2008-09
Est. Actual
$ million | | | 2009-10
Budget
$ million | | | 2010-11
Projection
$ million | | | 2011-12
Projection
$ million | | | 2012-13
Projection
$ million | |
Cash Receipts from Operating Activities | | | | | | | | | | | | | | | | | | |
Taxes received | | 10,105 | | | 8,801 | | | 9,286 | | | 9,990 | | | 10,739 | | | 11,546 | |
Grants and subsidies received | | 15,526 | | | 17,122 | | | 18,735 | | | 17,403 | | | 17,104 | | | 17,738 | |
Sales of goods and services | | 3,749 | | | 3,910 | | | 4,050 | | | 4,067 | | | 4,213 | | | 4,271 | |
Interest receipts | | 2,197 | | | 1,257 | | | 2,010 | | | 2,107 | | | 2,209 | | | 2,272 | |
Dividends and income tax equivalents | | 1,012 | | | 1,145 | | | 1,042 | | | 1,065 | | | 1,505 | | | 1,742 | |
Other receipts | | 4,707 | | | 4,665 | | | 3,219 | | | 3,212 | | | 3,347 | | | 3,496 | |
Total Operating Receipts | | 37,297 | | | 36,899 | | | 38,341 | | | 37,844 | | | 39,118 | | | 41,065 | |
| | | | | | |
Cash Payments for Operating Activities | | | | | | | | | | | | | | | | | | |
Payments for employees | | (15,674 | ) | | (15,992 | ) | | (16,975 | ) | | (17,859 | ) | | (18,908 | ) | | (19,624 | ) |
Payments for goods and services | | (7,246 | ) | | (8,067 | ) | | (8,442 | ) | | (8,623 | ) | | (8,995 | ) | | (9,235 | ) |
Grants and subsidies | | (8,757 | ) | | (8,898 | ) | | (9,097 | ) | | (8,510 | ) | | (8,084 | ) | | (8,278 | ) |
Interest paid | | (540 | ) | | (534 | ) | | (883 | ) | | (1,417 | ) | | (1,932 | ) | | (2,299 | ) |
Other payments | | (739 | ) | | (759 | ) | | (762 | ) | | (677 | ) | | (590 | ) | | (591 | ) |
Total Operating Payments | | (32,955 | ) | | (34,250 | ) | | (36,160 | ) | | (37,086 | ) | | (38,509 | ) | | (40,027 | ) |
| | | | | | |
Net Cash Inflows from Operating Activities | | 4,341 | | | 2,649 | | | 2,181 | | | 758 | | | 609 | | | 1,038 | |
| | | | | | |
Cash Flows from Investments in Non-Financial Assets | | | | | | | | | | | | | | | | | | |
Purchases of non-financial assets | | (6,651 | ) | | (7,137 | ) | | (9,270 | ) | | (8,540 | ) | | (6,151 | ) | | (4,321 | ) |
Sales of non-financial assets | | 340 | | | 343 | | | 251 | | | 266 | | | 207 | | | 359 | |
Net Cash Flows from Investments in Non-financial Assets | | (6,311 | ) | | (6,793 | ) | | (9,020 | ) | | (8,274 | ) | | (5,944 | ) | | (3,962 | ) |
| | | | | | |
Net Cash Flows from Investments in Financial Assets for Policy Purposes | | (389 | ) | | (229 | ) | | (307 | ) | | (387 | ) | | (239 | ) | | (258 | ) |
| | | | | | |
Net Cash Flows from Investments in Financial Assets for Liquidity Purposes | | (1,086 | ) | | (436 | ) | | (1,338 | ) | | (1,438 | ) | | (1,423 | ) | | (1,343 | ) |
| | | | | | |
Receipts from Financing Activities | | | | | | | | | | | | | | | | | | |
Advances received (net) | | (18 | ) | | (24 | ) | | (17 | ) | | (16 | ) | | (15 | ) | | (15 | ) |
Borrowing (net) | | 2,915 | | | 4,014 | | | 7,954 | | | 9,079 | | | 6,792 | | | 4,540 | |
Other financing (net) | | — | | | (1 | ) | | — | | | — | | | — | | | — | |
Net Cash Flows from Financing Activities | | 2,897 | | | 3,989 | | | 7,937 | | | 9,063 | | | 6,777 | | | 4,525 | |
| | | | | | |
Net Increase/(Decrease) in Cash held | | (548 | ) | | (821 | ) | | (546 | ) | | (278 | ) | | (219 | ) | | 1 | |
| | | | | | |
Net cash from operating activities | | 4,341 | | | 2,649 | | | 2,181 | | | 758 | | | 609 | | | 1,038 | |
Net cash flows from investments in non-financial assets | | (6,311 | ) | | (6,793 | ) | | (9,020 | ) | | (8,274 | ) | | (5,944 | ) | | (3,962 | ) |
Surplus/(Deficit) | | (1,970 | ) | | (4,144 | ) | | (6,838 | ) | | (7,516 | ) | | (5,335 | ) | | (2,924 | ) |
| | | | | | |
Derivation of ABS GFS Cash Surplus/Deficit | | | | | | | | | | | | | | | | | | |
Cash surplus/(deficit) | | (1,970 | ) | | (4,144 | ) | | (6,838 | ) | | (7,516 | ) | | (5,335 | ) | | (2,924 | ) |
Acquisitions under finance leases and similar arrangements | | (152 | ) | | | | | | | | | | | | | | | |
ABS GFS Cash Surplus/(Deficit) Including Finance Leases and Similar Arrangements | | (2,122 | ) | | (4,144 | ) | | (6,838 | ) | | (7,516 | ) | | (5,335 | ) | | (2,924 | ) |
Notes:
| 1. | Numbers may not add due to rounding. |
| 2. | Numbers have been restated where subsequent changes in classification have occurred. |
| | | | |
178 | | Budget Strategy and Outlook 2009-10 | | |
Table 10.8
Public Non-financial Corporations Sector Cash Flow Statement 1
| | | | | | | | | | | | | | | | | | |
| | | 2008-09
Budget 2
$ million | | | 2008-09
Est. Actual
$ million | | | 2009-10
Budget
$ million | | | 2010-11
Projection
$ million | | | 2011-12
Projection
$ million | | | 2012-13
Projection
$ million | |
Cash Receipts from Operating Activities | | | | | | | | | | | | | | | | | | |
Grants and subsidies received | | 1,904 | | | 1,889 | | | 1,806 | | | 1,793 | | | 1,699 | | | 1,768 | |
Sales of goods and services | | 8,647 | | | 8,982 | | | 9,612 | | | 11,708 | | | 12,950 | | | 14,300 | |
Interest receipts | | 93 | | | 135 | | | 78 | | | 77 | | | 78 | | | 84 | |
Other receipts | | 702 | | | 871 | | | 621 | | | 625 | | | 730 | | | 644 | |
Total Operating Receipts | | 11,346 | | | 11,877 | | | 12,118 | | | 14,203 | | | 15,456 | | | 16,796 | |
| | | | | | |
Cash Payments for Operating Activities | | | | | | | | | | | | | | | | | | |
Payments for employees | | (2,625 | ) | | (2,299 | ) | | (2,348 | ) | | (2,432 | ) | | (2,518 | ) | | (2,559 | ) |
Payments for goods and services | | (3,944 | ) | | (4,778 | ) | | (4,488 | ) | | (5,129 | ) | | (5,405 | ) | | (5,437 | ) |
Grants and subsidies | | — | | | (16 | ) | | (12 | ) | | (12 | ) | | (12 | ) | | (12 | ) |
Interest paid | | (1,759 | ) | | (1,516 | ) | | (1,987 | ) | | (2,516 | ) | | (2,920 | ) | | (3,179 | ) |
Other payments | | (731 | ) | | (885 | ) | | (668 | ) | | (842 | ) | | (1,159 | ) | | (1,343 | ) |
Total Operating Payments | | (9,059 | ) | | (9,494 | ) | | (9,502 | ) | | (10,930 | ) | | (12,014 | ) | | (12,528 | ) |
| | | | | | |
Net Cash Inflows from Operating Activities | | 2,286 | | | 2,382 | | | 2,616 | | | 3,272 | | | 3,442 | | | 4,268 | |
| | | | | | |
Cash Flows from Investments in Non-Financial Assets | | | | | | | | | | | | | | | | | | |
Purchases of non-financial assets | | (9,985 | ) | | (9,059 | ) | | (8,002 | ) | | (6,092 | ) | | (5,276 | ) | | (4,761 | ) |
Sales of non-financial assets | | 92 | | | 142 | | | 35 | | | 12 | | | 14 | | | 41 | |
Net Cash Flows from Investments in Non-financial Assets | | (9,894 | ) | | (8,916 | ) | | (7,967 | ) | | (6,080 | ) | | (5,262 | ) | | (4,720 | ) |
| | | | | | |
Net Cash Flows from Investments in Financial Assets for Policy Purposes | | (324 | ) | | (824 | ) | | 188 | | | (18 | ) | | (20 | ) | | (10 | ) |
| | | | | | |
Net Cash Flows from Investments in Financial Assets for Liquidity Purposes | | — | | | 25 | | | (33 | ) | | 5 | | | (7 | ) | | (1 | ) |
| | | | | | |
Receipts from Financing Activities | | | | | | | | | | | | | | | | | | |
Borrowing (net) | | 8,007 | | | 7,208 | | | 5,335 | | | 3,422 | | | 2,455 | | | 1,348 | |
Dividends paid | | (861 | ) | | (924 | ) | | (819 | ) | | (873 | ) | | (971 | ) | | (1,100 | ) |
Deposits received (net) | | 1 | | | 26 | | | — | | | — | | | — | | | — | |
Other financing (net) | | 388 | | | 327 | | | 332 | | | 378 | | | 242 | | | 258 | |
Net Cash Flows from Financing Activities | | 7,535 | | | 6,638 | | | 4,849 | | | 2,927 | | | 1,725 | | | 507 | |
| | | | | | |
Net Increase/(Decrease) in Cash held | | (396 | ) | | (696 | ) | | (347 | ) | | 106 | | | (123 | ) | | 44 | |
| | | | | | |
Net cash from operating activities | | 2,286 | | | 2,382 | | | 2,616 | | | 3,272 | | | 3,442 | | | 4,268 | |
Net cash flows from investments in non-financial assets | | (9,894 | ) | | (8,916 | ) | | (7,967 | ) | | (6,080 | ) | | (5,262 | ) | | (4,720 | ) |
Dividends paid | | (861 | ) | | (924 | ) | | (819 | ) | | (873 | ) | | (971 | ) | | (1,100 | ) |
Surplus/(Deficit) | | (8,468 | ) | | (7,458 | ) | | (6,169 | ) | | (3,681 | ) | | (2,792 | ) | | (1,552 | ) |
| | | | | | |
Derivation of ABS GFS Cash Surplus/Deficit | | | | | | | | | | | | | | | | | | |
Cash surplus/(deficit) | | (8,468 | ) | | (7,458 | ) | | (6,169 | ) | | (3,681 | ) | | (2,792 | ) | | (1,552 | ) |
ABS GFS Cash Surplus/(Deficit) Including Finance Leases and Similar Arrangements | | (8,468 | ) | | (7,458 | ) | | (6,169 | ) | | (3,681 | ) | | (2,792 | ) | | (1,552 | ) |
Notes:
| 1. | Numbers may not add due to rounding. |
| 2. | Numbers have been restated where subsequent changes in classification have occurred. |
| | | | |
| | | Budget Strategy and Outlook 2009-10 | | 179 |
Table 10.9
Non-financial Public Sector Cash Flow Statement 1
| | | | | | | | | | | | | | | | | | |
| | | 2008-09
Budget 2
$ million | | | 2008-09
Est. Actual
$ million | | | 2009-10
Budget
$ million | | | 2010-11
Projection
$ million | | | 2011-12
Projection
$ million | | | 2012-13
Projection
$ million | |
Cash Receipts from Operating Activities | | | | | | | | | | | | | | | | | | |
Taxes received | | 9,920 | | | 8,566 | | | 8,995 | | | 9,548 | | | 10,260 | | | 11,033 | |
Grants and subsidies received | | 15,592 | | | 17,199 | | | 18,836 | | | 17,504 | | | 17,175 | | | 17,814 | |
Sales of goods and services | | 12,197 | | | 12,686 | | | 13,456 | | | 15,559 | | | 16,940 | | | 18,349 | |
Interest receipts | | 2,290 | | | 1,389 | | | 2,087 | | | 2,183 | | | 2,286 | | | 2,354 | |
Dividends and income tax equivalents | | 20 | | | 18 | | | 26 | | | 31 | | | 40 | | | 43 | |
Other receipts | | 5,402 | | | 5,529 | | | 3,834 | | | 3,831 | | | 4,070 | | | 4,133 | |
Total Operating Receipts | | 45,421 | | | 45,387 | | | 47,234 | | | 48,656 | | | 50,772 | | | 53,727 | |
| | | | | | |
Cash Payments for Operating Activities | | | | | | | | | | | | | | | | | | |
Payments for employees | | (18,207 | ) | | (18,204 | ) | | (19,218 | ) | | (20,179 | ) | | (21,309 | ) | | (22,052 | ) |
Payments for goods and services | | (11,003 | ) | | (12,655 | ) | | (12,739 | ) | | (13,551 | ) | | (14,192 | ) | | (14,464 | ) |
Grants and subsidies | | (6,930 | ) | | (7,109 | ) | | (7,411 | ) | | (6,838 | ) | | (6,477 | ) | | (6,606 | ) |
Interest paid | | (2,203 | ) | | (1,910 | ) | | (2,693 | ) | | (3,615 | ) | | (4,501 | ) | | (5,109 | ) |
Other payments | | (1,311 | ) | | (1,402 | ) | | (1,195 | ) | | (1,317 | ) | | (1,214 | ) | | (1,290 | ) |
Total Operating Payments | | (39,654 | ) | | (41,279 | ) | | (43,256 | ) | | (45,500 | ) | | (47,693 | ) | | (49,522 | ) |
| | | | | | |
Net Cash Inflows from Operating Activities | | 5,767 | | | 4,108 | | | 3,977 | | | 3,156 | | | 3,079 | | | 4,205 | |
| | | | | | |
Cash Flows from Investments in Non-Financial Assets | | | | | | | | | | | | | | | | | | |
Purchases of non-financial assets | | (16,637 | ) | | (16,195 | ) | | (17,272 | ) | | (14,632 | ) | | (11,427 | ) | | (9,081 | ) |
Sales of non-financial assets | | 432 | | | 486 | | | 286 | | | 278 | | | 221 | | | 399 | |
Net Cash Flows from Investments in Non-financial Assets | | (16,205 | ) | | (15,710 | ) | | (16,986 | ) | | (14,354 | ) | | (11,206 | ) | | (8,682 | ) |
| | | | | | |
Net Cash Flows from Investments in Financial Assets for Policy Purposes | | (324 | ) | | (604 | ) | | 188 | | | (18 | ) | | (20 | ) | | (10 | ) |
| | | | | | |
Net Cash Flows from Investments in Financial Assets for Liquidity Purposes | | (1,085 | ) | | (411 | ) | | (1,372 | ) | | (1,433 | ) | | (1,430 | ) | | (1,344 | ) |
| | | | | | |
Receipts from Financing Activities | | | | | | | | | | | | | | | | | | |
Advances received (net) | | (18 | ) | | (24 | ) | | (17 | ) | | (16 | ) | | (15 | ) | | (15 | ) |
Borrowing (net) | | 10,922 | | | 11,222 | | | 13,289 | | | 12,501 | | | 9,247 | | | 5,889 | |
Deposits received (net) | | 1 | | | 26 | | | — | | | — | | | — | | | — | |
Other financing (net) | | (1 | ) | | (123 | ) | | 25 | | | (9 | ) | | 2 | | | — | |
Net Cash Flows from Financing Activities | | 10,904 | | | 11,101 | | | 13,298 | | | 12,476 | | | 9,234 | | | 5,874 | |
| | | | | | |
Net Increase/(Decrease) in Cash held | | (943 | ) | | (1,517 | ) | | (895 | ) | | (174 | ) | | (344 | ) | | 44 | |
| | | | | | |
Net cash from operating activities | | 5,767 | | | 4,108 | | | 3,977 | | | 3,156 | | | 3,079 | | | 4,205 | |
Net cash flows from investments in non-financial assets | | (16,205 | ) | | (15,710 | ) | | (16,986 | ) | | (14,354 | ) | | (11,206 | ) | | (8,682 | ) |
Surplus/(Deficit) | | (10,438 | ) | | (11,602 | ) | | (13,009 | ) | | (11,199 | ) | | (8,127 | ) | | (4,476 | ) |
| | | | | | |
Derivation of ABS GFS Cash Surplus/Deficit | | | | | | | | | | | | | | | | | | |
Cash surplus/(deficit) | | (10,438 | ) | | (11,602 | ) | | (13,009 | ) | | (11,199 | ) | | (8,127 | ) | | (4,476 | ) |
Acquisitions under finance leases and similar arrangements | | (152 | ) | | — | | | — | | | — | | | — | | | — | |
ABS GFS Cash Surplus/(Deficit) Including Finance Leases and Similar Arrangements | | (10,590 | ) | | (11,602 | ) | | (13,009 | ) | | (11,199 | ) | | (8,127 | ) | | (4,476 | ) |
Notes:
| 1. | Numbers may not add due to rounding. |
| 2. | Numbers have been restated where subsequent changes in classification have occurred. |
| | | | |
180 | | Budget Strategy and Outlook 2009-10 | | |
RECONCILIATION OF NET OPERATING BALANCE TO ACCOUNTING OPERATING RESULT
The primary difference between the net operating balance and the accounting operating result calculated under Australian Accounting Standards (AAS) is that valuation adjustments are excluded from the net operating balance.
Data presented in Table 10.10 provides a reconciliation of the General Government sector net operating balance to the accounting operating result.
Table 10.10
Reconciliation of UPF net operating balance to accounting surplus1
| | | | | | | | | |
| | | 2008 09
Budget
$ million | | | 2008 09
Est. Act.
$ million | | | 2009 10
Budget
$ million | |
Net operating balance General Government sector (Table 10.1) | | 809 | | | (574 | ) | | (1,954 | ) |
| | | |
Remeasurement/valuation adjustments | | | | | | | | | |
Bad debts and amortisation | | (57 | ) | | (39 | ) | | (42 | ) |
Deferred tax equivalents | | 329 | | | 279 | | | 219 | |
Dividends received on privatisation sales | | 384 | | | 609 | | | | |
Market value adjustments investments/loans | | 16 | | | (399 | ) | | 12 | |
Revaluation of provisions | | 14 | | | (11 | ) | | 14 | |
Decommissioned infrastructure assets and land under roads | | (143 | ) | | (143 | ) | | (143 | ) |
Gain/(loss) on assets sold/written off | | 36 | | | 5 | | | 6 | |
| | | |
AAS net surplus General Government sector | | 1,388 | | | (273 | ) | | (1,889 | ) |
Note:
| 1. | Numbers may not add due to rounding. |
| | | | |
| | | Budget Strategy and Outlook 2009-10 | | 181 |
GENERAL GOVERNMENT TIME SERIES
Data presented in Table 10.11 provides a time series from 2001-02 to 2007-08 for the General Government sector on the key fiscal aggregates used by the Government to measure financial performance. These aggregates have been backcast (as far as is possible) to comply with AASB 1049 Whole of Government and General Government Sector Financial Reporting.
Table 10.11
General Government Sector1
| | | | | | | | | | | | | | | | | | | | | |
| | | 2001-02
Actual
$ million | | | 2002-03
Actual
$ million | | | 2003-04
Actual
$ million | | | 2004-05
Actual
$ million | | | 2005-06
Actual
$ million | | | 2006-07
Actual
$ million | | | 2007-08
Actual
$ million | |
Revenue from Transactions | | | | | | | | | | | | | | | | | | | | | |
Taxation revenue | | 4,815 | | | 5,598 | | | 6,676 | | | 6,952 | | | 7,396 | | | 8,484 | | | 9,546 | |
Grant revenue | | 10,052 | | | 10,666 | | | 11,528 | | | 12,755 | | | 13,590 | | | 14,373 | | | 15,523 | |
Sales of goods and services | | 1,837 | | | 1,964 | | | 2,105 | | | 2,381 | | | 2,586 | | | 2,889 | | | 3,341 | |
Interest income | | (464 | ) | | (128 | ) | | 2,723 | | | 2,972 | | | 3,414 | | | 3,348 | | | (275 | ) |
Dividend and income tax equivalent income | | 1,287 | | | 1,036 | | | 1,148 | | | 1,028 | | | 1,057 | | | 863 | | | 1,255 | |
Other revenue | | 1,316 | | | 1,118 | | | 1,035 | | | 1,473 | | | 2,039 | | | 2,024 | | | 2,040 | |
Total Revenue | | 18,842 | | | 20,253 | | | 25,214 | | | 27,562 | | | 30,084 | | | 31,982 | | | 31,430 | |
| | | | | | | |
Expenses from Transactions | | | | | | | | | | | | | | | | | | | | | |
Employee expenses | | 7,969 | | | 8,431 | | | 8,972 | | | 9,595 | | | 10,615 | | | 11,731 | | | 13,171 | |
Superannuation expenses | | | | | | | | | | | | | | | | | | | | | |
Superannuation interest costs | | 626 | | | 630 | | | 1,040 | | | 1,009 | | | 826 | | | 1,154 | | | 816 | |
Other superannuation expenses | | 851 | | | 892 | | | 1,061 | | | 1,182 | | | 1,367 | | | 1,513 | | | 1,865 | |
Other operating expenses | | 3,398 | | | 3,794 | | | 3,948 | | | 4,392 | | | 5,227 | | | 6,109 | | | 6,612 | |
Depreciation and amortisation | | 1,511 | | | 1,460 | | | 1,460 | | | 1,585 | | | 1,679 | | | 1,880 | | | 1,850 | |
Other interest expenses | | 245 | | | 222 | | | 213 | | | 209 | | | 174 | | | 180 | | | 346 | |
Grant expenses | | 5,100 | | | 4,813 | | | 5,180 | | | 5,647 | | | 6,482 | | | 7,558 | | | 8,328 | |
Total Expenses | | 19,701 | | | 20,241 | | | 21,874 | | | 23,619 | | | 26,370 | | | 30,128 | | | 32,989 | |
| | | | | | | |
Net Operating Balance | | (858 | ) | | 12 | | | 3,340 | | | 3,942 | | | 3,714 | | | 1,855 | | | (1,559 | ) |
| | | | | | | |
OTHER KEY AGGREGATES | | | | | | | | | | | | | | | | | | | | | |
| | | | | | | |
Purchases of non-financial assets | | 2,416 | | | 2,232 | | | 2,415 | | | 2,843 | | | 3,186 | | | 4,418 | | | 5,716 | |
| | | | | | | |
Net acquisition of non-financial assets | | 708 | | | 155 | | | 503 | | | 1,053 | | | 1,236 | | | 2,067 | | | 3,668 | |
| | | | | | | |
Net lending / (borrowing) | | (1,602 | ) | | (140 | ) | | 2,838 | | | 2,873 | | | 2,478 | | | (211 | ) | | (5,226 | ) |
| | | | | | | |
Net Worth | | 58,093 | | | 64,894 | | | 77,723 | | | 96,433 | | | 105,035 | | | 117,831 | | | 155,178 | |
| | | | | | | |
Net Debt | | (11,572 | ) | | (11,802 | ) | | (14,811 | ) | | (19,406 | ) | | (23,202 | ) | | (26,686 | ) | | (22,598 | ) |
| | | | | | | |
Cash Surplus/Deficit | | 188 | | | 645 | | | 3,490 | | | 4,640 | | | 4,648 | | | 2,350 | | | (4,922 | ) |
Note:
| 1. | Numbers may not add due to rounding. |
Source: Budget Papers and Outcomes Reports for Queensland 2001-02 to 2007-08. (Numbers have been recast for recent changes to UPF presentation.)
| | | | |
182 | | Budget Strategy and Outlook 2009-10 | | |
OTHER GENERAL GOVERNMENT UPF DATA
Data in the following table is presented in accordance with the Uniform Presentation Framework.
Grants
Data presented in Tables 10.12 (a) and 10.12 (b) provides details of General Government current and capital grant revenue and expenses.
Table 10.12(a)
General Government Sector Grant Revenue 1
| | | | |
| | | 2008-09
Est. Act.
$ million | | 2009-10
Budget
$ million |
Current grant revenue | | | | |
Current grants from the Commonwealth | | | | |
General purpose grants | | 8,304 | | 7,611 |
Specific purpose grants/National Partnership Payments | | 4,343 | | 4,779 |
Specific purpose grants for on-passing | | 1,817 | | 2,224 |
Total current grants from the Commonwealth | | 14,464 | | 14,614 |
Other contributions and grants | | 467 | | 411 |
Total current grant revenue | | 14,931 | | 15,025 |
| | |
Capital grant revenue | | | | |
Capital grants from the Commonwealth | | | | |
General purpose grants | | 15 | | 8 |
Specific purpose grants/National Partnership Payments | | 2,140 | | 3,543 |
Specific purpose grants for on-passing | | 176 | | 142 |
Total capital grants from the Commonwealth | | 2,331 | | 3,693 |
Other contributions and grants | | 9 | | 17 |
Total capital grant revenue | | 2,340 | | 3,710 |
Total grant revenue | | 17,272 | | 18,735 |
Note:
| 1. | Numbers may not add due to rounding. |
| | | | |
| | | Budget Strategy and Outlook 2009-10 | | 183 |
Table 10.12(b)
General Government Sector Grant Expense 1
| | | | |
| | | 2008-09
Est. Act.
$ million | | 2009-10
Budget
$ million |
Current grant expense | | | | |
Private and Not-for-profit sector | | 3,433 | | 3,209 |
Private and Not-for-profit sector on-passing | | 1,419 | | 1,845 |
Households sector on-passing | | 28 | | — |
Local Government | | 209 | | 190 |
Local Government on-passing | | 370 | | 379 |
Grants to other sectors of Government | | 1,735 | | 1,674 |
Other | | 383 | | 202 |
Total current grant expense | | 7,578 | | 7,499 |
| | |
Capital grant expense | | | | |
Private and Not-for-profit sector | | 176 | | 421 |
Private and Not-for-profit sector on-passing | | 15 | | — |
Households sector on-passing | | 161 | | 142 |
Local Government | | 621 | | 775 |
Grants to other sectors of Government | | 56 | | 75 |
Other | | 282 | | 231 |
Total capital grant expense | | 1,312 | | 1,645 |
Total grant expense | | 8,889 | | 9,143 |
Note:
| 1. | Numbers may not add due to rounding. |
Dividend and Income Tax Equivalent Income
Table 10.13 provides details of the source of Dividend and Income Tax Equivalent income in the General Government sector.
Table 10.13
General Government Sector Dividend and Income Tax Equivalent Income 1
| | | | |
| | | 2008-09
Est. Act.
$ million | | 2009-10
Budget
$ million |
Dividend and Income Tax Equivalent income from PNFC sector | | 1,072 | | 1,119 |
Dividend and Income Tax Equivalent income from PFC sector | | 22 | | 27 |
Other Dividend income | | 4 | | 4 |
Total Dividend and Income Tax Equivalent income | | 1,098 | | 1,150 |
Note:
| 1. | Numbers may not add due to rounding. |
| | | | |
184 | | Budget Strategy and Outlook 2009-10 | | |
Expenses by function
Data presented in Table 10.14 provides details of General Government sector expenses by function.
Table 10.14
General Government Sector Expenses by Function1
| | | | | | | | | | | | |
| | | 2008-09
Budget
$ million | | 2008-09
Est. Act.
$ million | | 2009-10
Budget
$ million | | 2010-11
Projection
$ million | | 2011-12
Projection
$ million | | 2012-13
Projection
$ million |
General public services | | 1,428 | | 1,536 | | 1,411 | | 1,367 | | 1,409 | | 1,432 |
Public order and safety | | 3,351 | | 3,475 | | 3,594 | | 3,729 | | 3,873 | | 3,907 |
Education | | 8,241 | | 8,326 | | 9,332 | | 9,573 | | 9,644 | | 9,723 |
Health | | 8,928 | | 9,058 | | 9,523 | | 10,355 | | 11,033 | | 11,619 |
Social security and welfare | | 2,245 | | 2,179 | | 2,379 | | 2,553 | | 2,722 | | 2,874 |
Housing and community amenities | | 1,247 | | 1,778 | | 2,217 | | 1,760 | | 1,613 | | 1,680 |
Recreation and culture | | 823 | | 814 | | 711 | | 712 | | 719 | | 708 |
Fuel and energy | | 1,084 | | 1,126 | | 487 | | 394 | | 339 | | 373 |
Agriculture, forestry, fishing and hunting | | 943 | | 981 | | 801 | | 759 | | 800 | | 813 |
Mining, manufacturing and construction | | 160 | | 213 | | 225 | | 223 | | 242 | | 247 |
Transport and communications | | 3,953 | | 4,266 | | 4,511 | | 4,619 | | 4,855 | | 4,992 |
Other economic affairs | | 688 | | 660 | | 798 | | 789 | | 778 | | 754 |
Other purposes | | 2,681 | | 2,035 | | 3,156 | | 3,657 | | 4,164 | | 4,602 |
| | | | | | |
Total Expenses | | 35,772 | | 36,447 | | 39,146 | | 40,488 | | 42,191 | | 43,720 |
Notes:
| 1. | Numbers may not add due to rounding. |
| 2. | Numbers have been restated where subsequent changes in classification have occurred. |
| | | | |
| | | Budget Strategy and Outlook 2009-10 | | 185 |
Purchases of non-financial assets by function
Data presented in Table 10.15 provides details of General Government sector purchases of non-financial assets by function.
Table 10.15
General Government Sector Purchases of Non-financial Assets by Function1
| | | | | | |
| | | 2008-09
Budget
$ million | | 2008-09
Est. Act.
$ million | | 2009-10
Budget
$ million |
General public services | | 424 | | 450 | | 522 |
Public order and safety | | 970 | | 684 | | 872 |
Education | | 527 | | 627 | | 1,323 |
Health | | 902 | | 822 | | 1,218 |
Social security and welfare | | 152 | | 119 | | 223 |
Housing and community amenities | | 340 | | 410 | | 1,037 |
Recreation and culture | | 164 | | 139 | | 129 |
Agriculture, forestry, fishing and hunting | | 67 | | 71 | | 85 |
Mining, manufacturing and construction | | 20 | | 13 | | 15 |
Transport and communications | | 2,947 | | 3,648 | | 3,614 |
Other economic affairs | | 138 | | 153 | | 231 |
| | | |
Total Purchases | | 6,651 | | 7,137 | | 9,270 |
Note:
| 1. | Numbers may not add due to rounding. |
| | | | |
186 | | Budget Strategy and Outlook 2009-10 | | |
Taxes
Data presented in Table 10.16 provides details of taxation revenue collected by the General Government sector.
Table 10.16
General Government Sector Taxes 1
| | | | |
| | | 2008 09
Est. Actual
$ million | | 2009 10
Budget
$ million |
Taxes on employers’ payroll and labour force | | 2,728 | | 2,736 |
| | |
Taxes on property | | | | |
Land taxes | | 807 | | 1,047 |
Stamp duties on financial and capital transactions | | 1,777 | | 1,704 |
Other | | 441 | | 492 |
| | |
Taxes on the provision of goods and services | | | | |
Taxes on gambling | | 931 | | 1,006 |
Taxes on insurance | | 489 | | 509 |
| | |
Taxes on use of goods and performance of activities | | | | |
Motor vehicle taxes | | 1,449 | | 1,647 |
Other | | 138 | | 145 |
| | |
Total Taxation Revenue | | 8,759 | | 9,287 |
Note:
| 1. | Numbers may not add due to rounding. |
| | | | |
| | | Budget Strategy and Outlook 2009-10 | | 187 |
Loan Council Allocation
The Australian Loan Council requires all jurisdictions to prepare Loan Council Allocations (LCA) to provide an indication of each government’s probable call on financial markets over the forthcoming financial year.
Table 10.17 presents the State’s revised LCA Budget allocation and the Loan Council endorsed LCA for 2009-10.
Table 10.17
Loan Council Allocation 1
| | | | | | | |
| | | | | 2009 10
Nomination
$ million | | 2009 10
Budget
$ million | |
| | General Government sector cash deficit/(surplus) 2 | | 6,134 | | 6,838 | |
| | PNFC sector cash deficit/(surplus) 2 | | 5,617 | | 6,169 | |
| | | |
| | Non Financial Public Sector cash deficit/(surplus) 2 | | 11,751 | | 13,009 | |
| | | |
Less | | Net cash flows from investments in financial assets for policy purposes | | 180 | | 188 | |
Plus | | Memorandum items 3 | | 41 | | (1,411 | ) |
| | | |
| | Loan Council Allocation | | 11,612 | | 11,410 | |
Notes:
| 1. | Numbers may not add due to rounding. |
| 2. | Figures in brackets represent surpluses. |
| 3. | Memorandum items include operating leases and local government borrowings. |
The State’s Budget LCA allocation is a deficit of $11.41 billion. This compares to the LCA nomination of $11.612 billion.
| | | | |
188 | | Budget Strategy and Outlook 2009-10 | | |
CONTINGENT LIABILITIES
Contingent liabilities represent items that are not included in the Budget as significant uncertainty exists as to whether the Government would sacrifice future economic benefits in respect of these items. Nevertheless, such contingencies need to be recognised and managed wherever possible in terms of their potential impact on the Government’s financial position in the future.
The State’s quantifiable and non-quantifiable contingent liabilities are detailed in the 2007-08 Report on State Finances – Consolidated Financial Statements (Note 46). A summary of the State’s quantifiable contingent liabilities as at 30 June 2008 is provided below.
Table 10.18
Contingent liabilities
| | |
| | | 2008
$ million |
Nature of contingent liability | | |
| |
Guarantees and indemnities | | 6,057 |
QTC stock loans | | 124 |
Other | | 83 |
| |
Total | | 6,264 |
| | | | |
| | | Budget Strategy and Outlook 2009-10 | | 189 |
BACKGROUND AND INTERPRETATION OF UNIFORM PRESENTATION FRAMEWORK
As mentioned in the introduction to this chapter, the UPF has recently been reviewed following the release of the Australian Accounting Standards Board’s (AASB) new accounting standard, AASB 1049 Whole of Government and General Government Sector Financial Reporting.
The new standard aims to harmonise Government Finance Statistics (GFS) and Generally Accepted Accounting Principles (GAAP) with the objective of improving the clarity and transparency of government financial statements.
Accrual GFS framework
The GFS reporting framework, developed by the Australian Bureau of Statistics (ABS), is based on international statistical standards (the International Monetary Fund Manual on Government Finance Statistics and the United Nations System of National Accounts). This allows comprehensive assessments to be made of the economic impact of government.
The accrual GFS framework is based on an integrated recording of stocks and flows. Stocks refer to a unit’s holdings of assets, liabilities and net worth at a point in time, whilst flows represent the movement in the stock of assets and liabilities between two points in time. Flows comprise two separate types, transactions and other economic flows. Transactions come about as a result of mutually agreed interactions between units or within a single unit. Other economic flows would include revaluations and destruction or discovery of assets that do not result from a transaction. In GFS operating statements, other economic flows, being outside of the control of government, are excluded and do not affect the net operating result.
Generally Accepted Accounting Principles
In addition to the GFS framework, public sector entities have been required to report at year end against AAS 31 Financial Reporting by Government, which meant complying with the Accounting Standards issued by the AASB.
Harmonisation under AASB 1049
This dual reporting regime caused confusion for financial report users and so the Financial Reporting Council asked the AASB to develop a framework harmonising GAAP and GFS to issue an Australian accounting standard for a single set of government reports.
| | | | |
190 | | Budget Strategy and Outlook 2009-10 | | |
In the development of AASB 1049, the AASB adopted the following approaches:
| • | | Adoption of GAAP definition, recognition and measurement principles in almost all cases |
| • | | Amending presentation requirements to encompass a comprehensive result that retains GAAP classification system but overlays it with a transactions and other economic flows classification system based on GFS |
| • | | Expanding the disclosure requirements to incorporate key fiscal aggregates required by GFS. |
Revisions to the Uniform Presentation Framework
Following the introduction of AASB 1049, the Australian, state and territory governments consider that the UPF will continue to be an important framework for ensuring comparability of financial information across jurisdictions. There are a number of important areas where the UPF provides either additional information or clearer guidance on the preparation of government financial statements to that of AASB 1049. For example, the Australian, state and territory governments agree that net debt, a fiscal indicator not required by the new standard, continues to be an important indicator in transparent budget reporting and should continue to be presented on the face of the financial statements as a fiscal aggregate. Further, the UPF shall continue to apply to financial statements produced by government in budgets, mid-year budget updates and final budget outcome reports, whereas the new accounting standard applies only to outcome reports.
Therefore, rather than replacing the UPF with the new accounting standard, the framework was updated to align with AASB 1049. Australian, state and territory governments agreed that the updated framework would continue to provide a common core of comparable financial information in their budget papers and comparable data amongst jurisdictions while maintaining at least the current level of transparency.
Aligning the framework with AASB 1049 was not intended to create a UPF that complies with all the reporting requirements of AASB 1049. For example, the UPF does not include the same level of detail in relation to disclosure requirements as AASB 1049. Instead, the revised UPF allows jurisdictions to utilise the framework as the base set of statements and add additional relevant information in order to comply with AASB 1049.
Major disclosure differences arising from the adoption of the revised UPF are outlined in Box 10.1.
| | | | |
| | | Budget Strategy and Outlook 2009-10 | | 191 |
|
Box 10.1 Major disclosure differences arising from the adoption of the revised Uniform Presentation Framework |
ALL SECTORS Operating Statement • Current and capital grants revenue and expenses have been grouped together in the Operating statement. • Dividend and income tax equivalent income has been split out from Other revenue. • Superannuation expenses have been separately disclosed from Employee expenses. • Other economic flows are now shown on the Operating statement, separated into those affecting the Operating result (or accounting profit) and those affecting equity or reserves. Balance Sheet • Deferred tax assets and liabilities are now recognised in the balance sheet in the categories Other non-financial assets and Other liabilities respectively. • Prepayments are included in Other non-financial assets rather than with receivables, which reduces the Net financial worth. Cash Flow Statement • Interest receipts and Dividend and income tax equivalent receipts have been split out from Other receipts. • Payments for employees have been separated from Payments for goods and services. GENERAL GOVERNMENT SECTOR Operating Statement • Expanded grant revenue and expense information is supplied in two additional tables 10.12 (a) and (b). • Additional information on Dividend and income tax equivalent income is supplied in Table 10.13. Balance Sheet • The recognition of deferred tax assets and liabilities in the balance sheet is offset exactly by a reduction in the Investment in other public sector entities. • Net worth is therefore not impacted by this change but Net financial worth is, as the Deferred tax assets are disclosed as non-financial. |
| | | | |
192 | | Budget Strategy and Outlook 2009-10 | | |
|
Box 10.1 (cont.) Major disclosure differences arising from the adoption of the revised Uniform Presentation Framework |
PUBLIC NON-FINANCIAL SECTOR Operating Statement • Competitive neutrality fees, performance dividends and credit margin fees are now included in Other interest expenses rather than other operating expenses. • The Net operating balance for the PNFC sector no longer includes dividends declared and paid, and these are now included in Other economic flows – other movements in equity. • This also impacts on the Net lending aggregate which now excludes dividends. • The Operating result for the PNFC sector is effectively accounting profit after tax. Balance Sheet • The overfunded defined benefit superannuation is classified as a negative liability rather than an asset. • The net worth of the PNFC sector is reduced by the recognition of deferred tax assets and liabilities in the balance sheet. • The Net financial worth is reduced by the amount of the deferred tax liabilities as well as the deferred tax asset which disclosed as non-financial. Cash Flow Statement • Income tax paid is included in Other payments in the cash flow statement rather than Distributions paid, which increases the Cash surplus/(deficit). |
Operating statement
The operating statement combines the net result from transactions (net operating balance) and the impact of other economic flows to calculate the comprehensive result (total change in net worth). Neither other economic flows nor the comprehensive result were required under the former UPF.
Net operating balance is represented by revenues less expenses from transactions and excludes any other economic flows such as revaluations, gains or losses on asset disposals and allowances for doubtful debts.
In addition to the net result from transactions (net operating balance), the operating statement also includes other economic flows which are the total change in net worth driven by economic flows other than through transactions. Other economic flows are split between those that relate to the operating result (under GAAP) and those that relate to equity. The total of the net operating balance and all other economic flows equals the comprehensive result (total change in net worth).
| | | | |
| | | Budget Strategy and Outlook 2009-10 | | 193 |
Net lending is the net operating balance less net acquisition of non-financial assets. It is also referred to as the fiscal balance. It measures, in accrual terms, the gap between Government savings plus net capital transfers and investment in non-financial assets. A surplus indicates that the State Government is placing financial resources at the disposal of other sectors of the economy, whilst a deficit reflects the State utilising the financial resources of other sectors. Queensland’s net lending is driven by the size of the State’s capital program.
Balance sheet
The balance sheet shows stocks of financial and non-financial assets and liabilities. Key indicators in the balance sheet are net worth, net financial worth, net financial liabilities and net debt.
Net worth, also known as net assets, is defined as total assets less total liabilities. It provides a more comprehensive picture of a government’s position as all assets and liabilities are taken into account.
Net financial worth, on the other hand, is calculated as financial assets minus total liabilities. It measures a government’s net holdings of financial assets.
Net financial liabilities (a new key aggregate for the UPF) is calculated by deducting equity investments in the PNFC/PFC sectors from the net financial worth.
Net debt is represented by the sum of selected financial liabilities (such as deposits held, advances received and borrowings) minus the sum of selected financial assets (cash and deposits, loans and placements). It provides an indication of the strength of a government’s financial position.
Cash flow statement
Cash means cash on hand (notes and coins held and deposits held at call with a bank or financial institution) and cash equivalents (highly liquid investments readily convertible to cash and overdrafts considered integral to the cash management functions).
The cash flow statement demonstrates how cash is generated and applied in a single accounting period.
The cash surplus/deficit is the cash counterpart of the fiscal balance as disclosed in the operating statement. A surplus reflects the availability of cash to increase the State’s financial assets or decrease its liabilities, whilst a deficit reflects the requirement for cash either by running down the State’s financial assets or by drawing on the cash reserves of other sectors of the economy. It comprises net cash received/paid from operating activities, from sales and purchases of non-financial assets and from financing activities.
| | | | |
194 | | Budget Strategy and Outlook 2009-10 | | |
SECTOR CLASSIFICATION
GFS data is presented by institutional sector, distinguishing between the General Government sector and the Public Non-financial Corporations (PNFC) sector.
Budget reporting focuses on the General Government sector, which provides regulatory services and goods and services of a non-market nature that are provided at less than cost or at no cost. These services are largely financed by general revenue (Australian Government grants and state taxation). This sector comprises government departments, their commercialised business units/shared service providers and certain statutory bodies.
The PNFC sector comprises bodies that provide mainly market goods and services that are of a non-regulatory and non-financial nature. PNFCs are financed through sales to consumers of their goods and services and may be supplemented by explicit government subsidy to satisfy community service obligations. In general, PNFCs are legally distinguishable from the governments that own them. Examples of PNFCs include QR and the energy entities.
Together, the General Government sector and the PNFC sector comprise the Non-financial Public sector.
Further discussion of the GFS framework of reporting, including definitions of GFS terms, can be obtained from the webpage of the Australian Bureau of Statistics at www.abs.gov.au.
| | | | |
| | | Budget Strategy and Outlook 2009-10 | | 195 |
REPORTING ENTITIES
The reporting entities included in the General Government and PNFC sectors for the 2009-10 Budget are provided below.
General Government
Departments
Communities
Community Safety
Education and Training
Electoral Commission of Queensland
Employment, Economic Development and Innovation
Environment and Resource Management
Forestry Plantations Queensland Office
Health
Infrastructure and Planning
Justice and Attorney-General
Legislative Assembly
Office of the Governor
Office of the Ombudsman
Police
Premier and Cabinet
Public Service Commission
Public Works
Queensland Audit Office
The Public Trustee of Queensland
Transport and Main Roads
Treasury
| | | | |
196 | | Budget Strategy and Outlook 2009-10 | | |
Statutory Authorities
Anti-Discrimination Commission
Australian Agricultural College Corporation
Board of the Queensland Museum
City North Infrastructure Pty Ltd
Commission for Children and Young People and Child Guardian
Crime and Misconduct Commission
Gold Coast Institute of TAFE
Health Quality and Complaints Commission
Legal Aid Queensland
Library Board of Queensland
Motor Accident Insurance Commission
Nominal Defendant
Office of the Information Commissioner
Prostitution Licensing Authority
Queensland Art Gallery Board of Trustees
Queensland Building Services Authority
Queensland Events Corporation Pty Ltd
Queensland Future Growth Corporation
Queensland Performing Arts Trust
Queensland Rural Adjustment Authority (QRAA)
Queensland Studies Authority
Queensland Treasury Holdings Pty Ltd
Residential Tenancies Authority
South Bank Corporation
Southbank Institute of Technology
The Council of The Queensland Institute of Medical Research
Tourism Queensland
Translink Transit Authority
Urban Land Development Authority
Workers’ Compensation Regulatory Authority (Q-Comp)
Commercialised Business Units
CITEC
Goprint
Main Roads – RoadTek
Project Services
Property Services Group
QBuild
QFleet
SDS
Shared Service Providers
Corporate Administration Agency
Corporate and Professional Services
CorpTech
Queensland Health Shared Service Provider
Shared Service Agency
| | | | |
| | | Budget Strategy and Outlook 2009-10 | | 197 |
Public Non-financial Corporations
Cairns Ports
CS Energy Ltd
DBCT Holdings Pty Ltd
ENERGEX Ltd
Ergon Energy Corporation Limited
Forestry Plantations Queensland
Gladstone Area Water Board
Gladstone Ports Corporation
Gold Coast Events Co Pty Ltd
Mackay Ports
Mount Isa Water Board
Port of Brisbane Corporation Limited
Port of Townsville
Ports Corporation of Queensland Limited
Powerlink Queensland
Qld Airport Holdings (Cairns) Pty Ltd
Qld Airport Holdings (Mackay) Pty Ltd
Queensland Bulk Water Supply Authority
Queensland Bulk Water Transport Authority
Queensland Lottery Corporation Pty Ltd
Queensland Manufactured Water Authority
Queensland Motorways Limited
QR Limited
Queensland Water Infrastructure Pty Ltd
SEQ Water Grid Manager
South East Queensland (Gold Coast) Desalination Company Pty Ltd
Southern Regional Water Pipeline Company Pty Ltd
Stadiums Queensland
Stanwell Corporation Ltd
SunWater
Tarong Energy Corporation Ltd
The Trustees of Parklands Gold Coast
Western Corridor Recycled Water Pty Ltd
ZeroGen Pty Ltd
| | | | |
198 | | Budget Strategy and Outlook 2009-10 | | |
APPENDIX A – TAX EXPENDITURE STATEMENT
OVERVIEW
Governments employ a range of policy tools to achieve social and economic objectives. These include the use of direct budgetary outlays, regulatory mechanisms and taxation. This Tax Expenditure Statement (TES) details revenue foregone as a result of Government decisions relating to the provision of tax concessions. The TES is designed to improve transparency in the use of tax expenditures and increase public understanding of the fiscal process.
Tax expenditures are reductions in tax revenue that result from the use of the taxation system as a policy tool to deliver Government policy objectives. Tax expenditures are provided through a range of concessions, including:
| • | | the application of reduced tax rates to certain groups or sectors of the community |
| • | | provisions which defer payment of a tax liability to a future period. |
Labelling an exemption or concession as a tax expenditure does not necessarily imply any judgement as to its appropriateness. It merely makes the amount of the exemption or concession explicit and thereby facilitates its scrutiny as part of the annual Budget process.
Methodology
Revenue foregone approach
The method used almost exclusively by governments to quantify the value of their tax expenditures is the revenue foregone approach. This method estimates the revenue foregone through use of the concession by applying the benchmark rate of taxation to the volume of activities or assets affected by the concession. One of the deficiencies of the revenue foregone approach is that the effect on taxpayer behaviour resulting from the removal of the particular tax expenditure is not factored into the estimate. Consequently, the aggregation of costings for individual tax expenditure items presented in the TES will not necessarily provide an accurate estimate of the total level of assistance provided through tax expenditures.
| | | | |
| | | Budget Strategy and Outlook 2009-10 | | 199 |
Measuring tax expenditures requires the identification of:
| • | | concessionally taxed components of the benchmark tax base such as a specific activity or class of taxpayer |
| • | | a benchmark tax rate to apply to the concessionally taxed components of the tax base. |
Defining the tax benchmark
The most important step in the preparation of a TES is the establishment of a benchmark for each tax included in the statement. The benchmark provides a basis against which each tax concession can be evaluated. The aim of the benchmark is to determine which concessions are tax expenditures as opposed to structural elements of the tax. The key features of a tax benchmark are:
| • | | any specific accounting conventions applicable to the tax |
| • | | the deductibility of compulsory payments |
| • | | any provisions to facilitate administration |
| • | | provisions relating to any fiscal obligations. |
By definition, tax expenditures are those tax concessions not included as part of the tax benchmark.
Identification of benchmark revenue bases and rates requires a degree of judgement and is not definitive. Furthermore, data limitations mean that the tax expenditures are approximations and are not exhaustive. This statement does not include estimates of revenue foregone from exemptions or concessions provided to Government agencies. Very small exemptions or concessions are also excluded.
THE TAX EXPENDITURE STATEMENT
This year’s statement includes estimates of tax expenditures in 2007-08 and 2008-09 for payroll tax, land tax, duties, the community ambulance cover and gambling taxes. A summary of the major tax expenditures valued on the basis of revenue foregone is presented in Table A.1. Not all expenditures can be quantified at this time. Accordingly, the total value of tax expenditures should be considered as indicative only.
| | | | |
200 | | Budget Strategy and Outlook 2009-10 | | |
Table A.1
Tax expenditure summary1
| | | | |
| | | 2007-082
$ million | | 2008-09
$ million |
Payroll Tax | | | | |
Exemption threshold3 | | 999 | | 1,086 |
Deduction scheme4 | | 212 | | 265 |
Section 14 exemptions | | | | |
Local Government | | 95 | | 99 |
Education | | 153 | | 160 |
Hospitals | | 235 | | 244 |
Total Payroll Tax | | 1,694 | | 1,854 |
| | |
Land Tax | | | | |
Liability thresholds5 | | 344 | | 368 |
Graduated land tax scale | | 131 | | 172 |
Primary production deduction | | 55 | | 72 |
Section 13 exemptions not included elsewhere6 | | 55 | | 66 |
Land developers’ concession | | 15 | | 18 |
Capping of values | | 18 | | 30 |
Total Land Tax | | 618 | | 726 |
| | |
Duties | | | | |
Transfer duty on residential property | | | | |
Home concession | | 371 | | 305 |
First home concession | | 163 | | 239 |
First home vacant land concession | | 4 | | 4 |
Insurance duty | | | | |
Non-life insurance | | 119 | | 133 |
Workcover | | 23 | | 24 |
Health insurance | | 163 | | 173 |
Total Duties | | 843 | | 878 |
| | |
Community Ambulance Cover | | | | |
Concession to pensioners and seniors7 | | 44 | | 46 |
| | |
Taxes on Gambling | | | | |
Gaming machine taxes | | 114 | | 121 |
Casino taxes | | 10 | | 8 |
Total Gambling Tax | | 124 | | 129 |
Notes:
| 1. | Numbers may not add due to rounding. |
| 2. | 2007 08 estimates may have been revised since the 2008 09 Budget. |
| 3. | Exemption threshold of $1 million applies. |
| 4. | Deduction of $1 million, which reduces by $1 for every $4 above $1 million, is applicable to employers with an annual payroll between $1 million and $5 million from 1 July 2008. |
| 5. | Land tax is payable only on the value of taxable land above a threshold which depends on the ownership structure. |
| 6. | Applicable, but not limited, to religious bodies, public benevolent institutions and other exempt charitable institutions. |
| 7. | Estimates are based on the revenue foregone through the use of the levy exemption by pensioners and senior citizens. |
| | | | |
| | | Budget Strategy and Outlook 2009-10 | | 201 |
DISCUSSION OF INDIVIDUAL TAXES
Payroll tax
The benchmark tax base for payroll tax is assumed to be all wages, salaries and supplements (including employer superannuation contributions) paid in Queensland, as defined in the Pay-roll Tax Act 1971. The benchmark tax rate for payroll tax is assumed to be the statutory rate applying in each financial year.
Payroll tax exemption threshold
Employers who employ in Queensland with an annual Australian payroll of $1 million or less are exempt from payroll tax. On the basis of average weekly earnings, this threshold corresponds to approximately 17 full-time equivalent employees. This exemption is designed to assist small and medium sized businesses.
Deduction scheme
Since 1 July 2008, employers who employ in Queensland with Australian payrolls between $1 million and $5 million benefit from a deduction of $1 million, which reduces by $1 for every $4 by which the annual payroll exceeds $1 million. There is no deduction for employers or groups with an annual payroll in excess of $5 million. In 2007-08, the deduction reduced by $1 for every $3 by which the annual payroll exceeded $1 million, with no deduction when annual payrolls exceeded $4 million.
Section 14 exemptions
A number of organisations are provided with exemptions from payroll tax under Section 14 of the Pay-roll Tax Act 1971. The activities for which estimates have been calculated are wages paid by public hospitals, non-tertiary private educational institutions and local governments (excluding commercial activities).
Land tax
The benchmark tax base is assumed to be all freehold land within Queensland, excluding residential land used as a principal place of residence and land owned by individuals with a value for that year below the threshold. The benchmark tax rate for land tax is assumed to be the top rate of land tax applicable in Queensland in each financial year.
Liability thresholds
Land tax is payable on the value of taxable land above a threshold which depends on the land’s ownership. The threshold for companies, trusts and absentees is $350,000 and for resident individuals the threshold is $600,000.
| | | | |
202 | | Budget Strategy and Outlook 2009-10 | | |
Residential land owned by resident individuals as their principal place of residence is excluded from the estimate. The exemption from paying below a minimum amount ($1,200 in 2007-08 and $500 in 2008-09) is not included as a tax expenditure as it is regarded as the application of an administration threshold.
Graduated land tax scale
In 2007-08 and 2008-09, a graduated (concessional) scale of land tax rates is applicable to land with a taxable value of less than $3 million for resident individuals and $2 million for companies, trustees and absentees.
Primary production deduction
The taxable value of land owned by a resident individual, trustee or some absentees and companies does not include all or part of their land that is used for the business of agriculture, pasturage or dairy farming.
Section 13 exemptions (not elsewhere included)
A number of land tax exemptions are granted under Section 13 of the Land Tax Act 1915 to eligible organisations. These include, but are not limited to, public benevolent institutions, religious institutions and other exempt charitable institutions, retirement villages, trade unions and showgrounds.
Land developers’ concession
From 1 July 1998, land developers have been charged land tax on 60% of the unimproved value of (undeveloped) land subdivided in the previous financial year and which remains unsold at 30 June of that year. This concession is outlined in Section 3CA of the Land Tax Act 1915.
Transfer duty concession on residential property
The benchmark tax base is assumed to be all sales of residential property within Queensland. The benchmark tax scale is assumed to be the scale that actually applied in each financial year.
Home concession
A concessional rate of duty applies to purchases of a principal place of residence. In 2007-08, a concessional rate of 1% was applied on dutiable values up to $320,000. From 1 July 2008, the 1% concessional rate has been applied on dutiable values up to $350,000, rather than the normal schedule of rates between 1.5% and 3.5%. For properties valued over $350,000, the scheduled rates of transfer duty apply on the excess.
| | | | |
| | | Budget Strategy and Outlook 2009-10 | | 203 |
First home concession
Where a purchaser has not previously owned a residence in Queensland or elsewhere, the purchaser of a home receives a more generous concession on duty. This concession comprises a rebate in addition to the home concession on properties (this concession may not be applicable if the purchase price is less than the full market value of the property). The size of the rebate depends on the value of the property. Since 1 September 2008, a full concession has been provided to purchases of a first principal place of residence valued up to $500,000 ($320,000 in 2007-08, $350,000 from 1 July to 31 August 2008).
First home vacant land concession
Since 1 January 2007, a first home concession has been available for the purchase of certain vacant land up to the value of $300,000, with a full concession available on certain vacant land up to the value of $150,000.
Insurance duty
The benchmark tax base is assumed to be all premiums for general insurance policies (except for life insurance). The benchmark tax scale is assumed to be the scale that actually applied in each financial year.
The rate of duty applicable to most types of general insurance is 7.5%. Concessional rates apply to some other general insurance types (5% for motor vehicle insurance other than compulsory third party (CTP), workers’ compensation and professional indemnity insurance and 10c on a premium for CTP insurance). Data limitations mean that these insurance types are categorised into non-life insurance cover and WorkCover. An exemption from duty is also provided for private health insurance.
Duty on mortgages – home concessions and first home concessions
The benchmark tax base is assumed to be all mortgages and loans taken out in Queensland. The benchmark tax scale is assumed to be the scale that actually applied in each financial year.
A concession from duty is allowed where a home mortgage secures an advance attributable to the purchase or construction of the borrower’s home.
The data required to estimate the revenue foregone is not available. Mortgage duty was abolished from 1 July 2008.
Community Ambulance Cover
Concession to pensioners and seniors
Pensioners and senior card holders are exempt from paying the Community Ambulance Cover charge levied quarterly on electricity accounts.
| | | | |
204 | | Budget Strategy and Outlook 2009-10 | | |
Gambling taxes
Gaming machine tax concessions for licensed clubs
The benchmark tax base is assumed to be all gaming machines operated by licensed clubs and hotels in Queensland. The benchmark tax rate is assumed to be the highest marginal tax rate (as is applied to hotels) that actually applied in each financial year.
A concessional graduated tax rate scale applies to gaming machines operated by licensed clubs. The tax rate is calculated on the gaming machine monthly metered win and the top tax rate is only applied to the portion of gaming machine revenue where the monthly metered win exceeds $1.4 million for any licensed club.
Casino tax concessions
The benchmark tax base is assumed to be all casinos operating in Queensland. The benchmark tax rate is assumed to be the highest tax rate that is actually applied in each financial year.
A tax rate of 20% of gross revenue applies for standard transactions in the Brisbane and Gold Coast casinos. A concessional tax rate of 10% applies for gross revenue from standard transactions in the Cairns and Townsville casinos. From 1 July 2009, the tax rate applicable to gaming machines in casinos will increase to 30% of gross revenue in Brisbane and Gold Coast casinos and 20% in the Cairns and Townsville casinos.
In addition concessional rates also apply for revenue from high rollers in all casinos. High roller revenue is taxed at 10% in the Brisbane and Gold Coast casinos and, prior to 2009-10, 8% for the Cairns and Townsville Casinos. From 1 July 2009, high roller revenue at Cairns and Townsville casinos will be taxed at 10%. A GST credit is provided to casinos that approximates a reduction in the above tax rates of 9.09%.
| | | | |
| | | Budget Strategy and Outlook 2009-10 | | 205 |
APPENDIX B – CONCESSIONS STATEMENT
INTRODUCTION
The Government provides concessions in the form of discounts, rebates and subsidies to improve access to and the affordability of a range of services for individuals or families based on eligibility criteria relating to factors such as age, income and special needs or disadvantage.
This statement serves to highlight the cost and nature of concessions covering both concessions which are reflected as outlays in the Budget (for example, direct subsidy payments) and revenue foregone through fees and charges which are set at a rate lower than that applying to the wider community.
Varying methods have been used to estimate the cost of concessions depending on the nature of the concession, including:
| • | | direct Budget outlay cost (for example, direct subsidy or rebate payments) |
| • | | revenue foregone (for example, concessional fees and charges) |
| • | | cost of goods and services provided. |
Table B.1 sets out the cost of concessions by agency. The total value of concessions is estimated at $1.13 billion in 2009-10.
| | | | |
206 | | Budget Strategy and Outlook 2009-10 | | |
Table B.1
Concessions by agency1
| | | | |
Agency | | 2008-09
Est.Act.
$ million | | 2009-10
Estimate
$ million |
Department of Communities | | | | |
Government-managed housing rental rebate2 | | 315.2 | | 354.6 |
Electricity Rebate Scheme | | 77.0 | | 92.2 |
Electricity Life Support Scheme | | 1.0 | | 1.3 |
Pensioner Rate Subsidy Scheme | | 42.2 | | 43.1 |
Rail Concession Scheme | | 35.9 | | 36.0 |
Reticulated Natural Gas Rebate Scheme | | 4.1 | | 2.3 |
Home Energy Emergency Assistance Scheme | | 0.3 | | 2.7 |
SEQ Pensioner Water Subsidy Scheme | | 5.9 | | 11.3 |
National Reciprocal Transport Scheme | | 2.5 | | 3.8 |
Active Recreation Centres - concessional usage rates | | 0.2 | | 0.2 |
| | |
Department of Community Safety | | | | |
Urban Fire Levy Concession | | 5.6 | | 6.1 |
| | |
Department of Education and Training | | | | |
Living Away from Home Allowances Scheme | | 6.5 | | 6.5 |
School transport assistance for students with disabilities | | 32.2 | | 32.2 |
Non-State School Transport Assistance Scheme | | 4.5 | | 4.6 |
TAFE concessions | | 14.1 | | 15.8 |
| | |
Department of Employment, Economic Development and Innovation | | | | |
Drought Rate Rebate Scheme3 | | 0.8 | | — |
| | |
Department of Environment and Resource Management | | | | |
Environmental licence fee waiver4 | | 0.1 | | — |
Entry and tour fee concessions | | 0.2 | | 0.1 |
Additional Irrigators Fixed Water Charges Rebate Scheme | | 0.5 | | 0.6 |
| | |
Queensland Health | | | | |
Spectacle Supply Scheme | | 6.7 | | 7.7 |
Medical Aids Subsidy Scheme | | 27.7 | | 31.7 |
Patient Travel Subsidy Scheme | | 37.8 | | 37.7 |
Oral Health Scheme | | 103.1 | | 107.3 |
| | |
Department of Justice and Attorney-General | | | | |
Public Trustee of Queensland rebates of fees | | 19.6 | | 21.2 |
| | |
Department of the Premier and Cabinet | | | | |
Venue hire and lease discount - Judith Wright Centre of Contemporary Art | | 0.4 | | 0.4 |
Concessional entry fees - Queensland Museum | | 0.4 | | 0.4 |
Concessional entry fees - Queensland Art Gallery | | 0.4 | | 0.4 |
Venue hire discounts - Queensland Performing Arts Trust | | 0.3 | | 0.4 |
Venue hire discounts - South Bank Corporation | | 0.2 | | 0.2 |
| | | | |
| | | Budget Strategy and Outlook 2009-10 | | 207 |
Table B.1 (continued)
Concessions by agency1
| | | | |
Agency | | 2008-09
Est.Act.
$ million | | 2009-10
Estimate
$ million |
Department of Transport and Main Roads | | | | |
Light and heavy vehicle registration concession | | 82.7 | | 85.4 |
Recreational ship registration concession | | 0.9 | | 0.9 |
School Transport Assistance Scheme | | 130.0 | | 134.6 |
Translink Transit Authority transport concessions (SEQ) | | 56.6 | | 60.0 |
Other transport concessions incl. taxi subsidies | | 26.2 | | 27.9 |
| | |
Total | | 1,041.8 | | 1,129.6 |
Notes:
| 1. | Numbers may not add due to rounding. |
| 2. | Increases in markets rents have resulted in an increased estimated level of rental rebate for 2009 10. |
| 3. | This scheme concluded on 30 June 2008 with final payments made during 2008 09. |
| 4. | Due to the introduction of new environmental protection regulation, this concession ceased on 1 January 2009. |
Department of Communities
The Government-managed housing rental rebate targets low income families and individuals and represents the difference between the rents that would be payable in the private market and rent that is charged based on the household’s income. The concession is expected to be higher in 2009-10 than in 2008-09 due to an expected escalation in market rents.
The Electricity Rebate Scheme provides a rebate on the cost of domestic electricity supply to the home of eligible holders of a Pensioner Concession Card, a Queensland Seniors Card or a Repatriation Health Card for All Conditions (Gold Card) who receive a War Widow or Special Rate Totally or Permanently Incapacitated (TPI) pension.
The Electricity Life Support Concession Scheme is aimed at assisting seriously ill people who use home-based life support systems such as oxygen concentrators and kidney dialysis machines.
The Pensioner Rate Subsidy Scheme alleviates the impact of local government rates and charges on pensioners, thereby assisting them to continue to live in their own homes.
The Queensland Rail Concessions Scheme assists pensioners, veterans and seniors to reduce the cost of public transport and to maintain an active and healthy lifestyle.
The Reticulated Natural Gas Rebate Scheme provides a rebate off the cost of reticulated natural gas supplied to the home of eligible holders of a Pensioner Concession Card, Queensland Seniors Card or Repatriation Health Card for All Conditions (Gold Card) who receive a War Widow or Special Rate TPI pension.
| | | | |
208 | | Budget Strategy and Outlook 2009-10 | | |
The Home Energy Emergency Assistance Scheme provides one-off emergency assistance to low income households suffering a short term financial crisis and who are unable to pay their current electricity and/or reticulated natural gas account and are at risk of disconnection.
To lessen the impact of increased water prices on pensioners, the Government has established the South East Queensland Pensioner Water Subsidy Scheme. The scheme is being phased in over three years with the increased water prices and provides a subsidy of $40 in 2008-09, $70 in 2009-10 and $100 from 2010-11. The Scheme applies to eligible pensioners in the SEQ Water Grid and is in addition to the Pensioner Rate Subsidy Scheme.
The National Reciprocal Transport Scheme provides visitors from interstate who hold a state or territory Seniors Card with access to public transport concessions in Queensland. The four-year scheme, which commences in 2009, is to be fully funded by the Australian Government (subject to finalisation of specific details).
Concessional rates are offered to school groups for the use of a number of Active Recreation Centres, such as those at Currimundi and Tallebudgera.
Department of Community Safety
Pensioners are eligible for a 20% discount on the Urban Fire Levy payable on prescribed properties of which they are the owner or part-owner.
Department of Education and Training
The Department of Education and Training provides a living away from home allowance to students in Years 1 to 12 in state and non-state schools whose homes are geographically isolated from local schools. The allowances offset the costs associated with boarding away from home to attend school on a daily basis and include tuition and travel costs.
The Department also offers assistance to students with disabilities to access school programs to meet their educational needs. Assistance is in the form of the provision of taxis or specialised contracted minibuses, payment of fares on regular buses or trains, or an allowance for parents who drive their children to school.
The Non-State School Transport Assistance Scheme assists families of students attending non-state schools outside Brisbane whose bus fare is over a weekly threshold amount. The program also assists families of students with disabilities who attend a non-state school.
Concessions on TAFE tuition fees for Government-funded training are offered to a range of concession card holders, students of Aboriginal and Torres Strait Islander descent and students who can demonstrate extreme financial hardship.
| | | | |
| | | Budget Strategy and Outlook 2009-10 | | 209 |
Department of Employment, Economic Development and Innovation
To assist primary producers who have been detrimentally affected by drought leading to financial difficulty, assistance was previously provided in the form of a rebate of local government rates. This scheme concluded on 30 June 2008 with final payments made during 2008-09.
Department of Environment and Resource Management
Previously, a fee waiver was granted on environmental licences on the grounds of financial hardship or if there was a small or insignificant environmental risk. Due to the introduction of new environmental protection regulation, this concession concluded on 1 January 2009.
Concessional entry fees are available for specified protected areas including St Helena Island, David Fleay Wildlife Park and Mon Repos Conservation Park.
The Additional Irrigators Fixed Water Charges Rebate Scheme makes a rebate of up to $10,000 available for irrigators in eligible water supply schemes with an announced water allocation of 20% or less on 1 July 2008. Relevant invoices must be issued for the 1 July 2008 to 30 June 2009 financial year. Irrigators have until 30 September 2009 to lodge applications.
Queensland Health
The Spectacle Supply Scheme assists eligible Queensland residents by providing a comprehensive range of free basic spectacles. Queensland Health administers the scheme through its network of public hospitals and community services.
The Medical Aids Subsidy Scheme provides eligible Queensland residents with permanent and stabilised conditions or disabilities access to subsidies. Aids and equipment are provided primarily to assist people to live at home thus avoiding premature or inappropriate residential care or hospitalisation.
Queensland Health’s Patient Travel Subsidy Scheme provides financial assistance to patients who need to access specialist medical services which are not available within their local area. The Scheme provides a subsidy towards the cost of travel and accommodation for patients and, in some cases, an escort.
The Oral Health Scheme provides free dental care to eligible clients and their dependents who possess a current Health Care Card, Pensioner Concession Card, Queensland Seniors Card or Commonwealth Seniors Card. In rural and remote areas where no private dental practitioner exists, access to dental care for the general public is provided at a concessional rate.
| | | | |
210 | | Budget Strategy and Outlook 2009-10 | | |
Department of Justice and Attorney-General
The Public Trustee offers fee rebates (full or partial) for clients who, because of financial circumstances, cannot pay the full amount of fees that have been levied.
Department of the Premier and Cabinet
Discounts apply to venue rental fees charged to arts and community organisation hirers and rent reductions apply to lease amounts for resident cultural organisation tenants at the Judith Wright Centre of Contemporary Art.
Concessional ticket entry fees apply to a variety of concession card holders, students, children and families for special exhibitions at the Queensland Art Gallery and the Queensland Museum.
Queensland Performing Arts Trust offers discounts on venue rental fees charged to Government funded organisations, primarily Opera Queensland, Queensland Ballet, Queensland Orchestra and Queensland Theatre Company.
Community groups and charities are given discounts on venue rental fees at South Bank, such as the Suncorp Piazza and Cultural Forecourt.
Department of Transport and Main Roads
Motor vehicle and boat registration concessions are provided to holders of the Pensioner Concession Card, Queensland Seniors Card and to those receiving a TPI Ex-serviceperson Pension. The concession is aimed at improving the access to travel of pensioners and seniors.
Other motor vehicle and boat registration concessions are provided to:
| | • | | primary producers to ensure the costs of basic necessities are kept to a minimum |
| | • | | local governments to ensure lower costs of essential services |
| | • | | charitable and community service organisations who provide assistance in the form of food, clothing and shelter to persons in distress |
| | • | | people living in remote areas without access to the wider road network |
| | • | | car club members with vehicles over 30 years of age who are preserving Queensland’s motoring history |
| | • | | specific purpose vehicles that are used off road but need access to the road network to move between sites and to certain overseas consular positions. |
| | | | |
| | | Budget Strategy and Outlook 2009-10 | | 211 |
The School Transport Assistance Scheme is a program for students whose access to school is disadvantaged by distance or who are from defined low income groups. Assistance is provided towards the cost of travel on bus, rail and/or ferry with allowances for private vehicle transport.
Transport concessions are provided by the Government in a variety of forms and across a range of activities to ensure access and mobility for Queenslanders who are transport disadvantaged. The Translink Transit Authority administers transport concessions in South-East Queensland, with concessions in the remainder of the State, and the Taxi Subsidy Scheme, provided by the Department of Transport and Main Roads. Eligible categories to receive a concession include Pensioner Concession Card holders, Seniors Card holders, children and secondary and tertiary students. The provision of these concessions is in the form of a subsidy payment to transport operators.
| | | | |
212 | | Budget Strategy and Outlook 2009-10 | | |
This page has been left blank.
This page has been left blank.
By authority: S. C. Albury, Acting Government Printer, Queensland 2009

2009–10 State Budget Papers
1. Budget Speech
2. Budget Strategy and Outlook
3. Capital Statement
4. Budget Measures
5. Service Delivery Statements
Budget Highlights
The suite of Budget Papers is similar to that published in 2008–09.
In March 2009, machinery-of-Government changes saw the creation of 13 departments reporting to 18 Ministers.
These new arrangements have required minor changes to how information is presented in some Budget Papers. In particular, Budget Paper No. 5—Service Delivery Statements is now presented on a departmental rather than a Ministerial basis.
The 2009–10 Budget Papers provide continuity of information between the previous departmental structure and the new arrangements. Future budget papers will present information, including financial statements, only from a whole-of-department point of view.
The Budget Papers are available online at www.budget.qld.gov.au or they can be purchased through The Queensland Government Bookshop, individually or as a set. Please phone (07) 3883 8700 (1800 801 123 for callers outside of Brisbane).
© Crown copyright
All rights reserved
Queensland Government 2009
Excerpts from this publication may be reproduced, with appropriate
acknowledgement, as permitted under the Copyright Act.
Capital Statement
Budget Paper No.3
ISSN 1445-4890 (Print)
ISSN 1445-4904 (Online)

STATE BUDGET
2009-10
CAPITAL STATEMENT
Budget Paper No. 3
TABLE OF CONTENTS
| | | | |
1. | | Overview | | |
| | |
| | Introduction | | 2 |
| | Employment Generation | | 5 |
| | Capital Grants to Local Government Authorities | | 5 |
| | Funding the State Capital Program | | 6 |
| | |
2. | | State Capital Program - Planning and Priorities | | |
| | |
| | Introduction | | 11 |
| | Capital Planning and Priorities | | 11 |
| | 2009-10 Highlights | | 12 |
| | Queensland Future Growth Fund | | 20 |
| | |
3. | | Capital Outlays by Entity | | |
| | |
| | Communities | | 23 |
| | Community Safety | | 37 |
| | Education and Training | | 43 |
| | Electoral Commission of Queensland | | 55 |
| | Employment, Economic Development and Innovation | | 56 |
| | Environment and Resource Management | | 72 |
| | Health | | 81 |
| | Infrastructure and Planning | | 89 |
| | Justice and Attorney General | | 95 |
| | Legislative Assembly of Queensland | | 99 |
| | Office of the Governor | | 100 |
| | Office of the Ombudsman | | 101 |
| | Police | | 102 |
| | Premier and Cabinet | | 105 |
| | Public Works | | 109 |
| | Queensland Audit Office | | 115 |
| | Transport and main Roads | | 116 |
| | Treasury | | 139 |
| | | | | | |
| Appendix A – Entities included in Capital Outlays 2009-10 | | 140 |
| |
| Appendix B – Key Concepts and Coverage | | 143 |
1. OVERVIEW
KEY POINTS
| • | | Capital outlays in 2009-10 are estimated to be $18.2 billion, an increase of 12.8% or $2.068 billion on estimated actual 2008-09 capital outlays. |
| • | | Capital outlays will support over 127,000 full-time jobs in Queensland. |
| • | | The Government’s ongoing commitment to regional and rural Queensland is reflected in this Budget. Over 57% of expenditure will occur outside the Brisbane Statistical Division, including $221.8 million on the redevelopment of existing hospitals at Cairns, Mackay, Mount Isa, Townsville and Rockhampton, $199 million in the expansion and upgrade of the Lotus Glen Correctional Centre in Far North Queensland. |
| • | | In 2009-10 there will be capital outlays of $7.307 billion for transport and main roads including $244.7 million to continue construction of the new rail line and duplication of the Centenary Highway between Springfield to Darra, $138.2 million to extend the Eastern Busway from Buranda to Main Avenue, and $259.2 million towards the Gateway Upgrade Project. |
| • | | In partnership with the Australian Government, capital outlays of $1.447 billion for housing and homelessness services including $977.2 million from the National Partnership Agreement, and $1.837 billion for education and training including $1.168 billion from the Australian Government’s Building the Education Revolution program. |
| • | | The capital outlays of the Public Non-financial Corporations sector, including Government-owned corporations, constitute 39% of total outlays in 2009-10, including $3.206 billion in the energy sector. |
| • | | The Government will continue to invest in water infrastructure, with capital outlays of $1.122 billion in 2009-10, including $211.5 million for the Northern Pipeline Interconnector, $171 million for the Wyaralong Dam, and $120 million to complete the raising of the Hinze Dam. |
| | | | |
| | | Capital Statement 2009 10 | | 1 |
INTRODUCTION
This capital statement presents an overview of proposed capital outlays by the Queensland Government in 2009-10, as well as a summary of the Government’s approach to infrastructure provision. Capital outlays in 2009-10 are estimated to be $18.2 billion, net of a capital contingency reserve of $1 billion.
This represents an increase of 12.8% on estimated actual outlays in 2008-09 and reflects the Government’s continuing significant investment in public transport, roads and water infrastructure, increased expenditure on education, health and housing and homelessness services and progress with the South East Queensland Infrastructure Plan and Program (SEQIPP), as well as a number of other new capital investments.
Each year a major part of the Queensland Government’s capital program is undertaken through the Public Non-financial Corporations (PNFC) sector (that is, commercial entities of Government, including Government-owned corporations and other authorities such as the water bodies). For 2009-10, capital outlays of Queensland’s PNFC sector will constitute 39% of total outlays, reflecting major investments in water, electricity, rail and ports infrastructure.
Expenditure in 2009-10 is highest in the Brisbane Statistical Division – the most populated and one of the fastest growing areas of the State – planned at $8.246 billion. However, consistent with the Government’s commitment to building Queensland’s regions, over 57% of capital expenditure is expected to occur outside the Brisbane Statistical Division.
| | | | |
2 | | Capital Statement 2009 10 | | |
Capital outlays by purpose in 2009-10 are shown in Chart 1.1 below. Capital outlays by State Government entity are listed in Table 1.1.
Chart 1.1
Capital Outlays by Purpose, 2009-10
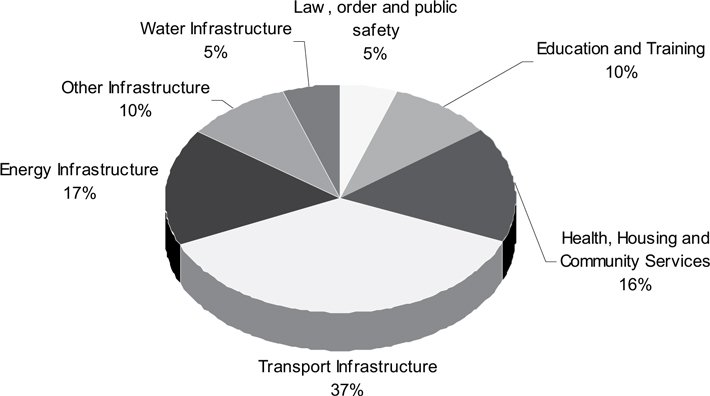
| | | | |
| | | Capital Statement 2009 10 | | 3 |
Table 1.1
Capital Outlays by Entity1,5,6
| | | | |
Entity | | 2008-09
Est. Act.
$’000 | | 2009-10
Budget
$’000 |
Communities | | | | |
Communities | | 197,565 | | 390,568 |
Housing and Homelessness Services | | 512,843 | | 1,447,016 |
Community Safety | | 329,370 | | 561,305 |
Education and Training | | 739,652 | | 1,837,253 |
Employment, Economic Development and Innovation | | | | |
Employment, Economic Development and Innovation | | 207,796 | | 281,681 |
Energy Generation sector | | 477,288 | | 545,432 |
Energy Transmission sector | | 676,158 | | 610,400 |
Energy Distribution sector | | 1,890,753 | | 2,050,336 |
Environment and Resource Management | | | | |
Environment and Resource Management | | 204,457 | | 161,825 |
Queensland Bulk Water Supply Authority | | 227,826 | | 182,644 |
Queensland Bulk Water Transport Authority | | 12,174 | | 21,378 |
Queensland Manufactured Water Authority | | 444,744 | | 229,683 |
Health | | 812,753 | | 1,298,695 |
Infrastructure and Planning2 | | | | |
Infrastructure and Planning | | 550,612 | | 806,220 |
Water Infrastructure Projects | | 731,458 | | 578,493 |
Justice and Attorney General | | 144,152 | | 212,252 |
Legislative Assembly of Queensland | | 3,638 | | 4,135 |
Police | | 257,328 | | 223,458 |
Premier and Cabinet | | 69,232 | | 116,151 |
Public Works | | 386,167 | | 494,866 |
Transport and Main Roads | | | | |
Transport | | 669,806 | | 798,711 |
QR Limited | | 2,133,728 | | 2,087,774 |
Port Authorities | | 793,013 | | 715,877 |
Main Roads | | 3,829,230 | | 3,529,625 |
Treasury | | 28,758 | | 12,260 |
Other Agencies3 | | 1,220 | | 1,547 |
Anticipated Capital Contingency Reserve4 | | -200,000 | | -1,000,000 |
| | | | |
Total Capital Outlays | | 16,131,721 | | 18,199,585 |
| | | | |
| | | | |
4 | | Capital Statement 2009 10 | | |
Table 1.1
Capital Outlays by Entity1,5,6 (Continued)
Notes:
| 1. | Includes associated statutory bodies. |
| 2. | Includes Property Services Group and Airport Link. |
| 3. | Includes the Electoral Commission of Queensland, Office of the Governor, Office of the Ombudsman and Queensland Audit Office. |
| 4. | Contingency recognises that individual agencies may budget to fully expend their capital works allocations, however on a whole of Government basis, there is likely to be under spending, resulting in a carryover of capital allocations. The amount for 2009 10 has been revised upwards to reflect large increases in the capital program and in anticipation of industry capacity constraints in some areas. |
| 5. | Capital works outside of Queensland are not included in the capital program. |
| 6. | Numbers may not add due to rounding. |
EMPLOYMENT GENERATION
The 2009-10 capital program will have a significant effect on employment, supporting over 127,000 full time jobs, either directly or indirectly. Estimated employment generation from budgeted capital expenditure in 2009-10 exceeds the forecast in the 2008-09 Capital Statement. This increased employment is spread across the range of Government services. Employment generating capital does not include expenditure on land purchases, and plant and equipment.
CAPITAL GRANTS TO LOCAL GOVERNMENT AUTHORITIES
As highlighted in Budget Paper 2 – Budget Strategy and Outlook, the Queensland Government provides capital grants and subsidies to local government authorities to assist with the creation or upgrading of a range of essential community infrastructure such as water supply, sewerage works, roads and drainage works.
In 2008-09, approximately 51.8% ($621.5 million) of total Queensland Government grants made to local government authorities were for capital purposes. Capital grants to local governments are expected to account for $774.8 million, or 57.7% of total Queensland Government grants in 2009-10.
Queensland Government capital grants to local government authorities are shown in Chart 1.2 below.
| | | | |
| | | Capital Statement 2009 10 | | 5 |
Chart 1.2
Queensland Government Capital Grants to
Local Government Authorities, by Purpose, 2009-10
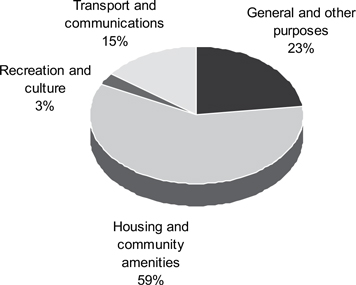
FUNDING THE STATE CAPITAL PROGRAM
The State’s capital program is implemented across both the General Government sector and the PNFC sector.
While the capital program undertaken across the PNFC sector contributes significantly towards meeting the Government’s priorities, the process through which this capital program is developed and funded is different from the General Government sector.
Entities in the PNFC sector operate as commercial business entities, generally within competitive markets, and as such progress their capital programs on the basis of needs identified within the market sectors they service. There are a number of ways in which the capital expenditure program for the PNFC sector can be funded. Their options include using cash flow from their business, borrowings, and, in certain situations, requesting a dividend reinvestment or equity injection from shareholding Ministers.
| | | | |
6 | | Capital Statement 2009 10 | | |
Table 1.2 outlines the major sources of funding for the State capital program.
In 2009-10, net borrowings and advances of $13.272 billion are estimated in support of the capital program, of which $7.937 billion is budgeted for the General Government sector, including $307 million to fund equity injections to PNFC entities. The expected borrowing and advances requirement of the PNFC sector 2009-10 is $5.335 billion. The major borrowers in this sector are Queensland Rail, the water bodies including Sunwater, and Queensland Motorways Limited.
In total, borrowings and advances are projected to fund around 77.1% of new infrastructure in 2009-10.
After allowing for the reinvestment of earnings on investments, free cash flow of $2.606 billion is expected to be available for investment in capital in 2009-10.
The funding allocations identified in the 2009-10 Capital Statement are presented in real dollars, that is project costs incorporate an allowance for cost escalation.
Table 1.2
Sources of Funding for Capital1
| | | | |
| | | 2008-09
Est. Act.
$ million | | 2009-10
Budget
$ million |
Total Capital Expenditure | | 16,132 | | 18,200 |
Less Capital Grants (Funded from Operating Revenue) | | 828 | | 1,201 |
Add Council water asset purchases | | 1,647 | | |
Net State Capital Funding Task | | 16,951 | | 16,999 |
Funding Sources | | | | |
Cash Flows from Operating Activities | | 4,108 | | 3,977 |
Less Reinvestments2 | | 411 | | 1,372 |
Equals Net Cash Flow for Capital Acquisitions | | 3,697 | | 2,606 |
| | |
Asset Sales | | 1,533 | | 473 |
Borrowings and Advances | | 11,198 | | 13,272 |
Cash Balances and Other Financing Sources3 | | 524 | | 648 |
| | |
Total Funding Sources | | 16,951 | | 16,999 |
Note:
| 1. | Numbers may not add due to rounding. |
| 2. | Primarily reflects reinvestment of General Government investment earnings relating to accruing entitlements. |
| 3. | Includes airport sales proceeds used to fund regional hospital projects. |
| | | | |
| | | Capital Statement 2009 10 | | 7 |
Table 1.3 outlines capital outlays in 2009-10 by entity for each statistical division.
Table 1.3
Total Capital Outlays by Entity within Statistical Division for 2009-101
| | | | | | | | | | | | | | |
Entity2 | | 05
Brisbane
$’000 | | 07
G/Coast
$’000 | | 09
S/Coast
$’000 | | 12
W/Moreton
$’000 | | 15
W/Bay
$’000 | | 20
D/Downs
$’000 | | 25
S/West
$’000 |
Communities | | 715,479 | | 208,335 | | 95,450 | | 23,046 | | 95,345 | | 77,552 | | 6,937 |
Community Safety | | 119,333 | | 20,041 | | 8,081 | | 165,508 | | 6,029 | | 6,607 | | 503 |
Education and Training | | 918,255 | | 320,282 | | 102,731 | | 22,947 | | 54,941 | | 40,897 | | 4,898 |
Employment, Economic Development and Innovation | | 1,226,248 | | 199,335 | | 128,107 | | 91,449 | | 354,743 | | 245,795 | | 103,002 |
Environment and Resource Management | | 217,003 | | 233,907 | | 6,903 | | 2,307 | | 9,156 | | 16,528 | | 3,383 |
Health | | 389,392 | | 316,004 | | 115,354 | | 9,070 | | 64,826 | | 28,715 | | 3,023 |
Infrastructure and Planning | | 278,511 | | 27,800 | | 290,414 | | 232,616 | | 74,496 | | 135,662 | | 22,127 |
Justice and Attorney General | | 202,510 | | 1,005 | | 570 | | 142 | | 522 | | 4,535 | | 297 |
Police | | 160,158 | | 12,667 | | 5,122 | | 955 | | 11,435 | | 2,919 | | 1,829 |
Premier and Cabinet | | 109,074 | | 0 | | 0 | | 215 | | 0 | | 6,628 | | 0 |
Public Works | | 285,028 | | 23,769 | | 66,422 | | 3,255 | | 11,937 | | 9,947 | | 1,085 |
Transport and Main Roads | | 3,607,078 | | 546,581 | | 144,379 | | 97,313 | | 579,524 | | 99,893 | | 31,915 |
Legislative Assembly of Queensland | | 4,135 | | 0 | | 0 | | 0 | | 0 | | 0 | | 0 |
Treasury | | 12,260 | | 0 | | 0 | | 0 | | 0 | | 0 | | 0 |
Other Agencies3 | | 1,547 | | 0 | | 0 | | 0 | | 0 | | 0 | | 0 |
Anticipated Capital Contingency Reserve | | | | | | | | | | | | | | |
| | | | | | | | | | | | | | |
Funds Allocated | | 8,246,011 | | 1,909,726 | | 963,533 | | 648,823 | | 1,262,954 | | 675,678 | | 178,999 |
| | | | |
8 | | Capital Statement 2009 10 | | |
Table 1.3
Total Capital Outlays by Entity within Statistical Division for 2009-101
| | | | | | | | | | | | | | |
Entity2 | | 30
Fitzroy
$’000 | | 35
C/West
$’000 | | 40
Mackay
$’000 | | 45
Northern
$’000 | | 50
F/North
$’000 | | 55
N/West
$’000 | | Totals
$’000 |
Communities | | 82,140 | | 7,497 | | 66,255 | | 175,919 | | 192,662 | | 90,965 | | 1,837,584 |
Community Safety | | 4,494 | | 251 | | 4,852 | | 18,100 | | 206,775 | | 732 | | 561,305 |
Education and Training | | 47,658 | | 4,265 | | 34,478 | | 47,697 | | 216,340 | | 21,864 | | 1,837,253 |
Employment, Economic Development and Innovation | | 301,358 | | 73,152 | | 227,853 | | 338,209 | | 159,988 | | 38,612 | | 3,487,849 |
Environment and Resource Management | | 18,322 | | 1,806 | | 40,381 | | 3,070 | | 34,521 | | 8,243 | | 595,530 |
Health | | 103,306 | | 1,512 | | 81,630 | | 70,093 | | 83,664 | | 32,106 | | 1,298,695 |
Infrastructure and Planning | | 59,691 | | 464 | | 45,356 | | 94,672 | | 119,431 | | 3,472 | | 1,384,713 |
Justice and Attorney General | | 388 | | 24 | | 809 | | 404 | | 983 | | 63 | | 212,252 |
Legislative Assembly of Queensland | | 0 | | 0 | | 0 | | 0 | | 0 | | 0 | | 4,135 |
Police | | 2,601 | | 159 | | 2,070 | | 2,707 | | 20,411 | | 425 | | 223,458 |
Premier and Cabinet | | 0 | | 0 | | 0 | | 234 | | 0 | | 0 | | 116,151 |
Public Works | | 8,862 | | 543 | | 7,215 | | 9,224 | | 66,132 | | 1,447 | | 494,866 |
Transport and Main Roads | | 563,380 | | 39,458 | | 972,418 | | 223,909 | | 184,307 | | 41,832 | | 7,131,987 |
Treasury | | 0 | | 0 | | 0 | | 0 | | 0 | | 0 | | 12,260 |
Other Agencies3 | | 0 | | 0 | | 0 | | 0 | | 0 | | 0 | | 1,547 |
Anticipated Capital Contingency Reserve | | | | | | | | | | | | | | -1,000,000 |
| | | | | | | | | | | | | | |
Funds Allocated | | 1,192,200 | | 129,131 | | 1,483,317 | | 984,238 | | 1,285,214 | | 239,761 | | 18,199,585 |
Notes
| 1. | Numbers may not add due to rounding. |
| 2. | Includes associated statutory bodies. Capital works outside of Queensland are not included in the 2009-10 capital program. |
| 3. | Includes the Electoral Commission of Queensland, Office of the Governor, Office of the Ombudsman and Queensland Audit Office. |
| | | | |
| | | Capital Statement 2009 10 | | 9 |
The Queensland statistical divisions are shown in Chart 1.3 below.
Chart 1.3
Queensland Statistical Divisions, 2008-09
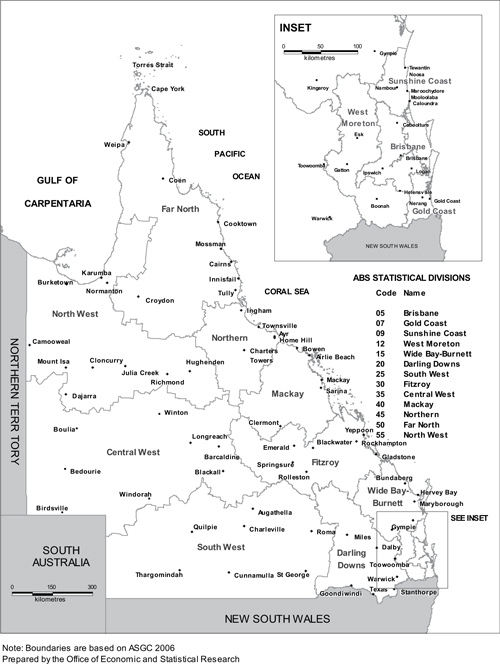
| | | | |
10 | | Capital Statement 2009 10 | | |
| 2. | STATE CAPITAL PROGRAM – PLANNING AND PRIORITIES |
INTRODUCTION
The Queensland Government is committed to creating the infrastructure necessary to support the economic and social development of the State. It does so:
| • | | by providing infrastructure in support of core service delivery priorities 3 General Government sector investment |
| • | | through investments made by commercial entities of Government, including Government-owned corporations (GOCs) 3 Public Non-financial Corporations (PNFC) sector investment |
| • | | where appropriate, by fostering private sector investment |
This chapter outlines key capital planning and expenditure priorities for the 2009-10 Budget.
CAPITAL PLANNING AND PRIORITIES
Capital investment decisions are primarily driven by the policy priorities of Government and factors such as demographic changes and planning requirements which impact upon service delivery requirements.
The Government has a range of mechanisms available to deliver the capital needed to support its priorities. These mechanisms include the Government directly funding and constructing infrastructure and providing capital grants to local government, the private sector and profit and not-for-profit organisations to deliver capital projects and provide services on behalf of the Government. The Government also considers opportunities for private sector involvement in public infrastructure delivery either through joint ventures or stand alone projects.
Investments made by the PNFC sector also constitute a major part of the State capital program. Entities in the PNFC sector operate on a commercial basis and, as such, their capital programs reflect needs identified within the market sector serviced by these entities.
| | | | |
| | | Capital Statement 2009 10 | | 11 |
South East Queensland Infrastructure Plan and Program
The South East Queensland Infrastructure Plan and Program 2009-2026 (SEQIPP) outlines the Government’s infrastructure priorities to support the SEQ Regional Plan to 2026 and represents a long term commitment to capital works in South East Queensland.
With a strong forward expenditure, SEQIPP is still the largest infrastructure program in the country with 380 identifiable projects, including 32 new projects.
Since the commencement of SEQIPP in 2005, 89 projects are complete, another 171 projects are underway, $16.4 billion has been invested and 130,000 jobs have been supported.
In the next year (2009-10), expenditure across all funding sources is forecast to increase by around $5.8 billion to reach around $22.2 billion, supporting 45,000 jobs.
2009-10 HIGHLIGHTS
The Government is committed to continuing to develop Queensland’s infrastructure base. Highlights of capital spending in 2009-10 are outlined in this section.
Water
The Government moved to address the long term demands on water supplies as a result of a growing population and the recent drought. While the worst drought on record in South East Queensland (SEQ) has passed, the investment in a range of major water infrastructure projects will continue to ensure the long term security of water supply in the region.
These projects will increase the supply of water and improve use of existing water resources to ensure a safe and sustainable water supply for the region well into the future.
The Government is also progressing a number of key regional water projects.
In 2009-10 the Government will invest over $1.122 billion in water infrastructure across the State.
South East Queensland
The Government is constructing a water grid to connect water storages throughout SEQ, allowing water to be moved around the region to meet demand in the area of highest need.
| | | | |
12 | | Capital Statement 2009 10 | | |
In 2009-10, funding of $211.5 million is allocated for construction of the Northern Pipeline Interconnector Stage 2. This pipeline will be approximately 48 km and extend from Eudlo to Cooroy on the Sunshine Coast and is due for completion in 2011-12. Additionally, an amount of $121 million is provided to complete the 38 km Toowoomba pipeline which is expected to be operational by January 2010. This pipeline links Wivenhoe Dam to Toowoomba’s Cressbrook Dam and is planned to provide water security to the Toowoomba region with the capacity to move 14,200 megalitres a year.
The $1.592 billion Traveston Crossing Dam is continuing to progress through the environmental approvals process. In 2009-10, funding of $75 million is allocated for environmental measures and community projects, such as the establishment of a Freshwater Species Conservation Centre, habitat and vegetation rehabilitation and relevant catchment management initiatives. When complete, the Traveston Crossing Dam will provide an additional 70,000 megalitres per annum of water for South East Queensland.
The $348 million Wyaralong Dam project is now under construction, with site preparation activities well advanced. In 2009-10, $171 million will be spent on construction activities including the commencement of major dam construction works and the upgrade to the Beaudesert to Boonah road. The Wyaralong Dam will provide an additional 26,000 megalitres per annum of water when operated with the recently completed Cedar Grove and the Bromelton Offstream Storage.
The Queensland Bulk Water Supply Authority is allocating $120 million in 2009-10 for the Hinze Dam Stage 3 project. This project is due for completion in December 2010 and will raise the Hinze Dam wall 15 metres, giving the dam a total capacity of nearly 310,000 megalitres, and providing an extra 5,840 megalitres a year into the South East Queensland Water Grid. The budget also includes $13.8 million for Stage 2 of the SEQ Fluoridation program.
State-wide
Notwithstanding widespread heavy rainfall over the past year across most of Queensland, water security across the state remains a critical issue. The acquisition of land for future water infrastructure projects will continue with $42.0 million allocated in 2009-10 for strategic land purchases.
SunWater will progress feasibility investigations and prepare business cases for a number of key regional water projects identified in the Program of Works, Statewide Water Grid Regional Water Infrastructure Projects. This
| | | | |
| | | Capital Statement 2009 10 | | 13 |
work will include expenditure of $5.4 million on feasibility investigations and the preparation of business cases for the Nathan Dam, Connors River Dam, Fitzroy River Weir and Water for Bowen projects.
Transport and Main Roads
In 2009-10, capital funding of $7.307 billion is provided for roads and other transport infrastructure including the Department of Transport and Main Roads, Airport Link, QR Limited, the ports corporations, Queensland Motorways Limited, RoadTek and the TransLink Transit Authority.
Roads
In 2009-10, capital funding of $3.53 billion is provided for roads projects. Highlights of the 2009-10 roads capital program include:
| • | | $650 million is provided towards the federally-funded Ipswich Motorway upgrade between Dinmore and Goodna, at a total estimated cost of $1.95 billion |
| • | | $259.2 million to construct a second Gateway Bridge crossing and to increase capacity on the Gateway Motorway, between Mt-Gravatt – Capalaba Road and Nudgee Road, at a total estimated cost of $1.883 billion |
| • | | $236 million is provided to commence the upgrading of the Bruce Highway between Cooroy and Curra (Section B—Sankeys Road to Traveston Road), at a total estimated cost of $613 million ($125 million -State, $488 million Australian Government) |
| • | | $130 million is provided to continue the federally-funded Ipswich Motorway upgrade between Wacol and Darra, at a total estimated cost of $700 million |
| • | | $119.7 million is provided towards the Centenary Highway duplication between Springfield and Darra, to meet the existing Logan Motorway Interchange at Carole Park, in conjunction with the Darra to Springfield rail extension, at a total estimated cost of $414.6 million |
| • | | $93.5 million is provided to upgrade the Pacific Motorway between Springwood South and Daisy Hill, at a total estimated cost of $421.6 million ($211.6 million—State, $210 million—Australian Government) |
| | | | |
14 | | Capital Statement 2009 10 | | |
| • | | $47.3 million is provided to continue the construction of the jointly-funded Townsville Port Access Road, at a total estimated cost of $190 million ($95 million—State, $95 million—Australian Government). |
Rail and ports
Highlights of the 2009-10 rail and ports capital program include:
| • | | coal network—$862 million is provided for coal network tracks and new and upgraded locomotives and wagons. All works are to support the haulage of coal in central Queensland. Projects include continuation of the Jilalan Yard Rail Upgrade, which will allow for additional coal haulage capacity on the network. A further $148.5 million is provided for new and upgraded coal rollingstock, including additional electric and diesel locomotives and coal wagons, to support the increased haulage of coal in Central Queensland |
| • | | Citytrain track infrastructure upgrades—$515 million to upgrade infrastructure and rollingstock on the Citytrain network as part of SEQIPP |
| • | | Cairns Port Limited—$16.5 million towards new and continuing seaport and cityport developments |
| • | | Abbot Point coal terminal—$17 million will be spent to finalize the X25 expansion of the Abbot Point Coal Terminal to increase the capacity of the terminal to 25 mt per annum. While a further $287.9 million is provided for the Abbot Point X50 Expansion, which will increase capacity to 50 million tonnes (mt) per annum. |
| • | | Gladstone port—$38.2 million of ongoing works at the RG Tanna Coal Terminal, $27.4 million for general works and $7 million for modification of the shiploading facilities at Auckland Point |
| • | | Port of Brisbane—$26 million on construction of berth and wharf 11 and 12 at Fisherman Islands to accommodate trade throughput and $10 million for the continuation of the Hamilton Site Redevelopment Program. To ensure all weather access to the Port of Bundaberg, a further $4.7 million will be spent on the construction of a bridge across the Burnett River |
| • | | Mackay port—$14.1 million for the development and continued upgrading of port infrastructure. |
| | | | |
| | | Capital Statement 2009 10 | | 15 |
Other Transport
The Department of Transport and Main Roads’ capital expenditure program in 2009-10, for other than roads-related transport, totals $751.4 million and predominantly comprises investment in public transport infrastructure and systems.
In the 2009-10 Budget, the Government continues to progress the implementation of SEQIPP. Some major projects in South East Queensland include:
| • | | $171.8 million towards construction of the Northern Busway between Enoggera Creek and Kedron |
| • | | $138.2 million for the construction of the Eastern Busway connection between Buranda and Main Avenue at Coorparoo |
| • | | $135.0 million towards the jointly-funded Gold Coast Rapid Transit System project which involves delivery of a light rail project from Parkwood to Broadbeach ($463.7 million – State, $365 million – Australian Government, and $120 million – Gold Coast City Council) |
| • | | $37.8 million towards construction of the Eastern Busway: Princess Alexandra Hospital to Buranda. Construction will include an elevated busway station within the Princess Alexandra Hospital and will be a key link in the regional busway network. |
The Translink Transit Authority capital expenditure program for 2009-10 totals $47.4 million, including $33 million towards the Translink Station Upgrade Program, to make passenger waiting environments at stations safe, comfortable and easy to use.
Energy
Electricity usage in Queensland has grown strongly during the past ten years, and this trend is expected to continue. Queensland’s annual electricity consumption over the last three years averaged approximately 47,837GWh and is expected to grow at an annual average of 3.2% over the next three years in accordance with the medium economic growth (50% Probability of Exceedance) projection in the 2008 Statement of Opportunities published by the National Electricity Market Management Company.
| | | | |
16 | | Capital Statement 2009 10 | | |
This represents a projected slight fall in growth from the 2007 Statement of Opportunities which was anticipating an annual average growth rate of 3.9% over the next three years.
This growth is driven to a large extent by an increase in population, economic activity and use of lifestyle appliances such as air-conditioners. The growth in energy consumption has been more significant in SEQ, due to the concentration of population and industry.
Investment in electricity infrastructure continues to be driven by peak demand. While demand management strategies are being explored and initiatives funded in the Budget as medium to long term responses, significant capital investment in the electricity sector is required to ensure the sector continues to meet demand. No new generation investment by State-owned generators is planned for 2009-10. While existing capacity will meet reliability and demand requirements in the short term, continued investment by the private sector will ensure that reliability and demand requirements are met into the future.
An additional 1,054 megawatts of capacity will be added to the State’s electricity supply over 2009-10 by the private sector as gas-fired plants currently being developed at Mt Stuart, Darling Downs, Condamine and Yarwun are progressively commissioned.
Altogether, a total of $3.206 billion has been budgeted to be spent in 2009-10 by the Government-owned electricity corporations on plant and network overhauls, maintenance and augmentation. This will ensure that the State’s electricity assets and infrastructure continue to maintain secure and reliable supply and are well positioned to meet forecast growth in demand.
Highlights of the 2009-10 electricity capital program include:
| • | | Generation sector: the primary focus will be capital works to ensure ongoing generation plant reliability and efficiency. CS Energy will spend $56.8 million on improvements to the Callide power station, including overhauls and major refurbishment work on the B station mid-life refit, $39.6 million and $54 million respectively on improvements to the Swanbank and Kogan power stations. Stanwell will spend $61.6 million on comprehensive maintenance works and plant upgrades of Stanwell, Barron Gorge and Kareeya power stations. |
Similarly, Tarong Energy will spend $123.2 million on maintenance and improvements at the Wivenhoe, Tarong and Tarong North power stations.
| | | | |
| | | Capital Statement 2009 10 | | 17 |
| • | | Transmission sector: Powerlink will undertake major transmission augmentation and new capital works of $610.4 million to reinforce electricity supply and maintain a secure and reliable transmission network across the state. |
| • | | Distribution sector: ENERGEX and Ergon energy have budgeted network and non-system capital expenditure of $1.044 billion and $1.007 billion respectively for the augmentation and maintenance of the distribution network and to improve the security and reliability of electricity supply in their respective regions. |
Health
In 2009-10, the Government continues its significant investment in health infrastructure with a $1.296 billion capital program. The focus for 2009-10 includes investment in new hospitals, hospital redevelopments and expansions (including emergency department upgrades), development of Community Health Centre infrastructure and investment in information and health technology.
The program includes:
| • | | further planning and development of three new tertiary hospitals in SEQ at the Gold Coast, Sunshine Coast and the Queensland Children’s Hospital |
| • | | with respect to the Sunshine Coast University Hospital (SCUH), the Government has decided to reorder the construction and proceed with the earlier construction of a private hospital comprising approximately 110 public beds on the SCUH site by 2013-14. Further details see page 82 |
| • | | redevelopments of existing hospitals at Cairns, Mackay, Mount Isa, Townsville and Rockhampton |
| • | | the Faster Emergency Care in our Hospitals initiative, which will deliver upgrades to some of our busiest emergency departments, including a dedicated paediatric emergency department at the Prince Charles Hospital. This initiative also includes expanded rehabilitation facilities. |
In addition, the Government will invest $80 million over five years (2009-10 to 2013-14) for an Academic and Research Centre to complement the new Queensland Children’s Hospital.
| | | | |
18 | | Capital Statement 2009 10 | | |
Housing
In 2009-10, the record capital program of $1.447 billion will deliver additional social housing throughout Queensland as well as improve the amenity of existing dwellings to ensure they remain available for rent. This capital investment will assist in meeting the growing need for affordable and appropriate housing for clients, improve Queensland’s response to people who are homeless or at significant risk of homelessness and improve housing condition and availability on Indigenous communities.
This major injection of funds includes $140 million from the Queensland Future Growth Fund and $977.2 million from the National Partnership Agreements with the Australian Government comprising Nation Building and Jobs Plan, Social Housing, Homelessness and Remote Indigenous Housing.
In 2009-10 it is expected the value of the social housing portfolio will reach almost $15 billion.
Education and Training
The education capital works budget in 2009-10 will total a record $1.843 billion (including an expenses component of $375.9 million), while the training budget will total $136.6 million ($15.9 million expensed). This infrastructure investment will also generate further employment opportunities.
A total of $149 million will be spent on facilities to cater for population growth areas across the state. This funding will provide a replacement school for Amberley State School, further staged work at five existing schools, new land acquisitions and additional classrooms at existing schools. During the 2009-10 financial year, schools at Peregian Springs and Thornlands South will be constructed which represent the first tranche of seven new schools to be delivered under the South-East Queensland Schools Public Private Partnership.
The Government’s State Schools of Tomorrow program will also continue its roll out with the allocation of $301 million to deliver new and upgraded facilities in schools.
The Government’s commitment to invest over $300 million to establish 240 new or additional kindergarten services by 2014 will provide $15.4 million in 2009-10 for the construction of six additional services on state sites for 2010 and a further nine on state sites for 2011. $17.2 million will also be allocated to the construction of Early Childhood Education Centres, Early Years Centres and Indigenous Child and Family Centres.
| | | | |
| | | Capital Statement 2009 10 | | 19 |
Almost two thirds of the education capital works budget will be used to build or upgrade facilities in Queensland schools as part of the Australian Government’s Building the Education Revolution program. In 2009-10, $1.168 billion will provide for the building or upgrade of large scale school infrastructure (such as libraries, halls and science and language laboratories) as well as the renewal of existing school buildings.
The Queensland Skills Plan included a six-year infrastructure program worth over $350 million. In 2009-10, $85.4 million will be invested in facilities for major trade and technician skills and a further $17.9 million will be provided for the redevelopment of TAFE campuses.
QUEENSLAND FUTURE GROWTH FUND
The Queensland Future Growth Fund (the Fund) was established in June 2006 with the net proceeds from the sale of certain Government-owned energy corporations.
The Fund supports initiatives and infrastructure benefiting Queensland by:
| • | | implementing strategies to secure water supply and providing finance for critical water infrastructure |
| • | | providing funding for infrastructure projects that support the State’s growth, particularly in the areas of transport, housing and commercial infrastructure |
| • | | supplying funds to research and develop innovative technologies that address climate change and proactively advance the State’s environmental sustainability. |
The Queensland Future Growth Corporation was created under the Future Growth Fund Act 2006 to administer the Fund.
In 2008-09 the fund is forecast to allocate a total of $955.7 million towards transport and water infrastructure, climate change projects, Smart State projects, social housing stock, clean coal technology and commercial infrastructure.
Over the coming years, the Fund will continue to contribute to the delivery of the following key priorities:
| • | | constructing infrastructure projects in the areas of water and transport, with $149.9 million forecast to be allocated to these areas in 2009-10 |
| | | | |
20 | | Capital Statement 2009 10 | | |
| • | | funding for clean coal technology that will make a proactive and positive contribution to the science and technology of reducing carbon emissions |
| • | | funding for the Renewable Energy Fund and the Queensland Smart Energy Savings Fund to support climate change initiatives such as the Queensland Solar Hot Water Program, the Geothermal Energy Centre of Excellence and a range of energy conservation and demand management measures designed to reduce peak electricity demand in Queensland |
| • | | contributing further towards Smart State projects, specifically the Innovation Building Fund |
| • | | funding for commercial infrastructure, with the remaining $50 million from the $100 million allocation to be provided to the Abbott Point Coal Terminal expansion in 2009-10 |
| • | | continuing to provide funding to the Department of Communities for the expansion of the State’s social housing stock, with $140 million forecast to be allocated from the Fund in 2009-10. |
The Fund will also continue to benefit from the re-injection of interest earnings on the Fund balance.
| | | | |
| | | Capital Statement 2009 10 | | 21 |
Table 2.1 shows the allocation of the Fund towards various projects.
Table 2.1
Queensland Future Growth Fund projects
| | | | | | | | | | | | |
| | | Total
allocation
$’000 | | 2006-07
Actual
$’000 | | 2007-08
Actual
$’000 | | 2008-09
Budget
$’000 | | 2008-09
Est. Act.
$’000 | | 2009-10
Estimate
$’000 |
Transport infrastructure | | 500,000 | | — | | 149,300 | | 177,000 | | 153,600 | | 135,100 |
| | | | | | |
Water infrastructure | | 1,000,000 | | — | | — | | 567,400 | | 557,200 | | 14,800 |
| | | | | | |
Clean coal technology | | 300,000 | | 29,600 | | 22,400 | | 19,400 | | 46,900 | | 19,000 |
| | | | | | |
Climate change projects | | 100,000 | | — | | — | | 32,000 | | 3,000 | | 43,200 |
| | | | | | |
Smart State projects | | 100,000 | | — | | 6,800 | | 20,000 | | 20,000 | | 23,200 |
| | | | | | |
Commercial infrastructure | | 600,000 | | 400,000 | | — | | 50,000 | | 50,000 | | 50,000 |
| | | | | | |
Social housing stock | | 500,000 | | — | | 85,000 | | 125,000 | | 125,000 | | 140,000 |
| | | | | | | | | | | | |
| | | | | | |
Total | | 3,100,000 | | 429,600 | | 263,500 | | 990,800 | | 955,700 | | 425,300 |
| | | | | | | | | | | | |
| | | | |
22 | | Capital Statement 2009 10 | | |
| 3. | CAPITAL OUTLAYS BY ENTITY |
COMMUNITIES
Total capital outlays for the Department of Communities in 2009-10 will be $1.838 billion, providing a significant investment for Child Safety services, Community and Youth Justice services, Disability services, Housing and Homelessness services, Sport and Recreation services, Stadiums Queensland and the Commission for Children and Young People and Child Guardian.
Housing and Homelessness Services
In 2009-10, a record capital program of $1.447 billion (including $140 million from Queensland Future Growth Fund, $977.2 million from the Australian Government’s Nation Building and Jobs Plan, Social Housing, Remote Indigenous Housing and Homelessness National Partnership Agreements) will expand the supply and enhance the standard of social housing rental units in Queensland. To complement this significant capital program a number of strategies will be progressed, including targeting assistance to clients in the greatest need and improving access to appropriate housing options, particularly for people who are homeless or at risk of homelessness.
Program Highlights
| • | | $1.030 billion for the provision of Government-managed social housing to commence construction of 1,601 and complete 737 rental units, purchase 69 rental units, purchase and develop land and enhance the condition of existing social housing. This includes: |
| | • | | $10.5 million as part of the Government’s Spinal Cord Injuries Initiative to commence construction of 11 rental units, complete 11 rental units and acquire land to facilitate future construction; |
| | • | | $10 million to fund the purchase of 34 rental units under the Council of Australian Governments’ National Mental Health Plan; and |
| | • | | $10.9 million to assist Queenslanders who are homeless or at risk of homelessness under the ‘A Place to Call Home’ homelessness initiative. |
| • | | $138.7 million in capital grants for upgrades to existing properties and new and replacement rental units for the 34 Indigenous communities. Construction will be completed on 194 new rental units, two rental units replaced and 1,311 rental units upgraded. In addition, $28.5 million will be invested to purchase 70 properties outside of Indigenous communities. |
| • | | $187 million in funding for the provision of community-managed social housing including: |
| | | | |
| | | Capital Statement 2009 10 | | 23 |
| | • | | $84 million in capital grants for affordable housing throughout Queensland; |
| | • | | $36.6 million in Community-managed Housing—Studio Units to commence construction of 109 rental units, complete construction of 185 rental units commenced in previous years and upgrade existing rental units; |
| | • | | $33.1 million in capital grants to the Brisbane Housing Company to continue construction of 97 rental units and complete a further 124 rental units to provide affordable housing to low-income households throughout the year; |
| | • | | $13.4 million in Long Term Community Housing to complete construction of 47 rental units and an additional purchase 16 rental units; |
| | • | | $11.3 million in funding for the Crisis Accommodation Program to complete construction of 39 rental units, purchase three rental units and upgrade existing rental units; |
| | • | | $6.3 million in capital grants for the Gold Coast Housing Company to continue construction of 32 units of accommodation to provide affordable housing to low- income households on the Gold Coast; and |
| | • | | $2.3 million in capital grants to complete construction of up to 117 rental units for affordable housing in the Whitsunday and Gold Coast regions. |
| • | | $45.8 million in capital works and capital grants for upgrades to Indigenous Community Housing Organisations’ properties which are being transitioned from the Australian Government to Queensland’s one social housing system. |
Community and Youth Justice Services
The 2009-10 Budget provides for $151.9 million in capital expenditure for Community and Youth Justice services, including additional capacity to provide a safe and secure environment for young people referred to youth detention centres.
Program Highlights
| • | | $170.7 million over five years to expand and upgrade the Cleveland Youth Detention Centre in Townsville to a 96-bed facility with completion scheduled in 2012-13. |
| • | | $5.3 million to finalise capital works and infrastructure upgrades, which commenced in 2006-07, at the Brisbane Youth Detention Centre. |
| • | | $3.1 million to finalise major capital upgrades to the Brisbane Childrens Court, and the Southern Outlook in Boonah, the main headquarters and location for delivering programs to youth. |
| | | | |
24 | | Capital Statement 2009 10 | | |
| • | | $1.8 million to establish a new permanent facility in Far North Queensland for the Northern Outlook. This facility will deliver increased programs to youth. |
| • | | $3.5 million commitment to complete capital upgrades to the current neighbourhood centres across the State which commenced in 2006-07. These works include disability access, safety and security, air-conditioning and upgrades to service rooms. |
| • | | $2.5 million in capital funding for the establishment of safe havens in Cherbourg and Coen, and on Palm Island and Mornington Island. |
| • | | $10.4 million to further develop and enhance the existing Integrated Client Management System (ICMS). |
| • | | $2.6 million as part of the Strengthening Rural Communities Strategy, a key component of the Blueprint for the Bush, to be provided to local communities for the Burdekin and Dalby Rural Multi-Tenant Service Centres. |
| • | | $1.6 million has been allocated for a capital grant towards the replacement of a neighbourhood centre in Hervey Bay and to the Cook Shire Council to construct a new neighbourhood centre. |
Child Safety Services
The 2009-10 Budget provides for $32.6 million in capital expenditure for Child Safety services. The capital program includes the establishment of residential care facilities, investment to enhance Indigenous service delivery, ongoing investment in the ICMS, and progression of office accommodation solutions to meet service delivery requirements.
Program Highlights
| • | | $9.9 million in 2009-10 to continue the establishment of safe houses in the Indigenous communities of Pormpuraaw, Kowanyama, Aurukun, Weipa/Napranum, Yarrabah and Palm Island following practical completion of the Doomadgee safe house in 2008-09. Planning will continue for additional safe houses in the Indigenous communities in Eastern Cape York, Torres Strait, Northern Peninsula Area (Bamaga, Seisia, New Mapoon, Umagico and Injinoo) and Mornington Island. The facilities will provide a safe place for Indigenous children and young people to be housed during initial assessments and longer term residential care, allowing children to remain within their own communities. |
| • | | $8 million in 2009-10 to continue the establishment of residential care facilities. These facilities will expand the range of placement options available for children and young people. |
| | | | |
| | | Capital Statement 2009 10 | | 25 |
| • | | $2.1 million in 2009-10 to continue the establishment of therapeutic residential care facilities in Cairns and South East Queensland. These facilities will extend the department’s capacity to respond to children with complex behaviours and mental health issues, by providing intensive support services. |
| • | | $8.8 million in 2009-10 to continue ongoing investment in ICMS and other information management systems. |
| • | | $2.6 million will be invested in 2009-10 to implement office accommodation initiatives to support departmental staff located across the State. |
Disability Services
Total capital expenditure for 2009-10 is $108.7 million to help deliver disability services across the state through a network of regional offices and through the construction of ‘purpose design’ infrastructure to support people with a disability.
Program Highlights
| • | | $21.7 million to purchase land and design and construct purpose-built accommodation (variable secure and forensic), as part of a targeted response for people with severely challenging behaviours (‘Positive Futures’ initiative). |
| • | | $19.7 million to purchase, construct and upgrade residential accommodation for clients including purpose designed housing for people with a disability and for people with mental illness. |
| • | | $3.4 million in 2009-10 to undertake capital upgrades to the department’s infrastructure at its Wacol site as part of the ‘Positive Futures’ initiative. |
| • | | $5.5 million in capital grants to the non-Government organisation sector initiative for asset acquisition and replacement and systems development. |
| • | | $5.1 million for enhancements to the Disability Services Queensland Information System to support the disability service system reform, ‘Growing Stronger’. |
| • | | $4.1 million in capital grants to purchase and construct specialist cluster housing for people with an intellectual disability and high and complex physical support needs. |
| • | | $2.5 million in capital grants to develop All Abilities Playgrounds in partnership with local councils which will provide safe and enjoyable recreational equipment and activities for all children including those with a disability. |
| • | | $1.6 million for the Transition from Correctional Facilities initiative targeting people with a mental illness in Cairns and Townsville. |
| | | | |
26 | | Capital Statement 2009 10 | | |
| • | | $1.2 million for the non-Government sector to reduce the number of younger people with a disability living in or at risk of entering residential aged care. |
| • | | $18.3 million in capital funding from the Australian Government under the Disability Assistance Package to purchase and/or build housing for people with disabilities. |
Sport and Recreation Services
Sport and Recreation services’ capital works, and grant and subsidy programs will provide $58.7 million in 2009-10 (including a capital grant of $10 million to Stadiums Queensland). This funding will assist sport and recreation organisations, local governments and schools to develop places and facilities that enable more Queenslanders to lead active, healthy lifestyles.
This capital expenditure relates principally to capital grant and subsidies to assist with the building or upgrading of community sport and recreation facilities which support the Government’s objectives to make Queenslanders Australia’s healthiest people.
Other capital expenditure by Sport and Recreation services improves the quality and accessibility of facilities at a number of the State’s Active Recreation Centres and the ongoing maintenance and provision of an appropriate level of office equipment and information technology hardware at office sites across Queensland.
Program Highlights
| • | | $55 million in funding (including a capital grant of $10 million to Stadiums Queensland) to develop and improve sport and recreation infrastructure to meet community participation needs; support local, regional, state and national levels of competition; and enable Queensland to attract and host key events. |
| • | | $3.4 million to improve facilities at Active Recreation Centres and Sports Houses throughout the State. |
Stadiums Queensland
The capital program for Stadiums Queensland reflects the investment required to develop and maintain the State’s stadia to a standard appropriate for the conduct of national and international events.
Stadiums Queensland’s 2009-10 capital program budget of $48.2 million provides $37 million towards the redevelopment of the Gold Coast Stadium at Carrara to a 23,000 seat facility. It is anticipated the stadium redevelopment will be completed by July 2011 and be the home ground of a new Gold Coast Australian Football League Team.
| | | | |
| | | Capital Statement 2009 10 | | 27 |
The capital maintenance and equipment program of $11.2 million includes $2 million for an upgrade to the northern stand at the Dairy Farmers Stadium.
Commission for Children and Young People and Child Guardian
The Commission for Children and Young People and Child Guardian’s capital program for 2009-10 provides for expenditure of $0.6 million. The major project to be undertaken is the development of a new Community Visitor Information System which will provide for a more efficient process for the lodgement of Community Visitor site reports.
Communities
| | | | | | | | | | |
Project | | Statistical
Division | | Total
Estimated
Cost
$’000 | | Expenditure
to
30-06-09
$’000 | | Budget
2009-10
$’000 | | Post
2009-10
$’000 |
HOUSING AND HOMELESSNESS SERVICES | | | | | | | | | | |
| | | | | |
Property, Plant and Equipment | | | | | | | | | | |
SOCIAL RENTAL HOUSING | | | | | | | | | | |
Construction | | | | | | | | | | |
Brisbane | | | | | | | | | | |
Detached Houses1 | | 05 | | | | | | 4,010 | | Ongoing |
Medium Density1 | | 05 | | | | | | 79,886 | | Ongoing |
Gold Coast | | | | | | | | | | |
Detached Houses1 | | 07 | | | | | | 79 | | Ongoing |
Medium Density | | 07 | | | | | | 4,492 | | Ongoing |
Sunshine Coast | | | | | | | | | | |
Detached Houses1 | | 09 | | | | | | 357 | | Ongoing |
Medium Density | | 09 | | | | | | 5,248 | | Ongoing |
Wide Bay-Burnett | | | | | | | | | | |
Detached Houses1 | | 15 | | | | | | 5,271 | | Ongoing |
Medium Density1 | | 15 | | | | | | 4,981 | | Ongoing |
Darling Downs | | | | | | | | | | |
Detached Houses1 | | 20 | | | | | | 385 | | Ongoing |
Medium Density1 | | 20 | | | | | | 7,810 | | Ongoing |
Fitzroy | | | | | | | | | | |
Detached Houses | | 30 | | | | | | 1,918 | | Ongoing |
Medium Density1 | | 30 | | | | | | 13,180 | | Ongoing |
Mackay | | | | | | | | | | |
Detached Houses | | 40 | | | | | | 1,429 | | Ongoing |
Medium Density1 | | 40 | | | | | | 10,509 | | Ongoing |
Northern | | | | | | | | | | |
Detached Houses | | 45 | | | | | | 9,330 | | Ongoing |
| | | | |
28 | | Capital Statement 2009 10 | | |
Communities
| | | | | | | | | | |
Project | | Statistical
Division | | Total
Estimated
Cost
$’000 | | Expenditure
to
30-06-09
$’000 | | Budget
2009-10
$’000 | | Post
2009-10
$’000 |
Medium Density1 | | 45 | | | | | | 9,532 | | Ongoing |
Far North | | | | | | | | | | |
Detached Houses1 | | 50 | | | | | | 9,655 | | Ongoing |
Medium Density1 | | 50 | | | | | | 10,458 | | Ongoing |
North West | | | | | | | | | | |
Detached Houses | | 55 | | | | | | 663 | | Ongoing |
Various | | Various | | | | | | 502,507 | | Ongoing |
| | | | | | | | | | |
Sub-total Construction | | | | | | | | 681,700 | | |
| | | | | | | | | | |
| | | | | |
Capital Works on Existing Dwellings | | | | | | | | | | |
Brisbane | | 05 | | | | | | 46,396 | | Ongoing |
Gold Coast | | 07 | | | | | | 5,988 | | Ongoing |
Sunshine Coast | | 09 | | | | | | 3,827 | | Ongoing |
Wide Bay-Burnett | | 15 | | | | | | 4,670 | | Ongoing |
Darling Downs | | 20 | | | | | | 3,117 | | Ongoing |
Fitzroy | | 30 | | | | | | 4,184 | | Ongoing |
Central West | | 35 | | | | | | 3,188 | | Ongoing |
Mackay | | 40 | | | | | | 3,606 | | Ongoing |
Northern | | 45 | | | | | | 6,221 | | Ongoing |
Far North | | 50 | | | | | | 7,975 | | Ongoing |
Various | | Various | | | | | | 63,250 | | Ongoing |
| | | | | | | | | | |
Sub-total Capital Works on Existing Dwellings | | | | | | | | 152,422 | | |
| | | | | | | | | | |
| | | | | |
Land Purchases and Improvement of Land | | Various | | | | | | 220,431 | | Ongoing |
Purchase of Existing Properties | | Various | | | | | | 32,868 | | Ongoing |
| | | | | | | | | | |
Sub-total SOCIAL RENTAL HOUSING | | | | | | | | 1,087,421 | | |
| | | | | | | | | | |
| | | | | |
INDIGENOUS COMMUNITY HOUSING | | | | | | | | | | |
Purchase of Existing Properties | | Various | | | | | | 28,500 | | Ongoing |
| | | | | | | | | | |
Sub-total INDIGENOUS COMMUNITY HOUSING | | | | | | | | 28,500 | | |
| | | | | | | | | | |
| | | | | |
CRISIS HOUSING | | | | | | | | | | |
Construction | | | | | | | | | | |
Brisbane1 | | 05 | | | | | | 1,600 | | Ongoing |
Gold Coast | | 07 | | | | | | 1,300 | | Ongoing |
Fitzroy1 | | 30 | | | | | | 1,600 | | Ongoing |
| | | | | | | | | | |
Sub-total Construction | | | | | | | | 4,500 | | |
| | | | | | | | | | |
| | | | |
| | | Capital Statement 2009 10 | | 29 |
Communities
| | | | | | | | | | |
Project | | Statistical
Division | | Total
Estimated
Cost
$’000 | | Expenditure
to
30-06-09
$’000 | | Budget
2009-10
$’000 | | Post
2009-10
$’000 |
Capital Works on Existing Dwellings | | | | | | | | | | |
Various | | Various | | | | | | 1,500 | | Ongoing |
| | | | | | | | | | |
Sub-total Capital Works on Existing Dwellings | | | | | | | | 1,500 | | |
| | | | | | | | | | |
| | | | | |
Purchase of Existing Properties | | | | | | | | | | |
Brisbane | | 05 | | | | | | 1,000 | | Ongoing |
Wide Bay-Burnett | | 15 | | | | | | 500 | | Ongoing |
| | | | | | | | | | |
Sub-total Purchase of Existing Properties | | | | | | | | 1,500 | | |
| | | | | | | | | | |
| | | | | |
Sub-total CRISIS HOUSING | | | | | | | | 7,500 | | |
| | | | | | | | | | |
| | | | | |
PRIVATE MARKET ASSISTANCE | | | | | | | | | | |
Construction | | | | | | | | | | |
North West | | 55 | | | | | | 8,000 | | Ongoing |
| | | | | | | | | | |
Sub-total Construction | | | | | | | | 8,000 | | |
| | | | | | | | | | |
| | | | | |
Investment | | Various | | | | | | 200 | | Ongoing |
| | | | | | | | | | |
Sub-total PRIVATE MARKET ASSISTANCE | | | | | | | | 8,200 | | |
| | | | | | | | | | |
| | | | | |
PLANT & EQUIPMENT | | | | | | | | | | |
Property, Plant & Equipment | | Various | | | | | | 446 | | Ongoing |
| | | | | | | | | | |
Sub-total PLANT & EQUIPMENT | | | | | | | | 446 | | |
| | | | | | | | | | |
| | | | | |
Total Property, Plant and Equipment | | | | | | | | 1,132,067 | | |
| | | | | | | | | | |
| | | | | |
Other Capital Expenditure | | | | | | | | | | |
Intangibles | | Various | | | | | | 5,632 | | Ongoing |
| | | | | | | | | | |
Total Other Capital Expenditure | | | | | | | | 5,632 | | |
| | | | | | | | | | |
| | | | | |
Capital Grants | | | | | | | | | | |
SOCIAL RENTAL HOUSING | | | | | | | | | | |
Brisbane | | 05 | | | | | | 34,637 | | Ongoing |
Gold Coast | | 07 | | | | | | 6,985 | | Ongoing |
Wide Bay-Burnett | | 15 | | | | | | 415 | | Ongoing |
Darling Downs | | 20 | | | | | | 2,925 | | Ongoing |
Mackay | | 40 | | | | | | 2,118 | | Ongoing |
Northern | | 45 | | | | | | 2,532 | | Ongoing |
North West | | 55 | | | | | | 36,742 | | Ongoing |
Various | | Various | | | | | | 78,000 | | Ongoing |
| | | | | | | | | | |
Sub-total SOCIAL RENTAL HOUSING | | | | | | | | 164,354 | | |
| | | | | | | | | | |
| | | | |
30 | | Capital Statement 2009 10 | | |
Communities
| | | | | | | | | | |
Project | | Statistical
Division | | Total
Estimated
Cost
$’000 | | Expenditure
to
30-06-09
$’000 | | Budget
2009-10
$’000 | | Post
2009-10
$’000 |
INDIGENOUS COMMUNITY HOUSING | | | | | | | | | | |
Wide Bay-Burnett | | 15 | | | | | | 1,222 | | Ongoing |
Fitzroy | | 30 | | | | | | 2,151 | | Ongoing |
Northern | | 45 | | | | | | 10,494 | | Ongoing |
Far North | | 50 | | | | | | 88,989 | | Ongoing |
North West | | 55 | | | | | | 35,851 | | Ongoing |
| | | | | | | | | | |
Sub-total INDIGENOUS COMMUNITY HOUSING | | | | | | | | 138,707 | | |
| | | | | | | | | | |
| | | | | |
CRISIS HOUSING | | | | | | | | | | |
Gold Coast | | 07 | | | | | | 1,631 | | Ongoing |
Central West | | 35 | | | | | | 855 | | Ongoing |
Various | | Various | | | | | | 1,326 | | Ongoing |
| | | | | | | | | | |
Sub-total CRISIS HOUSING | | | | | | | | 3,812 | | |
| | | | | | | | | | |
| | | | | |
PRIVATE MARKET ASSISTANCE | | | | | | | | | | |
Mackay | | 40 | | 3,500 | | 2,400 | | 1,100 | | |
| | | | | | | | | | |
Sub-total PRIVATE MARKET ASSISTANCE | | | | | | | | 1,100 | | |
| | | | | | | | | | |
| | | | | |
COMMUNITY RENEWAL | | | | | | | | | | |
Gold Coast | | 07 | | 2,820 | | 2,043 | | 777 | | |
Northern | | 45 | | 1,095 | | 528 | | 567 | | |
| | | | | | | | | | |
Sub-total COMMUNITY RENEWAL | | | | | | | | 1,344 | | |
| | | | | | | | | | |
| | | | | |
Total Capital Grants | | | | | | | | 309,317 | | |
| | | | | | | | | | |
| | | | | |
TOTAL HOUSING AND HOMELESSNESS SERVICES | | | | | | | | 1,447,016 | | |
| | | | | | | | | | |
| | | | | |
COMMUNITY AND YOUTH JUSTICE SERVICES | | | | | | | | | | |
| | | | | |
Property, Plant and Equipment | | | | | | | | | | |
Youth Development and Youth Justice Services | | | | | | | | | | |
Brisbane Childrens Court | | 05 | | 5,212 | | 3,894 | | 942 | | 376 |
Refurbishment | | | | | | | | | | |
Brisbane Youth Detention Centre | | 05 | | 27,882 | | 21,517 | | 5,258 | | 1,107 |
Cleveland Youth Detention Centre | | 45 | | 170,670 | | 5,341 | | 70,196 | | 95,133 |
- New | | | | | | | | | | |
Cleveland Youth Detention Centre | | 45 | | 22,955 | | 11,930 | | 4,212 | | 6,813 |
- Renewal | | | | | | | | | | |
Northern Outlook | | 50 | | 2,364 | | 549 | | 1,815 | | |
Southern Outlook | | 12 | | 5,258 | | 2,608 | | 2,177 | | 473 |
Multi Purpose and Neighbourhood Community Centres | | | | | | | | | | |
Caloundra Community Centre | | 09 | | 824 | | | | 824 | | |
| | | | |
| | | Capital Statement 2009 10 | | 31 |
Communities
| | | | | | | | | | |
Project | | Statistical
Division | | Total
Estimated
Cost
$’000 | | Expenditure
to
30-06-09
$’000 | | Budget
2009-10
$’000 | | Post
2009-10
$’000 |
Gympie Neighbourhood Centre | | 15 | | 274 | | | | 274 | | |
Lockhart River Multi-Tenant Service Centre | | 50 | | 1,325 | | | | 1,325 | | |
Mackay Multi-Tenant Service Centre | | 40 | | 1,498 | | 201 | | 1,297 | | |
Maleny Neighbourhood Centre | | 09 | | 1,973 | | 788 | | 1,185 | | |
Marlin Coast Neighbourhood Centre | | 50 | | 2,623 | | 630 | | 1,993 | | |
Mount Isa Neighbourhood Centre | | 55 | | 500 | | | | 500 | | |
Neighbourhood Centre Upgrades | | Various | | 3,950 | | 462 | | 3,488 | | |
Other Purpose and Neighbourhood Community Centres | | Various | | 25,922 | | 1,447 | | 9,647 | | 14,828 |
Office Accommodation | | | | | | | | | | |
Redevelopments | | Various | | 5,421 | | 726 | | 4,441 | | 254 |
New/Replacement Buildings | | Various | | 1,185 | | 219 | | 876 | | 90 |
Residential Accommodation | | Various | | 819 | | 731 | | 88 | | |
Retail Stores Undertakings | | Various | | 11,315 | | 7,675 | | 910 | | 2,730 |
Safe Havens | | Various | | 5,317 | | 3 | | 2,534 | | 2,780 |
SIS ICT Replacement Program | | Various | | | | | | 4,841 | | Ongoing |
Minor Capital Works | | Various | | | | | | 967 | | Ongoing |
Plant and Equipment Replacement Program | | Various | | | | | | 846 | | Ongoing |
Other Capital Works | | Various | | | | | | 11,515 | | Ongoing |
| | | | | | | | | | |
Total Property, Plant and Equipment | | | | | | | | 132,151 | | |
| | | | | | | | | | |
| | | | | |
Other Capital Expenditure | | | | | | | | | | |
Information Renewal Initiative and Referral for Active Intervention | | Various | | | | | | 158 | | Ongoing |
Integrated Client Management System (ICMS) | | Various | | 32,968 | | 18,826 | | 10,441 | | 3,701 |
Grants Management System | | Various | | 2,149 | | 2,064 | | 85 | | |
Information Management Program | | Various | | | | | | 1,916 | | Ongoing |
Detention Centre Operational Information System | | Various | | 2,360 | | | | 1,880 | | 480 |
| | | | | | | | | | |
Total Other Capital Expenditure | | | | | | | | 14,480 | | |
| | | | | | | | | | |
| | | | | |
Capital Grants | | | | | | | | | | |
Community Facilities Upgrade | | Various | | 200 | | 50 | | 150 | | |
Multi-Tenant Service Centre | | Various | | 2,800 | | 205 | | 2,595 | | |
| | | | |
32 | | Capital Statement 2009 10 | | |
Communities
| | | | | | | | | | |
Project | | Statistical
Division | | Total
Estimated
Cost
$’000 | | Expenditure
to
30-06-09
$’000 | | Budget
2009-10
$’000 | | Post
2009-10
$’000 |
Neighbourhood Centre | | Various | | 1,860 | | 300 | | 1,560 | | |
Welfare Reform | | Various | | 800 | | | | 800 | | |
Aurukun | | 50 | | 135 | | | | 135 | | |
| | | | | | | | | | |
Total Capital Grants | | | | | | | | 5,240 | | |
| | | | | | | | | | |
| | | | | |
TOTAL COMMUNITY AND YOUTH JUSTICE SERVICES | | | | | | | | 151,871 | | |
| | | | | | | | | | |
| | | | | |
CHILD SAFETY SERVICES | | | | | | | | | | |
| | | | | |
Property, Plant and Equipment | | | | | | | | | | |
Office accommodation | | Various | | | | | | 2,562 | | Ongoing |
Residential care facilities | | Various | | 30,674 | | 3,469 | | 8,030 | | 19,175 |
Therapeutic residential care facilities | | Various | | 8,847 | | 5,047 | | 2,100 | | 1,700 |
Services for Indigenous Communities | | Various | | 22,667 | | 2,331 | | 9,856 | | 10,480 |
Minor works and other plant and equipment | | 05 | | | | | | 1,252 | | Ongoing |
| | | | | | | | | | |
Total Property, Plant and Equipment | | | | | | | | 23,800 | | |
| | | | | | | | | | |
| | | | | |
Other Capital Expenditure | | | | | | | | | | |
Information management systems | | 05 | | 18,285 | | 6,677 | | 6,908 | | 4,700 |
Minor information systems | | 05 | | | | | | 1,873 | | Ongoing |
| | | | | | | | | | |
Total Other Capital Expenditure | | | | | | | | 8,781 | | |
| | | | | | | | | | |
| | | | | |
TOTAL CHILD SAFETY SERVICES | | | | | | | | 32,581 | | |
| | | | | | | | | | |
| | | | | |
DISABILITY SERVICES | | | | | | | | | | |
| | | | | |
Property, Plant and Equipment | | | | | | | | | | |
Fire Safety Upgrades | | Various | | 1,551 | | 333 | | 1,218 | | |
Residential Accommodation for Clients | | | | | | | | | | |
Hillcrest | | 05 | | 10,157 | | 9,539 | | 618 | | |
Wide Bay | | 15 | | 3,855 | | 2,546 | | 1,309 | | |
Mental Health Program | | Various | | 8,340 | | | | 4,630 | | 3,710 |
Young People in Residential Aged Care | | Various | | 3,000 | | | | 2,000 | | 1,000 |
Other Residential Accommodation | | Various | | 20,470 | | | | 11,139 | | 9,331 |
Respite Services | | | | | | | | | | |
Ashgrove | | 05 | | 1,767 | | 1,234 | | 533 | | |
Other | | Various | | 1,532 | | 1,445 | | 87 | | |
Service Centres | | | | | | | | | | |
Gladstone | | 15 | | 1,214 | | 856 | | 358 | | |
| | | | |
| | | Capital Statement 2009 10 | | 33 |
Communities
| | | | | | | | | | |
Project | | Statistical
Division | | Total
Estimated
Cost
$’000 | | Expenditure
to
30-06-09
$’000 | | Budget
2009-10
$’000 | | Post
2009-10
$’000 |
Specialist Response Service (Positive Futures) | | | | | | | | | | |
Forensic Accommodation | | Various | | 18,084 | | 220 | | 12,863 | | 5,001 |
Wacol Infrastructure Redevelopment | | 05 | | 16,048 | | | | 3,429 | | 12,619 |
Variable Secure Accommodation | | | | | | | | | | |
Gold Coast | | 07 | | 623 | | | | 623 | | |
Northern | | 45 | | 639 | | | | 639 | | |
Sunshine Coast | | 09 | | 824 | | | | 824 | | |
Statewide | | Various | | 25,258 | | 5,819 | | 6,771 | | 12,668 |
Office Accommodation | | | | | | | | | | |
Bundaberg | | 15 | | 366 | | 178 | | 188 | | |
Emerald | | 30 | | 150 | | 3 | | 147 | | |
Greater Brisbane Region | | 05 | | 2,300 | | 700 | | 1,600 | | |
Mackay | | 40 | | 1,300 | | | | 1,300 | | |
Maroochydore | | 09 | | 300 | | | | 300 | | |
Oxley | | 05 | | 2,600 | | 2 | | 2,598 | | |
Robina | | 07 | | 2,450 | | 70 | | 2,380 | | |
Townsville | | 45 | | 301 | | 25 | | 276 | | |
Wide Bay | | 15 | | 180 | | 1 | | 179 | | |
Other | | Various | | 437 | | 58 | | 379 | | |
Plant and Equipment Replacement | | Various | | | | | | 1,115 | | Ongoing |
Other Capital Works | | Various | | | | | | 9,273 | | Ongoing |
| | | | | | | | | | |
Total Property, Plant and Equipment | | | | | | | | 66,776 | | |
| | | | | | | | | | |
| | | | | |
Other Capital Expenditure | | | | | | | | | | |
Disability Information System (DISQIS Project) | | Various | | 29,253 | | 22,047 | | 3,273 | | 3,933 |
DISQIS (Growing Stronger) | | Various | | 8,400 | | | | 5,100 | | 3,300 |
Accommodation Support and Respite Services (AS&RS) Service Management System | | Various | | 855 | | | | 400 | | 455 |
| | | | | | | | | | |
Total Other Capital Expenditure | | | | | | | | 8,773 | | |
| | | | | | | | | | |
| | | | | |
Capital Grants | | | | | | | | | | |
Mental Health | | Various | | 3,523 | | 1,923 | | 1,600 | | |
All Abilities Playground | | Various | | 3,806 | | 1,337 | | 2,469 | | |
Young People in Residential Aged Care | | 05 | | 3,396 | | 2,196 | | 1,200 | | |
Strengthening NGOs | | Various | | 6,677 | | 1,176 | | 5,501 | | |
| | | | |
34 | | Capital Statement 2009 10 | | |
Communities
| | | | | | | | | | |
Project | | Statistical
Division | | Total
Estimated
Cost
$’000 | | Expenditure
to
30-06-09
$’000 | | Budget
2009-10
$’000 | | Post
2009-10
$’000 |
Purpose Design Housing | | Various | | 4,378 | | 278 | | 4,100 | | |
Disability Assistance Package | | Various | | 18,310 | | | | 18,310 | | |
| | | | | | | | | | |
Total Capital Grants | | | | | | | | 33,180 | | |
| | | | | | | | | | |
| | | | | |
TOTAL DISABILITY SERVICES | | | | | | | | 108,729 | | |
| | | | | | | | | | |
| | | | | |
SPORT AND RECREATION SERVICES | | | | | | | | | | |
| | | | | |
Property, Plant and Equipment | | | | | | | | | | |
Active Recreation Centres / Sports Houses | | Various | | | | | | 3,359 | | Ongoing |
Plant and Equipment | | 05 | | | | | | 334 | | Ongoing |
| | | | | | | | | | |
Total Property, Plant and Equipment | | | | | | | | 3,693 | | |
| | | | | | | | | | |
| | | | | |
Capital Grants | | | | | | | | | | |
Major Facilities | | Various | | | | | | 28,051 | | Ongoing |
Minor Facilities | | Various | | | | | | 11,500 | | Ongoing |
Local Sport and Recreation Program | | Various | | | | | | 2,500 | | Ongoing |
Qld Lifestyle Trailbikes Program | | Various | | 105 | | | | 105 | | |
Regional Tennis Facilities Program | | Various | | 8,000 | | 7,269 | | 380 | | 351 |
Sustainable Resource Communities | | 30 | | 4,900 | | 2,450 | | 2,450 | | |
| | | | | | | | | | |
Total Capital Grants | | | | | | | | 44,986 | | |
| | | | | | | | | | |
| | | | | |
TOTAL SPORT AND RECREATION SERVICES | | | | | | | | 48,679 | | |
| | | | | | | | | | |
| | | | | |
STADIUMS QUEENSLAND | | | | | | | | | | |
| | | | | |
Property, Plant and Equipment | | | | | | | | | | |
Gold Coast Stadium | | 07 | | 130,000 | | | | 37,000 | | 93,000 |
Capital Maintenance and Equipment | | Various | | | | | | 11,158 | | Ongoing |
| | | | | | | | | | |
Total Property, Plant and Equipment | | | | | | | | 48,158 | | |
| | | | | | | | | | |
| | | | | |
TOTAL STADIUMS QUEENSLAND | | | | | | | | 48,158 | | |
| | | | | | | | | | |
| | | | | |
COMMISSION FOR CHILDREN AND YOUNG PEOPLE AND CHILD GUARDIAN | | | | | | | | | | |
Property, Plant and Equipment | | | | | | | | | | |
Asset replacement program | | 05 | | | | | | 150 | | Ongoing |
| | | | | | | | | | |
Total Property, Plant and Equipment | | | | | | | | 150 | | |
| | | | | | | | | | |
| | | | |
| | | Capital Statement 2009 10 | | 35 |
Communities
| | | | | | | | | | |
Project | | Statistical
Division | | Total
Estimated
Cost
$’000 | | Expenditure
to
30-06-09
$’000 | | Budget
2009-10
$’000 | | Post
2009-10
$’000 |
Other Capital Expenditure | | | | | | | | | | |
Community Visitor Information System | | 05 | | 900 | | | | 400 | | 500 |
| | | | | | | | | | |
Total Other Capital Expenditure | | | | | | | | 400 | | |
| | | | | | | | | | |
| | | | | |
TOTAL COMMISSION FOR CHILDREN AND YOUNG PEOPLE AND CHILD GUARDIAN | | | | | | | | 550 | | |
| | | | | | | | | | |
| | | | | |
TOTAL COMMUNITIES | | | | | | | | 1,837,584 | | |
| | | | | | | | | | |
Note:
| 1. | Funded fully or in part under the Queensland Future Growth Fund |
| | | | |
36 | | Capital Statement 2009 10 | | |
COMMUNITY SAFETY
The department’s 2009-10 capital program will invest $561.3 million in capital acquisitions and grants to support healthy, safe and secure communities through public safety, emergency management, essential emergency response services, and secure and appropriate corrections services. These initiatives link to two of the Government’s Q2 Ambitions: Healthy - Making Queenslanders Australia’s healthiest people; and Fair - Supporting safe and caring communities.
The major features of this program include substantial investment in: the new South Queensland Correctional Precinct at Gatton; the expansion and upgrade of Lotus Glen Correctional Centre in Far North Queensland; and a new Queensland Emergency Operations Centre at Kedron.
Program Highlights
| • | | $199.0 million for the expansion and upgrade of the Lotus Glen Correctional Centre in Far North Queensland at a total cost of $445.0 million. |
| • | | $164.0 million for the first stage of the development of the South Queensland Correctional Precinct at Gatton, comprising a women’s centre and central infrastructure, at a total cost of $485.1 million. |
| • | | $54.9 million to build, at a total cost of $78.7 million, a new integrated communication and emergency operations centre at Kedron that will more effectively coordinate responses to day-to-day emergencies together with large-scale incidents and disasters. |
| • | | Total outlays of $59.5 million are provided for new ambulance facilities, vehicles, operational equipment, and ICT improvements, while $43.5 million is provided for fire facilities, urban and rural fire appliances, operational equipment and ICT improvements. |
| • | | Two new ambulance stations and 18 replacement or refurbished facilities will be commenced or completed during 2009-10. |
| • | | Four new fire stations and six replacement or refurbished facilities will be commenced or completed during 2009-10. |
| • | | $1.9 million will be invested to complete a replacement emergency services facility at Palm Island. |
| • | | $17.6 million is provided for the remaining work following the completion of four major prison infrastructure projects in Wacol and Townsville and the upgrade of perimeter security systems throughout the state. |
| | | | |
| | | Capital Statement 2009 10 | | 37 |
| • | | $2.4 million is provided for the upgrade and expansion of probation and parole services throughout the State. |
| • | | $20.9 million for purchasing 150 ambulance vehicles to ensure the ambulance fleet continues to be maintained at the highest possible level and for additional vehicles to meet increasing community needs. |
| • | | $10.4 million will be invested in 23 new or replacement urban fire and rescue appliances as part of the fleet replacement program to meet enhanced service delivery. $4.4 million will be invested in 34 new or replacement rural fire appliances including the first six of fourteen specialised 3,000 litre water carrying capacity appliances fitted with essential communication and firefighting equipment. |
| • | | There will be continued improvement of ICT and communications and operational equipment for ambulance services ($12.1 million) and for fire and rescue services ($2.6 million). |
| • | | $3.4 million has been allocated for strategic land purchases for ambulance services and $3.9 million for fire and rescue services land purchases. |
Community Safety
| | | | | | | | | | |
Project | | Statistical
Division | | Total
Estimated
Cost
$’000 | | Expenditure
to
30-06-09
$’000 | | Budget
2009-10
$’000 | | Post
2009-10
$’000 |
EMERGENCY SERVICES | | | | | | | | | | |
| | | | | |
Property, Plant and Equipment | | | | | | | | | | |
QUEENSLAND AMBULANCE SERVICE | | | | | | | | | | |
Building/General Works | | | | | | | | | | |
Ashgrove/ The Gap new station | | 05 | | 2,000 | | 201 | | 1,799 | | |
Burleigh Heads station refurbishment | | 07 | | 1,329 | | 1,300 | | 29 | | |
Chermside station refurbishment | | 05 | | 1,200 | | | | 150 | | 1,050 |
Clermont replacement station | | 40 | | 1,618 | | 1,223 | | 395 | | |
Gordonvale replacement station | | 50 | | 1,800 | | | | 200 | | 1,600 |
Grovely/ Mitchelton replacement station | | 05 | | 3,100 | | 510 | | 2,590 | | |
Ipswich replacement station | | 05 | | 4,000 | | 1,114 | | 2,886 | | |
Jimboomba replacement station | | 05 | | 2,000 | | | | 150 | | 1,850 |
Julia Creek replacement station | | 55 | | 746 | | 684 | | 62 | | |
Moranbah station refurbishment | | 40 | | 700 | | | | 700 | | |
| | | | |
| 38 | | Capital Statement 2009 10 | | |
Community Safety
| | | | | | | | | | |
Project | | Statistical
Division | | Total
Estimated
Cost
$’000 | | Expenditure
to
30-06-09
$’000 | | Budget
2009-10
$’000 | | Post
2009-10
$’000 |
Mount Morgan replacement station | | 30 | | 1,519 | | 1,400 | | 119 | | |
Pimpama replacement station (regional staff development unit) | | 07 | | 2,615 | | 1,900 | | 715 | | |
Ravenshoe replacement station | | 50 | | 2,000 | | | | 200 | | 1,800 |
Redcliffe replacement station | | 05 | | 1,480 | | 1,300 | | 180 | | |
Runaway Bay replacement station | | 07 | | 2,100 | | 100 | | 2,000 | | |
South Brisbane replacement regional staff development unit | | 05 | | 3,000 | | 587 | | 2,413 | | |
Springfield new station | | 05 | | 2,400 | | 200 | | 2,200 | | |
Stanthorpe replacement station | | 20 | | 1,800 | | | | 200 | | 1,600 |
Tully replacement station | | 50 | | 2,000 | | 500 | | 1,500 | | |
Yarrabah replacement station | | 50 | | 1,374 | | 609 | | 765 | | |
Minor works | | Various | | | | | | 3,834 | | Ongoing |
Land | | | | | | | | | | |
Strategic land acquisitions | | Various | | | | | | 3,400 | | Ongoing |
Other Plant and Equipment | | | | | | | | | | |
Ambulance vehicle purchases | | Various | | 38,230 | | | | 20,930 | | 17,300 |
Operational and communications equipment | | Various | | | | | | 6,736 | | Ongoing |
| | | | | | | | | | |
Sub-total QUEENSLAND AMBULANCE SERVICE | | | | | | 54,153 | | |
| | | | | | | | | | |
| | | | | |
QUEENSLAND FIRE AND RESCUE SERVICE | | | | | | | | | | |
Building/General Works | | | | | | | | | | |
Agnes Water new station | | 15 | | 1,100 | | | | 500 | | 600 |
Nambour replacement station | | 09 | | 3,060 | | 1,010 | | 2,050 | | |
Nerang new station | | 07 | | 3,450 | | 400 | | 3,050 | | |
Pullenvale replacement station | | 05 | | 3,000 | | 400 | | 2,600 | | |
Queensland Combined Emergency Services Academy - complex improvements | | 05 | | | | | | 1,595 | | Ongoing |
Redland Bay new station | | 05 | | 2,800 | | 501 | | 2,299 | | |
Ripley new station | | 05 | | 3,400 | | | | 200 | | 3,200 |
Southport station redevelopment | | 07 | | 5,289 | | 1,680 | | 3,609 | | |
Toowoomba Kitchener Street replacement station | | 20 | | 4,500 | | | | 1,800 | | 2,700 |
| | | | |
| | | Capital Statement 2009 10 | | 39 |
Community Safety
| | | | | | | | | | |
Project | | Statistical
Division | | Total
Estimated
Cost
$’000 | | Expenditure
to
30-06-09
$’000 | | Budget
2009-10
$’000 | | Post
2009-10
$’000 |
Woodridge replacement station | | 05 | | 3,600 | | 400 | | 3,200 | | |
Minor works | | Various | | | | | | 1,300 | | Ongoing |
Land | | | | | | | | | | |
Strategic land acquisitions | | Various | | | | | | 3,750 | | Ongoing |
Rural Operations land purchase | | Various | | | | | | 100 | | Ongoing |
Other Plant and Equipment | | Various | | | | | | 2,194 | | Ongoing |
Operational and communications equipment | | | | | | | | | | |
Rural Fire appliances | | Various | | | | | | 4,430 | | Ongoing |
Urban Fire appliances | | Various | | | | | | 10,360 | | Ongoing |
| | | | | | | | | | |
Sub-total QUEENSLAND FIRE AND RESCUE SERVICE | | | | 43,037 | | |
| | | | | | | | | | |
| | | | | |
EMERGENCY MANAGEMENT QUEENSLAND | | | | | | | | | | |
Buildings/ General Works | | | | | | | | | | |
Moranbah SES facility | | 40 | | 490 | | | | 490 | | |
Rolleston Emergency Services Centre | | 30 | | 270 | | | | 270 | | |
Other plant and equipment | | Various | | | | | | 515 | | Ongoing |
| | | | | | | | | | |
Sub-total EMERGENCY MANAGEMENT QUEENSLAND | | | | 1,275 | | |
| | | | | | | | | | |
| | | | | |
JOINT EMERGENCY SERVICE FACILITIES | | | | | | | | | | |
Palm Island replacement joint facility | | 45 | | 3,460 | | 1,544 | | 1,916 | | |
Queensland Emergency Operations Centre | | 05 | | 78,677 | | 15,251 | | 54,853 | | 8,573 |
| | | | | | | | | | |
Sub-total JOINT EMERGENCY SERVICE FACILITIES | | | | 56,769 | | |
| | | | | | | | | | |
| | | | | |
OTHER DEPARTMENTAL | | | | | | | | | | |
Minor works | | 05 | | | | | | 200 | | Ongoing |
| | | | | | | | | | |
Sub-total OTHER DEPARTMENTAL | | | | | | | | 200 | | |
| | | | | | | | | | |
Total Property, Plant and Equipment | | | | | | | | 155,434 | | |
| | | | | | | | | | |
| | | | | |
Other Capital Expenditure | | | | | | | | | | |
QUEENSLAND AMBULANCE SERVICE | | | | | | | | | | |
Strategic Information Management Initiative | | Various | | | | | | 2,704 | | Ongoing |
Information systems development | | Various | | | | | | 2,613 | | Ongoing |
QUEENSLAND FIRE AND RESCUE SERVICE | | | | | | | | | | |
Information systems development | | Various | | | | | | 445 | | Ongoing |
| | | | |
40 | | Capital Statement 2009 10 | | |
Community Safety
| | | | | | | | | | |
Project | | Statistical
Division | | Total
Estimated
Cost
$’000 | | Expenditure
to
30-06-09
$’000 | | Budget
2009-10
$’000 | | Post
2009-10
$’000 |
OTHER DEPARTMENTAL | | | | | | | | | | |
Information systems development | | Various | | | | | | 1,933 | | Ongoing |
| | | | | | | | | | |
Total Other Capital Expenditure | | | | | | | | 7,695 | | |
| | | | | | | | | | |
| | | | | |
Capital Grants | | | | | | | | | | |
Rural Fire Brigades | | Various | | | | | | 150 | | Ongoing |
State Emergency Service units | | Various | | | | | | 532 | | Ongoing |
| | | | | | | | | | |
Total Capital Grants | | | | | | | | 682 | | |
| | | | | | | | | | |
| | | | | |
TOTAL EMERGENCY SERVICES | | | | | | | | 163,811 | | |
| | | | | | | | | | |
| | | | | |
CORRECTIVE SERVICES | | | | | | | | | | |
Property, Plant and Equipment | | | | | | | | | | |
Expansion of Lotus Glen Correctional Centre (CC) | | 50 | | 445,005 | | 56,980 | | 199,000 | | 189,025 |
South Queensland Correctional Precinct at Gatton, First Stage | | 12 | | 485,073 | | 112,327 | | 164,000 | | 208,746 |
Women’s CC at Townsville | | 45 | | 125,000 | | 120,384 | | 4,616 | | |
Redevelopment of Sir David Longland CC | | 05 | | 109,000 | | 107,386 | | 1,614 | | |
Expansion of Arthur Gorrie CC | | 05 | | 56,000 | | 53,241 | | 2,759 | | |
Expansion of Townsville CC | | 45 | | 147,963 | | 140,667 | | 7,296 | | |
Perimeter security systems | | Various | | 40,000 | | 38,665 | | 1,335 | | |
Establishment of new Probation and Parole service | | Various | | 3,920 | | 3,036 | | 884 | | |
Probation and Parole in Indigenous Communities | | Various | | 1,500 | | 470 | | 1,030 | | |
Accommodation for Offenders under DPSOA | | Various | | 1,400 | | 600 | | 400 | | 400 |
Probation & Parole Office Accommodation | | Various | | | | | | 450 | | Ongoing |
Other acquisitions of property, plant and equipment | | Various | | | | | | 13,741 | | Ongoing |
| | | | | | | | | | |
Total Property, Plant and Equipment | | | | | | | | 397,125 | | |
| | | | | | | | | | |
| | | | |
| | | Capital Statement 2009 10 | | 41 |
Community Safety
| | | | | | | | | | |
Project | | Statistical
Division | | Total
Estimated
Cost
$’000 | | Expenditure
to
30-06-09
$’000 | | Budget
2009-10
$’000 | | Post
2009-10
$’000 |
Other Capital Expenditure | | | | | | | | | | |
IOMS Capital Upgrade | | 05 | | 1,220 | | 431 | | 369 | | 420 |
| | | | | | | | | | |
Total Other Capital Expenditure | | | | | | | | 369 | | |
| | | | | | | | | | |
| | | | | |
TOTAL CORRECTIVE SERVICES | | | | | | | | 397,494 | | |
| | | | | | | | | | |
| | | | | |
TOTAL COMMUNITY SAFETY | | | | | | | | 561,305 | | |
| | | | | | | | | | |
| | | | |
42 | | Capital Statement 2009 10 | | |
EDUCATION AND TRAINING
Total capital expenditure across the Education and Training portfolio (including the Department of Education and Training and related entities) is $1.837 billion in 2009-10. This record level of investment includes the commencement of the Government’s commitment to provide an extra 240 kindergarten services by 2014, the delivery of new, replacement and enhanced school and training facilities across the State and the delivery of projects under the Australian Government’s Building the Education Revolution program.
Education
A significant capital works program of $1.843 billion (including an expense component of $375.9 million) will be undertaken in 2009-10. A further $80.1 million will enable the commencement of the SEQ Private Partnership Schools Project under which seven new schools will be constructed in high growth areas. New schools at Thornlands South and Peregian Springs will open in 2010, with the remaining schools to open in 2011 and 2012.
The planning for capital works meets the Government’s priorities and needs by considering population growth, changes in education standards and delivery methods and addressing high priority needs such as student and staff health and safety.
Program Highlights
| • | | $1.168 billion to deliver the Building the Education Revolution Program. |
| • | | $149 million to construct a replacement school for Amberley State School, undertake staged work at 5 schools, make land acquisitions and to provide additional classrooms at existing schools in growth areas throughout the State. |
| • | | $100 million to replace and enhance facilities at existing schools. |
| • | | $301 million to continue the $1 billion Tomorrow’s Schools Program. |
| • | | $43.7 million to continue the schools solar and energy efficiency program. |
| • | | $11 million to acquire new employee housing and refurbish existing housing stock. |
| | | | |
| | | Capital Statement 2009 10 | | 43 |
Training
The 2009-10 capital works program sees $136.6 million (including an expense component of $15.9 million) dedicated to the construction, refurbishment and modernisation of training facilities.
Program Highlights
| • | | $22.7 million to continue the development of the SkillsTech Australia major trade and technician skills campus at Acacia Ridge. |
| • | | $22.2 million to develop a major trade and technician skills campus at Townsville. |
| • | | $9.1 million to redevelop the Nambour campus of the Sunshine Coast Institute of TAFE. |
| • | | $6.2 million to continue the redevelopment of the Cairns campus of the Tropical North Institute of TAFE. |
| • | | $28.9 million to develop the new Coomera Education Precinct of the Gold Coast Institute of TAFE. |
Early Childhood Education and Care
The Office for Early Childhood Education and Care will deliver on key early years infrastructure projects and the first stage of the Government’s commitment to provide an extra 240 kindergarten services by 2014 through a capital works program totalling $33.3 million in 2009-10.
Program Highlights
| • | | Invest $15.4 million in 2009-10 to commence delivery of the first stage of kindergartens announced to open on state school sites in 2010 and 2011. |
| • | | Invest $8.4 million in 2009-10 to establish early childhood education and care services at Nanango, Beenleigh, Toowoomba North, Ayr, The Gap, Beaudesert and Acacia Ridge. |
| • | | Invest $3.8 million in 2009-10 to commence planning, design and construction of the first stage of the indigenous child and family centres program funded by the Australian Government over five years. |
| | | | |
44 | | Capital Statement 2009 10 | | |
Education and Training1,2,3,4,5,6
| | | | | | | | | | |
Project | | Statistical
Division | | Total
Estimated
Cost
$’000 | | Expenditure
to
30-06-09
$’000 | | Budget
2009-10
$’000 | | Post
2009-10
$’000 |
DEPARTMENT OF EDUCATION AND TRAINING KEY TO ABBREVIATIONS | | | | | | | | | | |
GLAB - General Learning Area Block | | | | | | | | | | |
| | | | | |
Property, Plant and Equipment | | | | | | | | | | |
EDUCATION | | | | | | | | | | |
Amberley State School, New School by Relocation | | 05 | | 22,124 | | 2,453 | | 19,671 | | |
Atherton State High School, Tropical Tablelands Trade Training Centre | | 50 | | 6,201 | | | | 4,651 | | 1,550 |
Bayside Project, New Secondary School | | 05 | | 31,657 | | 6,728 | | 24,929 | | |
Bohlevale State School, Additional Amenities | | 45 | | 635 | | | | 550 | | 85 |
Bowen State High School, Additional Amenities | | 40 | | 592 | | 254 | | 338 | | |
Bremer State High School, State Schools of Tomorrow Renewal | | 05 | | 56,136 | | 3,617 | | 31,460 | | 21,059 |
Brisbane School of Distance Education, Redevelopment - Planning | | 05 | | 423 | | 42 | | 381 | | |
Brisbane State High School, Stages 2A and 2B - Performing Arts Centre | | 05 | | 8,287 | | 6,279 | | 2,008 | | |
Bundamba State School, State Schools of Tomorrow Renewal | | 05 | | 12,146 | | 4,045 | | 8,101 | | |
Bundamba State Secondary College, State Schools of Tomorrow Renewal | | 05 | | 16,234 | | 2,497 | | 13,737 | | |
Caboolture Special School, GLAB - 4 Spaces | | 05 | | 2,284 | | 84 | | 2,200 | | |
Calamvale Special School, Additional Amenities | | 05 | | 423 | | | | 423 | | |
Charleville State High School, Charleville Cluster Trade Training Centre | | 25 | | 1,650 | | | | 1,237 | | 413 |
Currimundi Special School, GLAB - 2 Storey - 4 Spaces - Open Under | | 09 | | 2,369 | | | | 2,369 | | |
| | | | |
| | | Capital Statement 2009 10 | | 45 |
Education and Training1,2,3,4,5,6
| | | | | | | | | | |
Project | | Statistical
Division | | Total
Estimated
Cost
$’000 | | Expenditure
to
30-06-09
$’000 | | Budget
2009-10
$’000 | | Post
2009-10
$’000 |
Dalby State High School, Surat Basin Trade Training Centre | | 20 | | 3,484 | | | | 2,613 | | 871 |
Darling Point Special School, State Schools of Tomorrow Renewal | | 05 | | 1,083 | | 138 | | 945 | | |
Durack State School, State Schools of Tomorrow Renewal | | 05 | | 11,484 | | 1,833 | | 9,651 | | |
Ferny Grove State High School, Additional Amenities | | 05 | | 508 | | 254 | | 254 | | |
Gilston State School, Administration Upgrade | | 07 | | 634 | | 351 | | 283 | | |
Glenala State High School, State Schools of Tomorrow Renewal | | 05 | | 13,905 | | 2,578 | | 11,327 | | |
Harristown State High School, Harristown Trade Training Centre | | 20 | | 1,150 | | | | 1,150 | | |
Heatley Secondary College, School Industry Trade Centre | | 45 | | 1,489 | | | | 1,489 | | |
Hervey Bay State High School, Additional Amenities | | 15 | | 423 | | | | 338 | | 85 |
Highfields State School, Multi Purpose Indoor Centre | | 20 | | 436 | | 2 | | 434 | | |
Inala State School, State Schools of Tomorrow Renewal | | 05 | | 11,216 | | 2,291 | | 8,925 | | |
Innisfail State High School, Learning Community | | 50 | | 32,189 | | 15,284 | | 16,905 | | |
Ithaca Creek State School, GLAB - 3 Storey - 8 Spaces - Open Under | | 05 | | 3,730 | | 3,233 | | 497 | | |
Kalbar State School, Replacement Blocks | | 12 | | 2,792 | | 271 | | 2,521 | | |
Kedron State High School, Sports Facility and Noise Mitigation | | 05 | | 3,807 | | 507 | | 3,300 | | |
Kenmore State High School, Stage 1 Redevelopment | | 05 | | 8,376 | | 711 | | 7,665 | | |
Kenmore State High School, Stage 2 Redevelopment - Planning | | 05 | | 423 | | | | 423 | | |
Kingaroy State High School, South Burnett Trade Training Centre | | 15 | | 3,560 | | | | 2,670 | | 890 |
Kowanyama State School, Pre-Prep Facility | | 50 | | 1,635 | | 1,279 | | 356 | | |
| | | | |
46 | | Capital Statement 2009 10 | | |
Education and Training1,2,3,4,5,6
| | | | | | | | | | |
Project | | Statistical
Division | | Total
Estimated
Cost
$’000 | | Expenditure
to
30-06-09
$’000 | | Budget
2009-10
$’000 | | Post
2009-10
$’000 |
Kuluin State School, Covered Sports Facility | | 09 | | 436 | | 2 | | 434 | | |
Lockhart State School, Pre-Prep Facility | | 50 | | 1,714 | | 1,342 | | 372 | | |
Lockyer District State High School, Lockyer District Trade Training Centre | | 12 | | 1,268 | | | | 951 | | 317 |
Longreach State High School, Outback Trade Training Centre | | 35 | | 2,350 | | | | 1,763 | | 587 |
Mackay North State High School, Mackay Technical College Trade Training Centre | | 40 | | 5,069 | | | | 3,800 | | 1,269 |
Mackay North State High School, School Industry Trade Centre | | 40 | | 1,489 | | | | 1,489 | | |
Manly State School, State Schools of Tomorrow Renewal | | 05 | | 8,685 | | 2,646 | | 6,039 | | |
Manly West State School, State Schools of Tomorrow Renewal | | 05 | | 8,196 | | 2,518 | | 5,678 | | |
Mansfield State High School, Additional Amenities | | 05 | | 592 | | 254 | | 338 | | |
Marsden State High School, Marsden Trade Training Centre | | 05 | | 1,147 | | | | 1,147 | | |
Maryborough State High School, Maryborough Trade Training Centre | | 15 | | 3,797 | | | | 2,538 | | 1,259 |
Meridan State College, Stage 3 | | 09 | | 14,789 | | 1,719 | | 13,070 | | |
Middle Ridge State School, Additional Amenities | | 20 | | 423 | | | | 423 | | |
Mitchelton Special School, Redevelopment | | 05 | | 4,486 | | 3,789 | | 697 | | |
Moggill State School, Multi Purpose Hall | | 05 | | 366 | | 1 | | 365 | | |
Morayfield State High School, Morayfield Trade Training Centre | | 05 | | 1,154 | | | | 1,154 | | |
Mornington Island State School, Pre-Prep Facility | | 55 | | 1,472 | | | | 1,472 | | |
Mountain Creek State High school, Additional Amenities | | 09 | | 635 | | 43 | | 592 | | |
| | | | |
| | | Capital Statement 2009 10 | | 47 |
Education and Training1,2,3,4,5,6
| | | | | | | | | | |
Project | | Statistical
Division | | Total
Estimated
Cost
$’000 | | Expenditure
to
30-06-09
$’000 | | Budget
2009-10
$’000 | | Post
2009-10
$’000 |
Mountain Creek State School, GLAB - 2 Space Special Education | | 09 | | 1,523 | | | | 1,523 | | |
Narangba Valley State School, Additional Amenities | | 05 | | 508 | | | | 508 | | |
Narangba Valley State School, GLAB - 2 Space Special Education | | 05 | | 1,523 | | 42 | | 1,481 | | |
Nebo State School. Additional Amenities | | 40 | | 611 | | 273 | | 338 | | |
Northern Peninsula Area College - Bamaga Junior Campus, Pre-Prep Facility | | 50 | | 1,604 | | 1,245 | | 359 | | |
Northern Peninsula Area College - Injinoo Junior, Pre-Prep Facility | | 50 | | 1,472 | | 54 | | 1,418 | | |
Oakey State High School, The Inner Downs Trade Training Centre | | 20 | | 1,528 | | | | 1,146 | | 382 |
Oonoonba State School, GLAB - 2 Spaces | | 45 | | 761 | | | | 761 | | |
Ormeau Woods State High School, Stage 2 - Planning | | 07 | | 3,334 | | | | 3,334 | | |
Palmwoods State School, Administration Block and Conversion of Old Administration to GLAs | | 09 | | 1,861 | | | | 1,861 | | |
Park Lake State School, Stage 2 | | 07 | | 3,723 | | | | 3,723 | | |
Redcliffe State High School, Redcliffe Peninsula Laboratory Skills Trade Training Centre | | 05 | | 1,097 | | | | 1,097 | | |
Redland Bay State School, Additional Amenities | | 05 | | 423 | | | | 338 | | 85 |
Richlands East State School, State Schools of Tomorrow Renewal | | 05 | | 10,537 | | 1,762 | | 8,775 | | |
Riverview State School, State Schools of Tomorrow Renewal | | 05 | | 7,639 | | 443 | | 7,196 | | |
Robina State High School, Rectification of Manual Arts Block | | 07 | | 423 | | 38 | | 385 | | |
| | | | |
48 | | Capital Statement 2009 10 | | |
Education and Training1,2,3,4,5,6
| | | | | | | | | | |
Project | | Statistical
Division | | Total
Estimated
Cost
$’000 | | Expenditure
to
30-06-09
$’000 | | Budget
2009-10
$’000 | | Post
2009-10
$’000 |
Rochedale State High School, Rochedale-Springwood Corridor Trade Training Centre | | 05 | | 1,167 | | | | 1,167 | | |
Rochedale State School, Administration Upgrade | | 05 | | 1,429 | | 752 | | 677 | | |
Rochedale State School, Oval and Associated Works | | 05 | | 1,064 | | 667 | | 397 | | |
Rockhampton State High School, Rockhampton Trade Training Centre | | 30 | | 1,269 | | | | 1,269 | | |
Serviceton South State School, State Schools of Tomorrow Renewal | | 05 | | 9,385 | | 1,536 | | 7,849 | | |
Silkstone State School, State Schools of Tomorrow Renewal | | 05 | | 15,814 | | 3,768 | | 12,046 | | |
Spinifex State College - Mount Isa - Senior Campus, North-West Queensland Trade Training Centre | | 55 | | 3,806 | | | | 2,854 | | 952 |
Stanthorpe State High School, Granite Border College Trade Training Centre | | 20 | | 3,492 | | | | 2,619 | | 873 |
Stretton State College, Secondary - Stage 3 - Planning | | 05 | | 846 | | | | 846 | | |
Tagai State College, Tagai Skills Trade Training Centre | | 50 | | 1,153 | | | | 1,153 | | |
Tagai State College - Badu Island Campus, Pre-Prep Facility | | 50 | | 1,731 | | 42 | | 1,689 | | |
Tagai State College - Saibai Island Campus, Pre-Prep Facility | | 50 | | 1,683 | | 1,047 | | 636 | | |
Tagai State College - Warraber Island Campus, Pre-Prep Facility | | 50 | | 1,503 | | 1,167 | | 336 | | |
Tagai State College - Yam Island Campus, Pre-Prep Facility | | 50 | | 845 | | 540 | | 305 | | |
The Gap State High School, Brisbane North-West Trade Training Centre | | 05 | | 3,501 | | | | 2,538 | | 963 |
Tingalpa State School, State Schools of Tomorrow Renewal | | 05 | | 6,660 | | 2,164 | | 4,496 | | |
| | | | |
| | | Capital Statement 2009 10 | | 49 |
Education and Training1,2,3,4,5,6
| | | | | | | | | | |
Project | | Statistical
Division | | Total
Estimated
Cost
$’000 | | Expenditure
to
30-06-09
$’000 | | Budget
2009-10
$’000 | | Post
2009-10
$’000 |
Tully State High School, Additional Amenities | | 50 | | 488 | | 4 | | 484 | | |
Tully State High School, Indoor Multi Purpose Courts | | 50 | | 508 | | | | 508 | | |
Varsity College, GLAB - 3 Storey - 8 Spaces | | 07 | | 2,961 | | 419 | | 2,542 | | |
Veresdale Scrub State School, Additional Amenities | | 12 | | 1,262 | | 507 | | 755 | | |
Veresdale Scrub State School, GLAB - 2 Spaces | | 12 | | 761 | | 42 | | 719 | | |
Western Cape College - Weipa, Stage 3 | | 50 | | 11,403 | | 3,033 | | 8,370 | | |
Western Suburbs State Special School, State Schools of Tomorrow Renewal | | 05 | | 4,432 | | 1,415 | | 3,017 | | |
Windsor State School, Additional Accommodation | | 05 | | 1,100 | | | | 1,100 | | |
Wondall Heights State School, State Schools of Tomorrow Renewal | | 05 | | 9,640 | | 2,623 | | 7,017 | | |
Woree State High School, School Industry Trade Centre | | 50 | | 1,692 | | | | 1,692 | | |
Woree State High School, Marine Technology Trade Training Centre | | 50 | | 1,692 | | | | 1,692 | | |
Wynnum North State High School, State Schools of Tomorrow Renewal | | 05 | | 28,297 | | 187 | | 19,203 | | 8,907 |
Wynnum State High School, State Schools of Tomorrow Renewal | | 05 | | 14,099 | | 279 | | 13,820 | | |
Wynnum West State School, State Schools of Tomorrow Renewal | | 05 | | 8,335 | | 2,287 | | 6,048 | | |
Xavier Special Education Program, Relocation | | 05 | | 4,230 | | 354 | | 3,876 | | |
Building the Education Revolution - National School Pride Program | | Various | | | | | | 12,899 | | Ongoing |
Building the Education Revolution - Primary Schools for the 21st Century | | Various | | | | | | 752,114 | | Ongoing |
| | | | |
50 | | Capital Statement 2009 10 | | |
Education and Training1,2,3,4,5,6
| | | | | | | | | | |
Project | | Statistical
Division | | Total
Estimated
Cost
$’000 | | Expenditure
to
30-06-09
$’000 | | Budget
2009-10
$’000 | | Post
2009-10
$’000 |
Building the Education Revolution - Secondary Schools for the 21st Century | | Various | | | | | | 117,215 | | Ongoing |
Employee Housing | | Various | | | | | | 9,307 | | Ongoing |
Energy Efficiency Initiatives | | Various | | | | | | 42,280 | | Ongoing |
General Works | | Various | | | | | | 108,910 | | Ongoing |
Land Acquisition | | Various | | | | | | 10,092 | | Ongoing |
Minor Works | | Various | | | | | | 5,193 | | Ongoing |
Tomorrow’s Schools - Round 2 | | Various | | | | | | 36,838 | | Ongoing |
Plant and equipment | | Various | | 35,975 | | | | 35,975 | | |
| | | | | | | | | | |
Sub-total EDUCATION | | | | | | | | 1,502,909 | | |
| | | | | | | | | | |
| | | | | |
TRAINING | | | | | | | | | | |
Barrier Reef Institute of TAFE - Townsville Stage II | | 45 | | 15,425 | | 2,788 | | 1,813 | | 10,824 |
Brisbane North Institute of TAFE - Grovely | | 05 | | 1,178 | | 432 | | 746 | | |
Central Queensland Institute of TAFE - Rockhampton | | 30 | | 8,814 | | 2,210 | | 6,604 | | |
Gold Coast Institute of TAFE - Coomera Education Precinct | | 07 | | 27,601 | | 544 | | 26,151 | | 906 |
Mackay Trade Training Campus | | 40 | | 41,780 | | 10,650 | | 10,876 | | 20,254 |
Metropolitan South Institute of TAFE - Loganlea Campus | | 05 | | 6,442 | | 2,719 | | 3,723 | | |
Metropolitan South Institute of TAFE - Mount Gravatt Stage II | | 05 | | 12,184 | | 1,197 | | 3,625 | | 7,362 |
SkillsTech Australia - Acacia Ridge Stage 2 | | 05 | | 48,804 | | 24,850 | | 17,850 | | 6,104 |
Sunshine Coast Institute of TAFE - Nambour | | 09 | | 11,155 | | 478 | | 8,228 | | 2,449 |
The Bremer Institute of TAFE - Redevelopment - Planning | | 05 | | 453 | | | | 453 | | |
Townsville Trade Training Campus | | 45 | | 32,055 | | 11,934 | | 20,121 | | |
Tropical North Institute of TAFE - Cairns | | 50 | | 26,102 | | 3,354 | | 5,644 | | 17,104 |
General Works | | 05 | | | | | | 11,964 | | Ongoing |
Minor Works | | Various | | | | | | 2,901 | | Ongoing |
Information Communication and Technology | | Various | | 10,938 | | | | 10,938 | | |
| | | | | | | | | | |
Sub-total TRAINING | | | | | | | | 131,637 | | |
| | | | | | | | | | |
| | | | |
| | | Capital Statement 2009 10 | | 51 |
Education and Training1,2,3,4,5,6
| | | | | | | | | | |
Project | | Statistical
Division | | Total
Estimated
Cost
$’000 | | Expenditure
to
30-06-09
$’000 | | Budget
2009-10
$’000 | | Post
2009-10
$’000 |
EARLY CHILDHOOD EDUCATION AND CARE | | | | | | | | | | |
Acacia Ridge, Early Childhood Education and Care Centre - Planning | | 05 | | 250 | | | | 250 | | |
Ayr State Preschool, Construction of Early Childhood Education Centre | | 45 | | 2,279 | | 1,481 | | 798 | | |
Beaudesert State Preschool, Construction of Early Childhood Education Centre | | 12 | | 2,429 | | 430 | | 1,999 | | |
Beenleigh State Preschool, Construction of Early Childhood Education Centre | | 07 | | 2,930 | | 1,131 | | 1,799 | | |
Browns plains, Construction of Early Years Centre | | 05 | | 3,460 | | 1,274 | | 2,186 | | |
Cairns, Early Years Centre - Planning | | 50 | | 250 | | | | 250 | | |
Nanango State Preschool, Construction of Early Childhood Education Centre | | 15 | | 2,320 | | 323 | | 1,997 | | |
The Gap Preschool, Early Childhood Education and Care Centre -Refurbishment | | 05 | | 800 | | | | 800 | | |
Toowoomba North State Preschool, Construction of Early Childhood Education Centre | | 20 | | 2,434 | | 1,637 | | 797 | | |
Construction of Kindergartens, Stages 1 and 2 | | Various | | 28,100 | | | | 15,430 | | 12,670 |
Indigenous Child and Family Centres | | Various | | 35,733 | | | | 3,800 | | 31,933 |
Early Learning and Care Centres | | 05 | | 2,485 | | | | 2,485 | | |
Minor Works | | 05 | | | | | | 720 | | Ongoing |
| | | | | | | | | | |
Sub-total EARLY CHILDHOOD EDUCATION AND CARE | | | | | | | | 33,311 | | |
| | | | | | | | | | |
| | | | | |
Other | | | | | | | | | | |
South East Queensland Schools PPP | | Various | | 232,275 | | | | 80,139 | | 152,136 |
| | | | | | | | | | |
Total Property, Plant and Equipment | | | | | | | | 1,747,996 | | |
| | | | | | | | | | |
| | | | |
52 | | Capital Statement 2009 10 | | |
Education and Training1,2,3,4,5,6
| | | | | | | | | | |
Project | | Statistical
Division | | Total
Estimated
Cost
$’000 | | Expenditure
to
30-06-09
$’000 | | Budget
2009-10
$’000 | | Post
2009-10
$’000 |
Capital Grants | | | | | | | | | | |
EDUCATION | | | | | | | | | | |
Capital Grants | | Various | | 72,848 | | | | 72,848 | | |
| | | | | | | | | | |
Sub-total EDUCATION | | | | | | | | 72,848 | | |
| | | | | | | | | | |
| | | | | |
TRAINING | | | | | | | | | | |
Australian Agricultural College Corporation | | Various | | | | | | 1,000 | | Ongoing |
Skills Centre Program | | Various | | | | | | 5,000 | | Ongoing |
South Bank Institute of Technology | | 05 | | 1,897 | | | | 1,897 | | |
Gold Coast Institute of TAFE | | 07 | | 3,338 | | | | 3,338 | | |
| | | | | | | | | | |
Sub-total TRAINING | | | | | | | | 11,235 | | |
| | | | | | | | | | |
| | | | | |
Total Capital Grants | | | | | | | | 84,083 | | |
| | | | | | | | | | |
| | | |
TOTAL DEPARTMENT OF EDUCATION AND TRAINING | | | | 1,832,079 | | |
| | | | | | | | | | |
| | | | | |
QUEENSLAND STUDIES AUTHORITY | | | | | | | | | | |
| | | | | |
Property, Plant and Equipment | | | | | | | | | | |
Other plant and equipment | | 05 | | | | | | 300 | | Ongoing |
| | | | | | | | | | |
Total Property, Plant and Equipment | | | | | | | | 300 | | |
| | | | | | | | | | |
| | | | | |
Other Capital Expenditure | | | | | | | | | | |
Other Software | | 05 | | 350 | | | | 350 | | |
Senior Learning Information Management System | | 05 | | 8,406 | | 7,828 | | 578 | | |
| | | | | | | | | | |
| | | | | |
Total Other Capital Expenditure | | | | | | | | 928 | | |
| | | | | | | | | | |
| | | | |
TOTAL QUEENSLAND STUDIES AUTHORITY | | | | | | 1,228 | | |
| | | | | | | | | | |
| | | | | |
CORPORATE AND PROFESSIONAL SERVICES | | | | | | | | | | |
Property, Plant and Equipment | | | | | | | | | | |
Property, plant and equipment | | 05 | | | | | | 262 | | Ongoing |
| | | | | | | | | | |
Total Property, Plant and Equipment | | | | | | | | 262 | | |
| | | | | | | | | | |
| | | |
TOTAL CORPORATE AND PROFESSIONAL SERVICES | | | | 262 | | |
| | | | | | | | | | |
| | | | |
| | | Capital Statement 2009 10 | | 53 |
Education and Training1,2,3,4,5,6
| | | | | | | | | | |
Project | | Statistical
Division | | Total
Estimated
Cost
$’000 | | Expenditure
to
30-06-09
$’000 | | Budget
2009-10
$’000 | | Post
2009-10
$’000 |
SOUTHBANK INSTITUTE OF TECHNOLOGY | | | | | | | | | | |
| | | | | |
Property, Plant and Equipment | | | | | | | | | | |
Information and communication technology | | 05 | | | | | | 835 | | Ongoing |
Other plant and equipment | | 05 | | | | | | 285 | | Ongoing |
| | | | | | | | | | |
| | | | | |
Total Property, Plant and Equipment | | | | | | | | 1,120 | | |
| | | | | | | | | | |
| | | | | |
TOTAL SOUTHBANK INSTITUTE OF TECHNOLOGY | | | | | | | | 1,120 | | |
| | | | | | | | | | |
| | | | | |
GOLD COAST INSTITUTE OF TAFE | | | | | | | | | | |
| | | | | |
Property, Plant and Equipment | | | | | | | | | | |
Information Communication & Technology | | 07 | | | | | | 367 | | Ongoing |
Other Plant & Equipment | | 07 | | | | | | 886 | | Ongoing |
Minor Capital Works | | 07 | | | | | | 1,311 | | Ongoing |
| | | | | | | | | | |
| | | | | |
Total Property, Plant and Equipment | | | | | | | | 2,564 | | |
| | | | | | | | | | |
| | | | | |
TOTAL GOLD COAST INSTITUTE OF TAFE | | | | | | | | 2,564 | | |
| | | | | | | | | | |
| | | | | |
TOTAL EDUCATION AND TRAINING | | | | | | | | 1,837,253 | | |
| | | | | | | | | | |
Notes:
| 1. | Education capital grants are distributed by non state entities throughout Queensland’s statistical divisions. |
| 2. | Project budgets listed in the table are in some cases indicative and are subject to refinement as projects are further developed. |
| 3. | Projects contained in the table have been included on the basis of projected enrolments. If projected enrolments do not eventuate, then listed projects may be deferred or stopped, or new projects added during the course of the financial year. |
| 4. | The amounts quoted in the above table reflect the estimated portion of project costs that will be capitalised. The amounts quoted in the program highlights, Service Delivery Statements and the Regional Budget Statements are the full financial costs of projects (i.e. they include some expensed items). |
| 5. | The Australian Government may also contribute funding for these projects. |
| 6. | Funds allocated to trade training centre projects are indicative and subject to Australian Government review and approval. |
| | | | |
54 | | Capital Statement 2009 10 | | |
ELECTORAL COMMISSION OF QUEENSLAND
An amount of $0.04 million is allocated towards the replacement of computers and photocopiers in 2009-10 to provide for the ongoing operational requirements associated with the efficient and effective provision of electoral services for the State of Queensland
Electoral Commission of Queensland
| | | | | | | | | | |
Project | | Statistical
Division | | Total
Estimated
Cost
$’000 | | Expenditure
to
30-06-09
$’000 | | Budget
2009-10
$’000 | | Post
2009-10
$’000 |
ELECTORAL COMMISSION OF QUEENSLAND | | | | | | | | | | |
| | | | | |
Property, Plant and Equipment | | | | | | | | | | |
Plant and equipment | | 05 | | | | | | 40 | | Ongoing |
| | | | | | | | | | |
| | | | | |
Total Property, Plant and Equipment | | | | | | | | 40 | | |
| | | | | | | | | | |
| | | | | |
TOTAL ELECTORAL COMMISSION OF QUEENSLAND | | | | | | | | 40 | | |
| | | | | | | | | | |
| | | | |
| | | Capital Statement 2009 10 | | 55 |
EMPLOYMENT, ECONOMIC DEVELOPMENT AND INNOVATION
Total capital outlay for 2009-10 for the Department of Economic Development and Innovation (DEEDI), including statutory bodies reporting to respective DEEDI Ministers and Energy Government-owned Corporations is $3.488 billion. A significant portion of this expenditure, some $3.206 billion will be spent state-wide on new energy infrastructure, systems upgrades and maintenance.
Primary Industries and Fisheries
Queensland Primary Industries and Fisheries (QPIF) capital expenditure program for 2009-10 is $33.4 million, which is primarily focussed on developing world class research facilities to deliver excellent scientific outcomes for primary industries and fisheries. QPIF has numerous facilities located throughout rural and regional Queensland. These require a significant level of minor works, and other plant and equipment upgrades to keep them operating effectively.
Program Highlights
| • | | $16.5 million has been allocated to the 2020 Beef Plan in 2009-10. 2020 Beef includes purchase of a new purpose-designed beef research property in North Queensland’s dry tropics, expected to carry 2,000 breeders, which will be one of Australia’s peak locations for projects to advance beef breeding. 2020 Beef will also include an upgrade of the Brian Pastures property near Gayndah (owned by AgForce and leased by the department) and co-location of the department with the Australian Agricultural College Corporation at its Berrigurra property at Blackwater. |
Forestry Plantations Queensland
The capital expenditure program for 2009-2010 is $13.6 million. This includes $5 million for the purchase of freehold land for hardwood plantation establishment, $3 million to construct buildings and land improvements, $2.3 million for the replacement of heavy plant and motor vehicles, $1.3 million for HR/Payroll system development, $1.1 million for roads and $0.9 million for other plant and equipment.
Australian Agricultural College Corporation
The key goal of the AACC is to be recognised as the preferred training provider for rural and related industries by 2012. Its capital expenditure program for 2009-2010 is $3.4 million.
| | | | |
56 | | Capital Statement 2009 10 | | |
Employment, Industry Development and Innovation
Capital expenditure of Employment, Industry Development and Innovation in 2009-10 is $213.4 million. The capital program is designed to provide innovation, direction and leadership to industry.
Program Highlights
| • | | $211.6 million to construct of the Ecosciences Precinct at Boggo Road and the Health and Food Sciences Precinct at Coopers Plains. Construction of the Health and Food Sciences Precinct is expected to be completed in early 2010 while the Ecosciences Precinct is expected to be completed in early 2011. |
Mines and Energy
The 2009-10 capital acquisition program of $15.1 million comprises expenditure to support the continuing development of the State’s minerals and energy industries including $4 million towards the completion of a new drill core storage facility at Mount Isa.
CS Energy Limited
A $186.8 million capital expenditure program is planned for 2009-10. This reflects the continued commitment to the ongoing reliability and efficiency of the plant and electricity supply.
Program Highlights
| • | | $56.8 million for improvements to the Callide Power Station including overhauls and major refurbishment work on Callide B as part of a mid-life refit. |
| • | | $39.6 million for improvements to the Swanbank Power Station including major overhauls. |
| • | | $54 million for efficiency enhancements to the Kogan Creek Power Station. |
| • | | $32.4 million for improvements to the Mica Creek Power Station including major overhauls. |
| | | | |
| | | Capital Statement 2009 10 | | 57 |
ENERGEX Limited
The ENERGEX Group’s total capital program of $1.044 billion is part of its commitment to providing a safe, secure and highly reliable, cost effective electricity delivery to its customers. The capital program will match the high growth in electricity usage largely attributable to population growth and increased use of lifestyle enhancing appliances, such as air conditioners. The regulated electricity capital expenditure component of the 2009-10 program is $936.9 million. This includes $564.5 million on the sub transmission system and $372.4 million on the distribution network.
Program Highlights
| • | | $15.4 million to establish a new electricity substation at Gympie to increase network capacity and reliability. |
| • | | $5.5 million to establish a new electricity substation at Buranda to cater for increased electricity network demand in the inner southern Brisbane suburbs. |
| • | | $3.2 million to upgrade electricity supplies between Loganlea and Jimboomba to increase network capacity and reliability. |
| • | | $8.6 million to improve electricity supplies between Coomera and Hope Island to cater for increased electricity demand in the northern Gold Coast area. |
| • | | $9.3 million to upgrade electricity supplies at the Bundamba electricity substation to increase network capacity. |
| • | | $7.4 million to upgrade electricity supplies from the Mudgeeraba substation to improve reliability and increase capacity. |
Stanwell Corporation Limited
Stanwell Corporation Limited’s expected capital expenditure for 2009-10 is $134.2 million. This relates to improving the assets at Stanwell, Barron Gorge and Kareeya and investment in potential upstream gas opportunities.
Program Highlights
| • | | $65.6 million for major overhauls and efficiency upgrades at Stanwell Power Station. |
| • | | $7.7 million investment in low nitrogen oxide burners at Stanwell Power Station to focus on emissions reductions. |
| • | | $6.1 million estimated investment in ongoing capital works at the Kareeya and Barron Gorge Hydro Power Stations. |
| | | | |
58 | | Capital Statement 2009 10 | | |
| • | | $8.1 million investment in the upgrade of information systems and infrastructure. |
| • | | $22.5 million investment in exploration and development of upstream gas supplies. |
Tarong Energy Corporation Limited
Tarong Energy’s capital expenditure program for 2009-10 is $224.4 million, which primarily relates to the Kunioon Project and maintaining operations at Tarong Power Station, Tarong North Power Station and Wivenhoe Power Station.
Program Highlights
| • | | $64.5 million on mine development to secure the fuel supply for the Tarong Power Stations. |
| • | | $56.2 million for instrumentation and control systems upgrade and overhaul expenditure, which includes a major overhaul of unit 4 at Tarong Power Station, major overhaul of units 1 and 2 at Wivenhoe Power Station and a mini overhaul at Tarong North Power Station. |
| • | | $9.4 million in relation to the mine void ash disposal project. |
| • | | $8.1 million in relation to low nitrogen oxide burners at the Tarong Power Station. |
Powerlink Queensland
Powerlink Queensland is the high voltage electricity transmission entity for Queensland. Powerlink Queensland’s budgeted capital expenditure for 2009-10 is $610.4 million.
Program Highlights
| • | | $110.5 million for construction of a 275kV transmission line between the existing Strathmore and Ross substations. This is the final stage of a three-stage $500 million program to reinforce high voltage electricity network between Central and North Queensland. |
| • | | $55.9 million towards establishing a new substation at Bowen North and constructing a 132kV transmission line between the new substation and the existing Strathmore Substation, catering for load growth in the Bowen region. |
| • | | $36.6 million to complete construction of a new 275/132kV substation at Larcom Creek and an 8.5km transmission line between Larcom Creek and a new substation at Yarwun, providing additional transmission capacity for the expansion of the Rio Tinto Aluminium Aluminia refinery at Yarwun and for future loads in the Gladstone State Development area. |
| | | | |
| | | Capital Statement 2009 10 | | 59 |
| • | | $9.7 million for the replacement of the 275/132kV Woolooga Substation, providing continued reliability of electricity supply to Gympie and the Fraser and North coasts. |
| • | | $24.6 million for construction of a 275kV transmission line between the existing South Pine Substation and ENERGEX’s Sandgate Substation, reinforcing high voltage electricity supply to north Brisbane. |
Ergon Energy Corporation Limited
Ergon Energy’s capital expenditure for 2009-10 of $1.007 billion includes a significant number of major projects which are primarily related to the electricity network and its associated infrastructure, with the objective of improving the quality of supply to domestic and commercial customers.
Program Highlights
| • | | $26 million for reinforcement of supply (customer initiated) to Dalyrmple Bay/Hay Point. |
| • | | $32 million for reinforcement of supply to North Mackay (Glenella). |
| • | | $28 million for reinforcement of supply to Townsville (Belgian Gardens and Oonoonba). |
| • | | $10 million for reinforcement of supply to North Rockhampton (Berserker). |
| • | | $13 million for reinforcement of supply to Burdekin area (Clare). |
| • | | $8 million for reinforcement of supply to Townsville (Black River). |
| • | | $15 million for reinforcement of supply to Airlie Beach. |
| • | | $10 million for reinforcement of supply to Capricorn Coast (Tanby). |
| • | | $21 million for reinforcement of supply to Dalby. |
| • | | $10 million for reinforcement of connection (customer initiated) to Arrow Energy Limited’s generator at Kogan. |
| | | | |
60 | | Capital Statement 2009 10 | | |
Tourism, Fair Trading and Office of Liquor, Gaming and Racing
The total capital expenditure program for Tourism, Fair Trading and the Office of Liquor, Gaming and Racing in 2009-10 will be $1.9 million.
Program Highlights
| • | | $0.82 million to be allocated to the Data Requirements 3 project involving a review of the current data requirement standards and development of a new standard capable of meeting the current and future electronic data exchange needs of the Office of Liquor, Gaming and Racing and its external clients. |
| • | | $0.5 million to be allocated to the Online Services project involving the development of online services for the use of the Office of Liquor, Gaming and Racing’s external clients and provides an intergrated interface with the Office’s existing Corporate Office of Gaming Systems enterprise information system. |
Tourism Queensland
Tourism Queensland’s 2009-10 capital budget is $0.52 million. This funding will be used for information technology hardware and software upgrades.
Employment, Economic Development and Innovation
| | | | | | | | | | |
Project | | Statistical
Division | | Total
Estimated
Cost
$’000 | | Expenditure
to
30-06-09
$’000 | | Budget
2009-10
$’000 | | Post
2009-10
$’000 |
PRIMARY INDUSTRIES AND FISHERIES | | | | | | | | | | |
| | | | | |
Property, Plant and Equipment | | | | | | | | | | |
2020 Beef Plan | | 45 | | 17,500 | | | | 16,500 | | 1,000 |
Relocation of Tick Fever Herd | | 20 | | 2,380 | | 1,635 | | 745 | | |
Relocation and refurbishment | | Various | | | | | | 400 | | Ongoing |
Research facilities development | | Various | | | | | | 1,500 | | Ongoing |
Vessel replacement | | Various | | | | | | 1,500 | | Ongoing |
Heavy plant and equipment | | Various | | | | | | 600 | | Ongoing |
Minor works | | Various | | | | | | 500 | | Ongoing |
Other plant and equipment | | Various | | | | | | 4,485 | | Ongoing |
| | | | | | | | | | |
Total Property, Plant and Equipment | | | | | | | | 26,230 | | |
| | | | | |
Other Capital Expenditure | | | | | | | | | | |
Intangible assets | | 05 | | | | | | 398 | | Ongoing |
| | | | |
| | | Capital Statement 2009 10 | | 61 |
Employment, Economic Development and Innovation
| | | | | | | | | | |
Project | | Statistical
Division | | Total
Estimated
Cost
$’000 | | Expenditure
to
30-06-09
$’000 | | Budget
2009-10
$’000 | | Post
2009-10
$’000 |
Other projects | | Various | | | | | | 450 | | Ongoing |
| | | | | | | | | | |
Total Other Capital Expenditure | | | | | | | | 848 | | |
| | | | | | | | | | |
| | | | | |
Capital Grants | | | | | | | | | | |
RSPCA facility | | 05 | | 10,000 | | 3,665 | | 6,335 | | |
| | | | | | | | | | |
Total Capital Grants | | | | | | | | 6,335 | | |
| | | | | | | | | | |
| | | |
TOTAL PRIMARY INDUSTRIES AND FISHERIES | | | | 33,413 | | |
| | | | | | | | | | |
| | | | | |
FORESTRY PLANTATIONS QUEENSLAND | | | | | | | | | | |
| | | | | |
Property, Plant and Equipment | | | | | | | | | | |
Roads | | Various | | | | | | 1,104 | | Ongoing |
Buildings & Land Improvements | | Various | | | | | | 3,012 | | Ongoing |
Land | | Various | | | | | | 5,000 | | Ongoing |
Heavy plant and motor vehicles | | Various | | | | | | 2,316 | | Ongoing |
Computer equipment | | Various | | | | | | 352 | | Ongoing |
Other plant and equipment | | Various | | | | | | 503 | | Ongoing |
| | | | | | | | | | |
Total Property, Plant and Equipment | | | | | | | | 12,287 | | |
| | | | | | | | | | |
| | | | | |
Other Capital Expenditure | | | | | | | | | | |
HR/Payroll System Development | | 05 | | 1,280 | | | | 1,280 | | |
| | | | | | | | | | |
Total Other Capital Expenditure | | | | | | | | 1,280 | | |
| | | | | | | | | | |
| | | |
TOTAL FORESTRY PLANTATIONS QUEENSLAND | | | | 13,567 | | |
| | | | | | | | | | |
| | | | | |
QRAA | | | | | | | | | | |
| | | | | |
Property, Plant and Equipment | | | | | | | | | | |
Computer equipment | | 05 | | | | | | 450 | | Ongoing |
| | | | | | | | | | |
Total Property, Plant and Equipment | | | | | | | | 450 | | |
| | | | | | | | | | |
| | | | | |
TOTAL QRAA | | | | | | | | 450 | | |
| | | | | | | | | | |
| | | | | |
AUSTRALIAN AGRICULTURAL COLLEGE CORPORATION | | | | | | | | | | |
| | | | | |
Property, Plant and Equipment | | | | | | | | | | |
Property Plant & Equipment | | Various | | | | | | 3,363 | | Ongoing |
| | | | | | | | | | |
Total Property, Plant and Equipment | | | | | | | | 3,363 | | |
| | | | |
62 | | Capital Statement 2009 10 | | |
Employment, Economic Development and Innovation
| | | | | | | | | | |
Project | | Statistical
Division | | Total
Estimated
Cost
$’000 | | Expenditure
to
30-06-09
$’000 | | Budget
2009-10
$’000 | | Post
2009-10
$’000 |
Other Capital Expenditure | | | | | | | | | | |
Minor Equipment | | Various | | | | | | 2 | | Ongoing |
| | | | | | | | | | |
Total Other Capital Expenditure | | | | | | | | 2 | | |
| | | | | | | | | | |
TOTAL AUSTRALIAN AGRICULTURAL COLLEGE CORPORATION | | | | | | | | 3,365 | | |
| | | | | | | | | | |
| | | | | |
EMPLOYMENT, INDUSTRY DEVELOPMENT AND INNOVATION | | | | | | | | | | |
| | | | | |
Property, Plant and Equipment | | | | | | | | | | |
Ecosciences Precinct at Boggo Road and the Health and Food Sciences Precinct at Coopers Plains | | 05 | | 377,900 | | 134,726 | | 211,627 | | 31,547 |
Other acquisitions of property, plant and equipment | | Various | | | | | | 807 | | Ongoing |
| | | | | | | | | | |
Total Property, Plant and Equipment | | | | | | | | 212,434 | | |
| | | | | | | | | | |
| | | | | |
Other Capital Expenditure | | | | | | | | | | |
Other intangible assets | | Various | | | | | | 226 | | Ongoing |
| | | | | | | | | | |
Total Other Capital Expenditure | | | | | | | | 226 | | |
| | | | | | | | | | |
| | | | | |
Capital Grants | | | | | | | | | | |
Other capital grants | | Various | | 1,523 | | 783 | | 740 | | |
| | | | | | | | | | |
Total Capital Grants | | | | | | | | 740 | | |
| | | | | | | | | | |
TOTAL EMPLOYMENT, INDUSTRY DEVELOPMENT AND INNOVATION | | | | | | | | 213,400 | | |
| | | | | | | | | | |
| | | | | |
MINES AND ENERGY | | | | | | | | | | |
| | | | | |
Property, Plant and Equipment | | | | | | | | | | |
Abandoned Mines | | 30 | | 6,394 | | 3,394 | | 3,000 | | |
Building and Accommodation upgrades | | | | | | | | | | |
Drill Core Facility | | 55 | | 4,788 | | 780 | | 4,008 | | |
Minor works | | Various | | | | | | 2,583 | | Ongoing |
Plant and equipment - general | | Various | | | | | | 4,663 | | Ongoing |
| | | | | | | | | | |
Total Property, Plant and Equipment | | | | | | | | 14,254 | | |
| | | | | | | | | | |
| | | | | |
Other Capital Expenditure | | | | | | | | | | |
Systems Software | | 05 | | 830 | | | | 830 | | |
| | | | | | | | | | |
Total Other Capital Expenditure | | | | | | | | 830 | | |
| | | | | | | | | | |
TOTAL MINES AND ENERGY | | | | | | | | 15,084 | | |
| | | | | | | | | | |
| | | | |
| | | Capital Statement 2009 10 | | 63 |
Employment, Economic Development and Innovation
| | | | | | | | | | |
Project | | Statistical
Division | | Total
Estimated
Cost
$’000 | | Expenditure
to
30-06-09
$’000 | | Budget
2009-10
$’000 | | Post
2009-10
$’000 |
CS ENERGY LIMITED | | | | | | | | | | |
| | | | | |
Property, Plant and Equipment | | | | | | | | | | |
Callide Power Station for overhaul and major refurbishment | | 30 | | | | | | 56,803 | | Ongoing |
Swanbank Power Station for major overhaul and improvements | | 05 | | | | | | 39,607 | | Ongoing |
Kogan Creek Power Station for efficiency enhancements | | 20 | | | | | | 53,998 | | Ongoing |
Mica Creek Power Station for major overhaul | | 55 | | | | | | 32,359 | | Ongoing |
Corporate | | 05 | | | | | | 4,048 | | Ongoing |
| | | | | | | | | | |
Total Property, Plant and Equipment | | | | | | | | 186,815 | | |
| | | | | | | | | | |
TOTAL CS ENERGY LIMITED | | | | | | | | 186,815 | | |
| | | | | | | | | | |
| | | | | |
ENERGEX LIMITED | | | | | | | | | | |
| | | | | |
Property, Plant and Equipment | | | | | | | | | | |
Distribution augmentation | | | | | | | | | | |
Distribution Augmentation - Brisbane | | 05 | | | | | | 211,893 | | Ongoing |
Establish a new substation at Gympie to increase network capacity and reliability | | 15 | | 15,415 | | | | 15,415 | | |
Distribution Augmentation - West Moreton | | 12 | | 20,950 | | | | 20,950 | | |
Distribution Augmentation - Wide Bay Burnett | | 15 | | 4,664 | | | | 4,664 | | |
Distribution Augmentation - Gold Coast | | 07 | | 39,278 | | | | 39,278 | | |
Distribution Augmentation - Sunshine Coast | | 09 | | 40,973 | | | | 40,973 | | |
Upgrade electricity supplies between Loganlea and Jimboomba | | 05 | | | | | | 3,244 | | Ongoing |
Extension of electricity substation at Taringa | | 05 | | | | | | 2,388 | | Ongoing |
Establish a new substation at Buranda | | 05 | | | | | | 5,494 | | Ongoing |
Improve electricity supply between Coomera and Hope Island | | 07 | | | | | | 8,565 | | Ongoing |
| | | | |
64 | | Capital Statement 2009 10 | | |
Employment, Economic Development and Innovation
| | | | | | | | | | |
Project | | Statistical
Division | | Total
Estimated
Cost
$’000 | | Expenditure
to
30-06-09
$’000 | | Budget
2009-10
$’000 | | Post
2009-10
$’000 |
Upgrade electricity supply from Mudgerraba substation to improve reliability | | 07 | | | | | | 7,420 | | Ongoing |
Upgrade electricity supply at the Bundamba substation to increase network capacity | | 05 | | 10,198 | | 924 | | 9,274 | | |
Complete electricity substation at Esk to improve network capacity and reliability | | 12 | | 6,440 | | 4,602 | | 1,838 | | |
Establish a new substation at Yandina to improve network reliability and capacity | | 09 | | 5,213 | | 4,210 | | 1,003 | | |
| | | | | | | | | | |
Sub-total Distribution augmentation | | | | | | | | 372,399 | | |
| | | | | | | | | | |
| | | | | |
Sub transmission program | | | | | | | | | | |
Sub Transmission - Brisbane | | 05 | | 607,811 | | 139,761 | | 391,036 | | 77,014 |
Sub Transmission - Gold Coast | | 07 | | 165,365 | | 45,491 | | 108,290 | | 11,584 |
Sub Transmission - West Moreton | | 12 | | 10,356 | | 4,889 | | 5,458 | | 9 |
Sub Transmission - Wide Bay Burnett | | 15 | | 64,075 | | 5,350 | | 52,950 | | 5,775 |
Sub Transmission - Sunshine Coast | | 09 | | 25,220 | | 18,471 | | 6,749 | | |
Other sub transmission works | | | | | | | | | | |
| | | | | | | | | | |
Sub-total Sub transmission program | | | | | | | | 564,483 | | |
| | | | | | | | | | |
| | | | | |
Non system | | | | | | | | | | |
Non Construction Capital | | 05 | | 2,302 | | | | 2,302 | | |
Newstead Project | | 05 | | | | | | 34,185 | | Ongoing |
Toowoomba | | 20 | | 6,647 | | 500 | | 6,147 | | |
Miscellaneous Property | | 05 | | 13,014 | | | | 13,014 | | |
Computer Hardware | | 05 | | 1,531 | | | | 1,531 | | |
Miscellaneous Capital | | 05 | | 20 | | | | 20 | | |
Other Generations | | 05 | | 5,240 | | | | 5,240 | | |
Metering Dynamics | | 05 | | 4,200 | | | | 4,200 | | |
Procurement Services Group - Fleet | | 05 | | 27,561 | | | | 27,561 | | |
Procurement Services Group - Other Property, Plant & Equipment | | 05 | | 9,362 | | | | 9,362 | | |
Computer Software | | 05 | | 3,092 | | | | 3,092 | | |
| | | | |
| | | Capital Statement 2009 10 | | 65 |
Employment, Economic Development and Innovation
| | | | | | | | | | |
Project | | Statistical
Division | | Total
Estimated
Cost
$’000 | | Expenditure
to
30-06-09
$’000 | | Budget
2009-10
$’000 | | Post
2009-10
$’000 |
Sub-total Non system | | | | | | | | 106,654 | | |
| | | | | | | | | | |
Total Property, Plant and Equipment | | | | | | | | 1,043,536 | | |
| | | | | | | | | | |
TOTAL ENERGEX LIMITED | | | | | | | | 1,043,536 | | |
| | | | | | | | | | |
| | | | | |
STANWELL CORPORATION LIMITED | | | | | | | | | | |
| | | | | |
Property, Plant and Equipment | | | | | | | | | | |
Kareeya | | | | | | | | | | |
Kareeya Power Station Minor Works | | 50 | | | | | | 1,935 | | Ongoing |
Barron Gorge | | | | | | | | | | |
Barron Gorge Power Station Coolers | | 50 | | 170 | | 110 | | 60 | | |
Barron Gorge - Generator Rewinds | | 50 | | 7,133 | | 104 | | 3,743 | | 3,286 |
Barron Gorge Power Station Minor Works | | 50 | | | | | | 360 | | Ongoing |
Stanwell Power Station | | | | | | | | | | |
Stanwell Power Station - Ash Storage Area Extension | | 30 | | 16,721 | | 580 | | 14,079 | | 2,062 |
Stanwell Power Station Unit Overhauls | | 30 | | | | | | 21,800 | | Ongoing |
Stanwell Power Station - Low Pressure Turbine and Generator Upgrade | | 30 | | 90,083 | | 35,584 | | 21,124 | | 33,375 |
Stanwell Power Station - Low nitrogen oxide burners | | 30 | | 35,775 | | 2,872 | | 7,697 | | 25,206 |
Stanwell Power Station Minor Works | | 30 | | | | | | 8,640 | | Ongoing |
Corporate and Other Business Development | | Various | | | | | | 32,255 | | Ongoing |
Exploration and development of upstream gas supplies | | 20 | | | | | | 22,500 | | Ongoing |
| | | | | | | | | | |
Total Property, Plant and Equipment | | | | | | | | 134,193 | | |
| | | | | | | | | | |
TOTAL STANWELL CORPORATION LIMITED | | | | | | | | 134,193 | | |
| | | | | | | | | | |
| | | | | |
TARONG ENERGY CORPORATION LIMITED | | | | | | | | | | |
| | | | | |
Property, Plant and Equipment | | | | | | | | | | |
Brisbane | | | | | | | | | | |
Information Services enhancements and initiatives | | 05 | | | | | | 8,769 | | Ongoing |
| | | | |
66 | | Capital Statement 2009 10 | | |
Employment, Economic Development and Innovation
| | | | | | | | | | |
Project | | Statistical
Division | | Total
Estimated
Cost
$’000 | | Expenditure
to
30-06-09
$’000 | | Budget
2009-10
$’000 | | Post
2009-10
$’000 |
Various business development initiatives | | 05 | | | | | | 25,081 | | Ongoing |
Corporate Capital Works | | 05 | | 6,600 | | 3,700 | | 2,900 | | |
Tarong Power Station | | | | | | | | | | |
Glen Wilga review | | 15 | | | | | | 7,777 | | Ongoing |
Instrumentation and control system refit - Tarong Power Station | | 15 | | 41,400 | | 19,130 | | 13,837 | | 8,433 |
Kunioon mine | | 15 | | 1,018,670 | | 61,486 | | 64,520 | | 892,664 |
Low nitrogen oxide burners | | 15 | | 27,168 | | 15,469 | | 8,106 | | 3,593 |
Mine void ash disposal project | | 15 | | 31,386 | | 21,966 | | 9,420 | | |
Other capital projects | | 15 | | | | | | 35,802 | | Ongoing |
Overhauls | | 15 | | | | | | 18,807 | | Ongoing |
| | | | | | | | | | |
Sub-total Tarong Power Station | | | | | | | | 158,269 | | |
| | | | | | | | | | |
| | | | | |
Wivenhoe Power Station | | | | | | | | | | |
Minor Works-Wivenhoe Power Station | | 20 | | | | | | 288 | | Ongoing |
Other capital projects-Wivenhoe Power Station | | 20 | | 5,051 | | 25 | | 4,617 | | 409 |
Major overhaul and control system refit | | 20 | | | | | | 18,936 | | Ongoing |
| | | | | | | | | | |
Sub-total Wivenhoe Power Station | | | | | | | | 23,841 | | |
| | | | | | | | | | |
| | | | | |
Tarong North Power Station | | | | | | | | | | |
Major overhaul - Tarong North Power Station | | 15 | | | | | | 4,425 | | Ongoing |
Other capital projects - Tarong North Power Station | | 15 | | | | | | 1,139 | | Ongoing |
| | | | | | | | | | |
Sub-total Tarong North Power Station | | | | | | | | 5,564 | | |
| | | | | | | | | | |
Total Property, Plant and Equipment | | | | | | | | 224,424 | | |
| | | | | | | | | | |
TOTAL TARONG ENERGY CORPORATION LIMITED | | | | | | | | 224,424 | | |
| | | | | | | | | | |
| | | | | |
POWERLINK QUEENSLAND | | | | | | | | | | |
| | | | | |
Property, Plant and Equipment | | | | | | | | | | |
Yabulu South to Ingham Transmission Replacement (Ross to Ingham) | | 45 | | 107,000 | | 3,000 | | 12,000 | | 92,000 |
| | | | |
| | | Capital Statement 2009 10 | | 67 |
Employment, Economic Development and Innovation
| | | | | | | | | | |
Project | | Statistical
Division | | Total
Estimated
Cost
$’000 | | Expenditure
to
30-06-09
$’000 | | Budget
2009-10
$’000 | | Post
2009-10
$’000 |
Woolooga 275/132kV Substation Replacement | | 15 | | 36,900 | | 27,200 | | 9,700 | | |
Tarong Secondary Systems Replacement | | 15 | | 24,500 | | 5,200 | | 8,000 | | 11,300 |
Swanbank A 110 kV Substation Rebuild | | 05 | | 34,400 | | 3,600 | | 20,000 | | 10,800 |
Clare Substation Rebuild | | 45 | | 31,400 | | 23,400 | | 7,100 | | 900 |
North Qld Transmission Reinforcement (Nebo to Strathmore) - Stage 2 | | 40 | | 145,400 | | 129,400 | | 16,000 | | |
South Pine 110kV Substation Refurbishment - Stage 1 | | 05 | | 63,000 | | 44,700 | | 15,500 | | 2,800 |
Innisfail - Edmonton Line Replacement | | 50 | | 94,700 | | 91,000 | | 3,700 | | |
Belmont 110kV Substation Refurbishment | | 05 | | 50,300 | | 13,500 | | 12,700 | | 24,100 |
Pandoin Substation Establishment | | 30 | | 44,100 | | 28,400 | | 15,700 | | |
Bowen Substation Establishment | | 40 | | 83,000 | | 9,100 | | 55,900 | | 18,000 |
South Pine - Sandgate 275kV Transmission | | 05 | | 57,900 | | 33,300 | | 24,600 | | |
Bouldercombe to South Pine Earthwire Replacement | | Various | | 35,400 | | 12,400 | | 8,100 | | 14,900 |
North Qld Transmission Reinforcement (Strathmore to Ross) - Stage 3 | | 45 | | 218,000 | | 56,400 | | 110,500 | | 51,100 |
Larcom Creek 275/132kV Substation Establishment | | 30 | | 74,300 | | 37,600 | | 36,600 | | 100 |
Other Projects | | Various | | 254,300 | | | | 254,300 | | |
| | | | | | | | | | |
Total Property, Plant and Equipment | | | | | | | | 610,400 | | |
| | | | | | | | | | |
| | | | | |
TOTAL POWERLINK QUEENSLAND | | | | | | | | 610,400 | | |
| | | | | | | | | | |
| | | | | |
ERGON ENERGY CORPORATION LIMITED | | | | | | | | | | |
| | | | | |
Property, Plant and Equipment | | | | | | | | | | |
System Related Corporation Initiated Works Reinforce Supply to Townsville (Black River) | | 45 | | 20,000 | | 12,000 | | 8,000 | | |
Reinforce Supply to Townsville (Belgian Gardens and Oonoonba) | | 45 | | 66,800 | | 27,000 | | 28,000 | | 11,800 |
| | | | |
68 | | Capital Statement 2009 10 | | |
Employment, Economic Development and Innovation
| | | | | | | | | | |
Project | | Statistical
Division | | Total
Estimated
Cost
$’000 | | Expenditure
to
30-06-09
$’000 | | Budget
2009-10
$’000 | | Post
2009-10
$’000 |
Reinforce Supply to North Queensland (undergrounding power lines) | | 45 | | 6,000 | | 1,000 | | 5,000 | | |
Reinforce Supply to Burdekin (Clare) | | 45 | | 20,000 | | 7,000 | | 13,000 | | |
Reinforce Supply to North Mackay (Glenella) | | 40 | | 114,000 | | 52,000 | | 32,000 | | 30,000 |
Reinforce Supply to Airlie Beach | | 40 | | 28,000 | | 13,000 | | 15,000 | | |
Reinforce Supply to North Rockhampton (Berserker) | | 30 | | 28,000 | | 14,000 | | 10,000 | | 4,000 |
Reinforce Supply to Capricorn Coast (Tanby) | | 30 | | 23,000 | | 10,000 | | 10,000 | | 3,000 |
Reinforce Supply to Bundaberg | | 15 | | 28,000 | | 19,000 | | 9,000 | | |
Reinforce Supply to North Burnett (Munduberra) | | 15 | | 21,000 | | 13,000 | | 5,000 | | 3,000 |
Reinforce Supply to North Burnett (Gayndah) | | 15 | | 21,000 | | 16,000 | | 5,000 | | |
Reinforce Supply to Dalby | | 20 | | 62,000 | | 29,000 | | 21,000 | | 12,000 |
Reinforce Roma Bulk Supply | | 25 | | 40,000 | | 7,000 | | 8,000 | | 25,000 |
Reinforce Supply to Birdsville | | 25 | | 13,000 | | | | 9,000 | | 4,000 |
Other Corporation Initiated Works Far North Queensland including substation at El Arish | | 50 | | 17,000 | | | | 17,000 | | |
Far North Queensland | | 50 | | 40,000 | | | | 40,000 | | |
| | | | | | | | | | |
Sub-total Other Corporation Initiated Works | | | | | | | | 57,000 | | |
| | | | | | | | | | |
Sundry Corporation Initiated Works | | Various | | | | | | 366,000 | | |
| | | | | | | | | | |
Sub-total Corporation Initiated Works | | | | 366,000 | | | | 601,000 | | |
| | | | | | | | | | |
| | | | | |
Isolated Systems | | | | | | | | | | |
Power station upgrades on Cape York Peninsula and Torres Strait Islands | | 50 | | 11,000 | | | | 11,000 | | |
Power station upgrades at remote communities on Cape York Peninsula and Torres Strait Islands, including Mapoon and Kowanyama | | 50 | | 16,000 | | 4,000 | | 8,000 | | 4,000 |
| | | | | | | | | | |
Sub-total Isolated Systems | | | | | | | | 19,000 | | |
| | | | | | | | | | |
| | | | |
| | | Capital Statement 2009 10 | | 69 |
Employment, Economic Development and Innovation
| | | | | | | | | | |
Project | | Statistical
Division | | Total
Estimated
Cost
$’000 | | Expenditure
to
30-06-09
$’000 | | Budget
2009-10
$’000 | | Post
2009-10
$’000 |
Customer Initiated Works | | | | | | | | | | |
Major Customer - Dalrymple Bay / Hay point | | 40 | | 64,000 | | 38,000 | | 26,000 | | |
Major Customer - Arrow Generator connection at Kogan | | 20 | | 34,000 | | 24,000 | | 10,000 | | |
Major Customer - Queensland Gas Company Miles Generator connection | | 20 | | 34,000 | | 27,000 | | 7,000 | | |
Other Customer Initiated Works Customer Initiated - Far North Queensland | | 50 | | 40,000 | | | | 40,000 | | |
Sundry Customer Initiated | | Various | | 222,000 | | | | 222,000 | | |
| | | | | | | | | | |
Sub-total System Related | | | | | | | | 925,000 | | |
| | | | | | | | | | |
| | | | | |
Other Regulated Asset Additions Sundry other regulated | | Various | | 81,600 | | | | 81,600 | | |
| | | | | | | | | | |
Sub-total Other Regulated Asset Additions | | | | | | | | 81,600 | | |
| | | | | | | | | | |
| | | | | |
Non-Regulated Asset Additions Sundry non-regulated asset additions | | 45 | | 200 | | | | 200 | | |
| | | | | | | | | | |
Sub-total Non-Regulated Asset Additions | | | | | | | | 200 | | |
| | | | | | | | | | |
| | | | | |
Total Property, Plant and Equipment | | | | | | | | 1,006,800 | | |
| | | | | | | | | | |
| | | |
TOTAL ERGON ENERGY CORPORATION LIMITED | | | | 1,006,800 | | |
| | | | | | | | | | |
| |
TOURISM, FAIR TRADING AND OFFICE OF LIQUOR, GAMING AND RACING | | |
| | | | | |
Property, Plant and Equipment | | | | | | | | | | |
Other Plant and Equipment | | 05 | | | | | | 562 | | Ongoing |
| | | | | | | | | | |
| | | | | |
Total Property, Plant and Equipment | | | | | | | | 562 | | |
| | | | | | | | | | |
| | | | | |
Other Capital Expenditure | | | | | | | | | | |
Online Services | | 05 | | 500 | | | | 500 | | |
Data Requirements 3 | | 05 | | 820 | | | | 820 | | |
| | | | | | | | | | |
| | | | | |
Total Other Capital Expenditure | | | | | | | | 1,320 | | |
| | | | | | | | | | |
| | |
TOTAL TOURISM, FAIR TRADING AND OFFICE OF LIQUOR, GAMING AND RACING | | 1,882 | | |
| | | | | | | | | | |
| | | | |
70 | | Capital Statement 2009 10 | | |
Employment, Economic Development and Innovation
| | | | | | | | | | |
Project | | Statistical
Division | | Total
Estimated
Cost
$’000 | | Expenditure
to
30-06-09
$’000 | | Budget
2009-10
$’000 | | Post
2009-10
$’000 |
TOURISM QUEENSLAND | | | | | | | | | | |
| | | | | |
Other Capital Expenditure | | | | | | | | | | |
BI and Budget modules for Finance One | | 05 | | 120 | | | | 120 | | |
Transition standard operating environment | | 05 | | 200 | | | | 200 | | |
Upgrade external systems including international websites | | 05 | | 200 | | | | 200 | | |
| | | | | | | | | | |
| | | | | |
Total Other Capital Expenditure | | | | | | | | 520 | | |
| | | | | | | | | | |
| | | | | |
TOTAL TOURISM QUEENSLAND | | | | | | | | 520 | | |
| | | | | | | | | | |
| | |
TOTAL EMPLOYMENT, ECONOMIC DEVELOPMENT AND INNOVATION | | 3,487,849 | | |
| | | | | | | | | | |
| | | | |
| | | Capital Statement 2009 10 | | 71 |
ENVIRONMENT AND RESOURCE MANAGEMENT
The capital program for the Department of Environment and Resource Management (including the department, Queensland Bulk Water Supply Authority, Queensland Bulk Water Transport Authority, Queensland Manufactured Water Authority, SEQ Water Grid Manager, SunWater, Gladstone Area Water Board and Mount Isa Water Board) for 2009-10 is $595.5 million. The department’s 2009-10 capital program principally supports the planning and management of the State’s water, land and vegetation resources and protection of Queensland’s natural and cultural heritage.
Natural Resources and Water
The 2009-10 capital budget for Natural Resources and Water is $68.5 million and demonstrates the Government’s commitment to the Toward Q2 Strong Ambition.
Program Highlights
| • | | The acquisition of land for future water infrastructure projects will continue with $42 million set aside in 2009-10 for strategic land purchases relating to Nathan and Connors River dams. |
| • | | The program of dam spillway upgrades will continue in 2009-10 with $4.9 million provided for capital works at Crooks and Wyndham dams. |
Environmental Protection
The 2009-10 capital budget for Environmental Protection is $33 million and provides for the continuing protection of Queensland’s natural and cultural heritage and demonstrates the Government’s commitment to the Toward Q2 Green Ambition.
Program Highlights
| • | | $15.4 million has been allocated for infrastructure on parks and forests as well as administrative building works. Of this, $12.6 million relates to parks and forests, $1.2 million relates to the More Great Walks program and $1.7 million relates to the administrative building works program. |
| • | | A further $10 million is committed in 2009-10 for land acquisitions relating to the 2006 election commitment to the purchase of rainforest and green land. |
| • | | $1.2 million has been allocated for a feasibility study for a new Great Walk from the Daintree River to the tip of Cape York Peninsula. |
| | | | |
72 | | Capital Statement 2009 10 | | |
Water Boards
The Gladstone Area Water Board’s capital budget is $15.4 million for 2009-10. Major projects include $3.3 million for the transition and management stage of the Gladstone-Fitzroy Pipeline project, $2.4 million for the Lower Fitzroy River Weirs planning project and $1 million to fluoridate potable water in the Gladstone Water Supply network.
The Mount Isa Water Board’s capital budget is $5.5 million for 2009-10 and includes $2.5 million for Stage 2 of the Lake Moondarra to Mount Isa Terminal Reservoir Pipeline replacement project.
SunWater
SunWater’s capital budget of $36.9 million for 2009-10 includes $13.6 million for the ongoing asset refurbishment program, $13 million for the Tinaroo Dam spillway upgrade, $2.7 million for replacement of the Bowen River Weir fishway and $4.9 million to finalise the business case for the Connors River Dam.
Queensland Bulk Water Supply Authority
The Queensland Bulk Water Supply Authority’s capital budget is $182.6 million for 2009-10. Major projects include $13.8 million for Stage 2 of the SEQ Fluoridation program, $5 million for initial work on the Wyaralong Water Treatment Plant, $2.9 million for the upgrade of SEQ dams and weirs, and $120 million for the Hinze Dam Stage 3 project. Due for completion in December 2010, the project will provide a total capacity of nearly 310 megalitres and deliver an extra 5,840 megalitres a year into the SEQ Water Grid.
Queensland Bulk Water Transport Authority
The handover of assets from Local Government was completed in the third quarter of 2008. The Queensland Bulk Water Transport Authority has allocated $17 million in 2009-10 to enhance these assets, including the replacement of trunk mains, pipe work, and pumps. A further $4.3 million has been allocated for implementation of information technology systems to improve the management and maintenance of these assets as well as new water pipelines transferred from Southern Regional Water Pipeline Company as part of the development of the SEQ Water Grid.
Queensland Manufactured Water Authority
The Western Corridor Recycled Water project will continue in 2009-10 with $130.7 million allocated to complete the water supply network. The project is diversifying SEQ water resources by producing purified recycled water that meets the Australian Drinking Water Guidelines at a budgeted total cost of $2.493 billion.
| | | | |
| | | Capital Statement 2009 10 | | 73 |
Construction of the SEQ (Gold Coast) Desalination Plant at Tugun will also continue in 2009-10 with $95.5 million allocated to complete the 48,545 megalitres a year desalination facility. The project will deliver drinking water directly to the SEQ water grid at a budgeted total cost of $942 million.
SEQ Water Grid Manager
Through 2009-10, the Water Grid Manager (WGM) will introduce systems and processes that automate the operations of the SEQ Water Grid. This work will include a Water Grid portal that will allow Grid participants to share and receive data and information as they require. The WGM will also continue to improve its own internal processes with the development of business intelligence tools to assist its operations.
Environment and Resource Management
| | | | | | | | | | |
Project | | Statistical
Division | | Total
Estimated
Cost
$’000 | | Expenditure
to
30-06-09
$’000 | | Budget
2009-10
$’000 | | Post
2009-10
$’000 |
NATURAL RESOURCES AND WATER | | | | | | | | | | |
| | | | | |
Property, Plant and Equipment | | | | | | | | | | |
Land acquisitions | | | | | | | | | | |
Future water infrastructure projects | | Various | | 75,114 | | 25,514 | | 42,000 | | 7,600 |
Dam spillways upgrades | | 50 | | 12,999 | | 3,617 | | 4,903 | | 4,479 |
Land development and management system | | 05 | | | | | | 2,100 | | Ongoing |
Building and accommodation upgrades | | Various | | | | | | 4,499 | | Ongoing |
Plant and equipment | | | | | | | | | | |
Water Reform - continuity of supply | | 05 | | | | | | 1,050 | | Ongoing |
Enhanced Water Resource Monitoring | | 50 | | 3,823 | | 3,497 | | 326 | | |
Other plant and equipment | | Various | | | | | | 6,232 | | Ongoing |
| | | | | | | | | | |
Total Property, Plant and Equipment | | | | | | | | 61,110 | | |
| | | | | | | | | | |
| | | | | |
Other Capital Expenditure | | | | | | | | | | |
Urban water management systems | | 05 | | | | | | 500 | | Ongoing |
| | | | |
74 | | Capital Statement 2009 10 | | |
Environment and Resource Management
| | | | | | | | | | |
Project | | Statistical
Division | | Total
Estimated
Cost
$’000 | | Expenditure
to
30-06-09
$’000 | | Budget
2009-10
$’000 | | Post
2009-10
$’000 |
Other systems development | | 05 | | | | | | 5,969 | | Ongoing |
| | | | | | | | | | |
Total Other Capital Expenditure | | | | | | | | 6,469 | | |
| | | | | | | | | | |
| | | | | |
Capital Grants | | | | | | | | | | |
Dam spillway upgrades | | Various | | 59,501 | | 28,941 | | 900 | | 29,660 |
| | | | | | | | | | |
Total Capital Grants | | | | | | | | 900 | | |
| | | | | | | | | | |
TOTAL NATURAL RESOURCES AND WATER | | | | | | | | 68,479 | | |
| | | | | | | | | | |
| | | | | |
GLADSTONE AREA WATER BOARD | | | | | | | | | | |
| | | | | |
Property, Plant and Equipment | | | | | | | | | | |
Delivery Network projects | | 30 | | 73,180 | | | | 545 | | 72,635 |
Awonga Dam Area projects | | 30 | | 28,230 | | 10 | | 510 | | 27,710 |
Treatment Plant projects | | 30 | | 27,355 | | 75 | | 1,125 | | 26,155 |
New Raw Water Storage Reservoir investigations | | 30 | | 16,500 | | | | 500 | | 16,000 |
Awoonga to Gladstone Pipeline remedial works | | 30 | | 15,960 | | | | 400 | | 15,560 |
Fitzroy Pipeline project - Transition and Management Stage | | 30 | | 6,057 | | 2,768 | | 3,289 | | |
Lower Fitzroy River Weirs - Planning Stage | | 30 | | 3,469 | | | | 2,351 | | 1,118 |
Rationalisation of land holding | | 30 | | 3,140 | | 1,325 | | 1,200 | | 615 |
Information systems projects | | 30 | | 1,929 | | | | 620 | | 1,309 |
Fluoridation project | | 30 | | 1,085 | | 85 | | 1,000 | | |
South Gladstone Reservoir roof replacement | | 30 | | 1,025 | | 100 | | 925 | | |
Awoonga Dam power supply upgrade | | 30 | | 985 | | 535 | | 450 | | |
Fitzsimmons Street Raw Water Reservoirs metering upgrade | | 30 | | 982 | | 332 | | 650 | | |
Boat Creek Raw Water Reservoir reinstatement works | | 30 | | 850 | | 100 | | 750 | | |
Control system integration | | 30 | | 500 | | 50 | | 450 | | |
Head Office minor works | | 30 | | 500 | | | | 250 | | 250 |
Head Office land acquisition | | 30 | | 400 | | | | 400 | | |
| | | | | | | | | | |
Total Property, Plant and Equipment | | | | | | | | 15,415 | | |
| | | | | | | | | | |
TOTAL GLADSTONE AREA WATER BOARD | | | | | | | | 15,415 | | |
| | | | | | | | | | |
| | | | |
| | | Capital Statement 2009 10 | | 75 |
Environment and Resource Management
| | | | | | | | | | |
Project | | Statistical
Division | | Total
Estimated
Cost
$’000 | | Expenditure
to
30-06-09
$’000 | | Budget
2009-10
$’000 | | Post
2009-10
$’000 |
MOUNT ISA WATER BOARD | | | | | | | | | | |
| | | | | |
Property, Plant and Equipment | | | | | | | | | | |
Lake Moondarra to Mount Isa Terminal Reservoir pipeline replacement - Stage 2 | | 55 | | 3,720 | | 1,220 | | 2,500 | | |
Lining Mount Isa Terminal Reservoir north and south tanks | | 55 | | 800 | | 11 | | 400 | | 389 |
Col Popple Pump Station upgrade (Planning and Design) | | 55 | | 400 | | | | 200 | | 200 |
Installation of fluoridation plant at Mount Isa Terminal Reservoir Pump Station | | 55 | | 400 | | | | 400 | | |
Water metering project | | 55 | | 100 | | | | 100 | | |
Mount Isa Water Board office building upgrade | | 55 | | 450 | | | | 450 | | |
Mount Isa Terminal Reservoir Pump Station upgrade | | 55 | | 17,500 | | 17,300 | | 200 | | |
Lake Julius power supply pole replacement | | 55 | | 404 | | 4 | | 400 | | |
Control system upgrade | | 55 | | 325 | | 11 | | 300 | | 14 |
Minor acquisitions | | 55 | | 50 | | | | 50 | | |
Minor capital works | | 55 | | 500 | | | | 500 | | |
| | | | | | | | | | |
Total Property, Plant and Equipment | | | | | | | | 5,500 | | |
| | | | | | | | | | |
TOTAL MOUNT ISA WATER BOARD | | | | | | | | 5,500 | | |
| | | | | | | | | | |
| | | | | |
SUNWATER | | | | | | | | | | |
| | | | | |
Property, Plant and Equipment | | | | | | | | | | |
Upgrades | | | | | | | | | | |
Bowen River Weir Fishway replacement | | 40 | | 4,098 | | 1,000 | | 2,709 | | 389 |
Tinaroo Falls Dam Spillway upgrade | | 50 | | 21,100 | | 3,625 | | 13,008 | | 4,467 |
| | | | | | | | | | |
Sub-total Upgrades | | | | | | | | 15,717 | | |
| | | | | | | | | | |
| | | | | |
Development of business cases | | | | | | | | | | |
Connors River Dam | | 40 | | 12,883 | | 7,980 | | 4,903 | | |
Fitzroy River Weir | | 30 | | 9,156 | | 9,066 | | 90 | | |
Nathan Dam | | 15 | | 14,546 | | 7,090 | | 200 | | 7,256 |
| | | | |
76 | | Capital Statement 2009 10 | | |
Environment and Resource Management
| | | | | | | | | | |
Project | | Statistical
Division | | Total
Estimated
Cost
$’000 | | Expenditure
to
30-06-09
$’000 | | Budget
2009-10
$’000 | | Post
2009-10
$’000 |
Water for Bowen | | 40 | | 6,200 | | 5,982 | | 218 | | |
| | | | | | | | | | |
Sub-total Development of business cases | | | | | | | | 5,411 | | |
| | | | | | | | | | |
| | | | | |
Refurbishment and enhancement (service contracts) | | | | | | | | | | |
Awoonga Callide Pipeline | | 30 | | | | | | 259 | | Ongoing |
Bundaberg Irrigation Distribution | | 15 | | | | | | 601 | | Ongoing |
Burdekin Moranbah Pipeline | | 45 | | | | | | 326 | | Ongoing |
Burdekin Irrigation Distribution | | 45 | | | | | | 1,412 | | Ongoing |
Burdekin Water Supply | | 45 | | | | | | 307 | | Ongoing |
Collinsville Pipeline | | 40 | | | | | | 404 | | Ongoing |
Dawson Irrigation Distribution | | 30 | | | | | | 400 | | Ongoing |
Emerald Irrigation Distribution | | 30 | | | | | | 251 | | Ongoing |
Macintyre Brook Water Supply | | 20 | | | | | | 1,196 | | Ongoing |
Mareeba Irrigation Distribution | | 50 | | | | | | 1,808 | | Ongoing |
Mareeba Water Supply | | 50 | | | | | | 749 | | Ongoing |
Pioneer Water Supply | | 40 | | | | | | 1,603 | | Ongoing |
St George Irrigation Distribution | | 25 | | | | | | 1,395 | | Ongoing |
St George Water Supply | | 25 | | | | | | 547 | | Ongoing |
Tarong Pipeline | | 15 | | | | | | 359 | | Ongoing |
Upper Condamine Water Supply | | 25 | | | | | | 310 | | Ongoing |
Other schemes (less than $250K) | | Various | | | | | | 1,640 | | Ongoing |
Minor works | | | | | | | | | | |
Plant and equipment purchase | | 05 | | | | | | 523 | | Ongoing |
Software development and hardware | | 05 | | | | | | 1,661 | | Ongoing |
| | | | | | | | | | |
Total Property, Plant and Equipment | | | | | | | | 36,879 | | |
| | | | | | | | | | |
TOTAL SUNWATER | | | | | | | | 36,879 | | |
| | | | | | | | | | |
| | | | | |
QUEENSLAND BULK WATER SUPPLY AUTHORITY | | | | | | | | | | |
| | | | | |
Property, Plant and Equipment | | | | | | | | | | |
Raising of the Hinze Dam (Stage 3) | | 07 | | 394,800 | | 195,000 | | 120,000 | | 79,800 |
Fluoridation program (Stage 2) | | Various | | 13,800 | | | | 13,800 | | |
Wyaralong Water Treatment Plant | | 07 | | 5,000 | | | | 5,000 | | |
Upgrade of existing dams and weirs | | Various | | 2,900 | | | | 2,900 | | |
Other capital works | | Various | | | | | | 28,472 | | Ongoing |
| | | | | | | | | | |
Total Property, Plant and Equipment | | | | | | | | 170,172 | | |
| | | | | | | | | | |
| | | | | |
Other Capital Expenditure | | | | | | | | | | |
Corporate Information System (CIS) | | 05 | | 5,460 | | 3,000 | | 2,460 | | |
| | | | |
| | | Capital Statement 2009 10 | | 77 |
Environment and Resource Management
| | | | | | | | | | |
Project | | Statistical
Division | | Total
Estimated
Cost
$’000 | | Expenditure
to
30-06-09
$’000 | | Budget
2009-10
$’000 | | Post
2009-10
$’000 |
Other | | Various | | | | | | 8,100 | | Ongoing |
Buildings | | Various | | | | | | 1,912 | | Ongoing |
| | | | | | | | | | |
Total Other Capital Expenditure | | | | | | | | 12,472 | | |
| | | | | | | | | | |
TOTAL QUEENSLAND BULK WATER SUPPLY AUTHORITY | | 182,644 | | |
| | | | | | | | | | |
| | | | | |
QUEENSLAND BULK WATER TRANSPORT AUTHORITY | | | | | | | | | | |
| | | | | |
Property, Plant and Equipment | | | | | | | | | | |
Enhancements to trunk mains, related pipework, and pumping stations | | Various | | | | | | 17,039 | | Ongoing |
| | | | | | | | | | |
Total Property, Plant and Equipment | | | | | | | | 17,039 | | |
| | | | | | | | | | |
| | | | | |
Other Capital Expenditure | | | | | | | | | | |
IT systems implementation | | 05 | | | | | | 4,339 | | Ongoing |
| | | | | | | | | | |
Total Other Capital Expenditure | | | | | | | | 4,339 | | |
| | | | | | | | | | |
TOTAL QUEENSLAND BULK WATER TRANSPORT AUTHORITY | | 21,378 | | |
| | | | | | | | | | |
| | | | | |
QUEENSLAND MANUFACTURED WATER AUTHORITY | | | | | | | | | | |
| | | | | |
Property, Plant and Equipment | | | | | | | | | | |
Western Corridor recycled water project | | 05 | | 2,493,000 | | 2,362,252 | | 130,748 | | |
South East Queensland (Gold Coast) Desalination Plant | | 07 | | 942,000 | | 846,500 | | 95,500 | | |
Other capital works | | 05 | | 3,435 | | | | 3,435 | | |
| | | | | | | | | | |
Total Property, Plant and Equipment | | | | | | | | 229,683 | | |
| | | | | | | | | | |
TOTAL QUEENSLAND MANUFACTURED WATER AUTHORITY | | 229,683 | | |
| | | | | | | | | | |
| | | | | |
SEQ WATER GRID MANAGER | | | | | | | | | | |
| | | | | |
Property, Plant and Equipment | | | | | | | | | | |
Plant and equipment | | 05 | | | | | | 30 | | Ongoing |
| | | | | | | | | | |
Total Property, Plant and Equipment | | | | | | | | 30 | | |
| | | | | | | | | | |
| | | | | |
Other Capital Expenditure | | | | | | | | | | |
Water Grid Manager portal | | 05 | | 750 | | | | 500 | | 250 |
Operational management systems | | 05 | | 2,100 | | | | 1,000 | | 1,100 |
| | | | |
78 | | Capital Statement 2009 10 | | |
Environment and Resource Management
| | | | | | | | | | |
Project | | Statistical
Division | | Total
Estimated
Cost
$’000 | | Expenditure
to
30-06-09
$’000 | | Budget
2009-10
$’000 | | Post
2009-10
$’000 |
Business Intelligence System | | 05 | | 1,600 | | | | 1,000 | | 600 |
| | | | | | | | | | |
Total Other Capital Expenditure | | | | | | | | 2,500 | | |
| | | | | | | | | | |
| | | | | |
TOTAL SEQ WATER GRID MANAGER | | | | | | | | 2,530 | | |
| | | | | | | | | | |
| | | | | |
ENVIRONMENTAL PROTECTION | | | | | | | | | | |
| | | | | |
Property, Plant and Equipment | | | | | | | | | | |
Plant and equipment | | Various | | | | | | 4,123 | | Ongoing |
Capital works - Parks and Forests | | | | | | | | | | |
Construction of Boodjamulla management infrastructure | | 55 | | 2,000 | | 200 | | 1,800 | | |
Barron Gorge National Park toilets | | 50 | | 250 | | | | 250 | | |
Idalia National Park boundary fencing | | 35 | | 360 | | 80 | | 280 | | |
Upgrade of Diamantina Homestead Complex | | 35 | | 578 | | 77 | | 501 | | |
Construction of new Cardwell Ranger Base | | 50 | | 620 | | 114 | | 506 | | |
Replace amenities block at Lake McKenzie | | 15 | | 437 | | | | 437 | | |
Redevelopment of day use area at Lake McKenzie | | 15 | | 602 | | 75 | | 275 | | 252 |
Waste treatment system at Waddy Point Ranger Base | | 15 | | 394 | | 2 | | 392 | | |
Replace amenities block at Waddy Point Campground | | 15 | | 373 | | 123 | | 250 | | |
Continued redevelopment of Fleays Wildlife Park | | 07 | | 1,066 | | 816 | | 250 | | |
Upgrade Broken River day use area car park at Eungella National Park | | 40 | | 291 | | 35 | | 256 | | |
Redevelopment of car park at Joseph Banks Conservation Park | | 15 | | 515 | | 60 | | 455 | | |
Radio Communications System expansion and upgrade | | Various | | 630 | | 380 | | 250 | | |
Workshop and compound at Bunya Mountains National Park | | 20 | | 390 | | 10 | | 380 | | |
Minor Works - Parks and Forests | | Various | | | | | | 6,290 | | Ongoing |
| | | | |
| | | Capital Statement 2009 10 | | 79 |
Environment and Resource Management
| | | | | | | | | | |
Project | | Statistical
Division | | Total
Estimated
Cost
$’000 | | Expenditure
to
30-06-09
$’000 | | Budget
2009-10
$’000 | | Post
2009-10
$’000 |
More Great Walks | | | | | | | | | | |
Daintree to Cape York Great Walk feasibility study | | 50 | | 1,230 | | | | 1,230 | | |
Conondale Great Walk | | 09 | | 1,350 | | 885 | | 465 | | |
Cooloola Great Walk | | 15 | | 1,275 | | 885 | | 390 | | |
Whitsunday Islands Great Walk | | 40 | | 1,225 | | 975 | | 250 | | |
Carnarvon Great Walk | | 30 | | 1,185 | | 1,140 | | 45 | | |
| | | | | | | | | | |
Sub-total More Great Walks | | | | | | | | 2,380 | | |
| | | | | | | | | | |
| | | | | |
Capital Works - administrative building works | | | | | | | | | | |
Relocation of Brisbane office | | 05 | | 350 | | | | 350 | | |
Minor works - administrative building works | | Various | | | | | | 1,376 | | Ongoing |
Rainforest/Green land acquisitions | | 50 | | 30,000 | | 20,000 | | 10,000 | | |
Moreton Bay Zoning Plan vessel acquisition | | 05 | | 377 | | 157 | | 220 | | |
| | | | | | | | | | |
| | | | | |
Total Property, Plant and Equipment | | | | | | | | 31,021 | | |
| | | | | | | | | | |
| | | | | |
Other Capital Expenditure | | | | | | | | | | |
Various system enhancements | | 05 | | | | | | 2,001 | | Ongoing |
| | | | | | | | | | |
Total Other Capital Expenditure | | | | | | | | 2,001 | | |
| | | | | | | | | | |
TOTAL ENVIRONMENTAL PROTECTION | | 33,022 | | |
| | | | | | | | | | |
TOTAL ENVIRONMENT AND RESOURCE MANAGEMENT | | 595,530 | | |
| | | | | | | | | | |
| | | | |
80 | | Capital Statement 2009 10 | | |
HEALTH
The total capital program for Queensland Health will see $1.296 billion invested in new capital acquisitions in 2009-10, and an additional investment of $3 million by the Queensland Institute of Medical Research (QIMR).
Department of Health
The Queensland Health capital works program is an important input into the delivery of health services and outputs that underpin the achievement of our mission to create dependable health care and better health for all Queenslanders in addition to supporting the Department’s contribution to meeting the Government’s ambitions outlined in Toward Q2: Tomorrow’s Queensland.
In 2009-10, Queensland Health will continue its capital investment across a broad range of health care settings including community health centres, hospitals, health technology, pathology and scientific services, mental health services, residential care, staff accommodation, and information and communication technologies. This program will ensure that health infrastructure and assets support the delivery of health services and contribute to improved health outcomes for Queenslanders.
Program Highlights
| • | | A total of $817.8 million will be invested in 2009-10 on hospital projects including: |
| | • | | $268.4 million in 2009-10 will be spent to continue planning and development of three new tertiary hospitals - the Gold Coast University Hospital, the Sunshine Coast University Hospital (SCUH) and the Queensland Children’s Hospital. A total investment of $4.616 billion has been committed to establish these new hospitals; |
| | • | | an additional $6 million in 2009-10 ($80 million over five years) will be invested to ensure the new Queensland Children’s Hospital is supported by a world class paediatric research centre; |
| | • | | $221.8 million will be expended in 2009-10 to redevelop the Cairns, Mackay, Townsville, Rockhampton and Mount Isa Hospitals. These projects represent a total investment of $1.399 billion. The projects at Townsville and Rockhampton have been expanded with an additional investment from the Australian Government’s Health and Hospitals Fund; |
| | | | |
| | | Capital Statement 2009 10 | | 81 |
| | • | | $31 million in 2009-10 to commence upgrades to the emergency departments at Logan, Redland, QEII and Bundaberg Hospitals, under the $140.4 million Faster Emergency Care in our Hospitals initiative. Under this initiative, emergency departments at Ipswich, Caboolture and Toowoomba Hospitals will also be upgraded; as well as a dedicated paediatric emergency department at The Prince Charles Hospital; |
| | • | | the Faster Emergency Care in our Hospitals initiative will also provide $14.7 million from 2010-11 to deliver expanded rehabilitation facilities at Rockhampton Hospital and Parklands Townsville; |
| | • | | $56 million is allocated in 2009-10 to progress projects to address health service demand management requirements throughout the State; and |
| | • | | additional hospital redevelopments are underway at Bundaberg and Robina Hospitals, with redevelopments at Ingham and Yeppoon due for completion during 2009-10. |
| • | | The current Global Financial Crisis has impacted negatively on the ability for Public Private Partnership (PPP) proposals to be value for money. In light of the current market conditions, the Queensland Government has decided to reorder the construction of the SCUH and proceed with the earlier construction of a private hospital comprising approximately 110 public beds on the SCUH site by 2013-14. The construction of the public hospital, to be collocated on the site, will now commence in 2013-14, for the completion in 2016-17. |
| • | | This will enable a higher prospect for a PPP to be achieved for the public hospital as market conditions normalise. |
| • | | The availability of public beds on the SCUH site in Kawana will represent the first stage of the establishment of the SCUH, with further construction on the site to see the public hospital capacity expand to 550 beds by 2016-17 with the capacity to further expand to 650 beds. The Queensland Government will evaluate the potential value for money represented by a PPP in 2010-11 to determine whether the hospital will be delivered using a PPP. |
| • | | In 2009-10, $71 million will be invested in community health services including community health centres at Cairns and Gladstone. This funding includes $17 million to continue the delivery of primary health care centres including Saibai Island and Yarrabah. |
| • | | The Government will provide $3.6 million funding in 2009-10 through the Sustainable Resource Communities initiative for new patient accommodation at Mount Isa; the extension and renovation of the Middlemount Community Health Centre; and new staff accommodation at Moranbah and Mount Isa. |
| | | | |
82 | | Capital Statement 2009 10 | | |
| • | | In 2009-10, $84.5 million will fund provision of health technology equipment that supports the efficient delivery of safe, quality health services. |
| • | | Replacement of the residential aged care facility in Nambour will continue, with $11.4 million in 2009-10, and total planned expenditure of $13.4 million. |
| • | | $48.4 million will be invested in 2009-10 for enhancements to mental health services, including $46.4 million under the Queensland Plan for Mental Health (2007-17). |
| • | | $11.1 million will be invested in 2009-10 on enhancements to Forensic and Scientific Services including the forensic laboratory and infrastructure and information systems upgrades. This will also include a pathology laboratory at Hervey Bay Hospital. |
| • | | A total of $87.1 million will be invested in 2009-10 in projects across e-Health Clinical Systems and other health systems. These are a series of interlinked projects that will contribute to the objectives of the e-Health strategy in delivering an electronic medical record to support a patient-centric, networked model of care to ensure location-independent delivery of health services. Key highlights of this investment include: |
| | • | | ongoing statewide rollout of a new Radiology Information System enabling a significant reduction in the time taken for radiologists to view, assess and diagnose medical problems; |
| | • | | implementation of digital technology for breast screening that will enable faster communication of the results to patients and the potential for improved detection of breast cancer; |
| | • | | ongoing implementation of an Enterprise Discharge Summary to provide a more accurate care record to consumers and improve communication to General Practitioners; and |
| | • | | Information and Communication Technology projects to enable secured system access, integration of existing systems and manage reference datasets. |
| • | | $86.2 million for information and communication technology equipment to replace, upgrade and provide future capacity/capability to support the e-Health strategy and clinical information solutions. This investment incorporates telephone system replacements, network and server upgrades. |
| | | | |
| | | Capital Statement 2009 10 | | 83 |
Council of the Queensland Institute of Medical Research
The QIMR capital program in 2009-10 will total $3 million for acquisition of new or replacement equipment including a $1 million upgrade of IT infrastructure plus state of the art scientific equipment.
Health
| | | | | | | | | | |
Project | | Statistical
Division | | Total
Estimated
Cost
$’000 | | Expenditure
to
30-06-09
$’000 | | Budget
2009-10
$’000 | | Post
2009-10
$’000 |
DEPARTMENT OF HEALTH | | | | | | | | | | |
| | | | | |
Property, Plant and Equipment | | | | | | | | | | |
Community Health Centres (CHC) | | | | | | | | | | |
Caboolture Health Precinct | | 05 | | 21,000 | | 3,095 | | 876 | | 17,029 |
Cairns Central CHC | | 50 | | 12,674 | | 8,573 | | 2,368 | | 1,733 |
Gladstone Community, Mental and Oral Health Consolidation | | 30 | | 15,950 | | 12,650 | | 3,300 | | |
Indigenous Alcohol Treatment and Rehabilitation | | Various | | 6,700 | | 2,000 | | 4,000 | | 700 |
Middlemount Community Health Centre Extension | | 40 | | 650 | | 90 | | 560 | | |
North Lakes Health Precinct | | 05 | | 53,541 | | 45,609 | | 7,932 | | |
Oral Health Queensland | | Various | | 14,150 | | 2,360 | | 10,290 | | 1,500 |
Robina Health Precinct | | 07 | | 36,310 | | 13,940 | | 17,896 | | 4,474 |
Sunshine Coast Health Precinct | | 09 | | 27,241 | | 20,332 | | 365 | | 6,544 |
Thursday Island Chronic Disease Centre | | 50 | | 39,015 | | 7,483 | | 5,266 | | 26,266 |
Weipa Hospital Redevelopment | | 50 | | 45,263 | | 44,308 | | 955 | | |
Project Finalisation - CHC | | Various | | 234 | | | | 234 | | |
| | | | | | | | | | |
Sub-total Community Health Centres (CHC) | | | | | | 54,042 | | |
| | | | | | | | | | |
| | | | | |
Primary Health Care Centres (PHCC) | | | | | | | | | | |
Saibai Island PHCC | | 50 | | 5,685 | | 76 | | 5,609 | | |
Yarrabah PHCC | | 50 | | 15,774 | | 4,917 | | 8,686 | | 2,171 |
Project Finalisation - PHCC | | Various | | 2,687 | | | | 2,687 | | |
| | | | | | | | | | |
Sub-total Primary Health Care Centres (PHCC) | | | | | | 16,982 | | |
| | | | | | | | | | |
| | | | | |
Hospitals | | | | | | | | | | |
Area Health Services Demand Management | | Various | | 297,500 | | 25,000 | | 56,000 | | 216,500 |
Building Works Capital Project Management | | Various | | 850 | | | | 850 | | |
Bundaberg Hospital Expansion | | 15 | | 41,350 | | 11,705 | | 26,568 | | 3,077 |
| | | | |
84 | | Capital Statement 2009 10 | | |
Health
| | | | | | | | | | |
Project | | Statistical
Division | | Total
Estimated
Cost
$’000 | | Expenditure
to
30-06-09
$’000 | | Budget
2009-10
$’000 | | Post
2009-10
$’000 |
Cairns Base Hospital Redevelopment | | 50 | | 446,300 | | 24,200 | | 21,800 | | 400,300 |
Cairns Hospital Emergency Department (Additional Bed Capacity) | | 50 | | 11,100 | | 4,698 | | 6,402 | | |
Cancer Treatment Facilities | | Various | | 35,100 | | | | 7,530 | | 27,570 |
Faster Emergency Care in our Hospitals (incl. expanded
rehabilitation facilities) | | Various | | 140,400 | | | | 31,000 | | 109,400 |
Gold Coast University Hospital1 | | 07 | | 1,761,853 | | 132,452 | | 155,012 | | 1,474,389 |
Ingham Hospital Redevelopment | | 45 | | 41,439 | | 37,595 | | 3,844 | | |
Innisfail Hospital Redevelopment | | 50 | | 42,510 | | 42,003 | | 507 | | |
Ipswich Hospital Additional Beds | | 05 | | 122,000 | | 86 | | 4,150 | | 117,764 |
Logan Elective Surgery | | 05 | | 3,400 | | 1,400 | | 2,000 | | |
Mackay Base Hospital Redevelopment | | 40 | | 405,618 | | 9,660 | | 61,018 | | 334,940 |
Master Planning Studies | | Various | | | | | | 1,163 | | Ongoing |
Mount Isa Health Campus Redevelopment | | 55 | | 65,190 | | 2,039 | | 25,420 | | 37,731 |
Princess Alexandra Hospital Emergency Department (Additional Bed Capacity) | | 05 | | 52,000 | | 13,179 | | 29,457 | | 9,364 |
Queensland Children’s Hospital1 | | 05 | | 1,283,530 | | 135,891 | | 105,124 | | 1,042,515 |
Queensland Children’s Hospital Academic and Research Centre | | 05 | | 80,000 | | | | 6,000 | | 74,000 |
Robina Hospital Emergency Department and Intensive Care Unit | | 07 | | 42,232 | | 35,508 | | 6,724 | | |
Robina Hospital Expansion | | 07 | | 240,000 | | 20,209 | | 72,375 | | 147,416 |
Rockhampton Hospital Expansion | | 30 | | 149,075 | | 41,019 | | 74,209 | | 33,847 |
Sunshine Coast Health Services District (Additional Bed Capacity) | | 09 | | 191,000 | | 58,079 | | 59,075 | | 73,846 |
Sunshine Coast University1 Hospital | | 09 | | 1,570,300 | | 67,896 | | 8,260 | | 1,494,144 |
The Prince Charles Hospital Upgrade | | 05 | | 139,570 | | 133,633 | | 5,937 | | |
Toowoomba Hospital Birthing Centre | | 20 | | 1,000 | | | | 1,000 | | |
Townsville Hospital Birthing Centre | | 45 | | 2,200 | | 1,000 | | 1,200 | | |
Townsville Hospital Expansion | | 45 | | 332,800 | | 220 | | 39,350 | | 293,230 |
Yeppoon Hospital Redevelopment | | 30 | | 21,525 | | 20,420 | | 1,105 | | |
| | | | |
| | | Capital Statement 2009 10 | | 85 |
Health
| | | | | | | | | | |
Project | | Statistical
Division | | Total
Estimated
Cost
$’000 | | Expenditure
to
30-06-09
$’000 | | Budget
2009-10
$’000 | | Post
2009-10
$’000 |
Projects finalisation - Hospitals | | Various | | 4,672 | | | | 4,672 | | |
| | | | | | | | | | |
Sub-total Hospitals | | | | | | | | 817,752 | | |
| | | | | | | | | | |
| | | | | |
Health Technology Replacement | | | | | | | | | | |
Healthy Hearing | | Various | | 2,825 | | 2,025 | | 200 | | 600 |
Health Technology Equipment | | Various | | | | | | 80,000 | | Ongoing |
Program Management | | Various | | | | | | 1,045 | | Ongoing |
Radiology Services Delivery | | Various | | 3,907 | | 298 | | 3,109 | | 500 |
Royal Children’s Hospital - Healthy Hearing | | 05 | | 200 | | 60 | | 140 | | |
| | | | | | | | | | |
Sub-total Health Technology Replacement | | | | | | | | 84,494 | | |
| | | | | | | | | | |
| | | | | |
Renal Services | | | | | | | | | | |
Mount Isa Dialysis Patient Accomodation | | 55 | | 835 | | | | 835 | | |
| | | | | | | | | | |
Sub-total Renal Services | | | | | | | | 835 | | |
| | | | | | | | | | |
| | | | | |
Mental Health Services | | | | | | | | | | |
Bundaberg Mental Health Beds | | 15 | | 2,000 | | | | 2,000 | | |
Queensland Mental Health Plan | | Various | | 119,109 | | 9,509 | | 41,367 | | 68,233 |
Queensland Mental Health Plan - Community | | Various | | 11,236 | | 3,527 | | 5,000 | | 2,709 |
| | | | | | | | | | |
Sub-total Mental Health Services | | | | | | | | 48,367 | | |
| | | | | | | | | | |
| | | | | |
Pathology and Scientific Services | | | | | | | | | | |
Forensic Science Enhancement | | Various | | 15,200 | | 7,600 | | 7,600 | | |
Hervey Bay Pathology Laboratory | | 15 | | 4,270 | | 470 | | 3,000 | | 800 |
Queensland Health Scientific Services | | 05 | | 21,846 | | 21,341 | | 505 | | |
| | | | | | | | | | |
Sub-total Pathology and Scientific Services | | | | | | | | 11,105 | | |
| | | | | | | | | | |
| | | | | |
Residential Care | | | | | | | | | | |
State Government Residential Aged Care Facilities Program | | | | | | | | | | |
Fire Safety Upgrades - Residential Aged Care | | Various | | 1,789 | | 1,490 | | 299 | | |
Nambour Residential Aged Care Facility | | 09 | | 13,408 | | 2,036 | | 11,372 | | |
| | | | | | | | | | |
Sub-total Residential Care | | | | | | | | 11,671 | | |
| | | | | | | | | | |
| | | | | |
Staff Accommodation Program | | | | | | | | | | |
Cape York Staff Accommodation-Kowanyama | | 50 | | 1,375 | | 43 | | 1,332 | | |
| | | | |
86 | | Capital Statement 2009 10 | | |
Health
| | | | | | | | | | |
Project | | Statistical
Division | | Total
Estimated
Cost
$’000 | | Expenditure
to
30-06-09
$’000 | | Budget
2009-10
$’000 | | Post
2009-10
$’000 |
Housing Stock Upgrades | | Various | | | | | | 1,000 | | Ongoing |
Moranbah Health Staff Accommodation | | 40 | | 1,600 | | 1,200 | | 400 | | |
Mount Isa Accomodation | | 55 | | 1,820 | | | | 1,820 | | |
Regional Accommodation Program | | Various | | 87,528 | | 85,769 | | 1,759 | | |
Project Finalisation - Staff Accommodation | | Various | | 670 | | | | 670 | | |
| | | | | | | | | | |
Sub-total Staff Accommodation Program | | | | | | | | 6,981 | | |
| | | | | | | | | | |
| | | | | |
Other Acquisitions of Property Plant and Equipment | | | | | | | | | | |
Capital Program Land Acquisition | | Various | | 5,259 | | | | 5,259 | | |
Critical Projects | | Various | | 7,346 | | 5,614 | | 1,732 | | |
Emergent Works Program | | Various | | | | | | 20,688 | | Ongoing |
Essential Infrastructure Projects | | Various | | 5,600 | | 4,000 | | 1,600 | | |
Health Contact Centre | | Various | | 8,762 | | 6,762 | | 2,000 | | |
Minor Capital Projects and Acquisitions2 | | Various | | | | | | 36,452 | | Ongoing |
Urgent Infrastructure Initiatives | | Various | | 9,026 | | 8,500 | | 526 | | |
Water Conservation Initiatives | | Various | | 2,000 | | 1,663 | | 337 | | |
| | | | | | | | | | |
Sub-total Other Acquisitions of Property Plant and Equipment | | | | | | | | 68,594 | | |
| | | | | | | | | | |
| | | | | |
Information Technology Equipment | | | | | | | | | | |
Information Technology Equipment Various Acquisition | | | | | | | | 86,239 | | Ongoing |
| | | | | | | | | | |
Sub-total Information Technology Equipment | | | | | | | | 86,239 | | |
| | | | | | | | | | |
Total Property, Plant and Equipment | | | | | | | | 1,207,062 | | |
| | | | | | | | | | |
| | | | | |
Other Capital Expenditure | | | | | | | | | | |
Information and Communication Technology e-Health Clinical Systems3 | | Various | | | | | | 55,240 | | Ongoing |
IT Contingency and Emergent Needs | | Various | | | | | | 1,773 | | Ongoing |
Other Health Systems | | Various | | | | | | 30,068 | | Ongoing |
| | | | | | | | | | |
Sub-total Information and Communication Technology | | | | | | | | 87,081 | | |
| | | | | | | | | | |
| | | | | |
Inventory Movement | | Various | | | | | | 1,521 | | Ongoing |
| | | | | | | | | | |
Total Other Capital Expenditure | | | | | | | | 88,602 | | |
| | | | | | | | | | |
TOTAL DEPARTMENT OF HEALTH | | | | | | | | 1,295,664 | | |
| | | | | | | | | | |
| | | | |
| | | Capital Statement 2009 10 | | 87 |
Health
| | | | | | | | | | |
Project | | Statistical
Division | | Total
Estimated
Cost
$'000 | | Expenditure
to
30-06-09
$'000 | | Budget
2009-10
$'000 | | Post
2009-10
$'000 |
COUNCIL OF THE QUEENSLAND INSTITUTE OF MEDICAL RESEARCH | | | | | | | | | | |
| | | | | |
Property, Plant and Equipment | | | | | | | | | | |
Other scientific equipment | | 05 | | | | | | 3,031 | | Ongoing |
| | | | | | | | | | |
Total Property, Plant and Equipment | | | | | | | | 3,031 | | |
| | | | | | | | | | |
TOTAL COUNCIL OF THE QUEENSLAND INSTITUTE OF MEDICAL RESEARCH | | | | | | | | 3,031 | | |
| | | | | | | | | | |
| | | | | |
TOTAL HEALTH | | | | | | | | 1,298,695 | | |
| | | | | | | | | | |
Notes:
| 1. | Total Estimated Cost may vary from 2008 09 State Budget Papers as costs are now expressed in estimated out turn dollars |
| 2. | Amount net of $23.5 million non capital component of project expenditure |
| 3. | Information and Communication Technology amount is net of $61.4 million non capital component of project expenditure |
| | | | |
88 | | Capital Statement 2009 10 | | |
INFRASTRUCTURE AND PLANNING
The department’s 2009-10 capital expenditure budget incorporating Property Services Group, Water Infrastructure Projects, Airport Link and Local Government, is $1.385 billion. The department contributes to the Government’s ambitions of building a strong economy and green, healthy communities that meet future challenges. The department’s role is to assess and improve infrastructure projects and to optimise the benefits for Queenslanders through planning, facilitation, delivery and coordination of strategic land use together with major infrastructure projects and initiatives across Queensland in collaboration with local governments and the community.
Infrastructure and Planning
Program Highlights
| • | | $15 million for the acquisition of a 70km long and 200m wide corridor between Callide and Gladstone State Development Area to accommodate co-location of the LNG pipelines to Curtis Island. |
| • | | $8.1 million for land acquisition relating to the Stanwell to Gladstone Infrastructure Corridor. |
| • | | $7.6 million to continue land acquisition and development planning in the Targinie precinct to provide a transport infrastructure corridor. |
| • | | $4.7 million to continue land acquisition development planning for service access from industrial projects in and around Townsville. |
| • | | $4 million allocated to extend the runway and upgrade the terminal of the Whitsunday Coast Airport. |
| • | | $3.6 million to develop two regional recreational trails - Brisbane Valley Railway Trail and the Boonah to Ipswich Trail. |
| • | | $3.5 million to continue land acquisition associated with Narangba and Kholo Hard Rock Haulage Corridor. |
Property Services Group
The Property Services Group delivers the property services component of the Industry Location Scheme. Key functions of the group include the acquisition, planning and development of land for business and industry locating to or expanding in Queensland. The Group’s capital expenditure plan for 2009-10 totals $87.2 million.
| | | | |
| | | Capital Statement 2009 10 | | 89 |
Program Highlights
| • | | Construction of the following projects is expected to proceed in 2009-10 when development approvals are obtained: |
| | • | | $26.1 million to construct Stage 1 of the Coolum Industrial Estate; |
| | • | | $10 million to construct Stage 6 of the Bohle Industrial Estate; |
| | • | | $7 million to construct the Amberley Aerospace Park; |
| | • | | $6 million to continue development of the South Mackay Industrial Estate; |
| | • | | $4.4 million to construct Stage 6 of the Crestmead Industrial Estate; and |
| | • | | $2.2 million to complete development of the Mt Isa Nordale Industrial Estate. |
| • | | The following land acquisitions are planned for 2009-10, subject to negotiations: |
| | • | | $6 million for the acquisition of land for future development of industrial estates in the Mackay region; |
| | • | | $5 million for the acquisition of land to extend the Abbot Point State Development Area; and |
| | • | | $2 million for continued acquisition within South East Queensland for the future development of industrial estates. |
Water Infrastructure Projects
The Government has established a number of special purpose vehicles to provide rigorous governance, management and delivery of the key water infrastructure projects.
Program Highlights
| • | | The $1.592 billion Traveston Crossing Dam is continuing to progress through the environmental approvals process. In 2009-10, $75 million is allocated for environmental measures and community projects, such as the establishment of a Freshwater Species Conservation Centre, habitat and vegetation rehabilitation and relevant catchment management initiatives. When complete, the Traveston Crossing Dam will provide an additional 70,000 megalitres a year of water for South East Queensland. |
| • | | In 2009-10, $211.5 million has been allocated for the construction of the Northern Pipeline Interconnector Stage 2. This pipeline will be approximately 48 km and extend from Eudlo to Cooroy on the Sunshine Coast and is due for completion in 2012 at a total cost of $450 million. |
| | | | |
90 | | Capital Statement 2009 10 | | |
| • | | The $348 million Wyaralong Dam project is now under construction, with site preparation activities well advanced. In 2009-10, $171 million will be spent on construction activities including the commencement of major dam construction works and the upgrade to the Beaudesert to Boonah road. The Wyaralong Dam will provide an additional 26,000 megalitres a year of water when operated with the recently completed Cedar Grove Weir and the Bromelton Offstream Storage. |
| • | | In 2009-10, $121 million is provided to complete the 38 km Toowoomba pipeline which is forecast to be operational by January 2010. This pipeline links Wivenhoe Dam to Toowoomba’s Cressbrook Dam and is planned to provide water security to the Toowoomba region with the capacity to move 14,200 mega litres a year. |
Airport Link
The acquisition of land to continue the development of the Airport Link toll road. The Airport Roundabout Upgrade commenced in April 2009.
| • | | $174.9 million is allocated for land acquisitions relating to the toll road linking Brisbane City with the Brisbane Airport. |
Local Government
The Local Government capital program will provide $497 million in 2009-10 to assist local governments to build vibrant, more sustainable communities. The majority of capital expenditure relates to capital grants and subsidies to assist with the creation or upgrading of a range of essential community infrastructure such as water supply, sewerage treatment and disposal, roads and drainage as well as facilities to improve social amenity.
Program Highlights
| • | | $18.9 million towards the redevelopment of the Flinders Street mall. |
| • | | $14 million under the Indigenous Environmental Health and Infrastructure Program to provide essential community infrastructure in the Torres Strait region, including major sewerage projects at Mabuaig and Moa Islands. |
| • | | $9 million for the Fluoride Capital Assistance Program to undertake capital works outside South East Queensland for the introduction of fluoridation. |
| • | | $2 million for the redevelopment of the historic Jezzine Barracks at North Ward. |
| | | | |
| | | Capital Statement 2009 10 | | 91 |
Infrastructure and Planning
| | | | | | | | | | |
Project | | Statistical
Division | | Total
Estimated
Cost
$’000 | | Expenditure
to
30-06-09
$’000 | | Budget
2009-10
$’000 | | Post
2009-10
$’000 |
INFRASTRUCTURE AND PLANNING | | | | | | | | | | |
| | | | | |
Property, Plant and Equipment | | | | | | | | | | |
Targinie Precinct | | 30 | | 57,000 | | 49,432 | | 7,568 | | |
Hardrock Haulage Roads | | 05 | | 23,450 | | 19,936 | | 3,514 | | |
Stanwell to Gladstone Infrastructure Corridor | | 30 | | 8,108 | | | | 8,108 | | |
Townsville State Development Area | | 45 | | 7,500 | | 2,790 | | 4,710 | | |
South East Queensland Regional Recreational Trails | | Various | | 4,854 | | 1,475 | | 2,299 | | 1,080 |
Whitsunday Coast Airport Upgrade | | 40 | | 4,000 | | | | 4,000 | | |
Other capital expenditure | | Various | | | | | | 122 | | Ongoing |
| | | | | | | | | | |
Total Property, Plant and Equipment | | | | | | | | 30,321 | | |
| | | | | | | | | | |
| | | | | |
Other Capital Expenditure | | | | | | | | | | |
Callide to Gladstone LNG Land Corridor | | 30 | | 30,000 | | | | 15,000 | | 15,000 |
Smart eDA Software Development Project | | 05 | | 3,000 | | 2,394 | | 606 | | |
| | | | | | | | | | |
Total Other Capital Expenditure | | | | | | | | 15,606 | | |
| | | | | | | | | | |
| | | | | |
Capital Grants | | | | | | | | | | |
South East Queensland Regional Recreational Trails | | Various | | 3,846 | | 2,001 | | 1,275 | | 570 |
| | | | | | | | | | |
Total Capital Grants | | | | | | | | 1,275 | | |
| | | | | | | | | | |
TOTAL INFRASTRUCTURE AND PLANNING | | | | | | | | 47,202 | | |
| | | | | | | | | | |
| | | | | |
PROPERTY SERVICES GROUP | | | | | | | | | | |
Property, Plant and Equipment | | | | | | | | | | |
Asset replacement program | | 05 | | | | | | 20 | | Ongoing |
| | | | | | | | | | |
Total Property, Plant and Equipment | | | | | | | | 20 | | |
| | | | | | | | | | |
| | | | | |
Other Capital Expenditure | | | | | | | | | | |
Land Development | | | | | | | | | | |
Abbot Point State Development Area - Service Infrastructure | | 40 | | 1,500 | | | | 250 | | 1,250 |
Aerospace and Defence Support Centre Amberley | | 05 | | 30,551 | | 1,499 | | 7,000 | | 22,052 |
Bohle Industrial Estate Stage 6 | | 45 | | 18,900 | | 2,360 | | 10,000 | | 6,540 |
| | | | |
92 | | Capital Statement 2009 10 | | |
Infrastructure and Planning
| | | | | | | | | | |
Project | | Statistical
Division | | Total
Estimated
Cost
$’000 | | Expenditure
to
30-06-09
$’000 | | Budget
2009-10
$’000 | | Post
2009-10
$’000 |
Charlton North Industrial Estate | | 20 | | 17,840 | | 1,072 | | 6,000 | | 10,768 |
Clinton Industrial Park - Blain Drive | | 30 | | 6,100 | | 500 | | 5,600 | | |
Clinton Industrial Estate - Red Rover Precinct | | 30 | | 10,500 | | 20 | | 80 | | 10,400 |
Coolum Industrial Estate - Stage 1 | | 09 | | 42,930 | | 1,522 | | 26,060 | | 15,348 |
Coolum Industrial Estate - Stage 2 | | 09 | | 1,200 | | | | 550 | | 650 |
Crestmead Industrial Estate - Stage 6 | | 05 | | 5,106 | | 662 | | 4,444 | | |
Ebenezer Industrial Precinct | | 05 | | 32,500 | | 500 | | 2,000 | | 30,000 |
Gladstone State Development | | 30 | | 25,750 | | 250 | | 500 | | 25,000 |
Area - service infrastructure | | | | | | | | | | |
Mount Isa Nordale Industrial Estate | | 55 | | 2,650 | | 417 | | 2,233 | | |
Narangba Industrial Estate | | 05 | | 3,300 | | 859 | | 2,441 | | |
South Mackay Industrial Estate | | 40 | | 13,500 | | 613 | | 6,000 | | 6,887 |
Minor works | | Various | | | | | | 500 | | Ongoing |
| | | | | | | | | | |
Sub-total Land Development | | | | | | | | 73,658 | | |
| | | | | | | | | | |
| | | | | |
Land Purchases | | | | | | | | | | |
Abbot Point State Development Area | | 40 | | 14,545 | | 9,545 | | 5,000 | | |
Mackay Region Industrial Land | | 40 | | 6,000 | | | | 6,000 | | |
South East Queensland Strategic Land | | 05 | | 16,468 | | 12,468 | | 2,000 | | 2,000 |
Minor land acquisitions | | Various | | | | | | 500 | | Ongoing |
| | | | | | | | | | |
Sub-total Land Purchases | | | | | | | | 13,500 | | |
| | | | | | | | | | |
Total Other Capital Expenditure | | | | | | | | 87,158 | | |
| | | | | | | | | | |
TOTAL PROPERTY SERVICES GROUP | | | | | | | | 87,178 | | |
| | | | | | | | | | |
| | | | | |
WATER INFRASTRUCTURE PROJECTS | | | | | | | | | | |
| | | | | |
Property, Plant and Equipment | | | | | | | | | | |
Traveston Crossing Dam - Stage 1 | | Various | | 1,592,000 | | 490,237 | | 75,000 | | 1,026,763 |
Northern Pipeline Interconnector Stage 2 | | 09 | | 450,000 | | 98,372 | | 211,450 | | 140,178 |
Wyaralong Dam | | 12 | | 348,000 | | 134,155 | | 171,000 | | 42,845 |
Toowoomba Pipeline | | 20 | | 187,000 | | 65,957 | | 121,043 | | |
| | | | | | | | | | |
Total Property, Plant and Equipment | | | | | | | | 578,493 | | |
| | | | | | | | | | |
TOTAL WATER INFRASTRUCTURE PROJECT | | | | | | | | 578,493 | | |
| | | | | | | | | | |
| | | | |
| | | Capital Statement 2009 10 | | 93 |
Infrastructure and Planning
| | | | | | | | | | |
Project | | Statistical
Division | | Total
Estimated
Cost
$’000 | | Expenditure
to
30-06-09
$’000 | | Budget
2009-10
$’000 | | Post
2009-10
$’000 |
AIRPORT LINK | | | | | | | | | | |
Property, Plant and Equipment | | | | | | | | | | |
Airport Link1 | | 05 | | 194,765 | | 13,981 | | 174,884 | | 5,900 |
| | | | | | | | | | |
Total Property, Plant and Equipment | | | | | | | | 174,884 | | |
| | | | | | | | | | |
TOTAL AIRPORT LINK | | | | | | | | 174,884 | | |
| | | | | | | | | | |
| | | | | |
LOCAL GOVERNMENT | | | | | | | | | | |
| | | | | |
Property, Plant and Equipment | | | | | | | | | | |
Plant and Equipment | | 05 | | | | | | 122 | | Ongoing |
| | | | | | | | | | |
Total Property, Plant and Equipment | | | | | | | | 122 | | |
| | | | | | | | | | |
| | | | | |
Capital Grants | | | | | | | | | | |
Other works | | Various | | | | | | 264,332 | | Ongoing |
Water | | Various | | | | | | 181,758 | | Ongoing |
Fluoride Capital Assistance Program | | Various | | 9,000 | | | | 9,000 | | |
Queensland’s 150th Anniversary - Legacy Infrastructure project | | Various | | 100,000 | | 80,000 | | 20,000 | | |
Flinders Street Mall Redevelopment - Townsville | | 45 | | 18,900 | | | | 18,900 | | |
Jezzine Barracks Redevelopment - Townsville | | 45 | | 10,000 | | 2,000 | | 2,000 | | 6,000 |
Kuranda Skyrail and infrastructure levy | | 50 | | | | | | 844 | | Ongoing |
| | | | | | | | | | |
Total Capital Grants | | | | | | | | 496,834 | | |
| | | | | | | | | | |
TOTAL LOCAL GOVERNMENT | | | | | | | | 496,956 | | |
| | | | | | | | | | |
TOTAL INFRASTRUCTURE AND PLANNING | | | | 1,384,713 | | |
| | | | | | | | | | |
Note:
| 1. | Total estimated cost includes land acquisition and early works, but excludes expenditure on land acquisition undertaken by the Department of Transport and Main Roads ($122 million) and the State’s contribution of $267.2 million towards the project. |
| | | | |
94 | | Capital Statement 2009 10 | | |
JUSTICE AND ATTORNEY GENERAL
The 2009-10 capital expenditure program for the Department of Justice and Attorney-General (including Industrial Relations, Public Trust Office, Crime and Misconduct Commission, Legal Aid Queensland and Anti-Discrimination Commission Queensland) is $212.3 million.
Justice and Attorney-General
The Department of Justice and Attorney-General capital expenditure program for 2009-10 is $201.5 million. The department’s capital program concentrates on the construction of new courthouses and new facilities, and the refurbishment and replacement of major building components for existing courthouses. It also includes the continual development and improvement of all departmental information systems and equipment.
Program Highlights
| • | | $152 million for the construction of the new Brisbane Supreme Court and District Court. |
| • | | $27.2 million for the completion of construction of a new courthouse and watchhouse at Ipswich to cope with the growing population in this area. This is part of a combined facility including a watchhouse and a police station. |
| • | | $7.8 million for the continual upgrade, improvement and development of the department’s information systems to ensure service delivery and operational efficiencies across the justice system. |
| • | | $0.75 million capital grant to Office of the Information Commissioner. |
Public Trust Office
The 2009-10 capital expenditure program for the Public Trust Office is $5.9 million. This expenditure will enable the Public Trust Office to continue to provide a wide range of efficient services to the Queensland community on a self funded basis. The Public Trust Office will source the investment for these capital assets from its own funds at no cost to Government.
Program Highlights
| • | | $2.7 million for a new office in SEQ to continue delivery of services in areas of greatest need in Queensland and $1.3 million on buildings improvements for current occupied premises. |
| | | | |
| | | Capital Statement 2009 10 | | 95 |
| • | | To ensure the Public Trust Office is maintaining optimal use of its computer hardware, a strategy has been developed to manage the upgrading of equipment on rolling replacement strategy. The Public Trust Office proposes to spend $0.2 million on computer hardware and $1.4 million on software during 2009-10. |
Legal Aid Queensland
The 2009-10 capital expenditure program for Legal Aid Queensland is $2.8 million. Legal Aid Queensland will invest in capital projects including $0.5 million in new leased accommodation for the Maroochydore Office. Legal Aid Queensland will also invest a further $1.2 million in the replacement of office equipment and vehicles. A further $0.68 million will be invested to develop the Core Business System technical redevelopment project.
Crime and Misconduct Commission
The 2009-10 capital expenditure program for the Crime and Misconduct Commission is $1.9 million. The Crime and Misconduct Commission will invest $0.55 million in vehicle replacements and $1.4 million on computer and other equipment.
Anti-Discrimination Commission
The 2009-10 capital expenditure program for the Anti-Discrimination Commission Queensland is $0.03 million. Anti-Discrimination Commission Queensland will invest $0.03 million on computer and other equipment replacement.
Justice and Attorney General
| | | | | | | | | | |
Project | | Statistical
Division | | Total
Estimated
Cost
$’000 | | Expenditure
to
30-06-09
$’000 | | Budget
2009-10
$’000 | | Post
2009-10
$’000 |
JUSTICE AND ATTORNEY-GENERAL | | | | | | | | | | |
| | | | | |
Property, Plant and Equipment | | | | | | | | | | |
Ipswich, land purchase and new courthouse | | 05 | | 91,510 | | 64,265 | | 27,245 | | |
Brisbane Supreme and District Court complex | | 05 | | 600,000 | | 56,533 | | 152,000 | | 391,467 |
Buildings, programmed renewal | | Various | | | | | | 5,800 | | Ongoing |
Minor capital works | | Various | | | | | | 2,265 | | Ongoing |
Other acquisitions of property, plant and equipment | | Various | | | | | | 5,648 | | Ongoing |
| | | | | | | | | | |
Total Property, Plant and Equipment | | | | | | | | 192,958 | | |
| | | | | | | | | | |
| | | | |
96 | | Capital Statement 2009 10 | | |
Justice and Attorney General
| | | | | | | | | | |
Project | | Statistical
Division | | Total
Estimated
Cost
$’000 | | Expenditure
to
30-06-09
$’000 | | Budget
2009-10
$’000 | | Post
2009-10
$’000 |
Other Capital Expenditure | | | | | | | | | | |
Integrated Justice Information Strategy | | 05 | | 25,307 | | 24,787 | | 520 | | |
Queensland Wide Integrated Courts System (QWIC) Renewal | | 05 | | 2,040 | | 1,640 | | 400 | | |
New Queensland Courts Case Management System | | 05 | | 2,028 | | 754 | | 1,274 | | |
Crown Law - VISUALFILES System | | 05 | | 2,623 | | 1,800 | | 523 | | 300 |
Minor capital works - software | | 05 | | | | | | 3,560 | | Ongoing |
Other capital | | 05 | | | | | | 1,549 | | Ongoing |
| | | | | | | | | | |
Total Other Capital Expenditure | | | | | | | | 7,826 | | |
| | | | | | | | | | |
| | | | | |
Capital Grants | | | | | | | | | | |
Right to Information (RTI)-Office of Information Commissioner | | 05 | | 750 | | | | 750 | | |
| | | | | | | | | | |
Total Capital Grants | | | | | | | | 750 | | |
| | | | | | | | | | |
TOTAL JUSTICE AND ATTORNEY-GENERAL | | | | | | 201,534 | | |
| | | | | | | | | | |
| | | | | |
PUBLIC TRUST OFFICE | | | | | | | | | | |
| | | | | |
Property, Plant and Equipment | | | | | | | | | | |
New office buildings | | 05 | | 2,700 | | | | 2,700 | | |
Property, plant and equipment | | 05 | | | | | | 567 | | Ongoing |
Building Improvements | | 05 | | | | | | 1,300 | | Ongoing |
| | | | | | | | | | |
Total Property, Plant and Equipment | | | | | | | | 4,567 | | |
| | | | | | | | | | |
| | | | | |
Other Capital Expenditure | | | | | | | | | | |
Computer software | | 05 | | | | | | 1,355 | | Ongoing |
| | | | | | | | | | |
Total Other Capital Expenditure | | | | | | | | 1,355 | | |
| | | | | | | | | | |
TOTAL PUBLIC TRUST OFFICE | | | | | | | | 5,922 | | |
| | | | | | | | | | |
| | | | | |
LEGAL AID QUEENSLAND | | | | | | | | | | |
| | | | | |
Property, Plant and Equipment | | | | | | | | | | |
Leasehold improvements | | 05 | | | | | | 731 | | Ongoing |
Brisbane building - minor works | | 05 | | | | | | 225 | | Ongoing |
Office equipment | | 05 | | | | | | 800 | | Ongoing |
Vehicle replacement | | 05 | | | | | | 414 | | Ongoing |
| | | | | | | | | | |
Total Property, Plant and Equipment | | | | | | | | 2,170 | | |
| | | | | | | | | | |
| | | | |
| | | Capital Statement 2009 10 | | 97 |
Justice and Attorney General
| | | | | | | | | | |
Project | | Statistical
Division | | Total
Estimated
Cost
$’000 | | Expenditure
to
30-06-09
$’000 | | Budget
2009-10
$’000 | | Post
2009-10
$’000 |
Other Capital Expenditure | | | | | | | | | | |
Core Business System technical redevelopment | | 05 | | | | | | 675 | | Ongoing |
| | | | | | | | | | |
Total Other Capital Expenditure | | | | | | | | 675 | | |
| | | | | | | | | | |
TOTAL LEGAL AID QUEENSLAND | | | | | | | | 2,845 | | |
| | | | | | | | | | |
| | | | | |
CRIME AND MISCONDUCT COMMISSION | | | | | | | | | | |
| | | | | |
Property, Plant and Equipment | | | | | | | | | | |
Vehicle replacements | | 05 | | | | | | 545 | | Ongoing |
Computer and other equipment | | 05 | | | | | | 1,376 | | Ongoing |
| | | | | | | | | | |
Total Property, Plant and Equipment | | | | | | | | 1,921 | | |
| | | | | | | | | | |
TOTAL CRIME AND MISCONDUCT COMMISSION | | | | | | | | 1,921 | | |
| | | | | | | | | | |
| | | | | |
ANTI-DISCRIMINATION COMMISSION | | | | | | | | | | |
| | | | | |
Property, Plant and Equipment | | | | | | | | | | |
Property, plant and equipment | | 05 | | | | | | 30 | | Ongoing |
| | | | | | | | | | |
Total Property, Plant and Equipment | | | | | | | | 30 | | |
| | | | | | | | | | |
TOTAL ANTI-DISCRIMINATION COMMISSION | | | | | | | | 30 | | |
| | | | | | | | | | |
TOTAL JUSTICE AND ATTORNEY GENERAL | | | | | | | | 212,252 | | |
| | | | | | | | | | |
| | | | |
98 | | Capital Statement 2009 10 | | |
LEGISLATIVE ASSEMBLY OF QUEENSLAND
Capital outlays in property, plant and equipment are critical to the delivery of the Legislative Assembly and Parliamentary Service output. The 2009-10 capital program of $4.1 million is principally allocated to the continuing replacement of major air conditioning plant within the Parliamentary Precinct and the completion of the upgrade of the toilet facilities on Members’ office floors. Other major capital projects include an upgrade of the toilet facilities on Level 7 of the Parliamentary Annexe, the replacement of major water and sewerage pipes within the Parliamentary Precinct, along with the upgrade and replacement of major information technology infrastructure, including the Legislative Assembly Chamber systems. Funding is also directed to the ongoing Parliament House Stonework Restoration Program, and a range of minor capital works projects designed to improve the functionality and performance of existing building infrastructure.
Legislative Assembly of Queensland
| | | | | | | | | | |
Project | | Statistical
Division | | Total
Estimated
Cost
$’000 | | Expenditure
to
30-06-09
$’000 | | Budget
2009-10
$’000 | | Post
2009-10
$’000 |
LEGISLATIVE ASSEMBLY OF QUEENSLAND | | | | | | | | | | |
| | | | | |
Property, Plant and Equipment | | | | | | | | | | |
Parliament House Stonework Restoration Program | | 05 | | 3,664 | | 2,814 | | 250 | | 600 |
Air-conditioning - upgrade and replacement | | 05 | | 1,000 | | 200 | | 200 | | 600 |
Members’ office floors - toilet facilities upgrade | | 05 | | 1,236 | | 618 | | 618 | | |
Refurbishment of Level 7 toilet amenities | | 05 | | 400 | | | | 400 | | |
Sewerage and water pipe replacement program | | 05 | | 250 | | | | 250 | | |
Replacement of ICT hardware and software | | 05 | | | | | | 845 | | Ongoing |
Minor capital works - plant and equipment | | 05 | | | | | | 1,572 | | Ongoing |
| | | | | | | | | | |
Total Property, Plant and Equipment | | | | | | | | 4,135 | | |
| | | | | | | | | | |
TOTAL LEGISLATIVE ASSEMBLY OF QUEENSLAND | | | | 4,135 | | |
| | | | | | | | | | |
| | | | |
| | | Capital Statement 2009 10 | | 99 |
OFFICE OF THE GOVERNOR
During 2009-10, the Office of the Governor will expend $35,000 towards capital replacements including motor vehicles and office equipment.
Ongoing replacement of capital items enables the Governor to undertake the full range of duties expected of the Head of State.
Office of the Governor
| | | | | | | | | | |
Project | | Statistical
Division | | Total
Estimated
Cost
$’000 | | Expenditure
to
30-06-09
$’000 | | Budget
2009-10
$’000 | | Post
2009-10
$’000 |
OFFICE OF THE GOVERNOR | | | | | | | | | | |
| | | | | |
Property, Plant and Equipment | | | | | | | | | | |
Asset replacement | | 05 | | | | | | 35 | | Ongoing |
| | | | | | | | | | |
Total Property, Plant and Equipment | | | | | | | | 35 | | |
| | | | | | | | | | |
TOTAL OFFICE OF THE GOVERNOR | | | | | | | | 35 | | |
| | | | | | | | | | |
| | | | |
100 | | Capital Statement 2009 10 | | |
OFFICE OF THE OMBUDSMAN
The Office has budgeted to spend $80,000 on plant and equipment consisting of computer equipment, general office equipment and upgrading the complaints management system.
Office of the Ombudsman
| | | | | | | | | | |
Project | | Statistical
Division | | Total
Estimated
Cost
$’000 | | Expenditure
to
30-06-09
$’000 | | Budget
2009-10
$’000 | | Post
2009-10
$’000 |
OFFICE OF THE OMBUDSMAN | | | | | | | | | | |
| | | | | |
Property, Plant and Equipment | | | | | | | | | | |
Computer equipment | | 05 | | | | | | 45 | | Ongoing |
Office equipment | | 05 | | | | | | 20 | | Ongoing |
| | | | | | | | | | |
Total Property, Plant and Equipment | | | | | | | | 65 | | |
| | | | | | | | | | |
| | | | | |
Other Capital Expenditure | | | | | | | | | | |
Upgrade of Office’s Complaints Management System | | 05 | | | | | | 15 | | Ongoing |
| | | | | | | | | | |
Total Other Capital Expenditure | | | | | | | | 15 | | |
| | | | | | | | | | |
TOTAL OFFICE OF THE OMBUDSMAN | | | | | | | | 80 | | |
| | | | | | | | | | |
| | | | |
| | | Capital Statement 2009 10 | | 101 |
POLICE
The Queensland Police Service (QPS) capital program for 2009-10 is $223.5 million. This investment will fund infrastructure activities including capital works, information technology and other essential equipment. The QPS is committed to providing a safe and secure environment that supports the Government’s Toward Q2 ambitions, particularly Fair - Supporting safe and caring communities.
Department of Police
Program Highlights
| • | | $57 million is provided to construct new and replacement facilites across the State to ensure QPS remains well positioned now and into the future. Key projects for 2009-10 include $8 million for the completion of new police stations at Carseldine, Crestmead/Marsden, Reedy Creek/Robina, Sippy Downs and Springfield; $11.3 million for the continuation of joint projects with the Department of Justice and Attorney-General to deliver replacement court facilities, police stations and watchhouses at Mareeba and Ipswich; $11.2 million for a replacement police station and watchhouse at Murgon, a replacement station at Holland Park, and the refurbishment of Beenleigh Police Station; and $3 million to initiate development of a replacement police station at Lockhart River. |
| • | | An additional $4.3 million in funding has been provided by the Australian Government for police housing in Aurukun, Doomadgee, Mornington Island and Woorabinda as part of the Improved Policing in Very Remote Areas Program. |
| • | | $100.6 million is provided to continue essential information and communication technology projects including Policelink, a new police contact centre for non-urgent calls. Another key project being progressed is the Public Safety Network which will provide data transfer capabilities between the QPS, the Department of Justice and Attorney-General and the Department of Community Safety. This funding will also see the delivery of the Digital Integrated Traffic Camera system, (which provides enhancements in digital camera technology) and continuation of work on the Computer Aided Dispatch (CAD) project to improve police response capabilities. |
| • | | $18 million will be invested as part of the Government’s commitment to build a new Queensland Police Academy at Wacol. This funding will include the delivery of a driver training facility. |
| • | | $43.5 million is provided for other plant and equipment, which includes motor vehicles and equipment for operational police. |
| | | | |
102 | | Capital Statement 2009 10 | | |
Police
| | | | | | | | | | |
Project | | Statistical
Division | | Total
Estimated
Cost
$’000 | | Expenditure
to
30-06-09
$’000 | | Budget
2009-10
$’000 | | Post
2009-10
$’000 |
DEPARTMENT OF POLICE | | | | | | | | | | |
| | | | | |
Property, Plant and Equipment | | | | | | | | | | |
Major Capital | | | | | | | | | | |
Beenleigh - police station refurbishment | | 07 | | 3,450 | | 530 | | 2,920 | | |
Camp Hill/Carina - replacement police station | | 05 | | 2,501 | | 63 | | 2,438 | | |
Carseldine - new police station | | 05 | | 6,473 | | 4,511 | | 1,962 | | |
Charleville - replacement of station and refurbishment of watchhouse | | 25 | | 5,998 | | 4,487 | | 1,511 | | |
Coomera - new district office | | 07 | | 10,025 | | 7,325 | | 2,700 | | |
Crestmead / Marsden - new police station | | 05 | | 5,000 | | 4,100 | | 900 | | |
Fortitude Valley - replacement police station | | 05 | | 13,200 | | 12,000 | | 1,200 | | |
Fortitude Valley - heritage building refurbishment | | 05 | | 2,800 | | 564 | | 2,236 | | |
Holland Park - replacement police station | | 05 | | 5,900 | | 5,550 | | 350 | | |
Ipswich - replacement police station and watchhouse | | 05 | | 18,979 | | 13,847 | | 5,132 | | |
Kawana Waters - replacement water police facility | | 09 | | 100 | | | | 100 | | |
Lockhart River - replacement police station | | 50 | �� | 10,000 | | | | 3,000 | | 7,000 |
Mareeba - replacement station and watchhouse | | 50 | | 7,400 | | 1,266 | | 6,134 | | |
Murgon - replacement police station / watchhouse | | 15 | | 8,760 | | 828 | | 7,932 | | |
Reedy Creek/Robina - new police station | | 07 | | 3,396 | | 3,090 | | 306 | | |
Sippy Downs - new police station | | 09 | | 2,420 | | 1,220 | | 1,200 | | |
Springfield - new police station | | 05 | | 4,185 | | 509 | | 3,676 | | |
Thursday Island - station extensions | | 50 | | 1,147 | | 63 | | 1,084 | | |
Other Major Capital | | Various | | | | | | 344 | | Ongoing |
| | | | | | | | | | |
Sub-total Major Capital | | | | | | | | 45,125 | | |
| | | | | | | | | | |
| | | | |
| | | Capital Statement 2009 10 | | 103 |
Police
| | | | | | | | | | |
Project | | Statistical
Division | | Total
Estimated
Cost
$’000 | | Expenditure
to
30-06-09
$’000 | | Budget
2009-10
$’000 | | Post
2009-10
$’000 |
Sub-Programs | | | | | | | | | | |
Land bank | | Various | | | | | | 1,000 | | Ongoing |
Small station program | | Various | | | | | | 1,200 | | Ongoing |
Upgrade of establishment | | Various | | | | | | 800 | | Ongoing |
Watchhouses - CCTV program | | Various | | | | | | 1,904 | | Ongoing |
| | | | | | | | | | |
Sub-total Sub-Programs | | | | | | | | 4,904 | | |
| | | | | | | | | | |
| | | | | |
Housing Program | | | | | | | | | | |
Aurukun - new residences | | 50 | | 2,800 | | 2,100 | | 700 | | |
Doomadgee - new residences | | 50 | | 1,600 | | 900 | | 700 | | |
Mornington Island - new residences | | 50 | | 3,750 | | 2,195 | | 1,555 | | |
Woorabinda - new residences | | 50 | | 3,590 | | 2,290 | | 1,300 | | |
Policing Indigenous Communities - Kowanyama | | 50 | | 3,000 | | 300 | | 2,700 | | |
Housing Program | | Various | | | | | | 1,300 | | Ongoing |
| | | | | | | | | | |
Sub-total Housing Program | | | | | | | | 8,255 | | |
| | | | | | | | | | |
| | | | | |
Minor Works | | | | | | | | | | |
Minor Works | | Various | | | | | | 3,000 | | Ongoing |
Other Property, Plant and Equipment | | | | | | | | | | |
Information and Communication Technology | | 05 | | | | | | 48,956 | | Ongoing |
Other plant and equipment (includes motor vehicles and resourcing equipment) | | Various | | | | | | 43,530 | | Ongoing |
Queensland Police Academy | | 05 | | 451,689 | | 27,531 | | 18,000 | | 406,158 |
| | | | | | | | | | |
Total Property, Plant and Equipment | | | | | | | | 171,770 | | |
| | | | | | | | | | |
| | | | | |
Other Capital Expenditure | | | | | | | | | | |
Intangibles - Information and Communication Technology | | 05 | | | | | | 51,688 | | Ongoing |
| | | | | | | | | | |
Total Other Capital Expenditure | | | | | | | | 51,688 | | |
| | | | | | | | | | |
TOTAL DEPARTMENT OF POLICE | | | | | | | | 223,458 | | |
| | | | | | | | | | |
| | | | |
104 | | Capital Statement 2009 10 | | |
PREMIER AND CABINET
The estimated 2009-10 capital expenditure for the Department of the Premier and Cabinet including all associated organisations is $116.2 million.
Premier and Cabinet
The department’s capital expenditure in 2009-10 is $3.3 million and provides for the enhancement and replacement of office equipment and information systems required to efficiently deliver the department’s programs.
The 2009-10 financial year will also see the completion of SmartCab (Queensland’s new Cabinet Information System). The system will significantly improve Cabinet processes and will provide more timely and higher quality information to Cabinet and Ministers, Queensland Government agencies, Ministerial Officers and Cabinet Review Committees.
South Bank Corporation
The 2009-10 capital works program for South Bank Corporation is directed at enhancing the visitor experience and to the ongoing operational requirements of South Bank Corporation and the Brisbane Convention and Exhibition Centre.
The early works contract for the Brisbane Convention and Exhibition Centre expansion has been completed. The project will continue into 2009-10 and will result in approximately 24,000 square metres (50%) of additional floor space. Key components of the expanded facility are a 600 seat and a 400 seat tiered plenary hall, breakout rooms, foyer/exhibition space, and ground floor restaurant and retail uses. The total cost of this project will be $130 million.
The construction of the Stormwater Harvesting System will also continue into 2009-10. The development has been delayed due to the original planned construction site no longer being available. The Corporation is now investigating alternative locations with the intention that the project will begin in early 2010. The new system is expected to meet 78% of South Bank Parkland’s irrigation and water feature needs. The total cost of the project will be $4.6 million.
Arts Queensland
Arts Queensland will continue to deliver key arts and cultural infrastructure for Queensland, with a number of capital works initiatives.
The 2009-10 capital program includes the $2.3 million for the maintenance of the Cultural Centre Auditorium as well as $6.9 million for the Auditorium’s ongoing transformation, “The Edge”, into a creative ideas and technology centre for young people.
| | | | |
| | | Capital Statement 2009 10 | | 105 |
Library Board of Queensland
The State Library will continue to invest in collection assets for its General Reference and Heritage Collections with an injection of $1.0 million. During the 2009-10 financial year, the State Library will maintain its plant and equipment base through the investment of $0.44 million on the replacement of its existing assets.
Queensland Art Gallery
In 2009-10 the Queensland Art Gallery will invest $2.1 million to purchase works of art for the Gallery’s collection as well as expend $0.20 million to replace property, plant and equipment.
Queensland Museum
The Queensland Museum has allocated $8.8 million in 2009-10 towards capital projects including:
| • | | $1.4 million for storage and infrastructure upgrades and enhancements for the State Collection |
| • | | $6.6 million for the construction of the National Carriage Factory at the Cobb+Co Museum in Toowoomba. The project will deliver a major heritage training, crafts and skills centre as well as provide an interactive regional tourism experience. Total project cost is estimated to be $7.3 million, with funding sourced from the State Government, the Queensland Museum Board, sponsorships and donations |
| • | | $0.67 million for the Museum’s property, plant and equipment expenditure program (includes $0.40 million for new roofing at the Hendra storage facilities) |
| • | | $0.10 million for the development of the WEB Content Management System and associated services which will provide greater public access to the Museum’s unique State Collection, knowledge systems and object based learning opportunities. |
Queensland Performing Arts Trust
In 2009-10, the Queensland Performing Arts Trust will spend $0.75 million on property, plant and equipment replacement. Expenditure will predominantly relate to the rollover of production equipment in venues, particularly in the refurbished Concert Hall and Lyric Theatre. This will improve service delivery to all hirers of the venue, including commercial producers and performing arts organisations.
| | | | |
106 | | Capital Statement 2009 10 | | |
Premier and Cabinet
| | | | | | | | | | |
Project | | Statistical
Division | | Total
Estimated
Cost
$’000 | | Expenditure
to
30-06-09
$’000 | | Budget
2009-10
$’000 | | Post
2009-10
$’000 |
PREMIER AND CABINET | | | | | | | | | | |
| | | | | |
Property, Plant and Equipment | | | | | | | | | | |
Asset replacement program | | 05 | | | | | | 1,373 | | Ongoing |
| | | | | | | | | | |
Total Property, Plant and Equipment | | | | | | | | 1,373 | | |
| | | | | | | | | | |
| | | | | |
Other Capital Expenditure | | | | | | | | | | |
Information systems replacement program | | 05 | | | | | | 196 | | Ongoing |
SmartCab (Queensland’s new Cabinet Information System) | | 05 | | 2,981 | | 1,223 | | 1,758 | | |
| | | | | | | | | | |
Total Other Capital Expenditure | | | | | | | | 1,954 | | |
| | | | | | | | | | |
TOTAL PREMIER AND CABINET | | | | | | | | 3,327 | | |
| | | | | | | | | | |
| | | | | |
SOUTH BANK CORPORATION | | | | | | | | | | |
| | | | | |
Property, Plant and Equipment | | | | | | | | | | |
Brisbane Convention and Exhibition Centre expansion | | 05 | | 130,000 | | 4,000 | | 69,470 | | 56,530 |
South Bank Precinct enhancements | | 05 | | | | | | 16,331 | | Ongoing |
Storm Water Harvesting System | | 05 | | 4,600 | | 200 | | 4,400 | | |
| | | | | | | | | | |
Total Property, Plant and Equipment | | | | | | | | 90,201 | | |
| | | | | | | | | | |
TOTAL SOUTH BANK CORPORATION | | | | | | 90,201 | | |
| | | | | | | | | | |
| | | | | |
ARTS QUEENSLAND | | | | | | | | | | |
| | | | | |
Property, Plant and Equipment | | | | | | | | | | |
Cultural Centre Auditorium - “The Edge” | | 05 | | 7,900 | | 1,040 | | 6,860 | | |
Cultural Centre Auditorium - Maintenance work | | 05 | | 2,250 | | | | 2,250 | | |
| | | | | | | | | | |
Total Property, Plant and Equipment | | | | | | | | 9,110 | | |
| | | | | | | | | | |
| | | | | |
Capital Grants | | | | | | | | | | |
Other capital grants | | 05 | | 200 | | | | 200 | | |
| | | | | | | | | | |
Total Capital Grants | | | | | | | | 200 | | |
| | | | | | | | | | |
TOTAL ARTS QUEENSLAND | | | | | | | | 9,310 | | |
| | | | | | | | | | |
| | | | |
| | | Capital Statement 2009 10 | | 107 |
Premier and Cabinet
| | | | | | | | | | |
Project | | Statistical
Division | | Total
Estimated
Cost
$’000 | | Expenditure
to
30-06-09
$’000 | | Budget
2009-10
$’000 | | Post
2009-10
$’000 |
LIBRARY BOARD OF QUEENSLAND | | | | | | | | | | |
Property, Plant and Equipment | | | | | | | | | | |
Plant and equipment - general | | 05 | | | | | | 437 | | Ongoing |
Library Collections expenditure | | 05 | | | | | | 1,012 | | Ongoing |
| | | | | | | | | | |
Total Property, Plant and Equipment | | | | | | | | 1,449 | | |
| | | | | | | | | | |
TOTAL LIBRARY BOARD OF QUEENSLAND | | | | | | 1,449 | | |
| | | | | | | | | | |
| | | | | |
QUEENSLAND ART GALLERY | | | | | | | | | | |
| | | | | |
Property, Plant and Equipment | | | | | | | | | | |
Queensland Art Gallery collection | | 05 | | | | | | 2,100 | | Ongoing |
Property, plant and equipment | | 05 | | | | | | 200 | | Ongoing |
| | | | | | | | | | |
Total Property, Plant and Equipment | | | | | | | | 2,300 | | |
| | | | | | | | | | |
TOTAL QUEENSLAND ART GALLERY | | | | | | 2,300 | | |
| | | | | | | | | | |
| | | | | |
QUEENSLAND MUSEUM | | | | | | | | | | |
| | | | | |
Property, Plant and Equipment | | | | | | | | | | |
Collection Storage, Acquisition and Management | | Various | | 2,379 | | 941 | | 1,438 | | |
National Carriage Factory | | 20 | | 7,312 | | 714 | | 6,598 | | |
Property, plant and equipment - other | | Various | | | | | | 677 | | Ongoing |
| | | | | | | | | | |
Total Property, Plant and Equipment | | | | | | | | 8,713 | | |
| | | | | | | | | | |
| | | | | |
Other Capital Expenditure | | | | | | | | | | |
WEB Content Management System | | 05 | | | | | | 101 | | Ongoing |
| | | | | | | | | | |
Total Other Capital Expenditure | | | | | | | | 101 | | |
| | | | | | | | | | |
TOTAL QUEENSLAND MUSEUM | | | | | | | | 8,814 | | |
| | | | | | | | | | |
| | | | | |
QUEENSLAND PERFORMING ARTS TRUST | | | | | | | | | | |
| | | | | |
Property, Plant and Equipment | | | | | | | | | | |
Property, plant and equipment | | 05 | | | | | | 750 | | Ongoing |
| | | | | | | | | | |
Total Property, Plant and Equipment | | | | | | | | 750 | | |
| | | | | | | | | | |
TOTAL QUEENSLAND PERFORMING ARTS TRUST | | | | 750 | | |
| | | | | | | | | | |
TOTAL PREMIER AND CABINET | | | | | | | | 116,151 | | |
| | | | | | | | | | |
| | | | |
108 | | Capital Statement 2009 10 | | |
PUBLIC WORKS
The department’s capital expenditure program for 2009-10, including commercialised business units (CBUs), the Shared Service Agency (SSA) and CorpTech, is $494.9 million. Capital expenditure by the department, excluding CBUs, SSA and CorpTech is $240.5 million.
Program Highlights
| • | | $53.4 million is provided in 2009-10 to continue the construction of a new government office building in First Avenue, Maroochydore. The building will provide 8,900 square metres of net lettable area. The total project cost is estimated at $92.2 million. |
| • | | $42.1 million is allocated in 2009-10 to continue the construction of a new government office building in Hartley Street, Cairns. The building will provide 9,600 square metres of net lettable area as Stage 2 of William McCormack Place. The total project cost is estimated at $80 million. |
| • | | $34 million is allocated in 2009-10 for the completion of a new Joint Contact Centre in Zillmere, Brisbane. The building will accommodate 417 new work points for Smart Service Queensland and the Police Department. The total project cost of construction is estimated at $44.5 million. |
| • | | $23 million is provided in 2009-10 for the completion of the site infrastructure works associated with the Boggo Road Precinct redevelopment. The redevelopment contributes significantly to the Smart State initiatives by providing the infrastructure necessary for the Ecosciences Precinct and for future residential, retail, commercial and recreational facilities that will form the Boggo Road Urban Village. The old Boggo Road Gaol is retained. The total project cost is estimated at $45.5 million. |
| • | | $14.6 million is allocated in 2009-10 for the construction and upgrade of government employee housing in rural and remote areas of the State, to support the delivery of Government services in these locations. |
| • | | $10.7 million is allocated in 2009-10 to complete the final stage of the refurbishment of 63 George Street, Brisbane which will provide 10,600 square metres of net lettable area. The total project cost is estimated at $50.6 million. |
| • | | $10.5 million is allocated in 2009-10 for the construction of a new government office building on Thursday Island. The building will provide 1,100 square metres of net lettable area. The total project cost is estimated at $13.5 million. |
| | | | |
| | | Capital Statement 2009 10 | | 109 |
| • | | $8.4 million is allocated in 2009-10 to complete the construction of the Kurilpa Bridge, a new footbridge from Tank Street to Kurilpa Point, adjacent to the Queensland Gallery of Modern Art at the Queensland Cultural Centre. The total project cost is estimated at $63.3 million. |
| • | | $6.8 million is provided in 2009-10 for the Kangaroo Point TAFE redevelopment involving the demolition of the existing 1960s buildings and the development as a public park of almost 10,000 square metres. Completion of the park is expected by late November 2009 at a total cost of $8.8 million. |
| • | | QFleet will purchase motor vehicles totalling $147.3 million. The vehicles will be leased to clients to facilitate the delivery of Government services across Queensland. The vehicle purchases and associated ongoing maintenance provide support for local Queensland firms. |
| • | | CorpTech, the technology centre of skill established under the Shared Service Initiative, has a capital expenditure program in 2009-10 of $49 million. This program will provide innovative whole-of-Government corporate applications and infrastructure solutions for the shared service providers and to agencies within Government. |
Public Works
| | | | | | | | | | |
Project | | Statistical
Division | | Total
Estimated
Cost
$’000 | | Expenditure
to
30-06-09
$’000 | | Budget
2009-10
$’000 | | Post
2009-10
$’000 |
DEPARTMENT OF PUBLIC WORKS | | | | | | | | | | |
| | | | | |
Property, Plant and Equipment | | | | | | | | | | |
Brisbane - Joint Contact Centre, Zillmere | | 05 | | 44,468 | | 10,443 | | 34,025 | | |
Brisbane - Boggo Road Precinct Redevelopment | | 05 | | 45,476 | | 22,512 | | 22,964 | | |
Brisbane - 63 George Street Refurbishment | | 05 | | 50,550 | | 39,837 | | 10,713 | | |
Brisbane - Tank Street - Pedestrian/Cycle Kurilpa Bridge | | 05 | | 63,300 | | 54,926 | | 8,374 | | |
Brisbane - Redevelopment of Kangaroo Point Former TAFE site | | 05 | | 8,750 | | 2,000 | | 6,750 | | |
Brisbane Vision 2020 Accommodation Strategy - 400 George Street | | 05 | | 4,500 | | | | 4,500 | | |
Brisbane - 317 Edward Street Installation of Power Generator | | 05 | | 5,000 | | | | 4,000 | | 1,000 |
| | | | |
110 | | Capital Statement 2009 10 | | |
Public Works
| | | | | | | | | | |
Project | | Statistical
Division | | Total
Estimated
Cost
$’000 | | Expenditure
to
30-06-09
$’000 | | Budget
2009-10
$’000 | | Post
2009-10
$’000 |
Brisbane - Energy Performance Contract (Various) | | 05 | | 4,588 | | 2,161 | | 2,427 | | |
Brisbane CBD - Healthy Lifestyles in Government Office Buildings | | 05 | | 2,050 | | 160 | | 1,890 | | |
Smart Service Queensland - System Development | | 05 | | 1,827 | | | | 1,827 | | |
Brisbane -111 George Street Lift Upgrade | | 05 | | 5,400 | | 250 | | 1,500 | | 3,650 |
Smart Service Queensland - Asset Replacement | | 05 | | 20,791 | | 16,963 | | 1,257 | | 2,571 |
Brisbane - Congestion Management Strategy - End of Trip Facility | | 05 | | 1,955 | | 1,426 | | 529 | | |
Brisbane - SWARA Relocation | | 05 | | 3,800 | | 3,449 | | 351 | | |
Gold Coast Convention and Exhibition Centre - Stage 2 Extension | | 07 | | 36,000 | | 35,200 | | 800 | | |
Maroochydore - New Office Building | | 09 | | 92,200 | | 16,754 | | 53,400 | | 22,046 |
Cairns - New Office Building | | 50 | | 80,000 | | 24,886 | | 42,100 | | 13,014 |
Mareeba - New Office Building | | 50 | | 6,500 | | | | 2,000 | | 4,500 |
Mareeba - Purchase and Refurbishment of Office Building | | 50 | | 13,400 | | 12,900 | | 500 | | |
Thursday Island - New Office Building | | 50 | | 13,500 | | 2,364 | | 10,500 | | 636 |
Government Employee Housing | | Various | | | | | | 14,577 | | Ongoing |
Other Plant and Equipment | | Various | | | | | | 10,759 | | Ongoing |
Workplace Health and Safety | | Various | | | | | | 900 | | Ongoing |
Carpet Replacement Program | | Various | | | | | | 800 | | Ongoing |
Anti Discrimination Program | | Various | | | | | | 300 | | Ongoing |
| | | | | | | | | | |
Total Property, Plant and Equipment | | | | | | | | 237,743 | | |
| | | | | | | | | | |
| | | | | |
Other Capital Expenditure | | | | | | | | | | |
Whole of Government ICT Initiatives | | Various | | | | | | 2,554 | | Ongoing |
| | | | | | | | | | |
Total Other Capital Expenditure | | | | | | | | 2,554 | | |
| | | | | | | | | | |
| | | | | |
Capital Grants | | | | | | | | | | |
Mackay Convention Precinct | | 40 | | 36,301 | | 36,140 | | 161 | | |
| | | | | | | | | | |
Total Capital Grants | | | | | | | | 161 | | |
| | | | | | | | | | |
TOTAL DEPARTMENT OF PUBLIC WORKS | | | | | | 240,458 | | |
| | | | | | | | | | |
| | | | |
| | | Capital Statement 2009 10 | | 111 |
Public Works
| | | | | | | | | | |
Project | | Statistical
Division | | Total
Estimated
Cost
$’000 | | Expenditure
to
30-06-09
$’000 | | Budget
2009-10
$’000 | | Post
2009-10
$’000 |
QBUILD | | | | | | | | | | |
| | | | | |
Property, Plant and Equipment | | | | | | | | | | |
Plant and Equipment | | Various | | | | | | 865 | | Ongoing |
| | | | | | | | | | |
Total Property, Plant and Equipment | | | | | | | | 865 | | |
| | | | | | | | | | |
| | | | | |
Other Capital Expenditure | | | | | | | | | | |
Business Systems | | 05 | | 26,828 | | 18,348 | | 8,480 | | |
| | | | | | | | | | |
Total Other Capital Expenditure | | | | | | | | 8,480 | | |
| | | | | | | | | | |
TOTAL QBUILD | | | | | | | | 9,345 | | |
| | | | | | | | | | |
| | | | | |
QFLEET | | | | | | | | | | |
| | | | | |
Property, Plant and Equipment | | | | | | | | | | |
Motor Vehicles | | Various | | | | | | 147,282 | | Ongoing |
Other Plant and Equipment | | 05 | | | | | | 242 | | Ongoing |
| | | | | | | | | | |
Total Property, Plant and Equipment | | | | | | | | 147,524 | | |
| | | | | | | | | | |
| | | | | |
Other Capital Expenditure | | | | | | | | | | |
Information Systems | | 05 | | | | | | 900 | | Ongoing |
| | | | | | | | | | |
Total Other Capital Expenditure | | | | | | | | 900 | | |
| | | | | | | | | | |
TOTAL QFLEET | | | | | | | | 148,424 | | |
| | | | | | | | | | |
| | | | | |
PROJECT SERVICES | | | | | | | | | | |
| | | | | |
Property, Plant and Equipment | | | | | | | | | | |
Plant and Equipment | | Various | | | | | | 662 | | Ongoing |
| | | | | | | | | | |
Total Property, Plant and Equipment | | | | | | | | 662 | | |
| | | | | | | | | | |
| | | | | |
Other Capital Expenditure | | | | | | | | | | |
Business Systems Software | | Various | | | | | | 2,160 | | Ongoing |
| | | | | | | | | | |
Total Other Capital Expenditure | | | | | | | | 2,160 | | |
| | | | | | | | | | |
TOTAL PROJECT SERVICES | | | | | | | | 2,822 | | |
| | | | | | | | | | |
| | | | |
112 | | Capital Statement 2009 10 | | |
Public Works
| | | | | | | | | | |
Project | | Statistical
Division | | Total
Estimated
Cost
$’000 | | Expenditure
to
30-06-09
$’000 | | Budget
2009-10
$’000 | | Post
2009-10
$’000 |
SDS | | | | | | | | | | |
| | | | | |
Property, Plant and Equipment | | | | | | | | | | |
Warehouse Equipment | | 05 | | | | | | 115 | | Ongoing |
| | | | | | | | | | |
Total Property, Plant and Equipment | | | | | | | | 115 | | |
| | | | | | | | | | |
| | | | | |
Other Capital Expenditure | | 05 | | | | | | 185 | | Ongoing |
| | | | | | | | | | |
Computer Software | | | | | | | | | | |
Total Other Capital Expenditure | | | | | | | | 185 | | |
| | | | | | | | | | |
TOTAL SDS | | | | | | | | 300 | | |
| | | | | | | | | | |
| | | | | |
CITEC | | | | | | | | | | |
| | | | | |
Property, Plant and Equipment | | | | | | | | | | |
Technology Transformation Program | | 05 | | 27,700 | | 970 | | 24,400 | | 2,330 |
Plant and Equipment | | 05 | | | | | | 7,340 | | Ongoing |
| | | | | | | | | | |
Total Property, Plant and Equipment | | | | | | | | 31,740 | | |
| | | | | | | | | | |
| | | | | |
Other Capital Expenditure | | | | | | | | | | |
Proprietary Software and Internally Developed Software and Systems | | 05 | | | | | | 11,666 | | Ongoing |
| | | | | | | | | | |
Total Other Capital Expenditure | | | | | | | | 11,666 | | |
| | | | | | | | | | |
TOTAL CITEC | | | | | | | | 43,406 | | |
| | | | | | | | | | |
| | | | | |
SHARED SERVICE AGENCY | | | | | | | | | | |
| | | | | |
Property, Plant and Equipment | | | | | | | | | | |
Asset Replacement | | 05 | | | | | | 1,079 | | Ongoing |
| | | | | | | | | | |
Total Property, Plant and Equipment | | | | | | | | 1,079 | | |
| | | | | | | | | | |
TOTAL SHARED SERVICE AGENCY | | | | | | | | 1,079 | | |
| | | | | | | | | | |
| | | | | |
CORP TECH | | | | | | | | | | |
| | | | | |
Property, Plant and Equipment | | | | | | | | | | |
Asset Replacement | | 05 | | | | | | 600 | | Ongoing |
| | | | | | | | | | |
Total Property, Plant and Equipment | | | | | | | | 600 | | |
| | | | | | | | | | |
| | | | |
| | | Capital Statement 2009 10 | | 113 |
Public Works
| | | | | | | | | | |
Project | | Statistical
Division | | Total
Estimated
Cost
$’000 | | Expenditure
to
30-06-09
$’000 | | Budget
2009-10
$’000 | | Post
2009-10
$’000 |
Other Capital Expenditure | | | | | | | | | | |
Corporate Solutions Program of Works | | 05 | | 241,918 | | 193,486 | | 48,432 | | |
| | | | | | | | | | |
Total Other Capital Expenditure | | | | | | | | 48,432 | | |
| | | | | | | | | | |
TOTAL CORP TECH | | | | | | | | 49,032 | | |
| | | | | | | | | | |
TOTAL PUBLIC WORKS | | | | | | | | 494,866 | | |
| | | | | | | | | | |
| | | | |
114 | | Capital Statement 2009 10 | | |
QUEENSLAND AUDIT OFFICE
Queensland Audit Office’s current accommodation lease expires at March 2010. The fitout costs under the new lease arrangements are expected to be $1.0 million. Information Standard 40 requires the implementation of an electronic document record management solution to appropriately manage all types of records and the estimated cost to progress this project is $0.14 million. Minor works expenditure of $0.25 million is to maintain and replace current office and IT equipment.
Queensland Audit Office
| | | | | | | | | | |
Project | | Statistical
Division | | Total
Estimated
Cost
$’000 | | Expenditure
to
30-06-09
$’000 | | Budget
2009-10
$’000 | | Post
2009-10
$’000 |
QUEENSLAND AUDIT OFFICE | | | | | | | | | | |
| | | | | |
Property, Plant and Equipment | | | | | | | | | | |
Fit out of Leased Accommodation | | 05 | | 1,000 | | | | 1,000 | | |
Minor works | | 05 | | | | | | 252 | | Ongoing |
| | | | | | | | | | |
Total Property, Plant and Equipment | | | | | | | | 1,252 | | |
| | | | | | | | | | |
| | | | | |
Other Capital Expenditure | | | | | | | | | | |
Operational Recordkeeping | | 05 | | 140 | | | | 140 | | |
| | | | | | | | | | |
Total Other Capital Expenditure | | | | | | | | 140 | | |
| | | | | | | | | | |
TOTAL QUEENSLAND AUDIT OFFICE | | | | | | | | 1,392 | | |
| | | | | | | | | | |
| | | | |
| | | Capital Statement 2009 10 | | 115 |
TRANSPORT AND MAIN ROADS
Transport
Queensland Transport’s capital expenditure program for 2009-10 totals $751.4 million and predominantly comprises investment in public transport infrastructure and systems.
Program Highlights
In the 2009-10 Budget, the Government continues to progress the implementation of the SEQIPP. Some major projects included in the SEQIPP initiative are:
| • | | $171.8 million towards construction of the Northern Busway between Enoggera Creek and Kedron |
| • | | $138.2 million has been allocated for the construction of the Eastern Busway connection between Buranda and Main Avenue at Coorparoo |
| • | | $135 million towards the Gold Coast Rapid Transit System project which involves delivery of stages of a light rail project from Parkwood to Broadbeach |
| • | | $37.8 million towards construction of the Eastern Busway: Princess Alexandra Hospital to Buranda. Construction will include an elevated busway station within the Princess Alexandra Hospital and will be a key link in the regional busway network |
| • | | $13.2 million to complete the Transit Oriented Development (TOD) being delivered in parallel with new Varsity Lakes rail station. |
Other major capital projects are:
| • | | $43.1 million towards the New Queensland Driver Licence project. The new driver licence is based on a modern licensing system which will deliver a number of benefits to both Government and licence holders |
| • | | $12.7 million commitment provided under the Urban Congestion Initiative to implement a number of new strategies to reduce urban congestion on arterial roads across SEQ. |
Translink Transit Authority
TransLink’s capital expenditure program for 2009-10 totals $47.4 million and predominantly entails investment in public transport infrastructure across Queensland.
Program Highlights
| • | | $33 million towards the Translink Station Upgrade Program. This program aim to make passenger waiting environments at stations safe, comfortable and easy to use. Expenditure within the program will be used to improve current bus stations and build additional bus station infrastructure. |
| | | | |
116 | | Capital Statement 2009 10 | | |
| • | | $6 million towards the Real Time Passenger Information System (RTPIS). RTPIS is a project to deliver a system that will track and monitor buses and ferries within the TransLink network. Within 2009-10 RTPIS will be deployed and evaluated on 100 SunBus buses on the Sunshine Coast. |
QR Limited
QR Limited is allocating $2.088 billion for capital outlays in 2009-10 in Queensland.
Program Highlights
| • | | $515 million to upgrade infrastructure and rollingstock on the Citytrain network as part of SEQIPP including: |
| | • | | Springfield Line construction $125 million; |
| | • | | Extension of the Gold Coast railway from Robina to Varsity Lakes $97.3 million; |
| | • | | MetTRIP track infrastructure - predominantly the Caboolture to Beerburrum duplication $62.7 million; |
| | • | | Corinda to Darra: Third Track $57 million; |
| | • | | Metropolitan Freight Capacity Enhancement $17.9 million; and |
| | • | | Additional rollingstock (102 x 3 car units) to deliver substantial service enhancements between the Gold Coast, Brisbane and the Sunshine Coast $155.1 million. |
| • | | $862 million for coal network track works and new and upgraded locomotives and wagons. All works are to support the haulage of coal in central Queensland: |
| | • | | Jilalan Yard Upgrade $178.3 million; |
| | • | | Procurement of 10 New Diesel Locomotives (4100 Class) $54 million; |
| | • | | Vermont Spur and Balloon Loop $41.6 million; |
| | • | | Coppabella to Ingsdon Duplication $34 million; |
| | • | | Goonyella to Abbot Point Expansion Initial Infrastructure Works $29.9 million; |
| | • | | Electric Locomotives Upgrade Program $26 million; |
| | • | | Grantleigh to Tunnel Duplication $21.1 million; |
| | • | | Coal Electric Locomotives Fleet Upgrade - Stages 1 and 2 $20.9 million; |
| | | | |
| | | Capital Statement 2009 10 | | 117 |
| | • | | 12 and 16 Cylinder Loco Overhauls Coal $19.1 million; |
| | • | | Fabrication of 15 New Diesel Locomotives (4100 Class) $15.3 million; |
| | • | | Dalrymple Bay Coal Terminal: 3rd Loop $14.3 million; and |
| | • | | Fabrication of 1,190 New Coal Wagons (VCA 106T) $13.2 million. |
| • | | In excess of $40 million to improve safety at public level crossings including: |
| | • | | completion of the program to upgrade (predominantly via the installation of boom gates) 66 high risk public level crossings on the Queensland rail network $28.5 million; and |
| | • | | upgrade eight Priority Level Crossings in North Queensland, between Farleigh and Garradunga $9.8 million. |
| • | | Other major capital projects are: |
| | • | | $34.5 million for the replacement of aged and maintenance intensive bridges including the replacement of the St Lawrence River Bridge at St Lawrence on the North Coast Line; |
| | • | | $18.5 million to modify and improve QR facilities and infrastructure for rail travel for disabled persons as prescribed by the Disability Discrimination Act 1992 and to modify the Electric Multiple Unit, Suburban Multiple Unit and Inter Urban Multiple Unit fleets to meet disability standards for Accessible Public Transport 2007 compliance requirements; |
| | • | | $14 million for Albion Station Land Bridge, construction of an 8 metre wide land bridge on the rail corridor; and |
| | • | | $12 million for Jondaryan Track Upgrade to replace some track components between Jondaryan and Gatton, formation stabilisation between Jondaryan and Toowoomba as well as timber bridge elimination between Jondaryan and Gatton. |
Port of Brisbane Corporation Limited
In 2009-10, Port of Brisbane Corporation Limited has allocated $215.9 million for the continuing development of the Port of Brisbane and the Port of Bundaberg. This allocation is driven predominately by the Hamilton Site Redevelopment Program and construction of additional berths at Fisherman Islands, in order to accommodate the long term development across a range of commodity areas.
Program Highlights
| • | | $26 million for the construction of berth and wharf 11 and 12 at Fisherman Islands to accommodate increasing trade throughput at the Port of Brisbane. |
| | | | |
118 | | Capital Statement 2009 10 | | |
| • | | $10 million for the continuation of the Hamilton Site Redevelopment Program. |
| • | | $4.7 million to construct a bridge across the Burnett River to ensure all weather access to the Port of Bundaberg. |
| • | | $20 million for ground improvements at Bishop Drive Estate, Port of Brisbane. |
Cairns Ports
In 2009-10, Cairns Ports Limited has allocated $16.5 million towards new and continuing Seaport development.
Program Highlights
| • | | $9.4 million to design and construct a Cruise Facility Terminal at the existing heritage cargo sheds (Numbers 2 and 3) at the Port of Cairns. |
| • | | $5 million to construct a Maritime Training College at Tingira Street, Cairns. |
Gladstone Ports Corporation
In 2009-10, Gladstone Ports Corporation Limited has allocated $108.6 million towards the ongoing expansion of the ports at Gladstone and Rockhampton.
Program Highlights
| • | | $38.2 million towards ongoing works at the RG Tanna Coal Terminal at the Port of Gladstone. |
| • | | $27.4 million for general works around the Port of Gladstone, including road rebuilding, land reclamation and mobile plant replacements. |
| • | | $7 million for projects relating to the modification of the shiploading facilities at Auckland Point. |
Mackay Ports
In 2009-10, Mackay Ports Limited has allocated $14.1 million for the development and continued upgrading of port infrastructure.
Program Highlights
| • | | $4.5 million for enhancement of major infrastructure. |
| • | | $2.1 million for the upgrade of high voltage and low voltage assets at the Port of Mackay. |
| • | | $1.9 million for the Harbour Road redevelopment. |
| | | | |
| | | Capital Statement 2009 10 | | 119 |
Ports Corporation of Queensland Limited
In 2009-10, Ports Corporation of Queensland Limited has allocated $349.8 million for various port development projects.
Program Highlights
| • | | $287.9 million for the Abbot Point Coal Terminal X50 Expansion, which will increase the capacity of the terminal to 50 million tonnes per annum. |
| • | | $23.5 million for refurbishment of stacker-reclaimers 1 and 2 in relation to the Abbot Point Coal Terminal Expansion project. |
| • | | $17 million for the Abbot Point Coal Terminal X25 Expansion to increase the capacity of the terminal to 25 million tonnes per annum. |
Port of Townsville
Port of Townsville Limited has allocated $11.0 million for plant acquisition, infrastructure development and port improvements during the 2009-10 financial year.
Program Highlights
| • | | $3.4 million to increase structural security of Berth 4 to ensure the berth can cope with increased service loading. |
| • | | $2.6 million for review of the existing High Density Polyethylene fire line system to ensure the system is compliant with Australian Standards and Codes. |
| • | | $1.4 million for Berth 1 Services Jetty Duplication for the provision of additional access and pipe racks along the north side of the existing access road. |
Main Roads
The Queensland Government is committed to delivering a roads program that supports Queensland’s growing population, while managing urban traffic growth and congestion. The 2009-10 infrastructure program, which amounts to $3.530 billion and which includes Queensland Motorways Limited and RoadTek, will help sustain jobs throughout the state and continue the critical infrastructure already underway. Key service delivery priorities for Main Roads in 2009-10 are:
| • | | develop and implement initiatives to improve safety for users of the transport system |
| • | | manage the impact of urban traffic growth |
| • | | deliver the Government’s road infrastructure commitments, through SEQIPP, the Roads Implementation Program and other major capital works programs |
| | | | |
120 | | Capital Statement 2009 10 | | |
| • | | plan and prioritise future works to meet long term needs of industry and the community |
| • | | preserve, maintain and operate the state controlled road network to improve the reliability of service to industry and the community |
| • | | maintaining and improving quality of life for Queenslanders by providing connectivity to employment, health, education and services. |
Main Roads’ capital program reflects yet another major commitment by the State Government to the transport needs of Queensland. It continues the commitment to SEQIPP, as well as continuation of the enhanced capital works programs across the rest of the state.
Road safety is an integral part of all new works undertaken by Main Roads. Safer Roads Sooner aims to address the road toll and reduce the number of people who sustain serious injuries in road crashes. The State Government is providing $66 million in 2009-10 through Safer Roads Sooner, which includes $4 million to specifically target motorcycle safety.
Program Highlights
| • | | $650 million is provided towards the federally funded Ipswich Motorway upgrade between Dinmore and Goodna, at a total estimated cost of $1.95 billion. |
| • | | $259.2 million is provided to construct a second Gateway Bridge river crossing and to increase capacity on the Gateway Motorway, between Mt Gravatt-Capalaba Road and Nudgee Road, at a total estimated cost of $1.883 billion. |
| • | | $236 million is provided to commence the upgrading of the Bruce Highway between Cooroy and Curra (Section B - Sankeys Road to Traveston Road), at a total estimated cost of $613 million ($125 million - State, $488 million Australian Government). |
| • | | $130 million is provided to continue the federally-funded Ipswich Motorway upgrade between Wacol and Darra, at a total estimated cost of $700 million. |
| • | | $125 million is provided to continue construction of the new Houghton Highway duplication between Brighton and Redcliffe, at a total estimated cost of $315 million. |
| • | | $119.7 million is provided towards the Centenary Highway duplication between Springfield and Darra, to meet the existing Logan Motorway Interchange at Carole Park, in conjunction with the Darra to Springfield rail extension, at a total estimated cost of $414.6 million. |
| | | | |
| | | Capital Statement 2009 10 | | 121 |
| • | | $93.5 million is provided to upgrade the Pacific Motorway between Springwood South and Daisy Hill, at a total estimated cost of $421.6 million ($211.6 million - -State, $210 million - Australian Government). |
| • | | $47.3 million is provided to continue the construction of the jointly-funded Townsville Port Access Road, at a total estimated cost of $190 million ($95 million - State, $95 million - Australian Government). |
| • | | $37.6 million is provided towards the duplication of the Forgan Bridge in Mackay, at a total estimated cost of $148 million. |
| • | | $36 million is provided towards the realignment of the Dawson Highway at the Calliope Range, west of Gladstone, at a total estimated cost of $70 million. |
| • | | $35.2 million is provided to continue interchange improvements on the Pacific Motorway at Robina and Varsity Lakes, at a total estimated cost of $142 million ($72 million - State, $70 million - Australian Government). |
| • | | $32 million is provided to commence widening the Labrador - Carrara Road (Olsen Avenue), between Melia Court and Smith Street Connection Road, at a total estimated cost of $126.2 million. |
| • | | $30 million is provided towards widening the Gold Coast Highway to four lanes, between Government Road and Robert Street, at a total estimated cost of $127 million. |
| • | | $16.7 million is provided towards widening the Gregory Developmental Road from north of One Mile Gin Creek to south of Ryans Creek, and at Fletcher Creek, south of Bluff Downs Road, at a total cost of $23.3 million. |
| • | | $16 million is provided to complete widening on the Maryborough-Hervey Bay Road, between Torbanlea turn-off and Dundowran Road, south of Pialba, at a total estimated cost of $17.1 million. |
| • | | $12.1 million is provided to complete the construction of the Bundaberg Ring Road, at a total estimated cost of $100 million. |
| • | | $11.3 million is provided to complete construction of a new bridge and approaches on the Endeavour Valley Road at Endeavour River, west of Cooktown, at a total estimated cost of $15 million. |
| • | | $11.3 million is provided towards replacing the bridges across the Don River and approaches on the Leichhardt Highway, south of Wowan, at a total estimated cost of $65 million. |
| • | | $11 million is provided to complete construction of a new two-lane sealed road on the new Abbot Street (South Townsville Road) alignment, between Oonoonba Road and River Boulevard, at a total estimated cost of $11.6 million. |
| | | | |
122 | | Capital Statement 2009 10 | | |
| • | | $9 million is provided towards upgrading the Kennedy Developmental Road between Three Ways and The Lynd, south of Mt Garnet, at a total estimated cost of $31.5 million. |
| • | | $8.8 million is provided towards the upgrade of the Warrego Highway from Mitchell towards Roma to allow Type 2 road train access. |
| • | | $8.7 million is provided in federal funding to commence four-laning works on the Bruce Highway southern approaches to Mackay, between Temples Lane and Farrellys Lane, at a total estimated cost of $33.3 million. |
| • | | $8 million is provided to complete construction of the Joint Levee Road between Sams Road and Barnes Creek Road in North Mackay, at a total estimated cost of $20 million. |
| • | | $5.8 million is provided to complete widening and sealing on the New England Highway, between Munro Road and Pioneer Road, south of Crows Nest, at a total estimated cost of $9.5 million. |
| • | | $5.7 million is provided to complete improvements on the New England Highway at the Ruthven Street and Jellicoe Street intersection, at a total estimated cost of $9.7 million. |
| • | | $5.3 million is provided to complete paving and sealing sections on the Roma -Taroom Road, north east of Roma, at a total estimated cost of $29.7 million. |
| • | | $4.5 million is provided to complete sealing on the Aramac - Torrens Creek Road, south of Torrens Creek, at a total estimated cost of $14.4 million. |
| • | | $4.5 million is provided to pave and seal a 15 kilometre section of the Wills Developmental Road, north of Gregory. |
| • | | $4.4 million is provided to complete widening, repairing and strengthening the Flinders Highway at Jardine Valley, west of Charters Towers, at a total estimated cost of $8.8 million. |
| • | | $4 million is provided to complete widening and sealing on the Carnavon Highway, north of Injune, at a total estimated cost of $4.9 million. |
| • | | $3.5 million is provided for paving and sealing sections of the Diamantina Developmental Road, between Bedourie and Boulia, at a total estimated cost of $6.2 million. |
| • | | $2.4 million is provided for resealing sections of the Diamantina Developmental Road, between Quilpie and Windorah, at a total estimated cost of $2.9 million. |
| | | | |
| | | Capital Statement 2009 10 | | 123 |
Transport and Main Roads
| | | | | | | | | | |
Project | | Statistical
Division | | Total
Estimated
Cost
$’000 | | Expenditure
to
30-06-09
$’000 | | Budget
2009-10
$’000 | | Post
2009-10
$’000 |
| TRANSPORT | | | | | | | | | | |
| | | | | |
| Property, Plant and Equipment | | | | | | | | | | |
Public Transport Infrastructure | | | | | | | | | | |
Gold Coast Rapid Transit System1 (Parkwood to Broadbeach) | | 07 | | 948,741 | | 36,166 | | 135,000 | | 777,575 |
Varsity Station Urban Village TOD | | 07 | | 23,733 | | 10,501 | | 13,232 | | |
South East Queensland High Occupancy Vehicle Program (Planning Phase Only) | | Various | | 3,477 | | 590 | | 2,887 | | |
Transport Corridor Acquisitions - SEQ | | Various | | | | | | 115,384 | | Ongoing |
South East Queensland Cycle Network | | 05 | | | | | | 9,941 | | Ongoing |
| | | | | | | | | | |
Sub-total Public Transport Infrastructure | | | | | | | | 276,444 | | |
| | | | | | | | | | |
| | | | | |
Busways | | | | | | | | | | |
Northern Busway: Enoggera Creek to Kedron | | 05 | | 734,700 | | 289,009 | | 171,800 | | 273,891 |
Eastern Busway: Buranda to Coorparoo (Stage 2A) | | 05 | | 465,794 | | 111,288 | | 138,244 | | 216,262 |
Eastern Busway: Princess Alexandra Hospital to Buranda | | 05 | | 137,800 | | 100,000 | | 37,800 | | |
Northern Busway: Kedron to Chermside (Concept Stage) | | 05 | | 20,000 | | | | 20,000 | | |
| | | | | | | | | | |
Sub-total Busways | | | | | | | | 367,844 | | |
| | | | | | | | | | |
| | | | | |
Maritime Infrastructure | | | | | | | | | | |
Townsville & REEFVTS project | | 45 | | 2,500 | | 1,242 | | 1,258 | | |
Townsville VHF Communications upgrade | | 45 | | 620 | | 123 | | 497 | | |
Boating Infrastructure Minor Works | | Various | | | | | | 5,077 | | Ongoing |
Marine Safety Minor Works | | Various | | | | | | 2,338 | | Ongoing |
| | | | | | | | | | |
Sub-total Maritime Infrastructure | | | | | | | | 9,170 | | |
| | | | | | | | | | |
| | | | | |
Other Property, Plant and Equipment | | | | | | | | | | |
Urban Congestion Initiative | | 05 | | 26,020 | | | | 12,730 | | 13,290 |
Gladstone CSC | | 30 | | 1,736 | | 512 | | 1,224 | | |
Cairns CSC | | 50 | | 900 | | | | 300 | | 600 |
Infrastructure Replacement Upgrades | | 05 | | | | | | 9,415 | | Ongoing |
Departmental Plant and Equipment | | Various | | | | | | 1,546 | | Ongoing |
| | | | |
124 | | Capital Statement 2009 10 | | |
Transport and Main Roads
| | | | | | | | | | |
Project | | Statistical
Division | | Total
Estimated
Cost
$’000 | | Expenditure
to
30-06-09
$’000 | | Budget
2009-10
$’000 | | Post
2009-10
$’000 |
CBD Refurbishment | | 05 | | | | | | 790 | | Ongoing |
Corporate Property Minor Works | | Various | | | | | | 750 | | Ongoing |
| | | | | | | | | | |
Sub-total Other Property, Plant and Equipment | | | | | | | | 26,755 | | |
| | | | | | | | | | |
| Total Property, Plant and Equipment | | | | | | | | 680,213 | | |
| | | | | | | | | | |
| | | | | |
| Other Capital Expenditure | | | | | | | | | | |
New Queensland Driver Licence | | 05 | | 84,085 | | 41,000 | | 43,085 | | |
Qld Motorcycle Safety Program | | 05 | | 750 | | | | 750 | | |
| | | | | | | | | | |
| Total Other Capital Expenditure | | | | | | | | 43,835 | | |
| | | | | | | | | | |
| | | | | |
Capital Grants | | | | | | | | | | |
South East Queensland Cycle Network | | Various | | | | | | 12,576 | | Ongoing |
SchoolBUS - Steep Roads Program | | Various | | | | | | 8,300 | | Ongoing |
Rural and Remote Airstrips | | Various | | | | | | 3,000 | | Ongoing |
Public Transport Infrastructure - Compliance with Disability Standards | | Various | | | | | | 1,935 | | Ongoing |
Accessible Buses | | Various | | | | | | 1,000 | | Ongoing |
Safe School Travel | | Various | | | | | | 300 | | Ongoing |
Safe Walking and Pedalling | | Various | | | | | | 200 | | Ongoing |
| | | | | | | | | | |
Total Capital Grants | | | | | | | | 27,311 | | |
| | | | | | | | | | |
TOTAL TRANSPORT | | | | | | | | 751,359 | | |
| | | | | | | | | | |
| | | | | |
TRANSLINK TRANSIT AUTHORITY | | | | | | | | | | |
| | | | | |
Property, Plant and Equipment | | | | | | | | | | |
Real Time Passenger Information System (RTPIS) | | 09 | | 13,111 | | 7,141 | | 5,970 | | |
TransLink Station Upgrade Program | | Various | | 173,212 | | 28,550 | | 33,000 | | 111,662 |
Integrated Ticketing Equipment | | 05 | | 7,790 | | 1,154 | | 1,148 | | 5,488 |
Integrated Scheduling | | 05 | | 2,913 | | 799 | | 2,114 | | |
Plant and Equipment | | 05 | | | | | | 120 | | Ongoing |
| | | | | | | | | | |
Total Property, Plant and Equipment | | | | | | | | 42,352 | | |
| | | | | | | | | | |
| | | | | |
Capital Grants | | | | | | | | | | |
Accessible Buses | | 05 | | | | | | 2,000 | | Ongoing |
Station and Stop Infrastructure Improvement Grant (SASIIG) | | Various | | | | | | 3,000 | | Ongoing |
| | | | | | | | | | |
| | | | |
| | | Capital Statement 2009 10 | | 125 |
Transport and Main Roads
| | | | | | | | | | |
Project | | Statistical
Division | | Total
Estimated
Cost
$’000 | | Expenditure
to
30-06-09
$’000 | | Budget
2009-10
$’000 | | Post
2009-10
$’000 |
Total Capital Grants | | | | | | | | 5,000 | | |
| | | | | | | | | | |
TOTAL TRANSLINK TRANSIT AUTHORITY | | | | | | | | 47,352 | | |
| | | | | | | | | | |
| | | | | |
QR LIMITED | | | | | | | | | | |
| | | | | |
Property, Plant and Equipment | | | | | | | | | | |
QR Network | | | | | | | | | | |
Citytrain MetTRIP Track Infrastructure Upgrades - Stages 1 and 2 | | 12 | | 654,485 | | 591,822 | | 62,663 | | |
Springfield Line | | 05 | | 386,265 | | 140,123 | | 125,000 | | 121,142 |
Robina to Varsity Lakes | | 07 | | 300,131 | | 202,848 | | 97,283 | | |
Corinda to Darra: Third Track | | 05 | | 187,829 | | 130,829 | | 57,000 | | |
Dalrymple Bay Coal Terminal: 3rd Loop | | 40 | | 115,300 | | 101,043 | | 14,257 | | |
Vermont Spur and Balloon Loop | | 40 | | 90,020 | | 48,409 | | 41,611 | | |
Metropolitan Freight Capacity Enhancements | | 05 | | 84,260 | | 66,329 | | 17,931 | | |
Coppabella - Ingsdon Duplication | | 40 | | 79,600 | | 20,901 | | 34,000 | | 24,699 |
Stanwell to Wycarbah Duplication | | 30 | | 71,500 | | 64,053 | | 7,447 | | |
Broadlea - Mallawa - Wotonga Duplication | | 40 | | 67,600 | | 66,431 | | 1,169 | | |
Wiggins Island (Gladstone) Balloon Loop | | 30 | | 22,000 | | 14,192 | | 7,808 | | |
Goonyella to Abbot Point Expansion X75/X100 Early Works | | 40 | | 50,600 | | 20,749 | | 29,851 | | |
Minimum Maintenance Track - Metro | | 05 | | 49,217 | | 34,813 | | 8,990 | | 5,414 |
Grantleigh to Tunnel Duplication | | 30 | | 49,000 | | 27,938 | | 21,062 | | |
Federal: Boom Gates for Level Crossings | | Various | | 42,740 | | 14,250 | | 28,490 | | |
Callemondah 3rd Spur | | 30 | | 37,754 | | 33,754 | | 4,000 | | |
TransLink Ticketing: Conduit Requirements | | 05 | | 31,546 | | 14,946 | | 2,600 | | 14,000 |
Westwood to Wycarbah Duplication | | 30 | | 30,156 | | 26,000 | | 4,156 | | |
Electrification Capacity Upgrade Strategy | | 05 | | 30,107 | | 18,286 | | 9,951 | | 1,870 |
| | | | |
126 | | Capital Statement 2009 10 | | |
Transport and Main Roads
| | | | | | | | | | |
Project | | Statistical
Division | | Total
Estimated
Cost
$’000 | | Expenditure
to
30-06-09
$’000 | | Budget
2009-10
$’000 | | Post
2009-10
$’000 |
Bolingbroke Feeder Station | | 40 | | 29,900 | | 27,110 | | 2,790 | | |
Bridge Replacement Stage 3 | | Various | | 60,372 | | 44,051 | | 16,321 | | |
Turnout & Crossover Refurbishment | | 05 | | 28,500 | | 8,349 | | 6,200 | | 13,951 |
St Lawrence River Bridge Replacement | | 40 | | 28,374 | | 10,148 | | 18,226 | | |
Coal System: Turnout Replacements Stage 2 | | Various | | 22,558 | | 1,866 | | 7,370 | | 13,322 |
Central Qld Coal Formation Strengthening (Stage 2) | | Various | | 20,538 | | 9,842 | | 5,243 | | 5,453 |
Electrification Infrastructure Renewal Strategy | | 05 | | 20,476 | | 5,563 | | 5,060 | | 9,853 |
Telecommunications Infrastructure Renewal - Metro | | 05 | | 18,730 | | 10,043 | | 4,350 | | 4,337 |
Mindi Electrical Substation | | 40 | | 18,500 | | 15,999 | | 2,501 | | |
Kinrola Branch Relay | | 30 | | 16,590 | | 16,040 | | 550 | | |
Regional Re-railing Strategy | | 25 | | 24,222 | | 23,622 | | 600 | | |
Jondaryan Track Upgrade | | Various | | 13,500 | | 1,500 | | 12,000 | | |
Noise Amelioration: Statewide Strategy | | 05 | | 13,154 | | 8,906 | | 2,000 | | 2,248 |
ATP TBS Migration Project | | 30 | | 30,999 | | 10,252 | | 6,000 | | 14,747 |
UTC Disaster Recovery | | Various | | 12,491 | | 6,091 | | 2,100 | | 4,300 |
Goonyella - Abbot Point Electrification Phase | | 40 | | 11,400 | | 7,600 | | 3,800 | | |
Corridor Integrity Strategy | | Various | | 11,055 | | 8,180 | | 1,712 | | 1,163 |
Corridor Land Requirements | | 05 | | 10,792 | | 2,292 | | 1,000 | | 7,500 |
North Coast Line Re-railing (Nambour to Parana) | | 15 | | 10,700 | | 6,777 | | 1,550 | | 2,373 |
VPI-type Processors Replacement (Farleigh to Purono) | | Various | | 10,730 | | 240 | | 2,051 | | 8,439 |
Telecommunications Backbone Network Strategy | | Various | | 10,346 | | 6,121 | | 1,891 | | 2,334 |
North Queensland: 8 Priority Level Crossing Upgrades | | Various | | 10,000 | | 250 | | 9,750 | | |
QR Network Coal - General | | Various | | | | | | 341,462 | | Ongoing |
QR Network Other - General | | Various | | | | | | 38,658 | | Ongoing |
| | | | | | | | | | |
Sub-total QR Network | | | | | | | | 1,068,454 | | |
| | | | | | | | | | |
| | | | | |
QR Freight Coal | | | | | | | | | | |
Jilalan Yard Upgrade | | 40 | | 500,000 | | 287,862 | | 178,288 | | 33,850 |
| | | | |
| | | Capital Statement 2009 10 | | 127 |
Transport and Main Roads
| | | | | | | | | | |
Project | | Statistical
Division | | Total
Estimated
Cost
$’000 | | Expenditure
to
30-06-09
$’000 | | Budget
2009-10
$’000 | | Post
2009-10
$’000 |
Coal Electric Loco Fleet Upgrade - Stages 1 & 2 | | 45 | | 187,475 | | 155,240 | | 20,900 | | 11,335 |
Electric Loco Upgrade Program | | 30 | | 141,000 | | 110,985 | | 26,000 | | 4,015 |
15 New Diesel Locomotives (4100 Class) | | 15 | | 92,000 | | 71,432 | | 15,256 | | 5,312 |
12 & 16 Cylinder Loco Overhauls - Coal | | 05 | | 50,779 | | 22,983 | | 19,100 | | 8,696 |
4000 Class Loco E Inspection Program | | 05 | | 27,550 | | 14,466 | | 6,187 | | 6,897 |
1,190 New Coal Wagons (VCA 106T) | | 05 | | 155,742 | | 142,546 | | 13,196 | | |
10 New Diesel Electric Locomotives (4100 Class) | | 15 | | 74,500 | | 14,920 | | 54,000 | | 5,580 |
| | | | | | | | | | |
Sub-total QR Freight Coal | | | | | | | | 332,927 | | |
| | | | | | | | | | |
| | | | | |
QR Freight Bulk Freight | | | | | | | | | | |
12 & 16 Cylinder Loco Overhauls - Bulk Freight | | 05 | | 10,540 | | 5,982 | | 2,279 | | 2,279 |
QR Freight Regional Freight | | | | | | | | | | |
12 & 16 Cylinder Loco Overhauls - Regional Freight | | 05 | | 22,457 | | 14,564 | | 3,100 | | 4,793 |
QR Freight | | | | | | | | | | |
QR Freight - General in Queensland | | Various | | | | | | 148,039 | | Ongoing |
Passenger Services | | | | | | | | | | |
Future Citytrain Rollingstock (58 x 3 car units) | | 05 | | 923,175 | | 2,100 | | 11,236 | | 909,839 |
Additional Citytrain Rollingstock | | 15 | | 296,837 | | 125,506 | | 125,822 | | 45,509 |
MetTRIP - additional Citytrain Rollingstock | | 15 | | 289,456 | | 271,449 | | 18,007 | | |
Citytrain Disability Standards 2007 Compliance: Infrastructure | | 05 | | 82,879 | | 49,937 | | 11,000 | | 21,942 |
MetTRIP - Citytrain Intermodal Works* | | 05 | | 26,794 | | 25,714 | | 1,080 | | |
Citytrain Disability Standards 2007 Compliance: Rollingstock | | 05 | | 48,594 | | 7,092 | | 7,500 | | 34,002 |
Brunswick Street Upgrade | | 05 | | 29,600 | | 27,674 | | 1,926 | | |
SMU200 Major Overhauls | | 05 | | 19,200 | | 15,121 | | 4,079 | | |
MetTRIP - Citytrain Station Upgrades | | 05 | | 15,459 | | 12,210 | | 3,249 | | |
| | | | |
128 | | Capital Statement 2009 10 | | |
Transport and Main Roads
| | | | | | | | | | |
Project | | Statistical
Division | | Total
Estimated
Cost
$’000 | | Expenditure
to
30-06-09
$’000 | | Budget
2009-10
$’000 | | Post
2009-10
$’000 |
Albion Station Land Bridge | | 05 | | 15,000 | | 1,000 | | 14,000 | | |
Passenger Services - General | | 05 | | | | | | 185,017 | | Ongoing |
| | | | | | | | | | |
Sub-total Passenger Services | | | | | | | | 382,916 | | |
| | | | | | | | | | |
| | | | | |
Across QR | | | | | | | | | | |
Rail Welding Facility | | 05 | | 34,970 | | 19,050 | | 15,920 | | |
SAP Business Model Program | | 05 | | 12,300 | | 9,217 | | 3,083 | | |
Major Property Disposals | | Various | | 19,261 | | 17,177 | | 2,084 | | |
Head Office Refurbishments | | 05 | | 26,193 | | 10,727 | | 15,466 | | |
Motor Vehicle Acquisitions 2009/10 | | 05 | | | | | | 19,000 | | Ongoing |
Across QR - General | | 05 | | | | | | 94,506 | | Ongoing |
| | | | | | | | | | |
Sub-total Across QR | | | | | | | | 150,059 | | |
| | | | | | | | | | |
Total Property, Plant and Equipment | | | | | | | | 2,087,774 | | |
| | | | | | | | | | |
TOTAL QR LIMITED | | | | | | | | 2,087,774 | | |
| | | | | | | | | | |
| | | | | |
PORT OF BRISBANE CORPORATION LIMITED | | | | | | | | | | |
| | | | | |
Property, Plant and Equipment | | | | | | | | | | |
Wharf & Berth 11 and 12 | | 05 | | 342,500 | | 34,000 | | 26,000 | | 282,500 |
Ground Improvement - T11, T12 and T13 | | 05 | | 194,040 | | 56,500 | | 23,470 | | 114,070 |
Hamilton Site Redevelopment | | 05 | | 65,300 | | 37,300 | | 10,000 | | 18,000 |
General Purpose Berth | | 05 | | 57,400 | | 56,400 | | 1,000 | | |
Cityreach Boardwalk | | 05 | | 4,200 | | 200 | | 2,000 | | 2,000 |
Lay-up Berth | | 05 | | 3,850 | | 1,850 | | 2,000 | | |
Subdivisional Roadworks - Fisherman Islands Business Park | | 05 | | 3,500 | | 1,500 | | 2,000 | | |
Port Drive - Truck Parking & Associated Works | | 05 | | 3,000 | | | | 3,000 | | |
Filling Foreshore Works in Bulk Precinct | | 05 | | 3,000 | | | | 3,000 | | |
Port Central | | 05 | | | | | | 25,000 | | Ongoing |
Upgrades of Major Roads | | 05 | | | | | | 23,000 | | Ongoing |
Ground Improvement Bishop Drive Estate (S2 & S3) | | 05 | | | | | | 20,000 | | Ongoing |
Port West - Lessee Developments | | 05 | | | | | | 9,000 | | Ongoing |
Port West - Infrastructure | | 05 | | | | | | 8,000 | | Ongoing |
Warehouses & Container Facilities | | 05 | | | | | | 7,500 | | Ongoing |
| | | | |
| | | Capital Statement 2009 10 | | 129 |
Transport and Main Roads
| | | | | | | | | | |
Project | | Statistical
Division | | Total
Estimated
Cost
$’000 | | Expenditure
to
30-06-09
$’000 | | Budget
2009-10
$’000 | | Post
2009-10
$’000 |
Lessee Terminals or Wharves | | 05 | | | | | | 6,000 | | Ongoing |
Portgate Property Developments | | 05 | | | | | | 6,000 | | Ongoing |
Colmslie Estate | | 05 | | | | | | 5,250 | | Ongoing |
Eagle Farm Estate | | 05 | | | | | | 4,500 | | Ongoing |
Building & Landscaping Upgrades | | 05 | | | | | | 4,350 | | Ongoing |
Port West - Filling | | 05 | | | | | | 4,000 | | Ongoing |
Electrical & Communication Upgrades | | 05 | | | | | | 500 | | Ongoing |
Minor Plant & Equipment | | 05 | | | | | | 14,710 | | Ongoing |
Port of Bundaberg | | | | | | | | | | |
Burnett Bridge | | 15 | | 7,700 | | 3,000 | | 4,700 | | |
Land Development | | 15 | | 765 | | | | 765 | | |
Road Improvements | | 15 | | 150 | | | | 150 | | |
| | | | | | | | | | |
Total Property, Plant and Equipment | | | | | | | | 215,895 | | |
| | | | | | | | | | |
TOTAL PORT OF BRISBANE CORPORATION LIMITED | | | | | | | | 215,895 | | |
| | | | | | | | | | |
| | | | | |
CAIRNS PORTS | | | | | | | | | | |
| | | | | |
Property, Plant and Equipment | | | | | | | | | | |
Cairns Seaport | | | | | | | | | | |
Tingira St Subdivision Development | | 50 | | 5,509 | | 509 | | 5,000 | | |
General Cargo Consolidation | | 50 | | 3,803 | | 3 | | 100 | | 3,700 |
Liberty Street Transport Facility | | 50 | | 1,650 | | 1,320 | | 330 | | |
Lease Acquisitions | | 50 | | 500 | | 250 | | 250 | | |
Seaport Minor Plant & Equipmemt | | 50 | | | | | | 320 | | Ongoing |
| | | | | | | | | | |
Sub-total Cairns Seaport | | | | | | | | 6,000 | | |
| | | | | | | | | | |
| | | | | |
Cairns Cityport | | | | | | | | | | |
Foreshore Development | | 50 | | 16,528 | | 1,465 | | 240 | | 14,823 |
Cruise Facility Terminal | | 50 | | 11,200 | | 503 | | 9,413 | | 1,284 |
Cityport Commercial Allowance | | 50 | | 2,487 | | 687 | | 200 | | 1,600 |
Site Decontamination | | 50 | | 2,313 | | 1,098 | | 15 | | 1,200 |
Shed 2 Refurbishment | | 50 | | 500 | | | | 460 | | 40 |
Corporate Minor Plant and Equipment | | 50 | | | | | | 128 | | Ongoing |
| | | | | | | | | | |
Sub-total Cairns Cityport | | | | | | | | 10,456 | | |
| | | | | | | | | | |
Total Property, Plant and Equipment | | | | | | | | 16,456 | | |
| | | | | | | | | | |
TOTAL CAIRNS PORTS | | | | | | | | 16,456 | | |
| | | | | | | | | | |
| | | | |
130 | | Capital Statement 2009 10 | | |
Transport and Main Roads
| | | | | | | | | | |
Project | | Statistical
Division | | Total
Estimated
Cost
$’000 | | Expenditure
to
30-06-09
$’000 | | Budget
2009-10
$’000 | | Post
2009-10
$’000 |
GLADSTONE PORTS CORPORATION | | | | | | | | | | |
| | | | | |
Property, Plant and Equipment | | | | | | | | | | |
RG Tanna Coal Terminal | | | | | | | | | | |
RG Tanna Coal Terminal Expansion Projects | | 30 | | 780,000 | | 776,921 | | 3,079 | | |
RG Tanna Coal Terminal Projects | | 30 | | 139,535 | | 15,496 | | 38,190 | | 85,849 |
RG Tanna Dust Suppression Projects | | 30 | | 9,610 | | | | 2,510 | | 7,100 |
| | | | | | | | | | |
Sub-total RG Tanna Coal Terminal | | | | | | | | 43,779 | | |
| | | | | | | | | | |
| | | | | |
Fisherman’s Landing Projects | | 30 | | 78,024 | | 3,422 | | 14,150 | | 60,452 |
Port General Projects | | 30 | | 62,889 | | 2,344 | | 27,444 | | 33,101 |
Auckland Point Projects | | 30 | | 8,800 | | | | 7,000 | | 1,800 |
Port Alma Shipping Terminal Projects | | 30 | | 1,800 | | | | 1,800 | | |
Barney Point Projects | | 30 | | 5,100 | | 2,700 | | 2,400 | | |
Minor Plant and Equipment Projects | | 30 | | | | | | 12,041 | | Ongoing |
| | | | | | | | | | |
Total Property, Plant and Equipment | | | | | | | | 108,614 | | |
| | | | | | | | | | |
TOTAL GLADSTONE PORTS CORPORATION | | | | | | | | 108,614 | | |
| | | | | | | | | | |
| | | | | |
MACKAY PORTS | | | | | | | | | | |
| | | | | |
Property, Plant and Equipment | | | | | | | | | | |
High Voltage and Low Voltage Assets | | 40 | | 2,704 | | 602 | | 2,102 | | |
Harbour Road Redevelopment | | 40 | | 2,000 | | 100 | | 1,900 | | |
Drainage Works - Mulherin Park Subdivision | | 40 | | 1,550 | | 525 | | 1,025 | | |
South Mulherin Park Parkland Development | | 40 | | 1,209 | | 159 | | 1,050 | | |
Strategic Port Land Rationalisation | | 40 | | | | | | 1,000 | | Ongoing |
Consolidate Mackay Ports Maintenance Facilities | | 40 | | 821 | | 96 | | 725 | | |
Presto Avenue Drainage | | 40 | | 776 | | 510 | | 266 | | |
Office Fitout and Communications | | 40 | | 640 | | | | 640 | | |
Stage II Hardstand (Mulherin Park) | | 40 | | 450 | | 100 | | 350 | | |
Slade Point Road Subdivision (Concept Plan) | | 40 | | 201 | | 126 | | 75 | | |
| | | | |
| | | Capital Statement 2009 10 | | 131 |
Transport and Main Roads
| | | | | | | | | | |
Project | | Statistical
Division | | Total
Estimated
Cost
$’000 | | Expenditure
to
30-06-09
$’000 | | Budget
2009-10
$’000 | | Post
2009-10
$’000 |
Infrastructure Renewal/Replacement | | 40 | | | | | | 4,499 | | Ongoing |
Plant and Equipment Replacements | | 40 | | | | | | 515 | | Ongoing |
| | | | | | | | | | |
Total Property, Plant and Equipment | | | | | | | | 14,147 | | |
| | | | | | | | | | |
TOTAL MACKAY PORTS | | | | | | | | 14,147 | | |
| | | | | | | | | | |
| | | | | |
PORTS CORPORATION OF QUEENSLAND LIMITED | | | | | | | | | | |
| | | | | |
Property, Plant and Equipment | | | | | | | | | | |
Abbot Point Expansion X50 | | 40 | | 818,000 | | 382,643 | | 287,900 | | 147,457 |
Abbot Point Expansion X25 | | 40 | | 95,000 | | 78,000 | | 17,000 | | |
Abbot Point Expansion Refurbishment SR1 and SR2 | | 40 | | 68,300 | | 7,851 | | 23,500 | | 36,949 |
Louisa Creek Land Acquisitions | | 40 | | 10,000 | | 8,656 | | 1,344 | | |
Abbot Point Multi Cargo Facility | | 40 | | 5,000 | | 3,400 | | 1,600 | | |
Head Office Miscellaneous Plant and Equipment | | 05 | | | | | | 174 | | Ongoing |
Port Development | | | | | | | | | | |
Abbot Point Port Development | | 40 | | | | | | 11,695 | | Ongoing |
Thurs Island Port Development | | 50 | | | | | | 4,046 | | Ongoing |
Hay Point Port Development | | 40 | | | | | | 2,239 | | Ongoing |
Mourilyan Port Development | | 45 | | | | | | 255 | | Ongoing |
Weipa Port Development | | 50 | | | | | | 49 | | Ongoing |
Karumba Port Development | | 55 | | | | | | 6 | | Ongoing |
Lucinda Port Development | | 45 | | | | | | 5 | | Ongoing |
| | | | | | | | | | |
Total Property, Plant and Equipment | | | | | | | | 349,813 | | |
| | | | | | | | | | |
TOTAL PORTS CORPORATION OF QUEENSLAND LIMITED | | | | | | | | 349,813 | | |
| | | | | | | | | | |
| | | | | |
PORT OF TOWNSVILLE | | | | | | | | | | |
| | | | | |
Property, Plant and Equipment | | | | | | | | | | |
Berth 4 Revetment Slope Stabilisation | | 45 | | 3,365 | | | | 3,365 | | |
Saltwater Fire System Review and Upgrade | | 45 | | 2,700 | | 150 | | 2,550 | | |
Berth 1 Services Jetty Duplication | | 45 | | 1,600 | | 250 | | 1,350 | | |
Port of Townsville Quarry Planning and Approvals | | 45 | | 927 | | 340 | | 587 | | |
Minor Plant and Equipment | | 45 | | | | | | 3,100 | | Ongoing |
| | | | | | | | | | |
| | | | |
132 | | Capital Statement 2009 10 | | |
Transport and Main Roads
| | | | | | | | | | |
Project | | Statistical
Division | | Total
Estimated
Cost
$’000 | | Expenditure
to
30-06-09
$’000 | | Budget
2009-10
$’000 | | Post
2009-10
$’000 |
Total Property, Plant and Equipment | | | | | | | | 10,952 | | |
| | | | | | | | | | |
TOTAL PORT OF TOWNSVILLE | | | | | | | | 10,952 | | |
| | | | | | | | | | |
| | | | | |
MAIN ROADS | | | | | | | | | | |
| | | | | |
Property, Plant and Equipment | | | | | | | | | | |
Corporate Buildings | | | | | | | | | | |
Deagon Roads and Maintenance Depot | | 05 | | 6,190 | | 400 | | 4,440 | | 1,350 |
Nundah Laboratory and Office Complex | | 05 | | 49,500 | | 900 | | 18,000 | | 30,600 |
Rockhampton Workshop | | 30 | | 2,200 | | 400 | | 1,800 | | |
Spring Hill Office Complex | | 05 | | 10,400 | | 900 | | 3,500 | | 6,000 |
Other works | | Various | | | | | | 2,260 | | Ongoing |
| | | | | | | | | | |
Sub-total Corporate Buildings | | | | | | | | 30,000 | | |
| | | | | | | | | | |
| | | | | |
National Network | | | | | | | | | | |
Bruce Highway | | | | | | | | | | |
Cardwell Range, construct deviation | | 50 | | 98,950 | | 8,950 | | 22,000 | | 68,000 |
Cooroy to Curra, construct new 4 lane road | | 15 | | 613,000 | | 50,000 | | 236,000 | | 327,000 |
Temples Lane to Farrellys Lane, southern approaches to Mackay, duplicate 2 to 4 lanes | | 40 | | 33,254 | | | | 8,728 | | 24,526 |
Cunningham Arterial/Highway (Ipswich Motorway) | | | | | | | | | | |
Dinmore - Goodna, construction | | 05 | | 1,950,000 | | 156,800 | | 649,970 | | 1,143,230 |
Wacol - Darra, widen 4 to 6 lanes | | 05 | | 700,000 | | 464,830 | | 130,000 | | 105,170 |
Flinders Highway | | | | | | | | | | |
Jardine Valley section: 214.00 - 226.10km, east of Hughenden, rehabilitate and widen | | 55 | | 8,801 | | 4,404 | | 4,397 | | |
Townsville Port Access Road, construct new road | | 45 | | 190,000 | | 87,141 | | 47,294 | | 55,565 |
Pacific Motorway | | | | | | | | | | |
Robina and Varsity Lakes, interchange improvements | | 07 | | 142,000 | | 8,000 | | 35,200 | | 98,800 |
| | | | |
| | | Capital Statement 2009 10 | | 133 |
Transport and Main Roads
| | | | | | | | | | |
Project | | Statistical
Division | | Total
Estimated
Cost
$’000 | | Expenditure
to
30-06-09
$’000 | | Budget
2009-10
$’000 | | Post
2009-10
$’000 |
Springwood South - Daisy Hill, construct additional lanes | | 05 | | 421,626 | | 29,626 | | 93,487 | | 298,513 |
Warrego Highway | | | | | | | | | | |
Mitchell towards Roma, upgrade to allow Type 2 road train access | | 25 | | 40,000 | | | | 8,800 | | 31,200 |
Other construction | | Various | | | | | | 148,971 | | Ongoing |
| | | | | | | | | | |
Sub-total National Network | | | | | | | | 1,384,847 | | |
| | | | | | | | | | |
| | | | | |
Other State-controlled Roads | | | | | | | | | | |
Aramac - Torrens Creek | | | | | | | | | | |
section: 125.08 - 246.98km, construct to seal standard | | 55 | | 14,366 | | 9,854 | | 4,512 | | |
Brighton - Redcliffe Road | | | | | | | | | | |
Houghton Highway Bridge, duplication between Brighton and Redcliffe | | 05 | | 315,000 | | 167,615 | | 125,000 | | 22,385 |
Bundaberg Ring Road | | | | | | | | | | |
construct to new sealed 2 lane standard | | 15 | | 100,000 | | 87,932 | | 12,068 | | |
Carnarvon Highway | | | | | | | | | | |
Injune - Rolleston, section: 21.10 -29.60km, widen and seal | | 25 | | 4,850 | | 885 | | 3,965 | | |
Dawson Highway | | | | | | | | | | |
Gladstone - Biloela, Calliope Range, new realignment | | 30 | | 70,000 | | 4,542 | | 36,000 | | 29,458 |
Diamantina Developmental Road | | | | | | | | | | |
Bedourie - Boulia, section: 76.00 - 82.00km, pave and seal | | 35 | | 2,400 | | 130 | | 2,270 | | |
Bedourie - Boulia, sections: 29.00 - 36.70km and 17.83 - 21.80km, pave and seal | | 35 | | 3,750 | | 2,517 | | 1,233 | | |
Quilpie - Windorah, various locations, bitumen resealing | | 35 | | 2,851 | | | | 2,430 | | 421 |
Endeavour Valley Road | | | | | | | | | | |
Endeavour River, west of Cooktown, construct bridge and approaches | | 50 | | 15,000 | | 3,745 | | 11,255 | | |
| | | | |
134 | | Capital Statement 2009 10 | | |
Transport and Main Roads
| | | | | | | | | | |
Project | | Statistical
Division | | Total
Estimated
Cost
$’000 | | Expenditure
to
30-06-09
$’000 | | Budget
2009-10
$’000 | | Post
2009-10
$’000 |
Gold Coast Highway | | | | | | | | | | |
Helensvale - Southport, Government Road - Robert Street, widen to 4 lanes | | 07 | | 127,000 | | 34,000 | | 30,000 | | 63,000 |
Gregory Developmental Road | | | | | | | | | | |
2.70km north of One Mile Gin Creek - 0.30km south of Ryans Creek, widen pavement | | 45 | | 9,703 | | 3,443 | | 6,260 | | |
Fletcher Creek, 2.00km south of Bluff Downs Road, widen pavement | | 45 | | 13,573 | | 1,411 | | 10,449 | | 1,713 |
Kennedy Developmental Road | | | | | | | | | | |
Three Ways - The Lynd, south of Mt Garnet, widen pavement | | 50 | | 31,510 | | 311 | | 8,999 | | 22,200 |
Labrador - Carrara | | | | | | | | | | |
Melia Court - Smith Street Connection Road, widen to 6 lanes | | 07 | | 126,175 | | | | 32,000 | | 94,175 |
Leichhardt Highway | | | | | | | | | | |
Don River bridges, south of Wowan, replace bridges | | 30 | | 65,000 | | 670 | | 11,290 | | 53,040 |
Mackay - Slade Point Road (Barnes Creek Road) | | | | | | | | | | |
Forgan Bridge over the Pioneer River, construct bridge and approaches | | 40 | | 148,000 | | 74,796 | | 37,582 | | 35,622 |
Maryborough - Hervey Bay Road | | | | | | | | | | |
Torbanlea turn-off - Dundowran Road, south of Pialba, duplicate 2 to 4 lanes | | 15 | | 17,149 | | 1,107 | | 16,042 | | |
New England Highway | | | | | | | | | | |
Munro Road - Pioneer Road, south of Crows Nest, widen and seal | | 20 | | 9,519 | | 3,736 | | 5,783 | | |
Ruthven Street / Jellicoe Street, North Toowoomba, intersection improvements | | 20 | | 9,702 | | 4,015 | | 5,687 | | |
| | | | |
| | | Capital Statement 2009 10 | | 135 |
Transport and Main Roads
| | | | | | | | | | |
Project | | Statistical
Division | | Total
Estimated
Cost
$’000 | | Expenditure
to
30-06-09
$’000 | | Budget
2009-10
$’000 | | Post
2009-10
$’000 |
Rockleigh - North Mackay Highway | | | | | | | | | | |
Sams Road - Barnes Creek Road, north Mackay, construct deviation - sealed standard | | 40 | | 20,000 | | 11,954 | | 8,046 | | |
Roma - Taroom Road | | | | | | | | | | |
sections: 0 - 64.90km, pave and seal | | 25 | | 13,963 | | 9,347 | | 4,616 | | |
sections: 64.90 - 149.40km, pave and seal | | 20 | | 15,700 | | 13,005 | | 662 | | 2,033 |
South Townsville | | | | | | | | | | |
Oonoonba Road - River Boulevard, Fairfield Waters, construct to new sealed 2 lane standard | | 45 | | 11,641 | | 662 | | 10,979 | | |
Western Arterial (Centenary Highway) | | | | | | | | | | |
Springfield - Darra, duplicate to 4 lanes | | 05 | | 414,600 | | 177,576 | | 119,700 | | 117,324 |
Wills Developmental Road | | | | | | | | | | |
Julia Creek - Burketown, section: 380.52 - 395.24km, north of Gregory, pave and seal | | 55 | | 4,500 | | | | 4,500 | | |
Other construction | | Various | | | | | | 1,107,055 | | Ongoing |
| | | | | | | | | | |
Sub-total Other State-controlled Roads | | | | | | | | 1,618,383 | | |
| | | | | | | | | | |
Plant and equipment | | Various | | | | | | 8,000 | | Ongoing |
| | | | | | | | | | |
Total Property, Plant and Equipment | | | | | | | | 3,041,230 | | |
| | | | | | | | | | |
| | | | | |
Other Capital Expenditure | | | | | | | | | | |
Information technology | | Various | | | | | | 6,500 | | Ongoing |
| | | | | | | | | | |
Total Other Capital Expenditure | | | | | | | | 6,500 | | |
| | | | | | | | | | |
| | | | | |
Capital Grants | | | | | | | | | | |
Transport Infrastructure Development Scheme - Capital Grants | | | | | | | | | | |
Auburn Road, sections: 100.34 - 101.34km; 102.00 - 104.00km, construct to new sealed 2 lane standard | | 20 | | 603 | | | | 299 | | 304 |
Bundaberg Port access road, Burnett Heads, construct new road | | 15 | | 1,000 | | 97 | | 903 | | |
| | | | |
136 | | Capital Statement 2009 10 | | |
Transport and Main Roads
| | | | | | | | | | |
Project | | Statistical
Division | | Total
Estimated
Cost
$’000 | | Expenditure
to
30-06-09
$’000 | | Budget
2009-10
$’000 | | Post
2009-10
$’000 |
Charles Street (Fulham Road - Anne Street), Aitkenvale, rehabilitate pavement | | 45 | | 2,363 | | | | 791 | | 1,572 |
Doomadgee Road East, south of Burketown, pave and seal | | 55 | | 2,400 | | 200 | | 400 | | 1,800 |
Jubilee Bridge, Innisfail, construct new bridge | | 50 | | 18,000 | | | | 6,000 | | 12,000 |
Nine Mile Road, south of Ridgelands Road, Rockhampton, widen and seal | | 30 | | 500 | | | | 500 | | |
Pacific Motorway (Nathan - Logan Road), construct bikeway near Runcorn | | 05 | | 16,783 | | 10,333 | | 3,110 | | 3,340 |
Russell Park Road, section: 9.40 - 21.40km, north of Clermont, pave and seal | | 40 | | 3,000 | | 750 | | 750 | | 1,500 |
Whitehill Road / Edwards Street intersection, Raceview, install traffic signals | | 12 | | 650 | | | | 650 | | |
Yaraka - Retreat Road, section: 24.00 - 41.72km, south east of Jundah, pave and seal | | 35 | | 2,350 | | | | 2,350 | | |
Yuleba - Surat Road, seal shoulders | | 25 | | 1,380 | | | | 1,000 | | 380 |
Other capital grants | | Various | | | | | | 33,312 | | Ongoing |
| | | | | | | | | | |
Sub-total Transport Infrastructure Development Scheme - Capital Grants | | | | | | | | 50,065 | | |
| | | | | | | | | | |
Federal Black Spot | | Various | | | | | | 43,009 | | Ongoing |
| | | | | | | | | | |
Total Capital Grants | | | | | | | | 93,074 | | |
| | | | | | | | | | |
TOTAL MAIN ROADS | | | | | | | | 3,140,804 | | |
| | | | | | | | | | |
| | | | | |
ROADTEK | | | | | | | | | | |
| | | | | |
Property, Plant and Equipment | | | | | | | | | | |
Hire plant | | Various | | | | | | 28,000 | | Ongoing |
| | | | | | | | | | |
Total Property, Plant and Equipment | | | | | | | | 28,000 | | |
| | | | | | | | | | |
| | | | | |
Other Capital Expenditure | | | | | | | | | | |
Information technology | | Various | | | | | | 91 | | Ongoing |
| | | | | | | | | | |
Total Other Capital Expenditure | | | | | | | | 91 | | |
| | | | | | | | | | |
TOTAL ROADTEK | | | | | | | | 28,091 | | |
| | | | | | | | | | |
| | | | |
| | | Capital Statement 2009 10 | | 137 |
Transport and Main Roads
| | | | | | | | | | |
Project | | Statistical
Division | | Total
Estimated
Cost
$’000 | | Expenditure
to
30-06-09
$’000 | | Budget
2009-10
$’000 | | Post
2009-10
$’000 |
QUEENSLAND MOTORWAYS LIMITED | | | | | | | | | | |
| | | | | |
Property, Plant and Equipment | | | | | | | | | | |
Free-Flow Tolling Project | | 05 | | 171,729 | | 128,152 | | 43,577 | | |
Gateway Motorway, Gateway Upgrade Project | | 05 | | 1,883,000 | | 1,332,534 | | 259,152 | | 291,314 |
Other | | 05 | | | | | | 21,937 | | Ongoing |
Sundry roadworks | | 05 | | | | | | 22,664 | | Ongoing |
Toll equipment | | 05 | | | | | | 13,400 | | Ongoing |
| | | | | | | | | | |
Total Property, Plant and Equipment | | | | | | | | 360,730 | | |
| | | | | | | | | | |
TOTAL QUEENSLAND MOTORWAYS LIMITED | | | | | | | | 360,730 | | |
| | | | | | | | | | |
TOTAL TRANSPORT AND MAIN ROADS | | | | | | | | 7,131,987 | | |
| | | | | | | | | | |
Notes:
| 1. | Partially funded by Commonwealth and Local Government contributions. |
| * | Funded fully or in part under the Smart State Building Fund |
| | | | |
138 | | Capital Statement 2009 10 | | |
TREASURY
The total capital expenditure program for Queensland Treasury in 2009-10 will be $12.3 million.
The principal components of Treasury’s capital program include:
| • | | $5.1 million provided for the further implementation and development of the Revenue Management System within the Office of State Revenue. The system employs a contemporary technology to provide revenue and information management and e-business capability to better service the Government and people of Queensland in collecting and administering State tax revenue streams; and |
| • | | $7.2 million to be allocated to ongoing asset replacement, primarily the replacement of exisiting IT assets. |
Treasury
| | | | | | | | | | |
Project | | Statistical
Division | | Total
Estimated
Cost
$’000 | | Expenditure
to
30-06-09
$’000 | | Budget
2009-10
$’000 | | Post
2009-10
$’000 |
TREASURY DEPARTMENT | | | | | | | | | | |
| | | | | |
Property, Plant and Equipment | | | | | | | | | | |
Asset replacement | | 05 | | | | | | 7,160 | | Ongoing |
| | | | | | | | | | |
Total Property, Plant and Equipment | | | | | | | | 7,160 | | |
| | | | | | | | | | |
| | | | | |
Other Capital Expenditure | | | | | | | | | | |
OSR - Revenue Management System | | 05 | | 68,277 | | 62,760 | | 5,100 | | 417 |
| | | | | | | | | | |
Total Other Capital Expenditure | | | | | | | | 5,100 | | |
| | | | | | | | | | |
| | | | | |
TOTAL TREASURY DEPARTMENT | | | | | | | | 12,260 | | |
| | | | | | | | | | |
| | | | |
| | | Capital Statement 2009 10 | | 139 |
APPENDIX A –
ENTITIES INCLUDED IN CAPITAL OUTLAYS 2009-10
Communities
Housing and Homelessness Services
Community and Youth Justice Services
Child Safety Services
Disability Services
Sport and Recreation Services
Stadiums Queensland
Commission for Children and Young People and Child Guardian
Community Safety
Emergency Services
Corrective Services
Education and Training
Department of Education and Training
Queensland Studies Authority
Corporate and Professional Services
Southbank Institute of Technology
Gold Coast Institute of TAFE
Electoral Commission of Queensland
Employment, Economic Development and Innovation
Primary Industries and Fisheries
Forestry Plantations Queensland
QRAA
Australian Agricultural College Corporation
Employment, Industry Development and Innovation
Mines and Energy
CS Energy Limited
ENERGEX Limited
Stanwell Corporation Limited
Tarong Energy Corporation Limited
Powerlink Queensland
Ergon Energy Corporation Limited
Tourism, Fair Trading and Office of Liquor, Gaming and Racing
Tourism Queensland
| | | | |
140 | | Capital Statement 2009 10 | | |
Environment and Resource Management
Natural Resources and Water
Gladstone Area Water Board
Mount Isa Water Board
Sunwater
Queensland Bulk Water Supply Authority
Queensland Bulk Water Transport Authority
Queensland Manufactured Water Authority
SEQ Water Grid Manager
Environmental Protection
Health
Department of Health
Council of the Queensland Institute of Medical Research
Infrastructure and Planning
Infrastructure and Planning
Property Services Group
Water Infrastructure Projects
Airport Link
Local Government
Justice and Attorney General
Justice and Attorney General
Public Trust Office
Legal Aid Queensland
Crime and Misconduct Commission
Anti Discrimination Commission
Legislative Assembly of Queensland
Office of the Governor
Office of the Ombudsman
Police
Premier and Cabinet
Premier and Cabinet
South Bank Corporation
Arts Queensland
Library Board of Queensland
Queensland Art Gallery
Queensland Museum
Queensland Performing Arts Trust
| | | | |
| | | Capital Statement 2009 10 | | 141 |
Public Works
Department of Public Works
QBuild
QFleet
Project Services
SDS
CITEC
Shared Service Agency
Corp Tech
Queensland Audit Office
Transport and Main Roads
Transport
Translink Transit Authority
QR Limited
Port of Brisbane Corporation Limited
Cairns Ports
Gladstone Ports Corporation
Mackay Ports
Ports Corporation of Queensland Limited
Port of Townsville
Main Roads
RoadTek
Queensland Motorways Limited
Treasury
| | | | |
142 | | Capital Statement 2009 10 | | |
APPENDIX B –
KEY CONCEPTS AND COVERAGE
COVERAGE OF THE CAPITAL STATEMENT
Under accrual output budgeting, capital is the stock of assets including property, plant and equipment, intangible assets and inventories that an agency owns and/or controls and uses in the delivery of services, as well as capital grants made to other entities. For the purpose of this Budget Paper, capital outlays refer to the gross acquisition of these assets. The following definitions are applicable throughout this document:
| • | | total capital outlays – property, plant and equipment outlays, other capital expenditure and capital grants |
| • | | property, plant and equipment outlays – property, plant and equipment outlays as per the financial statements excluding asset sales, depreciation and revaluations |
| • | | other capital expenditure – intangibles, such as software development, and self-generating and regenerating assets |
| • | | capital grants – capital grants to other entities (excluding grants to other Government departments, statutory bodies and individuals under the First Home Owners Grant scheme). |
Capital outlays include information for all bodies defined as reporting entities for the purpose of whole-of-Government financial reporting requirements, excluding Public Financial Corporations. Projects without a recorded total estimated cost are ongoing. The entities included in scope for the Capital Statement are listed in Appendix A.
The Capital Statement only provides details of projects being undertaken within Queensland.
CAPITAL CONTINGENCY
Consistent with the approach adopted in previous years, a capital contingency reserve has been included. This reserve recognises that while agencies budget to fully use their capital works allocation, circumstances such as project lead-in times, project management constraints, unexpected weather conditions and capacity constraints such as the supply of labour and materials may prevent full usage. On a whole-of-Government basis, there is likely to be underspending, resulting in a carryover of capital allocations.
| | | | |
| | | Capital Statement 2009 10 | | 143 |
By authority: S. C. Albury, Acting Government Printer, Queensland 2009

2009–10 State Budget Papers
| 2. | Budget Strategy and Outlook |
| 5. | Service Delivery Statements |
Budget Highlights
The suite of Budget Papers is similar to that published in 2008–09.
In March 2009, machinery-of-Government changes saw the creation of 13 departments reporting to 18 Ministers.
These new arrangements have required minor changes to how information is presented in some Budget Papers. In particular, Budget Paper No. 5—Service Delivery Statements is now presented on a departmental rather than a Ministerial basis.
The 2009–10 Budget Papers provide continuity of information between the previous departmental structure and the new arrangements. Future budget papers will present information, including financial statements, only from a whole-of-department point of view.
The Budget Papers are available online at www.budget.qld.gov.au or they can be purchased through The Queensland Government Bookshop, individually or as a set. Please phone (07) 3883 8700 (1800 801 123 for callers outside of Brisbane).
© Crown copyright
All rights reserved
Queensland Government 2009
Excerpts from this publication may be reproduced, with appropriate
acknowledgement, as permitted under the Copyright Act.
Budget Measures
Budget Paper No. 4
ISSN 1445-4890 (Print)
ISSN 1445-4904 (Online)

STATE BUDGET
2009-10
BUDGET MEASURES
Budget Paper No. 4
TABLE OF CONTENTS
| | | | |
1. | | Overview | | 1 |
| | |
| | Introduction | | 1 |
| | |
| | The 2009-10 Budget – Priorities | | 1 |
| | |
| | Explanation of Scope and Terms | | 6 |
| | |
2. | | Expense Measures | | 7 |
| | |
| | Department of Communities | | 8 |
| | |
| | Department of Community Safety | | 17 |
| | |
| | Department of Education and Training | | 21 |
| | |
| | Department of Employment, Economic Development and Innovation | | 26 |
| | |
| | Department of Environment and Resource Management | | 30 |
| | |
| | Department of Health | | 34 |
| | |
| | Department of Infrastructure and Planning | | 36 |
| | |
| | Department of Justice and Attorney-General | | 38 |
| | |
| | Department of Police | | 41 |
| | |
| | Department of Public Works | | 43 |
| | |
| | Department of the Premier and Cabinet | | 44 |
| | |
| | Department of Transport and Main Roads | | 45 |
| | |
| | Legislative Assembly of Queensland | | 48 |
| | |
| | Treasury Department | | 49 |
| | |
3. | | Capital Measures | | 50 |
| | |
| | Department of Communities | | 51 |
| | |
| | Department of Community Safety | | 57 |
| | |
| | Department of Education and Training | | 59 |
| | |
| | Department of Employment, Economic Development and Innovation | | 61 |
| | |
| | Department of Health | | 62 |
| | | | |
| | Department of Infrastructure and Planning | | 65 |
| | |
| | Department of Justice and Attorney-General | | 68 |
| | |
| | Department of Police | | 70 |
| | |
| | Department of the Premier and Cabinet | | 72 |
| | |
| | Department of Transport and Main Roads | | 73 |
| | |
4. | | Revenue Measures | | 77 |
| | |
| | Department of Employment, Economic Development and Innovation | | 78 |
| | |
| | Department of Health | | 79 |
| | |
| | Department of Justice and Attorney-General | | 80 |
| | |
| | Department of Transport and Main Roads | | 81 |
| | |
| | Treasury Department | | 82 |
FEATURES
| | • | | This Budget Paper presents a consolidation of expense, capital and revenue measures reflecting decisions since the 2008-09 Budget. |
| | • | | The measures reflect the Government’s policy agenda, targeting priority areas in which the Government will concentrate its efforts to improve performance and respond to changing community needs and expectations and the changing economic climate. |
INTRODUCTION
The intention in producing this paper is to provide a consolidated view of the Government’s policy decisions with budgetary impacts made since the 2008-09 Budget. It complements other Budget Papers, in particular Budget Paper No. 2 – Budget Strategy and Outlook, Budget Paper No. 3 – Capital Statement and the Service Delivery Statements.
This paper includes only new policy decisions and does not detail the full amount of additional funding being provided to agencies to deliver services and infrastructure. For example, formula-driven changes in funding are not included.
For details on the total funding available to agencies, refer to agencies’ Service Delivery Statements.
This chapter explains the Government’s Budget priorities which provide the framework for Government policy making and the major themes of the 2009-10 Budget.
THE 2009-10 BUDGET – PRIORITIES
The 2009-10 Budget introduces measures focused towards achievement in a set of Budget priorities.
These priorities include:
| | • | | Delivering Jobs for Queensland |
| | • | | Investing in Our Health |
| | • | | Renewable Energy and the Environment |
| | • | | Promoting Education and Early Childhood |
| | • | | Improving Emergency Services |
| | | | |
| | | Budget Measures 2009 10 | | 1 |
Delivering Jobs for Queensland
The Government’s immediate priority is protecting jobs in the face of the largest global economic downturn in eight decades. The 2009-10 capital program is aimed at supporting job creation and meeting the infrastructure needs of our rapidly growing population.
As well as protecting jobs now, the Government is preparing for the future. By investing in initiatives that will develop the skills base of Queensland workers, support emerging industries, build on traditional strengths, and attract investment and innovation, Queensland will be well positioned to lead Australia through the period of economic recovery and beyond.
Significant measures that involve additional funding include:
| | • | | Payroll Tax Rebate for Apprentice and Trainee Wages (page 83) |
| | • | | Queensland Tourism Strategy (page 29) |
| | • | | Better TAFE Facilities (page 21) |
| | • | | Nation Building and Jobs Plan Element 1—New Capital Works (page 53) |
| | • | | Nation Building and Jobs Plan Element 2—Works on Existing Dwellings (pages 14, 54) |
| | • | | A Fresh Approach (page 61) |
These are complemented by a range of other initiatives, such as establishment of the Green Army to provide 2,300 jobs through work placements of up to six months, which are to be resourced from existing funding.
Investing in Our Health
To make Queenslanders Australia’s healthiest people, the Government is investing in healthy lifestyles, hospitals and other frontline health services to ensure we receive the best possible healthcare.
Significant measures include:
| | • | | Expanded Rehabilitation and Step Down Facilities (pages 34, 62) |
| | • | | Faster Emergency Care in our Hospitals (pages 35, 62) |
| | • | | Nurse Practitioners (page 35) |
| | • | | Surgery Connect (page 35) |
| | • | | Queensland Children’s Hospital Academic and Research Centre (page 63) |
| | | | |
2 | | Budget Measures 2009 10 | | |
Renewable Energy and the Environment
Reducing Queensland’s carbon footprint and protecting its natural wonders are at the heart of the Queensland Government’s commitment to tackling the challenges of climate change and preserving the environment for a sustainable future. The Government will continue to invest in a broad range of initiatives to reduce greenhouse gas emissions, adapt to climate change and help households and businesses minimise their energy costs.
Significant measures include:
| | • | | Energy Conservation and Demand Management (page 27) |
| | • | | Energy Efficiency Retrofit (page 31) |
| | • | | Renewable Energy Projects (page 27) |
| | • | | Great Barrier Reef Protection Package (page 32) |
| | • | | Maintenance of EPA Estate Assets (page 32) |
| | • | | Expansion of the Wild River Rangers Program (page 33) |
| | • | | Clean Energy Strategy for Remote/Isolated Communities (page 26) |
| | • | | ClimateSmart Business Service (page 30) |
Better and Safer Roads
The Queensland Government is committed to delivering the infrastructure to build and preserve Queensland roads, while managing the impact of urban growth. The 2009-10 Budget continues the Queensland Government’s aim to deliver the infrastructure needed to connect Queenslanders while creating and sustaining jobs for Queensland’s workforce.
The Government’s road building program plans for growth by creating and sustaining Queensland jobs, improving road safety and quality, reducing congestion, and continuing to connect people and places around the State.
Significant measures include:
| | • | | Safer Roads Sooner—Additional Road Upgrades (page 45) |
| | • | | Urban Congestion Initiatives (pages 47, 76) |
| | • | | Sustainable Resources Communities Funding—Road Safety Improvements (page 74) |
| | • | | Road Safety Enforcement Initiatives (pages 41, 70) |
| | • | | Digital Integrated Traffic Camera System (pages 41, 70) |
| | | | |
| | | Budget Measures 2009 10 | | 3 |
Promoting Education and Early Childhood
In line with the Government’s Towards Q2: Tomorrow’s Queensland agenda, a focus for 2009-10 will be improving the educational outcomes for all students, with particular emphasis on the essentials of literacy, numeracy and science. Major infrastructure investment will support this by providing high quality teaching and learning environments.
Significant measures include:
| | • | | Early Childhood Reform (pages 22, 60) |
| | • | | Literacy and Numeracy Action Plan (page 23) |
| | • | | Productivity Places Program National Program (page 24) |
| | • | | Science Spark (page 25) |
| | • | | Additional School Grants (page 21) |
| | • | | Additional Assistance for non-State Schools (page 59) |
| | • | | South East Queensland Public Private Partnership Schools Project (page 25) |
| | • | | Building the Education Revolution (pages 22, 59, 60) |
| | • | | National Secondary Schools Computer Fund (page 24) |
| | | | |
4 | | Budget Measures 2009 10 | | |
Improving Emergency Services
Over the past year, Queensland has experienced devastating floods, cyclones and torrential storms. The Government’s investment in emergency services will help make Queensland communities safer and provide quality emergency relief services.
Significant measures include:
| | • | | Contribution to Fire Service (page 18) |
| | • | | Helicopter Services (page 18) |
| | • | | Keeping Our Beaches Safe (page 18) |
| | • | | Support Our Heroes—Rural Fire Service (pages 19, 57) |
| | • | | Support Our Heroes—State Emergency Services (pages 19, 58) |
| | • | | Sustainable Disaster Management (page 20) |
| | • | | Sustainable Resource Communities Funding— Upgrade of Bowen Basin Emergency Service Centres (page 58) |
| | • | | Disaster Management Warehouses and Caches (page 30) |
| | • | | Disaster Preparedness in Vulnerable Communities (page 31) |
| | • | | Bushfire Community Training Package (page 30) |
| | | | |
| | | Budget Measures 2009 10 | | 5 |
EXPLANATION OF SCOPE AND TERMS
The following is a description of the scope and terms applied in this document.
Scope
This document includes measures with the following features:
| | • | | Sector. Only Queensland General Government sector agencies are included. Measures involving Government-owned Corporations or other Public Non-financial Corporation sector agencies are within scope if the measures are being funded directly by the General Government sector. |
| | • | | Timeframe. Measures based on decisions made since the release of the 2008-09 Budget (June 2008), including the 2009-10 Budget. |
| | • | | Type. Measures with budgetary impacts; in particular, expense and capital measures with service delivery, capital enhancement, grant or subsidy impacts on the community. Revenue measures involving a significant change in revenue policy, including changes in tax rate. |
Initiatives of a technical nature or non-policy based adjustments, such as parameter based funding adjustments, are not included as they do not reflect changes in government policy. The main focus is on measures reflecting policy decisions that impact directly on the community through service delivery or other means.
| | • | | Materiality. Minor measures or measures with non-significant community impact are not included in the document. |
Funding basis
Tables in this document are presented on a net funding basis.
| | • | | Net funding refers to the impact of funding the measure on appropriations from the Consolidated Fund or centrally held funds (such as the Queensland Future Growth Fund) to the relevant General Government agency. It does not include funding directed to the measure from existing agency resources or other sources. Where the funding is provided from sources other than the Queensland Government, this is indicated in the text. |
| | • | | Amounts refer to additional funding being provided to agencies for a particular program or project, as a result of Government decisions since the 2008-09 Budget. This may differ to other Budget papers, such as Budget Paper No. 3 – Capital Statement, that may refer to total funding. |
| | • | | Amounts included in the tables relating to revenue measures represent the impact of the measure on Government revenue (with a positive amount representing additional revenue). |
| | | | |
6 | | Budget Measures 2009 10 | | |
Introduction
The following tables present the relevant portfolio expense measures relating to decisions taken since the 2008-09 Budget. This does not represent the full amount of additional funding provided to agencies since the 2008-09 Budget. For further explanation, refer to Explanation of Scope and Terms in Chapter 1.
| | | | |
| | | Budget Measures 2009 10 | | 7 |
Department of Communities
| | | | | | | | | | |
| | | 2008-09
$’000 | | 2009-10
$’000 | | 2010-11
$’000 | | 2011-12
$’000 | | 2012-13
$’000 |
Community Services Workers Award Wage Increases | | — | | 65,000 | | 100,000 | | 124,000 | | 125,000 |
This is a whole-of-Government Initiative in recognition of the recent Queensland Industrial Relations Commission increase to award rates for community service workers. The Government will provide $414 million over four years for allocation on a prioritised basis to State supported services for dependant and vulnerable Queenslanders. Funding will be allocated across a number of Government agencies and will significantly contribute to the sustainability of the non-government sector.
Child Safety Services
| | | | | | | | | | |
| | | 2008-09
$’000 | | 2009-10
$’000 | | 2010-11
$’000 | | 2011-12
$’000 | | 2012-13
$’000 |
Additional Child Protection Placements | | 29,988 | | 25,330 | | 25,330 | | 25,330 | | 25,330 |
The Government will provide additional funding to improve the diversity and stability of placements for children in care with complex and extreme needs. This initiative is part of a broader program to increase the quality of placement options for children in care.
| | | | |
8 | | Budget Measures 2009 10 | | |
| | | | | | | | | | |
| | | 2008-09
$’000 | | 2009-10
$’000 | | 2010-11
$’000 | | 2011-12
$’000 | | 2012-13
$’000 |
South West Queensland Indigenous Family and Youth Coaching and Mentoring Service | | — | | 490 | | 920 | | 890 | | — |
The Government will provide additional funding through the Prevention and Early Intervention Incentives Pool to provide innovative Indigenous youth mentoring services in South West Queensland, focused on reducing the number of children and youth entering the statutory child protection and youth justice systems. A greater focus on early intervention produces a better outcome for children and their families and helps to avoid significant additional future costs.
Community and Youth Justice Services
| | | | | | | | | | |
| | | 2008-09
$’000 | | 2009-10
$’000 | | 2010-11
$’000 | | 2011-12
$’000 | | 2012-13
$’000 |
Breaking the cycle of domestic and family violence in Rockhampton | | — | | 1,095 | | 1,607 | | — | | — |
The Government will provide additional funding through the Prevention and Early Intervention Incentives Pool to support the 21 -month trial of a new approach to preventing domestic and family violence in Rockhampton. This multi-agency initiative aims to link the provision of government and non-government services for assessments, planning and management of domestic and family violence cases and links service provision with the Magistrates Court processes. The Government is focussing on prevention and early intervention to assist families early before they need high-cost interventions and services.
| | | | |
| | | Budget Measures 2009 10 | | 9 |
| | | | | | | | | | |
| | | 2008-09
$’000 | | 2009-10
$’000 | | 2010-11
$’000 | | 2011-12
$’000 | | 2012-13
$’000 |
Commission for Children and Young People and Child Guardian-Fit out for Office Relocation | | 42 | | 463 | | 475 | | 488 | | 502 |
The Government is providing additional funds to meet the long term accommodation requirements of the Commission. The Commission’s office relocated to new premises as part of a joint project with other government agencies. The co-location of the agencies consolidated various business operations and also resulted in reduced overall lease costs and opportunities to leverage off shared resources and infrastructure. The capital component of this intiative can be found in Chapter 3 Capital Measures.
| | | | | | | | | | |
| | | 2008-09
$’000 | | 2009-10
$’000 | | 2010-11
$’000 | | 2011-12
$’000 | | 2012-13
$’000 |
Electricity Rebate and Electricity Life Support Concession Scheme-Supplementation | | — | | 12,720 | | 12,720 | | 12,720 | | 12,720 |
The Government will provide additional funding to increase the Electricity Rebate and Electricity Life Support Concession Scheme in line with electricity prices announced by the Queensland Competition Authority.
| | | | | | | | | | |
| | | 2008-09
$’000 | | 2009-10
$’000 | | 2010-11
$’000 | | 2011-12
$’000 | | 2012-13
$’000 |
Expansion of Youth Detention Centre Capacity | | 1,317 | | 2,916 | | 8,267 | | 16,177 | | 17,572 |
The Government will provide additional funding for the expansion of youth detention capacity. These funds are provided to enable additional and recurrent service delivery and operating requirements associated with expansion of the Cleveland Youth Detention Centre and additional bed capacity at the Brisbane Youth Detention Centre. The capital component of this initiative can be found in Chapter 3 Capital Measures.
| | | | |
10 | | Budget Measures 2009 10 | | |
| | | | | | | | | | |
| | | 2008-09
$’000 | | 2009-10
$’000 | | 2010-11
$’000 | | 2011-12
$’000 | | 2012-13
$’000 |
Lifeline Financial Counselling Service | | 1,000 | | 2,000 | | — | | — | | — |
The Government is providing additional funding to increase the capacity of the Lifeline Financial Counselling Service to respond to the financial counselling needs of individuals and families impacted by the decline in economic conditions. This initiative will support a State-wide financial counselling hotline and the employment of generalist financial counsellors in locations across the State to assist people to take control of their finances and escape the cycle of debt.
| | | | | | | | | | |
| | | 2008-09
$’000 | | 2009-10
$’000 | | 2010-11
$’000 | | 2011-12
$’000 | | 2012-13
$’000 |
National Reciprocal Transport Scheme | | 2,479 | | 3,769 | | 4,001 | | 4,242 | | — |
Funding will be provided to enable visitors from interstate who hold a state or territory Seniors Card to access public transport concessions in Queensland. The four-year scheme, which commences in 2009, is to be fully funded by the Australian Government (subject to the finalisation of specific details).
| | | | | | | | | | |
| | | 2008-09
$’000 | | 2009-10
$’000 | | 2010-11
$’000 | | 2011-12
$’000 | | 2012-13
$’000 |
Youth Enterprise Partnership: Supporting Vulnerable Young People to Achieve Independent and Productive Lives | | — | | 495 | | 840 | | 457 | | — |
The Government will provide additional funding through the Prevention and Early Intervention Incentives Pool to improve economic and social outcomes for young people (under 18) who have recently entered the youth justice system and are at risk of further offending; and/or are experiencing homelessness or are at risk of homelessness. The focus on early intervention will ensure young people are assisted early before they need high cost interventions and services. This initiative is based on an innovative service delivery model involving the integration of social enterprises and tailored support.
| | | | |
| | | Budget Measures 2009 10 | | 11 |
Disability Services
| | | | | | | | | | |
| | | 2008-09
$’000 | | 2009-10
$’000 | | 2010-11
$’000 | | 2011-12
$’000 | | 2012-13
$’000 |
National Disability Services-Special Purpose Payment | | 4,100 | | 8,900 | | 20,414 | | 20,645 | | 33,693 |
The National Disability Agreement came into effect on 1 January 2009 and replaces funding previously provided through the Commonwealth State and Territory Disability Agreement. It aims to improve outcomes for people with a disability and identifies a range of reforms to improve the disability service system and achieve greater national consistency. From 2008-09 to 2012-13, Queensland will receive an additional $87.8 million over five years in Australian Government funding towards achieving the outcomes specified in the Agreement.
| | | | | | | | | | |
| | | 2008-09
$’000 | | 2009-10
$’000 | | 2010-11
$’000 | | 2011-12
$’000 | | 2012-13
$’000 |
Responding to Personal Emergencies and Critical Situations | | — | | 5,000 | | 5,000 | | 5,000 | | 5,000 |
The Government will provide increased funding for the most vulnerable people with a disability and their families, to develop a planned, sustainable service response.
| | | | |
12 | | Budget Measures 2009 10 | | |
| | | | | | | | | | |
| | | 2008-09
$’000 | | 2009-10
$’000 | | 2010-11
$’000 | | 2011-12
$’000 | | 2012-13
$’000 |
Self-directed Funding for Young People with a Disability | | — | | 519 | | 547 | | — | | — |
The Government will provide additional funding through the Prevention and Early Intervention Incentives Pool to pilot a brokerage model of self-directed funding for families of children with a disability and young people with a disability. This initiative aims to support choice and independence, with the capacity for families and young people to negotiate directly with services to meet their goals and changing needs and will avoid significant additional future costs.
| | | | | | | | | | |
| | | 2008-09
$’000 | | 2009-10
$’000 | | 2010-11
$’000 | | 2011-12
$’000 | | 2012-13
$’000 |
Wacol Infrastructure Upgrade | | 404 | | 79 | | 149 | | 805 | | 741 |
The Government will provide funding to upgrade infrastructure at Wacol to create purpose-designed positive environments for adults with an intellectual or cognitive disability who exhibit challenging behaviour and who are at risk of harm. This funding will help fulfil the delivery of the Government’s commitments to the Investing in Positive Futures Program of reforms. The capital component of this intiative can be found in Chapter 3 Capital Measures.
| | | | | | | | | | |
| | | 2008-09
$’000 | | 2009-10
$’000 | | 2010-11
$’000 | | 2011-12
$’000 | | 2012-13
$’000 |
Young Persons Community Residential Program | | — | | 2,159 | | 2,159 | | 2,159 | | — |
The Government will provide additional funding through the Prevention and Early Intervention Incentives Pool to pilot two Community Residential Programs to assist young people (aged 15-25 years) showing the early signs and symptoms of mental health problems. This initiative will offer short-term, intensive and focused support for young people experiencing mental health issues for up to three weeks in a safe and supportive community house. An outreach service to support young people in the community will also be provided. The initiative focusses on prevention and early intervention responses to ensure young people do not become reliant on high-cost interventions and services.
| | | | |
| | | Budget Measures 2009 10 | | 13 |
| | | | | | | | | | |
| | | 2008-09
$’000 | | 2009-10
$’000 | | 2010-11
$’000 | | 2011-12
$’000 | | 2012-13
$’000 |
YoungCare project on the Gold Coast | | — | | 1,000 | | 1,000 | | 1,000 | | — |
As announced in the 2009 State Election, the Government will provide funding to enable additional accommodation support for young people with a disability on the Gold Coast. This initiative will increase the capacity of YoungCare to accommodate and support young people with complex disability and health care needs.
Housing and Homelessness Services
| | | | | | | | | | |
| | | 2008-09
$’000 | | 2009-10
$’000 | | 2010-11
$’000 | | 2011-12
$’000 | | 2012-13
$’000 |
Homelessness National Partnership Agreement | | — | | 18,630 | | 26,160 | | 27,260 | | 27,340 |
Funding will be provided to assist people who are homeless or at risk of homelessness to achieve sustainable housing and social inclusion. The Australian Government is providing $99.4 million over four years and matching funds will be contributed by the State. The implementation plan to support this agreement remains subject to final negotiations between the Queensland and Australian Governments. The capital component of this initiative can be found in Chapter 3 Capital Measures.
| | | | | | | | | | |
| | | 2008-09
$’000 | | 2009-10
$’000 | | 2010-11
$’000 | | 2011-12
$’000 | | 2012-13
$’000 |
Nation Building and Jobs Plan Element 2-Works on Existing Dwellings | | 14,970 | | 11,868 | | — | | — | | — |
The Australian Government announced funding of $6.4 billion over three and a half years for social housing under the Nation Building and Jobs Plan. Queensland will receive almost $1.281 billion which will deliver up to 4,000 new dwellings. Element two of the plan, the repairs and maintenance program, will focus on increasing the number of disability-modified dwellings, accelerating existing environmental initiatives and extending the useful life of some older stock. The capital component of this initiative can be found in Chapter 3 Capital Measures.
| | | | |
14 | | Budget Measures 2009 10 | | |
| | | | | | | | | | |
| | | 2008-09
$’000 | | 2009-10
$’000 | | 2010-11
$’000 | | 2011-12
$’000 | | 2012-13
$’000 |
National Affordable Housing Agreement | | — | | 235 | | 3,273 | | 7,232 | | 12,312 |
Funding will be provided for the National Affordable Housing Agreement (NAHA) which came into effect on 1 January 2009 and replaces funding previously provided through the Commonwealth State Housing Agreement. The NAHA aims to improve housing affordability, reduce homelessness and reduce Indigenous housing disadvantage. Queensland will receive an additional $23 million in funding over the term of the five year agreement. In addition to the NAHA, three related National Partnership Agreements have also been developed.
| | | | | | | | | | |
| | | 2008-09
$’000 | | 2009-10
$’000 | | 2010-11
$’000 | | 2011-12
$’000 | | 2012-13
$’000 |
Remote Indigenous Housing National Partnership Agreement | | 581 | | 17,584 | | 18,484 | | 21,686 | | 26,515 |
Funding will be provided to improve housing amenity and reduce overcrowding for Indigenous people, particularly in remote areas and discrete communities. Over the 10 year agreement, $1,156 billion will deliver new dwellings, repairs, maintenance and major upgrades to existing housing, tenancy management services and employment outcomes. The capital component of this initiative can be found in Chapter 3 Capital Measures.
| | | | |
| | | Budget Measures 2009 10 | | 15 |
Sport and Recreation Services
| | | | | | | | | | |
| | | 2008-09
$’000 | | 2009-10
$’000 | | 2010-11
$’000 | | 2011-12
$’000 | | 2012-13
$’000 |
Gold Coast Stadium | | — | | 200 | | 600 | | 6,000 | | 6,000 |
As announced in the 2009 State Election, funding is provided for debt servicing to support the capital program for the redevelopment of the Gold Coast Stadium. Expected to be completed in 2011, the redevelopment will increase stadium capactiy to 23,000 seats, support more than 350 jobs during construction and contribute $340 million to the economy over the next 10 years. The stadium is earmarked as the home ground for a new Gold Coast Australian Football League Team.
| | | | |
16 | | Budget Measures 2009 10 | | |
Department of Community Safety
Corrective Services
| | | | | | | | | | |
| | | 2008-09
$’000 | | 2009-10
$’000 | | 2010-11
$’000 | | 2011-12
$’000 | | 2012-13
$’000 |
Bridging the Gap | | — | | 330 | | 530 | | 600 | | — |
The Government is providing additional funding for the Bridging the Gap program as part of the Prevention and Early Intervention Initiative. The program will identify prisoners with cognitive impairment or intellectual disability and provide them with specialised throughcare case management and support while they are in prison.
Bridging the Gap will also provide identified prisoners with specialist support and practical re-settlement assistance in the community after release from custody. The program aims to reduce the likelihood of further offending and thus minimise the cost of re-engagement with the criminal justice system.
| | | | | | | | | | |
| | | 2008-09
$’000 | | 2009-10
$’000 | | 2010-11
$’000 | | 2011-12
$’000 | | 2012-13
$’000 |
Probation and Parole Growth in Demand | | — | | 2,000 | | 3,000 | | 4,000 | | 5,000 |
The Government is providing additional funding of $14 million over four years and $5 million in ongoing funding from 2013-14 to manage increased demand on services supervising offenders in the community.
| | | | |
| | | Budget Measures 2009 10 | | 17 |
Emergency Services
| | | | | | | | | | |
| | | 2008-09
$’000 | | 2009-10
$’000 | | 2010-11
$’000 | | 2011-12
$’000 | | 2012-13
$’000 |
Contribution to Fire Service | | — | | 15,931 | | 15,931 | | 15,931 | | 15,931 |
The Government has made an additional $15.9 million available to the Queensland Fire and Rescue Service to fund wage increases, operating costs associated with the recently completed state-of-the-art Queensland Combined Emergency Services Training Academy at Whyte Island and the upgrade of equipment to maintain firefighter safety.
| | | | | | | | | | |
| | | 2008-09
$’000 | | 2009-10
$’000 | | 2010-11
$’000 | | 2011-12
$’000 | | 2012-13
$’000 |
Helicopter Services | | 500 | | 500 | | 500 | | 500 | | 500 |
The Government will provide additional funding to meet increased costs for state-owned rescue helicopters.
| | | | | | | | | | |
| | | 2008-09
$’000 | | 2009-10
$’000 | | 2010-11
$’000 | | 2011-12
$’000 | | 2012-13
$’000 |
Keeping Our Beaches Safe | | — | | 600 | | 600 | | 600 | | 600 |
The Government is committed to improving the safety of Queenslanders and visitors to our beaches and public swimming locations and as announced in the 2009 State Election, has donated a twin-engine EC135 helicopter to Surf Life Saving Queensland valued at $6 million. This will provide greater capacity for surf rescues and patrols along beaches from Coolangatta to Noosa. Funding of $400,000 per annum ongoing has also been allocated to cover the operating costs of the helicopter as well as funding of $200,000 per annum over four years for 23 new beach patrol services and additional equipment on regional beaches north of the Sunshine Coast.
| | | | |
18 | | Budget Measures 2009 10 | | |
| | | | | | | | | | |
| | | 2008-09
$’000 | | 2009-10
$’000 | | 2010-11
$’000 | | 2011-12
$’000 | | 2012-13
$’000 |
Prevention and Early Intervention Initiative-Vulnerable Clients | | — | | 373 | | 446 | | — | | — |
The Government will provide funding to implement a Queensland Ambulance Service Vulnerable Clients Program initiative to train ambulance officers to provide a coordinated and issues-focused approach to dealing with vulnerable clients. The initiative will ensure that at-risk vulnerable clients are identified early and referred to appropriate agencies for assistance before the need for high cost health intervention measures is required.
| | | | | | | | | | |
| | | 2008-09
$’000 | | 2009-10
$’000 | | 2010-11
$’000 | | 2011-12
$’000 | | 2012-13
$’000 |
Support Our Heroes-Rural Fire Service | | — | | 760 | | 1,840 | | 1,120 | | 1,100 |
As announced in the 2009 State Election, the Government will provide funds to the Rural Fire Service to purchase operating equipment. This is to equip volunteers with the tools they need to protect themselves and the community in the event of natural disaster and to ensure enhanced State capability.
| | | | | | | | | | |
| | | 2008-09
$’000 | | 2009-10
$’000 | | 2010-11
$’000 | | 2011-12
$’000 | | 2012-13
$’000 |
Support Our Heroes-State Emergency Services | | — | | 1,021 | | 1,015 | | 1,015 | | 1,015 |
As announced in the 2009 State Election, the Government is funding the State Emergency Service for the purchase of vehicles to equip volunteers with the tools they need to protect the community and ensure they are better prepared for natural disasters.
| | | | |
| | | Budget Measures 2009 10 | | 19 |
| | | | | | | | | | |
| | | 2008-09
$’000 | | 2009-10
$’000 | | 2010-11
$’000 | | 2011-12
$’000 | | 2012-13
$’000 |
Sustainable Disaster Management | | — | | 1,725 | | 1,725 | | 1,725 | | 1,725 |
The Government is providing funding to deliver disaster management priorities through the continuation of staffing for Disaster Operations, Disaster Management Compliance and the provision of Emergency Management Queensland regional disaster management positions that will support enhanced disaster planning and preparedness.
| | | | |
20 | | Budget Measures 2009 10 | | |
Department of Education and Training
| | | | | | | | | | |
| | | 2008-09
$’000 | | 2009-10
$’000 | | 2010-11
$’000 | | 2011-12
$’000 | | 2012-13
$’000 |
Additional School Grants | | — | | 7,475 | | 14,950 | | 14,950 | | 14,950 |
As announced in the 2009 State Election, the Government will provide funding for additional school grants commencing in the 2010 school year, with an additional $10,000 per school for all schools, and a further $3,000 per school for schools in disadvantaged areas.
| | | | | | | | | | |
| | | 2008-09
$’000 | | 2009-10
$’000 | | 2010-11
$’000 | | 2011-12
$’000 | | 2012-13
$’000 |
Additional Teacher Aides | | — | | 4,500 | | 14,100 | | 24,500 | | 29,300 |
As announced in the 2009 State Election, the Government will provide funding to progressively implement a three year commitment to allocate an additional 15,000 hours of teacher aide time each week to support students from Prep to Year 7.
| | | | | | | | | | |
| | | 2008-09
$’000 | | 2009-10
$’000 | | 2010-11
$’000 | | 2011-12
$’000 | | 2012-13
$’000 |
Better TAFE Facilities | | — | | 39,124 | | — | | — | | — |
Funding will be provided as part of the Australian Government Teaching and Learning Capital Fund for Vocational Education and Training to support priority maintenance, small capital works and purchases of plant and equipment by Queensland TAFE institutes.
| | | | |
| | | Budget Measures 2009 10 | | 21 |
| | | | | | | | | | |
| | | 2008-09
$’000 | | 2009-10
$’000 | | 2010-11
$’000 | | 2011-12
$’000 | | 2012-13
$’000 |
Building the Education Revolution | | 39,177 | | 286,053 | | 110,526 | | — | | — |
The Queensland Government will manage a major program of capital investment as part of the Australian Government’s Building the Education Revolution infrastructure package. This is the expense component of the program which will include minor infrastructure and school refurbishment projects across all state schools under the National School Pride program, construction and renewal of large scale primary school infrastructure under Primary Schools for the 21st Century and the construction of science and language laboratories under Secondary Schools Science and Language Centres for the 21st Century. The capital component of this initiative can be found in Chapter 3 Capital Measures.
| | | | | | | | | | |
| | | 2008-09
$’000 | | 2009-10
$’000 | | 2010-11
$’000 | | 2011-12
$’000 | | 2012-13
$’000 |
Early Childhood Reform | | 20 | | 19,240 | | 40,720 | | 103,540 | | 143,950 |
The Queensland and Australian Governments are working together to ensure universal access to quality early childhood education in the year before school. Funding is provided by the Australian Government as part of the Early Childhood Reform National Partnership. This initiative also includes minor works and capital grants as part of the Queensland Government’s commitment to establish up to 240 additional kindergarten services by 2014. Details of the capital component can be found in Chapter 3 Capital Measures.
| | | | |
22 | | Budget Measures 2009 10 | | |
| | | | | | | | | | |
| | | 2008-09
$’000 | | 2009-10
$’000 | | 2010-11
$’000 | | 2011-12
$’000 | | 2012-13
$’000 |
Edmund Rice Bridge Program | | — | | 1,164 | | 913 | | 913 | | — |
In an effort to prevent future high-cost interventions, the Government will provide funding from the Prevention and Early Intervention Initiative for the Edmund Rice Bridge Program. The program is an innovative model of support for young people aged between 12 and 15 years who are returning from the juvenile justice system and who are at risk of disengaging from education and other social connections.
| | | | | | | | | | |
| | | 2008-09
$’000 | | 2009-10
$’000 | | 2010-11
$’000 | | 2011-12
$’000 | | 2012-13
$’000 |
Every Child Counts-Logan Pilot | | — | | 2,798 | | 2,921 | | 2,963 | | — |
As part of the Prevention and Early Intervention Initiative the Government will provide funding for Every Child Counts, an innovative pilot program which will trial new approaches to improving the educational outcomes of disadvantaged students in the Logan area. By intervening early the Government aims to avoid significant future costs.
| | | | | | | | | | |
| | | 2008-09
$’000 | | 2009-10
$’000 | | 2010-11
$’000 | | 2011-12
$’000 | | 2012-13
$’000 |
Literacy and Numeracy Action Plan | | — | | 9,750 | | 15,240 | | 15,620 | | — |
The Government will provide funding to enable intensive teaching for Year 3 and 5 students not meeting national standards in literacy and numeracy, engage up to 80 literacy and numeracy coaches in schools that are not achieving national standards and establish 72 Summer schools for Year 5 to 7 students who need extra support and to provide intensive professional development support to teachers. This initiative is supplemented by redirection of existing funding of $31.7 million over three years, and forms part of the joint Commonwealth-State Literacy and Numeracy National Partnership.
| | | | |
| | | Budget Measures 2009 10 | | 23 |
| | | | | | | | | | |
| | | 2008-09
$’000 | | 2009-10
$’000 | | 2010-11
$’000 | | 2011-12
$’000 | | 2012-13
$’000 |
Maintenance of Employee Housing | | 5,000 | | 10,000 | | 5,000 | | — | | — |
The Government will undertake a further program of maintenance for employee housing across the State. This initiative will increase the maintenance funding for employee housing to a total of $15.8 million for 2008-09, $22.4 million for 2009-10 and $12.4 million for 2010-11.
| | | | | | | | | | |
| | | 2008-09
$’000 | | 2009-10
$’000 | | 2010-11
$’000 | | 2011-12
$’000 | | 2012-13
$’000 |
National Secondary Schools Computer Fund | | 30,015 | | 113,284 | | 66,185 | | 80,183 | | 41,050 |
Funding will be provided for new information and communication technology (ICT) for Queensland secondary schools with students in years 9 to 12. This initiative forms part of the Australian Government’s Digital Education Revolution which will deliver sustainable and meaningful change in teaching and learning to prepare state and non-state school students for further education and training and life and work in a digital world.
| | | | | | | | | | |
| | | 2008-09
$’000 | | 2009-10
$’000 | | 2010-11
$’000 | | 2011-12
$’000 | | 2012-13
$’000 |
Productivity Places Program National Partnership | | 12,428 | | 62,352 | | 85,880 | | 98,690 | | — |
Funding will be provided by the Australian Government, together with an investment of $124.3 million over four years by the Queensland Government, and contributions from individuals and enterprises, to provide a major boost to skilling over a four year period. This program will create around 102,000 additional training places for Queenslanders in the workforce, together with around 46,000 additional training places for job seekers, including new entrants to the labour market, in priority qualifications.
| | | | |
24 | | Budget Measures 2009 10 | | |
| | | | | | | | | | |
| | | 2008-09
$’000 | | 2009-10
$’000 | | 2010-11
$’000 | | 2011-12
$’000 | | 2012-13
$’000 |
Science Spark | | — | | 11,090 | | 15,920 | | 16,470 | | 15,100 |
The Government will provide funding for a new Science Spark Program which will include 100 new science teachers in primary schools to work with students in Years 4 to 7, a comprehensive professional development program for primary teachers and an expansion in the number of Earth Smart Science Schools from 60 to 1,000.
| | | | | | | | | | |
| | | 2008-09
$’000 | | 2009-10
$’000 | | 2010-11
$’000 | | 2011-12
$’000 | | 2012-13
$’000 |
South East Queensland Public Private Partnership Schools Project | | — | | 2,515 | | 7,692 | | 12,719 | | 15,653 |
The Government will provide funding for financing costs associated with the service payments for the South East Queensland Public Private Partnership Schools Project. The project will build, operate and maintain seven new state schools in high growth areas. Primary schools will be located in Thornlands South, Peregian Springs, Bellbird Park and Collingwood Park in Ipswich, East Coomera and Bundilla on the Sunshine Coast. Peregian Springs and Thornlands South will be completed for the start of the 2010 school year. The remaining schools, including a new high school to be built at Murrumba Downs, will open in 2011 and 2012.
| | | | | | | | | | |
| | | 2008-09
$’000 | | 2009-10
$’000 | | 2010-11
$’000 | | 2011-12
$’000 | | 2012-13
$’000 |
Trade Training Centres in Schools | | 2,734 | | 61,092 | | 45,793 | | 47,842 | | 32,800 |
Funding will be provided by the Australian Government and made available by application to Queensland state and non-state schools to build, upgrade and equip trade or vocational education and training facilities. The Queensland and Australian Governments are working closely to establish Trade Training Centres to help increase the proportion of students achieving Year 12 or equivalent qualifications and skills in traditional trades and emerging industries.
| | | | |
| | | Budget Measures 2009 10 | | 25 |
Department of Employment, Economic Development and Innovation
Employment, Industry Development and Innovation
| | | | | | | | | | |
| | | 2008-09
$’000 | | 2009-10
$’000 | | 2010-11
$’000 | | 2011-12
$’000 | | 2012-13
$’000 |
Queensland Made Means Queensland Jobs | | — | | 1,350 | | 1,350 | | 1,350 | | 1,200 |
The Industry Capability Network (Queensland) assists competitive Queensland companies access major infrastructure and resource project opportunities and global supply chains. The Queensland Government has committed $6.45 million over five years ($1.2 million in 2013-14) to match Queensland industry skills and capabilities with the identified needs of major projects and supply chains.
Mines and Energy
| | | | | | | | | | |
| | | 2008-09
$’000 | | 2009-10
$’000 | | 2010-11
$’000 | | 2011-12
$’000 | | 2012-13
$’000 |
Clean Energy Strategy for Remote/Isolated Communities | | 5,000 | | — | | — | | — | | — |
As announced in the Major Economic Statement, the Government provided funding to Ergon Energy Corporation Limited to undertake a trial of an energy conservation program in Queensland’s isolated communities. The trial will investigate ways to reduce the cost of supplying energy to these communities as well as reducing greenhouse gas emissions and electricity bills.
| | | | |
26 | | Budget Measures 2009 10 | | |
| | | | | | | | | | |
| | | 2008-09
$’000 | | 2009-10
$’000 | | 2010-11
$’000 | | 2011-12
$’000 | | 2012-13
$’000 |
Energy Conservation and Demand Management | | — | | 47,700 | | — | | — | | — |
The Government will provide funding totalling $47.7 million to ENERGEX Limited and Ergon Energy Corporation Limited, including $18.3 million announced in the Major Economic Statement, to initiate a range of energy conservation and demand management measures designed to reduce peak electricity demand in Queensland. Implementing these measures is expected to significantly reduce greenhouse gas emissions as well as electricity infrastructure costs. This will also have potential to reduce long term increases in electricity tariffs through a reduction in required capital expenditure.
| | | | | | | | | | |
| | | 2008-09
$’000 | | 2009-10
$’000 | | 2010-11
$’000 | | 2011-12
$’000 | | 2012-13
$’000 |
Renewable Energy Projects | | — | | 10,266 | | 8,534 | | 7,000 | | — |
The Government will provide funding from the Queensland Renewable Energy Fund towards four projects:
| | • | | $4.3 million to Ergon Energy Corporation Limited for the new Birdsville Geothermal Power Station. The project will replace existing plant that is reaching the end of its design life with more efficient equipment that will use the existing wet geothermal resources more efficiently, producing more energy from these resources; |
| | • | | $9 million to Mackay Sugar Co-operative Association Ltd for the Mackay Sugar Cogeneration Project. This 36MW cogeneration project will use bagasse more productively than its traditional use in low efficiency boilers, replacing old, inefficient plant and streamlining storage practices at all of its mills; |
| | • | | $7.5 million grant to the Commonwealth Scientific and Industrial Research Organisation for SolarGas One subject to a significant financial commitment from an industry partner. This project will be the world’s first multi-tower solar array system using SolarGas technology; and |
| | • | | $5 million for the Coastal Geothermal Energy Initiative to define regions with higher geothermal heat flow and possible sources of hot rocks for geothermal energy, close to existing electricity transmission lines. |
| | | | |
| | | Budget Measures 2009 10 | | 27 |
| | | | | | | | | | | |
| | | 2008-09
$’000 | | 2009-10
$’000 | | | 2010-11
$’000 | | 2011-12
$’000 | | 2012-13
$’000 |
Street Lighting; Subsidy | | — | | (6,642 | ) | | — | | — | | — |
In 2008-09, the Government provided $13.3 million in grants to assist local governments in South East Queensland transition to higher street lighting tariffs. The street lighting subsidy will cease on 30 June 2009.
Primary Industries and Fisheries
| | | | | | | | | | |
| | | 2008-09
$’000 | | 2009-10
$’000 | | 2010-11
$’000 | | 2011-12
$’000 | | 2012-13
$’000 |
Exceptional Circumstances Primary Producer and Small Business Interest Subsidies | | 11,038 | | — | | — | | — | | — |
Funding was provided to primary producers and small businesses affected by adverse seasonal conditions arising from the drought.
| | | | | | | | | | |
| | | 2008-09
$’000 | | 2009-10
$’000 | | 2010-11
$’000 | | 2011-12
$’000 | | 2012-13
$’000 |
West Indian Program Drywood Termites | | 893 | | 554 | | — | | — | | — |
Additional funding is being provided for the treatment of West Indian Drywood Termites required under the Diseases in Timber Act 1975 and compensation payments due to loss of trade. Total funding in 2008-09 is $1.2 million and $0.9 million in 2009-10 (the above table does not include $0.35 million of existing internal funding provided in 2008-09 and 2009-10).
| | | | |
28 | | Budget Measures 2009 10 | | |
Tourism, Fair Trading and Office of Liquor, Gaming and Racing
| | | | | | | | | | |
| | | 2008-09
$’000 | | 2009-10
$’000 | | 2010-11
$’000 | | 2011-12
$’000 | | 2012-13
$’000 |
Queensland Tourism Strategy | | — | | 12,000 | | 12,000 | | 12,000 | | — |
A revised Queensland Tourism Strategy will provide an additional $36 million package over three years commencing 2009-10 to Protect Tourism Jobs. This will include facilitation of a new regionally focused marketing and product development campaign to drive tourism and tourism infrastructure development.
| | | | |
| | | Budget Measures 2009 10 | | 29 |
Department of Environment and Resource Management
Environmental Protection
| | | | | | | | | | |
| | | 2008-09
$’000 | | 2009-10
$’000 | | 2010-11
$’000 | | 2011-12
$’000 | | 2012-13
$’000 |
Bushfire Community Training Package | | — | | 600 | | 1,000 | | 1,000 | | 1,000 |
The Government will provide $4.6 million over five years, including $1 million in 2013-14, to develop and support a network of Volunteer Community Education Officers to deliver bushfire education messages to their local communities, especially in non-urban communities.
| | | | | | | | | | |
| | | 2008-09
$’000 | | 2009-10
$’000 | | 2010-11
$’000 | | 2011-12
$’000 | | 2012-13
$’000 |
ClimateSmart Business Service | | — | | — | | 1,000 | | 5,000 | | 5,000 |
The Government will provide $15 million over four years, including $4 million in 2013-14 for the ClimateSmart Business Service to supply information to small to medium businesses on how to save energy and reduce their greenhouse gas emissions.
| | | | | | | | | | |
| | | 2008-09
$’000 | | 2009-10
$’000 | | 2010-11
$’000 | | 2011-12
$’000 | | 2012-13
$’000 |
Disaster Management Warehouses and Caches | | — | | — | | 1,600 | | 1,600 | | 170 |
The Government will provide $3.4 million over three years for major equipment warehouses in Brisbane and Townsville and additional stock for existing warehouses in Cairns, Rockhampton, Toowoomba and Beenleigh to help the State Emergency Service respond to large scale emergencies and disasters.
| | | | |
30 | | Budget Measures 2009 10 | | |
| | | | | | | | | | |
| | | 2008-09
$’000 | | 2009-10
$’000 | | 2010-11
$’000 | | 2011-12
$’000 | | 2012-13
$’000 |
Disaster Preparedness in Vulnerable Communities | | — | | 1,320 | | 2,370 | | 1,640 | | 1,390 |
The Government will provide $7.7 million over five years, including $0.94 million in 2013-14 to develop community awareness, improve the ability of business to cope with the impact of disasters and improve evacuation preparedness in the event of a natural disaster.
| | | | | | | | | | |
| | | 2008-09
$’000 | | 2009-10
$’000 | | 2010-11
$’000 | | 2011-12
$’000 | | 2012-13
$’000 |
Energy Efficiency Retrofit Program | | — | | — | | 2,000 | | 2,000 | | 2,000 |
The Government will provide $8 million over 4 years, including $2 million in 2013-14, to support a progressive retrofit of government buildings to increase their energy efficiency.
| | | | | | | | | | |
| | | 2008-09
$’000 | | 2009-10
$’000 | | 2010-11
$’000 | | 2011-12
$’000 | | 2012-13
$’000 |
Extending Rural Water Use Efficiency Initiative | | — | | 500 | | 1,000 | | 1,500 | | 1,500 |
The Government will extend its investment in the successful Rural Water Use Efficiency program and provide $4.5 million over four years to continue to build climate change resilience by partnering with stakeholders to promote water use efficiency on farms and improved energy efficiency in irrigation systems.
| | | | |
| | | Budget Measures 2009 10 | | 31 |
| | | | | | | | | | |
| | | 2008-09
$’000 | | 2009-10
$’000 | | 2010-11
$’000 | | 2011-12
$’000 | | 2012-13
$’000 |
Great Barrier Reef Protection Package | | 385 | | 8,983 | | 9,039 | | 13,296 | | 10,670 |
The Government is developing a package of legislative and related measures to prevent broad scale agricultural pollution of the Great Barrier Reef. Additional funding of $50 million over five years (including $6.2 million in 2013-14 and a reallocation of $1.4 million in internal funding) is provided for the Great Barrier Reef Protection Package. This is the State’s first regulatory step toward mitigating the impacts of key pollutants, for example, nutrients, sediments and pesticides, on reef quality.
| | | | | | | | | | |
| | | 2008-09
$’000 | | 2009-10
$’000 | | 2010-11
$’000 | | 2011-12
$’000 | | 2012-13
$’000 |
Maintenance of EPA Estate Assets | | — | | 5,000 | | 5,000 | | 5,000 | | 5,000 |
The Government will provide additional ongoing funding of $5 million per annum for the maintenance of assets on the protected area estate. Protected area infrastructure and visitor services include roads and fire-lines, walking tracks, camping areas and day-use facilities, administrative buildings and workshops.
| | | | | | | | | | |
| | | 2008-09
$’000 | | 2009-10
$’000 | | 2010-11
$’000 | | 2011-12
$’000 | | 2012-13
$’000 |
Mining, Petroleum and Gas Industry Expansion-Environmental Assessments | | — | | 1,200 | | 1,200 | | 1,200 | | 1,200 |
The Government will provide additional funding of $1.2 million per annum for an increase in comprehensive Environmental Impact Statement assessments. This will increase the capacity to assess the environmental implications and mitigation measures of proposed major mining, gas and petroleum projects, and allow the timely commencement of approved new projects in regional communities.
| | | | |
32 | | Budget Measures 2009 10 | | |
| | | | | | | | | | |
| | | 2008-09
$’000 | | 2009-10
$’000 | | 2010-11
$’000 | | 2011-12
$’000 | | 2012-13
$’000 |
Moreton Bay Marine Park Management | | — | | 930 | | 930 | | 930 | | 930 |
The Government will provide additional funding of $0.93 million per annum for an extra eight rangers for the Moreton Bay Marine Park. The rangers will undertake compliance and public education activities, research and monitoring programs, and respond to wildlife strandings within the expanded Moreton Bay Marine Park.
Natural Resources and Water
| | | | | | | | | | |
| | | 2008-09
$’000 | | 2009-10
$’000 | | 2010-11
$’000 | | 2011-12
$’000 | | 2012-13
$’000 |
Continued Roll Out of Water Metering Program | | — | | 1,940 | | 1,063 | | 980 | | 900 |
To demonstrate the Government’s commitment to the National Water Initiative, additional funding of $4.9 million over four years is provided to continue the water metering program for rural water users throughout the State. The program provides reliable and credible water information on the take of water. This is used to ensure rural water users receive their fair share of the resource, according to what they are entitled to take and environmental outcomes are achieved.
| | | | | | | | | | |
| | | 2008-09
$’000 | | 2009-10
$’000 | | 2010-11
$’000 | | 2011-12
$’000 | | 2012-13
$’000 |
Expansion of the Wild River Rangers Program | | — | | 897 | | 1,380 | | 1,380 | | 1,380 |
The Wild River Rangers program will be expanded with additional funding of $5 million over four years ($0.9 million in 2009-10) to employ an additional 10 rangers. Initial placements for negotiation with local Indigenous communities include Hinchinbrook Island and the Staaten River catchment. Other negotiations are likely to include the Northern Peninsular Area and additional rangers for established groups throughout the Gulf of Carpentaria and Cape York Peninsula.
| | | | |
| | | Budget Measures 2009 10 | | 33 |
Department of Health
| | | | | | | | | | |
| | | 2008-09
$’000 | | 2009-10
$’000 | | 2010-11
$’000 | | 2011-12
$’000 | | 2012-13
$’000 |
Expanded Detention Centre | | — | | — | | 1,053 | | 1,857 | | 1,850 |
The Government will provide funding to meet the additional service delivery requirements, including health and education services, for the expansion of the Cleveland Youth Detention Centre in Townsville. This will enhance capacity to provide more appropriate program and clinical interventions to young people in detention. This is a whole-of-Government initiative.
| | | | | | | | | | |
| | | 2008-09
$’000 | | 2009-10
$’000 | | 2010-11
$’000 | | 2011-12
$’000 | | 2012-13
$’000 |
Expanded Rehabilitation and Step Down Facilities | | — | | 12,975 | | 16,800 | | 20,625 | | 20,625 |
As announced in the 2009 State Election, funding will be provided to expand rehabilitation services, with additional bed capacity at Eventide Sandgate, Rockhampton Hospital and Parklands Townsville. Central Queensland will also benefit from new outreach services, based at Rockhampton. Of this funding $1.1 million will be spent delivering world class online tools to assist doctors and nurses to assess elderly patients faster. This initiative is being funded through the National Partnership Agreement on Hospital and Health Workforce Reform. The capital component of this initiative can be found in Chapter 3 Capital Measures.
| | | | |
34 | | Budget Measures 2009 10 | | |
| | | | | | | | | | |
| | | 2008-09
$’000 | | 2009-10
$’000 | | 2010-11
$’000 | | 2011-12
$’000 | | 2012-13
$’000 |
Faster Emergency Care in our Hospitals | | — | | — | | 6,821 | | 12,629 | | — |
As announced in the 2009 State Election, funding will be provided to upgrade or expand emergency departments at Logan, Redland and QEII Hospitals to improve efficiency through additional adult treatment bays, dedicated paediatric waiting areas and treatment bays. This initiative is being funded through the National Partnership Agreement on Hospital and Health Workforce Reform. The capital component of this initiative can be found in Chapter 3 Capital Measures.
| | | | | | | | | | |
| | | 2008-09
$’000 | | 2009-10
$’000 | | 2010-11
$’000 | | 2011-12
$’000 | | 2012-13
$’000 |
Nurse Practitioners | | — | | 875 | | 2,625 | | 4,375 | | — |
As announced in the 2009 State Election, funding will be provided to train and recruit 30 new nurse practitioners to work in the busiest emergency departments to cut down on waiting times, with 10 commencing in the next 12 months. This initiative is being funded through the National Partnership Agreement on Hospital and Health Workforce Reform.
| | | | | | | | | | |
| | | 2008-09
$’000 | | 2009-10
$’000 | | 2010-11
$’000 | | 2011-12
$’000 | | 2012-13
$’000 |
Surgery Connect | | 30,000 | | 30,000 | | 40,000 | | 40,000 | | — |
The Government will provide additional funding for the Surgery Connect Program, which provides treatment opportunities for patients who have been waiting longer than clinically recommended for their surgery. This funding includes an additional $90 million announced during the 2009 State Election to provide an extra 20,000 elective surgery procedures over the next three years, including 3,300 procedures on children. This initiative is being funded from the National Health Care Agreement and Australian Government election commitment funding.
| | | | |
| | | Budget Measures 2009 10 | | 35 |
Department of Infrastructure and Planning
Infrastructure and Planning
| | | | | | | | | | |
| | | 2008-09
$’000 | | 2009-10
$’000 | | 2010-11
$’000 | | 2011-12
$’000 | | 2012-13
$’000 |
Green Building Skills Fund | | — | | 100 | | 140 | | 140 | | 120 |
As announced in the 2009 State Election, the Government has established a $0.5 million Green Building Skills Fund, to skill up to 3,000 industry participants with green building skills over four years. This will boost the green skills base of Queensland’s building industry across a range of professionals and support the ‘Green Door’ Initiative to lift environmental standards for all new homes, offices and government buildings.
| | | | | | | | | | |
| | | 2008-09
$’000 | | 2009-10
$’000 | | 2010-11
$’000 | | 2011-12
$’000 | | 2012-13
$’000 |
Townsville Marine Precinct | | — | | 6,500 | | 25,000 | | 5,000 | | — |
The Government is providing funding of up to $36.5 million which includes support for the construction of a new marine precinct in Townsville and assistance to marine industries affected by the construction of the Eastern Port Access Bridge. This precinct will gather Townsville’s marine industries into an efficient, environmentally friendly cluster.
| | | | |
36 | | Budget Measures 2009 10 | | |
Local Government
| | | | | | | | | | |
| | | 2008-09
$’000 | | 2009-10
$’000 | | 2010-11
$’000 | | 2011-12
$’000 | | 2012-13
$’000 |
Community Development Employment Programs | | — | | 1,440 | | 1,440 | | 1,440 | | 1,440 |
The Government will provide funding of $5.76 million over four years to fulfil its obligations under the Council of Australian Governments National Partnership Agreement on Indigenous Economic Participation. This will fund the conversion of 80 Community Development Employment Projects municipal services positions in mainland Indigenous Councils.
| | | | |
| | | Budget Measures 2009 10 | | 37 |
Department of Justice and Attorney-General
Justice and Attorney-General
| | | | | | | | | | |
| | | 2008-09
$’000 | | 2009-10
$’000 | | 2010-11
$’000 | | 2011-12
$’000 | | 2012-13
$’000 |
Magistrates Courts-Appointment of Additional Judicial Registrars | | — | | 700 | | 1,400 | | 1,400 | | 1,400 |
The Government is continuing funding to provide an innovative response to the growing workload of Queensland Magistrates by appointing judicial registrars in the Magistrates Courts. The success of a trial has resulted in the continuation of these arrangements in the key court centres of Brisbane, Beenleigh, Townsville and Southport and involves judicial registrars hearing some minor matters that previously required the determination of magistrates.
| | | | | | | | | | |
| | | 2008-09
$’000 | | 2009-10
$’000 | | 2010-11
$’000 | | 2011-12
$’000 | | 2012-13
$’000 |
Office of the Director of Public Prosecutions | | 3,500 | | 3,300 | | 3,300 | | 3,300 | | 3,300 |
The Government funded the Office of the Director of Public Prosecutions for additional staff to address workload increases in response to the appointment of additional judges and increased demand for services. The capital component of this initiative can be located in Chapter 3 Capital Measures.
| | | | |
38 | | Budget Measures 2009 10 | | |
| | | | | | | | | | |
| | | 2008-09
$’000 | | 2009-10
$’000 | | 2010-11
$’000 | | 2011-12
$’000 | | 2012-13
$’000 |
Queensland Civil and Administrative Tribunal | | 3,214 | | 2,759 | | — | | — | | — |
The Government is providing funding to implement the new Queensland Civil and Administrative Tribunal (QCAT), which will commence on 1 December 2009. QCAT will improve the delivery of justice services through the amalgamation of existing tribunals. The capital component of this initiative can be located in Chapter 3 Capital Measures.
| | | | | | | | | | |
| | | 2008-09
$’000 | | 2009-10
$’000 | | 2010-11
$’000 | | 2011-12
$’000 | | 2012-13
$’000 |
Registry of Births Deaths and Marriages | | — | | 1,914 | | 5,073 | | 5,656 | | 6,301 |
The Registry of Births, Deaths and Marriages will carry out the backcapture of life event registrations which currently exist in paper or index format only.
| | | | | | | | | | |
| | | 2008-09
$’000 | | 2009-10
$’000 | | 2010-11
$’000 | | 2011-12
$’000 | | 2012-13
$’000 |
Road Safety Initiatives | | 98 | | 859 | | 1,433 | | 1,819 | | 1,832 |
The Government is providing funding aimed at improving road safety and reducing the road toll in Queensland. This funding will allow the department to manage increased demand for services resulting from additional road safety activities undertaken by Queensland Transport and the Queensland Police Service.
| | | | |
| | | Budget Measures 2009 10 | | 39 |
| | | | | | | | | | |
| | | 2008-09
$’000 | | 2009-10
$’000 | | 2010-11
$’000 | | 2011-12
$’000 | | 2012-13
$’000 |
Special Circumstances Court Diversion | | 673 | | 1,200 | | 1,260 | | 590 | | — |
The Government is providing funding to improve access to the justice system by piloting appropriate interventions in the Magistrates Court for defendants charged with minor offences who have a mental illness, intellectual disability or cognitive impairment or who are homeless or at risk of homelessness.
| | | | | | | | | | |
| | | 2008-09
$’000 | | 2009-10
$’000 | | 2010-11
$’000 | | 2011-12
$’000 | | 2012-13
$’000 |
Telecommunications Interception-Crime and Misconduct Commission | | — | | 1,385 | | — | | — | | — |
The Government will commit funding to enable the Crime and Misconduct Commission to access an interim telephone interception capability, while evaluating options for the most appropriate long term implementation of this capability.
| | | | | | | | | | |
| | | 2008-09
$’000 | | 2009-10
$’000 | | 2010-11
$’000 | | 2011-12
$’000 | | 2012-13
$’000 |
Victims Financial Assistance and Service Scheme | | 1,850 | | 13,062 | | 15,570 | | 16,620 | | 16,620 |
The Government is providing additional funding to implement and operate the new Victims Financial Assistance and Service Scheme, which will commence 1 December 2009. The capital component of this initiative can be found in Chapter 3 Capital Measures.
| | | | |
40 | | Budget Measures 2009 10 | | |
Department of Police
| | | | | | | | | | |
| | | 2008-09
$’000 | | 2009-10
$’000 | | 2010-11
$’000 | | 2011-12
$’000 | | 2012-13
$’000 |
Digital Integrated Traffic Camera System | | 2,432 | | 4,628 | | — | | — | | — |
The Government is funding new technology to deliver a digital platform necessary for the upgraded fixed speed and red light camera programs. The capital component of this initiative can be found in Chapter 3 Capital Measures.
| | | | | | | | | | |
| | | 2008-09
$’000 | | 2009-10
$’000 | | 2010-11
$’000 | | 2011-12
$’000 | | 2012-13
$’000 |
Road Safety Enforcement Initiatives | | 3,937 | | 17,655 | | 23,223 | | 23,395 | | 23,608 |
The Government is funding a range of road safety initiatives including a staged roll-out of new fixed speed camera sites; micro Digi-Cam systems and additional handheld lasers and mobile radars to assist with speed management; additional motorcycles targeting road safety and traffic congestion management strategies; and additional Q-cars to target serial and high risk traffic offenders. Funding will also provide an additional 106 traffic police officers over two years starting in 2008-09. These initiatives are funded through an increase in traffic infringement penalties. The capital component of these initiatives can be found in Chapter 3 Capital Measures.
| | | | |
| | | Budget Measures 2009 10 | | 41 |
| | | | | | | | | | |
| | | 2008-09
$’000 | | 2009-10
$’000 | | 2010-11
$’000 | | 2011-12
$’000 | | 2012-13
$’000 |
Telecommunications Interception-Interim Arrangements | | — | | 2,009 | | — | | — | | — |
The Government has committed funding to enable the Queensland Police Service to access an interim telephone interception capability while evaluating options for the most appropriate long term implementation of this capability. The capital component of this initiative can be found in Chapter 3 Capital Measures.
| | | | |
42 | | Budget Measures 2009 10 | | |
Department of Public Works
| | | | | | | | | | |
| | | 2008-09
$’000 | | 2009-10
$’000 | | 2010-11
$’000 | | 2011-12
$’000 | | 2012-13
$’000 |
Security in Government Employee Houses in Indigenous Communities | | — | | 1,000 | | — | | — | | — |
The Government will provide funding of $1 million in 2009-10 to undertake an audit of the security in the Government’s employee housing portfolio in Indigenous communities. The funding will also allow urgent works to be undertaken on these residences to address identified safety and security issues.
| | | | |
| | | Budget Measures 2009 10 | | 43 |
Department of the Premier and Cabinet
| | | | | | | | | | |
| | | 2008-09
$’000 | | 2009-10
$’000 | | 2010-11
$’000 | | 2011-12
$’000 | | 2012-13
$’000 |
Brisbane Festival | | 2,000 | | 2,000 | | 2,000 | | 2,000 | | 2,000 |
The Government is providing additional funding of up to $2 million for the Brisbane Festival, bringing the Government’s total commitment to $5.3 million per year. The additional funding will support the amalgamation of the biennial Brisbane Festival and the annual Riverfestival and the staging of a single annual event.
| | | | |
44 | | Budget Measures 2009 10 | | |
Department of Transport and Main Roads
Main Roads
| | | | | | | | | | |
| | | 2008-09
$’000 | | 2009-10
$’000 | | 2010-11
$’000 | | 2011-12
$’000 | | 2012-13
$’000 |
Queensland Motorcycle Safety Strategy | | — | | 4,000 | | 4,000 | | 4,000 | | 4,000 |
The Government is providing $20 million over five years starting in 2009-10 specifically to address accident sites predominantly involving motorcycles. New works will provide high-benefit, cost-effective treatments to mitigate both known and potentially high severity crash sites on the state-controlled road network. This new expenditure, funded from the increased revenue available under the Camera Detection Offences Program, is being administered through the Safer Roads Sooner Program, and is in addition to allocations under that program.
| | | | | | | | | | |
| | | 2008-09
$’000 | | 2009-10
$’000 | | 2010-11
$’000 | | 2011-12
$’000 | | 2012-13
$’000 |
Safer Roads Sooner-Additional Road Upgrades | | 2,604 | | 15,000 | | 15,000 | | 15,000 | | — |
The Government announced in November 2008 that it would provide additional funding to the Safer Roads Sooner (SRS) Program. From 2009-10 an additional $45 million over three years, funded from the increase to the penalty unit amount, is available for allocation under the SRS Program towards road improvements that are directly aimed at addressing black spots on the state-controlled road network. To achieve this, SRS provides high-benefit, cost-effective projects to address both known and potentially high severity (fatal and hospitalisation) crash sites on the state-controlled road network.
| | | | |
| | | Budget Measures 2009 10 | | 45 |
Transport
| | | | | | | | | | |
| | | 2008-09
$’000 | | 2009-10
$’000 | | 2010-11
$’000 | | 2011-12
$’000 | | 2012-13
$’000 |
Queensland Motorcycle Safety Strategy | | 641 | | 1,662 | | 1,067 | | 744 | | 597 |
The Government will provide funding of $4.7 million over five years to further improve the education and safety of the motorcycling public of Queensland. These funds will be used to introduce improved learner and provisional licence schemes and requirements, targeted motorcycle public education campaigns and associated materials and address road maintenance and infrastructure projects targeted at motorcycle rider safety. The capital component of this initiative can be found in Chapter 3 Capital Measures.
| | | | | | | | | | |
| | | 2008-09
$’000 | | 2009-10
$’000 | | 2010-11
$’000 | | 2011-12
$’000 | | 2012-13
$’000 |
Taxi Subsidy Scheme | | 2,800 | | 7,000 | | — | | — | | — |
The Government will provide additional funding of $9.8 million over two years to the Taxi Subsidy Scheme to ensure mobility for eligible Queenslanders with physical and or intellectual impairments. This additional funding will supplement the continuity of transport services to approximately 48,300 Taxi Subsidy Scheme members. Growth in the scheme continues to rise based on an ageing population, an increase in Queenslanders with mobility impairments and annual increases in the costs of taxi fares.
| | | | |
46 | | Budget Measures 2009 10 | | |
| | | | | | | | | | |
| | | 2008-09
$’000 | | 2009-10
$’000 | | 2010-11
$’000 | | 2011-12
$’000 | | 2012-13
$’000 |
Upgrade of Queensland School Bus Fleet | | — | | — | | 8,440 | | 11,572 | | 8,348 |
The Government will provide additional funding of $28.4 million over three years to upgrade school buses. These additional funds will extend the current program of replacement of an ageing Queensland school bus fleet with newer rollover compliant vehicles.
| | | | | | | | | | |
| | | 2008-09
$’000 | | 2009-10
$’000 | | 2010-11
$’000 | | 2011-12
$’000 | | 2012-13
$’000 |
Urban Congestion Initiatives | | 1,030 | | 2,545 | | 4,767 | | 5,638 | | — |
The Government will allocate funding of $14 million to activities to address increasing congestion levels. These funds will provide programs to alter travel behaviour, present travel options, promote strategies to spread peak hour demand, keep traffic on our roads flowing freely, provide end-of-trip facilities to promote walking and cycling and review freight efficiency. The measures include:
| | • | | $5.7 million to trial a Real Time Passenger Information Service for public transport, on the Sunshine Coast; |
| | • | | $2.5 million for operation of five articulated passenger buses, capable of accommodating up to 180 passengers for operation on the South-East Busway; and |
| | • | | $1 million for operations and maintenance of additional Park and Ride facilities at railway stations within South-East Queensland. |
The capital component of this initiative can be found in Chapter 3 Capital Measures.
| | | | |
| | | Budget Measures 2009 10 | | 47 |
Legislative Assembly of Queensland
| | | | | | | | | | |
| | | 2008-09
$’000 | | 2009-10
$’000 | | 2010-11
$’000 | | 2011-12
$’000 | | 2012-13
$’000 |
Electorate Office Relocations from Redistribution and Security Upgrades | | 1,928 | | 900 | | — | | — | | — |
The Government has provided funding for the relocation of a number of Members’ electorate offices as a result of the 2008 Electoral Redistribution. Following a comprehensive security review conducted in 2007-08, the Government has also funded the implementation of a range of initiatives to improve electorate office security, including physical and electronic security initiatives and operational awareness and preparedness training for electorate office staff.
| | | | |
48 | | Budget Measures 2009 10 | | |
Treasury Department
| | | | | | | | | | | | | | |
| | | 2008-09
$’000 | | 2009-10
$’000 | | | 2010-11
$’000 | | | 2011-12
$’000 | | | 2012-13
$’000 | |
Abolition of the Queensland Fuel Subsidy Scheme | | — | | (554,050 | ) | | (594,000 | ) | | (612,000 | ) | | (630,000 | ) |
In light of the current fiscal environment, the Government will abolish the Queensland Fuel Subsidy Scheme from 1 July 2009.
| | | | | | | | | | | | | | |
| | | 2008-09
$’000 | | 2009-10
$’000 | | | 2010-11
$’000 | | | 2011-12
$’000 | | | 2012-13
$’000 | |
Additional Public Sector Efficiency Target | | — | | (200,000 | ) | | (200,000 | ) | | (200,000 | ) | | (200,000 | ) |
In the Major Economic Statement, the Government announced a public sector efficiency target of $100 million per annum from
2009-10 rising to $200 million from 2010-11. In light of the efficiencies to be made from the restructure of Government departments, the Government has decided to bring forward the $200 million per annum savings target to commence in 2009-10. Together with the 2008-09 target, the efficiency savings target will total $60 million in 2008-09 and $280 million per annum from 2009-10.
| | | | |
| | | Budget Measures 2009 10 | | 49 |
The following tables present the relevant portfolio capital measures relating to decisions taken since the 2008-09 Budget. This does not represent the full amount of additional funding provided to agencies since the 2008-09 Budget. For further explanation, refer to Explanation of Scope and Terms in Chapter 1.
| | | | |
50 | | Budget Measures 2009 10 | | |
Department of Communities
Community and Youth Justice Services
| | | | | | | | | | |
| | | 2008-09
$’000 | | 2009-10
$’000 | | 2010-11
$’000 | | 2011-12
$’000 | | 2012-13
$’000 |
Commission for Children and Young People and Child Guardian-Fit out for Office Relocation | | 2,938 | | — | | — | | — | | — |
The Government provided funding for the fitout of office accommodation for the Commission’s long term accommodation strategy. The Commission’s office relocated to new premises as part of a joint project with other government agencies. The co-location of the agencies consolidated various business operations and also resulted in reduced overall lease costs and opportunities to leverage off shared resources and infrastructure. The operating component of this initiative can be found in Chapter 2 Expense Measures.
| | | | | | | | | | |
| | | 2008-09
$’000 | | 2009-10
$’000 | | 2010-11
$’000 | | 2011-12
$’000 | | 2012-13
$’000 |
Expansion of Youth Detention Centre Capacity | | — | | 64,934 | | 65,011 | | 26,835 | | 3,287 |
The Government will provide funding to expand the capacity of Cleveland Youth Detention Centre and address the lack of detention capacity for young women in North Queensland. Total funding of $170.7 million includes $10.6 million from existing capital allocations for the accommodation of 48 additional beds and associated infrastructure. The operating component of this initiative can be found in Chapter 2 Expense Measures.
| | | | |
| | | Budget Measures 2009 10 | | 51 |
| | | | | | | | | | |
| | | 2008-09
$’000 | | 2009-10
$’000 | | 2010-11
$’000 | | 2011-12
$’000 | | 2012-13
$’000 |
Sustainable Resource Communities Funding-Moura Shire Council Youth Centre | | 100 | | 400 | | — | | — | | — |
The Government will fund the construction of a youth centre in Moura under the Sustainable Resource Communities Initiative launched in August 2008. This initiative provides funding for economic and social infrastructure in key mining areas to create new jobs and secure existing jobs in these communities.
Disability Services
| | | | | | | | | | |
| | | 2008-09
$’000 | | 2009-10
$’000 | | 2010-11
$’000 | | 2011-12
$’000 | | 2012-13
$’000 |
Wacol Infrastructure Upgrade | | 2,421 | | 3,426 | | 10,201 | | — | | — |
The Government will provide funding to upgrade infrastructure at Wacol to create purpose-designed positive environments for adults with an intellectual or cognitive disability who exhibit challenging behaviour and who are at risk of harm. This funding will help fulfil the delivery of the Government’s commitments to the Investing in Positive Futures Program of reforms. The operating component of this initiative can be found in Chapter 2 Expense Measures.
| | | | |
52 | | Budget Measures 2009 10 | | |
Housing and Homelessness Services
| | | | | | | | | | |
| | | 2008-09
$’000 | | 2009-10
$’000 | | 2010-11
$’000 | | 2011-12
$’000 | | 2012-13
$’000 |
Homelessness National Partnership Agreement | | 5,865 | | 5,865 | | 5,865 | | 5,865 | | 12,240 |
Funding of $35.7 million will be provided by the Australian Government and the Queensland Government will provide equivalent funding for the A Place to Call Home Initiative. Funding will provide at least 143 dwellings to people who are homeless or at high risk of homelessness, and provide tenancy and other support services for up to 12 months to stabilise tenants’ circumstances and ensure long-term stable tenancies. The operating component of this initiative can be found in Chapter 2 Expense Measures.
| | | | | | | | | | |
| | | 2008-09
$’000 | | 2009-10
$’000 | | 2010-11
$’000 | | 2011-12
$’000 | | 2012-13
$’000 |
Nation Building and Jobs Plan Element 1-New Capital Works | | 12,014 | | 776,367 | | 349,778 | | 62,575 | | — |
The Australian Government announced funding of $6.4 billion over three and a half years for social housing under the Nation Building and Jobs Plan. Queensland will receive almost $1,281 billion which will deliver up to 4,000 new dwellings. The initiative comprises two elements; one for new construction and another for repairs to existing social housing dwellings. Stage one of the construction element provides funding for social housing projects already in the development pipeline, which will see 444 new dwellings completed before 30 June 2010.
| | | | |
| | | Budget Measures 2009 10 | | 53 |
| | | | | | | | | | |
| | | 2008-09
$’000 | | 2009-10
$’000 | | 2010-11
$’000 | | 2011-12
$’000 | | 2012-13
$’000 |
Nation Building and Jobs Plan Element 2-Works on Existing Dwellings | | 25,078 | | 28,180 | | — | | — | | — |
The Australian Government announced funding of $6.4 billion over three and a half years for social housing under the Nation Building and Jobs Plan. Queensland will receive almost $1,281 billion which will deliver up to 4,000 new dwellings. Element two of the plan, the repairs and maintenance program, will focus on increasing the number of disability-modified dwellings, accelerating existing environmental initiatives and extending the useful life of some older stock. The operating component of this initiative can be found in Chapter 2 Expense Measures.
| | | | | | | | | | |
| | | 2008-09
$’000 | | 2009-10
$’000 | | 2010-11
$’000 | | 2011-12
$’000 | | 2012-13
$’000 |
Remote Indigenous Housing National Partnership Agreement | | — | | 91,707 | | 48,263 | | 74,798 | | 119,175 |
Funding of $1.156 billion will be provided by the Australian Government over 10 years to improve housing amenity and reduce overcrowding for Indigenous people, particularly in remote areas and discrete communities. Funding will provide new dwellings, repairs, maintenance and major upgrades to existing housing, tenancy management services and employment outcomes. The operating component of this initiative can be found in Chapter 2 Expense Measures.
| | | | |
54 | | Budget Measures 2009 10 | | |
| | | | | | | | | | |
| | | 2008-09
$’000 | | 2009-10
$’000 | | 2010-11
$’000 | | 2011-12
$’000 | | 2012-13
$’000 |
Social Housing National Partnership Agreement | | 5,000 | | 75,096 | | — | | — | | — |
Under the Social Housing National Partnership Agreement, $80.1 million will be provided by the Australian Government over two years for the construction of new social housing, improved housing opportunities for Indigenous people and accommodation options to assist persons who are homeless or at risk of homelessness to transition to secure long term accommodation. Funding will boost new social housing dwellings by 141 in 2008-09 and 250 in 2009-10.
| | | | | | | | | | |
| | | 2008-09
$’000 | | 2009-10
$’000 | | 2010-11
$’000 | | 2011-12
$’000 | | 2012-13
$’000 |
Sustainable Resource Communities Funding-Moranbah Affordable Housing | | 2,400 | | 1,100 | | — | | — | | — |
As part of the Sustainable Resource Communities Funding Initiative, $3.5 million will be provided towards the construction of 42 affordable private rental dwellings in Moranbah to alleviate the lack of affordable housing.
Sport and Recreation Services
| | | | | | | | | | |
| | | 2008-09
$’000 | | 2009-10
$’000 | | 2010-11
$’000 | | 2011-12
$’000 | | 2012-13
$’000 |
Sustainable Resource Communities Funding-Emerald Driver Training | | 1,000 | | 1,000 | | — | | — | | — |
As part of the Sustainable Resource Communities Funding Initiative, the Government has committed funding of $2 million to the Central Highlands Regional Council towards the construction of the Emerald Driver Training and Motor Sport Complex. This project will include a facility for driver training, heavy plant operator training and a motor sport element.
| | | | |
| | | Budget Measures 2009 10 | | 55 |
| | | | | | | | | | |
| | | 2008-09
$’000 | | 2009-10
$’000 | | 2010-11
$’000 | | 2011-12
$’000 | | 2012-13
$’000 |
Sustainable Resource Communities Funding-Hunter Street Sports Complex, Blackwater | | 750 | | 750 | | — | | — | | — |
As part of the Sustainable Resource Communities Funding Initiative, the Government has committed funding of $1.5 million to the Central Highlands Regional Council towards the construction of the Hunter Street Sports Complex Development at Blackwater. This project will include four high-quality, multi-purpose playing fields with mixed, automatic irrigation systems for rugby league, rugby union, soccer, cricket and touch football.
| | | | | | | | | | |
| | | 2008-09
$’000 | | 2009-10
$’000 | | 2010-11
$’000 | | 2011-12
$’000 | | 2012-13
$’000 |
Sustainable Resource Communities Funding-Moura Aquatic Centre | | 500 | | 500 | | — | | — | | — |
As part of the Sustainable Resource Communities Funding Initiative, the Government has committed funding of $1 million over two years to the Banana Shire Council towards the upgrade of the Moura Aquatic Centre. This project will involve upgrading the existing facility to include a heated pool.
| | | | | | | | | | |
| | | 2008-09
$’000 | | 2009-10
$’000 | | 2010-11
$’000 | | 2011-12
$’000 | | 2012-13
$’000 |
Sustainable Resource Communities Funding-Upgrade the Cloncurry Pool | | 200 | | 200 | | — | | — | | — |
As part of the Sustainable Resource Communities Funding Initiative, the Government has committed funding of $0.4 million to the Cloncurry Shire Council towards the upgrade of the Cloncurry Pool. This project will include replacing the existing filtration system and the replacement of the existing pool tiles.
| | | | |
56 | | Budget Measures 2009 10 | | |
Department of Community Safety
Corrective Services
| | | | | | | | | | |
| | | 2008-09
$’000 | | 2009-10
$’000 | | 2010-11
$’000 | | 2011-12
$’000 | | 2012-13
$’000 |
Probation and Parole Growth-Office Accommodation | | — | | 450 | | 450 | | 450 | | 450 |
The Government is providing funding to meet staff office accommodation requirements as a result of growth in demand for Probation and Parole Services.
Emergency Services
| | | | | | | | | | |
| | | 2008-09
$’000 | | 2009-10
$’000 | | 2010-11
$’000 | | 2011-12
$’000 | | 2012-13
$’000 |
Support Our Heroes-Rural Fire Service Equipment | | — | | 1,080 | | — | | 720 | | 720 |
The Government will provide funding to the Rural Fire Service for the purchase of vehicles. This is to equip volunteers with the mobility and tools they need to protect themselves and the community in the event of natural disaster and to ensure enhanced State capability.
| | | | |
| | | Budget Measures 2009 10 | | 57 |
| | | | | | | | | | |
| | | 2008-09
$’000 | | 2009-10
$’000 | | 2010-11
$’000 | | 2011-12
$’000 | | 2012-13
$’000 |
Support Our Heroes-State Emergency Services Equipment | | — | | 200 | | 200 | | 180 | | 180 |
The Government will provide funding to the State Emergency Service for the purchase of flood boats and rescue trailers to equip volunteers with the tools they need to protect the community and ensure they are better prepared for natural disasters.
| | | | | | | | | | |
| | | 2008-09
$’000 | | 2009-10
$’000 | | 2010-11
$’000 | | 2011-12
$’000 | | 2012-13
$’000 |
Sustainable Resource Communities Funding-Upgrade of Bowen Basin Emergency Services Centres | | 775 | | 700 | | — | | — | | — |
Funding has been committed to establish and/or upgrade Emergency Services Centres at Moranbah, Rolleston and Nebo to improve emergency front line service delivery in these areas.
| | | | |
58 | | Budget Measures 2009 10 | | |
Department of Education and Training
| | | | | | | | | | |
| | | 2008-09
$’000 | | 2009-10
$’000 | | 2010-11
$’000 | | 2011-12
$’000 | | 2012-13
$’000 |
Additional Assistance for non-State Schools | | — | | — | | 50,000 | | — | | — |
The Government will provide additional one-off support to the non-state sector for new schools or the extension of existing school facilities to cater specifically for disengaged young people, through funds under the $850 million, five year State Schools of Tomorrow Initiative.
| | | | | | | | | | |
| | | 2008-09
$’000 | | 2009-10
$’000 | | 2010-11
$’000 | | 2011-12
$’000 | | 2012-13
$’000 |
Building the Education Revolution | | 38,243 | | 882,229 | | 569,380 | | — | | — |
The Queensland Government will manage a major program of capital investment as part of the Australian Government’s Building the Education Revolution infrastructure package. This will include minor infrastructure and school refurbishment projects across all state schools under the National School Pride program, construction and renewal of large scale primary school infrastructure under Primary Schools for the 21st Century and the construction of science and language laboratories under Secondary Schools Science and Language Centres for the 21st Century. The expense component of this initiative can be found in Chapter 2 Expense Measures.
| | | | |
| | | Budget Measures 2009 10 | | 59 |
| | | | | | | | | | |
| | | 2008-09
$’000 | | 2009-10
$’000 | | 2010-11
$’000 | | 2011-12
$’000 | | 2012-13
$’000 |
Building the Education Revolution-non-State Schools | | 55,800 | | 487,000 | | 296,900 | | — | | — |
Funding of almost $840 million will be provided to the non-state sector to enable significant infrastructure investment as part of the Australian Government’s Building the Education Revolution Initiative.
| | | | | | | | | | |
| | | 2008-09
$’000 | | 2009-10
$’000 | | 2010-11
$’000 | | 2011-12
$’000 | | 2012-13
$’000 |
Early Childhood Reform-Kindergarten Infrastructure | | 180 | | 18,290 | | 26,170 | | 57,450 | | 81,660 |
The Queensland and Australian Governments are working together to ensure universal access to quality early childhood education in the year before school. The Queensland Government has committed more than $300 million over six years to establish up to 240 additional kindergarten services by 2014. Funding is also provided by the Australian Government as part of the Early Childhood Reform National Partnership. The expense component of this initiative can be found in Chapter 2 Expense Measures.
| | | | | | | | | | |
| | | 2008-09
$’000 | | 2009-10
$’000 | | 2010-11
$’000 | | 2011-12
$’000 | | 2012-13
$’000 |
Upgrade of various childcare centres | | — | | 3,650 | | — | | — | | — |
The Government is providing funding through the Sustainable Resource Communities Initiative to expand child care capacity in the Bowen Basin communities of Moura, Clermont, Moranbah, Theodore, Blackwater and Middlemount.
| | | | |
60 | | Budget Measures 2009 10 | | |
Department of Employment, Economic Development and Innovation
Primary Industries and Fisheries
| | | | | | | | | | | |
| | | 2008-09
$’000 | | 2009-10
$’000 | | 2010-11
$’000 | | 2011-12
$’000 | | 2012-13
$’000 | |
A Fresh Approach | | — | | 10,000 | | 5,000 | | — | | (15,000 | ) |
The Fresh Approach Initiative aims to build a skilled agricultural workforce, implement a Research and Development investment strategy and network, and modernise services to accelerate the economic growth of the primary industries sector. To support the Fresh Approach, $15 million is being advanced for the infrastructure component of the strategy, with repayment to be made in 2012-13 from the rationalisation of research infrastructure.
| | | | |
| | | Budget Measures 2009 10 | | 61 |
Department of Health
| | | | | | | | | | |
| | | 2008-09
$’000 | | 2009-10
$’000 | | 2010-11
$’000 | | 2011-12
$’000 | | 2012-13
$’000 |
Expanded Rehabilitation and Step Down Facilities | | — | | — | | 14,700 | | — | | — |
As announced in the 2009 State Election, funding will be provided to expand Parklands Townsville and the Rockhampton Hospital to deliver expanded rehabilitation services through additional bed capacity. This initiative is being funded through the National Partnership Agreement on Hospital and Health Workforce Reform. The expense component of this initiative can be found in Chapter 2 Expense Measures.
| | | | | | | | | | |
| | | 2008-09
$’000 | | 2009-10
$’000 | | 2010-11
$’000 | | 2011-12
$’000 | | 2012-13
$’000 |
Faster Emergency Care in our Hospitals | | — | | 31,000 | | 34,700 | | 60,000 | | — |
As announced in the 2009 State Election, funding will be provided to expand Queensland’s busiest emergency departments, including at Logan, Redland, QEII, Ipswich, Caboolture, Bundaberg and Toowoomba Hospitals. This initiative will also include the development of a dedicated paediatric emergency department at The Prince Charles Hospital. This initiative is being funded through the National Partnership Agreement on Hospital and Health Workforce Reform. The expense component of this initiative can be found in Chapter 2 Expense Measures.
| | | | |
62 | | Budget Measures 2009 10 | | |
| | | | | | | | | | |
| | | 2008-09
$’000 | | 2009-10
$’000 | | 2010-11
$’000 | | 2011-12
$’000 | | 2012-13
$’000 |
Queensland Children’s Hospital Academic and Research Centre | | — | | 6,000 | | 12,000 | | 24,000 | | 30,000 |
The Government will provide $80 million over five years ($8 million in 2013-14) to establish an Academic and Research Centre
co-located with the new Queensland Children’s Hospital, which will enhance the ability to attract and retain leading specialists in child and youth health. The new facility will support progress in priority areas of research and the achievement of improved health outcomes for children and young people through the direct application of research findings to clinical care.
| | | | | | | | | | |
| | | 2008-09
$’000 | | 2009-10
$’000 | | 2010-11
$’000 | | 2011-12
$’000 | | 2012-13
$’000 |
Rockhampton Hospital Expansion | | 6,000 | | 51,000 | | 19,000 | | — | | — |
Additional funding of $76 million over three years is being provided through the Australian Government’s Health and Hospitals Fund to further expand the Rockhampton Hospital, building on the Queensland Government-funded redevelopment currently underway. This new expansion will provide additional inpatient beds, operating theatres, and education and research space to support regional health training. This project will bring the total cost of the Rockhampton Hospital expansion to $149 million.
| | | | | | | | | | |
| | | 2008-09
$’000 | | 2009-10
$’000 | | 2010-11
$’000 | | 2011-12
$’000 | | 2012-13
$’000 |
Sustainable Resource Communities Funding-Patient and Staff Accommodation and Facility Upgrades | | 1,290 | | 3,615 | | 1,000 | | 5,500 | | — |
The Government is providing funding through the Sustainable Resource Communities Initiative for new patient accommodation at Mount Isa; the extension and renovation of the Middlemount Community Health Centre; a new aged care annex attached to the Cloncurry Hospital; and new staff accommodation at Moranbah, Clermont, Dysart and Mount Isa.
| | | | |
| | | Budget Measures 2009 10 | | 63 |
| | | | | | | | | | |
| | | 2008-09
$’000 | | 2009-10
$’000 | | 2010-11
$’000 | | 2011-12
$’000 | | 2012-13
$’000 |
Townsville Hospital Expansion | | — | | 19,000 | | 33,800 | | 100,200 | | 82,000 |
Additional funding of $250 million over five years ($15 million in 2013-14) is being provided through the Australian Government’s Health and Hospitals Fund to further expand the Townsville Hospital, building on the Queensland Government-funded redevelopment currently underway. This new expansion will provide additional beds, operating theatres and support services for the people of North Queensland. This project will bring the total cost of the Townsville Hospital expansion to $332.8 million.
| | | | |
64 | | Budget Measures 2009 10 | | |
Department of Infrastructure and Planning
Infrastructure and Planning
| | | | | | | | | | |
| | | 2008-09
$’000 | | 2009-10
$’000 | | 2010-11
$’000 | | 2011-12
$’000 | | 2012-13
$’000 |
Callide to Gladstone LNG Land Corridor | | — | | 15,000 | | 15,000 | | — | | — |
As announced in the 2009 State Election, the Government will provide $30 million in funding to purchase land for a Callide to Gladstone ‘gas super-highway’. The land will create a 70km by 200 metre wide corridor between Callide and the Gladstone State Development Area to accommodate co-location of the LNG pipelines to Curtis Island. The land has an estimated value of up to $30 million and the up front cost of the land will be recovered from the companies utilising the infrastructure corridor.
| | | | | | | | | | |
| | | 2008-09
$’000 | | 2009-10
$’000 | | 2010-11
$’000 | | 2011-12
$’000 | | 2012-13
$’000 |
Whitsunday Airport Upgrade | | — | | 4,000 | | — | | — | | — |
As announced in the 2009 State Election, the Government will provide funding of $4 million towards the upgrade of the Whitsunday Airport.
| | | | |
| | | Budget Measures 2009 10 | | 65 |
Local Government
| | | | | | | | | | |
| | | 2008-09
$’000 | | 2009-10
$’000 | | 2010-11
$’000 | | 2011-12
$’000 | | 2012-13
$’000 |
Flinders Street Mall Redevelopment-Townsville | | — | | 18,900 | | — | | — | | — |
As announced in the 2009 State Election, the Government will provide $18.9 million to support the redevelopment of the Flinders Street Mall. The Queensland Government contribution towards the Mall will occur in conjunction with contributions towards the project from the Australian Government and Townsville City Council.
| | | | | | | | | | |
| | | 2008-09
$’000 | | 2009-10
$’000 | | 2010-11
$’000 | | 2011-12
$’000 | | 2012-13
$’000 |
Jezzine Barracks Redevelopment-Townsville | | 2,000 | | 2,000 | | 2,000 | | 2,000 | | 2,000 |
As announced in the 2009 State Election, the Government will provide total funding of $10 million for the redevelopment of the historic Jezzine Barracks at North Ward to rejuvenate the area, improving public access and creating world class community facilities. The site has been preserved as a major heritage and community site and protected from future housing developments.
| | | | |
66 | | Budget Measures 2009 10 | | |
| | | | | | | | | | | | |
| | | 2008-09
$’000 | | 2009-10
$’000 | | 2010-11
$’000 | | 2011-12
$’000 | | | 2012-13
$’000 | |
Local Government Grants and Subsidies Program | | — | | 48,301 | | 78,543 | | (53,890 | ) | | (77,218 | ) |
$880 million has been identified for infrastructure projects since commencement of the five year $700 million suite of grants and subsidies program in 2006-07. The current grants and subsidies scheme will close and be replaced by a $45 million per annum scheme with new criteria for provision of infrastructure assistance for councils with limited financial resources. Existing commitments under the ceasing program, including high priority sewerage treatment plant upgrades totalling $437.9 million, will be met.
| | | | |
| | | Budget Measures 2009 10 | | 67 |
Department of Justice and Attorney-General
Justice and Attorney-General
| | | | | | | | | | |
| | | 2008-09
$’000 | | 2009-10
$’000 | | 2010-11
$’000 | | 2011-12
$’000 | | 2012-13
$’000 |
Office of the Director of Public Prosecutions | | 660 | | — | | — | | — | | — |
The Government funded the Office of the Director of Public Prosecutions for additional staff to address workload increases in response to the appointment of additional judges and increased demand for services. The expense component of this initiative can be located in Chapter 2 Expense Measures.
| | | | | | | | | | |
| | | 2008-09
$’000 | | 2009-10
$’000 | | 2010-11
$’000 | | 2011-12
$’000 | | 2012-13
$’000 |
Queensland Civil and Administrative Tribunal | | 34 | | 583 | | — | | — | | — |
The Government is providing funding to implement the new Queensland Civil and Administrative Tribunal (QCAT), which will commmence on 1 December 2009. QCAT will improve the delivery of justice services through the amalgamation of existing tribunals. The expense component of this initiative can be located in Chapter 2 Expense Measures.
| | | | |
68 | | Budget Measures 2009 10 | | |
| | | | | | | | | | |
| | | 2008-09
$’000 | | 2009-10
$’000 | | 2010-11
$’000 | | 2011-12
$’000 | | 2012-13
$’000 |
Victims Financial Assistance and Service Scheme | | — | | 110 | | — | | — | | — |
The Government will provide funding for implementation of information management systems for the Victims Financial Assistance and Service Scheme. The expense component of this initiative can be found in Chapter 2 Expense Measures.
| | | | |
| | | Budget Measures 2009 10 | | 69 |
Department of Police
| | | | | | | | | | |
| | | 2008-09
$’000 | | 2009-10
$’000 | | 2010-11
$’000 | | 2011-12
$’000 | | 2012-13
$’000 |
Digital Integrated Traffic Camera System | | 3,077 | | 21,750 | | — | | — | | — |
The Government is funding new technology to deliver a digital platform necessary for the upgraded fixed speed and red light camera programs. The expense component of this initiative can be found in Chapter 2 Expense Measures.
| | | | | | | | | | |
| | | 2008-09
$’000 | | 2009-10
$’000 | | 2010-11
$’000 | | 2011-12
$’000 | | 2012-13
$’000 |
Mount Isa Police Staff Accommodation | | — | | — | | 2,700 | | — | | — |
The Government is providing funding to construct housing for police employees in Mount Isa in 2010-11. This will assist in attracting and retaining staff in the area.
| | | | | | | | | | |
| | | 2008-09
$’000 | | 2009-10
$’000 | | 2010-11
$’000 | | 2011-12
$’000 | | 2012-13
$’000 |
Road Safety Enforcement Initiatives | | 4,233 | | 2,500 | | 225 | | — | | — |
The Government is funding a range of road safety initiatives including a staged roll-out of new fixed speed camera sites; micro Digi-Cam systems and additional handheld lasers and mobile radars to assist with speed management; additional motorcycles targeting road safety and traffic congestion management strategies; and additional Q-cars to target serial and high risk traffic offenders. Funding will also provide an additional 106 traffic police officers over two years starting in 2008-09. These initiatives are funded through an increase in traffic infringement penalties. The expense component of theses initiatives can be found in Chapter 2 Expense Measures.
| | | | |
70 | | Budget Measures 2009 10 | | |
| | | | | | | | | | |
| | | 2008-09
$’000 | | 2009-10
$’000 | | 2010-11
$’000 | | 2011-12
$’000 | | 2012-13
$’000 |
Telecommunications Interception-Interim Arrangements | | — | | 276 | | — | | — | | — |
The Government has committed funding to enable the Queensland Police Service to access an interim telephone interception capability while evaluating options for the most appropriate long term strategy. The expense component of this initiative can be found in Chapter 2 Expense Measures.
| | | | |
| | | Budget Measures 2009 10 | | 71 |
Department of the Premier and Cabinet
| | | | | | | | | | |
| | | 2008-09
$’000 | | 2009-10
$’000 | | 2010-11
$’000 | | 2011-12
$’000 | | 2012-13
$’000 |
National Carriage Factory | | — | | 2,250 | | — | | — | | — |
The Government is providing funding of $2.25 million to support the Queensland Museum in creating the National Carriage Factory, a heritage training centre at Toowoomba. Total project cost is estimated to be $7.3 million, with funding sourced from the Queensland Government, the Queensland Museum Board, sponsorships and donations.
| | | | |
72 | | Budget Measures 2009 10 | | |
Department of Transport and Main Roads
Main Roads
| | | | | | | | | | |
| | | 2008-09
$’000 | | 2009-10
$’000 | | 2010-11
$’000 | | 2011-12
$’000 | | 2012-13
$’000 |
Additional Noise Barriers | | — | | 2,000 | | 2,000 | | 2,000 | | — |
Additional funding of $6 million has been allocated over three years for the retrofitting of noise barriers in high-priority locations on roads that have had natural growth in traffic which has resulted in noise levels in excess of acceptable limits. Many of the roads included in this program were constructed prior to the requirement of having noise barriers installed. In 2009-10 noise barrier construction will commence on the Monash Road to Klump Road section of the Pacific Motorway and the first of the Nicklin Way sites.
| | | | | | | | | | |
| | | 2008-09
$’000 | | 2009-10
$’000 | | 2010-11
$’000 | | 2011-12
$’000 | | 2012-13
$’000 |
Heavy Vehicle Rest Areas | | 1,000 | | 4,000 | | — | | — | | — |
The Government is providing $5 million in 2008-09 and 2009-10 for heavy vehicle rest areas through revenues collected under the Camera Detected Offence Program. These new works will provide rest area facilities for the freight industry on a number of key state-controlled roads to complement existing facilities on these road links.
| | | | |
| | | Budget Measures 2009 10 | | 73 |
| | | | | | | | | | |
| | | 2008-09
$’000 | | 2009-10
$’000 | | 2010-11
$’000 | | 2011-12
$’000 | | 2012-13
$’000 |
Sustainable Resources Communities Funding-Road Safety Improvements | | 4,050 | | 12,150 | | 10,200 | | 3,000 | | 2,500 |
The Government will provide an additional $31.9 million over five years to continuing road safety improvements on the Peak Downs Highway, and the upgrade of Ardurad and the Cloncurry-Dajarra Roads to deliver safety and community benefits. Construction will commence in 2009-10 on overtaking lanes on the Capricorn Highway, flood mitigation improvements on the Flinders Highway, and paving on sections of the Gregory-Camooweal Road.
Transport
| | | | | | | | | | |
| | | 2008-09
$’000 | | 2009-10
$’000 | | 2010-11
$’000 | | 2011-12
$’000 | | 2012-13
$’000 |
Cairns Cruise Ship Terminal Redevelopment | | — | | 11,200 | | — | | — | | — |
The Government will provide funding of $11.2 million from the Queensland Future Growth Fund in 2009-10 to Cairns Ports Limited for the development of the cruise ship terminal. The funds will be used to redevelop the heritage listed Wharf Shed No. 3 and associated wharf and landside facilities as a cruise ship terminal.
| | | | | | | | | | |
| | | 2008-09
$’000 | | 2009-10
$’000 | | 2010-11
$’000 | | 2011-12
$’000 | | 2012-13
$’000 |
Ipswich to Springfield Rail Line: Early Works and Land Acquisition | | — | | 31,800 | | — | | — | | — |
The Government will provide funding of $31.8 million in 2009-10 for early works and land acquisition for the Ipswich to Springfield Public Transport Corridor. The project will provide for enhanced public transport services, encourage the provision of affordable housing and attract commercial development and employment to the western corridor.
| | | | |
74 | | Budget Measures 2009 10 | | |
| | | | | | | | | | |
| | | 2008-09
$’000 | | 2009-10
$’000 | | 2010-11
$’000 | | 2011-12
$’000 | | 2012-13
$’000 |
Mitchelton to Keperra to Ferny Grove: Track Duplication | | — | | 21,200 | | 41,573 | | — | | — |
The Government will provide $62.8 million over two years for the duplication of the Ferny Grove rail line between Keperra and Ferny Grove to accommodate the provision of additional rail services.
| | | | | | | | | | |
| | | 2008-09
$’000 | | 2009-10
$’000 | | 2010-11
$’000 | | 2011-12
$’000 | | 2012-13
$’000 |
Queensland Motorcycle Safety Strategy | | — | | 750 | | — | | — | | — |
The Government will provide funding of $0.75 million in 2009-10 to further improve the education and safety of the motorcycling public of Queensland. These funds will be used to introduce improved learner and provisional licence schemes and requirements for motorcycle riders. The expense component of this initiative can be found in Chapter 2 Expense Measures.
| | | | |
| | | Budget Measures 2009 10 | | 75 |
| | | | | | | | | | |
| | | 2008-09
$’000 | | 2009-10
$’000 | | 2010-11
$’000 | | 2011-12
$’000 | | 2012-13
$’000 |
Urban Congestion Initiatives | | 2,970 | | 9,730 | | 7,695 | | 5,625 | | — |
The Government will allocate funding of $26 million to activities to address increasing congestion levels. These funds will provide programs to alter travel behaviour, present travel options, promote strategies to spread peak hour demand, keep traffic on our roads flowing freely, provide end-of-trip facilities to promote walking and cycling and review freight efficiency. The measures include:
| | • | | $9.5 million to establish additional Park and Ride facilities in line with the South-East Queensland Park and Ride policy/strategy with key priorities including Burpengary, Dinmore, Strathpine, Ormiston and Western Corridor priorities in conjunction with the Ipswich Motorway upgrade; |
| | • | | $7 million for purchase of five articulated passenger buses, capable of accommodating up to 180 passengers for services on the South-East Busway; |
| | • | | $4.3 million for priority bus route measures including indented bays, to minimise disruption to traffic; and |
| | • | | $2.5 million to provide active transport and end of trip facilities supporting up to 900 cycle space parking with change/shower facilities. |
The operating component of this initiative can be found in Chapter 2 Expense Measures.
| | | | |
76 | | Budget Measures 2009 10 | | |
The following tables present the relevant portfolio revenue measures relating to decisions taken since the 2008-09 Budget. For further explanation, refer to Explanation of Scope and Terms in Chapter 1.
| | | | |
| | | Budget Measures 2009 10 | | 77 |
Department of Employment, Economic Development and Innovation
Tourism, Fair Trading and Office of Liquor, Gaming and Racing
| | | | | | | | | | |
| | | 2008-09
$’000 | | 2009-10
$’000 | | 2010-11
$’000 | | 2011-12
$’000 | | 2012-13
$’000 |
Increase Tax Rate on Casino Gaming Machines | | — | | 36,000 | | 38,000 | | 40,000 | | 42,000 |
As announced in the Major Economic Statement, the Government will reduce the disparity between tax rates applicable to gaming machines in casinos compared to those in large clubs and hotels by increasing the tax rate on casino gaming machine wins by 10% and removing some concessional rates on premium play from 1 July 2009.
| | | | |
78 | | Budget Measures 2009 10 | | |
Department of Health
| | | | | | | | | | |
| | | 2008-09
$’000 | | 2009-10
$’000 | | 2010-11
$’000 | | 2011-12
$’000 | | 2012-13
$’000 |
Annual review of selected fees and charges | | — | | 3,625 | | 7,540 | | 7,842 | | 8,155 |
Revenue initiatives identified include increases to enable Queensland Health to recover the cost of service provision to overseas visitors and third party insurance patients for accommodation and theatre fees; and outpatient services and emergency department consultations. There will be no effect on Medicare eligible public patients. Additionally the fees charged to private patients electing for a single room in a public hospital will increase. Figures represent total expected increase in revenue for these fees and charges, with an effective commencement date of 1 January 2010.
| | | | |
| | | Budget Measures 2009 10 | | 79 |
Department of Justice and Attorney-General
Justice and Attorney-General
| | | | | | | | | | |
| | | 2008-09
$’000 | | 2009-10
$’000 | | 2010-11
$’000 | | 2011-12
$’000 | | 2012-13
$’000 |
Penalty Unit Increase | | 20,227 | | 40,227 | | 40,247 | | 40,269 | | 40,269 |
The Government approved an increase to the penalty unit, from $75 to $ 100, commencing 1 January 2009. The penalty unit had not kept pace with the Consumer Price Index over time. The fee was set at $75 in 1999 and had not been increased since that time. The increase to the penalty unit enabled the allocation of additional resources to a range of priority initiatives aimed at improving road safety.
| | | | |
80 | | Budget Measures 2009 10 | | |
Department of Transport and Main Roads
Transport
| | | | | | | | | | |
| | | 2008-09
$’000 | | 2009-10
$’000 | | 2010-11
$’000 | | 2011-12
$’000 | | 2012-13
$’000 |
Motor Vehicle Registration Increase | | — | | 183,000 | | 190,320 | | 197,933 | | 205,850 |
The Government announced this policy on 10 December 2008 as part of the Major Economic Statement. The Government will increase motor vehicle registration fees, commencing 1 July 2009. These increases were detailed in the Major Economic Statement which in addition stated total motor vehicle registration costs from 1 July 2009 will incorporate the annual adjustment for Consumer Price Index and changes to Compulsory Third Party premiums bid by insurance companies. The revenue from the increase in motor vehicle registration fees will assist the Government to continue to deliver its roads program.
| | | | | | | | | | |
| | | 2008-09
$’000 | | 2009-10
$’000 | | 2010-11
$’000 | | 2011-12
$’000 | | 2012-13
$’000 |
Penalty Unit Increase | | 16,876 | | 33,752 | | 33,752 | | 33,752 | | 33,752 |
The Government, commencing 1 January 2009, increased the penalty unit amount from $75 to $100. The penalty unit for infringement notice penalties had not increased since 1999 (when the State Penalties Enforcement Act 1999 was enacted) and for other offences it had not increased since 1995. The penalty unit had not kept up with the Consumer Price Index over time, effectively reducing the level of punishment and deterrence of fines for various offences.
| | | | |
| | | Budget Measures 2009 10 | | 81 |
Treasury Department
| | | | | | | | | | |
| | | 2008-09
$’000 | | 2009-10
$’000 | | 2010-11
$’000 | | 2011-12
$’000 | | 2012-13
$’000 |
Delay in Abolition of Transfer Duty on Core Business Assets | | — | | 33,000 | | 112,000 | | 165,000 | | 183,000 |
In light of the significant fall in revenues facing the State, the Government will defer the abolition of transfer duty on core business assets until 1 July 2013.
| | | | | | | | | | | |
| | | 2008-09
$’000 | | 2009-10
$’000 | | | 2010-11
$’000 | | 2011-12
$’000 | | 2012-13
$’000 |
Introduction of Land Tax Instalment Payment | | — | | (8,000 | ) | | — | | — | | — |
The Government will introduce an instalment payment option for land tax liabilities in 2010-11, to spread the tax liability over a longer period, thereby reducing the impact on taxpayer cashflows. In 2009-10, as an interim measure, the Government will extend the period of payment for land tax assessments from 30 days to 90 days at an estimated cost of $8 million.
| | | | | | | | | | |
| | | 2008-09
$’000 | | 2009-10
$’000 | | 2010-11
$’000 | | 2011-12
$’000 | | 2012-13
$’000 |
Introduction of Land Tax Surcharge | | — | | 93,000 | | 109,000 | | 115,000 | | 122,000 |
As announced in the Major Economic Statement, the Government will introduce a land tax surcharge of 0.5% from 1 July 2009. It will apply where the aggregate value of all land (for land tax purposes) exceeds $5 million and only to the portion of the value exceeding $5 million.
| | | | |
82 | | Budget Measures 2009 10 | | |
| | | | | | | | | | | |
| | | 2008-09
$’000 | | 2009-10
$’000 | | | 2010-11
$’000 | | 2011-12
$’000 | | 2012-13
$’000 |
Payroll Tax Rebate for Apprentice and Trainee Wages | | — | | (15,000 | ) | | — | | — | | — |
The wages of apprentices and trainees are exempt from payroll tax. In addition to this employment incentive, the Government has decided to provide a 25% payroll tax rebate in 2009-10 on the wages of each apprentice and trainee employed. This rebate will be offset against the tax payable on the wages of other employees.
| | | | | | | | | | | | | | |
| | | 2008-09
$’000 | | 2009-10
$’000 | | | 2010-11
$’000 | | | 2011-12
$’000 | | | 2012-13
$’000 | |
Transfer Duty-First Home Owner Concession for Land Purchases | | — | | (5,700 | ) | | (6,464 | ) | | (7,162 | ) | | (7,935 | ) |
The exemption threshold for first home buyers purchasing vacant land will increase from $150,000 to $250,000 to more closely align the vacant land concession with the concession available for established homes. A partial concession will be provided for vacant land valued up to $400,000.
| | | | |
| | | Budget Measures 2009 10 | | 83 |
By authority: S. C. Albury, Acting Government Printer, Queensland 2009