EXHIBIT (c)(vi)
Document Entitled
State Budget 2010-11 – Mid Year Fiscal and Economic Review
State Budget 2010–11
Mid Year Fiscal and Economic Review
Queensland Government

Queensland
Government
STATE BUDGET
2010-11
MID YEAR FISCAL
AND ECONOMIC REVIEW
CONTEXT
The Mid Year Fiscal and Economic Review (MYFER) is required by the Australian Loan Council’s Uniform Presentation Framework.
The MYFER presents revised fiscal estimates for the current Budget year and the three following years for the General Government, Public Non-financial Corporations and Non-financial Public sectors. These revised estimates take into account developments since the preparation of the 2010-11 Budget.
The release of this year’s MYFER was delayed to incorporate a preliminary assessment of the economic and fiscal impacts of the December-January floods.
The December-January flood event has had a devastating effect on communities and will come with a significant human and economic cost. Estimating the impact in economic and financial terms is very difficult as the full extent of the damage has yet to emerge and agencies and local government efforts remain appropriately focussed on the immediate relief and response effort. Treasury expects further estimates of the cost of the damage to be incorporated in the June State Budget for 2011-12.
ECONOMIC OVERVIEW
While global economic and financial conditions have improved somewhat in the last 12 months, widespread flooding across Queensland has severely impacted the State’s export sector in particular, which has also been affected by a higher Australian Dollar exchange rate. Further, ongoing tight credit conditions and consumer caution are continuing to impact the nation and the state. As a result, economic conditions will be weaker in 2010-11 than initially anticipated. This has led to downward revisions in the majority of economic and fiscal forecasts.
Despite this, the medium term outlook for the economy remains strong, with business investment expected to recover in 2010-11 and accelerate further in 2011-12, driven by investment in the mining sector, including LNG developments. The rebuilding effort following the floods is also expected to boost economic activity in 2011-12.
FISCAL OVERVIEW
For the purposes of this publication, an estimate based on initial assessments from councils and agencies and the cost of previous disasters has been used to inform the costing of the current flood disaster. This estimate is $5 billion over the period 2010-11 to 2012-13.
This is a preliminary estimate for planning purposes and will be updated over time, including at the 2011-12 Budget, as more information comes to hand.
The floods have placed further pressure on an already challenging fiscal position. Nonetheless, Australia has an institutional framework for natural disasters that is very supportive of State and local governments and the Australian Government will meet a significant proportion of the cost of this disaster.
| | |
| | |
| Mid Year Fiscal and Economic Review 2010-11 | | 4 |
Queensland is forecasting net operating deficits across each year of the forward estimates. The operating deficits are expected to peak at $4 billion in 2011-12, before falling to $1.7 billion in 2013-14. The timing of the Australian Government’s Natural Disaster Relief and Recovery Arrangements (NDRRA) spending is having a significant impact on Queensland’s operating position across the forward estimates with the impact being an improved operating position in 2010-11 and operating deficits larger than would otherwise be expected in 2011-12 and 2012-13.
Lower than anticipated economic growth, combined with the appreciation of the Australian Dollar, is expected to see the recovery in revenue take longer than previously anticipated, with revenue growth across the forward estimates expected to average 2.2%. The slower revenue growth is also impacted by the $2 billion advance payment from the Australian Government for NDRRA reimbursement which will be received in 2010-11.
Over the period to 2013-14, own-purpose expenses growth is expected to average 4.15% per year, compared to projected average growth in inflation and population of 5.04%.
Despite the challenging operating environment, the State’s expected future stock of borrowings is now lower than expected in the 2010-11 Budget. The asset sales proceeds have been utilised to retire existing debt and have also provided the State with a significant liquidity buffer which has all but eliminated the need for the State to access the capital markets in 2010-11. The sale of the Abbot Point Coal Terminal during the first half of this calendar year will support the State’s disaster recovery efforts.
The flooding will necessitate a major review of the State’s spending priorities such as the delay in the Brisbane Cross River Rail project, which was due to commence construction in 2013 but will now be delayed at least two years. The outcome of this review will be incorporated in the 2011-12 State Budget. The review is essential in terms of restoring the State’s fiscal position, but is also important in the recovery context because of physical capacity constraints on Government and contractors. A major reprioritisation effort will therefore be essential to ensure the timely completion of restoration works.
A review of the State’s spending priorities to ensure adequate financial and physical resources are available for the recovery effort will be a major focus of the 2011-12 Budget.
POLICY MEASURES
The Government has committed to a range of measures (including revenue protection measures) delivering additional savings rising to around $400 million per annum by 2014-15.
| • | | increasing the existing public service efficiency target from almost $400 million in 2012-13 to $450 million in 2013-14 and $500 million in 2014-15 |
| • | | a proposed program of 3,500 voluntary separations from non-service delivery areas over the period 2011-12 to 2012-13, which is anticipated to deliver net savings to the Budget of around $175 million per annum in 2012-13 and ongoing. The terms and conditions of the offer will be developed over coming months by the Public Service Commission. Unions and affected employees will be consulted on this initiative |
| • | | returning $215 million in capital savings from lower costs of project delivery (comprising $150 million from the Department of Transport and Main Roads capital program and $65 million from other departments) and also giving rise to lower depreciation costs. This funding will be returned to the Consolidated Fund and will not result in the scaling back of projects. |
| | |
| | |
| Mid Year Fiscal and Economic Review 2010-11 | | 5 |
| • | | a rationalisation of programs in the Department of Employment, Economic Development and Innovation to deliver annual savings of $20 million from 2012-13. The Department currently operates some 110 programs and will conduct a review to identify areas of overlap and duplication |
Two revenue protection measures will be put in place:
| • | | aligning Queensland’s model for applying duty to the acquisition of land owned by a company to that which applies in most other jurisdictions. The harmonisation of the treatment, through the ‘landholder’ model, is expected to result in revenue of approximately $30 million per annum from 2011-12 from transactions presently falling outside the system |
| • | | as part of centralising revenue collection, the collection of royalties will in future be undertaken by the Office of State Revenue. Revenue will also change from quarterly to monthly collections, with implementation to be undertaken in consultation with the mining industry. |
| | |
| | |
| Mid Year Fiscal and Economic Review 2010-11 | | 6 |
ECONOMIC CONDITIONS AND OUTLOOK
Feature Box: Economic Impact of Queensland Floods
Flooding over December and January, combined with much wetter than usual weather conditions since September 2010, is estimated to have detracted 1 3/4 percentage points, or $4 billion in real terms, from gross state product (GSP) in Queensland in 2010-11. The table below compares forecasts in the MYFER with what forecasts would have been under normal weather conditions. In the absence of floods, economic growth in Queensland would have been predicted to improve to 3% in 2010-11, rather than ease to 1 1/4% as currently forecast.
The loss in economic growth of 1 3/4 percentage points in Queensland includes estimates of the direct impact of flooding on coal, rural and tourism exports, some delays to construction activity, as well as flow-on effects to employment, private spending, wages and prices. However, the impact of the floods remains difficult to quantify at this time, given uncertainty over the extent of damage caused and the timing and pace of the recovery.
However, the need to rebuild this infrastructure means that economic growth in Queensland is expected to be higher in 2011-12 than would have otherwise been the case. In particular, around 30,000 properties have been flood affected, requiring significant increases in dwelling construction activity. Some catch up in coal exports is also expected to occur from June quarter 2011, and continue through 2011-12, given expansions to system capacity made in recent years. As a result, economic growth in 2011-12 is now forecast to be 5%, compared with 4 1/4% in the absence of floods.
Further, with the State and national economy already characterised by tight labour markets and high levels of capacity utilisation, part of the rebuilding effort will have to occur at the expense of other investment. In the public sector’s case, this may necessitate a reprioritising of capital projects, while for the private sector, labour shortages may limit the scale to which investment can fully bounce back by next year. However, the dwelling sector represents one key area where spare capacity exists, after being weighed down for several years due to tighter credit conditions and higher interest rates.
Impact of floods on MYFER economic forecasts1
(annual percentage change)
| | | | | | | | | | | | | | | | |
| | | 2010-11 | | | 2011-12 | |
| | | MYFER
forecast | | | Excluding
floods | | | MYFER
forecast | | | Excluding
floods | |
Gross state product2 | | | 1 1/4 | | | | 3 | | | | 5 | | | | 4 1/4 | |
Employment | | | 2 3/4 | | | | 2 3/4 | | | | 3 1/4 | | | | 3 | |
Unemployment rate | | | 5 3/4 | | | | 5 3/4 | | | | 5 1/4 | | | | 5 1/2 | |
Inflation | | | 3 1/4 | | | | 3 | | | | 3 | | | | 3 | |
Wage Price Index | | | 3 1/2 | | | | 3 1/2 | | | | 4 | | | | 3 3/4 | |
Population | | | 2 | | | | 2 | | | | 2 | | | | 2 | |
Notes:
| 1. | All numbers are in year-average terms unless stated otherwise. |
| 2. | CVM, 2007-08 reference year. |
Source: Queensland Treasury.
Employment
While the floods are expected to reduce employment in the agricultural sector and in severely affected businesses, increased employment driven by the recovery effort is expected to drive year-average employment growth of 3 1/4% by 2011-12, compared with a forecast of 3% in the absence of floods. As a result, the unemployment rate is forecast to fall to 5 1/4% in that year, compared with 5 1/2% in the absence of the rebuilding effort.
| | |
| | |
| Mid Year Fiscal and Economic Review 2010-11 | | 7 |
Prices and wages
The floods are also expected to see year-average growth in Brisbane’s Consumer Price Index (CPI) reach 3 1/4% in 2010-11, compared with 3% in the absence of floods, with higher meat, fruit and vegetable prices expected to add around a 1/4 of a percentage point to inflation. While these price increases are expected to unwind as supply normalises, stronger growth in the price of household contents and services are expected to offset this, leaving inflation at 3% in 2011-12. A tighter labour market due to the recovery effort, along with slightly higher inflation, is expected to put some upward pressure on wages. As a result, year-average growth in the Wage Price Index is forecast to be 4% in 2011-12, compared with 3 3/4% in the absence of floods.
Coal sector
Heavy rains have disrupted production for many coal companies, with many open-cut mines reporting varying degrees of pit flooding. In January 2011, the Queensland Resources Council estimated that only 15% of Queensland’s coalmines were operating at full capacity, with the remaining 85% either operating under restrictions or closed. Flooding has also damaged coal railing infrastructure and it is not expected to regain full capacity for some time. Approximately 15 million tonnes in export tonnages will either be delayed or lost in 2010-11, amounting to around $2.5 billion in nominal terms at recent coal prices.
However, expansions to rail and port infrastructure over recent years suggest that the coal system has the capacity to support a strong recovery in export tonnages next year. Furthermore, ongoing strong demand from traditional coal importing countries in Asia, combined with supply disruptions in other key coal exporting countries, means that flooding in Queensland is likely to contribute to a surge in coal contract prices from June quarter 2011, supporting export incomes. This is likely to unwind as supply normalises.
Rural sector
The heavy rain and floods have severely impacted Queensland’s rural sector, with the combined impact of abnormal weather conditions estimated to be above $1 billion in 2010-11. Torrential rain prior to Christmas has left a sizable portion of the sugar cane crop unharvested, as well as lowering yields, resulting in an estimated 20% reduction in raw sugar production in 2010-11. There are reports indicating that flooding in Southern Queensland is likely to have destroyed almost half of the cotton crops, while yields from remaining crops may also have been affected. Although the majority of winter crops (mainly wheat) had been harvested before the floods, heavy rainfalls have adversely affected the quality of the crops, while any unharvested crops may have been destroyed. Meanwhile, heavy rain has adversely affected the amount of sorghum planted, while a substantial portion of the existing plantation is expected to have been heavily damaged by floods in the Southern Queensland region.
While the extent of livestock losses due to floods is not believed to be exceptional at this point in time, feedlots and cattle processing have been affected by flood waters and road closures. However, with beef prices much higher and strong demand, cattle slaughtering is likely to increase significantly later in the year when cattle movement is restored. Consequently, the impact of the floods on meat production is not expected to be as large as for crops. Despite a large portion of horticultural crops being already harvested before the floods, there will still be a sizable loss to production especially due to flooding in the Lockyer Valley.
Tourism
While the flooded regions in Central and Southern Queensland constitute around 10% of tourism exports, the severity of the floods is likely to impact arrivals in these regions in the second half of 2010-11, due to negative publicity stemming from the worldwide reporting of Queensland’s floods. Widespread rainfall across Queensland since September 2010 has dampened tourist demand for popular destinations such as the Gold Coast, Sunshine Coast, Cairns and Whitsundays. Travel between Brisbane and these destinations may have been hampered by disruptions to transportation from the floods. Interstate and overseas tourism exports totalled almost $8 billion in 2009-10, with losses likely to amount to more than $300 million this financial year.
| | |
| | |
| Mid Year Fiscal and Economic Review 2010-11 | | 8 |
External Conditions
Queensland’s major trading partners are now estimated to have grown by 5 1/2% in 2010, compared with 4 1/4% assumed at Budget. This is largely due to a faster than anticipated recovery from the global financial crisis in Asia (see Table 1), with economies in this region benefitting from a stronger than expected turnaround in global industrial production and trade. Major trading partners are forecast to grow 3 3/4% in 2011, similar to that at Budget time. However, several factors continue to weigh on the outlook for advanced economies, including the impact of an elevated Yen in Japan, fiscal consolidation in Europe, and prolonged weakness in the US housing and labour markets.
Table 1
Queensland major trading partner GDP outlook
(annual % change)
| | | | | | | | | | | | | | | | | | | | |
| | | 2009 | | | 2010 | | | 2011 | |
| | | Actual | | | Budget | | | MYFER | | | Budget | | | MYFER | |
| | | | | |
Major trading partners1 | | | -1.4 | | | | 4 1/4 | | | | 5 1/2 | | | | 3 3/4 | | | | 3 3/4 | |
Non-Japan Asia2 | | | 2.7 | | | | 6 3/4 | | | | 7 3/4 | | | | 6 | | | | 6 | |
China | | | 9.1 | | | | 10 1/4 | | | | 10 | | | | 9 1/4 | | | | 9 1/4 | |
India | | | 7.4 | | | | 8 1/4 | | | | 8 3/4 | | | | 8 1/4 | | | | 8 1/4 | |
Japan | | | -6.3 | | | | 2 1/2 | | | | 4 1/4 | | | | 1 3/4 | | | | 1 1/4 | |
Europe3 | | | -4.1 | | | | 1 1/4 | | | | 1 3/4 | | | | 1 3/4 | | | | 1 1/2 | |
United States | | | -2.6 | | | | 3 1/4 | | | | 3 | | | | 3 | | | | 3 1/4 | |
| 3. | Includes United Kingdom. |
Sources: Consensus Economics and Queensland Treasury.
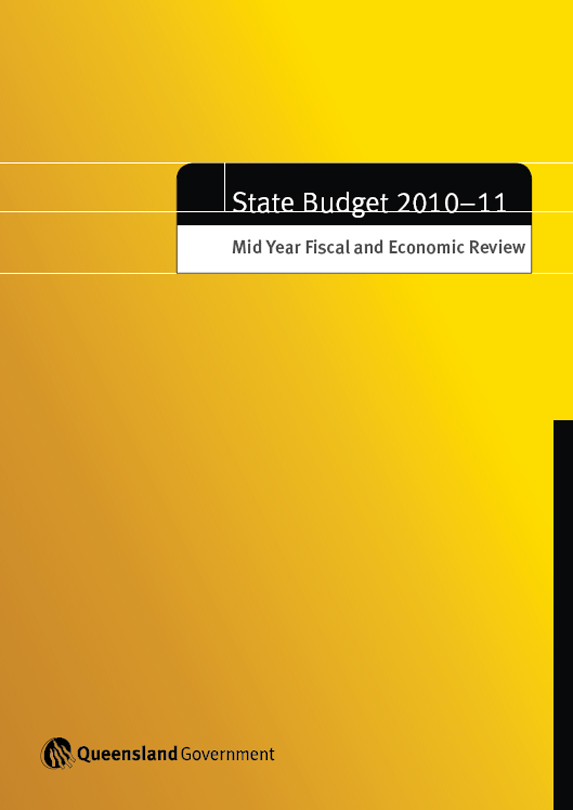
Economic growth in China and India is forecast to remain strong, at 9 1/4% and 8 1/4% respectively, in 2011, notwithstanding recent tightening measures put in place by authorities to ease inflationary pressure. A strong growth outlook in emerging Asia has in turn supported ongoing high prices for the State’s major commodity exports so far in 2010-11 (Figure 1a). Looking ahead, coal prices are likely to be significantly boosted in the short term by domestic supply constraints due to flooding across Queensland.
The resilience of the Asian region has heightened Reserve Bank of Australia (RBA) concerns over the inflationary impact of another mining boom on the Australian economy. This has led to tighter monetary policy. While markets at Budget time expected only one 25 basis point rise in the cash rate to 4.75% by late 2011, the RBA raised the cash rate to this level in November 2010. Further, most commercial banks raised lending rates by more than the latest cash rate rise, citing increased funding costs since the financial crisis. As a result, higher lending rates are now expected over the next two years.
The above trends have contributed to the most significant change in external conditions since Budget, with the A$ appreciating by around 17% since June, to reach parity with the US$ in mid October. The rise has been broad-based, with the A$ in trade weighted terms rising around 10% over this period (Figure 1b). The initial appreciation in the A$ was largely driven by widening differences in monetary settings, with the US Federal Reserve undertaking quantitative easing and the Bank of Japan and the European Central Bank re-affirming their commitment to maintain official rates at very low levels. More recently, the currency has been supported by commodity price strength.
| | |
| | |
| Mid Year Fiscal and Economic Review 2010-11 | | 9 |
Sources: ABARE, Reuters and DataStream.
Domestic Economic Outlook
Economic growth in Queensland improved to 2.3% in 2009-10, following 1.1% growth in 2008-09. This largely reflected stronger growth in coal exports to emerging Asia, as well as public sector stimulus. Reflecting the legacy of the financial crisis, private domestic demand contracted during the year. Ongoing tight credit conditions and below average business confidence caused business investment to fall, after tripling over the previous eight years. These factors, combined with the cessation of the First Home Owners Boost and higher lending rates, also caused dwelling investment to fall during the year. As a result, economic growth in Queensland was similar to the Australian average for the second successive year in 2009-10.
While the Queensland economy was forecast at Budget time to strengthen into 2010-11, the impact of widespread flooding in regional Queensland, Ipswich and Brisbane is now expected to see economic growth slow to 1 1/4% in 2010-11 (see Table 2). The impact of the floods and well above average rainfall since September 2010 is expected to have detracted 1 3/4 percentage points from Queensland’s economic growth in 2010-11. The Feature Box on Economic Impact of Queensland Floods discusses the impact on the economy in more detail, including the impact on the coal and agricultural industries in particular.
Abstracting from the loss in output due to floods and general wet weather, economic growth in Queensland would have been expected to strengthen to 3% in 2010-11, rather than slow to 1 1/4% as currently forecast. This represents growth below the 3 3/4% original Budget forecast. This largely reflects additional changes to the external and domestic environment which have weighed on the outlook. In particular, the higher than expected A$ has adversely affected exports of non-commodity goods, tourism and education exports. Ongoing restrictive credit conditions and tighter monetary policy relative to those expected at Budget time have delayed the recovery in dwelling investment, while financing difficulties and excess supply have also weakened the outlook for commercial property. Weaker housing activity is also expected to flow through to slower growth in consumption. As a result, the recovery in private sector demand is now expected to be weaker than originally anticipated.
While some of these factors will continue to weigh on activity into 2011-12, the rebuilding effort associated with the floods, along with an anticipated solid recovery in coal exports, is forecast to drive economic growth of 5% in 2011-12, above the 4 1/2% originally forecast at Budget time. The approval of major LNG projects has also boosted the investment outlook for 2011-12, as well as the medium-term outlook for State economic growth.
| | |
| | |
| Mid Year Fiscal and Economic Review 2010-11 | | 10 |
Table 2
Economic forecasts1,2
(annual % change)
| | | | | | | | | | | | | | | | | | | | |
| | | 2009-10 | | | 2010-11 | | | 2011-12 | |
| | | Outcomes | | | Budget | | | MYFER/
MYEFO | | | Budget | | | MYFER/
MYEFO | |
Queensland | | | | | | | | | | | | | | | | | | | | |
Gross state product3 | | | 2.3 | | | | 3 3/4 | | | | 1 1/4 | | | | 4 1/2 | | | | 5 | |
Employment | | | 0.9 | | | | 2 3/4 | | | | 2 3/4 | | | | 3 1/4 | | | | 3 1/4 | |
Unemployment rate4 | | | 5.7 | | | | 5 1/2 | | | | 5 3/4 | | | | 5 1/4 | | | | 5 1/4 | |
Inflation | | | 2.7 | | | | 3 | | | | 3 1/4 | | | | 3 | | | | 3 | |
Wage Price Index | | | 3.3 | | | | 3 1/2 | | | | 3 1/2 | | | | 3 3/4 | | | | 4 | |
Population | | | 2.3 | | | | 2 1/4 | | | | 2 | | | | 2 1/4 | | | | 2 | |
Australia | | | | | | | | | | | | | | | | | | | | |
Gross domestic product3 | | | 2.2 | | | | 3 1/4 | | | | 3 1/4 | | | | 4 | | | | 3 3/4 | |
Employment5 | | | 2.4 | | | | 2 1/4 | | | | 2 1/2 | | | | 2 | | | | 2 | |
Unemployment rate4 | | | 5.2 | | | | 5 | | | | 4 3/4 | | | | 4 3/4 | | | | 4 1/2 | |
Inflation5 | | | 3.1 | | | | 2 1/2 | | | | 2 3/4 | | | | 2 1/2 | | | | 3 | |
Wage Price Index5 | | | 3.0 | | | | 3 3/4 | | | | 3 3/4 | | | | 4 | | | | 4 | |
Population6 | | | 2.0 | | | | 1 3/4 | | | | 1 3/4 | | | | 1 1/2 | | | | 1 1/2 | |
Notes:
| 1. | Economic forecasts for Queensland and Australia are not directly comparable, reflecting in particular the different timing of when forecasts were finalised and differences in external assumptions used to produce forecasts. |
| 2. | All numbers are in year-average terms unless stated otherwise. |
| 3. | CVM, 2007-08 reference year for Queensland; 2008-09 reference year for Australia. |
| 4. | Year-average for Queensland; seasonally adjusted estimate for the June quarter for Australia. |
| 5. | Through-the-year growth to the June quarter. WPI is seasonally adjusted. |
| 6. | Australian estimates are through-the-year to 31 December. |
Sources: Queensland Treasury and Australian Government 2010-11 MYEFO.
Dwelling investment
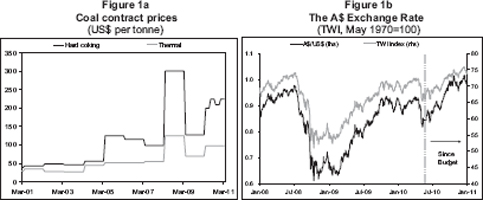
The short term dwelling investment outlook has softened since Budget, when investment was forecast to rise 6 3/4% in 2010-11. Higher mortgage rates since late 2009 and the cessation of the FHOB have had a sharper than expected impact on demand, with the trend number of private house approvals in late 2010 falling back to a level broadly in line with that in early 2009 (Figure 2a). This, combined with tighter monetary policy relative to Budget and a moderation in population growth, is now expected to see house construction fall in 2010-11.
Source: ABS 8731.0.
| | |
| | |
| Mid Year Fiscal and Economic Review 2010-11 | | 11 |
While some improvement in credit conditions was assumed at Budget time, business surveys suggest access to finance will remain a constraint on property development into 2011 in Queensland. A weaker outlook for medium-to-high density construction has also been exacerbated by oversupply in some regions, with approvals for medium-to-high density dwellings on the Gold Coast for the first eleven months of 2010 only one third of their level reached in the same period in 2007 (Figure 2b). Wetter than usual weather conditions have also caused delays in dwelling construction activity in the first three quarters of the financial year.
A faster than expected easing in resident population growth has also weighed on the dwelling investment outlook. With net overseas and interstate migration anticipated to be lower than initially thought, resident population growth is now assumed to be 2% in 2010-11 and 2011-12, compared with 2 1/4% per year at Budget time (see Table 2).
However, the recovery in dwelling investment in 2011-12 is expected to be sharper than anticipated at Budget time, reflecting the continued rebuilding task associated with flooded properties. Underlying demand from stronger growth in incomes and assuming improvement in credit conditions should also support dwelling investment going forward.
Household consumption
A slower than originally expected recovery in the housing sector in 2010-11 is anticipated to result in weaker growth in consumption relative to the 3 1/2% and 4% forecast for 2010-11 and 2011-12 at Budget time. While the need to replace household contents following the floods is likely to see strong growth in some areas of consumer spending in the second half of 2010-11, this is likely to occur at the expense of spending in other areas or reduced household savings for those uninsured. Further, a slower recovery in dwelling construction in the first half of 2010-11 prior to the floods had already dampened spending on household goods and services. The outlook for housing wealth has also softened, affecting households’ ability and willingness to draw on increased equity to finance spending. Recent surveys suggest an easing in expectations for house price growth over the next year. Higher than expected mortgage rates have also dampened the outlook for growth in disposable incomes.
Nevertheless, growth in consumer spending is still expected to gradually improve over the next two years, reflecting some strengthening in employment and wages growth, as well as the income boost from a strong terms of trade.
Business investment
The recovery in business investment in 2010-11 is now expected to be slightly below the 9 1/2% forecast in the State Budget. Non-residential construction is now expected to fall, with approvals for commercial property trending well below previous peaks, credit remaining tight and a weaker outlook for consumer demand since Budget. Engineering construction should partly offset this, surging to a new historic high in the September quarter 2010 (Figure 3). Furthermore, a high A$ should encourage some bring-forward of machinery and equipment investment in 2010-11, as businesses take advantage of cheaper imported capital goods.
| | |
| | |
| Mid Year Fiscal and Economic Review 2010-11 | | 12 |

Sources: ABS 5206.0.
Growth in business investment is expected to gather momentum into 2011-12 and is likely to be stronger than the 17 3/4% forecast at Budget time. Final investment decisions for both the BG Group’s and Santos’s Curtis Island LNG projects suggests that activity related to this sector will be stronger than initially anticipated in 2011-12, despite some expected delays in 2010-11 as a result of the floods. These projects are likely to have flow-on effects to other industries and result in more broad-based growth in business investment in 2011-12.
Exports
Queensland’s export sector has been heavily affected by flooding and wetter than usual weather conditions. Total exports are now expected to fall in 2010-11, compared with a rise forecast at Budget time. Flooding has seen most mines operate below capacity and caused damage across the State’s coal railing infrastructure. Approximately 15 million tonnes in coal export tonnages is expected to be delayed or lost in 2010-11. Furthermore, wet weather and flooding has also damaged sugar, cotton and other crops, and also deterred tourists from interstate and overseas (see Feature Box on Economic Impact of Queensland Floods).
The high A$ is also expected to hinder overseas tourism exports and, combined with tighter student visa application standards, weigh on education exports. Low international airfares and the high A$ may also encourage prospective interstate tourists to instead opt for overseas travel, adversely affecting interstate tourism. The exchange rate appreciation will also act to dampen exports of non-commodity goods, such as manufactures, that are priced in A$ terms.
Labour market
Despite the impact of the floods and a weaker than expected recovery in private sector demand in 2010-11, year-average employment is still forecast to grow by 2 3/4% this year, in line with that anticipated at Budget time (see Table 2). However, this largely reflects stronger than expected job creation in the first half of 2010-11, where job gains in the rural, mineral and government sectors helped drive 3.1% annual employment growth. Employment growth is expected to weaken in the second half of 2010-11, partly reflecting the temporary disruption to business activity due to the floods, but then accelerate through 2011-12 as the rebuilding effort gathers pace. On balance, year average employment in 2011-12 is forecast to be 3 1/4%, similar to the forecast at Budget time.
| | |
| | |
| Mid Year Fiscal and Economic Review 2010-11 | | 13 |
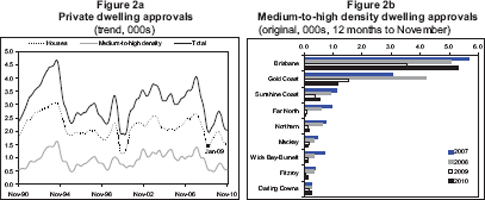
However, the labour force participation rate has risen faster than expected since Budget time, reaching a record high in December 2010. As a result, the unemployment rate is now forecast to average 5 3/4% in 2010-11, compared with the 5 1/2% originally forecast. An acceleration in employment growth in 2011-12 is forecast to bring the unemployment rate down to a year-average rate of 5 1/4%, in line with that forecast at Budget time. This would represent an unemployment rate well below the historic average (Figure 4).
Growth in the Wage Price Index is forecast to reach 4% in 2011-12, slightly higher than the 3 3/4% forecast at Budget time. Wages growth is anticipated to be supported by the well below average unemployment rate as well as higher than originally anticipated inflation in 2010-11 due to floods. Specifically, upward pressure on food prices is expected to result in inflation of 3 1/4% in 2010-11, compared with 3% originally anticipated.
| 1. | 2010-11 is an estimated actual and 2011-12 is a forecast. |
Sources: ABS 6202.0 and Queensland Treasury.
Risks and Opportunities
While the current economic forecasts have attempted to incorporate the impacts of floods, the extent of the damage to many facets of the economy is uncertain at this point in time. Equally uncertain is the timing and the pace at which damaged properties and infrastructure will be rebuilt. As a result, the economic outcomes may vary from the current forecasts. Importantly, the strong La Niña weather pattern is expected to continue into the March quarter 2011, leading to an increased risk of more rainfall and tropical cyclones. This could further disrupt economic activity and delay the rebuilding of damaged infrastructure.
The exact scope and timing of construction activity related to the LNG sector will affect the overall economic outlook. A faster ramp up in construction may result in stronger investment and economic growth than currently assumed, whereas any construction delays would have the opposite effect. Nevertheless, the recent approval of two major LNG projects should boost the medium term economic growth prospects for the State relative to Budget time.
| | |
| | |
| Mid Year Fiscal and Economic Review 2010-11 | | 14 |
However, several key risks to the outlook remain. With Asian and Latin American economies recovering at a much faster pace than the US and Western Europe, there has been a widening discord in monetary policy settings and exchange rate alignment among G20 countries. An escalation in trade frictions and the likelihood of competitive devaluations may undermine the global recovery. The re-emergence of sovereign debt concerns in Ireland and other European countries poses a risk to financial markets and the global recovery.
There also remain key uncertainties specific to China. A realignment of the Renminbi exchange rate could have a particularly adverse effect on China’s growth. Further, if recent attempts to curb inflation prove ineffective, a more substantial slowing in economic growth may need to occur to anchor inflation expectations. Finally, while a partial unwinding of Chinese coal imports from Queensland is assumed, China has begun to diversify its import sources to countries such as Indonesia and Mongolia. Any acceleration in this trend may lead to a larger fall in coal exports to China than currently assumed.
In Australia, the higher terms of trade and quantitative easing in the US has placed upward pressure on the A$. If the level of the A$ moves higher than currently assumed, this could exacerbate the fall in export earnings for a large portion of the State’s exports traded in US$ terms and also further deter overseas students and tourists. However, if advanced economies recover faster than expected and begin to normalise monetary policy, the A$ may average lower than currently anticipated.
| | |
| | |
| Mid Year Fiscal and Economic Review 2010-11 | | 15 |
FISCAL OUTLOOK
Feature Box: Fiscal Impact of Queensland Floods
The MYFER incorporates a preliminary estimate of the financial impact of the floods. Given the full extent of the damage is yet to be fully quantified, this estimate has been determined based on the cost of previous disasters, taking into account the larger geographic spread of the disaster and the more urbanised nature of towns and cities impacted by this disaster. As a result, there are a number of caveats to these estimates:
| • | | The focus of agency staff appropriately remains on immediate response and recovery efforts. |
| • | | Given the scale of the floods, in terms of severity and area affected, past experience indicates it will take up to 12 months before firm estimates of the cost are completed. |
The flooding is an historically significant event for the State and will require a major and sustained relief and restoration effort. However, Australia has an institutional framework for natural disasters that is supportive of State and local governments.
EXPENDITURE
Natural Disaster Relief and Recovery Arrangements (NDRRA)
The prime mechanism through which relief and restoration will be delivered is the Commonwealth-State NDRRA assistance.
The NDRRA includes a range of pre-agreed relief measures and a cost sharing formula that varies in accordance with the severity of the event. With the severity of this flooding event, Queensland will be eligible for reimbursement from the Australian Government for up to 75 percent of the cost of those measures.
The most significant expenditure measure, in terms of cost, is the Restoration of Essential Public Assets. The bulk of this expenditure will be for State and local government roads.
Many of the areas affected by the recent flooding were also affected by the monsoonal flooding and tropical cyclone events that took place in January to April of 2010. Much of this program of restoration work is still taking place with many councils in particular facing repairs to roads previously damaged in other natural disasters. Under NDRRA conventions, where multiple disasters have affected a particular area or asset, the cost is attributed to the most recent disaster event.
Other NDRRA measures include the Disaster Relief Assistance Scheme (emergency and recovery assistance to individuals); Counter-Disaster Operations; and Concessional Loans and Grants to Primary Producers and Small Businesses.
The MYFER includes estimated NDRRA expenditure for these floods of $5 billion over three years, in addition to an amount of $2 billion relating to previous natural disasters that is also incorporated into the estimates. Total NDRRA expenditure is estimated to be $1.6 billion in 2010-11, $2.7 billion in 2011-12 and $2.7 billion in 2012-13.
The reimbursement arrangements with the Australian Government under the NDRRA cost sharing formula have been finalised. The Australian Government has agreed to an advance payment of $2 billion, with progressive reimbursement for the remaining NDRRA expenses.
The timing of the Australian Government’s NDRRA spending is having a significant impact on Queensland’s operating position across the forward estimates since payments are to be made faster than has been the case historically. In particular, the Commonwealth’s advance payment of $2 billion in 2010-11 improves the operating balance in 2010-11, but as restoration work is carried out in 2011-12 and 2012-13, the operating deficits in these years are larger than would otherwise be expected.
The Queensland Government will make similar arrangements for local government with an initial advance of $400 million and progressive reimbursement for remaining NDRRA expenses.
| | |
| | |
| Mid Year Fiscal and Economic Review 2010-11 | | 16 |
Non-NDRRA Eligible Expenditure and Other Measures
Agencies may have incurred expenditure that does not fit within the categories of NDRRA eligible relief measures for which they will seek additional funding. This expenditure, which includes activities such as fodder purchase and dropping and animal welfare, has not been quantified.
The Government has launched a state wide independent Commission of Inquiry to examine Queensland’s flood disaster. The cost of this Inquiry, budgeted at $15 million, has been factored into the MYFER estimates, as has the Government’s donation to the Premier’s Disaster Relief Appeal.
The Government has set aside funding for the Flood Recovery Taskforce and a Queensland Reconstruction Authority which will scope and coordinate the state wide rebuilding program. The $2 billion advance NDRRA revenue payment from the Australian Government will be directed to the Queensland Reconstruction Authority as will the proceeds from the sale of the Abbot Point Coal Terminal once it is finalised.
The Government has also implemented new programs to assist in the recovery and rebuilding effort including additional funding for Tourism Queensland for a new marketing program, increases to the Jobs Assist program to help firms in trouble and a reallocation of sports grants to assist flood affected sporting groups to rebuild.
REVENUE
A large part of the State’s revenue comes from the Australian Government and will not be directly impacted. However, the extent of the impact of flooding on the national economy is likely to have some impact on future GST receipts.
The most significant and direct revenue impact for the State will be a reduction in mining royalties due to lost production associated with mine flooding and other flood related impacts on the supply chain.
While there has been an increase in coal prices in response to the floods, this will not have an immediate offsetting impact, with agreed contract prices already in place for the March quarter 2011.
The mining industry is at a varied state of recovery, and the MYFER incorporates a loss of production volumes as a result of the floods in the order of 15 million tonnes. The reduction in royalty revenue associated with this loss of production is estimated at around $200 million in 2010-11.
It is also expected that the State’s other key revenue sources of payroll tax and transfer duties will be impacted by the floods as a consequence of a reduction in overtime payments and reduced casual work hours for some parts of the community and an initial slowing of activity in the property market. These impacts have been estimated at around $35 million in 2010-11 for payroll tax.
THE CAPITAL PROGRAM
The State’s capital program was originally budgeted at $17.1 billion in 2010-11, but is now expected to be around $15.1 billion.
The flooding will necessitate additional expenditure on the restoration of core public assets during the remainder of 2010-11, including by the Government Owned Corporations on the State’s passenger and non-coal freight rail network. However, the flooding and wet weather generally will lead to delays and therefore underspends in the State capital program this year. Further, given capacity constraints, some of the State capital works effort may need to be redirected to repair and recovery projects, which are not generally considered to be capital works, in order to get emergency and high priority works completed.
| | |
| | |
| Mid Year Fiscal and Economic Review 2010-11 | | 17 |
GENERAL GOVERNMENT SECTOR
Table 3
Key financial aggregates
| | | | | | | | | | | | | | | | | | | | | | | | |
| | | 2009-10
Actual
$ million | | | 2010-11
Budget
$ million | | | 2010-11
Revised
$ million | | | 2011-12
Projection
$ million | | | 2012-13
Projection
$ million | | | 2013-14
Projection
$ million | |
Revenue | | | 39,729 | | | | 40,606 | | | | 41,829 | | | | 41,796 | | | | 43,731 | | | | 44,633 | |
Expenses | | | 39,785 | | | | 42,352 | | | | 43,297 | | | | 45,755 | | | | 47,287 | | | | 46,311 | |
Net operating balance | | | (56 | ) | | | (1,745 | ) | | | (1,468 | ) | | | (3,959 | ) | | | (3,556 | ) | | | (1,677 | ) |
Cash surplus/(deficit) | | | (5,305 | ) | | | (6,396 | ) | | | (5,660 | ) | | | (7,406 | ) | | | (5,665 | ) | | | (2,656 | ) |
Capital purchases | | | 8,767 | | | | 8,335 | | | | 7,883 | | | | 7,328 | | | | 5,930 | | | | 4,763 | |
Net borrowing | | | 5,182 | | | | 7,629 | | | | 81 | | | | 8,928 | | | | 6,947 | | | | 3,898 | |
Gross borrowing | | | 15,916 | | | | 23,250 | | | | 20,497 | | | | 29,521 | | | | 36,487 | | | | 40,403 | |
Net worth | | | 175,655 | | | | 188,564 | | | | 176,697 | | | | 175,664 | | | | 175,206 | | | | 177,020 | |
Net debt | | | (13,342 | ) | | | (6,743 | ) | | | (9,790 | ) | | | (1,576 | ) | | | 4,614 | | | | 7,502 | |
Operating balance
The operating balance expected for 2010-11 is a deficit of $1.468 billion compared to a forecast deficit of $1.745 billion at the time of the 2010-11 Budget. The $277 million improvement in the net operating balance since the Budget primarily reflects:
| • | | the accelerated claims process for NDRRA expenditure, including an advance payment of $2 billion from the Australian Government, resulting in additional Commonwealth grants revenue, partially offset by the advance payment to local councils |
| • | | a $286 million downward revision to royalty revenue estimates, primarily due to lost coal production from the flood events and also from the appreciation of the A$-US$ exchange rate, partially offset by stronger coal prices expected in the final quarter of 2010-11 |
| • | | downward revisions to GST revenue of $194 million |
| • | | a $426 million reduction in taxation revenue forecasts, primarily associated with lower than anticipated levels of activity in the property market and the expected impact of the floods on transfer duty and payroll tax collections |
| • | | additional expenditure decisions of $187 million since Budget, for a number of initiatives. |
The downward revisions to revenue associated with the exchange rate and lower estimates of GST also flow through to the remainder of the forward estimates years.
The net impact on the 2010-11 operating balance of NDRRA expenditure and revenue is driven by the advance payment from the Australian Government of $2 billion and an existing expense provision in the 2010-11 Budget for disaster recovery, in the order of $700 million, for works that have subsequently been affected by the most recent flood events.
| | |
| | |
| Mid Year Fiscal and Economic Review 2010-11 | | 18 |
Table 4 provides a reconciliation of the current net operating balance for 2010-11 to the 2010-11 Budget estimate.
Table 4
Reconciliation of 2010-11 Budget and MYFER net operating balances1
| | | | |
| | | 2010-11 | |
| | | $ million | |
2010-11 Budget net operating balance | | | (1,745 | ) |
| |
Expenditure policy decisions2 | | | (187 | ) |
Taxation revisions3 | | | (426 | ) |
Royalty and land rent revisions4 | | | (286 | ) |
GST revisions5 | | | (194 | ) |
Disaster related expense6 | | | (945 | ) |
Realignment of NDRRA revenue7 | | | 2,198 | |
Other parameter adjustments8 | | | 117 | |
| |
Mid Year Fiscal and Economic Review net operating balance | | | (1,468 | ) |
Notes:
| 1. | Denotes impact on net operating balance. Numbers may not add due to rounding. |
| 2. | Reflects expenditure policy decisions taken since the 2010-11 Budget, |
| 3. | Reflects changes in taxation estimates across a range of state taxes as outlined in the section on Revenue. Also includes the impact of the floods on transfer duty and payroll tax. |
| 4. | Reflects changes in royalty and land rent estimates, largely due to production delays due to the recent flood and the appreciation of the A$-US$ exchange rate, partially offset by expectations of higher prices in the final quarter of 2010-11. |
| 5. | As advised by the Australian Government in the 2010-11 Mid Year Economic and Fiscal Outlook. |
| 6. | Reflects the expected increase in disaster expenditure since the 2010-11 Budget and includes the cost of the Queensland Reconstruction Authority, Flood Inquiry, Government’s donation to the Premier’s Flood Relief Appeal and flood recovery programs. |
| 7. | Revenue from the Commonwealth’s share of NDRRA costs including for the current flood event. |
| 8. | The net impact of adjustments of a non-policy nature such as for borrowing costs, depreciation expenses and changes in the timing of expenditure. |
| | |
| | |
| Mid Year Fiscal and Economic Review 2010-11 | | 19 |
Expenses
Figure 5
Budget and Mid Year Fiscal and Economic Review Expenses, by Category
General Government Sector 2010-11
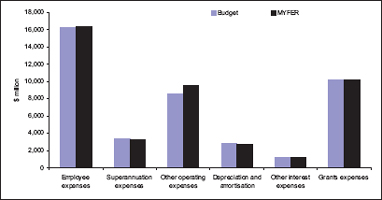
Expenses in 2010-11 are expected to be $945 million (or 2.2%) higher than the Budget estimate.
NDRRA expenditure, including for the most recent flood event, is estimated at approximately $1.6 Billion in 2010-11, some of which was included in the 2010-11 Budget. In addition, the initial costs of the Commission of Inquiry into flood disaster, the establishment of the Queensland Reconstruction Authority, the Government’s donation to the Premier’s Disaster Relief Appeal and other flood relief programs have contributed to the increase in expenditure since Budget.
The Government has previously announced the adoption of the Ernst and Young recommendations to improve the Health Payroll System at a cost of $209 million over three years, with $92 million of this provided in 2010-11. The MYFER provides for the total cost to be funded from whole-of-Government savings initiatives including the proposed Voluntary Separation Program.
Some modest service delivery initiatives are also provided, such as extending the ClimateSmart Home Service program (through savings from the generator review), providing additional funding to support students with a disability and delivering on the Government’s election commitment to construct a Townsville Ocean Terminal.
A key commitment of the Queensland Government is for growth in own-purpose expenses to not exceed real per capita growth. Expenditure growth, excluding Commonwealth related expenses, is expected to average 4.15% per year over the period 2009-10 to 2013-14. Further details on the Government’s progress in achieving this goal are outlined in the section on Fiscal Principles.
| | |
| | |
| Mid Year Fiscal and Economic Review 2010-11 | | 20 |
Revenue
Figure 6
Budget and Mid Year Fiscal and Economic Review Revenue, by Category
General Government Sector 2010-11
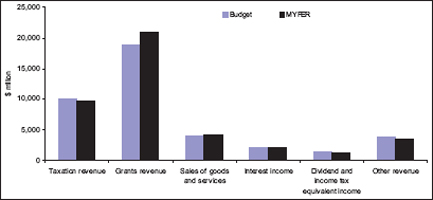
General Government revenue in 2010-11 is estimated to be $41.829 billion, $1.223 billion higher than the 2010-11 Budget estimate. This primarily reflects the $2 billion advance in NDRRA revenue from the Australian Government. Partially offsetting this are:
| • | | downward revisions to royalty estimates, primarily due to lost production as a result of the floods and the appreciation of the A$-US$ exchange rate, partially offset by price increases in the final quarter of 2010-11 |
| • | | revisions to GST revenue |
| • | | a lower than expected level of property market activity impacting transfer duty including as a result of the recent flood events. The flood has also had a modest impact on payroll tax |
Consistent with the downward revision to gross state product, the revenue outlook (excluding NDRRA revenue from the Australian Government) has softened since the 2010-11 Budget. Within the State, factors such as interest rate increases have delayed an anticipated recovery in the property market, while lower than expected levels of household consumption nationally have reduced the Australian Government’s forecasts of GST revenue.
Floods have had a significant impact on the expected level of coal production in 2010-11, while the strength of the A$ is more than offsetting improvements in the outlook for coal prices. In particular, the 2010-11 Budget assumed a 2010-11 year-average exchange rate of US$0.86, whereas the MYFER is based on a 2010-11 year-average assumption of US$0.97. Royalty assumptions for 2010-11 and the forward estimates are as outlined in Table 5.
| | |
| | |
| Mid Year Fiscal and Economic Review 2010-11 | | 21 |
Table 5
Royalty Assumptions
| | | | | | | | | | | | | | | | |
| | | 2010-11
Revised | | | 2011-12
Projection | | | 2012-13
Projection | | | 2013-14
Projection | |
Tonnages – Crown Export Coal (Mt) | | | 165 | | | | 187 | | | | 199 | | | | 211 | |
Exchange Rate US$ per A$ | | | 0.97 | | | | 0.95 | | | | 0.92 | | | | 0.90 | |
Year Average Coal Prices | | | | | | | | | | | | | | | | |
Hard Coking | | | 231 | | | | 221 | | | | 200 | | | | 180 | |
Semi-Soft | | | 185 | | | | 173 | | | | 160 | | | | 140 | |
Thermal | | | 98 | | | | 118 | | | | 105 | | | | 98 | |
Treasury will commence discussions with the Queensland Resources Council on moving major royalty payers from a quarterly to monthly collection cycle from 2012. This will improve the timeliness of collections and enhance the Government’s monitoring and forecasting capacity over this significant revenue item.
The reduction in taxation forecasts of $426 million (or 4.2%) in 2010-11 primarily reflects a revision to the transfer duty forecast, with turnover in the housing stock much less than anticipated. This is associated with a moderation to the outlook for the owner-occupied property sector as a result of the cessation of the Australian Government’s First Home Owners Boost (which had flow-on impacts to other sectors of the residential property market) and increased interest rates. The outlook for residential investment property and non-residential property remains subdued due to continuing tightness in credit conditions and expectations of below-trend rates of economic growth in 2010-11. The level of transfer duty collections is now estimated to be less than that in 2009-10.
Further revisions have also been made to transfer duty and payroll tax in 2010-11 as a result of the recent flood events, although payroll tax estimates are still higher than in the 2010-11 Budget as a result of strong employment growth during the first half of 2010-11.
Table 6 outlines changes in taxation and royalty revenue since the 2010-11 Budget.
| | |
| | |
| Mid Year Fiscal and Economic Review 2010-11 | | 22 |
Table 6
Taxation and royalty revenue1
| | | | | | | | | | | | |
| | | 2009-10
Actual
$ million | | | 2010-11
Budget
$ million | | | 2010-11
Revised
$ million | |
Payroll tax | | | 2,687 | | | | 2,888 | | | | 2,930 | |
| | | |
Duties | | | | | | | | | | | | |
Transfer | | | 1,978 | | | | 2,229 | | | | 1,885 | |
Vehicle registration2 | | | 398 | | | | 467 | | | | 447 | |
Insurance3 | | | 443 | | | | 466 | | | | 471 | |
Other duties4 | | | 26 | | | | 21 | | | | 24 | |
Total duties | | | 2,845 | | | | 3,183 | | | | 2,827 | |
| | | |
Gambling taxes and levies | | | | | | | | | | | | |
Gaming machine tax | | | 517 | | | | 536 | | | | 542 | |
Health Services Levy | | | 33 | | | | 34 | | | | 36 | |
Lotteries taxes | | | 238 | | | | 245 | | | | 230 | |
Wagering taxes | | | 39 | | | | 41 | | | | 41 | |
Casino taxes | | | 82 | | | | 89 | | | | 86 | |
Keno tax | | | 19 | | | | 20 | | | | 20 | |
Total gambling taxes and levies | | | 927 | | | | 964 | | | | 954 | |
| | | |
Other taxes | | | | | | | | | | | | |
Land tax | | | 1,033 | | | | 1,117 | | | | 1,052 | |
Motor vehicle registration | | | 1,252 | | | | 1,311 | | | | 1,311 | |
Fire levy | | | 298 | | | | 311 | | | | 317 | |
Community Ambulance Cover | | | 155 | | | | 154 | | | | 154 | |
Guarantee fees | | | 112 | | | | 192 | | | | 150 | |
Other taxes | | | 65 | | | | 70 | | | | 70 | |
| | | |
Total taxation revenue | | | 9,375 | | | | 10,192 | | | | 9,766 | |
| | | |
Royalties | | | | | | | | | | | | |
Coal | | | 1,756 | | | | 2,766 | | | | 2,466 | |
Other royalties and land rents | | | 392 | | | | 477 | | | | 491 | |
Total royalties | | | 2,148 | | | | 3,243 | | | | 2,957 | |
Notes:
| 1. | Numbers may not add due to rounding. |
| 2. | Vehicle registration duties in 2009-10 effectively represent only 11 months of collections, due to a one-off accrual |
adjustment.
| 3. | Includes duty on accident insurance premiums. |
| 4. | Includes duty on life insurance premiums. |
| | |
| | |
| Mid Year Fiscal and Economic Review 2010-11 | | 23 |
Revenue growth from 2011-12 to 2013-14 is expected to average 2.2% per annum. This is mainly driven by the advance NDRRA payment from the Australian Government and taxation and GST returning to long-term trend growth rates from 2011-12 onwards, with relatively stable royalty revenues anticipated as an easing in contract prices is assumed to largely offset strong volume growth. Growth in own-source revenues is also partly offset by reductions in Australian Government stimulus package flows, such as the Nation Building and Jobs Plan, which will largely reach completion in 2010-11.
Fiscal Principles
The fiscal principles of the Queensland Government are broadly based around three themes: fiscal sustainability; a competitive tax regime; and managing the State’s balance sheet.
The principles of the Queensland Government are:
| • | | In the General Government sector, meet all operating expenses from operating revenue (where operating revenue is defined as total revenue from transactions and operating expenses are defined as total expenses from transactions less depreciation). |
This principle is expected to be met in 2010-11 and 2013-14. In 2011-12 and 2012-13 natural disaster spending has resulted in a $1.6 billion deterioration and $1.3 billion deterioration respectively since the 2010-11 Budget.
| • | | Growth in own-purpose expenses in the General Government sector not to exceed real per capita growth. |
Growth in own-purpose expenses in 2009-10 was 2.81%, primarily reflecting the implementation of savings measures introduced in the 2009-10 Budget. In comparison, growth in population and inflation was almost 5%. The 2009-10 outcome represents the lowest growth in own-purpose expenses since 2002-03.
At the time of the 2010-11 Budget, growth in own-purpose expenses in 2010-11 was estimated at 5.97%, reflecting an unusually high level of expenses associated with natural disaster relief and reparation works and one-off costs associated with the assets sale program. Own-purpose expenses in 2010-11 are now expected to grow by 10.12%, with the increase since Budget primarily as a result of the significant flood reparation work, including an upfront payment to local councils. Other contributing factors include funding for improvements to the Queensland Health payroll system and modest service delivery enhancements.
The Government remains committed to ensuring that, on average across the forward estimates, own-purpose expenses growth will not exceed the real per capita constraint. The savings measures introduced by the Government will assist in achieving this principle. On average across the forward estimates, own-purpose expenses are expected to grow by 4.15% per annum, compared to real per capita growth of 5.04%. This decline in own-purpose expenses in 2013-14 is because the cost of the floods is expected to impact on the previous three years.
| | |
| | |
| Mid Year Fiscal and Economic Review 2010-11 | | 24 |
| • | | Achieve a General Government net operating surplus as soon as possible, but no later than 2015-16. |
Despite a moderation in the revenue outlook since the 2010-11 Budget, the Queensland Government is committed to returning to a net operating surplus no later than 2015-16.
In this regard, the Government is introducing additional savings measures rising to $400 million per annum by 2014-15 (with total savings of approximately $800 million over the period 2010-11 to 2014-15).
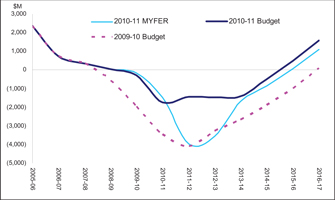
Consistent with the projection in the 2010-11 Budget, Figure 7 indicates Queensland is on track to achieve a surplus in 2015-16. This reflects the fiscal benefits of the savings initiatives outlined above, largely offsetting the reductions in revenue since Budget by the end of the forward estimates period.
Figure 7
Budget and Mid Year Fiscal and Economic Review
General Government Sector Net Operating Balance, 2005-06 to 2016-17
| • | | Maintain a competitive tax environment for business. |
Per capita tax collections in Queensland in 2010-11 are estimated at $2,136, compared with an estimated $2,636 for the average of the other states. This differential of $500 per capita is the largest differential since 2000-01.
| | |
| | |
| Mid Year Fiscal and Economic Review 2010-11 | | 25 |
| • | | Stabilise net financial liabilities as a proportion of revenue in the Non-financial Public sector. |
The assets sale program undertaken by the Queensland Government has resulted in the net financial liabilities to revenue ratio being significantly lower than it would have been in the absence of asset sales.
Consistent with standard practice, assets sale proceeds are not factored into the budget estimates until the sale is finalised. Accordingly, the current estimates account for the Government’s sale of QR National and the Port of Brisbane and Forestry Plantations Queensland transactions. The transfer of Queensland Motorways Limited to Queensland Investment Corporation and the Abbot Point Coal Terminal transaction are expected to be completed prior to 30 June 2011, but are not yet included in the estimates.
For the asset sales that have been finalised, proceeds have been utilised to extinguish borrowings. The reduced borrowings as a result of asset sales is most apparent in the Non-financial Public sector, which effectively amalgamates the General Government and Public Non-financial Corporations sectors and is discussed in further detail below.
The proceeds from the QR National ($4.6 billion, including the transfer of a working capital borrowing facility to the new entity), Port of Brisbane ($2.1 billion in cash receipts) and Forestry Plantations Queensland ($0.6 billion) transactions have resulted in the State’s debt levels being significantly lower than if the asset sales had not occurred.
Further borrowings will also be avoided, as the capital requirements of these entities will no longer be funded by the State. Approximately $2.8 billion of this capital requirement, across the forward estimates, had been factored into the 2010-11 Budget.
| • | | Target full funding of long-term liabilities such as superannuation in accordance with actuarial advice. |
As at the most recent actuarial review (released June 2008), accruing superannuation liabilities were fully funded. The State Actuary reviews the scheme every 3 years. The proposed transfer of Queensland Motorways Limited to the Queensland Investment Corporation’s investment trust will benefit the scheme.
| | |
| | |
| Mid Year Fiscal and Economic Review 2010-11 | | 26 |
Table 6
The fiscal principles of the Queensland Government
| | | | | | | | | | | | |
Principle | | Indicator | |
Fiscal sustainability | | | | | | | | | | | | |
| | | |
| | | | | | Operating
Revenue
($ million) | | | Operating expenses
less depreciation
($ million) | |
In the General Government sector, meet all operating expenses from operating revenue (where operating revenue is defined as total revenue from transactions and operating expenses are defined as total expenses from transactions less depreciation) | | | 2009-10 | | | | 39,729 | | | | 37,285 | |
| | | 2010-11 | | | | 41,829 | | | | 40,514 | |
| | | 2011-12 | | | | 41,796 | | | | 42,743 | |
| | | 2012-13 | | | | 43,731 | | | | 44,034 | |
| | | 2013-14 | | | | 44,633 | | | | 42,819 | |
| | | |
| | | Growth in: | | | Own purpose
expense | | | Inflation plus
population | |
Growth in own-purpose expenses in the General Government sector not to exceed real per capita growth | | | 2009-10 | | | | 2.81 | % | | | 4.95 | % |
| | | 2010-11 | | | | 10.12 | % | | | 5.25 | % |
| | | 2011-12 | | | | 7.52 | % | | | 5.00 | % |
| | | 2012-13 | | | | 3.27 | % | | | 5.00 | % |
| | | 2013-14 | | | | (2.98 | %) | | | 5.00 | % |
| | | Average | | | | 4.15 | % | | | 5.04 | % |
| |
| | | Net operating balance ($ million) | |
Achieve a General Government net operating surplus as soon as possible, but no later than 2015-16 | | | 2009-10 | | | | | | | | (56 | ) |
| | | 2010-11 | | | | | | | | (1,468 | ) |
| | | 2011-12 | | | | | | | | (3,959 | ) |
| | | 2012-13 | | | | | | | | (3,556 | ) |
| | | 2013-14 | | | | | | | | (1,677 | ) |
Competitive tax regime | | | | | | | | | | | | |
| |
| | | Taxation revenue per capita, 2010-11 | |
Maintain a competitive tax environment for business | | | Queensland: | | | | | | | $ | 2,136 | |
| |
| Average of other states
and territories: |
| | $ | 2,636 | |
Managing the State’s balance sheet | | | | | | | | | | | | |
| |
| | | Net Financial Liabilities/Revenue
Non-financial Public Sector | |
Stabilise net financial liabilities as a proportion of revenue in the Non-financial Public Sector | | | 2009-10 | | | | | | | | 94 | % |
| | | 2010-11 | | | | | | | | 96 | % |
| | | 2011-12 | | | | | | | | 120 | % |
| | | 2012-13 | | | | | | | | 131 | % |
| | | 2013-14 | | | | | | | | 137 | % |
Target full funding of long-term liabilities such as superannuation in accordance with actuarial advice | |
| As at last actuarial review (released
June 2008), accruing superannuation
liabilities were fully funded. The
State Actuary reviews the scheme
every 3 years. |
|
The net financial liabilities to revenue ratio identified in Table 6 does not include the benefit of the Queensland Motorways Limited or Abbot Point Coal Terminal transactions. After completion of these transactions, the ratio is expected to be 87% in 2010-11 and 129% in 2013-14.
In the absence of asset sales, it is estimated that the forecast ratio for 2013-14 would have been 147%.
| | |
| | |
| Mid Year Fiscal and Economic Review 2010-11 | | 27 |
CASH FLOWS AND BALANCE SHEET
Non-financial Public Sector
The Non-financial Public (NFP) sector is essentially the amalgam of the General Government and Public Non-financial Corporations (PNFC) sectors, with transactions between these sectors being eliminated.
Net borrowings of $1.651 billion are expected in the NFP sector in 2010-11, a decrease of $9.392 billion compared with the 2010-11 Budget estimate, with asset sales proceeds utilised to repay debt and reduce borrowing requirements and the lower than budgeted operating deficit as a result of the advance NDRRA payment from the Australian Government.
Figure 8
Budget and Mid Year Fiscal and Economic Review
Non-financial Public Sector Net Borrowings
2010-11 to 2013-14
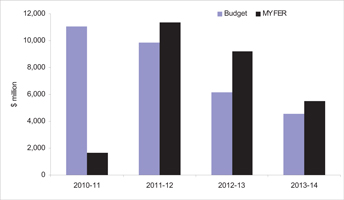
Net borrowings over 2010-11 and the forward estimates are expected to be $27.669 billion, compared to $31.563 billion estimated in the 2010-11 Budget. The reduction reflects the cash proceeds and reduced capital spending associated with asset sales, partially offset by the increased General Government sector deficits as a result of downward revisions to GST, taxation and royalty revenues and the cost of responding to floods.
| | |
| | |
| Mid Year Fiscal and Economic Review 2010-11 | | 28 |
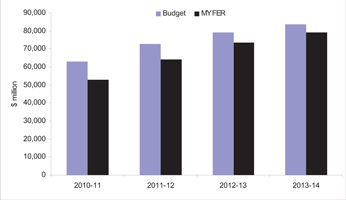
Gross borrowings of $52.839 billion are projected at 30 June 2011, $9.988 billion lower than the 2010-11 Budget estimate due to cash proceeds and reduced capital spending associated with asset sales being utilised to repay existing debt and reduce borrowing requirements and the advance NDRRA payment by the Australian Government. By 2013-14, gross borrowings are expected to reach $78.954 billion, $4.591 billion lower than the estimate at the time of the 2010-11 Budget.
Figure 9
Budget and Mid Year Fiscal and Economic Review
Non-financial Public Sector Gross Borrowings
2010-11 to 2013-14
Purchases of non-financial assets (capital spending) of $13.731 billion are expected in the NFP sector in 2010-11, somewhat lower (11.3% or $1.748 billion) than the 2010-11 Budget estimate, primarily due to the reduced capital requirement in the PNFC sector with the sale of QR National and lower projected capital expenditure this financial year as a result of the floods and wet weather.
Over the period 2010-11 to 2013-14, NFP sector purchases of non-financial assets of $45.8 billion are planned. This is $3.3 billion lower than anticipated at the time of the 2010-11 Budget, largely driven by reduced expenditure in the PNFC sector, as a result of the QR National and Port of Brisbane transactions.
General Government Sector
Cash surplus/deficit
A cash deficit of $5.660 billion is expected in 2010-11, a $736 million improvement in the deficit since Budget as a result of the lower operating deficit and a modest reduction in capital spending.
Capital purchases
Purchases of non-financial assets are expected to be $7.883 billion in 2010-11, lower (5.4%) than the 2010-11 Budget estimate of $8.335 billion reflecting some revisions to the expected timing of expenditure including as a result of recent flooding and wet weather.
| | |
| | |
| Mid Year Fiscal and Economic Review 2010-11 | | 29 |
Over the period 2010-11 to 2013-14, purchases of non-financial assets of $25.9 billion are planned, largely consistent with the estimate at the time of the 2010-11 Budget.
Borrowings
Net borrowings of $81 million are expected in 2010-11, a decrease of $7.548 billion compared with the 2010-11 Budget estimate. The revised position primarily reflects the repatriation of proceeds from the sale of QR National to the General Government sector, along with the net proceeds from the Port of Brisbane transaction and the advance NDRRA payment from the Australian Government.
Net borrowings over 2010-11 and the forward estimates are expected to be $19.854 billion, $2.356 billion less than forecast at Budget largely reflecting the repatriation of net proceeds from asset sales, partly offset by the larger operating deficits that are primarily associated with downward revisions to revenue forecasts and responding to the floods.
Gross borrowings (the stock of borrowings outstanding as stated in the balance sheet) of $20.497 billion are forecast at 30 June 2011, $2.753 billion less than the Budget estimate, primarily reflecting a significant proportion of the proceeds from the sale of QR National being used to repay QR borrowings.
Net worth
The net worth, or equity, of the State is the amount by which the State’s assets exceed its liabilities. This is the value of the investment held on behalf of the people of Queensland by public sector entities.
The net worth of the General Government sector at 30 June 2011 is estimated at $176.697 billion. This is $11.867 billion lower than the forecast in the 2010-11 Budget, primarily due to downward revaluations of land and other fixed assets, such as roads, in the 30 June 2010 year-end process, to reflect market value.
Net debt
Net debt is the sum of advances received and borrowings less cash and deposits, advances paid and investments, loans and placements.
In 2010-11, net debt in the General Government sector is estimated to be negative $9.790 billion, compared to negative $6.743 billion estimated at the time of the 2010-11 Budget. The reduction in net debt primarily reflects the lower level of borrowings.
Queensland’s negative net debt of $2,141 per capita compares well to the weighted average net debt of $1,590 per capita in the other states.
Table 7
Projected net debt per capita at 30 June 2011
| | | | | | | | | | | | | | | | | | | | | | | | |
| | | QLD | | | NSW | | | VIC | | | WA | | | SA | | | TAS | |
Net debt per capita ($) | | | (2,141 | ) | | | 1,668 | | | | 1,989 | | | | 616 | | | | 1,943 | | | | (606 | ) |
Sources: Mid Year Updates for QLD, NSW, WA, SA. Pre-election Budget Update for Vic. Budget for Tas. Population data is based on Australian Government Mid Year Economic and Fiscal Outlook forecasts.
| | |
| | |
| Mid Year Fiscal and Economic Review 2010-11 | | 30 |
Public Non-financial Corporations Sector
Net borrowings are forecast to decrease to $1.571 billion in 2010-11 compared to the Budget estimate of $3.414 billion. This is due to the reduction in net cash flows from operating activities being more than offset by the repayment of borrowings and reduced capital spending, primarily associated with the removal of QR National and the Port of Brisbane Corporation from the Budget and forward estimates.
Capital spending (purchases of non-financial assets) in the PNFC sector has been revised downwards from the Budget estimate over the four years from 2010-11. Capital spending over this period is expected to total $19.942 billion, a decrease of $3.024 billion from the Budget estimate of $22.966 billion. This decrease primarily reflects the removal of previously committed QR National capital projects.
The PNFC sector is projected to have a net operating surplus of $333 million in 2010-11, an increase of $22 million compared to the 2010-11 Budget estimate.
| | |
| | |
| Mid Year Fiscal and Economic Review 2010-11 | | 31 |
UNIFORM PRESENTATION FRAMEWORK AND LOAN COUNCIL ALLOCATION
Uniform Presentation Framework Information
General Government Sector Operating Statement 1
| | | | | | | | | | | | | | | | | | | | | | | | |
| | | | | | | 2010-11
Budget 2
$ million | | | 2010-11
Revised
$ million | | | 2011-12
Projection
$ million | | | 2012-13
Projection
$ million | | | 2013-14
Projection
$ million | |
| | | | | | |
| | Revenue from Transactions | | | | | | | | | | | | | | | | | | | | |
| | Taxation revenue | | | 10,192 | | | | 9,766 | | | | 10,627 | | | | 11,528 | | | | 12,345 | |
| | Grants revenue | | | 18,872 | | | | 20,832 | | | | 19,522 | | | | 20,316 | | | | 20,142 | |
| | Sales of goods and services | | | 4,077 | | | | 4,196 | | | | 4,427 | | | | 4,523 | | | | 4,745 | |
| | Interest income | | | 2,132 | | | | 2,129 | | | | 2,209 | | | | 2,271 | | | | 2,323 | |
| | Dividend and income tax equivalent income | | | 1,460 | | | | 1,360 | | | | 1,099 | | | | 1,235 | | | | 1,387 | |
| | Other revenue | | | 3,874 | | | | 3,546 | | | | 3,912 | | | | 3,858 | | | | 3,692 | |
| | Total Revenue from Transactions | | | 40,606 | | | | 41,829 | | | | 41,796 | | | | 43,731 | | | | 44,633 | |
| | | | | | |
Less | | Expenses from Transactions | | | | | | | | | | | | | | | | | | | | |
| | Employee expenses | | | 16,221 | | | | 16,350 | | | | 17,560 | | | | 18,064 | | | | 18,771 | |
| | Superannuation expenses | | | | | | | | | | | | | | | | | | | | |
| | Superannuation interest cost | | | 1,261 | | | | 1,174 | | | | 1,221 | | | | 1,231 | | | | 1,234 | |
| | Other superannuation expenses | | | 2,103 | | | | 2,149 | | | | 2,225 | | | | 2,300 | | | | 2,350 | |
| | Other operating expenses | | | 8,502 | | | | 9,524 | | | | 10,244 | | | | 10,400 | | | | 8,938 | |
| | Depreciation and amortisation | | | 2,822 | | | | 2,783 | | | | 3,012 | | | | 3,253 | | | | 3,492 | |
| | Other interest expenses | | | 1,242 | | | | 1,160 | | | | 1,566 | | | | 2,037 | | | | 2,367 | |
| | Grants expenses | | | 10,201 | | | | 10,157 | | | | 9,928 | | | | 10,002 | | | | 9,159 | |
| | Total Expenses from Transactions | | | 42,352 | | | | 43,297 | | | | 45,755 | | | | 47,287 | | | | 46,311 | |
| | | | | | |
Equals | | Net Operating Balance | | | (1,745 | ) | | | (1,468 | ) | | | (3,959 | ) | | | (3,556 | ) | | | (1,677 | ) |
| | | | | | |
Plus | | Other economic flows - included in operating result | | | (178 | ) | | | 365 | | | | (39 | ) | | | 9 | | | | 28 | |
| | | | | | |
Equals | | Operating Result | | | (1,924 | ) | | | (1,102 | ) | | | (3,998 | ) | | | (3,547 | ) | | | (1,650 | ) |
| | | | | | |
Plus | | Other economic flows - other movements in equity | | | 2,881 | | | | 2,145 | | | | 2,964 | | | | 3,089 | | | | 3,463 | |
| | | | | | |
Equals | | Comprehensive Result - Total Change In Net Worth | | | 957 | | | | 1,042 | | | | (1,034 | ) | | | (457 | ) | | | 1,814 | |
| | | | | | |
| | KEY FISCAL AGGREGATES | | | | | | | | | | | | | | | | | | | | |
| | | | | | |
| | Net Operating Balance | | | (1,745 | ) | | | (1,468 | ) | | | (3,959 | ) | | | (3,556 | ) | | | (1,677 | ) |
| | | | | | |
Less | | Net Acquisition of Non-financial Assets | | | | | | | | | | | | | | | | | | | | |
| | Purchases of non-financial assets | | | 8,335 | | | | 7,883 | | | | 7,328 | | | | 5,930 | | | | 4,763 | |
| | Less | | Sales of non-financial assets | | | 203 | | | | 211 | | | | 211 | | | | 314 | | | | 164 | |
| | Less | | Depreciation | | | 2,822 | | | | 2,783 | | | | 3,012 | | | | 3,253 | | | | 3,492 | |
| | Plus | | Change in inventories | | | 73 | | | | 86 | | | | 15 | | | | 63 | | | | 73 | |
| | Plus | | Other movements in non-financial assets | | | 186 | | | | 189 | | | | 182 | | | | 130 | | | | 141 | |
| | Equals | | Total Net Acquisition of Non-financial Assets | | | 5,569 | | | | 5,165 | | | | 4,302 | | | | 2,556 | | | | 1,320 | |
| | | | | | |
Equals | | Net Lending / (Borrowing) | | | (7,314 | ) | | | (6,632 | ) | | | (8,261 | ) | | | (6,111 | ) | | | (2,998 | ) |
Notes:
| 1. | Numbers may not add due to rounding. |
| 2. | Numbers have been restated where subsequent changes in classification have occurred. |
| | |
| | |
| Mid Year Fiscal and Economic Review 2010-11 | | 32 |
Public Non-financial Corporations Sector Operating Statement 1
| | | | | | | | | | | | | | | | | | | | | | | | |
| | | | | | | 2010-11
Budget 2
$ million | | | 2010-11
Revised
$ million | | | 2011-12
Projection
$ million | | | 2012-13
Projection
$ million | | | 2013-14
Projection
$ million | |
| | Revenue from Transactions | | | | | | | | | | | | | | | | | | | | |
| | Grants revenue | | | 2,092 | | | | 2,078 | | | | 2,114 | | | | 2,126 | | | | 2,223 | |
| | Sales of goods and services | | | 10,574 | | | | 8,660 | | | | 7,658 | | | | 8,331 | | | | 9,013 | |
| | Interest income | | | 98 | | | | 115 | | | | 110 | | | | 99 | | | | 102 | |
| | Other revenue | | | 323 | | | | 312 | | | | 346 | | | | 354 | | | | 326 | |
| | Total Revenue from Transactions | | | 13,086 | | | | 11,165 | | | | 10,228 | | | | 10,910 | | | | 11,664 | |
| | | | | | |
Less | | Expenses from Transactions | | | | | | | | | | | | | | | | | | | | |
| | Employee expenses | | | 2,563 | | | | 2,081 | | | | 1,769 | | | | 1,786 | | | | 1,895 | |
| | Superannuation expenses | | | | | | | | | | | | | | | | | | | | |
| | Other superannuation expenses | | | 106 | | | | 161 | | | | 139 | | | | 149 | | | | 161 | |
| | Other operating expenses | | | 4,284 | | | | 3,705 | | | | 3,066 | | | | 3,148 | | | | 3,224 | |
| | Depreciation and amortisation | | | 2,747 | | | | 2,268 | | | | 2,429 | | | | 2,572 | | | | 2,677 | |
| | Other interest expenses | | | 2,654 | | | | 2,233 | | | | 2,297 | | | | 2,484 | | | | 2,647 | |
| | Grants expenses | | | 34 | | | | 34 | | | | 14 | | | | 14 | | | | 3 | |
| | Other property expenses | | | 388 | | | | 351 | | | | 259 | | | | 295 | | | | 332 | |
| | Total Expenses from Transactions | | | 12,776 | | | | 10,833 | | | | 9,974 | | | | 10,449 | | | | 10,939 | |
| | | | | | |
Equals | | Net Operating Balance | | | 311 | | | | 333 | | | | 254 | | | | 462 | | | | 725 | |
| | | | | | |
Plus | | Other economic flows - included in operating result | | | (109 | ) | | | 538 | | | | (255 | ) | | | (288 | ) | | | (234 | ) |
| | | | | | |
Equals | | Operating Result | | | 202 | | | | 871 | | | | (1 | ) | | | 174 | | | | 492 | |
| | | | | | |
Plus | | Other economic flows - other movements in equity | | | (453 | ) | | | (2,829 | ) | | | 222 | | | | 47 | | | | 66 | |
| | | | | | |
Equals | | Comprehensive Result - Total Change In Net Worth | | | (251 | ) | | | (1,958 | ) | | | 222 | | | | 220 | | | | 557 | |
| | | | | | |
| | KEY FISCAL AGGREGATES | | | | | | | | | | | | | | | | | | | | |
| | | | | | |
| | Net Operating Balance | | | 311 | | | | 333 | | | | 254 | | | | 462 | | | | 725 | |
| | | | | | |
Less | | Net Acquisition of Non-financial Assets | | | | | | | | | | | | | | | | | | | | |
| | Purchases of non-financial assets | | | 7,144 | | | | 5,849 | | | | 4,781 | | | | 4,891 | | | | 4,421 | |
| | Less | | Sales of non-financial assets | | | 184 | | | | 572 | | | | 116 | | | | 223 | | | | 42 | |
| | Less | | Depreciation | | | 2,747 | | | | 2,268 | | | | 2,429 | | | | 2,572 | | | | 2,677 | |
| | Plus | | Change in inventories | | | 26 | | | | (2 | ) | | | (15 | ) | | | 16 | | | | 13 | |
| | Plus | | Other movements in non-financial assets | | | 40 | | | | 44 | | | | 59 | | | | 61 | | | | 62 | |
| | Equals | | Total Net Acquisition of Non-financial Assets | | | 4,281 | | | | 3,052 | | | | 2,280 | | | | 2,173 | | | | 1,777 | |
| | | | | | |
Equals | | Net Lending / (Borrowing) | | | (3,970 | ) | | | (2,719 | ) | | | (2,026 | ) | | | (1,711 | ) | | | (1,052 | ) |
Notes:
| 1. | Numbers may not add due to rounding. |
| 2. | Numbers have been restated where subsequent changes in classification have occurred. |
| | |
| | |
| Mid Year Fiscal and Economic Review 2010-11 | | 33 |
Non-financial Public Sector Operating Statement 1
| | | | | | | | | | | | | | | | | | | | | | | | |
| | | | | | | 2010-11
Budget 2
$ million | | | 2010-11
Revised
$ million | | | 2011-12
Projection
$ million | | | 2012-13
Projection
$ million | | | 2013-14
Projection
$ million | |
| | | | | | |
| | Revenue from Transactions | | | | | | | | | | | | | | | | | | | | |
| | Taxation revenue | | | 9,854 | | | | 9,491 | | | | 10,329 | | | | 11,173 | | | | 11,962 | |
| | Grants revenue | | | 18,914 | | | | 21,002 | | | | 19,657 | | | | 20,461 | | | | 20,297 | |
| | Sales of goods and services | | | 14,316 | | | | 12,521 | | | | 11,755 | | | | 12,505 | | | | 13,383 | |
| | Interest income | | | 2,230 | | | | 2,245 | | | | 2,318 | | | | 2,370 | | | | 2,425 | |
| | Dividend and income tax equivalent income | | | 25 | | | | 23 | | | | 26 | | | | 32 | | | | 41 | |
| | Other revenue | | | 4,194 | | | | 3,855 | | | | 4,258 | | | | 4,212 | | | | 4,019 | |
| | Total Revenue from Transactions | | | 49,533 | | | | 49,137 | | | | 48,343 | | | | 50,752 | | | | 52,126 | |
| | | | | | |
Less | | Expenses from Transactions | | | | | | | | | | | | | | | | | | | | |
| | Employee expenses | | | 18,664 | | | | 18,322 | | | | 19,233 | | | | 19,747 | | | | 20,554 | |
| | Superannuation expenses | | | | | | | | | | | | | | | | | | | | |
| | Superannuation interest cost | | | 1,261 | | | | 1,174 | | | | 1,221 | | | | 1,231 | | | | 1,234 | |
| | Other superannuation expenses | | | 2,209 | | | | 2,311 | | | | 2,364 | | | | 2,449 | | | | 2,512 | |
| | Other operating expenses | | | 12,415 | | | | 12,869 | | | | 12,956 | | | | 13,173 | | | | 11,757 | |
| | Depreciation and amortisation | | | 5,568 | | | | 5,050 | | | | 5,441 | | | | 5,825 | | | | 6,169 | |
| | Other interest expenses | | | 3,704 | | | | 3,243 | | | | 3,676 | | | | 4,285 | | | | 4,760 | |
| | Grants expenses | | | 8,197 | | | | 8,296 | | | | 7,975 | | | | 8,049 | | | | 7,108 | |
| | Total Expenses from Transactions | | | 52,017 | | | | 51,265 | | | | 52,865 | | | | 54,759 | | | | 54,095 | |
| | | | | | |
Equals | | Net Operating Balance | | | (2,485 | ) | | | (2,128 | ) | | | (4,522 | ) | | | (4,006 | ) | | | (1,969 | ) |
| | | | | | |
Plus | | Other economic flows - included in operating result | | | (287 | ) | | | (259 | ) | | | (293 | ) | | | (279 | ) | | | (206 | ) |
| | | | | | |
Equals | | Operating Result | | | (2,772 | ) | | | (2,387 | ) | | | (4,816 | ) | | | (4,285 | ) | | | (2,175 | ) |
| | | | | | |
Plus | | Other economic flows - other movements in equity | | | 3,728 | | | | 2,907 | | | | 3,782 | | | | 3,828 | | | | 3,989 | |
| | | | | | |
Equals | | Comprehensive Result - Total Change In Net Worth | | | 957 | | | | 520 | | | | (1,034 | ) | | | (457 | ) | | | 1,814 | |
| | | | | | |
| | KEY FISCAL AGGREGATES | | | | | | | | | | | | | | | | | | | | |
| | | | | | |
| | Net Operating Balance | | | (2,485 | ) | | | (2,128 | ) | | | (4,522 | ) | | | (4,006 | ) | | | (1,969 | ) |
| | | | | | |
Less | | Net Acquisition of Non-financial Assets | | | | | | | | | | | | | | | | | | | | |
| | Purchases of non-financial assets | | | 15,479 | | | | 13,731 | | | | 12,108 | | | | 10,822 | | | | 9,184 | |
| | Less | | Sales of non-financial assets | | | 387 | | | | 783 | | | | 327 | | | | 537 | | | | 207 | |
| | Less | | Depreciation | | | 5,568 | | | | 5,050 | | | | 5,441 | | | | 5,825 | | | | 6,169 | |
| | Plus | | Change in inventories | | | 99 | | | | 84 | | | | — | | | | 78 | | | | 86 | |
| | Plus | | Other movements in non-financial assets | | | 227 | | | | 234 | | | | 241 | | | | 191 | | | | 203 | |
| | Equals | | Total Net Acquisition of Non-financial Assets | | | 9,850 | | | | 8,216 | | | | 6,581 | | | | 4,728 | | | | 3,097 | |
| | | | | | |
Equals | | Net Lending / (Borrowing) | | | (12,335 | ) | | | (10,344 | ) | | | (11,104 | ) | | | (8,735 | ) | | | (5,066 | ) |
Notes:
| 1. | Numbers may not add due to rounding. |
| 2. | Numbers have been restated where subsequent changes in classification have occurred. |
| | |
| | |
| Mid Year Fiscal and Economic Review 2010-11 | | 34 |
General Government Sector Balance Sheet 1
| | | | | | | | | | | | | | | | | | | | |
| | | 2010-11
Budget 2
$ million | | | 2010-11
Revised
$ million | | | 2011-12
Projection
$ million | | | 2012-13
Projection
$ million | | | 2013-14
Projection
$ million | |
Assets | | | | | | | | | | | | | | | | | | | | |
Financial Assets | | | | | | | | | | | | | | | | | | | | |
Cash and deposits | | | 308 | | | | 445 | | | | 349 | | | | 311 | | | | 282 | |
Advances paid | | | 594 | | | | 595 | | | | 623 | | | | 639 | | | | 651 | |
Investments, loans and placements | | | 29,553 | | | | 29,712 | | | | 30,589 | | | | 31,384 | | | | 32,426 | |
Receivables | | | 3,357 | | | | 3,784 | | | | 3,710 | | | | 3,906 | | | | 4,105 | |
Equity | | | | | | | | | | | | | | | | | | | | |
Investments in other public sector entities | | | 24,648 | | | | 17,451 | | | | 17,673 | | | | 17,893 | | | | 18,450 | |
Investments - other | | | 59 | | | | 73 | | | | 119 | | | | 149 | | | | 149 | |
| | | | | |
Total Financial Assets | | | 58,518 | | | | 52,060 | | | | 53,063 | | | | 54,282 | | | | 56,063 | |
| | | | | |
Non-financial Assets | | | | | | | | | | | | | | | | | | | | |
Land and other fixed assets | | | 182,735 | | | | 176,664 | | | | 184,072 | | | | 189,626 | | | | 193,701 | |
Other non-financial assets | | | 6,759 | | | | 5,495 | | | | 5,748 | | | | 6,057 | | | | 6,377 | |
Total Non-financial Assets | | | 189,493 | | | | 182,159 | | | | 189,820 | | | | 195,683 | | | | 200,077 | |
| | | | | |
Total Assets | | | 248,012 | | | | 234,219 | | | | 242,882 | | | | 249,965 | | | | 256,141 | |
| | | | | |
Liabilities | | | | | | | | | | | | | | | | | | | | |
Payables | | | 3,085 | | | | 3,481 | | | | 3,485 | | | | 3,546 | | | | 3,617 | |
Superannuation liability | | | 25,462 | | | | 25,664 | | | | 25,969 | | | | 26,123 | | | | 26,128 | |
Other employee benefits | | | 4,177 | | | | 4,428 | | | | 4,696 | | | | 4,956 | | | | 5,228 | |
Deposits held | | | — | | | | 4 | | | | 4 | | | | 4 | | | | 4 | |
Advances received | | | 462 | | | | 461 | | | | 459 | | | | 457 | | | | 455 | |
Borrowing | | | 23,250 | | | | 20,497 | | | | 29,521 | | | | 36,487 | | | | 40,403 | |
Other liabilities | | | 3,012 | | | | 2,987 | | | | 3,084 | | | | 3,185 | | | | 3,286 | |
Total Liabilities | | | 59,447 | | | | 57,522 | | | | 67,219 | | | | 74,758 | | | | 79,121 | |
| | | | | |
Net Worth | | | 188,564 | | | | 176,697 | | | | 175,664 | | | | 175,206 | | | | 177,020 | |
Net Financial Worth | | | (929 | ) | | | (5,462 | ) | | | (14,156 | ) | | | (20,477 | ) | | | (23,057 | ) |
Net Financial Liabilities | | | 25,576 | | | | 22,913 | | | | 31,829 | | | | 38,370 | | | | 41,508 | |
Net Debt | | | (6,743 | ) | | | (9,790 | ) | | | (1,576 | ) | | | 4,614 | | | | 7,502 | |
Notes:
| 1. | Numbers may not add due to rounding. |
| 2. | Numbers have been restated where subsequent changes in classification have occurred. |
| | |
| | |
| Mid Year Fiscal and Economic Review 2010-11 | | 35 |
Public Non-financial Corporations Sector Balance Sheet 1
| | | | | | | | | | | | | | | | | | | | |
| | | 2010-11
Budget 2
$ million | | | 2010-11
Revised
$ million | | | 2011-12
Projection
$ million | | | 2012-13
Projection
$ million | | | 2013-14
Projection
$ million | |
Assets | | | | | | | | | | | | | | | | | | | | |
Financial Assets | | | | | | | | | | | | | | | | | | | | |
Cash and deposits | | | 943 | | | | 1,315 | | | | 1,296 | | | | 1,304 | | | | 1,406 | |
Advances paid | | | 247 | | | | 275 | | | | 258 | | | | 241 | | | | 225 | |
Investments, loans and placements | | | 561 | | | | 611 | | | | 431 | | | | 368 | | | | 319 | |
Receivables | | | 2,032 | | | | 1,592 | | | | 1,680 | | | | 1,818 | | | | 1,916 | |
Equity | | | | | | | | | | | | | | | | | | | | |
Investments - other | | | 99 | | | | 83 | | | | 100 | | | | 122 | | | | 132 | |
Total Financial Assets | | | 3,882 | | | | 3,875 | | | | 3,765 | | | | 3,853 | | | | 3,998 | |
| | | | | |
Non-financial Assets | | | | | | | | | | | | | | | | | | | | |
Land and other fixed assets | | | 72,658 | | | | 57,023 | | | | 59,854 | | | | 62,573 | | | | 65,063 | |
Other non-financial assets | | | 1,449 | | | | 1,169 | | | | 1,168 | | | | 1,178 | | | | 1,177 | |
Total Non-financial Assets | | | 74,107 | | | | 58,192 | | | | 61,022 | | | | 63,751 | | | | 66,240 | |
| | | | | |
Total Assets | | | 77,989 | | | | 62,067 | | | | 64,787 | | | | 67,604 | | | | 70,238 | |
| | | | | |
Liabilities | | | | | | | | | | | | | | | | | | | | |
Payables | | | 2,555 | | | | 2,246 | | | | 2,125 | | | | 2,282 | | | | 2,445 | |
Superannuation liability | | | 131 | | | | 79 | | | | 64 | | | | 48 | | | | 48 | |
Other employee benefits | | | 958 | | | | 648 | | | | 644 | | | | 615 | | | | 630 | |
Deposits held | | | 20 | | | | 16 | | | | 16 | | | | 16 | | | | 17 | |
Advances received | | | 11 | | | | 11 | | | | 11 | | | | 10 | | | | 9 | |
Borrowing | | | 39,578 | | | | 32,341 | | | | 34,752 | | | | 36,963 | | | | 38,550 | |
Other liabilities | | | 7,773 | | | | 6,205 | | | | 6,435 | | | | 6,708 | | | | 7,021 | |
Total Liabilities | | | 51,027 | | | | 41,547 | | | | 44,046 | | | | 46,643 | | | | 48,719 | |
| | | | | |
Net Worth | | | 26,962 | | | | 20,520 | | | | 20,742 | | | | 20,962 | | | | 21,519 | |
Net Financial Worth | | | (47,145 | ) | | | (37,672 | ) | | | (40,281 | ) | | | (42,789 | ) | | | (44,721 | ) |
Net Debt | | | 37,859 | | | | 30,168 | | | | 32,794 | | | | 35,076 | | | | 36,625 | |
Notes:
| 1. | Numbers may not add due to rounding. |
| 2. | Numbers have been restated where subsequent changes in classification have occurred. |
| | |
| | |
| Mid Year Fiscal and Economic Review 2010-11 | | 36 |
Non-financial Public Sector Balance Sheet 1
| | | | | | | | | | | | | | | | | | | | |
| | | 2010-11
Budget 2
$ million | | | 2010-11
Revised
$ million | | | 2011-12
Projection
$ million | | | 2012-13
Projection
$ million | | | 2013-14
Projection
$ million | |
Assets | | | | | | | | | | | | | | | | | | | | |
Financial Assets | | | | | | | | | | | | | | | | | | | | |
Cash and deposits | | | 1,251 | | | | 1,759 | | | | 1,645 | | | | 1,615 | | | | 1,688 | |
Advances paid | | | 829 | | | | 858 | | | | 869 | | | | 870 | | | | 866 | |
Investments, loans and placements | | | 30,113 | | | | 30,325 | | | | 31,022 | | | | 31,754 | | | | 32,747 | |
Receivables | | | 3,943 | | | | 3,940 | | | | 4,089 | | | | 4,297 | | | | 4,450 | |
Equity | | | | | | | | | | | | | | | | | | | | |
Investments in other public sector entities | | | (2,250 | ) | | | (3,004 | ) | | | (3,005 | ) | | | (3,005 | ) | | | (3,006 | ) |
Investments - other | | | 158 | | | | 155 | | | | 219 | | | | 271 | | | | 280 | |
Total Financial Assets | | | 34,044 | | | | 34,033 | | | | 34,839 | | | | 35,801 | | | | 37,025 | |
| | | | | |
Non-financial Assets | | | | | | | | | | | | | | | | | | | | |
Land and other fixed assets | | | 255,358 | | | | 233,653 | | | | 243,891 | | | | 252,165 | | | | 258,729 | |
Other non-financial assets | | | 790 | | | | 678 | | | | 628 | | | | 622 | | | | 619 | |
Total Non-financial Assets | | | 256,147 | | | | 234,331 | | | | 244,519 | | | | 252,787 | | | | 259,348 | |
| | | | | |
Total Assets | | | 290,191 | | | | 268,363 | | | | 279,358 | | | | 288,588 | | | | 296,373 | |
| | | | | |
Liabilities | | | | | | | | | | | | | | | | | | | | |
Payables | | | 4,223 | | | | 4,311 | | | | 4,329 | | | | 4,421 | | | | 4,510 | |
Superannuation liability | | | 25,593 | | | | 25,743 | | | | 26,033 | | | | 26,171 | | | | 26,176 | |
Other employee benefits | | | 5,135 | | | | 5,076 | | | | 5,340 | | | | 5,572 | | | | 5,858 | |
Deposits held | | | 20 | | | | 20 | | | | 20 | | | | 20 | | | | 20 | |
Advances received | | | 462 | | | | 462 | | | | 460 | | | | 457 | | | | 455 | |
Borrowing | | | 62,827 | | | | 52,839 | | | | 64,274 | | | | 73,451 | | | | 78,954 | |
Other liabilities | | | 3,367 | | | | 3,215 | | | | 3,240 | | | | 3,290 | | | | 3,380 | |
Total Liabilities | | | 101,627 | | | | 91,666 | | | | 103,695 | | | | 113,382 | | | | 119,353 | |
| | | | | |
Net Worth | | | 188,564 | | | | 176,697 | | | | 175,664 | | | | 175,206 | | | | 177,020 | |
Net Financial Worth | | | (67,583 | ) | | | (57,633 | ) | | | (68,856 | ) | | | (77,581 | ) | | | (82,328 | ) |
Net Financial Liabilities | | | 65,333 | | | | 54,629 | | | | 65,851 | | | | 74,576 | | | | 79,322 | |
Net Debt | | | 31,116 | | | | 20,378 | | | | 31,218 | | | | 39,690 | | | | 44,128 | |
Notes:
| 1. | Numbers may not add due to rounding. |
| 2. | Numbers have been restated where subsequent changes in classification have occurred. |
| | |
| | |
| Mid Year Fiscal and Economic Review 2010-11 | | 37 |
General Government Sector Cash Flow Statement 1
| | | | | | | | | | | | | | | | | | | | |
| | | 2010-11
Budget 2
$ million | | | 2010-11
Revised
$ million | | | 2011-12
Projection
$ million | | | 2012-13
Projection
$ million | | | 2013-14
Projection
$ million | |
Cash Receipts from Operating Activities | | | | | | | | | | | | | | | | | | | | |
Taxes received | | | 10,190 | | | | 9,765 | | | | 10,626 | | | | 11,527 | | | | 12,344 | |
Grants and subsidies received | | | 18,883 | | | | 20,840 | | | | 19,530 | | | | 20,324 | | | | 20,150 | |
Sales of goods and services | | | 4,485 | | | | 4,638 | | | | 4,778 | | | | 4,889 | | | | 5,112 | |
Interest receipts | | | 2,131 | | | | 2,128 | | | | 2,206 | | | | 2,267 | | | | 2,319 | |
Dividends and income tax equivalents | | | 1,062 | | | | 1,020 | | | | 1,257 | | | | 1,131 | | | | 1,288 | |
Other receipts | | | 4,832 | | | | 4,667 | | | | 4,930 | | | | 4,881 | | | | 4,729 | |
Total Operating Receipts | | | 41,582 | | | | 43,058 | | | | 43,327 | | | | 45,019 | | | | 45,942 | |
| | | | | |
Cash Payments for Operating Activities | | | | | | | | | | | | | | | | | | | | |
Payments for employees | | | (18,435 | ) | | | (18,419 | ) | | | (20,405 | ) | | | (21,174 | ) | | | (22,072 | ) |
Payments for goods and services | | | (9,298 | ) | | | (10,583 | ) | | | (11,045 | ) | | | (11,231 | ) | | | (9,766 | ) |
Grants and subsidies | | | (10,135 | ) | | | (10,116 | ) | | | (9,919 | ) | | | (9,964 | ) | | | (9,101 | ) |
Interest paid | | | (1,240 | ) | | | (1,158 | ) | | | (1,565 | ) | | | (2,037 | ) | | | (2,367 | ) |
Other payments | | | (738 | ) | | | (770 | ) | | | (681 | ) | | | (663 | ) | | | (694 | ) |
Total Operating Payments | | | (39,847 | ) | | | (41,047 | ) | | | (43,616 | ) | | | (45,068 | ) | | | (43,999 | ) |
| | | | | |
Net Cash Inflows from Operating Activities | | | 1,735 | | | | 2,012 | | | | (289 | ) | | | (49 | ) | | | 1,943 | |
| | | | | |
Cash Flows from Investments in Non-Financial Assets | | | | | | | | | | | | | | | | | | | | |
Purchases of non-financial assets | | | (8,335 | ) | | | (7,883 | ) | | | (7,328 | ) | | | (5,930 | ) | | | (4,763 | ) |
Sales of non-financial assets | | | 203 | | | | 211 | | | | 211 | | | | 314 | | | | 164 | |
Net Cash Flows from Investments in Non-financial Assets | | | (8,131 | ) | | | (7,672 | ) | | | (7,117 | ) | | | (5,616 | ) | | | (4,599 | ) |
| | | | | |
Net Cash Flows from Investments in Financial Assets for Policy Purposes | | | (1 | ) | | | 6,503 | | | | (748 | ) | | | (532 | ) | | | (569 | ) |
| | | | | |
Net Cash Flows from Investments in Financial Assets for Liquidity Purposes | | | (1,361 | ) | | | (1,378 | ) | | | (864 | ) | | | (782 | ) | | | (696 | ) |
| | | | | |
Receipts from Financing Activities | | | | | | | | | | | | | | | | | | | | |
Advances received (net) | | | (14 | ) | | | (6 | ) | | | (6 | ) | | | (6 | ) | | | (6 | ) |
Borrowing (net) | | | 7,629 | | | | 81 | | | | 8,928 | | | | 6,947 | | | | 3,898 | |
Net Cash Flows from Financing Activities | | | 7,615 | | | | 75 | | | | 8,922 | | | | 6,941 | | | | 3,892 | |
| | | | | |
Net Increase/(Decrease) in Cash held | | | (143 | ) | | | (460 | ) | | | (96 | ) | | | (38 | ) | | | (29 | ) |
| | | | | |
Net cash from operating activities | | | 1,735 | | | | 2,012 | | | | (289 | ) | | | (49 | ) | | | 1,943 | |
Net cash flows from investments in non-financial assets | | | (8,131 | ) | | | (7,672 | ) | | | (7,117 | ) | | | (5,616 | ) | | | (4,599 | ) |
Surplus/(Deficit) | | | (6,396 | ) | | | (5,660 | ) | | | (7,406 | ) | | | (5,665 | ) | | | (2,656 | ) |
| | | | | |
Derivation of ABS GFS Cash Surplus/Deficit | | | | | | | | | | | | | | | | | | | | |
Cash surplus/(deficit) | | | (6,396 | ) | | | (5,660 | ) | | | (7,406 | ) | | | (5,665 | ) | | | (2,656 | ) |
Acquisitions under finance leases and similar arrangements | | | (71 | ) | | | (71 | ) | | | (67 | ) | | | (15 | ) | | | (26 | ) |
ABS GFS Cash Surplus/(Deficit) Including Finance Leases and Similar Arrangements | | | (6,467 | ) | | | (5,731 | ) | | | (7,473 | ) | | | (5,680 | ) | | | (2,682 | ) |
Notes:
| 1. | Numbers may not add due to rounding. |
| 2. | Numbers have been restated where subsequent changes in classification have occurred. |
| | |
| | |
| Mid Year Fiscal and Economic Review 2010-11 | | 38 |
Public Non-financial Corporations Sector Cash Flow Statement 1
| | | | | | | | | | | | | | | | | | | | |
| | | 2010-11
Budget 2
$ million | | | 2010-11
Revised
$ million | | | 2011-12
Projection
$ million | | | 2012-13
Projection
$ million | | | 2013-14
Projection
$ million | |
Cash Receipts from Operating Activities | | | | | | | | | | | | | | | | | | | | |
Grants and subsidies received | | | 2,096 | | | | 2,221 | | | | 2,104 | | | | 2,135 | | | | 2,220 | |
Sales of goods and services | | | 11,329 | | | | 8,250 | | | | 8,110 | | | | 8,727 | | | | 9,457 | |
Interest receipts | | | 98 | | | | 116 | | | | 110 | | | | 99 | | | | 102 | |
Other receipts | | | 664 | | | | 698 | | | | 718 | | | | 740 | | | | 716 | |
Total Operating Receipts | | | 14,186 | | | | 11,285 | | | | 11,041 | | | | 11,702 | | | | 12,495 | |
| | | | | |
Cash Payments for Operating Activities | | | | | | | | | | | | | | | | | | | | |
Payments for employees | | | (2,605 | ) | | | (2,261 | ) | | | (1,928 | ) | | | (1,981 | ) | | | (2,042 | ) |
Payments for goods and services | | | (5,016 | ) | | | (4,071 | ) | | | (3,410 | ) | | | (3,519 | ) | | | (3,594 | ) |
Grants and subsidies | | | (31 | ) | | | (31 | ) | | | (12 | ) | | | (12 | ) | | | — | |
Interest paid | | | (2,535 | ) | | | (2,160 | ) | | | (2,256 | ) | | | (2,477 | ) | | | (2,609 | ) |
Other payments | | | (884 | ) | | | (927 | ) | | | (953 | ) | | | (909 | ) | | | (1,000 | ) |
Total Operating Payments | | | (11,071 | ) | | | (9,451 | ) | | | (8,559 | ) | | | (8,897 | ) | | | (9,245 | ) |
| | | | | |
Net Cash Inflows from Operating Activities | | | 3,115 | | | | 1,834 | | | | 2,482 | | | | 2,804 | | | | 3,250 | |
| | | | | |
Cash Flows from Investments in Non-Financial Assets | | | | | | | | | | | | | | | | | | | | |
Purchases of non-financial assets | | | (7,144 | ) | | | (5,849 | ) | | | (4,781 | ) | | | (4,891 | ) | | | (4,421 | ) |
Sales of non-financial assets | | | 184 | | | | 572 | | | | 116 | | | | 223 | | | | 42 | |
Net Cash Flows from Investments in Non-financial Assets | | | (6,961 | ) | | | (5,277 | ) | | | (4,665 | ) | | | (4,669 | ) | | | (4,378 | ) |
| | | | | |
Net Cash Flows from Investments in Financial Assets for Policy Purposes | | | 445 | | | | 2,394 | | | | (18 | ) | | | (22 | ) | | | (10 | ) |
| | | | | |
Net Cash Flows from Investments in Financial Assets for Liquidity Purposes | | | 6 | | | | (13 | ) | | | 3 | | | | 3 | | | | 5 | |
| | | | | |
Receipts from Financing Activities | | | | | | | | | | | | | | | | | | | | |
Advances received (net) | | | — | | | | (1 | ) | | | (1 | ) | | | (1 | ) | | | (1 | ) |
Borrowing (net) | | | 3,414 | | | | 1,571 | | | | 2,413 | | | | 2,231 | | | | 1,603 | |
Dividends paid | | | (856 | ) | | | (702 | ) | | | (913 | ) | | | (817 | ) | | | (912 | ) |
Other financing (net) | | | 417 | | | | (542 | ) | | | 678 | | | | 478 | | | | 544 | |
Net Cash Flows from Financing Activities | | | 2,975 | | | | 326 | | | | 2,178 | | | | 1,891 | | | | 1,234 | |
| | | | | |
Net Increase/(Decrease) in Cash held | | | (420 | ) | | | (735 | ) | | | (19 | ) | | | 8 | | | | 102 | |
| | | | | |
Net cash from operating activities | | | 3,115 | | | | 1,834 | | | | 2,482 | | | | 2,804 | | | | 3,250 | |
Net cash flows from investments in non-financial assets | | | (6,961 | ) | | | (5,277 | ) | | | (4,665 | ) | | | (4,669 | ) | | | (4,378 | ) |
Dividends paid | | | (856 | ) | | | (702 | ) | | | (913 | ) | | | (817 | ) | | | (912 | ) |
Surplus/(Deficit) | | | (4,702 | ) | | | (4,146 | ) | | | (3,096 | ) | | | (2,681 | ) | | | (2,041 | ) |
| | | | | |
Derivation of ABS GFS Cash Surplus/Deficit | | | | | | | | | | | | | | | | | | | | |
Cash surplus/(deficit) | | | (4,702 | ) | | | (4,146 | ) | | | (3,096 | ) | | | (2,681 | ) | | | (2,041 | ) |
Acquisitions under finance leases and similar arrangements | | | — | | | | (4 | ) | | | (16 | ) | | | (15 | ) | | | (15 | ) |
ABS GFS Cash Surplus/(Deficit) Including Finance Leases and Similar Arrangements | | | (4,702 | ) | | | (4,149 | ) | | | (3,111 | ) | | | (2,697 | ) | | | (2,056 | ) |
Notes:
| 1. | Numbers may not add due to rounding. |
| 2. | Numbers have been restated where subsequent changes in classification have occurred. |
| | |
| | |
| Mid Year Fiscal and Economic Review 2010-11 | | 39 |
Non-financial Public Sector Cash Flow Statement 1
| | | | | | | | | | | | | | | | | | | | |
| | | 2010-11
Budget 2
$ million | | | 2010-11
Revised
$ million | | | 2011-12
Projection
$ million | | | 2012-13
Projection
$ million | | | 2013-14
Projection
$ million | |
Cash Receipts from Operating Activities | | | | | | | | | | | | | | | | | | | | |
Taxes received | | | 9,853 | | | | 9,490 | | | | 10,328 | | | | 11,172 | | | | 11,961 | |
Grants and subsidies received | | | 18,928 | | | | 21,148 | | | | 19,659 | | | | 20,468 | | | | 20,305 | |
Sales of goods and services | | | 15,480 | | | | 12,552 | | | | 12,558 | | | | 13,268 | | | | 14,195 | |
Interest receipts | | | 2,229 | | | | 2,244 | | | | 2,315 | | | | 2,367 | | | | 2,421 | |
Dividends and income tax equivalents | | | 33 | | | | 39 | | | | 23 | | | | 26 | | | | 32 | |
Other receipts | | | 5,493 | | | | 5,362 | | | | 5,648 | | | | 5,621 | | | | 5,445 | |
Total Operating Receipts | | | 52,015 | | | | 50,835 | | | | 50,532 | | | | 52,920 | | | | 54,358 | |
| | | | | |
Cash Payments for Operating Activities | | | | | | | | | | | | | | | | | | | | |
Payments for employees | | | (20,920 | ) | | | (20,571 | ) | | | (22,237 | ) | | | (23,051 | ) | | | (24,002 | ) |
Payments for goods and services | | | (13,994 | ) | | | (14,332 | ) | | | (14,137 | ) | | | (14,413 | ) | | | (12,996 | ) |
Grants and subsidies | | | (8,128 | ) | | | (8,247 | ) | | | (7,969 | ) | | | (7,998 | ) | | | (7,050 | ) |
Interest paid | | | (3,583 | ) | | | (3,168 | ) | | | (3,634 | ) | | | (4,278 | ) | | | (4,723 | ) |
Other payments | | | (1,396 | ) | | | (1,375 | ) | | | (1,275 | ) | | | (1,244 | ) | | | (1,307 | ) |
Total Operating Payments | | | (48,022 | ) | | | (47,693 | ) | | | (49,253 | ) | | | (50,983 | ) | | | (50,079 | ) |
| | | | | |
Net Cash Inflows from Operating Activities | | | 3,993 | | | | 3,142 | | | | 1,279 | | | | 1,937 | | | | 4,280 | |
| | | | | |
Cash Flows from Investments in Non-Financial Assets | | | | | | | | | | | | | | | | | | | | |
Purchases of non-financial assets | | | (15,479 | ) | | | (13,731 | ) | | | (12,108 | ) | | | (10,822 | ) | | | (9,184 | ) |
Sales of non-financial assets | | | 387 | | | | 783 | | | | 327 | | | | 537 | | | | 207 | |
Net Cash Flows from Investments in Non-financial Assets | | | (15,092 | ) | | | (12,948 | ) | | | (11,781 | ) | | | (10,285 | ) | | | (8,977 | ) |
| | | | | |
Net Cash Flows from Investments in Financial Assets for Policy Purposes | | | 851 | | | | 8,359 | | | | (87 | ) | | | (76 | ) | | | (35 | ) |
| | | | | |
Net Cash Flows from Investments in Financial Assets for Liquidity Purposes | | | (1,355 | ) | | | (1,391 | ) | | | (861 | ) | | | (779 | ) | | | (690 | ) |
| | | | | |
Receipts from Financing Activities | | | | | | | | | | | | | | | | | | | | |
Advances received (net) | | | (14 | ) | | | (6 | ) | | | (6 | ) | | | (6 | ) | | | (6 | ) |
Borrowing (net) | | | 11,043 | | | | 1,651 | | | | 11,340 | | | | 9,177 | | | | 5,501 | |
Other financing (net) | | | 9 | | | | (3 | ) | | | — | | | | 1 | | | | — | |
Net Cash Flows from Financing Activities | | | 11,038 | | | | 1,642 | | | | 11,335 | | | | 9,172 | | | | 5,494 | |
| | | | | |
Net Increase/(Decrease) in Cash held | | | (565 | ) | | | (1,196 | ) | | | (116 | ) | | | (31 | ) | | | 72 | |
| | | | | |
Net cash from operating activities | | | 3,993 | | | | 3,142 | | | | 1,279 | | | | 1,937 | | | | 4,280 | |
Net cash flows from investments in non-financial assets | | | (15,092 | ) | | | (12,948 | ) | | | (11,781 | ) | | | (10,285 | ) | | | (8,977 | ) |
Surplus/(Deficit) | | | (11,099 | ) | | | (9,806 | ) | | | (10,503 | ) | | | (8,347 | ) | | | (4,698 | ) |
| | | | | |
Derivation of ABS GFS Cash Surplus/Deficit | | | | | | | | | | | | | | | | | | | | |
Cash surplus/(deficit) | | | (11,099 | ) | | | (9,806 | ) | | | (10,503 | ) | | | (8,347 | ) | | | (4,698 | ) |
Acquisitions under finance leases and similar arrangements | | | (71 | ) | | | (75 | ) | | | (82 | ) | | | (30 | ) | | | (41 | ) |
ABS GFS Cash Surplus/(Deficit) Including Finance Leases and Similar Arrangements | | | (11,170 | ) | | | (9,881 | ) | | | (10,585 | ) | | | (8,378 | ) | | | (4,738 | ) |
Notes:
| 1. | Numbers may not add due to rounding. |
| 2. | Numbers have been restated where subsequent changes in classification have occurred. |
| | |
| | |
| Mid Year Fiscal and Economic Review 2010-11 | | 40 |
Loan Council Allocation
Loan Council Allocation1
| | | | | | | | | | |
| | | | | 2010-11
Budget
$ million | | | 2010-11
Revised
$ million | |
| | General Government sector cash deficit/(surplus)2 | | | 6,396 | | | | 5,660 | |
| | PNFC sector cash deficit/(surplus)2 | | | 4,702 | | | | 4,146 | |
| | | |
| | Non Financial Public Sector cash deficit/(surplus)2 | | | 11,099 | | | | 9,806 | |
| | Acquisitions under finance leases and similar arrangements3 | | | (71 | ) | | | (75 | ) |
| | | |
Equals | | ABS GFS cash deficit/(surplus) | | | 11,170 | | | | 9,881 | |
Less | | Net cash flows from investments in financial assets for policy purposes | | | 851 | | | | 8,359 | |
| | | |
Plus | | Memorandum Items4 | | | 1,234 | | | | 1,234 | |
| | | |
| | Loan Council Allocation | | | 11,553 | | | | 2,756 | |
Notes:
| 1. | Numbers may not add due to rounding. |
| 2. | Figures in brackets represent surpluses. |
| 3. | Finance leases are shown with a negative sign as they are deducted in compiling the ABS GFS cash deficit/surplus. |
| 4. | Memorandum items include operating leases and local government borrowings. |
The revised LCA is outside the 2% tolerance level mainly due to the proceeds from the QR National and Port of Brisbane transactions being utilised to reduce borrowings.
| | |
| | |
| Mid Year Fiscal and Economic Review 2010-11 | | 41 |
TAXATION AND ROYALTY REVENUE – 2009-10 TO 2013-14
Taxation and royalty revenue1
| | | | | | | | | | | | | | | | | | | | | | | | |
| | | 2009-10
Actual
$ million | | | 2010-11
Budget
$ million | | | 2010-11
Revised
$ million | | | 2011-12
Revised
$ million | | | 2012-13
Revised
$ million | | | 2013-14
Revised
$ million | |
Payroll tax | | | 2,687 | | | | 2,888 | | | | 2,930 | | | | 3,213 | | | | 3,506 | | | | 3,830 | |
Transfer duty | | | 1,978 | | | | 2,229 | | | | 1,885 | | | | 2,175 | | | | 2,497 | | | | 2,725 | |
Other duties | | | 867 | | | | 954 | | | | 942 | | | | 1,001 | | | | 1,057 | | | | 1,116 | |
Gambling taxes and levies | | | 927 | | | | 964 | | | | 954 | | | | 983 | | | | 1,013 | | | | 1,043 | |
Land tax | | | 1,033 | | | | 1,117 | | | | 1,052 | | | | 1,136 | | | | 1,206 | | | | 1,278 | |
Motor vehicle registration | | | 1,252 | | | | 1,311 | | | | 1,311 | | | | 1,364 | | | | 1,418 | | | | 1,475 | |
Other taxes | | | 631 | | | | 728 | | | | 692 | | | | 756 | | | | 833 | | | | 879 | |
Total taxation revenue | | | 9,375 | | | | 10,192 | | | | 9,766 | | | | 10,627 | | | | 11,528 | | | | 12,345 | |
| | | | | | |
Royalties | | | | | | | | | | | | | | | | | | | | | | | | |
Coal | | | 1,756 | | | | 2,766 | | | | 2,466 | | | | 2,787 | | | | 2,722 | | | | 2,533 | |
Other royalties and land rents | | | 392 | | | | 477 | | | | 491 | | | | 562 | | | | 561 | | | | 582 | |
Total Royalties | | | 2,148 | | | | 3,243 | | | | 2,957 | | | | 3,349 | | | | 3,283 | | | | 3,115 | |
Note:
| 1. | Numbers may not add due to rounding. |
| | |
| | |
| Mid Year Fiscal and Economic Review 2010-11 | | 42 |

Queensland
Government
State Budget 2010–11
Mid Year Fiscal and Economic Review
www.treasury.qld.gov.au