EXHIBIT (c)(vii)
The Queensland Treasury Corporation Half Year Report for the
half year ended December 31, 2010
AUDAX AT FIDELIS
QUEENSLAND
TREASURY
CORPORATION
QUEENSLAND TREASURY CORPORATION
HALF-YEARLY REPORT DECEMBER 2010
QUEENSLAND TREASURY CORPORATION
HALF-YEARLY REPORT DECEMBER 2010
Contents
Queensland Treasury Corporation 1
Five-year Business Summary 2
Chairman’s Report 4
Half-year Financial Statements 7
Management Report 24
Appendix A: Loans to Clients 25
Appendix B: Partners in Financial Markets 30
Appendix C: QTC’s 2010-11 Indicative Borrowing Program 32
Appendix D: Corporate Directory 33
Vision
Partners in financial sustainability.
Mission
To create and deliver unique and relevant value for the Queensland public sector.
Values
We focus on our clients, are passionate about Queensland, value and respect our people, are collaborative and seek continuous improvement and, above all else, we value integrity.
Queensland Treasury Corporation
Queensland Treasury Corporation is the Queensland Government’s central financing authority and corporate treasury services provider, with responsibility for:
sourcing and managing the debt funding to finance Queensland’s infrastructure requirements in the most cost-effective manner
providing financial and risk management advice to the Queensland Government and its Queensland public sector clients on financial risk issues, and
investing the State’s short- to medium-term cash surpluses, to maximise returns to clients through a conservative risk management framework.
QTC does not formulate policy, but works within the policy frameworks developed by the Government and Queensland Treasury. QTC’s role is not to take direct equity in projects, however, it may, at the direction of the Government, invest equity in special purpose vehicles established to achieve a specific outcome for the State.
Debt funding and management
QTC borrows funds in the domestic and international markets in a manner that minimises the State’s, and QTC’s, liquidity and refinancing risk. We then lend these funds to our clients, or use them to manage our clients’ debt or to refinance maturing debt. With responsibility for all of the State’s debt raising, QTC is able to capture significant economies of scale and scope in the issuance, management and administration of debt.
Financial advisory and risk management services
QTC works closely with its public sector clients to assist in managing their risk in financial transactions and achieve the best financial solutions for their organisations and for Queensland. In assisting clients, QTC does not provide advice that is contrary to the interests of the State. We encourage our clients and Queensland Treasury, our major stakeholder, to use our organisation as an extension of their resources, by:
providing them with low cost access to professional skills and resources to ensure that their financial risks are identified and managed on a consistent basis
acting as a central store of knowledge and expertise on financial structures and transactions, and the risks and benefits they encompass
providing Queensland Treasury with advice on matters of financial and commercial policy and risk relating to the State and its entities
working as a conduit between the Government and the private sector, and
using our economies of scale and scope to ensure that the best possible solutions are obtained.
Short- to medium-term investments
QTC uses its financial markets expertise, developed through strong relationships with the domestic and international markets, together with its understanding of debt management and the management of financial risk, to provide clients with investment solutions that achieve a high return within a conservative risk environment. Clients can choose from an overnight facility, a managed short-term fund or fixed-term facilities. Alternatively, we can assist them to source appropriate solutions from the marketplace.
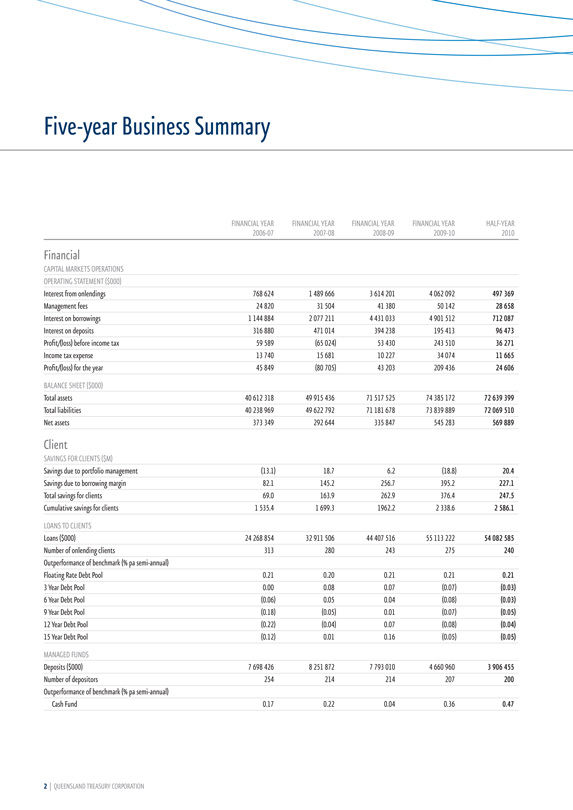
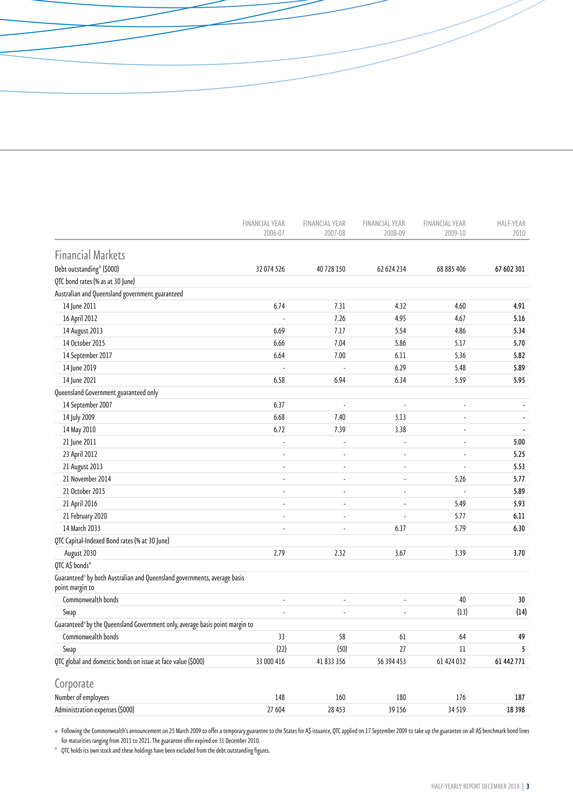
Five-year Business Summary
FINANCIAL YEAR FINANCIAL YEAR FINANCIAL YEAR FINANCIAL YEAR HALF-YEAR
2006-07 2007-08 2008-09 2009-10 2010
Financial
CAPITAL MARKETS OPERATIONS
OPERATING STATEMENT ($000)
Interest from onlendings 768 624 1 489 666 3 614 201 4 062 092 497 369
Management fees 24 820 31 504 41 380 50 142 28 658
Interest on borrowings 1 144 884 2 077 211 4 431 033 4 901 512 712 087
Interest on deposits 316 880 471 014 394 238 195 413 96 473
Profit/(loss) before income tax 59 589 (65 024) 53 430 243 510 36 271
Income tax expense 13 740 15 681 10 227 34 074 11 665
Profit/(loss) for the year 45 849 (80 705) 43 203 209 436 24 606
BALANCE SHEET ($000)
Total assets 40 612 318 49 915 436 71 517 525 74 385 172 72 639 399
Total liabilities 40 238 969 49 622 792 71 181 678 73 839 889 72 069 510
Net assets 373 349 292 644 335 847 545 283 569 889
Client
SAVINGS FOR CLIENTS ($M)
Savings due to portfolio management (13.1) 18.7 6.2 (18.8) 20.4
Savings due to borrowing margin 82.1 145.2 256.7 395.2 227.1
Total savings for clients 69.0 163.9 262.9 376.4 247.5
Cumulative savings for clients 1 535.4 1 699.3 1962.2 2 338.6 2 586.1
LOANS TO CLIENTS
Loans ($000) 24 268 854 32 911 506 44 407 516 55 113 222 54 082 585
Number of onlending clients 313 280 243 275 240
Outperformance of benchmark (% pa semi-annual)
Floating Rate Debt Pool 0.21 0.20 0.21 0.21 0.21
3 Year Debt Pool 0.00 0.08 0.07 (0.07) (0.03)
6 Year Debt Pool (0.06) 0.05 0.04 (0.08) (0.03)
9 Year Debt Pool (0.18) (0.05) 0.01 (0.07) (0.05)
12 Year Debt Pool (0.22) (0.04) 0.07 (0.08) (0.04)
15 Year Debt Pool (0.12) 0.01 0.16 (0.05) (0.05)
MANAGED FUNDS
Deposits ($000) 7 698 426 8 251 872 7 793 010 4 660 960 3 906 455
Number of depositors 254 214 214 207 200
Outperformance of benchmark (% pa semi-annual)
Cash Fund 0.17 0.22 0.04 0.36 0.47
2 | QUEENSLAND TREASURY CORPORATION
FINANCIAL YEAR FINANCIAL YEAR FINANCIAL YEAR FINANCIAL YEAR HALF-YEAR 2006-07 2007-08 2008-09 2009-10 2010
Financial Markets
Debt outstanding* ($000) 32 074 526 40 728 150 62 624 234 68 885 406 67 602 301
QTC bond rates (% as at 30 June)
Australian and Queensland government guaranteed
14 June 2011 6.74 7.31 4.32 4.60 4.91
16 April 2012 - 7.26 4.95 4.67 5.16
14 August 2013 6.69 7.17 5.54 4.86 5.34
14 October 2015 6.66 7.04 5.86 5.17 5.70
14 September 2017 6.64 7.00 6.11 5.36 5.82
14 June 2019 - - 6.29 5.48 5.89
14 June 2021 6.58 6.94 6.34 5.59 5.95
Queensland Government guaranteed only
14 September 2007 6.37 - - - -
14 July 2009 6.68 7.40 3.13 - -
14 May 2010 6.72 7.39 3.38 - -
21 June 2011 - - - - 5.00
23 April 2012 - - - - 5.25
21 August 2013 - - - - 5.53
21 November 2014 - - - 5.26 5.77
21 October 2015 - - - - 5.89
21 April 2016 - - - 5.49 5.93
21 February 2020 - - - 5.77 6.11
14 March 2033 - - 6.37 5.79 6.30
QTC Capital-Indexed Bond rates (% at 30 June)
August 2030 2.79 2.32 3.67 3.39 3.70
QTC A$ bonds*
Guaranteed+ by both Australian and Queensland governments, average basis point margin to
Commonwealth bonds - - - 40 30
Swap - - - (13) (14)
Guaranteed+ by the Queensland Government only, average basis point margin to
Commonwealth bonds 33 58 61 64 49
Swap (22) (50) 27 11 5
QTC global and domestic bonds on issue at face value ($000) 33 000 416 41 833 356 56 394 453 61 424 032 61 442 771
Corporate
Number of employees 148 160 180 176 187
Administration expenses ($000) 27 604 28 453 39 156 34 519 18 398
+ Following the Commonwealth’s announcement on 25 March 2009 to offer a temporary guarantee to the States for A$ issuance, QTC applied on 17 September 2009 to take up the guarantee on all A$ benchmark bond lines for maturities ranging from 2011 to 2021. The guarantee offer expired on 31 December 2010.
* QTC holds its own stock and these holdings have been excluded from the debt outstanding figures.
HALF-YEARLY REPORT DECEMBER 2010 | 3
Chairman’s Report
Stephen Rochester
Chairman
QTC ALSO ACHIEVED QUANTIFIABLE SAVINGS FOR CUSTOMERS AND THE STATE OF $247.5 MILLION, PRINCIPALLY THROUGH ITS ABILITY TO ADD VALUE THROUGH THE MANAGEMENT OF BORROWING MARGINS.
As economic activity around the world improves, despite significant and as yet unresolved structural issues, Queensland Treasury Corporation has successfully and progressively raised and managed its funding to meet the State’s requirements through its borrowing program, which was recently revised from $18 billion to $15 billion for the 2010-11 financial year.
With its new operating model and structure embedded, QTC’s employees have demonstrated a responsive and flexible approach to their partnerships with Queensland public sector organisations, helping ensure the ongoing delivery of better financial outcomes across the State.
For the half-year ended 31 December 2010, we achieved an accounting profit from our capital markets operations of $24.6 million (2009: $143.5 million). The reduction in profit for the current period was primarily due to the write-back of fair value accounting losses in the prior comparative period. Separate from our capital markets operations, the long term assets operations recorded a profit of $915.0 million (2009: $1,279.6 million).
The long term assets segment comprises the investments that fund the State’s superannuation and other long-term obligations that were transferred to QTC by the State Government under an administrative arrangement. In return, QTC issued the State with a fixed-rate note that provides the State with a fixed rate of return, while QTC bears the impact of fluctuations in the value and returns on the asset portfolio. These assets continue to be managed by Queensland Investment Corporation. The accumulated losses incurred by the long term assets segment to date have no impact on QTC’s capacity to meet its obligations, as there is no cash flow effect for QTC. In addition, under the Queensland Treasury Corporation Act 1988, any QTC losses are the responsibility of the Consolidated Fund of the Queensland Government.
QTC also achieved quantifiable savings for customers and the State of $247.5 million, principally through its ability to add value through the management of borrowing margins.
While the first few months of the 2010-11 financial year were relatively uneventful, November and December brought significant flooding events to much of the State. In early January, substantial rainfall also caused damaging flooding to the north-west of the State’s capital city, which ultimately culminated in considerable flooding across parts of the south-eastern corner of Queensland.
January also brought a category five tropical cyclone to the coast off Cairns in the north of the State. The cyclone caused extensive damage to a number of small communities and regional industries in the Cassowary Coast region; prioritised rebuilding work is now underway in the far north and south east corner of the State to support affected communities as they begin to rebuild their lives.
4 | QUEENSLAND TREASURY CORPORATION
Within Australia, economic recovery continues and the underlying fundamentals of the Queensland and Australian economy remain strong with continued commodities demand from the Asia Pacific region underpinning a large pipeline of investment in the resources sector.
While the damage following the floods and cyclone events is expected to lead to a slowdown in economic growth in Queensland for the 2010-11 financial year, a rebound in 2011-12 is anticipated as the rebuilding effort across the State escalates.
Volatile but improved economic conditions internationally have led to an improvement in confidence, which has seen increased global investment flows to Australia and Queensland.
In the first half of the financial year, and as this process of global markets rebalancing occurred, we continued our preparations for the planned withdrawal on 31 December 2010 of the Australian Government Guarantee (AGG) for any new debt issuance. In doing so, QTC has focused its funding task on the establishment of liquid AUD benchmark bond lines guaranteed solely by the Queensland State Government, establishing seven new State Government guaranteed AUD benchmark bond lines in 2010 to fill maturity gaps and complement existing AGG maturities.
As the year progresses, investor support has continued for Queensland as demonstrated through the well-received 15 February issue of $4 billion of QTC’s eighth new State Government guaranteed domestic benchmark bond, maturing in 2018. With strong balance sheet demand and fund manager participation, the issue was very successful and equalled the record size for a syndicated AUD bond issue, which was achieved by QTC in 2010. As a result of this and other issuance, QTC is well past its halfway mark for this year’s borrowing program.
On a final note, and on behalf of the Board, it has been my great pleasure to welcome QTC’s new Chief Executive, Philip Noble, who joined us on 1 December 2010. Another recent change saw Neil Castles, QTC’s General Manager of Risk – who had been with us for more than 23 years – take on a high-profile new challenge as the Queensland Department of Health’s Deputy Director General of Finance, Procurement and Legal Services. While we are sure to miss his expertise within QTC, we look forward to continuing our work with him in his new role and thank him for his contribution to QTC.
As the State faces its significant rebuilding task ahead, I am confident that, with Philip’s leadership and expertise, QTC and its talented and capable employees will continue to achieve the best financial outcomes for the State of Queensland.
STEPHEN ROCHESTER
Chairman
WITH STRONG BALANCE SHEET DEMAND AND FUND MANAGER PARTICIPATION, THE ISSUE WAS VERY SUCCESSFUL AND EQUALLED THE RECORD SIZE FOR A SYNDICATED AUD BOND ISSUE, WHICH WAS ACHIEVED BY QTC IN 2010.
HALF-YEARLY REPORT DECEMBER 2010 | 5

6 | QUEENSLAND TREASURY CORPORATION
Financial Statements FOR THE HALF-YEAR ENDED 31 DECEMBER 2010
Contents
Statement of Comprehensive Income 8
Balance Sheet 9
Statement of Changes in Equity 10
Statement of Cash Flows 11
Notes to and forming part of the Financial Statements 12
Certificate of the Queensland Treasury Corporation 22
Independent Auditor’s Review Report 23
HALF-YEARLY REPORT DECEMBER 2010 | 7

Statement of Comprehensive Income FOR THE HALF-YEAR ENDED 31 DECEMBER 2010
31 DECEMBER 2010 31 DECEMBER 2009 NOTE $000 $000
Capital markets operations
NET INTEREST INCOME
Interest income 4 825 709 1 683 154
Interest expense 4 (808 560) (1 540 555)
17 149 142 599
OTHER INCOME
Fees – management 6 28 658 24 945
Fees – professional 246 399
Fees – other 226 232
Amortisation of cross border lease deferred income 3 219 4 299
Lease income 15 666 9 739
48 015 39 614
EXPENSES
Administration expenses (18 398) (15 696)
Depreciation on leased assets (10 521) (6 717)
Loss on sale of property, plant and equipment - (70)
Provisions – cooperative housing societies (18) (13)
(28 937) (22 496)
Share of associate’s net profit 44 115
Profit from capital markets operations before income tax 36 271 159 832
Income tax expense (11 665) (16 300)
Profit from capital markets operations after income tax 24 606 143 532
Long term assets
NET RETURN FROM INVESTMENTS IN LONG TERM ASSETS
Net change in fair value of unit trusts 5 1 811 261 2 116 607
Interest on fixed rate note (875 438) (819 056)
Management fees (20 827) (17 905)
Profit from long term assets 914 996 1 279 646
Total net profit for the period after tax 939 602 1 423 178
Total comprehensive income attributable to the owners 939 602 1 423 178
TOTAL COMPREHENSIVE INCOME DERIVED FROM:
Capital markets operations 3 24 606 143 532
Long term assets 3 914 996 1 279 646
Total comprehensive income 939 602 1 423 178
The accompanying notes form part of these financial statements.
Note: Throughout these financial statements the capital markets operations and the long term assets operations have been disclosed separately to distinguish between QTC’s main central treasury management role and its additional responsibilities following the transfer of the State’s superannuation and other long term assets on 1 July 2008 (refer notes 1 and 3).
8 | QUEENSLAND TREASURY CORPORATION
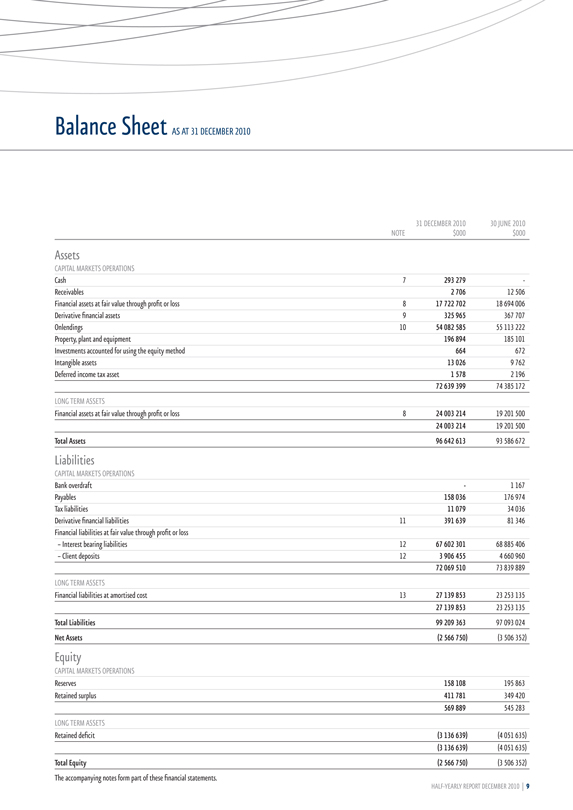
Balance Sheet AS AT 31 DECEMBER 2010
31 DECEMBER 2010 30 JUNE 2010 NOTE $000 $000
Assets
CAPITAL MARKETS OPERATIONS
Cash 7 293 279 -
Receivables 2 706 12 506
Financial assets at fair value through profit or loss 8 17 722 702 18 694 006
Derivative financial assets 9 325 965 367 707
Onlendings 10 54 082 585 55 113 222
Property, plant and equipment 196 894 185 101
Investments accounted for using the equity method 664 672
Intangible assets 13 026 9 762
Deferred income tax asset 1 578 2 196
72 639 399 74 385 172
LONG TERM ASSETS
Financial assets at fair value through profit or loss 8 24 003 214 19 201 500
24 003 214 19 201 500
Total Assets 96 642 613 93 586 672
Liabilities
CAPITAL MARKETS OPERATIONS
Bank overdraft - 1 167
Payables 158 036 176 974
Tax liabilities 11 079 34 036
Derivative financial liabilities 11 391 639 81 346
Financial liabilities at fair value through profit or loss
– Interest bearing liabilities 12 67 602 301 68 885 406
– Client deposits 12 3 906 455 4 660 960
72 069 510 73 839 889
LONG TERM ASSETS
Financial liabilities at amortised cost 13 27 139 853 23 253 135
27 139 853 23 253 135
Total Liabilities 99 209 363 97 093 024
Net Assets (2 566 750) (3 506 352)
Equity
CAPITAL MARKETS OPERATIONS
Reserves 158 108 195 863
Retained surplus 411 781 349 420
569 889 545 283
LONG TERM ASSETS
Retained deficit (3 136 639) (4 051 635)
(3 136 639) (4 051 635)
Total Equity (2 566 750) (3 506 352)
The accompanying notes form part of these financial statements.
HALF-YEARLY REPORT DECEMBER 2010 | 9
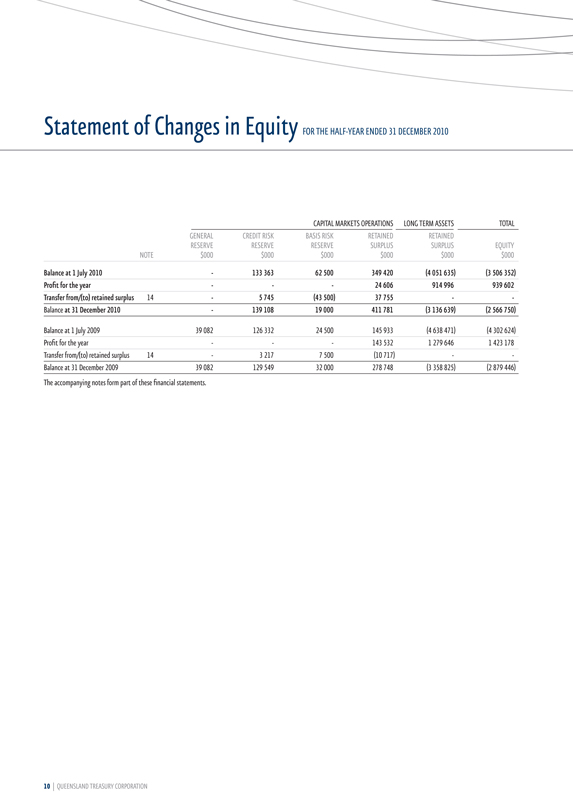
Statement of Changes in Equity FOR THE HALF-YEAR ENDED 31 DECEMBER 2010
CAPITAL MARKETS OPERATIONS LONG TERM ASSETS TOTAL
GENERAL CREDIT RISK BASIS RISK RETAINED RETAINED RESERVE RESERVE RESERVE SURPLUS SURPLUS EQUITY NOTE $000 $000 $000 $000 $000 $000
Balance at 1 July 2010 - 133 363 62 500 349 420 (4 051 635) (3 506 352)
Profit for the year - - - 24 606 914 996 939 602
Transfer from/(to) retained surplus 14 - 5 745 (43 500) 37 755 - -
Balance at 31 December 2010 - 139 108 19 000 411 781 (3 136 639) (2 566 750)
Balance at 1 July 2009 39 082 126 332 24 500 145 933 (4 638 471) (4 302 624)
Profit for the year - - - 143 532 1 279 646 1 423 178
Transfer from/(to) retained surplus 14 - 3 217 7 500 (10 717) - -
Balance at 31 December 2009 39 082 129 549 32 000 278 748 (3 358 825) (2 879 446)
The accompanying notes form part of these financial statements.
10 | QUEENSLAND TREASURY CORPORATION
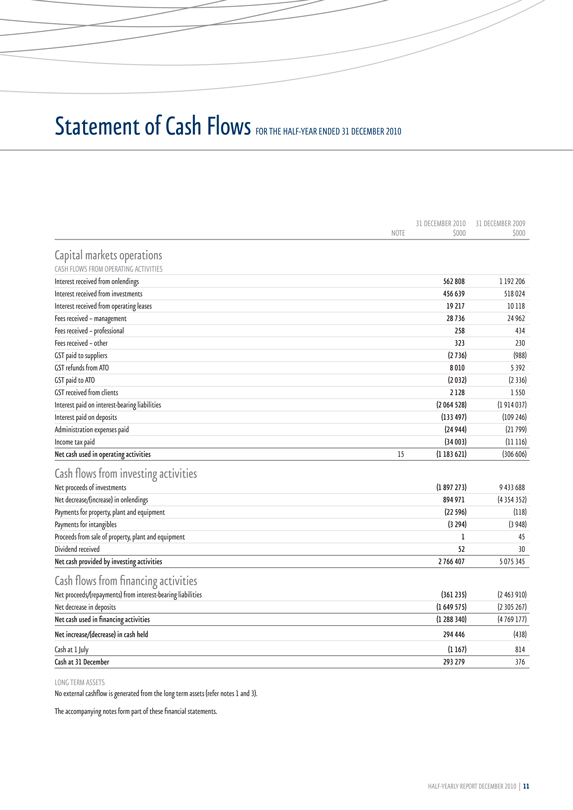
Statement of Cash Flows FOR THE HALF-YEAR ENDED 31 DECEMBER 2010
31 DECEMBER 2010 31 DECEMBER 2009 NOTE $000 $000
Capital markets operations
CASH FLOWS FROM OPERATING ACTIVITIES
Interest received from onlendings 562 808 1 192 206
Interest received from investments 456 639 518 024
Interest received from operating leases 19 217 10 118
Fees received – management 28 736 24 962
Fees received – professional 258 434
Fees received – other 323 230
GST paid to suppliers (2 736) (988)
GST refunds from ATO 8 010 5 392
GST paid to ATO (2 032) (2 336)
GST received from clients 2 128 1 550
Interest paid on interest-bearing liabilities (2 064 528) (1 914 037)
Interest paid on deposits (133 497) (109 246)
Administration expenses paid (24 944) (21 799)
Income tax paid (34 003) (11 116)
Net cash used in operating activities 15 (1 183 621) (306 606)
Cash flows from investing activities
Net proceeds of investments (1 897 273) 9 433 688
Net decrease/(increase) in onlendings 894 971 (4 354 352)
Payments for property, plant and equipment (22 596) (118)
Payments for intangibles (3 294) (3 948)
Proceeds from sale of property, plant and equipment 1 45
Dividend received 52 30
Net cash provided by investing activities 2 766 407 5 075 345
Cash flows from financing activities
Net proceeds/(repayments) from interest-bearing liabilities (361 235) (2 463 910)
Net decrease in deposits (1 649 575) (2 305 267)
Net cash used in financing activities (1 288 340) (4 769 177)
Net increase/(decrease) in cash held 294 446 (438)
Cash at 1 July (1 167) 814
Cash at 31 December 293 279 376
LONG TERM ASSETS
No external cashflow is generated from the long term assets (refer notes 1 and 3).
The accompanying notes form part of these financial statements.
HALF-YEARLY REPORT DECEMBER 2010 | 11
Notes to and Forming Part of the Financial Statements
FOR THE HALF-YEAR ENDED 31 DECEMBER 2010
1. General information
Queensland Treasury Corporation (QTC) is constituted under the Queensland Treasury Corporation Act 1988 (the Act), with the Under Treasurer designated as the Corporation Sole under section 5(2) of the Act.
QTC is the State’s central financing authority and corporate treasury services provider, with responsibility for providing debt funding, liability management, cash management and financial risk management advice to public sector clients. These services, which form part of QTC’s Capital Markets Operations segment, are undertaken on a cost-recovery basis with QTC lending at an interest rate based on its cost of funds and with the benefits/costs of liability and asset management being passed on to its clients being Queensland public sector entities.
The majority of QTC’s profits from its Capital Markets Operations are generated as a result of interest earned from the investment of QTC’s equity. QTC ensures that in undertaking its capital markets activities it has adequate capital to manage its risks.
QTC holds a portfolio of assets which were transferred to QTC by the State Government under an administrative arrangement. These assets are the investments of QTC’s Long Term Assets segment and were accumulated to fund superannuation and other long-term obligations of the State such as insurance and long service leave. In return, QTC issued to the State a fixed rate note which has resulted in the State receiving a fixed rate of return on the note, while QTC bears the impact of fluctuations in the value and returns on the asset portfolio (refer notes 3 and 5).
The Long Term Asset Advisory Board is responsible for the oversight of the Long Term Assets which do not form part of QTC’s day-to-day Capital Markets Operations. The Long Term Assets are held in unit trusts managed by QIC Limited (QIC).
Although there is no domestic requirement for the preparation of half-year financial statements, in order to meet offshore requirements and to better meet the needs of users of QTC’s financial information, an interim general purpose financial report has been prepared.
The half-year financial report does not include all notes of the type normally included within the annual financial report and therefore cannot be expected to provide as full an understanding of the financial performance, financial position and financing and investing activities of the entity as the full financial report. It should be read in conjunction with the annual financial report of QTC as at 30 June 2010.
2. Summary of significant accounting policies
(A) BASIS OF PREPARATION
These general purpose financial statements for the half-year ended 31 December 2010 have been prepared in accordance with the requirements of the Financial Accountability Act 2009 and AASB 134: Interim Financial Reporting.
COMPLIANCE WITH INTERNATIONAL FINANCIAL REPORTING STANDARDS
The financial statements of QTC comply with Australian Accounting Standards and International Financial Reporting Standards as issued by the International Accounting Standards Board. QTC is designated as a not-for-profit entity, however, the Corporation has elected to comply with the requirements of International Financial Reporting Standards (IFRS) as if it is a for-profit entity.
BASIS OF MEASUREMENT
The financial statements are prepared on the basis of fair value measurement of assets and liabilities except where otherwise stated.
FUNCTIONAL AND PRESENTATION CURRENCY
These financial statements are presented in Australian dollars, which is QTC’s functional currency.
CLASSIFICATION OF ASSETS AND LIABILITIES
The balance sheet is presented on a liquidity basis. Assets and liabilities are presented in decreasing order of liquidity and are not distinguished between current and non current.
(B) INVESTMENT IN JOINT VENTURE ENTITY
QTC’s investment in Local Government Infrastructure Services Pty Ltd is accounted for using the equity method in the financial statements. Under the equity method, the share of the profits or losses of the joint venture is recognised in the income statement, and the share of movement in equity is recognised in the balance sheet. Investments in joint venture entities are carried at the equity accounted amount.
(C) FOREIGN CURRENCY
Foreign currency transactions are initially translated into Australian dollars at the rate of exchange applying at the date of the transaction. At balance date, amounts payable to and by QTC in foreign currencies have been valued using current exchange rates after taking into account interest rates and accrued interest.
Exchange gains/losses are brought to account in the income statement.
(D) FINANCIAL ASSETS AND FINANCIAL LIABILITIES
RECOGNITION AND DERECOGNITION
Financial assets and financial liabilities are recognised in the balance sheet when QTC becomes party to the contractual provisions of the financial instrument.
A financial asset is derecognised when the contractual rights to the cash flows from the financial assets expire or are transferred and no longer controlled by QTC.
A financial liability is removed from the balance sheet when the obligation specified in the contract is discharged, cancelled or expires.
MEASUREMENT
Financial assets and liabilities at fair value through profit or loss are measured at fair value by reference to quoted market prices when available. If quoted market prices are not available, then fair values are estimated on the basis of pricing models or other recognised valuation techniques.
Fair value is the amount for which an asset could be exchanged or liability settled between knowledgeable, willing parties in an arm’s length transaction.
QTC uses mid market rates as the basis for establishing fair values of quoted financial instruments with offsetting risk positions. In general, the risk characteristics of funds borrowed together with the financial derivatives used to manage interest rate and foreign currency risks closely match those of funds onlent. In all other cases, the bid-offer spread is applied where material.
Financial liabilities at amortised cost are measured using the effective interest method. The effective interest method is a method of calculating the amortised cost of a financial instrument and allocating the interest income or interest expense over the relevant period. In this way, interest is recognised in the income statement in the period in which it accrues.
12 | QUEENSLAND TREASURY CORPORATION
2. Summary of significant accounting policies (CONTINUED)
(D) FINANCIAL ASSETS AND FINANCIAL LIABILITIES (CONTINUED)
CLASSIFICATION
Financial instruments on initial recognition are classified into the following categories:
Receivables
Onlendings
Derivative financial instruments
Financial assets at fair value through profit or loss
Financial liabilities at fair value through profit or loss, and
Financial liabilities at amortised cost.
QTC’s accounting policies for significant financial assets and financial liabilities are listed below.
ONLENDINGS
Onlendings, with the exception of loans to cooperative housing societies, are included in the balance sheet at market or fair value which is the redemption value. Loans to cooperative housing societies are based on the balance of each housing society’s loans to its members adjusted where necessary for a specific provision for impairment.
DERIVATIVE FINANCIAL INSTRUMENTS
QTC uses derivative financial instruments to hedge its exposure to interest rate, foreign currency and credit risks as part of asset and liability management activities. In addition they may be used to deliver long term floating rate or long term fixed rate exposure. In accordance with its treasury policy, QTC does not hold or issue derivative financial instruments for speculative purposes.
All derivatives are carried as assets when fair value is positive and as liabilities when fair value is negative.
FINANCIAL ASSETS AT FAIR VALUE THROUGH PROFIT OR LOSS
Financial assets at fair value through profit or loss include financial assets held for Capital Markets Operations and investments held in unit trusts (Long Term Assets).
– Financial assets – Capital Markets Operations
Financial assets – Capital Markets Operations, consist of investments in money market deposits, discount securities, semi-government bonds and floating rate notes. Unrealised gains and losses are brought to account in the income statement.
– Investments in unit trusts – Long Term Assets
Investments in unit trusts consist of investments held and managed by QIC and include Australian equities, international equities and other diversified products (refer note 8). These investments are measured at market value based on the hard close unit price quoted by QIC adjusted for fees outstanding on the account and net of any GST recoverable.
FINANCIAL LIABILITIES AT FAIR VALUE THROUGH PROFIT OR LOSS
Financial liabilities at fair value through profit or loss include interest-bearing liabilities and deposits. Unrealised gains and losses are brought to account in the income statement.
– Interest-bearing liabilities
Interest-bearing liabilities mainly consist of Australian and overseas bonds. Australian bonds include QTC’s domestic, capital indexed and public bonds. Overseas bonds include global bonds and Eurobonds. Global bonds are Australian dollar denominated bonds issued overseas.
– Client deposits
Client deposits are accepted to either the Working Capital Facility (11AM Fund) or the Cash Fund. Income derived from the investment of these deposits accrues to depositors daily. The amount shown in the balance sheet represents the market value of deposits held at balance date.
Collateral held and securities which are sold under agreements to repurchase are disclosed as deposits.
FINANCIAL LIABILITIES AT AMORTISED COST
Financial liabilities at amortised cost consist of a fixed rate note issued to the State Government in exchange for a portfolio of assets (Long Term Assets). The fixed rate note was initially recognised at par value, which equated to the fair value of the financial assets acquired. Deposits and withdrawals can be made from the note based on changes in the State Government’s long-term liabilities. The note is long-term in nature and has a term of 50 years. Interest on the fixed rate note is capitalised monthly and the rate is reviewed annually, consistent with the triennial actuarial assessment of the State’s defined benefit liability.
(E) INTEREST INCOME AND INTEREST EXPENSE
The recognition of investment income and borrowing costs includes net realised gains/losses from the sale of investments (interest income) and the preredemption of borrowings (interest expense) together with the net unrealised gains/losses arising from holding investments and certain onlendings (interest income) and net unrealised gains/losses from borrowings (interest expense). These unrealised gains/losses are a result of revaluing to market daily.
The majority of onlendings are provided to clients on a pooled basis. Interest costs are allocated to clients based on the daily movement in the market value of the pool.
(F) NET CHANGE IN FAIR VALUE OF INVESTMENTS IN UNIT TRUSTS
Changes in the net market value of investments are recognised in the period in which they occur. The net market value is based on the closing unit redemption price and includes both realised and unrealised movements, net of allowances for costs expected to be incurred in realising these investments. Distributions are reinvested into the trusts.
(G) INCOME TAX
QTC is exempt from the payment of income tax under section 50-25 of the Income Tax Assessment Act 1997 (as amended).
QTC makes a payment in lieu of income tax to the Queensland Government’s Consolidated Fund. The calculation of the income tax liability is based on the income of certain activities controlled by QTC’s Capital Markets Operations.
No income tax is payable on the Long Term Assets.
QTC’s controlled and jointly controlled entities are defined as State and Territory bodies under section 24AO of the Income Tax Assessment Act 1936 and as a consequence, are exempt from Commonwealth tax under section 24AM of this Act.
(H) ROUNDING
Amounts have been rounded to the nearest thousand dollars, except for Note 17, which is rounded to the nearest million dollars.
(I) COMPARATIVE FIGURES
Where necessary, comparative figures have been adjusted to conform with changes in presentation in the current year.
(J) OPERATING RESULT
The operating profit after tax for the half-year ended 31 December 2010 for the Capital Markets Operations segment was $24.606 million. QTC made an operating profit after tax of $914.996 million for the Long Term Assets segment.
The result on the Long Term Assets segment continues to reverse the losses recorded in the 2009 financial year due to the poor performance of the equity, property and credit markets.
The accumulated losses incurred by the Long Term Assets have no impact on QTC’s capacity to meet its obligations as there is no cash flow effect for QTC. In addition, under the Queensland Treasury Corporation Act 1988, any losses of the Corporation shall be the responsibility of the Consolidated Fund of the Queensland Government.
HALF-YEARLY REPORT DECEMBER 2010 | 13
Notes to and Forming Part of the Financial Statements (cont)
FOR THE HALF-YEAR ENDED 31 DECEMBER 2010
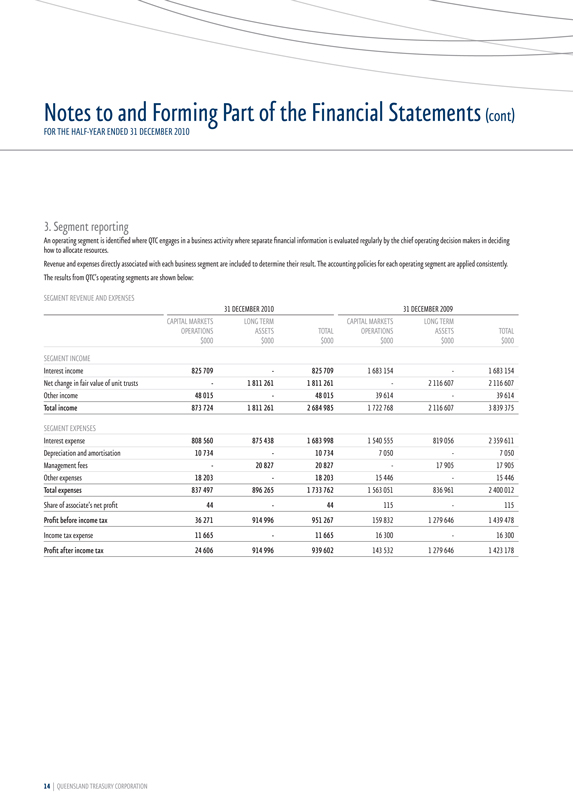
3. Segment reporting
An operating segment is identified where QTC engages in a business activity where separate financial information is evaluated regularly by the chief operating decision makers in deciding how to allocate resources.
Revenue and expenses directly associated with each business segment are included to determine their result. The accounting policies for each operating segment are applied consistently.
The results from QTC’s operating segments are shown below:
SEGMENT REVENUE AND EXPENSES
31 DECEMBER 2010 31 DECEMBER 2009
CAPITAL MARKETS LONG TERM CAPITAL MARKETS LONG TERM OPERATIONS ASSETS TOTAL OPERATIONS ASSETS TOTAL $000 $000 $000 $000 $000 $000
SEGMENT INCOME
Interest income 825 709 - 825 709 1 683 154 - 1 683 154
Net change in fair value of unit trusts - 1 811 261 1 811 261 - 2 116 607 2 116 607
Other income 48 015 - 48 015 39 614 - 39 614
Total income 873 724 1 811 261 2 684 985 1 722 768 2 116 607 3 839 375
SEGMENT EXPENSES
Interest expense 808 560 875 438 1 683 998 1 540 555 819 056 2 359 611
Depreciation and amortisation 10 734 - 10 734 7 050 - 7 050
Management fees - 20 827 20 827 - 17 905 17 905
Other expenses 18 203 - 18 203 15 446 - 15 446
Total expenses 837 497 896 265 1 733 762 1 563 051 836 961 2 400 012
Share of associate’s net profit 44 - 44 115 - 115
Profit before income tax 36 271 914 996 951 267 159 832 1 279 646 1 439 478
Income tax expense 11 665 - 11 665 16 300 - 16 300
Profit after income tax 24 606 914 996 939 602 143 532 1 279 646 1 423 178
14 | QUEENSLAND TREASURY CORPORATION
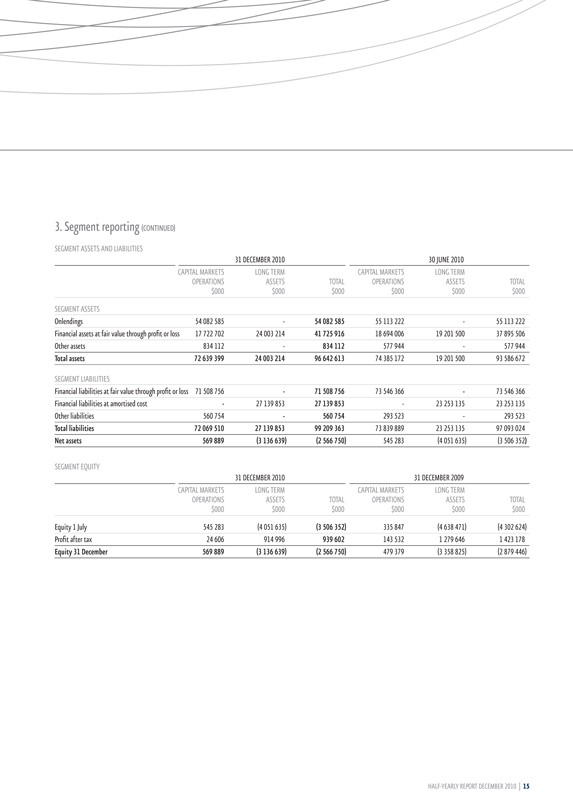
3. Segment reporting (CONTINUED)
SEGMENT ASSETS AND LIABILITIES
31 DECEMBER 2010 30 JUNE 2010
CAPITAL MARKETS LONG TERM CAPITAL MARKETS LONG TERM OPERATIONS ASSETS TOTAL OPERATIONS ASSETS TOTAL $000 $000 $000 $000 $000 $000
SEGMENT ASSETS
Onlendings 54 082 585 - 54 082 585 55 113 222 - 55 113 222
Financial assets at fair value through profit or loss 17 722 702 24 003 214 41 725 916 18 694 006 19 201 500 37 895 506
Other assets 834 112 - 834 112 577 944 - 577 944
Total assets 72 639 399 24 003 214 96 642 613 74 385 172 19 201 500 93 586 672
SEGMENT LIABILITIES
Financial liabilities at fair value through profit or loss 71 508 756 - 71 508 756 73 546 366 - 73 546 366
Financial liabilities at amortised cost - 27 139 853 27 139 853 - 23 253 135 23 253 135
Other liabilities 560 754 - 560 754 293 523 - 293 523
Total liabilities 72 069 510 27 139 853 99 209 363 73 839 889 23 253 135 97 093 024
Net assets 569 889 (3 136 639) (2 566 750) 545 283 (4 051 635) (3 506 352)
SEGMENT EQUITY
31 DECEMBER 2010 31 DECEMBER 2009
CAPITAL MARKETS LONG TERM CAPITAL MARKETS LONG TERM OPERATIONS ASSETS TOTAL OPERATIONS ASSETS TOTAL $000 $000 $000 $000 $000 $000
Equity 1 July 545 283 (4 051 635) (3 506 352) 335 847 (4 638 471) (4 302 624)
Profit after tax 24 606 914 996 939 602 143 532 1 279 646 1 423 178
Equity 31 December 569 889 (3 136 639) (2 566 750) 479 379 (3 358 825) (2 879 446)
HALF-YEARLY REPORT DECEMBER 2010 | 15
Notes to and Forming Part of the Financial Statements (cont)
FOR THE HALF-YEAR ENDED 31 DECEMBER 2010
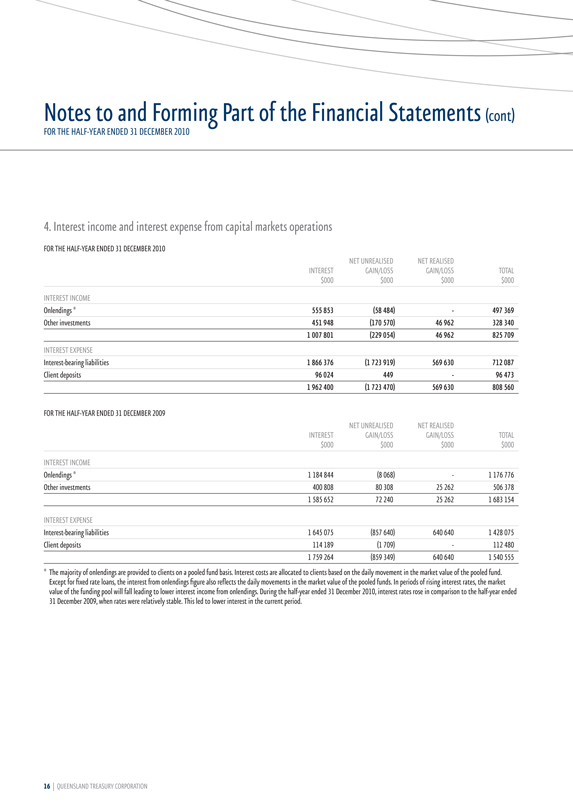
4. Interest income and interest expense from capital markets operations
FOR THE HALF-YEAR ENDED 31 DECEMBER 2010
NET UNREALISED NET REALISED INTEREST GAIN/LOSS GAIN/LOSS TOTAL $000 $000 $000 $000
INTEREST INCOME
Onlendings * 555 853 (58 484) - 497 369
Other investments 451 948 (170 570) 46 962 328 340
1 007 801 (229 054) 46 962 825 709
INTEREST EXPENSE
Interest-bearing liabilities 1 866 376 (1 723 919) 569 630 712 087
Client deposits 96 024 449 - 96 473
1 962 400 (1 723 470) 569 630 808 560
FOR THE HALF-YEAR ENDED 31 DECEMBER 2009
NET UNREALISED NET REALISED INTEREST GAIN/LOSS GAIN/LOSS TOTAL $000 $000 $000 $000
INTEREST INCOME
Onlendings * 1 184 844 (8 068) - 1 176 776
Other investments 400 808 80 308 25 262 506 378
1 585 652 72 240 25 262 1 683 154
INTEREST EXPENSE
Interest-bearing liabilities 1 645 075 (857 640) 640 640 1 428 075
Client deposits 114 189 (1 709) - 112 480
1 759 264 (859 349) 640 640 1 540 555
* The majority of onlendings are provided to clients on a pooled fund basis. Interest costs are allocated to clients based on the daily movement in the market value of the pooled fund. Except for fixed rate loans, the interest from onlendings figure also reflects the daily movements in the market value of the pooled funds. In periods of rising interest rates, the market value of the funding pool will fall leading to lower interest income from onlendings. During the half-year ended 31 December 2010, interest rates rose in comparison to the half-year ended 31 December 2009, when rates were relatively stable. This led to lower interest in the current period.
16 | QUEENSLAND TREASURY CORPORATION
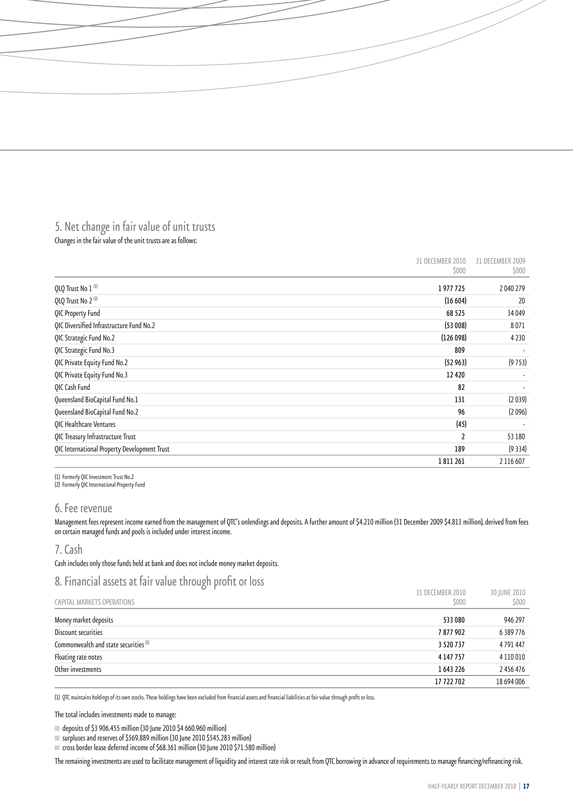
5. Net change in fair value of unit trusts
Changes in the fair value of the unit trusts are as follows:
31 DECEMBER 2010 31 DECEMBER 2009 $000 $000
QLQ Trust No 1 (1) 1 977 725 2 040 279
QLQ Trust No 2 (2) (16 604) 20
QIC Property Fund 68 525 34 049
QIC Diversified Infrastructure Fund No.2 (53 008) 8 071
QIC Strategic Fund No.2 (126 098) 4 230
QIC Strategic Fund No.3 809 -
QIC Private Equity Fund No.2 (52 963) (9 753)
QIC Private Equity Fund No.3 12 420 -
QIC Cash Fund 82 -
Queensland BioCapital Fund No.1 131 (2 039)
Queensland BioCapital Fund No.2 96 (2 096)
QIC Healthcare Ventures (45) -
QIC Treasury Infrastructure Trust 2 53 180
QIC International Property Development Trust 189 (9 334)
1 811 261 2 116 607
(1) Formerly QIC Investment Trust No.2
(2) Formerly QIC International Property Fund
6. Fee revenue
Management fees represent income earned from the management of QTC’s onlendings and deposits. A further amount of $4.210 million (31 December 2009 $4.811 million), derived from fees on certain managed funds and pools is included under interest income.
7. Cash
Cash includes only those funds held at bank and does not include money market deposits.
8. Financial assets at fair value through profit or loss
31 DECEMBER 2010 30 JUNE 2010 CAPITAL MARKETS OPERATIONS $000 $000
Money market deposits 533 080 946 297
Discount securities 7 877 902 6 389 776
Commonwealth and state securities (1) 3 520 737 4 791 447
Floating rate notes 4 147 757 4 110 010
Other investments 1 643 226 2 456 476
17 722 702 18 694 006
(1) QTC maintains holdings of its own stocks. These holdings have been excluded from financial assets and financial liabilities at fair value through profit or loss.
The total includes investments made to manage:
deposits of $3 906.455 million (30 June 2010 $4 660.960 million) surpluses and reserves of $569.889 million (30 June 2010 $545.283 million) cross border lease deferred income of $68.361 million (30 June 2010 $71.580 million)
The remaining investments are used to facilitate management of liquidity and interest rate risk or result from QTC borrowing in advance of requirements to manage financing/refinancing risk.
HALF-YEARLY REPORT DECEMBER 2010 | 17
Notes to and Forming Part of the Financial Statements (cont)
FOR THE HALF-YEAR ENDED 31 DECEMBER 2010
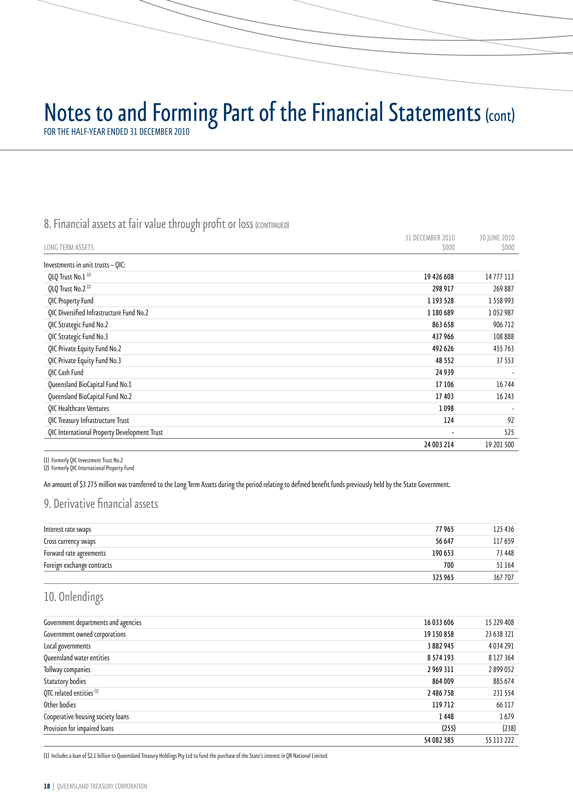
8. Financial assets at fair value through profit or loss (CONTINUED)
31 DECEMBER 2010 30 JUNE 2010 LONG TERM ASSETS $000 $000
Investments in unit trusts – QIC:
QLQ Trust No.1 (1) 19 426 608 14 777 113
QLQ Trust No.2 (2) 298 917 269 887
QIC Property Fund 1 193 528 1 558 993
QIC Diversified Infrastructure Fund No.2 1 180 689 1 052 987
QIC Strategic Fund No.2 863 658 906 712
QIC Strategic Fund No.3 437 966 108 888
QIC Private Equity Fund No.2 492 626 455 763
QIC Private Equity Fund No.3 48 552 37 553
QIC Cash Fund 24 939 -
Queensland BioCapital Fund No.1 17 106 16 744
Queensland BioCapital Fund No.2 17 403 16 243
QIC Healthcare Ventures 1 098 -
QIC Treasury Infrastructure Trust 124 92
QIC International Property Development Trust - 525
24 003 214 19 201 500
(1) Formerly QIC Investment Trust No.2
(2) Formerly QIC International Property Fund
An amount of $3 275 million was transferred to the Long Term Assets during the period relating to defined benefit funds previously held by the State Government.
9. Derivative financial assets
Interest rate swaps 77 965 125 436
Cross currency swaps 56 647 117 659
Forward rate agreements 190 653 73 448
Foreign exchange contracts 700 51 164
325 965 367 707
10. Onlendings
Government departments and agencies 16 033 606 15 229 408
Government owned corporations 19 150 858 23 638 321
Local governments 3 882 945 4 034 291
Queensland water entities 8 574 193 8 127 364
Tollway companies 2 969 311 2 899 052
Statutory bodies 864 009 885 674
QTC related entities (1) 2 486 758 231 554
Other bodies 119 712 66 117
Cooperative housing society loans 1 448 1 679
Provision for impaired loans (255) (238)
54 082 585 55 113 222
(1) Includes a loan of $2.1 billion to Queensland Treasury Holdings Pty Ltd to fund the purchase of the State’s interest in QR National Limited.
18 | QUEENSLAND TREASURY CORPORATION
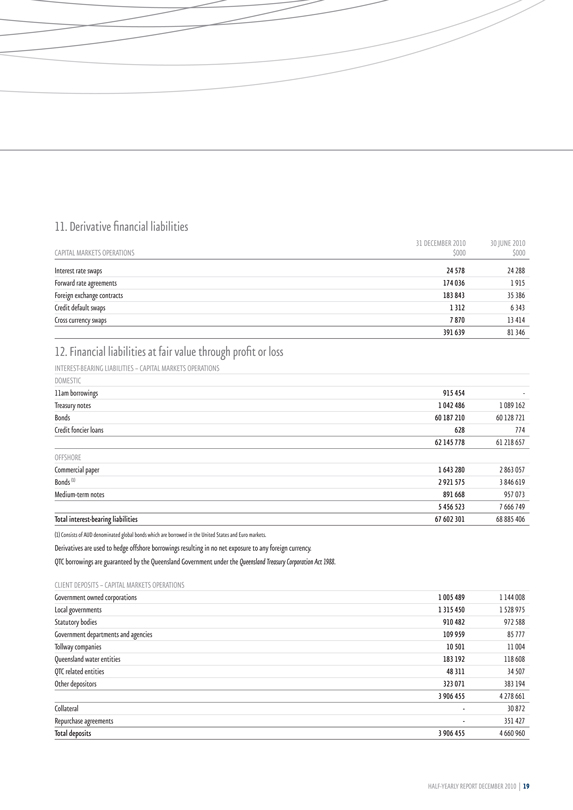
11. Derivative financial liabilities
31 DECEMBER 2010 30 JUNE 2010
$000 $000
CAPITAL MARKETS OPERATIONS
Interest rate swaps 24 578 24 288
Forward rate agreements 174 036 1 915
Foreign exchange contracts 183 843 35 386
Credit default swaps 1 312 6 343
Cross currency swaps 7 870 13 414
391 639 81 346
12. Financial liabilities at fair value through profit or loss
INTEREST-BEARING LIABILITIES – CAPITAL MARKETS OPERATIONS
DOMESTIC
11am borrowings 915 454 -
Treasury notes 1 042 486 1 089 162
Bonds 60 187 210 60 128 721
Credit foncier loans 628 774
62 145 778 61 218 657
OFFSHORE
Commercial paper 1 643 280 2 863 057
Bonds (1) 2 921 575 3 846 619
Medium-term notes 891 668 957 073
5 456 523 7 666 749
Total interest-bearing liabilities 67 602 301 68 885 406
(1) Consists of AUD denominated global bonds which are borrowed in the United States and Euro markets.
Derivatives are used to hedge offshore borrowings resulting in no net exposure to any foreign currency.
QTC borrowings are guaranteed by the Queensland Government under the Queensland Treasury Corporation Act 1988.
CLIENT DEPOSITS – CAPITAL MARKETS OPERATIONS
Government owned corporations 1 005 489 1 144 008
Local governments 1 315 450 1 528 975
Statutory bodies 910 482 972 588
Government departments and agencies 109 959 85 777
Tollway companies 10 501 11 004
Queensland water entities 183 192 118 608
QTC related entities 48 311 34 507
Other depositors 323 071 383 194
3 906 455 4 278 661
Collateral - 30 872
Repurchase agreements - 351 427
Total deposits 3 906 455 4 660 960
HALF-YEARLY REPORT DECEMBER 2010 | 19
Notes to and Forming Part of the Financial Statements (cont)
FOR THE HALF-YEAR ENDED 31 DECEMBER 2010
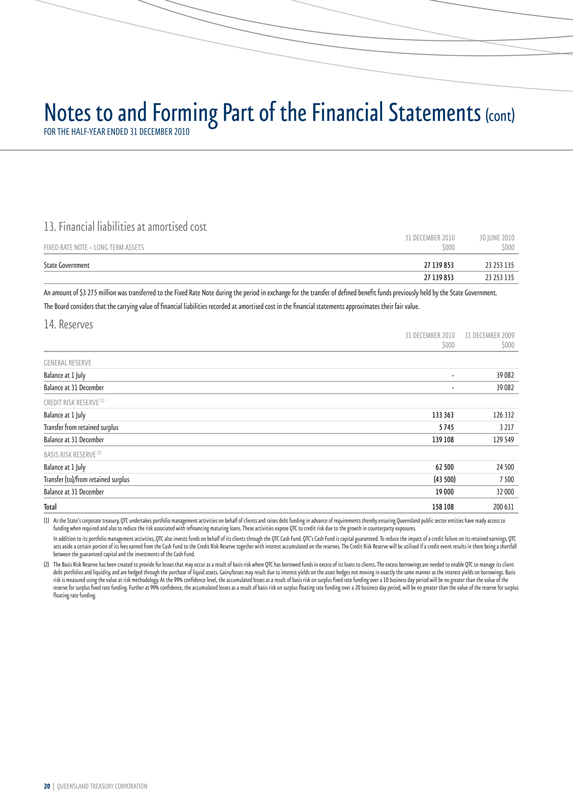
13. Financial liabilities at amortised cost
31 DECEMBER 2010 30 JUNE 2010
$000 $000
FIXED RATE NOTE – LONG TERM ASSETS
State Government 27 139 853 23 253 135
27 139 853 23 253 135
An amount of $3 275 million was transferred to the Fixed Rate Note during the period in exchange for the transfer of defined benefit funds previously held by the State Government.
The Board considers that the carrying value of financial liabilities recorded at amortised cost in the financial statements approximates their fair value.
14. Reserves
31 DECEMBER 2010 31 DECEMBER 2009
$000 $000
GENERAL RESERVE
Balance at 1 July - 39 082
Balance at 31 December - 39 082
CREDIT RISK RESERVE (1)
Balance at 1 July 133 363 126 332
Transfer from retained surplus 5 745 3 217
Balance at 31 December 139 108 129 549
BASIS RISK RESERVE (2)
Balance at 1 July 62 500 24 500
Transfer (to)/from retained surplus (43 500) 7 500
Balance at 31 December 19 000 32 000
Total 158 108 200 631
(1) As the State’s corporate treasury, QTC undertakes portfolio management activities on behalf of clients and raises debt funding in advance of requirements thereby ensuring Queensland public sector entities have ready access to funding when required and also to reduce the risk associated with refinancing maturing loans. These activities expose QTC to credit risk due to the growth in counterparty exposures.
In addition to its portfolio management activities, QTC also invests funds on behalf of its clients through the QTC Cash Fund. QTC’s Cash Fund is capital guaranteed. To reduce the impact of a credit failure on its retained earnings, QTC sets aside a certain portion of its fees earned from the Cash Fund to the Credit Risk Reserve together with interest accumulated on the reserves. The Credit Risk Reserve will be utilised if a credit event results in there being a shortfall between the guaranteed capital and the investments of the Cash Fund.
(2) The Basis Risk Reserve has been created to provide for losses that may occur as a result of basis risk where QTC has borrowed funds in excess of its loans to clients. The excess borrowings are needed to enable QTC to manage its client debt portfolios and liquidity, and are hedged through the purchase of liquid assets. Gains/losses may result due to interest yields on the asset hedges not moving in exactly the same manner as the interest yields on borrowings. Basis risk is measured using the value at risk methodology. At the 99% confidence level, the accumulated losses as a result of basis risk on surplus fixed rate funding over a 10 business day period will be no greater than the value of the reserve for surplus fixed rate funding. Further at 99% confidence, the accumulated losses as a result of basis risk on surplus floating rate funding over a 20 business day period, will be no greater than the value of the reserve for surplus floating rate funding.
20 | QUEENSLAND TREASURY CORPORATION
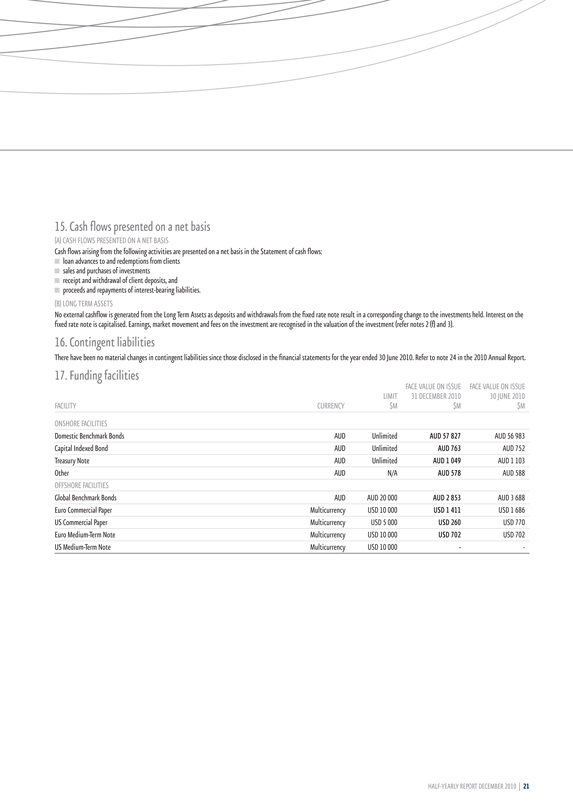
15. Cash flows presented on a net basis
(A) CASH FLOWS PRESENTED ON A NET BASIS
Cash flows arising from the following activities are presented on a net basis in the Statement of cash flows:
loan advances to and redemptions from clients
sales and purchases of investments
receipt and withdrawal of client deposits, and
proceeds and repayments of interest-bearing liabilities.
(B) LONG TERM ASSETS
No external cashflow is generated from the Long Term Assets as deposits and withdrawals from the fixed rate note result in a corresponding change to the investments held. Interest on the fixed rate note is capitalised. Earnings, market movement and fees on the investment are recognised in the valuation of the investment (refer notes 2 (f) and 3).
16. Contingent liabilities
There have been no material changes in contingent liabilities since those disclosed in the financial statements for the year ended 30 June 2010. Refer to note 24 in the 2010 Annual Report.
17. Funding facilities
FACE VALUE ON ISSUE FACE VALUE ON ISSUE LIMIT 31 DECEMBER 2010 30 JUNE 2010 FACILITY CURRENCY $M $M $M
ONSHORE FACILITIES
Domestic Benchmark Bonds AUD Unlimited AUD 57 827 AUD 56 983
Capital Indexed Bond AUD Unlimited AUD 763 AUD 752
Treasury Note AUD Unlimited AUD 1 049 AUD 1 103
Other AUD N/A AUD 578 AUD 588
OFFSHORE FACILITIES
Global Benchmark Bonds AUD AUD 20 000 AUD 2 853 AUD 3 688
Euro Commercial Paper Multicurrency USD 10 000 USD 1 411 USD 1 686
US Commercial Paper Multicurrency USD 5 000 USD 260 USD 770
Euro Medium-Term Note Multicurrency USD 10 000 USD 702 USD 702
US Medium-Term Note Multicurrency USD 10 000 - -
HALF-YEARLY REPORT DECEMBER 2010 | 21
Certificate of the Queensland Treasury Corporation
The foregoing half-year financial statements have been prepared in accordance with the Financial Accountability Act 2009 and other prescribed requirements including AASB 134: Interim Financial Reporting.
The Directors draw attention to note 2(a) to the financial statements, which includes a statement of compliance with International Financial Reporting Standards.
We certify that in our opinion:
(i) the prescribed requirements for establishing and keeping the accounts have been complied with in all material respects
(ii) the foregoing half-yearly financial statements have been drawn up so as to present a true and fair view of Queensland Treasury Corporation’s assets and liabilities, financial position and financial performance for the half-year ended 31 December 2010, and
(iii) the interim management report includes a fair review of the information required under article 4(4) of the Law of January 11, 2008 on transparency requirements for issuers of securities on the Luxembourg Stock Exchange.
Signed in accordance with a resolution of the Directors.
G P BRADLEY P C NOBLE
Corporation Sole Chief Executive
Queensland Treasury Corporation
Brisbane 10 February 2011
22 | QUEENSLAND TREASURY CORPORATION
Independent Auditor’s Review Report TO QUEENSLAND TREASURY CORPORATION
Report on the Half-year Financial Report
I have reviewed the accompanying half-year financial report of Queensland Treasury Corporation, which comprises the balance sheet as at 31 December 2010, and the statement of comprehensive income, statement of changes in equity and statement of cash flows for the half-year ended on that date, notes to and forming part of the financial report and the certificate of the Queensland Treasury Corporation.
THE CORPORATION SOLE’S RESPONSIBILITY
The corporation sole is responsible for the preparation of the half-year financial report that gives a true and fair view in accordance with Australian Accounting Standards (including the Australian Accounting Interpretations). This responsibility also includes such internal controls as the corporation sole determines is necessary to enable the preparation of the half-year financial report that is free from material misstatement, whether due to fraud or error.
AUDITOR’S RESPONSIBILITY
My responsibility is to express a conclusion on the half-year financial report based on my review. The review was conducted in accordance with Auditing Standard on Review Engagements ASRE 2410 Review of Interim and Other Financial Reports Performed by the Independent Auditor of the Entity, in order to state whether, on the basis of the procedures described, anything has come to my attention that causes me to believe that the half-year financial report is not presented fairly, in all material respects. As the auditor of Queensland Treasury Corporation, ASRE 2410 requires that I comply with the ethical requirements relevant to the audit of the annual financial report.
A review of a half-year financial report consists of making enquiries, primarily of persons responsible for financial and accounting matters, and applying analytical and other review procedures. A review is substantially less in scope than an audit conducted in accordance with Australian Auditing Standards and consequently does not enable me to obtain assurance that I would become aware of all significant matters that might be identified in an audit. Accordingly, I do not express an audit opinion.
INDEPENDENCE
The Auditor-General Act 2009 promotes the independence of the Auditor-General and all authorised auditors. The Auditor-General is the auditor of all Queensland public sector entities and can only be removed by Parliament.
The Auditor-General may conduct an audit in any way considered appropriate and is not subject to direction by any person about the way in which audit powers are to be exercised. The Auditor-General has for the purposes of conducting an audit, access to all documents and property and can report to Parliament matters which in the Auditor-General’s opinion are significant.
CONCLUSION
Based on my review, which is not an audit, I have not become aware of any matter that makes me believe that the half-year financial report of Queensland Treasury Corporation does not –
(a) present fairly, in all material respects, the financial position of the Queensland Treasury Corporation as at 31 December 2010 and its financial performance and its cash flows for the period ended on that date;
(b) comply with Australian Accounting Standard AASB 134 Interim Financial Reporting.
OTHER MATTERS - ELECTRONIC PRESENTATION OF THE REVIEWED FINANCIAL REPORT
This review report relates to the financial report of Queensland Treasury Corporation for the half-year ended 31 December 2010. Where the financial report is included on Queensland Treasury Corporation’s website, the Corporation is responsible for the integrity of Queensland Treasury Corporation’s website and I have not been engaged to report on the integrity of Queensland Treasury Corporation’s website. The review report refers only to the subject matter described above. It does not provide an opinion on any other information which may have been hyperlinked to/from these statements or otherwise included with the financial report. If users of the financial report are concerned with the inherent risks arising from publication on a website, they are advised to refer to the hard copy of the reviewed financial report to confirm the information contained in this website version of the financial report.
These matters also relate to the presentation of the reviewed financial report in other electronic media including CD Rom.
G G POOLE FCPA
Auditor-General of Queensland
AUDITOR GENERAL
10 FEB 2011
OF QUEENSLAND
Queensland Audit Office Brisbane
HALF-YEARLY REPORT DECEMBER 2010 | 23
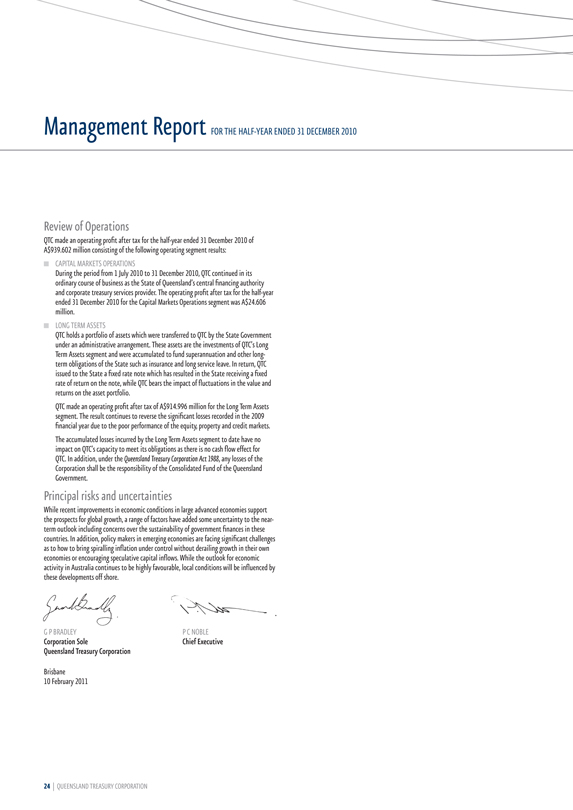
Management Report FOR THE HALF-YEAR ENDED 31 DECEMBER 2010
Review of Operations
QTC made an operating profit after tax for the half-year ended 31 December 2010 of A$939.602 million consisting of the following operating segment results:
CAPITAL MARKETS OPERATIONS
During the period from 1 July 2010 to 31 December 2010, QTC continued in its ordinary course of business as the State of Queensland’s central financing authority and corporate treasury services provider. The operating profit after tax for the half-year ended 31 December 2010 for the Capital Markets Operations segment was A$24.606 million.
LONG TERM ASSETS
QTC holds a portfolio of assets which were transferred to QTC by the State Government under an administrative arrangement. These assets are the investments of QTC’s Long Term Assets segment and were accumulated to fund superannuation and other long-term obligations of the State such as insurance and long service leave. In return, QTC issued to the State a fixed rate note which has resulted in the State receiving a fixed rate of return on the note, while QTC bears the impact of fluctuations in the value and returns on the asset portfolio.
QTC made an operating profit after tax of A$914.996 million for the Long Term Assets segment. The result continues to reverse the significant losses recorded in the 2009 financial year due to the poor performance of the equity, property and credit markets.
The accumulated losses incurred by the Long Term Assets segment to date have no impact on QTC’s capacity to meet its obligations as there is no cash flow effect for QTC. In addition, under the Queensland Treasury Corporation Act 1988, any losses of the Corporation shall be the responsibility of the Consolidated Fund of the Queensland Government.
Principal risks and uncertainties
While recent improvements in economic conditions in large advanced economies support the prospects for global growth, a range of factors have added some uncertainty to the near-term outlook including concerns over the sustainability of government finances in these countries. In addition, policy makers in emerging economies are facing significant challenges as to how to bring spiralling inflation under control without derailing growth in their own economies or encouraging speculative capital inflows. While the outlook for economic activity in Australia continues to be highly favourable, local conditions will be influenced by these developments off shore.
G P BRADLEY P C NOBLE
Corporation Sole Chief Executive Queensland Treasury Corporation
Brisbane 10 February 2011
24 | QUEENSLAND TREASURY CORPORATION
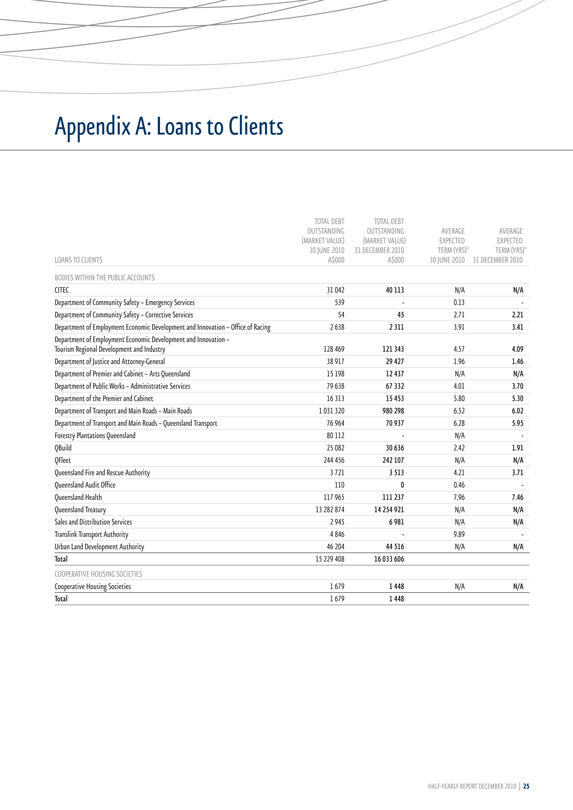
Appendix A:
Loans to Clients
TOTAL DEBT TOTAL DEBT OUTSTANDING OUTSTANDING AVERAGE AVERAGE (MARKET VALUE) (MARKET VALUE) EXPECTED EXPECTED 30 JUNE 2010 31 DECEMBER 2010 TERM (YRS)* TERM (YRS)* LOANS TO CLIENTS A$000 A$000 30 JUNE 2010 31 DECEMBER 2010
BODIES WITHIN THE PUBLIC ACCOUNTS
CITEC 31 042 40 113 N/A N/A
Department of Community Safety – Emergency Services 539 - 0.13 -
Department of Community Safety – Corrective Services 54 45 2.71 2.21
Department of Employment Economic Development and Innovation – Office of Racing 2 638 2 311 3.91 3.41
Department of Employment Economic Development and Innovation – Tourism Regional Development and Industry 128 469 121 343 4.57 4.09
Department of Justice and Attorney-General 38 917 29 427 1.96 1.46
Department of Premier and Cabinet – Arts Queensland 15 198 12 437 N/A N/A
Department of Public Works – Administrative Services 79 638 67 332 4.01 3.70
Department of the Premier and Cabinet 16 313 15 453 5.80 5.30
Department of Transport and Main Roads – Main Roads 1 031 320 980 298 6.52 6.02
Department of Transport and Main Roads – Queensland Transport 76 964 70 937 6.28 5.95
Forestry Plantations Queensland 80 112 - N/A -
QBuild 25 082 30 636 2.42 1.91
QFleet 244 456 242 107 N/A N/A
Queensland Fire and Rescue Authority 3 721 3 513 4.21 3.71
Queensland Audit Office 110 0 0.46 -
Queensland Health 117 965 111 237 7.96 7.46
Queensland Treasury 13 282 874 14 254 921 N/A N/A
Sales and Distribution Services 2 945 6 981 N/A N/A
Translink Transport Authority 4 846 - 9.89 -
Urban Land Development Authority 46 204 44 516 N/A N/A
Total 15 229 408 16 033 606
COOPERATIVE HOUSING SOCIETIES
Cooperative Housing Societies 1 679 1 448 N/A N/A
Total 1 679 1 448
HALF-YEARLY REPORT DECEMBER 2010 | 25

Appendix A: Loans to Clients (CONTINUED)
TOTAL DEBT TOTAL DEBT OUTSTANDING OUTSTANDING AVERAGE AVERAGE (MARKET VALUE) (MARKET VALUE) EXPECTED EXPECTED 30 JUNE 2010 31 DECEMBER 2010 TERM (YRS)* TERM (YRS)*LOANS TO CLIENTS A$000 A$000 30 JUNE 2010 31 DECEMBER 2010
GOVERNMENT OWNED CORPORATIONS
CS Energy Ltd 862 497 842 007 N/A N/A
ENERGEX Ltd 4 207 280 4 439 341 N/A N/A
Ergon Energy Corporation Limited 4 130 523 4 325 731 N/A N/A
Eungella Water Pipeline Pty Ltd 33 047 31 483 13.37 12.84
Gladstone Ports Corporation 611 961 601 871 N/A N/A
Port of Brisbane Corporation 764 571 - N/A -
Port of Townsville Limited 11 367 9 585 14.14 15.59
Ports Corporation of Queensland Limited 795 317 875 208 N/A N/A
Powerlink 3 433 076 3 542 904 N/A N/A
QR Limited 4 379 640 - N/A -
Queensland Rail Limited 3 069 717 3 091 064 N/A N/A
Stanwell Corporation Limited 655 365 642 554 N/A N/A
SunWater 225 781 220 634 N/A N/A
Tarong Energy Corporation Limited 458 179 528 476 N/A N/A
Total 23 638 321 19 150 858
LOCAL GOVERNMENTS
Balonne Shire Council 1 877 1 645 9.53 9.68
Banana Shire Council 14 824 13 722 16.18 15.63
Barcaldine Regional Council 1 701 1 594 14.51 14.30
Barcoo Shire Council 86 77 4.90 4.40
Blackall Tambo Regional Council 415 387 8.65 8.10
Brisbane City Council 995 138 975 671 13.94 13.96
Bulloo Shire Council 1 325 1 225 6.83 6.32
Bundaberg Regional Council 61 030 57 372 N/A 12.24
Burdekin Shire Council 7 516 6 539 5.87 5.63
Cairns Regional Council 106 816 101 575 17.13 16.79
Carpentaria Shire Council 4 265 3 934 16.08 16.30
Cassowary Coast Regional Council 20 639 18 833 N/A 9.79
Central Highlands Regional Council 14 363 24 300 N/A N/A
Charters Towers Regional Council 419 359 4.70 4.43
Cloncurry Shire Council 4 541 4 014 12.64 12.76
Cook Shire Council 4 553 8 637 14.30 13.76
Diamantina Shire Council 1 780 1 638 7.34 6.86
Etheridge Shire Council 3 231 2 968 6.69 6.19
Fraser Coast Regional Council 120 511 113 978 N/A N/A
Gladstone Regional Council 113 473 108 211 17.52 17.19
Gold Coast City Council 616 570 591 118 N/A N/A
Goondiwindi Regional Council 2 011 1 899 16.97 16.78
Gympie Regional Council 29 411 27 937 18.57 18.39
26 | QUEENSLAND TREASURY CORPORATION
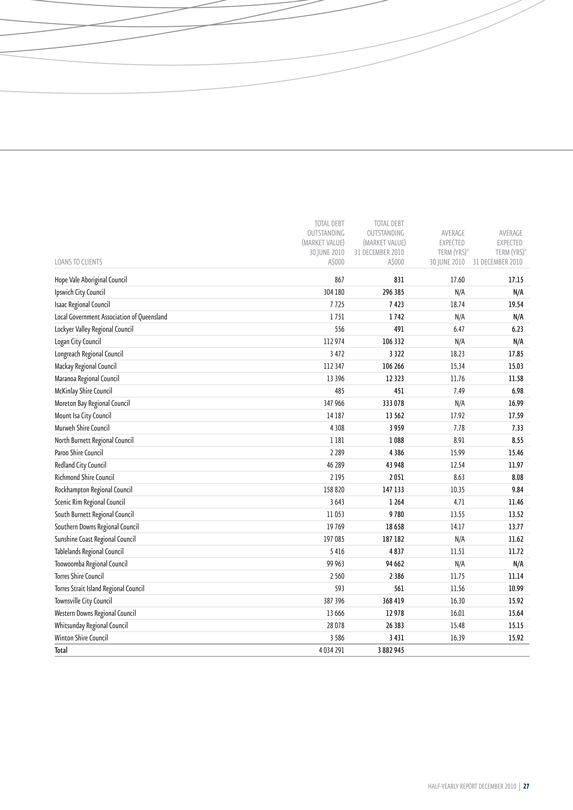
TOTAL DEBT TOTAL DEBT OUTSTANDING OUTSTANDING AVERAGE AVERAGE (MARKET VALUE) (MARKET VALUE) EXPECTED EXPECTED 30 JUNE 2010 31 DECEMBER 2010 TERM (YRS)* TERM (YRS)* LOANS TO CLIENTS A$000 A$000 30 JUNE 2010 31 DECEMBER 2010
Hope Vale Aboriginal Council 867 831 17.60 17.15
Ipswich City Council 304 180 296 385 N/A N/A
Isaac Regional Council 7 725 7 423 18.74 19.54
Local Government Association of Queensland 1 751 1 742 N/A N/A
Lockyer Valley Regional Council 556 491 6.47 6.23
Logan City Council 112 974 106 332 N/A N/A
Longreach Regional Council 3 472 3 322 18.23 17.85
Mackay Regional Council 112 347 106 266 15.34 15.03
Maranoa Regional Council 13 396 12 323 11.76 11.58
McKinlay Shire Council 485 451 7.49 6.98
Moreton Bay Regional Council 347 966 333 078 N/A 16.99
Mount Isa City Council 14 187 13 562 17.92 17.59
Murweh Shire Council 4 308 3 959 7.78 7.33
North Burnett Regional Council 1 181 1 088 8.91 8.55
Paroo Shire Council 2 289 4 386 15.99 15.46
Redland City Council 46 289 43 948 12.54 11.97
Richmond Shire Council 2 195 2 051 8.63 8.08
Rockhampton Regional Council 158 820 147 133 10.35 9.84
Scenic Rim Regional Council 3 643 1 264 4.71 11.46
South Burnett Regional Council 11 053 9 780 13.55 13.52
Southern Downs Regional Council 19 769 18 658 14.17 13.77
Sunshine Coast Regional Council 197 085 187 182 N/A 11.62
Tablelands Regional Council 5 416 4 837 11.51 11.72
Toowoomba Regional Council 99 963 94 662 N/A N/A
Torres Shire Council 2 560 2 386 11.75 11.14
Torres Strait Island Regional Council 593 561 11.56 10.99
Townsville City Council 387 396 368 419 16.30 15.92
Western Downs Regional Council 13 666 12 978 16.01 15.64
Whitsunday Regional Council 28 078 26 383 15.48 15.15
Winton Shire Council 3 586 3 431 16.39 15.92
Total 4 034 291 3 882 945
HALF-YEARLY REPORT DECEMBER 2010 | 27
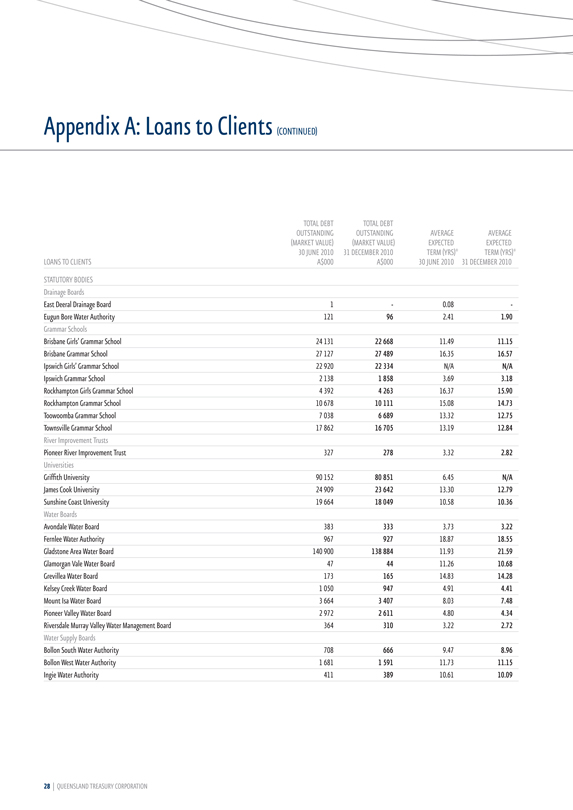
Appendix A: Loans to Clients (CONTINUED)
TOTAL DEBT TOTAL DEBT OUTSTANDING OUTSTANDING AVERAGE AVERAGE (MARKET VALUE) (MARKET VALUE) EXPECTED EXPECTED 30 JUNE 2010 31 DECEMBER 2010 TERM (YRS)* TERM (YRS)* LOANS TO CLIENTS A$000 A$000 30 JUNE 2010 31 DECEMBER 2010
STATUTORY BODIES
Drainage Boards
East Deeral Drainage Board 1 - 0.08 -
Eugun Bore Water Authority 121 96 2.41 1.90
Grammar Schools
Brisbane Girls’ Grammar School 24 131 22 668 11.49 11.15
Brisbane Grammar School 27 127 27 489 16.35 16.57
Ipswich Girls’ Grammar School 22 920 22 334 N/A N/A
Ipswich Grammar School 2 138 1 858 3.69 3.18
Rockhampton Girls Grammar School 4 392 4 263 16.37 15.90
Rockhampton Grammar School 10 678 10 111 15.08 14.73
Toowoomba Grammar School 7 038 6 689 13.32 12.75
Townsville Grammar School 17 862 16 705 13.19 12.84
River Improvement Trusts
Pioneer River Improvement Trust 327 278 3.32 2.82
Universities
Griffith University 90 152 80 851 6.45 N/A
James Cook University 24 909 23 642 13.30 12.79
Sunshine Coast University 19 664 18 049 10.58 10.36
Water Boards
Avondale Water Board 383 333 3.73 3.22
Fernlee Water Authority 967 927 18.87 18.55
Gladstone Area Water Board 140 900 138 884 11.93 21.59
Glamorgan Vale Water Board 47 44 11.26 10.68
Grevillea Water Board 173 165 14.83 14.28
Kelsey Creek Water Board 1 050 947 4.91 4.41
Mount Isa Water Board 3 664 3 407 8.03 7.48
Pioneer Valley Water Board 2 972 2 611 4.80 4.34
Riversdale Murray Valley Water Management Board 364 310 3.22 2.72
Water Supply Boards
Bollon South Water Authority 708 666 9.47 8.96
Bollon West Water Authority 1 681 1 591 11.73 11.15
Ingie Water Authority 411 389 10.61 10.09
28 | QUEENSLAND TREASURY CORPORATION
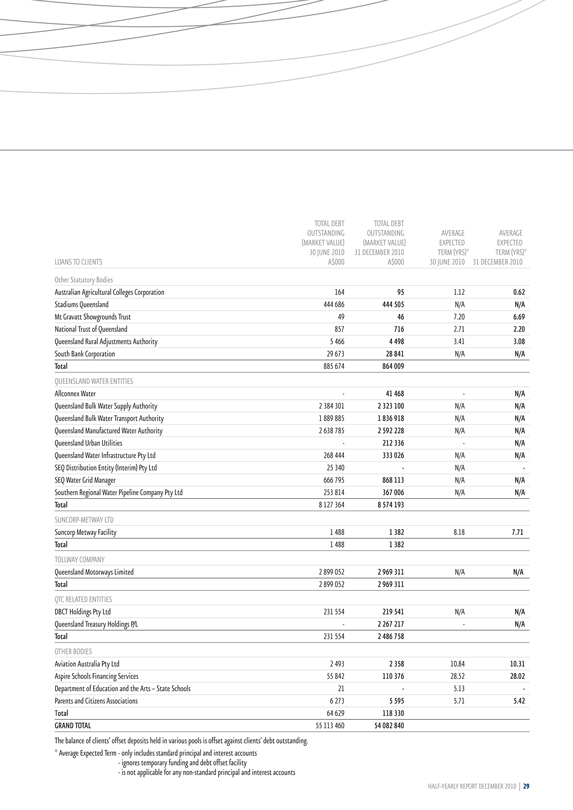
TOTAL DEBT TOTAL DEBT OUTSTANDING OUTSTANDING AVERAGE AVERAGE (MARKET VALUE) (MARKET VALUE) EXPECTED EXPECTED 30 JUNE 2010 31 DECEMBER 2010 TERM (YRS)* TERM (YRS)* LOANS TO CLIENTS A$000 A$000 30 JUNE 2010 31 DECEMBER 2010
Other Statutory Bodies
Australian Agricultural Colleges Corporation 164 95 1.12 0.62
Stadiums Queensland 444 686 444 505 N/A N/A
Mt Gravatt Showgrounds Trust 49 46 7.20 6.69
National Trust of Queensland 857 716 2.71 2.20
Queensland Rural Adjustments Authority 5 466 4 498 3.41 3.08
South Bank Corporation 29 673 28 841 N/A N/A
Total 885 674 864 009
QUEENSLAND WATER ENTITIES
Allconnex Water - 41 468 - N/A
Queensland Bulk Water Supply Authority 2 384 301 2 323 100 N/A N/A
Queensland Bulk Water Transport Authority 1 889 885 1 836 918 N/A N/A
Queensland Manufactured Water Authority 2 638 785 2 592 228 N/A N/A
Queensland Urban Utilities - 212 336 - N/A
Queensland Water Infrastructure Pty Ltd 268 444 333 026 N/A N/A
SEQ Distribution Entity (Interim) Pty Ltd 25 340 - N/A -
SEQ Water Grid Manager 666 795 868 113 N/A N/A
Southern Regional Water Pipeline Company Pty Ltd 253 814 367 006 N/A N/A
Total 8 127 364 8 574 193
SUNCORP-METWAY LTD
Suncorp Metway Facility 1 488 1 382 8.18 7.71
Total 1 488 1 382
TOLLWAY COMPANY
Queensland Motorways Limited 2 899 052 2 969 311 N/A N/A
Total 2 899 052 2 969 311
QTC RELATED ENTITIES
DBCT Holdings Pty Ltd 231 554 219 541 N/A N/A
Queensland Treasury Holdings P/L - 2 267 217 - N/A
Total 231 554 2 486 758
OTHER BODIES
Aviation Australia Pty Ltd 2 493 2 358 10.84 10.31
Aspire Schools Financing Services 55 842 110 376 28.52 28.02
Department of Education and the Arts – State Schools 21 - 5.13 -
Parents and Citizens Associations 6 273 5 595 5.71 5.42
Total 64 629 118 330
GRAND TOTAL 55 113 460 54 082 840
The balance of clients’ offset deposits held in various pools is offset against clients’ debt outstanding.
* Average Expected Term - only includes standard principal and interest accounts
- ignores temporary funding and debt offset facility
- is not applicable for any non-standard principal and interest accounts
HALF-YEARLY REPORT DECEMBER 2010 | 29
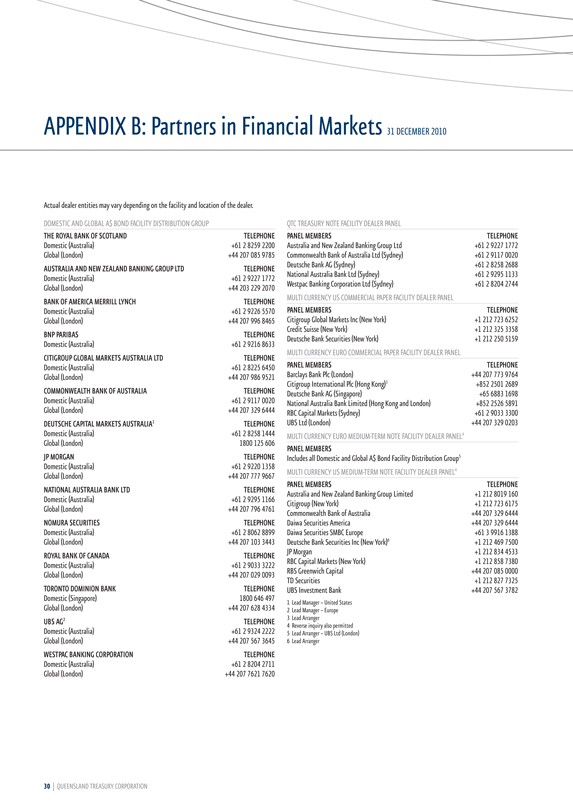
APPENDIX B: Partners in Financial Markets 31 DECEMBER 2010
Actual dealer entities may vary depending on the facility and location of the dealer.
DOMESTIC AND GLOBAL A$ BOND FACILITY DISTRIBUTION GROUP
THE ROYAL BANK OF SCOTLAND TELEPHONE
Domestic (Australia) +61 2 8259 2200
Global (London) +44 207 085 9785
AUSTRALIA AND NEW ZEALAND BANKING GROUP LTD TELEPHONE
Domestic (Australia) +61 2 9227 1772
Global (London) +44 203 229 2070
BANK OF AMERICA MERRILL LYNCH TELEPHONE
Domestic (Australia) +61 2 9226 5570
Global (London) +44 207 996 8465
BNP PARIBAS TELEPHONE
Domestic (Australia) +61 2 9216 8633
CITIGROUP GLOBAL MARKETS AUSTRALIA LTD TELEPHONE
Domestic (Australia) +61 2 8225 6450
Global (London) +44 207 986 9521
COMMONWEALTH BANK OF AUSTRALIA TELEPHONE
Domestic (Australia) +61 2 9117 0020
Global (London) +44 207 329 6444
DEUTSCHE CAPITAL MARKETS AUSTRALIA1 TELEPHONE
Domestic (Australia) +61 2 8258 1444
Global (London) 1800 125 606
JP MORGAN TELEPHONE
Domestic (Australia) +61 2 9220 1358
Global (London) +44 207 777 9667
NATIONAL AUSTRALIA BANK LTD TELEPHONE
Domestic (Australia) +61 2 9295 1166
Global (London) +44 207 796 4761
NOMURA SECURITIES TELEPHONE
Domestic (Australia) +61 2 8062 8899
Global (London) +44 207 103 3443
ROYAL BANK OF CANADA TELEPHONE
Domestic (Australia) +61 2 9033 3222
Global (London) +44 207 029 0093
TORONTO DOMINION BANK TELEPHONE
Domestic (Singapore) 1800 646 497
Global (London) +44 207 628 4334
UBS AG2 TELEPHONE
Domestic (Australia) +61 2 9324 2222
Global (London) +44 207 567 3645
WESTPAC BANKING CORPORATION TELEPHONE
Domestic (Australia) +61 2 8204 2711
Global (London) +44 207 7621 7620
QTC TREASURY NOTE FACILITY DEALER PANEL
PANEL MEMBERS TELEPHONE
Australia and New Zealand Banking Group Ltd +61 2 9227 1772
Commonwealth Bank of Australia Ltd (Sydney) +61 2 9117 0020
Deutsche Bank AG (Sydney) +61 2 8258 2688
National Australia Bank Ltd (Sydney) +61 2 9295 1133
Westpac Banking Corporation Ltd (Sydney) +61 2 8204 2744
MULTI CURRENCY US COMMERCIAL PAPER FACILITY DEALER PANEL
PANEL MEMBERS TELEPHONE
Citigroup Global Markets Inc (New York) +1 212 723 6252
Credit Suisse (New York) +1 212 325 3358
Deutsche Bank Securities (New York) +1 212 250 5159
MULTI CURRENCY EURO COMMERCIAL PAPER FACILITY DEALER PANEL
PANEL MEMBERS TELEPHONE
Barclays Bank Plc (London) +44 207 773 9764
Citigroup International Plc (Hong Kong)3 +852 2501 2689
Deutsche Bank AG (Singapore) +65 6883 1698
National Australia Bank Limited (Hong Kong and London) +852 2526 5891
RBC Capital Markets (Sydney) +61 2 9033 3300
UBS Ltd (London) +44 207 329 0203
MULTI CURRENCY EURO MEDIUM-TERM NOTE FACILITY DEALER PANEL4
PANEL MEMBERS
Includes all Domestic and Global A$ Bond Facility Distribution Group5
MULTI CURRENCY US MEDIUM-TERM NOTE FACILITY DEALER PANEL4
PANEL MEMBERS TELEPHONE
Australia and New Zealand Banking Group Limited +1 212 8019 160
Citigroup (New York) +1 212 723 6175
Commonwealth Bank of Australia +44 207 329 6444
Daiwa Securities America +44 207 329 6444
Daiwa Securities SMBC Europe +61 3 9916 1388
Deutsche Bank Securities Inc (New York)6 +1 212 469 7500
JP Morgan +1 212 834 4533
RBC Capital Markets (New York) +1 212 858 7380
RBS Greenwich Capital +44 207 085 0000
TD Securities +1 212 827 7325
UBS Investment Bank +44 207 567 3782
1 Lead Manager – United States
2 Lead Manager – Europe
3 Lead Arranger
4 Reverse inquiry also permitted
5 Lead Arranger – UBS Ltd (London)
6 Lead Arranger
30 | QUEENSLAND TREASURY CORPORATION
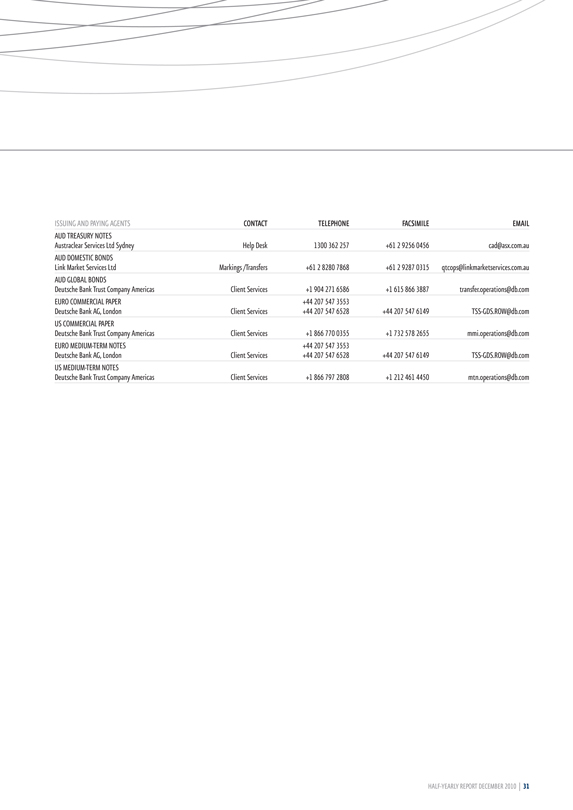
ISSUING AND PAYING AGENTS CONTACT TELEPHONE FACSIMILE EMAIL
AUD TREASURY NOTES
Austraclear Services Ltd Sydney Help Desk 1300 362 257 +61 2 9256 0456 cad@asx.com.au
AUD DOMESTIC BONDS
Link Market Services Ltd Markings /Transfers +61 2 8280 7868 +61 2 9287 0315 qtcops@linkmarketservices.com.au
AUD GLOBAL BONDS
Deutsche Bank Trust Company Americas Client Services +1 904 271 6586 +1 615 866 3887 transfer.operations@db.com
EURO COMMERCIAL PAPER +44 207 547 3553
Deutsche Bank AG, London Client Services +44 207 547 6528 +44 207 547 6149 TSS-GDS.ROW@db.com
US COMMERCIAL PAPER
Deutsche Bank Trust Company Americas Client Services +1 866 770 0355 +1 732 578 2655 mmi.operations@db.com
EURO MEDIUM-TERM NOTES +44 207 547 3553
Deutsche Bank AG, London Client Services +44 207 547 6528 +44 207 547 6149 TSS-GDS.ROW@db.com
US MEDIUM-TERM NOTES
Deutsche Bank Trust Company Americas Client Services +1 866 797 2808 +1 212 461 4450 mtn.operations@db.com
HALF-YEARLY REPORT DECEMBER 2010 | 31
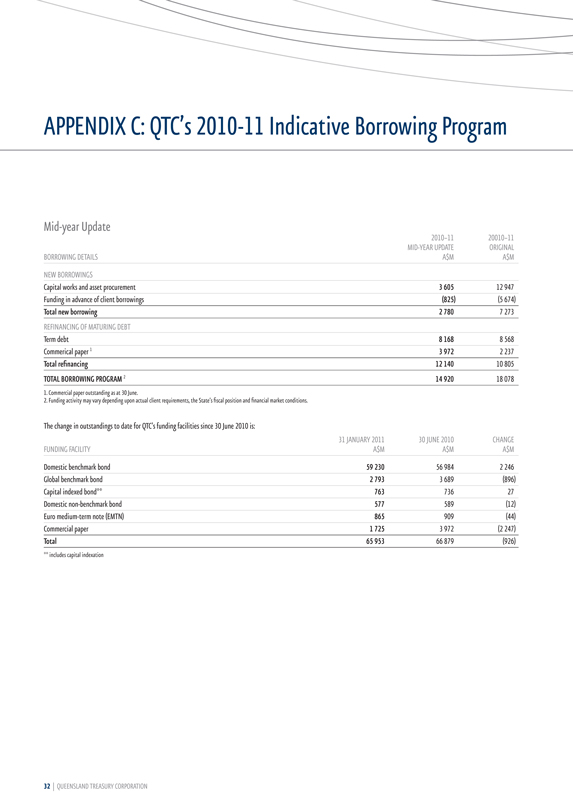
APPENDIX C: QTC’s 2010-11 Indicative Borrowing Program
Mid-year Update
2010–11 20010–11 MID-YEAR UPDATE ORIGINAL BORROWING DETAILS A$M A$M
NEW BORROWINGS
Capital works and asset procurement 3 605 12 947
Funding in advance of client borrowings (825) (5 674)
Total new borrowing 2 780 7 273
REFINANCING OF MATURING DEBT
Term debt 8 168 8 568
Commerical paper 1 3 972 2 237
Total refinancing 12 140 10 805
TOTAL BORROWING PROGRAM 2 14 920 18 078
1. Commercial paper outstanding as at 30 June.
2. Funding activity may vary depending upon actual client requirements, the State’s fiscal position and financial market conditions.
The change in outstandings to date for QTC’s funding facilities since 30 June 2010 is:
31 JANUARY 2011 30 JUNE 2010 CHANGE
FUNDING FACILITY A$M A$M A$M
Domestic benchmark bond 59 230 56 984 2 246
Global benchmark bond 2 793 3 689 (896)
Capital indexed bond** 763 736 27
Domestic non-benchmark bond 577 589 (12)
Euro medium-term note (EMTN) 865 909 (44)
Commercial paper 1 725 3 972 (2 247)
Total 65 953 66 879 (926)
** includes capital indexation
32 | QUEENSLAND TREASURY CORPORATION
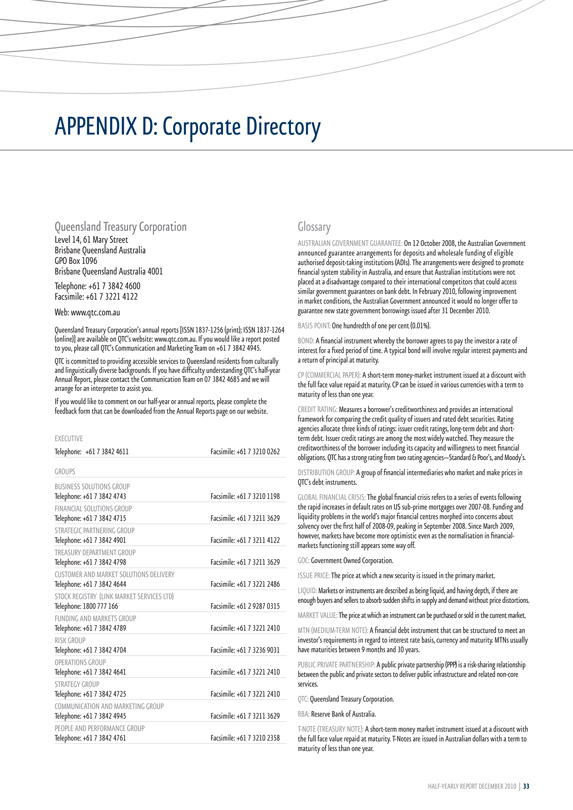
APPENDIX D: Corporate Directory
Queensland Treasury Corporation
Level 14, 61 Mary Street
Brisbane Queensland Australia
GPO Box 1096
Brisbane Queensland Australia 4001
Telephone: +61 7 3842 4600
Facsimile: +61 7 3221 4122
Web: www.qtc.com.au
Queensland Treasury Corporation’s annual reports [ISSN 1837-1256 (print); ISSN 1837-1264 (online)] are available on QTC’s website: www.qtc.com.au. If you would like a report posted to you, please call QTC’s Communication and Marketing Team on +61 7 3842 4945.
QTC is committed to providing accessible services to Queensland residents from culturally and linguistically diverse backgrounds. If you have difficulty understanding QTC’s half-year Annual Report, please contact the Communication Team on 07 3842 4685 and we will arrange for an interpreter to assist you.
If you would like to comment on our half-year or annual reports, please complete the feedback form that can be downloaded from the Annual Reports page on our website.
EXECUTIVE
Telephone: +61 7 3842 4611 Facsimile: +61 7 3210 0262
GROUPS
BUSINESS SOLUTIONS GROUP
Telephone: +61 7 3842 4743 Facsimile: +61 7 3210 1198
FINANCIAL SOLUTIONS GROUP
Telephone: +61 7 3842 4715 Facsimile: +61 7 3211 3629
STRATEGIC PARTNERING GROUP
Telephone: +61 7 3842 4901 Facsimile: +61 7 3211 4122
TREASURY DEPARTMENT GROUP
Telephone: +61 7 3842 4798 Facsimile: +61 7 3211 3629
CUSTOMER AND MARKET SOLUTIONS DELIVERY
Telephone: +61 7 3842 4644 Facsimile: +61 7 3221 2486
STOCK REGISTRY (LINK MARKET SERVICES LTD)
Telephone: 1800 777 166 Facsimile: +61 2 9287 0315
FUNDING AND MARKETS GROUP
Telephone: +61 7 3842 4789 Facsimile: +61 7 3221 2410
RISK GROUP
Telephone: +61 7 3842 4704 Facsimile: +61 7 3236 9031
OPERATIONS GROUP
Telephone: +61 7 3842 4641 Facsimile: +61 7 3221 2410
STRATEGY GROUP
Telephone: +61 7 3842 4725 Facsimile: +61 7 3221 2410
COMMUNICATION AND MARKETING GROUP
Telephone: +61 7 3842 4945 Facsimile: +61 7 3211 3629
PEOPLE AND PERFORMANCE GROUP
Telephone: +61 7 3842 4761 Facsimile: +61 7 3210 2358
Glossary
AUSTRALIAN GOVERNMENT GUARANTEE: On 12 October 2008, the Australian Government announced guarantee arrangements for deposits and wholesale funding of eligible authorised deposit-taking institutions (ADIs). The arrangements were designed to promote financial system stability in Australia, and ensure that Australian institutions were not placed at a disadvantage compared to their international competitors that could access similar government guarantees on bank debt. In February 2010, following improvement in market conditions, the Australian Government announced it would no longer offer to guarantee new state government borrowings issued after 31 December 2010.
BASIS POINT: One hundredth of one per cent (0.01%).
BOND: A financial instrument whereby the borrower agrees to pay the investor a rate of interest for a fixed period of time. A typical bond will involve regular interest payments and a return of principal at maturity.
CP (COMMERCIAL PAPER): A short-term money-market instrument issued at a discount with the full face value repaid at maturity. CP can be issued in various currencies with a term to maturity of less than one year.
CREDIT RATING: Measures a borrower’s creditworthiness and provides an international framework for comparing the credit quality of issuers and rated debt securities. Rating agencies allocate three kinds of ratings: issuer credit ratings, long-term debt and short-term debt. Issuer credit ratings are among the most widely watched. They measure the creditworthiness of the borrower including its capacity and willingness to meet financial obligations. QTC has a strong rating from two rating agencies—Standard & Poor’s, and Moody’s.
DISTRIBUTION GROUP: A group of financial intermediaries who market and make prices in QTC’s debt instruments.
GLOBAL FINANCIAL CRISIS: The global financial crisis refers to a series of events following the rapid increases in default rates on US sub-prime mortgages over 2007-08. Funding and liquidity problems in the world’s major financial centres morphed into concerns about solvency over the first half of 2008-09, peaking in September 2008. Since March 2009, however, markets have become more optimistic even as the normalisation in financial-markets functioning still appears some way off.
GOC: Government Owned Corporation.
ISSUE PRICE: The price at which a new security is issued in the primary market.
LIQUID: Markets or instruments are described as being liquid, and having depth, if there are enough buyers and sellers to absorb sudden shifts in supply and demand without price distortions.
MARKET VALUE: The price at which an instrument can be purchased or sold in the current market.
MTN (MEDIUM-TERM NOTE): A financial debt instrument that can be structured to meet an investor’s requirements in regard to interest rate basis, currency and maturity. MTNs usually have maturities between 9 months and 30 years.
PUBLIC PRIVATE PARTNERSHIP: A public private partnership (PPP) is a risk-sharing relationship between the public and private sectors to deliver public infrastructure and related non-core services.
QTC: Queensland Treasury Corporation.
RBA: Reserve Bank of Australia.
T-NOTE (TREASURY NOTE): A short-term money market instrument issued at a discount with the full face value repaid at maturity. T-Notes are issued in Australian dollars with a term to maturity of less than one year.
HALF-YEARLY REPORT DECEMBER 2010 | 33

Level 14, 61 Mary Street Brisbane Queensland Australia
GPO Box 1096 Brisbane Queensland Australia 4001
Telephone: +61 7 3842 4600 Facsimile: +61 7 3221 4122
www.qtc.com.au