EXHIBIT (c)(xiii)
Government of Queensland State Accounts June Quarter 2011.

Queensland
State
Accounts
June Quarter 2011
Queensland Government
Office of Economic and Statistical Research
For further information
Office of Economic and Statistical Research
Level 8
33 Charlotte Street
Brisbane Q 4000
Telephone: (07) 3224 5326
Facsimile: (07) 3227 7437
E-mail qsa@treasury.qld.gov.au
Websites
www.oesr.qld.gov.au/releases/qsa
or
www.treasury.qld.gov.au
© The State of Queensland (Queensland Treasury) 2011

You are free to copy, communicate and adapt the work, as long as you attribute the authors,
This document is licensed under a Creative Commons Attribution 2.5 Australia license.
To view a copy of this license, visit http://creativecommons.org./license/by/2.5/au
To attribute this work cite Queensland State Accounts, Office of Economic and Statistical Research, Queensland Treasury
ISSN 1321-2338
| | |

| | Queensland State Accounts, June Quarter 2011 |
TABLE I
Percentage change in Gross State/Domestic Product
Chain volume measures (2008-09 prices)
| | | | | | | | | | | | |
| | | Queensland
(a) | | | Rest of
Australia
(a) | | | Australia
(b) | |
TREND | | | | | | | | | | | | |
Mar qtr 11 to Jun qtr 11 | | | -0.1 | | | | 0.3 | | | | 0.2 | |
Jun qtr 10 to Jun qtr 11 | | | -1.7 | | | | 1.8 | | | | 1.1 | |
ORIGINAL | | | | | | | | | | | | |
Year-average (c) | | | 0.2 | | | | 2.3 | | | | 1.9 | |
| (a) | Source: OESR Queensland State Accounts |
| (c) | Reference quarter and the three preceding quarters compared with the same period a year earlier |
June Quarter 2011 – Key Points
Quarterly Results
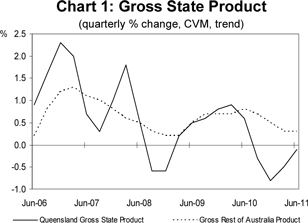
| • | | Queensland gross state product (GSP) declined 0.1 per cent in June quarter 2011, following a decline of 0.5 per cent in the March quarter 2011, to be 1.7 per cent lower over the year. In contrast, Rest of Australia recorded growth of 0.3 per cent in June quarter 2011. |
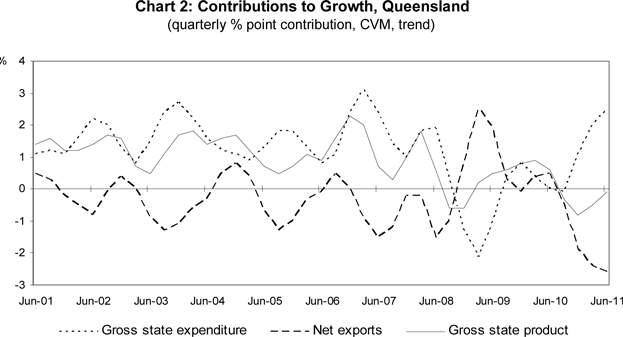
| • | | Gross state expenditure (a measure of domestic demand) strengthened further, rising 2.5 per cent in the June quarter, following an increase of 2.0 per cent in March quarter 2011. |
| • | | Offsetting the rise in domestic demand, the Queensland trade sector detracted 2.6 percentage points from economic growth in the June quarter. Both exports of goods and services (down 4.1 per cent) and imports of goods and services (up 3.2 per cent) detracted from Queensland’s growth. |
- 1 -
Annual Results
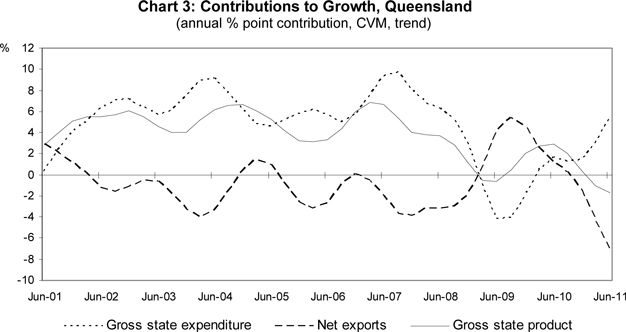
| • | | In real trend terms, GSP declined by 1.7 per cent over the year to June quarter 2011. This followed a decline of 1.0 per cent over the year to March quarter 2011. In contrast, gross Rest of Australia product grew by 1.8 per cent over the year to June quarter 2011. |
| • | | Gross state expenditure increased 5.7 per cent over the year to the June quarter. As a result, gross state expenditure contributed 5.5 percentage points to Queensland’s economic growth. The increase in domestic demand was mainly driven by higher business investment, household consumption and general government consumption, contributing 4.5, 1.3 and 0.7 percentage points respectively to Queensland GSP growth. |
| • | | Net exports detracted 7.2 percentage points from Queensland GSP growth over the year to the June quarter. Both exports of goods and services (down 15.4 per cent) and imports of goods and services (up 3.6 per cent) detracted from growth. |
Preliminary 2010-11 Outcome
| • | | The Queensland economy recorded year-average growth of 0.2 per cent (preliminary) in 2010-11, following growth of 2.2 per cent in 2009-10 and 0.6 per cent in 2008-09. This modest growth was largely due to the adverse impacts of natural disasters in March quarter 2011. |
| • | | A rebound in domestic demand, which contributed 2.7 percentage points to Queensland’s economic growth in 2010-11, was partially offset by a detraction from the trade sector. |
| • | | This preliminary estimate for Queensland’s economic performance for 2010-11 may be subject to revision over the coming quarters as updated ABS data are incorporated into the Queensland State Accounts. |
- 2 -
| | |
 | | Queensland State Accounts, June Quarter 2011 |
Expenditure on GSP – Main Features
Household Final Consumption Expenditure
Quarterly Results (Trend, CVM)
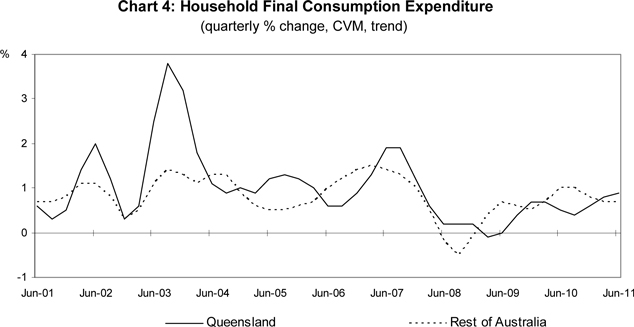
| • | | Queensland household final consumption expenditure increased 0.9 per cent in real trend terms in June quarter 2011, contributing 0.5 percentage point to GSP growth. |
| • | | Growth in household consumption was mainly driven by expenditure on health, food and rent and other dwelling services. These increases were partially offset by a decline in expenditure on the purchases of vehicles, and insurance and other financial services. |
| • | | In comparison, household consumption in the Rest of Australia recorded growth of 0.7 per cent, contributing 0.4 percentage point to growth in the Rest of Australia in the June quarter. |
Annual Results (Trend, CVM)
| • | | Queensland recorded household consumption growth of 2.7 per cent over the year to June quarter 2011, contributing 1.3 percentage points to annual growth in GSP. |
| • | | For the Rest of Australia, household consumption rose 3.3 per cent over the year to June quarter 2011, contributing 1.8 percentage points to annual growth in gross Rest of Australia product. |
- 3 -
Dwelling Investment
Quarterly Results (Trend, CVM)
| • | | Queensland dwelling investment continued to decline, down 1.8 per cent in June quarter 2011, following a 4.5 per cent decrease in March quarter 2011. |
| • | | The decrease in dwelling investment was driven by declines in both new and used dwelling investment (down 3.0 per cent) and alterations and additions (down 0.5 per cent). |
| • | | In contrast, dwelling investment in the Rest of Australia increased 1.8 per cent in the June quarter, following an increase of 2.0 per cent in the previous quarter. |
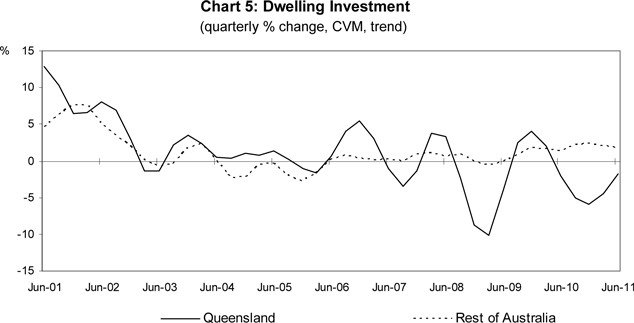
Annual Results (Trend, CVM)
| • | | Queensland dwelling investment decreased 16.2 per cent over the year to June quarter 2011, following a decline of 16.4 per cent over the year to March quarter 2011. This is the fourth consecutive annual decline in dwelling investment. Dwelling investment detracted 1.1 percentage points from annual GSP growth in June quarter 2011. |
| • | | The annual decrease was driven by a 20.3 per cent decline in new and used dwellings investment and an 11.4 per cent decline in alterations and additions. |
| • | | In contrast, dwelling investment in the Rest of Australia increased 8.5 per cent over the year to June quarter 2011, following an increase of 8.0 per cent over the year to March quarter 2011. |
- 4 -
| | |
 | | Queensland State Accounts, June Quarter 2011 |
Business Investment
Quarterly Results (Trend, CVM)
| • | | Queensland business investment (comprised of non-dwelling construction and machinery and equipment) increased at a record high 11.4 per cent in June quarter 2011, contributing 1.7 percentage points to GSP growth. |
| • | | The increase in business investment was driven by higher investment in both non-dwelling construction and machinery and equipment, up 13.8 and 8.5 per cent respectively. |
| • | | Rest of Australia business investment increased 0.2 per cent in the June quarter, with higher investment in machinery and equipment (up 3.0 per cent) more than offsetting a decline in non-dwelling construction investment (down 2.5 per cent). |
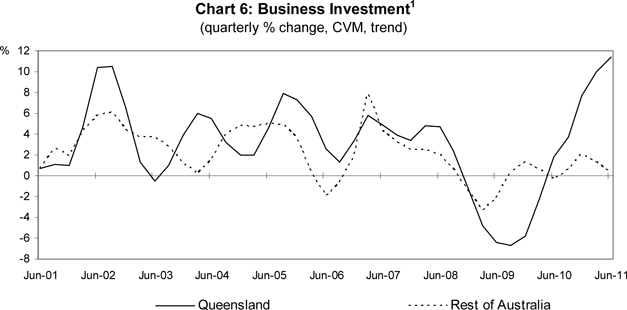
Annual Results (Trend, CVM)
| • | | Queensland business investment2 increased by a record 36.9 per cent over the year to June quarter 2011, following a 25.1 per cent increase over the year to March quarter 2011. |
| • | | Investment rose in both non-dwelling construction (up 44.2 per cent) and machinery and equipment (up 28.6 per cent) resulting in business investment contributing 4.5 percentage points to Queensland GSP growth over the year to June quarter 2011. |
| • | | Business investment in the Rest of Australia increased 4.3 per cent over the year to June quarter 2011, following an increase of 3.7 per cent over the year to March quarter. |
| 1 | In 2009 Tarong Energy completed the acquisition of the remaining 50 per cent of Tarong North Power Station not already owned and this transaction has been excluded from the underlying trend estimate for December quarter 2009. |
| 2 | In November 2010, the Queensland Government floated QR National and sold a 99-year lease on the Port of Brisbane. Users should interpret the trend estimate of business investment with caution around this period. |
- 5 -
Public Final Demand
Quarterly Results (Trend, CVM)
| • | | Queensland public final demand (comprised of general government consumption and investment and public corporations investment), decreased 0.7 per cent in June quarter 2011, following an decrease of 0.3 per cent in the previous quarter. Public final demand detracted 0.2 percentage point from GSP growth in the June quarter. |
| • | | The decrease in public final demand was driven by decreases in both public corporations investment3 (down 11.7 per cent) and general government investment (down 0.1 per cent) together detracting 0.3 percentage point from GSP growth. This was partly offset by an increase in general government consumption of 0.5 per cent, contributing 0.1 percentage point to GSP growth. |
| • | | Public final demand in the Rest of Australia increased 0.5 per cent in the June quarter, following 0.6 per cent growth in the previous quarter. |
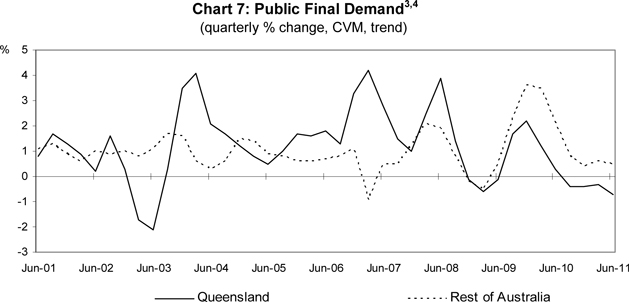
Annual Results (Trend, CVM)
| • | | Queensland public final demand decreased 1.8 per cent over the year to June quarter 2011, detracting 0.4 percentage point from GSP growth. This followed a decline of 0.8 per cent over the year to March quarter 2011. |
| • | | The decrease in public final demand was due to both lower general government investment (down 10.8 per cent) and lower public corporations investment (down 21.3 per cent) offsetting higher general government consumption (up 4.8 per cent). |
| • | | Public final demand in the Rest of Australia rose 2.3 per cent over the year to June quarter 2011, following growth of 3.9 per cent over the year to March quarter 2011. |
| 3 | In November 2010, the Queensland Government floated QR National and sold a 99-year lease on the Port of Brisbane. Users should interpret the trend estimate of public gross fixed capital formation, public corporations - state and local, with caution around this period. |
| 4 | Tarong Energy completed the acquisition of the remaining 50 per cent of Tarong North Power Station not already owned and this transaction has been excluded from the underlying trend estimate for December quarter 2009. Additionally, quarterly growth estimates for Rest of Australia in March quarter 2007 are affected by a trend break resulting from the privatisation of Telstra. |
- 6 -
| | |
 | | Queensland State Accounts, June Quarter 2011 |
Exports of Goods and Services
Quarterly (Trend, CVM)
| • | | Queensland exports of goods and services declined 4.1 per cent in June quarter 2011, with overseas and interstate exports declining 4.6 per cent and 2.8 per cent respectively. |
| • | | The decrease in overseas exports of goods and services was largely driven by a decline in exports of goods (down 5.1 per cent), underpinned by a large decline in coal exports. |
| • | | Lower interstate exports of goods and services was driven by a decrease in both exports of goods (down 3.1 per cent) and exports of selected services (down 1.8 per cent). |
| • | | In comparison, Rest of Australia recorded an increase of 0.4 per cent in aggregate exports of goods and services. A decline in overseas exports (down 0.1 per cent) was more than offset by a rise in interstate exports (up 3.2 per cent). |
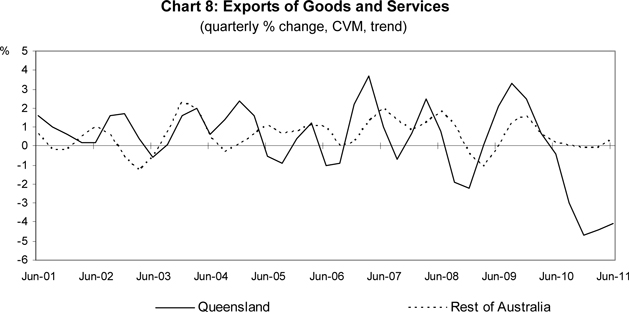
Annual (Trend, CVM)
| • | | In annual terms, Queensland exports of goods and services decreased 15.4 per cent over the year to June quarter 2011, detracting 6.0 percentage points from annual growth in GSP. The decrease in aggregate exports of goods and services was driven by declines in both overseas exports (down 18.2 per cent) and interstate exports (down 7.0 per cent). |
| • | | In contrast, exports of goods and services in the Rest of Australia increased 0.2 per cent over the year to June quarter 2011, after remaining unchanged over the year to March quarter 2011. |
- 7 -
Imports of Goods and Services
Quarterly Results (Trend, CVM)
| • | | Imports of goods and services rose 3.2 per cent in June quarter 2011. A rise in overseas imports (up 3.1 per cent) was complemented by a rise in interstate imports (up 3.2 per cent). |
| • | | Within aggregate overseas imports, overseas goods imports rose 2.8 per cent and overseas services imports were 4.2 per cent higher in the June quarter. |
| • | | The increase in interstate imports was driven by higher imports of goods (up 3.5 per cent) with interstate imports of selected services remaining unchanged. |
| • | | In comparison, imports of goods and services to the Rest of Australia increased 2.7 per cent in the June quarter, following growth of 2.4 per cent in March quarter 2010. |
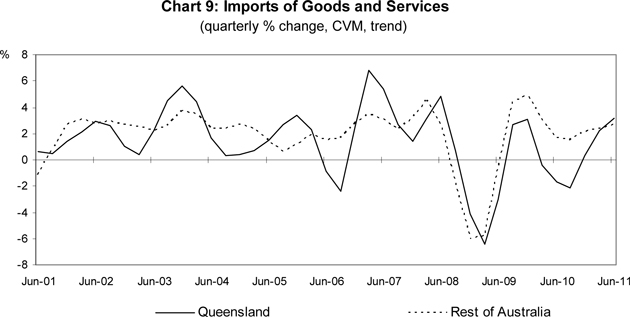
Annual Results (Trend, CVM)
| • | | In annual terms, Queensland imports of goods and services increased 3.6 per cent over the year to June quarter 2011, resulting in imports detracting 1.3 percentage points from annual GSP growth. |
| • | | In comparison, Rest of Australia imports of goods and services increased 9.0 per cent over the year to June quarter 2011, with an increase in overseas imports (up 10.6 per cent) more than offsetting a decline in interstate imports (down 7.0 per cent). |
- 8 -
| | |
 | | Queensland State Accounts, June Quarter 2011 |
Summary Tables
Table II
Changes and Contribution to Growth, Quarterly, Trend, Chain Volume Measures (a)
| | | | | | | | | | | | | | | | |
| | | Queensland | | | Rest of Australia (b) | |
| | | Quarterly
%
change
Mar-11
to Jun-11 | | | % point
contribution
to growth
in GSP
Mar-11 to
Jun-11 | | | Quarterly
%
change
Mar-11
to Jun-11 | | | % point
contribution
to growth
in GSP
Mar-11 to
Jun-11 | |
| | | | |
Household consumption | | | 0.9 | | | | 0.5 | | | | 0.7 | | | | 0.4 | |
| | | | |
Private investment | | | 7.0 | | | | 1.7 | | | | 0.7 | | | | 0.2 | |
Dwelling investment | | | -1.8 | | | | -0.1 | | | | 1.8 | | | | 0.1 | |
New and used | | | -3.0 | | | | -0.1 | | | | 1.4 | | | | 0.0 | |
Alterations and additions | | | -0.5 | | | | 0.0 | | | | 2.4 | | | | 0.1 | |
Business investment | | | 11.4 | | | | 1.7 | | | | 0.2 | | | | 0.0 | |
Non-dwelling construction | | | 13.8 | | | | 1.2 | | | | -2.5 | | | | -0.2 | |
Machinery and equipment | | | 8.5 | | | | 0.6 | | | | 3.0 | | | | 0.2 | |
| | | | |
Public final demand | | | -0.7 | | | | -0.2 | | | | 0.5 | | | | 0.1 | |
General government consumption | | | 0.5 | | | | 0.1 | | | | 0.7 | | | | 0.1 | |
Public corporations investment | | | -11.7 | | | | -0.3 | | | | 0.9 | | | | 0.0 | |
General government investment | | | -0.1 | | | | 0.0 | | | | -0.4 | | | | 0.0 | |
| | | | |
Changes in inventories | | | n.a. | | | | 0.6 | | | | n.a. | | | | 0.2 | |
| | | | |
Gross state expenditure | | | 2.5 | | | | 2.5 | | | | 1.0 | | | | 1.0 | |
| | | | |
Exports of goods and services | | | -4.1 | | | | -1.4 | | | | 0.4 | | | | 0.1 | |
Overseas | | | -4.6 | | | | -1.2 | | | | -0.1 | | | | 0.0 | |
Interstate | | | -2.8 | | | | -0.3 | | | | 3.2 | | | | 0.1 | |
| | | | |
less Imports of goods and services | | | 3.2 | | | | 1.1 | | | | 2.7 | | | | 0.8 | |
Overseas | | | 3.1 | | | | 0.6 | | | | 3.2 | | | | 0.8 | |
Interstate | | | 3.2 | | | | 0.5 | | | | -2.8 | | | | -0.1 | |
| | | | |
Gross state product (c) | | | -0.1 | | | | -0.1 | | | | 0.3 | | | | 0.3 | |
| (a) | Chain volume measure reference year 2008-09. |
| (b) | Due to the ABS methodology of estimating trend estimates in aggregate, rather than as the sum of the trend estimates of their components, the Rest of Australia contributions to growth are not additive. |
n.a. not applicable
| (c) | Includes statistical discrepancy. |
With respect to the real trend quarterly changes and contributions to growth in June quarter 2011:
| • | | Household final consumption expenditure in Queensland increased 0.9 per cent and contributed 0.5 percentage point to overall growth. |
| • | | Dwelling investment decreased 1.8 per cent and detracted 0.1 percentage point from GSP growth, while business investment (comprised of non-dwelling construction, and machinery and equipment) increased 11.4 per cent and contributed 1.7 percentage points to GSP growth. |
| • | | Public final demand (comprised of general government consumption and investment, and public corporations investment) decreased 0.7 per cent. |
| • | | Net exports detracted 2.6 percentage points from economic growth. Both exports of goods and services (down 4.1 per cent) and imports of goods and services (up 3.2 per cent) detracted from Queensland’s growth. |
- 9 -
Table III
Changes and Contribution to Growth, Annual, Trend, Chain Volume Measures (a)
| | | | | | | | | | | | | | | | |
| | | Queensland | | | Rest of Australia (b) | |
| | | Annual
% change
Jun-10 to
Jun-11 | | | % point
contribution
to growth
in GSP
Jun-10 to
Jun-11 | | | Annual
% change
Jun-10 to
Jun-11 | | | % point
contribution
to growth
in GSP
Jun-10 to
Jun-11 | |
| | | | |
Household consumption | | | 2.7 | | | | 1.3 | | | | 3.3 | | | | 1.8 | |
| | | | |
Private investment | | | 16.0 | | | | 3.5 | | | | 4.0 | | | | 0.9 | |
Dwelling investment | | | -16.2 | | | | -1.1 | | | | 8.5 | | | | 0.5 | |
New and used | | | -20.3 | | | | -0.7 | | | | 11.2 | | | | 0.4 | |
Alterations and additions | | | -11.4 | | | | -0.3 | | | | 4.7 | | | | 0.1 | |
Business investment | | | 36.9 | | | | 4.5 | | | | 4.3 | | | | 0.5 | |
Non-dwelling construction | | | 44.2 | | | | 2.9 | | | | 0.7 | | | | 0.0 | |
Machinery and equipment | | | 28.6 | | | | 1.7 | | | | 8.0 | | | | 0.5 | |
| | | | |
Public final demand | | | -1.8 | | | | -0.4 | | | | 2.3 | | | | 0.6 | |
General government consumption | | | 4.8 | | | | 0.7 | | | | 3.0 | | | | 0.6 | |
Public corporations investment | | | -21.3 | | | | -0.5 | | | | -2.7 | | | | 0.0 | |
General government investment | | | -10.8 | | | | -0.7 | | | | 1.6 | | | | 0.1 | |
| | | | |
Changes in inventories | | | n.a. | | | | 1.1 | | | | n.a. | | | | 0.9 | |
| | | | |
Gross state expenditure | | | 5.7 | | | | 5.5 | | | | 4.2 | | | | 4.2 | |
| | | | |
Exports of goods and services | | | -15.4 | | | | -6.0 | | | | 0.2 | | | | 0.1 | |
Overseas | | | -18.2 | | | | -5.3 | | | | 0.8 | | | | 0.2 | |
Interstate | | | -7.0 | | | | -0.7 | | | | -2.7 | | | | -0.1 | |
| | | | |
less Imports of goods and services | | | 3.6 | | | | 1.3 | | | | 9.0 | | | | 2.4 | |
Overseas | | | 8.9 | | | | 1.7 | | | | 10.6 | | | | 2.6 | |
Interstate | | | -2.7 | | | | -0.4 | | | | -7.0 | | | | -0.2 | |
| | | | |
Gross state product (c) | | | -1.7 | | | | -1.7 | | | | 1.8 | | | | 1.8 | |
n.a. not applicable
| (a) | Chain volume measure reference year 2008-09. |
| (b) | Due to the ABS methodology of estimating trend estimates in aggregate, rather than as the sum of the trend estimates of their components, the Rest of Australia contributions to growth are not additive. |
| (c) | Includes statistical discrepancy. |
With respect to the real trend annual changes and contributions to growth for Queensland over the year to June quarter 2011:
| • | | Household final consumption expenditure increased 2.7 per cent and contributed 1.3 percentage points to annual GSP growth. |
| • | | Dwelling investment in Queensland decreased 16.2 per cent, resulting in a 1.1 percentage points detraction from overall growth. |
| • | | Business investment (comprised of non-dwelling construction, and machinery and equipment) increased 36.9 per cent and contributed 4.5 percentage points to Queensland annual GSP growth. |
| • | | Public final demand (comprised of general government consumption and investment, and public corporations investment) decreased 1.8 per cent, resulting in a 0.4 percentage point detraction from overall growth. |
| • | | Net exports detracted 7.2 percentage points from Queensland’s annual economic growth. A 6.0 percentage points detraction from exports was complemented by a 1.3 percentage points detraction from imports. |
- 10 -
| | |
 | | Queensland State Accounts, June Quarter 2011 |
Table IV
Changes and Contribution to Growth, Quarterly, Trend, Current Prices
| | | | | | | | | | | | | | | | |
| | | Queensland | | | Rest of Australia (a) | |
| | | Quarterly
%
change
Mar-11
to Jun-11 | | | % point
contribution
to growth
in GSP
Mar-11 to
Jun-11 | | | Quarterly
%
change
Mar-11
to Jun-11 | | | % point
contribution
to growth
in GSP
Mar-11 to
Jun-11 | |
| | | | |
Compensation of employees | | | 1.8 | | | | 0.9 | | | | 2.1 | | | | 1.0 | |
Gross operating surplus and mixed income | | | 1.1 | | | | 0.5 | | | | 0.8 | | | | 0.3 | |
Gross state product at factor cost | | | 1.5 | | | | 1.3 | | | | 1.5 | | | | 1.4 | |
Taxes less subsidies on production and imports | | | 1.3 | | | | 0.1 | | | | 2.0 | | | | 0.2 | |
| | | | |
Gross state product (b) | | | 1.3 | | | | 1.3 | | | | 1.6 | | | | 1.6 | |
| | | | |
Household consumption | | | 1.7 | | | | 0.9 | | | | 1.2 | | | | 0.6 | |
| | | | |
Private investment | | | 6.6 | | | | 1.5 | | | | 0.4 | | | | 0.1 | |
Dwelling investment | | | -1.1 | | | | -0.1 | | | | 2.3 | | | | 0.1 | |
New and used | | | -2.3 | | | | -0.1 | | | | 1.8 | | | | 0.1 | |
Alterations and additions | | | 0.2 | | | | 0.0 | | | | 3.1 | | | | 0.1 | |
Business investment | | | 10.9 | | | | 1.5 | | | | -0.5 | | | | -0.1 | |
Non-dwelling construction | | | 14.4 | | | | 1.1 | | | | -2.2 | | | | -0.1 | |
Machinery and equipment | | | 6.5 | | | | 0.4 | | | | 1.4 | | | | 0.1 | |
| | | | |
Public final demand | | | -0.4 | | | | -0.1 | | | | 0.9 | | | | 0.2 | |
General government consumption | | | 0.7 | | | | 0.1 | | | | 1.1 | | | | 0.2 | |
Public corporations investment | | | -10.6 | | | | -0.2 | | | | 1.1 | | | | 0.0 | |
General government investment | | | 0.2 | | | | 0.0 | | | | -0.4 | | | | 0.0 | |
| | | | |
Changes in inventories | | | n.a. | | | | 0.4 | | | | n.a. | | | | 0.3 | |
| | | | |
Gross state expenditure | | | 2.7 | | | | 2.7 | | | | 1.4 | | | | 1.4 | |
| | | | |
Exports of goods and services | | | -0.9 | | | | -0.3 | | | | 2.5 | | | | 0.6 | |
Overseas | | | -0.6 | | | | -0.1 | | | | 2.4 | | | | 0.5 | |
Interstate | | | -1.8 | | | | -0.2 | | | | 2.9 | | | | 0.1 | |
| | | | |
less Imports of goods and services | | | 3.4 | | | | 1.1 | | | | 2.0 | | | | 0.5 | |
Overseas | | | 3.9 | | | | 0.7 | | | | 2.4 | | | | 0.5 | |
Interstate | | | 2.9 | | | | 0.4 | | | | -1.8 | | | | 0.0 | |
| | | | |
Gross state product (b) | | | 1.3 | | | | 1.3 | | | | 1.6 | | | | 1.6 | |
n.a. not applicable
| (a) | Due to the ABS methodology of estimating trend estimates in aggregate, rather than as the sum of the trend estimates of their components, the Rest of Australia contributions to growth are not additive. |
| (b) | Includes statistical discrepancy. |
With respect to the current price trend quarterly changes and contributions to growth in June quarter 2011:
| • | | Compensation of employees increased 1.8 per cent in Queensland, compared with growth of 2.1 per cent for the Rest of Australia. |
| • | | Gross operating surplus and mixed income increased 1.1 per cent in Queensland in comparison to an increase of 0.8 per cent in the Rest of Australia. |
| • | | Household final consumption increased 1.7 per cent and contributed 0.9 percentage point to nominal GSP growth. |
| • | | In current price terms, Queensland overseas exports of goods and services decreased by 0.6 per cent in the quarter, with a decline in export volumes (down 4.6 per cent) offsetting higher prices (up 4.2 per cent). Overseas imports of goods and services increased 3.9 per cent in the June quarter, reflecting both increased import volumes (up 3.1 per cent) and increased prices (up 0.7 per cent). |
- 11 -
Table V
Changes and Contribution to Growth, Annual, Trend, Current Prices
| | | | | | | | | | | | | | | | |
| | | Queensland | | | Rest of Australia (a) | |
| | | Annual
% change
Jun-10 to
Jun-11 | | | % point
contribution
to growth
in GSP
Jun-10 to
Jun-11 | | | Annual
% change
Jun-10 to
Jun-11 | | | % point
contribution
to growth
in GSP
Jun-10 to
Jun-11 | |
| | | | |
Compensation of employees | | | 7.2 | | | | 3.4 | | | | 8.2 | | | | 3.9 | |
Gross operating surplus and mixed income | | | 0.4 | | | | 0.2 | | | | 3.8 | | | | 1.6 | |
Gross state product at factor cost | | | 3.9 | | | | 3.5 | | | | 7.0 | | | | 6.3 | |
Taxes less subsidies on production and imports | | | 5.3 | | | | 0.5 | | | | 7.1 | | | | 0.7 | |
Gross state product (b) | | | 3.8 | | | | 3.8 | | | | 7.0 | | | | 7.0 | |
| | | | |
Household consumption | | | 5.5 | | | | 2.8 | | | | 5.9 | | | | 3.1 | |
| | | | |
Private investment | | | 15.0 | | | | 3.2 | | | | 4.1 | | | | 0.9 | |
Dwelling investment | | | -14.4 | | | | -1.0 | | | | 11.2 | | | | 0.6 | |
New and used | | | -19.0 | | | | -0.7 | | | | 13.8 | | | | 0.4 | |
Alterations and additions | | | -9.2 | | | | -0.3 | | | | 7.5 | | | | 0.2 | |
Business investment | | | 34.7 | | | | 4.1 | | | | 2.5 | | | | 0.3 | |
Non-dwelling construction | | | 46.9 | | | | 3.0 | | | | 3.1 | | | | 0.2 | |
Machinery and equipment | | | 21.0 | | | | 1.2 | | | | 2.0 | | | | 0.1 | |
| | | | |
Public final demand | | | -1.5 | | | | -0.4 | | | | 4.0 | | | | 1.0 | |
General government consumption | | | 3.9 | | | | 0.7 | | | | 4.7 | | | | 0.9 | |
Public corporations investment | | | -17.4 | | | | -0.4 | | | | 0.3 | | | | 0.0 | |
General government investment | | | -10.7 | | | | -0.6 | | | | 2.7 | | �� | | 0.1 | |
| | | | |
Changes in inventories | | | n.a. | | | | 1.1 | | | | n.a. | | | | 1.0 | |
| | | | |
Gross state expenditure | | | 6.8 | | | | 6.7 | | | | 6.2 | | | | 6.2 | |
| | | | |
Exports of goods and services | | | -6.0 | | | | -2.0 | | | | 7.0 | | | | 1.7 | |
Overseas | | | -6.8 | | | | -1.6 | | | | 8.8 | | | | 1.9 | |
Interstate | | | -4.0 | | | | -0.4 | | | | -3.5 | | | | -0.1 | |
| | | | |
less Imports of goods and services | | | 3.0 | | | | 1.0 | | | | 5.5 | | | | 1.3 | |
Overseas | | | 8.9 | | | | 1.5 | | | | 6.6 | | | | 1.4 | |
Interstate | | | -3.5 | | | | -0.5 | | | | -4.0 | | | | -0.1 | |
| | | | |
Gross state product (b) | | | 3.8 | | | | 3.8 | | | | 7.0 | | | | 7.0 | |
n.a. not applicable
| (a) | Due to the ABS methodology of estimating trend estimates in aggregate, rather than as the sum of the trend estimates of their components, the Rest of Australia contributions to growth are not additive. |
| (b) | Includes statistical discrepancy. |
With respect to the current price annual changes and contributions to growth over the year to June quarter 2011:
| • | | Compensation of employees increased 7.2 per cent in Queensland and contributed 3.4 percentage points to annual nominal GSP growth. |
| • | | Queensland gross operating surplus and mixed income increased 0.4 per cent, compared with a 3.8 per cent rise for Rest of Australia. |
| • | | Queensland exports of goods and services decreased 6.0 per cent in annual terms, driven by lower export volumes (down 15.4 per cent) partially offset by a 11.1 per cent rise in the price of exports. |
| • | | Queensland imports of goods and services rose 3.0 per cent, driven by a rise in import volumes (up 3.6 per cent) and a moderate decline in import prices (down 0.5 per cent). |
- 12 -
| | |
 | | Queensland State Accounts, June Quarter 2011 |
Performance of the Queensland Economy in 2010-11
This June quarter 2011 edition of the Queensland State Accounts contains the first preliminary estimate for the 2010-11 financial year and may be subject to revision.
The Queensland economy recorded year-average growth of 0.2 per cent in 2010-11 following growth of 2.2 per cent in 2009-10 and 0.6 per cent in 2008-09. This preliminary result was largely due to the adverse impacts of natural disasters in March quarter 2011. This compares with year-average growth in the Rest of Australia of 2.3 per cent in 2010-11.
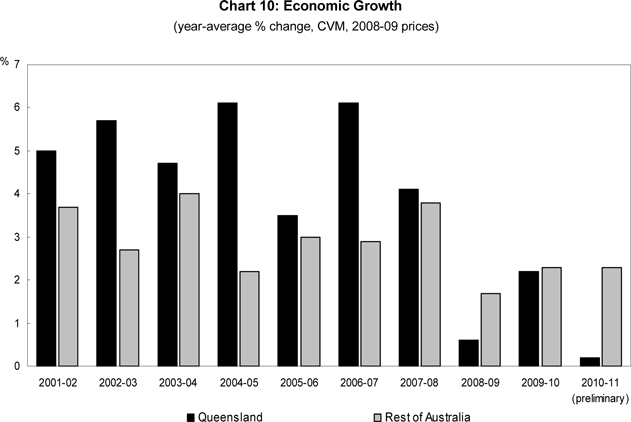
A rebound in domestic demand, which contributed 2.7 percentage points to Queensland’s economic growth in 2010-11, was partially offset by a 2.8 percentage points detraction from the trade sector.
Household final consumption expenditure, up 2.4 per cent in 2010-11, contributed 1.2 percentage points to GSP in 2010-11.
Dwelling investment declined by 12.9 per cent, detracting 0.9 percentage point from GSP in 2010-11.
A strong rebound in business investment, up 20.0 per cent in 2010-11 following a decline of 19.3 per cent in 2009-10, contributed 2.5 percentage points to Queensland GSP growth. Both components of business investment rose. Non-dwelling construction increased 25.5 per cent, driven mainly by a resources-related surge in engineering construction, and machinery and equipment rose 14.1 per cent.
- 13 -
Public final demand declined 0.4 per cent in 2010-11, with growth in general government consumption more than offset by lower public corporations investment5 and general government investment. Public corporation investment declined by 13.7 per cent and detracted 0.4 percentage point from GSP growth in 2010-11. Following several years of very strong growth, general government investment declined 8.5 per cent, detracting 0.5 percentage point from Queensland’s economic growth in 2010-11.
The trade sector (net exports) detracted 2.8 percentage points from Queensland’s economic growth in 2010-11, a turnaround from a contribution of 3.6 percentage points in 2009-10. The adverse impact of natural disasters on commodity production and transportation resulted in a record decline in exports of goods and services (down 7.8 per cent), which more than offset a minor decline in imports of goods and services (down 0.7 per cent) in 2010-11.
Gross Rest of Australia product increased 2.3 per cent in 2010-11. Growth for the Rest of Australia was driven by domestic demand, which was partly offset by a detraction from net exports.
Table VI
Changes and Contribution to Growth, 2010-11, Year-Average, CVM (a)
| | | | | | | | | | | | | | | | |
| | | Queensland | | | Rest of Australia | |
| | | Year-average
% change
2009-10 to
2010-11 (p) | | | % point
contribution
to growth
in GSP
2009-10 to
2010-11 (p) | | | Year-average
% change
2009-10 to
2010-11 (p) | | | % point
contribution
to growth
in GSP
2009-10 to
2010-11 (p) | |
| | | | |
Household consumption | | | 2.4 | | | | 1.2 | | | | 3.5 | | | | 1.9 | |
| | | | |
Private investment | | | 6.3 | | | | 1.4 | | | | 3.5 | | | | 0.8 | |
Dwelling investment | | | -12.9 | | | | -0.9 | | | | 7.4 | | | | 0.4 | |
New and used | | | -17.9 | | | | -0.7 | | | | 11.5 | | | | 0.4 | |
Alterations and additions | | | -6.8 | | | | -0.2 | | | | 1.9 | | | | 0.0 | |
Business investment | | | 20.0 | | | | 2.5 | | | | 3.4 | | | | 0.4 | |
Non-dwelling construction | | | 25.5 | | | | 1.7 | | | | 6.9 | | | | 0.4 | |
Machinery and equipment | | | 14.1 | | | | 0.8 | | | | 0.0 | | | | 0.0 | |
| | | | |
Public final demand | | | -0.4 | | | | -0.1 | | | | 5.8 | | | | 1.4 | |
General government consumption | | | 5.0 | | | | 0.8 | | | | 4.0 | | | | 0.7 | |
Public corporations investment | | | -13.7 | | | | -0.4 | | | | -1.3 | | | | 0.0 | |
General government investment | | | -8.5 | | | | -0.5 | | | | 17.5 | | | | 0.7 | |
| | | | |
Changes in inventories | | | n.a. | | | | 0.2 | | | | n.a. | | | | 0.2 | |
| | | | |
Gross state expenditure | | | 2.8 | | | | 2.7 | | | | 4.2 | | | | 4.3 | |
| | | | |
Exports of goods and services | | | -7.8 | | | | -3.0 | | | | 0.2 | | | | 0.1 | |
Overseas | | | -6.6 | | | | -1.9 | | | | 2.3 | | | | 0.5 | |
Interstate | | | -11.0 | | | | -1.2 | | | | -10.5 | | | | -0.4 | |
| | | | |
less Imports of goods and services | | | -0.7 | | | | -0.2 | | | | 9.0 | | | | 2.4 | |
Overseas | | | 8.4 | | | | 1.5 | | | | 11.2 | | | | 2.7 | |
Interstate | | | -10.5 | | | | -1.8 | | | | -11.0 | | | | -0.3 | |
| | | | |
Gross state product (b) | | | 0.2 | | | | 0.2 | | | | 2.3 | | | | 2.3 | |
| (a) | Chain volume measure reference year 2008-09. |
n.a. not applicable
| (b) | Includes statistical discrepancy. |
| 5 | In November 2010, the Queensland Government floated QR National and sold a 99-year lease on the Port of Brisbane. Users should interpret the estimate of business investment and public gross fixed capital formation, public corporations - state and local, with caution around this period. |
- 14 -
| | |
 | | Queensland State Accounts, June Quarter 2011 |
Queensland State Accounts - Tables
| | | | | | |
| Table | | Domestic Production Account – Queensland | | Page | |
| 1 | | Trend, chain volume measures, $m | | | 16 | |
| 2 | | Trend, chain volume measures, quarterly % change | | | 18 | |
| 3 | | Trend, chain volume measures, quarterly contribution to growth, % points | | | 20 | |
| 4 | | Trend, chain volume measures, annual % change | | | 22 | |
| 5 | | Trend, chain volume measures, annual contribution to growth, % points | | | 24 | |
Additional tables available on the Internet
URL: http://www.oesr.qld.gov.au/releases/qsatables
| | |
| Table | | Domestic Production Account – Queensland |
| |
| 6 | | Seasonally adjusted, chain volume measures, $m |
| 7 | | Seasonally adjusted, chain volume measures, quarterly % change |
| 8 | | Seasonally adjusted, chain volume measures, annual % change |
| 9 | | Original, chain volume measures, $m |
| 10 | | Original, chain volume measures, annual % change |
| 11 | | Trend, current prices, $m |
| 12 | | Trend, current prices, quarterly % change |
| 13 | | Trend, current prices, quarterly contribution to growth, % points |
| 14 | | Seasonally adjusted, current prices, $m |
| 15 | | Seasonally adjusted, current prices, quarterly % change |
| 16 | | Seasonally adjusted, current prices, quarterly contribution to growth, % points |
| 17 | | Original, current prices, $m |
| 18 | | Original, current prices, annual % change |
| 19 | | Trend, implicit price deflators, 2008-09 = 100 |
| 20 | | Original, implicit price deflators, 2008-09 = 100 |
| |
| Table | | Domestic Production Account - Rest of Australia |
| |
| 21 | | Trend, chain volume measures, $m |
| 22 | | Trend, chain volume measures, quarterly % change |
| 23 | | Seasonally adjusted, chain volume measures, $m |
| 24 | | Original, chain volume measures, $m |
| 25 | | Trend, current prices, $m |
| 26 | | Original, current prices, $m |
| 27 | | Trend, implicit price deflators, 2008-09 = 100 |
- 15 -
| | |
| DOMESTIC PRODUCTION ACCOUNT - QUEENSLAND | | TABLE 1 |
| (Trend, chain volume measure (a), $m) | | |
| | | | | | | | | | | | | | | | | | | | | | | | | | | | | | | | | | | | | | | | | | | | | | | | | | | | |
| | | 2007-08 | | | 2008-09 | | | 2009-10 | | | 2010-11 | |
| | | Jun | | | Sep | | | Dec | | | Mar | | | Jun | | | Sep | | | Dec | | | Mar | | | Jun | | | Sep | | | Dec | | | Mar | | | Jun | |
| | | | | | | | | | | | | |
Final consumption expenditure | | | 41,347 | | | | 41,518 | | | | 41,658 | | | | 41,649 | | | | 41,641 | | | | 41,827 | | | | 42,148 | | | | 42,475 | | | | 42,731 | | | | 43,016 | | | | 43,379 | | | | 43,745 | | | | 44,088 | |
| | | | | | | | | | | | | |
Households | | | 31,640 | | | | 31,701 | | | | 31,774 | | | | 31,748 | | | | 31,747 | | | | 31,875 | | | | 32,113 | | | | 32,348 | | | | 32,514 | | | | 32,640 | | | | 32,840 | | | | 33,093 | | | | 33,382 | |
| | | | | | | | | | | | | |
General government | | | 9,708 | | | | 9,818 | | | | 9,884 | | | | 9,901 | | | | 9,895 | | | | 9,952 | | | | 10,034 | | | | 10,127 | | | | 10,218 | | | | 10,376 | | | | 10,539 | | | | 10,652 | | | | 10,706 | |
National | | | 3,057 | | | | 3,096 | | | | 3,125 | | | | 3,118 | | | | 3,081 | | | | 3,040 | | | | 2,994 | | | | 2,995 | | | | 3,067 | | | | 3,187 | | | | 3,287 | | | | 3,335 | | | | 3,349 | |
State and local | | | 6,646 | | | | 6,721 | | | | 6,759 | | | | 6,783 | | | | 6,813 | | | | 6,912 | | | | 7,040 | | | | 7,132 | | | | 7,151 | | | | 7,188 | | | | 7,252 | | | | 7,317 | | | | 7,357 | |
| | | | | | | | | | | | | |
Private gross fixed capital formation (b) (c) | | | 17,409 | | | | 17,374 | | | | 16,773 | | | | 15,871 | | | | 15,164 | | | | 14,736 | | | | 14,473 | | | | 14,354 | | | | 14,294 | | | | 14,287 | | | | 14,710 | | | | 15,487 | | | | 16,574 | |
| | | | | | | | | | | | | |
Dwellings | | | 5,214 | | | | 5,088 | | | | 4,645 | | | | 4,171 | | | | 4,009 | | | | 4,111 | | | | 4,279 | | | | 4,370 | | | | 4,283 | | | | 4,066 | | | | 3,827 | | | | 3,653 | | | | 3,588 | |
New and used | | | 3,113 | | | | 3,006 | | | | 2,730 | | | | 2,448 | | | | 2,342 | | | | 2,331 | | | | 2,357 | | | | 2,373 | | | | 2,309 | | | | 2,179 | | | | 2,022 | | | | 1,896 | | | | 1,840 | |
Alterations and additions | | | 2,101 | | | | 2,082 | | | | 1,915 | | | | 1,723 | | | | 1,667 | | | | 1,779 | | | | 1,922 | | | | 1,997 | | | | 1,974 | | | | 1,887 | | | | 1,805 | | | | 1,757 | | | | 1,748 | |
| | | | | | | | | | | | | |
Business Investment (b) (c) | | | 10,176 | | | | 10,416 | | | | 10,289 | | | | 9,799 | | | | 9,173 | | | | 8,557 | | | | 8,058 | | | | 7,875 | | | | 8,016 | | | | 8,314 | | | | 8,956 | | | | 9,853 | | | | 10,973 | |
Non-dwelling construction (b) | | | 4,696 | | | | 4,942 | | | | 5,035 | | | | 4,900 | | | | 4,620 | | | | 4,369 | | | | 4,169 | | | | 4,139 | | | | 4,231 | | | | 4,366 | | | | 4,754 | | | | 5,364 | | | | 6,103 | |
Machinery and equipment (b) | | | 5,480 | | | | 5,474 | | | | 5,254 | | | | 4,899 | | | | 4,552 | | | | 4,188 | | | | 3,890 | | | | 3,735 | | | | 3,786 | | | | 3,948 | | | | 4,202 | | | | 4,489 | | | | 4,870 | |
| | | | | | | | | | | | | |
Livestock and orchards | | | 194 | | | | 200 | | | | 206 | | | | 209 | | | | 213 | | | | 217 | | | | 222 | | | | 228 | | | | 235 | | | | 244 | | | | 249 | | | | 250 | | | | 248 | |
Intellectual property products | | | 900 | | | | 892 | | | | 878 | | | | 875 | | | | 899 | | | | 940 | | | | 979 | | | | 1,006 | | | | 1,016 | | | | 1,016 | | | | 1,024 | | | | 1,047 | | | | 1,082 | |
Ownership transfer costs | | | 923 | | | | 787 | | | | 721 | | | | 770 | | | | 860 | | | | 920 | | | | 902 | | | | 841 | | | | 761 | | | | 696 | | | | 643 | | | | 602 | | | | 556 | |
| | | | | | | | | | | | | |
Public gross fixed capital formation (b) (c) | | | 5,156 | | | | 5,284 | | | | 5,198 | | | | 5,085 | | | | 5,075 | | | | 5,275 | | | | 5,535 | | | | 5,627 | | | | 5,576 | | | | 5,360 | | | | 5,134 | | | | 4,974 | | | | 4,804 | |
| | | | | | | | | | | | | |
Public corporations (b) (c) | | | 2,181 | | | | 2,174 | | | | 2,082 | | | | 1,991 | | | | 1,898 | | | | 1,827 | | | | 1,711 | | | | 1,605 | | | | 1,604 | | | | 1,600 | | | | 1,542 | | | | 1,430 | | | | 1,263 | |
Commonwealth (b) | | | 52 | | | | 43 | | | | 43 | | | | 58 | | | | 82 | | | | 102 | | | | 102 | | | | 87 | | | | 72 | | | | 68 | | | | 78 | | | | 91 | | | | 105 | |
State and local (c) | | | 2,131 | | | | 2,131 | | | | 2,039 | | | | 1,933 | | | | 1,815 | | | | 1,725 | | | | 1,609 | | | | 1,518 | | | | 1,532 | | | | 1,532 | | | | 1,464 | | | | 1,338 | | | | 1,157 | |
| | | | | | | | | | | | | |
General government | | | 2,999 | | | | 3,110 | | | | 3,116 | | | | 3,095 | | | | 3,178 | | | | 3,448 | | | | 3,824 | | | | 4,022 | | | | 3,972 | | | | 3,760 | | | | 3,591 | | | | 3,545 | | | | 3,542 | |
National | | | 672 | | | | 705 | | | | 655 | | | | 584 | | | | 565 | | | | 617 | | | | 686 | | | | 738 | | | | 765 | | | | 766 | | | | 765 | | | | 770 | | | | 776 | |
State and local | | | 2,317 | | | | 2,405 | | | | 2,461 | | | | 2,511 | | | | 2,613 | | | | 2,831 | | | | 3,138 | | | | 3,285 | | | | 3,207 | | | | 2,994 | | | | 2,826 | | | | 2,775 | | | | 2,766 | |
| | | | | | | | | | | | | |
Change in inventories | | | 333 | | | | 292 | | | | 4 | | | | -272 | | | | -270 | | | | 26 | | | | 238 | | | | 203 | | | | 49 | | | | -65 | | | | 84 | | | | 375 | | | | 740 | |
| | | | | | | | | | | | | |
Gross state expenditure | | | 64,270 | | | | 64,468 | | | | 63,634 | | | | 62,333 | | | | 61,611 | | | | 61,864 | | | | 62,393 | | | | 62,659 | | | | 62,650 | | | | 62,597 | | | | 63,307 | | | | 64,581 | | | | 66,206 | |
- 16 -
| | | | | | | | | | | | | | | | | | | | | | | | | | | | | | | | | | | | | | | | | | | | | | | | | | | | |
Exports of goods and services | | | 24,272 | | | | 23,821 | | | | 23,292 | | | | 23,326 | | | | 23,827 | | | | 24,608 | | | | 25,233 | | | | 25,401 | | | | 25,302 | | | | 24,536 | | | | 23,375 | | | | 22,335 | | | | 21,412 | |
| | | | | | | | | | | | | |
Overseas | | | 17,355 | | | | 17,234 | | | | 17,118 | | | | 17,228 | | | | 17,309 | | | | 17,534 | | | | 18,061 | | | | 18,671 | | | | 19,010 | | | | 18,394 | | | | 17,266 | | | | 16,311 | | | | 15,557 | |
Goods | | | 14,441 | | | | 14,311 | | | | 14,216 | | | | 14,353 | | | | 14,496 | | | | 14,799 | | | | 15,398 | | | | 16,060 | | | | 16,387 | | | | 15,779 | | | | 14,683 | | | | 13,774 | | | | 13,074 | |
Services | | | 2,914 | | | | 2,924 | | | | 2,901 | | | | 2,875 | | | | 2,813 | | | | 2,735 | | | | 2,663 | | | | 2,610 | | | | 2,622 | | | | 2,615 | | | | 2,583 | | | | 2,537 | | | | 2,483 | |
| | | | | | | | | | | | | |
Interstate | | | 6,917 | | | | 6,587 | | | | 6,175 | | | | 6,098 | | | | 6,518 | | | | 7,074 | | | | 7,172 | | | | 6,730 | | | | 6,293 | | | | 6,142 | | | | 6,110 | | | | 6,023 | | | | 5,854 | |
Goods | | | 5,395 | | | | 5,156 | | | | 4,814 | | | | 4,749 | | | | 5,132 | | | | 5,651 | | | | 5,741 | | | | 5,303 | | | | 4,856 | | | | 4,696 | | | | 4,683 | | | | 4,630 | | | | 4,485 | |
Selected services | | | 1,522 | | | | 1,431 | | | | 1,360 | | | | 1,350 | | | | 1,386 | | | | 1,423 | | | | 1,431 | | | | 1,427 | | | | 1,436 | | | | 1,446 | | | | 1,427 | | | | 1,394 | | | | 1,369 | |
| | | | | | | | | | | | | |
less Imports of goods and services | | | 24,948 | | | | 25,135 | | | | 24,100 | | | | 22,560 | | | | 21,885 | | | | 22,485 | | | | 23,171 | | | | 23,083 | | | | 22,692 | | | | 22,220 | | | | 22,297 | | | | 22,785 | | | | 23,510 | |
| | | | | | | | | | | | | |
less Overseas | | | 12,363 | | | | 12,301 | | | | 11,601 | | | | 10,844 | | | | 10,660 | | | | 11,109 | | | | 11,779 | | | | 12,212 | | | | 12,418 | | | | 12,505 | | | | 12,735 | | | | 13,106 | | | | 13,517 | |
less Goods | | | 9,402 | | | | 9,403 | | | | 8,869 | | | | 8,240 | | | | 8,053 | | | | 8,410 | | | | 8,987 | | | | 9,333 | | | | 9,457 | | | | 9,469 | | | | 9,595 | | | | 9,844 | | | | 10,119 | |
less Services | | | 2,961 | | | | 2,898 | | | | 2,732 | | | | 2,603 | | | | 2,607 | | | | 2,699 | | | | 2,792 | | | | 2,879 | | | | 2,961 | | | | 3,035 | | | | 3,140 | | | | 3,262 | | | | 3,398 | |
| | | | | | | | | | | | | |
less Interstate | | | 12,585 | | | | 12,834 | | | | 12,499 | | | | 11,717 | | | | 11,225 | | | | 11,377 | | | | 11,392 | | | | 10,871 | | | | 10,274 | | | | 9,716 | | | | 9,562 | | | | 9,679 | | | | 9,993 | |
less Goods | | | 11,646 | | | | 11,922 | | | | 11,628 | | | | 10,888 | | | | 10,416 | | | | 10,523 | | | | 10,520 | | | | 9,972 | | | | 9,347 | | | | 8,814 | | | | 8,701 | | | | 8,846 | | | | 9,160 | |
less Selected services | | | 939 | | | | 912 | | | | 871 | | | | 829 | | | | 809 | | | | 853 | | | | 873 | | | | 899 | | | | 927 | | | | 901 | | | | 861 | | | | 833 | | | | 833 | |
| | | | | | | | | | | | | |
Statistical discrepancy (E) | | | 171 | | | | 228 | | | | 147 | | | | -17 | | | | -178 | | | | -258 | | | | -231 | | | | -176 | | | | -48 | | | | 76 | | | | 70 | | | | 31 | | | | -7 | |
| | | | | | | | | | | | | |
Gross state product | | | 63,765 | | | | 63,382 | | | | 62,974 | | | | 63,082 | | | | 63,375 | | | | 63,729 | | | | 64,224 | | | | 64,800 | | | | 65,212 | | | | 64,989 | | | | 64,455 | | | | 64,162 | | | | 64,101 | |
| (a) | Chain volume measure reference year 2008-09 |
| (b) | In March quarter 2007, there was a trend break due to the Commonwealth Government’s privatisation of Telstra and users should interpret the trend estimates around this period with caution. Additionally, Tarong Energy completed the acquisition of the remaining 50 per cent of Tarong North Power Station not already owned and this transaction has been excluded from the underlying trend estimate for December quarter 2009. |
| (c) | In November 2010, the Queensland Government floated QR National and sold a lease of the Port of Brisbane. Users should interpret the trend estimate of business investment and public gross fixed capital formation, public corporations - state and local, with caution around this period. |
TABLE 1
- 17 -
| | |
| DOMESTIC PRODUCTION ACCOUNT - QUEENSLAND | | TABLE 2 |
| (Trend, chain volume measure (a), quarterly percentage change, %) | | |
| | | | | | | | | | | | | | | | | | | | | | | | | | | | | | | | | | | | | | | | | | | | | | | | | | | | |
| | | 2007-08 | | | 2008-09 | | | 2009-10 | | | 2010-11 | |
| | | Jun | | | Sep | | | Dec | | | Mar | | | Jun | | | Sep | | | Dec | | | Mar | | | Jun | | | Sep | | | Dec | | | Mar | | | Jun | |
| | | | | | | | | | | | | |
Final consumption expenditure | | | 0.5 | | | | 0.4 | | | | 0.3 | | | | 0.0 | | | | 0.0 | | | | 0.4 | | | | 0.8 | | | | 0.8 | | | | 0.6 | | | | 0.7 | | | | 0.8 | | | | 0.8 | | | | 0.8 | |
| | | | | | | | | | | | | |
Households | | | 0.2 | | | | 0.2 | | | | 0.2 | | | | -0.1 | | | | 0.0 | | | | 0.4 | | | | 0.7 | | | | 0.7 | | | | 0.5 | | | | 0.4 | | | | 0.6 | | | | 0.8 | | | | 0.9 | |
| | | | | | | | | | | | | |
General government | | | 1.5 | | | | 1.1 | | | | 0.7 | | | | 0.2 | | | | -0.1 | | | | 0.6 | | | | 0.8 | | | | 0.9 | | | | 0.9 | | | | 1.5 | | | | 1.6 | | | | 1.1 | | | | 0.5 | |
National | | | 1.5 | | | | 1.3 | | | | 0.9 | | | | -0.2 | | | | -1.2 | | | | -1.3 | | | | -1.5 | | | | 0.0 | | | | 2.4 | | | | 3.9 | | | | 3.1 | | | | 1.5 | | | | 0.4 | |
State and local | | | 1.4 | | | | 1.1 | | | | 0.6 | | | | 0.4 | | | | 0.4 | | | | 1.5 | | | | 1.9 | | | | 1.3 | | | | 0.3 | | | | 0.5 | | | | 0.9 | | | | 0.9 | | �� | | 0.5 | |
| | | | | | | | | | | | | |
Private gross fixed capital formation (b) (c) | | | 2.9 | | | | -0.2 | | | | -3.5 | | | | -5.4 | | | | -4.5 | | | | -2.8 | | | | -1.8 | | | | -0.8 | | | | -0.4 | | | | 0.0 | | | | 3.0 | | | | 5.3 | | | | 7.0 | |
| | | | | | | | | | | | | |
Dwellings | | | 3.3 | | | | -2.4 | | | | -8.7 | | | | -10.2 | | | | -3.9 | | | | 2.5 | | | | 4.1 | | | | 2.1 | | | | -2.0 | | | | -5.1 | | | | -5.9 | | | | -4.5 | | | | -1.8 | |
New and used | | | 2.8 | | | | -3.4 | | | | -9.2 | | | | -10.3 | | | | -4.3 | | | | -0.5 | | | | 1.1 | | | | 0.7 | | | | -2.7 | | | | -5.6 | | | | -7.2 | | | | -6.2 | | | | -3.0 | |
Alterations and additions | | | 4.2 | | | | -0.9 | | | | -8.0 | | | | -10.0 | | | | -3.3 | | | | 6.7 | | | | 8.0 | | | | 3.9 | | | | -1.2 | | | | -4.4 | | | | -4.3 | | | | -2.7 | | | | -0.5 | |
| | | | | | | | | | | | | |
Business Investment (b) (c) | | | 4.7 | | | | 2.4 | | | | -1.2 | | | | -4.8 | | | | -6.4 | | | | -6.7 | | | | -5.8 | | | | -2.3 | | | | 1.8 | | | | 3.7 | | | | 7.7 | | | | 10.0 | | | | 11.4 | |
Non-dwelling construction (b) | | | 7.2 | | | | 5.2 | | | | 1.9 | | | | -2.7 | | | | -5.7 | | | | -5.4 | | | | -4.6 | | | | -0.7 | | | | 2.2 | | | | 3.2 | | | | 8.9 | | | | 12.8 | | | | 13.8 | |
Machinery and equipment (b) | | | 2.7 | | | | -0.1 | | | | -4.0 | | | | -6.8 | | | | -7.1 | | | | -8.0 | | | | -7.1 | | | | -4.0 | | | | 1.4 | | | | 4.3 | | | | 6.4 | | | | 6.8 | | | | 8.5 | |
| | | | | | | | | | | | | |
Livestock and orchards | | | 4.3 | | | | 3.1 | | | | 3.0 | | | | 1.5 | | | | 1.9 | | | | 1.9 | | | | 2.3 | | | | 2.7 | | | | 3.1 | | | | 3.8 | | | | 2.0 | | | | 0.4 | | | | -0.8 | |
Intellectual property products | | | 0.6 | | | | -0.9 | | | | -1.6 | | | | -0.3 | | | | 2.7 | | | | 4.6 | | | | 4.1 | | | | 2.8 | | | | 1.0 | | | | 0.0 | | | | 0.8 | | | | 2.2 | | | | 3.3 | |
Ownership transfer costs | | | -13.6 | | | | -14.7 | | | | -8.4 | | | | 6.8 | | | | 11.7 | | | | 7.0 | | | | -2.0 | | | | -6.8 | | | | -9.5 | | | | -8.5 | | | | -7.6 | | | | -6.4 | | | | -7.6 | |
| | | | | | | | | | | | | |
Public gross fixed capital formation (b) (c) | | | 8.5 | | | | 2.5 | | | | -1.6 | | | | -2.2 | | | | -0.2 | | | | 3.9 | | | | 4.9 | | | | 1.7 | | | | -0.9 | | | | -3.9 | | | | -4.2 | | | | -3.1 | | | | -3.4 | |
| | | | | | | | | | | | | |
Public corporations | | | 6.3 | | | | -0.3 | | | | -4.2 | | | | -4.4 | | | | -4.7 | | | | -3.7 | | | | -6.3 | | | | -6.2 | | | | -0.1 | | | | -0.2 | | | | -3.6 | | | | -7.3 | | | | -11.7 | |
Commonwealth (b) | | | -8.8 | | | | -17.3 | | | | 0.0 | | | | 34.9 | | | | 41.4 | | | | 24.4 | | | | 0.0 | | | | -14.7 | | | | -17.2 | | | | -5.6 | | | | 14.7 | | | | 16.7 | | | | 15.4 | |
State and local (c) | | | 7.2 | | | | 0.0 | | | | -4.3 | | | | -5.2 | | | | -6.1 | | | | -5.0 | | | | -6.7 | | | | -5.7 | | | | 0.9 | | | | 0.0 | | | | -4.4 | | | | -8.6 | | | | -13.5 | |
| | | | | | | | | | | | | |
General government | | | 10.2 | | | | 3.7 | | | | 0.2 | | | | -0.7 | | | | 2.7 | | | | 8.5 | | | | 10.9 | | | | 5.2 | | | | -1.2 | | | | -5.3 | | | | -4.5 | | | | -1.3 | | | | -0.1 | |
National | | | 23.3 | | | | 4.9 | | | | -7.1 | | | | -10.8 | | | | -3.3 | | | | 9.2 | | | | 11.2 | | | | 7.6 | | | | 3.7 | | | | 0.1 | | | | -0.1 | | | | 0.7 | | | | 0.8 | |
State and local | | | 6.9 | | | | 3.8 | | | | 2.3 | | | | 2.0 | | | | 4.1 | | | | 8.3 | | | | 10.8 | | | | 4.7 | | | | -2.4 | | | | -6.6 | | | | -5.6 | | | | -1.8 | | | | -0.3 | |
| | | | | | | | | | | | | |
Gross state expenditure | | | 1.9 | | | | 0.3 | | | | -1.3 | | | | -2.0 | | | | -1.2 | | | | 0.4 | | | | 0.9 | | | | 0.4 | | | | 0.0 | | | | -0.1 | | | | 1.1 | | | | 2.0 | | | | 2.5 | |
- 18 -
| | | | | | | | | | | | | | | | | | | | | | | | | | | | | | | | | | | | | | | | | | | | | | | | | | | | |
Exports of goods and services | | | 0.8 | | | | -1.9 | | | | -2.2 | | | | 0.1 | | | | 2.1 | | | | 3.3 | | | | 2.5 | | | | 0.7 | | | | -0.4 | | | | -3.0 | | | | -4.7 | | | | -4.4 | | | | -4.1 | |
| | | | | | | | | | | | | |
Overseas | | | 1.7 | | | | -0.7 | | | | -0.7 | | | | 0.6 | | | | 0.5 | | | | 1.3 | | | | 3.0 | | | | 3.4 | | | | 1.8 | | | | -3.2 | | | | -6.1 | | | | -5.5 | | | | -4.6 | |
Goods | | | 1.7 | | | | -0.9 | | | | -0.7 | | | | 1.0 | | | | 1.0 | | | | 2.1 | | | | 4.0 | | | | 4.3 | | | | 2.0 | | | | -3.7 | | | | -6.9 | | | | -6.2 | | | | -5.1 | |
Services | | | 1.7 | | | | 0.3 | | | | -0.8 | | | | -0.9 | | | | -2.2 | | | | -2.8 | | | | -2.6 | | | | -2.0 | | | | 0.5 | | | | -0.3 | | | | -1.2 | | | | -1.8 | | | | -2.1 | |
| | | | | | | | | | | | | |
Interstate | | | -1.5 | | | | -4.8 | | | | -6.3 | | | | -1.2 | | | | 6.9 | | | | 8.5 | | | | 1.4 | | | | -6.2 | | | | -6.5 | | | | -2.4 | | | | -0.5 | | | | -1.4 | | | | -2.8 | |
Goods | | | -0.5 | | | | -4.4 | | | | -6.6 | | | | -1.4 | | | | 8.1 | | | | 10.1 | | | | 1.6 | | | | -7.6 | | | | -8.4 | | | | -3.3 | | | | -0.3 | | | | -1.1 | | | | -3.1 | |
Selected services | | | -5.0 | | | | -6.0 | | | | -5.0 | | | | -0.7 | | | | 2.7 | | | | 2.7 | | | | 0.6 | | | | -0.3 | | | | 0.6 | | | | 0.7 | | | | -1.3 | | | | -2.3 | | | | -1.8 | |
| | | | | | | | | | | | | |
less Imports of goods and services | | | 4.8 | | | | 0.7 | | | | -4.1 | | | | -6.4 | | | | -3.0 | | | | 2.7 | | | | 3.1 | | | | -0.4 | | | | -1.7 | | | | -2.1 | | | | 0.3 | | | | 2.2 | | | | 3.2 | |
| | | | | | | | | | | | | |
less Overseas | | | 5.1 | | | | -0.5 | | | | -5.7 | | | | -6.5 | | | | -1.7 | | | | 4.2 | | | | 6.0 | | | | 3.7 | | | | 1.7 | | | | 0.7 | | | | 1.8 | | | | 2.9 | | | | 3.1 | |
less Goods | | | 5.4 | | | | 0.0 | | | | -5.7 | | | | -7.1 | | | | -2.3 | | | | 4.4 | | | | 6.9 | | | | 3.9 | | | | 1.3 | | | | 0.1 | | | | 1.3 | | | | 2.6 | | | | 2.8 | |
less Services | | | 4.1 | | | | -2.1 | | | | -5.7 | | | | -4.7 | | | | 0.2 | | | | 3.5 | | | | 3.4 | | | | 3.1 | | | | 2.8 | | | | 2.5 | | | | 3.5 | | | | 3.9 | | | | 4.2 | |
| | | | | | | | | | | | | |
less Interstate | | | 4.5 | | | | 2.0 | | | | -2.6 | | | | -6.3 | | | | -4.2 | | | | 1.4 | | | | 0.1 | | | | -4.6 | | | | -5.5 | | | | -5.4 | | | | -1.6 | | | | 1.2 | | | | 3.2 | |
less Goods | | | 4.8 | | | | 2.4 | | | | -2.5 | | | | -6.4 | | | | -4.3 | | | | 1.0 | | | | 0.0 | | | | -5.2 | | | | -6.3 | | | | -5.7 | | | | -1.3 | | | | 1.7 | | | | 3.5 | |
less Selected services | | | 0.9 | | | | -2.9 | | | | -4.5 | | | | -4.8 | | | | -2.4 | | | | 5.4 | | | | 2.3 | | | | 3.0 | | | | 3.1 | | | | -2.8 | | | | -4.4 | | | | -3.3 | | | | 0.0 | |
| | | | | | | | | | | | | |
Gross state product (d) | | | 0.6 | | | | -0.6 | | | | -0.6 | | | | 0.2 | | | | 0.5 | | | | 0.6 | | | | 0.8 | | | | 0.9 | | | | 0.6 | | | | -0.3 | | | | -0.8 | | | | -0.5 | | | | -0.1 | |
| (a) | Chain volume measure reference year 2008-09 |
| (b) | In March quarter 2007, there was a trend break due to the Commonwealth Government’s privatisation of Telstra and users should interpret the trend estimates around this period with caution. Additionally, Tarong Energy completed the acquisition of the remaining 50 per cent of Tarong North Power Station not already owned and this transaction has been excluded from the underlying trend estimate for December quarter 2009. |
| (c) | In November 2010, the Queensland Government floated QR National and sold a lease of the Port of Brisbane. Users should interpret the trend estimate of business investment and public gross fixed capital formation, public corporations - state and local, with caution around this period. |
| (d) | Includes statistical discrepancy. |
TABLE 2
- 19 -
| | | | |
| DOMESTIC PRODUCTION ACCOUNT - QUEENSLAND | | | TABLE 3 | |
| (Trend, chain volume measure (a), quarterly contribution to growth, % points) | | | | |
| | | | | | | | | | | | | | | | | | | | | | | | | | | | | | | | | | | | | | | | | | | | | | | | | | | | |
| | | 2007-08 | | | 2008-09 | | | 2009-10 | | | 2010-11 | |
| | | Jun | | | Sep | | | Dec | | | Mar | | | Jun | | | Sep | | | Dec | | | Mar | | | Jun | | | Sep | | | Dec | | | Mar | | | Jun | |
| | | | | | | | | | | | | |
Final consumption expenditure | | | 0.3 | | | | 0.3 | | | | 0.2 | | | | 0.0 | | | | 0.0 | | | | 0.3 | | | | 0.5 | | | | 0.5 | | | | 0.4 | | | | 0.4 | | | | 0.6 | | | | 0.6 | | | | 0.5 | |
| | | | | | | | | | | | | |
Households | | | 0.1 | | | | 0.1 | | | | 0.1 | | | | 0.0 | | | | 0.0 | | | | 0.2 | | | | 0.4 | | | | 0.4 | | | | 0.3 | | | | 0.2 | | | | 0.3 | | | | 0.4 | | | | 0.5 | |
| | | | | | | | | | | | | |
General government | | | 0.2 | | | | 0.2 | | | | 0.1 | | | | 0.0 | | | | 0.0 | | | | 0.1 | | | | 0.1 | | | | 0.1 | | | | 0.1 | | | | 0.2 | | | | 0.3 | | | | 0.2 | | | | 0.1 | |
National | | | 0.1 | | | | 0.1 | | | | 0.0 | | | | 0.0 | | | | -0.1 | | | | -0.1 | | | | -0.1 | | | | 0.0 | | | | 0.1 | | | | 0.2 | | | | 0.2 | | | | 0.1 | | | | 0.0 | |
State and local | | | 0.1 | | | | 0.1 | | | | 0.1 | | | | 0.0 | | | | 0.0 | | | | 0.2 | | | | 0.2 | | | | 0.1 | | | | 0.0 | | | | 0.1 | | | | 0.1 | | | | 0.1 | | | | 0.1 | |
| | | | | | | | | | | | | |
Private gross fixed capital formation (b) (c) | | | 0.8 | | | | -0.1 | | | | -0.9 | | | | -1.4 | | | | -1.1 | | | | -0.7 | | | | -0.4 | | | | -0.2 | | | | -0.1 | | | | 0.0 | | | | 0.7 | | | | 1.2 | | | | 1.7 | |
| | | | | | | | | | | | | |
Dwellings | | | 0.3 | | | | -0.2 | | | | -0.7 | | | | -0.8 | | | | -0.3 | | | | 0.2 | | | | 0.3 | | | | 0.1 | | | | -0.1 | | | | -0.3 | | | | -0.4 | | | | -0.3 | | | | -0.1 | |
New and used | | | 0.1 | | | | -0.2 | | | | -0.4 | | | | -0.4 | | | | -0.2 | | | | 0.0 | | | | 0.0 | | | | 0.0 | | | | -0.1 | | | | -0.2 | | | | -0.2 | | | | -0.2 | | | | -0.1 | |
Alterations and additions | | | 0.1 | | | | 0.0 | | | | -0.3 | | | | -0.3 | | | | -0.1 | | | | 0.2 | | | | 0.2 | | | | 0.1 | | | | 0.0 | | | | -0.1 | | | | -0.1 | | | | -0.1 | | | | 0.0 | |
| | | | | | | | | | | | | |
Business Investment (b) (c) | | | 0.7 | | | | 0.4 | | | | -0.2 | | | | -0.8 | | | | -1.0 | | | | -1.0 | | | | -0.8 | | | | -0.3 | | | | 0.2 | | | | 0.5 | | | | 1.0 | | | | 1.4 | | | | 1.7 | |
Non-dwelling construction (b) | | | 0.5 | | | | 0.4 | | | | 0.1 | | | | -0.2 | | | | -0.4 | | | | -0.4 | | | | -0.3 | | | | 0.0 | | | | 0.1 | | | | 0.2 | | | | 0.6 | | | | 0.9 | | | | 1.2 | |
Machinery and equipment (b) | | | 0.2 | | | | 0.0 | | | | -0.3 | | | | -0.6 | | | | -0.6 | | | | -0.6 | | | | -0.5 | | | | -0.2 | | | | 0.1 | | | | 0.2 | | | | 0.4 | | | | 0.4 | | | | 0.6 | |
| | | | | | | | | | | | | |
Livestock and orchards | | | 0.0 | | | | 0.0 | | | | 0.0 | | | | 0.0 | | | | 0.0 | | | | 0.0 | | | | 0.0 | | | | 0.0 | | | | 0.0 | | | | 0.0 | | | | 0.0 | | | | 0.0 | | | | 0.0 | |
Intellectual property products | | | 0.0 | | | | 0.0 | | | | 0.0 | | | | 0.0 | | | | 0.0 | | | | 0.1 | | | | 0.1 | | | | 0.0 | | | | 0.0 | | | | 0.0 | | | | 0.0 | | | | 0.0 | | | | 0.1 | |
Ownership transfer costs | | | -0.2 | | | | -0.2 | | | | -0.1 | | | | 0.1 | | | | 0.1 | | | | 0.1 | | | | 0.0 | | | | -0.1 | | | | -0.1 | | | | -0.1 | | | | -0.1 | | | | -0.1 | | | | -0.1 | |
| | | | | | | | | | | | | |
Public gross fixed capital formation (b) (c) | | | 0.6 | | | | 0.2 | | | | -0.1 | | | | -0.2 | | | | 0.0 | | | | 0.3 | | | | 0.4 | | | | 0.1 | | | | -0.1 | | | | -0.3 | | | | -0.3 | | | | -0.2 | | | | -0.3 | |
| | | | | | | | | | | | | |
Public corporations (b) (c) | | | 0.2 | | | | 0.0 | | | | -0.1 | | | | -0.1 | | | | -0.1 | | | | -0.1 | | | | -0.2 | | | | -0.2 | | | | 0.0 | | | | 0.0 | | | | -0.1 | | | | -0.2 | | | | -0.3 | |
Commonwealth (b) | | | 0.0 | | | | 0.0 | | | | 0.0 | | | | 0.0 | | | | 0.0 | | | | 0.0 | | | | 0.0 | | | | 0.0 | | | | 0.0 | | | | 0.0 | | | | 0.0 | | | | 0.0 | | | | 0.0 | |
State and local (c) | | | 0.2 | | | | 0.0 | | | | -0.1 | | | | -0.2 | | | | -0.2 | | | | -0.1 | | | | -0.2 | | | | -0.1 | | | | 0.0 | | | | 0.0 | | | | -0.1 | | | | -0.2 | | | | -0.3 | |
| | | | | | | | | | | | | |
General government | | | 0.4 | | | | 0.2 | | | | 0.0 | | | | 0.0 | | | | 0.1 | | | | 0.4 | | | | 0.6 | | | | 0.3 | | | | -0.1 | | | | -0.3 | | | | -0.3 | | | | -0.1 | | | | 0.0 | |
National | | | 0.2 | | | | 0.1 | | | | -0.1 | | | | -0.1 | | | | 0.0 | | | | 0.1 | | | | 0.1 | | | | 0.1 | | | | 0.0 | | | | 0.0 | | | | 0.0 | | | | 0.0 | | | | 0.0 | |
State and local | | | 0.2 | | | | 0.1 | | | | 0.1 | | | | 0.1 | | | | 0.2 | | | | 0.3 | | | | 0.5 | | | | 0.2 | | | | -0.1 | | | | -0.3 | | | | -0.3 | | | | -0.1 | | | | 0.0 | |
| | | | | | | | | | | | | |
Change in inventories | | | 0.2 | | | | -0.1 | | | | -0.5 | | | | -0.4 | | | | 0.0 | | | | 0.5 | | | | 0.3 | | | | -0.1 | | | | -0.2 | | | | -0.2 | | | | 0.2 | | | | 0.5 | | | | 0.6 | |
| | | | | | | | | | | | | |
Gross state expenditure | | | 1.9 | | | | 0.3 | | | | -1.3 | | | | -2.1 | | | | -1.1 | | | | 0.4 | | | | 0.8 | | | | 0.4 | | | | 0.0 | | | | -0.1 | | | | 1.1 | | | | 2.0 | | | | 2.5 | |
- 20 -
| | | | | | | | | | | | | | | | | | | | | | | | | | | | | | | | | | | | | | | | | | | | | | | | | | | | |
Exports of goods and services | | | 0.3 | | | | -0.7 | | | | -0.8 | | | | 0.1 | | | | 0.8 | | | | 1.2 | | | | 1.0 | | | | 0.3 | | | | -0.2 | | | | -1.2 | | | | -1.8 | | | | -1.6 | | | | -1.4 | |
| | | | | | | | | | | | | |
Overseas | | | 0.5 | | | | -0.2 | | | | -0.2 | | | | 0.2 | | | | 0.1 | | | | 0.4 | | | | 0.8 | | | | 0.9 | | | | 0.5 | | | | -0.9 | | | | -1.7 | | | | -1.5 | | | | -1.2 | |
Goods | | | 0.4 | | | | -0.2 | | | | -0.1 | | | | 0.2 | | | | 0.2 | | | | 0.5 | | | | 0.9 | | | | 1.0 | | | | 0.5 | | | | -0.9 | | | | -1.7 | | | | -1.4 | | | | -1.1 | |
Services | | | 0.1 | | | | 0.0 | | | | 0.0 | | | | 0.0 | | | | -0.1 | | | | -0.1 | | | | -0.1 | | | | -0.1 | | | | 0.0 | | | | 0.0 | | | | 0.0 | | | | -0.1 | | | | -0.1 | |
| | | | | | | | | | | | | |
Interstate | | | -0.2 | | | | -0.5 | | | | -0.7 | | | | -0.1 | | | | 0.7 | | | | 0.9 | | | | 0.2 | | | | -0.7 | | | | -0.7 | | | | -0.2 | | | | 0.0 | | | | -0.1 | | | | -0.3 | |
Goods | | | 0.0 | | | | -0.4 | | | | -0.5 | | | | -0.1 | | | | 0.6 | | | | 0.8 | | | | 0.1 | | | | -0.7 | | | | -0.7 | | | | -0.2 | | | | 0.0 | | | | -0.1 | | | | -0.2 | |
Selected services | | | -0.1 | | | | -0.1 | | | | -0.1 | | | | 0.0 | | | | 0.1 | | | | 0.1 | | | | 0.0 | | | | 0.0 | | | | 0.0 | | | | 0.0 | | | | 0.0 | | | | -0.1 | | | | 0.0 | |
| | | | | | | | | | | | | |
less Imports of goods and services | | | 1.8 | | | | 0.3 | | | | -1.6 | | | | -2.4 | | | | -1.1 | | | | 0.9 | | | | 1.1 | | | | -0.1 | | | | -0.6 | | | | -0.7 | | | | 0.1 | | | | 0.8 | | | | 1.1 | |
| | | | | | | | | | | | | |
less Overseas | | | 0.9 | | | | -0.1 | | | | -1.1 | | | | -1.2 | | | | -0.3 | | | | 0.7 | | | | 1.1 | | | | 0.7 | | | | 0.3 | | | | 0.1 | | | | 0.4 | | | | 0.6 | | | | 0.6 | |
less Goods | | | 0.8 | | | | 0.0 | | | | -0.8 | | | | -1.0 | | | | -0.3 | | | | 0.6 | | | | 0.9 | | | | 0.5 | | | | 0.2 | | | | 0.0 | | | | 0.2 | | | | 0.4 | | | | 0.4 | |
less Services | | | 0.2 | | | | -0.1 | | | | -0.3 | | | | -0.2 | | | | 0.0 | | | | 0.1 | | | | 0.1 | | | | 0.1 | | | | 0.1 | | | | 0.1 | | | | 0.2 | | | | 0.2 | | | | 0.2 | |
| | | | | | | | | | | | | |
less Interstate | | | 0.9 | | | | 0.4 | | | | -0.5 | | | | -1.2 | | | | -0.8 | | | | 0.2 | | | | 0.0 | | | | -0.8 | | | | -0.9 | | | | -0.9 | | | | -0.2 | | | | 0.2 | | | | 0.5 | |
less Goods | | | 0.8 | | | | 0.4 | | | | -0.5 | | | | -1.2 | | | | -0.7 | | | | 0.2 | | | | 0.0 | | | | -0.9 | | | | -1.0 | | | | -0.8 | | | | -0.2 | | | | 0.2 | | | | 0.5 | |
less Selected services | | | 0.0 | | | | 0.0 | | | | -0.1 | | | | -0.1 | | | | 0.0 | | | | 0.1 | | | | 0.0 | | | | 0.0 | | | | 0.0 | | | | 0.0 | | | | -0.1 | | | | 0.0 | | | | 0.0 | |
| | | | | | | | | | | | | |
Statistical discrepancy (E) | | | 0.2 | | | | 0.1 | | | | -0.1 | | | | -0.3 | | | | -0.3 | | | | -0.1 | | | | 0.0 | | | | 0.1 | | | | 0.2 | | | | 0.2 | | | | 0.0 | | | | -0.1 | | | | -0.1 | |
| | | | | | | | | | | | | |
Gross state product | | | 0.6 | | | | -0.6 | | | | -0.6 | | | | 0.2 | | | | 0.5 | | | | 0.6 | | | | 0.8 | | | | 0.9 | | | | 0.6 | | | | -0.3 | | | | -0.8 | | | | -0.5 | | | | -0.1 | |
| (a) | Chain volume measure reference year 2008-09 |
| (b) | In March quarter 2007, there was a trend break due to the Commonwealth Government’s privatisation of Telstra and users should interpret the trend estimates around this period with caution. Additionally, Tarong Energy completed the acquisition of the remaining 50 per cent of Tarong North Power Station not already owned and this transaction has been excluded from the underlying trend estimate for December quarter 2009. |
| (c) | In November 2010, the Queensland Government floated QR National and sold a lease of the Port of Brisbane. Users should interpret the trend estimate of business investment and public gross fixed capital formation, public corporations - state and local, with caution around this period. |
TABLE 3
- 21 -
| | | | |
| DOMESTIC PRODUCTION ACCOUNT - QUEENSLAND | | | TABLE 4 | |
| (Trend, chain volume measure (a), annual percentage change, %) | | | | |
| | | | | | | | | | | | | | | | | | | | | | | | | | | | | | | | | | | | | | | | | | | | | | | | | | | | |
| | | 2007-08 | | | 2008-09 | | | 2009-10 | | | 2010-11 | |
| | | Jun | | | Sep | | | Dec | | | Mar | | | Jun | | | Sep | | | Dec | | | Mar | | | Jun | | | Sep | | | Dec | | | Mar | | | Jun | |
| | | | | | | | | | | | | |
Final consumption expenditure | | | 4.4 | | | | 3.1 | | | | 2.1 | | | | 1.2 | | | | 0.7 | | | | 0.7 | | | | 1.2 | | | | 2.0 | | | | 2.6 | | | | 2.8 | | | | 2.9 | | | | 3.0 | | | | 3.2 | |
| | | | | | | | | | | | | |
Households | | | 3.9 | | | | 2.2 | | | | 1.2 | | | | 0.5 | | | | 0.3 | | | | 0.5 | | | | 1.1 | | | | 1.9 | | | | 2.4 | | | | 2.4 | | | | 2.3 | | | | 2.3 | | | | 2.7 | |
| | | | | | | | | | | | | |
General government | | | 6.1 | | | | 6.4 | | | | 5.4 | | | | 3.5 | | | | 1.9 | | | | 1.4 | | | | 1.5 | | | | 2.3 | | | | 3.3 | | | | 4.3 | | | | 5.0 | | | | 5.2 | | | | 4.8 | |
National | | | 4.4 | | | | 5.3 | | | | 5.3 | | | | 3.5 | | | | 0.8 | | | | -1.8 | | | | -4.2 | | | | -3.9 | | | | -0.5 | | | | 4.8 | | | | 9.8 | | | | 11.4 | | | | 9.2 | |
State and local | | | 7.0 | | | | 6.8 | | | | 5.4 | | | | 3.5 | | | | 2.5 | | | | 2.8 | | | | 4.2 | | | | 5.1 | | | | 5.0 | | | | 4.0 | | | | 3.0 | | | | 2.6 | | | | 2.9 | |
| | | | | | | | | | | | | |
Private gross fixed capital formation (b) (c) | | | 9.8 | | | | 8.1 | | | | 2.7 | | | | -6.2 | | | | -12.9 | | | | -15.2 | | | | -13.7 | | | | -9.6 | | | | -5.7 | | | | -3.0 | | | | 1.6 | | | | 7.9 | | | | 16.0 | |
| | | | | | | | | | | | | |
Dwellings | | | 2.3 | | | | 3.4 | | | | -4.4 | | | | -17.3 | | | | -23.1 | | | | -19.2 | | | | -7.9 | | | | 4.8 | | | | 6.8 | | | | -1.1 | | | | -10.6 | | | | -16.4 | | | | -16.2 | |
New and used | | | 3.3 | | | | 2.8 | | | | -6.0 | | | | -19.2 | | | | -24.8 | | | | -22.5 | | | | -13.7 | | | | -3.1 | | | | -1.4 | | | | -6.5 | | | | -14.2 | | | | -20.1 | | | | -20.3 | |
Alterations and additions | | | 0.9 | | | | 4.3 | | | | -2.0 | | | | -14.5 | | | | -20.7 | | | | -14.6 | | | | 0.4 | | | | 15.9 | | | | 18.4 | | | | 6.1 | | | | -6.1 | | | | -12.0 | | | | -11.4 | |
| | | | | | | | | | | | | |
Business Investment (b) (c) | | | 17.8 | | | | 16.1 | | | | 10.9 | | | | 0.8 | | | | -9.9 | | | | -17.8 | | | | -21.7 | | | | -19.6 | | | | -12.6 | | | | -2.8 | | | | 11.1 | | | | 25.1 | | | | 36.9 | |
Non-dwelling construction (b) | | | 19.1 | | | | 23.3 | | | | 21.8 | | | | 11.9 | | | | -1.6 | | | | -11.6 | | | | -17.2 | | | | -15.5 | | | | -8.4 | | | | -0.1 | | | | 14.0 | | | | 29.6 | | | | 44.2 | |
Machinery and equipment (b) | | | 16.7 | | | | 10.3 | | | | 2.2 | | | | -8.2 | | | | -16.9 | | | | -23.5 | | | | -26.0 | | | | -23.8 | | | | -16.8 | | | | -5.7 | | | | 8.0 | | | | 20.2 | | | | 28.6 | |
| | | | | | | | | | | | | |
Livestock and orchards | | | 9.6 | | | | 12.4 | | | | 13.8 | | | | 12.4 | | | | 9.8 | | | | 8.5 | | | | 7.8 | | | | 9.1 | | | | 10.3 | | | | 12.4 | | | | 12.2 | | | | 9.6 | | | | 5.5 | |
Intellectual property products | | | 8.3 | | | | 4.6 | | | | 0.2 | | | | -2.2 | | | | -0.1 | | | | 5.4 | | | | 11.5 | | | | 15.0 | | | | 13.0 | | | | 8.1 | | | | 4.6 | | | | 4.1 | | | | 6.5 | |
Ownership transfer costs | | | -24.4 | | | | -35.9 | | | | -38.2 | | | | -27.9 | | | | -6.8 | | | | 16.9 | | | | 25.1 | | | | 9.2 | | | | -11.5 | | | | -24.3 | | | | -28.7 | | | | -28.4 | | | | -26.9 | |
| | | | | | | | | | | | | |
Public gross fixed capital formation (b) (c) | | | 14.9 | | | | 14.1 | | | | 12.6 | | | | 7.1 | | | | -1.6 | | | | -0.2 | | | | 6.5 | | | | 10.7 | | | | 9.9 | | | | 1.6 | | | | -7.2 | | | | -11.6 | | | | -13.8 | |
| | | | | | | | | | | | | |
Public corporations (b) (c) | | | 8.6 | | | | 3.2 | | | | 0.4 | | | | -3.0 | | | | -13.0 | | | | -16.0 | | | | -17.8 | | | | -19.4 | | | | -15.5 | | | | -12.4 | | | | -9.9 | | | | -10.9 | | | | -21.3 | |
Commonwealth (b) | | | -5.5 | | | | -4.4 | | | | -25.9 | | | | 1.8 | | | | 57.7 | | | | 137.2 | | | | 137.2 | | | | 50.0 | | | | -12.2 | | | | -33.3 | | | | -23.5 | | | | 4.6 | | | | 45.8 | |
State and local (c) | | | 8.2 | | | | 2.9 | | | | 1.4 | | | | -2.7 | | | | -14.8 | | | | -19.1 | | | | -21.1 | | | | -21.5 | | | | -15.6 | | | | -11.2 | | | | -9.0 | | | | -11.9 | | | | -24.5 | |
| | | | | | | | | | | | | |
General government | | | 22.2 | | | | 24.4 | | | | 22.7 | | | | 13.7 | | | | 6.0 | | | | 10.9 | | | | 22.7 | | | | 30.0 | | | | 25.0 | | | | 9.0 | | | | -6.1 | | | | -11.9 | | | | -10.8 | |
National | | | 65.1 | | | | 80.3 | | | | 53.0 | | | | 7.2 | | | | -15.9 | | | | -12.5 | | | | 4.7 | | | | 26.4 | | | | 35.4 | | | | 24.1 | | | | 11.5 | | | | 4.3 | | | | 1.4 | |
State and local | | | 9.8 | | | | 12.3 | | | | 16.2 | | | | 15.8 | | | | 12.8 | | | | 17.7 | | | | 27.5 | | | | 30.8 | | | | 22.7 | | | | 5.8 | | | | -9.9 | | | | -15.5 | | | | -13.8 | |
| | | | | | | | | | | | | |
Gross state expenditure | | | 6.4 | | | | 5.2 | | | | 2.8 | | | | -1.1 | | | | -4.1 | | | | -4.0 | | | | -2.0 | | | | 0.5 | | | | 1.7 | | | | 1.2 | | | | 1.5 | | | | 3.1 | | | | 5.7 | |
- 22 -
| | | | | | | | | | | | | | | | | | | | | | | | | | | | | | | | | | | | | | | | | | | | | | | | | | | | |
Exports of goods and services | | | 3.2 | | | | 2.1 | | | | -0.9 | | | | -3.2 | | | | -1.8 | | | | 3.3 | | | | 8.3 | | | | 8.9 | | | | 6.2 | | | | -0.3 | | | | -7.4 | | | | -12.1 | | | | -15.4 | |
| | | | | | | | | | | | | |
Overseas | | | 5.8 | | | | 6.1 | | | | 3.9 | | | | 0.9 | | | | -0.3 | | | | 1.7 | | | | 5.5 | | | | 8.4 | | | | 9.8 | | | | 4.9 | | | | -4.4 | | | | -12.6 | | | | -18.2 | |
Goods | | | 5.4 | | | | 6.3 | | | | 4.1 | | | | 1.1 | | | | 0.4 | | | | 3.4 | | | | 8.3 | | | | 11.9 | | | | 13.0 | | | | 6.6 | | | | -4.6 | | | | -14.2 | | | | -20.2 | |
Services | | | 8.3 | | | | 5.6 | | | | 2.4 | | | | 0.4 | | | | -3.5 | | | | -6.5 | | | | -8.2 | | | | -9.2 | | | | -6.8 | | | | -4.4 | | | | -3.0 | | | | -2.8 | | | | -5.3 | |
| | | | | | | | | | | | | |
Interstate | | | -2.8 | | | | -7.3 | | | | -12.0 | | | | -13.2 | | | | -5.8 | | | | 7.4 | | | | 16.1 | | | | 10.4 | | | | -3.5 | | | | -13.2 | | | | -14.8 | | | | -10.5 | | | | -7.0 | |
Goods | | | 1.1 | | | | -4.0 | | | | -10.0 | | | | -12.4 | | | | -4.9 | | | | 9.6 | | | | 19.3 | | | | 11.7 | | | | -5.4 | | | | -16.9 | | | | -18.4 | | | | -12.7 | | | | -7.6 | |
Selected services | | | -14.5 | | | | -17.3 | | | | -18.5 | | | | -15.7 | | | | -8.9 | | | | -0.6 | | | | 5.2 | | | | 5.7 | | | | 3.6 | | | | 1.6 | | | | -0.3 | | | | -2.3 | | | | -4.7 | |
| | | | | | | | | | | | | |
less Imports of goods and services | | | 12.4 | | | | 10.3 | | | | 4.3 | | | | -5.3 | | | | -12.3 | | | | -10.5 | | | | -3.9 | | | | 2.3 | | | | 3.7 | | | | -1.2 | | | | -3.8 | | | | -1.3 | | | | 3.6 | |
| | | | | | | | | | | | | |
less Overseas | | | 19.7 | | | | 16.0 | | | | 4.7 | | | | -7.8 | | | | -13.8 | | | | -9.7 | | | | 1.5 | | | | 12.6 | | | | 16.5 | | | | 12.6 | | | | 8.1 | | | | 7.3 | | | | 8.9 | |
less Goods | | | 18.2 | | | | 15.8 | | | | 5.1 | | | | -7.6 | | | | -14.3 | | | | -10.6 | | | | 1.3 | | | | 13.3 | | | | 17.4 | | | | 12.6 | | | | 6.8 | | | | 5.5 | | | | 7.0 | |
less Services | | | 24.8 | | | | 16.6 | | | | 3.4 | | | | -8.5 | | | | -12.0 | | | | -6.9 | | | | 2.2 | | | | 10.6 | | | | 13.6 | | | | 12.4 | | | | 12.5 | | | | 13.3 | | | | 14.8 | |
| | | | | | | | | | | | | |
less Interstate | | | 6.0 | | | | 5.3 | | | | 4.0 | | | | -2.7 | | | | -10.8 | | | | -11.4 | | | | -8.9 | | | | -7.2 | | | | -8.5 | | | | -14.6 | | | | -16.1 | | | | -11.0 | | | | -2.7 | |
less Goods | | | 7.7 | | | | 6.7 | | | | 5.0 | | | | -2.0 | | | | -10.6 | | | | -11.7 | | | | -9.5 | | | | -8.4 | | | | -10.3 | | | | -16.2 | | | | -17.3 | | | | -11.3 | | | | -2.0 | |
less Selected services | | | -10.7 | | | | -9.7 | | | | -8.1 | | | | -11.0 | | | | -13.8 | | | | -6.5 | | | | 0.2 | | | | 8.4 | | | | 14.6 | | | | 5.6 | | | | -1.4 | | | | -7.3 | | | | -10.1 | |
| | | | | | | | | | | | | |
Gross state product (d) | | | 3.7 | | | | 2.8 | | | | 1.1 | | | | -0.5 | | | | -0.6 | | | | 0.5 | | | | 2.0 | | | | 2.7 | | | | 2.9 | | | | 2.0 | | | | 0.4 | | | | -1.0 | | | | -1.7 | |
| (a) | Chain volume measure reference year 2008-09 |
| (b) | In March quarter 2007, there was a trend break due to the Commonwealth Government’s privatisation of Telstra and users should interpret the trend estimates around this period with caution. Additionally, Tarong Energy completed the acquisition of the remaining 50 per cent of Tarong North Power Station not already owned and this transaction has been excluded from the underlying trend estimate for December quarter 2009. |
| (c) | In November 2010, the Queensland Government floated QR National and sold a lease of the Port of Brisbane. Users should interpret the trend estimate of business investment and public gross fixed capital formation, public corporations - state and local, with caution around this period. |
| (d) | Includes statistical discrepancy. |
TABLE 4
- 23 -
| | | | |
| DOMESTIC PRODUCTION ACCOUNT - QUEENSLAND | | | TABLE 5 | |
| (Trend, chain volume measure (a), annual contribution to growth, % points) | | | | |
| | | | | | | | | | | | | | | | | | | | | | | | | | | | | | | | | | | | | | | | | | | | | | | | | | | | |
| | | 2007-08 | | | 2008-09 | | | 2009-10 | | | 2010-11 | |
| | | Jun | | | Sep | | | Dec | | | Mar | | | Jun | | | Sep | | | Dec | | | Mar | | | Jun | | | Sep | | | Dec | | | Mar | | | Jun | |
| | | | | | | | | | | | | |
Final consumption expenditure | | | 2.8 | | | | 2.0 | | | | 1.4 | | | | 0.8 | | | | 0.5 | | | | 0.5 | | | | 0.8 | | | | 1.3 | | | | 1.7 | | | | 1.9 | | | | 1.9 | | | | 2.0 | | | | 2.1 | |
| | | | | | | | | | | | | |
Households | | | 1.9 | | | | 1.1 | | | | 0.6 | | | | 0.3 | | | | 0.2 | | | | 0.3 | | | | 0.5 | | | | 1.0 | | | | 1.2 | | | | 1.2 | | | | 1.1 | | | | 1.1 | | | | 1.3 | |
| | | | | | | | | | | | | |
General government | | | 0.9 | | | | 1.0 | | | | 0.8 | | | | 0.5 | | | | 0.3 | | | | 0.2 | | | | 0.2 | | | | 0.4 | | | | 0.5 | | | | 0.7 | | | | 0.8 | | | | 0.8 | | | | 0.7 | |
National | | | 0.2 | | | | 0.3 | | | | 0.3 | | | | 0.2 | | | | 0.0 | | | | -0.1 | | | | -0.2 | | | | -0.2 | | | | 0.0 | | | | 0.2 | | | | 0.5 | | | | 0.5 | | | | 0.4 | |
State and local | | | 0.7 | | | | 0.7 | | | | 0.6 | | | | 0.4 | | | | 0.3 | | | | 0.3 | | | | 0.4 | | | | 0.6 | | | | 0.5 | | | | 0.4 | | | | 0.3 | | | | 0.3 | | | | 0.3 | |
| | | | | | | | | | | | | |
Private gross fixed capital formation (b) (c) | | | 2.5 | | | | 2.1 | | | | 0.7 | | | | -1.7 | | | | -3.5 | | | | -4.2 | | | | -3.7 | | | | -2.4 | | | | -1.4 | | | | -0.7 | | | | 0.4 | | | | 1.7 | | | | 3.5 | |
| | | | | | | | | | | | | |
Dwellings | | | 0.2 | | | | 0.3 | | | | -0.3 | | | | -1.4 | | | | -1.9 | | | | -1.5 | | | | -0.6 | | | | 0.3 | | | | 0.4 | | | | -0.1 | | | | -0.7 | | | | -1.1 | | | | -1.1 | |
New and used | | | 0.2 | | | | 0.1 | | | | -0.3 | | | | -0.9 | | | | -1.2 | | | | -1.1 | | | | -0.6 | | | | -0.1 | | | | -0.1 | | | | -0.2 | | | | -0.5 | | | | -0.7 | | | | -0.7 | |
Alterations and additions | | | 0.0 | | | | 0.1 | | | | -0.1 | | | | -0.5 | | | | -0.7 | | | | -0.5 | | | | 0.0 | | | | 0.4 | | | | 0.5 | | | | 0.2 | | | | -0.2 | | | | -0.4 | | | | -0.3 | |
| | | | | | | | | | | | | |
Business Investment (b) (c) | | | 2.5 | | | | 2.3 | | | | 1.6 | | | | 0.1 | | | | -1.6 | | | | -2.9 | | | | -3.5 | | | | -3.0 | | | | -1.8 | | | | -0.4 | | | | 1.4 | | | | 3.1 | | | | 4.5 | |
Non-dwelling construction (b) | | | 1.2 | | | | 1.5 | | | | 1.4 | | | | 0.8 | | | | -0.1 | | | | -0.9 | | | | -1.4 | | | | -1.2 | | | | -0.6 | | | | 0.0 | | | | 0.9 | | | | 1.9 | | | | 2.9 | |
Machinery and equipment (b) | | | 1.3 | | | | 0.8 | | | | 0.2 | | | | -0.7 | | | | -1.5 | | | | -2.0 | | | | -2.2 | | | | -1.8 | | | | -1.2 | | | | -0.4 | | | | 0.5 | | | | 1.2 | | | | 1.7 | |
| | | | | | | | | | | | | |
Livestock and orchards | | | 0.0 | | | | 0.0 | | | | 0.0 | | | | 0.0 | | | | 0.0 | | | | 0.0 | | | | 0.0 | | | | 0.0 | | | | 0.0 | | | | 0.0 | | | | 0.0 | | | | 0.0 | | | | 0.0 | |
Intellectual property products | | | 0.1 | | | | 0.1 | | | | 0.0 | | | | 0.0 | | | | 0.0 | | | | 0.1 | | | | 0.2 | | | | 0.2 | | | | 0.2 | | | | 0.1 | | | | 0.1 | | | | 0.1 | | | | 0.1 | |
Ownership transfer costs | | | -0.5 | | | | -0.7 | | | | -0.7 | | | | -0.5 | | | | -0.1 | | | | 0.2 | | | | 0.3 | | | | 0.1 | | | | -0.2 | | | | -0.4 | | | | -0.4 | | | | -0.4 | | | | -0.3 | |
| | | | | | | | | | | | | |
Public gross fixed capital formation (b) (c) | | | 1.1 | | | | 1.1 | | | | 0.9 | | | | 0.5 | | | | -0.1 | | | | 0.0 | | | | 0.5 | | | | 0.9 | | | | 0.8 | | | | 0.1 | | | | -0.6 | | | | -1.0 | | | | -1.2 | |
| | | | | | | | | | | | | |
Public corporations (b) (c) | | | 0.3 | | | | 0.1 | | | | 0.0 | | | | -0.1 | | | | -0.4 | | | | -0.5 | | | | -0.6 | | | | -0.6 | | | | -0.5 | | | | -0.4 | | | | -0.3 | | | | -0.3 | | | | -0.5 | |
Commonwealth (b) | | | 0.0 | | | | 0.0 | | | | 0.0 | | | | 0.0 | | | | 0.0 | | | | 0.1 | | | | 0.1 | | | | 0.0 | | | | 0.0 | | | | -0.1 | | | | 0.0 | | | | 0.0 | | | | 0.1 | |
State and local (c) | | | 0.3 | | | | 0.1 | | | | 0.0 | | | | -0.1 | | | | -0.5 | | | | -0.6 | | | | -0.7 | | | | -0.7 | | | | -0.4 | | | | -0.3 | | | | -0.2 | | | | -0.3 | | | | -0.6 | |
| | | | | | | | | | | | | |
General government | | | 0.9 | | | | 1.0 | | | | 0.9 | | | | 0.6 | | | | 0.3 | | | | 0.5 | | | | 1.1 | | | | 1.5 | | | | 1.3 | | | | 0.5 | | | | -0.4 | | | | -0.7 | | | | -0.7 | |
National | | | 0.4 | | | | 0.5 | | | | 0.4 | | | | 0.1 | | | | -0.2 | | | | -0.1 | | | | 0.0 | | | | 0.2 | | | | 0.3 | | | | 0.2 | | | | 0.1 | | | | 0.0 | | | | 0.0 | |
State and local | | | 0.3 | | | | 0.4 | | | | 0.6 | | | | 0.5 | | | | 0.5 | | | | 0.7 | | | | 1.1 | | | | 1.2 | | | | 0.9 | | | | 0.3 | | | | -0.5 | | | | -0.8 | | | | -0.7 | |
| | | | | | | | | | | | | |
Change in inventories | | | -0.2 | | | | -0.1 | | | | -0.2 | | | | -0.7 | | | | -0.9 | | | | -0.4 | | | | 0.4 | | | | 0.8 | | | | 0.5 | | | | -0.1 | | | | -0.2 | | | | 0.3 | | | | 1.1 | |
| | | | | | | | | | | | | |
Gross state expenditure | | | 6.3 | | | | 5.2 | | | | 2.8 | | | | -1.1 | | | | -4.2 | | | | -4.1 | | | | -2.0 | | | | 0.5 | | | | 1.6 | | | | 1.2 | | | | 1.4 | | | | 3.0 | | | | 5.5 | |
- 24 -
| | | | | | | | | | | | | | | | | | | | | | | | | | | | | | | | | | | | | | | | | | | | | | | | | | | | |
Exports of goods and services | | | 1.2 | | | | 0.8 | | | | -0.3 | | | | -1.2 | | | | -0.7 | | | | 1.2 | | | | 3.1 | | | | 3.3 | | | | 2.3 | | | | -0.1 | | | | -2.9 | | | | -4.7 | | | | -6.0 | |
| | | | | | | | | | | | | |
Overseas | | | 1.6 | | | | 1.6 | | | | 1.0 | | | | 0.3 | | | | -0.1 | | | | 0.5 | | | | 1.5 | | | | 2.3 | | | | 2.7 | | | | 1.3 | | | | -1.2 | | | | -3.6 | | | | -5.3 | |
Goods | | | 1.2 | | | | 1.4 | | | | 0.9 | | | | 0.2 | | | | 0.1 | | | | 0.8 | | | | 1.9 | | | | 2.7 | | | | 3.0 | | | | 1.5 | | | | -1.1 | | | | -3.5 | | | | -5.1 | |
Services | | | 0.4 | | | | 0.3 | | | | 0.1 | | | | 0.0 | | | | -0.2 | | | | -0.3 | | | | -0.4 | | | | -0.4 | | | | -0.3 | | | | -0.2 | | | | -0.1 | | | | -0.1 | | | | -0.2 | |
| | | | | | | | | | | | | |
Interstate | | | -0.3 | | | | -0.8 | | | | -1.4 | | | | -1.5 | | | | -0.6 | | | | 0.8 | | | | 1.6 | | | | 1.0 | | | | -0.4 | | | | -1.5 | | | | -1.7 | | | | -1.1 | | | | -0.7 | |
Goods | | | 0.1 | | | | -0.4 | | | | -0.9 | | | | -1.1 | | | | -0.4 | | | | 0.8 | | | | 1.5 | | | | 0.9 | | | | -0.4 | | | | -1.5 | | | | -1.6 | | | | -1.0 | | | | -0.6 | |
Selected services | | | -0.4 | | | | -0.5 | | | | -0.5 | | | | -0.4 | | | | -0.2 | | | | 0.0 | | | | 0.1 | | | | 0.1 | | | | 0.1 | | | | 0.0 | | | | 0.0 | | | | -0.1 | | | | -0.1 | |
| | | | | | | | | | | | | |
less Imports of goods and services | | | 4.5 | | | | 3.8 | | | | 1.6 | | | | -2.0 | | | | -4.8 | | | | -4.2 | | | | -1.5 | | | | 0.8 | | | | 1.3 | | | | -0.4 | | | | -1.4 | | | | -0.5 | | | | 1.3 | |
| | | | | | | | | | | | | |
less Overseas | | | 3.3 | | | | 2.7 | | | | 0.8 | | | | -1.5 | | | | -2.7 | | | | -1.9 | | | | 0.3 | | | | 2.2 | | | | 2.8 | | | | 2.2 | | | | 1.5 | | | | 1.4 | | | | 1.7 | |
less Goods | | | 2.3 | | | | 2.1 | | | | 0.7 | | | | -1.1 | | | | -2.1 | | | | -1.6 | | | | 0.2 | | | | 1.7 | | | | 2.2 | | | | 1.7 | | | | 0.9 | | | | 0.8 | | | | 1.0 | |
less Services | | | 1.0 | | | | 0.7 | | | | 0.1 | | | | -0.4 | | | | -0.6 | | | | -0.3 | | | | 0.1 | | | | 0.4 | | | | 0.6 | | | | 0.5 | | | | 0.5 | | | | 0.6 | | | | 0.7 | |
| | | | | | | | | | | | | |
less Interstate | | | 1.2 | | | | 1.1 | | | | 0.8 | | | | -0.5 | | | | -2.1 | | | | -2.3 | | | | -1.8 | | | | -1.3 | | | | -1.5 | | | | -2.6 | | | | -2.8 | | | | -1.8 | | | | -0.4 | |
less Goods | | | 1.3 | | | | 1.2 | | | | 0.9 | | | | -0.4 | | | | -1.9 | | | | -2.2 | | | | -1.8 | | | | -1.5 | | | | -1.7 | | | | -2.7 | | | | -2.8 | | | | -1.7 | | | | -0.3 | |
less Selected services | | | -0.2 | | | | -0.2 | | | | -0.1 | | | | -0.2 | | | | -0.2 | | | | -0.1 | | | | 0.0 | | | | 0.1 | | | | 0.2 | | | | 0.1 | | | | 0.0 | | | | -0.1 | | | | -0.1 | |
| | | | | | | | | | | | | |
Statistical discrepancy (E) | | | 0.6 | | | | 0.6 | | | | 0.3 | | | | -0.1 | | | | -0.5 | | | | -0.8 | | | | -0.6 | | | | -0.3 | | | | 0.2 | | | | 0.5 | | | | 0.5 | | | | 0.3 | | | | 0.1 | |
| | | | | | | | | | | | | |
Gross state product | | | 3.7 | | | | 2.8 | | | | 1.1 | | | | -0.5 | | | | -0.6 | | | | 0.5 | | | | 2.0 | | | | 2.7 | | | | 2.9 | | | | 2.0 | | | | 0.4 | | | | -1.0 | | | | -1.7 | |
| (a) | Chain volume measure reference year 2008-09 |
| (b) | In March quarter 2007, there was a trend break due to the Commonwealth Government’s privatisation of Telstra and users should interpret the trend estimates around this period with caution. Additionally, Tarong Energy completed the acquisition of the remaining 50 per cent of Tarong North Power Station not already owned and this transaction has been excluded from the underlying trend estimate for December quarter 2009. |
| (c) | In November 2010, the Queensland Government floated QR National and sold a lease of the Port of Brisbane. Users should interpret the trend estimate of business investment and public gross fixed capital formation, public corporations - state and local, with caution around this period. |
TABLE 5
- 25 -
Explanatory Notes
Overview
The Queensland State Accounts are compiled in accordance with the international standards contained in the System of National Accounts 2008 (SNA08).
Readers interested in more detailed information on the changes to national and state accounts are referred to the Australian Bureau of Statistics (ABS) Australian National Accounts: Concepts, Sources and Methods, 2000 (ABS 5216.0) and the following ABS information papers:
| • | | Australian National Accounts, Introduction of Chain Volume and Price Indexes, Sep 1997 (ABS 5248.0); and |
| • | | Product changes to Australian System of National Accounts following revisions to international standards, 2009 (ABS 5204.0.55.005). |
The broad structure of the Queensland State Accounts is that of a social accounting matrix comprising two regions: Queensland and the Rest of Australia. This enables the appropriate comparison to be made of the performance of Queensland with respect to the performance of the rest of the nation, rather than with Australia as a whole. This publication reports only on the domestic production accounts of these two regions.
The Queensland State Accounts are designed to allow consolidation of the two regions into the single region of Australia. The Australian National Accounts, produced by the ABS, form a clear national framework and set of estimates, with which the Queensland State Accounts is congruent.
The ABS also produces the Australian National Accounts, National Income, Expenditure and Product (ABS 5206.0). The Queensland State Accounts uses as much Queensland information contained in this ABS publication as is appropriate and relevant. However, since the purpose of the Queensland State Accounts is to measure the structure and performance of the Queensland economy as accurately and comprehensively as possible, it significantly extends the information contained in the Australian National Accounts, National Income, Expenditure and Product series. Since this extension is feasible in the case of a single State, especially one with the statistical resources of Queensland, the Queensland State Accounts is not necessarily bound to agree exactly with any ABS estimates. Nevertheless, the quality of the Australian National Accounts is such that the Queensland State Accounts estimates are generally and routinely benchmarked to them. In all cases, the ABS estimates are taken into strong initial consideration.
The major extension of the domestic production account in the Queensland State Accounts system is the addition of estimates of interstate trade in goods and trade in services. This enables the system to derive quarterly estimates of gross state product in volume terms. As well, this provides a more comprehensive understanding of Queensland’s overall trade performance, and replaces the more limited understanding provided by the common misperception of overseas State trade as total State trade.
- 26 -
| | |
 | | Queensland State Accounts, June Quarter 2011 |
Methodology
The estimates in the Queensland State Accounts generally agree with those of the Australian Bureau of Statistics (ABS) Australian National Accounts, National Income, Expenditure and Product (ABS 5206.0) when available, except in cases where the Office of Economic and Statistical Research (OESR) has improved on ABS estimates. These improvements generally arise from data confrontation exercises which involve alternative sources of evidence or information, and which often involve the input of further primary information.
Chain Volume Measures
The chain volume measures appearing in this issue are annually re-weighted chained Laspeyres indexes referenced to the current price in a reference year, currently 2008-09. Chained Laspeyres volume measures are compiled by linking together (compounding) movements in volumes, calculated by using the average prices of the previous financial year, and applying the compounded movements to the current price estimates of the reference year. Quarterly chain volume estimates are benchmarked to annual chain volume estimates, so that the quarterly estimates for a financial year sum to the corresponding annual estimate.
Chain volume measures are not generally additive. They do not sum in total, in the way original current price components do. To minimise this impact, the ABS uses the year preceding the last full financial year as the reference year. This approach means that the chain volume measures are additive in the reference year (currently 2008-09) and the quarters following the reference year. However, the chain volume measures are not additive in the quarters preceding the reference year.
Compensation of employees
The OESR estimate of compensation of employees (COE) differs from that published by the ABS in Australian National Accounts: National Income, Expenditure and Product (ABS 5206.0). As reported in the September quarter 1994 issue of the Queensland State Accounts, the OESR is of the opinion that the compensation of employees (COE) series published in the ABS 5206.0 substantially under-recorded COE from the period commencing September quarter 1993. As a result, in the period starting with September quarter 1993 and ending December quarter 2001, the average of the quarterly movements in average weekly earnings, and survey of employment and earnings is combined with the number of wage and salary earners to derive the COE series published in the Queensland State Accounts.
From March 2002 onwards, the OESR COE series is extrapolated using the quarterly movements in the compensation of employees series published in ABS Australian National Accounts, National Income, Expenditure and Product (ABS 5206.0).
Further, the OESR estimates of COE differ from that published by the ABS in Australian National Accounts, State Accounts, 2009-10 (ABS 5220.0) for 2009-10. This difference primarily reflects the OESR incorporating public sector wages consistent with Queensland Treasury data on employee expenses in the State general government sector.
- 27 -
Gross operating surplus and gross mixed income
OESR uses indicators of activity to estimate Queensland’s share of the five components of Australia’s gross operating surplus and mixed income (GOS/MI). Since March quarter 2001, State data from the ABS publication Business Indicators: Australia (ABS 5276.0) has been used to estimate the share for private non-financial corporations. These estimates are benchmarked to the annual ABS estimates contained in Australian National Accounts, State Accounts 2009-10 (ABS 5220.0) up to 2009-10.
The OESR estimates of GOS/MI differ from that published by the ABS in Australian National Accounts, State Accounts, 2009-10 (ABS 5220.0) for 2009-10. This difference reflects the OESR using a different methodology to allocate the Australian estimates of industry GOS/MI between Queensland and the Rest of Australia.
Taxes less subsidies on production and imports
The quarterly Queensland State Accounts taxes less subsidies on production and imports (taxes) estimates are compiled using government finance statistics provided by the ABS to calculate State and local government taxes and estimates of Commonwealth taxes levied in Queensland. These estimates have been benchmarked to the ABS estimates contained in Australian National Accounts, State Accounts 2009-10 (ABS 5220.0).
Statistical discrepancy (I) and (E)
In line with the ABS practice, an explicit statistical discrepancy has been retained in the Queensland State Accounts. This discrepancy is allocated between the income and expenditure estimates to provide a unique measure of quarterly current gross state product. This is pro-rated from the national estimates to Queensland using gross state/domestic product.
Gross state product
The estimates of gross state product (GSP) are produced by summing the income components of gross state product: compensation of employees, gross operating surplus, gross mixed income, and taxes less subsidies on production and imports. Expenditure estimates of GSP comprise the summation of household and government consumption, capital formation, change in inventories and exports less imports. These are balanced against the income components of GSP (i.e. the income approach).
The method used to obtain chain volume estimates of GSP could be best described as ‘indirect’ as the only current price estimates of GSP available are obtained by aggregating the incomes accruing from production (i.e. the income approach). It is not possible to satisfactorily deflate such incomes to produce chain volume estimates because they do not comprise readily identifiable price and quantity elements. Consequently, the chain volume estimates of GSP are derived using the expenditure approach.
Household final consumption expenditure
The estimate of household final consumption expenditure is largely based on ABS estimates in Australian National Accounts, National Income, Expenditure and Product (ABS 5206.0) supplemented with data contained in Tourism Research Australia (TRA) National Visitor Survey and International Visitor Survey, and the ABS Balance of Payments and International Investment Position (ABS 5302.0).
- 28 -
| | |
 | | Queensland State Accounts, June Quarter 2011 |
Differences between the Australian National Accounts, National Income, Expenditure and Product (ABS 5206.0) and the Queensland State Accounts are due primarily to differences in the estimates of net interstate and overseas expenditure by visitors.
General government final consumption expenditure
Estimates of these components are generally taken from the ABS estimates in the Australian National Accounts, National Income, Expenditure and Product (ABS 5206.0).
In some instances, particularly in the most recent quarters, there are differences between the Queensland State Accounts estimates of general government final consumption expenditure and those published by the ABS Australian National Accounts: National Income, Expenditure and Product (ABS 5206.0). In these cases, the OESR has incorporated additional information that has become available after the release of ABS estimates. No adjustments have been made for Australia.
In 1999-2000 the Queensland State Accounts current price estimate is different from the ABS by $1.1 billion due to different treatment of an abnormal return on QSuper trust assets.
Private gross fixed capital formation
This is formed by the addition of the components of private investment: dwellings, non-dwelling construction, machinery and equipment, livestock and orchards, intangible fixed assets and ownership transfer costs. Estimates of these components are generally taken from the ABS estimates in the Australian National Accounts, National Income, Expenditure and Product (ABS 5206.0).
Business investment
This is calculated by the addition of non-dwelling construction and machinery and equipment.
General government gross fixed capital formation
Estimates of general government investment, including Commonwealth and State and local general government investment, are generally taken from the ABS estimates in the Australian National Accounts, National Income, Expenditure and Product (ABS 5206.0).
In some instances, there are differences between the Queensland State Accounts estimates of general government gross fixed capital formation and those published by the ABS Australian National Accounts: National Income, Expenditure and Product (ABS 5206.0). In these cases, the OESR has either corrected ABS estimates or incorporated additional information that has become available after the release of ABS estimates. No adjustments have been made to Australia.
Public corporations gross fixed capital formation
Estimates of these components are generally taken from the ABS estimates in the Australian National Accounts, National Income, Expenditure and Product (ABS 5206.0). However, in some instances, there are differences between the Queensland State Accounts estimates of public corporations gross fixed capital formation and those published by the ABS Australian National Accounts: National Income, Expenditure and Product (ABS 5206.0). In these cases, the OESR has incorporated additional information that has become available after the release of ABS estimates. No adjustments have been made to Australia.
- 29 -
Changes in inventories
Estimates of these components are made by allocating the national inventory activity identified in the ABS estimates in the Australian National Accounts, National Income, Expenditure and Product (ABS 5206.0) to Queensland.
Gross state expenditure
The sum of household final consumption expenditure, general government final consumption expenditure, private gross fixed capital formation, public corporations gross fixed capital formation, general government gross fixed capital formation and change in inventories.
Exports of goods, overseas
Estimates are derived using data from ABS International Trade in Goods and Services (ABS 5368.0) at the two digit Standard International Trade Classification (SITC) level. The chain volume measure series is estimated using Queensland specific SITC implicit price deflators obtained from the ABS.
Exports of services, overseas
Estimates for Queensland are derived as a share from the ABS Balance of Payments and International Investment Position (ABS 5302.0). Data from the TRA International Visitor Survey and ABS Overseas Arrivals and Departures (ABS 3401.0) is also used.
Exports of goods, interstate
Estimated from the ABS Queensland Interstate Trade Survey in which interstate exports of goods are estimated by broad commodity group.
This Queensland Interstate Trade Survey was revised in June quarter 2008. The new survey was incorporated into the Queensland State Accounts in the September quarter 2008 edition, with series prior to June quarter 2008 re-estimated based on the differences in the levels of interstate exports between the old and the new surveys.
Exports of selected services, interstate
Exports of selected services are estimated using a combination of results from the TRA National Visitor Survey and the ABS Balance of Payments and International Investment Position (ABS 5302.0). Historical expenditure figures were derived using a combination of the above, Domestic Tourism Expenditure Surveys (1982, 1992), and Queensland Travel and Tourism Corporation’s Queensland Visitors Survey.
Imports of goods, overseas
The difference between the Queensland State Accounts estimates of Queensland imports of goods, overseas and those published by the ABS Australian National Accounts: National Income, Expenditure and Product (ABS 5206.0) are due to different treatment of civil aircraft imports. Estimates are derived on a Balance of Payments Broad Economic Category (BOP BEC) basis, using unpublished data from the ABS Balance of Payments and International Investment Position (ABS 5302.0). Chain volume measures are derived using Queensland specific BOP BEC implicit price deflators.
- 30 -
| | |
 | | Queensland State Accounts, June Quarter 2011 |
Imports of services, overseas
This is estimated for Queensland by calculating the State’s share from the ABS Balance of Payments and International Investment Position (ABS 5302.0).
Imports of goods, interstate
Estimated from the ABS Queensland Interstate Trade Survey in which interstate imports of goods are estimated by broad commodity group.
This Queensland Interstate Trade Survey was revised in June quarter 2008. The new survey was incorporated into the Queensland State Accounts in the September quarter 2008 edition, with series prior to June quarter 2008 re-estimated based on the differences in the levels of interstate imports between the old and the new surveys.
Imports of selected services, interstate
Selected services are estimated using a combination of results from the TRA National Visitor Survey and the ABS Balance of Payments and International Investment Position (ABS 5302.0). Historical expenditure figures were derived using a combination of the above, Domestic Tourism Expenditure Surveys (1982, 1992), and Queensland Travel and Tourism Corporation’s Queensland Visitors Survey.
Expenditure on gross state product
The sum of gross state expenditure, the statistical discrepancy (E), exports of goods and services, less imports of goods and services.
Seasonally adjusted estimates
The seasonal component of a time series comprises three main types of systematic calendar related influences: seasonal influences, trading day influences and moving holiday influences. For more information on these influences see the ABS information paper An Introductory Course on Time Series Analysis (ABS 1346.0.55.001).
Seasonal adjustment removes the estimated effects of seasonal and other types of calendar variations from the statistical series, so that the effects of other influences can be analysed.
To produce smoothed seasonally adjusted estimates for the Queensland State Accounts, seasonal factors are obtained using the X-11Q procedure (developed by the U.S. Bureau of the Census). The X-11Q procedure uses an iterative system of moving averages and linear regression techniques to obtain seasonal and other systematic calendar effects.
For quarterly series, prior adjustments can be incorporated for moving holidays and trading day adjustments. However, in accordance with the methodology used by the ABS to adjust the Australian National Accounts, it was assumed that the trading day effects on quarterly Queensland State Accounts series are likely to be insignificant except in the case of private final consumption expenditure.
- 31 -
Separate current and chain volume measure seasonal factors are calculated for interstate and foreign imports and exports of tourism services, reflecting the seasonality in the implicit price deflators of these series.
Differences in the estimates and in assumptions and judgments made in the smoothing procedure will result in the seasonally adjusted estimates in the Queensland State Accounts being different to those produced and published by the ABS.
Trend estimates
Trend estimates may be produced by smoothing out the residual/irregular components of the seasonally adjusted series. The trend component is defined as the long term movement in a series and is typically a result of influences such as population growth, price inflation and general economic development.
Queensland State Accounts trend estimates are compiled by applying a seven term Henderson moving average, similar to that used by the ABS and outlined in the ABS information paper A Guide to Smoothing Time Series – Monitoring Trends (ABS 1349.0).
The Henderson procedure is a symmetric moving average that is centred on a point in time that is designed to minimise the distortion to trend level, turning point and timing. The Henderson method uses individually tailored end-weights to overcome the end-point problem (insufficient observations available for the calculation of the last three quarters of a series). These end-weights reflect the irregularity of the series being trended.
Differences in the estimates and in assumptions and judgments made in the filtering procedure will result in the trend estimates in the Queensland State Accounts being different to those produced and published by the ABS.
- 32 -
| | |
 | | Queensland State Accounts, June Quarter 2011 |
Notes on formulae used (changes)
Last quarter
Change in a variable from one quarter to the next, e.g. the change from March quarter 2011 to June quarter 2011. This is only appropriate for seasonally adjusted and trend estimates. In the tables, this item is referred to as “quarterly percentage change”.
Same quarter last year
Change in a variable from one quarter to the same quarter in the following year, e.g. the change from June quarter 2010 to June quarter 2011. This provides a measure of annual change. In the tables, this item is referred to as “annual percentage change”.
Year-average
Change in a variable from one set of four continuous quarters to the same four quarters in the following year, e.g. the change from the sum of September quarter 2009, December quarter 2009, March quarter 2010 and June quarter 2010 to the sum or average of September quarter 2010, December quarter 2010, March quarter 2011 and June quarter 2011. This also provides a measure of annual change.
Contribution to growth
The contribution of a component of an aggregate series to change in the aggregate from one period to another is given by the formula:
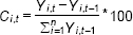
where Ci,t is the percentage point contribution to the change in the aggregate series  from time period t-1 to time period t, caused by the change in the ith component of the aggregate series. Series calculated this way are referred to as “quarterly contribution to growth”.
It should be noted that contributions are also calculated for the change from time period t-4 to time period t. Series calculated this way are referred to as “annual contribution to growth”.
- 33 -
Glossary of Terms
These definitions have been constructed from the point of view of the Queensland State Accounts, rather than the Australian National Accounts; that is, they relate to the case of Queensland or to the Rest of Australia, rather than the nation as a whole.
Business investment
Defined as the gross fixed capital formation on machinery and equipment plus non-dwelling construction.
Chain volume measures
Chain volume measure (or real) estimates are valued in the price of a reference year and as a result are free of the direct effects of price changes. For example, estimates for June quarter 2011 are valued using 2008-09 prices.
Changes in inventories
Inventories consist of materials and supplies, work-in-progress, finished goods and goods for resale, and includes all inventories held by government.
Compensation of employees
Compensation of employees is the total remuneration, in cash or in kind, payable by an enterprise to an employee in return for work done by the latter during the accounting period. It is further classified into two sub-components: wages and salaries; and employers’ social contributions. Compensation of employees excludes any taxes payable by the employer on the wage and salary bill (e.g. payroll tax).
Current prices
Current price (or nominal) estimates are valued at the prices of the period to which the observation relates. For example, estimates for June quarter 2011 are valued using June quarter 2011 prices.
Dwellings
Dwellings are buildings that are used entirely or primarily as residences, including any associated structures, such as garages, and all permanent fixtures customarily installed in residences.
Exports of goods and services
Goods, commodities or services sold by residents (Queenslanders) to non-residents.
Exports of goods and services, interstate
Goods, commodities or services sold by residents (Queenslanders) to Rest of Australia residents.
Exports of goods and services, overseas
Goods, commodities or services sold by residents (Queenslanders) to overseas residents.
- 34 -
| | |
 | | Queensland State Accounts, June Quarter 2011 |
Exports of goods, interstate
All transfers of ownership of goods from Queensland residents to Rest of Australia residents.
Exports of goods, overseas
All transfers of ownership of goods from Queensland residents to residents of overseas countries.
Exports of selected services, interstate
Sales of services provided by Queensland resident producers to Rest of Australia residents, including sales to Rest of Australia residents visiting Queensland.
Exports of services, overseas
Sales of services provided by Queensland resident producers to residents of overseas countries, including sales to overseas residents visiting Queensland.
General government
General government consists of all government units and non-market units that are controlled and predominantly financed by government. It mainly comprises Commonwealth, State and local government departments, offices and other bodies that are primarily engaged in production of goods and services outside the normal market mechanism. Statistics for this broad sector are broken down into two levels of government: National government; and State and local government.
General government final consumption expenditure
Net expenditure on goods and services by government authorities, except those classified as public corporations, which does not result in the creation of fixed assets or inventories or in the acquisition of land and existing buildings or second-hand assets. This can be thought of as investment by government departments.
General government gross fixed capital formation
Expenditure on new fixed assets plus net expenditure on second-hand fixed assets, whether for additions or replacements (other than weapons of destruction and weapon delivery systems).
Gross fixed capital formation
The value of acquisitions of new and existing produced assets, other than inventories, less the value of disposals of new or existing produced assets, other than inventories.
Gross mixed income
The surplus accruing to owners of unincorporated enterprises from the process of production (as defined for gross operating surplus).
- 35 -
Gross operating surplus
The surplus accruing to owners from processes of production before deducting any explicit or implicit interest charges, rent or other property income payable on financial assets required to carry on the production and before deducting consumption of fixed capital.
Gross state expenditure
The total expenditure within a given period by Queensland residents on final goods and services (i.e. final consumption plus capital formation).
Gross state product
The total market value of goods and services produced in Queensland within a given period after deducting the cost of goods and services used up in the process of production, but before deducting allowances for the consumption of fixed capital.
Total factor income
That part of the cost of producing the gross state product which consists of gross payments to factors of production (labour and capital). It represents the value added by these factors in the process or production, and is equivalent to gross state product less taxes plus subsidies on production and imports.
Household
A small group of persons who share the same living accommodation, who pool some, or all, of their income and wealth and who consume certain types of goods and services collectively, mainly housing and food.
The household sector includes all non-financial unincorporated enterprises that are owned and controlled by households and are not included in the private non-financial corporations sector.
Most business partnerships and sole proprietorships are included because their owners combine their business and personal affairs and do not keep separate accounts for their business operations and therefore do not qualify as quasi-corporations.
Household final consumption expenditure
Net expenditure on goods and services by persons and expenditure of a current nature by private non-profit institutions serving households.
Implicit price deflator
Obtained by dividing a current price value by its real (CVM) counterpart.
Imports of goods and services
Goods, commodities or services purchased by residents (Queenslanders) from non-residents (Rest of Australia and overseas countries).
- 36 -
| | |
 | | Queensland State Accounts, June Quarter 2011 |
Imports of goods and services, interstate
The value of interstate (Rest of Australia) goods imported by Queensland residents and amounts payable to interstate (Rest of Australia) residents for the provision of services to Queensland residents.
Imports of goods and services, overseas
The value of overseas goods imported by Queensland residents and amounts payable to overseas residents for the provision of services to Queensland residents.
Imports of goods, interstate
All transfers of ownership of goods from interstate residents (Rest of Australia) to Queensland residents.
Imports of goods, overseas
All transfers of ownership of goods from residents of overseas countries to Queensland residents.
Imports of services, overseas
Sales of services provided by residents of overseas countries to Queensland residents including, sales to Queensland residents visiting overseas countries.
Imports of selected services, interstate
Sales of selected services provided by resident producers of other states to Queensland, including sales to Queensland residents visiting other states.
Nominal prices
See current prices.
Non-dwelling construction
Consists of non-residential buildings and other structures. ‘Non-residential buildings’ are buildings other than dwellings, including fixtures, facilities and equipment that are integral parts of the structures and costs of site clearance and preparations.
Private gross fixed capital formation
The total value of private sector producers’ acquisitions, less disposals of fixed assets during the accounting period plus certain additions to the value of non-produced assets realised by the production activity of institutional units. Expenditure is broken down into dwellings, non-dwelling construction, machinery and equipment, livestock and orchards, intangible fixed assets and ownership transfer costs.
Public corporations
Resident government controlled corporations and quasi-corporations that are created for the purpose of producing goods and services for the market and may be a source of profit or other financial gain to their owner(s).
- 37 -
Public corporations gross fixed capital formation
The value of new and existing produced assets, other than inventories, less the value of disposals of new and existing produced assets, other than inventories. This can be thought of as investment by government owned corporations.
Public final demand
Defined as the sum of general government final consumption expenditure, public corporations gross fixed capital formation and general government gross fixed capital formation.
Real prices
See chain volume measures.
Seasonal adjustment
Seasonal adjustment is the process of estimating and then removing from a time series influences that are systematic and calendar related, such as trading day effects and moving holidays.
Taxes less subsidies on production and imports
Taxes less subsidies on production and imports consists of ‘taxes less subsidies on products’ and ‘other’ taxes/subsidies on production. Taxes/subsidies on products are payable on goods and services when they are produced or sold by their producers and include taxes/subsidies and duties/subsidies on imports. Other taxes on production consist mainly of taxes on the ownership or use of land, building or other assets used in production, or labour employed or compensation of employees paid.
Trend
Trend estimates reflect the ‘long term’ movement in a time series without calendar related and irregular effects, and is a reflection of the underlying level. It is the result of influences such as population growth, price inflation and general economic changes.
- 38 -

Queensland Government