EXHIBIT (c)(vi)
Document Entitled
State Budget 2011-12 – Mid Year Fiscal and Economic Review

State Budget 2011 — 12
Mid Year Fiscal and Economic Review

STATE BUDGET 2011-12
MID YEAR FISCAL AND ECONOMIC REVIEW
CONTEXT
The Mid Year Fiscal and Economic Review (MYFER) is published in accordance with the Australian Loan Council’s Uniform Presentation Framework.
The MYFER presents revised fiscal estimates for the current Budget year and the three following years for the General Government, Public Non-financial Corporations (PNFC) and Non-financial Public sectors. These revised estimates take into account developments since the preparation of the 2011-12 Budget.
Key fiscal objectives of the Queensland Government in formulating the 2011-12 MYFER were to:
| | • | | achieve a General Government net operating surplus by no later than 2015-16 |
| | • | | stabilise net financial liabilities as a proportion of revenue in the Non-financial Public Sector. |
Achieving these objectives has required further fiscal consolidation measures to improve the net operating balance, rising to over $550 million in 2014-15 and reducing capital expenditure by over $500 million across the forward estimates.
ECONOMIC OVERVIEW
| | • | | Largely reflecting the impact of natural disasters on exports, economic growth in Queensland slowed to 0.2% in 2010-11, slightly above the unchanged gross state product (GSP) estimated in the 2011-12 Budget for 2010-11. |
| | • | | A recovery in exports and continuing strong growth in resource sector investment are anticipated to support economic growth in 2011-12 and 2012-13. However, a deterioration in external conditions means that growth is now predicted to be 4 1/4% in 2011-12 and 5% in 2012-13, lower than the 5% and 5 1/4% forecast respectively at Budget. |
| | • | | A faster than previously expected ramp up in resource sector investment should see the level of business investment in 2011-12 and 2012-13 higher than that forecast at Budget. The escalation in the Euro debt crisis has lowered asset prices and confidence and resulted in a slower than anticipated recovery in dwelling investment and weaker than expected growth in household consumption. Weaker external conditions have also weighed on the outlook for exports growth in both 2011-12 and 2012-13. |
| | • | | Reflecting both a weaker outlook for labour intensive sectors of the economy and increased caution in staff recruitment, employment is forecast to grow 1 1/2% and 2 1/4% in 2011-12 and 2012-13 respectively, weaker than the 3% and 3 1/4% forecast at Budget time. As a result, the year-average unemployment rate is now forecast to be 5 1/2% in 2011-12 and 5 1/4% in 2012-13, slightly higher than Budget expectations of 5% and 4 3/4% respectively. |
| | | | |
| | | Mid Year Fiscal and Economic Review 2011-12 | | 1 |
FISCAL OVERVIEW
| | • | | The timing of disaster payments from the Australian Government has a significant impact on Queensland’s operating position across the forward estimates. The 2011-12 General Government net operating balance is expected to be a deficit of $2.853 billion, compared to a Budget estimate of $4.058 billion, reflecting a further disaster related advance payment of $1.4 billion from the Australian Government. |
| | • | | Operating deficits are also forecast for 2012-13 and 2013-14. A small headline operating surplus is forecast for 2014-15. These forecasts also reflect the timing of natural disaster cashflows. |
| | • | | Forecast lower economic growth is reflected in tax, royalty and GST revenue projections being $1.144 billion less over the period 2011-12 to 2014-15 than projected in the 2011-12 Budget. Policy decisions have lessened the impact of this deterioration. |
| | • | | General Government capital purchases are expected to be $7.292 billion in 2011-12, $112 million (1.6%) higher than the 2011-12 Budget estimate of $7.180 billion. |
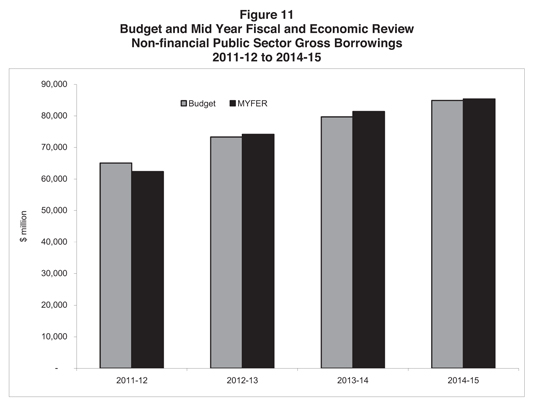
| | • | | Non-financial Public Sector borrowings of $62.352 billion are projected at 30 June 2012, $2.736 billion less than the 2011-12 Budget estimate. By 2014-15, gross borrowings are expected to reach $85.378 billion. |
SAVINGS AND REVENUE POLICY MEASURES
The Queensland Government remains committed to improving the State’s fiscal position and meeting its fiscal principles. In this regard, the Government has committed to the following measures in the 2011-12 MYFER:
| | • | | further reductions in the size of the Queensland Public Service through extending the Voluntary Separation Program to contribute towards further ongoing savings of $150 million per annum from 2013-14 |
| | • | | increased cost recovery for major projects and mining services raising $19 million in a full year and ongoing |
| | • | | deferral of the abolition of duty on the transfer of core business assets until the Budget can accommodate the abolition |
| | • | | cash bidding for prospective exploration land expected to result in a net gain of $95 million per annum from 2013-14 after related expenses |
| | • | | application of transfer duty on the transfer of mining tenures raising $30 million per annum in a full year |
| | • | | reducing the holdings of the Estates Construction Fund |
| | • | | capital savings of $506.5 million predominately from deferring the Queensland Police Academy. |
Further details on the new savings and revenue measures to be implemented by the Queensland Government can be found later in this document.
| | | | |
| | | Mid Year Fiscal and Economic Review 2011-12 | | 2 |
ECONOMIC CONDITIONS AND OUTLOOK
External Conditions
A number of risks to the external environment outlined at the time of Budget have eventuated and remain unresolved, resulting in heightened financial market volatility and a weaker outlook for the global economy than previously expected. Queensland’s major trading partner economies are now expected to grow 2 3/4% in 2011 and 3 1/4% in 2012, a downgrade of 1/2 and 1 percentage point respectively since the time of Budget (see Table 1).
Table 1
Queensland major trading partner GDP outlook
(annual % change)
| | | | | | | | | | |
| | | 2010 | | 2011 | | 2012 |
| | | Actual | | Budget | | MYFER | | Budget | | MYFER |
Major trading partners1 | | 5.7 | | 3 1/4 | | 2 3/4 | | 4 1/4 | | 3 1/4 |
Non-Japan Asia2 | | 8.1 | | 6 | | 5 1/2 | | 6 1/4 | | 5 |
China | | 10.4 | | 9 1/4 | | 9 1/4 | | 9 | | 8 1/4 |
India | | 8.5 | | 8 | | 7 1/4 | | 8 1/2 | | 7 1/2 |
Japan | | 4.5 | | 0 | | - 1/2 | | 2 3/4 | | 2 |
Europe3 | | 1.8 | | 1 3/4 | | 1 1/2 | | 1 3/4 | | 1/4 |
United States | | 3.0 | | 2 3/4 | | 1 3/4 | | 3 1/4 | | 2 |
| 3. | Includes United Kingdom. |
Sources: Consensus Economics and Queensland Treasury.
Concerns over the debt levels of European governments have escalated significantly in recent months. At the time of Budget, anxiety largely centred on smaller countries, in particular Greece. However, concerns over fiscal sustainability have spread to larger nations such as Italy and Spain. This has seen a rise in borrowing costs, with the spread between Italian and German government bond yields more than doubling since Budget.
With these larger economies integral to the European banking system, measures of interbank funding stress have risen markedly since Budget. While this prompted the US Federal Reserve in concert with other central banks to provide increased US$ liquidity in early December to avert the type of credit squeeze that occurred during the Global Financial Crisis in 2008, this addressed a symptom of the crisis rather than its underlying cause. An European Union Summit meeting in mid-December went some way to addressing the latter, with an expansion in the size of the European Financial Stability Fund via increased funding from the International Monetary Fund, as well as plans for greater fiscal integration of European economies. However, the sheer size of sovereign debt and the lack of detail in the fiscal union proposal mean that a resolution to the European debt crisis still appears some time away. Meanwhile, a still sluggish recovery in the housing and labour markets, as well as uncertainty over policy formulation, have weighed on the economic outlook for the United States.
| | | | |
| | | Mid Year Fiscal and Economic Review 2011-12 | | 3 |
These events have translated into weaker consumer and business confidence across most developed economies and seen European and US share markets fall 20% and 10% since Budget (see Figure 1a and Figure 1b). Weaker asset prices, higher funding costs, lower confidence and the need for further austerity measures are now all forecast to see Europe slip back into recession in early 2012 and grow only 1/4% for the full year, compared with 1 3/4% forecast at Budget time. Economic growth in the US is now forecast to be 1 3/4% and 2% in 2011 and 2012, well below the 2 3/4% and 3 1/4% expected at Budget time.
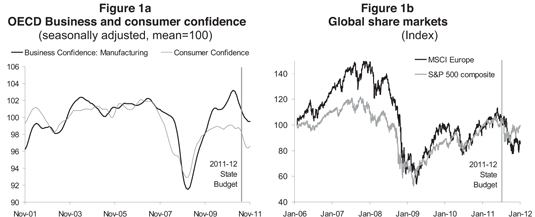
Sources: OECD and Datastream.
At Budget time, economic growth in emerging Asia was anticipated to ease slightly in response to monetary tightening. However, weakness in developed economies has softened the near term outlook, particularly for key manufacturing and export centres in Asia. The US and Europe account for around one third of both India’s and China’s exports – Queensland’s second and third largest export markets. These four economies in turn account for more than half of exports from Japan, Taiwan and Korea. As a result, central banks across emerging Asia have abandoned their tightening bias in order to foster domestic demand as export growth softens. Economic growth in non-Japan Asia is still expected to be a solid 5 1/2% in 2011 and 5% 2012, although below that projected at the time of Budget (see Table 1). Safe haven capital flows have also seen the Yen reach historic highs against the US$, weakening the outlook for Japan – Queensland’s largest market for overseas exports.
With Asia accounting for around three quarters of Queensland’s overseas exports, near term growth in demand for Queensland’s resources has softened. However, with this region expected to be a source of strong resource demand over the long term, the significant expansion in Queensland’s mining investment and export capacity that began in 2010-11 is still expected to gather pace through the rest of 2011-12.
Global events have also dampened business and consumer confidence in Australia (see Figure 2a). This has softened domestic demand and inflationary pressures in non-mining sectors, causing the Reserve Bank of Australia (RBA) to cut official interest rates in both November and December (see Figure 2b). This contrasts with market expectations at Budget time for official interest rates to be raised throughout 2011-12.
| | | | |
| | | Mid Year Fiscal and Economic Review 2011-12 | | 4 |
However, despite a more accommodative RBA stance, the A$ has remained largely above parity – barring periods of heightened market stress associated with the Euro debt crisis – and is likely to average slightly higher over the forecast period compared with expectations at Budget time. Support for the A$ partly reflects relatively greater monetary policy easing elsewhere, with the Fed announcing it would keep its funds rate near zero through to mid-2013, the Bank of Japan and Bank of England expanding their quantitative easing programs, and the European Central Bank expected to move to an increasing accommodative stance to support the euro zone. A$ strength also reflects Asia’s increasing role in driving global growth, which has supported commodity prices, mining investment and growth prospects nationally.
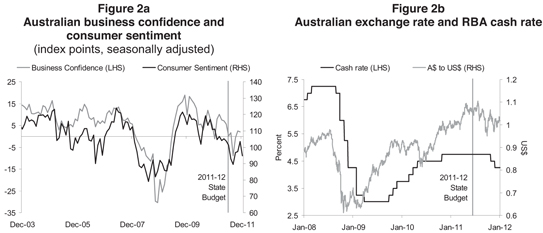
Sources: Westpac Melbourne Institute, NAB, RBA and Datastream.
Domestic Economic Outlook
Largely reflecting the impact of natural disasters on exports, economic growth in Queensland was 0.2% in 2010-11, a fraction above the Budget estimate of unchanged gross state product. While exports fell in 2010-11, domestic demand began to recover, largely reflecting a substantial turnaround in business investment.
A recovery in exports and a further surge in resource sector investment are still anticipated to bolster economic growth in 2011-12 and 2012-13. However, the deterioration in external conditions since Budget suggests growth will be 4 1/4% in 2011-12 and 5% in 2012-13, slightly weaker than the 5% and 5 1/4% forecast respectively at Budget (see Table 2). The escalation in the Euro debt crisis has lowered asset prices and confidence and resulted in a slower than anticipated recovery in dwelling investment and weaker than expected growth in household consumption and employment. Further, softer global growth prospects and supply disruptions mean the recovery in coal exports in 2011-12 will be slower than anticipated. In contrast, the outlook for business investment has strengthened, with a faster than anticipated ramp up in LNG investment and more resource projects reaching final investment decision since Budget.
| | | | |
| | | Mid Year Fiscal and Economic Review 2011-12 | | 5 |
Table 2
Economic forecasts1
(annual % change)
| | | | | | | | | | |
| | | 2010-11 | | 2011-12 | | 2012-13 |
| | | Outcomes | | Budget | | MYFER | | Budget | | MYFER |
Queensland | | | | | | | | | | |
Gross state product2 | | 0.2 | | 5 | | 4 1/4 | | 5 1/4 | | 5 |
Employment | | 2.3 | | 3 | | 1 1/2 | | 3 1/4 | | 2 1/4 |
Unemployment rate5 | | 5.5 | | 5 | | 5 1/2 | | 4 3/4 | | 5 1/4 |
Inflation6 | | 3.3 | | 3 | | 2 1/2 | | 3 1/4 | | 3 3/4 |
Wage Price Index | | 3.9 | | 4 | | 3 3/4 | | 4 1/4 | | 3 3/4 |
Population | | 1.7 | | 1 3/4 | | 1 3/4 | | 2 | | 2 |
Australia | | | | | | | | | | |
Gross domestic product2 | | 2.1 | | 4 | | 3 1/4 | | 3 3/4 | | 3 1/4 |
Employment4 | | 2.2 | | 1 3/4 | | 1 | | 1 3/4 | | 1 1/2 |
Unemployment rate5 | | 4.9 | | 4 3/4 | | 5 1/2 | | 4 1/2 | | 5 1/2 |
Inflation4,6 | | 3.6 | | 2 3/4 | | 2 1/4 | | 3 | | 3 1/4 |
Wage Price Index4 | | 3.8 | | 4 | | 3 3/4 | | 4 1/4 | | 3 3/4 |
Population3 | | 1.4 | | 1 1/2 | | 1 1/2 | | 1 1/2 | | 1 1/2 |
Notes:
| 1. | All numbers are in year-average terms unless stated otherwise. |
| 2. | Chain Volume Measure, 2008-09 reference year for Queensland; 2009-10 reference year for Australia. |
| 3. | Australian estimates are through-the-year to 31 December. |
| 4. | Seasonally adjusted, through-the-year growth to the June quarter. |
| 5. | Year-average for Queensland; seasonally adjusted estimate for the June quarter for Australia. |
| 6. | Headline inflation in 2012-13 includes a 3/4 of a percentage point contribution from the introduction of the carbon price. |
Sources: Queensland Treasury and Australian Government 2011-12 Mid Year Economic and Fiscal Outlook.
Business investment
The level of business investment in 2011-12 and 2012-13 is now expected to be higher than forecast at Budget time. Business investment is now expected to increase by around 35% in 2011-12, up from the 27 3/4% forecast in the 2011-12 Budget. The ramp up in LNG construction has been faster than initially expected, seeing business investment rise by more than 20% in 2010-11, compared with a Budget estimate of 13% growth, and rise by more than 10% in September quarter 2011 alone, to reach a new historic high (see Figure 3a). Despite a deterioration in the near term global outlook, expectations for Asian resource demand to remain strong in the longer term have seen additional resource projects reach final investment decisions since Budget, including BMA’s Caval Ridge coal mine and Wiggins Island port and rail infrastructure.
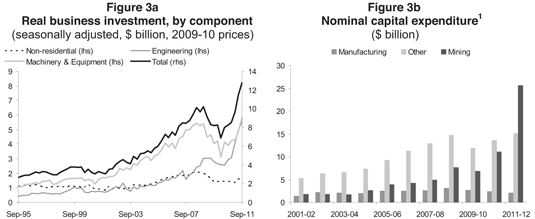
Sources: ABS 5206.0. ABS 5625.0.
Note: 1. 2011-2012 is an estimate, based on 10 year average realisation ratios.
| | | | |
| | | Mid Year Fiscal and Economic Review 2011-12 | | 6 |
Dwelling investment
The dwelling investment outlook has softened since Budget, when investment was forecast to partly recover by 5 3/4% in 2011-12. Civilian population growth slowed further to 11,200 persons in September quarter 2011, dampening owner occupier demand. Lower demand has seen the ABS measure of Brisbane house prices fall 5.2% over the past year. While this benefits housing affordability, weaker prospects for capital gains and greater uncertainty since the escalation in the Euro debt crisis have weighed on investor demand since Budget, as has ongoing tight credit conditions.
These negative effects are expected to be partly offset by the positive impact from recent cuts in official interest rates and the Queensland Government’s Queensland Building Boost grant, which is to be extended until 30 April 2012. With the surge in business investment expected to generate higher migration levels and stronger employment growth next year, the expected recovery in dwelling investment is forecast to strengthen in 2012-13.
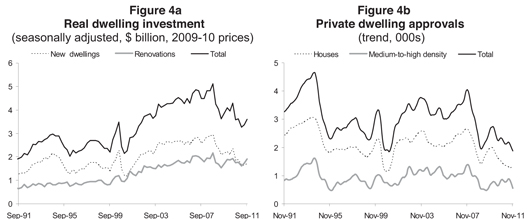
Sources: ABS 8731.0. ABS 5206.0.
Household consumption
Growth in household consumption is likely to be lower than the 2 1/4% and 4 3/4% forecast for 2011-12 and 2012-13 respectively at Budget time. In addition to slower than expected growth in employment and wages, a decline in equity prices and a further fall in house prices since the Budget have adversely affected household wealth and confidence. This has constrained households’ willingness and ability to access housing wealth for consumption, and is likely to facilitate greater consumer caution and higher household saving rates than originally expected. A slower than expected recovery in dwelling investment in 2011-12 is also expected to translate into weaker spending on household items. These factors are expected to more than offset the positive impact on disposable incomes from the recent cuts in official interest rates. Nevertheless, growth in consumer spending is still expected to gradually improve over the next two years, reflecting a strengthening in employment growth.
| | | | |
| | | Mid Year Fiscal and Economic Review 2011-12 | | 7 |

Exports
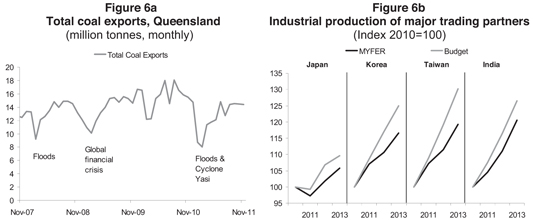
Exports growth is expected to be weaker than the 10% and 9 1/2% forecast for 2011-12 and 2012-13 respectively at Budget time, largely reflecting a weaker outlook for coal export volumes. On the supply side, slower progress in pit de-watering and extended industrial action at BMA mines have not only impacted exports, but also elevated hard coking coal contract prices in 2011. On the demand side, however, higher prices have deterred interest from China. Furthermore, while industrial production in major coal markets, such as Japan, Korea, India and Taiwan, is still expected to increase over coming years, the rate of improvement is now projected to be weaker than at Budget time, largely reflecting the impact of weaker US and European economies on export led growth in the Asian region (see Figure 6b).
The outlook for non-coal exports has also softened, with weaker advanced economies and a higher than expected A$ forecast to weigh on the recovery in manufactured exports, as well as on beef and tourism exports. While the Federal Government recently adopted recommendations from the Knight Review into improving the competitiveness of the overseas education market, this is not expected to improve education exports until 2012-13. Rural exports are still forecast to recover strongly from natural disasters, with good growing conditions and high world prices.
Source: ABS unpublished trade data, various ports, Consensus Economics, DataStream and Queensland Treasury.
| | | | |
| | | Mid Year Fiscal and Economic Review 2011-12 | | 8 |
Looking further ahead, following the boost to GSP from LNG driven investment over the next few years, exports of LNG are expected to start contributing to economic growth from 2014-15. The three projects currently under construction have the potential to exceed 20 million tonnes of LNG exports per year by the end of the decade and see LNG become the State’s second largest commodity export, behind coal. Several large scale new thermal coal projects currently under consideration also have the potential to significantly boost coal production and exports in the medium term.
Labour market, prices and wages
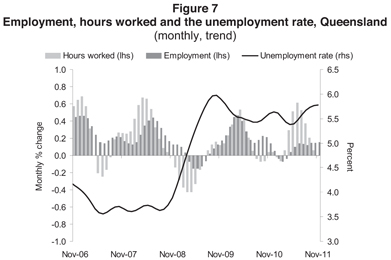
Reflecting both a weaker outlook for labour intensive sectors of the economy and greater investor caution, employment is forecast to grow 1 1/2% and 2 1/4% in 2011-12 and 2012-13 respectively, slower than the 3% and 3 1/4% forecast at Budget time. Employers have preferred to increase hours worked to existing staff, rather than staffing levels, this year. While total hours worked were 2 3/4% higher in the first five months of 2011-12 relative to the same period a year earlier, employment was only 1% higher. This increase in the average work week partly reflects a delay in hiring decisions given heightened uncertainty and financial market volatility. A weaker than anticipated recovery in dwelling investment and growth in consumer spending has also softened the outlook for jobs growth. This will translate into a slightly higher year average unemployment rate of 5 1/2% in 2011-12 compared with the Budget forecast of 5%.
Source: ABS 6202.0.
Excluding the one off impact of the Australian Government’s carbon pricing scheme, the outlook for inflation, as measured by the Brisbane Consumer Price Index (CPI), has softened. In 2011-12, the CPI is expected to rise 2 1/2% in year-average terms, weaker than the 3% forecast at Budget. This reflects a faster than expected wind back in disaster affected fruit and vegetable prices, while the slower recovery in dwelling investment should result in weaker than anticipated growth in rents and house construction costs. In 2012-13, a slightly higher profile for the A$ and forecast weaker household demand is expected to see weaker price growth in imported goods and services and discretionary goods. However, with the carbon pricing scheme now legislated, this is expected to add 3/4 of a percentage point to inflation next financial year. As a result, headline CPI growth is forecast to be 3 3/4% in 2012-13, higher than the 3 1/4% forecast at Budget time, when a carbon price had not yet been legislated and consequently had not been incorporated into forecasts.
| | | | |
| | | Mid Year Fiscal and Economic Review 2011-12 | | 9 |
With a weaker outlook for the labour market and underlying inflation, growth in labour costs, as measured by the Wage Price Index, is also expected to be slightly lower than originally forecast at Budget time (see Table 2).
Risks and Opportunities
The timing associated with major resource sector expansions (LNG in particular) will affect the business investment and economic outlook through the forecast period. It is possible that the timing of investment approval and construction commencement for some major projects could affect the profile for investment growth. In this update, the outlook for business investment has improved as projects have been approved ahead of the profile previously forecast.
Any further escalation in the European debt crisis presents a key risk to the global economic outlook, including emerging Asia. The adverse impact of prolonged financial stress on confidence and wealth would in turn slow the recovery in domestic demand in Queensland, regardless of any easing in monetary policy. Further, the weaker outlook for global activity and commodity prices would push back any recovery in export earnings and possibly lead to some resource projects being delayed.
High sovereign debt levels, combined with the practical difficulty of implementing clear and credible policy responses in a number of major economies, points to an ongoing risk of economic and financial volatility over the next few years.
The latest seasonal outlook from the Bureau of Meteorology suggests that there remains a risk of an above average number of cyclones in eastern Australia this summer, which could disrupt construction activity as well as coal, crop and tourism exports.
If net overseas and interstate migration do not recover as expected, population growth could remain more subdued than currently forecast, resulting in further downward pressure on growth in household consumption and dwelling investment.
| | | | |
| | | Mid Year Fiscal and Economic Review 2011-12 | | 10 |
FISCAL OUTLOOK
Table 3
General Government
Key financial aggregates
| | | | | | | | | | | | | | | | | | | | | | | | |
| | | 2010-11
Actual
$ million | | | 2011-12
Budget
$ million | | | 2011-12
Revised
$ million | | | 2012-13
Projection
$ million | | | 2013-14
Projection
$ million | | | 2014-15
Projection
$ million | |
Revenue | | | 41,957 | | | | 43,007 | | | | 44,416 | | | | 43,631 | | | | 48,150 | | | | 50,257 | |
Expenses | | | 43,473 | | | | 47,065 | | | | 47,269 | | | | 47,844 | | | | 49,410 | | | | 50,197 | |
Net operating balance | | | (1,516 | ) | | | (4,058 | ) | | | (2,853 | ) | | | (4,213 | ) | | | (1,261 | ) | | | 60 | |
Cash surplus/(deficit) | | | (5,880 | ) | | | (7,915 | ) | | | (6,914 | ) | | | (7,456 | ) | | | (3,807 | ) | | | (1,126 | ) |
Capital purchases | | | 8,237 | | | | 7,180 | | | | 7,292 | | | | 6,987 | | | | 6,250 | | | | 4,810 | |
Net borrowing | | | 1,311 | | | | 8,931 | | | | 8,172 | | | | 9,320 | | | | 5,556 | | | | 2,486 | |
Gross borrowing | | | 25,089 | | | | 33,185 | | | | 32,158 | | | | 41,490 | | | | 47,049 | | | | 49,549 | |
Net worth | | | 171,222 | | | | 177,023 | | | | 171,282 | | | | 171,271 | | | | 173,719 | | | | 178,195 | |
Net debt | | | (9,047 | ) | | | (1,528 | ) | | | (3,206 | ) | | | 4,924 | | | | 9,015 | | | | 10,441 | |
The operating balance expected for 2011-12 is a deficit of $2.853 billion compared to a forecast deficit of $4.058 billion at the time of the 2011-12 Budget. The improved position is primarily due to a further advance payment (brought forward from subsequent years) for Natural Disaster Relief and Recovery Arrangements (NDRRA) works from the Australian Government valued at $1.4 billion. This is also the key reason for the deterioration of the 2012-13 net operating balance since the 2011-12 Budget.
Natural Disasters
At the time of the 2011-12 Budget, the cost of the 2010-11 floods and Cyclone Yasi was estimated at $6.671 billion ($6.799 billion including non-NDRRA expenditure). Updated estimates indicate that the total cost of these disasters will be $6.884 billion ($7 billion including non-NDRRA). The majority of the cost increase reflects an increase in the cost of repairing local government assets.
Table 4
Floods and Cyclone Yasi Estimates of Expenditure Less Reallocations
Budget to Mid Year Fiscal and Economic Review
| | | | | | | | | | | | |
| | | Budget
$ million | | | MYFER
$ million | | | Difference
$ million | |
NDRRA Expenditure | | | | | | | | | | | | |
State roads | | | 2,894 | | | | 2,894 | | | | — | |
Local Government assets | | | 2,746 | | | | 3,114 | | | | 368 | |
Other State assets | | | 150 | | | | 150 | | | | — | |
Support services and other payments | | | 492 | | | | 496 | | | | 4 | |
Loans | | | 389 | | | | 230 | | | | (159 | ) |
Total NDRRA Expenditure | | | 6,671 | | | | 6,884 | | | | 213 | |
Non-NDRRA Expenditure | | | 128 | | | | 128 | | | | — | |
| | | | | | | | | | | | |
TOTAL1 | | | 6,799 | | | | 7,012 | | | | 213 | |
| | | | | | | | | | | | |
| Note: | 1. This total does not include reallocations from prior events to current events. |
In addition, $363 million has been reallocated from previous disasters to the 2010-11 flood and Yasi events reflecting instances where assets already damaged from prior events were subject to further damage from the floods and Yasi, in line with NDRRA conventions. This brings the total NDRRA cost of the 2010-11 flood and Cyclone Yasi to $7.2 billion.
| | | | |
| | | Mid Year Fiscal and Economic Review 2011-12 | | 11 |
Since the 2011-12 Budget, post Yasi disaster events have added approximately $285 million to the total cost of disasters. This is in addition to $1.872 billion in costs across the forward estimates from previous events, bringing the total cost of natural disasters to $8.2 billion from 2011-12 to 2013-14.
The bulk of the reconstruction activity will occur in rebuilding roads, bridges and transport infrastructure including by local governments. Other State assets such as schools were also damaged by the disasters and required restoration. In addition to this, substantial assistance has been provided to individuals and small businesses and primary producers. Table 5 outlines total natural disaster spending across the forward estimates, by type.
Table 5
NDRRA Spending1
| | | | | | | | | | | | |
| | | 2011-12
$ million | | | 2012-13
$ million | | | 2013-14
$ million | |
State Roads | | | 1,366 | | | | 2,038 | | | | 900 | |
Other State assets | | | 158 | | | | 49 | | | | — | |
State grants | | | 167 | | | | — | | | | — | |
Local government | | | 1,511 | | | | 957 | | | | 842 | |
Loans | | | 213 | | | | — | | | | — | |
Total expenditure | | | 3,415 | | | | 3,044 | | | | 1,742 | |
Less loans/capitalised expenditure | | | 978 | | | | 1,314 | | | | 450 | |
Total expenses | | | 2,437 | | | | 1,730 | | | | 1,292 | |
Note:
| 1. | This is the total cost of all NDRRA events across 2011-12 to 2013-14, comprising 2010-11 floods and Cyclone Yasi, previous events, and events that have occurred after Cyclone Yasi. |
Under NDRRA, the Australian Government is responsible for up to 75 percent of the cost of natural disasters. The Commonwealth has confirmed that it will provide a further advance of $1.4 billion (in addition to the $2 billion advance payment made in 2010-11 and the $500 million already committed for 2011-12). The Commonwealth has also indicated that all remaining NDRRA payments will be made on a reimbursement basis the financial year after the spending is incurred.
The timing of the Australian Government’s NDRRA payments has a significant impact on Queensland’s operating position across the forward estimates particularly in light of the significant advance payments provided to Queensland. This results in a timing separation between revenue and expenditure. In addition, any expenditure which is capitalised and therefore not expensed will also change the underlying fiscal position of Government.
Table 6 presents the underlying net operating balance of the General Government Sector after removing the impact of natural disasters.
| | | | |
| | | Mid Year Fiscal and Economic Review 2011-12 | | 12 |
Table 6
Impact of NDRRA funding on the net operating balance1
| | | | | | | | | | | | | | | | |
| | | 2011-12
$ million | | | 2012-13
$ million | | | 2013-14
$ million | | | 2014-15
$ million | |
Published net operating balance | | | (2,853 | ) | | | (4,213 | ) | | | (1,261 | ) | | | 60 | |
less NDRRA revenue 2,3 | | | 2,594 | | | | — | | | | 1,611 | | | | 1,220 | |
add NDRRA operating expenses3 | | | 2,437 | | | | 1,730 | | | | 1,292 | | | | — | |
Underlying net operating balance | | | (3,010 | ) | | | (2,483 | ) | | | (1,580 | ) | | | (1,160 | ) |
Notes:
| 1. | Includes revenue and expenditure in relation to all events from 2009. |
| 2. | Following the advance payments from the Australian Government, the remaining revenues are expected to lag expenses by up to 12 months as per advice from the Australian Government. |
| 3. | Excludes loans provided through the State, which are not treated as revenue. |
The movement in NDRRA revenue and expense since Budget has led to an improved net operating balance in 2011-12 and 2014-15 and a converse deterioration of the operating balance in 2012-13 and 2013-14. Across the forward estimates, the movement in NDRRA revenue and expenses is largely neutral.
Net Operating Balance
General Government
The $1.205 billion improvement in the net operating balance in 2011-12 since the Budget primarily reflects:
| | • | | the advance payment of $1.4 billion from the Australian Government related to NDRRA as well as slightly lower than forecast NDRRA expense |
| | • | | downward revisions to taxes, royalties and GST revenue of approximately $303 million with tax policy decisions marginally offsetting this deterioration |
| | • | | policy decisions of Government, including the funding associated with the 2018 Gold Coast Commonwealth Games |
| | • | | lower than expected net flows from Government owned corporations in part due to increased community service obligation payments, in particular to Ergon Energy as a result of lower energy load. |
| | | | |
| | | Mid Year Fiscal and Economic Review 2011-12 | | 13 |
Table 7 provides a reconciliation of the current net operating balance for 2011-12 to the 2011-12 Budget estimate.
Table 7
Reconciliation of 2011-12 Budget and MYFER net operating balances1
| | | | |
| | | 2011-12
$ million | |
2011-12 Budget net operating balance | | | (4,058 | ) |
Natural disasters2 | | | 1,599 | |
Taxes3 | | | (29 | ) |
Royalties4 | | | (188 | ) |
GST5 | | | (86 | ) |
Other revenue | | | (23 | ) |
GOC net flows | | | (82 | ) |
Policy decisions6 | | | (132 | ) |
Other technical adjustments7 | | | 147 | |
2011-12 Mid Year Fiscal and Economic Review net operating balance | | | (2,853 | ) |
Notes:
| 1. | Denotes impact on net operating balance. Numbers may not add due to rounding. |
| 2. | Reflects changes in natural disaster revenue and expense as per previous discussion. |
| 3. | Reflects changes in taxation estimates across a range of State taxes (excluding policy decisions) as outlined in the section on Revenue. |
| 4. | Reflects changes in royalty estimates as outlined in the section on Revenue. |
| 5. | As advised by the Australian Government in their 2011-12 Mid Year Economic and Fiscal Outlook. |
| 6. | Reflects policy decisions since the 2011-12 Budget. Major variances include funding for the 2018 Commonwealth Games along with the savings and revenue measures outlined in detail later in the document. |
| 7. | Reflects the impact of a range of technical adjustments such as a change in timing of Commonwealth NPP payments, partially offset by the cost of reinsuring the State’s assets, growth funding and actuarial adjustments to the superannuation and long service leave schemes. |
As outlined in Table 3, the General Government sector is expected to show headline net operating deficits across all years before returning to a surplus in 2014-15. Major movements from the 2011-12 Budget over the forward estimates period include:
| | • | | a change in the quantum and timing of NDRRA expenses and revenue which leads to year to year variations in the operating result. However, its impact is largely neutral across the forward estimates as a whole |
| | • | | a deterioration of $1.144 billion in GST, taxation and royalty revenue across the forward estimates, excluding policy decisions |
| | • | | $883 million reduction in Government owned corporation net flows reflecting increased community service obligation payments to Queensland Rail and Ergon Energy as well as the impact of the introduction of the carbon tax in 2012 on State Government owned electricity generation assets |
| | • | | an expense provision of $100 million per annum from 2012-13 for the introduction of a carbon price from 1 July 2012 |
| | • | | a combined net saving across the forward estimates of $737 million arising from policy decisions of Government including spending, savings and revenue measures. |
| | | | |
| | | Mid Year Fiscal and Economic Review 2011-12 | | 14 |
Expenses
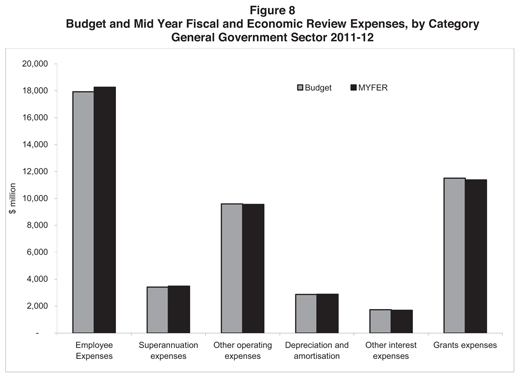
Expenses in 2011-12 are expected to be $204 million (or 0.4%) higher than the Budget estimate mostly as a result of policy decisions of Government. Grants expense is slightly below the 2011-12 Budget estimate reflecting a recashflowing of NDRRA grants to local councils.
Expenditure policy decisions of Government since the 2011-12 Budget have been relatively small with the most significant spending decision related to the 2018 Gold Coast Commonwealth Games. Based on current estimates, the Games are expected to cost approximately $184 million in expenses and a further $161 million in capital over the forward estimates.
The Government’s Mines to Minds initiative has not been factored into the Mid Year Fiscal and Economic Review position given a decision is yet to be made on whether it will be established as individual trust accounts or a dedicated education fund. This initiative will be factored into the fiscal position when that decision has been made.
Expense estimates also include a provision of $100 million per annum from 2012-13 for the introduction of a carbon price from 1 July 2012. This will be further reviewed in the 2012-13 Budget.
| | | | |
| | | Mid Year Fiscal and Economic Review 2011-12 | | 15 |
Revenue
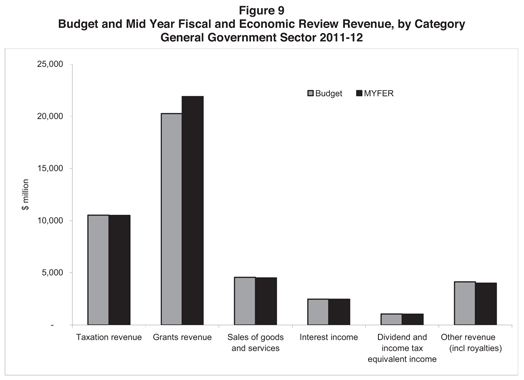
General Government revenue in 2011-12 is estimated to be $44.416 billion, $1.409 billion higher than the 2011-12 Budget estimate. This primarily reflects the $1.4 billion advance in NDRRA revenue from the Australian Government. Other movements since the 2011-12 include:
| | • | | tax revenue has reduced by $29 million (excluding the impact of applying transfer duty to change in ownership of mining tenures). Although lower than expected levels of property market activity so far in 2011-12 has impacted transfer duty revenue, this has been largely offset by stronger than expected payroll tax receipts |
| | • | | a $188 million reduction in royalties primarily because the volume of coal exports in 2011-12 is expected to be 12 million tonnes less than estimated in the 2011-12 Budget. |
Royalty assumptions for 2011-12 and the forward estimates are outlined in Table 22 in the appendix. Taxation and royalty projections are also included in the appendix.
| | | | |
| | | Mid Year Fiscal and Economic Review 2011-12 | | 16 |
Table 8 outlines changes in taxation and royalty revenue since the 2011-12 Budget.
Table 8
Taxation and royalty revenue1
| | | | | | | | | | | | |
| | | 2010-11
Actual
$ million | | | 2011-12
Budget
$ million | | | 2011-12
Revised
$ million | |
Payroll tax | | | 3,023 | | | | 3,263 | | | | 3,492 | |
Duties | | | | | | | | | | | | |
Transfer | | | 1,933 | | | | 2,180 | | | | 1,960 | |
Vehicle registration | | | 432 | | | | 462 | | | | 440 | |
Insurance2 | | | 483 | | | | 528 | | | | 538 | |
Other duties3 | | | 33 | | | | 28 | | | | 31 | |
Total duties | | | 2,881 | | | | 3,198 | | | | 2,969 | |
Gambling taxes and levies | | | | | | | | | | | | |
Gaming machine tax | | | 550 | | | | 568 | | | | 575 | |
Health Services Levy | | | 40 | | | | 41 | | | | 44 | |
Lotteries taxes | | | 216 | | | | 221 | | | | 225 | |
Wagering taxes | | | 40 | | | | 42 | | | | 38 | |
Casino taxes | | | 80 | | | | 88 | | | | 88 | |
Keno tax | | | 20 | | | | 20 | | | | 22 | |
Total gambling taxes and levies | | | 945 | | | | 981 | | | | 992 | |
Other taxes | | | | | | | | | | | | |
Land tax | | | 1,042 | | | | 1,064 | | | | 1,047 | |
Motor vehicle registration | | | 1,336 | | | | 1,373 | | | | 1,383 | |
Fire levy | | | 314 | | | | 335 | | | | 330 | |
Community Ambulance Cover4 | | | 152 | | | | 25 | | | | 30 | |
Guarantee fees | | | 219 | | | | 234 | | | | 211 | |
Other taxes | | | 63 | | | | 54 | | | | 55 | |
Total taxation revenue | | | 9,975 | | | | 10,527 | | | | 10,509 | |
Royalties | | | | | | | | | | | | |
Coal | | | 2,357 | | | | 2,755 | | | | 2,633 | |
Other royalties and land rents | | | 519 | | | | 690 | | | | 623 | |
Total royalties and land rents | | | 2,876 | | | | 3,445 | | | | 3,257 | |
Notes:
| 1. | Numbers may not add due to rounding. |
| 2. | Includes duty on accident insurance premiums. |
| 3. | Includes duty on life insurance premiums. |
| 4. | The Community Ambulance Cover levy was abolished from 1 July 2011. A small amount of accrued liability for Community Ambulance Cover has been received in 2011-12. |
Compared to the 2011-12 Budget, total movements from 2011-12 to 2014-15 are:
| | • | | an increase of $276 million in taxation revenue reflecting policy decisions of $600 million and a reduction of $324 million arising from a lower than expected level of property market activity, partly offset by stronger than expected growth in payroll tax |
| | • | | a reduction of $276 million in royalty and land rent revenue |
| | • | | a $544 million reduction in GST revenue reflecting the Australian Government’s downward revision to the forecast size of the GST pool. |
| | | | |
| | | Mid Year Fiscal and Economic Review 2011-12 | | 17 |
Fiscal Principles
The fiscal principles of the Queensland Government are broadly based around three themes: fiscal sustainability; a competitive tax regime; and managing the State’s balance sheet.
The 2011-12 MYFER includes a number of measures driven by the pursuit of these principles. They are in addition to the following measures taken in recent years:
| | • | | increases in motor vehicle registration fees |
| | • | | significant reform of the State’s royalty system in 2008-09 following a review of Queensland’s royalty regime |
| | • | | progressive reforms to transfer duty rates and concessions |
| | • | | an increase in the tax rate on casino gaming machine wins |
| | • | | introduction of a price path for Translink services |
| | • | | the abolition of the Queensland Fuel Subsidy Scheme on 1 July 2009 |
| | • | | the Voluntary Separation Program with a program of 3,500 voluntary separations from non-service delivery areas of Government |
| | • | | public sector efficiency targets which rise to $500 million in 2014-15 |
| | • | | reforms to various grant programs including local government grants and subsidies following the Local Government Reform Program |
| | • | | establishment of a $10 billion indicative limit from 2013-14 onwards for the annual capital program |
| | • | | a program of asset sales which included Forestry Plantations Queensland, Queensland Motorways Limited, Abbot Point Coal Terminal, Port of Brisbane Corporation, and QR National Limited |
| | • | | reform of the Government owned corporations sector including increased private sector provision of infrastructure |
| | • | | closure of QSuper’s defined benefit account to new members. |
The fiscal principles of the Queensland Government are:
| | • | | In the General Government sector, meet all operating expenses from operating revenue (where operating revenue is defined as total revenue from transactions and operating expenses are defined as total expenses from transactions less depreciation). |
As a result of the mismatch between the timing of Australian Government NDRRA funding and the associated expenditures, operating expenses are expected to exceed operating revenue in 2012-13. However, this principle is expected to be met in 2011-12 and from 2013-14 onwards.
| | • | | Growth in own-purpose expenses in the General Government sector not to exceed real per capita growth. |
The Government remains committed to ensuring that, on average across the forward estimates, own-purpose expenses growth will not exceed the real per capita constraint. The savings measures introduced by the Government will assist in achieving this principle. On average across the forward estimates, own-purpose expenses are expected to grow by 3.85% per annum, compared to real per capita growth of 4.88%.
| | | | |
| | | Mid Year Fiscal and Economic Review 2011-12 | | 18 |
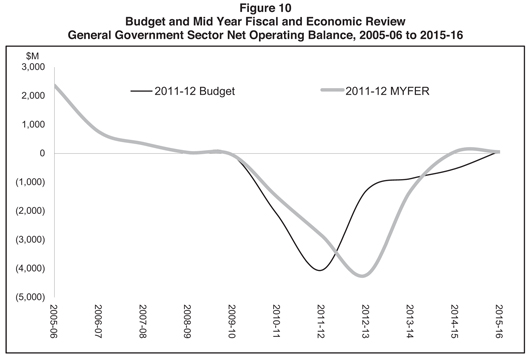
| | • | | Achieve a General Government net operating surplus as soon as possible, but no later than 2015-16. |
Despite a moderation in the underlying fiscal outlook since the 2011-12 Budget, the Queensland Government is committed to returning to a net operating surplus no later than 2015-16, noting that the headline operating surplus projected for 2014-15 reflects the expected receipt of NDRRA revenues with no offsetting expense in that year.
Consistent with the projection in the 2011-12 Budget, Figure 10 indicates Queensland is on track to achieve a surplus in 2015-16. This reflects the fiscal benefits of the measures outlined in this document, largely offsetting the impact of other revisions to the operating position since Budget, by the end of the forward estimates period.
The projected surplus in 2015-16 is reliant on the Government’s commitment that own-purpose expenses growth will not exceed real per capita growth. A key aspect of this commitment is ensuring that future public service wage outcomes are kept at a level that restrains total expenses growth.
| | | | |
| | | Mid Year Fiscal and Economic Review 2011-12 | | 19 |
| | • | | Maintain a competitive tax environment for business. |
Per capita tax collections in Queensland in 2011-12 are estimated at $2,271, compared with an estimated $2,711 for the average of the other states.
| | • | | Stabilise net financial liabilities as a proportion of revenue in the Non-financial Public sector. |
The net financial liability to revenue ratio is expected to peak in 2012-13 at 123% and stabilise at slightly below that level for the remainder of the forward estimates. This is an improvement on the ratio estimated in the 2011-12 Budget, which was projected to reach 127% in 2014-15.
| | • | | Target full funding of long-term liabilities such as superannuation in accordance with actuarial advice. |
As at the most recent actuarial review (released June 2011), accruing superannuation liabilities were fully funded when the transfer of Queensland Motorways Limited to the Queensland Investment Corporation’s investment trust were taken into account.
| | | | |
| | | Mid Year Fiscal and Economic Review 2011-12 | | 20 |
Table 9
The fiscal principles of the Queensland Government
| | | | | | | | | | |
Principle | | Indicator | |
Fiscal sustainability | | | | | | | | | | |
| | | |
| | | | | Operating
Revenue
($ million) | | | Operating expenses
less depreciation
($ million) | |
| In the General Government sector, meet all operating expenses from operating revenue (where operating revenue is defined as total revenue from transactions and operating expenses are defined as total expenses from transactions less depreciation) | | 2010-11 | | | 41,957 | | | | 40,967 | |
| | 2011-12 | | | 44,416 | | | | 44,384 | |
| | 2012-13 | | | 43,631 | | | | 44,715 | |
| | 2013-14 | | | 48,150 | | | | 46,045 | |
| | 2014-15 | | | 50,257 | | | | 46,678 | |
| | | |
| | | Growth in: | | Own purpose
expense | | | Inflation plus
population | |
| Growth in own-purpose expenses in the General Government sector not to exceed real per capita growth | | 2010-11 | | | 11.4 | % | | | 5.05 | % |
| | 2011-12 | | | 9.10 | % | | | 4.25 | % |
| | 2012-13 | | | 1.92 | % | | | 5.75 | % |
| | 2013-14 | | | 2.97 | % | | | 4.75 | % |
| | 2014-15 | | | 1.41 | % | | | 4.75 | % |
| | Avg over FEs | | | 3.85 | % | | | 4.88 | % |
| |
| | | Net operating balance ($ million) | |
| Achieve a General Government net operating surplus as soon as possible, but no later than 2015-16 | | 2010-11 | | | | | | | (1,516 | ) |
| | 2011-12 | | | | | | | (2,853 | ) |
| | 2012-13 | | | | | | | (4,213 | ) |
| | 2013-14 | | | | | | | (1,261 | ) |
| | 2014-15 | | | | | | | 60 | |
Competitive tax regime | | | | | | | | | | |
| |
| | | Taxation revenue per capita, 2011-12 | |
| Maintain a competitive tax environment for business | | Queensland: | | | | | | | $2,271 | |
| | Average of other states and territories: | | | | $2,711 | |
Managing the State’s balance sheet | | | | | | | | | | |
| |
| | | Net Financial Liabilities/Revenue
Non-financial Public Sector | |
| Stabilise net financial liabilities as a proportion of revenue in the Non-financial Public Sector | | 2010-11 | | | | | | | 84 | % |
| | 2011-12 | | | | | | | 102 | % |
| | 2012-13 | | | | | | | 123 | % |
| | 2013-14 | | | | | | | 122 | % |
| | 2014-15 | | | | | | | 122 | % |
| Target full funding of long-term liabilities such as superannuation in accordance with actuarial advice | | As at last actuarial review (released June 2011), accruing superannuation liabilities were fully funded when the QML transaction is taken into account. The State Actuary reviews the scheme every 3 years. | |
| | | | |
| | | Mid Year Fiscal and Economic Review 2011-12 | | 21 |
CASH FLOWS AND BALANCE SHEET
Non-financial Public Sector
The Non-financial Public (NFP) sector is essentially the amalgam of the General Government and PNFC sectors, with transactions between these sectors being eliminated.
Gross borrowings of $62.352 billion are projected at 30 June 2012 in the NFP sector, $2.736 billion less than the 2011-12 Budget estimate due to the $1.4 billion advance NDRRA payment from the Australian Government together with lower borrowings in the PNFC Sector. By 2014-15, gross borrowings are expected to reach $85.378 billion.
Purchases of non-financial assets (capital spending) of $11.833 billion are expected in the NFP sector in 2011-12, $480 million (3.9%) less than the 2011-12 Budget estimate, primarily due to reduced electricity network capital investment. This also accounts for lower capital spending across the forward estimates.
Over the period 2011-12 to 2014-15, NFP sector purchases of non-financial assets of $43.170 billion are planned. This is $808 million less than anticipated at the time of the 2011-12 Budget.
| | | | |
| | | Mid Year Fiscal and Economic Review 2011-12 | | 22 |
General Government Sector
Cash surplus/deficit
A cash deficit of $6.914 billion is expected in 2011-12, an improvement of $1.001 billion in the deficit since Budget primarily as a result of the $1.4 billion advance NDRRA payment from the Australian Government, partially offset by other adjustments such as reduced key revenue flows and policy decisions of Government.
Capital purchases
Purchases of non-financial assets are expected to be $7.292 billion in 2011-12, $112 million (1.6%) higher than the 2011-12 Budget estimate of $7.180 billion reflecting some revisions to the expected timing of expenditure.
Over the period 2011-12 to 2014-15, purchases of non-financial assets of $25.339 billion are planned, $260 million more than at the time of the 2011-12 Budget, partially reflecting the impact of post Yasi natural disasters as well as capital investment for the 2018 Commonwealth Games, partially offset by capital savings across the forward estimates of $506.5 million.
Borrowings
Net borrowings of $8.172 million are expected in 2011-12, a decrease of $759 million compared with the 2011-12 Budget estimate. Again, the revised position primarily reflects the $1.4 billion advance NDRRA payment from the Australian Government.
Net borrowings over 2011-12 and the forward estimates are expected to be $25.534 billion, $1.640 billion more than forecast at Budget largely reflecting the deterioration in the net operating balance across the forward estimates since the 2011-12 Budget and modestly higher capital investment.
Gross borrowings (the stock of borrowings outstanding as stated in the balance sheet) of $32.158 billion are forecast at 30 June 2012, $1.027 billion less than the Budget estimate, again reflecting the re-profiling of the NDRRA payments from the Australian Government.
Net worth
The net worth, or equity, of the State is the amount by which the State’s assets exceed its liabilities. This is the value of the investment held on behalf of the people of Queensland by public sector entities.
The net worth of the General Government sector at 30 June 2012 is estimated at $171.282 billion. This is $5.741 billion lower than the forecast in the 2011-12 Budget, primarily due to downward revaluations of land and other fixed assets, such as roads, in the 30 June 2011 year-end process, to reflect market value. These revaluations were finalised for the 30 June 2011 audited actual process and relate in large part to the effect of natural disasters. In addition, there has been a decrease in the value of the PNFC Sector due mainly to changes in the valuation of electricity infrastructure to take account of the Australian Government’s carbon tax. The 30 June 2012 estimate is in line with the 30 June 2011 outcome of $171.222 billion.
| | | | |
| | | Mid Year Fiscal and Economic Review 2011-12 | | 23 |
Net debt
Net debt is the sum of advances received and borrowings less cash and deposits, advances paid and investments, loans and placements.
In 2011-12, net debt in the General Government sector is estimated to be negative $3.206 billion, compared to negative $1.528 billion estimated at the time of the 2011-12 Budget. The improvement in the General Government net debt position primarily reflects the improvement in the net operating balance in 2011-12 on the back of the advance NDRRA payment from the Australian Government.
Queensland’s negative net debt of $693 per capita compares well to the weighted average net debt of $2,036 per capita in the other states.
Table 10
Projected net debt per capita at 30 June 2012
| | | | | | | | | | | | | | | | | | | | | | | | |
| | | QLD | | | NSW | | | VIC | | | WA | | | SA | | | TAS | |
Net debt per capita ($) | | | (693 | ) | | | 1,470 | | | | 2,983 | | | | 1,498 | | | | 2,670 | | | | 103 | |
Sources: Mid Year Updates for all jurisdictions except Tasmania which is based on Budget numbers. Population data is based on Australian Government Mid Year Economic and Fiscal Outlook forecasts.
Public Non-financial Corporations Sector
The PNFC Sector is forecast to achieve a net operating balance of $390 million in 2011-12 ($192 million improvement on the 2011-12 Budget) and have capital purchases of $4.542 billion (down $592 million on Budget). Capital spending over 2011-12 and the outyears is expected to total $17.832 billion, a decrease of $1.067 billion from the Budget estimate of $18.899 billion. Reflecting this revised capital position and the improved net operating balance, 2011-12 gross borrowings are expected to be $1.708 billion less than forecast in the 2011-12 Budget. Net borrowings in 2011-12 are forecast to be $1.469 billion, $1.489 billion lower than the Budget estimate of $2.958 billion.
Since the 2011-12 Budget major influences on the PNFC sector include the:
| | • | | introduction of the Australian Government’s carbon tax which has had a downward impact on profitability |
| | • | | independent review of electricity network capital (refer to following discussion) |
| | • | | electricity generator review. |
| | | | |
| | | Mid Year Fiscal and Economic Review 2011-12 | | 24 |
Independent Review of Queensland Electricity Network Businesses
An independent review of the Queensland electricity network businesses (Energex, Ergon and Powerlink) which was undertaken by the same panel as the 2004 “Somerville Review” found that the state of the distribution network has improved significantly since the original 2004 review. Changes to security standards have been recommended by the Panel with consequent reductions in planned capital expenditure. The Panel consider that this will not be detrimental to existing network performance. The Panel also recommended amendments to Energex’s Minimum Service Standard targets (the final decision on these standards rests with the Queensland Competition Authority).
The effect of this Review and demand related reductions are to reduce capital expenditure in Energex and Ergon by $1.5 billion over the 5 year regulatory period and consequently lower borrowings for these entities. A total of $1.145 billion has been identified as reduced capital requirements over the forward estimates period as a result of this review. Lower projected demand growth will also contribute to these savings.
2011-12 MID YEAR FISCAL AND ECONOMIC REVIEW REVENUE AND SAVINGS MEASURES1
Expense
| | | | | | | | | | | | | | | | |
| | | 2011-12
$million | | | 2012-13
$million | | | 2013-14
$million | | | 2014-15
$million | |
Savings Dividend - Extension of the Voluntary Separation Program | | | — | | | | — | | | | (150.0 | ) | | | (150.0 | ) |
In the 2010-11 Mid Year Fiscal and Economic Review, the Queensland Government announced a Voluntary Separation Program aimed at achieving some 3,500 separations. Some 3,339 offers have currently been accepted, with some agencies still to complete their programs.
The Government will be directing Queensland Government entities to reopen their programs and refresh expressions of interest pools to achieve further savings. Over 9,000 expressions of interest were received from public servants under the current VSP.
It is estimated that up to an additional 1,500 public servants will depart under the extended VSP, bringing the total number of public servants exiting under this program to 5,000. All savings generated under this proposal will be returned to the Consolidated Fund as agency savings dividends.
This will provide agencies with the capacity to achieve the savings dividend of $150 million per annum from 2013-14.
The Government is committed to achieving these savings through active central agency management of the program of separations and will review progress in the 2012-13 Budget to ensure any required additional effort is implemented to achieve the full $150 million savings.
| 1 | Where expense or capital measures are negative it represents a savings and where they are positive it represents a cost. Where revenue measures are positive it represents additional revenue. |
| | | | |
| | | Mid Year Fiscal and Economic Review 2011-12 | | 25 |
Revenue
| | | | | | | | | | | | | | | | |
| | | 2011-12
$million | | | 2012-13
$million | | | 2013-14
$million | | | 2014-15
$million | |
Increased Cost Recovery – DEEDI – Major Projects and Mining Services | | | — | | | | 9.5 | | | | 19.0 | | | | 19.0 | |
The Department of Employment, Economic Development and Innovation (DEEDI) and the Coordinator General provide services to industry in the areas of mining and major projects. The cost of providing these services is not fully covered by the fees charged.
The cost of administering mining and petroleum functions is not fully met by fees charged. It is proposed that fees and charges will be increased by $5 million per annum to address the shortfall.
Currently, DEEDI imposes a levy on industry which covers the costs of the health and safety inspectorate. The levy does not currently allow for the costs associated with safety at abandoned mines. It is proposed that the levy be increased by $8 million per annum to meet these costs.
The Coordinator General provides major project services to the private sector but does not fully recover the cost of these services. It is proposed that the fees for services including Environmental Impact Statement fees and Material Change of Use application fees will be increased to fully recover costs.
It is proposed that the revised fees and charges take effect from 1 January 2013, allowing sufficient time for the Regulatory Assessment Statement process to take place.
| | | | | | | | | | | | | | | | |
| | | 2011-12
$million | | | 2012-13
$million | | | 2013-14
$million | | | 2014-15
$million | |
Deferral of Abolition of Duty on Transfer of Core Business Assets | | | — | | | | — | | | | 240.0 | | | | 260.0 | |
The Intergovernmental Agreement on the Reform of Commonwealth-State Financial Relations required the abolition or review of a number of State taxes. Since then, Queensland has abolished eight taxes at a cumulative cost over the period 2005-06 to 2011-12 of $3.5 billion.
In light of the significant deterioration over recent years in the revenue performance of key taxes such as transfer duty and goods and services tax, the abolition of duty on the transfer of core business assets will be deferred until the Budget can accommodate the abolition.
| | | | | | | | | | | | | | | | |
| | | 2011-12
$million | | | 2012-13
$million | | | 2013-14
$million | | | 2014-15
$million | |
Net Revenue from Cash Bidding for Prospective Exploration Land | | | (2.5 | ) | | | 35.0 | | | | 95.0 | | | | 95.0 | |
Due to the tightly held nature of coal and petroleum (including coal seam gas) tenure and tenements, highly prospective areas are known to attract strong investor interest, for which the State receives no revenue. It is therefore proposed that a relatively small number of such prospective areas will be subject to a competitive cash bidding process. This is also in keeping with Recommendation 49 of the Henry Tax Review which recommended that “..state governments should consider using a cash bidding system to allocate exploration permits”.
| | | | |
| | | Mid Year Fiscal and Economic Review 2011-12 | | 26 |
| | | | | | | | | | | | | | | | |
| | | 2011-12
$million | | | 2012-13
$million | | | 2013-14
$million | | | 2014-15
$million | |
Duty on the Transfer of Exploration Permits | | | 10.0 | | | | 30.0 | | | | 30.0 | | | | 30.0 | |
Transfer Duty is currently payable on the transfer of mining and petroleum tenures. However, direct and indirect transfers of exploration permits or authorities to prospect do not attract duty.
With immediate effect, duty will also apply to the direct and indirect transfer of exploration permits and authorities to prospect. The grant of mining tenures including exploration permits and authorities will continue to be exempt from duty.
This policy change will more closely align Queensland’s duty treatment of exploration permits and authorities to other resource states.
Capital
| | | | | | | | | | | | | | |
| | | 2011-12
$million | | 2012-13
$million | | | 2013-14
$million | | | 2014-15
$million | |
Reducing the Holdings of the Estates Construction Fund | | | | | (40.0 | ) | | | (80.0 | ) | | | (80.0 | ) |
The Estates Construction Fund is the vehicle through which the Government develops land for industrial purposes. Given the strengthening outlook for business investment it is expected that demand will increase and the extent of holdings will be reduced with the proceeds returned to the Consolidated Fund.
| | | | | | | | | | | | | | | | |
| | | 2011-12
$million | | | 2012-13
$million | | | 2013-14
$million | | | 2014-15
$million | |
CoastConnect:Caloundra to Maroochydore Quality Bus Corridor | | | — | | | | — | | | | — | | | | (26.0 | ) |
The Government will defer by one year the CoastConnect: Caloundra to Maroochydore quality bus corridor, saving $26 million over the forward estimates. Staged construction was expected to commence from 2014. The total estimated cost of the CoastConnect project is $366.3 million.
| | | | | | | | | | | | | | | | |
| | | 2011-12
$million | | | 2012-13
$million | | | 2013-14
$million | | | 2014-15
$million | |
Interim: High Occupancy Vehicle Lanes: Kedron to Chermside | | | — | | | | — | | | | (20.0 | ) | | | (19.1 | ) |
The Government has decided to defer this High Occupancy Vehicle project.
| | | | | | | | | | | | | | | | |
| | | 2011-12
$million | | | 2012-13
$million | | | 2013-14
$million | | | 2014-15
$million | |
Queensland Police Academy | | | — | | | | (164.9 | ) | | | (176.5 | ) | | | — | |
The Government will defer completion of the new Police Academy at Wacol, saving an estimated $341.4 million over the forward estimates.
To date, approximately $110 million has been committed to the Police Academy. Completed infrastructure includes the Driver Training Centre and refurbishment of some heritage buildings.
| | | | |
| | | Mid Year Fiscal and Economic Review 2011-12 | | 27 |
| | | | | | | | | | | | | | | | |
| | | 2011-12
$million | | | 2012-13
$million | | | 2013-14
$million | | | 2014-15
$million | |
Queensland Kindergartens | | | | | | | | | | | | | | | | |
Capital Saving | | | — | | | | (80.0 | ) | | | (20.0 | ) | | | — | |
Additional Recurrent Funding | | | 3.25 | | | | 6.5 | | | | 6.5 | | | | 6.5 | |
The Government has pledged to provide universal access to kindergartens across Queensland.
This commitment set a target of achieving 65% attendance in 2011, which has been achieved.
The Government committed to build up to 240 new kindergarten services, based on projections of a requirement for both new kindergartens as well as many Long Day Care centres, including a qualified teacher to provide a kindergarten program.
To date 121 new kindergarten services have been opened or will be open for 2013. The Government now projects that a further 45 extra services will be required to meet the overall demand for services. The reduced requirement for new services results in a capital saving of $100 million.
The Government is supplementing the recurrent allocation by $6.5 million per annum to assist in the achievement of future targets.
| | | | |
| | | Mid Year Fiscal and Economic Review 2011-12 | | 28 |
UNIFORM PRESENTATION FRAMEWORK AND LOAN COUNCIL ALLOCATION
Uniform Presentation Framework Information
Table 11
General Government Sector Operating Statement 1
| | | | | | | | | | | | | | | | | | | | | | |
| | | | | 2011-12
Budget
$ million | | | 2011-12
Revised
$ million | | | 2012-13
Projection
$ million | | | 2013-14
Projection
$ million | | | 2014-15
Projection
$ million | |
| | Revenue from Transactions | | | | | | | | | | | | | | | | | | | | |
| | Taxation revenue | | | 10,527 | | | | 10,509 | | | | 11,337 | | | | 12,315 | | | | 13,364 | |
| | Grants revenue | | | 20,262 | | | | 21,898 | | | | 19,426 | | | | 22,331 | | | | 22,732 | |
| | Sales of goods and services | | | 4,559 | | | | 4,510 | | | | 4,835 | | | | 5,113 | | | | 5,290 | |
| | Interest income | | | 2,477 | | | | 2,461 | | | | 2,616 | | | | 2,694 | | | | 2,765 | |
| | Dividend and income tax equivalent income | | | 1,047 | | | | 1,038 | | | | 1,174 | | | | 1,467 | | | | 1,753 | |
| | Other revenue | | | 4,134 | | | | 4,001 | | | | 4,244 | | | | 4,229 | | | | 4,354 | |
| | Total Revenue from Transactions | | | 43,007 | | | | 44,416 | | | | 43,631 | | | | 48,150 | | | | 50,257 | |
| Less | | Expenses from Transactions | | | | | | | | | | | | | | | | | | | | |
| | Employee expenses | | | 17,932 | | | | 18,272 | | | | 18,898 | | | | 19,737 | | | | 20,742 | |
| | Superannuation expenses | | | | | | | | | | | | | | | | | | | | |
| | Superannuation interest cost | | | 1,201 | | | | 1,221 | | | | 1,235 | | | | 1,324 | | | | 1,325 | |
| | Other superannuation expenses | | | 2,212 | | | | 2,259 | | | | 2,318 | | | | 2,374 | | | | 2,416 | |
| | Other operating expenses | | | 9,597 | | | | 9,560 | | | | 9,588 | | | | 9,561 | | | | 9,499 | |
| | Depreciation and amortisation | | | 2,872 | | | | 2,885 | | | | 3,129 | | | | 3,365 | | | | 3,519 | |
| | Other interest expenses | | | 1,747 | | | | 1,691 | | | | 2,126 | | | | 2,486 | | | | 2,722 | |
| | Grants expenses | | | 11,504 | | | | 11,381 | | | | 10,550 | | | | 10,564 | | | | 9,975 | |
| | Total Expenses from Transactions | | | 47,065 | | | | 47,269 | | | | 47,844 | | | | 49,410 | | | | 50,197 | |
| Equals | | Net Operating Balance | | | (4,058 | ) | | | (2,853 | ) | | | (4,213 | ) | | | (1,261 | ) | | | 60 | |
| Plus | | Other economic flows - included in operating result | | | (97 | ) | | | (19 | ) | | | (84 | ) | | | (57 | ) | | | 37 | |
| Equals | | Operating Result | | | (4,155 | ) | | | (2,872 | ) | | | (4,297 | ) | | | (1,317 | ) | | | 98 | |
| Plus | | Other economic flows - other movements in equity | | | 3,211 | | | | 3,103 | | | | 4,286 | | | | 3,766 | | | | 4,378 | |
| Equals | | Comprehensive Result - Total Change In Net Worth | | | (943 | ) | | | 231 | | | | (11 | ) | | | 2,449 | | | | 4,476 | |
| | KEY FISCAL AGGREGATES | | | | | | | | | | | | | | | | | | | | |
| | Net Operating Balance | | | (4,058 | ) | | | (2,853 | ) | | | (4,213 | ) | | | (1,261 | ) | | | 60 | |
| Less | | Net Acquisition of Non-financial Assets | | | | | | | | | | | | | | | | | | | | |
| | Purchases of non-financial assets | | | 7,180 | | | | 7,292 | | | | 6,987 | | | | 6,250 | | | | 4,810 | |
| | Less Sales of non-financial assets | | | 226 | | | | 242 | | | | 283 | | | | 213 | | | | 234 | |
| | Less Depreciation | | | 2,872 | | | | 2,885 | | | | 3,129 | | | | 3,365 | | | | 3,519 | |
| | Plus Change in inventories | | | 39 | | | | 43 | | | | (31 | ) | | | 61 | | | | 46 | |
| | Plus Other movements in non-financial assets | | | 213 | | | | 229 | | | | 195 | | | | 206 | | | | 206 | |
| | Equals Total Net Acquisition of Non-financial Assets | | | 4,334 | | | | 4,437 | | | | 3,740 | | | | 2,939 | | | | 1,309 | |
| Equals | | Net Lending / (Borrowing) | | | (8,392 | ) | | | (7,290 | ) | | | (7,954 | ) | | | (4,200 | ) | | | (1,249 | ) |
Note:
| 1. | Numbers may not add due to rounding. |
| | | | |
| | | Mid Year Fiscal and Economic Review 2011-12 | | 29 |
Table 12
Public Non-financial Corporations Sector Operating Statement 1
| | | | | | | | | | | | | | | | | | | | | | |
| | | | | 2011-12
Budget
$ million | | | 2011-12
Revised
$ million | | | 2012-13
Projection
$ million | | | 2013-14
Projection
$ million | | | 2014-15
Projection
$ million | |
| | Revenue from Transactions | | | | | | | | | | | | | | | | | | | | |
| | Grants revenue | | | 2,129 | | | | 2,208 | | | | 2,360 | | | | 2,465 | | | | 2,519 | |
| | Sales of goods and services | | | 7,406 | | | | 7,161 | | | | 8,368 | | | | 9,215 | | | | 10,033 | |
| | Interest income | | | 108 | | | | 91 | | | | 91 | | | | 91 | | | | 94 | |
| | Other revenue | | | 347 | | | | 415 | | | | 405 | | | | 382 | | | | 421 | |
| | Total Revenue from Transactions | | | 9,991 | | | | 9,875 | | | | 11,225 | | | | 12,153 | | | | 13,066 | |
| Less | | Expenses from Transactions | | | | | | | | | | | | | | | | | | | | |
| | Employee expenses | | | 1,637 | | | | 1,759 | | | | 1,891 | | | | 1,995 | | | | 2,068 | |
| | Superannuation expenses | | | | | | | | | | | | | | | | | | | | |
| | Other superannuation expenses | | | 211 | | | | 208 | | | | 226 | | | | 232 | | | | 238 | |
| | Other operating expenses | | | 3,359 | | | | 3,214 | | | | 3,892 | | | | 4,016 | | | | 3,891 | |
| | Depreciation and amortisation | | | 2,234 | | | | 2,034 | | | | 2,167 | | | | 2,288 | | | | 2,387 | |
| | Other interest expenses | | | 2,073 | | | | 1,991 | | | | 2,240 | | | | 2,431 | | | | 2,592 | |
| | Grants expenses | | | 27 | | | | 16 | | | | 17 | | | | 18 | | | | 19 | |
| | Other property expenses | | | 252 | | | | 262 | | | | 274 | | | | 383 | | | | 439 | |
| | Total Expenses from Transactions | | | 9,793 | | | | 9,485 | | | | 10,707 | | | | 11,363 | | | | 11,634 | |
| Equals | | Net Operating Balance | | | 198 | | | | 390 | | | | 518 | | | | 791 | | | | 1,432 | |
| Plus | | Other economic flows - included in operating result | | | (249 | ) | | | (221 | ) | | | (248 | ) | | | (196 | ) | | | (271 | ) |
| Equals | | Operating Result | | | (51 | ) | | | 170 | | | | 270 | | | | 594 | | | | 1,161 | |
| Plus | | Other economic flows - other movements in equity | | | 128 | | | | (1,279 | ) | | | 351 | | | | 216 | | | | (265 | ) |
| Equals | | Comprehensive Result - Total Change In Net Worth | | | 77 | | | | (1,109 | ) | | | 621 | | | | 810 | | | | 896 | |
| | KEY FISCAL AGGREGATES | | | | | | | | | | | | | | | | | | | | |
| | Net Operating Balance | | | 198 | | | | 390 | | | | 518 | | | | 791 | | | | 1,432 | |
| Less | | Net Acquisition of Non-financial Assets | | | | | | | | | | | | | | | | | | | | |
| | Purchases of non-financial assets | | | 5,134 | | | | 4,542 | | | | 4,715 | | | | 4,196 | | | | 4,379 | |
| | Less Sales of non-financial assets | | | 88 | | | | 95 | | | | 42 | | | | 51 | | | | 43 | |
| | Less Depreciation | | | 2,234 | | | | 2,034 | | | | 2,167 | | | | 2,288 | | | | 2,387 | |
| | Plus Change in inventories | | | 5 | | | | (9 | ) | | | 15 | | | | 1 | | | | 5 | |
| | Plus Other movements in non-financial assets | | | 43 | | | | 43 | | | | 45 | | | | 47 | | | | 49 | |
| | Equals Total Net Acquisition of Non-financial Assets | | | 2,861 | | | | 2,447 | | | | 2,566 | | | | 1,906 | | | | 2,003 | |
| Equals | | Net Lending / (Borrowing) | | | (2,663 | ) | | | (2,056 | ) | | | (2,048 | ) | | | (1,115 | ) | | | (571 | ) |
Note:
| 1. | Numbers may not add due to rounding. |
| | | | |
| | | Mid Year Fiscal and Economic Review 2011-12 | | 30 |
Table 13
Non-financial Public Sector Operating Statement 1
| | | | | | | | | | | | | | | | | | | | | | |
| | | | | 2011-12
Budget
$ million | | | 2011-12
Revised
$ million | | | 2012-13
Projection
$ million | | | 2013-14
Projection
$ million | | | 2014-15
Projection
$ million | |
| | Revenue from Transactions | | | | | | | | | | | | | | | | | | | | |
| | Taxation revenue | | | 10,202 | | | | 10,203 | | | | 10,974 | | | | 11,926 | | | | 12,954 | |
| | Grants revenue | | | 20,411 | | | | 22,060 | | | | 19,580 | | | | 22,502 | | | | 22,922 | |
| | Sales of goods and services | | | 11,605 | | | | 11,319 | | | | 12,821 | | | | 13,918 | | | | 14,895 | |
| | Interest income | | | 2,586 | | | | 2,552 | | | | 2,707 | | | | 2,786 | | | | 2,858 | |
| | Dividend and income tax equivalent income | | | 16 | | | | 27 | | | | 42 | | | | 55 | | | | 61 | |
| | Other revenue | | | 4,481 | | | | 4,416 | | | | 4,649 | | | | 4,611 | | | | 4,774 | |
| | Total Revenue from Transactions | | | 49,300 | | | | 50,577 | | | | 50,773 | | | | 55,798 | | | | 58,466 | |
| Less | | Expenses from Transactions | | | | | | | | | | | | | | | | | | | | |
| | Employee expenses | | | 19,480 | | | | 19,946 | | | | 20,689 | | | | 21,629 | | | | 22,705 | |
| | Superannuation expenses | | | | | | | | | | | | | | | | | | | | |
| | Superannuation interest cost | | | 1,201 | | | | 1,221 | | | | 1,235 | | | | 1,324 | | | | 1,325 | |
| | Other superannuation expenses | | | 2,423 | | | | 2,467 | | | | 2,544 | | | | 2,605 | | | | 2,654 | |
| | Other operating expenses | | | 12,596 | | | | 12,421 | | | | 13,093 | | | | 13,160 | | | | 12,953 | |
| | Depreciation and amortisation | | | 5,106 | | | | 4,918 | | | | 5,296 | | | | 5,652 | | | | 5,907 | |
| | Other interest expenses | | | 3,586 | | | | 3,471 | | | | 4,115 | | | | 4,645 | | | | 5,024 | |
| | Grants expenses | | | 9,551 | | | | 9,350 | | | | 8,361 | | | | 8,288 | | | | 7,665 | |
| | Total Expenses from Transactions | | | 53,942 | | | | 53,795 | | | | 55,334 | | | | 57,304 | | | | 58,233 | |
| Equals | | Net Operating Balance | | | (4,642 | ) | | | (3,218 | ) | | | (4,560 | ) | | | (1,506 | ) | | | 233 | |
| Plus | | Other economic flows - included in operating result | | | (346 | ) | | | (320 | ) | | | (332 | ) | | | (253 | ) | | | (234 | ) |
| Equals | | Operating Result | | | (4,988 | ) | | | (3,537 | ) | | | (4,892 | ) | | | (1,758 | ) | | | (1 | ) |
| Plus | | Other economic flows - other movements in equity | | | 4,045 | | | | 3,769 | | | | 4,881 | | | | 4,207 | | | | 4,477 | |
| Equals | | Comprehensive Result - Total Change In Net Worth | | | (943 | ) | | | 231 | | | | (11 | ) | | | 2,449 | | | | 4,476 | |
| | KEY FISCAL AGGREGATES | | | | | | | | | | | | | | | | | | | | |
| | Net Operating Balance | | | (4,642 | ) | | | (3,218 | ) | | | (4,560 | ) | | | (1,506 | ) | | | 233 | |
| Less | | Net Acquisition of Non-financial Assets | | | | | | | | | | | | | | | | | | | | |
| | Purchases of non-financial assets | | | 12,313 | | | | 11,833 | | | | 11,702 | | | | 10,446 | | | | 9,189 | |
| | Less Sales of non-financial assets | | | 313 | | | | 337 | | | | 325 | | | | 264 | | | | 277 | |
| | Less Depreciation | | | 5,106 | | | | 4,918 | | | | 5,296 | | | | 5,652 | | | | 5,907 | |
| | Plus Change in inventories | | | 44 | | | | 34 | | | | (15 | ) | | | 62 | | | | 51 | |
| | Plus Other movements in non-financial assets | | | 256 | | | | 272 | | | | 240 | | | | 253 | | | | 255 | |
| | Equals Total Net Acquisition of Non-financial Assets | | | 7,194 | | | | 6,884 | | | | 6,306 | | | | 4,845 | | | | 3,312 | |
Equals | | Net Lending / (Borrowing) | | | (11,837 | ) | | | (10,102 | ) | | | (10,866 | ) | | | (6,350 | ) | | | (3,079 | ) |
Note:
| 1. | Numbers may not add due to rounding. |
| | | | |
| | | Mid Year Fiscal and Economic Review 2011-12 | | 31 |
Table 14
General Government Sector Balance Sheet 1
| | | | | | | | | | | | | | | | | | | | |
| | | 2011-12
Budget
$ million | | | 2011-12
Revised
$ million | | | 2012-13
Projection
$ million | | | 2013-14
Projection
$ million | | | 2014-15
Projection
$ million | |
Assets | | | | | | | | | | | | | | | | | | | | |
Financial Assets | | | | | | | | | | | | | | | | | | | | |
Cash and deposits | | | 353 | | | | 496 | | | | 519 | | | | 565 | | | | 579 | |
Advances paid | | | 1,011 | | | | 855 | | | | 851 | | | | 842 | | | | 846 | |
Investments, loans and placements | | | 34,088 | | | | 34,598 | | | | 35,769 | | | | 37,181 | | | | 38,194 | |
Receivables | | | 3,864 | | | | 4,351 | | | | 4,535 | | | | 4,744 | | | | 5,101 | |
Equity | | | | | | | | | | | | | | | | | | | | |
Investments in other public sector entities | | | 18,985 | | | | 16,944 | | | | 17,564 | | | | 18,375 | | | | 19,271 | |
Investments - other | | | 119 | | | | 147 | | | | 177 | | | | 177 | | | | 177 | |
Total Financial Assets | | | 58,420 | | | | 57,390 | | | | 59,415 | | | | 61,884 | | | | 64,168 | |
Non-financial Assets | | | | | | | | | | | | | | | | | | | | |
Land and other fixed assets | | | 183,708 | | | | 178,502 | | | | 186,241 | | | | 192,109 | | | | 196,878 | |
Other non-financial assets | | | 5,907 | | | | 5,538 | | | | 5,926 | | | | 6,347 | | | | 6,852 | |
Total Non-financial Assets | | | 189,616 | | | | 184,040 | | | | 192,167 | | | | 198,456 | | | | 203,730 | |
Total Assets | | | 248,035 | | | | 241,430 | | | | 251,582 | | | | 260,340 | | | | 267,897 | |
Liabilities | | | | | | | | | | | | | | | | | | | | |
Payables | | | 3,218 | | | | 3,486 | | | | 3,564 | | | | 3,641 | | | | 3,724 | |
Superannuation liability | | | 25,764 | | | | 25,769 | | | | 26,029 | | | | 26,202 | | | | 26,227 | |
Other employee benefits | | | 4,908 | | | | 4,992 | | | | 5,376 | | | | 5,780 | | | | 6,177 | |
Advances received | | | 740 | | | | 584 | | | | 572 | | | | 554 | | | | 510 | |
Borrowing | | | 33,185 | | | | 32,158 | | | | 41,490 | | | | 47,049 | | | | 49,549 | |
Other liabilities | | | 3,198 | | | | 3,159 | | | | 3,280 | | | | 3,396 | | | | 3,515 | |
Total Liabilities | | | 71,013 | | | | 70,148 | | | | 80,312 | | | | 86,621 | | | | 89,702 | |
Net Worth | | | 177,023 | | | | 171,282 | | | | 171,271 | | | | 173,719 | | | | 178,195 | |
| | | | | | | | | | | | | | | | | | | | |
Net Financial Worth | | | (12,593 | ) | | | (12,758 | ) | | | (20,897 | ) | | | (24,737 | ) | | | (25,535 | ) |
Net Financial Liabilities | | | 31,578 | | | | 29,702 | | | | 38,461 | | | | 43,112 | | | | 44,805 | |
Net Debt | | | (1,528 | ) | | | (3,206 | ) | | | 4,924 | | | | 9,015 | | | | 10,441 | |
| | | | | | | | | | | | | | | | | | | | |
Note:
| 1. | Numbers may not add due to rounding. |
| | | | |
| | | Mid Year Fiscal and Economic Review 2011-12 | | 32 |
Table 15
Public Non-financial Corporations Sector Balance Sheet 1
| | | | | | | | | | | | | | | | | | | | |
| | | 2011-12
Budget
$ million | | | 2011-12
Revised
$ million | | | 2012-13
Projection
$ million | | | 2013-14
Projection
$ million | | | 2014-15
Projection
$ million | |
Assets | | | | | | | | | | | | | | | | | | | | |
Financial Assets | | | | | | | | | | | | | | | | | | | | |
Cash and deposits | | | 1,643 | | | | 1,584 | | | | 1,797 | | | | 2,004 | | | | 2,108 | |
Advances paid | | | 296 | | | | 274 | | | | 274 | | | | 279 | | | | 291 | |
Investments, loans and placements | | | 376 | | | | 247 | | | | 125 | | | | 83 | | | | 69 | |
Receivables | | | 1,851 | | | | 2,059 | | | | 2,132 | | | | 2,233 | | | | 2,293 | |
Equity | | | | | | | | | | | | | | | | | | | | |
Investments - other | | | 104 | | | | 137 | | | | 168 | | | | 183 | | | | 201 | |
Total Financial Assets | | | 4,271 | | | | 4,303 | | | | 4,496 | | | | 4,782 | | | | 4,962 | |
Non-financial Assets | | | | | | | | | | | | | | | | | | | | |
Land and other fixed assets | | | 56,674 | | | | 53,639 | | | | 56,966 | | | | 59,716 | | | | 62,649 | |
Other non-financial assets | | | 1,319 | | | | 1,151 | | | | 1,266 | | | | 1,350 | | | | 1,477 | |
Total Non-financial Assets | | | 57,992 | | | | 54,790 | | | | 58,232 | | | | 61,066 | | | | 64,126 | |
Total Assets | | | 62,263 | | | | 59,093 | | | | 62,728 | | | | 65,849 | | | | 69,088 | |
Liabilities | | | | | | | | | | | | | | | | | | | | |
Payables | | | 2,035 | | | | 2,259 | | | | 2,408 | | | | 2,552 | | | | 2,867 | |
Superannuation liability | | | 68 | | | | (92 | ) | | | (100 | ) | | | (100 | ) | | | (99 | ) |
Other employee benefits | | | 690 | | | | 731 | | | | 746 | | | | 762 | | | | 778 | |
Deposits held | | | 16 | | | | 23 | | | | 25 | | | | 28 | | | | 30 | |
Advances received | | | 11 | | | | 11 | | | | 10 | | | | 9 | | | | 8 | |
Borrowing | | | 31,902 | | | | 30,194 | | | | 32,682 | | | | 34,330 | | | | 35,830 | |
Other liabilities | | | 7,403 | | | | 7,511 | | | | 7,880 | | | | 8,381 | | | | 8,892 | |
Total Liabilities | | | 42,126 | | | | 40,637 | | | | 43,652 | | | | 45,962 | | | | 48,306 | |
Net Worth | | | 20,137 | | | | 18,455 | | | | 19,076 | | | | 19,887 | | | | 20,782 | |
| | | | | | | | | | | | | | | | | | | | |
Net Financial Worth | | | (37,855 | ) | | | (36,335 | ) | | | (39,156 | ) | | | (41,180 | ) | | | (43,344 | ) |
Net Debt | | | 29,614 | | | | 28,122 | | | | 30,521 | | | | 32,001 | | | | 33,400 | |
| | | | | | | | | | | | | | | | | | | | |
Notes:
| 1. | Numbers may not add due to rounding. |
| | | | |
| | | Mid Year Fiscal and Economic Review 2011-12 | | 33 |
Table 16
Non-financial Public Sector Balance Sheet 1
| | | | | | | | | | | | | | | | | | | | |
| | | 2011-12
Budget
$ million | | | 2011-12
Revised $
million | | | 2012-13
Projection
$ million | | | 2013-14
Projection
$ million | | | 2014-15
Projection
$ million | |
Assets | | | | | | | | | | | | | | | | | | | | |
Financial Assets | | | | | | | | | | | | | | | | | | | | |
Cash and deposits | | | 1,996 | | | | 2,080 | | | | 2,316 | | | | 2,569 | | | | 2,687 | |
Advances paid | | | 1,296 | | | | 1,117 | | | | 1,114 | | | | 1,111 | | | | 1,128 | |
Investments, loans and placements | | | 34,466 | | | | 34,845 | | | | 35,894 | | | | 37,263 | | | | 38,263 | |
Receivables | | | 4,565 | | | | 5,283 | | | | 5,451 | | | | 5,627 | | | | 5,748 | |
Equity | | | | | | | | | | | | | | | | | | | | |
Investments in other public sector entities | | | (1,088 | ) | | | (1,511 | ) | | | (1,511 | ) | | | (1,511 | ) | | | (1,511 | ) |
Investments - other | | | 222 | | | | 285 | | | | 345 | | | | 360 | | | | 378 | |
Total Financial Assets | | | 41,458 | | | | 42,100 | | | | 43,609 | | | | 45,421 | | | | 46,693 | |
Non-financial Assets | | | | | | | | | | | | | | | | | | | | |
Land and other fixed assets | | | 240,347 | | | | 232,140 | | | | 243,207 | | | | 251,825 | | | | 259,526 | |
Other non-financial assets | | | 791 | | | | 917 | | | | 982 | | | | 1,054 | | | | 1,170 | |
Total Non-financial Assets | | | 241,138 | | | | 233,057 | | | | 244,188 | | | | 252,879 | | | | 260,697 | |
Total Assets | | | 282,596 | | | | 275,156 | | | | 287,797 | | | | 298,300 | | | | 307,390 | |
Liabilities | | | | | | | | | | | | | | | | | | | | |
Payables | | | 4,123 | | | | 4,657 | | | | 4,795 | | | | 4,881 | | | | 4,984 | |
Superannuation liability | | | 25,832 | | | | 25,677 | | | | 25,929 | | | | 26,102 | | | | 26,127 | |
Other employee benefits | | | 5,598 | | | | 5,723 | | | | 6,122 | | | | 6,542 | | | | 6,955 | |
Deposits held | | | 16 | | | | 23 | | | | 25 | | | | 28 | | | | 30 | |
Advances received | | | 740 | | | | 584 | | | | 572 | | | | 555 | | | | 511 | |
Borrowing | | | 65,088 | | | | 62,352 | | | | 74,172 | | | | 81,378 | | | | 85,378 | |
Other liabilities | | | 4,176 | | | | 4,859 | | | | 4,910 | | | | 5,094 | | | | 5,210 | |
Total Liabilities | | | 105,573 | | | | 103,875 | | | | 116,527 | | | | 124,580 | | | | 129,195 | |
Net Worth | | | 177,023 | | | | 171,282 | | | | 171,271 | | | | 173,719 | | | | 178,195 | |
| | | | | | | | | | | | | | | | | | | | |
Net Financial Worth | | | (64,115 | ) | | | (61,775 | ) | | | (72,918 | ) | | | (79,159 | ) | | | (82,502 | ) |
Net Financial Liabilities | | | 63,028 | | | | 60,264 | | | | 71,407 | | | | 77,648 | | | | 80,991 | |
Net Debt | | | 28,085 | | | | 24,916 | | | | 35,445 | | | | 41,016 | | | | 43,841 | |
| | | | | | | | | | | | | | | | | | | | |
Notes:
| 1. | Numbers may not add due to rounding. |
| | | | |
| | | Mid Year Fiscal and Economic Review 2011-12 | | 34 |
Table 17
General Government Sector Cash Flow Statement 1
| | | | | | | | | | | | | | | | | | | | |
| | | 2011-12
Budget
$ million | | | 2011-12
Revised
$ million | | | 2012-13
Projection
$ million | | | 2013-14
Projection
$ million | | | 2014-15
Projection
$ million | |
Cash Receipts from Operating Activities | | | | | | | | | | | | | | | | | | | | |
Taxes received | | | 10,526 | | | | 10,505 | | | | 11,336 | | | | 12,314 | | | | 13,363 | |
Grants and subsidies received | | | 20,275 | | | | 21,911 | | | | 19,440 | | | | 22,346 | | | | 22,744 | |
Sales of goods and services | | | 5,161 | | | | 5,126 | | | | 5,445 | | | | 5,719 | | | | 5,905 | |
Interest receipts | | | 2,477 | | | | 2,462 | | | | 2,616 | | | | 2,695 | | | | 2,765 | |
Dividends and income tax equivalents | | | 1,201 | | | | 1,027 | | | | 1,074 | | | | 1,300 | | | | 1,453 | |
Other receipts | | | 6,028 | | | | 5,793 | | | | 6,286 | | | | 5,854 | | | | 5,958 | |
Total Operating Receipts | | | 45,668 | | | | 46,825 | | | | 46,198 | | | | 50,227 | | | | 52,188 | |
Cash Payments for Operating Activities | | | | | | | | | | | | | | | | | | | | |
Payments for employees | | | (20,704 | ) | | | (20,892 | ) | | | (21,799 | ) | | | (22,849 | ) | | | (24,052 | ) |
Payments for goods and services | | | (11,673 | ) | | | (11,570 | ) | | | (11,654 | ) | | | (11,300 | ) | | | (11,179 | ) |
Grants and subsidies | | | (11,482 | ) | | | (11,520 | ) | | | (10,478 | ) | | | (10,471 | ) | | | (9,883 | ) |
Interest paid | | | (1,747 | ) | | | (1,692 | ) | | | (2,134 | ) | | | (2,494 | ) | | | (2,731 | ) |
Other payments | | | (1,023 | ) | | | (1,015 | ) | | | (886 | ) | | | (884 | ) | | | (893 | ) |
Total Operating Payments | | | (46,629 | ) | | | (46,689 | ) | | | (46,950 | ) | | | (47,998 | ) | | | (48,738 | ) |
Net Cash Inflows from Operating Activities | | | (961 | ) | | | 136 | | | | (752 | ) | | | 2,229 | | | | 3,450 | |
Cash Flows from Investments in Non-Financial Assets | | | | | | | | | | | | | | | | | | | | |
Purchases of non-financial assets | | | (7,180 | ) | | | (7,292 | ) | | | (6,987 | ) | | | (6,250 | ) | | | (4,810 | ) |
Sales of non-financial assets | | | 226 | | | | 242 | | | | 283 | | | | 213 | | | | 234 | |
Net Cash Flows from Investments in Non-financial Assets | | | (6,954 | ) | | | (7,050 | ) | | | (6,705 | ) | | | (6,036 | ) | | | (4,576 | ) |
Net Cash Flows from Investments in Financial Assets for Policy Purposes | | | (484 | ) | | | 1,160 | | | | (665 | ) | | | (616 | ) | | | (294 | ) |
Net Cash Flows from Investments in Financial Assets for Liquidity Purposes | | | (1,045 | ) | | | (1,235 | ) | | | (1,159 | ) | | | (1,065 | ) | | | (1,003 | ) |
Receipts from Financing Activities | | | | | | | | | | | | | | | | | | | | |
Advances received (net) | | | 221 | | | | 136 | | | | (16 | ) | | | (21 | ) | | | (48 | ) |
Borrowing (net) | | | 8,931 | | | | 8,172 | | | | 9,320 | | | | 5,556 | | | | 2,486 | |
Net Cash Flows from Financing Activities | | | 9,152 | | | | 8,308 | | | | 9,304 | | | | 5,534 | | | | 2,438 | |
Net Increase/(Decrease) in Cash held | | | (293 | ) | | | 1,319 | | | | 23 | | | | 46 | | | | 14 | |
Net cash from operating activities | | | (961 | ) | | | 136 | | | | (752 | ) | | | 2,229 | | | | 3,450 | |
Net cash flows from investments in non-financial assets | | | (6,954 | ) | | | (7,050 | ) | | | (6,705 | ) | | | (6,036 | ) | | | (4,576 | ) |
Surplus/(Deficit) | | | (7,915 | ) | | | (6,914 | ) | | | (7,456 | ) | | | (3,807 | ) | | | (1,126 | ) |
| | | | | | | | | | | | | | | | | | | | |
Derivation of ABS GFS Cash Surplus/Deficit | | | | | | | | | | | | | | | | | | | | |
Cash surplus/(deficit) | | | (7,915 | ) | | | (6,914 | ) | | | (7,456 | ) | | | (3,807 | ) | | | (1,126 | ) |
Acquisitions under finance leases and similar arrangements | | | (67 | ) | | | (67 | ) | | | (15 | ) | | | (26 | ) | | | (26 | ) |
ABS GFS Cash Surplus/(Deficit) Including Finance Leases and Similar Arrangements | | | (7,982 | ) | | | (6,980 | ) | | | (7,471 | ) | | | (3,833 | ) | | | (1,152 | ) |
| | | | | | | | | | | | | | | | | | | | |
Note:
| 1. | Numbers may not add due to rounding. |
| | | | |
| | | Mid Year Fiscal and Economic Review 2011-12 | | 35 |
Table 18
Public Non-financial Corporations Sector Cash Flow Statement 1
| | | | | | | | | | | | | | | | | | | | |
| | | 2011-12
Budget
$ million | | | 2011-12
Revised
$ million | | | 2012-13
Projection
$ million | | | 2013-14
Projection
$ million | | | 2014-15
Projection
$ million | |
Cash Receipts from Operating Activities | | | | | | | | | | | | | | | | | | | | |
Grants and subsidies received | | | 2,114 | | | | 2,353 | | | | 2,364 | | | | 2,463 | | | | 2,508 | |
Sales of goods and services | | | 8,141 | | | | 7,630 | | | | 9,094 | | | | 10,004 | | | | 10,925 | |
Interest receipts | | | 108 | | | | 91 | | | | 91 | | | | 91 | | | | 94 | |
Other receipts | | | 999 | | | | 937 | | | | 887 | | | | 843 | | | | 899 | |
Total Operating Receipts | | | 11,363 | | | | 11,011 | | | | 12,436 | | | | 13,401 | | | | 14,427 | |
Cash Payments for Operating Activities | | | | | | | | | | | | | | | | | | | | |
Payments for employees | | | (1,846 | ) | | | (1,931 | ) | | | (2,110 | ) | | | (2,212 | ) | | | (2,290 | ) |
Payments for goods and services | | | (4,035 | ) | | | (3,668 | ) | | | (4,426 | ) | | | (4,398 | ) | | | (4,439 | ) |
Grants and subsidies | | | (24 | ) | | | (13 | ) | | | (14 | ) | | | (14 | ) | | | (15 | ) |
Interest paid | | | (1,986 | ) | | | (1,968 | ) | | | (2,233 | ) | | | (2,424 | ) | | | (2,586 | ) |
Other payments | | | (1,301 | ) | | | (1,200 | ) | | | (1,170 | ) | | | (1,398 | ) | | | (1,397 | ) |
Total Operating Payments | | | (9,192 | ) | | | (8,780 | ) | | | (9,953 | ) | | | (10,446 | ) | | | (10,728 | ) |
Net Cash Inflows from Operating Activities | | | 2,171 | | | | 2,231 | | | | 2,483 | | | | 2,954 | | | | 3,699 | |
Cash Flows from Investments in Non-Financial Assets | | | | | | | | | | | | | | | | | | | | |
Purchases of non-financial assets | | | (5,134 | ) | | | (4,542 | ) | | | (4,715 | ) | | | (4,196 | ) | | | (4,379 | ) |
Sales of non-financial assets | | | 88 | | | | 95 | | | | 42 | | | | 51 | | | | 43 | |
Net Cash Flows from Investments in Non-financial Assets | | | (5,046 | ) | | | (4,447 | ) | | | (4,673 | ) | | | (4,145 | ) | | | (4,337 | ) |
Net Cash Flows from Investments in Financial Assets for Policy Purposes | | | 156 | | | | 134 | | | | (30 | ) | | | (16 | ) | | | (18 | ) |
Net Cash Flows from Investments in Financial Assets for Liquidity Purposes | | | 23 | | | | 321 | | | | 10 | | | | 11 | | | | 11 | |
Receipts from Financing Activities | | | | | | | | | | | | | | | | | | | | |
Borrowing (net) | | | 2,958 | | | | 1,469 | | | | 2,541 | | | | 1,649 | | | | 1,487 | |
Dividends paid | | | (918 | ) | | | (737 | ) | | | (756 | ) | | | (865 | ) | | | (1,035 | ) |
Other financing (net) | | | 452 | | | | (1,504 | ) | | | 636 | | | | 619 | | | | 297 | |
Net Cash Flows from Financing Activities | | | 2,492 | | | | (772 | ) | | | 2,422 | | | | 1,403 | | | | 749 | |
Net Increase/(Decrease) in Cash held | | | (204 | ) | | | (2,533 | ) | | | 213 | | | | 207 | | | | 104 | |
Net cash from operating activities | | | 2,171 | | | | 2,231 | | | | 2,483 | | | | 2,954 | | | | 3,699 | |
Net cash flows from investments in non-financial assets | | | (5,046 | ) | | | (4,447 | ) | | | (4,673 | ) | | | (4,145 | ) | | | (4,337 | ) |
Dividends paid | | | (918 | ) | | | (737 | ) | | | (756 | ) | | | (865 | ) | | | (1,035 | ) |
Surplus/(Deficit) | | | (3,793 | ) | | | (2,953 | ) | | | (2,945 | ) | | | (2,056 | ) | | | (1,673 | ) |
| | | | | | | | | | | | | | | | | | | | |
Derivation of ABS GFS Cash Surplus/Deficit | | | | | | | | | | | | | | | | | | | | |
Cash surplus/(deficit) | | | (3,793 | ) | | | (2,953 | ) | | | (2,945 | ) | | | (2,056 | ) | | | (1,673 | ) |
ABS GFS Cash Surplus/(Deficit) Including Finance Leases and Similar Arrangements | | | (3,793 | ) | | | (2,953 | ) | | | (2,945 | ) | | | (2,056 | ) | | | (1,673 | ) |
| | | | | | | | | | | | | | | | | | | | |
Note:
| 1. | Numbers may not add due to rounding. |
| | | | |
| | | Mid Year Fiscal and Economic Review 2011-12 | | 36 |
Table 19
Non-financial Public Sector Cash Flow Statement1
| | | | | | | | | | | | | | | | | | | | |
| | | 2011-12
Budget
$ million | | | 2011-12
Revised
$ million | | | 2012-13
Projection
$ million | | | 2013-14
Projection
$ million | | | 2014-15
Projection
$ million | |
Cash Receipts from Operating Activities | | | | | | | | | | | | | | | | | | | | |
Taxes received | | | 10,201 | | | | 10,200 | | | | 10,973 | | | | 11,925 | | | | 12,953 | |
Grants and subsidies received | | | 20,413 | | | | 22,078 | | | | 19,588 | | | | 22,518 | | | | 22,926 | |
Sales of goods and services | | | 12,942 | | | | 12,405 | | | | 14,158 | | | | 15,313 | | | | 16,403 | |
Interest receipts | | | 2,586 | | | | 2,553 | | | | 2,707 | | | | 2,786 | | | | 2,859 | |
Dividends and income tax equivalents | | | 22 | | | | 40 | | | | 30 | | | | 44 | | | | 56 | |
Other receipts | | | 7,027 | | | | 6,730 | | | | 7,173 | | | | 6,696 | | | | 6,857 | |
Total Operating Receipts | | | 53,191 | | | | 54,005 | | | | 54,629 | | | | 59,282 | | | | 62,055 | |
Cash Payments for Operating Activities | | | | | | | | | | | | | | | | | | | | |
Payments for employees | | | (22,461 | ) | | | (22,738 | ) | | | (23,810 | ) | | | (24,958 | ) | | | (26,237 | ) |
Payments for goods and services | | | (15,364 | ) | | | (14,904 | ) | | | (15,717 | ) | | | (15,306 | ) | | | (15,209 | ) |
Grants and subsidies | | | (9,531 | ) | | | (9,345 | ) | | | (8,276 | ) | | | (8,195 | ) | | | (7,572 | ) |
Interest paid | | | (3,500 | ) | | | (3,449 | ) | | | (4,115 | ) | | | (4,646 | ) | | | (5,028 | ) |
Other payments | | | (2,045 | ) | | | (1,938 | ) | | | (1,736 | ) | | | (1,860 | ) | | | (1,895 | ) |
Total Operating Payments | | | (52,900 | ) | | | (52,375 | ) | | | (53,654 | ) | | | (54,964 | ) | | | (55,942 | ) |
Net Cash Inflows from Operating Activities | | | 290 | | | | 1,630 | | | | 976 | | | | 4,318 | | | | 6,113 | |
Cash Flows from Investments in Non-Financial Assets | | | | | | | | | | | | | | | | | | | | |
Purchases of non-financial assets | | | (12,313 | ) | | | (11,833 | ) | | | (11,702 | ) | | | (10,446 | ) | | | (9,189 | ) |
Sales of non-financial assets | | | 313 | | | | 337 | | | | 325 | | | | 264 | | | | 277 | |
Net Cash Flows from Investments in Non-financial Assets | | | (12,000 | ) | | | (11,496 | ) | | | (11,377 | ) | | | (10,182 | ) | | | (8,912 | ) |
Net Cash Flows from Investments in Financial Assets for Policy Purposes | | | 128 | | | | 106 | | | | (60 | ) | | | (16 | ) | | | (18 | ) |
Net Cash Flows from Investments in Financial Assets for Liquidity Purposes | | | (1,022 | ) | | | (914 | ) | | | (1,149 | ) | | | (1,054 | ) | | | (993 | ) |
Receipts from Financing Activities | | | | | | | | | | | | | | | | | | | | |
Advances received (net) | | | 221 | | | | 136 | | | | (16 | ) | | | (21 | ) | | | (48 | ) |
Borrowing (net) | | | 11,889 | | | | 9,641 | | | | 11,862 | | | | 7,205 | | | | 3,973 | |
Other financing (net) | | | (4 | ) | | | (316 | ) | | | 1 | | | | 3 | | | | 3 | |
Net Cash Flows from Financing Activities | | | 12,105 | | | | 9,460 | | | | 11,846 | | | | 7,186 | | | | 3,928 | |
Net Increase/(Decrease) in Cash held | | | (498 | ) | | | (1,214 | ) | | | 236 | | | | 253 | | | | 118 | |
Net cash from operating activities | | | 290 | | | | 1,630 | | | | 976 | | | | 4,318 | | | | 6,113 | |
Net cash flows from investments in non-financial assets | | | (12,000 | ) | | | (11,496 | ) | | | (11,377 | ) | | | (10,182 | ) | | | (8,912 | ) |
Surplus/(Deficit) | | | (11,710 | ) | | | (9,866 | ) | | | (10,401 | ) | | | (5,863 | ) | | | (2,799 | ) |
| | | | | | | | | | | | | | | | | | | | |
Derivation of ABS GFS Cash Surplus/Deficit | | | | | | | | | | | | | | | | | | | | |
Cash surplus/(deficit) | | | (11,710 | ) | | | (9,866 | ) | | | (10,401 | ) | | | (5,863 | ) | | | (2,799 | ) |
Acquisitions under finance leases and similar arrangements | | | (67 | ) | | | (67 | ) | | | (15 | ) | | | (26 | ) | | | (26 | ) |
ABS GFS Cash Surplus/(Deficit) Including Finance Leases and Similar Arrangements | | | (11,776 | ) | | | (9,933 | ) | | | (10,416 | ) | | | (5,889 | ) | | | (2,825 | ) |
| | | | | | | | | | | | | | | | | | | | |
Note:
| 1. | Numbers may not add due to rounding. |
| | | | |
| | | Mid Year Fiscal and Economic Review 2011-12 | | 37 |
Loan Council Allocation
Table 20
Loan Council Allocation1
| | | | | | | | | | |
| | | | | 2011-12
Budget
$ million | | | 2011-12
Revised
$ million | |
| | General Government sector cash deficit/(surplus)2 | | | 7,915 | | | | 6,914 | |
| | PNFC sector cash deficit/(surplus)2 | | | 3,793 | | | | 2,953 | |
| | Non Financial Public Sector cash deficit/(surplus)2 | | | 11,710 | | | | 9,866 | |
| | Acquisitions under finance leases and similar arrangements3 | | | (67 | ) | | | (67 | ) |
Equals | | ABS GFS cash deficit/(surplus) | | | 11,776 | | | | 9,933 | |
Less | | Net cash flows from investments in financial assets for policy purposes | | | 128 | | | | 106 | |
Plus | | Memorandum Items4 | | | 1,992 | | | | 2,017 | |
| | Loan Council Allocation | | | 13,640 | | | | 11,844 | |
Notes:
| 1. | Numbers may not add due to rounding. |
| 2. | Figures in brackets represent surpluses. |
| 3. | Finance leases are shown with a negative sign as they are deducted in compiling the ABS GFS cash deficit/surplus. |
| 4. | Memorandum items include operating leases and local government borrowings. |
The revised LCA is outside the 2% tolerance level since Budget primarily as a result of the $1.4 billion advance NDRRA payment from the Australian Government and lower than budgeted capital spending in the Public Non-financial Corporation Sector.
| | | | |
| | | Mid Year Fiscal and Economic Review 2011-12 | | 38 |
APPENDIX
TAXATION AND ROYALTY REVENUE – 2010-11 TO 2014-15
Table 21
Taxation and royalty revenue1
| | | | | | | | | | | | | | | | | | | | | | | | |
| | | 2010-11
Actual
$ million | | | 2011-12
Budget
$ million | | | 2011-12
Revised
$ million | | | 2012-13
Projection
$ million | | | 2013-14
Projection
$ million | | | 2014-15
Projection
$ million | |
Payroll tax | | | 3,023 | | | | 3,263 | | | | 3,492 | | | | 3,867 | | | | 4,250 | | | | 4,664 | |
Transfer duty | | | 1,933 | | | | 2,180 | | | | 1,960 | | | | 2,175 | | | | 2,497 | | | | 2,851 | |
Other duties | | | 948 | | | | 1,018 | | | | 1,009 | | | | 1,092 | | | | 1,167 | | | | 1,248 | |
Gambling taxes and levies | | | 945 | | | | 981 | | | | 992 | | | | 1,023 | | | | 1,055 | | | | 1,088 | |
Land tax | | | 1,042 | | | | 1,064 | | | | 1,047 | | | | 1,089 | | | | 1,155 | | | | 1,224 | |
Motor vehicle registration | | | 1,336 | | | | 1,373 | | | | 1,383 | | | | 1,438 | | | | 1,496 | | | | 1,556 | |
Other taxes | | | 747 | | | | 648 | | | | 625 | | | | 652 | | | | 695 | | | | 732 | |
Total taxation revenue | | | 9,975 | | | | 10,527 | | | | 10,509 | | | | 11,337 | | | | 12,315 | | | | 13,364 | |
Royalties | | | | | | | | | | | | | | | | | | | | | | | | |
Coal | | | 2,357 | | | | 2,755 | | | | 2,633 | | | | 2,790 | | | | 2,720 | | | | 2,623 | |
Other royalties | | | 365 | | | | 548 | | | | 483 | | | | 584 | | | | 634 | | | | 846 | |
Land rents | | | 154 | | | | 142 | | | | 140 | | | | 148 | | | | 158 | | | | 168 | |
Total royalties and land rents | | | 2,876 | | | | 3,445 | | | | 3,257 | | | | 3,523 | | | | 3,512 | | | | 3,638 | |
Note:
| 1. | Numbers may not add due to rounding. |
ROYALTY ASSUMPTIONS
Table 22
Royalty Assumptions
| | | | | | | | | | | | | | | | |
| | | 2011-12
Revised | | | 2012-13
Projection | | | 2013-14
Projection | | | 2014-15
Projection | |
Tonnages – Crown Export Coal (Mt) | | | 163 | | | | 189 | | | | 205 | | | | 221 | |
Exchange Rate US$ per A$ | | | 1.03 | | | | 0.97 | | | | 0.93 | | | | 0.91 | |
Year Average Coal Prices | | | | | | | | | | | | | | | | |
Hard Coking | | | 270 | | | | 230 | | | | 200 | | | | 180 | |
Semi-Soft | | | 200 | | | | 170 | | | | 150 | | | | 140 | |
Thermal | | | 125 | | | | 125 | | | | 115 | | | | 105 | |
| | | | |
| | | Mid Year Fiscal and Economic Review 2011-12 | | 39 |

State Budget 2011 — 12
Mid Year Fiscal and Economic Review