EXHIBIT (c)(vii)
The Queensland Treasury Corporation Half Yearly Report
for the half-year ended December 31, 2011
AUDAX AT FIDELIS
QUEENSLAND
TREASURY
CORPORATION
HALF-YEARLY
REPORT
DECEMBER 2011

VISION
PARTNERS IN FINANCIAL SUSTAINABILITY
MISSION
TO CREATE AND DELIVER UNIQUE AND RELEVANT VALUE FOR QUEENSLAND’S PUBLIC SECTOR
VALUES
WE ARE FOCUSED ON OUR CLIENTS
WE ARE PASSIONATE ABOUT QUEENSLAND
WE VALUE AND RESPECT OUR PEOPLE
WE ARE COLLABORATIVE AND SEEK CONTINUOUS IMPROVEMENT
ABOVE ALL ELSE,
WE VALUE INTEGRITY
Queensland Treasury Corporation is the Queensland Government’s central financing authority and corporate treasury services provider, with responsibility for:
sourcing and managing the debt funding to finance Queensland’s infrastructure requirements in the most cost-effective manner
providing financial and risk management advice to the Queensland Government and its public sector clients on financial risk issues, and
investing the State’s short- to medium-term cash surpluses, to maximise client returns through a conservative risk management framework.
QTC does not formulate Government policy, but works within the policy frameworks developed by the Government and Queensland Treasury.
Debt funding and management
QTC borrows funds in the domestic and international markets in a manner that minimises the State’s and QTC’s liquidity and refinancing risk. We then lend these funds to meet our clients’ debt requirements, for both new borrowings and the refinancing of existing debt. With responsibility for all of the State’s debt raising, QTC is able to capture significant economies of scale and scope in the issuance, management and administration of debt.
Financial advisory and risk management services
QTC works closely with its public sector clients to assist in managing their risk in financial transactions and achieve the best financial solutions for their organisations and for Queensland. In assisting clients, QTC does not provide advice that is contrary to the interests of the State. We encourage our clients and Queensland Treasury, our major stakeholder, to use our organisation as an extension of their resources, by:
providing access, on a cost recovery basis, to professional skills and resources to ensure that their financial risks are identified and managed on a consistent basis
acting as a central store of knowledge and expertise on financial structures and transactions, and the risks and benefits they encompass
providing Queensland Treasury with advice on matters of financial and commercial policy and risk relating to the State and its entities
working as a conduit between the Government and the private sector, and
using our economies of scale and scope to ensure that the best possible solutions are obtained.
Short- to medium-term investments
QTC uses its financial markets expertise, developed through strong relationships with the domestic and international markets, together with its understanding of debt management and the management of financial risk, to provide clients with investment solutions that achieve a high return within a conservative risk environment. Clients can choose from an overnight facility, a managed short-term fund or fixed-term facilities. Alternatively, we can assist them to source appropriate solutions from the marketplace.
QUEENSLAND
TREASURY
CORPORATION
CONTENTS
Queensland Treasury Corporation 1
Five-Year Business Summary 3 Chairman’s and
Chief Executive’s Report 4
Financial Statements 7
Appendices 25
HALF-YEARLY REPORT DECEMBER 2011 QUEENSLAND TREASURY CORPORATION 1
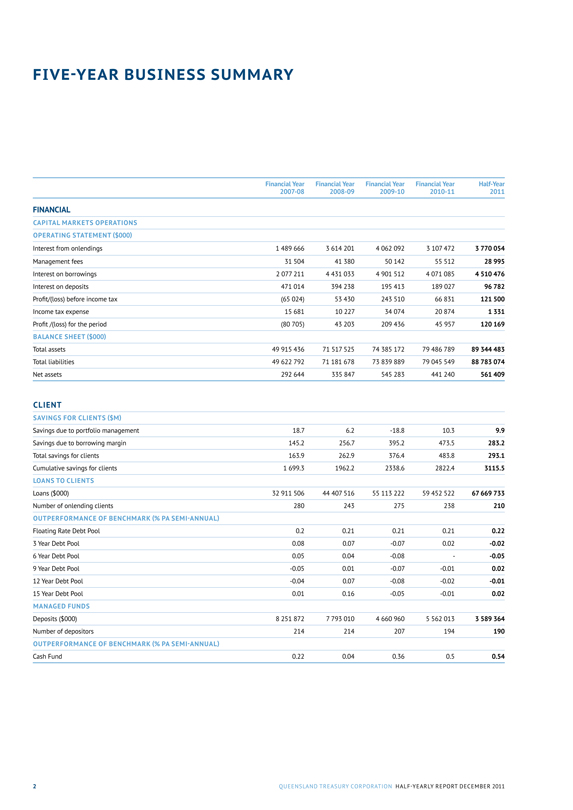
FIVE-YEAR BUSINESS SUMMARY
Financial Year Financial Year Financial Year Financial Year Half-Year
2007-08 2008-09 2009-10 2010-11 2011
FINANCIAL
CAPITAL MARKETS OPERATIONS
OPERATING STATEMENT ($000)
Interest from onlendings 1 489 666 3 614 201 4 062 092 3 107 472 3 770 054
Management fees 31 504 41 380 50 142 55 512 28 995
Interest on borrowings 2 077 211 4 431 033 4 901 512 4 071 085 4 510 476
Interest on deposits 471 014 394 238 195 413 189 027 96 782
Profit/(loss) before income tax (65 024) 53 430 243 510 66 831 121 500
Income tax expense 15 681 10 227 34 074 20 874 1 331
Profit/(loss) for the period (80 705) 43 203 209 436 45 957 120 169 BALANCE SHEET ($000)
Total assets 49 915 436 71 517 525 74 385 172 79 486 789 89 344 483
Total liabilities 49 622 792 71 181 678 73 839 889 79 045 549 88 783 074
Net assets 292 644 335 847 545 283 441 240 561 409
CLIENT
SAVINGS FOR CLIENTS ($M)
Savings due to portfolio management 18.7 6.2 -18.8 10.3 9.9
Savings due to borrowing margin 145.2 256.7 395.2 473.5 283.2
Total savings for clients 163.9 262.9 376.4 483.8 293.1
Cumulative savings for clients 1 699.3 1962.2 2338.6 2822.4 3115.5
LOANS TO CLIENTS
Loans ($000) 32 911 506 44 407 516 55 113 222 59 452 522 67 669 733
Number of onlending clients 280 243 275 238 210
OUTPERFORMANCE OF BENCHMARK (% PA SEMI-ANNUAL)
Floating Rate Debt Pool 0.2 0.21 0.21 0.21 0.22
3 Year Debt Pool 0.08 0.07 -0.07 0.02 -0.02
6 Year Debt Pool 0.05 0.04 -0.08 - -0.05
9 Year Debt Pool -0.05 0.01 -0.07 -0.01 0.02
12 Year Debt Pool -0.04 0.07 -0.08 -0.02 -0.01
15 Year Debt Pool 0.01 0.16 -0.05 -0.01 0.02
MANAGED FUNDS
Deposits ($000) 8 251 872 7 793 010 4 660 960 5 562 013 3 589 364
Number of depositors 214 214 207 194 190
OUTPERFORMANCE OF BENCHMARK (% PA SEMI-ANNUAL)
Cash Fund 0.22 0.04 0.36 0.5 0.54
2 QUEENSLAND TREASURY CORPORATION HALF-YEARLY REPORT DECEMBER 2011
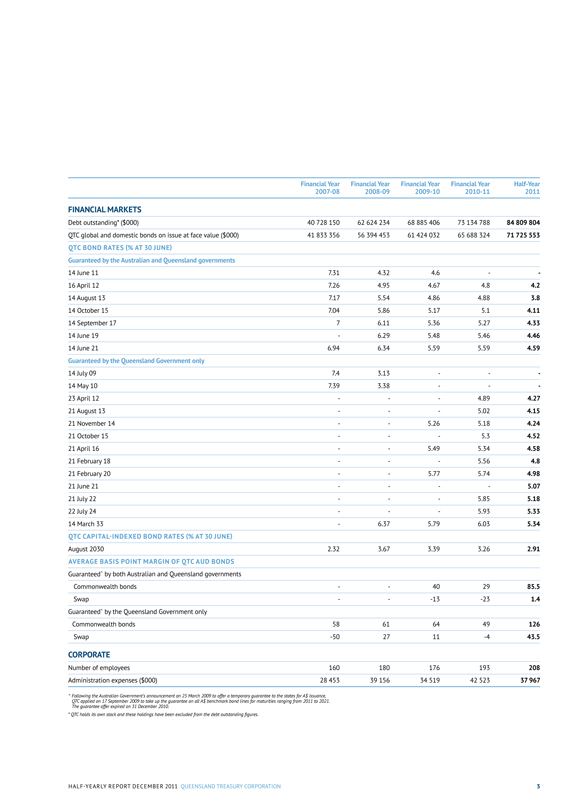
Financial Year Financial Year Financial Year Financial Year Half-Year
2007-08 2008-09 2009-10 2010-11 2011
FINANCIAL MARKETS
Debt outstanding* ($000) 40 728 150 62 624 234 68 885 406 73 134 788 84 809 804
QTC global and domestic bonds on issue at face value ($000) 41 833 356 56 394 453 61 424 032 65 688 324 71 725 553
QTC BOND RATES (% AT 30 JUNE)
Guaranteed by the Australian and Queensland governments
14 June 11 7.31 4.32 4.6
16 April 12 7.26 4.95 4.67 4.8 4.2
14 August 13 7.17 5.54 4.86 4.88 3.8
14 October 15 7.04 5.86 5.17 5.1 4.11
14 September 17 7 6.11 5.36 5.27 4.33
14 June 19 - 6.29 5.48 5.46 4.46
14 June 21 6.94 6.34 5.59 5.59 4.59
Guaranteed by the Queensland Government only
14 July 09 7.4 3.13
14 May 10 7.39 3.38
23 April 12 - - 4.89 4.27
21 August 13 - - 5.02 4.15
21 November 14 - - 5.26 5.18 4.24
21 October 15 - 5.3 4.52
21 April 16 - - 5.49 5.34 4.58
21 February 18 - - 5.56 4.8
21 February 20 - - 5.77 5.74 4.98
21 June 21 5.07
21 July 22 - - 5.85 5.18
22 July 24 - - 5.93 5.33
14 March 33 - 6.37 5.79 6.03 5.34
QTC CAPITAL-INDEXED BOND RATES (% AT 30 JUNE)
August 2030 2.32 3.67 3.39 3.26 2.91
AVERAGE BASIS POINT MARGIN OF QTC AUD BONDS
Guaranteed^ by both Australian and Queensland governments
Commonwealth bonds - - 40 29 85.5
Swap - -13 -23 1.4
Guaranteed^ by the Queensland Government only
Commonwealth bonds 58 61 64 49 126
Swap -50 27 11 -4 43.5
CORPORATE
Number of employees 160 180 176 193 208
Administration expenses ($000) 28 453 39 156 34 519 42 523 37967
^ Following the Australian Government’s announcement on 25 March 2009 to offer a temporary guarantee to the states for A$ issuance, QTC applied on 17 September 2009 to take up the guarantee on all A$ benchmark bond lines for maturities ranging from 2011 to 2021. The guarantee offer expired on 31 December 2010.
* QTC holds its own stock and these holdings have been excluded from the debt outstanding figures.
HALF-YEARLY REPORT DECEMBER 2011 QUEENSLAND TREASURY CORPORATION 3
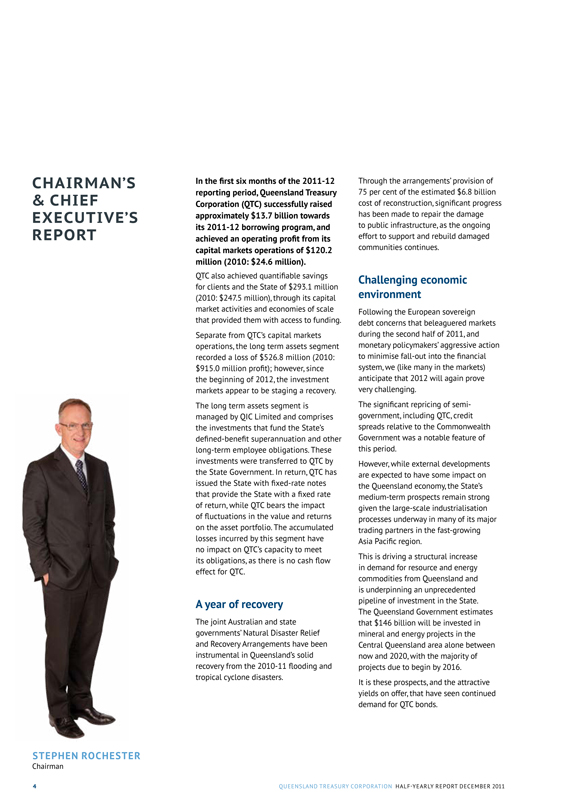
CHAIRMAN’S & CHIEF EXECUTIVE’S REPORT
STEPHEN ROCHESTER
Chairman
In the first six months of the 2011-12 reporting period, Queensland Treasury Corporation (QTC) successfully raised approximately $13.7 billion towards its 2011-12 borrowing program, and achieved an operating profit from its capital markets operations of $120.2 million (2010: $24.6 million).
QTC also achieved quantifiable savings for clients and the State of $293.1 million (2010: $247.5 million), through its capital market activities and economies of scale that provided them with access to funding.
Separate from QTC’s capital markets operations, the long term assets segment recorded a loss of $526.8 million (2010: $915.0 million profit); however, since the beginning of 2012, the investment markets appear to be staging a recovery.
The long term assets segment is managed by QIC Limited and comprises the investments that fund the State’s defined-benefit superannuation and other long-term employee obligations. These investments were transferred to QTC by the State Government. In return, QTC has issued the State with fixed-rate notes that provide the State with a fixed rate of return, while QTC bears the impact of fluctuations in the value and returns on the asset portfolio. The accumulated losses incurred by this segment have no impact on QTC’s capacity to meet its obligations, as there is no cash flow effect for QTC.
A year of recovery
The joint Australian and state governments’ Natural Disaster Relief and Recovery Arrangements have been instrumental in Queensland’s solid recovery from the 2010-11 flooding and tropical cyclone disasters.
Through the arrangements’ provision of 75 per cent of the estimated $6.8 billion cost of reconstruction, significant progress has been made to repair the damage to public infrastructure, as the ongoing effort to support and rebuild damaged communities continues.
Challenging economic environment
Following the European sovereign debt concerns that beleaguered markets during the second half of 2011, and monetary policymakers’ aggressive action to minimise fall-out into the financial system, we (like many in the markets) anticipate that 2012 will again prove very challenging.
The significant repricing of semi-government, including QTC, credit spreads relative to the Commonwealth Government was a notable feature of this period.
However, while external developments are expected to have some impact on the Queensland economy, the State’s medium-term prospects remain strong given the large-scale industrialisation processes underway in many of its major trading partners in the fast-growing Asia Pacific region.
This is driving a structural increase in demand for resource and energy commodities from Queensland and is underpinning an unprecedented pipeline of investment in the State. The Queensland Government estimates that $146 billion will be invested in mineral and energy projects in the Central Queensland area alone between now and 2020, with the majority of projects due to begin by 2016.
It is these prospects, and the attractive yields on offer, that have seen continued demand for QTC bonds.
4 QUEENSLAND TREASURY CORPORATION HALF-YEARLY REPORT December 2011
Borrowing program revised
On 18 January 2012, having raised approximately $13.7 billion towards its 2011-12 borrowing program, QTC revised its estimated borrowing requirement for the 2011-12 financial year down from $22 billion to $19.2 billion. This decrease in the borrowing requirement results from Queensland’s lower capital spend in 2011-12, particularly in the energy and rail corporations, and advance payments received from the Australian Government relating to natural disaster works.
In July, QTC issued a $1.5 billion State Government guaranteed domestic benchmark bond, maturing in 2021, with positive uptake from investors.
Then, in October, in response to increasingly challenging market, QTC announced it was implementing a strategy of issuing bonds on a reverse- enquiry basis through its distribution group of 17 international banks.
To complete its borrowing program for 2011-12, QTC intends to maintain its reverse-enquiry issuance strategy, and take advantage of other term funding opportunities as they arise.
QTC’s approach to raising funds relies on its ability to attract and maintain a diverse range of wholesale investors from various global locations, and it remains committed to open and transparent communication with the market. As part of its annual domestic and offshore investor relations roadshow program, over the past six months, QTC representatives have met with key institutional investors, as well as representatives of its distribution group banks and other financial intermediaries.
Capital markets operations
QTC’s $120.2 million operating profit from its capital markets operations primarily represents unrealised accounting gains on investments held in advance of future lending requirements, and includes a $14.8 million write down in the value of software under development.
Greater efficiencies and enhanced teamwork
Within QTC, we look forward to greater efficiencies and enhanced teamwork as we co-locate all employees in one building, and our in-house resources implement upgraded business systems and processes to support both employees and our clients. These developments will enhance our capacity and our capabilities as we focus on delivering financial solutions to the State’s public sector.
On behalf of the Board and the senior management team, we thank our team of talented and dedicated employees, whose contributions to their clients’ businesses continue to build a better Queensland.
STEPHEN ROCHESTER
Chairman
PHILIP NOBLE
Chief Executive
HALF-YEARLY REPORT DECEMBER 2011 QUEENSLAND TREASURY CORPORATION 5
PHILIP NOBLE
Chief Executive

6 QUEENSLAND TREASURY CORPORATION HALF-YEARLY REPORT DECEMBER 2011
AUDAX AT FIDELIS
QUEENSLAND
TREASURY
CORPORATION
FINANCIAL STATEMENTS
FOR THE HALF-YEAR ENDED 31 DECEMBER 2011
Contents
Statement of Comprehensive Income 8
Balance Sheet 9
Statement of Changes in Equity 10
Statement of Cash Flows 11
Notes to and forming part of the Financial Statements 12
Certificate of the Queensland Treasury Corporation 22
Independent Auditor’s Review Report 23
Management Report 24 7
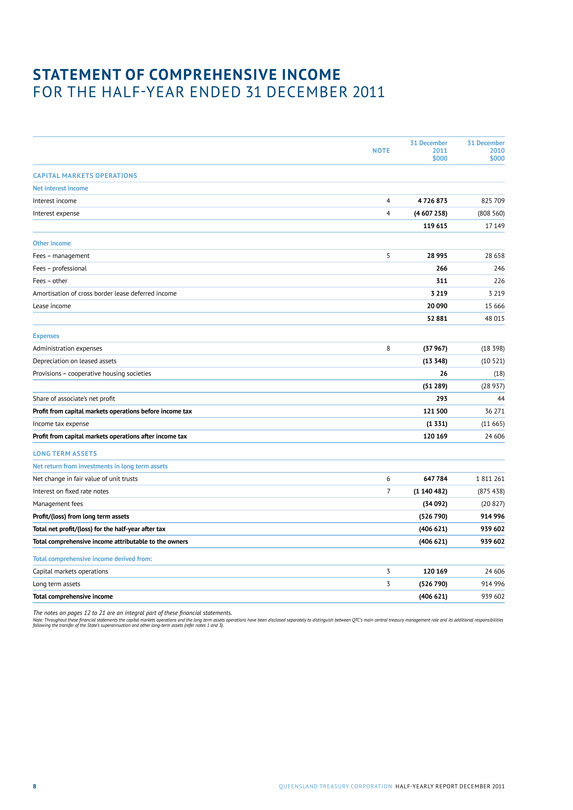
STATEMENT OF COMPREHENSIVE INCOME
FOR THE HALF-YEAR ENDED 31 DECEMBER 2011
NOTE
31 December 2011 $000
31 December 2010 $000
CAPITAL MARKETS OPERATIONS
Net interest income
Interest income 4 4 726 873 825 709
Interest expense 4 (4 607 258) (808 560)
119 615 17 149
Other income
Fees - management 5 28 995 28 658
Fees - professional 266 246
Fees - other 311 226
Amortisation of cross border lease deferred income 3 219 3 219
Lease income 20 090 15 666
52 881 48 015
Expenses
Administration expenses 8 (37 967) (18 398)
Depreciation on leased assets (13 348) (10 521)
Provisions - cooperative housing societies 26 (18)
(51 289) (28 937)
Share of associate’s net profit 293 44
Profit from capital markets operations before income tax 121 500 36 271
Income tax expense (1 331) (11 665)
Profit from capital markets operations after income tax 120 169 24 606
LONG TERM ASSETS
Net return from investments in long term assets
Net change in fair value of unit trusts 6 647 784 1 811 261
Interest on fixed rate notes 7 (1 140 482) (875 438)
Management fees (34 092) (20 827)
Profit/(loss) from long term assets (526 790) 914 996
Total net profit/(loss) for the half-year after tax (406 621) 939 602
Total comprehensive income attributable to the owners (406 621) 939 602
Total comprehensive income derived from:
Capital markets operations 3 120 169 24 606
Long term assets 3 (526 790) 914 996
Total comprehensive income (406 621) 939 602
The notes on pages 12 to 21 are an integral part of these financial statements.
Note: Throughout these financial statements the capital markets operations and the long term assets operations have been disclosed separately to distinguish between QTC’s main central treasury management role and its additional responsibilities following the transfer of the State’s superannuation and other long-term assets (refer notes 1 and 3).
8 QUEENSLAND TREASURY CORPORATION HALF-YEARLY REPORT DECEMBER 2011
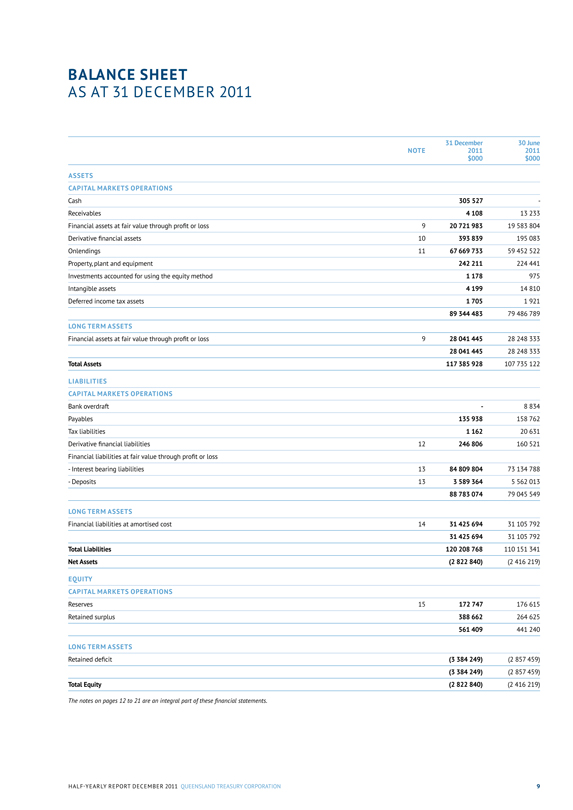
BALANCE SHEET
AS AT 31 DECEMBER 2011
NOTE
31 December 2011 $000
30 June 2011 $000
ASSETS
CAPITAL MARKETS OPERATIONS
Cash 305 527 -
Receivables 4 108 13 233
Financial assets at fair value through profit or loss 9 20 721 983 19 583 804
Derivative financial assets 10 393 839 195 083
Onlendings 11 67 669 733 59 452 522
Property, plant and equipment 242 211 224 441
Investments accounted for using the equity method 1 178 975
Intangible assets 4 199 14 810
Deferred income tax assets 1 705 1 921
89 344 483 79 486 789
LONG TERM ASSETS
Financial assets at fair value through profit or loss 9 28 041 445 28 248 333
28 041 445 28 248 333
Total Assets 117 385 928 107 735 122
LIABILITIES
CAPITAL MARKETS OPERATIONS
Bank overdraft - 8 834
Payables 135 938 158 762
Tax liabilities 1 162 20 631
Derivative financial liabilities 12 246 806 160 521
Financial liabilities at fair value through profit or loss
- Interest bearing liabilities 13 84 809 804 73 134 788
- Deposits 13 3 589 364 5 562 013
88 783 074 79 045 549
LONG TERM ASSETS
Financial liabilities at amortised cost 14 31 425 694 31 105 792
31 425 694 31 105 792
Total Liabilities 120 208 768 110 151 341
Net Assets (2 822 840) (2 416 219)
EQUITY CAPITAL MARKETS OPERATIONS
Reserves 15 172 747 176 615
Retained surplus 388 662 264 625
561 409 441 240
LONG TERM ASSETS
Retained deficit (3 384 249) (2 857 459)
(3 384 249) (2 857 459)
Total Equity (2 822 840) (2 416 219)
The notes on pages 12 to 21 are an integral part of these financial statements.
HALF-YEARLY REPORT DECEMBER 2011 QUEENSLAND TREASURY CORPORATION 9
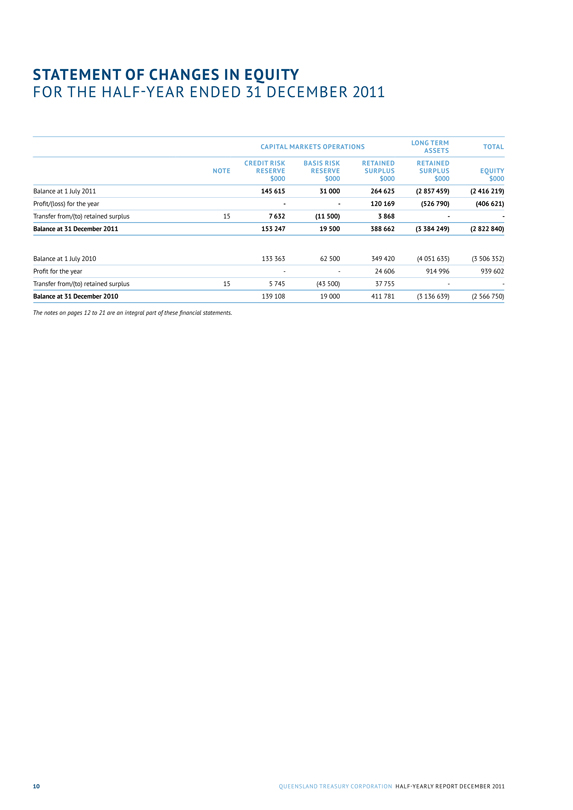
STATEMENT OF CHANGES IN EQUITY
FOR THE HALF-YEAR ENDED 31 DECEMBER 2011
CAPITAL MARKETS OPERATIONS
LONG TERM ASSETS
TOTAL
NOTE
CREDIT RISK RESERVE $000
BASIS RISK RESERVE $000
RETAINED SURPLUS $000
RETAINED SURPLUS $000
EQUITY $000
Balance at 1 July 2011 145 615 31 000 264 625 (2 857 459) (2 416 219)
Profit/(loss) for the year - - 120 169 (526 790) (406 621)
Transfer from/(to) retained surplus 15 7 632 (11 500) 3 868 - -
Balance at 31 December 2011 153 247 19 500 388 662 (3 384 249) (2 822 840)
Balance at 1 July 2010 133 363 62 500 349 420 (4 051 635) (3 506 352)
Profit for the year - - 24 606 914 996 939 602
Transfer from/(to) retained surplus 15 5 745 (43 500) 37 755 - -
Balance at 31 December 2010 139 108 19 000 411 781 (3 136 639) (2 566 750)
The notes on pages 12 to 21 are an integral part of these financial statements.
10 QUEENSLAND TREASURY CORPORATION HALF-YEARLY REPORT DECEMBER 2011
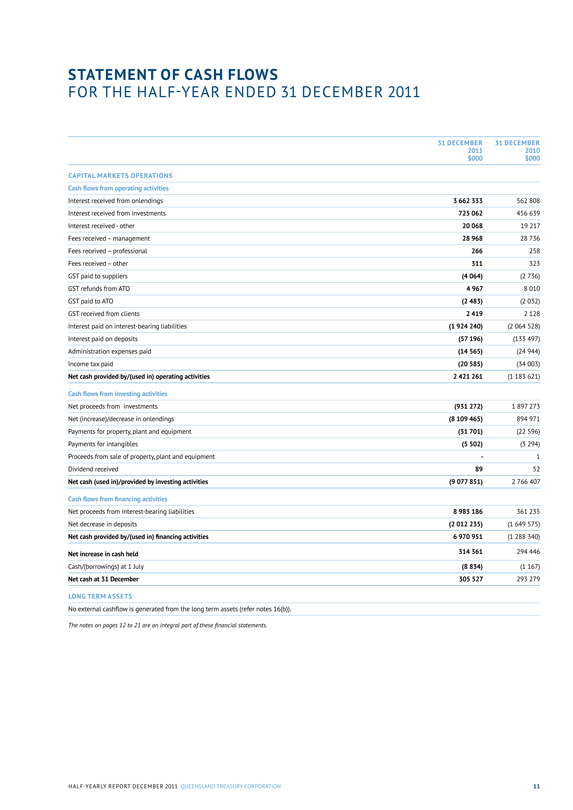
STATEMENT OF CASH FLOWS
FOR THE HALF-YEAR ENDED 31 DECEMBER 2011
31 DECEMBER 2011 $000
31 DECEMBER 2010 $000
CAPITAL MARKETS OPERATIONS
Cash flows from operating activities
Interest received from onlendings 3 662 333 562 808
Interest received from investments 725 062 456 639
Interest received-other 20 068 19 217
Fees received - management 28 968 28 736
Fees received - professional 266 258
Fees received - other 311 323
GST paid to suppliers (4 064) (2 736)
GST refunds from ATO 4 967 8 010
GST paid to ATO (2 483) (2 032)
GST received from clients 2 419 2 128
Interest paid on interest-bearing liabilities (1 924 240) (2 064 528)
Interest paid on deposits (57 196) (133 497)
Administration expenses paid (14 565) (24 944)
Income tax paid (20 585) (34 003)
Net cash provided by/(used in) operating activities 2 421 261 (1 183 621)
Cash flows from investing activities
Net proceeds from investments (931 272) 1 897 273
Net (increase)/decrease in onlendings (8 109 465) 894 971
Payments for property, plant and equipment (31 701) (22 596)
Payments for intangibles (5 502) (3 294)
Proceeds from sale of property, plant and equipment - 1
Dividend received 89 52
Net cash (used in)/provided by investing activities (9 077 851) 2 766 407
Cash flows from financing activities
Net proceeds from interest-bearing liabilities 8 983 186 361 235
Net decrease in deposits (2 012 235) (1 649 575)
Net cash provided by/(used in) financing activities 6 970 951 (1 288 340)
Net increase in cash held 314 361 294 446
Cash/(borrowings) at 1 July (8 834) (1 167)
Net cash at 31 December 305 527 293 279
LONG TERM ASSETS
No external cashflow is generated from the long term assets (refer notes 16(b)).
The notes on pages 12 to 21 are an integral part of these financial statements.
HALF-YEARLY REPORT DECEMBER 2011 QUEENSLAND TREASURY CORPORATION 11
NOTES TO AND FORMING PART OF THE FINANCIAL STATEMENTS
FOR THE HALF-YEAR ENDED 31 DECEMBER 2011
CONTENTS
1 General information 12
2 Summary of significant accounting policies 12
3 Segment reporting 14
4 Interest income and interest expense from capital markets operations 15
5 Fees - management 16
6 Net change in fair value of unit trusts 16
7 Interest on fixed rate notes 16
8 Administration fees 17
9 Financial assets at fair value through profit or loss 17
10 Derivative financial assets 18
11 Onlendings 18
12 Derivative financial liabilities 19
13 Financial liabilities at fair value through profit or loss 19
14 Financial liabilities at amortised cost 20
15 Reserves 20
16 Notes to the statement of cash flows 21
17 Contingent liabilities 21
18 Funding facilities 21
1 General information
Queensland Treasury Corporation (QTC) is constituted under the Queensland Treasury Corporation Act 1988 (the Act), with the Under Treasurer designated as the Corporation Sole under section 5 (2) of the Act.
QTC is the State’s central financing authority and corporate treasury services provider, with responsibility for providing debt funding, liability management, cash management and financial risk management advice to public sector clients. These services, which form part of QTC’s Capital Markets Operations segment, are undertaken on a cost-recovery basis with QTC lending at an interest rate based on its cost of funds and with the benefits/costs of liability and asset management being passed on to its clients being Queensland public sector entities.
The majority of QTC’s profits from its Capital Markets Operations are generated as a result of interest earned from the investment of QTC’s equity. QTC ensures that in undertaking its Capital Markets activities it has adequate capital to manage its risks.
QTC holds a portfolio of assets which were transferred to QTC by the State Government. These assets are the investments of QTC’s Long Term Assets segment and are held to fund superannuation and other long-term obligations of the State such as insurance and long service leave. In return, QTC has issued to the State fixed rate notes which has resulted in the State receiving a fixed rate of return on the notes, while QTC bears the impact of fluctuations in the value and returns on the asset portfolio (refer notes 3 and 6).
The Long Term Asset Advisory Board is responsible for the oversight of the Long Term Assets which do not form part of QTC’s day-to-day Capital Markets Operations. The Long Term Assets are held in unit trusts managed by QIC Limited (QIC).
Although there is no domestic requirement for the preparation of half-year financial statements, in order to meet offshore requirements and to better meet the needs of users of QTC’s financial information, an interim general purpose financial report has been prepared.
The half-year financial statement does not include all notes of the type normally included within the annual financial statements and therefore cannot be expected to provide as full an understanding of the financial performance, financial position and financing and investing activities of the entity as the full financial report. It should be read in conjunction with the annual financial report of QTC as at 30 June 2011.
2 Summary of significant accounting policies
(a) Basis of preparation
The half-year financial report is a general purpose financial report prepared in accordance AASB 134:
Interim Financial Reporting. Compliance with AASB 134 ensures compliance with International Financial Reporting Standard IAS 34 ‘Interim Financial Reporting’. The half-year report does not include notes of the type normally included in an annual financial report and shall be read in conjunction with the most recent annual financial report.
Compliance with International Financial Reporting Standards
While QTC is designated as a not-for-profit entity, the Corporation has elected to comply with the requirements of International Financial Reporting Standards (IFRS) as if it is a for-profit entity.
Basis of measurement
The financial statements are prepared on the basis of fair value measurement of assets and liabilities except where otherwise stated.
Functional and presentation currency
These financial statements are presented in Australian dollars, which is QTC’s functional currency.
Classification of assets and liabilities
The balance sheet is presented on a liquidity basis. Assets and liabilities are presented in decreasing order of liquidity and are not distinguished between current and non current.
(b) Investments in joint venture entity
QTC’s investment in Local Government Infrastructure Services Pty Ltd is accounted for using the equity method in the financial statements. Under the equity method, the share of the profits or losses of the joint venture is recognised in the income statement, and the share of movement in equity is recognised in the balance sheet. Investments in joint venture entities are carried at the equity accounted amount.
(c) Cash
Cash assets include only those funds held at bank and do not include money market deposits.
(d) Financial assets and financial liabilities Recognition and derecognition
Financial assets and financial liabilities are recognised in the balance sheet when QTC becomes party to the contractual provisions of the financial instrument.
A financial asset is derecognised when the contractual rights to the cash flows from the financial assets expire or are transferred and no longer controlled by QTC.
A financial liability is removed from the balance sheet when the obligation specified in the contract is discharged, cancelled or expires.
Measurement
Financial assets and liabilities at fair value through profit or loss are measured at fair value by reference to quoted market prices when available. If quoted market prices are not available, then fair values are estimated on the basis of pricing models or other recognised valuation techniques.
Fair value is the amount for which an asset could be exchanged or liability settled between knowledgeable, willing parties in an arm’s length transaction.
QTC uses mid market rates as the basis for establishing fair values of quoted financial instruments with offsetting risk positions. In general, the risk characteristics of funds borrowed, together with the financial derivatives used to manage interest rate and foreign currency risks, closely match those of funds onlent.
In all other cases, the bid-offer spread is applied where material.
12 QUEENSLAND TREASURY CORPORATION HALF-YEARLY REPORT DECEMBER 2011
Financial liabilities at amortised cost are measured using the effective interest method. The effective interest method is a method of calculating the amortised cost of a financial instrument and allocating the interest income or interest expense over the relevant period. In this way, interest is recognised in the income statement in the period in which it accrues.
Classification
Financial instruments on initial recognition are classified into the following categories:
Receivables
Onlendings
Derivative financial instruments
Financial assets at fair value through profit or loss
Financial liabilities at fair value through profit or loss, and
Financial liabilities at amortised cost.
QTC’s accounting policies for significant financial assets and financial liabilities are listed below.
Onlendings
Onlendings, with the exception of loans to cooperative housing societies, are included in the balance sheet at market or fair value which is the redemption value. Loans to cooperative housing societies are based on the balance of each housing society’s loans to its members adjusted where necessary for a specific provision for impairment.
Derivative financial instruments
QTC uses derivative financial instruments to hedge its exposure to interest rate, foreign currency and credit risks as part of asset and liability management activities. In addition they may be used to deliver long term floating rate or long term fixed rate exposure. In accordance with its treasury policy, QTC does not hold or issue derivative financial instruments for speculative purposes.
All derivatives are carried as assets when fair value is positive and as liabilities when fair value is negative.
Financial assets at fair value through profit or loss
Financial assets at fair value through profit or loss include financial assets held for Capital Markets Operations and investments held in unit trusts (Long Term Assets).
Financial assets - Capital Markets Operations
Financial assets consist of investments in money market deposits, discount securities, semi-government bonds and floating rate notes. Unrealised gains and losses are brought to account in the income statement.
Investments in unit trusts - Long Term Assets
Investments in unit trusts consist of investments held and managed by QIC and include Australian equities, international equities and other diversified products (refer note 9). These investments are measured at market value based on the hard close unit price quoted by QIC adjusted for fees outstanding on the account and net of any GST recoverable.
Financial liabilities at fair value through profit or loss
Financial liabilities at fair value through profit or loss include interest-bearing liabilities and deposits. Unrealised gains and losses are brought to account in the income statement.
Interest-bearing liabilities
Interest-bearing liabilities consist of Australian bonds, overseas bonds and commercial paper. Australian bonds include QTC’s domestic, capital indexed and public bonds. Overseas bonds include global bonds and Eurobonds. Global bonds are Australian dollar denominated bonds issued overseas. Commercial paper is short term in nature and issued on the domestic or foreign markets.
Deposits
Client deposits are accepted to either the Working Capital Facility (11AM Fund) or the Cash Fund. Income derived from the investment of these deposits accrues to depositors daily. The amount shown in the balance sheet represents the market value of deposits held at balance date.
Collateral held and securities which are sold under agreements to repurchase are disclosed as deposits.
Financial liabilities at amortised cost
Financial liabilities at amortised cost consist of fixed rate notes issued to the State Government in exchange for a portfolio of assets (Long Term Assets). The fixed rate notes are initially recognised at par value, which equated to the fair value of the financial assets acquired. Deposits and withdrawals can be made from the notes based on changes in the State Government’s long-term liabilities. The notes are long-term in nature and have a term of 50 years. Interest on the fixed rate notes is capitalised monthly and the rate is reviewed annually, consistent with the triennial actuarial assessment of the State’s defined benefit liability.
(e) Interest income and interest expense
The recognition of investment income and borrowing costs includes net realised gains/losses from the sale of investments (interest income) and the preredemption of borrowings (interest expense) together with the net unrealised
gains/losses arising from holding investments and certain onlendings (interest income) and net unrealised gains/losses from borrowings (interest expense). These unrealised gains/losses are a result of revaluing to market daily.
The majority of onlendings are provided to clients on a pooled basis. Interest costs are allocated to clients based on the daily movement in the market value of the pool.
(f) Net change in fair value of investments in unit trusts
Changes in the net market value of investments are recognised in the period in which they occur. The net market value is based on the closing unit redemption price and includes both realised and unrealised movements, net of allowances for costs expected to be incurred in realising these investments. Distributions are reinvested into the trusts.
(g) Intangible assets
Software
Acquired computer software licences are capitalised on the basis of the costs incurred to acquire and bring to use the specific software. These costs are amortised over their estimated useful lives which are between two and five years.
Costs associated with the development of internally generated software are capitalised only when the designated project is technically and commercially feasible and is expected to generate future economic benefits to QTC. The expenditure capitalised comprises all directly attributable costs including some labour costs. All other costs associated with the development of software are expensed as incurred. Subsequent costs are added to the initial costs of the asset only when they specifically meet the capitalisation criteria.
Computer software development costs recognised as assets are amortised on a straight-line basis over the period of expected benefit, which is usually between three and five years.
Impairment
The carrying amounts of QTC’s assets are reviewed at each balance sheet date to determine whether there is any indication of impairment. If any such indication exists, the asset’s recoverable amount is estimated. An impairment loss is recognised in the income statement if the carrying amount of an asset exceeds its recoverable amount. The recoverable amount is assessed as the greater of its value in use and its fair value less costs to sell.
(h) Income tax
QTC is exempt from the payment of income tax under section 50-25 of the Income Tax Assessment Act 1997 (as amended).
QTC makes a payment in lieu of income tax to the Queensland Government’s Consolidated Fund. The calculation of the income tax liability is based on the income of certain activities controlled by QTC’s Capital Markets Operations.
No income tax is payable on the Long Term Assets.
In calculating the payment in lieu of income tax expense, tax effect accounting principles are adopted for income received and expenses paid in relation to the management and administration of clients’ borrowings and deposits as well as for advisory services and structured finance transactions. For all other QTC operations on which a payment in lieu of income tax is made, tax effect accounting principles are not applied.
QTC’s controlled and jointly controlled entities are defined as State and Territory bodies under section 24AO of the Income Tax Assessment Act 1936 and as a consequence, are exempt from Commonwealth tax under section 24AM of this Act.
(i) Rounding
Amounts have been rounded to the nearest thousand dollars except for note 18 which is rounded to the nearest million dollars.
(j) Foreign currency
Foreign currency transactions are initially translated into Australian dollars at the rate of exchange applying at the date of the transaction. At balance date, amounts payable to and by QTC in foreign currencies have been valued using current exchange rates after taking into account interest rates and accrued interest.
Exchange gains/losses are brought to account in the income statement.
(k) Operating result
The operating profit after tax for the half-year ended 31 December 2011 for the Capital Markets Operations segment was $120.169 million. QTC made an operating loss of $526.790 million for the Long Term Assets segment.
The accumulated net losses incurred by the Long Term Assets segment have no impact on QTC’s capacity to meet its obligations as there is no cash flow effect for QTC (refer note 16). In addition, under the Queensland Treasury Corporation Act 1988, any losses of the Corporation shall be the responsibility of the Consolidated Fund of the Queensland Government.
HALF-YEARLY REPORT DECEMBER 2011 QUEENSLAND TREASURY CORPORATION 13
NOTES TO AND FORMING PART OF THE FINANCIAL STATEMENTS
FOR THE HALF-YEAR ENDED 31 DECEMBER 2011
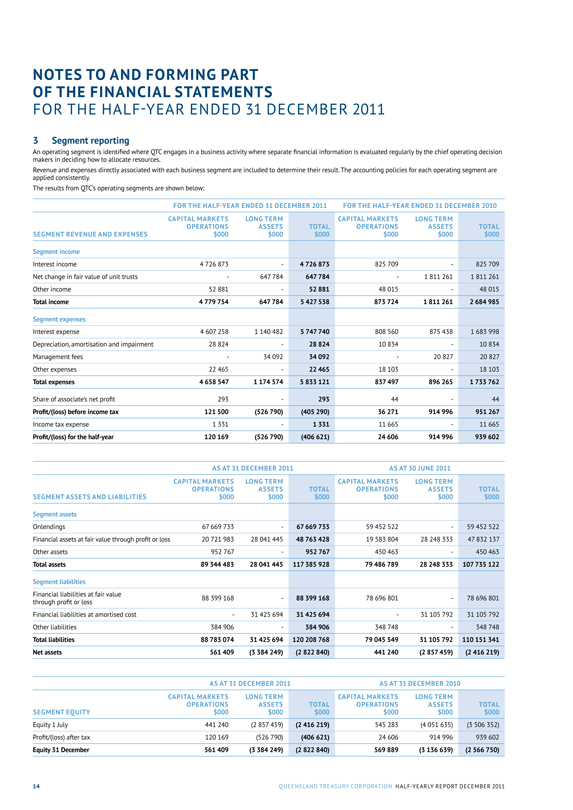
3 Segment reporting
An operating segment is identified where QTC engages in a business activity where separate financial information is evaluated regularly by the chief operating decision makers in deciding how to allocate resources.
Revenue and expenses directly associated with each business segment are included to determine their result. The accounting policies for each operating segment are applied consistently.
The results from QTCs operating segments are shown below:
FOR THE HALF-YEAR ENDED 31 DECEMBER 2011 FOR THE HALF-YEAR ENDED 31 DECEMBER 2010
SEGMENT REVENUE AND EXPENSES
CAPITAL MARKETS OPERATIONS $000
LONG TERM ASSETS $000
TOTAL $000
CAPITAL MARKETS OPERATIONS $000
LONG TERM ASSETS $000
TOTAL $000
Segment income Interest income 4 726 873 - 4 726 873 825 709 - 825 709
Net change in fair value of unit trusts - 647 784 647 784 - 1 811 261 1 811 261
Other income 52 881 - 52 881 48 015 - 48 015
Total income 4 779 754 647 784 5 427 538 873 724 1 811 261 2 684 985
Segment expenses Interest expense 4 607 258 1 140 482 5 747 740 808 560 875 438 1 683 998
Depreciation, amortisation and impairment 28 824 - 28 824 10 834 - 10 834
Management fees - 34 092 34 092 - 20 827 20 827
Other expenses 22 465 - 22 465 18 103 - 18 103
Total expenses 4 658 547 1 174 574 5 833 121 837 497 896 265 1 733 762
Share of associate’s net profit 293 - 293 44 - 44
Profit/(loss) before income tax 121 500 (526 790) (405 290) 36 271 914 996 951 267
Income tax expense 1 331 - 1 331 11 665 - 11 665
Profit/(loss) for the half-year 120 169 (526 790) (406 621) 24 606 914 996 939 602
AS AT 31 DECEMBER 2011 AS AT 30 JUNE 2011
SEGMENT ASSETS AND LIABILITIES
CAPITAL MARKETS OPERATIONS $000
LONG TERM ASSETS $000
TOTAL $000
CAPITAL MARKETS OPERATIONS $000
LONG TERM ASSETS $000
TOTAL $000
Segment assets Onlendings 67 669 733 - 67 669 733 59 452 522 - 59 452 522
Financial assets at fair value through profit or loss 20 721 983 28 041 445 48 763 428 19 583 804 28 248 333 47 832 137
Other assets 952 767 - 952 767 450 463 - 450 463
Total assets 89 344 483 28 041 445 117 385 928 79 486 789 28 248 333 107 735 122
Segment liabilities Financial liabilities at fair value through profit or loss 88 399 168 - 88 399 168 78 696 801 - 78 696 801
Financial liabilities at amortised cost - 31 425 694 31 425 694 - 31 105 792 31 105 792
Other liabilities 384 906 - 384 906 348 748 - 348 748
Total liabilities 88 783 074 31 425 694 120 208 768 79 045 549 31 105 792 110 151 341
Net assets 561 409 (3 384 249) (2 822 840) 441 240 (2 857 459) (2 416 219)
AS AT 31 DECEMBER 2011 AS AT 31 DECEMBER 2010
SEGMENT EQUITY
CAPITAL MARKETS OPERATIONS $000
LONG TERM ASSETS $000
TOTAL $000
CAPITAL MARKETS OPERATIONS $000
LONG TERM ASSETS $000
TOTAL $000
Equity 1 July 441 240 (2 857 459) (2 416 219) 545 283 (4 051 635) (3 506 352)
Profit/(loss) after tax 120 169 (526 790) (406 621) 24 606 914 996 939 602
Equity 31 December 561 409 (3 384 249) (2 822 840) 569 889 (3 136 639) (2 566 750)
14 QUEENSLAND TREASURY CORPORATION HALF-YEARLY REPORT DECEMBER 2011
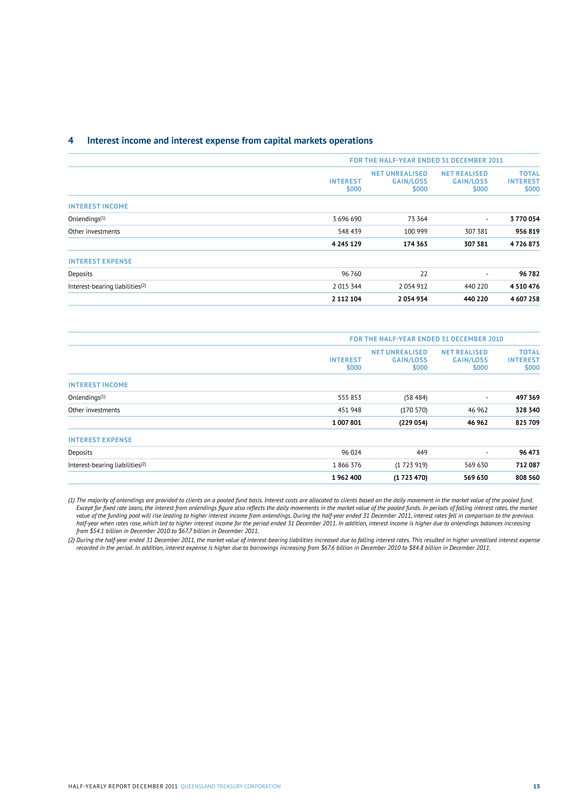
4 Interest income and interest expense from capital markets operations
FOR THE HALF-YEAR ENDED 31 DECEMBER 2011
INTEREST $000
NET UNREALISED GAIN /LOSS $000
NET REALISED GAIN /LOSS $000
TOTAL INTEREST $000
INTEREST INCOME Onlendings(1) 3 696 690 73 364 - 3 770 054
Other investments 548 439 100 999 307 381 956 819
4 245 129 174 363 307 381 4 726 873
INTEREST EXPENSE Deposits 96 760 22 - 96 782
Interest-bearing liabilities(2) 2 015 344 2 054 912 440 220 4 510 476
2 112 104 2 054 934 440 220 4 607 258
FOR THE HALF-YEAR ENDED 31 DECEMBER 2010
INTEREST $000
NET UNREALISED GAIN /LOSS $000
NET REALISED GAIN /LOSS $000
TOTAL INTEREST $000
INTEREST INCOME Onlendings(1) 555 853 (58 484) - 497 369
Other investments 451 948 (170 570) 46 962 328 340
1 007 801 (229 054) 46 962 825 709
INTEREST EXPENSE Deposits 96 024 449 - 96 473
Interest-bearing Liabilities(2) 1 866 376 (1 723 919) 569 630 712 087
1 962 400 (1 723 470) 569 630 808 560
(1) The majority of onlendings are provided to clients on a pooled fund basis. Interest costs are allocated to clients based on the daily movement in the market value of the pooled fund. Except for fixed rate loans, the interest from onlendings figure also reflects the daily movements in the market value of the pooled funds. In periods of falling interest rates, the market value of the funding pool will rise leading to higher interest income from onlendings. During the half-year ended 31 December 2011, interest rates fell in comparison to the previous half-year when rates rose, which led to higher interest income for the period ended 31 December 2011. In addition, interest income is higher due to onlendings balances increasing from $54.1 billion in December 2010 to $67.7 billion in December 2011.
(2) During the half-year ended 31 December 2011, the market value of interest-bearing liabilities increased due to falling interest rates. This resulted in higher unrealised interest expense recorded in the period. In addition, interest expense is higher due to borrowings increasing from $67.6 billion in December 2010 to $84.8 billion in December 2011.
HALF-YEARLY REPORT DECEMBER 2011 QUEENSLAND TREASURY CORPORATION 15
NOTES TO AND FORMING PART
OF THE FINANCIAL STATEMENTS
FOR THE HALF-YEAR ENDED 31 DECEMBER 2011
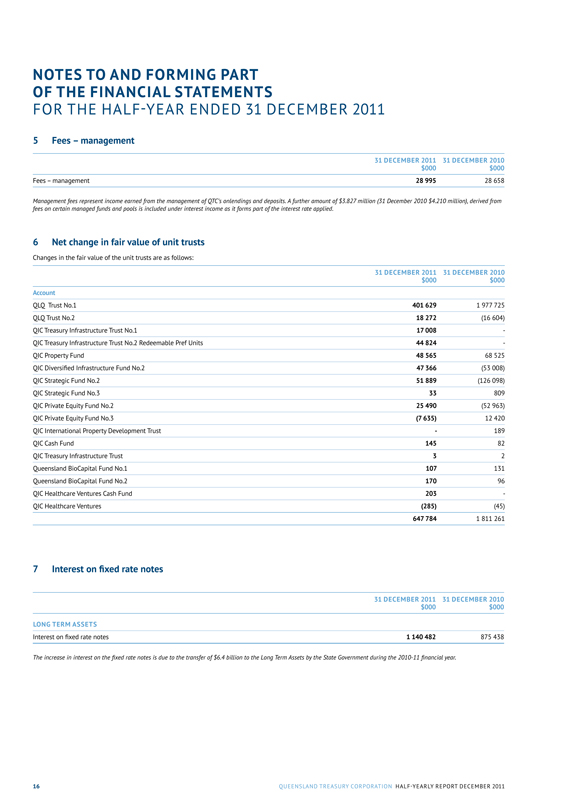
5 Fees - management
31 DECEMBER 2011 31 DECEMBER 2010 $000 $000
Fees - management 28 995 28 658
Management fees represent income earned from the management of QTC’s onlendings and deposits. A further amount of $3,827 million (31 December 2010 $4,210 million), derived from fees on certain managed funds and pools is included under interest income as it forms part of the interest rate applied.
6 Net change in fair value of unit trusts
Changes in the fair value of the unit trusts are as follows:
31 DECEMBER 2011 31 DECEMBER 2010
$000 $000
Account
QLQ Trust No.l 401 629 1 977 725
QLQ Trust No.2 18 272 (16 604)
QIC Treasury Infrastructure Trust No.l 17 008 -
QIC Treasury Infrastructure Trust No.2
Redeemable Pref Units 44 824 -
QIC Property Fund 48 565 68 525
QIC Diversified Infrastructure Fund No.2 47 366 (53 008)
QIC Strategic Fund No.2 51 889 (126 098)
QIC Strategic Fund No.3 33 809
QIC Private Equity Fund No.2 25 490 (52 963)
QIC Private Equity Fund No.3 (7 635) 12 420
QIC International Property Development Trust - 189
QIC Cash Fund 145 82
QIC Treasury Infrastructure Trust 3 2
Queensland BioCapital Fund No.l 107 131
Queensland BioCapital Fund No.2 170 96
QIC Healthcare Ventures Cash Fund 203 -
QIC Healthcare Ventures (285) (45)
647 784 1 811 261
7 Interest on fixed rate notes
31 DECEMBER 2011 31 DECEMBER 2010
$000 $000
LONG TERM ASSETS
Interest on fixed rate notes 1140 482 875 438
The increase in interest on the fixed rate notes is due to the transfer of $6.4 billion to the Long Term Assets by the State Government during the 2010-11 financial year.
16 QUEENSLAND TREASURY CORPORATION HALF-YEARLY REPORT DECEMBER 2011
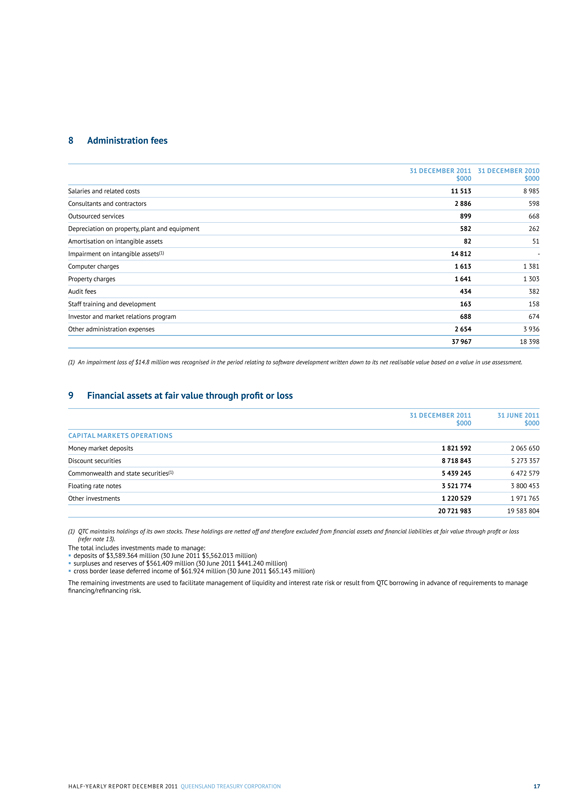
8 Administration fees
31 DECEMBER 2011 31 DECEMBER 2010 $000 $000
Salaries and related costs 11 513 8 985
Consultants and contractors 2 886 598
Outsourced services 899 668
Depreciation on property, plant and equipment 582 262
Amortisation on intangible assets 82 51
Impairment on intangible assets(1) 14 812 -
Computer charges 1 613 1 381
Property charges 1 641 1 303
Audit fees 434 382
Staff training and development 163 158
Investor and market relations program 688 674
Other administration expenses 2 654 3 936
37 967 18 398
(1) An impairment loss of $14.8 million was recognised in the period relating to software development written down to its net realisable value based on a value in use assessment.
9 Financial assets at fair value through profit or loss
31 DECEMBER 2011 31 JUNE 2011
$000 $000
CAPITAL MARKETS OPERATIONS
Money market deposits 1 821 592 2 065 650
Discount securities 8 718 843 5 273 357
Commonwealth and state securities(1) 5 439 245 6 472 579
Floating rate notes 3 521 774 3 800 453
Other investments 1 220 529 1 971 765
20 721 983 19 583 804
(1) QTC maintains holdings of its own stocks. These holdings are netted off and therefore excluded from financial assets and financial liabilities at fair value through profit or loss
(refer note 13).
The total includes investments made to manage:
* deposits of $3,589.364 million (30 June 2011 $5,562.013 million)
* surpluses and reserves of $561.409 million (30 June 2011 $441.240 million)
* cross border lease deferred income of $61.924 million (30 June 2011 $65.143 million)
The remaining investments are used to facilitate management of liquidity and interest rate risk or result from QTC borrowing in advance of requirements to manage financing/refinancing risk.
HALF-YEARLY REPORT DECEMBER 2011 QUEENSLAND TREASURY CORPORATION 17
NOTES TO AND FORMING PART OF THE FINANCIAL STATEMENTS
FOR THE HALF-YEAR ENDED 31 DECEMBER 2011
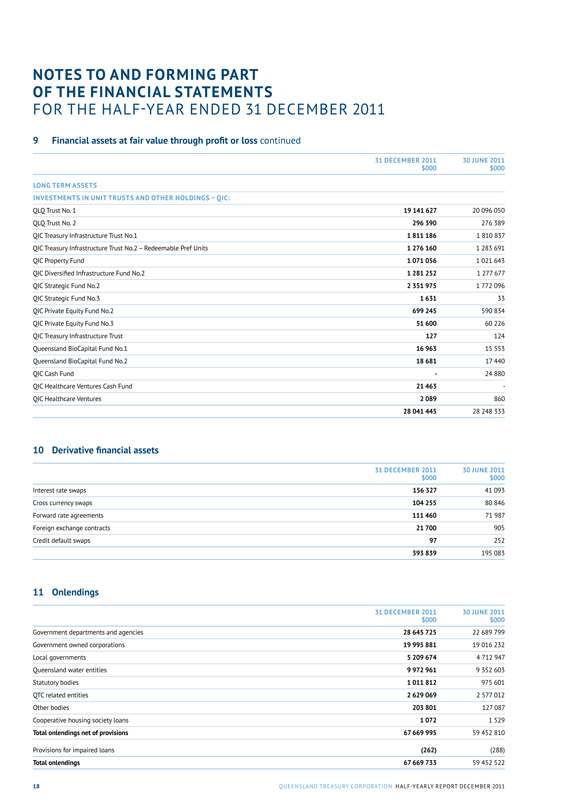
9 Financial assets at fair value through profit or loss continued
31 DECEMBER 2011 30 JUNE 2011
$000 $000
LONG TERM ASSETS
INVESTMENTS IN UNIT TRUSTS AND OTHER HOLDINGS - QIC:
QLQ Trust No. 1 19 141 627 20 096 050
QLQ Trust No. 2 296 390 276 389
QIC Treasury Infrastructure Trust No.1 1 811 186 1 810 837
QIC Treasury Infrastructure Trust No.2 - Redeemable Pref Units 1 276 160 1 283 691
QIC Property Fund 1 071 056 1 021 643
QIC Diversified Infrastructure Fund No.2 1 281 252 1 277 677
QIC Strategic Fund No.2 2 351 975 1 772 096
QIC Strategic Fund No.3 1 631 33
QIC Private Equity Fund No.2 699 245 590 834
QIC Private Equity Fund No.3 51 600 60 226
QIC Treasury Infrastructure Trust 127 124
Queensland BioCapital Fund No.1 16 963 15 553
Queensland BioCapital Fund No.2 18 681 17 440
QIC Cash Fund - 24 880
QIC Healthcare Ventures Cash Fund 21 463 -
QIC Healthcare Ventures 2 089 860
28 041 445 28 248 333
10 Derivative financial assets
31 DECEMBER 2011 30 JUNE 2011
$000 $000
Interest rate swaps 156 327 41 093
Cross currency swaps 104 255 80 846
Forward rate agreements 111 460 71 987
Foreign exchange contracts 21 700 905
Credit default swaps 97 252
393 839 195 083
11 Onlendings
31 DECEMBER 2011 30 JUNE 2011
$000 $000
Government departments and agencies 28 645 725 22 689 799
Government owned corporations 19 995 881 19 016 232
Local governments 5 209 674 4 712 947
Queensland water entities 9 972 961 9 352 603
Statutory bodies 1 011 812 975 601
QTC related entities 2 629 069 2 577 012
Other bodies 203 801 127 087
Cooperative housing society loans 1 072 1 529
Total onlendings net of provisions 67 669 995 59 452 810
Provisions for impaired loans (262) (288)
Total onlendings 67 669 733 59 452 522
18 QUEENSLAND TREASURY CORPORATION HALF-YEARLY REPORT DECEMBER 2011
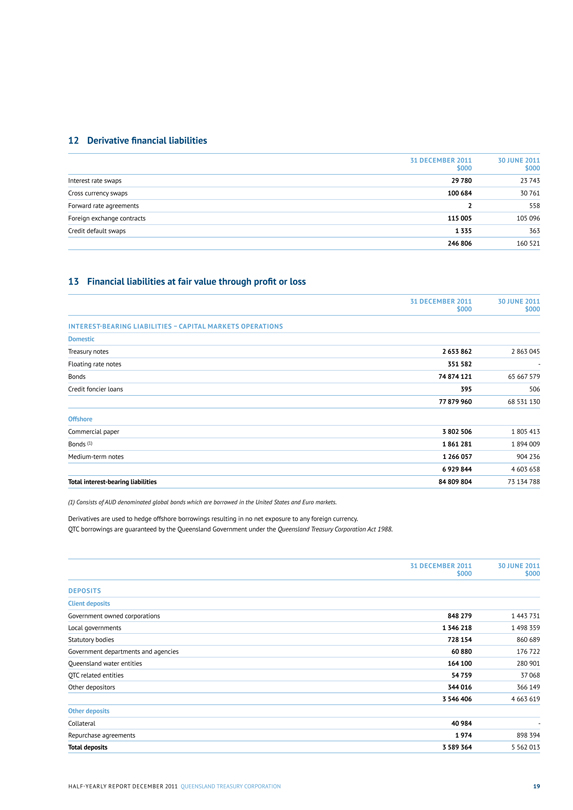
12 Derivative financial liabilities
31 DECEMBER 2011 30 JUNE 2011
$000 $000
Interest rate swaps 29 780 23 743
Cross currency swaps 100 684 30 761
Forward rate agreements 2 558
Foreign exchange contracts 115 005 105 096
Credit default swaps 1 335 363
246 806 160 521
13 Financial liabilities at fair value through profit or loss
31 DECEMBER 2011 30 JUNE 2011
$000 $000
INTEREST-BEARING LIABILITIES - CAPITAL MARKETS OPERATIONS
Domestic
Treasury notes 2 653 862 2 863 045
Floating rate notes 351 582 -
Bonds 74 874 121 65 667 579
Credit foncier loans 395 506
77 879 960 68 531 130
Offshore
Commercial paper 3 802 506 1 805 413
Bonds (1) 1 861 281 1 894 009
Medium-term notes 1 266 057 904 236
6 929 844 4 603 658
Total interest-bearing liabilities 84 809 804 73 134 788
(1) Consists of AUD denominated global bonds which are borrowed in the United States and Euro markets.
Derivatives are used to hedge offshore borrowings resulting in no net exposure to any foreign currency.
QTC borrowings are guaranteed by the Queensland Government under the Queensland Treasury Corporation Act 1988.
31 DECEMBER 2011 30 JUNE 2011
$000 $000
DEPOSITS
Client deposits
Government owned corporations 848 279 1 443 731
Local governments 1 346 218 1 498 359
Statutory bodies 728 154 860 689
Government departments and agencies 60 880 176 722
Queensland water entities 164 100 280 901
QTC related entities 54 759 37 068
Other depositors 344 016 366 149
3 546 406 4 663 619
Other deposits
Collateral 40 984 -
Repurchase agreements 1 974 898 394
Total deposits 3 589 364 5 562 013
HALF-YEARLY REPORT DECEMBER 2011 QUEENSLAND TREASURY CORPORATION 19
NOTES TO AND FORMING PART OF THE FINANCIAL STATEMENTS
FOR THE HALF-YEAR ENDED 31 DECEMBER 2011
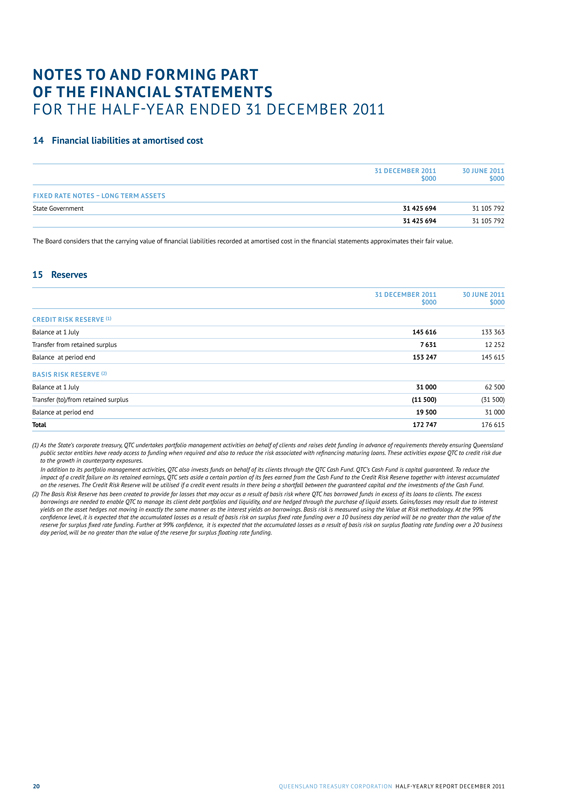
14 Financial liabilities at amortised cost
31 DECEMBER 2011 $000 30 JUNE 2011 $000
FIXED RATE NOTES - LONG TERM ASSETS State Government 31 425 694 31 105 792
31 425 694 31 105 792
The Board considers that the carrying value of financial liabilities recorded at amortised cost in the financial statements approximates their fair value.
15 Reserves
31 DECEMBER 2011 $000 30 JUNE 2011 $000
CREDIT RISK RESERVE (1) Balance at 1 July 145 616 133 363
Transfer from retained surplus 7 631 12 252
Balance at period end 153 247 145 615
BASIS RISK RESERVE(2) Balance at 1 July 31 000 62 500
Transfer (to)/from retained surplus (11 500) (31 500)
Balance at period end 19 500 31 000
Total 172 747 176 615
(1) As the State’s corporate treasury, QTC undertakes portfolio management activities on behalf of clients and raises debt funding in advance of requirements thereby ensuring Queensland public sector entities have ready access to funding when required and also to reduce the risk associated with refinancing maturing loans. These activities expose QTC to credit risk due to the growth in counterparty exposures.
In addition to its portfolio management activities, QTC also invests funds on behalf of its clients through the QTC Cash Fund. QTC’s Cash Fund is capital guaranteed. To reduce the impact of a credit failure on its retained earnings, QTC sets aside a certain portion of its fees earned from the Cash Fund to the Credit Risk Reserve together with interest accumulated on the reserves. The Credit Risk Reserve will be utilised if a credit event results in there being a shortfall between the guaranteed capital and the investments of the Cash Fund.
(2) The Basis Risk Reserve has been created to provide for losses that may occur as a result of basis risk where QTC has borrowed funds in excess of its loans to clients. The excess borrowings are needed to enable QTC to manage its client debt portfolios and liquidity, and are hedged through the purchase of liquid assets. Gains/losses may result due to interest yields on the asset hedges not moving in exactly the same manner as the interest yields on borrowings. Basis risk is measured using the Value at Risk methodology. At the 99% confidence level, it is expected that the accumulated losses as a result of basis risk on surplus fixed rate funding over a 10 business day period will be no greater than the value of the reserve for surplus fixed rate funding. Further at 99% confidence, it is expected that the accumulated losses as a result of basis risk on surplus floating rate funding over a 20 business day period, will be no greater than the value of the reserve for surplus floating rate funding.
20 QUEENSLAND TREASURY CORPORATION HALF-YEARLY REPORT DECEMBER 2011
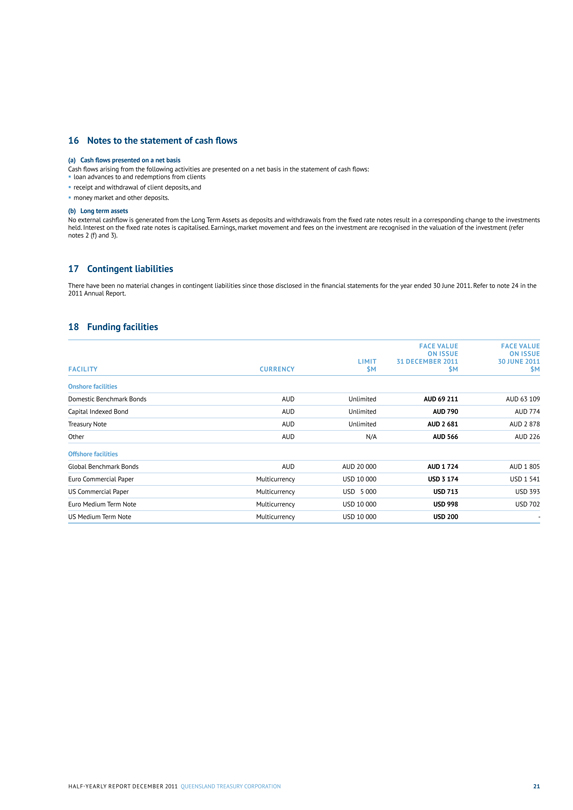
16 Notes to the statement of cash flows
(a) Cash flows presented on a net basis
Cash flows arising from the following activities are presented on a net basis in the statement of cash flows:
loan advances to and redemptions from clients
receipt and withdrawal of client deposits, and
money market and other deposits.
(b) Long term assets
No external cashflow is generated from the Long Term Assets as deposits and withdrawals from the fixed rate notes result in a corresponding change to the investments held. Interest on the fixed rate notes is capitalised. Earnings, market movement and fees on the investment are recognised in the valuation of the investment (refer notes 2 (f) and 3).
17 Contingent liabilities
There have been no material changes in contingent liabilities since those disclosed in the financial statements for the year ended 30 June 2011. Refer to note 24 in the 2011 Annual Report.
18 Funding facilities
FACILITY
CURRENCY
LIMIT $M
FACE VALUE ON ISSUE 31 DECEMBER 2011 $M
FACE VALUE ON ISSUE 30 JUNE 2011 $M
Onshore facilities Domestic Benchmark Bonds AUD Unlimited AUD 69 211 AUD 63 109
Capital Indexed Bond AUD Unlimited AUD 790 AUD 774
Treasury Note AUD Unlimited AUD 2 681 AUD 2 878
Other AUD N/A AUD 566 AUD 226
Offshore facilities Global Benchmark Bonds AUD AUD 20 000 AUD 1 724 AUD 1 805
Euro Commercial Paper Multicurrency USD 10 000 USD 3 174 USD 1 541
US Commercial Paper Multicurrency USD 5 000 USD 713 USD 393
Euro Medium Term Note Multicurrency USD 10 000 USD 998 USD 702
US Medium Term Note Multicurrency USD 10 000 USD 200 -
HALF-YEARLY REPORT DECEMBER 2011 QUEENSLAND TREASURY CORPORATION 21
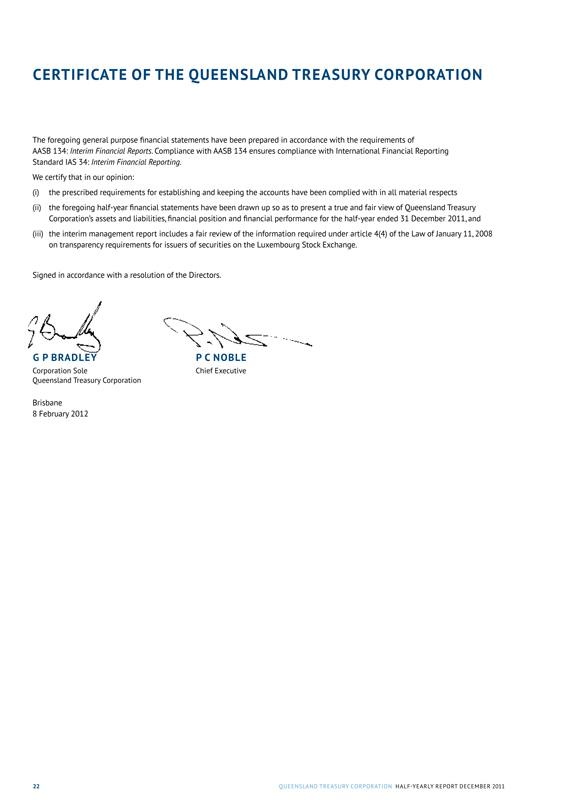
CERTIFICATE OF THE OUEENSLAND TREASURY CORPORATION
The foregoing general purpose financial statements have been prepared in accordance with the requirements of AASB 134: Interim Financial Reports. Compliance with AASB 134 ensures compliance with International Financial Reporting Standard IAS 34: Interim Financial Reporting.
We certify that in our opinion:
(i) the prescribed requirements for establishing and keeping the accounts have been complied with in all material respects
(ii) the foregoing half-year financial statements have been drawn up so as to present a true and fair view of Queensland Treasury Corporation’s assets and liabilities, financial position and financial performance for the half-year ended 31 December 2011, and
(iii) the interim management report includes a fair review of the information required under article 4(4) of the Law of January 11, 2008 on transparency requirements for issuers of securities on the Luxembourg Stock Exchange.
Signed in accordance with a resolution of the Directors.
G P BRADLEY
Corporation Sole
Queensland Treasury Corporation
P C NOBLE
Chief Executive
Brisbane
8 February 2012
22 QUEENSLAND TREASURY CORPORATION HALF-YEARLY REPORT DECEMBER 2011
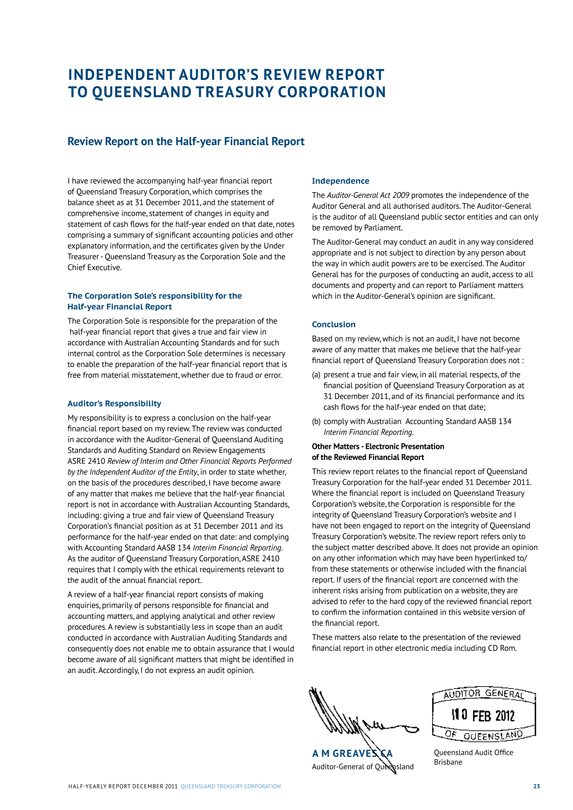
INDEPENDENT AUDITOR’S REVIEW REPORT TO OUEENSLAND TREASURY CORPORATION
Review Report on the Half-year Financial Report
I have reviewed the accompanying half-year financial report of Queensland Treasury Corporation, which comprises the balance sheet as at 31 December 2011, and the statement of comprehensive income, statement of changes in equity and statement of cash flows for the half-year ended on that date, notes comprising a summary of significant accounting policies and other explanatory information, and the certificates given by the Under Treasurer - Queensland Treasury as the Corporation Sole and the Chief Executive.
The Corporation Sole’s responsibility for the Half-year Financial Report
The Corporation Sole is responsible for the preparation of the half-year financial report that gives a true and fair view in accordance with Australian Accounting Standards and for such internal control as the Corporation Sole determines is necessary to enable the preparation of the half-year financial report that is free from material misstatement, whether due to fraud or error.
Auditor’s Responsibility
My responsibility is to express a conclusion on the half-year financial report based on my review. The review was conducted in accordance with the Auditor-General of Queensland Auditing Standards and Auditing Standard on Review Engagements ASRE 2410 Review of Interim and Other Financial Reports Performed by the Independent Auditor of the Entity, in order to state whether, on the basis of the procedures described, I have become aware of any matter that makes me believe that the half-year financial report is not in accordance with Australian Accounting Standards, including: giving a true and fair view of Queensland Treasury Corporation’s financial position as at 31 December 2011 and its performance for the half-year ended on that date: and complying with Accounting Standard AASB 134 Interim Financial Reporting. As the auditor of Queensland Treasury Corporation, ASRE 2410 requires that I comply with the ethical requirements relevant to the audit of the annual financial report.
A review of a half-year financial report consists of making enquiries, primarily of persons responsible for financial and accounting matters, and applying analytical and other review procedures. A review is substantially less in scope than an audit conducted in accordance with Australian Auditing Standards and consequently does not enable me to obtain assurance that I would become aware of all significant matters that might be identified in an audit. Accordingly, I do not express an audit opinion.
Independence
The Auditor-General Act 2009 promotes the independence of the Auditor General and all authorised auditors. The Auditor-General is the auditor of all Queensland public sector entities and can only be removed by Parliament.
The Auditor-General may conduct an audit in anyway considered appropriate and is not subject to direction by any person about the way in which audit powers are to be exercised. The Auditor General has for the purposes of conducting an audit, access to all documents and property and can report to Parliament matters which in the Auditor-General’s opinion are significant.
Conclusion
Based on my review, which is not an audit, I have not become aware of any matter that makes me believe that the half-year financial report of Queensland Treasury Corporation does not:
(a) present a true and fair view, in all material respects, of the financial position of Queensland Treasury Corporation as at 31 December 2011, and of its financial performance and its cash flows for the half-year ended on that date;
(b) comply with Australian Accounting Standard AASB 134 Interim Financial Reporting.
Other Matters - Electronic Presentation of the Reviewed Financial Report
This review report relates to the financial report of Queensland Treasury Corporation for the half-year ended 31 December 2011. Where the financial report is included on Queensland Treasury Corporation’s website, the Corporation is responsible for the integrity of Queensland Treasury Corporation’s website and I have not been engaged to report on the integrity of Queensland Treasury Corporation’s website. The review report refers only to the subject matter described above. It does not provide an opinion on any other information which may have been hyperlinked to/ from these statements or otherwise included with the financial report. If users of the financial report are concerned with the inherent risks arising from publication on a website, they are advised to refer to the hard copy of the reviewed financial report to confirm the information contained in this website version of the financial report.
These matters also relate to the presentation of the reviewed financial report in other electronic media including CD Rom.
AUDITOR GENERAL
10 FEB 2012
OF QUEENSLAND
A M GREAVES CA
Auditor-General of Queensland
Queensland Audit Office
Brisbane
HALF-YEARLY REPORT DECEMBER 2011 QUEENSLAND TREASURY CORPORATION 23
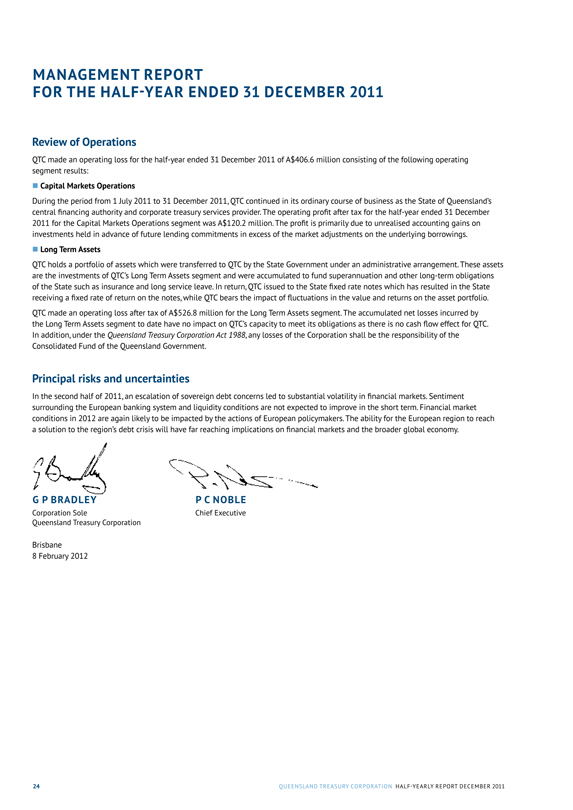
MANAGEMENT REPORT
FOR THE HALF-YEAR ENDED 31 DECEMBER 2011
Review of Operations
QTC made an operating loss for the half-year ended 31 December 2011 of A$406.6 million consisting of the following operating segment results:
Capital Markets Operations
During the period from 1 July 2011 to 31 December 2011, QTC continued in its ordinary course of business as the State of Queensland’s central financing authority and corporate treasury services provider. The operating profit after tax for the half-year ended 31 December 2011 for the Capital Markets Operations segment was A$120.2 million. The profit is primarily due to unrealised accounting gains on investments held in advance of future lending commitments in excess of the market adjustments on the underlying borrowings.
Long Term Assets
QTC holds a portfolio of assets which were transferred to QTC by the State Government under an administrative arrangement. These assets are the investments of QTC’s Long Term Assets segment and were accumulated to fund superannuation and other long-term obligations of the State such as insurance and long service leave. In return, QTC issued to the State fixed rate notes which has resulted in the State receiving a fixed rate of return on the notes, while QTC bears the impact of fluctuations in the value and returns on the asset portfolio.
QTC made an operating loss after tax of A$526.8 million for the Long Term Assets segment. The accumulated net losses incurred by the Long Term Assets segment to date have no impact on QTC’s capacity to meet its obligations as there is no cash flow effect for QTC.
In addition, under the Queensland Treasury Corporation Act 1988, any losses of the Corporation shall be the responsibility of the Consolidated Fund of the Queensland Government.
Principal risks and uncertainties
In the second half of 2011, an escalation of sovereign debt concerns led to substantial volatility in financial markets. Sentiment surrounding the European banking system and liquidity conditions are not expected to improve in the short term. Financial market conditions in 2012 are again likely to be impacted by the actions of European policymakers. The ability for the European region to reach a solution to the region’s debt crisis will have far reaching implications on financial markets and the broader global economy.
G P BRADLEY
Corporation Sole
Queensland Treasury Corporation
Brisbane
8 February 2012
P C NOBLE
Chief Executive
24 QUEENSLAND TREASURY CORPORATION HALF-YEARLY REPORT DECEMBER 2011
AUDAX AT FIDELIS
QUEENSLAND
TREASURY
CORPORATION
APPENDICES
CONTENTS
Appendix A – Loans to clients 26
Appendix B – QTC’s 2011-12 indicative borrowing program 30
Appendix C – Glossary 31
Appendix D – Contacts 32
25
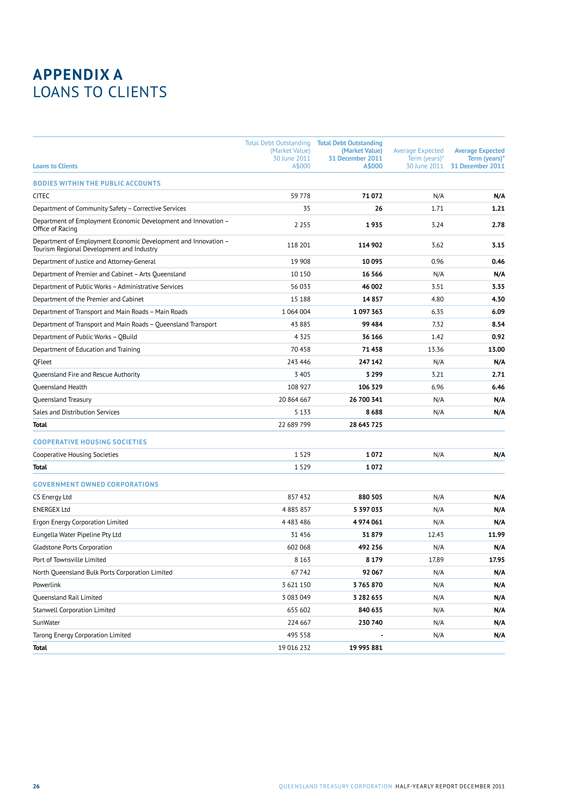
APPENDIX A
LOANS TO CLIENTS
Total Debt Outstanding Total Debt Outstanding
(Market Value) (Market Value) Average Expected Average Expected
30 June 2011 31 December 2011 Term (years)* Term (years)*
Loans to Clients A$000 A$000 30 June 2011 31 December 2011
BODIES WITHIN THE PUBLIC ACCOUNTS
CITEC 59 778 71 072 N/A N/A
Department of Community Safety – Corrective Services 35 26 1.71 1.21
Department of Employment Economic Development and Innovation – 2 255 1 935 3.24 2.78
Office of Racing
Department of Employment Economic Development and Innovation – 118 201 114 902 3.62 3.15
Tourism Regional Development and Industry
Department of Justice and Attorney-General 19 908 10 095 0.96 0.46
Department of Premier and Cabinet – Arts Queensland 10 150 16 566 N/A N/A
Department of Public Works – Administrative Services 56 033 46 002 3.51 3.35
Department of the Premier and Cabinet 15 188 14 857 4.80 4.30
Department of Transport and Main Roads – Main Roads 1 064 004 1 097 363 6.35 6.09
Department of Transport and Main Roads – Queensland Transport 43 885 99 484 7.32 8.54
Department of Public Works – QBuild 4 325 36 166 1.42 0.92
Department of Education and Training 70 458 71 458 13.36 13.00
QFleet 243 446 247 142 N/A N/A
Queensland Fire and Rescue Authority 3 405 3 299 3.21 2.71
Queensland Health 108 927 106 329 6.96 6.46
Queensland Treasury 20 864 667 26 700 341 N/A N/A
Sales and Distribution Services 5 133 8 688 N/A N/A
Total 22 689 799 28 645 725
COOPERATIVE HOUSING SOCIETIES
Cooperative Housing Societies 1 529 1 072 N/A N/A
Total 1 529 1 072
GOVERNMENT OWNED CORPORATIONS
CS Energy Ltd 857 432 880 505 N/A N/A
ENERGEX Ltd 4 885 857 5 397 033 N/A N/A
Ergon Energy Corporation Limited 4 483 486 4 974 061 N/A N/A
Eungella Water Pipeline Pty Ltd 31 456 31 879 12.43 11.99
Gladstone Ports Corporation 602 068 492 256 N/A N/A
Port of Townsville Limited 8 163 8 179 17.89 17.95
North Queensland Bulk Ports Corporation Limited 67 742 92 067 N/A N/A
Powerlink 3 621 150 3 765 870 N/A N/A
Queensland Rail Limited 3 083 049 3 282 655 N/A N/A
Stanwell Corporation Limited 655 602 840 635 N/A N/A
SunWater 224 667 230 740 N/A N/A
Tarong Energy Corporation Limited 495 558 - N/A N/A
Total 19 016 232 19 995 881
26 QUEENSLAND TREASURY CORPORATION HALF-YEARLY REPORT DECEMBER 2011
Loans to Clients
Total Debt Outstanding
(Market Value)
30 June 2011
A$000
Total Debt Outstanding
(Market Value)
31 December 2011
A$000
Average Expected
Term (years)*
30 June 2011
Average Expected
Term (years)*
31 December 2011
LOCAL GOVERNMENTS
Balonne Shire Council 1 596 1 559 9.39 9.10
Banana Shire Council 12 662 12 878 15.86 15.39
Barcaldine Regional Council 1 557 1 555 14.17 14.18
Barcoo Shire Council 70 62 3.89 3.37
Blackall Tambo Regional Council 3 386 3 323 7.90 7.45
Brisbane City Council 1 215 806 1 542 493 13.99 13.99
Bulloo Shire Council 1 162 1 105 5.82 5.34
Bundaberg Regional Council 56 238 56 064 11.96 11.76
Burdekin Shire Council 8 976 8 212 6.34 6.16
Cairns Regional Council 101 324 104 095 16.47 16.18
Carpentaria Shire Council 5 469 5 598 17.04 16.56
Cassowary Coast Regional Council 31 518 31 215 N/A 13.80
Central Highlands Regional Council 34 485 35 226 N/A N/A
Charters Towers Regional Council 325 292 3.92 3.41
Cloncurry Shire Council 12 094 12 203 17.98 17.76
Cook Shire Council 4 329 8 913 13.32 12.92
Diamantina Shire Council 2 053 1 955 6.59 6.20
Etheridge Shire Council 2 800 2 647 5.76 5.34
Fraser Coast Regional Council 113 142 127 362 N/A N/A
Gladstone Regional Council 126 635 130 038 17.22 15.93
Gold Coast City Council 785 457 804 368 N/A N/A
Goondiwindi Regional Council 1 881 1 894 16.52 16.33
Gympie Regional Council 28 107 29 022 17.93 17.41
Ipswich City Council 357 310 369 395 N/A N/A
Isaac Regional Council 12 454 12 929 19.39 18.71
Local Government Association of Queensland 1 734 1 645 N/A 6.27
Lockyer Valley Regional Council 436 384 6.18 6.36
Logan City Council 108 409 111 229 N/A 14.99
Longreach Regional Council 5 785 5 979 16.21 15.82
Mackay Regional Council 193 496 198 727 16.92 16.11
Maranoa Regional Council 11 765 11 563 11.60 11.61
McKinlay Shire Council 2 937 2 403 4.45 3.61
Moreton Bay Regional Council 354 411 364 992 16.75 16.29
Mount Isa City Council 19 403 20 017 18.00 17.45
Murweh Shire Council 5 777 5 652 9.67 9.54
North Burnett Regional Council 3 997 3 900 8.75 8.39
Paroo Shire Council 2 198 2 268 15.02 14.71
Redland City Council 60 337 61 198 12.35 11.96
Richmond Shire Council 1 999 1 802 7.65 3.18
Rockhampton Regional Council 199 112 198 294 11.01 10.76
Scenic Rim Regional Council 4 986 4 698 15.40 15.41
Somerset Regional Council - 19 796 N/A N/A
South Burnett Regional Council 10 113 9 588 13.23 12.87
Southern Downs Regional Council 23 894 24 172 14.86 14.34
Sunshine Coast Regional Council 209 580 212 536 12.02 11.71
Tablelands Regional Council 9 400 9 496 16.29 16.01
Toowoomba Regional Council 93 749 155 108 N/A N/A
Torres Shire Council 2 299 2 245 10.93 10.77
Torres Strait Island Regional Council 557 557 10.59 10.09
Townsville City Council 403 703 413 622 N/A N/A
Western Downs Regional Council 22 657 23 259 16.37 15.89
Whitsunday Regional Council 35 932 36 593 16.39 16.04
Winton Shire Council 3 445 3 549 15.46 15.11
Total 4 712 947 5 209 674
HALF-YEARLY REPORT DECEMBER 2011 QUEENSLAND TREASURY CORPORATION 27
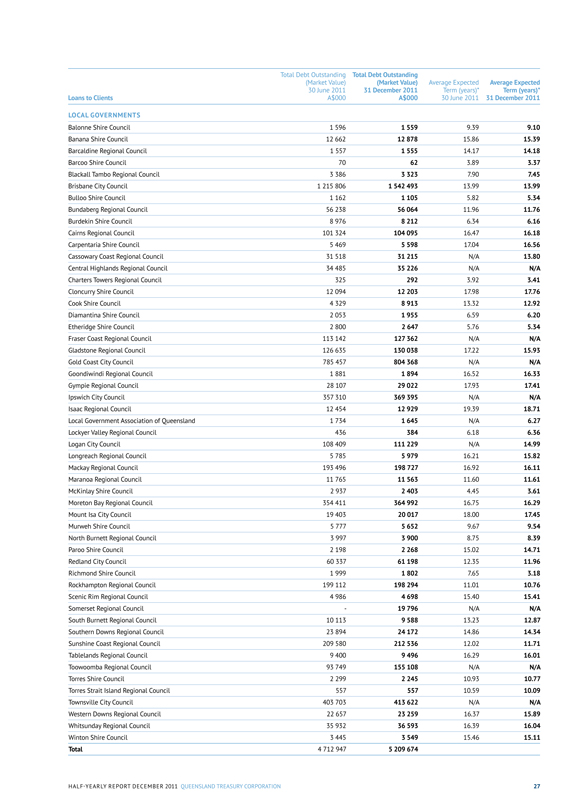
APPENDIX A
LOANS TO CLIENTS continued
Loans to Clients
Total Debt Outstanding
(Market Value)
30 June 2011
A$000
Total Debt Outstanding
(Market Value)
31 December 2011
A$000
Average Expected
Term (years)*
30 June 2011
Average Expected
Term (years)*
31 December 2011
STATUTORY BODIES
Drainage Boards
Eugun Bore Water Authority 73 49 1.41 0.91
Grammar Schools
Brisbane Girls’ Grammar School 22 243 22 048 10.73 10.40
Brisbane Grammar School 26 987 27 178 16.49 16.37
Ipswich Girls Grammar School 22 328 23 557 N/A N/A
Ipswich Grammar School 1 598 1 391 2.69 2.29
Rockhampton Girls Grammar School 4 364 4 497 15.43 14.95
Rockhampton Grammar School 12 819 13 038 14.50 14.27
Toowoomba Grammar School 6 657 6 717 12.27 11.75
Townsville Grammar School 16 355 16 460 12.63 12.48
River Improvement Trusts
Pioneer River Improvement Trust 232 187 2.36 1.89
Universities
Griffith University 75 397 70 356 5.62 5.19
James Cook University 23 499 23 969 12.35 12.06
Sunshine Coast University 17 514 17 311 10.06 9.58
University of Southern Queensland 14 980 14 901 9.87 9.37
Water Boards
Avondale Water Board 288 243 2.73 2.24
Fernlee Water Authority 935 968 18.06 17.48
Gladstone Area Water Board 147 405 174 691 20.66 18.90
Glamorgan Vale Water Board 44 44 10.18 9.68
Grevillea Water Board 166 170 13.84 13.54
Kelsey Creek Water Board 857 769 3.90 3.39
Mount Isa Water Board 3 265 3 148 6.95 6.44
Pioneer Valley Water Board 2 361 2 055 3.92 3.55
Riversdale Murray Valley Water Management Board 259 208 2.23 1.74
Water Supply Boards
Bollon South Water Authority 650 633 8.47 7.96
Bollon West Water Authority 1 581 1 588 10.75 10.31
Ingie Water Authority 382 376 9.61 9.12
Other Statutory Bodies
Australian Agricultural Colleges Corporation 24 - 0.14 -
Stadiums Queensland 476 720 480 276 N/A 7.44
Mt Gravatt Showgrounds Trust 43 41 6.19 5.71
National Trust of Queensland 982 842 1.72 N/A
Queensland Rural Adjustments Authority 8 519 7 279 5.15 5.14
South Bank Corporation 29 288 29 938 N/A N/A
Urban Land Development Authority 56 784 66 886 N/A N/A
Total 975 601 1 011 812
28 QUEENSLAND TREASURY CORPORATION ANNUAL REPORT 2010–2011
Loans to Clients
Total Debt Outstanding
(Market Value)
30 June 2011
A$000
Total Debt Outstanding
(Market Value)
31 December 2011
A$000
Average Expected
Term (years)*
30 June 2011
Average Expected
Term (years)*
31 December 2011
QUEENSLAND WATER ENTITIES
Allconnex Water 121 523 150 548 N/A N/A
Queensland Bulk Water Supply Authority 2 261 369 5 554 365 N/A N/A
Queensland Bulk Water Transport Authority 1 878 295 1 969 178 N/A N/A
Queensland Manufactured Water Authority 2 665 260 - N/A N/A
Queensland Urban Utilities 290 075 314 098 N/A N/A
Queensland Water Infrastructure Pty Ltd 380 879 - N/A N/A
SEQ Water Grid Manager 1 160 931 1 350 146 N/A N/A
Southern Regional Water Pipeline Company Pty Ltd 467 751 505 573 N/A N/A
Unitywater 126 521 129 054 N/A N/A
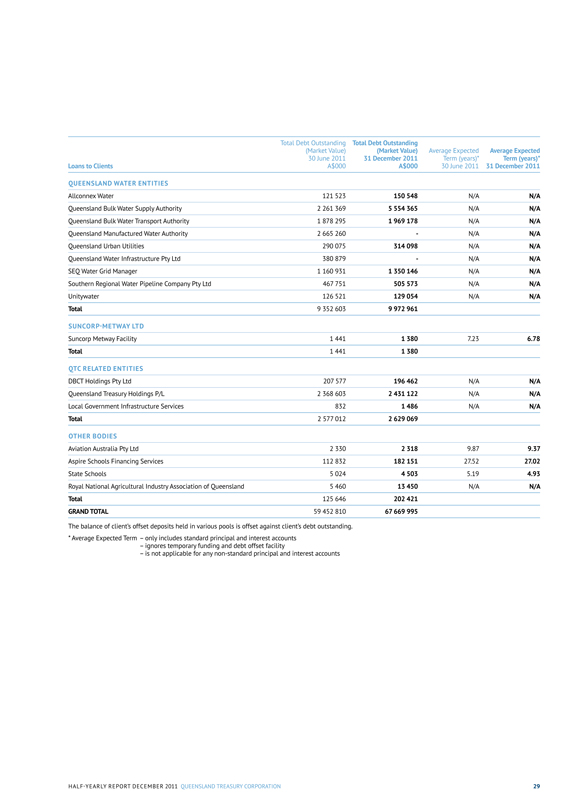
Total 9 352 603 9 972 961
SUNCORP-METWAY LTD
Suncorp Metway Facility 1 441 1 380 7.23 6.78
Total 1 441 1 380
QTC RELATED ENTITIES
DBCT Holdings Pty Ltd 207 577 196 462 N/A N/A
Queensland Treasury Holdings P/L 2 368 603 2 431 122 N/A N/A
Local Government Infrastructure Services 832 1 486 N/A N/A
Total 2 577 012 2 629 069
OTHER BODIES
Aviation Australia Pty Ltd 2 330 2 318 9.87 9.37
Aspire Schools Financing Services 112 832 182 151 27.52 27.02
State Schools 5 024 4 503 5.19 4.93
Royal National Agricultural Industry Association of Queensland 5 460 13 450 N/A N/A
Total 125 646 202 421
GRAND TOTAL 59 452 810 67 669 995
The balance of client’s offset deposits held in various pools is offset against client’s debt outstanding.
* Average Expected Term – only includes standard principal and interest accounts
– ignores temporary funding and debt offset facility
– is not applicable for any non-standard principal and interest accounts
HALF-YEARLY REPORT DECEMBER 2011 QUEENSLAND TREASURY CORPORATION 29
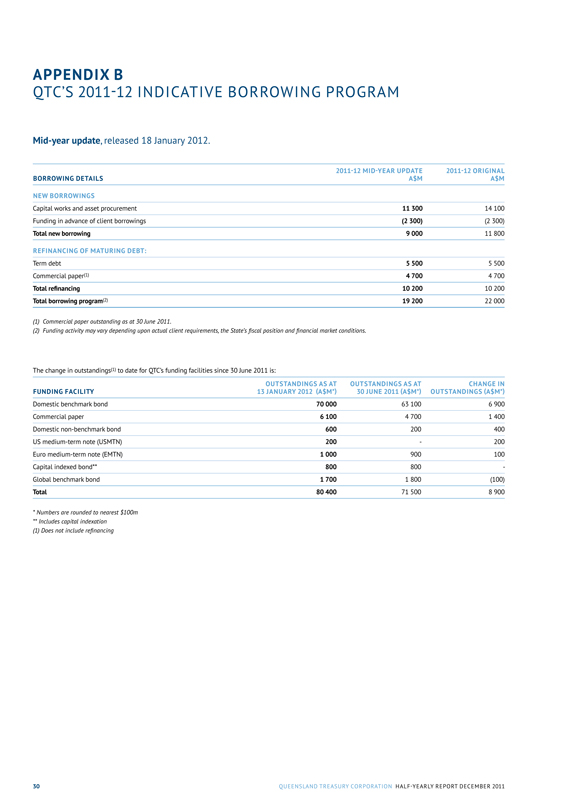
APPENDIX B
QTC’S 2011-12 INDICATIVE BORROWING PROGRAM
Mid-year update, released 18 January 2012.
2011-12 MID-YEAR UPDATE 2011-12 ORIGINAL
BORROWING DETAILS A$M A$M
NEW BORROWINGS
Capital works and asset procurement 11 300 14 100
Funding in advance of client borrowings (2 300) (2 300)
Total new borrowing 9 000 11 800
REFINANCING OF MATURING DEBT:
Term debt 5 500 5 500
Commercial paper(1) 4 700 4 700
Total refinancing 10 200 10 200
Total borrowing program(2) 19 200 22 000
(1) Commercial paper outstanding as at 30 June 2011.
(2) Funding activity may vary depending upon actual client requirements, the State’s fiscal position and financial market conditions.
The change in outstandings(1) to date for QTC’s funding facilities since 30 June 2011 is:
OUTSTANDINGS AS AT OUTSTANDINGS AS AT CHANGE IN
FUNDING FACILITY 13 JANUARY 2012 (A$M*) 30 JUNE 2011 (A$M*) OUTSTANDINGS (A$M*)
Domestic benchmark bond 70 000 63 100 6 900
Commercial paper 6 100 4 700 1 400
Domestic non-benchmark bond 600 200 400
US medium-term note (USMTN) 200 - 200
Euro medium-term note (EMTN) 1 000 900 100
Capital indexed bond** 800 800 -
Global benchmark bond 1 700 1 800 (100)
Total 80 400 71 500 8 900
* Numbers are rounded to nearest $100m
** Includes capital indexation
(1) Does not include refinancing
30 QUEENSLAND TREASURY CORPORATION HALF-YEARLY REPORT DECEMBER 2011
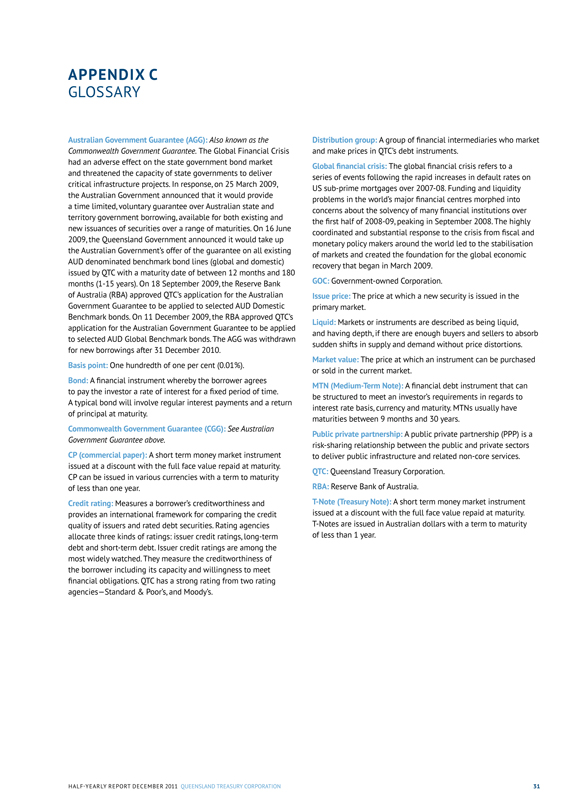
APPENDIX C
GLOSSARY
Australian Government Guarantee (AGG): Also known as the Commonwealth Government Guarantee. The Global Financial Crisis had an adverse effect on the state government bond market and threatened the capacity of state governments to deliver critical infrastructure projects. In response, on 25 March 2009, the Australian Government announced that it would provide a time limited, voluntary guarantee over Australian state and territory government borrowing, available for both existing and new issuances of securities over a range of maturities. On 16 June 2009, the Queensland Government announced it would take up the Australian Government’s offer of the guarantee on all existing AUD denominated benchmark bond lines (global and domestic) issued by QTC with a maturity date of between 12 months and 180 months (1-15 years). On 18 September 2009, the Reserve Bank of Australia (RBA) approved QTC’s application for the Australian Government Guarantee to be applied to selected AUD Domestic Benchmark bonds. On 11 December 2009, the RBA approved QTC’s application for the Australian Government Guarantee to be applied to selected AUD Global Benchmark bonds. The AGG was withdrawn for new borrowings after 31 December 2010.
Basis point: One hundredth of one per cent (0.01%).
Bond: A financial instrument whereby the borrower agrees to pay the investor a rate of interest for a fixed period of time. A typical bond will involve regular interest payments and a return of principal at maturity.
Commonwealth Government Guarantee (CGG): See Australian Government Guarantee above.
CP (commercial paper): A short term money market instrument issued at a discount with the full face value repaid at maturity.
CP can be issued in various currencies with a term to maturity of less than one year.
Credit rating: Measures a borrower’s creditworthiness and provides an international framework for comparing the credit quality of issuers and rated debt securities. Rating agencies allocate three kinds of ratings: issuer credit ratings, long-term debt and short-term debt. Issuer credit ratings are among the most widely watched. They measure the creditworthiness of the borrower including its capacity and willingness to meet financial obligations. QTC has a strong rating from two rating agencies–Standard & Poor’s, and Moody’s.
Distribution group: A group of financial intermediaries who market and make prices in QTC’s debt instruments.
Global financial crisis: The global financial crisis refers to a series of events following the rapid increases in default rates on US sub-prime mortgages over 2007-08. Funding and liquidity problems in the world’s major financial centres morphed into concerns about the solvency of many financial institutions over the first half of 2008-09, peaking in September 2008. The highly coordinated and substantial response to the crisis from fiscal and monetary policy makers around the world led to the stabilisation of markets and created the foundation for the global economic recovery that began in March 2009.
GOC: Government-owned Corporation.
Issue price: The price at which a new security is issued in the primary market.
Liquid: Markets or instruments are described as being liquid, and having depth, if there are enough buyers and sellers to absorb sudden shifts in supply and demand without price distortions.
Market value: The price at which an instrument can be purchased or sold in the current market.
MTN (Medium-Term Note): A financial debt instrument that can be structured to meet an investor’s requirements in regards to interest rate basis, currency and maturity. MTNs usually have maturities between 9 months and 30 years.
Public private partnership: A public private partnership (PPP) is a risk-sharing relationship between the public and private sectors to deliver public infrastructure and related non-core services.
QTC: Queensland Treasury Corporation.
RBA: Reserve Bank of Australia.
T-Note (Treasury Note): A short term money market instrument issued at a discount with the full face value repaid at maturity. T-Notes are issued in Australian dollars with a term to maturity of less than 1 year.
HALF-YEARLY REPORT DECEMBER 2011 QUEENSLAND TREASURY CORPORATION 31
APPENDIX D
CONTACTS
QUEENSLAND TREASURY CORPORATION
Level 14, 61 Mary Street
Brisbane Queensland Australia
GPO Box 1096
Brisbane Queensland
Australia 4001
Telephone: +61 7 3842 4600
Facsimile: +61 7 3221 4122
Internet: www.qtc.com.au
Queensland Treasury Corporation’s annual reports [ISSN 1837-1256 (print); ISSN 1837-1264 (online)] are available on QTC’s website: www.qtc.com.au. If you would like a report posted to you, please call QTC’s Communication and Marketing Group on +61 7 3842 4945.
If you would like to comment on our Annual Report, please complete the feedback form that can be downloaded from the Annual Reports page on our website.
Telephone Facsimile
EXECUTIVE +61 7 3842 4611 +61 7 3210 0262
GROUPS
Business Solutions Group +61 7 3842 4743 +61 7 3482 4958
Financial Solutions Group +61 7 3842 4601 +61 7 3211 3629
Strategic Partnering Group +61 7 3842 4901 +61 7 3211 4122
Treasury Department Group +61 7 3842 4798 +61 7 3211 3629
Customer and Market Solutions Delivery +61 7 3842 4947 +61 7 3221 2486
Infrastructure Projects Assessment Team +61 7 3035 1847 +61 7 3225 1271
Stock registry (Link Market Services Ltd) 1800 777 166 +61 2 9287 0315
Funding and Markets Group +61 7 3842 4789 +61 7 3221 2410
Risk Group +61 7 3842 4704 +61 7 3236 9031
Operations Group +61 7 3842 4641 +61 7 3221 4122
Strategy Group +61 7 3842 4650 +61 7 3221 4122
People and Performance Group +61 7 3842 4761 +61 7 3210 2358
Communication and Marketing Group +61 7 3842 4714 +61 7 3211 3629
Interpreter
QTC is committed to providing accessible services to Queensland residents from culturally and linguistically diverse backgrounds. If you have difficulty understanding QTC’s Annual Report, please contact QTC’s Communication and Marketing Group on 07 3842 4945 and we will arrange for an interpreter to assist you.
32 QUEENSLAND TREASURY CORPORATION HALF-YEARLY REPORT DECEMBER 2011
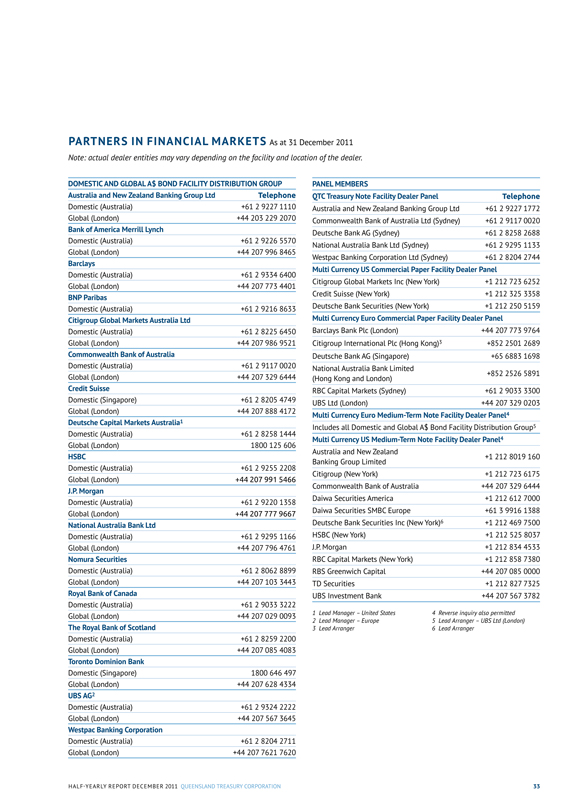
PARTNERS IN FINANCIAL MARKETS As at 31 December 2011
Note: actual dealer entities may vary depending on the facility and location of the dealer.
DOMESTIC AND GLOBAL A$ BOND FACILITY DISTRIBUTION GROUP
Australia and New Zealand Banking Group Ltd Telephone
Domestic (Australia) +61 2 9227 1110
Global (London) +44 203 229 2070
Bank of America Merrill Lynch
Domestic (Australia) +61 2 9226 5570
Global (London) +44 207 996 8465
Barclays
Domestic (Australia) +61 2 9334 6400
Global (London) +44 207 773 4401
BNP Paribas
Domestic (Australia) +61 2 9216 8633
Citigroup Global Markets Australia Ltd
Domestic (Australia) +61 2 8225 6450
Global (London) +44 207 986 9521
Commonwealth Bank of Australia
Domestic (Australia) +61 2 9117 0020
Global (London) +44 207 329 6444
Credit Suisse
Domestic (Singapore) +61 2 8205 4749
Global (London) +44 207 888 4172
Deutsche Capital Markets Australia1
Domestic (Australia) +61 2 8258 1444
Global (London) 1800 125 606
HSBC
Domestic (Australia) +61 2 9255 2208
Global (London) +44 207 991 5466
J.P. Morgan
Domestic (Australia) +61 2 9220 1358
Global (London) +44 207 777 9667
National Australia Bank Ltd
Domestic (Australia) +61 2 9295 1166
Global (London) +44 207 796 4761
Nomura Securities
Domestic (Australia) +61 2 8062 8899
Global (London) +44 207 103 3443
Royal Bank of Canada
Domestic (Australia) +61 2 9033 3222
Global (London) +44 207 029 0093
The Royal Bank of Scotland
Domestic (Australia) +61 2 8259 2200
Global (London) +44 207 085 4083
Toronto Dominion Bank
Domestic (Singapore) 1800 646 497
Global (London) +44 207 628 4334
UBS AG2
Domestic (Australia) +61 2 9324 2222
Global (London) +44 207 567 3645
Westpac Banking Corporation
Domestic (Australia) +61 2 8204 2711
Global (London) +44 207 7621 7620
PANEL MEMBERS
QTC Treasury Note Facility Dealer Panel Telephone
Australia and New Zealand Banking Group Ltd +61 2 9227 1772
Commonwealth Bank of Australia Ltd (Sydney) +61 2 9117 0020
Deutsche Bank AG (Sydney) +61 2 8258 2688
National Australia Bank Ltd (Sydney) +61 2 9295 1133
Westpac Banking Corporation Ltd (Sydney) +61 2 8204 2744
Multi Currency US Commercial Paper Facility Dealer Panel
Citigroup Global Markets Inc (New York) +1 212 723 6252
Credit Suisse (New York) +1 212 325 3358
Deutsche Bank Securities (New York) +1 212 250 5159
Multi Currency Euro Commercial Paper Facility Dealer Panel
Barclays Bank PLc (London) +44 207 773 9764
Citigroup International PLc (Hong Kong)3 +852 2501 2689
Deutsche Bank AG (Singapore) +65 6883 1698
National Australia Bank Limited +852 2526 5891
(Hong Kong and London)
RBC Capital Markets (Sydney) +61 2 9033 3300
UBS Ltd (London) +44 207 329 0203
Multi Currency Euro Medium-Term Note Facility Dealer Panel4
Includes all Domestic and Global A$ Bond Facility Distribution Group5
Multi Currency US Medium-Term Note Facility Dealer Panel4
Australia and New Zealand
+1 212 8019 160
Banking Group Limited
Citigroup (New York) +1 212 723 6175
Commonwealth Bank of Australia +44 207 329 6444
Daiwa Securities America +1 212 612 7000
Daiwa Securities SMBC Europe +61 3 9916 1388
Deutsche Bank Securities Inc (New York)6 +1 212 469 7500
HSBC (New York) +1 212 525 8037
J.P. Morgan +1 212 834 4533
RBC Capital Markets (New York) +1 212 858 7380
RBS Greenwich Capital +44 207 085 0000
TD Securities +1 212 827 7325
UBS Investment Bank +44 207 567 3782
1 Lead Manager – United States
2 Lead Manager – Europe
3 Lead Arranger
4 Reverse inquiry also permitted
5 Lead Arranger – UBS Ltd (London)
6 Lead Arranger
HALF-YEARLY REPORT DECEMBER 2011 QUEENSLAND TREASURY CORPORATION 33
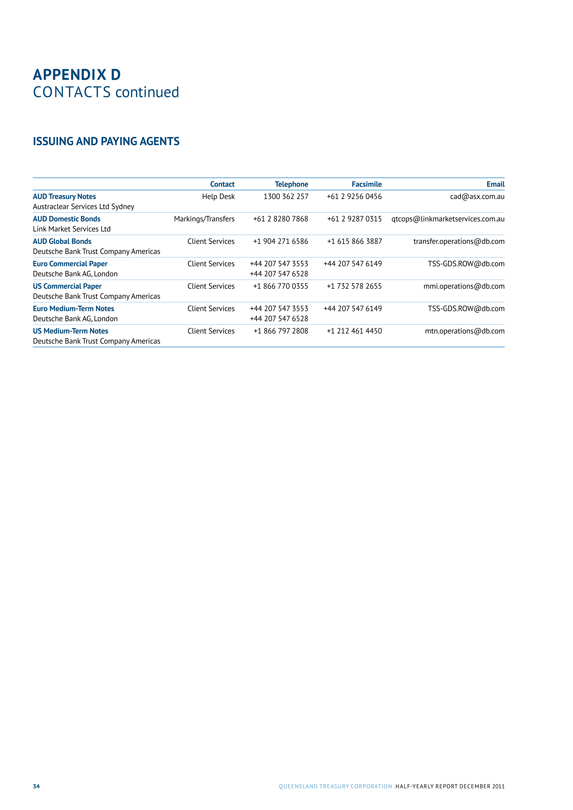
APPENDIX D
CONTACTS continued
ISSUING AND PAYING AGENTS
Contact Telephone Facsimile Email
AUD Treasury Notes
Austraclear Services Ltd Sydney
Help Desk 1300 362 257 +61 2 9256 0456 cad@asx.com.au
AUD Domestic Bonds
Link Market Services Ltd
Markings/Transfers +61 2 8280 7868 +61 2 9287 0315 qtcops@linkmarketservices.com.au
AUD Global Bonds
Deutsche Bank Trust Company Americas
Client Services +1 904 271 6586 +1 615 866 3887 transfer.operations@db.com
Euro Commercial Paper
Deutsche Bank AG, London
Client Services +44 207 547 3553
+44 207 547 6528
+44 207 547 6149 TSS-GDS.ROW@db.com
US Commercial Paper
Deutsche Bank Trust Company Americas
Client Services +1 866 770 0355 +1 732 578 2655 mmi.operations@db.com
Euro Medium-Term Notes
Deutsche Bank AG, London
Client Services +44 207 547 3553
+44 207 547 6528
+44 207 547 6149 TSS-GDS.ROW@db.com
US Medium-Term Notes
Deutsche Bank Trust Company Americas
Client Services +1 866 797 2808 +1 212 461 4450 mtn.operations@db.com
34 QUEENSLAND TREASURY CORPORATION HALF-YEARLY REPORT DECEMBER 2011
AUDAX AT FIDELIS
QUEENSLAND
TREASURY
CORPORATION
Level 14 61 Mary Street Brisbane
GPO Box 1096 Brisbane
Queensland Australia 4001
Telephone: +61 7 3842 4600
Facsimile: +61 7 3221 4122
www.qtc.com.au
Queensland
Government