EXHIBIT (c)(vi)
The Queensland Treasury Corporation Half Yearly Report
for the half-year ended December 31, 2012
December Half-yearly rePOrT 2012
QUEENSLAND TREASURY CORPORATION
QUEENSLAND TREASURY CORPORATION VISION SECURING QUEENSLAND’S FINANCIAL SUCCESS MISSION TOD ELIVER OPTIMAL FINANCIAL OUTCOMES THROUGHSO UND FUNDING AND FINANCIAL RISK MANAGEMENT VALUES WE ARE FOCUSED ON OUR CLIENTS WE ARE PASSIONATE ABOUT QUEENSLAND WE VALUE AND RESPECT OUR PEOPLE WE ARE COLLABORATIVE AND SEEK CONTINUOUS IMPROVEMENT ABOVE ALL ELSE, WE VALUE INTEGRITY
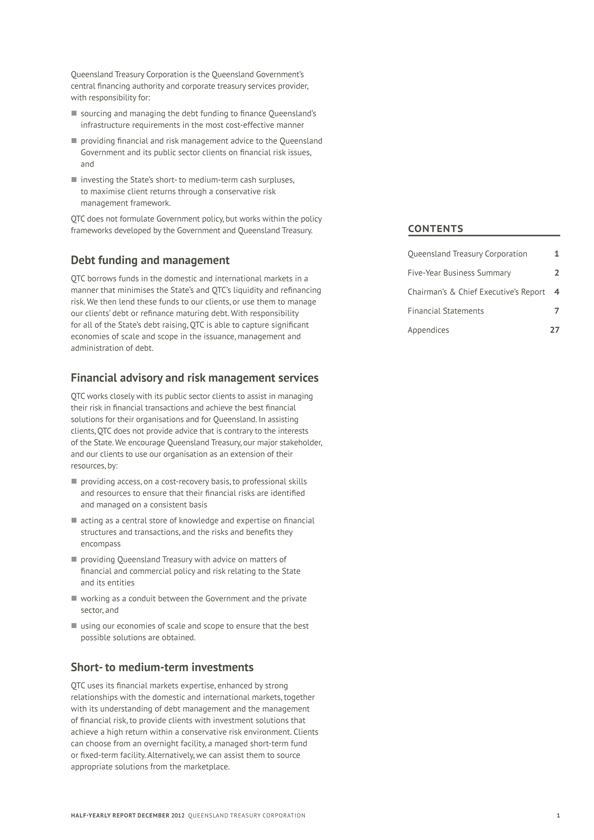
Queensland Treasury corporation is the Queensland government’s central financing authority and corporate treasury services with responsibility for: sourcing and managing the debt funding to finance Queensland’s infrastructure requirements in the most cost-effective manner providing financial and risk management advice to the Government and its public sector clients on financial risk and investing the State’s short- to medium-term cash surpluses, to maximise client returns through a conservative risk management framework. QTC does not formulate Government policy, Contents but works within frameworks developed by the Government and Queensland Treasury. Debt funding and management Queensland Treasury corporation 1 five-year business Summary 2 QTC borrows funds in the domestic and international markets manner that minimises the State’s and QTC’s chairman’s liquidity & chief executive’s report and 4 risk. We then lend these funds to our clients, or use them our clients’ debt or refinance maturing debt. financial Statements With 7 for all of the State’s debt raising, QTC is able to capture appendices 27 economies of scale and scope in the issuance, management and administration of debt. Financial advisory and risk management services QTC works closely with its public sector clients to assist in their risk in financial transactions and achieve the best solutions for their organisations and for Queensland. In clients, QTc does not provide advice that is contrary to the interests of the State. We encourage Queensland Treasury, our major and our clients to use our organisation as an extension of resources, by: providing access, on a cost-recovery basis, to professional and resources to ensure that their financial risks are and managed on a consistent basis acting as a central store of knowledge and expertise on structures and transactions, and the risks and benefits they encompass providing Queensland Treasury with advice on matters of financial and commercial policy and risk relating to the and its entities working as a conduit between the Government and the private sector, and using our economies of scale and scope to ensure that the possible solutions are obtained. Short- to medium-term investments QTC uses its financial markets expertise, enhanced by strong relationships with the domestic and international markets, with its understanding of debt management and the management of financial risk, to provide clients with investment achieve a high return within a conservative risk environment. can choose from an overnight facility, a managed short-term or fixed-term facility. Alternatively, we can assist them to appropriate solutions from the marketplace. Half-yearly report December 2012 QUEENSLAND TREASURY CORPORATION 1
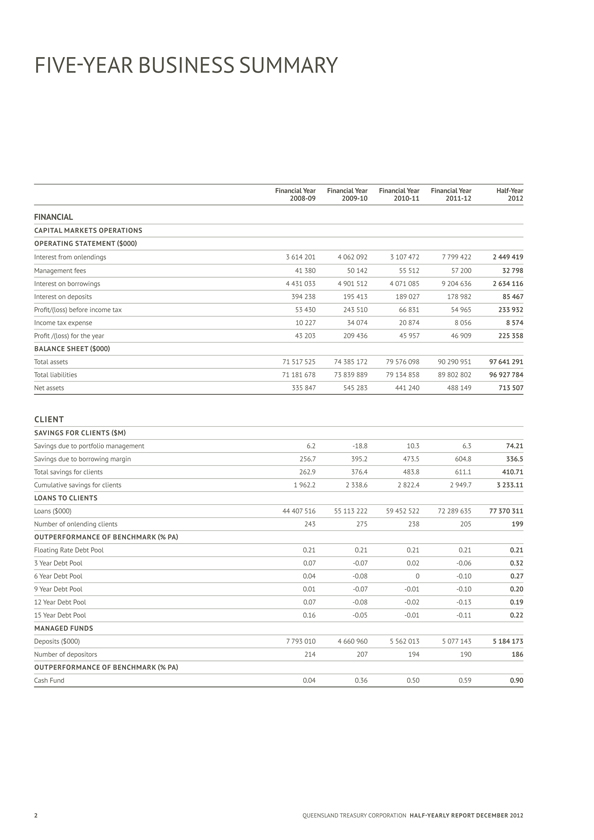
five-year business Summary Financial Year Financial Year Financial Year Financial Year Half-Year 2008-09 2009-10 2010-11 2011-12 2012 FINANCIAL CAPITAL MARKETS OPERATIONS OPERATING g STATEMENT ($000) Interest from onlendings 3 614 201 4 062 092 3 107 472 7 799 422 2 449 419 Management fees 41 380 50 142 55 512 57 200 32 798 Interest on borrowings 4 431 033 4 901 512 4 071 085 9 204 636 2 634 116 interest on deposits 394 238 195 413 189 027 178 982 85 467 Profit/(loss) before income tax 53 430 243 510 66 831 54 965 233 932 income tax expense 10 227 34 074 20 874 8 056 8 574 Profit /(loss) for the year 43 203 209 436 45 957 46 909 225 358 BALANCE SHEET ($000) Total assets 71 517 525 74 385 172 79 576 098 90 290 951 97 641 291 Total liabilities 71 181 678 73 839 889 79 134 858 89 802 802 96 927 784 net assets 335 847 545 283 441 240 488 149 713 507 CLIENT Savings FOR CLIENTS ($M) Savings due to portfolio management 6.2 -18.8 10.3 6.3 74.21 Savings due to borrowing margin 256.7 395.2 473.5 604.8 336.5 Total savings for clients 262.9 376.4 483.8 611.1 410.71 Cumulative savings for clients 1 962.2 2 338.6 2 822.4 2 949.73 233.11 LOANS TO CLIENTS Loans ($000) 44 407 516 55 113 222 59 452 522 72 289 635 77 370 311 Number of on lending clients 243 275 238 205 199 OUTPERFORMANCE OF BENCHMARK (% PA) Floating Rate Debt Pool 0.21 0.21 0.21 0.21 0.21 3 year Debt Pool 0.07 -0.07 0.02 -0.06 0.32 6 year Debt Pool 0.04 -0.08 0 -0.10 0.27 9 year Debt Pool 0.01 -0.07 -0.01 -0.10 0.20 12 year Debt Pool 0.07 -0.08 -0.02 -0.13 0.19 15 year Debt Pool 0.16 -0.05 -0.01 -0.11 0.22 MANAGED FUNDS Deposits ($000) 7 793 010 4 660 960 5 562 013 5 077 143 5 184 173 number of depositors 214 207 194 190 186 OuTPERFORMANCE OF BENCHMARK (% PA) cash fund 0.04 0.36 0.50 0.59 0.90 2 QUEENSLAND TREASURY CORPORATION Half-yearly REPORT December 2012
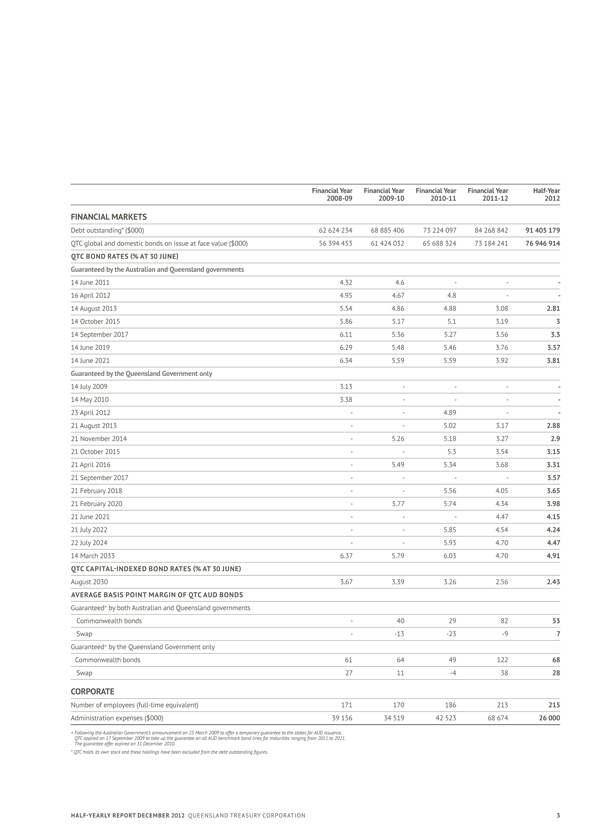
Financial Year Financial Year Financial Year Financial Year Half-Year 2008-09 2009-10 2010-11 2011-12 2012 FINANCIAL MARKETS Debt outstanding* ($000) 62 624 234 68 885 406 73 224 097 84 268 842 91 405 179 QTC global and domestic bonds on issue 56 394 at 453 face 61 424 032 value 65 688($000)324 73 184 241 76 946 914 QTC BONDRATES (% AT 30 June) guaranteed by the Australian and Queensland governments 14 June 2011 4.32 4.6 - - -16 april 2012 4.95 4.67 4.8 - - 14 August 2013 5.54 4.86 4.88 3.08 2.81 14 October 2015 5.86 5.17 5.1 3.19 3 14 September 2017 6.11 5.36 5.27 3.56 3.3 14 June 2019 6.29 5.48 5.46 3.76 3.57 14 June 2021 6.34 5.59 5.59 3.92 3.81 guaranteed by the Queensland government only 14 July 2009 3.13 - - - -14 may 2010 3.38 - - - -23 april 2012 - - 4.89 - - 21 August 2013 - - 5.02 3.17 2.88 21 November 2014 - 5.26 5.18 3.27 2.9 21 October 2015 - - 5.3 3.54 3.15 21 april 2016 - 5.49 5.34 3.68 3.31 21 September 2017 - - - - 3.57 21 February 2018 - - 5.56 4.05 3.65 21 February 2020 - 5.77 5.74 4.34 3.98 21 June 2021 - - - 4.47 4.15 21 July 2022 - - 5.85 4.54 4.24 22 July 2024 - - 5.93 4.70 4.47 14 march 2033 6.37 5.79 6.03 4.70 4.91 QTC CAPITAL-INDExED BOND RATES (% AT 30 JuNE) August 2030 3.67 3.39 3.26 2.56 2.43 Average BASIS POINT Margin OF QTC AUD BONDS guaranteed+ by both Australian and Queensland governments commonwealth bonds - 40 29 82 53 Swap - -13 -23 -9 7 guaranteed+ by the Queensland government only commonwealth bonds 61 64 49 122 68 Swap 27 11 -4 38 28 CORPORATE Number of employees (full-time equivalent) 171 170 186 213 215 Administration expenses ($000) 39 156 34 519 42 523 68 674 26 000 + Following the Australian Government’s announcement on 25 March 2009 to offer a temporary guarantee to the states for AUD issuance, QTC applied on 17 September 2009 to take up the guarantee on all AUD benchmark bond lines for maturities ranging from 2011 to 2021. The guarantee offer expired on 31 December 2010. * QTC holds its own stock and these holdings have been excluded from the debt outstanding figures Half-yearly REPORT December 2012 QUEENSLAND TREASURY CORPORATION 3
Hairman’S for the half-year ended 31 December These initiatives have included the 2012, Queensland Treasury corporation Queensland Government’s (QTC) achieved an operating independent review profit of Queensland’s from & chief its capital markets operations current and of future $225.4 million (HY2011: and $120. the establishment 2 million). eXecuTive’S We also achieved quantifiable Queensland—a stand-alone savings unit of for clients and the State Queensland of $410. Treasury and 7 Trade million, to rePOrT principally through our achieve capital the markets efficient activities and economies assessment, of prioritisation scale. and delivery of critical With regular market issuance, QTC had successfully raised QTc also $11. played a central 9 billion role in or 64 per cent of the total managing year’s the program partial of $18.7 billion, asState’s 31 December $1.5 billion 2012. National Ltd (QRN; now Separate from QTC’s capital markets in October. This operations, the long-term assets exceptional outcome for the State in terms operations recorded a profit of $1,154.5 of process management, million (HY2011: loss of $526.8 million). achieved and the costs This segment comprises the investments that fund the State’s defined benefit superannuation and other Achieving long-term sustainable obligations. Managed by QIC, these obligations were transferred access to funding to QTC by the Queensland government under an The Queensland government released administrative arrangement; in return, its mid-year fiscal and economic review QTC issued the State with fixed-rate in late December, which did not result in notes that provide a fixed rate of return. any change to the While QTC bears the fluctuations in the for the remainder of value and returns on the asset portfolio, the strong fiscal there is no cash flow effect for QTC. by the Government to any accumulated losses incurred by this credit rating over the segment have no impact on QTC’s ability rating agencies Standard to meet its obligations or on its capital Moody’s affirmed their markets activities. (AA+/Stable/A-1+ and for Queensland. Delivering whole-of-State With an annual borrowing benefits $18.7 billion, as at 31 had raised $6.6 billion A key highlight of the and past had six commercial months has paper been the support that QTc has provided of $5.3 billion. Funds to the State in the attainment regular issuance of its program priorities and objectives, the State’s particularly capital in light of the release and of the to refinance Queensland maturing State Budget and the development of the in the period under review, we issued Government’s key fiscal principles. three new AUD benchmark QTC has delivered strong in 2017, whole-of-State 2019 and 2023, benefits, through quantifiable a choice of Queensland government- savings generated for clients guaranteed from core bonds funding with and liquidity management everyactivities, year through and to its contribution to the success of some of the State’s key initiatives. 4 QUEENSLAND TREASURY CORPORATION Half-yearly rePOr T December 2012
All three benchmark bond issues received strong support from a diverse mix of investors, both in terms of geographical location and investor type. In particular, the 2017 benchmark bond attracted a higher proportion of US investor participation as a result of the inclusion of a US Rule 144A capability, which came into effect in 2011-12. As we complete our 2012-13 borrowing program in the next six months, AUD benchmark bonds will remain our principal source of funding. We will continue regular issuance into existing liquid benchmark bond lines on both a public and a reverse enquiry basis. With interest rates at a historic low, we will also seek opportunities to lengthen our debt maturity profile. Through regular dialogue with the 15 global banks that make up our Fixed Interest Distribution Group and provide pricing to investors in the primary and secondary markets, we will also continue to monitor global markets for opportunities to diversify our funding sources to meet investor requirements. Creating client value Following elections at both the State and local levels of government in the first half of 2012, we implemented a significant program of work to renew our client relationships across the public sector and increase client value through product, service and organisational innovation. Over the past six months, our expertise has been sought across a number of major client projects and initiatives, including the: Boundaries Commission’s evaluation of the financial impacts of a number of proposed local government de-amalgamations nnpublic consultation process undertaken by the Australian Energy Market Commission on the rules governing the economic regulation of electricity network service providers nnDepartment of Treasury and Trade’s establishment of Projects Queensland, with the secondment of 16 QTC employees to help staff that office nnrecovery planning and funding application support to local governments, following a number of significant natural disasters, and nnState-wide series of educational forums to support senior officials of local governments, including courses for Indigenous and Torres Strait Island local governments, in conjunction with the Department of Local Government and the Local Government Association of Queensland. Our ability to respond flexibly to the needs of our clients will remain a key focus across the next six months, particularly as we balance ongoing client demand with increasing demand for our involvement in significant whole-of-State initiatives. Maintaining organisational sustainability Over the past six months, we have reviewed and updated our strategic plan, reflecting on the value we can deliver to our clients and the State, and the unique role we fulfil across the public sector. Through this process, we renewed our corporate vision and mission, reaffirming our commitment to build on the strong foundation of our past achievements to best address the challenges of the future, and ensure we meet the State’s financing requirements and contribute to a sustainable future for all Queenslanders. We also took the opportunity to align our organisational structure to our strategy, streamlining responsibility and accountability, ensuring the prioritised allocation of resources, and maintaining our organisational flexibility. The delivery of increased operational efficiencies across the organisation has been a significant priority, with the rationalisation of our work spaces and subsequent co-location of all employees into one office. We also delivered enhanced online services to our clients through QTC Connect, improving operational efficiencies and completing this major program of work. Over the next six months, QTC will focus on its core funding and debt management business to meet the State’s financing requirements and help drive public sector financial sustainability. On behalf of the Board and our senior management team, we thank our team of experts, whose collective efforts, energies and commitment have delivered a strong outcome for our organisation. We look forward to building on this positive foundation over the second half of the financial year to deliver optimal financial outcomes that help secure Queensland’s financial success. G P Bradley Chairman P C Noble Chief Executive Half-yearly REPORT December 2012 QUEENSLAND TREASURY CORPORATION

6 QUEENSLAND TREAS URYC ORPORATION HALF -YEARLY REPORT DECEMBER 2012
QUEENSLAND TREASURY CORPORATION financial Statements for The Half-year ended 31 December 2012 Contents Statement of comprehensive income 8 balance Sheet 9 Statement of Changes 10 in Equity Statement of cash flows 11 Notes to and forming part of the financial Statements 12 Certificate of the Queensland Treasury corporation 22 independent auditor’s review report 23 Management Report 25 7
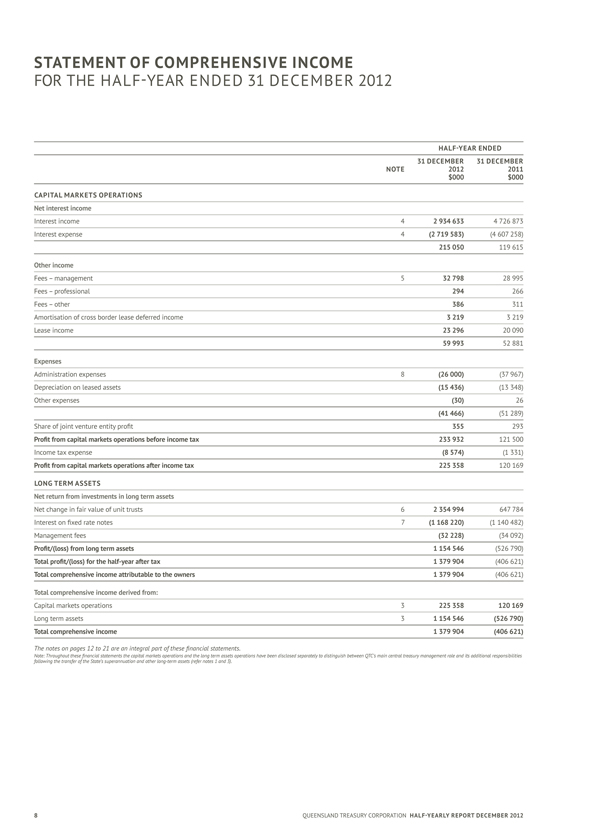
STATEMENT OF Comprehensive INCOME for The Half-year ended 31 December 2012 HALF -YEARENDED 31 DECEMBER 31 DECEMBER NOTE 2012 2011 $000 $000 CAPITAL MARKETSOPERATIONS Net interest income interest income 4 2 934 633 4 726 873 interest expense 4 (2 719 583) (4 607 258) 215 050 119 615 Other income Fees – management 5 32 798 28 995 fees – professional 294 266 fees – other 386 311 amortisation of cross border lease deferred income 3 219 3 219 lease income 23 296 20 090 59 993 52 881 Expenses administration expenses 8 (26 000) (37 967) Depreciation on leased assets (15 436) (13 348) Other expenses (30) 26 (41 466) (51 289) Share of joint venture entity profit 355 293 Profit from capital markets operations before income tax 233 932 121 500 income tax expense (8 574) (1 331) Profit from capital markets operations after income tax 225 358 120 169 LONg TERM ASSETS Net return from investments in long term assets Net change in fair value of unit trusts 6 2 354 994 647 784 Interest on fixed rate notes 7 (1 168 220) (1 140 482) Management fees (32 228) (34 092) Profit/(loss) from long term assets 1 154 546 (526 790) Total profit/(loss) for the half-year after tax 1 379 904 (406 621) Total comprehensive income attributable to the owners 1 379 904 (406 621) Total comprehensive income derived from: Capital markets operations 3 225 358 120 169 Long term assets 3 1 154 546 (526 790) Total comprehensive income 1 379 904 (406 621) The notes on pages 12 to 21 are an integral part of these financial statements. Note: Throughout these financial statements the capital markets operations and the long term assets operations following the transfer of the State’s superannuation and other long-term assets (refer notes 1 and 3). 8 QUEENSLAND TREASURY CORPORATION Half-yearly report T December 2012
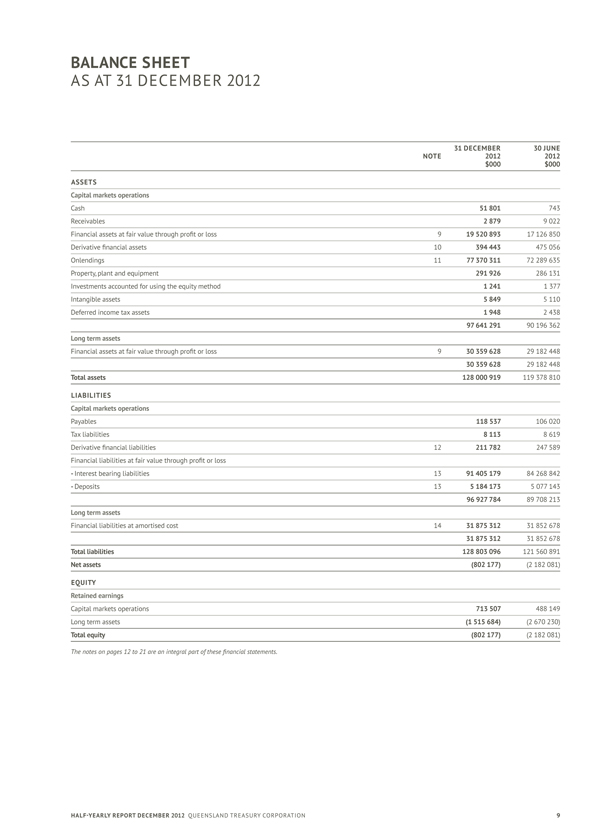
BALANCE SHEET as at 31 December 2012 31 DECEMBER 30 June NOTE 2012 2012 $000 $000 ASSETS Capital markets operations cash 51 801 743 receivables 2 879 9 022 Financial assets at fair value through profit or loss 9 19 520 893 17 126 850 Derivative financial assets 10 394 443 475 056 Onlendings 11 77 370 311 72 289 635 Property, plant and equipment 291 926 286 131 Investments accounted for using the equity method 1 241 1 377 Intangible assets 5 849 5 110 Deferred income tax assets 1 948 2 438 97 641 291 90 196 362 Long term assets Financial assets at fair value through profit or loss 9 30 359 628 29 182 448 30 359 628 29 182 448 Total assets 128 000 919 119 378 810 LIABILITIES Capital markets operations Payables 118 537 106 020 Tax liabilities 8 113 8 619 Derivative financial liabilities 12 211 782 247 589 Financial liabilities at fair value through profit or loss - Interest bearing liabilities 13 91 405 179 84 268 842 - Deposits 13 5 184 173 5 077 143 96 927 784 89 708 213 Long term assets financial liabilities at amortised cost 14 31 875 312 31 852 678 31 875 312 31 852 678 Total liabilities 128 803 096 121 560 891 Net assets (802 177) (2 182 Equity Retained earnings Capital markets operations 713 507 488 149 Long term assets (1 515 684) (2 670 Total equity (802 177) (2 182 The notes on pages 12 to 21 are an integral part of these financial statements. Half-yearly report December 2012 QUEENSLAND TREASURY CORPORATION 9
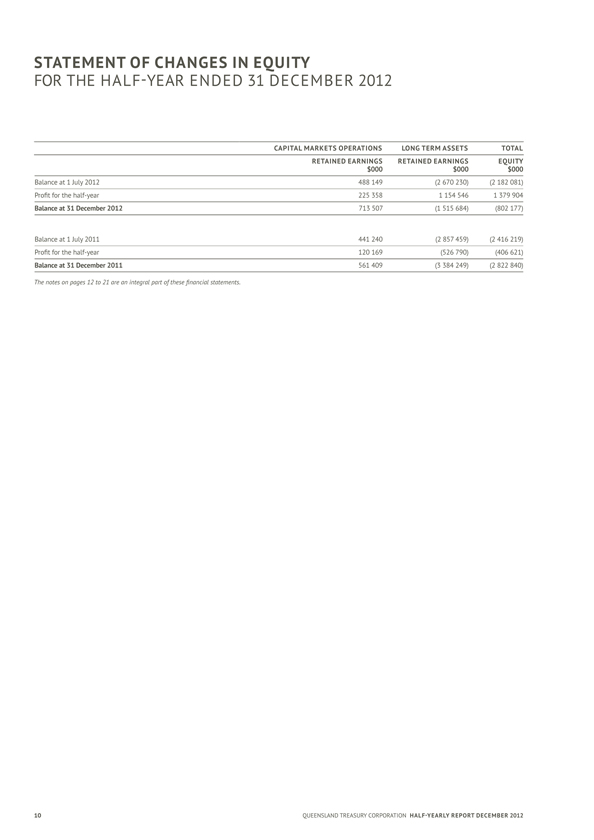
STATEMENT OF CHANGES IN EQUITY FOR THE HALF-YEAR ENDED 31 DECEMBER 2012 CAPITAL MARKETS OPERATIONS LONG TERMASSETS TOTAL RETAINED Earnings RETAINED EARNIN gS Equity $000 $000 $000 balance at 1 July 2012 488 149 (2 670 230)(2 182 081) Profit for the half-year 225 358 1 154 546 1 379 904 Balance at 31 December 2012 713 507 (1 515 684)(802 177) balance at 1 July 2011 441 240 (2 857 459)(2 416 219) Profit for the half-year 120 169 (526 790)(406 621) Balance at 31 December 2011 561 409 (3 384 249)(2 822 840) The notes on pages 12 to 21 are an integral part of these financial statements. 10 QUEENSLAND TREASURY CORPORATION Half-yearly rePOr T December 2012
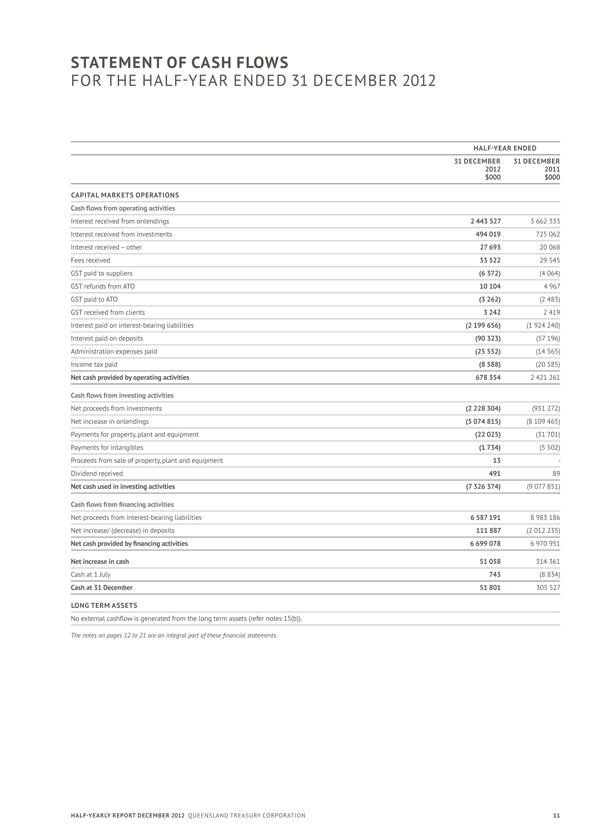
STATEMENT OF CASH Flows for The Half-year ended 31 December 2012 HALF -YEARENDED 31 DECEMBER 31 DECEMBER 2012 2011 $000 $000 CAPITAL MARKETS OPERATIONS Cash flows from operating activities Interest received from onlendings 2 443 527 3 662 333 interest received from investments 494 019 725 062 interest received – other 27 693 20 068 fees received 33 522 29 545 GST paid to suppliers (6 372) (4 064) gST refunds from aTO 10 104 4 967 gST paid to aTO (3 262) (2 483) gST received from clients 3 242 2 419 Interest paid on interest-bearing liabilities (2 199 656) (1 924 interest paid on deposits (90 323) (57 196) administration expenses paid (25 552) (14 565) income tax paid (8 588) (20 585) Net cash provided by operating activities 678 354 2 421 261 Cash flows from investing activities net proceeds from investments (2 228 304) (931 272) Net increase in onlendings (5 074 815) (8 109 Payments for property, plant and equipment (22 025) (31 701) Payments for intangibles (1 734) (5 502) Proceeds from sale of property, plant and equipment 13 -Dividend received 491 89 Net cash used in investing activities (7 326 374) (9 077 Cash flows from financing activities Net proceeds from interest-bearing liabilities 6 587 191 8 983 186 Net increase/ (decrease) in deposits 111 887 (2 012 Net cash provided by financing activities 6 699 078 6 970 951 Net increase in cash 51 058 314 361 cash at 1 July 743 (8 834) Cash at 31 December 51 801 305 527 Long TERM ASSETS No external cashflow is generated from the long term assets (refer notes The notes on pages 12 to 21 are an integral part of these financial statements. Half-yearly rePOrT December 2012 QUEENSLAND TREASURY CORPORATION 11
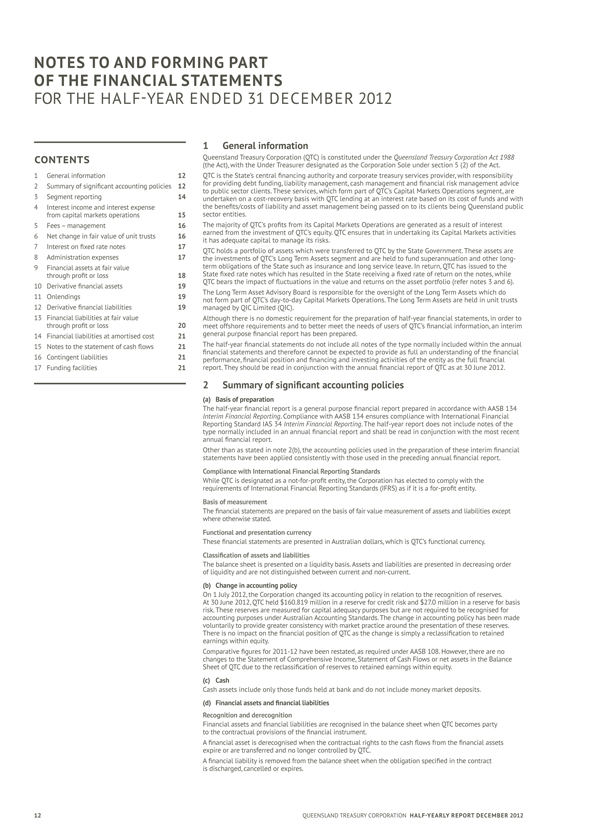
NOTES TO AND Forming PART OF THE FINANCIAL STATEMENTS for The Half-year ended 31 December 2012 1 general information Contents Queensland Treasury Corporation Queensland(QTC) Treasury Corporation is constituted Act 1988 (the Act), with the Under Treasurer designated as the 1 general information 12 QTC is the State’s central financing authority and 2 Summary of significant accounting policies 12 for providing debt funding, liability management, cash to public sector clients. These services, which form 3 Segment reporting 14 undertaken on a cost-recovery basis with QTC lending 4 interest income and interest expense the benefits/costs of liability and from capital markets 15 operations sector entities. 5 Fees – management 16 The majority of QTC’s profits from its Capital Markets earned from the investment of QTC’s equity. QTC ensures 6 Net change in fair 16 value of unit trusts it has adequate capital to manage its risks. 7 Interest on fixed rate 17 notes QTC holds a portfolio of assets which were transferred 8 administration expenses 17 the investments of QTC’s Long Term Assets segment and 9 financial assets at fair value term obligations of the State such as insurance and through profit or loss 18 State fixed rate notes which has resulted in the State QTC bears the impact of fluctuations in the value and 10 Derivative financial 19 assets The Long Term Asset Advisory Board is responsible for 11 Onlendings 19 not form part of QTC’s day-to-day Capital Markets 12 Derivative financial 19 liabilities managed by QIC Limited (QIC). 13 financial liabilities at fair value Although there is no domestic requirement for the through profit or loss 20 meet offshore requirements and to better meet the 14 financial liabilities at amortised cost 21 general purpose financial report has been prepared. 15 Notes to the statement 21 The of cash half-year flows financial statements do not include all financial statements and therefore cannot be expected 16 Contingent liabilities 21 performance, financial position and financing and 17 Funding facilities 21 report. They should be read in conjunction with the 2 Summary of significant accounting (a) Basis of preparation The half-year financial report is a general purpose Interim Financial Reporting. Compliance with AASB 134 ensures compliance Reporting Standard Interim Financial Reporting. IAS 34 The half-year report does not type normally included in an annual financial report annual financial report. Other than as stated in note 2(b), the accounting statements have been applied consistently with those Compliance with International Financial Reporting Standards While QTC is designated as a not-for-profit entity, requirements of International Financial Reporting Basis of measurement The financial statements are prepared on the basis of where otherwise stated. Functional and presentation currency These financial statements are presented in Australian Classification of assets and liabilities The balance sheet is presented on a liquidity basis. of liquidity and are not distinguished between current (b) Change in accounting policy On 1 July 2012, the Corporation changed its accounting At 30 June 2012, QTC held $160.819 million in a reserve risk. These reserves are measured for capital adequacy accounting purposes under Australian Accounting voluntarily to provide greater consistency with market There is no impact on the financial position earnings within equity. Comparative figures for 2011-12 have been restated, as changes to the Statement of Comprehensive Income, Sheet of QTC due to the reclassification of reserves (c) Cash Cash assets include only those funds held at bank and (d) Financial assets and financial liabilities Recognition and derecognition Financial assets and financial liabilities are recognised to the contractual provisions of the financial A financial asset is derecognised when the contractual expire or are transferred and no longer controlled by A financial liability is removed from the balance sheet is discharged, cancelled or expires. 12 QUEENSLAND TREASURY CORPORATION Half-yearly rePOr T December 2012
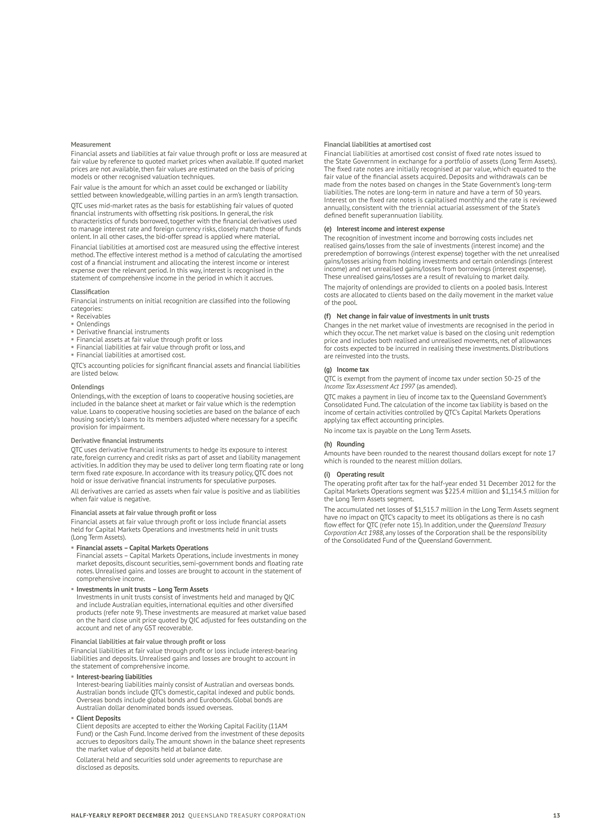
Measurement Financial assets and liabilities at fair value through profit or loss are measured at fair value by reference to quoted market prices when available. If quoted market prices are not available, then fair values are estimated on the basis of pricing models or other recognised valuation techniques.Fair value is the amount for which an asset could be exchanged or liability settled between knowledgeable, willing parties in an arm’s length transaction.QTC uses mid-market rates as the basis for establishing fair values of quoted financial instruments with offsetting risk positions. In general, the risk characteristics of funds borrowed, together with the financial derivatives used to manage interest rate and foreign currency risks, closely match those of funds onlent. In all other cases, the bid-offer spread is applied where material.Financial liabilities at amortised cost are measured using the effective interest method. The effective interest method is a method of calculating the amortised cost of a financial instrument and allocating the interest income or interest expense over the relevant period. In this way, interest is recognised in the statement of comprehensive income in the period in which it accrues. ClassificationFinancial instruments on initial recognition are classified into the following categories: §receivables §Onlendings §Derivative financial instruments §Financial assets at fair value through profit or loss §Financial liabilities at fair value through profit or loss, and §Financial liabilities at amortised cost.QTC’s accounting policies for significant financial assets and financial liabilities are listed below.OnlendingsOnlendings, with the exception of loans to cooperative housing societies, are included in the balance sheet at market or fair value which is the redemption value. Loans to cooperative housing societies are based on the balance of each housing society’s loans to its members adjusted where necessary for a specific provision for impairment.Derivative financial instrumentsQTC uses derivative financial instruments to hedge its exposure to interest rate, foreign currency and credit risks as part of asset and liability management activities. In addition they may be used to deliver long term floating rate or long term fixed rate exposure. In accordance with its treasury policy, QTC does not hold or issue derivative financial instruments for speculative purposes.all derivatives are carried as assets when fair value is positive and as liabilities when fair value is negative. Financial assets at fair value through profit or loss Financial assets at fair value through profit or loss include financial assets held for Capital Markets Operations and investments held in unit trusts (Long Term Assets). §Financial assets – Capital Markets Operations Financial assets – Capital Markets Operations, include investments in money market deposits, discount securities, semi-government bonds and floating rate notes. Unrealised gains and losses are brought to account in the statement of comprehensive income. §Investments in unit trusts – Long Term Assets Investments in unit trusts consist of investments held and managed by QIC and include Australian equities, international equities and other diversified products (refer note 9). These investments are measured at market value based on the hard close unit price quoted by QIC adjusted for fees outstanding on the account and net of any GST recoverable.Financial liabilities at fair value through profit or lossFinancial liabilities at fair value through profit or loss include interest-bearing liabilities and deposits. Unrealised gains and losses are brought to account in the statement of comprehensive income. §Interest-bearing liabilities Interest-bearing liabilities mainly consist of Australian and overseas bonds. Australian bonds include QTC’s domestic, capital indexed and public bonds. Overseas bonds include global bonds and Eurobonds. Global bonds are Australian dollar denominated bonds issued overseas. §Client Deposits Client deposits are accepted to either the Working Capital Facility (11AM Fund) or the Cash Fund. Income derived from the investment of these deposits accrues to depositors daily. The amount shown in the balance sheet represents the market value of deposits held at balance date. Collateral held and securities sold under agreements to repurchase are disclosed as deposits. Financial liabilities at amortised cost Financial liabilities at amortised cost consist of fixed rate notes issued to the State Government in exchange for a portfolio of assets (Long Term Assets). The fixed rate notes are initially recognised at par value, which equated to the fair value of the financial assets acquired. Deposits and withdrawals can be made from the notes based on changes in the State Government’s long-term liabilities. The notes are long-term in nature and have a term of 50 years. Interest on the fixed rate notes is capitalised monthly and the rate is reviewed annually, consistent with the triennial actuarial assessment of the State’s defined benefit superannuation liability. (e) Interest income and interest expense The recognition of investment income and borrowing costs includes net realised gains/losses from the sale of investments (interest income) and the pre redemption of borrowings (interest expense) together with the net unrealised gains/losses arising from holding investments and certain onlendings (interest income) and net unrealised gains/losses from borrowings (interest expense). These unrealised gains/losses are a result of revaluing to market daily. The majority of onlendings are provided to clients on a pooled basis. Interest costs are allocated to clients based on the daily movement in the market value of the pool.(f) Net change in fair value of investments in unit trusts Changes in the net market value of investments are recognised in the period in which they occur. The net market value is based on the closing unit redemption price and includes both realised and unrealised movements, net of allowances for costs expected to be incurred in realising these investments. Distributions are reinvested into the trusts.(g) Income taxQTc is exempt from the payment of income tax under section 50-25 of the Income Tax Assessment Act 1997 (as amended).QTC makes a payment in lieu of income tax to the Queensland Government’s Consolidated Fund. The calculation of the income tax liability is based on the income of certain activities controlled by QTC’s Capital Markets Operations applying tax effect accounting principles. No income tax is payable on the Long Term Assets.(h) Roundingamounts have been rounded to the nearest thousand dollars except for note 17 which is rounded to the nearest million dollars. (i) Operating resultThe operating profit after tax for the half-year ended 31 December 2012 for the Capital Markets Operations segment was $225.4 million and $1,154.5 million for the Long Term Assets segment. The accumulated net losses of $1,515.7 million in the Long Term Assets segment have no impact on QTC’s capacity to meet its obligations as there is no cash flow effect for QTC (refer note 15). In addition, under the Queensland Treasury Corporation Act 1988, any losses of the corporation shall be the responsibility of the Consolidated Fund of the Queensland Government. Half-yearly report December 2012 QUEENSLAND TREASURY CORPORATION
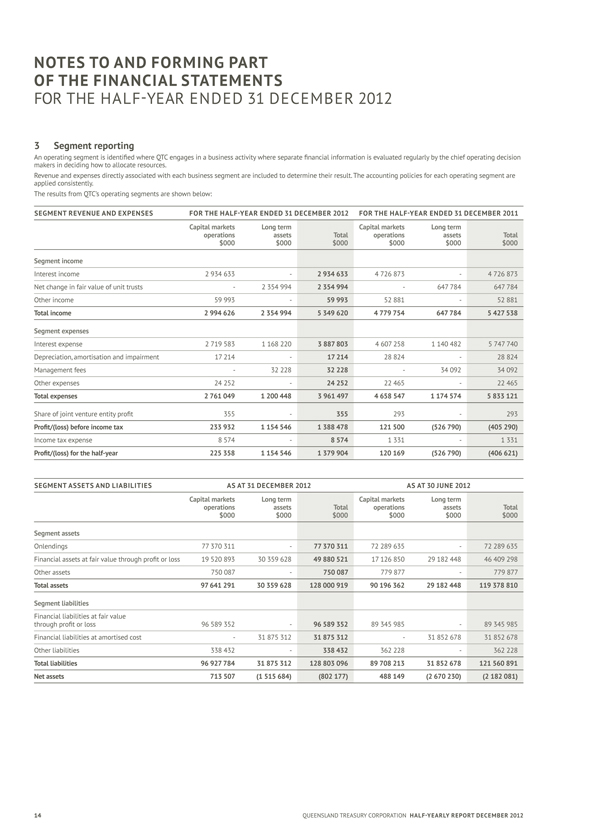
NOTES TO AND Forming PART OF THE FINANCIAL STATEMENTS for The Half-year ended 31 December 2012 3 Segment reporting An operating segment is identified where QTC engages in a business activity makers in deciding how to allocate resources. Revenue and expenses directly associated with each business segment are applied consistently. The results from QTC’s operating segments are shown below: SEgMENTRE venue AND EXPENSES FOR THE HALF -YEAR ENDED 31 DECEMBER 2012 FORTHE HALF -YEAR ENDED 31 DECEMBER 2011 Capital markets Long term Capital markets Long term operations assets Total operations assets Total $000 $000 $000 $000 $000 $000 Segment income interest income 2 934 633 - 2 934 633 4 726 873 - 4 726 873 Net change in fair value of unit - 2 trusts 354 994 2 354 994 - 647 784 647 784 Other income 59 993 - 59 993 52 881 - 52 881 Total income 2 994 626 2 354 994 5 349 620 4 779 754 647 784 5 427 538 Segment expenses interest expense 2 719 583 1 168 220 3 887 803 4 607 258 1 140 482 5 747 740 Depreciation, amortisation and impairment 17 214 - 17 214 28 824 - 28 824 Management fees - 32 228 32 228 - 34 092 34 092 Other expenses 24 252 - 24 252 22 465 - 22 465 Total expenses 2 761 049 1 200 448 3 961 497 4 658 547 1 174 574 5 833 121 Share of joint venture entity 355 profit - 355 293 - 293 Profit/(loss) before 233 932 1 154 546 income 1 388 478 tax 121 500 (526 790) (405 290) income tax expense 8 574 - 8 574 1 331 - 1 331 Profit/(loss) for the half-year225 358 1 154 546 1 379 904 120 169 (526 790) (406 621) SEgMENT ASSETS AND LIABILITIES ASAT 31 DECEMBER 2012 ASAT 30 JuNE 2012 Capital markets Long term Capital markets Long term operations assets Total operations assets Total $000 $000 $000 $000 $000 $000 Segment assets Onlendings 77 370 311 - 77 370 311 72 289 635 - 72 289 635 Financial assets at fair19value 520 893 through 30 359 628 profit 49 880 521 or 17 loss 126 850 29 182 448 46 409 298 Other assets 750 087 - 750 087 779 877 - 779 877 Total assets 97 641 291 30 359 628 128 000 919 90 196 362 29 182 448 119 378 810 Segment liabilities financial liabilities at fair value through profit or loss 96 589 352 - 96 589 352 89 345 985 - 89 345 985 financial liabilities at amortised cost - 31 875 312 31 875 312 - 31 852 678 31 852 678 Other liabilities 338 432 - 338 432 362 228 - 362 228 Total liabilities 96 927 784 31 875 312 128 803 096 89 708 213 31 852 678 121 560 891 Net assets 713 507 (1 515 684) (802 177) 488 149 (2 670 230) (2 182 081) 14 QUEENSLAND TREASURY CORPORATION Half-yearly rePOr T December 2012
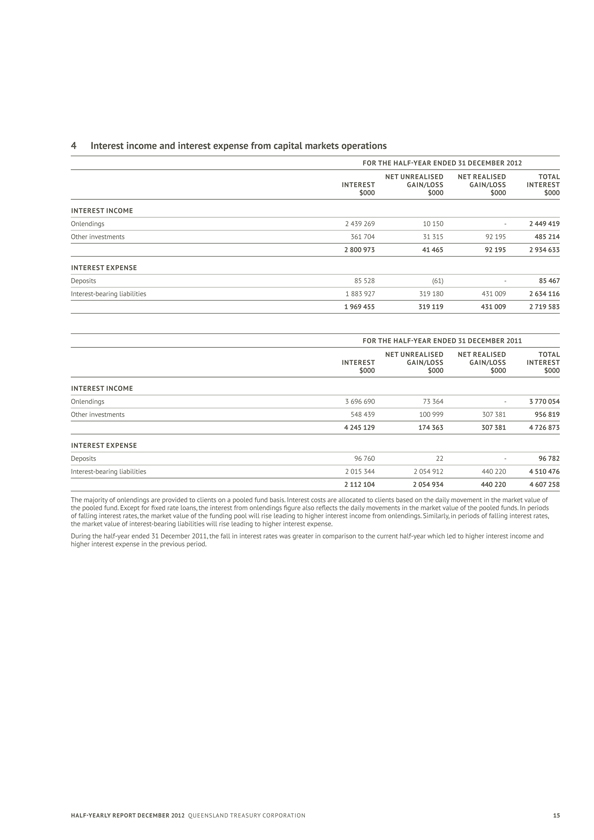
4 Interest income and interest expense from capital markets operations FOR THE HALF-YEAR ENDED 31 DECEMBER 2012 NET UNREALISED NET REALISED TOTAL INTEREST GAIN/LOSS GAIN/LOSS INTEREST $000 $000 $000 $000 INTEREST INCOME Onlendings 2 439 269 10 150 - 2 449 419 Other investments 361 704 31 315 92 195 485 214 2 800 973 41 465 92 195 2 934 633 INTEREST EXPENSE Deposits 85 528 (61) - 85 467 Interest-bearing liabilities 1 883 927 319 180 431 009 2 634 116 1 969 455 319 119 431 009 2 719 583 FOR THE HALF-YEAR ENDED 31 DECEMBER 2011 NET uNREALISED NET REALISED TOTAL INTEREST GAIN/LOSS GAIN/LOSS INTEREST $000 $000 $000 $000 INTEREST INCOME Onlendings 3 696 690 73 364 - 3 770 054 Other investments 548 439 100 999 307 381 956 819 4 245 129 174 363 307 381 4 726 873 INTEREST E xPENSE Deposits 96 760 22 - 96 782 Interest-bearing liabilities 2 015 344 2 054 912 440 220 4 510 476 2 112 104 2 054 934 440 220 4 607 258 The majority of onlendings are provided to clients on a pooled fund basis. Interest costs are allocated to clients based on the daily movement in the market value of the pooled fund. Except for fixed rate loans, the interest from onlendings figure also reflects the daily movements in the market value of the pooled funds. In periods of falling interest rates, the market value of the funding pool will rise leading to higher interest income from onlendings. Similarly, in periods of falling interest rates, the market value of interest-bearing liabilities will rise leading to higher interest expense. During the half-year ended 31 December 2011, the fall in interest rates was greater in comparison to the current half-year which led to higher interest income and higher interest expense in the previous period. Half-yearly rePOrT December 2012 QUEENSLAND TREASURY CORPORATION 15
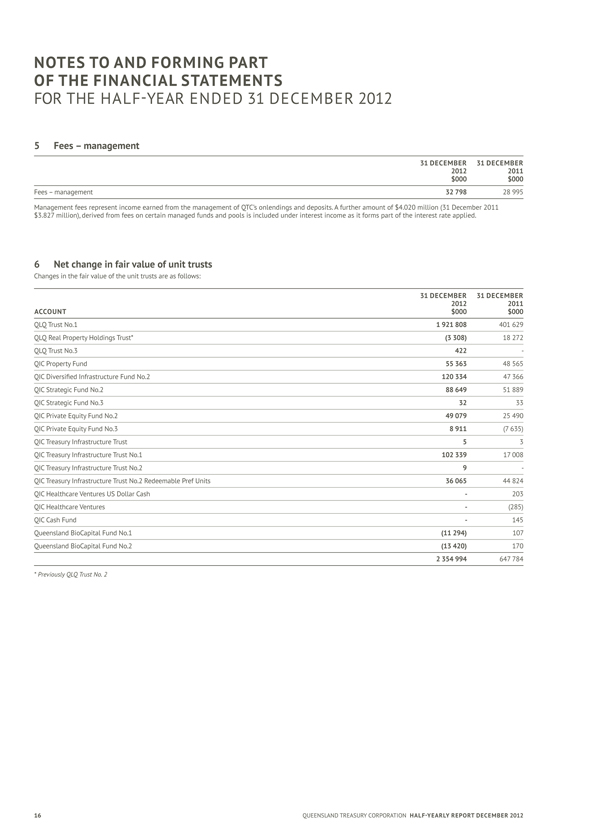
NOTES TO AND FORMING PART OF THE FINANCIAL STATEMENTS FOR THE HALF-YEAR ENDED 31 DECEMBER 2012 5 FEES – management 31 DECEMBER 31 DECEMBER 2012 2011 $000 $000 Fees – management 32 798 28 995 Management fees represent income earned from the management of QTC’s onlendings and deposits. A further amount of $4.020 million (31 December 2011 $3.827 million), derived from fees on certain managed funds and pools is included under interest income as it forms part of the interest rate applied. 6 Net change in fair value of unit trusts Changes in the fair value of the unit trusts are as follows: 31 DECEMBER 31 DECEMBER 2012 2011 ACCOuNT $000 $000 QLQ Trust No.1 1 921 808 401 629 QLQ Real Property Holdings Trust* (3 308) 18 272 QLQ Trust No.3 422 -Qic Property fund 55 363 48 565 QIC Diversified Infrastructure Fund No.2 120 334 47 366 QIC Strategic Fund No.2 88 649 51 889 QIC Strategic Fund No.3 32 33 QIC Private Equity Fund No.2 49 079 25 490 QIC Private Equity Fund No.3 8 911 (7 635) Qic Treasury infrastructure Trust 5 3 QIC Treasury Infrastructure Trust No.1 102 339 17 008 QIC Treasury Infrastructure Trust No.2 9 -QIC Treasury Infrastructure Trust No.2 Redeemable Pref Units36 065 44 824 Qic Healthcare ventures uS Dollar cash - 203 Qic Healthcare ventures - (285) Qicc ash fund - 145 Queensland BioCapital Fund No.1 (11 294) 107 Queensland BioCapital Fund No.2 (13 420) 170 2 354 994 647 784 * Previously QLQ Trust No. 2 16 QUEENSLAND TREASURY CORPORATION Half-yearly REPORT December 2012
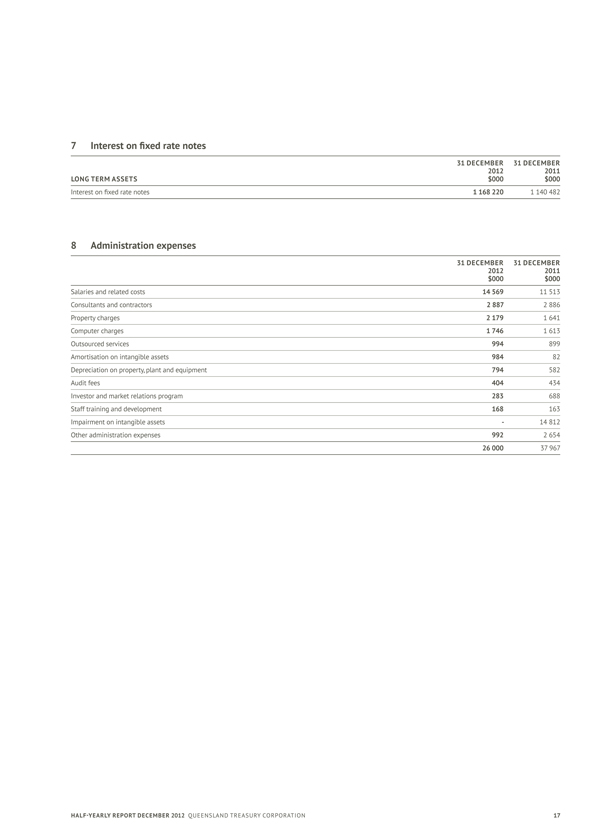
7 interest on fixed rate notes 31 DECEMBER 31 DECEMBER 2012 2011 LONg TERMASSETS $000 $000 Interest on fixed rate notes 1 168 220 1 140 482 8 Administration expenses 31 DECEMBER 31 DECEMBER 2012 2011 $000 $000 Salaries and related costs 14 569 11 513 consultants and contractors 2 887 2 886 Property charges 2 179 1 641 Computer charges 1 746 1 613 Outsourced services 994 899 Amortisation on intangible assets 984 82 Depreciation on property, plant and equipment 794 582 audit fees 404 434 Investor and market relations program 283 688 Staff training and development 168 163 Impairment on intangible assets - 14 812 Other administration expenses 992 2 654 26 000 37 967 Half-yearly rePOrT December 2012 QUEENSLAND TREASURY CORPORATION 17
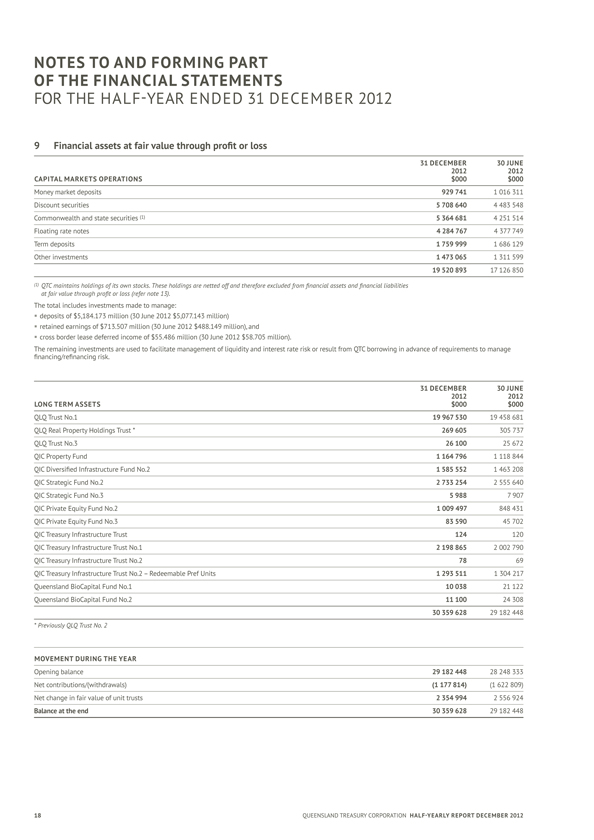
NOTES TO AND FORMING PART OF THE FINANCIAL STATEMENTS FOR THE HALF-YEAR ENDED 31 December 2012 9 Financial assets at fair value through 31 DECEMBER 30 JUNE 2012 2012 CAPITAL MARKETSOPERATIONS $000 $000 Money market deposits 929 741 1 016 311 Discount securities 5 708 640 4 483 548 commonwealth and state securities (1) 5 364 681 4 251 514 Floating rate notes 4 284 767 4 377 749 Term deposits 1 759 999 1 686 129 Other investments 1 473 065 1 311 599 19 520 893 17 126 850 QTC maintains holdings of its own stocks. These holdings are netted off and therefore excluded from financial assets and financial liabilities at fair value through profit or loss (refer note 13).The total includes investments made to manage: §deposits of $5,184.173 million (30 June 2012 $5,077.143 million) §retained earnings of $713.507 million (30 June 2012 $488.149 million), and §cross border lease deferred income of $55.486 million (30 June 2012 $58.705 million). The remaining investments are used to facilitate management of liquidity and interest rate risk or result from QTC borrowing in advance of requirements to manage financing/refinancing risk. 31 DECEMBER 30 June 2012 2012 LONG TERMASSETS $000 $000 QLQ Trust No.1 19 967 530 19 458 681 QLQ Real Property Holdings Trust * 269 605 305 737 QLQ Trust No.3 26 100 25 672 Qic Property fund 1 164 796 1 118 844 QIC Diversified Infrastructure Fund No.2 1 585 552 1 463 208 QIC Strategic Fund No.2 2 733 254 2 555 640 QIC Strategic Fund No.3 5 988 7 907 QIC Private Equity Fund No.2 1 009 497 848 431 QIC Private Equity Fund No.3 83 590 45 702 Qic Treasury infrastructure Trust 124 120 QIC Treasury Infrastructure Trust No.1 2 198 865 2 002 790 QIC Treasury Infrastructure Trust No.2 78 69 QIC Treasury Infrastructure Trust No.2 – Redeemable Pref Units1 293 511 1 304 217 Queensland BioCapital Fund No.1 10 038 21 122 Queensland BioCapital Fund No.2 11 100 24 308 30 359 628 29 182 448 * Previously QLQ Trust No. 2 MOVEMENT DURING THE YEAR Opening balance 29 182 448 28 248 333 Net contributions/(withdrawals) (1 177 814) (1 622 809) Net change in fair value of unit trusts 2 354 994 2 556 924 Balance at the end 30 359 628 29 182 448 18 QUEENSLAND TREASURY CORPORATION Half-yearly report December 2012
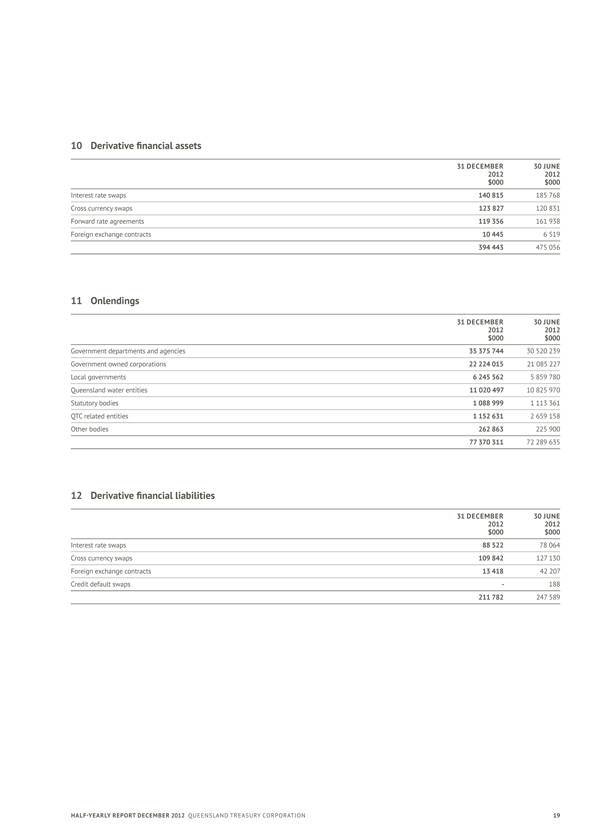
10Derivative financial assets 31 DECEMBER 30 June 2012 2012 $000 $000 interest rate swaps 140 815 185 768 cross currency swaps 123 827 120 831 Forward rate agreements 119 356 161 938 Foreign exchange contracts 10 445 6 519 394 443 475 056 11 Onlendings 31 DECEMBER 30 June 2012 2012 $000 $000 Government departments and agencies 35 375 744 30 520 239 government owned corporations 22 224 015 21 085 227 Local governments 6 245 562 5 859 780 Queensland water entities 11 020 497 10 825 970 Statutory bodies 1 088 999 1 113 361 QTc related entities 1 152 631 2 659 158 Other bodies 262 863 225 900 77 370 311 72 289 635 12Derivative financial liabilities 31 DECEMBER 30 JuNE 2012 2012 $000 $000 interest rate swaps 88 522 78 064 cross currency swaps 109 842 127 130 Foreign exchange contracts 13 418 42 207 credit default swaps - 188 211 782 247 589 Half-yearly report December 2012 QUEENSLAND TREASURY CORPORATION 19
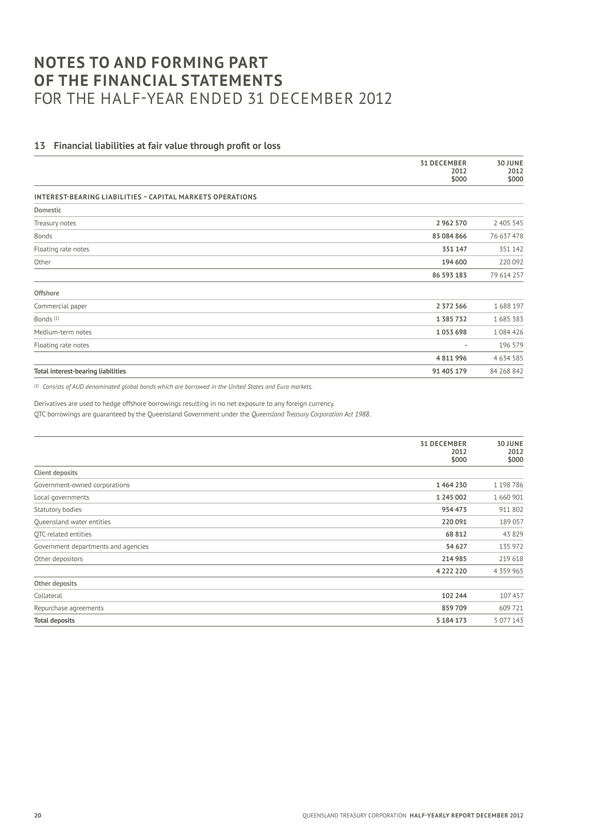
NOTES TO AND FORMING PART OF THE FINANCIAL STATEMENTS FOR THE Half-year ENDED 31 December 2012 13 Financial liabilities at fair value 31 DECEMBER 30 JUNE 2012 2012 $000 $000 INTEREST- BEARING LIABILITIES – CAPITAL MARKETS OPERATIONS Domestic Treasury notes 2 962 570 2 405 545 bonds 83 084 866 76 637 478 Floating rate notes 351 147 351 142 Other 194 600 220 092 86 593 183 79 614 257 Offshore commercial paper 2 372 566 1 688 197 bonds (1) 1 385 732 1 685 383 medium-term notes 1 053 698 1 084 426 Floating rate notes - 196 579 4 811 996 4 634 585 Total interest-bearing liabilities 91 405 179 84 268 842 (1) Consists of AUD denominated global bonds which are borrowed in the United States and Euro markets. Derivatives are used to hedge offshore borrowings resulting in no net QTC borrowings are guaranteed by Queensland the Treasury Queensland Corporation Act 1988. Government under the 31 DECEMBER 30 JUNE 2012 2012 $000 $000 Client deposits government- owned corporations 1 464 230 1 198 786 Local governments 1 245 002 1 660 901 Statutory bodies 954 473 911 802 Queensland water entities 220 091 189 057 QTC related entities 68 812 43 829 Government departments and agencies 54 627 135 972 Other depositors 214 985 219 618 4 222 220 4 359 965 Other deposits collateral 102 244 107 457 Repurchase agreements 859 709 609 721 Total deposits 5 184 173 5 077 143 20 QUEENSLAND TREASURY CORPORATION Half-yearly REPORT December 2012
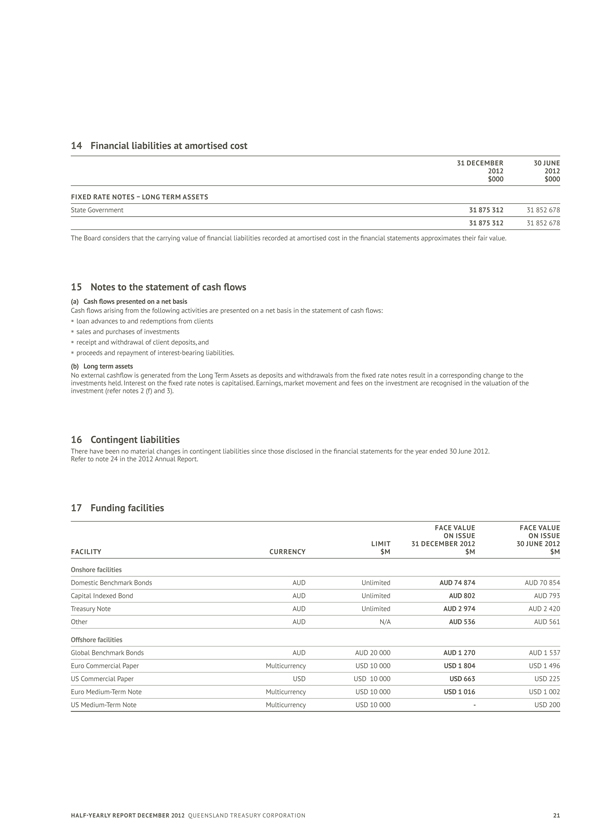
14 Financial liabilities at amortised cost 31 DECEMBER 30 JUNE 2012 2012 $000 $000 FIXED RATE NOTES – LONG TERM ASSETS State government 31 875 312 31 852 678 31 875 312 31 852 678 The Board considers that the carrying value of financial liabilities 15 Notes to the statement of cash flows(a) Cash flows presented on a net basis Cash flows arising from the following activities are presented on a net basis in the statement of cash flows: §loan advances to and redemptions from clients §sales and purchases of investments §receipt and withdrawal of client deposits, and §proceeds and repayment of interest-bearing liabilities.(b) Long term assets No external cashflow is generated from the Long Term Assets as deposits and withdrawals from the fixed rate notes result in a corresponding change to the investments held. Interest on the fixed rate notes is capitalised. Earnings, market movement and fees on the investment are recognised in the valuation of the investment (refer notes 2 (f) and 3).16 Contingent liabilities There have been no material changes in contingent liabilities since those disclosed in the financial statements for the year ended 30 June 2012. Refer to note 24 in the 2012 Annual Report. 17 Funding facilities FACE VALUE FACE VALUE ON ISSUE ON ISSUE LIMIT 31 DECEMBER 2012 30 JUNE 2012 FACILITY CURRENCY $M $M $M Onshore facilities Domestic Benchmark Bonds auD unlimited AUD 74 874 auD 70 854 capital indexed bond auD unlimited AuD 802 auD 793 Treasury note auD unlimited AUD 2 974 auD 2 420 Other AUD N/A AUD 536 AUD 561 Offshore facilities Global Benchmark Bonds AUD AUD 20 000 AUD 1 270 AUD 1 537 euro commercial Paper multicurrency USD 10 000 USD 1 804 USD 1 496 US commercial Paper USD USD 10 000 uSD 663 USD 225 euro medium-Term note multicurrency USD 10 000 uSD 1 016 USD 1 002 US medium-Term note multicurrency USD 10 000 - USD 200 Half-yearly REPORT December 2012 QUEENSLAND TREASURY CORPORATION 21
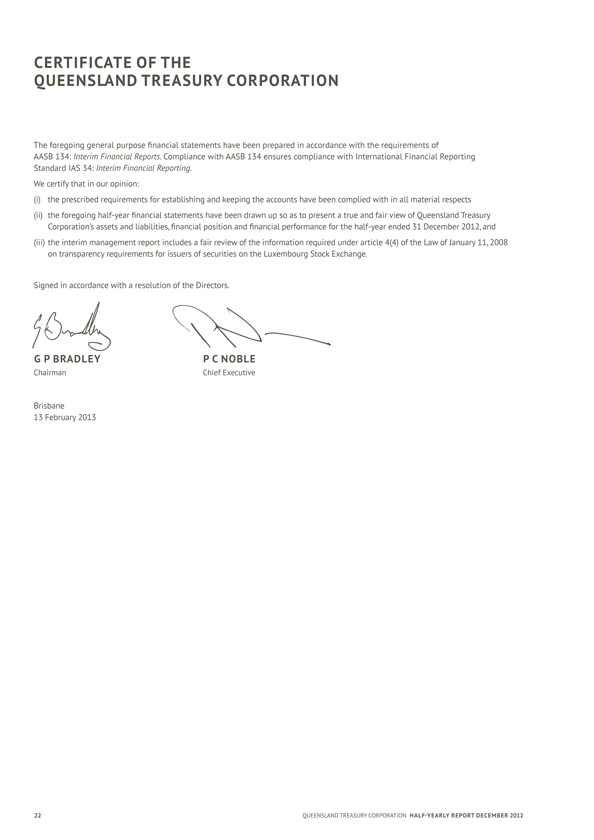
CERTIFICATE OF THE QUEENSLAND TREASURY CORPORATION he foregoing general purpose financial statements have been prepared in accordance with the requirements of AASB 134: Interim Financial Reports. Compliance with AASB 134 ensures compliance with International Financial Reporting Standard IAS 34: Interim Financial Reporting. We certify that in our opinion:(i) the prescribed requirements for establishing and keeping the accounts have been complied with in all material respects(ii) the foregoing half-year financial statements have been drawn up so as to present a true and fair view of Queensland Treasury Corporation’s assets and liabilities, financial position and financial performance for the half-year ended 31 December 2012, and(iii) the interim management report includes a fair review of the information required under article 4(4) of the Law of January 11, 2008 on transparency requirements for issuers of securities on the Luxembourg Stock Exchange. Signed in accordance with a resolution of the Directors. G P BRADLEY P C NOBLE chairman chief executive brisbane 13 february 2013 22 QUEENSLAND TREASURY CORPORATION Half-yearly REPORT December 2012
Independent Auditor ’s Review Report To Queensland Treasury Corporation Review Report on the Half-year Financial Report I have reviewed the accompanying half-year financial report of Queensland Treasury Corporation, which comprises the balance sheet as at 31 December 2012, and the statement of comprehensive income, statement of changes in equity and statement of cash flows for the half-year ended on that date, notes comprising a summary of significant accounting policies and other explanatory information, and the certificates given by the Chairman and Chief Executive. The Corporation Sole’s responsibility for the Half-year Financial Report The Corporation Sole is responsible for the preparation of the half-year financial report that gives a true and fair view in accordance with Australian Accounting Standards and for such internal control as the Corporation Sole determines is necessary to enable the preparation of the half-year financial report that is free from material misstatement, whether due to fraud or error. Auditor’s Responsibility My responsibility is to express a conclusion on the half-year financial report based on my review. The review was conducted in accordance with the Auditor-General of Queensland Auditing Standards and Auditing Standard on Review Engagements ASRE 2410 Review of a Financial Report Performed by the Independent Auditor of the Entity, in order to state whether, on the basis of the procedures described, I have become aware of any matter that makes me believe that the half-year financial report is not in accordance with Australian Accounting Standards, including: giving a true and fair view of Queensland Treasury Corporation’s financial position as at 31 December 2012 and its performance for the half-year ended on that date and complying with Accounting Standard AASB 134 Interim Financial Reporting. As the auditor of Queensland Treasury Corporation, ASRE 2410 requires that I comply with the ethical requirements relevant to the audit of the annual financial report. A review of a half-year financial report consists of making enquiries, primarily of persons responsible for financial and accounting matters, and applying analytical and other review procedures. A review is substantially less in scope than an audit conducted in accordance with Australian Auditing Standards and consequently does not enable me to obtain assurance that I would become aware of all significant matters that might be identified in an audit. Accordingly, I do not express an audit opinion. Independence The Auditor-General Act 2009 promotes the independence of the Auditor-General and all authorised auditors. The Auditor-General is the auditor of all Queensland public sector entities and can be removed only by Parliament. The Auditor-General may conduct an audit in any way considered appropriate and is not subject to direction by any person about the way in which audit powers are to be exercised. The Auditor-General has for the purposes of conducting an audit, access to all documents and property and can report to Parliament matters which in the Auditor-General’s opinion are significant. Conclusion Based on my review, which is not an audit, I have not become aware of any matter that makes me believe that the half-year financial report of Queensland Treasury Corporation does not: (a) present a true and fair view, in all material respects, of the financial position of Queensland Treasury Corporation as at 31 December 2012, and of its financial performance and its cash flows for the half-year ended on that date; (b) comply with Australian Accounting Standard AASB 134 Interim Financial Reporting. Half-yearly REPORT December 2012 QUEENSLAND TREASURY CORPORATION
Other Matters - Electronic Presentation of the Reviewed Financial Report This review report relates to the financial report of Queensland Treasury Corporation for the half-year ended 31 December 2012. Where the financial report is included on Queensland Treasury Corporation’s website, the Corporation is responsible for the integrity of Queensland Treasury Corporation’s website and I have not been engaged to report on the integrity of Queensland Treasury Corporation’s website. The review report refers only to the subject matter described above. It does not provide an opinion on any other information which may have been hyperlinked to/from these statements or otherwise included with the financial report. If users of the financial report are concerned with the inherent risks arising from publication on a website, they are advised to refer to the hard copy of the reviewed financial report to confirm the information contained in this website version of the financial report. These matters also relate to the presentation of the reviewed financial report in other electronic media. A M GREAVES FCA Auditor-General of Queensland Queensland Audit Office Brisbane AUDITOR GENERAL 15 FEB 2013 OF QUEENSLAND Queensland Audit Office Brisbane QUEENSLAND TREASURY CORPORATION Half-yearly REPORT December 2012
Management Report For the Half-year ended 31 December 2012 Review of operations QTC made an operating profit for the half-year ended 31 December 2012 of AUD 1,379.9 million consisting of the following operating segment results: nn Capital Markets Operations During the period from 1 July 2012 to 31 December 2012, QTC continued in its ordinary course of business as the State of Queensland’s central financing authority and corporate treasury services provider. The operating profit after tax for the half-year ended 31 December 2012 for the Capital Markets Operations segment was AUD 225.4 million. The profit is primarily due to net unrealised accounting gains on QTC’s borrowing and lending operations. nnLong Term Assets QTC holds a portfolio of assets which were transferred to QTC by the State Government under an administrative arrangement. These assets are the investments of QTC’s Long Term Assets segment and were accumulated to fund superannuation and other long-term obligations of the State such as insurance and long service leave. In return, QTC issued to the State fixed rate notes which has resulted in the State receiving a fixed rate of return on the notes, while QTC bears the impact of fluctuations in the value and returns on the asset portfolio. QTC made an operating profit after tax of AUD 1,154.5 million for the Long Term Assets segment. The accumulated net losses incurred by the Long Term Assets segment to date have no impact on QTC’s capacity to meet its obligations as there is no cash flow effect for QTC. In addition, under the Queensland Treasury Corporation Act 1988, any losses of the Corporation shall be the responsibility of the Consolidated Fund of the Queensland Government. Principal risks and uncertainties Financial market conditions improved over the course of the second half of 2012 as the global economy stabilised. Improved economic conditions are expected throughout 2013 however markets will be susceptible to downside risks to global growth. g P BRADLEY P C NOBLE chairman chief executive brisbane 13 february 2013 Half-yearly REPORT December 2012 QUEENSLAND TREASURY CORPORATION

26 QUEENSLAND TREASURY CORPORATION HALF -YEARLY REPORT DECEMBER 2012
QUEENSLAND TREASURY CORPORATION APPENDICES Contents appendix a 28 appendix b 32 appendix c 33 appendix D 34 27
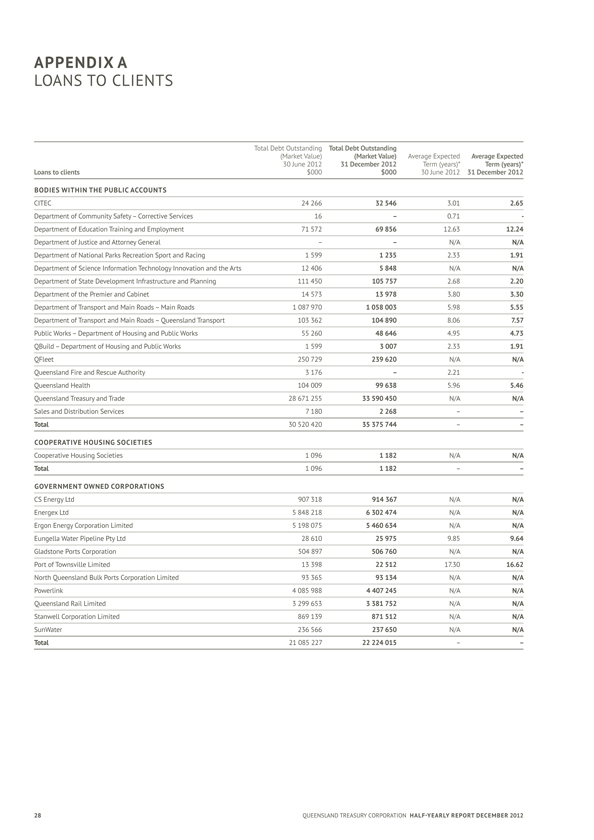
APPENDIX A LOANS TO CLIENTS Total Debt Total Debt Outstanding (Market Value) (Market value) Average Average Expected 30 June 2012 31 December 2012 Term (years)* Term (years)* Loans to clients $000 $000 30 June 2012 31 December 2012 BODIES Within The Public Accounts Citec 24 266 32 546 3.01 2.65 Department of community Safety – corrective Services 16 – 0.71 Department of Education Training and Employment 71 572 69 856 12.63 12.24 Department of Justice and attorney general – – N/A N/a Department of National Parks Recreation 1 Sport 599 and 1 Racing 235 2.33 1.91 Department of Science Information Technology 12 406 Innovation 5 848 and the N/AArts N/a Department of State Development Infrastructure 111 450 and 105 757 Planning 2.68 2.20 Department of the Premier and cabinet 14 573 13 978 3.80 3.30 Department of Transport and main roads – main roads 1 087 970 1 058 003 5.98 5.55 Department of Transport and main roads – Queensland Transport 103 362 104 890 8.06 7.57 Public Works – Department of Housing and 55 260 Public Works 48 646 4.95 4.73 QBuild – Department of Housing and Public 1 599 Works 3 007 2.33 1.91 Qfleet 250 729 239 620 N/A N/a Queensland fire and rescue authority 3 176 – 2.21 Queensland Health 104 009 99 638 5.96 5.46 Queensland Treasury and Trade 28 671 255 33 590 450 N/A N/a Sales and Distribution Services 7 180 2 268 – – Total 30 520 420 35 375 744 – – COOPERATIVE HOUSING SOCIETIES Cooperative Housing Societies 1 096 1 182 N/A N/a Total 1 096 1 182 – – GOVERNMENT OWNED CORPORATIONS CS Energy Ltd 907 318 914 367 N/A N/a Energex Ltd 5 848 218 6 302 474 N/A N/a Ergon Energy Corporation Limited 5 198 075 5 460 634 N/A N/a Eungella Water Pipeline Pty Ltd 28 610 25 975 9.85 9.64 gladstone Ports corporation 504 897 506 760 N/A N/a Port of Townsville limited 13 398 22 512 17.30 16.62 North Queensland Bulk Ports Corporation 93 Limited 365 93 134 N/A N/a Powerlink 4 085 988 4 407 245 N/A N/a Queensland rail limited 3 299 653 3 381 752 N/A N/a Stanwell corporation limited 869 139 871 512 N/A N/a SunWater 236 566 237 650 N/A N/a Total 21 085 227 22 224 015 – – 28 QUEENSLAND TREASURY CORPORATION Half-yearly rePOr T December 2012
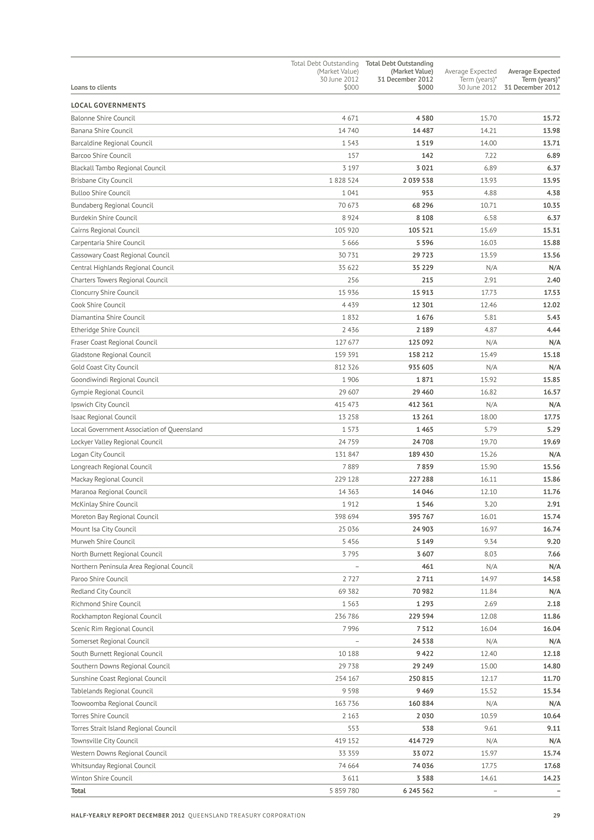
Total Debt Total Debt Outstanding (Market Value) (Market value) Average Average Expected 30 June 2012 31 December 2012 Term (years)* Term (years)* Loans to clients $000 $000 30 June 2012 31 December 2012 LOCAL GOVERNMENTS balonne Shire council 4671 4 580 15.70 15.72 banana Shire council 14 740 14 487 14.21 13.98 Barcaldine Regional Council 1 543 1 519 14.00 13.71 barcoo Shire council 157 142 7.22 6.89 Blackall Tambo Regional Council 3 197 3 021 6.89 6.37 brisbane city council 1 828 524 2 039 538 13.93 13.95 bulloo Shire council 1 041 953 4.88 4.38 Bundaberg Regional Council 70 673 68 296 10.71 10.35 Burdekin Shire Council 8 924 8 108 6.58 6.37 Cairns Regional Council 105 920 105 521 15.69 15.31 carpentaria Shire council 5 666 5 596 16.03 15.88 Cassowary Coast Regional Council 30 731 29 723 13.59 13.56 Central Highlands Regional Council 35 622 35 229 N/A N/a Charters Towers Regional Council 256 215 2.91 2.40 cloncurry Shire council 15 936 15 913 17.73 17.53 Cook Shire Council 4 439 12 301 12.46 12.02 Diamantina Shire council 1 832 1 676 5.81 5.43 Etheridge Shire Council 2 436 2 189 4.87 4.44 Fraser Coast Regional Council 127 677 125 092 N/A N/a Gladstone Regional Council 159 391 158 212 15.49 15.18 gold coast city council 812 326 935 605 N/A N/a Goondiwindi Regional Council 1 906 1 871 15.92 15.85 Gympie Regional Council 29 607 29 460 16.82 16.57 pswich city council 415 473 412 361 N/A N/a Isaac Regional Council 13 258 13 261 18.00 17.75 local government association of Queensland 1 573 1 465 5.79 5.29 Lockyer Valley Regional Council 24 759 24 708 19.70 19.69 Logan City Council 131 847 189 430 15.26 N/a Longreach Regional Council 7 889 7 859 15.90 15.56 Mackay Regional Council 229 128 227 288 16.11 15.86 Maranoa Regional Council 14 363 14 046 12.10 11.76 mckinlay Shire council 1 912 1 546 3.20 2.91 Moreton Bay Regional Council 398 694 395 767 16.01 15.74 mount isa city council 25 036 24 903 16.97 16.74 murweh Shire council 5 456 5 149 9.34 9.20 North Burnett Regional Council 3 795 3 607 8.03 7.66 Northern Peninsula Area Regional Council – 461 N/A N/a Paroo Shire council 2 727 2 711 14.97 14.58 redland city council 69 382 70 982 11.84 N/a richmond Shire council 1 563 1 293 2.69 2.18 Rockhampton Regional Council 236 786 229 594 12.08 11.86 Scenic Rim Regional Council 7 996 7 512 16.04 16.04 Somerset Regional Council – 24 538 N/A N/a South Burnett Regional Council 10 188 9 422 12.40 12.18 Southern Downs Regional Council 29 738 29 249 15.00 14.80 Sunshine Coast Regional Council 254 167 250 815 12.17 11.70 Tablelands Regional Council 9 598 9 469 15.52 15.34 Toowoomba Regional Council 163 736 160 884 N/A N/a Torres Shire council 2 163 2 030 10.59 10.64 Torres Strait Island Regional Council 553 538 9.61 9.11 Townsville city council 419 152 414 729 N/A N/a Western Downs Regional Council 33 359 33 072 15.97 15.74 Whitsunday Regional Council 74 664 74 036 17.75 17.68 Winton Shire council 3 611 3 588 14.61 14.23 Total 5 859 780 6 245 562 – – Half-yearly REPORT December 2012 QUEENSLAND TREASURY CORPORATION 29
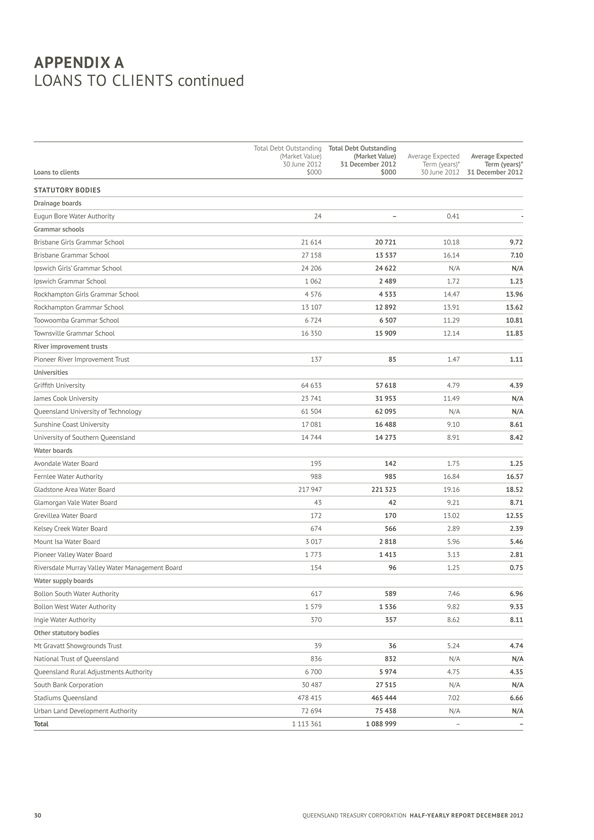
APPENDIX A LOANS TO CLIENTS continued Total Debt Total Debt Outstanding (Market Value) (Market value) Average Average Expected 30 June 2012 31 December 2012 Term (years)* Term (years)* Loans to clients $000 $000 30 June 2012 31 December 2012 STATUTORY BODIES Drainage boards Eugun Bore Water Authority 24 – 0.41 grammar schools brisbane girls grammar School 21 614 20 721 10.18 9.72 brisbane grammar School 27 158 13 537 16.14 7.10 ipswich girls’ grammar School 24 206 24 622 N/A N/a ipswich grammar School 1 062 2 489 1.72 1.23 Rockhampton Girls Grammar School 4 576 4 533 14.47 13.96 Rockhampton Grammar School 13 107 12 892 13.91 13.62 Toowoomba grammar School 6 724 6 507 11.29 10.81 Townsville grammar School 16 350 15 909 12.14 11.83 River improvement trusts Pioneer river improvement Trust 137 85 1.47 1.11 universities Griffith University 64 633 57 618 4.79 4.39 James Cook University 23 741 31 953 11.49 N/a Queensland University of Technology 61 504 62 095 N/A N/a Sunshine coast university 17 081 16 488 9.10 8.61 university of Southern Queensland 14 744 14 273 8.91 8.42 water boards avondale Water board 195 142 1.75 1.25 fernlee Water authority 988 985 16.84 16.57 gladstone area Water board 217 947 221 323 19.16 18.52 Glamorgan Vale Water Board 43 42 9.21 8.71 grevillea Water board 172 170 13.02 12.55 Kelsey Creek Water Board 674 566 2.89 2.39 mount isa Water board 3 017 2 818 5.96 5.46 Pioneer valley Water board 1 773 1 413 3.13 2.81 Riversdale Murray Valley Water Management 154 Board 96 1.25 0.75 water supply boards bollon South Water authority 617 589 7.46 6.96 bollon West Water authority 1 579 1 536 9.82 9.33 Ingie Water Authority 370 357 8.62 8.11 Other statutory bodies Mt Gravatt Showgrounds Trust 39 36 5.24 4.74 national Trust of Queensland 836 832 N/A N/a Queensland Rural Adjustments Authority 6 700 5 974 4.75 4.35 South Bank Corporation 30 487 27 515 N/A N/a Stadiums Queensland 478 415 465 444 7.02 6.66 urban land Development authority 72 694 75 438 N/A N/a Total 1 113 361 1 088 999 – – 30 QUEENSLAND TREASURY CORPORATION Half-yearly REPORT December 2012
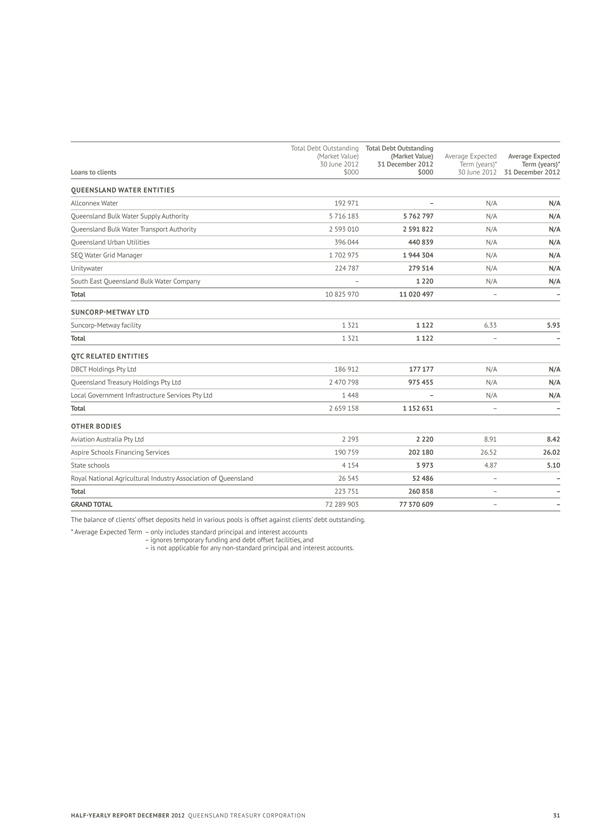
Total Debt Total Debt Outstanding (Market Value) (Market value) Average Average Expected 30 June 2012 31 December 2012 Term (years)* Term (years)* Loans to clients $000 $000 30 June 2012 31 December 2012 QUEENSLANDWATER ENTITIES allconnex Water 192 971 – N/A N/a Queensland Bulk Water Supply Authority5 716 183 5 762 797 N/A N/a Queensland Bulk Water Transport Authority2 593 010 2 591 822 N/A N/a Queensland urban utilities 396 044 440 839 N/A N/a SEQ Water Grid Manager 1 702 975 1 944 304 N/A N/a unitywater 224 787 279 514 N/A N/a South East Queensland Bulk Water Company – 1 220 N/A N/a Total 10 825 970 11 020 497 – – SuNCORP-METwAY LTD Suncorp-metway facility 1 321 1 122 6.33 5.93 Total 1 321 1 122 – – QTC RELATED ENTITIES DBCT Holdings Pty Ltd 186 912 177 177 N/A N/a Queensland Treasury Holdings Pty Ltd 2 470 798 975 455 N/A N/a local government infrastructure Services Pty ltd 1 448 – N/A N/a Total 2 659 158 1 152 631 – – OTHER BODIES aviation australia Pty ltd 2 293 2 220 8.91 8.42 Aspire Schools Financing Services 190 759 202 180 26.52 26.02 State schools 4 154 3 973 4.87 5.10 Royal National Agricultural Industry Association 26 545 of 52 486 Queensland – – Total 223 751 260 858 – –GRAND TOTAL 72 289 903 77 370 609 – – The balance of clients’ offset deposits held in various pools is offset against clients’ debt outstanding. * Average Expected Term – only includes standard principal and interest accounts – ignores temporary funding and debt offset facilities, and – is not applicable for any non-standard principal and interest accounts. Half-yearly REPORT December 2012 QUEENSLAND TREASURY CORPORATION
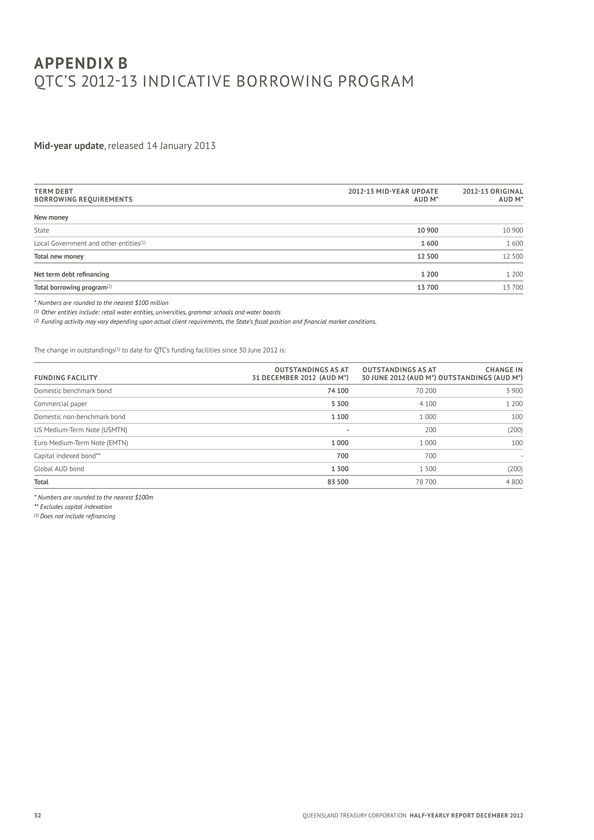
APPENDIX B QTC’S 2012-13 INDICATIVE BORROWING PROGRAM Mid-year update, released 14 January 2013 TERM DEBT 2012-13 MID-YEAR UPDATE 2012-13 ORIGINAL BORROWING REQUIREMENTS AUD M* AuD M* New money State 10 900 10 900 local government and other entities(1) 1 600 1 600 Total new money 12 500 12 500 Net term debt refinancing 1 200 1 200 Total borrowing program(2) 13 700 13 700 * Numbers are rounded to the nearest $100 million (1) Other entities include: retail water entities, universities, grammar schools and water boards (2) Funding activity may vary depending upon actual client requirements, the State’s fiscal position and financial market conditions. The change in Outstandings(1) to date for QTC’s funding facilities since 30 June 2012 is: OUTSTANDINGS AS ( AT) Outstandings AS ( AT) CHANGE ( IN) FUNDING FACILITY 31 DECEMBER 2012 AUD M* 30 JUNE 2012 AUD M* OUTSTANDINGS AUD M* Domestic benchmark bond 74 100 70 200 3 900 commercial paper 5 300 4 100 1 200 Domestic non-benchmark bond 1 100 1 000 100 US Medium-Term Note (USMTN) - 200 (200) Euro Medium-Term Note (EMTN) 1 000 1 000 100 Capital indexed bond** 700 700 -global AUD Bond 1 300 1 500 (200) Total 83 500 78 700 4 800 * Numbers are rounded to the nearest $100m ** Excludes capital indexation (1) Does not include refinancing QUEENSLAND TREASURY CORPORATION Half-yearly REPORT December 20132 2
APPENDIX C GLOSSARY Australian Government Guarantee (AGG): Also known as the Commonwealth Government Guarantee. The global financial crisis had an adverse effect on the state government bond market and threatened the capacity of state governments to deliver critical infrastructure projects. In response, on 25 March 2009, the Australian Government announced that it would provide a time-limited, voluntary guarantee over Australian state and territory government borrowing, available for both existing and new issuances of securities over a range of maturities. On 16 June 2009, the Queensland Government announced it would take up the Australian Government’s offer of the guarantee on all existing AUD denominated benchmark bond lines (global and domestic) issued by QTC with a maturity date of between 12 months and 180 months (1-15 years). On 18 September 2009, the Reserve Bank of Australia (RBA) approved QTC’s application for the Australian Government Guarantee to be applied to selected AUD Domestic Benchmark bonds. On 11 December 2009, the RBA approved QTC’s application for the Australian Government Guarantee to be applied to selected AUD Global Benchmark bonds. The AGG was withdrawn for new borrowings after 31 December 2010. Basis point: One hundredth of one per cent (0.01%). Bond: A financial instrument where the borrower agrees to pay the investor a rate of interest for a fixed period of time. A typical bond will involve regular interest payments and a return of principal at maturity. Commonwealth Government Guarantee (CGG): See Australian Government Guarantee above. CP (commercial paper): A short-term money market instrument issued at a discount with the full face value repaid at maturity. CP can be issued in various currencies with a term to maturity of less than one year. Credit rating: Measures a borrower’s creditworthiness and provides an international framework for comparing the credit quality of issuers and rated debt securities. Rating agencies allocate three kinds of ratings: issuer credit ratings, long-term debt and short-term debt. Issuer credit ratings are among the most widely watched. They measure the creditworthiness of the borrower including its capacity and willingness to meet financial obligations. QTC has a strong rating from two rating agencies—Standard & Poor’s, and Moody’s. Distribution group: A group of financial intermediaries who market and make prices in QTC’s debt instruments. Global financial crisis: The global financial crisis refers to a series of events following the rapid increases in default rates on US sub-prime mortgages over 2007-08. Funding and liquidity problems in the world’s major financial centres morphed into concerns about the solvency of many financial institutions over the first half of 2008-09, peaking in September 2008. The highly coordinated and substantial response to the crisis from fiscal and monetary policy makers around the world led to the stabilisation of markets and created the foundation for the global economic recovery that began in March 2009. GOC: Government-owned Corporation. Issue price: The price at which a new security is issued in the primary market. Liquid: Markets or instruments are described as being liquid, and having depth, if there are enough buyers and sellers to absorb sudden shifts in supply and demand without price distortions. Market value: The price at which an instrument can be purchased or sold in the current market. MTN (Medium-Term Note): A financial debt instrument that can be structured to meet an investor’s requirements in regards to interest rate basis, currency and maturity. MTNs usually have maturities between 9 months and 30 years. QTC: Queensland Treasury Corporation. RBA: Reserve Bank of Australia. T-Note (Treasury Note): A short-term money market instrument issued at a discount with the full face value repaid at maturity. T-Notes are issued in Australian dollars with a term to maturity of less than 1 year. Half-yearly REPORT December 2012 QUEENSLAND TREASURY CORPORATION
APPENDIX D Contacts Queensland Treasury Corporation Level 6, 123 Albert Street Brisbane Queensland Australia GPO Box 1096 Brisbane Queensland Australia 4001 Telephone: +61 7 3842 4600 Facsimile: +61 7 3221 4122 Email: enquiry@qtc.com.au Internet: www.qtc.com.au Queensland Treasury Corporation’s annual and half-yearly reports (ISSN 1837-1256 print; ISSN 1837-1264 online) are available on QTC’s website at www.qtc.com.au/ qtc/public/annual-reports. If you would like a copy of a report posted to you, please call QTC’s Communication and Marketing Group on +61 7 3842 4714. If you would like to comment on a report, please complete the online enquiry form located on our website. Telephone EXECUTIVE +61 7 3842 4611 BUSINESS SERVICES DIVISION People & Performance group +61 7 3842 4761 Risk Services group +61 7 3842 4704 CLIENT SERVICES DIVISION Local government & Statutory Bodies group +61 7 3842 4743 Strategic Partners group +61 7 3842 4901 Treasury & Departments group +61 7 3842 4798 CORPORATE SERVICES DIVISION Client & Market Solutions Delivery +61 7 3842 4644 Communication & Marketing group +61 7 3842 4714 Financial Solutions group +61 7 3842 4601 Operations group +61 7 3842 4641 FUNDING & MARKETS DIVISION Funding & Liquidity group +61 7 3842 4789 Market Strategy & Risk group +61 7 3842 4789 STOCK REGISTRY (LINK MARKET SERVICES LTD) 1800 777 166 QTC is committed to providing accessible services to Queensland residents from culturally and linguistically diverse backgrounds. If you have difficulty understanding this report, please contact QTC’s Communication and Marketing Group on +61 7 3842 4714 and we will arrange for an interpreter to assist you. QUEENSLAND TREASURY CORPORATION Half-yearly REPORT December
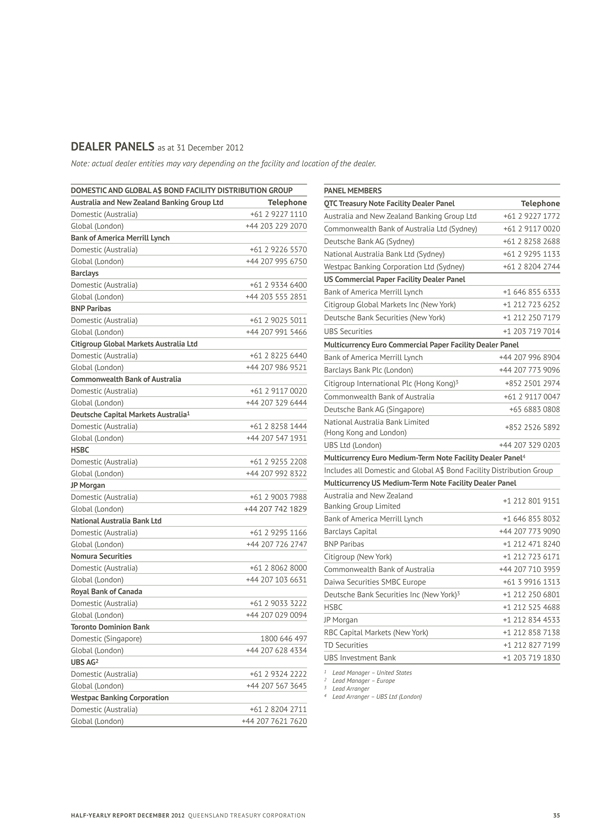
DEALER PANELS as at 31 December 2012 Note: actual dealer entities may vary depending on the facility and location of the dealer. DOMESTIC AND GLOBAL A$ BOND FACILITY DISTRIBUTION GROUP PANEL MEMBERS Australia and New Zealand Banking group Ltd Telephone QTC Treasury Note Facility Dealer Panel Telephone Domestic (Australia) +61 2 9227 1110 Australia and New Zealand+61 2 9227 Banking 1772 Global (London) +44 203 229 2070 Commonwealth Bank of Australia+61 2 9117 0020 Bank of America Merrill Lynch Deutsche Bank AG (Sydney) +61 2 8258 2688 Domestic (Australia) +61 2 9226 5570 National Australia Bank+61Ltd 2 9295 1133 Global (London) +44 207 995 6750 Westpac Banking Corporation+61 2 8204 2744 Ltd Barclays US Commercial Paper Facility Dealer Panel Domestic (Australia) +61 2 9334 6400 Bank of America Merrill+1 646 Lynch 855 6333 Global (London) +44 203 555 2851 Citigroup Global Markets+1 212 Inc 723 6252(New BNP Paribas Domestic (Australia) +61 2 9025 5011 Deutsche Bank Securities+1 212(New 250 7179 Global (London) +44 207 991 5466 UBS Securities +1 203 719 7014 Citigroup global Markets Australia Ltd Multicurrency Euro Commercial Paper Facility Dealer Panel Domestic (Australia) +61 2 8225 6440 Bank of America Merrill+44 Lynch 207 996 8904 Global (London) +44 207 986 9521 Barclays Bank Plc (London) +44 207 773 9096 Commonwealth Bank of Australia 3 Domestic (Australia) +61 2 9117 0020 Citigroup International+852 Plc 2501 2974 (Hong Commonwealth Bank of Australia+61 2 9117 0047 Global (London) +44 207 329 6444 Deutsche Bank AG (Singapore) +65 6883 0808 Deutsche Capital Markets Australia1 National Australia Bank Limited Domestic (Australia) +61 2 8258 1444 +852 2526 5892 (Hong Kong and London) Global (London) +44 207 547 1931 UBS Ltd (London) +44 207 329 0203 HSBC Multicurrency Euro Medium-Term Note Facility Dealer Panel4 Domestic (Australia) +61 2 9255 2208 Global (London) +44 207 992 8322 Includes all Domestic and Global JP Morgan Multicurrency US Medium-Term Note Facility Dealer Panel Domestic (Australia) +61 2 9003 7988 australia and new Zealand +1 212 801 9151 Global (London) +44 207 742 1829 Banking Group Limited National Australia Bank Ltd Bank of America Merrill+1 646 Lynch 855 8032 Domestic (Australia) +61 2 9295 1166 barclays capital +44 207 773 9090 Global (London) +44 207 726 2747 bnP Paribas +1 212 471 8240 Nomura Securities Citigroup (New York) +1 212 723 6171 Domestic (Australia) +61 2 8062 8000 Commonwealth Bank of Australia+44 207 710 3959 Global (London) +44 207 103 6631 Daiwa Securities Smbce urope +61 3 9916 1313 Royal Bank of Canada Deutsche Bank Securities 3 +1 212 Inc 250 6801 (New Domestic (Australia) +61 2 9033 3222 HSbc +1 212 525 4688 Global (London) +44 207 029 0094 JP Morgan +1 212 834 4533 Toronto Dominion Bank RBC Capital Markets (New+1 212 York) 858 7138 Domestic (Singapore) 1800 646 497 TD Securities +1 212 827 7199 Global (London) +44 207 628 4334 2 UBS Investment Bank +1 203 719 1830 UBS Ag Domestic (Australia) +61 2 9324 2222 1 Lead Manager – United States 2 Lead Manager – Europe Global (London) +44 207 567 3645 3 Lead Arranger westpac Banking Corporation 4 Lead Arranger – UBS Ltd (London) Domestic (Australia) +61 2 8204 2711 Global (London) +44 207 7621 7620 Half-yearly REPORT December 2012 QUEENSLAND TREASURY CORPORATION 35
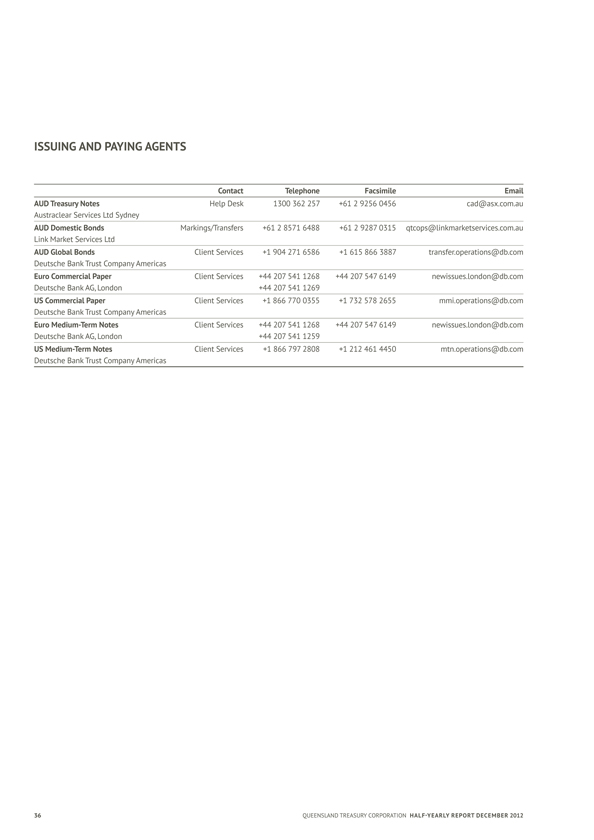
ISSUING AND PAYING AGENTS Contact Telephone Facsimile Email AUD Treasury Notes Help Desk1300 362 257 +61 2 9256 0456 cad@asx.com.au austraclear Services ltd Sydney AUD Domestic Bonds Markings/Transfers+61 2 8571 6488 +61 2 9287 0315 qtcops@linkmarketservices Link Market Services Ltd AUD global Bonds client Services +1 904 271 6586 +1 615 866 3887 transfer.operations@db Deutsche Bank Trust Company Americas Euro Commercial Paper client Services +44 207 541 1268 +44 207 547 6149 newissues.london@db. Deutsche Bank AG, London +44 207 541 1269 uS Commercial Paper client Services +1 866 770 0355 +1 732 578 2655 mmi.operations@db. Deutsche Bank Trust Company Americas Euro Medium-Term Notes client Services +44 207 541 1268 +44 207 547 6149 newissues.london@db. Deutsche Bank AG, London +44 207 541 1259 uS Medium-Term Notes client Services +1 866 797 2808 +1 212 461 4450 mtn.operations@db. Deutsche Bank Trust Company Americas 36 QUEENSLAND TREASURY CORPORATION HALF -YEARLY REPORT DECEMBER 2012

HALF-YEARLY REPORT DECEMBER 2012 QUEENSLAND TREASURY CORPORATION

QUEENSLAND TREASURY CORPORATION level 6 123 albert Street brisbane GPO box 1096 brisbane Queensland australia 4001 Telephone: +61 7 3842 4600 facsimile: +61 7 3221 4122 www.qtc.com.au © Queensland Treasury Corporation 2013