EXHIBIT (c)(vii)
Queensland’s Budget Papers for 2013-14
State Budget 2013-14
Budget Speech
Budget Paper No.1
AUDAX AT FIDELIS
Great state. Great opportunity.
QUEENSLAND GOVERNMENT
2013-14 State Budget Papers
1. Budget Speech
2. Budget Strategy and Outlook
3. Capital Statement
4. Budget Measures
5. Service Delivery Statements
Appropriation Bills
Concessions Statement
The suite of Budget Papers is similar to that published in 2012-13.
The Budget Papers are available online at www.budget.qld.gov.au
© Crown copyright
All rights reserved
Queensland Government 2013
Excerpts from this publication may be reproduced, with appropriate
acknowledgement, as permitted under the Copyright Act.
Budget Speech
Budget Paper No.1
ISSN 1445-4890 (Print)
ISSN 1445-4904 (Online)
APPROPRIATION BILL 2013
(First Reading Speech, 4 June 2013)
TREASURER
The Honourable Tim Nicholls MP
Treasurer and Minister for Trade
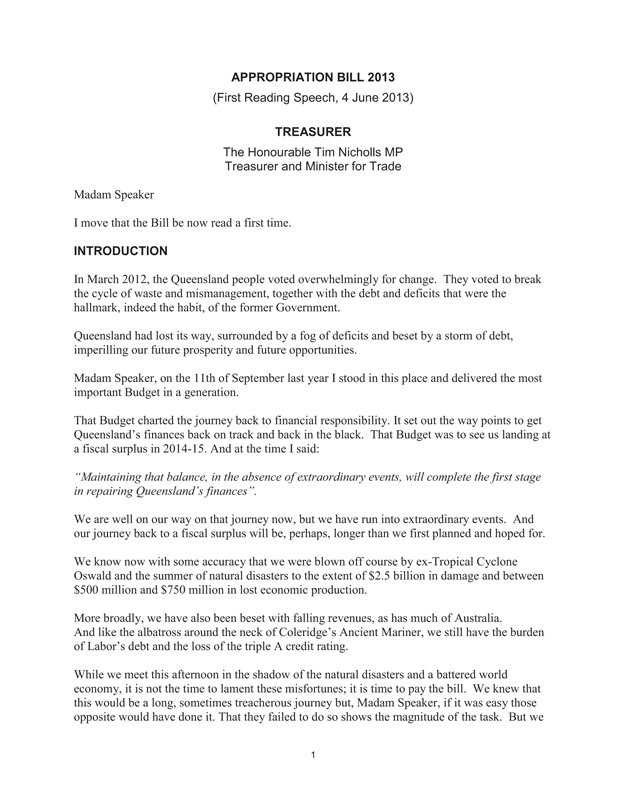
APPROPRIATION BILL 2013
(First Reading Speech, 4 June 2013)
TREASURER
The Honourable Tim Nicholls MP Treasurer and Minister for Trade
Madam Speaker
I move that the Bill be now read a first time.
INTRODUCTION
In March 2012, the Queensland people voted overwhelmingly for change. They voted to break the cycle of waste and mismanagement, together with the debt and deficits that were the hallmark, indeed the habit, of the former Government.
Queensland had lost its way, surrounded by a fog of deficits and beset by a storm of debt, imperilling our future prosperity and future opportunities.
Madam Speaker, on the 11th of September last year I stood in this place and delivered the most important Budget in a generation.
That Budget charted the journey back to financial responsibility. It set out the way points to get Queensland’s finances back on track and back in the black. That Budget was to see us landing at a fiscal surplus in 2014-15. And at the time I said:
“Maintaining that balance, in the absence of extraordinary events, will complete the first stage in repairing Queensland’s finances”.
We are well on our way on that journey now, but we have run into extraordinary events. And our journey back to a fiscal surplus will be, perhaps, longer than we first planned and hoped for.
We know now with some accuracy that we were blown off course by ex-Tropical Cyclone Oswald and the summer of natural disasters to the extent of $2.5 billion in damage and between $500 million and $750 million in lost economic production.
More broadly, we have also been beset with falling revenues, as has much of Australia. And like the albatross around the neck of Coleridge’s Ancient Mariner, we still have the burden of Labor’s debt and the loss of the triple A credit rating.
While we meet this afternoon in the shadow of the natural disasters and a battered world economy, it is not the time to lament these misfortunes; it is time to pay the bill. We knew that this would be a long, sometimes treacherous journey but, Madam Speaker, if it was easy those opposite would have done it. That they failed to do so shows the magnitude of the task. But we
1
would be letting Queenslanders down if we didn’t continue with the journey and see it through to safe harbour.
In many respects this journey has become harder since last year’s Budget. This year’s Budget has again been framed in a challenging external environment. The revenue environment is weak and Queenslanders have again had to deal with the devastation of natural disasters.
The national economy is trying to manage the transition from an unprecedented peak in mining investment back to consumption in the broader economy on a more normal basis. It is a fine balancing act and confidence is the key.
Last year I concluded my first Budget speech around the theme that “confidence is everything”.
That is as true today as it was then. The Queensland Government will do its part in building confidence by being unashamedly pro-growth. We will make Queensland the best place to invest and do business in the country.
Last year we took the steps necessary to improve our finances. I said that my hope was that no Queensland Government would need to undertake a repair task of such magnitude again. It would be disrespectful to Queenslanders if we simply threw those gains away. This Budget locks in those gains. It makes good on our promise to deliver frontline services. It is not a frivolous or fanciful Budget. It does the hard yards up the middle that Queenslanders need to get their State’s finances sorted out.
The Government will continue to be upfront about the challenges we face and take the community with us on the choices we need to make. The one thing we won’t do is kick the can down the road for our children to solve our problems.
But in 2013-14, our focus rightly turns to growth, rebuilding and the resilience of people and communities.
THE ECONOMY - GROWTH
Madam Speaker, the Queensland economy grew strongly in 2011-12, recording growth of 4 per cent.
In 2012-13, spending by businesses and households is expected to contribute less to growth, as mining investment approaches its peak and the impact of the 2011-12 one-off boosts to consumption pass.
Despite these changes, a strengthening in exports will see overall economic growth ease only slightly in 2012-13, to 3.5 per cent.
Economic growth in Queensland’s major trading partners in 2013 is estimated to be 2.75 per cent, similar to that recorded in 2012. Growth is anticipated to strengthen to 3.25 per cent from 2014 onwards, with non-Japan Asia continuing to be the main driver of growth. However, these rates remain below the annual average of 3.7 per cent in the decade to 2007 immediately preceding the global financial crisis.
2
Looking ahead in Queensland, sustained low interest rates and stronger population growth are expected to strengthen spending by the household sector.
The pending completion of $60 billion in LNG projects will see business investment fall from its historic highs each year from 2013-14 to 2015-16. Business investment will continue to feature prominently, but not in the way it has in the previous decade.
This Budget forecasts economic growth of 3 per cent in 2013-14. This places Queensland with a State growth rate second only to WA and above the national growth rate of 2.75 per cent. Over the forward estimates economic growth is predicted to average over 4 per cent.
The ramp up in LNG production by 2015-16 will lead to growth in overseas exports of 23 per cent in 2015-16 which, combined with a stronger domestic sector, will boost economic growth to 6 per cent in that year. While these figures underpin our confidence for the future we need to recognise they are the product of the export of gas. We need to continue our work to strengthen and grow the other pillars of the economy that employ so many Queenslanders.
In this Budget, we see a strengthening household sector and increasing exports which will support a recovery in employment growth from 2013-14 onwards and a steady improvement in the unemployment rate, from 6 per cent in 2013-14 down to 5.5 per cent in 2015-16.
Employment growth is forecast to rise to 2.75 per cent per year by 2015-16.
The Queensland economy remains strong and is growing.
2013 NATURAL DISASTERS – REBUILDING
Madam Speaker, early this year, Queenslanders were once again cruelly confronted with the hardship and challenge of natural disasters.
Ex-Tropical Cyclone Oswald and the flooding that followed brought destruction to 57 Queensland local government areas from January to March 2013. Many of these same areas were just recovering from the loss and damage brought by the natural disasters of 2010 to 2012.
There was a substantial impact on agricultural production in the Wide Bay-Burnett, Lockyer and Fassifern Valley areas, including sugar cane, fruit and vegetable production.
The Queensland Reconstruction Authority estimates the cost of the disaster to be $2.5 billion, of which the State’s contribution is in excess of $620 million.
The size and scale of the 2013 disaster is often misunderstood because it did not feature as prominently as earlier disasters but its scale and reach was equally as devastating to those affected. In fact, in terms of cost it was second only to the December 2010 and January 2011 disasters.
Over 2,000 residents were evacuated in the Bundaberg region, over 4,300 properties damaged, 750 businesses affected across the State, 390,000 homes and businesses left without power, 22 per cent of State controlled roads affected and 3,100 kilometres of the State rail network damaged.
3
The additional cost of repairs comes on top of the cost of other recent significant natural disasters. This Budget allocates total disaster spending over the three years from 2012-13 to 2014-15 of $9.3 billion.
The total cost of natural disasters since 2010 now stands at over $13.8 billion. This represents enough funds to have built two cross river rail projects and a second range crossing for Toowoomba or $3,010 per man, woman and child.
RESILIENCE
Madam Speaker, this Budget provides funding of $40 million, matched equally by the Australian Government, towards a Betterment Fund.
The Newman Government stood ready to make a contribution of $100 million to a Betterment Fund but the Australian Government was unwilling to match the funding. A fund with $200 million in it would have made a real dent in the backlog of betterment projects that local governments have put forward. But it was not to be.
There are obviously sound economic and public finance reasons to advocate for a new approach to disaster funding – we are about to repair some infrastructure for the second and third time in ten years.
Let’s take just one example. In 2011, the Gayndah water intake plant on the banks of the Burnett River was damaged. The intake is the only source of water for the town. At a cost of $1.22 million the water intake was repaired in its original place, to its original standard and specification. No flood proofing occurred. Along came the January 2013 floods and again, the Gayndah water intake plant, only a year old was severely damaged.
It is said that the definition of insanity is to keep doing the same thing but expect a different result. That was the Labor way.
This time it will be different, in partnership with the North Burnett Regional Council a new pumping station and intake will be built upstream at the Claude Wharton Weir, at a slightly greater cost, but a cost that is an investment in the future. It’s a smart investment.
Betterment makes sense, it is better that the town gets clean drinking water and it is better that both the State and Australian Governments don’t have to rebuild the same infrastructure twice.
This Budget puts a down payment on resilience, but it is unfinished business for the Newman Government and the Queensland community. It is the discussion we need to have and will continue to have over coming years.
DEBT
Madam Speaker, with fiscal deficits since 2006-07 totalling $45.3 billion, no one can deny that we inherited a debt and deficit problem from Labor.
The Budget sees that Labor debt in the General Government sector rising by $9.4 billion over the forward estimates but, importantly stabilising in 2015-16. From 2013-14 onwards debt in the General Government sector rises by only $800 million, as we rein it in.
4
Gross debt will reach $80.1 billion in 2014-15. This compares to Labor’s last projection of $85.4 billion, which the Commission of Audit found to be unrealistic. We have stopped the rot.
The General Government fiscal balance is estimated to be a deficit of $8.7 billion in 2012-13, compared to a forecast deficit of $11.2 billion in the 2012-13 MYFER.
The improvement in the forecast 2012-13 fiscal balance since the 2012-13 MYFER primarily reflects a government that can keep a tight rein on expenses, as well as a result of changes in the timing of disaster expenditure.
A fiscal deficit of $7.7 billion is budgeted for 2013-14, compared to a forecast of $4.6 billion in the 2012-13 MYFER. This largely reflects the incorporation of extra costs associated with recent flooding, a change in timing of Australian Government disaster recovery funding as a result of the changed expenditure profile, and lower royalty revenue.
As I have said consistently since becoming Treasurer, there is no magic pudding. Government must strive to live within its means, not simply because it’s a good thing to do, but to ensure we have the funds available to invest, create jobs and grow the Queensland economy.
The reality is Labor’s deficits are now catching up with us. They are restricting our ability to act.
Madam Speaker, in 2005, before the great debt binge began in earnest, a Queensland teenager leaving high school and commencing their adult life would have done so with a State debt burden of a modest $3,900. A student in Grade 9 this year, who will be leaving school at the end of 2016 - the point at which we finally stabilise the debt, will commence his or her adult life with a State debt burden of $16,000. That is Labor’s legacy.
In 2012-13 the interest payments on debt in the Government sector will rise by over 23 per cent. This robs the Budget of over $2.1 billion, which could have been spent on service delivery and infrastructure.
So we have to be smarter about delivering infrastructure because Labor has maxed out the credit card. We will continue to drive partnerships with the private and non-government sectors to use the limited funds that we do have to invest in new infrastructure and revitalise services, because the people of Queensland deserve better from their leaders than decades of debt.
Strong expenditure control means the forecast level of borrowings at 30 June 2015 is expected to be $6.2 billion lower than the comparable estimate in the Independent Commission of Audit’s
Interim Report and $5.2 billion lower than final forecast by the previous Government in the 2011-12 MYFER. We are saving $750 million in interest. That’s money we can use to deliver services.
We have brought the previous Government’s debt spiral under control as we said we would before the election.
REVENUE & SAVINGS
Forecasts of key own source revenues such as taxation, GST and mining royalties have fallen by $5.3 billion since we were elected in March 2012 and $2.6 billion since the 2012-13 MYFER.
5

To illustrate, land tax is down 6.4 per cent in Queensland - the first time a fall has been recorded since 1996-97. Gaming revenue from casinos has also fallen by 2.8 per cent since the last Budget.
This downturn also reflects the ongoing weakness of export coal prices, downward reductions in the GST pool distributed by the Australian Government and the impact of the slower than anticipated property market recovery on transfer duty and land tax.
If collected, the $5.3 billion in revenue would have negated the need for any tax increases. The Government would have had the funds to expand infrastructure and deliver new services.
We may lament this loss of revenue, but that won’t fix the problem. We have to toe the line and find ways to fix it. As the Premier often says “find the solution, don’t fight the problem!”.
Given the loss of revenue, the rebuilding task and the need to fund new services the Government has made the balanced and responsible decision to delay reaching a fiscal surplus in 2014-15. Instead we forecast a small fiscal deficit of $244 million that year and project a fiscal surplus of over $1 billion a year later in 2015-16. This is our best prediction but Madam Speaker I haven’t, this Government hasn’t, given up on reaching a fiscal balance sooner if we can.
In practical terms, the 2014-15 Budget result will depend heavily on the timing of payments from the Australian Government for its share of natural disaster costs.
The delay in reaching a fiscal surplus means that the Government will not have to raise taxes or cut spending by as much as it would have otherwise had to do.
The State Government has only a small range of taxation measures at its disposal. These are usually inefficient and are unpopular at the best of times, but when revenue falls, expenditures increase and debt is your problem, there is only one option.
In this Budget we implement a small number of measures to help deal with the loss of revenue.
Remedial measures will improve the budget on average by $450 million per annum.
The rate of duty applicable to insurance premiums for general insurance products will increase to 9 per cent from 1 August 2013. There will be no increase in the duty rate applicable to workers’ compensation insurance premiums or Compulsory Third Party motor vehicle insurance premiums. Queensland’s insurance duty regime will, along with New South Wales, remain competitive with other States.
This measure will assist in meeting part of the State’s contribution to the implementation of the National Disability Insurance Scheme, known as DisabilityCare Australia.
Queensland has a highly competitive payroll tax regime, with the lowest rate of payroll tax in Australia and the highest threshold of any mainland State. The Government has committed to further enhancing Queensland’s competitiveness by increasing the payroll tax threshold to $1.6 million. The next increase in the payroll tax threshold, to $1.2 million, which had been intended to take effect from 1 July 2013, will now be deferred until 1 July 2015.
6
The Government will break with the past and recast the Urban Fire Levy first introduced in 1984. Currently, the cost of supplying Emergency Management, Fire and Rescue Services across Queensland is $587.3 million. The current levy raises $346.9 million, leaving a shortfall of $240.4 million.
From 1 January the renamed Emergency Management, Fire and Rescue Levy will be extended to all properties receiving a rates notice. It is appropriate that as all Queenslanders potentially benefit from the work of emergency management services across Queensland, whether it’s a helicopter rescue, water bombing, disaster co-ordination or swift water rescues they make a contribution to those services. The Levy will also rise by 6.5 per cent from 1 January 2014. The lowest category of the existing Levy, Class D, will apply to those areas in Queensland who are currently not making a contribution.
In 2013-14 the Levy will fund approximately 60 per cent of the operational costs of these services. More importantly, it will provide a more sustainable funding base for services into the future.
The Government will await the recommendations of the Keelty Review and detailed consideration of the review undertaken by the Member for Mirani before making any further changes to emergency services and related matters, as outlined in the Government’s response to the final Independent Commission of Audit report.
As a result of these balanced changes Queensland will retain its competitive tax status, with per capita state tax estimated at $2,528 in 2013-14, compared to an average of $3,003 for the other states and territories. A saving of $475 per capita.
EXPENSES
General Government expenses in 2012-13 are estimated to be only 1.1 per cent higher than in 2011-12. This is the lowest rate of expenses growth since the introduction of accrual accounting in the public sector in 1998-99, and contrasts with average rates of expenses growth of 8.9 per cent over the decade to 2011-12.
Employee expenses in 2012-13 are estimated to be only 0.9 per cent higher than in 2011-12. This is the smallest increase since 1998-99.
Total General Government sector expenses in 2013-14 are expected to increase by 4.1 per cent over the estimated actual for 2012-13, primarily as a result of natural disaster reconstruction works and for increased service delivery, including the provision of health and education services.
Expenses overall are projected to grow on average by 2.6 per cent over the period 2012-13 to 2016-17.
We value the taxpayer’s dollar and we will continue to ensure we keep a tight rein on expenses. This expenditure constraint comes at a time when we are still investing in core services like health, education and disability services.
7
COST OF LIVING & ELECTRICITY
Madam Speaker, this Government took to the last election a Contract with Queensland. This Government has delivered on that Contract and kept its promises.
We said that we would “Lower the Cost of Living for Families by Cutting Waste” and we have.
In the Contract we said the following:
• We will abolish Labor’s $7,000 tax on buying the family home – it’s been delivered
• We will freeze family car rego for our first term – it’s been delivered
• Our four point plan will reduce household water prices – it’s been delivered
• Cut Labor’s public transport fare increases by half in our first term – it’s been delivered,
• Reward regular commuters by reintroducing discounted weekly fares for go card users – it’s been delivered, and
• We will reform electricity tariffs to save families money and ensure the cost of carbon tax and green energy schemes are listed on power bills – work is well underway to deliver on this commitment, including the freeze to tariff 11 last year.
Madam Speaker, the Government understands the shock and dismay of Queenslanders at the electricity price increase. It is indeed a kick in the guts for households and businesses. Frankly, it is also probably the single most difficult issue the Government has had to grapple with to date.
At its heart, the problems that we are dealing with are the consequences of decisions taken over a number of years where governments have either ignored, or papered over, the fact that those decisions would ultimately be paid for by electricity consumers. The truth is that when governments in Australia, be they State or Federal, pass laws or introduce schemes that move away from supplying electricity based on least cost, then under the rules that govern the Australian electricity market there can only be one outcome - consumers pay more.
The Beattie Government’s decision in the middle part of the last decade to spend billions on the network in the name of reliability – is being paid for by consumers now. The Federal Government’s 20 per cent Renewable Energy Target - is being paid for by consumers now. The former State Government’s so-called Solar Bonus Scheme - it is effectively a $3 billion solar tax being paid for by guess who? - Queensland consumers now. By 2015-16 the Solar Bonus is going to cost Queensland households an extra $276.
And the latest and most unnecessary increase of them all - the Carbon Tax.
We have to stop loading up the electricity industry with policies that increase costs only to be surprised when those same policies increase prices.
Faced with the latest increase, the Government had two choices - it could introduce a new subsidy for electricity prices. However, with a $7.7 billion deficit next year we would have to borrow the money to pay for it - meaning we would be asking taxpayers years down the track to pay off the debt for the electricity we are using today. That’s not fair.
8
Alternatively, we could have increased taxes to pay for the subsidy. That is, increase taxes on people only to recycle it in the form of a subsidy to those people and make it sound like a virtue - straight out of the Julia Gillard and Wayne Swan play book.
What we are doing is controlling what we can control. We are making sure those electricity businesses we control are operating as efficiently as possible. The savings we are asking Ergon and Energex to find from their capital and operating budgets are for the express purpose of delivering better price outcomes for consumers over the long run. We have found capital and operating expenditure savings totalling $3 billion out to 2019-20, but we are dealing with a massive network that can’t be turned on a dime.
KEY EXPENDITURES
Madam Speaker, this is the Budget that invests in key frontline services - the education budget increases by $707 million, or 6.6 per cent - the disability services budget is up $64 million, or 4.7 per cent and the health budget is up $533 million or 4.5 per cent.
Being a Government for all Queenslanders is vitally important to those of us on this side of the House. The Government will again invest heavily in our regions, through both specific programs like “Royalties for the Regions” as well as ongoing expenditure directed to where it is needed most.
Again in 2013-14, over 75 per cent of the Government’s capital expenditure will take place outside Brisbane.
Disability Services
In December 2012, the Government announced a commitment to provide an additional $868 million over a period to 2018-19 to address the historical under-funding of disability services in Queensland and to support implementation of the NDIS in Queensland. This funding, coupled with the Australian Government’s commitment to provide the State with a share of the proposed 0.5 per cent Medicare Levy increase will contribute to the Queensland Government funding of $2.03 billion of scheme costs in 2019-20. This Budget makes the first allocation for the NDIS.
It also provides additional funding of $106 million over four years to assist with existing Disability Services demand pressures. This funding will help to ensure that young people with a disability exiting the care of the State, or leaving school, are supported. It will also help people with spinal cord injuries to leave hospital and live in the community.
This Budget brings forward $25 million into 2013-14 from 2015-16. This money will provide additional care packages in line with DisabilityCare Australia concepts.
Great Teachers = Great Results
The Queensland Government understands and values the contribution made by teachers - many a young life has been turned around or inspired to greatness through the intervention of a caring, motivated, teacher.
9
The Budget provides additional funding of $537 million over five years from 2013-14 to focus on professional excellence in teaching and increasing the autonomy of our schools. It comprises a range of initiatives such as mentoring for beginning teachers; accelerated progression and bonus payments for high performing teachers; paid post-graduate study and strategies to strengthen discipline in schools.
Fixing our Schools and Hospitals
Madam Speaker, good managers everywhere know how important it is to keep on top of your asset base and to make sure your equipment is properly maintained. We also routinely tell our children that we aren’t going to buy them something new until they look after what they already have.
The former Government found looking after the asset base all too boring in comparison to the excitement of new project announcements. For this reason, some of our schools and hospitals have toilets that don’t flush, windows that don’t shut, broken air conditioning – the list goes on.
It borders on negligence.
This Government is making major inroads into the maintenance backlog in our schools and health facilities. This Budget allocates a further $100 million to fixing our schools, bringing the total additional funding under this Government to $300 million over three years. We also provide an additional $147 million over four years as part of a $327 million program to address the health maintenance backlog.
Queensland Health Rostering and Payroll System
Madam Speaker, it is not with any pleasure that I announce that the Government has had to provide increased funding of $384 million over four years to enable the Department to operate and improve the Queensland Health rostering and payroll system.
The Health payroll system will cost an estimated $1.25 billion, over seven years, since the failed implementation in 2010.
I know the Minister and departmental staff are working incredibly hard to enhance the payroll environment, improve pay outcomes for Queensland health employees and stem the financial bleeding. They need, and will continue to receive, our support.
Revitalisation of Regional, Rural and Remote Health Services
The Government is providing increased funding of $83 million over four years to support and enable better access to health care services for Queenslanders in regional, rural and remote communities. This will be achieved through the development of improved ambulatory and primary health care models, delivery of enhanced outreach services and establishment of the Rural Telehealth Service.
Hospital in the Home
As identified in the final report of the Independent Commission of Audit, hospital avoidance and substitution programs that drive a vastly improved community health care outcome are
10

desperately needed. Hospital in the Home is one such program. Studies have shown that Hospital in the Home is associated with reductions in mortality, readmission rates and cost, and increases in patient carer satisfaction.
The Government will provide increased funding of $28 million over four years for additional Hospital in the Home services to be provided by the private sector. This provides acute care by health professionals in the comfort of home as a substitute for inpatient care received at a hospital - better for patients and better for the system.
Economic Development and Reform
The Government is focussing on making Queensland the best business environment in Australia.
We are working hard on reducing the regulatory burden on industry and the timeframes for project approvals.
With support from the Deputy Premier, the Coordinator-General has made 145 statutory decisions since April 2012, a decision rate 3.25 times greater than the previous Government achieved in its last 12 month period.
Queensland is world famous for its mining resources and expertise, but there is much that remains to be known about the geology and mineral potential of the State. We want Queensland to be the exploration capital of Australia, and for quality geological data to be there for the world to see.
The Government will provide new funding of $30 million over three years for a range of initiatives to upgrade the Geological Survey of Queensland. This is a sound investment in
Queensland’s future prosperity.
Trade and Investment Queensland, a function treated like a prize by the previous Government and catapulted from department to department, will be given the stability it deserves and Queensland business needs. It will be established as a separate stand-alone entity, governed by a Board that has practical export business experience.
Now more than ever, it is vital that Queensland businesses and industries maintain and develop their relationships with our major trading partners. Importantly, we need to focus on assisting small to medium enterprises establish footholds in new markets across Asia and the Americas.
We have great natural advantages within our trade exposed industries. We grow healthy and safe food in a region that is increasingly demanding food security. We supply world class primary products; our research and education industries take knowledge to the world and our manufacturers use Queensland’s smarts to deliver products to the world.
Queensland needs to be outwardly proud and promote our achievements and unique characteristics – effectively pushing our ‘Brand Queensland’ to the world. The Government sees Trade and Investment Queensland as an important driver of economic growth through export opportunities.
11
We are also proceeding with the implementation of our response to the independent Commission of Audit recommendations – recommendations for better services and a more dynamic economy. This Queensland Government wants to work with, not compete against, the private sector. We look forward to existing Queensland business growing new businesses to take advantage of the opportunities that will arise.
Whether it’s Economic Development Queensland, within the Deputy Premier’s department, or the Tourism Investment Attraction Unit within Minister Stuckey’s department, or the Contestability Unit within Queensland Health established by Minister Springborg or Projects Queensland in Treasury, the Government is determined to diversify the Queensland economy and grow its four pillars.
Fundamentally, the Government is moving from being the “doer” to the “enabler”.
Federal Financial Relations
Madam Speaker, there once was a Federal Member for the seat of Griffith who became Prime Minister in 2007. We were promised an end to the blame game.
The early signs showed some promise – over 90 specific purpose agreements were collapsed into five. There was to be a very small number of national partnership agreements, focussed on outcomes and not red tape.
Well guess what. Today we have nearly 74 separate national partnership agreements that are highly prescriptive – more and more Government red tape. The great news is that there are another 28 of these agreements under development now. More public servants in Canberra watching public servants in Brisbane – lead in the saddle bags of the teachers and nurses in the field who are just trying to do their jobs.
Many of these reporting requirements are designed by undoubtedly well-meaning people, but who are often far removed from the realities of Queensland life. Attending Floriade does not qualify you to lecture a grazier in north-west Queensland about keeping cattle alive during a drought. The drive from Queanbeyan to Capital Circuit does not qualify you to understand the tyranny of distance faced by the people of Longreach.
The way the current Commonwealth Government conducts its federal relations is based on the politics of the fiscal wedge. The Commonwealth makes an announcement via press conference and demands the States magically “find” the extra money. The States look bad if they don’t agree, so then have to raise taxes or reduce spending – both of which the Commonwealth publicly objects to – in order to fund the spending.
Government finances right around Australia are clearly stressed. In these difficult times, the most sensible thing we can do is to sit down and have an adult conversation about who is best placed to be responsible for what.
The Queensland Government is ready for that conversation. Governments have no right to be preaching to businesses about productivity and efficiency until they get the basics right themselves.
12
The best part about this reform is that it won’t cost taxpayers a cent, but it does take courage and a grown-up attitude as well as an acknowledgement of the reality that Governments can’t solve every problem. We really need a grown up in government in Canberra. Let’s hope we get that after September 14.
CONCLUSION
Madam Speaker, in March last year the new Government said how it would go about fixing
Queensland’s finances and delivering services for Queensland. How we would be a “can do” Government for a “can do” State.
Last September, in our first Budget, I laid out the chart for the journey back to sound State finances, while at the same time supporting the four pillars of the economy and boosting confidence. I said it was the most important Budget in a generation. It started the hard work and reforms necessary to make sure Queensland is a better State, a stronger State, a great State.
This Budget is another way point on our journey.
It supports the growth we need to pay off the debts of the past while providing the jobs of the future.
It builds resilience, not just in our finances, but in our community. By lowering interest bills we can spend more on services and strengthen our communities by giving them the help they need when they need it.
It rebuilds not just the State’s balance sheet, but the facilities and infrastructure we all need and rely on every day - roads, schools, hospitals, parks and playgrounds. It empowers people to invest and grow with confidence.
Madam Speaker now is not the time to waver or change course. This Budget continues the journey of ensuring Queensland is a Great State with Great Opportunity.
I commend the Budget to the house.
13

State Budget 2013–14 Budget Speech Budget Paper No.1 www.budget.qld.gov.au

State Budget 2013-14 Budget Speech Budget Paper No.1 www.budget.qld.gov.au
State Budget 2013-14
Budget Strategy and Outlook
Budget Paper No.2
Great state. Great opportunity.
Queensland Government
2013–14 State Budget Papers
1. Budget Speech
2. Budget Strategy and Outlook
3. Capital Statement
4. Budget Measures
5. Service Delivery Statements Appropriation Bills Concessions Statement
The suite of Budget Papers is similar to that published in 2012-13.
The Budget Papers are available online at www.budget.qld.gov.au
© Crown copyright All rights reserved
Queensland Government 2013
Excerpts from this publication may be reproduced, with appropriate acknowledgement, as permitted under the Copyright Act.
Budget Strategy and Outlook Budget Paper No.2 ISSN 1445-4890 (Print) ISSN 1445-4904 (Online)
Queensland Government
STATE BUDGET 2013-14
BUDGET STRATEGY AND OUTLOOK
Budget Paper No. 2
TABLE OF CONTENTS
1. Fiscal strategy and outlook 1
Context 3
Overview 5
Budget outcomes 2012-13 10
2013-14 Budget and outyear projections 13
Fiscal strategy as a guiding principle for policy 19
Achievement of fiscal principles 24
2. Economic performance and outlook 27
External environment 28
Queensland economy 31
3. Revenue 47
2013-14 Revenue by category 49
Revenue changes since the 2012-13 Budget and MYFER 51
Queensland’s revenue trends 52
2013-14 Budget initiatives 55
Taxation revenue 59
Queensland’s competitive tax status 64
Grants revenue 65
Sales of goods and services 68
Interest income 70
Dividend and income tax equivalent income 71
Other revenue 71
4. Expenses 75
2012-13 estimated actual 76
2013-14 Budget and outyears 77
Expenses by operating statement category 78
Operating expenses by purpose 87
Departmental expenses 88
5. Balance sheet and cash flows 91
Background 91
Balance sheet 92
Cash flows 100
Reconciliation of operating cash flows to the operating statement 102
6. Inter-governmental financial relations 103
Federal financial arrangements 104
Australian Government funding to Queensland 107
Payments to Queensland for specific purposes 108
GST revenue payments 115
State-local government financial relations 122
7. Public Non-financial Corporations sector 123
Context 123
Reform 124
Independent Commission of Audit 125
Finances and performance 128
8. Uniform presentation framework 137
Introduction 137
Uniform presentation framework financial information 137
Reconciliation of net operating balance to accounting operating result 147
General Government time series 148
Other General Government uniform presentation framework data 149
Contingent liabilities 155
Background and interpretation of uniform presentation framework 156
Sector classification 158
Reporting entities 159
Appendix A – Tax expenditure statement 163
Overview 163
The Tax Expenditure Statement 164
Discussion of individual taxes 166
Appendix B – Revenue and expense assumptions and sensitivity analysis 171
Taxation revenue assumptions and revenue risks 173
Royalty assumptions and revenue risks 174
Sensitivity of expenditure estimates and expenditure risks 176
1 FISCAL STRATEGY AND OUTLOOK
FEATURES
• The General Government fiscal balance is estimated to be a deficit of $8.7 billion in 2012-13 compared to a forecast deficit of $11.2 billion in the 2012-13 Mid Year Fiscal and Economic Review (MYFER).
• The improvement in the forecast 2012-13 fiscal balance since the 2012-13 MYFER primarily reflects lower than anticipated levels of operating expenditure across all expenditure categories, including as a result of changes in the timing of disaster expenditure.
• Expenses in 2012-13 are estimated to have grown by only 1.1% on 2011-12. This represents the lowest growth since accrual accounting commenced in 1998-99 and contrasts with average expenses growth of 8.9% per annum in the decade to 2011-12.
• A fiscal deficit of $7.7 billion is budgeted for 2013-14 compared to a forecast of $4.6 billion in the 2012-13 MYFER. This largely reflects the incorporation of costs associated with recent flooding, a change in timing of Australian Government disaster recovery funding as a result of the changed expenditure profile, and downward revisions to revenue.
• The rebuilding effort as a result of the recent flooding caused by ex-Tropical Cyclone Oswald is forecast to cost $2.5 billion. The majority of this funding will be used to rebuild damaged roads and local government infrastructure. The cost of this disaster, coupled with other significant recent disasters, amounts to $9.3 billion over the 2012-13 to 2014-15 period.
• Key revenue sources such as taxation, GST and mining royalties have fallen by $4.2 billion in underlying terms since the 2012-13 Budget, with $2.6 billion of this decline since 2012-13 MYFER. This reflects the ongoing weakness of export coal prices, downward reductions in the GST pool distributed by the Australian Government and the impact of the slower than anticipated property market recovery on transfer duty and land tax. Relative to the Independent Commission of Audit Interim Report, these revenue sources have fallen by $5.3 billion.
• In the 2013-14 Budget, the Government is continuing to deliver the savings outlined in the 2012-13 Budget, as well implement savings and revenue measures that offset expenditure decisions made subsequent to the 2012-13 Budget. Nevertheless, the scale of natural disasters and revenue write-downs has resulted in a modest fiscal deficit of $244 million (or 0.5% of General Government revenue) being projected for 2014-15. The Government will continue to pursue a fiscal balance in 2014-15 as a policy objective.
Budget Strategy and Outlook 2013-14 1
• The projected fiscal position continues to improve over the remainder of the forward estimates largely due to the fiscal repair measures implemented by Government since coming to Office and continued expenditure discipline. As a result, fiscal surpluses exceeding $1 billion are projected in both 2015-16 and 2016-17.
• Despite a very difficult external environment making the fiscal consolidation task much tougher, the Government’s fiscal repair initiatives are still expected to result in General Government borrowings stabilising from 2014-15, with total non-financial public sector borrowings at 30 June 2015 expected to be $6.2 billion lower than the comparable estimate in the Independent
Commission of Audit’s Interim Report.
• The Government has accepted the majority of recommendations in the Final Report of the Independent Commission of Audit which is fundamentally about ways in which the quality and quantity of frontline services can be improved.
Although the implementation of the Government’s response is expected to improve value for money in government service delivery, no savings from this have been incorporated in the 2013-14 Budget estimates.
2 Budget Strategy and Outlook 2013-14
CONTEXT
The 2012-13 Budget implemented significant fiscal repair in Queensland. The 2012-13 Budget delivered measures totalling $7.8 billion over the 2012-13 to 2015-16 period. These savings were made by exiting activities that are not the domain of the Queensland Government, by reducing waste and inefficiency in Government activities and by implementing specifically targeted revenue measures.
As part of this process of fiscal repair, the Government adopted a new set of fiscal principles clearly aimed at improving the sustainability of the State’s finances. These principles are:
• stabilise then significantly reduce debt
• achieve and maintain a General Government sector fiscal balance by 2014-15
• maintain a competitive tax environment for business
• target full funding of long term liabilities such as superannuation in accordance with actuarial advice.
These fiscal principles guided Government decision making during the preparation of the 2012-13 Budget and continue to guide Government decisions including in the 2013-14 Budget.
Since coming to Office, the Government has clearly demonstrated its ability to manage expenditure, with operating expenses in 2012-13 estimated to be almost $2 billion lower than budgeted. This means expenses in 2012-13 are estimated to have grown by only 1.1% on 2011-12, which represents the lowest growth since accrual accounting commenced in 1998-99 and contrasts with average expenses growth of 8.9% per annum in the decade to 2011-12.
The Government will continue to focus its efforts on restraining expenditure growth both through ensuring that the fiscal repair measures in the 2012-13 continue to be achieved and by pursuing further reform.
However, the 2013-14 Budget has been made significantly more difficult by the rebuilding task following the widespread flooding arising from ex-Tropical Cyclone Oswald. This disaster has been estimated to cost $2.5 billion and comes on top of the significant natural disasters in 2010-11 and 2011-12 to bring total disaster spending over the 2012-13 to 2014-15 period to $9.3 billion.
In addition, key revenue sources such as taxation, GST and mining royalties have fallen by $4.2 billion in underlying terms since the 2012-13 Budget, with $2.6 billion of this decline since 2012-13 Mid Year Fiscal and Economic Review (MYFER). This reflects the ongoing weakness of export coal prices, downward reductions in the GST pool distributed by the Australian Government and the impact of the slower than anticipated property market recovery on transfer duty and land tax.
Budget Strategy and Outlook 2013-14 3
To keep a fiscal balance in 2014-15 within reach and ensure borrowings in the General Government sector stabilise, the Government has decided that some further measures will be implemented in the 2013-14 Budget including:
• a two year deferral of the planned increase in the payroll tax threshold, from $1.1 million to $1.2 million, to 1 July 2015
• an increase in duty rates on general insurance products, more closely aligning Queensland’s rates with those applied in other states
• extending the Emergency Management, Fire and Rescue Levy (currently known as the Urban Fire Levy) to all rateable properties to ensure a sustainable funding base for emergency management services
• additional departmental savings of $100 million per annum from 2013-14 onwards. Further detail on these measures is provided in the Revenue and Expense Chapters of this Budget Paper, with financial impacts detailed in Budget Paper 4 – Budget Measures.
In the absence of measures taken in the 2012-13 and 2013-14 Budgets, the fiscal deficit would be $10.1 billion in 2013-14.
In addition to these measures, the Government has accepted the majority of the recommendations outlined in the Final Report of the Independent Commission of Audit. The Final Report is fundamentally about examining ways in which the quality and quantity of frontline services can be improved, including models that make better use of the skills, capacity and innovation of the private and not-for-profit sectors.
The Government’s implementation of the accepted recommendations represents the next stage of public sector reform in Queensland and will guide how public services are delivered into the future. Many of the recommendations relate to contestability.
Contestability is not an outcome, but rather a process whereby Government tests the market to ensure it is providing the public with the best possible solution at the best possible price. The Government is determined to transition to being the “enabler”. It does not always need to be the “doer”.
While there is a clear expectation that the associated reforms will result in improved value for money outcomes in the delivery of services, no associated savings have been factored into the forward estimates presented in the 2013-14 Budget.
4 Budget Strategy and Outlook 2013-14
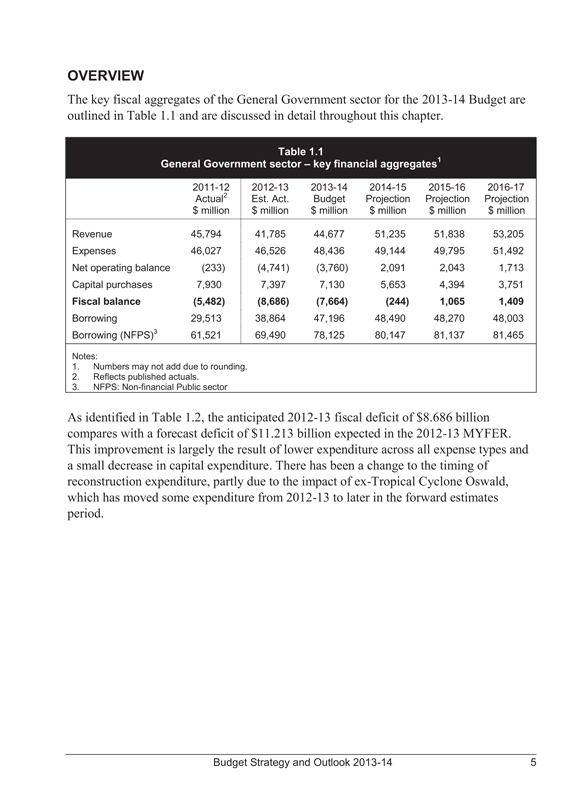
OVERVIEW
The key fiscal aggregates of the General Government sector for the 2013-14 Budget are outlined in Table 1.1 and are discussed in detail throughout this chapter.
Table 1.1
General Government sector – key financial aggregates1
2011-12 2012-13 2013-14 2014-15 2015-16 2016-17
Actual2 Est. Act. Budget Projection Projection Projection
$ million $ million $ million $ million $ million $ million
Revenue 45,794 41,785 44,677 51,235 51,838 53,205
Expenses 46,027 46,526 48,436 49,144 49,795 51,492
Net operating balance(233) (4,741) (3,760) 2,091 2,043 1,713
Capital purchases 7,930 7,397 7,130 5,653 4,394 3,751
Fiscal balance (5,482) (8,686) (7,664) (244) 1,065 1,409
Borrowing 29,513 38,864 47,196 48,490 48,270 48,003
Borrowing (NFPS)3 61,521 69,490 78,125 80,147 81,137 81,465
Notes:
1. Numbers may not add due to rounding.
2. Reflects published actuals.
3. NFPS: Non-financial Public sector
As identified in Table 1.2, the anticipated 2012-13 fiscal deficit of $8.686 billion compares with a forecast deficit of $11.213 billion expected in the 2012-13 MYFER. This improvement is largely the result of lower expenditure across all expense types and a small decrease in capital expenditure. There has been a change to the timing of reconstruction expenditure, partly due to the impact of ex-Tropical Cyclone Oswald, which has moved some expenditure from 2012-13 to later in the forward estimates period.
Budget Strategy and Outlook 2013-14 5
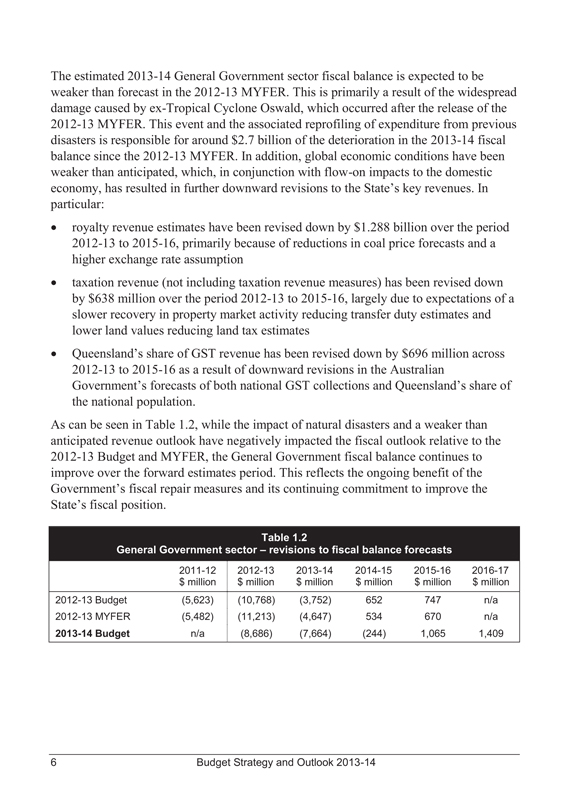
The estimated 2013-14 General Government sector fiscal balance is expected to be weaker than forecast in the 2012-13 MYFER. This is primarily a result of the widespread damage caused by ex-Tropical Cyclone Oswald, which occurred after the release of the 2012-13 MYFER. This event and the associated reprofiling of expenditure from previous disasters is responsible for around $2.7 billion of the deterioration in the 2013-14 fiscal balance since the 2012-13 MYFER. In addition, global economic conditions have been weaker than anticipated, which, in conjunction with flow-on impacts to the domestic economy, has resulted in further downward revisions to the State’s key revenues. In particular:
• royalty revenue estimates have been revised down by $1.288 billion over the period 2012-13 to 2015-16, primarily because of reductions in coal price forecasts and a higher exchange rate assumption
• taxation revenue (not including taxation revenue measures) has been revised down by $638 million over the period 2012-13 to 2015-16, largely due to expectations of a slower recovery in property market activity reducing transfer duty estimates and lower land values reducing land tax estimates
• Queensland’s share of GST revenue has been revised down by $696 million across 2012-13 to 2015-16 as a result of downward revisions in the Australian Government’s forecasts of both national GST collections and Queensland’s share of the national population.
As can be seen in Table 1.2, while the impact of natural disasters and a weaker than anticipated revenue outlook have negatively impacted the fiscal outlook relative to the 2012-13 Budget and MYFER, the General Government fiscal balance continues to improve over the forward estimates period. This reflects the ongoing benefit of the Government’s fiscal repair measures and its continuing commitment to improve the
State’s fiscal position.
Table 1.2
General Government sector – revisions to fiscal balance forecasts
2011-12 2012-13 2013-14 2014-15 2015-16 2016-17
$ million $ million $ million $ million $ million $ million
2012-13 Budget (5,623) (10,768) (3,752) 652 747 n/a
2012-13 MYFER (5,482) (11,213) (4,647) 534 670 n/a
2013-14 Budget n/a (8,686) (7,664) (244) 1,065 1,409
6 Budget Strategy and Outlook 2013-14
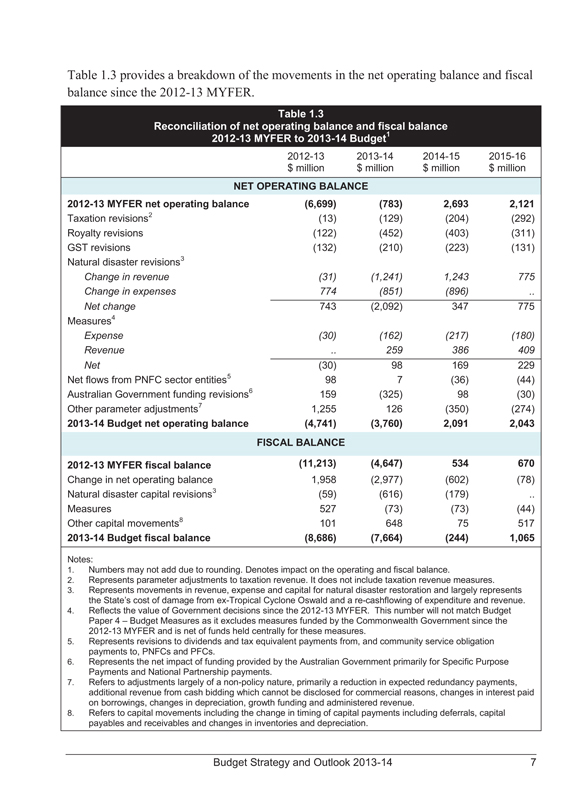
Table 1.3 provides a breakdown of the movements in the net operating balance and fiscal balance since the 2012-13 MYFER.
Table 1.3
Reconciliation of net operating balance and fiscal balance
2012-13 MYFER to 2013-14 Budget1
2012-13 2013-14 2014-15 2015-16
$ million $ million $ million $ million
NET OPERATING BALANCE
2012-13 MYFER net operating balance (6,699) (783) 2,693 2,121
Taxation revisions2 (13) (129) (204) (292)
Royalty revisions (122) (452) (403) (311)
GST revisions (132) (210) (223) (131)
Natural disaster revisions3
Change in revenue (31) (1,241) 1,243 775
Change in expenses 774 (851) (896) ..
Net change 743 (2,092) 347 775
Measures4
Expense (30) (162) (217) (180)
Revenue .. 259 386 409
Net (30) 98 169 229
Net flows from PNFC sector entities5 98 7 (36) (44)
Australian Government funding revisions6 159 (325) 98 (30)
Other parameter adjustments7 1,255 126 (350) (274)
2013-14 Budget net operating balance (4,741) (3,760) 2,091 2,043
FISCAL BALANCE
2012-13 MYFER fiscal balance (11,213) (4,647) 534 670
Change in net operating balance 1,958 (2,977) (602) (78)
Natural disaster capital revisions3 (59) (616) (179) ..
Measures 527 (73) (73) (44)
Other capital movements8 101 648 75 517
2013-14 Budget fiscal balance (8,686) (7,664) (244) 1,065
Notes:
1. Numbers may not add due to rounding. Denotes impact on the operating and fiscal balance.
2. Represents parameter adjustments to taxation revenue. It does not include taxation revenue measures.
3. Represents movements in revenue, expense and capital for natural disaster restoration and largely represents the State’s cost of damage from ex-Tropical Cyclone Oswald and a re-cashflowing of expenditure and revenue.
4. Reflects the value of Government decisions since the 2012-13 MYFER. This number will not match Budget Paper 4 – Budget Measures as it excludes measures funded by the Commonwealth Government since the 2012-13 MYFER and is net of funds held centrally for these measures.
5. Represents revisions to dividends and tax equivalent payments from, and community service obligation payments to, PNFCs and PFCs.
6. Represents the net impact of funding provided by the Australian Government primarily for Specific Purpose Payments and National Partnership payments.
7. Refers to adjustments largely of a non-policy nature, primarily a reduction in expected redundancy payments, additional revenue from cash bidding which cannot be disclosed for commercial reasons, changes in interest paid on borrowings, changes in depreciation, growth funding and administered revenue.
8. Refers to capital movements including the change in timing of capital payments including deferrals, capital payables and receivables and changes in inventories and depreciation.
Budget Strategy and Outlook 2013-14 7
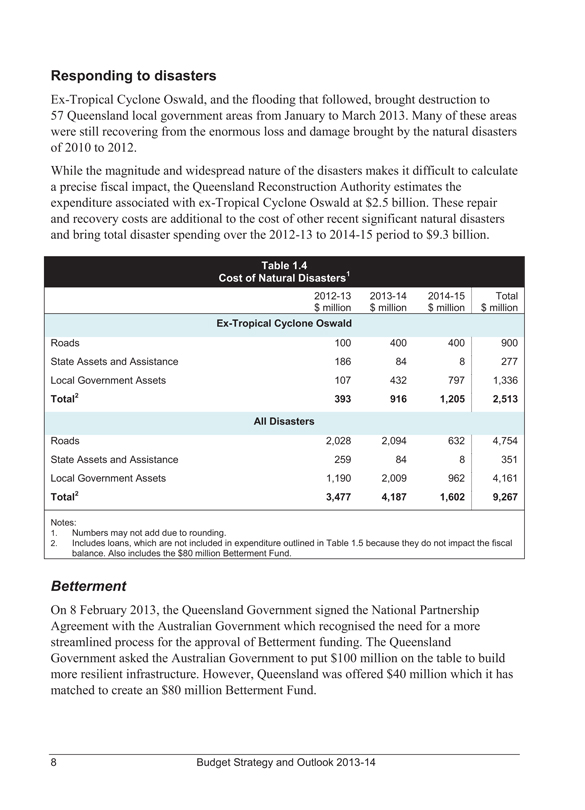
Responding to disasters
Ex-Tropical Cyclone Oswald, and the flooding that followed, brought destruction to 57 Queensland local government areas from January to March 2013. Many of these areas were still recovering from the enormous loss and damage brought by the natural disasters of 2010 to 2012.
While the magnitude and widespread nature of the disasters makes it difficult to calculate a precise fiscal impact, the Queensland Reconstruction Authority estimates the expenditure associated with ex-Tropical Cyclone Oswald at $2.5 billion. These repair and recovery costs are additional to the cost of other recent significant natural disasters and bring total disaster spending over the 2012-13 to 2014-15 period to $9.3 billion.
Table 1.4
Cost of Natural Disasters1
2012-13 2013-14 2014-15 Total
$ million $ million $ million $ million
Ex-Tropical Cyclone Oswald
Roads 100 400 400 900
State Assets and Assistance 186 84 8 277
Local Government Assets 107 432 797 1,336
Total2 393 916 1,205 2,513
All Disasters
Roads 2,028 2,094 632 4,754
State Assets and Assistance 259 84 8 351
Local Government Assets 1,190 2,009 962 4,161
Total2 3,477 4,187 1,602 9,267
Notes:
1. Numbers may not add due to rounding.
2. Includes loans, which are not included in expenditure outlined in Table 1.5 because they do not impact the fiscal balance. Also includes the $80 million Betterment Fund.
Betterment
On 8 February 2013, the Queensland Government signed the National Partnership Agreement with the Australian Government which recognised the need for a more streamlined process for the approval of Betterment funding. The Queensland Government asked the Australian Government to put $100 million on the table to build more resilient infrastructure. However, Queensland was offered $40 million which it has matched to create an $80 million Betterment Fund.
8 Budget Strategy and Outlook 2013-14
A number of roads and bridges have been rendered inaccessible on multiple occasions as a result of weather events in recent years. A map identifying the number of times sections of the State-controlled road network have been impacted by events is available at www.qldreconstruction.org.au.
The Queensland Government has identified a number of proposed betterment works, including sealing and strengthening road pavements and installing flood mitigation infrastructure. Betterment projects already benefiting from the Fund include:
• Gayndah Water Intake (North Burnett Regional Council)
• Blacks Road, Isis River (Bundaberg Regional Council)
• Barretts Road, Isis River (Bundaberg Regional Council)
• Gentle Annie Bridge, Apple Tree Creek (Bundaberg Regional Council).
Australian Government payments
The Australian Government released its 2013-14 Budget on 14 May 2013. As well as reducing forecasts for Queensland’s share of GST revenue, the Australian Government again reduced forecasts for health payments. Since the 2012-13 Budget, the Australian Government has reduced health funding forecasts by approximately $476 million across the forward estimates.
In addition, the Australian Government has continued its practice of moving cash payments to suit its own fiscal requirements, rather than to align with the actual delivery of services. Funding from the Australian Government has a significant impact on
Queensland’s fiscal position when it is not matched by an expense in the same financial year. This increases the volatility of the Queensland Budget estimate and makes it difficult to identify underlying trends over time.
The timing of revenue and expenditure in relation to natural disasters has significantly impacted Queensland’s headline fiscal balance. In particular, the Australian Government provided significant natural disaster funding in 2010-11 and 2011-12 in advance of spending requirements with the remaining payments in arrears of expenditure. This timing mismatch had the effect of improving Queensland’s budget outcomes in 2011-12, but is negatively impacting the State’s fiscal position in 2012-13 and 2013-14.
Budget Strategy and Outlook 2013-14 9
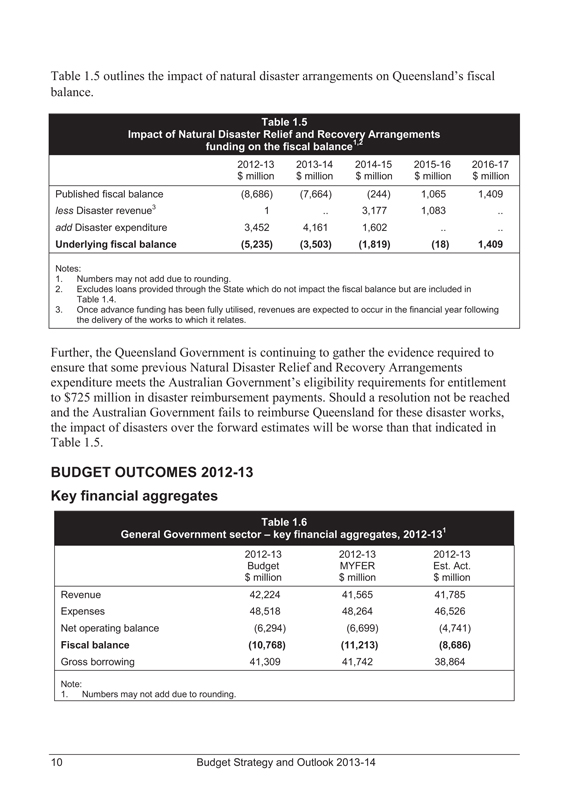
Table 1.5 outlines the impact of natural disaster arrangements on Queensland’s fiscal balance.
Table 1.5
Impact of Natural Disaster Relief and Recovery Arrangements funding on the fiscal balance1,2
2012-13 2013-14 2014-15 2015-16 2016-17
$ million $ million $ million $ million $ million
Published fiscal balance(8,686)(7,664)(244) 1,065 1,409
less Disaster revenue3 1 .. 3,177 1,083 ..
add Disaster expenditure 3,452 4,161 1,602 .. ..
Underlying fiscal balance (5,235) (3,503) (1,819) (18) 1,409
Notes:
1. Numbers may not add due to rounding.
2. Excludes loans provided through the State which do not impact the fiscal balance but are included in Table 1.4.
3. Once advance funding has been fully utilised, revenues are expected to occur in the financial year following the delivery of the works to which it relates.
Further, the Queensland Government is continuing to gather the evidence required to ensure that some previous Natural Disaster Relief and Recovery Arrangements expenditure meets the Australian Government’s eligibility requirements for entitlement to $725 million in disaster reimbursement payments. Should a resolution not be reached and the Australian Government fails to reimburse Queensland for these disaster works, the impact of disasters over the forward estimates will be worse than that indicated in Table 1.5.
BUDGET OUTCOMES 2012-13
Key financial aggregates
Table 1.6
General Government sector – key financial aggregates, 2012-131
2012-13 2012-13 2012-13
Budget MYFER Est. Act.
$ million $ million $ million
Revenue 42,224 41,565 41,785
Expenses 48,518 48,264 46,526
Net operating balance (6,294) (6,699) (4,741)
Fiscal balance (10,768) (11,213) (8,686)
Gross borrowing 41,309 41,742 38,864
Note:
1. Numbers may not add due to rounding.
10 Budget Strategy and Outlook 2013-14
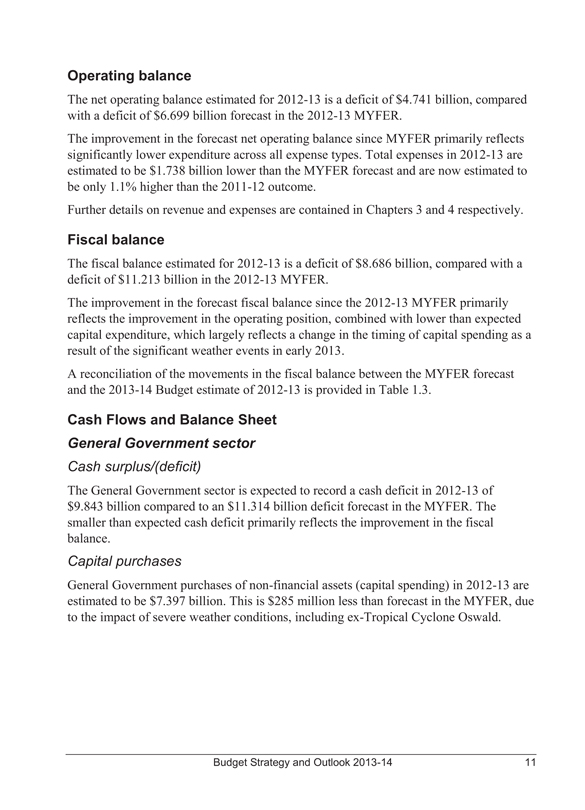
Operating balance
The net operating balance estimated for 2012-13 is a deficit of $4.741 billion, compared with a deficit of $6.699 billion forecast in the 2012-13 MYFER.
The improvement in the forecast net operating balance since MYFER primarily reflects significantly lower expenditure across all expense types. Total expenses in 2012-13 are estimated to be $1.738 billion lower than the MYFER forecast and are now estimated to be only 1.1% higher than the 2011-12 outcome.
Further details on revenue and expenses are contained in Chapters 3 and 4 respectively.
Fiscal balance
The fiscal balance estimated for 2012-13 is a deficit of $8.686 billion, compared with a deficit of $11.213 billion in the 2012-13 MYFER.
The improvement in the forecast fiscal balance since the 2012-13 MYFER primarily reflects the improvement in the operating position, combined with lower than expected capital expenditure, which largely reflects a change in the timing of capital spending as a result of the significant weather events in early 2013.
A reconciliation of the movements in the fiscal balance between the MYFER forecast and the 2013-14 Budget estimate of 2012-13 is provided in Table 1.3.
Cash Flows and Balance Sheet
General Government sector
Cash surplus/(deficit)
The General Government sector is expected to record a cash deficit in 2012-13 of $9.843 billion compared to an $11.314 billion deficit forecast in the MYFER. The smaller than expected cash deficit primarily reflects the improvement in the fiscal balance.
Capital purchases
General Government purchases of non-financial assets (capital spending) in 2012-13 are estimated to be $7.397 billion. This is $285 million less than forecast in the MYFER, due to the impact of severe weather conditions, including ex-Tropical Cyclone Oswald.
Budget Strategy and Outlook 2013-14 11
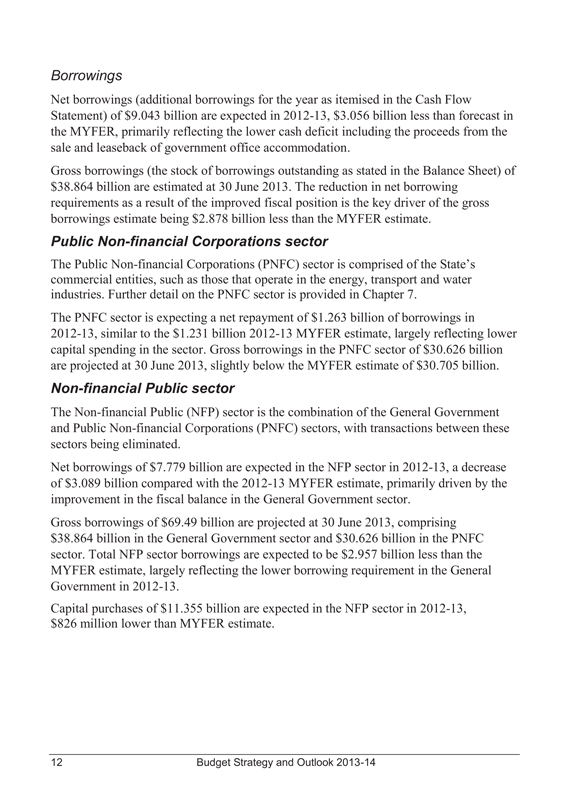
Borrowings
Net borrowings (additional borrowings for the year as itemised in the Cash Flow Statement) of $9.043 billion are expected in 2012-13, $3.056 billion less than forecast in the MYFER, primarily reflecting the lower cash deficit including the proceeds from the sale and leaseback of government office accommodation.
Gross borrowings (the stock of borrowings outstanding as stated in the Balance Sheet) of $38.864 billion are estimated at 30 June 2013. The reduction in net borrowing requirements as a result of the improved fiscal position is the key driver of the gross borrowings estimate being $2.878 billion less than the MYFER estimate.
Public Non-financial Corporations sector
The Public Non-financial Corporations (PNFC) sector is comprised of the State’s commercial entities, such as those that operate in the energy, transport and water industries. Further detail on the PNFC sector is provided in Chapter 7.
The PNFC sector is expecting a net repayment of $1.263 billion of borrowings in 2012-13, similar to the $1.231 billion 2012-13 MYFER estimate, largely reflecting lower capital spending in the sector. Gross borrowings in the PNFC sector of $30.626 billion are projected at 30 June 2013, slightly below the MYFER estimate of $30.705 billion.
Non-financial Public sector
The Non-financial Public (NFP) sector is the combination of the General Government and Public Non-financial Corporations (PNFC) sectors, with transactions between these sectors being eliminated.
Net borrowings of $7.779 billion are expected in the NFP sector in 2012-13, a decrease of $3.089 billion compared with the 2012-13 MYFER estimate, primarily driven by the improvement in the fiscal balance in the General Government sector.
Gross borrowings of $69.49 billion are projected at 30 June 2013, comprising $38.864 billion in the General Government sector and $30.626 billion in the PNFC sector. Total NFP sector borrowings are expected to be $2.957 billion less than the MYFER estimate, largely reflecting the lower borrowing requirement in the General Government in 2012-13.
Capital purchases of $11.355 billion are expected in the NFP sector in 2012-13, $826 million lower than MYFER estimate.
12 Budget Strategy and Outlook 2013-14
2013-14 BUDGET AND OUTYEAR PROJECTIONS
Key financial aggregates
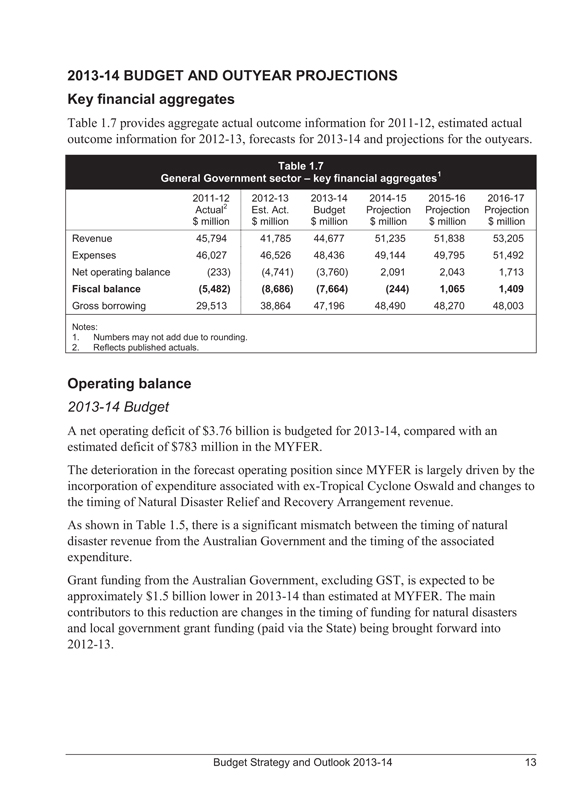
Table 1.7 provides aggregate actual outcome information for 2011-12, estimated actual outcome information for 2012-13, forecasts for 2013-14 and projections for the outyears.
Table 1.7
General Government sector – key financial aggregates1
2011-12 Actual2 $ million 2012-13 Est. Act. $ million 2013-14 Budget $ million 2014-15 Projection $ million 2015-16 Projection $ million 2016-17 Projection $ million
Revenue 45,794 41,785 44,677 51,235 51,838 53,205
Expenses 46,027 46,526 48,436 49,144 49,795 51,492
Net operating balance (233) (4,741) (3,760) 2,091 2,043 1,713
Fiscal balance (5,482) (8,686) (7,664) (244) 1,065 1,409
Gross borrowing 29,513 38,864 47,196 48,490 48,270 48,003
Notes:
1. Numbers may not add due to rounding.
2. Reflects published actuals.
Operating balance
2013-14 Budget
A net operating deficit of $3.76 billion is budgeted for 2013-14, compared with an estimated deficit of $783 million in the MYFER.
The deterioration in the forecast operating position since MYFER is largely driven by the incorporation of expenditure associated with ex-Tropical Cyclone Oswald and changes to the timing of Natural Disaster Relief and Recovery Arrangement revenue.
As shown in Table 1.5, there is a significant mismatch between the timing of natural disaster revenue from the Australian Government and the timing of the associated expenditure.
Grant funding from the Australian Government, excluding GST, is expected to be approximately $1.5 billion lower in 2013-14 than estimated at MYFER. The main contributors to this reduction are changes in the timing of funding for natural disasters and local government grant funding (paid via the State) being brought forward into 2012-13.
Budget Strategy and Outlook 2013-14 13
The other key drivers in the deterioration of the forecast 2013-14 net operating position since the 2012-13 MYFER are:
• a $452 million reduction in forecast royalty revenue, largely due to a weaker outlook for coal prices
• a $210 million reduction in Queensland’s forecast share of GST revenue, as a result of the Australian Government revising down the size of the national GST pool and also revising down Queensland’s share of the national population
• a $129 million underlying reduction in taxation revenue, primarily reflecting a slower recovery in property market activity and weakness in taxable land values.
Forward estimates
Significant improvements in the net operating balance are projected over the forward estimates as a result of the fiscal repair measures announced in the 2012-13 Budget, which were estimated to improve the fiscal balance by an average of $2.4 billion per annum from 2013-14 onwards.
The 2013-14 Budget demonstrates the Government’s ongoing commitment to fiscal discipline. While the Government is implementing service delivery enhancements, such as Great Teachers = Great Results, the budget impact of spending measures since the 2012-13 Budget has been offset across the forward estimates by saving and revenue measures.
Total operating expenses are expected to grow by 4.1% in 2013-14, with the largest component of this growth relating to grants to local governments associated with disaster recovery. Abstracting from disaster related expenditure, operating expenses are expected to grow by 2.8%. Expenses are projected to continue to grow modestly from 2014-15 onwards.
14 Budget Strategy and Outlook 2013-14
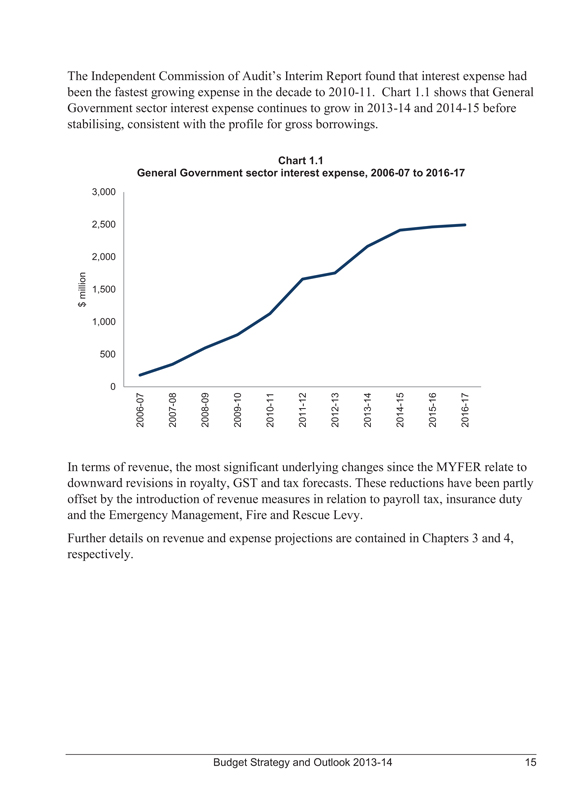
The Independent Commission of Audit’s Interim Report found that interest expense had been the fastest growing expense in the decade to 2010-11. Chart 1.1 shows that General Government sector interest expense continues to grow in 2013-14 and 2014-15 before stabilising, consistent with the profile for gross borrowings.
Chart 1.1
General Government sector interest expense, 2006-07 to 2016-17
$ million
3,000
2,500
2,000
1,500
1,000
500
0
2006-07 2007-08 2008-09 2009-10 2010-11 2011-12 2012-13 2013-14 2014-15 2015-16 2016-17
In terms of revenue, the most significant underlying changes since the MYFER relate to downward revisions in royalty, GST and tax forecasts. These reductions have been partly offset by the introduction of revenue measures in relation to payroll tax, insurance duty and the Emergency Management, Fire and Rescue Levy.
Further details on revenue and expense projections are contained in Chapters 3 and 4, respectively.
Budget Strategy and Outlook 2013-14 15
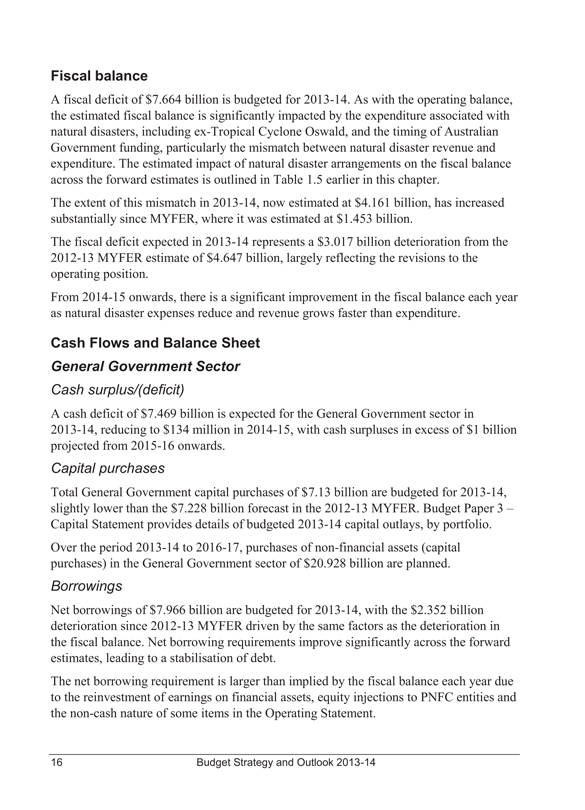
Fiscal balance
A fiscal deficit of $7.664 billion is budgeted for 2013-14. As with the operating balance, the estimated fiscal balance is significantly impacted by the expenditure associated with natural disasters, including ex-Tropical Cyclone Oswald, and the timing of Australian Government funding, particularly the mismatch between natural disaster revenue and expenditure. The estimated impact of natural disaster arrangements on the fiscal balance across the forward estimates is outlined in Table 1.5 earlier in this chapter.
The extent of this mismatch in 2013-14, now estimated at $4.161 billion, has increased substantially since MYFER, where it was estimated at $1.453 billion.
The fiscal deficit expected in 2013-14 represents a $3.017 billion deterioration from the 2012-13 MYFER estimate of $4.647 billion, largely reflecting the revisions to the operating position.
From 2014-15 onwards, there is a significant improvement in the fiscal balance each year as natural disaster expenses reduce and revenue grows faster than expenditure.
Cash Flows and Balance Sheet
General Government Sector
Cash surplus/(deficit)
A cash deficit of $7.469 billion is expected for the General Government sector in 2013-14, reducing to $134 million in 2014-15, with cash surpluses in excess of $1 billion projected from 2015-16 onwards.
Capital purchases
Total General Government capital purchases of $7.13 billion are budgeted for 2013-14, slightly lower than the $7.228 billion forecast in the 2012-13 MYFER. Budget Paper 3 – Capital Statement provides details of budgeted 2013-14 capital outlays, by portfolio.
Over the period 2013-14 to 2016-17, purchases of non-financial assets (capital purchases) in the General Government sector of $20.928 billion are planned.
Borrowings
Net borrowings of $7.966 billion are budgeted for 2013-14, with the $2.352 billion deterioration since 2012-13 MYFER driven by the same factors as the deterioration in the fiscal balance. Net borrowing requirements improve significantly across the forward estimates, leading to a stabilisation of debt.
The net borrowing requirement is larger than implied by the fiscal balance each year due to the reinvestment of earnings on financial assets, equity injections to PNFC entities and the non-cash nature of some items in the Operating Statement.
16 Budget Strategy and Outlook 2013-14
Gross borrowings of $47.196 billion are expected in the General Government sector at 30 June 2014, similar to the 2012-13 MYFER forecast of $47.103 billion, reflecting the lower borrowing requirement in 2012-13 being offset by the higher borrowing requirement in 2013-14.
Over the Budget and forward estimates period, total General Government net borrowings of $8.74 billion are planned. Gross borrowings are expected to peak at $48.49 billion at 30 June 2015, before declining slightly to $48.003 billion at 30 June 2017. This would represent the first reduction in General Government gross borrowings since 2005-06.
Non-financial Public Sector
Net borrowings in 2013-14 are estimated at $8.496 billion, compared to a 2012-13 MYFER forecast of $6.839 billion. This largely reflects the deterioration in the General Government sector’s fiscal balance, partially offset by a lower than expected borrowing requirement in the PNFC sector.
Total net borrowings across 2013-14 and the forward estimates are expected to be $11.653 billion. These borrowings represent less than a third of the planned $36.274 billion of purchases of non-financial assets in this period, which includes $15.346 billion in the PNFC sector.
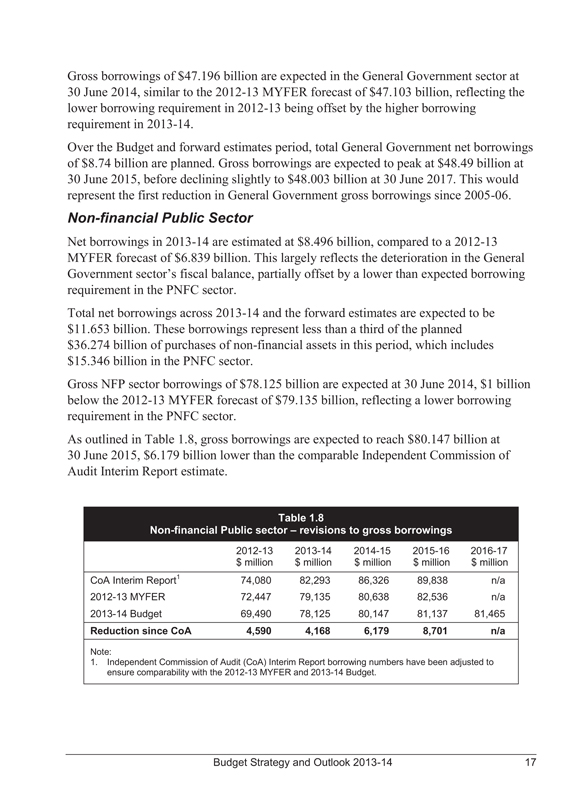
Gross NFP sector borrowings of $78.125 billion are expected at 30 June 2014, $1 billion below the 2012-13 MYFER forecast of $79.135 billion, reflecting a lower borrowing requirement in the PNFC sector.
As outlined in Table 1.8, gross borrowings are expected to reach $80.147 billion at 30 June 2015, $6.179 billion lower than the comparable Independent Commission of Audit Interim Report estimate.
Table 1.8
Non-financial Public sector – revisions to gross borrowings
2012-13 2013-14 2014-15 2015-16 2016-17
$ million $ million $ million $ million $ million
CoA Interim Report1 74,080 82,293 86,326 89,838 n/a
2012-13 MYFER 72,447 79,135 80,638 82,536 n/a
2013-14 Budget 69,490 78,125 80,147 81,137 81,465
Reduction since CoA 4,590 4,168 6,179 8,701 n/a
Note:
1. Independent Commission of Audit (CoA) Interim Report borrowing numbers have been adjusted to ensure comparability with the 2012-13 MYFER and 2013-14 Budget.
Budget Strategy and Outlook 2013-14 17
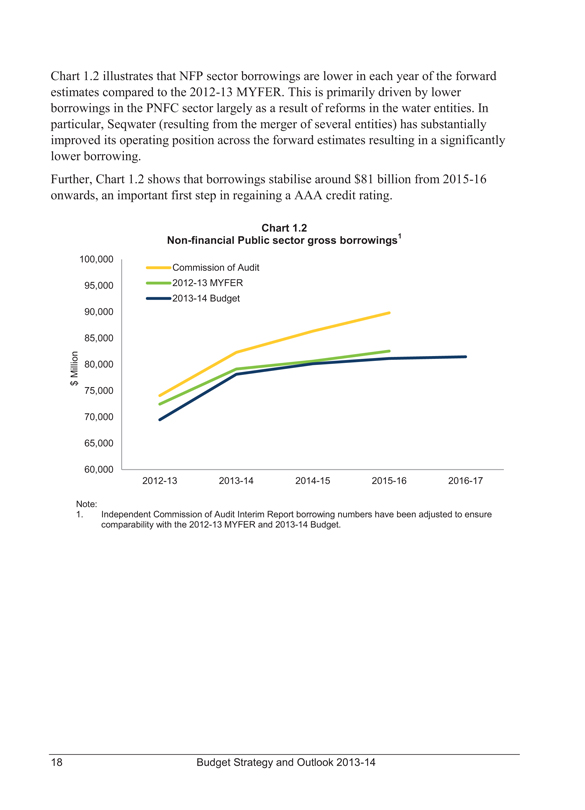
Chart 1.2 illustrates that NFP sector borrowings are lower in each year of the forward estimates compared to the 2012-13 MYFER. This is primarily driven by lower borrowings in the PNFC sector largely as a result of reforms in the water entities. In particular, Seqwater (resulting from the merger of several entities) has substantially improved its operating position across the forward estimates resulting in a significantly lower borrowing.
Further, Chart 1.2 shows that borrowings stabilise around $81 billion from 2015-16 onwards, an important first step in regaining a AAA credit rating.
Chart 1.2
Non-financial Public sector gross borrowings1
$ Million
100,000
95,000
90,000
85,000
80,000
75,000
70,000
65,000
60,000
Commission of Audit
2012-13 MYFER
2013-14 Budget
2012-13 2013-14 2014-15 2015-16 2016-17
Note:
1. Independent Commission of Audit Interim Report borrowing numbers have been adjusted to ensure comparability with the 2012-13 MYFER and 2013-14 Budget.
18 Budget Strategy and Outlook 2013-14
FISCAL STRATEGY AS A GUIDING PRINCIPLE FOR POLICY
The Government undertook significant fiscal reform in the 2012-13 Budget. Without this reform the Government would not have been as well placed to meet the costs associated with the rebuilding task arising from the ex-Tropical Cyclone Oswald. However, the extent of the disaster repairs and continued weakness in global economic conditions has created further fiscal challenges for Government.
Savings on Track
The 2012-13 Budget included measures worth $7.766 billion over the period 2012-13 to 2015-16, comprising:
• expense measures of $5.277 billion
• revenue measures of $0.812 billion
• capital measures of $1.677 billion.
These measures were largely achieved by Government exiting activities that are not the domain of the Queensland Government, by reducing waste and inefficiency in Government activities and by implementing specifically targeted revenue measures.
The Government implemented a number of expense measures in late 2011-12 (for example, $431.2 million from 2011-12 to 2014-15 from the abolition of redundant carbon schemes) or part way through 2012-13 (for example, $287.7 million from 2012-13 to 2015-16 from ceasing state employment programs which are appropriately the responsibility of the Australian Government). Once implemented, these measures resulted in ongoing annual savings.
Another major component of the 2012-13 Budget fiscal measures was a 14,000 reduction in Full Time Equivalent (FTE) positions in 2012-13 including 10,600 redundancies. As outlined in Chapter 4, the Government is now estimating the reduction in FTEs in 2012-13 to be 12,800, including approximately 9,200 redundancies.
The Government has clearly demonstrated its ability to manage expenditure, with operating expenses in 2012-13 estimated to be $2 billion lower than budgeted. It is estimated that total operating expenses in 2012-13 will be only 1.1% above 2011-12 levels.
Ongoing monitoring of Government activity will ensure that forecast savings continue to be met across the forward estimates. As part of this monitoring process, the Government has decided that departments will achieve further savings of $100 million per annum from 2013-14. More detail on this measure can be found in Chapter 4 of this Budget Paper and in Budget Paper 4 – Budget Measures.
Budget Strategy and Outlook 2013-14 19
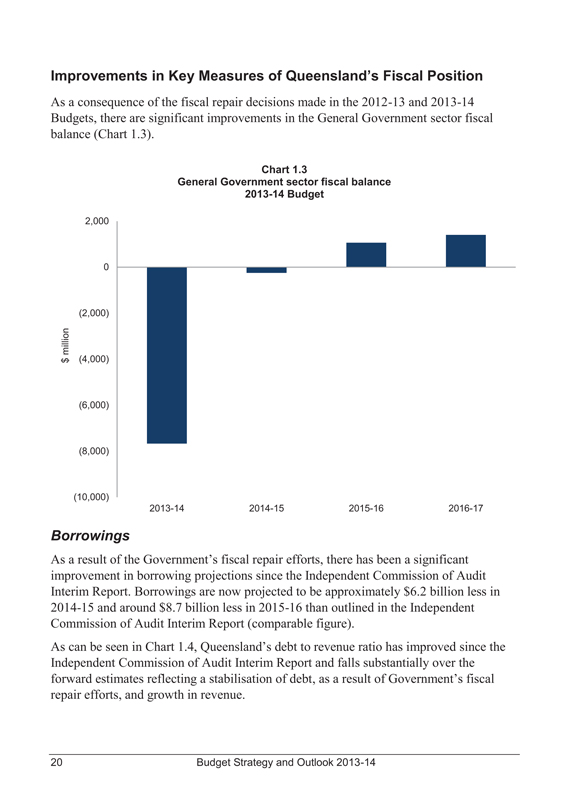
Improvements in Key Measures of Queensland’s Fiscal Position
As a consequence of the fiscal repair decisions made in the 2012-13 and 2013-14 Budgets, there are significant improvements in the General Government sector fiscal balance (Chart 1.3).
Chart 1.3
General Government sector fiscal balance 2013-14 Budget
$ million
2,000
0
(2,000)
(4,000)
(6,000)
(8,000)
(10,000)
2013-14 2014-15 2015-16 2016-17
Borrowings
As a result of the Government’s fiscal repair efforts, there has been a significant improvement in borrowing projections since the Independent Commission of Audit Interim Report. Borrowings are now projected to be approximately $6.2 billion less in 2014-15 and around $8.7 billion less in 2015-16 than outlined in the Independent Commission of Audit Interim Report (comparable figure).
As can be seen in Chart 1.4, Queensland’s debt to revenue ratio has improved since the Independent Commission of Audit Interim Report and falls substantially over the forward estimates reflecting a stabilisation of debt, as a result of Government’s fiscal repair efforts, and growth in revenue.
20 Budget Strategy and Outlook 2013-14
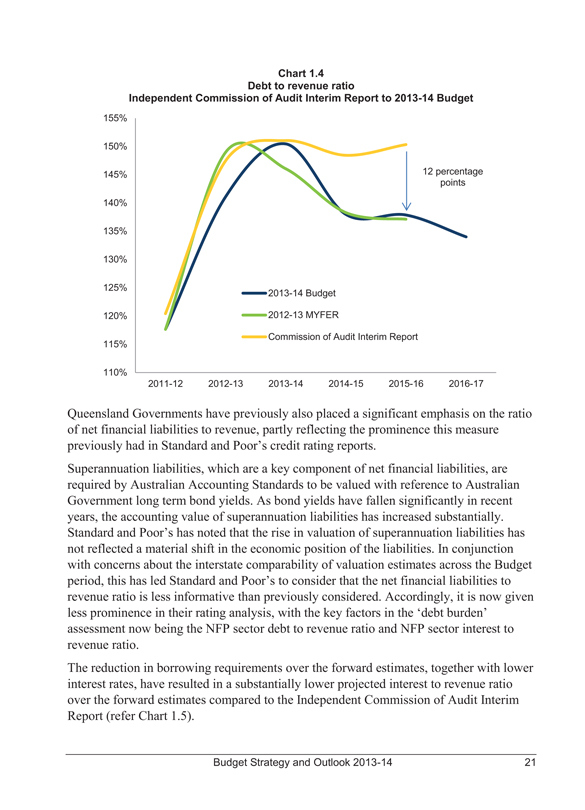
Chart 1.4
Debt to revenue ratio
Independent Commission of Audit Interim Report to 2013-14 Budget
155%
150%
145%
140%
135%
130%
125%
120%
115%
110%
12 percentage points
2013-14 Budget
2012-13 MYFER
Commission of Audit Interim Report
2011-12 2012-13 2013-14 2014-15 2015-16 2016-17
Queensland Governments have previously also placed a significant emphasis on the ratio of net financial liabilities to revenue, partly reflecting the prominence this measure previously had in Standard and Poor’s credit rating reports.
Superannuation liabilities, which are a key component of net financial liabilities, are required by Australian Accounting Standards to be valued with reference to Australian Government long term bond yields. As bond yields have fallen significantly in recent years, the accounting value of superannuation liabilities has increased substantially.
Standard and Poor’s has noted that the rise in valuation of superannuation liabilities has not reflected a material shift in the economic position of the liabilities. In conjunction with concerns about the interstate comparability of valuation estimates across the Budget period, this has led Standard and Poor’s to consider that the net financial liabilities to revenue ratio is less informative than previously considered. Accordingly, it is now given less prominence in their rating analysis, with the key factors in the ‘debt burden’ assessment now being the NFP sector debt to revenue ratio and NFP sector interest to revenue ratio.
The reduction in borrowing requirements over the forward estimates, together with lower interest rates, have resulted in a substantially lower projected interest to revenue ratio over the forward estimates compared to the Independent Commission of Audit Interim Report (refer Chart 1.5).
Budget Strategy and Outlook 2013-14 21
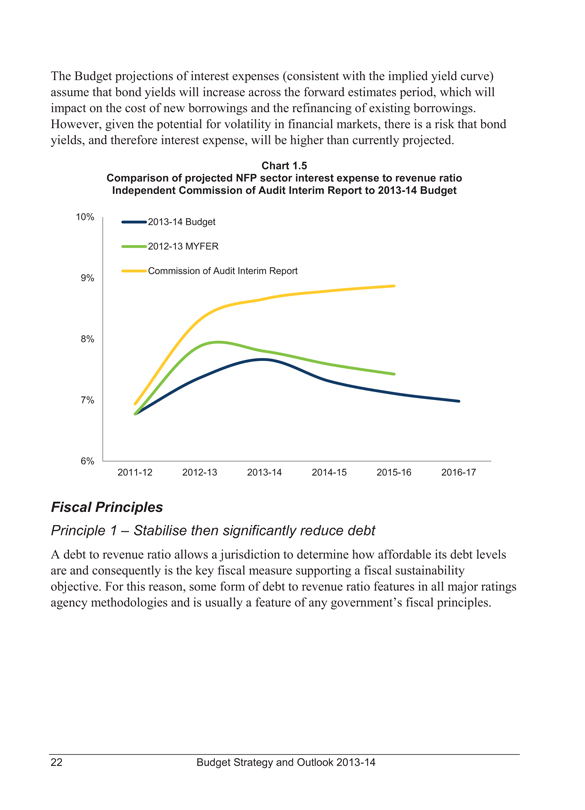
The Budget projections of interest expenses (consistent with the implied yield curve) assume that bond yields will increase across the forward estimates period, which will impact on the cost of new borrowings and the refinancing of existing borrowings. However, given the potential for volatility in financial markets, there is a risk that bond yields, and therefore interest expense, will be higher than currently projected.
Chart 1.5
Comparison of projected NFP sector interest expense to revenue ratio Independent Commission of Audit Interim Report to 2013-14 Budget
10%
9%
8%
7%
6%
2013-14 Budget
2012-13 MYFER
Commission of Audit Interim Report
2011-12 2012-13 2013-14 2014-15 2015-16 2016-17
Fiscal Principles
Principle 1 – Stabilise then significantly reduce debt
A debt to revenue ratio allows a jurisdiction to determine how affordable its debt levels are and consequently is the key fiscal measure supporting a fiscal sustainability objective. For this reason, some form of debt to revenue ratio features in all major ratings agency methodologies and is usually a feature of any government’s fiscal principles.
22 Budget Strategy and Outlook 2013-14
Principle 2 – Achieve and maintain a General Government sector fiscal balance by 2014-15
The Independent Commission of Audit’s Interim Report emphasised that fiscal repair requires realigning recurrent and capital spending so that it can be funded from recurrent revenue. The achievement of an operating surplus in itself is not sufficient for Government to attain fiscal sustainability or maintain or improve its credit rating given the impact of capital investment on the debt position.
Borrowing should not be undertaken for the maintenance of the existing capital base. This means that Government needs a minimum of a balanced operating position (depreciation and maintenance are expensed) with any operating surplus used to fund new capital expansion. The size of that surplus should be determined by the appropriate size of the capital program and the sustainability of current debt levels.
While it is arguably appropriate to borrow for new essential infrastructure when debt levels are manageable, they are currently too high.
Accordingly, the fiscal balance has replaced the operating balance as the primary fiscal target of the Government.
In the 2013-14 Budget, the Government has implemented savings and revenue measures that offset expenditure decisions since MYFER, and is continuing to deliver the savings outlined in the 2012-13 Budget. Nevertheless, the scale of natural disasters and revenue write-downs has resulted in a modest fiscal deficit of $244 million (or 0.5% of General Government revenue) being projected for 2014-15. The Government will continue to pursue a fiscal balance in 2014-15 as a policy objective.
Principle 3 – Maintain a competitive tax environment for business
Queensland has a competitive tax environment for business. Queensland’s General Government taxation revenue as a percentage of gross state product has fallen over the past decade (in part reflecting the relative weakness in the property sector and the abolition of state taxes under the Intergovernmental Agreement on Federal Financial Relations). Queensland’s tax take, on a per capita basis, is also significantly less than the average of the other states.
Principle 4 – Target full funding of long term liabilities such as superannuation in accordance with actuarial advice
One of the enduring features of Queensland public finance has been setting aside funding, on an actuarially determined basis, to meet long term employee entitlements – most notably superannuation and long service leave.
Budget Strategy and Outlook 2013-14 23
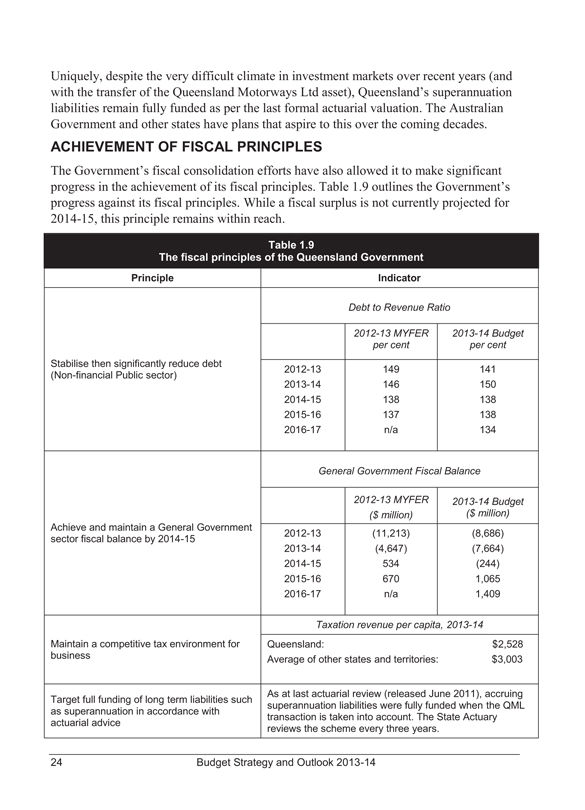
Uniquely, despite the very difficult climate in investment markets over recent years (and with the transfer of the Queensland Motorways Ltd asset), Queensland’s superannuation liabilities remain fully funded as per the last formal actuarial valuation. The Australian Government and other states have plans that aspire to this over the coming decades.
ACHIEVEMENT OF FISCAL PRINCIPLES
The Government’s fiscal consolidation efforts have also allowed it to make significant progress in the achievement of its fiscal principles. Table 1.9 outlines the Government’s progress against its fiscal principles. While a fiscal surplus is not currently projected for 2014-15, this principle remains within reach.
Table 1.9
The fiscal principles of the Queensland Government
Principle Indicator Debt to Revenue Ratio
2012-13 MYFER
2013-14 Budget
per cent
per cent
Stabilise then significantly reduce debt
(Non-financial Public sector)
2012-13
149
141
2013-14
146
150
2014-15
138
138
2015-16
137
138
2016-17
n/a
134
General Government Fiscal Balance
2012-13 MYFER
2013-14 Budget
($ million)
($ million)
Achieve and maintain a General Government sector fiscal balance by 2014-15
2012-13
(11,213)
(8,686)
2013-14
(4,647)
(7,664)
2014-15
534
(244)
2015-16
670
1,065
2016-17
n/a
1,409
Taxation revenue per capita, 2013-14
Maintain a competitive tax environment for business
Queensland:
$2,528
Average of other states and territories:
$3,003
Target full funding of long term liabilities such as superannuation in accordance with actuarial advice
As at last actuarial review (released June 2011), accruing superannuation liabilities were fully funded when the QML transaction is taken into account. The State Actuary reviews the scheme every three years.
24 Budget Strategy and Outlook 2013-14
Box 1.1
Independent Commission of Audit Final Report
The Independent Commission of Audit was established on 26 March 2012 in keeping with the
Government’s election commitment.
The Independent Commission’s Interim Report was released in June 2012 and focussed on the immediate fiscal repair task – that was, addressing the unsustainable gap between expenditure and revenue growth and the consequent rapid rise in State debt.
The Government took steps to address these issues in the 2012-13 Budget.
The Independent Commission delivered its Final Report in February 2013. The Final Report is focussed on the role and operations of Government in a modern economy.
The Final Report is essentially about ways in which the quality and quantity of frontline services can be improved, including models that make better use of the skills, capacity and innovation of the private and not-for-profit sectors.
The Queensland Government wants to be able to provide more services to Queenslanders and improve the quality of those services.
The Queensland Government’s view is that the best way to expand and improve services is to fundamentally change the way in which its services are structured and managed.
Government has accepted the overwhelming majority of the recommendations in the Final Report. In many cases, it is possible to identify examples which already put the Government on the path to implementation. In other cases, recommendations that imply major change represent what has been standard practice in some other states for many years.
Nonetheless, the implementation task will be considerable and will need to be staged. Some recommendations can be implemented quickly. Others will take several years or will be ongoing in nature.
Many of the recommendations relate to contestability. Contestability is not an outcome, but rather a process whereby Government tests the market to ensure it is providing the public with the best possible solution at the best possible price.
The Government is determined to transition to the enabler. It does not always need to be the provider. In a modern Queensland, citizens care much less about who is the provider – they care about access, quality and timeliness of the services they receive.
The Government’s response to the Final Report is set out in A Plan – Better Services for Queenslanders: www.treasury.qld.gov.au/coa-response/better-services.shtml.
Budget Strategy and Outlook 2013-14 25

26 Budget Strategy and Outlook 2013-14
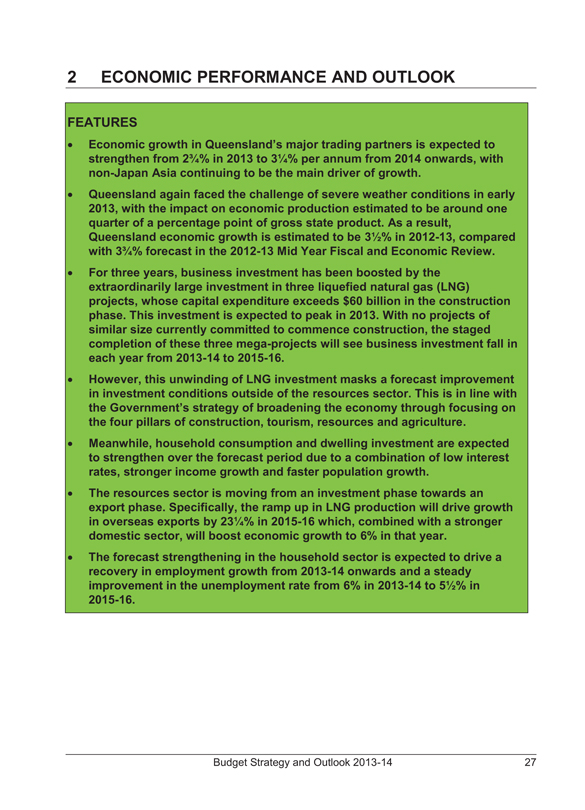
2 ECONOMIC PERFORMANCE AND OUTLOOK
FEATURES
• Economic growth in Queensland’s major trading partners is expected to strengthen from 2 3/4% in 2013 to 3 1/4% per annum from 2014 onwards, with non-Japan Asia continuing to be the main driver of growth.
• Queensland again faced the challenge of severe weather conditions in early 2013, with the impact on economic production estimated to be around one quarter of a percentage point of gross state product. As a result, Queensland economic growth is estimated to be 3 1/2% in 2012-13, compared with 3 3/4% forecast in the 2012-13 Mid Year Fiscal and Economic Review.
• For three years, business investment has been boosted by the extraordinarily large investment in three liquefied natural gas (LNG) projects, whose capital expenditure exceeds $60 billion in the construction phase. This investment is expected to peak in 2013. With no projects of similar size currently committed to commence construction, the staged completion of these three mega-projects will see business investment fall in each year from 2013-14 to 2015-16.
• However, this unwinding of LNG investment masks a forecast improvement in investment conditions outside of the resources sector. This is in line with the Government’s strategy of broadening the economy through focusing on the four pillars of construction, tourism, resources and agriculture.
• Meanwhile, household consumption and dwelling investment are expected to strengthen over the forecast period due to a combination of low interest rates, stronger income growth and faster population growth.
• The resources sector is moving from an investment phase towards an export phase. Specifically, the ramp up in LNG production will drive growth in overseas exports by 23 1/4% in 2015-16 which, combined with a stronger domestic sector, will boost economic growth to 6% in that year.
• The forecast strengthening in the household sector is expected to drive a recovery in employment growth from 2013-14 onwards and a steady improvement in the unemployment rate from 6% in 2013-14 to 5 1/2% in 2015-16.
Budget Strategy and Outlook 2013-14 27
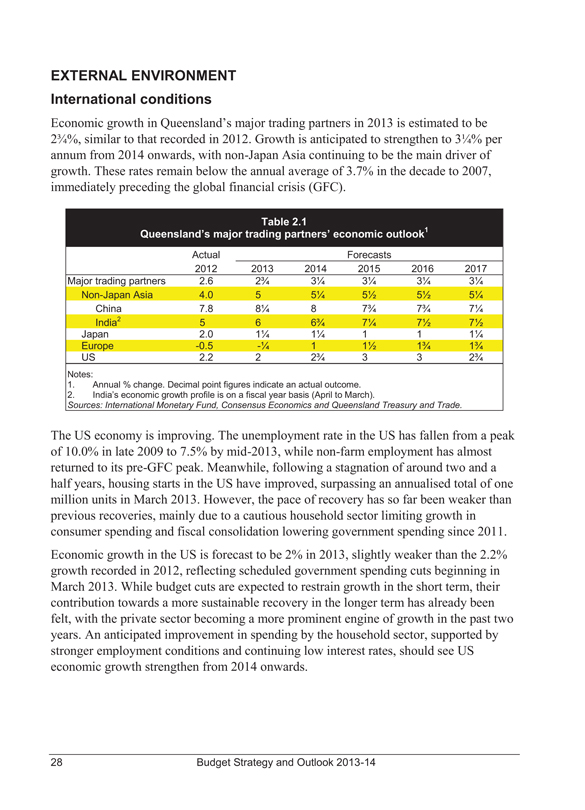
EXTERNAL ENVIRONMENT
International conditions
Economic growth in Queensland’s major trading partners in 2013 is estimated to be
2 3/4%, similar to that recorded in 2012. Growth is anticipated to strengthen to 3 1/4% per annum from 2014 onwards, with non-Japan Asia continuing to be the main driver of growth. These rates remain below the annual average of 3.7% in the decade to 2007, immediately preceding the global financial crisis (GFC).
Table 2.1
Queensland’s major trading partners’ economic outlook1
Actual Forecasts
2012 2013 2014 2015 2016 2017
Major trading partners 2.6 2 3/4 3 1/4 3 1/4 3 1/4 3 1/4
Non-Japan Asia 4.0 5 5 1/4 5 1/2 5 1/2 5 1/4
China 7.8 8 1/4 8 7 3/4 7 3/4 7 1/4
India2 5 6 6 3/4 7 1/4 7 1/2 7 1/2
Japan 2.0 1 1/4 1 1/4 1 1 1 1/4
Europe -0.5 - 1/4 1 1 1/2 1 3/4 1 3/4
US 2.2 2 2 3/4 3 3 2 3/4
Notes:
1. Annual % change. Decimal point figures indicate an actual outcome.
2. India’s economic growth profile is on a fiscal year basis (April to March).
Sources: International Monetary Fund, Consensus Economics and Queensland Treasury and Trade.
The US economy is improving. The unemployment rate in the US has fallen from a peak of 10.0% in late 2009 to 7.5% by mid-2013, while non-farm employment has almost returned to its pre-GFC peak. Meanwhile, following a stagnation of around two and a half years, housing starts in the US have improved, surpassing an annualised total of one million units in March 2013. However, the pace of recovery has so far been weaker than previous recoveries, mainly due to a cautious household sector limiting growth in consumer spending and fiscal consolidation lowering government spending since 2011.
Economic growth in the US is forecast to be 2% in 2013, slightly weaker than the 2.2% growth recorded in 2012, reflecting scheduled government spending cuts beginning in March 2013. While budget cuts are expected to restrain growth in the short term, their contribution towards a more sustainable recovery in the longer term has already been felt, with the private sector becoming a more prominent engine of growth in the past two years. An anticipated improvement in spending by the household sector, supported by stronger employment conditions and continuing low interest rates, should see US economic growth strengthen from 2014 onwards.
28 Budget Strategy and Outlook 2013-14
In Japan, economic growth in 2012 was boosted by reconstruction related government expenditure, offsetting the decline in exports due to subdued overseas demand and high Yen exchange rates. Recognising the underlying weakness of the economy, the Bank of Japan launched another round of quantitative easing in September and October 2012. Subsequently, a large scale fiscal stimulus package was announced by the Japanese Government in January 2013.
In an attempt to end the deflation spiral in Japan, the Bank of Japan implemented an aggressive monetary easing regime in April 2013 that aims to lift the country’s inflation rate to the Bank’s increased target of 2% per annum in two years. As a result of these stimulatory policies, growth prospects for the Japanese economy have improved, with a moderate recovery anticipated from mid-2013 onwards. However, scheduled increases in the consumption tax in 2014 and 2015, together with an unwinding in reconstruction spending, may disrupt the pace of the recovery at that time.
Confronted by weakening overseas demand, Korea’s economic growth moderated to 2.0% in 2012. Although overseas demand may improve somewhat in 2013, the recent sharp depreciation of the Yen is likely to adversely affect Korea’s export performance and, therefore, its overall economic growth, due to the similarity of the two countries’ export profiles.
Despite the announcement of a large fiscal stimulus package in September 2012 and an easy monetary stance resulting in social financing increasing almost 23% in 2012, China’s economic growth slowed to 7.8% in the year. The focus of the new national leaders on income redistribution, together with the longer term objective of a more domestically driven economy, is expected to see China’s economic growth moderate somewhat during this transition phase. However, China’s demand for resources from overseas is not expected to wane, due to the intention of the Chinese Government to limit the pace of growth in domestic mining.
With the implementation of “Outright Monetary Transactions” and the establishment of the “European Stability Mechanism” in September 2012, the risk of a financial meltdown in the Euro Area has been largely averted. However, large scale fiscal austerity in some peripheral economies and the risk averseness of the banking sector pushed the Euro Area deeper into recession over the course of 2012. This trend is expected to continue in 2013, with the realisation of an anticipated recovery in 2014 hinging on the progress of banking and fiscal unions in the region. Confidence remains fragile, as seen during the crisis in Cyprus in early 2013.
Budget Strategy and Outlook 2013-14 29
Assumptions
Forecasts for the Queensland economy are based on several assumptions, including about the RBA’s monetary policy stance, the A$ exchange rate and seasonal conditions over the forecast period:
• in line with market expectations, the official cash rate is assumed to be lowered some time in 2013-14, with the easing cycle ending in early 2015. The official cash rate is anticipated to gradually move toward a more neutral level by the end of 2016-17
• as anticipated in the 2012-13 State Budget, the A$ has remained well above parity with the US$ for most of 2012-13. The ongoing appetite for Australian debt is expected to see the A$ remain close to parity in 2013-14, before gradually easing over the remainder of the forecast period, as global monetary and economic conditions improve. Recent volatility in the exchange rate has seen the A$ fall below parity. This has occurred more quickly than the budget projections, but current levels would need to be sustained for a number of months before forecasts would need to be adjusted
• after flooding in early 2013, seasonal conditions in the State as a whole are assumed to return to normal from 2013-14 onward. However, uneven rainfall distribution has meant that parts of western and south western Queensland were recently drought declared.
This chapter ends with a discussion of the risks related to the global economy, financial markets and other assumptions driving the Queensland outlook.
30 Budget Strategy and Outlook 2013-14
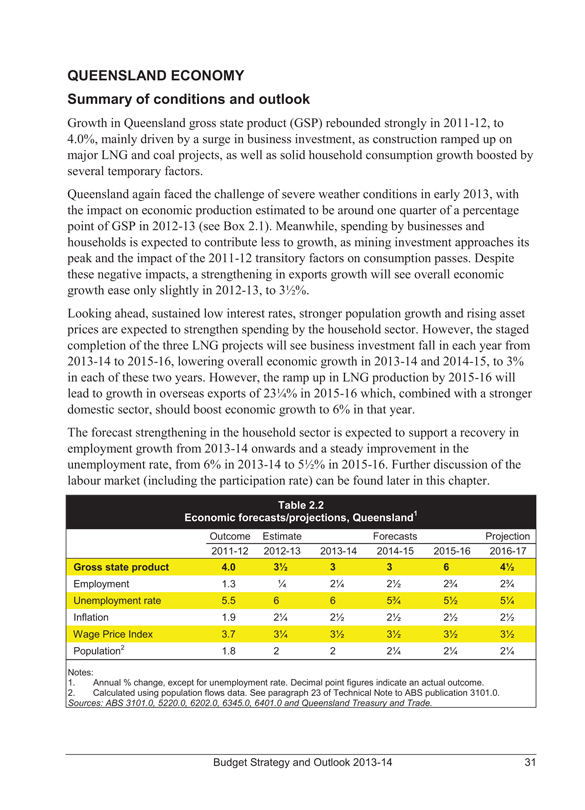
QUEENSLAND ECONOMY
Summary of conditions and outlook
Growth in Queensland gross state product (GSP) rebounded strongly in 2011-12, to 4.0%, mainly driven by a surge in business investment, as construction ramped up on major LNG and coal projects, as well as solid household consumption growth boosted by several temporary factors.
Queensland again faced the challenge of severe weather conditions in early 2013, with the impact on economic production estimated to be around one quarter of a percentage point of GSP in 2012-13 (see Box 2.1). Meanwhile, spending by businesses and households is expected to contribute less to growth, as mining investment approaches its peak and the impact of the 2011-12 transitory factors on consumption passes. Despite these negative impacts, a strengthening in exports growth will see overall economic growth ease only slightly in 2012-13, to 31/2%.
Looking ahead, sustained low interest rates, stronger population growth and rising asset prices are expected to strengthen spending by the household sector. However, the staged completion of the three LNG projects will see business investment fall in each year from 2013-14 to 2015-16, lowering overall economic growth in 2013-14 and 2014-15, to 3% in each of these two years. However, the ramp up in LNG production by 2015-16 will lead to growth in overseas exports of 231/4% in 2015-16 which, combined with a stronger domestic sector, should boost economic growth to 6% in that year.
The forecast strengthening in the household sector is expected to support a recovery in employment growth from 2013-14 onwards and a steady improvement in the unemployment rate, from 6% in 2013-14 to 51/2% in 2015-16. Further discussion of the labour market (including the participation rate) can be found later in this chapter.
Table 2.2
Economic forecasts/projections, Queensland1
Outcome Estimate Forecasts Projection
2011-12 2012-13 2013-14 2014-15 2015-16 2016-17
Gross state product 4.0 31/2 3 3 6 41/2
Employment 1.3 1/4 21/4 21/2 23/4 23/4
Unemployment rate 5.5 6 6 53/4 51/2 51/4
Inflation 1.9 21/4 21/2 21/2 21/2 21/2
Wage Price Index 3.7 31/4 31/2 31/2 31/2 31/2
Population2 1.8 2 2 21/4 21/4 21/4
Notes:
1. Annual % change, except for unemployment rate. Decimal point figures indicate an actual outcome.
2. Calculated using population flows data. See paragraph 23 of Technical Note to ABS publication 3101.0.
Sources: ABS 3101.0, 5220.0, 6202.0, 6345.0, 6401.0 and Queensland Treasury and Trade.
Budget Strategy and Outlook 2013-14 31
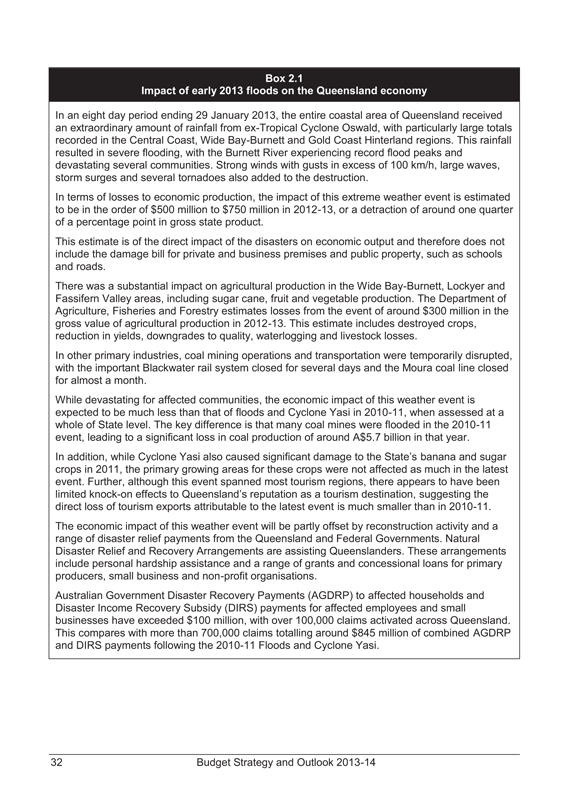
Box 2.1
Impact of early 2013 floods on the Queensland economy
In an eight day period ending 29 January 2013, the entire coastal area of Queensland received an extraordinary amount of rainfall from ex-Tropical Cyclone Oswald, with particularly large totals recorded in the Central Coast, Wide Bay-Burnett and Gold Coast Hinterland regions. This rainfall resulted in severe flooding, with the Burnett River experiencing record flood peaks and devastating several communities. Strong winds with gusts in excess of 100 km/h, large waves, storm surges and several tornadoes also added to the destruction.
In terms of losses to economic production, the impact of this extreme weather event is estimated to be in the order of $500 million to $750 million in 2012-13, or a detraction of around one quarter of a percentage point in gross state product.
This estimate is of the direct impact of the disasters on economic output and therefore does not include the damage bill for private and business premises and public property, such as schools and roads.
There was a substantial impact on agricultural production in the Wide Bay-Burnett, Lockyer and Fassifern Valley areas, including sugar cane, fruit and vegetable production. The Department of Agriculture, Fisheries and Forestry estimates losses from the event of around $300 million in the gross value of agricultural production in 2012-13. This estimate includes destroyed crops, reduction in yields, downgrades to quality, waterlogging and livestock losses.
In other primary industries, coal mining operations and transportation were temporarily disrupted, with the important Blackwater rail system closed for several days and the Moura coal line closed for almost a month.
While devastating for affected communities, the economic impact of this weather event is expected to be much less than that of floods and Cyclone Yasi in 2010-11, when assessed at a whole of State level. The key difference is that many coal mines were flooded in the 2010-11 event, leading to a significant loss in coal production of around A$5.7 billion in that year.
In addition, while Cyclone Yasi also caused significant damage to the State’s banana and sugar crops in 2011, the primary growing areas for these crops were not affected as much in the latest event. Further, although this event spanned most tourism regions, there appears to have been limited knock-on effects to Queensland’s reputation as a tourism destination, suggesting the direct loss of tourism exports attributable to the latest event is much smaller than in 2010-11.
The economic impact of this weather event will be partly offset by reconstruction activity and a range of disaster relief payments from the Queensland and Federal Governments. Natural Disaster Relief and Recovery Arrangements are assisting Queenslanders. These arrangements include personal hardship assistance and a range of grants and concessional loans for primary producers, small business and non-profit organisations.
Australian Government Disaster Recovery Payments (AGDRP) to affected households and Disaster Income Recovery Subsidy (DIRS) payments for affected employees and small businesses have exceeded $100 million, with over 100,000 claims activated across Queensland. This compares with more than 700,000 claims totalling around $845 million of combined AGDRP and DIRS payments following the 2010-11 Floods and Cyclone Yasi.
32 Budget Strategy and Outlook 2013-14
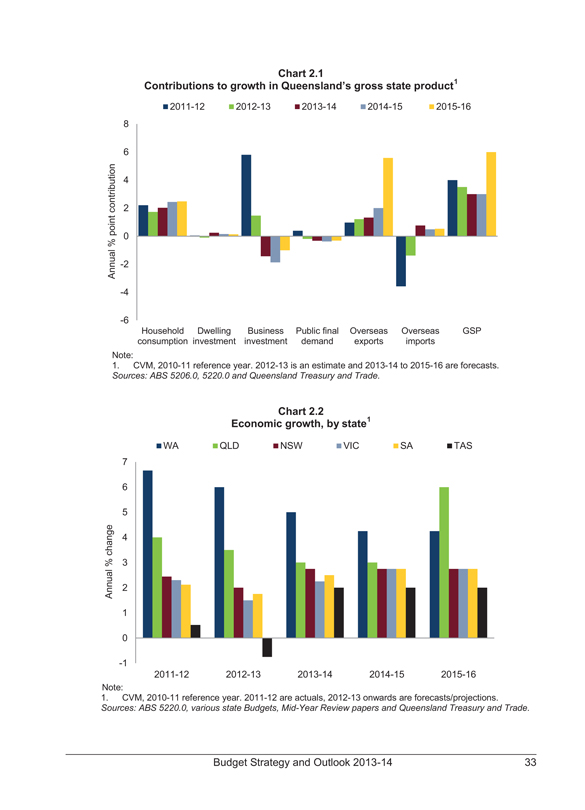
Chart 2.1
1
Contributions to growth in Queensland’s gross state product
2011-12 2012-13 2013-14 2014-15 2015-16
Annual % point contribution
8
6
4
2
0
-2
-4
-6
Household Dwelling Business Public final Overseas Overseas GSP
consumption investment investment demand exports imports
Note:
1. CVM, 2010-11 reference year. 2012-13 is an estimate and 2013-14 to 2015-16 are forecasts.
Sources: ABS 5206.0, 5220.0 and Queensland Treasury and Trade.
Chart 2.2
1
Economic growth, by state
WA QLD NSW VIC SA TAS
Annual % change
7
6
5
4
3
2
1
0
-1
2011-12 2012-13 2013-14 2014-15 2015-16
Note:
1. CVM, 2010-11 reference year. 2011-12 are actuals, 2012-13 onwards are forecasts/projections.
Sources: ABS 5220.0, various state Budgets, Mid-Year Review papers and Queensland Treasury and Trade.
Budget Strategy and Outlook 2013-14 33
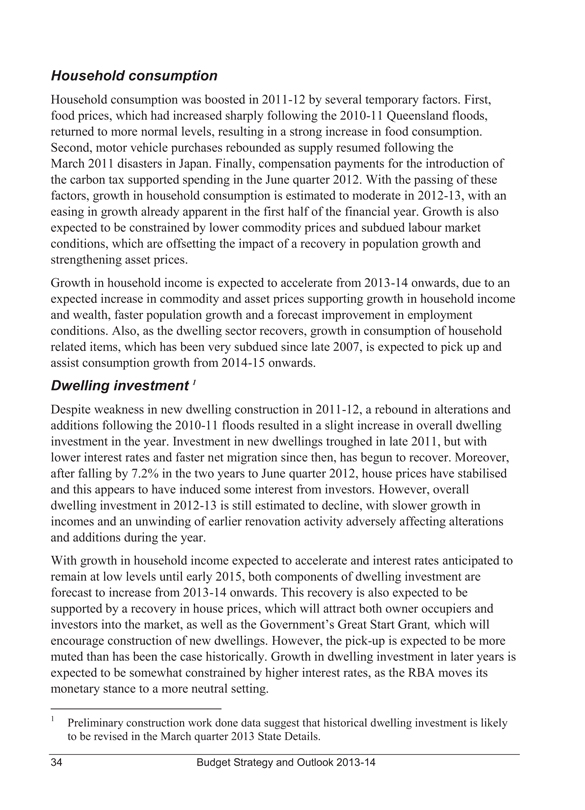
Household consumption
Household consumption was boosted in 2011-12 by several temporary factors. First, food prices, which had increased sharply following the 2010-11 Queensland floods, returned to more normal levels, resulting in a strong increase in food consumption. Second, motor vehicle purchases rebounded as supply resumed following the March 2011 disasters in Japan. Finally, compensation payments for the introduction of the carbon tax supported spending in the June quarter 2012. With the passing of these factors, growth in household consumption is estimated to moderate in 2012-13, with an easing in growth already apparent in the first half of the financial year. Growth is also expected to be constrained by lower commodity prices and subdued labour market conditions, which are offsetting the impact of a recovery in population growth and strengthening asset prices.
Growth in household income is expected to accelerate from 2013-14 onwards, due to an expected increase in commodity and asset prices supporting growth in household income and wealth, faster population growth and a forecast improvement in employment conditions. Also, as the dwelling sector recovers, growth in consumption of household related items, which has been very subdued since late 2007, is expected to pick up and assist consumption growth from 2014-15 onwards.
Dwelling investment 1
Despite weakness in new dwelling construction in 2011-12, a rebound in alterations and additions following the 2010-11 floods resulted in a slight increase in overall dwelling investment in the year. Investment in new dwellings troughed in late 2011, but with lower interest rates and faster net migration since then, has begun to recover. Moreover, after falling by 7.2% in the two years to June quarter 2012, house prices have stabilised and this appears to have induced some interest from investors. However, overall dwelling investment in 2012-13 is still estimated to decline, with slower growth in incomes and an unwinding of earlier renovation activity adversely affecting alterations and additions during the year.
With growth in household income expected to accelerate and interest rates anticipated to remain at low levels until early 2015, both components of dwelling investment are forecast to increase from 2013-14 onwards. This recovery is also expected to be supported by a recovery in house prices, which will attract both owner occupiers and investors into the market, as well as the Government’s Great Start Grant, which will encourage construction of new dwellings. However, the pick-up is expected to be more muted than has been the case historically. Growth in dwelling investment in later years is expected to be somewhat constrained by higher interest rates, as the RBA moves its monetary stance to a more neutral setting.
1 Preliminary construction work done data suggest that historical dwelling investment is likely to be revised in the March quarter 2013 State Details.
34 Budget Strategy and Outlook 2013-14
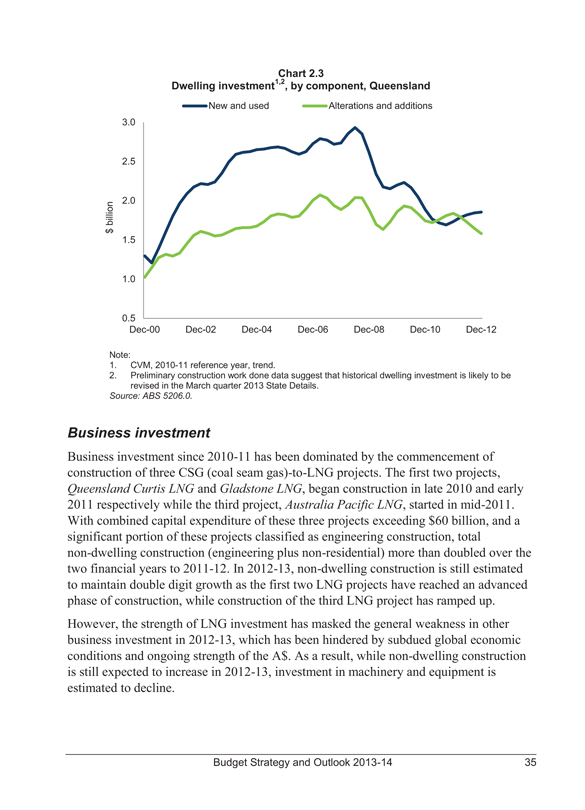
Chart 2.3
1,2
Dwelling investment , by component, Queensland
New and used Alterations and additions
$ billion
3.0
2.5
2.0
1.5
1.0
0.5
Dec-00 Dec-02 Dec-04 Dec-06 Dec-08 Dec-10 Dec-12
Note:
1. CVM, 2010-11 reference year, trend.
2. Preliminary construction work done data suggest that historical dwelling investment is likely to be revised in the March quarter 2013 State Details.
Source: ABS 5206.0.
Business investment
Business investment since 2010-11 has been dominated by the commencement of construction of three CSG (coal seam gas)-to-LNG projects. The first two projects, Queensland Curtis LNG and Gladstone LNG, began construction in late 2010 and early 2011 respectively while the third project, Australia Pacific LNG, started in mid-2011. With combined capital expenditure of these three projects exceeding $60 billion, and a significant portion of these projects classified as engineering construction, total non-dwelling construction (engineering plus non-residential) more than doubled over the two financial years to 2011-12. In 2012-13, non-dwelling construction is still estimated to maintain double digit growth as the first two LNG projects have reached an advanced phase of construction, while construction of the third LNG project has ramped up.
However, the strength of LNG investment has masked the general weakness in other business investment in 2012-13, which has been hindered by subdued global economic conditions and ongoing strength of the A$. As a result, while non-dwelling construction is still expected to increase in 2012-13, investment in machinery and equipment is estimated to decline.
Budget Strategy and Outlook 2013-14 35
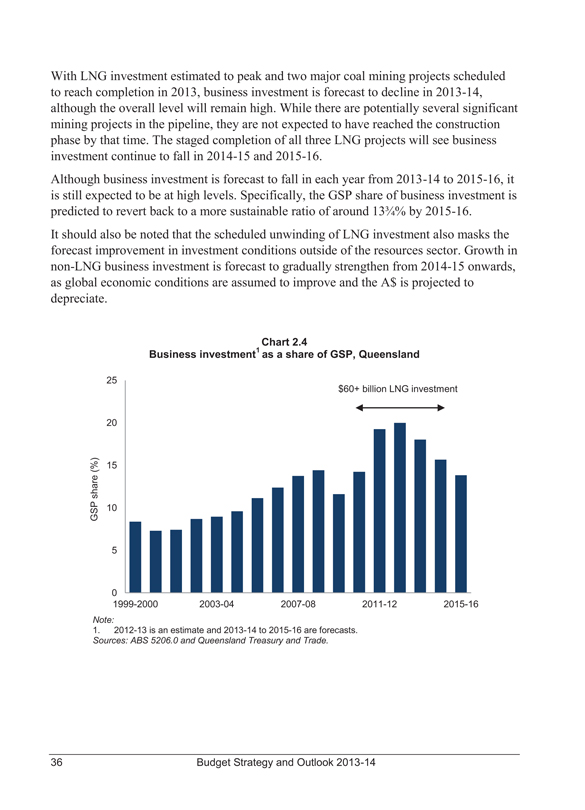
With LNG investment estimated to peak and two major coal mining projects scheduled to reach completion in 2013, business investment is forecast to decline in 2013-14, although the overall level will remain high. While there are potentially several significant mining projects in the pipeline, they are not expected to have reached the construction phase by that time. The staged completion of all three LNG projects will see business investment continue to fall in 2014-15 and 2015-16.
Although business investment is forecast to fall in each year from 2013-14 to 2015-16, it is still expected to be at high levels. Specifically, the GSP share of business investment is predicted to revert back to a more sustainable ratio of around 133/4% by 2015-16.
It should also be noted that the scheduled unwinding of LNG investment also masks the forecast improvement in investment conditions outside of the resources sector. Growth in non-LNG business investment is forecast to gradually strengthen from 2014-15 onwards, as global economic conditions are assumed to improve and the A$ is projected to depreciate.
Chart 2.4
1
Business investment as a share of GSP, Queensland
GSP share (%)
$60+ billion LNG investment
25
20
15
10
5
0
1999-2000 2003-04 2007-08 2011-12 2015-16
Note:
1. 2012-13 is an estimate and 2013-14 to 2015-16 are forecasts.
Sources: ABS 5206.0 and Queensland Treasury and Trade.
36 Budget Strategy and Outlook 2013-14
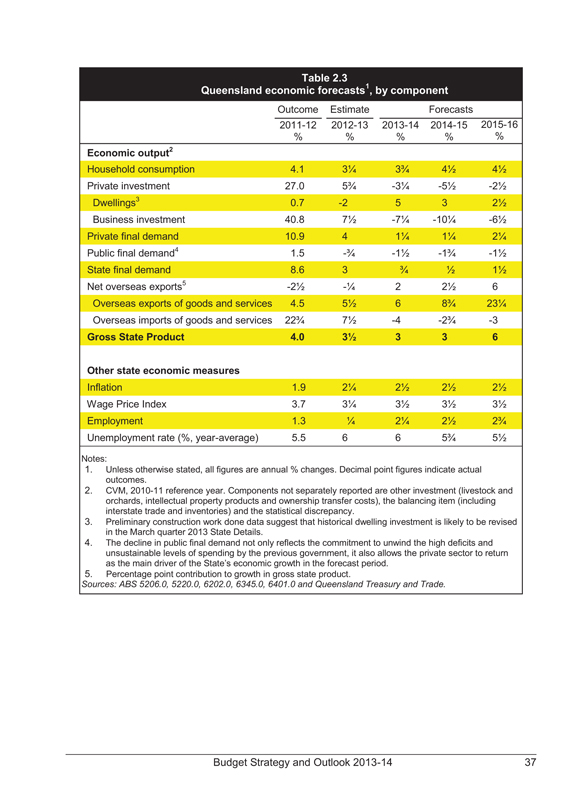
Table 2.3
Queensland economic forecasts1 , by component
Outcome Estimate Forecasts
2011-12 2012-13 2013-14 2014-15 2015-16
%%%%%
Economic output2
Household consumption 4.1 31/4 33/4 41/2 41/2
Private investment 27.0 53/4 -31/4 -51/2 -21/2
Dwellings3 0.7 -2 5 3 21/2
Business investment 40.8 71/2 -71/4 -101/4 -61/2
Private final demand 10.9 4 11/4 11/4 21/4
Public final demand4 1.5 -3/4 -11/2 -13/4 -11/2
State final demand 8.6 3 3/4 1/2 11/2
Net overseas exports5 -21/2 -1/4 2 21/2 6
Overseas exports of goods and services 4.5 51/2 6 83/4 231/4
Overseas imports of goods and services 223/4 71/2 -4 -23/4 -3
Gross State Product 4.0 31/2 3 3 6
Other state economic measures
Inflation 1.9 21/4 21/2 21/2 21/2
Wage Price Index 3.7 31/4 31/2 31/2 31/2
Employment 1.3 1/4 21/4 21/2 23/4
Unemployment rate (%, year-average) 5.5 6 6 53/4 51/2
Notes:
1. Unless otherwise stated, all figures are annual % changes. Decimal point figures indicate actual outcomes.
2. CVM, 2010-11 reference year. Components not separately reported are other investment (livestock and orchards, intellectual property products and ownership transfer costs), the balancing item (including interstate trade and inventories) and the statistical discrepancy.
3. Preliminary construction work done data suggest that historical dwelling investment is likely to be revised in the March quarter 2013 State Details.
4. The decline in public final demand not only reflects the commitment to unwind the high deficits and unsustainable levels of spending by the previous government, it also allows the private sector to return as the main driver of the State’s economic growth in the forecast period.
5. Percentage point contribution to growth in gross state product.
Sources: ABS 5206.0, 5220.0, 6202.0, 6345.0, 6401.0 and Queensland Treasury and Trade.
Budget Strategy and Outlook 2013-14 37
Public final demand
Very strong growth in government spending contributed significantly to economic growth over the second half of the decade to 2009-10. However the level of spending was not sustainable and drove up government debt, creating the risk of a massive adjustment if not quickly addressed. Continuing on the path established in the previous budget, this Budget further unwinds the high deficits and unsustainable levels of spending by the previous government. This consolidation at the state level is combined with Australian Government fiscal tightening. As a result, real public final demand (which is the sum of Federal, state and local government consumption and investment) is forecast to decline modestly in each year over the period to 2015-16.
Box 2.2
Red tape reduction
Unnecessary and excessive regulation can be a significant hindrance on Queensland’s economy, by stifling productivity and increasing costs for businesses. Regulatory reform and red tape reduction is therefore essential to boost Queensland’s economy. By ensuring that Queensland’s regulatory system is efficient and streamlined, the Government can allow business to focus on innovation, productivity, growth and competitiveness, rather than being bogged down in unnecessary or duplicative forms and requirements.
Queensland is implementing Australia’s most rigorous framework for measuring and reducing the burden of regulation. This framework will establish a baseline measure of the regulatory burden and set targets for each agency toward achieving the Government’s objective of reducing this burden by 20% by 2018. Over 150 different regulatory reforms have been delivered so far, ranging from major legislative changes through to targeted administrative changes. The Government has also significantly increased the rigour around the development of new regulation and changes to existing regulation by establishing the Office of Best Practice Regulation in the Queensland Competition Authority. Agencies are required to develop regulatory proposals in accordance with regulatory best practice principles, including the development of Regulatory Impact Statements and public consultation for significant regulatory changes.
38 Budget Strategy and Outlook 2013-14
Overseas exports and imports
Growth in the volume of overseas exports of goods in 2012-13 is expected to be similar to that in 2011-12. Coal export volumes have recovered from the weak outcome in 2011-12, which was caused by industrial action and weak overseas demand. However, growth in base metal and cotton exports are estimated to be slower. Base metal production was temporarily hampered by the transition of the Ernest Henry copper mine from open cut to underground operations, while a fall in cotton prices led to lower cotton production in the year.
Lower commodity prices are expected to lower the nominal value of overseas exports of goods in 2012-13. So far in 2012-13, international prices of aluminium, copper and zinc have fallen 11%, 6% and 5% respectively in year-average terms, and unit export values of hard coking and thermal coal have also declined 36% and 18% respectively relative to 2011-12.
Coal export volumes are forecast to continue to grow from 2013-14 onwards, supported by stronger demand from China and the completion of the Daunia and Caval Ridge hard coking coal mines. Also, the scheduled completion of the Eagle Downs and Grosvenor (Phase 1) coal mines by 2015-16 should provide support to coal exports from 2016-17 onwards. While coal prices are expected to recover over the forecast period, increases in supply and the slow pace of recovery in advanced economies are expected to limit the extent of this rebound.
The first LNG exports are scheduled for 2014-15 but export volumes are only expected to ramp up substantially in the following year, driving double digit growth in overseas goods exports in 2015-16.
With more than a dozen regional areas in the west of Queensland now drought declared, beef producers face very challenging circumstances. Following several years of good weather conditions which underpinned herd rebuilding, a hot and dry 2012-13 summer west of the Great Dividing Range has seen producers start to de-stock properties. In addition, a reduction in the live cattle import quota to Indonesia has reduced demand for live cattle exports, further adding to supply and putting downward pressure on prices. These conditions are expected to bring forward beef export volumes into 2012-13 and 2013-14, but will adversely affect supply in later years. Meanwhile, demand is expected to be supported by rising exports to China, which will partly offset reduced demand from some traditional markets.
After two consecutive seasons of low production due to poor weather conditions, raw sugar production has rebounded in the 2012-13 season to above 4.3 million tonnes and some further growth is anticipated in the 2013-14 season. Lower cotton prices have resulted in a significant reduction in the area planted to cotton, leading to a fall in cotton exports in 2013-14.
Budget Strategy and Outlook 2013-14 39
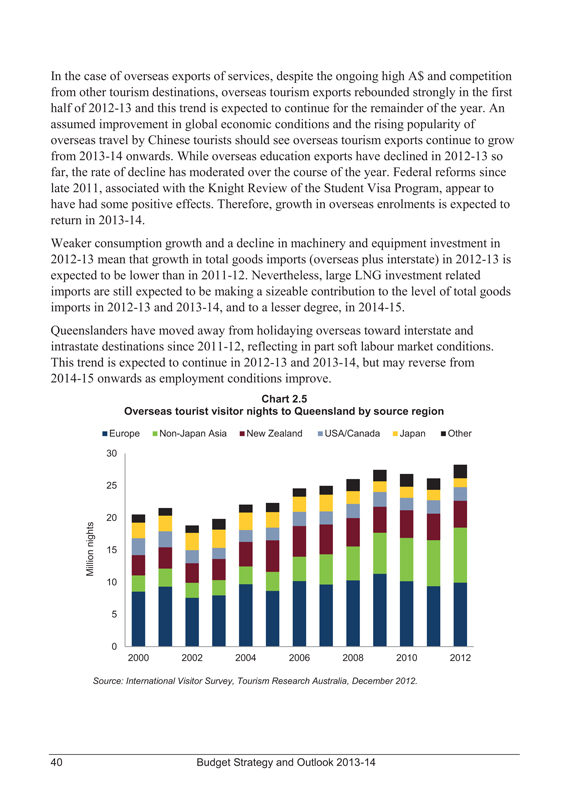
In the case of overseas exports of services, despite the ongoing high A$ and competition from other tourism destinations, overseas tourism exports rebounded strongly in the first half of 2012-13 and this trend is expected to continue for the remainder of the year. An assumed improvement in global economic conditions and the rising popularity of overseas travel by Chinese tourists should see overseas tourism exports continue to grow from 2013-14 onwards. While overseas education exports have declined in 2012-13 so far, the rate of decline has moderated over the course of the year. Federal reforms since late 2011, associated with the Knight Review of the Student Visa Program, appear to have had some positive effects. Therefore, growth in overseas enrolments is expected to return in 2013-14.
Weaker consumption growth and a decline in machinery and equipment investment in 2012-13 mean that growth in total goods imports (overseas plus interstate) in 2012-13 is expected to be lower than in 2011-12. Nevertheless, large LNG investment related imports are still expected to be making a sizeable contribution to the level of total goods imports in 2012-13 and 2013-14, and to a lesser degree, in 2014-15.
Queenslanders have moved away from holidaying overseas toward interstate and intrastate destinations since 2011-12, reflecting in part soft labour market conditions. This trend is expected to continue in 2012-13 and 2013-14, but may reverse from 2014-15 onwards as employment conditions improve.
Chart 2.5
Overseas tourist visitor nights to Queensland by source region
Europe Non-Japan Asia New Zealand USA/Canada Japan Other
Million nights
30
25
20
15
10
5
0
2000 2002 2004 2006 2008 2010 2012
Source: International Visitor Survey, Tourism Research Australia, December 2012.
40 Budget Strategy and Outlook 2013-14
Labour market
Year average employment growth is estimated to moderate in 2012-13, although some improvement has occurred since late 2012. This reflects a combination of factors, including household caution and the high A$, which have impacted on labour intensive sectors such as retail, building construction, accommodation and food services, manufacturing, and arts and recreation services. Further, falling commodity prices and the high A$ have induced trade exposed industries to cut costs by winding back employment during the course of 2012-13. With growth in household spending expected to pick up from 2013-14 onwards, employment growth is forecast to accelerate over the forecast period.
With strong employment growth between early and mid-2000s encouraging entrants into the labour market, the labour participation rate in Queensland rose from below 65% in 2004 to reach almost 68% by 2009. The weakening of employment conditions following the GFC saw the labour participation rate gradually fall and the decline has steepened since early 2012. This sharp drop in the participation rate coincided with a slight reduction in employment of females, who generally have a greater propensity to leave the labour force. Meanwhile, the impact of the baby boomers reaching retirement age has begun to place downward pressure on the labour participation rate. However, as employment growth is expected to strengthen from 2013-14 onwards, the “encouraged worker effect” will result in the labour participation rate remaining relatively stable over the forecast period.
With labour force growth predicted to be slightly below employment growth, the unemployment rate is forecast to fall steadily over the forecast period.
Budget Strategy and Outlook 2013-14 41
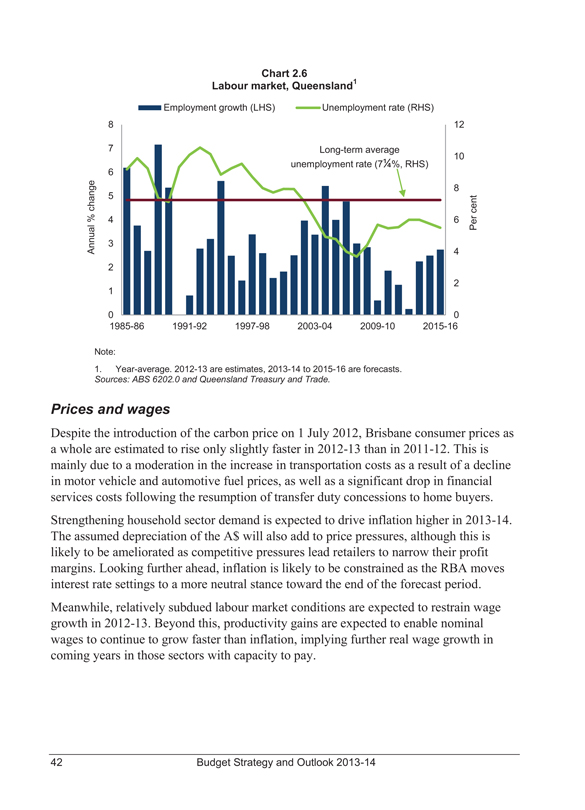
%
Annual change
8 7 6 5 4 3 2 1 0 1985-86
Employment growth (LHS) 1991-92
Chart 2.6
Labour market, Queensland1
Unemployment rate (RHS) 1997-98
Long-term average
unemployment rate (71/4%, RHS) 2003-04
2009-10
12 10 8
6 Per cent
4
2
0
2015-16
Note:
1. Year-average. 2012-13 are estimates, 2013-14 to 2015-16 are forecasts.
Sources: ABS 6202.0 and Queensland Treasury and Trade.
Prices and wages
Despite the introduction of the carbon price on 1 July 2012, Brisbane consumer prices as a whole are estimated to rise only slightly faster in 2012-13 than in 2011-12. This is mainly due to a moderation in the increase in transportation costs as a result of a decline in motor vehicle and automotive fuel prices, as well as a significant drop in financial services costs following the resumption of transfer duty concessions to home buyers.
Strengthening household sector demand is expected to drive inflation higher in 2013-14. The assumed depreciation of the A$ will also add to price pressures, although this is likely to be ameliorated as competitive pressures lead retailers to narrow their profit margins. Looking further ahead, inflation is likely to be constrained as the RBA moves interest rate settings to a more neutral stance toward the end of the forecast period.
Meanwhile, relatively subdued labour market conditions are expected to restrain wage growth in 2012-13. Beyond this, productivity gains are expected to enable nominal wages to continue to grow faster than inflation, implying further real wage growth in coming years in those sectors with capacity to pay.
42 Budget Strategy and Outlook 2013-14
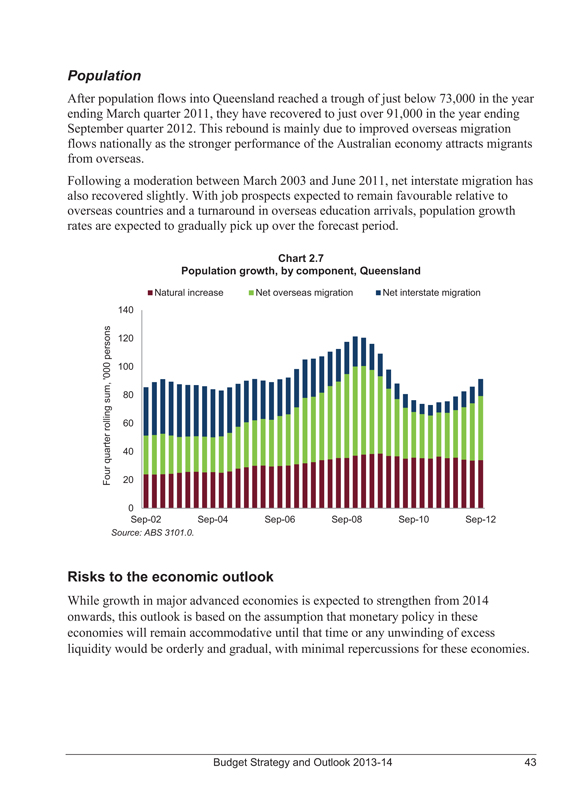
Population
After population flows into Queensland reached a trough of just below 73,000 in the year ending March quarter 2011, they have recovered to just over 91,000 in the year ending September quarter 2012. This rebound is mainly due to improved overseas migration flows nationally as the stronger performance of the Australian economy attracts migrants from overseas.
Following a moderation between March 2003 and June 2011, net interstate migration has also recovered slightly. With job prospects expected to remain favourable relative to overseas countries and a turnaround in overseas education arrivals, population growth rates are expected to gradually pick up over the forecast period.
| | | | | | | | | | | | |
Chart 2.7 |
Population growth, by component, Queensland |
| | | Natural increase | | Net overseas migration | | Net interstate migration | | | | | | |
| | | 140 | | | | | | | | | | |
persons | | 120 | | | | | | | | | | |
‘000 | | 100 | | | | | | | | | | |
sum, | | 80 | | | | | | | | | | |
rolling | | 60 | | | | | | | | | | |
quarter | | 40 | | | | | | | | | | |
Four | | 20 | | | | | | | | | | |
| | | 0 | | | | | | | | | | |
| | | Sep-02 | | Sep-04 | | Sep-06 | | Sep-08 | | Sep-10 | | Sep-12 |
Source: ABS 3101.0.
Risks to the economic outlook
While growth in major advanced economies is expected to strengthen from 2014 onwards, this outlook is based on the assumption that monetary policy in these economies will remain accommodative until that time or any unwinding of excess liquidity would be orderly and gradual, with minimal repercussions for these economies.
Budget Strategy and Outlook 2013-14 43
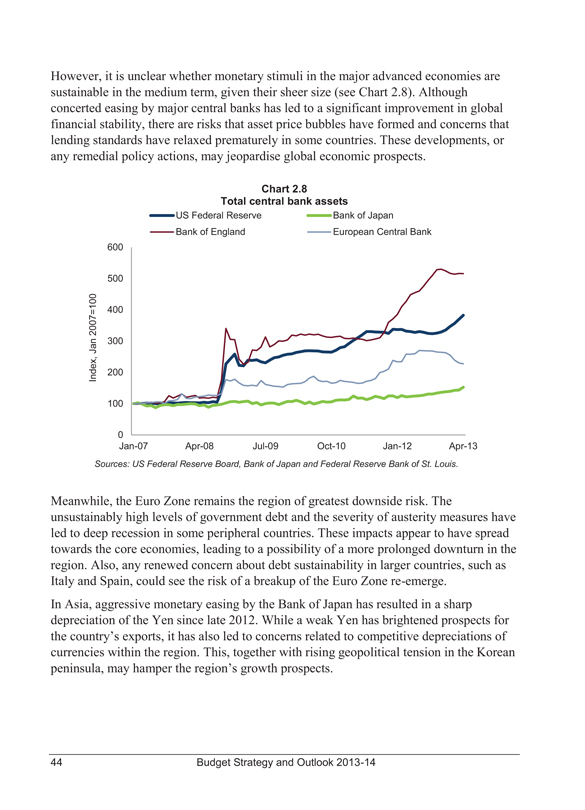
However, it is unclear whether monetary stimuli in the major advanced economies are sustainable in the medium term, given their sheer size (see Chart 2.8). Although concerted easing by major central banks has led to a significant improvement in global financial stability, there are risks that asset price bubbles have formed and concerns that lending standards have relaxed prematurely in some countries. These developments, or any remedial policy actions, may jeopardise global economic prospects.
| | | | | | | | | | | | |
| | | | | | | Chart 2.8 | | | | | | |
| | | | | | | Total central bank assets | | | | | | |
| | | | | US Federal Reserve | | Bank of Japan | | | | | | |
| | | | | Bank of England | | European Central Bank | | | | | | |
| | | 600 | | | | | | | | | | |
| | | 500 | | | | | | | | | | |
| | | 400 | | | | | | | | | | |
| | | 300 | | | | | | | | | | |
Index, Jan 2007=100 | | 200 | | | | | | | | | | |
| | | 100 | | | | | | | | | | |
| | | 0 | | | | | | | | | | |
| | | Jan-07 | | Apr-08 | | Jul-09 | | Oct-10 | | Jan-12 | | Apr-13 |
Sources: US Federal Reserve Board, Bank of Japan and Federal Reserve Bank of St. Louis.
Meanwhile, the Euro Zone remains the region of greatest downside risk. The unsustainably high levels of government debt and the severity of austerity measures have led to deep recession in some peripheral countries. These impacts appear to have spread towards the core economies, leading to a possibility of a more prolonged downturn in the region. Also, any renewed concern about debt sustainability in larger countries, such as Italy and Spain, could see the risk of a breakup of the Euro Zone re-emerge.
In Asia, aggressive monetary easing by the Bank of Japan has resulted in a sharp depreciation of the Yen since late 2012. While a weak Yen has brightened prospects for the country’s exports, it has also led to concerns related to competitive depreciations of currencies within the region. This, together with rising geopolitical tension in the Korean peninsula, may hamper the region’s growth prospects.
44 Budget Strategy and Outlook 2013-14
Any deterioration of global growth prospects means that the assumed moderate recovery in commodity prices may not eventuate. Nevertheless, the recent depreciation of the Yen has led the A$ to fall below parity against the US$ from mid-May. If the A$ depreciates faster than currently assumed, it would offset some of the adverse effect of lower than expected commodity prices.
For Queensland, the major domestic risk surrounds the timing and the pace of the unwinding of LNG investment due for completion between 2014 and 2016. Given the large size of the three LNG projects, any pick-up in growth from other parts of the Queensland economy may not be enough to prevent economic growth slowing more rapidly than currently expected, especially in 2014-15.
Budget Strategy and Outlook 2013-14 45

46 Budget Strategy and Outlook 2013-14
3 REVENUE
FEATURES
• Total General Government sector revenue is estimated to be $41.785 billion in 2012-13, $4 billion lower than in 2011-12. This reduction is attributable to a decline of $4.2 billion in grants revenue from the Australian Government.
• Total General Government sector revenue is estimated to be $44.677 billion in 2013-14. The increase of $2.892 billion on 2012-13 estimated actual revenue is primarily driven by growth of $1.665 billion in grants from the Australian Government and $853 million in taxation revenue.
• Key revenue sources such as taxation, GST and mining royalties have fallen by $4.2 billion in underlying terms since the 2012-13 Budget, with $2.6 billion of this decline since 2012-13 MYFER. This reflects the ongoing weakness of export coal prices, downward reductions in the GST pool distributed by the Australian Government and the impact of the slower than anticipated property market recovery on transfer duty and land tax. Relative to the Independent Commission of Audit Interim Report, these revenue sources have fallen by $5.3 billion.
• To continue to assist with the fiscal repair task the Government has introduced a number of new measures:
– rates of general insurance duty will be increased to 9% from 1 August 2013, providing consistency across general insurance products and more closely aligning Queensland with other jurisdictions
– from 1 January 2014 increase and broaden the coverage of the Urban Fire levy to ensure a sustainable funding base for emergency services. The levy will be known as the Emergency Management, Fire and Rescue Levy and will be applied to all rateable properties
– the second payroll tax threshold increase from $1.1 million to $1.2 million will be deferred two years to now take effect from 1 July 2015 rather than 1 July 2013.
• Total revenue is expected to grow across the forward estimates, with average growth of 6.2% over the period 2012-13 to 2016-17, supported by measures taken by the Government in the 2012-13 and 2013-14 Budgets. However, this is significantly less than the 9.3% per annum average growth over the period 2001-02 to 2011-12. If revenue was to grow by 9.3% from 2012-13, then estimated total revenue would be almost $9 billion higher over this period.
• Queensland will retain its competitive tax status, with per capita state tax estimated at $2,528 in 2013-14, compared to an average of $3,003 for the other states and territories.
Budget Strategy and Outlook 2013-14 47
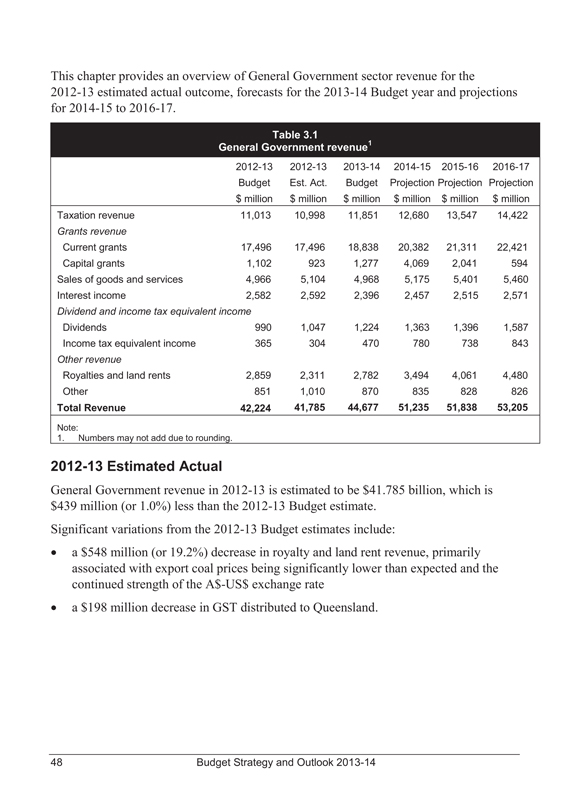
This chapter provides an overview of General Government sector revenue for the 2012-13 estimated actual outcome, forecasts for the 2013-14 Budget year and projections for 2014-15 to 2016-17.
Table 3.1
General Government revenue1
2012-13 2012-13 2013-14 2014-15 2015-16 2016-17 Budget Est. Act. Budget Projection Projection Projection $ million
$ million $ million $ million $ million $ million Taxation revenue 11,013 10,998 11,851 12,680 13,547 14,422 Grants revenue Current grants 17,496 17,496 18,838 20,382 21,311 22,421 Capital grants 1,102 923 1,277 4,069 2,041 594 Sales of goods and services 4,966 5,104 4,968 5,175 5,401 5,460
Interest income 2,582 2,592 2,396 2,457 2,515 2,571
Dividend and income tax equivalent income
Dividends 990 1,047 1,224 1,363 1,396 1,587
Income tax equivalent income 365 304 470 780 738 843
Other revenue
Royalties and land rents 2,859 2,311 2,782 3,494 4,061 4,480
Other 851 1,010 870 835 828 826
Total Revenue 42,224 41,785 44,677 51,235 51,838 53,205
Note:
1. Numbers may not add due to rounding.
2012-13 Estimated Actual
General Government revenue in 2012-13 is estimated to be $41.785 billion, which is $439 million (or 1.0%) less than the 2012-13 Budget estimate.
Significant variations from the 2012-13 Budget estimates include:
• a $548 million (or 19.2%) decrease in royalty and land rent revenue, primarily associated with export coal prices being significantly lower than expected and the continued strength of the A$-US$ exchange rate
• a $198 million decrease in GST distributed to Queensland.
48 Budget Strategy and Outlook 2013-14
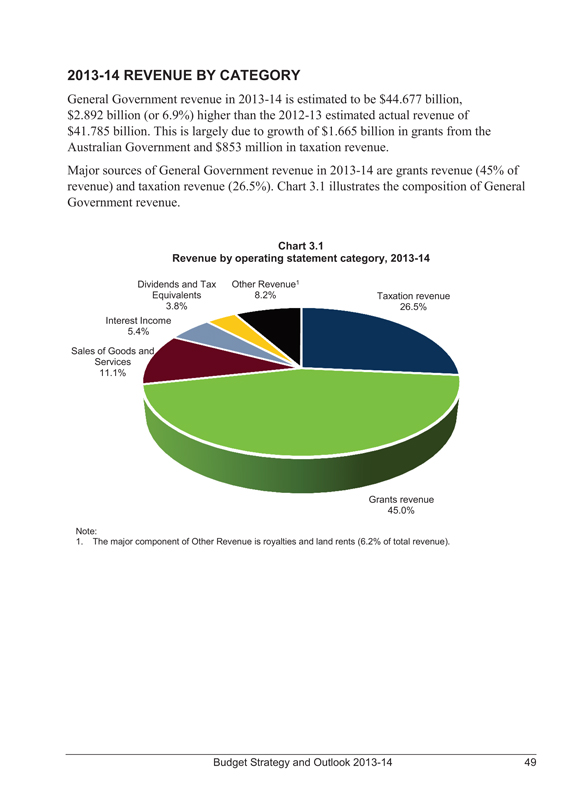
2013-14 REVENUE BY CATEGORY
General Government revenue in 2013-14 is estimated to be $44.677 billion, $2.892 billion (or 6.9%) higher than the 2012-13 estimated actual revenue of $41.785 billion. This is largely due to growth of $1.665 billion in grants from the Australian Government and $853 million in taxation revenue.
Major sources of General Government revenue in 2013-14 are grants revenue (45% of revenue) and taxation revenue (26.5%). Chart 3.1 illustrates the composition of General Government revenue.
| | | | |
| | | Chart 3.1 | | |
Revenue by operating statement category, 2013-14 | | | | |
Dividends and Tax | | Other Revenue1 | | |
Equivalents | | 8.2% | | Taxation revenue |
3.8% | | | | 26.5% |
Interest Income | | | | |
5.4% | | | | |
Sales of Goods and | | | | |
Services | | | | |
11.1% | | | | |
| | | | | Grants revenue |
| | | | | 45.0% |
Note:
1. The major component of Other Revenue is royalties and land rents (6.2% of total revenue).
Budget Strategy and Outlook 2013-14 49
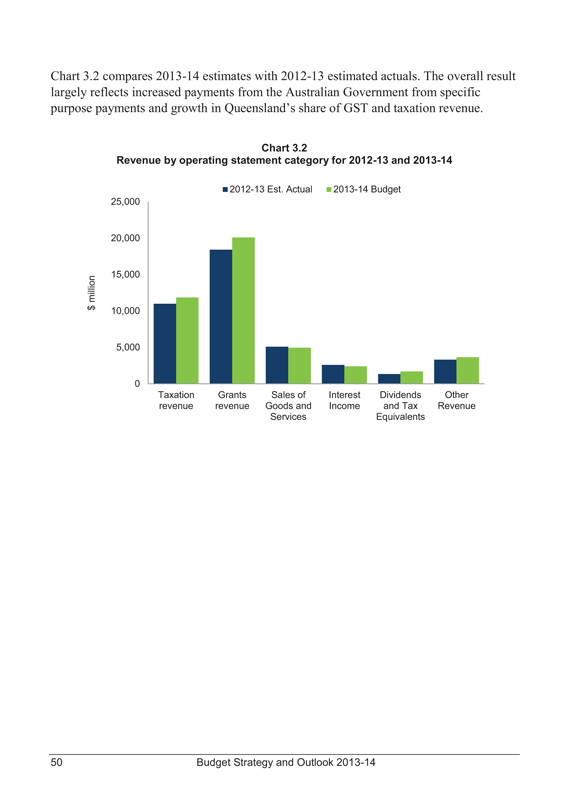
Chart 3.2 compares 2013-14 estimates with 2012-13 estimated actuals. The overall result largely reflects increased payments from the Australian Government from specific purpose payments and growth in Queensland’s share of GST and taxation revenue.
Chart 3.2
Revenue by operating statement category for 2012-13 and 2013-14
| | | | | | | | | | | | |
| | | | | 2012-13 Est. Actual | | 2013-14 Budget | | | | | | |
$ million | | | | | | | | | | | | |
25,000 | | | | | | | | | | | | |
20,000 15,000 | | | | | | | | | | | | |
10,000 | | | | | | | | | | | | |
5,000 | | | | | | | | | | | | |
0 | | | | | | | | | | | | |
| | | Taxation | | Grants | | Sales of | | Interest | | Dividends | | Other |
| | | revenue | | revenue | | Goods and | | Income | | and Tax | | Revenue |
| | | | | | | Services | | | | Equivalents | | |
50 Budget Strategy and Outlook 2013-14
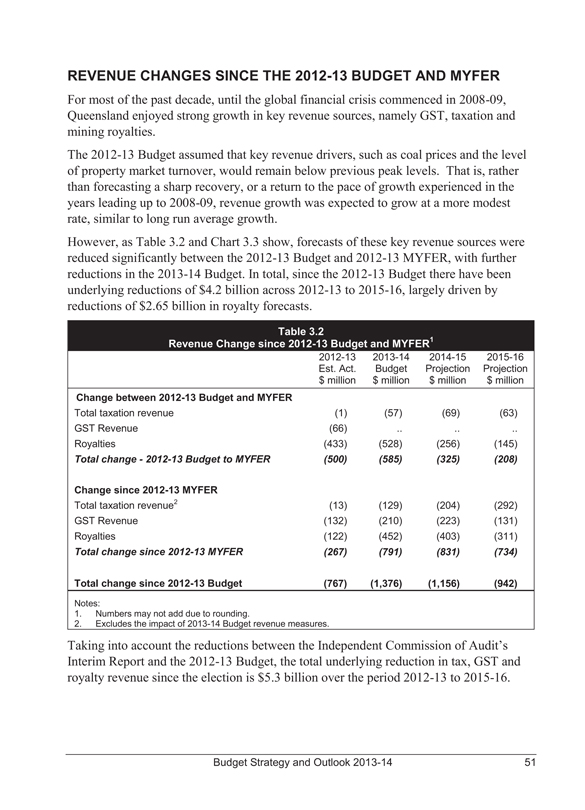
REVENUE CHANGES SINCE THE 2012-13 BUDGET AND MYFER
For most of the past decade, until the global financial crisis commenced in 2008-09, Queensland enjoyed strong growth in key revenue sources, namely GST, taxation and mining royalties.
The 2012-13 Budget assumed that key revenue drivers, such as coal prices and the level of property market turnover, would remain below previous peak levels. That is, rather than forecasting a sharp recovery, or a return to the pace of growth experienced in the years leading up to 2008-09, revenue growth was expected to grow at a more modest rate, similar to long run average growth.
However, as Table 3.2 and Chart 3.3 show, forecasts of these key revenue sources were reduced significantly between the 2012-13 Budget and 2012-13 MYFER, with further reductions in the 2013-14 Budget. In total, since the 2012-13 Budget there have been underlying reductions of $4.2 billion across 2012-13 to 2015-16, largely driven by reductions of $2.65 billion in royalty forecasts.
Table 3.2
Revenue Change since 2012-13 Budget and MYFER1
2012-13 Est. Act. $ million
2013-14 Budget $ million
2014-15 Projection $ million
2015-16 Projection $ million
Change between 2012-13 Budget and MYFER
Total taxation revenue (1) (57) (69) (63)
GST Revenue (66) .. .. ..
Royalties (433) (528) (256) (145)
Total change - 2012-13 Budget to MYFER (500) (585) (325) (208)
Change since 2012-13 MYFER
Total taxation revenue2 (13) (129) (204) (292)
GST Revenue (132) (210) (223) (131)
Royalties (122) (452) (403) (311)
Total change since 2012-13 MYFER (267) (791) (831) (734)
Total change since 2012-13 Budget (767) (1,376) (1,156) (942)
Notes:
1. Numbers may not add due to rounding.
2. Excludes the impact of 2013-14 Budget revenue measures.
Taking into account the reductions between the Independent Commission of Audit’s Interim Report and the 2012-13 Budget, the total underlying reduction in tax, GST and royalty revenue since the election is $5.3 billion over the period 2012-13 to 2015-16.
Budget Strategy and Outlook 2013-14 51
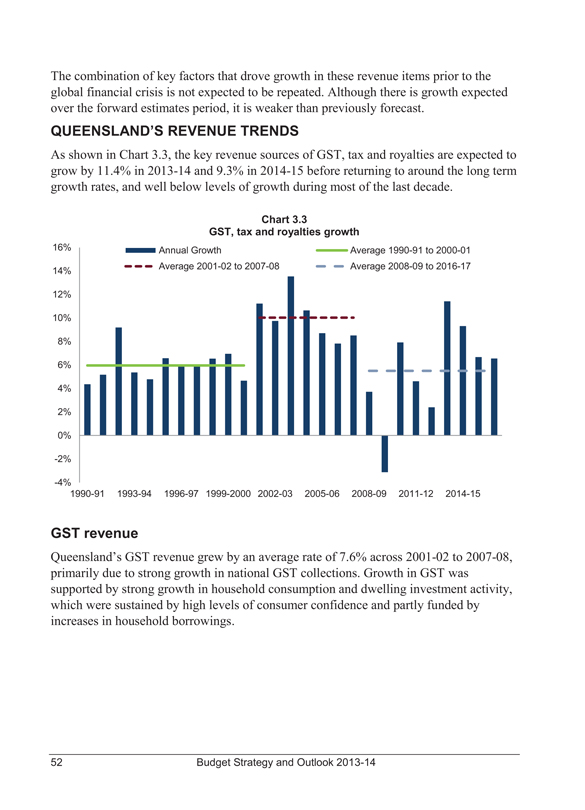
The combination of key factors that drove growth in these revenue items prior to the global financial crisis is not expected to be repeated. Although there is growth expected over the forward estimates period, it is weaker than previously forecast.
QUEENSLAND’S REVENUE TRENDS
As shown in Chart 3.3, the key revenue sources of GST, tax and royalties are expected to grow by 11.4% in 2013-14 and 9.3% in 2014-15 before returning to around the long term growth rates, and well below levels of growth during most of the last decade.
Chart 3.3
GST, tax and royalties growth
16% Annual Growth Average 1990-91 to 2000-01
14% Average 2001-02 to 2007-08 Average 2008-09 to 2016-17
12%
10%
8%
6%
4%
2%
0%
-2%
-4%
1990-91 1993-94 1996-97 1999-2000 2002-03 2005-06 2008-09 2011-12 2014-15
GST revenue
Queensland’s GST revenue grew by an average rate of 7.6% across 2001-02 to 2007-08, primarily due to strong growth in national GST collections. Growth in GST was supported by strong growth in household consumption and dwelling investment activity, which were sustained by high levels of consumer confidence and partly funded by increases in household borrowings.
52 Budget Strategy and Outlook 2013-14
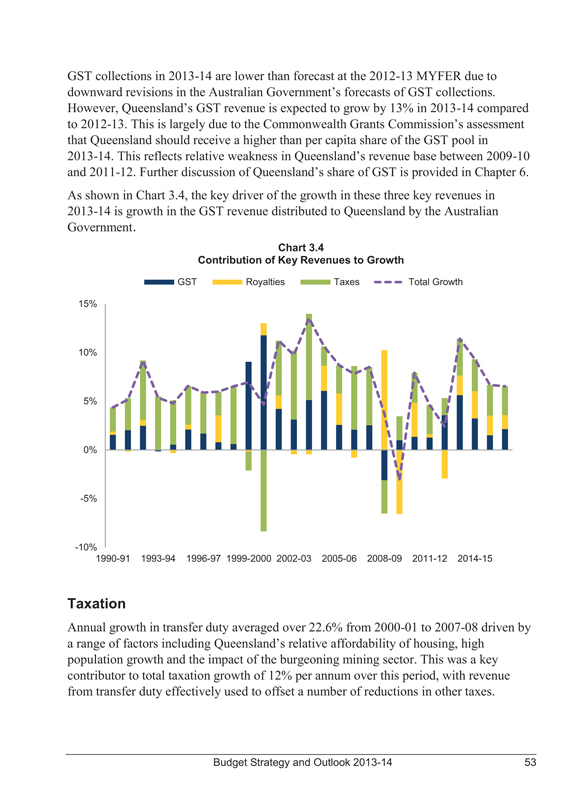
GST collections in 2013-14 are lower than forecast at the 2012-13 MYFER due to downward revisions in the Australian Government’s forecasts of GST collections. However, Queensland’s GST revenue is expected to grow by 13% in 2013-14 compared to 2012-13. This is largely due to the Commonwealth Grants Commission’s assessment that Queensland should receive a higher than per capita share of the GST pool in 2013-14. This reflects relative weakness in Queensland’s revenue base between 2009-10 and 2011-12. Further discussion of Queensland’s share of GST is provided in Chapter 6.
As shown in Chart 3.4, the key driver of the growth in these three key revenues in 2013-14 is growth in the GST revenue distributed to Queensland by the Australian Government.
Chart 3.4
Contribution of Key Revenues to Growth
GST Royalties Taxes Total Growth
15%
10%
5%
0%
-5%
-10%
1990-91 1993-94 1996-97 1999-2000 2002-03 2005-06 2008-09 2011-12 2014-15
Taxation
Annual growth in transfer duty averaged over 22.6% from 2000-01 to 2007-08 driven by a range of factors including Queensland’s relative affordability of housing, high population growth and the impact of the burgeoning mining sector. This was a key contributor to total taxation growth of 12% per annum over this period, with revenue from transfer duty effectively used to offset a number of reductions in other taxes.
Budget Strategy and Outlook 2013-14 53
Looking forward, transfer duty growth is expected to be modest relative to that experienced between 2000-01 and 2007-08. While low interest rates and a solid economic outlook are expected to support recovery in the property market, this is expected to occur at a gradual pace, particularly in the non-residential sector. Growth of around 5.3% per annum is expected over the period 2011-12 to 2016-17.
While housing turnover over the forward estimates is expected to improve from its historically low levels and prices recover, this will still see transfer duty growth lower than for most of the past decade. Expected growth rates across the forward estimates are lower than in previous budget updates with transfer duty collections expected to remain below the 2007-08 peak level until beyond 2016-17.
Since the global financial crisis, payroll tax has taken over from transfer duty as the key contributor to Queensland’s tax revenue collections. In 2007-08, these two taxes contributed around $2.9 billion each but since then payroll tax has grown to exceed $4 billion while transfer duty has remained steady at around $2 billion. The growth in payroll tax is due to the relatively stable base and relationship to the underlying strength in economic conditions compared with the volatility associated with transfer duty. However, slower growth in the resources sector will moderate growth going forward. Hence, payroll tax is expected to grow by 7.8% on average across the forward estimates, well below the 9.4% average across the period 1999-00 to 2011-12.
Royalty revenue
Royalty revenue grew strongly between 2000-01 and 2007-08, with growth in revenue in excess of 50% in both 2004-05 and 2005-06. In contrast to the other key discretionary revenues, royalty revenues reached a peak in 2008-09, as record coal prices had been contracted prior to the onset of the global financial crisis. Royalty revenue then fell significantly in 2009-10, along with coal contract prices, and has not yet returned to the levels of 2008-09.
Royalty revenue is estimated to have declined in 2012-13, primarily due to the current weakness in coal prices and high A$-US$ exchange rate. However, royalties are expected to recover from 2013-14 onwards, supported by steady growth in export volumes, a recovery in coal prices and the exchange rate depreciating. The average growth rates projected across the forward estimates are still substantially lower than experienced during the 2000s, which was driven by sharp increases in price to a greater extent than volume growth.
The LNG industry is expected to start contributing to royalties from 2014-15 but with growth strongest in 2015-16. As a consequence of the method used to levy royalties on gas, State royalties are directly impacted by cost escalation on projects.
54 Budget Strategy and Outlook 2013-14
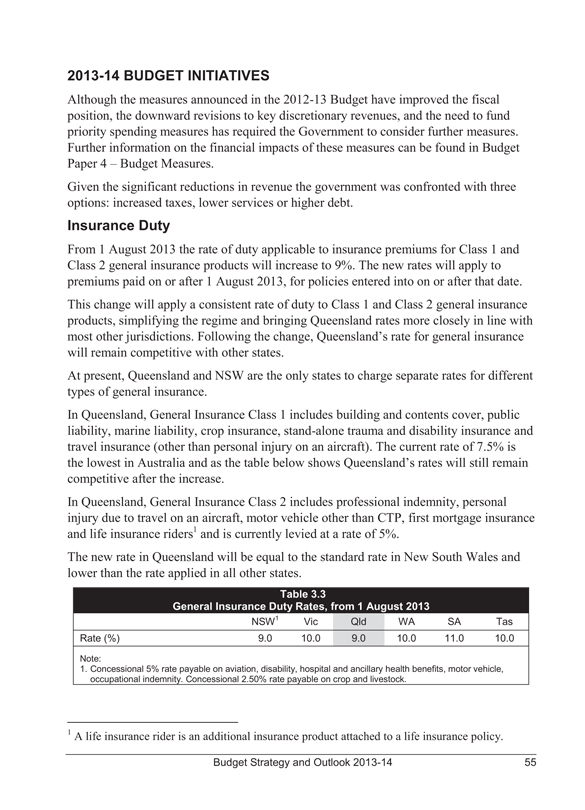
2013-14 BUDGET INITIATIVES
Although the measures announced in the 2012-13 Budget have improved the fiscal position, the downward revisions to key discretionary revenues, and the need to fund priority spending measures has required the Government to consider further measures. Further information on the financial impacts of these measures can be found in Budget Paper 4 – Budget Measures.
Given the significant reductions in revenue the government was confronted with three options: increased taxes, lower services or higher debt.
Insurance Duty
From 1 August 2013 the rate of duty applicable to insurance premiums for Class 1 and Class 2 general insurance products will increase to 9%. The new rates will apply to premiums paid on or after 1 August 2013, for policies entered into on or after that date.
This change will apply a consistent rate of duty to Class 1 and Class 2 general insurance products, simplifying the regime and bringing Queensland rates more closely in line with most other jurisdictions. Following the change, Queensland’s rate for general insurance will remain competitive with other states.
At present, Queensland and NSW are the only states to charge separate rates for different types of general insurance.
In Queensland, General Insurance Class 1 includes building and contents cover, public liability, marine liability, crop insurance, stand-alone trauma and disability insurance and travel insurance (other than personal injury on an aircraft). The current rate of 7.5% is the lowest in Australia and as the table below shows Queensland’s rates will still remain competitive after the increase.
In Queensland, General Insurance Class 2 includes professional indemnity, personal injury due to travel on an aircraft, motor vehicle other than CTP, first mortgage insurance and life insurance riders1 and is currently levied at a rate of 5%.
The new rate in Queensland will be equal to the standard rate in New South Wales and lower than the rate applied in all other states.
Table 3.3
General Insurance Duty Rates, from 1 August 2013
NSW1 Vic Qld WA SA Tas
Rate (%) 9.0 10.0 9.0 10.0 11.0 10.0
Note:
1. Concessional 5% rate payable on aviation, disability, hospital and ancillary health benefits, motor vehicle, occupational indemnity. Concessional 2.50% rate payable on crop and livestock.
1 A life insurance rider is an additional insurance product attached to a life insurance policy.
Budget Strategy and Outlook 2013-14 55
There will be no changes to the duty payable on Workers Compensation or Compulsory Third Party (CTP) premiums.
This change is expected to provide additional revenue of approximately $195 million in 2013-14 and will be used to partially fund the State’s contribution to the National Disability Insurance Scheme (DisabilityCare).
Emergency Management, Fire and Rescue Levy
From 1 January 2014, the Government is increasing and broadening the coverage of the Urban Fire Levy to ensure a sustainable funding base for emergency services. The levy will be known as the Emergency Management, Fire and Rescue Levy and will be applied to all rateable properties. Local governments affected for the first time will be provided with transitional assistance.
The levy will be extended to include Emergency Management Queensland, recognising that all Queenslanders are at risk from a wide range of emergencies including floods, cyclones, storms as well as fire and accidents. Emergency Management Queensland operates the State Emergency Service, emergency helicopter, disaster management and supports volunteer marine rescue services.
Since the levy was introduced the equipment needed and expertise involved with emergency management has grown significantly. The rate of the levy will increase by 6.5% to help partially offset the increasing costs of providing these services throughout Queensland although the levy does not cover the full costs of service provision.
Table 3.4 identifies the annual Emergency Management, Fire and Rescue Levy amount payable from 1 January 2014, for each property group and location class. Property group 1 includes vacant land, while detached houses are in property group 2. Property groups 3 to 16 cover a range of commercial properties.
Location classes are based on the number of funded service personnel in each location, with the more urbanised areas of Queensland (e.g. Brisbane, Cairns, Townsville) being in location class A. Location class E covers rateable properties that are not currently subject to the Urban Fire Levy, reflecting the broader purpose of the Emergency Management, Fire and Rescue Levy.
Further details of each property group and location class are available from www.dcs.qld.gov.au.
56 Budget Strategy and Outlook 2013-14
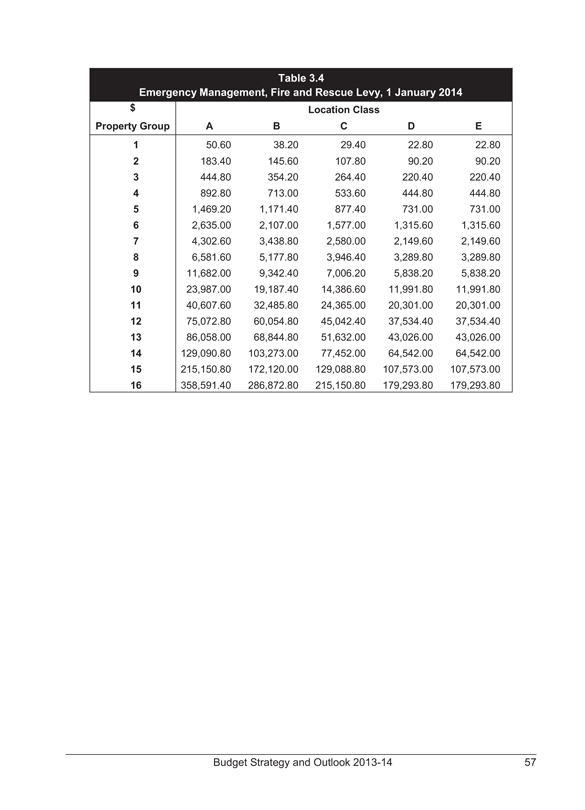
Table 3.4
Emergency Management, Fire and Rescue Levy, 1 January 2014
$ Property Group
Location Class
A B C D E
1 50.60 38.20 29.40 22.80 22.80
2 183.40 145.60 107.80 90.20 90.20
3 444.80 354.20 264.40 220.40 220.40
4 892.80 713.00 533.60 444.80 444.80
5 1,469.20 1,171.40 877.40 731.00 731.00
6 2,635.00 2,107.00 1,577.00 1,315.60 1,315.60
7 4,302.60 3,438.80 2,580.00 2,149.60 2,149.60
8 6,581.60 5,177.80 3,946.40 3,289.80 3,289.80
9 11,682.00 9,342.40 7,006.20 5,838.20 5,838.20
10 23,987.00 19,187.40 14,386.60 11,991.80 11,991.80
11 40,607.60 32,485.80 24,365.00 20,301.00 20,301.00
12 75,072.80 60,054.80 45,042.40 37,534.40 37,534.40
13 86,058.00 68,844.80 51,632.00 43,026.00 43,026.00
14 129,090.80 103,273.00 77,452.00 64,542.00 64,542.00
15 215,150.80 172,120.00 129,088.80 107,573.00 107,573.00
16 358,591.40 286,872.80 215,150.80 179,293.80 179,293.80
Budget Strategy and Outlook 2013-14 57
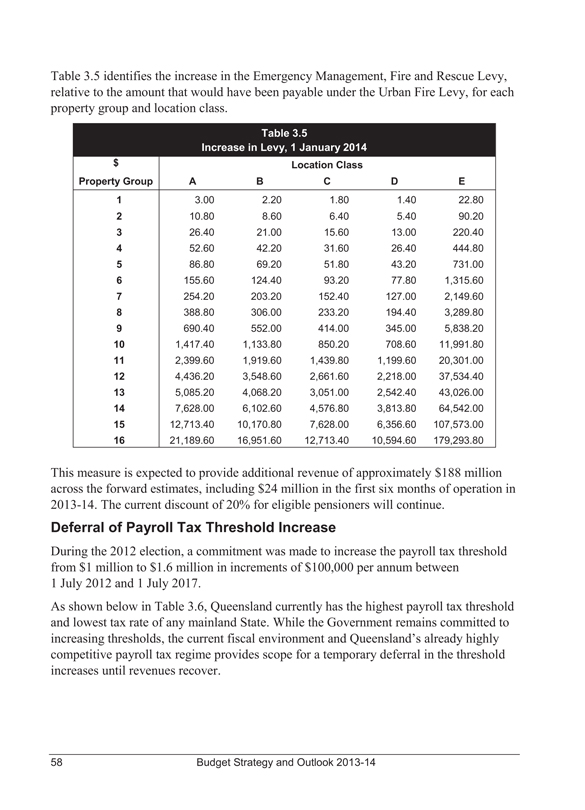
Table 3.5 identifies the increase in the Emergency Management, Fire and Rescue Levy, relative to the amount that would have been payable under the Urban Fire Levy, for each property group and location class.
Table 3.5
Increase in Levy, 1 January 2014
$ Property Group
Location Class A B C D E
1 3.00 2.20 1.80 1.40 22.80
2 10.80 8.60 6.40 5.40 90.20
3 26.40 21.00 15.60 13.00 220.40
4 52.60 42.20 31.60 26.40 444.80
5 86.80 69.20 51.80 43.20 731.00
6 155.60 124.40 93.20 77.80 1,315.60
7 254.20 203.20 152.40 127.00 2,149.60
8 388.80 306.00 233.20 194.40 3,289.80
9 690.40 552.00 414.00 345.00 5,838.20
10 1,417.40 1,133.80 850.20 708.60 11,991.80
11 2,399.60 1,919.60 1,439.80 1,199.60 20,301.00
12 4,436.20 3,548.60 2,661.60 2,218.00 37,534.40
13 5,085.20 4,068.20 3,051.00 2,542.40 43,026.00
14 7,628.00 6,102.60 4,576.80 3,813.80 64,542.00
15 12,713.40 10,170.80 7,628.00 6,356.60 107,573.00
16 21,189.60 16,951.60 12,713.40 10,594.60 179,293.80
This measure is expected to provide additional revenue of approximately $188 million across the forward estimates, including $24 million in the first six months of operation in 2013-14. The current discount of 20% for eligible pensioners will continue.
Deferral of Payroll Tax Threshold Increase
During the 2012 election, a commitment was made to increase the payroll tax threshold from $1 million to $1.6 million in increments of $100,000 per annum between 1 July 2012 and 1 July 2017.
As shown below in Table 3.6, Queensland currently has the highest payroll tax threshold and lowest tax rate of any mainland State. While the Government remains committed to increasing thresholds, the current fiscal environment and Queensland’s already highly competitive payroll tax regime provides scope for a temporary deferral in the threshold increases until revenues recover.
58 Budget Strategy and Outlook 2013-14

Table 3.6
Payroll Tax Rates and Thresholds from 1 July 2013
QLD NSW1 VIC WA SA TAS ACT NT
Exemption Threshold ($’000) 1,100 708 550 750 600 1,250 1,750 1,500
Tax Rate (%) 4.75 5.45 4.90 5.50 4.95 6.10 6.85 5.5
Note:
1. Estimate based on annual indexation.
The Government has decided to defer the scheduled increases by two years with the next increase to $1.2 million occurring from 1 July 2015, rather than 1 July 2013. The table below compares the implementation dates of the threshold increases from the 2012-13 Budget with the revised schedule.
Table 3.7
Payroll Tax Threshold Changes
1/7/2012 $ million
1/7/2013 $ million
1/7/2014 $ million
1/7/2015 $ million
1/7/2016 $ million
1/7/2017 $ million
1/7/2018 $ million
1/7/2019 $ million
2012-13 Budget 1.1 1.2 1.3 1.4 1.5 1.6 1.6 1.6
Revised 1.1 1.1 1.1 1.2 1.3 1.4 1.5 1.6
This change will provide savings to the Budget of approximately $315 million over the forward estimates period.
TAXATION REVENUE
One of the Queensland Government’s key fiscal objectives is to maintain a competitive tax regime promoting economic development and jobs growth, whilst raising sufficient revenue to meet the service and infrastructure needs of the people of Queensland.
Total revenue from taxation is expected to grow by 7.8% in 2013-14, with 2.4% of this attributable to revenue measures announced in this Budget.
Budget Strategy and Outlook 2013-14 59
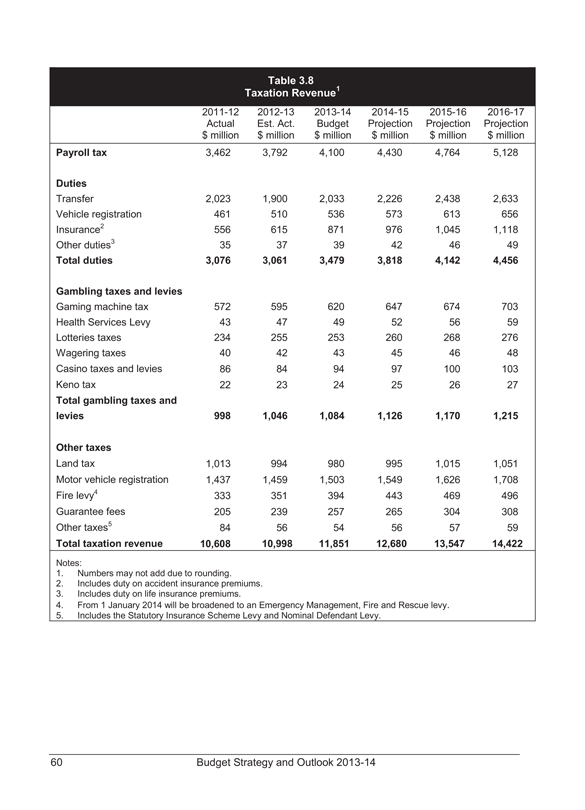
Table 3.8
Taxation Revenue1
2011-12 Actual $ million
2012-13 Est. Act. $ million
2013-14 Budget $ million
2014-15 Projection $ million
2015-16 Projection $ million
2016-17 Projection $ million
Payroll tax 3,462 3,792 4,100 4,430 4,764 5,128
Duties
Transfer 2,023 1,900 2,033 2,226 2,438 2,633
Vehicle registration 461 510 536 573 613 656
Insurance2 556 615 871 976 1,045 1,118
Other duties3 35 37 39 42 46 49
Total duties 3,076 3,061 3,479 3,818 4,142 4,456
Gambling taxes and levies
Gaming machine tax 572 595 620 647 674 703
Health Services Levy 43 47 49 52 56 59
Lotteries taxes 234 255 253 260 268 276
Wagering taxes 40 42 43 45 46 48
Casino taxes and levies 86 84 94 97 100 103
Keno tax 22 23 24 25 26 27
Total gambling taxes and levies 998 1,046 1,084 1,126 1,170 1,215
Other taxes
Land tax 1,013 994 980 995 1,015 1,051
Motor vehicle registration 1,437 1,459 1,503 1,549 1,626 1,708
Fire levy4 333 351 394 443 469 496
Guarantee fees 205 239 257 265 304 308
Other taxes5 84 56 54 56 57 59
Total taxation revenue 10,608 10,998 11,851 12,680 13,547 14,422
Notes:
1. Numbers may not add due to rounding.
2. Includes duty on accident insurance premiums.
3. Includes duty on life insurance premiums.
4. From 1 January 2014 will be broadened to an Emergency Management, Fire and Rescue levy.
5. Includes the Statutory Insurance Scheme Levy and Nominal Defendant Levy.
60 Budget Strategy and Outlook 2013-14
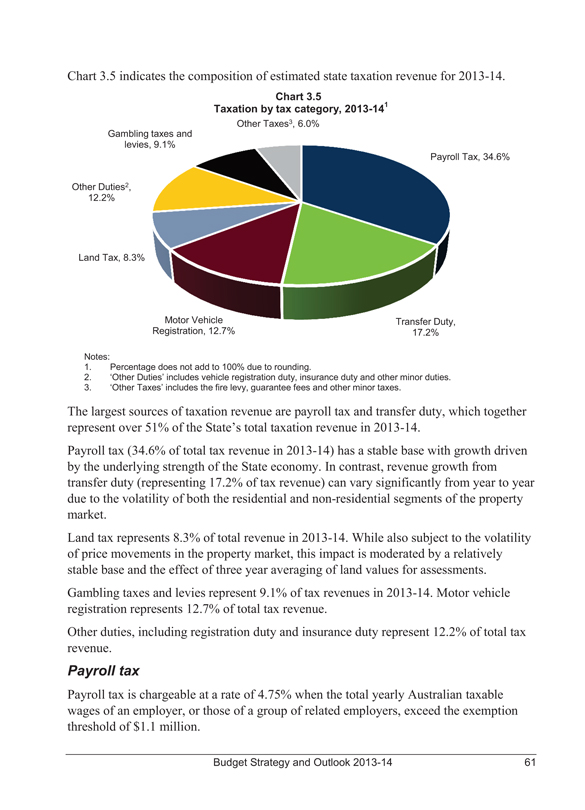
Chart 3.5 indicates the composition of estimated state taxation revenue for 2013-14.
Chart 3.5
Taxation by tax category, 2013-141
Other Taxes3, 6.0%
Gambling taxes and levies, 9.1%
Payroll Tax, 34.6%
Other Duties2, 12.2%
Land Tax, 8.3%
Motor Vehicle Registration, 12.7%
Transfer Duty, 17.2%
Notes:
1. Percentage does not add to 100% due to rounding.
2. ‘Other Duties’ includes vehicle registration duty, insurance duty and other minor duties.
3. ‘Other Taxes’ includes the fire levy, guarantee fees and other minor taxes.
The largest sources of taxation revenue are payroll tax and transfer duty, which together represent over 51% of the State’s total taxation revenue in 2013-14.
Payroll tax (34.6% of total tax revenue in 2013-14) has a stable base with growth driven by the underlying strength of the State economy. In contrast, revenue growth from transfer duty (representing 17.2% of tax revenue) can vary significantly from year to year due to the volatility of both the residential and non-residential segments of the property market.
Land tax represents 8.3% of total revenue in 2013-14. While also subject to the volatility of price movements in the property market, this impact is moderated by a relatively stable base and the effect of three year averaging of land values for assessments.
Gambling taxes and levies represent 9.1% of tax revenues in 2013-14. Motor vehicle registration represents 12.7% of total tax revenue.
Other duties, including registration duty and insurance duty represent 12.2% of total tax revenue.
Payroll tax
Payroll tax is chargeable at a rate of 4.75% when the total yearly Australian taxable wages of an employer, or those of a group of related employers, exceed the exemption threshold of $1.1 million.
Budget Strategy and Outlook 2013-14 61
The overall payroll tax rate of 4.75% is the lowest in Australia and the exemption threshold of $1.1 million is the highest threshold of any mainland state. Queensland employers with total yearly Australian taxable wages between $1.1 million and $5.5 million also obtain a partial deduction, with the deduction withdrawn at a rate of $1 in every $4 of taxable wages.
Payroll tax collections are estimated to be $4.1 billion in 2013-14, representing growth of 8.1% on the 2012-13 estimated actual. Despite modest employment growth in 2012-13 payroll tax collections are estimated to have grown by 9.5% over 2011-12. This reflects the relative strength of the resources sector. The expectation is that slower growth in the resources sector will moderate payroll tax growth in 2013-14 and beyond.
As outlined in Chapter 2, labour market conditions are expected to improve over the budget and forward estimates period but the average growth of 7.8% remains well below the average of 9.4% from the period 1999-00 to 2011-12.
Duties
Duties are levied on a range of financial and property transactions.
The major duties include transfer, vehicle registration and insurance duties.
• Transfer duty is charged at various rates on the transfer of real and business property. The Queensland Government offers extensive concessions for the transfer of land where the property is purchased as a home. For example, eligible first home buyers of properties up to $500,000 will pay no duty with reduced rates available up to $550,000.
Revenue from transfer duty is expected to grow by 7% in 2013-14. This is based on the expectation that the recent increase in the number of transactions, along with modest growth in house prices will continue, offsetting a subdued outlook for non-residential activity.
From 2014-15 the non-residential sector is expected to recover allowing for the rate of growth to pick up slightly in 2014-15 and 2015-16. The extraordinary annual growth in transfer duty of 22.6% from 2000-01 to 2007-08 is unlikely to ever be repeated.
• Vehicle registration duty is charged at rates of between 2% and 4% of the dutiable value of a motor vehicle on the transfer or initial registration of the motor vehicle, with the rate generally depending on the number of cylinders or rotors of the vehicle.
Revenue from vehicle registration duty is expected to grow by 5% in 2013-14, reflecting a moderation in the number of sales following strong growth of 10.6% in 2012-13.
62 Budget Strategy and Outlook 2013-14
• Insurance duty is charged on contracts of general insurance, life insurance and accident insurance. From 1 August 2013 the rate for most general insurance products will increase to 9%. The new rates will apply to premiums paid on or after 1 August 2013, for policies entered into on or after that date. Temporary or term life insurance continues to attract duty at 5% of the first year’s premium. Other contracts of life insurance are charged at 0.05% of the sum insured up to $2,000, and 0.01% of the balance of the sum insured. Revenue from insurance duty is expected to grow strongly in 2013-14, primarily reflecting the impact of the rate increases.
Gambling taxes and levies
A range of gambling activities are subject to state taxes and levies. Total gambling tax and levy collections are estimated to grow by 3.6% in 2013-14.
Land tax
Land tax is levied on the taxable value of the landowner’s aggregated holdings of freehold land owned in Queensland as at midnight on 30 June each year. The principal place of residence is deducted from this value.
Resident individuals are generally liable for land tax if the total taxable value of the freehold land owned by that person as at 30 June is equal to or greater than $600,000. Companies, trustees and absentees are liable for land tax if the total taxable value of the freehold land owned as at 30 June is equal to or greater than $350,000.
Land tax is estimated to fall by 1.4% to $980 million in 2013-14 with very restrained growth over the outyears. In recent years, land tax revenue has been adversely impacted by declining values, particularly for commercial and multi-unit residential land. Even with modest recovery in land values expected going forward, the three year averaging process dilutes the impact on tax collections which is reflected by the moderate growth over the budget period.
Motor vehicle registration fees
Motor vehicle registration fees are expected to grow by 3.0% in 2013-14, primarily reflecting an increase in the number of motor vehicles as under the Government’s election commitment there is no increase in the level of registration fees for private vehicles during this term of government.
Budget Strategy and Outlook 2013-14 63
Emergency Management, Fire and Rescue Levy
The Emergency Management, Fire and Rescue Levy revenue, which is used partly to offset the costs of emergency management in Queensland is expected to grow by 12.4% in 2013-14 reflecting the rate increase of 6.5% and extending the levy to all rateable properties.
Guarantee fees
Guarantee fees are revenues collected by Queensland Treasury Corporation (QTC) on behalf of the State and comprise performance dividends, competitive neutrality fees and credit margin fees. These fees promote competitive neutrality between public sector agencies and those in the private sector, and ensure that the benefits accruing from the financial backing and superior borrowing performance of the State (through QTC) are shared between the borrower and the State.
Other taxes
Other taxes represent revenue from taxes such as the Statutory Insurance Scheme levy and the Nominal Defendant levy.
Tax expenditures
Tax expenditures are reductions in tax revenue that result from the use of the tax system as a policy tool to deliver Government policy objectives. Tax expenditures are provided through a range of concessions, including tax exemptions, reduced tax rates, tax rebates, tax deductions and provisions which defer payment of a tax liability to a future period. Appendix A provides details of tax expenditure arrangements currently provided by the Queensland Government.
QUEENSLAND’S COMPETITIVE TAX STATUS
Taxation can impact on business decisions regarding investment and employment, and also household investment and home ownership. Maintaining the competitiveness of
Queensland’s tax system provides a competitive advantage to business and moderates the tax burden for its citizens, and is therefore fundamental to the Government’s commitment to job creation and sustainable development.
One of the Queensland Government’s fiscal objectives is to maintain a competitive tax environment for business. As Table 3.9 shows, taxation per capita in Queensland is significantly lower than the average taxation per capita in the other states and territories. In 2013-14, it is estimated that Queensland’s taxation per capita will be $475 per capita less than the average of other jurisdictions.
Queensland’s tax effort, as measured by the Commonwealth Grants Commission, was more than 12% below the national average in 2011-12.
64 Budget Strategy and Outlook 2013-14
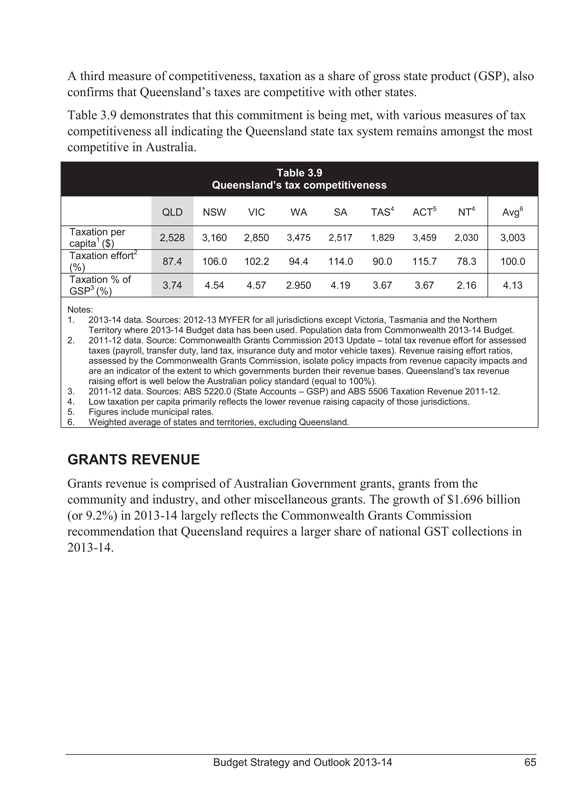
A third measure of competitiveness, taxation as a share of gross state product (GSP), also confirms that Queensland’s taxes are competitive with other states.
Table 3.9 demonstrates that this commitment is being met, with various measures of tax competitiveness all indicating the Queensland state tax system remains amongst the most competitive in Australia.
Table 3.9
Queensland’s tax competitiveness
QLD NSW VIC WA SA TAS4 ACT5 NT4 Avg6
Taxation per capita1 ($) 2,528 3,160 2,850 3,475 2,517 1,829 3,459 2,030 3,003
Taxation effort2 (%) 87.4 106.0 102.2 94.4 114.0 90.0 115.7 78.3 100.0
Taxation % of GSP3 (%) 3.74 4.54 4.57 2.950 4.19 3.67 3.67 2.16 4.13
Notes:
1. 2013-14 data. Sources: 2012-13 MYFER for all jurisdictions except Victoria, Tasmania and the Northern Territory where 2013-14 Budget data has been used. Population data from Commonwealth 2013-14 Budget.
2. 2011-12 data. Source: Commonwealth Grants Commission 2013 Update - total tax revenue effort for assessed taxes (payroll, transfer duty, land tax, insurance duty and motor vehicle taxes). Revenue raising effort ratios, assessed by the Commonwealth Grants Commission, isolate policy impacts from revenue capacity impacts and are an indicator of the extent to which governments burden their revenue bases. Queensland’s tax revenue raising effort is well below the Australian policy standard (equal to 100%).
3. 2011-12 data. Sources: ABS 5220.0 (State Accounts - GSP) and ABS 5506 Taxation Revenue 2011-12.
4. Low taxation per capita primarily reflects the lower revenue raising capacity of those jurisdictions.
5. Figures include municipal rates.
6. Weighted average of states and territories, excluding Queensland.
GRANTS REVENUE
Grants revenue is comprised of Australian Government grants, grants from the community and industry, and other miscellaneous grants. The growth of $1.696 billion (or 9.2%) in 2013-14 largely reflects the Commonwealth Grants Commission recommendation that Queensland requires a larger share of national GST collections in 2013-14.
Budget Strategy and Outlook 2013-14 65
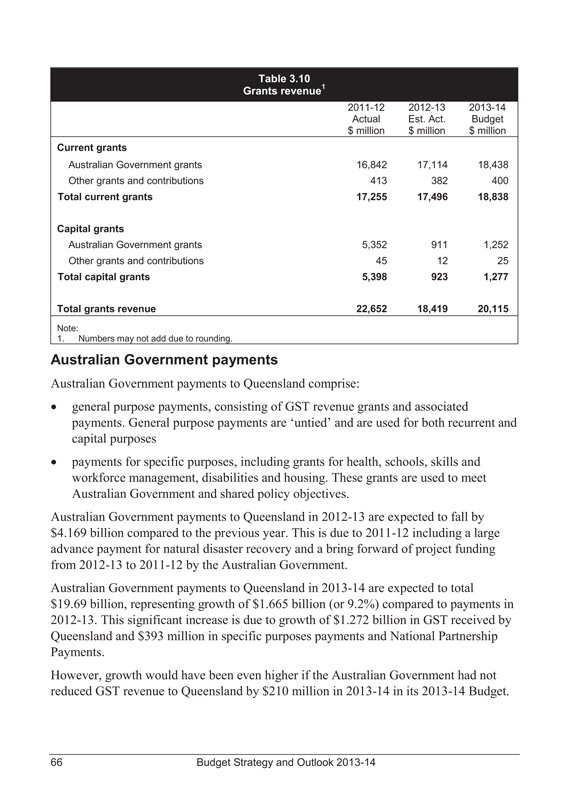
Table 3.10
Grants revenue1
2011-12 Actual $ million 2012-13 Est. Act. $ million 2013-14 Budget $ million
Current grants
Australian Government grants 16,842 17,114 18,438
Other grants and contributions 413 382 400
Total current grants 17,255 17,496 18,838
Capital grants
Australian Government grants 5,352 911 1,252
Other grants and contributions 45 12 25
Total capital grants 5,398 923 1,277
Total grants revenue 22,652 18,419 20,115
Note:
1. Numbers may not add due to rounding.
Australian Government payments
Australian Government payments to Queensland comprise:
• general purpose payments, consisting of GST revenue grants and associated payments. General purpose payments are ‘untied’ and are used for both recurrent and capital purposes
• payments for specific purposes, including grants for health, schools, skills and workforce management, disabilities and housing. These grants are used to meet Australian Government and shared policy objectives.
Australian Government payments to Queensland in 2012-13 are expected to fall by $4.169 billion compared to the previous year. This is due to 2011-12 including a large advance payment for natural disaster recovery and a bring forward of project funding from 2012-13 to 2011-12 by the Australian Government.
Australian Government payments to Queensland in 2013-14 are expected to total $19.69 billion, representing growth of $1.665 billion (or 9.2%) compared to payments in 2012-13. This significant increase is due to growth of $1.272 billion in GST received by Queensland and $393 million in specific purposes payments and National Partnership Payments.
However, growth would have been even higher if the Australian Government had not reduced GST revenue to Queensland by $210 million in 2013-14 in its 2013-14 Budget.
66 Budget Strategy and Outlook 2013-14
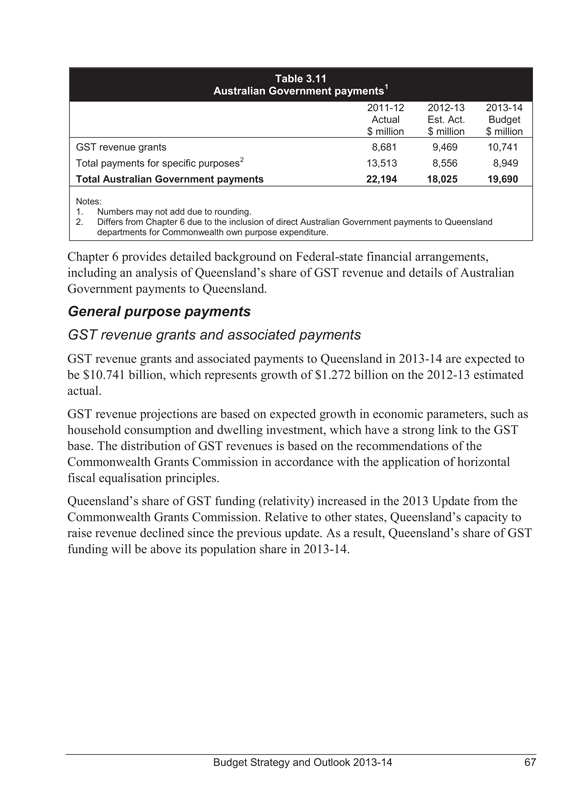
Table 3.11
Australian Government payments1
2011-12 Actual $ million 2012-13 Est. Act. $ million 2013-14 Budget $ million
GST revenue grants 8,681 9,469 10,741
Total payments for specific purposes2 13,513 8,556 8,949
Total Australian Government payments 22,194 18,025 19,690
Notes:
1. Numbers may not add due to rounding.
2. Differs from Chapter 6 due to the inclusion of direct Australian Government payments to Queensland departments for Commonwealth own purpose expenditure.
Chapter 6 provides detailed background on Federal-state financial arrangements, including an analysis of Queensland’s share of GST revenue and details of Australian
Government payments to Queensland.
General purpose payments
GST revenue grants and associated payments
GST revenue grants and associated payments to Queensland in 2013-14 are expected to be $10.741 billion, which represents growth of $1.272 billion on the 2012-13 estimated actual.
GST revenue projections are based on expected growth in economic parameters, such as household consumption and dwelling investment, which have a strong link to the GST base. The distribution of GST revenues is based on the recommendations of the Commonwealth Grants Commission in accordance with the application of horizontal fiscal equalisation principles.
Queensland’s share of GST funding (relativity) increased in the 2013 Update from the Commonwealth Grants Commission. Relative to other states, Queensland’s capacity to raise revenue declined since the previous update. As a result, Queensland’s share of GST funding will be above its population share in 2013-14.
Budget Strategy and Outlook 2013-14 67
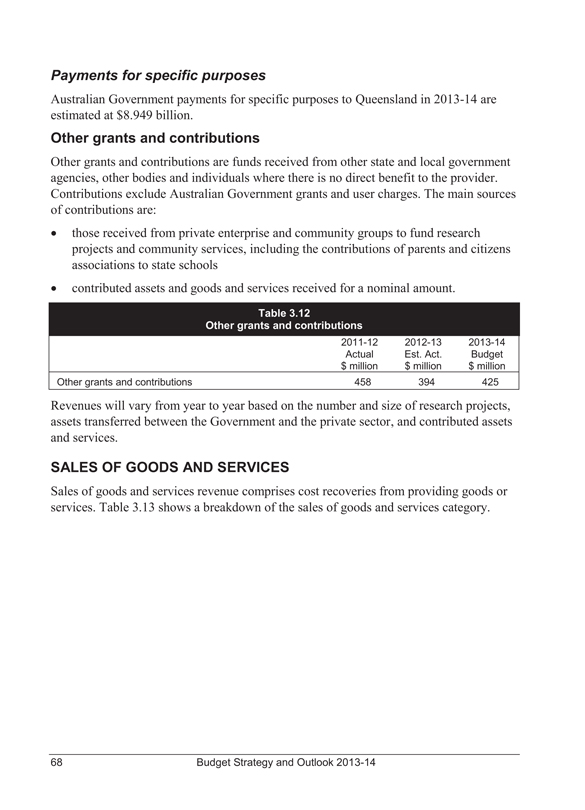
Payments for specific purposes
Australian Government payments for specific purposes to Queensland in 2013-14 are estimated at $8.949 billion.
Other grants and contributions
Other grants and contributions are funds received from other state and local government agencies, other bodies and individuals where there is no direct benefit to the provider. Contributions exclude Australian Government grants and user charges. The main sources of contributions are:
• those received from private enterprise and community groups to fund research projects and community services, including the contributions of parents and citizens associations to state schools
• contributed assets and goods and services received for a nominal amount.
Table 3.12
Other grants and contributions
2011-12 Actual $ million 2012-13 Est. Act. $ million 2013-14 Budget $ million
Other grants and contributions 458 394 425
Revenues will vary from year to year based on the number and size of research projects, assets transferred between the Government and the private sector, and contributed assets and services.
SALES OF GOODS AND SERVICES
Sales of goods and services revenue comprises cost recoveries from providing goods or services. Table 3.13 shows a breakdown of the sales of goods and services category.
68 Budget Strategy and Outlook 2013-14
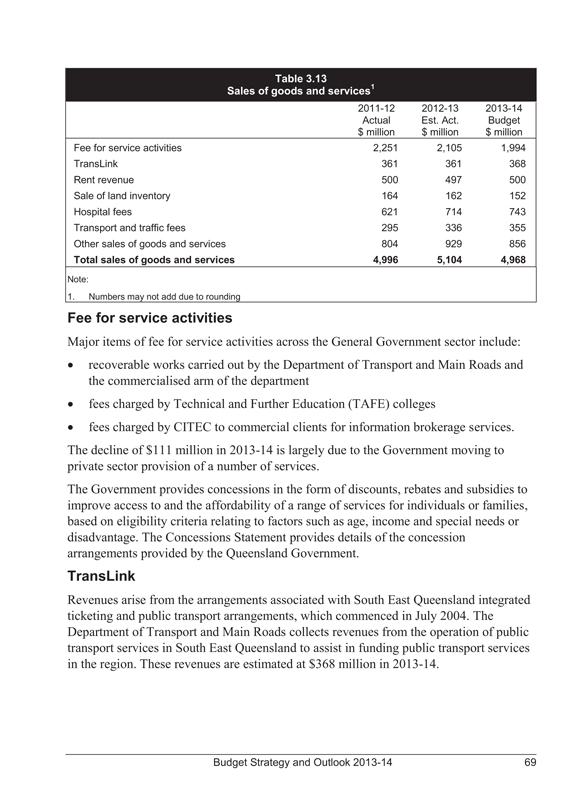
Table 3.13
Sales of goods and services1
2011-12 Actual $ million 2012-13 Est. Act. $ million 2013-14 Budget $ million
Fee for service activities 2,251 2,105 1,994
TransLink 361 361 368
Rent revenue 500 497 500
Sale of land inventory 164 162 152
Hospital fees 621 714 743
Transport and traffic fees 295 336 355
Other sales of goods and services 804 929 856
Total sales of goods and services 4,996 5,104 4,968
Note:
1. Numbers may not add due to rounding
Fee for service activities
Major items of fee for service activities across the General Government sector include: • recoverable works carried out by the Department of Transport and Main Roads and the commercialised arm of the department • fees charged by Technical and Further Education (TAFE) colleges • fees charged by CITEC to commercial clients for information brokerage services. The decline of $111 million in 2013-14 is largely due to the Government moving to private sector provision of a number of services.
The Government provides concessions in the form of discounts, rebates and subsidies to improve access to and the affordability of a range of services for individuals or families, based on eligibility criteria relating to factors such as age, income and special needs or disadvantage. The Concessions Statement provides details of the concession arrangements provided by the Queensland Government.
TransLink
Revenues arise from the arrangements associated with South East Queensland integrated ticketing and public transport arrangements, which commenced in July 2004. The Department of Transport and Main Roads collects revenues from the operation of public transport services in South East Queensland to assist in funding public transport services in the region. These revenues are estimated at $368 million in 2013-14.
Budget Strategy and Outlook 2013-14 69
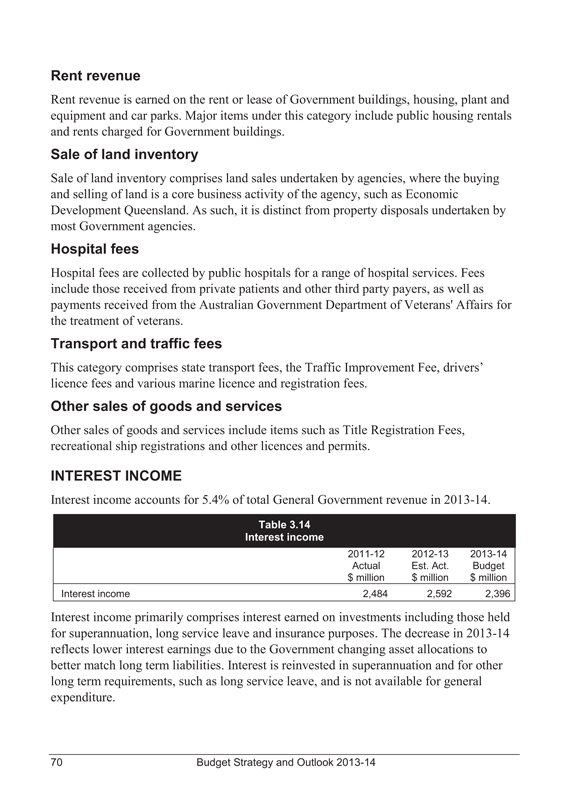
Rent revenue
Rent revenue is earned on the rent or lease of Government buildings, housing, plant and equipment and car parks. Major items under this category include public housing rentals and rents charged for Government buildings.
Sale of land inventory
Sale of land inventory comprises land sales undertaken by agencies, where the buying and selling of land is a core business activity of the agency, such as Economic Development Queensland. As such, it is distinct from property disposals undertaken by most Government agencies.
Hospital fees
Hospital fees are collected by public hospitals for a range of hospital services. Fees include those received from private patients and other third party payers, as well as payments received from the Australian Government Department of Veterans’ Affairs for the treatment of veterans.
Transport and traffic fees
This category comprises state transport fees, the Traffic Improvement Fee, drivers’ licence fees and various marine licence and registration fees.
Other sales of goods and services
Other sales of goods and services include items such as Title Registration Fees, recreational ship registrations and other licences and permits.
INTEREST INCOME
Interest income accounts for 5.4% of total General Government revenue in 2013-14.
Table 3.14
Interest income
2011-12 Actual $ million 2012-13 Est. Act. $ million 2013-14 Budget $ million
Interest income 2,484 2,592 2,396
Interest income primarily comprises interest earned on investments including those held for superannuation, long service leave and insurance purposes. The decrease in 2013-14 reflects lower interest earnings due to the Government changing asset allocations to better match long term liabilities. Interest is reinvested in superannuation and for other long term requirements, such as long service leave, and is not available for general expenditure.
70 Budget Strategy and Outlook 2013-14
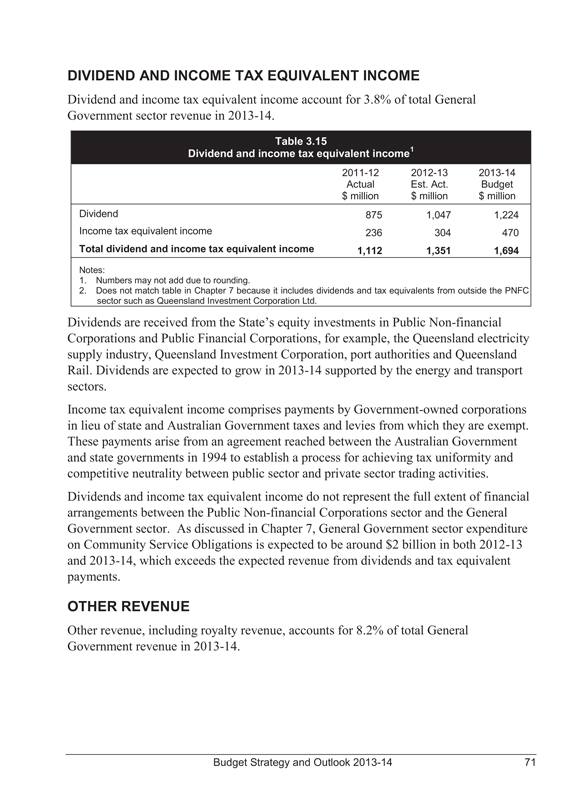
DIVIDEND AND INCOME TAX EQUIVALENT INCOME
Dividend and income tax equivalent income account for 3.8% of total General Government sector revenue in 2013-14.
Table 3.15
Dividend and income tax equivalent income1
2011-12 Actual $ million 2012-13 Est. Act. $ million 2013-14 Budget $ million
Dividend 875 1,047 1,224
Income tax equivalent income 236 304 470
Total dividend and income tax equivalent income 1,112 1,351 1,694
Notes:
1. Numbers may not add due to rounding.
2. Does not match table in Chapter 7 because it includes dividends and tax equivalents from outside the PNFC sector such as Queensland Investment Corporation Ltd.
Dividends are received from the State’s equity investments in Public Non-financial Corporations and Public Financial Corporations, for example, the Queensland electricity supply industry, Queensland Investment Corporation, port authorities and Queensland Rail. Dividends are expected to grow in 2013-14 supported by the energy and transport sectors.
Income tax equivalent income comprises payments by Government-owned corporations in lieu of state and Australian Government taxes and levies from which they are exempt. These payments arise from an agreement reached between the Australian Government and state governments in 1994 to establish a process for achieving tax uniformity and competitive neutrality between public sector and private sector trading activities.
Dividends and income tax equivalent income do not represent the full extent of financial arrangements between the Public Non-financial Corporations sector and the General Government sector. As discussed in Chapter 7, General Government sector expenditure on Community Service Obligations is expected to be around $2 billion in both 2012-13 and 2013-14, which exceeds the expected revenue from dividends and tax equivalent payments.
OTHER REVENUE
Other revenue, including royalty revenue, accounts for 8.2% of total General Government revenue in 2013-14.
Budget Strategy and Outlook 2013-14 71
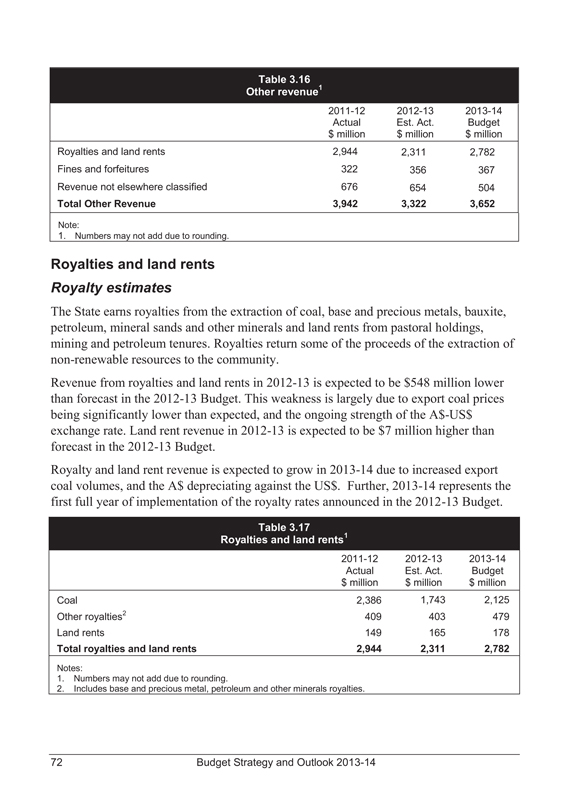
Table 3.16
Other revenue1
2011-12 Actual $ million 2012-13 Est. Act. $ million 2013-14 Budget $ million
Royalties and land rents 2,944 2,311 2,782
Fines and forfeitures 322 356 367
Revenue not elsewhere classified 676 654 504
Total Other Revenue 3,942 3,322 3,652
Note:
1. Numbers may not add due to rounding.
Royalties and land rents
Royalty estimates
The State earns royalties from the extraction of coal, base and precious metals, bauxite, petroleum, mineral sands and other minerals and land rents from pastoral holdings, mining and petroleum tenures. Royalties return some of the proceeds of the extraction of non-renewable resources to the community.
Revenue from royalties and land rents in 2012-13 is expected to be $548 million lower than forecast in the 2012-13 Budget. This weakness is largely due to export coal prices being significantly lower than expected, and the ongoing strength of the A$-US$ exchange rate. Land rent revenue in 2012-13 is expected to be $7 million higher than forecast in the 2012-13 Budget.
Royalty and land rent revenue is expected to grow in 2013-14 due to increased export coal volumes, and the A$ depreciating against the US$. Further, 2013-14 represents the first full year of implementation of the royalty rates announced in the 2012-13 Budget.
Table 3.17
Royalties and land rents1
| | | | | | |
| | | 2011-12 | | 2012-13 | | 2013-14 |
| | | Actual | | Est. Act. | | Budget |
| | | $ million | | $ million | | $ million |
Coal | | 2,386 | | 1,743 | | 2,125 |
Other royalties2 | | 409 | | 403 | | 479 |
Land rents | | 149 | | 165 | | 178 |
Total royalties and land rents | | 2,944 | | 2,311 | | 2,782 |
Notes:
1. Numbers may not add due to rounding.
2. Includes base and precious metal, petroleum and other minerals royalties.
72 Budget Strategy and Outlook 2013-14
Although global economic uncertainty will influence demand for resources from our trading partners, the longer term outlook for royalties is generally positive. Production volumes are expected to improve as demand is driven by more competitive prices and the rates of growth in our major trading partners increase. Coal prices are expected to settle above recent contract benchmarks but still well below historical levels. The exchange rate is expected to return below parity across the forward estimates gradually falling as international markets stabilise and the fundamental determinants of the exchange rate determine its ‘fair value’.
There is a significant degree of uncertainty associated with estimates of commodity prices and the A$-US$ exchange rate, both of which have significant impacts on royalty revenue.
Further details of the assumptions underlying the royalty estimates, and the impact of changes in the assumptions are contained in Appendix B.
Fines and forfeitures
The major fines and infringements included in this category are issued by Department of Transport and Main Roads, Queensland Police Service and toll road operators, incorporating fixed and mobile camera offences, speeding and tolling offences. There is an expected growth of 3.1% in collections of fines and forfeitures in 2013-14.
Since taking over responsibility for the State Penalties Enforcement Registry (SPER) on 25 May 2012, the Office of State Revenue has implemented a number of reforms. The legislation program commenced with new information gathering powers as part of the Fiscal Repair Amendment Act 2012, allowing the Registrar to access new data sources. The SPER debt pool has been analysed and tailored approaches are being developed to ensure the most appropriate and cost effective enforcement strategy is deployed.
The trial of the use of Mercantile Agents has shown positive indications of improved debt collections. Additional options for collection of debts are being evaluated. The SPER website has been updated and new tools made available to debtors. Online facilities are now available for payment, balance enquiry and instalment plans.
Revenue not elsewhere classified
The $151 million decrease in 2013-14 includes an expected decline in asset transfers from non-Queensland Government entities and reductions in sundry revenue across a number of departments.
Budget Strategy and Outlook 2013-14 73
74 Budget Strategy and Outlook 2013-14
4 EXPENSES
FEATURES
• Reflecting the focus of the 2012-13 Budget on fiscal repair, General Government sector expenses in 2012-13 are estimated to be only 1.1% higher than in 2011-12. This is the lowest rate of growth since accrual accounting commenced in 1998-99, and contrasts with an average rate of expenses growth of 8.9% over the decade to 2011-12.
• The main reason why expenses growth is so modest is the Government’s determination to keep employee expenses under control and reduce the size of the public service. The number of Full Time Equivalent (FTE) positions in government departments is estimated to have fallen by around 12,800 from 30 June 2012 to 30 June 2013.
• FTE redundancies related to the Government’s fiscal repair program are estimated to be around 9,200 in 2012-13. This is lower than the 2012-13 Budget estimate of 10,600 redundancies.
• The number of FTEs in the public service in 2016-17 is projected to be less than in 2011-12. This, combined with a disciplined approach to affordable wage outcomes, is expected to result in average employee expenses growth of 2.5% over the period 2011-12 to 2016-17.
• Employee expenses in 2012-13 are estimated to be only 0.9% above 2011-12. This is the smallest increase since accrual accounting commenced in 1998-99. On current estimates, employee expenses growth in 2013-14 will be only 0.1% above 2012-13, primarily reflecting the full year effort of savings measures implemented in the 2012-13 Budget.
• In 2013-14, General Government sector expenses, excluding natural disaster expenses, are expected to increase by $1.254 billion (or 2.8%) over the estimated actual for 2012-13 primarily as a result of increased service delivery including the provision of public hospital and education services.
• In 2012-13, total General Government sector expenses decreased by $1.738 billion over the 2012-13 Mid Year Fiscal and Economic Review (MYFER) partly reflecting a change in the timing of natural disaster reconstruction spending and lower than expected cost of redundancies.
• Expenses are projected to grow on average by 2.6% over the period 2012-13 to 2016-17.
• The major areas of expenditure are health and education, which together constitute approximately 50% of General Government sector expenses.
Budget Strategy and Outlook 2013-14 75
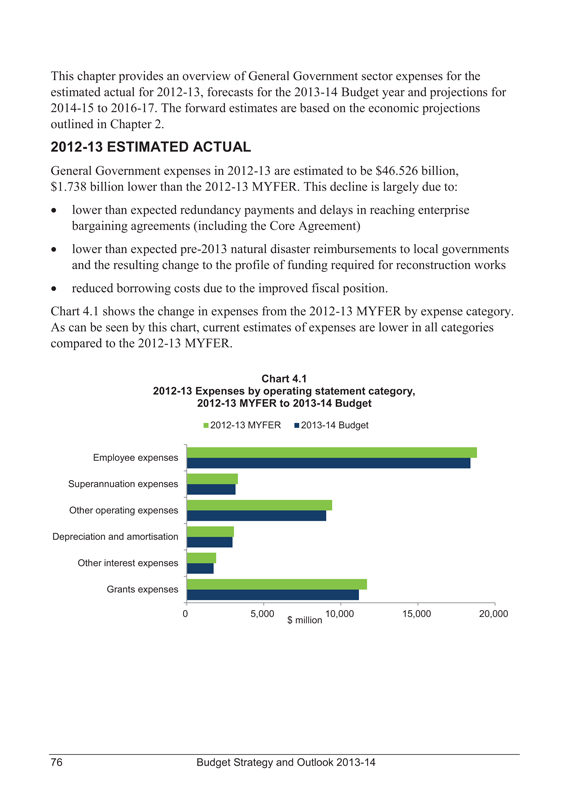
This chapter provides an overview of General Government sector expenses for the estimated actual for 2012-13, forecasts for the 2013-14 Budget year and projections for 2014-15 to 2016-17. The forward estimates are based on the economic projections outlined in Chapter 2.
2012-13 ESTIMATED ACTUAL
General Government expenses in 2012-13 are estimated to be $46.526 billion, $1.738 billion lower than the 2012-13 MYFER. This decline is largely due to:
• lower than expected redundancy payments and delays in reaching enterprise bargaining agreements (including the Core Agreement)
• lower than expected pre-2013 natural disaster reimbursements to local governments and the resulting change to the profile of funding required for reconstruction works
• reduced borrowing costs due to the improved fiscal position.
Chart 4.1 shows the change in expenses from the 2012-13 MYFER by expense category. As can be seen by this chart, current estimates of expenses are lower in all categories compared to the 2012-13 MYFER.
Chart 4.1
2012-13 Expenses by operating statement category,
2012-13 MYFER to 2013-14 Budget
2012-13 MYFER 2013-14 Budget
Employee expenses
Superannuation expenses
Other operating expenses
Depreciation and amortisation
Other interest expenses
Grants expenses
0 5,000 10,000 15,000 20,000
$ million
76 Budget Strategy and Outlook 2013-14
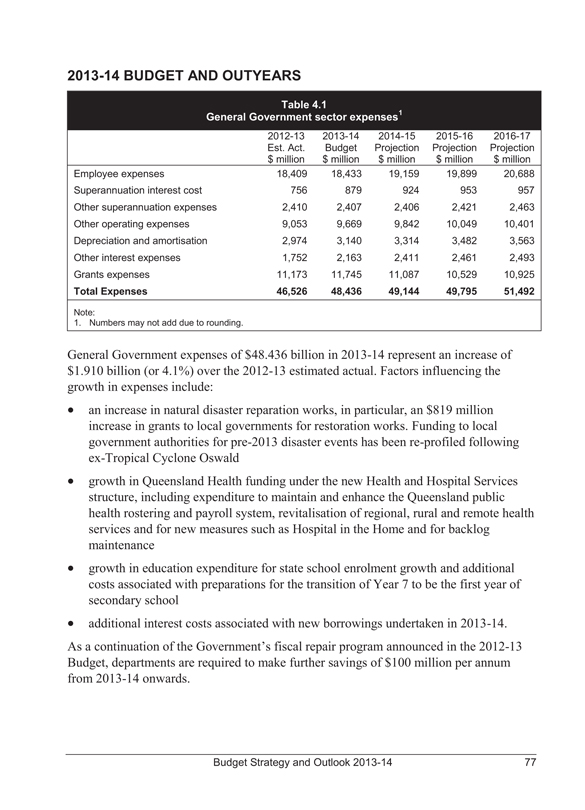
2013-14 BUDGET AND OUTYEARS
Table 4.1
General Government sector expenses1
2012-13 Est. Act. $ million 2013-14 Budget $ million 2014-15 Projection $ million 2015-16 Projection $ million
2016-17 Projection $ million
Employee expenses 18,409 18,433 19,159 19,899 20,688
Superannuation interest cost 756 879 924 953 957
Other superannuation expenses 2,410 2,407 2,406 2,421 2,463
Other operating expenses 9,053 9,669 9,842 10,049 10,401
Depreciation and amortisation 2,974 3,140 3,314 3,482 3,563
Other interest expenses 1,752 2,163 2,411 2,461 2,493
Grants expenses 11,173 11,745 11,087 10,529 10,925
Total Expenses 46,526 48,436 49,144 49,795 51,492
Note:
1. Numbers may not add due to rounding.
General Government expenses of $48.436 billion in 2013-14 represent an increase of $1.910 billion (or 4.1%) over the 2012-13 estimated actual. Factors influencing the growth in expenses include:
• an increase in natural disaster reparation works, in particular, an $819 million increase in grants to local governments for restoration works. Funding to local government authorities for pre-2013 disaster events has been re-profiled following ex-Tropical Cyclone Oswald
• growth in Queensland Health funding under the new Health and Hospital Services structure, including expenditure to maintain and enhance the Queensland public health rostering and payroll system, revitalisation of regional, rural and remote health services and for new measures such as Hospital in the Home and for backlog maintenance
• growth in education expenditure for state school enrolment growth and additional costs associated with preparations for the transition of Year 7 to be the first year of secondary school
• additional interest costs associated with new borrowings undertaken in 2013-14.
As a continuation of the Government’s fiscal repair program announced in the 2012-13 Budget, departments are required to make further savings of $100 million per annum from 2013-14 onwards.
Budget Strategy and Outlook 2013-14 77
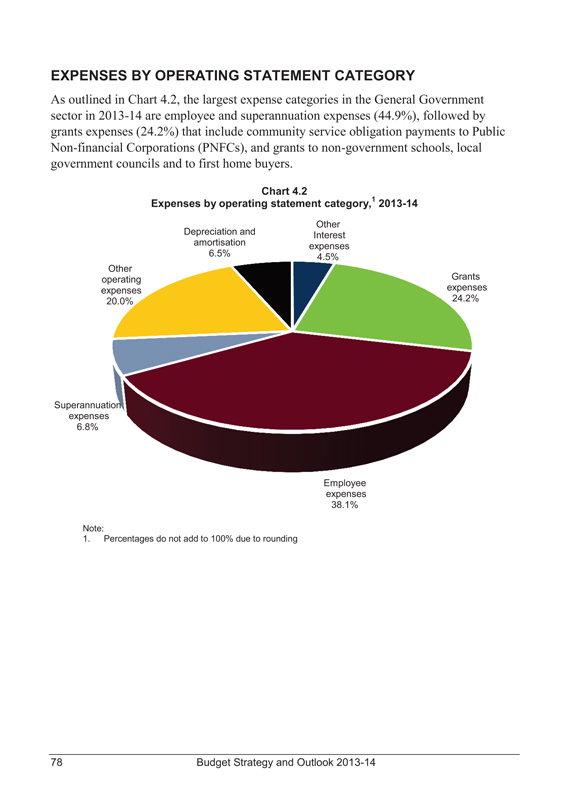
EXPENSES BY OPERATING STATEMENT CATEGORY
As outlined in Chart 4.2, the largest expense categories in the General Government sector in 2013-14 are employee and superannuation expenses (44.9%), followed by grants expenses (24.2%) that include community service obligation payments to Public Non-financial Corporations (PNFCs), and grants to non-government schools, local government councils and to first home buyers.
Chart 4.2
Expenses by operating statement category,1 2013-14
Other Interest expenses 4.5%
Depreciation and amortisation 6.5%
Other operating expenses 20.0%
Grants expenses 24.2%
Superannuation expenses 6.8%
Employee expenses 38.1%
Note:
1. Percentages do not add to 100% due to rounding
78 Budget Strategy and Outlook 2013-14
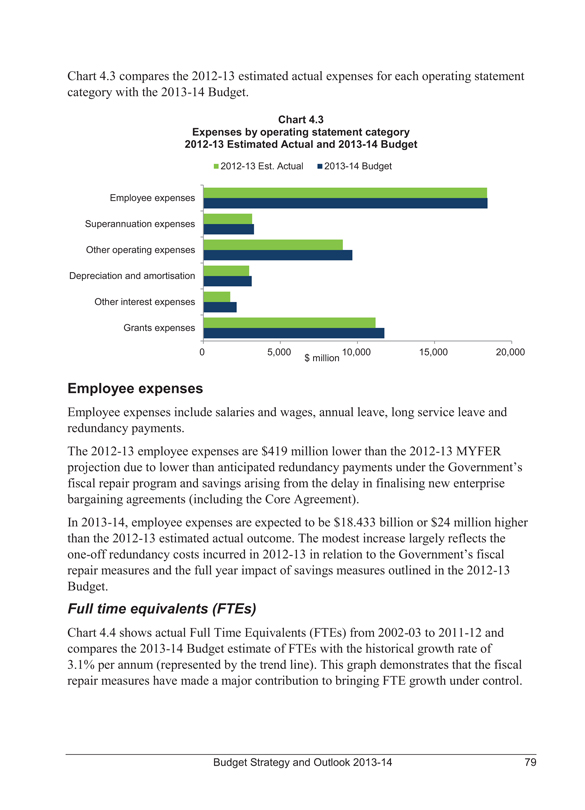
Chart 4.3 compares the 2012-13 estimated actual expenses for each operating statement category with the 2013-14 Budget.
Chart 4.3
Expenses by operating statement category 2012-13 Estimated Actual and 2013-14 Budget
2012-13 Est. Actual 2013-14 Budget
Employee expenses
Superannuation expenses
Other operating expenses
Depreciation and amortisation
Other interest expenses
Grants expenses
0 5,000 10,000 15,000 20,000
$ million
Employee expenses
Employee expenses include salaries and wages, annual leave, long service leave and redundancy payments.
The 2012-13 employee expenses are $419 million lower than the 2012-13 MYFER projection due to lower than anticipated redundancy payments under the Government’s fiscal repair program and savings arising from the delay in finalising new enterprise bargaining agreements (including the Core Agreement).
In 2013-14, employee expenses are expected to be $18.433 billion or $24 million higher than the 2012-13 estimated actual outcome. The modest increase largely reflects the one-off redundancy costs incurred in 2012-13 in relation to the Government’s fiscal repair measures and the full year impact of savings measures outlined in the 2012-13 Budget.
Full time equivalents (FTEs)
Chart 4.4 shows actual Full Time Equivalents (FTEs) from 2002-03 to 2011-12 and compares the 2013-14 Budget estimate of FTEs with the historical growth rate of 3.1% per annum (represented by the trend line). This graph demonstrates that the fiscal repair measures have made a major contribution to bringing FTE growth under control.
Budget Strategy and Outlook 2013-14 79
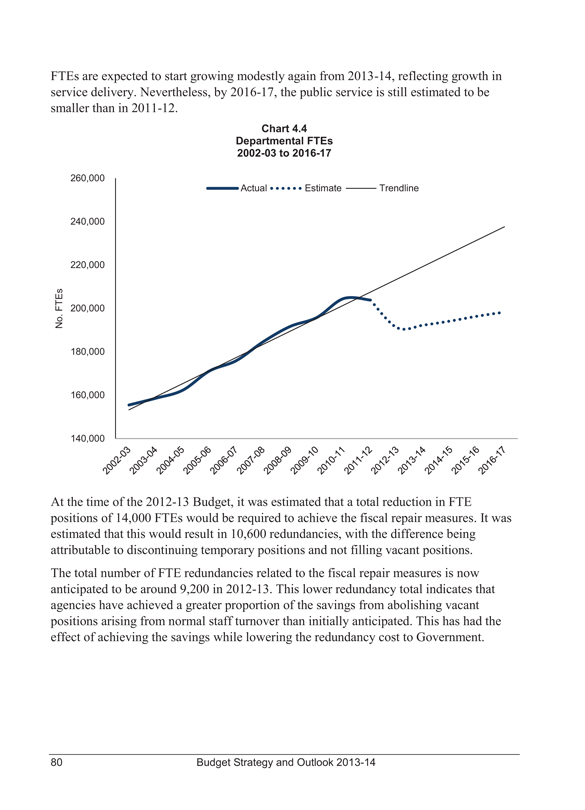
FTEs are expected to start growing modestly again from 2013-14, reflecting growth in service delivery. Nevertheless, by 2016-17, the public service is still estimated to be smaller than in 2011-12.
Chart 4.4 Departmental FTEs 2002-03 to 2016-17
Actual Estimate Trendline
No. FTEs
260,000
240,000
220,000
200,000
180,000
160,000
140,000
2002-03 2003-04 2004-05 2005-06 2006-07 2007-08 2008-09 2009-10 2010-11 2011-12 2012-13 2013-14 2014-15 2015-16 2016-17
At the time of the 2012-13 Budget, it was estimated that a total reduction in FTE positions of 14,000 FTEs would be required to achieve the fiscal repair measures. It was estimated that this would result in 10,600 redundancies, with the difference being attributable to discontinuing temporary positions and not filling vacant positions.
The total number of FTE redundancies related to the fiscal repair measures is now anticipated to be around 9,200 in 2012-13. This lower redundancy total indicates that agencies have achieved a greater proportion of the savings from abolishing vacant positions arising from normal staff turnover than initially anticipated. This has had the effect of achieving the savings while lowering the redundancy cost to Government.
80 Budget Strategy and Outlook 2013-14
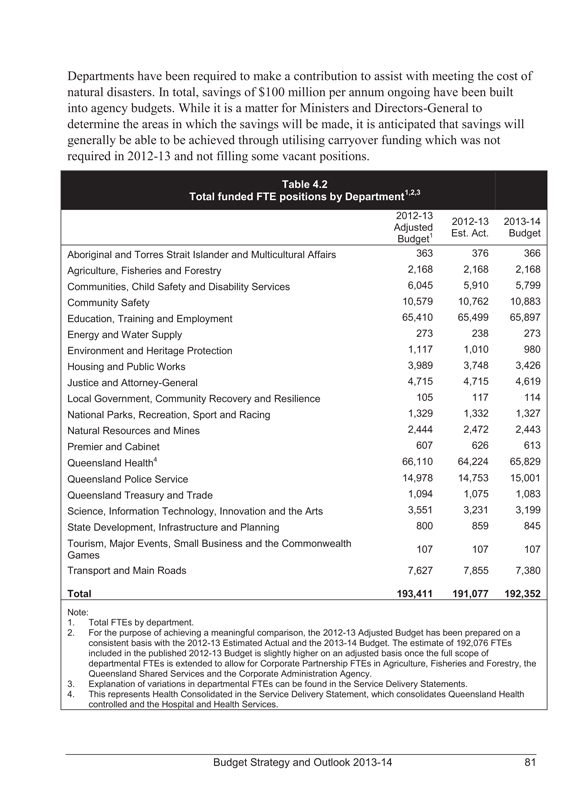
Departments have been required to make a contribution to assist with meeting the cost of natural disasters. In total, savings of $100 million per annum ongoing have been built into agency budgets. While it is a matter for Ministers and Directors-General to determine the areas in which the savings will be made, it is anticipated that savings will generally be able to be achieved through utilising carryover funding which was not required in 2012-13 and not filling some vacant positions.
Table 4.2
Total funded FTE positions by Department1,2,3
2012-13 Adjusted Budget1 2012-13 Est. Act. 2013-14 Budget
Aboriginal and Torres Strait Islander and Multicultural Affairs 363 376 366
Agriculture, Fisheries and Forestry 2,168 2,168 2,168
Communities, Child Safety and Disability Services 6,045 5,910 5,799
Community Safety 10,579 10,762 10,883
Education, Training and Employment 65,410 65,499 65,897
Energy and Water Supply 273 238 273
Environment and Heritage Protection 1,117 1,010 980
Housing and Public Works 3,989 3,748 3,426
Justice and Attorney-General 4,715 4,715 4,619
Local Government, Community Recovery and Resilience 105 117 114
National Parks, Recreation, Sport and Racing 1,329 1,332 1,327
Natural Resources and Mines 2,444 2,472 2,443
Premier and Cabinet 607 626 613
Queensland Health4 66,110 64,224 65,829
Queensland Police Service 14,978 14,753 15,001
Queensland Treasury and Trade 1,094 1,075 1,083
Science, Information Technology, Innovation and the Arts 3,551 3,231 3,199
State Development, Infrastructure and Planning 800 859 845
Tourism, Major Events, Small Business and the Commonwealth
Games 107 107 107
Transport and Main Roads 7,627 7,855 7,380
Total 193,411 191,077 192,352
Note:
1. Total FTEs by department.
2. For the purpose of achieving a meaningful comparison, the 2012-13 Adjusted Budget has been prepared on a consistent basis with the 2012-13 Estimated Actual and the 2013-14 Budget. The estimate of 192,076 FTEs included in the published 2012-13 Budget is slightly higher on an adjusted basis once the full scope of departmental FTEs is extended to allow for Corporate Partnership FTEs in Agriculture, Fisheries and Forestry, the Queensland Shared Services and the Corporate Administration Agency.
3. Explanation of variations in departmental FTEs can be found in the Service Delivery Statements.
4. This represents Health Consolidated in the Service Delivery Statement, which consolidates Queensland Health controlled and the Hospital and Health Services.
Budget Strategy and Outlook 2013-14 81
Table 4.2 shows the total funded FTE positions by department and is consistent with agency Service Delivery Statements.
Superannuation expenses
The superannuation interest cost represents the imputed interest on the Government’s accruing defined benefit superannuation liabilities.
In determining the State’s defined benefit superannuation liabilities, AASB 119 Employee Benefits requires the discounting of future benefit obligations using yield rates on government bonds net of investment tax. In 2011-12 yields fell to historical lows resulting in a significant increase in the present value of superannuation liabilities. The fall in discount rates contributed to a lower superannuation interest cost in 2012-13.
In 2013-14, superannuation interest costs are projected to increase by $123 million over the estimated actual to $879 million. This increase is in part due to a revision of AASB 119, which applies from 1 July 2013, requiring interest costs be imputed on a net liability approach and applying the discount rate to both the gross liability and superannuation plan assets. Prior to 2013-14, interest calculated on plan assets were calculated using the expected rate of return of 7.0% per annum.
Other superannuation expenses represent employer superannuation contributions to accumulation superannuation and the current service cost of the State’s defined benefit obligation (or the increase in the present value of the defined benefit obligation resulting from employee service in the current period).
Other operating expenses
Other operating expenses comprise the non-labour costs of providing goods and services, repairs and maintenance, consultancies, contractors, electricity, communications and marketing.
In 2012-13, other operating expenses are $385 million lower than the 2012-13 MYFER estimate mainly due to deferrals in Commonwealth-funded education programs and change in the timing of NDRRA expenses.
In 2013-14 other operating expenses are estimated to increase by $616 million over the 2012-13 estimated actual to $9.669 billion. Factors contributing to the growth in other operating expenses include:
• an increase in Queensland Health funding under the new Health and Hospital Services structure including expenditure to maintain and enhance the Queensland public health rostering and payroll system, revitalisation of regional, rural and remote health services and backlog maintenance
• growth in school expenditure, including growth in Commonwealth-funded education programs.
82 Budget Strategy and Outlook 2013-14
Depreciation and amortisation
Depreciation and amortisation expense is an estimate of the progressive consumption of the State’s assets through normal usage, wear and tear and obsolescence. Growth in this expense category primarily reflects asset revaluations and the size of the State’s capital program.
Other interest expenses
Other interest expenses include interest paid on borrowings to acquire capital assets and infrastructure such as roads and government buildings.
In 2013-14, the General Government sector has total debt servicing costs forecast at $2.163 billion, representing 4.5% of total expenses. This is $184 million lower than forecast in the 2012-13 MYFER due to the improved fiscal balance in 2012-13 and lower interest rates.
Grants expenses
Current grants include grants and subsidies to the community (such as schools, hospitals, benevolent institutions and local governments) and personal benefit payments. Funding includes support for non-government healthcare providers and organisations servicing the community in partnership with government in the family support, disability, youth and childcare sectors. Community service obligations (CSOs) are provided where PNFCs are required to provide non-commercial services or services at non-commercial prices for the benefit of the community (for further details refer Chapter 7).
Table 4.3 provides a break down of grants by category and recipient type.
Budget Strategy and Outlook 2013-14 83
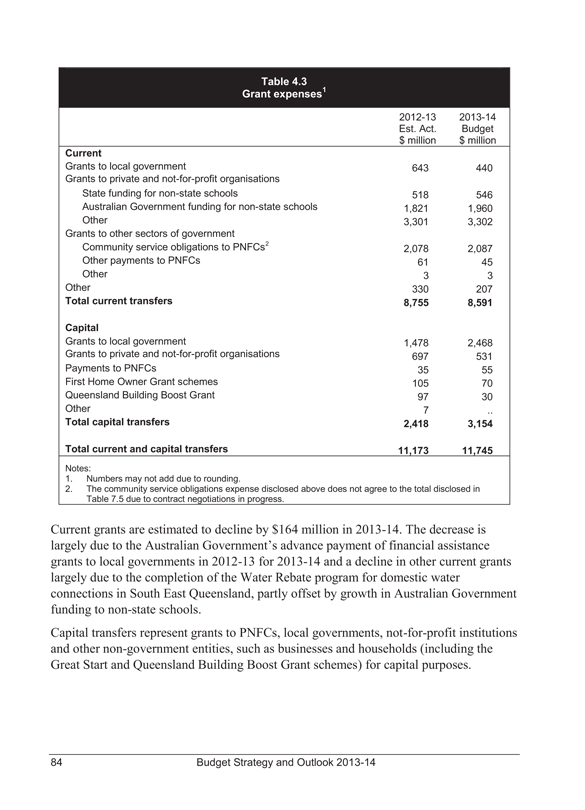
Table 4.3
Grant expenses1
2012-13 Est. Act. $ million 2013-14 Budget $ million
Current
Grants to local government 643 440
Grants to private and not-for-profit organisations
State funding for non-state schools 518 546
Australian Government funding for non-state schools 1,821 1,960
Other 3,301 3,302
Grants to other sectors of government
Community service obligations to PNFCs2 2,078 2,087
Other payments to PNFCs 61 45
Other 3 3
Other 330 207
Total current transfers 8,755 8,591
Capital
Grants to local government 1,478 2,468
Grants to private and not-for-profit organisations 697 531
Payments to PNFCs 35 55
First Home Owner Grant schemes 105 70
Queensland Building Boost Grant 97 30
Other 7 ..
Total capital transfers 2,418 3,154
Total current and capital transfers 11,173 11,745
Notes:
1. Numbers may not add due to rounding.
2. The community service obligations expense disclosed above does not agree to the total disclosed in Table 7.5 due to contract negotiations in progress.
Current grants are estimated to decline by $164 million in 2013-14. The decrease is largely due to the Australian Government’s advance payment of financial assistance grants to local governments in 2012-13 for 2013-14 and a decline in other current grants largely due to the completion of the Water Rebate program for domestic water connections in South East Queensland, partly offset by growth in Australian Government funding to non-state schools.
Capital transfers represent grants to PNFCs, local governments, not-for-profit institutions and other non-government entities, such as businesses and households (including the Great Start and Queensland Building Boost Grant schemes) for capital purposes.
84 Budget Strategy and Outlook 2013-14
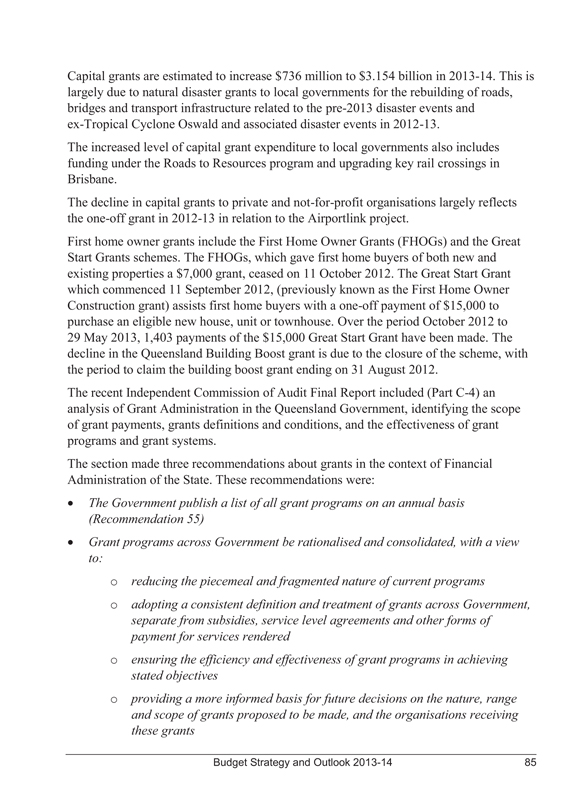
Capital grants are estimated to increase $736 million to $3.154 billion in 2013-14. This is largely due to natural disaster grants to local governments for the rebuilding of roads, bridges and transport infrastructure related to the pre-2013 disaster events and ex-Tropical Cyclone Oswald and associated disaster events in 2012-13.
The increased level of capital grant expenditure to local governments also includes funding under the Roads to Resources program and upgrading key rail crossings in Brisbane.
The decline in capital grants to private and not-for-profit organisations largely reflects the one-off grant in 2012-13 in relation to the Airportlink project.
First home owner grants include the First Home Owner Grants (FHOGs) and the Great Start Grants schemes. The FHOGs, which gave first home buyers of both new and existing properties a $7,000 grant, ceased on 11 October 2012. The Great Start Grant which commenced 11 September 2012, (previously known as the First Home Owner Construction grant) assists first home buyers with a one-off payment of $15,000 to purchase an eligible new house, unit or townhouse. Over the period October 2012 to 29 May 2013, 1,403 payments of the $15,000 Great Start Grant have been made. The decline in the Queensland Building Boost grant is due to the closure of the scheme, with the period to claim the building boost grant ending on 31 August 2012.
The recent Independent Commission of Audit Final Report included (Part C-4) an analysis of Grant Administration in the Queensland Government, identifying the scope of grant payments, grants definitions and conditions, and the effectiveness of grant programs and grant systems.
The section made three recommendations about grants in the context of Financial Administration of the State. These recommendations were:
The Government publish a list of all grant programs on an annual basis (Recommendation 55)
Grant programs across Government be rationalised and consolidated, with a view to:
o reducing the piecemeal and fragmented nature of current programs
o adopting a consistent definition and treatment of grants across Government, separate from subsidies, service level agreements and other forms of payment for services rendered
o ensuring the efficiency and effectiveness of grant programs in achieving stated objectives
o providing a more informed basis for future decisions on the nature, range and scope of grants proposed to be made, and the organisations receiving these grants
Budget Strategy and Outlook 2013-14 85
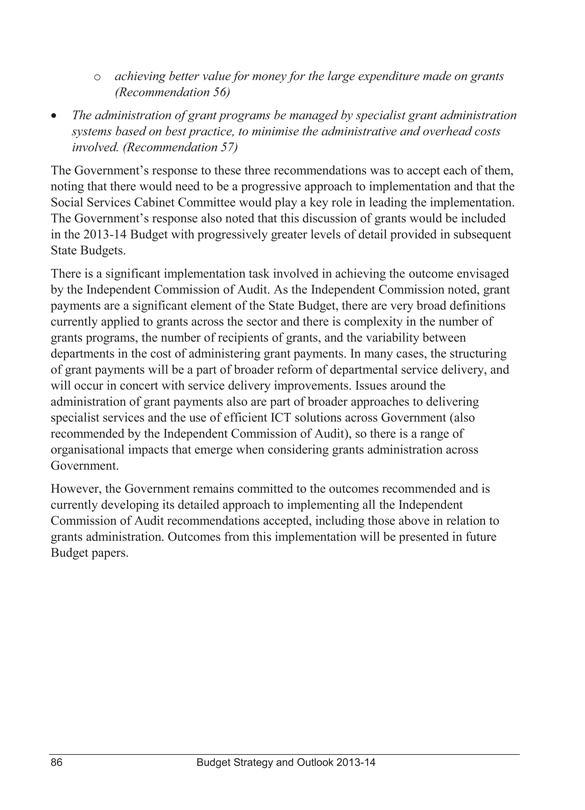
o achieving better value for money for the large expenditure made on grants (Recommendation 56)
The administration of grant programs be managed by specialist grant administration systems based on best practice, to minimise the administrative and overhead costs involved. (Recommendation 57)
The Government’s response to these three recommendations was to accept each of them, noting that there would need to be a progressive approach to implementation and that the Social Services Cabinet Committee would play a key role in leading the implementation. The Government’s response also noted that this discussion of grants would be included in the 2013-14 Budget with progressively greater levels of detail provided in subsequent State Budgets.
There is a significant implementation task involved in achieving the outcome envisaged by the Independent Commission of Audit. As the Independent Commission noted, grant payments are a significant element of the State Budget, there are very broad definitions currently applied to grants across the sector and there is complexity in the number of grants programs, the number of recipients of grants, and the variability between departments in the cost of administering grant payments. In many cases, the structuring of grant payments will be a part of broader reform of departmental service delivery, and will occur in concert with service delivery improvements. Issues around the administration of grant payments also are part of broader approaches to delivering specialist services and the use of efficient ICT solutions across Government (also recommended by the Independent Commission of Audit), so there is a range of organisational impacts that emerge when considering grants administration across Government.
However, the Government remains committed to the outcomes recommended and is currently developing its detailed approach to implementing all the Independent Commission of Audit recommendations accepted, including those above in relation to grants administration. Outcomes from this implementation will be presented in future Budget papers.
86 Budget Strategy and Outlook 2013-14
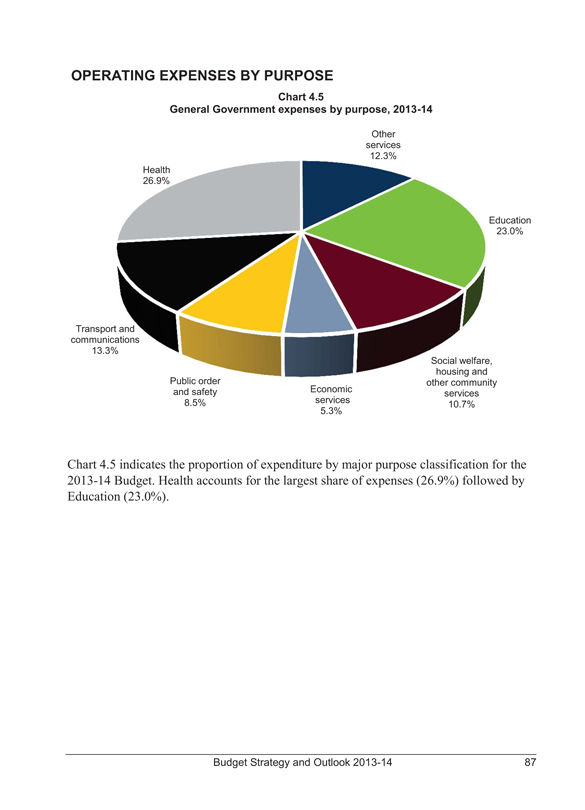
OPERATING EXPENSES BY PURPOSE
Chart 4.5
General Government expenses by purpose, 2013-14
Other services 12.3%
Health 26.9%
Education 23.0%
Transport and communications 13.3%
Public order and safety 8.5%
Economic services 5.3%
Social welfare, housing and other community services 10.7%
Chart 4.5 indicates the proportion of expenditure by major purpose classification for the 2013-14 Budget. Health accounts for the largest share of expenses (26.9%) followed by Education (23.0%).
Budget Strategy and Outlook 2013-14 87
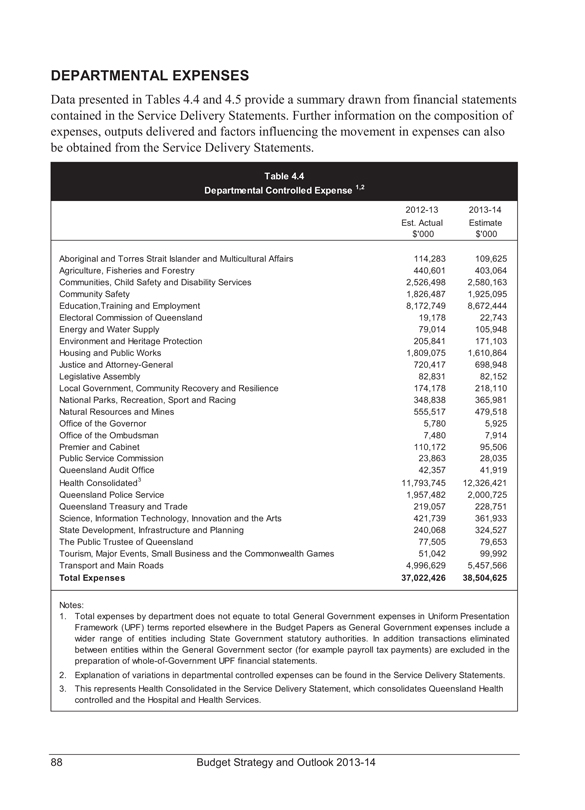
DEPARTMENTAL EXPENSES
Data presented in Tables 4.4 and 4.5 provide a summary drawn from financial statements contained in the Service Delivery Statements. Further information on the composition of expenses, outputs delivered and factors influencing the movement in expenses can also be obtained from the Service Delivery Statements.
Table 4.4
Departmental Controlled Expense 1,2
2012-13 Est. Actual $‘000 2013-14 Estimate $‘000
Aboriginal and Torres Strait Islander and Multicultural Affairs 114,283 109,625
Agriculture, Fisheries and Forestry 440,601 403,064
Communities, Child Safety and Disability Services 2,526,498 2,580,163
Community Safety 1,826,487 1,925,095
Education,Training and Employment 8,172,749 8,672,444
Electoral Commission of Queensland 19,178 22,743
Energy and Water Supply 79,014 105,948
Environment and Heritage Protection 205,841 171,103
Housing and Public Works 1,809,075 1,610,864
Justice and Attorney-General 720,417 698,948
Legislative Assembly 82,831 82,152
Local Government, Community Recovery and Resilience 174,178 218,110
National Parks, Recreation, Sport and Racing 348,838 365,981
Natural Resources and Mines 555,517 479,518
Office of the Governor 5,780 5,925
Office of the Ombudsman 7,480 7,914
Premier and Cabinet 110,172 95,506
Public Service Commission 23,863 28,035
Queensland Audit Office 42,357 41,919
Health Consolidated3 11,793,745 12,326,421
Queensland Police Service 1,957,482 2,000,725
Queensland Treasury and Trade 219,057 228,751
Science, Information Technology, Innovation and the Arts 421,739 361,933
State Development, Infrastructure and Planning 240,068 324,527
The Public Trustee of Queensland 77,505 79,653
Tourism, Major Events, Small Business and the Commonwealth Games 51,042 99,992
Transport and Main Roads 4,996,629 5,457,566
Total Expenses 37,022,426 38,504,625
Notes:
1. Total expenses by department does not equate to total General Government expenses in Uniform Presentation Framework (UPF) terms reported elsewhere in the Budget Papers as General Government expenses include a wider range of entities including State Government statutory authorities. In addition transactions eliminated between entities within the General Government sector (for example payroll tax payments) are excluded in the preparation of whole-of-Government UPF financial statements.
2. Explanation of variations in departmental controlled expenses can be found in the Service Delivery Statements.
3. This represents Health Consolidated in the Service Delivery Statement, which consolidates Queensland Health controlled and the Hospital and Health Services.
88 Budget Strategy and Outlook 2013-14
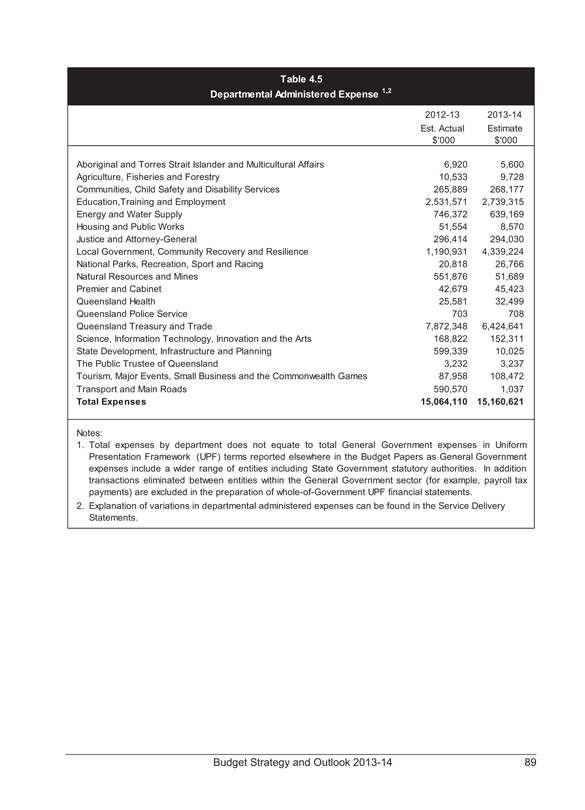
Table 4.5
Departmental Administered Expense 1,2
2012-13 Est. Actual $‘000 2013-14 Estimate $‘000
Aboriginal and Torres Strait Islander and Multicultural Affairs 6,920 5,600
Agriculture, Fisheries and Forestry 10,533 9,728
Communities, Child Safety and Disability Services 265,889 268,177
Education,Training and Employment 2,531,571 2,739,315
Energy and Water Supply 746,372 639,169
Housing and Public Works 51,554 8,570
Justice and Attorney-General 296,414 294,030
Local Government, Community Recovery and Resilience 1,190,931 4,339,224
National Parks, Recreation, Sport and Racing 20,818 26,766
Natural Resources and Mines 551,876 51,689
Premier and Cabinet 42,679 45,423
Queensland Health 25,581 32,499
Queensland Police Service 703 708
Queensland Treasury and Trade 7,872,348 6,424,641
Science, Information Technology, Innovation and the Arts 168,822 152,311
State Development, Infrastructure and Planning 599,339 10,025
The Public Trustee of Queensland 3,232 3,237
Tourism, Major Events, Small Business and the Commonwealth Games 87,958 108,472
Transport and Main Roads 590,570 1,037
Total Expenses 15,064,110 15,160,621
Notes:
1. Total expenses by department does not equate to total General Government expenses in Uniform Presentation Framework (UPF) terms reported elsewhere in the Budget Papers as General Government expenses include a wider range of entities including State Government statutory authorities. In addition transactions eliminated between entities within the General Government sector (for example, payroll tax payments) are excluded in the preparation of whole-of-Government UPF financial statements.
2. Explanation of variations in departmental administered expenses can be found in the Service Delivery Statements.
Budget Strategy and Outlook 2013-14 89
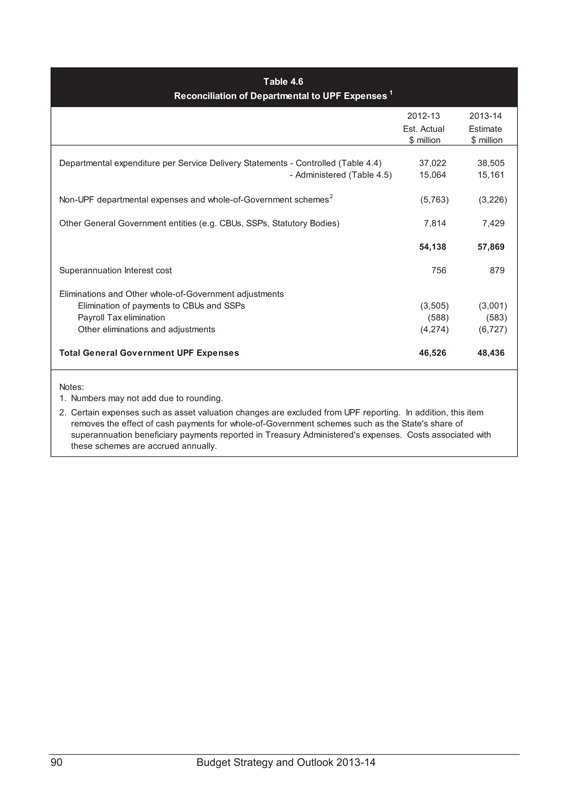
Table 4.6
Reconciliation of Departmental to UPF Expenses 1
2012-13 Est. Actual $ million 2013-14 Estimate $ million
Departmental expenditure per Service Delivery Statements - Controlled (Table 4.4) 37,022 38,505
- Administered (Table 4.5) 15,064 15,161
Non-UPF departmental expenses and whole-of-Government schemes2 (5,763) (3,226)
Other General Government entities (e.g. CBUs, SSPs, Statutory Bodies) 7,814 7,429
54,138 57,869
Superannuation Interest cost 756 879
Eliminations and Other whole-of-Government adjustments
Elimination of payments to CBUs and SSPs (3,505) (3,001)
Payroll Tax elimination (588) (583)
Other eliminations and adjustments (4,274) (6,727)
Total General Government UPF Expenses 46,526 48,436
Notes:
1. Numbers may not add due to rounding.
2. Certain expenses such as asset valuation changes are excluded from UPF reporting. In addition, this item removes the effect of cash payments for whole-of-Government schemes such as the State’s share of superannuation beneficiary payments reported in Treasury Administered’s expenses. Costs associated with these schemes are accrued annually.
90 Budget Strategy and Outlook 2013-14
5 BALANCE SHEET AND CASH FLOWS
FEATURES
• A key fiscal principle of the Queensland Government is to stabilise then significantly reduce debt. The Government has undertaken an extensive fiscal repair task which has resulted in borrowings stabilising at around $81 billion from 2015-16.
• Borrowings in 2015-16 are expected to be $81.1 billion, $8.7 billion less than the comparable estimates in the Independent Commission of Audit interim report and $1.4 billion less than forecast in the 2012-13 Mid Year Fiscal and Economic Review (MYFER).
• General Government capital purchases (Purchases of Non-financial Assets) of $7.1 billion in 2013-14 will be funded entirely by borrowings. However, due to government’s fiscal repair efforts, by 2015-16 General Government capital purchases of $4.4 billion will be funded entirely by operating cash flows.
• Net borrowing requirements improve significantly across the forward estimates, with gross borrowings in the General Government sector projected to stabilise at around $48 billion from 2014-15.
• The General Government sector is forecast to record a cash deficit of $7.5 billion in 2013-14, improving to a surplus of over $1 billion by 2015-16.
BACKGROUND
The balance sheet shows the projected assets, liabilities and net worth of the General Government sector as at 30 June each financial year. It is important for the Government to maintain a strong balance sheet to provide it with the stability, flexibility and capacity to deal with any emerging financial and economic pressures.
As identified by the Independent Commission of Audit, Queensland’s balance sheet has significantly deteriorated in recent years, culminating in the loss of Queensland’s AAA credit rating in 2009. The Independent Commission found that this deterioration was the result of a lack of fiscal discipline, particularly in the General Government sector.
Following the Independent Commission’s Interim Report, the Government implemented measures to immediately and significantly repair Queensland’s fiscal position. As outlined in previous chapters, the Government’s task of fiscal repair is continuing and has already led to substantial improvements in Queensland’s fiscal position.
Budget Strategy and Outlook 2013-14 91
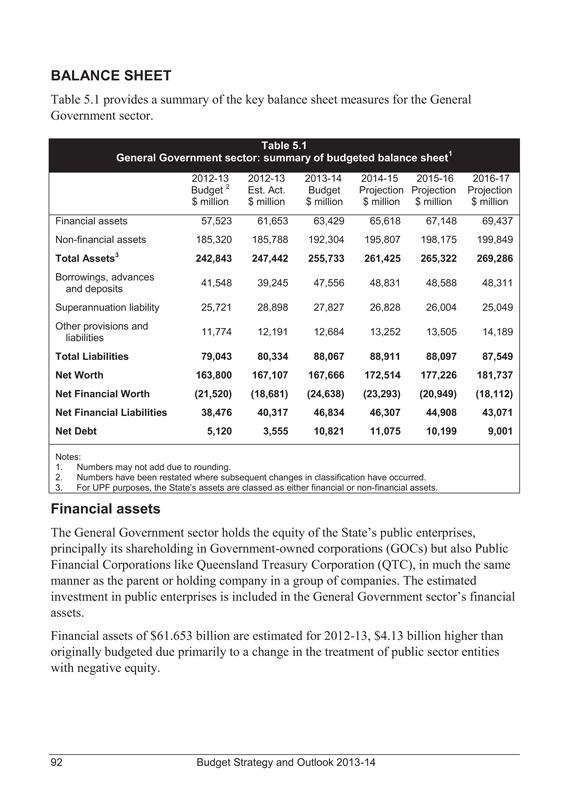
BALANCE SHEET
Table 5.1 provides a summary of the key balance sheet measures for the General Government sector.
Table 5.1
General Government sector: summary of budgeted balance sheet1
2012-13 Budget 2 $ million 2012-13 Est. Act. $ million 2013-14 Budget $ million 2014-15 Projection $ million 2015-16 Projection $ million 2016-17 Projection $ million
Financial assets 57,523 61,653 63,429 65,618 67,148 69,437
Non-financial assets 185,320 185,788 192,304 195,807 198,175 199,849
Total Assets3 242,843 247,442 255,733 261,425 265,322 269,286
Borrowings, advances and deposits 41,548 39,245 47,556 48,831 48,588 48,311
Superannuation liability 25,721 28,898 27,827 26,828 26,004 25,049
Other provisions and liabilities 11,774 12,191 12,684 13,252 13,505 14,189
Total Liabilities 79,043 80,334 88,067 88,911 88,097 87,549
Net Worth 163,800 167,107 167,666 172,514 177,226 181,737
Net Financial Worth (21,520) (18,681) (24,638) (23,293) (20,949) (18,112)
Net Financial Liabilities 38,476 40,317 46,834 46,307 44,908 43,071
Net Debt 5,120 3,555 10,821 11,075 10,199 9,001
Notes:
1. Numbers may not add due to rounding.
2. Numbers have been restated where subsequent changes in classification have occurred.
3. For UPF purposes, the State’s assets are classed as either financial or non-financial assets.
Financial assets
The General Government sector holds the equity of the State’s public enterprises, principally its shareholding in Government-owned corporations (GOCs) but also Public Financial Corporations like Queensland Treasury Corporation (QTC), in much the same manner as the parent or holding company in a group of companies. The estimated investment in public enterprises is included in the General Government sector’s financial assets.
Financial assets of $61.653 billion are estimated for 2012-13, $4.13 billion higher than originally budgeted due primarily to a change in the treatment of public sector entities with negative equity.
92 Budget Strategy and Outlook 2013-14
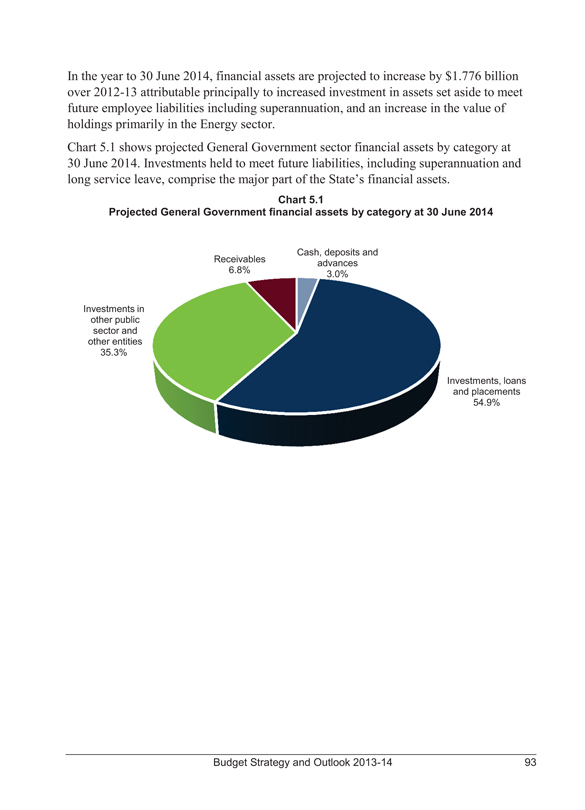
In the year to 30 June 2014, financial assets are projected to increase by $1.776 billion over 2012-13 attributable principally to increased investment in assets set aside to meet future employee liabilities including superannuation, and an increase in the value of holdings primarily in the Energy sector.
Chart 5.1 shows projected General Government sector financial assets by category at 30 June 2014. Investments held to meet future liabilities, including superannuation and long service leave, comprise the major part of the State’s financial assets.
Chart 5.1
Projected General Government financial assets by category at 30 June 2014
Receivables 6.8%
Cash, deposits and advances 3.0%
Investments in other public sector and other entities 35.3%
Investments, loans and placements 54.9%
Budget Strategy and Outlook 2013-14 93
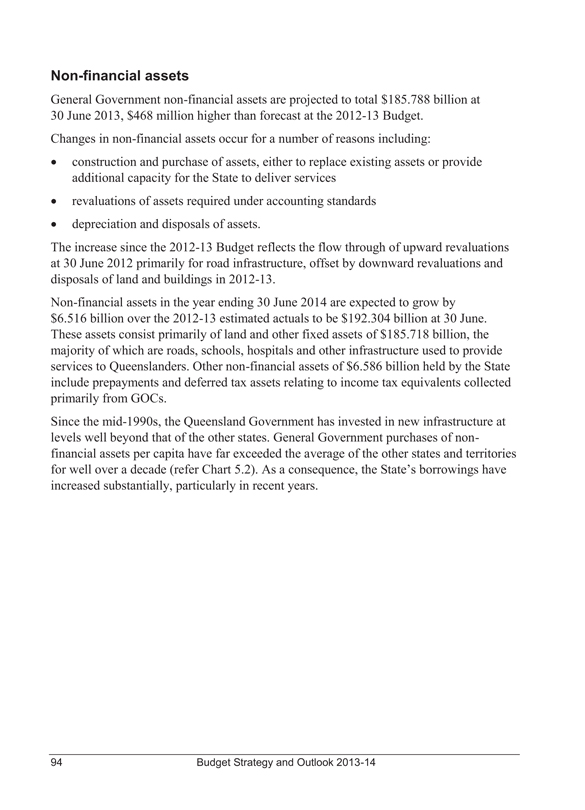
Non-financial assets
General Government non-financial assets are projected to total $185.788 billion at 30 June 2013, $468 million higher than forecast at the 2012-13 Budget.
Changes in non-financial assets occur for a number of reasons including:
• construction and purchase of assets, either to replace existing assets or provide additional capacity for the State to deliver services
• revaluations of assets required under accounting standards
• depreciation and disposals of assets.
The increase since the 2012-13 Budget reflects the flow through of upward revaluations at 30 June 2012 primarily for road infrastructure, offset by downward revaluations and disposals of land and buildings in 2012-13.
Non-financial assets in the year ending 30 June 2014 are expected to grow by $6.516 billion over the 2012-13 estimated actuals to be $192.304 billion at 30 June. These assets consist primarily of land and other fixed assets of $185.718 billion, the majority of which are roads, schools, hospitals and other infrastructure used to provide services to Queenslanders. Other non-financial assets of $6.586 billion held by the State include prepayments and deferred tax assets relating to income tax equivalents collected primarily from GOCs.
Since the mid-1990s, the Queensland Government has invested in new infrastructure at levels well beyond that of the other states. General Government purchases of non-financial assets per capita have far exceeded the average of the other states and territories for well over a decade (refer Chart 5.2). As a consequence, the State’s borrowings have increased substantially, particularly in recent years.
94 Budget Strategy and Outlook 2013-14
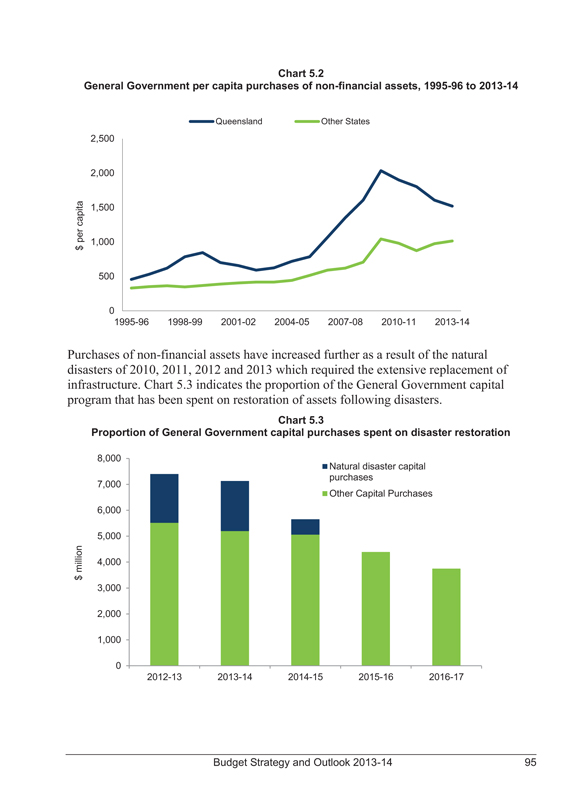
Chart 5.2
General Government per capita purchases of non-financial assets, 1995-96 to 2013-14
Queensland Other States
$ per capita
2,500 2,000 1,500 1,000 500 0
1995-96 1998-99 2001-02 2004-05 2007-08 2010-11 2013-14
Purchases of non-financial assets have increased further as a result of the natural disasters of 2010, 2011, 2012 and 2013 which required the extensive replacement of infrastructure. Chart 5.3 indicates the proportion of the General Government capital program that has been spent on restoration of assets following disasters.
Chart 5.3
Proportion of General Government capital purchases spent on disaster restoration
Natural disaster capital purchases
Other Capital Purchases
$ million
8,000 7,000 6,000 5,000 4,000 3,000 2,000 1,000 0
2012-13 2013-14 2014-15 2015-16 2016-17
Budget Strategy and Outlook 2013-14 95
Purchases of non-financial assets for the General Government sector are forecast to reduce from $7.397 billion in 2012-13 to just under $4 billion in 2016-17.
This reduction in capital spending is to be expected following a prolonged period of elevated capital spending (i.e. the infrastructure does not need to be rebuilt), reduced spending on disaster restoration and is in keeping with the Government’s fiscal repair objectives.
Liabilities
General Government Sector
General Government liabilities of $80.334 billion in 2012-13 are $1.291 billion higher than budgeted. This is primarily the result of an increase in forecast superannuation liabilities due to the impact of historically low bond yields on the actuarially assessed superannuation liability, partially offset by a decrease in forecast borrowings as a result of an improved fiscal balance in 2012-13.
Total liabilities in the General Government in 2013-14 are budgeted to increase from 2012-13 by $7.733 billion. This is primarily to support the capital program in 2013-14 of $7.13 billion.
Liabilities relating to employee entitlements (principally superannuation and long service leave) are projected to total $33.766 billion at 30 June 2014, a 2.2% decrease on the 2012-13 estimated actual. The State’s superannuation liability can be seen to decline over the forward estimates primarily as a result of the defined benefit fund being closed to new entrants from 2009. In addition, as interest rates return to more normal levels it is expected that their negative impact on superannuation liabilities will start to reverse.
General Government borrowings of $47.196 billion are forecast for 2013-14, an increase of $8.332 billion over 2012-13. This increase primarily reflects capital purchases of $7.13 billion, equity injections to Public Non-financial Corporations of $77 million and an operating cash deficit of $669 million.
The level of General Government borrowings stabilises at around $48 billion from 2014-15, primarily as a result of the Government’s savings and revenue measures. Stabilisation of debt is a crucial first step towards the Government’s aim of restoring the AAA credit rating.
Over the Budget and forward estimates period, total General Government net borrowings of $8.74 billion and positive operating cash flows of $14.754 billion are planned to fund the $20.928 billion worth of capital projects in the General Government sector and $603 million worth of equity injections to the Public Non-financial Corporations sector.
The remainder of the liabilities balance consists of payables and other liabilities such as unearned revenue and provisions.
The composition of the General Government sector’s liabilities is illustrated in Chart 5.4.
96 Budget Strategy and Outlook 2013-14
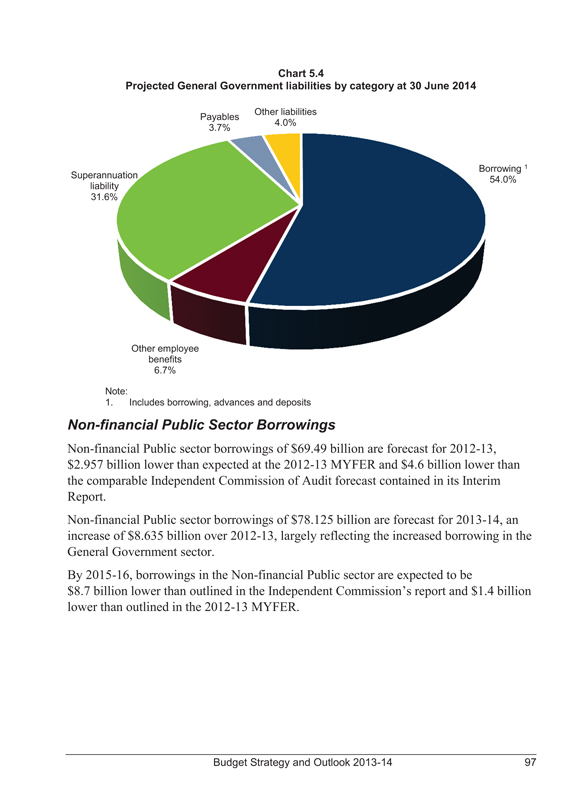
Chart 5.4
Projected General Government liabilities by category at 30 June 2014
Payables 3.7%
Other liabilities 4.0%
Superannuation liability 31.6%
Borrowing 1 54.0%
Other employee benefits 6.7%
Note:
1. Includes borrowing, advances and deposits
Non-financial Public Sector Borrowings
Non-financial Public sector borrowings of $69.49 billion are forecast for 2012-13, $2.957 billion lower than expected at the 2012-13 MYFER and $4.6 billion lower than the comparable Independent Commission of Audit forecast contained in its Interim Report.
Non-financial Public sector borrowings of $78.125 billion are forecast for 2013-14, an increase of $8.635 billion over 2012-13, largely reflecting the increased borrowing in the General Government sector.
By 2015-16, borrowings in the Non-financial Public sector are expected to be $8.7 billion lower than outlined in the Independent Commission’s report and $1.4 billion lower than outlined in the 2012-13 MYFER.
Budget Strategy and Outlook 2013-14 97
As shown in Chart 1.2 (in Chapter 1), Non-financial Public sector borrowing is lower in each year of the forward estimates compared to the 2012-13 MYFER. This is primarily driven by lower borrowings in the Public Non-financial Corporations sector largely as a result of reforms to the water entities. In particular, Seqwater (resulting from the merger of several entities) has substantially improved its operating position across the forward estimates resulting in significantly lower borrowings.
As can also be seen in Chart 1.2, borrowings stabilise at around $81 billion from 2015-16, an important first step in regaining a AAA credit rating.
A number of small sales in 2012-13 have also assisted in reducing debt.
Following the initial public offering of QR National (now known as Aurizon) in November 2010, the State retained approximately 34% of the issued shares in the company. The share value at the initial public offering was $2.55.
By the end of November 2012, the Queensland Government sold over 430 million shares in Aurizon at a price of $3.47 through a selective buyback and cornerstone placement raising $1.5 billion. A further sale of 200 million shares at $4.03 in March 2013 brought total proceeds on sale to $2.3 billion. These proceeds have allowed the Government to repay the full amount of debt associated with the shares ($2.3 billion). Further, the sale prices achieved through both tranches have exceeded the assumptions used in the 2012-13 Budget and MYFER of $3.40 a share (based on the closing market price at 30 June 2012).
Proceeds from the sale of the remaining 189.2 million shares will depend upon the share price received, with the proceeds used to further reduce debt.
On 30 April 2013, sale proceeds of $527 million were received from the sale and leaseback of seven office buildings in the Brisbane CBD. These proceeds have also been used to pay down whole-of-Government debt.
The Government considers the Non-financial Public sector debt to revenue ratio to be an important indicator, consistent with its fiscal principle of stabilising debt (refer Chart 1.4 in Chapter 1). Consistent with the practice of ratings agencies, less emphasis is now placed on the net financial liabilities to revenue ratio, which incorporates the volatile superannuation liability.
98 Budget Strategy and Outlook 2013-14
Net financial worth
The net financial worth measure is an indicator of financial strength. Net financial worth is defined as financial assets less all existing and accruing liabilities. Financial assets include cash and deposits, advances, financial investments, loans, receivables and equity in public enterprises.
The net financial worth measure is broader than the alternative measure - net debt - which measures only cash, advances and investments on the assets side and borrowings and advances on the liabilities side.
The net financial worth of the General Government sector for 2013-14 is forecast at negative $24.638 billion. The decrease in net financial worth from 2012-13 to 2013-14 ($5.957 billion) is primarily the result of the increase in borrowings partially offset by increases in investments, loans and placements and equity in public enterprises.
Net financial worth is expected to stabilise and improve over the forward estimates period as borrowings stabilise as a consequence of the Government’s fiscal repair efforts and as financial assets continue to grow.
Net financial liabilities
Net financial liabilities are total liabilities less financial assets, other than equity investments in other public sector entities. This measure is broader than net debt as it includes significant liabilities, other than borrowings (for example, accrued employee liabilities such as superannuation and long service leave entitlements).
The net financial liabilities of the General Government sector for 2013-14 are forecast at $46.834 billion, $6.517 billion higher than 2012-13 which largely reflects additional borrowings in support of the capital program.
Net financial liabilities decrease after 2013-14 as borrowings stabilise and financial assets continue to grow.
Net worth
The net worth, or equity, of the State is the amount by which the State’s assets exceed its liabilities. This is the value of the investment held on behalf of the people of Queensland by public sector instrumentalities.
Changes in the State’s net worth occur for a number of reasons including:
• operating surpluses (deficits) that increase (decrease) the Government’s equity
• revaluation of assets and liabilities as required by accounting standards. For example, the Government’s accruing liabilities for employee superannuation and long service leave are determined by actuarial assessments
Budget Strategy and Outlook 2013-14 99
• movements in the net worth of the State’s investments in the Public Non-financial
Corporations and Public Financial Corporations sectors
• gains or losses on disposal of assets. Government agencies routinely buy and sell assets. Where the selling price of an asset is greater (less) than its value in an agency’s accounts, the resultant profit (loss) affects net worth.
The net worth of the General Government sector in 2012-13 is forecast to be $167.107 billion. This is $3.307 billion more than forecast in the 2012-13 Budget primarily due to a change in treatment of investments in public sector entities with negative equity.
From 2013-14, net worth is projected to steadily increase mainly as a result of the improved fiscal balance position and growth in assets.
Net debt
Net debt is the sum of advances received and borrowings less cash and deposits, advances paid and investments, loans and placements.
Queensland maintains a strong net debt position due, in part, to the way it has structured its financial investments held to cover long term liabilities i.e. because the net debt measure includes assets held to cover long term liabilities. These financial investments are quarantined to cover primarily the superannuation obligations of Government.
Net debt for the General Government sector in 2012-13 is forecast to be $3.555 billion, $1.565 billion less than forecast in the 2012-13 Budget. Net debt will increase to
$10.821 billion in 2013-14 as a result of increased borrowings in that year and is then projected to stabilise and then steadily decrease to a projected $9.001 billion in 2016-17.
CASH FLOWS
The cash flow statement provides information on the Government’s estimated cash flows from its operating, financing and investing activities.
The cash flow statement records estimated cash payments and cash receipts and hence differs from accrued revenue and expenditure recorded in the operating statement. In particular, the operating statement records certain revenues and expenses that do not have an associated cash flow (for example, depreciation expense). The timing of recognition of accrued revenues or expenses in the operating statement may differ from the actual cash disbursement or receipt (for example, tax equivalents). A reconciliation between the cash flows from operations and the operating statement is provided in Table 5.2.
The cash flow statement also records cash flows associated with investing and financing activities that are otherwise reflected in the balance sheet. For example, purchases of capital equipment are recorded in the cash flow statement and impact on the balance sheet through an increase in physical assets.
The cash flow statement provides the cash surplus (deficit) measure which is comprised of the net cash flow from operating activities plus the net cash flow from investment in non-financial assets (or physical capital).
The Australian Bureau of Statistics Government Finance Statistics (GFS) surplus (deficit) is derived by including the initial increase in liability at the inception of finance leases in the cash surplus (deficit). This measure is also used to derive the Loan Council Allocation nomination, provided in Chapter 8.
The General Government cash deficit of $9.843 billion in 2012-13 is $833 million lower than that forecast at the time of the 2012-13 Budget and $1.471 billion lower than the 2012-13 MYFER. This is largely due to the improved operating position and the sale and leaseback of seven government buildings to QIC Limited.
A cash deficit of $7.469 billion is forecast in 2013-14 for the General Government sector, with the cash deficit forecast to decline significantly over the forward estimates, returning to a surplus in 2015-16.
The major factors contributing to the improved forecast cash position are improved net inflows from operating activities as a result of Government’s efforts in relation to the fiscal repair task and savings in the capital program partially as a result of the reduced Natural Disaster Relief and Recovery Arrangements requirement from 2015-16 as well as tighter expenditure management by Government.
Total General Government capital purchases of $7.13 billion are budgeted for 2013-14 and, over the period 2013-14 to 2016-17, capital expenditure is expected to total $20.928 billion in the General Government sector.
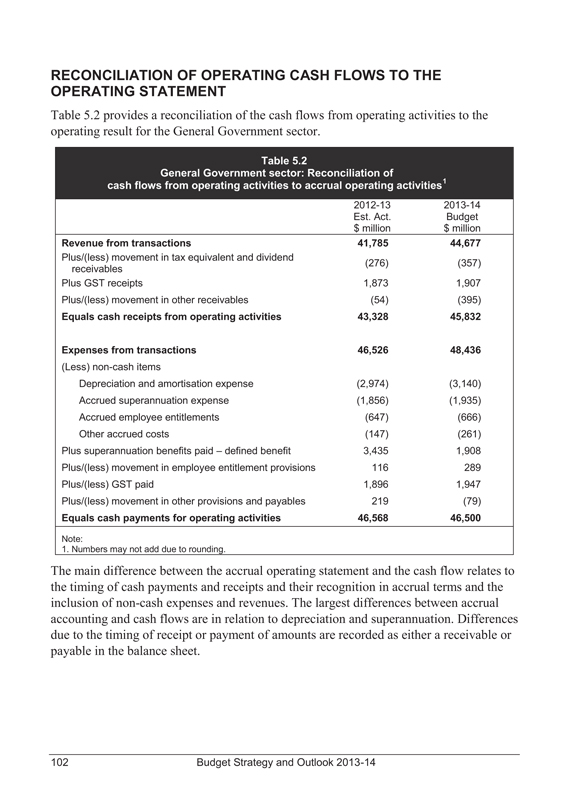
RECONCILIATION OF OPERATING CASH FLOWS TO THE OPERATING STATEMENT
Table 5.2 provides a reconciliation of the cash flows from operating activities to the operating result for the General Government sector.
Table 5.2
General Government sector: Reconciliation of
cash flows from operating activities to accrual operating activities1
2012-13 2013-14
Est. Act. Budget
$ million $ million
Revenue from transactions 41,785 44,677
Plus/(less) movement in tax equivalent and dividend receivables (276) (357)
Plus GST receipts 1,873 1,907
Plus/(less) movement in other receivables (54) (395)
Equals cash receipts from operating activities 43,328 45,832
Expenses from transactions 46,526 48,436
(Less) non-cash items
Depreciation and amortisation expense (2,974) (3,140)
Accrued superannuation expense (1,856) (1,935)
Accrued employee entitlements (647) (666)
Other accrued costs (147) (261)
Plus superannuation benefits paid – defined benefit 3,435 1,908
Plus/(less) movement in employee entitlement provisions 116 289
Plus/(less) GST paid 1,896 1,947
Plus/(less) movement in other provisions and payables 219 (79)
Equals cash payments for operating activities 46,568 46,500
Note:
1. Numbers may not add due to rounding.
The main difference between the accrual operating statement and the cash flow relates to the timing of cash payments and receipts and their recognition in accrual terms and the inclusion of non-cash expenses and revenues. The largest differences between accrual accounting and cash flows are in relation to depreciation and superannuation. Differences due to the timing of receipt or payment of amounts are recorded as either a receivable or payable in the balance sheet.
6 INTER-GOVERNMENTAL FINANCIAL RELATIONS
FEATURES
• The Australian Government Budget, released on 14 May 2013, made a number of assumptions in relation to funding agreements for education and infrastructure that are still under consideration by the Queensland Government.
• Total GST revenue to all states is expected to be $50.250 billion in 2013-14, an increase of $2.55 billion or 5.3%. Since the 2012-13 Commonwealth Budget, the estimate of total GST revenue for 2013-14 has been revised down by $650 million. The growth of the GST pool has slowed substantially since 2007-08, reinforcing the need to protect the GST base.
• Estimated Australian Government funding in 2013-14 for Queensland included in the 2013-14 Queensland Budget is $19.530 billion. Queensland is estimated to receive $8.473 billion in payments for specific purposes, with $3.647 billion as National Specific Purpose Payments, $2.831 billion as National Health Reform funding and $1.995 billion as National Partnership Payments.
• The National Partnership (NP) model envisaged in the Intergovernmental Agreement on Federal Financial Relations poses policy and financial risks for Queensland. The uncertainty of ongoing Australian Government funding for expiring NPs which have raised service delivery levels poses a significant risk of cost shifting to Queensland. NPs that include input controls such as matched funding deliberately confuse roles and responsibilities by giving the Australian Government greater control over state funding and policy directions.
• Queensland is estimated to receive $10.741 billion of GST revenue in 2013-14, $608 million more than its population share. This is $453 million less than estimated in the 2012-13 Commonwealth Budget.
• The Australian Government’s GST Distribution Review final report, released in November 2012, proposed changes to the current horizontal fiscal equalisation arrangements, and the consideration by the Commonwealth Grants Commission (CGC) of issues in a future methodology review. Queensland welcomes many elements of the long term vision for federal financial relations articulated in the report.
• Federal and State Treasurers have agreed that the CGC would commence a methodology review this year, to be completed by 2015. A major issue for the Queensland Government will be reform of the mining revenue assessment, including full recognition of the expenses incurred by the State in the development and operation of the mining industry.
FEDERAL FINANCIAL ARRANGEMENTS
The Australian Government Budget, released on 14 May 2013, made a number of assumptions in relation to funding agreements for education and infrastructure that are still under consideration by the Queensland Government. National aggregates and interstate comparisons in this chapter will use Australian Government estimates for consistency. Queensland specific figures will be consistent with Queensland Budget estimates, which exclude the proposed funding for the National Education Reform Agreement and some large infrastructure projects such as Cross River Rail and the Gateway Upgrade North.
Federal financial relations in Australia are characterised by a disparity between the revenue raising capacity and the expenditure responsibilities of the federal and state governments. The Australian Government collects the major share of taxation revenues and states and territories (states) must rely on grants from the Australian Government to meet their expenditure requirements. These grants represent approximately 44.7% of all states’ revenues in 2013-14, up from 44.3% in 2012-13, based on the Australian Government Budget estimates.
This high degree of mismatch is known as vertical fiscal imbalance (VFI) and arises from a number of factors. These include:
• the Australian Constitution, which precludes states from levying customs duty or excise duty, or introducing taxes based on the value of goods produced – for example, a consumption or retail tax
• restrictions imposed by the Australian Government, particularly on the states’ levying of income tax. While the Constitution permits states to levy income tax, High Court decisions effectively allow the Australian Government to nullify this power
• agreements with the Australian Government, which prevent reinstatement of taxes that were abolished under the arrangements associated with the introduction of the GST. These include a number of duties and financial taxes, such as debits tax.
National tax reform and other changes since 2000 have led to an increase in VFI. Chart 6.1 shows that while the states received 35% of their revenues from the Australian Government in 1999-2000, this is forecast to increase to 44.7% in 2013-14. In contrast, the proportion of the states’ General Government revenues from state taxes has declined from 39.8% in 1999-2000 to 31.7% in 2013-14.
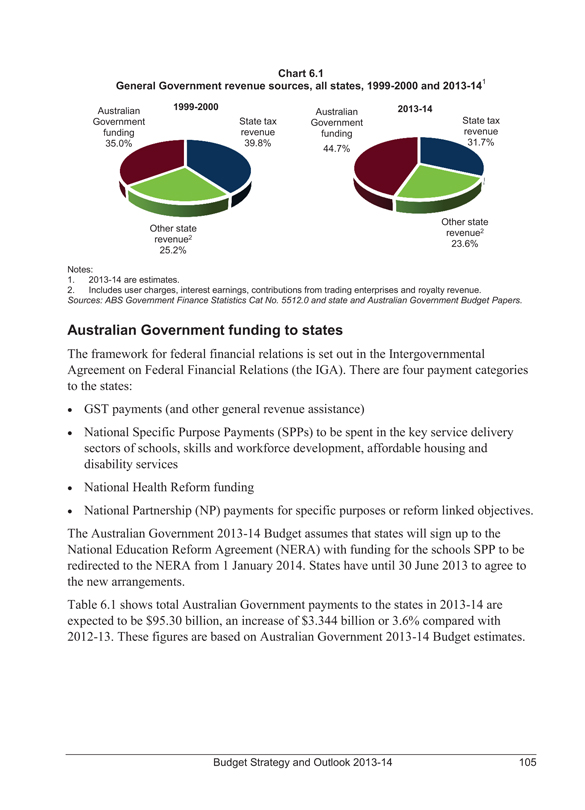
Chart 6.1
General Government revenue sources, all states, 1999-2000 and 2013-141
| | | | | | | | | | |
Australian Government funding 35.0% | | 1999-2000 | | State tax revenue 39.8% | | Australian Government funding 44.7% | | 2013-14 | | State tax revenue 31.7% |
Other state revenue2 25.2% | | | | | | | | | | Other state revenue2 23.6% |
Notes:
1. 2013-14 are estimates.
2. Includes user charges, interest earnings, contributions from trading enterprises and royalty revenue.
Sources: ABS Government Finance Statistics Cat No. 5512.0 and state and Australian Government Budget Papers.
Australian Government funding to states
The framework for federal financial relations is set out in the Intergovernmental Agreement on Federal Financial Relations (the IGA). There are four payment categories to the states:
• GST payments (and other general revenue assistance)
• National Specific Purpose Payments (SPPs) to be spent in the key service delivery sectors of schools, skills and workforce development, affordable housing and disability services
• National Health Reform funding
• National Partnership (NP) payments for specific purposes or reform linked objectives.
The Australian Government 2013-14 Budget assumes that states will sign up to the National Education Reform Agreement (NERA) with funding for the schools SPP to be redirected to the NERA from 1 January 2014. States have until 30 June 2013 to agree to the new arrangements.
Table 6.1 shows total Australian Government payments to the states in 2013-14 are expected to be $95.30 billion, an increase of $3.344 billion or 3.6% compared with 2012-13. These figures are based on Australian Government 2013-14 Budget estimates.
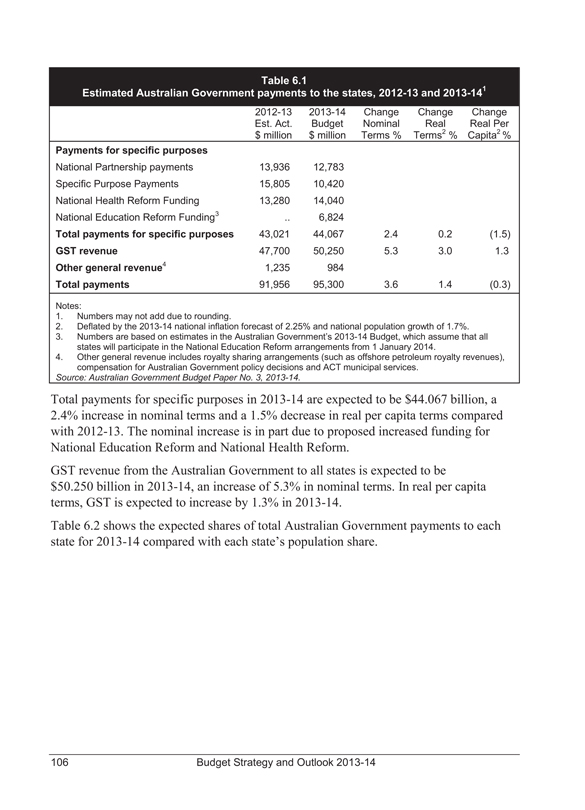
Table 6.1
Estimated Australian Government payments to the states, 2012-13 and 2013-141
| | | | | | | | | | |
| | | 2012-13 | | 2013-14 | | Change | | Change | | Change |
| | | Est. Act. | | Budget | | Nominal | | Real | | Real Per |
| | | $ million | | $ million | | Terms % | | Terms2 % | | Capita2 % |
Payments for specific purposes | | | | | | | | | | |
National Partnership payments | | 13,936 | | 12,783 | | | | | | |
Specific Purpose Payments | | 15,805 | | 10,420 | | | | | | |
National Health Reform Funding | | 13,280 | | 14,040 | | | | | | |
National Education Reform Funding3 | | .. | | 6,824 | | | | | | |
Total payments for specific purposes | | 43,021 | | 44,067 | | 2.4 | | 0.2 | | (1.5) |
GST revenue | | 47,700 | | 50,250 | | 5.3 | | 3.0 | | 1.3 |
Other general revenue4 | | 1,235 | | 984 | | | | | | |
Total payments | | 91,956 | | 95,300 | | 3.6 | | 1.4 | | (0.3) |
Notes:
1. Numbers may not add due to rounding.
2. Deflated by the 2013-14 national inflation forecast of 2.25% and national population growth of 1.7%.
3. Numbers are based on estimates in the Australian Government’s 2013-14 Budget, which assume that all
states will participate in the National Education Reform arrangements from 1 January 2014.
4. Other general revenue includes royalty sharing arrangements (such as offshore petroleum royalty revenues),
compensation for Australian Government policy decisions and ACT municipal services.
Source: Australian Government Budget Paper No. 3, 2013-14.
Total payments for specific purposes in 2013-14 are expected to be $44.067 billion, a 2.4% increase in nominal terms and a 1.5% decrease in real per capita terms compared with 2012-13. The nominal increase is in part due to proposed increased funding for National Education Reform and National Health Reform.
GST revenue from the Australian Government to all states is expected to be
$50.250 billion in 2013-14, an increase of 5.3% in nominal terms. In real per capita terms, GST is expected to increase by 1.3% in 2013-14.
Table 6.2 shows the expected shares of total Australian Government payments to each state for 2013-14 compared with each state’s population share.
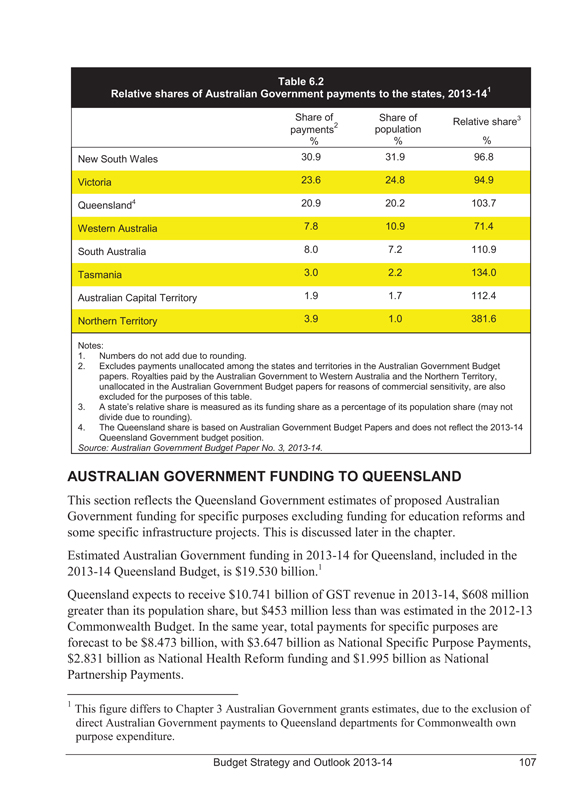
Table 6.2
Relative shares of Australian Government payments to the states, 2013-141
| | | | | | |
| | | Share of payments2 % | | Share of population % | | Relative share3 % |
New South Wales | | 30.9 | | 31.9 | | 96.8 |
Victoria | | 23.6 | | 24.8 | | 94.9 |
Queensland4 | | 20.9 | | 20.2 | | 103.7 |
Western Australia | | 7.8 | | 10.9 | | 71.4 |
South Australia | | 8.0 | | 7.2 | | 110.9 |
Tasmania | | 3.0 | | 2.2 | | 134.0 |
Australian Capital Territory | | 1.9 | | 1.7 | | 112.4 |
Northern Territory | | 3.9 | | 1.0 | | 381.6 |
Notes:
1. Numbers do not add due to rounding.
2. Excludes payments unallocated among the states and territories in the Australian Government Budget papers. Royalties paid by the Australian Government to Western Australia and the Northern Territory, unallocated in the Australian Government Budget papers for reasons of commercial sensitivity, are also excluded for the purposes of this table.
3. A state’s relative share is measured as its funding share as a percentage of its population share (may not divide due to rounding).
4. The Queensland share is based on Australian Government Budget Papers and does not reflect the 2013-14 Queensland Government budget position.
Source: Australian Government Budget Paper No. 3, 2013-14.
AUSTRALIAN GOVERNMENT FUNDING TO QUEENSLAND
This section reflects the Queensland Government estimates of proposed Australian Government funding for specific purposes excluding funding for education reforms and some specific infrastructure projects. This is discussed later in the chapter.
Estimated Australian Government funding in 2013-14 for Queensland, included in the 2013-14 Queensland Budget, is $19.530 billion.1 Queensland expects to receive $10.741 billion of GST revenue in 2013-14, $608 million greater than its population share, but $453 million less than was estimated in the 2012-13 Commonwealth Budget. In the same year, total payments for specific purposes are forecast to be $8.473 billion, with $3.647 billion as National Specific Purpose Payments, $2.831 billion as National Health Reform funding and $1.995 billion as National Partnership Payments.
1
This figure differs to Chapter 3 Australian Government grants estimates, due to the exclusion of direct Australian Government payments to Queensland departments for Commonwealth own purpose expenditure.
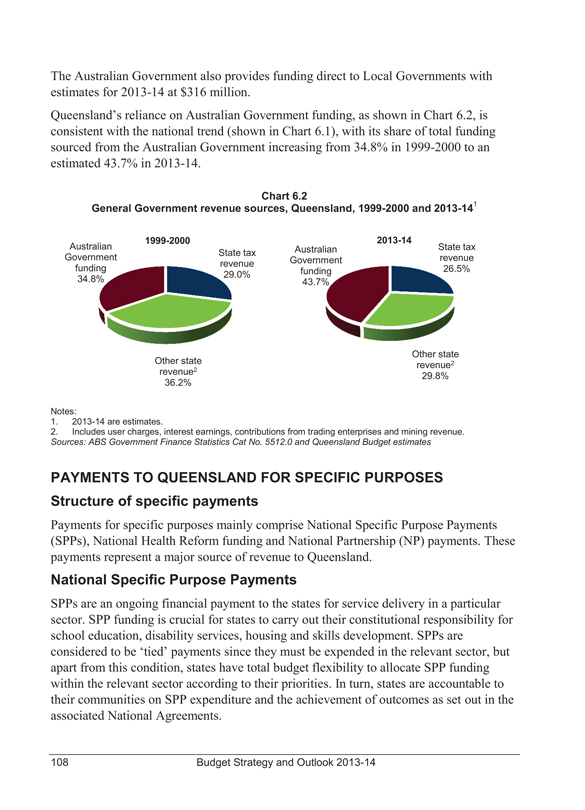
The Australian Government also provides funding direct to Local Governments with estimates for 2013-14 at $316 million.
Queensland’s reliance on Australian Government funding, as shown in Chart 6.2, is consistent with the national trend (shown in Chart 6.1), with its share of total funding sourced from the Australian Government increasing from 34.8% in 1999-2000 to an estimated 43.7% in 2013-14.
Chart 6.2
General Government revenue sources, Queensland, 1999-2000 and 2013-141
| | | | | | | | | | |
Australian Government funding 34.8% | | 1999-2000 | | State tax revenue 29.0% | | Australian Government funding 43.7% | | 2013-14 | | State tax revenue 26.5% |
Other state revenue2 36.2% | | | | | | | | | | Other state revenue2 29.8% |
Notes:
1. 2013-14 are estimates.
2. Includes user charges, interest earnings, contributions from trading enterprises and mining revenue.
Sources: ABS Government Finance Statistics Cat No. 5512.0 and Queensland Budget estimates
PAYMENTS TO QUEENSLAND FOR SPECIFIC PURPOSES
Structure of specific payments
Payments for specific purposes mainly comprise National Specific Purpose Payments (SPPs), National Health Reform funding and National Partnership (NP) payments. These payments represent a major source of revenue to Queensland.
National Specific Purpose Payments
SPPs are an ongoing financial payment to the states for service delivery in a particular sector. SPP funding is crucial for states to carry out their constitutional responsibility for school education, disability services, housing and skills development. SPPs are considered to be ‘tied’ payments since they must be expended in the relevant sector, but apart from this condition, states have total budget flexibility to allocate SPP funding within the relevant sector according to their priorities. In turn, states are accountable to their communities on SPP expenditure and the achievement of outcomes as set out in the associated National Agreements.
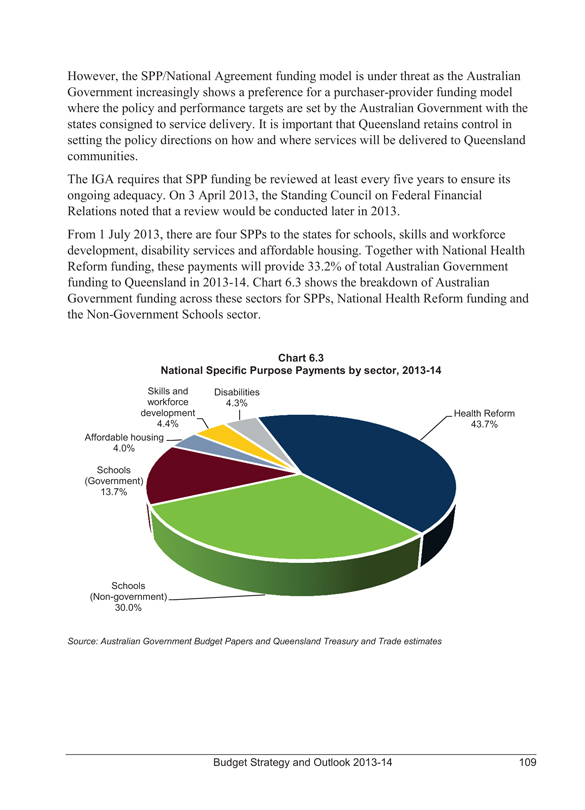
However, the SPP/National Agreement funding model is under threat as the Australian Government increasingly shows a preference for a purchaser-provider funding model where the policy and performance targets are set by the Australian Government with the states consigned to service delivery. It is important that Queensland retains control in setting the policy directions on how and where services will be delivered to Queensland communities.
The IGA requires that SPP funding be reviewed at least every five years to ensure its ongoing adequacy. On 3 April 2013, the Standing Council on Federal Financial Relations noted that a review would be conducted later in 2013.
From 1 July 2013, there are four SPPs to the states for schools, skills and workforce development, disability services and affordable housing. Together with National Health Reform funding, these payments will provide 33.2% of total Australian Government funding to Queensland in 2013-14. Chart 6.3 shows the breakdown of Australian Government funding across these sectors for SPPs, National Health Reform funding and the Non-Government Schools sector.
Chart 6.3
National Specific Purpose Payments by sector, 2013-14
| | | | |
Skills and workforce development 4.4% | | Disabilities 4.3% | | Health Reform 43.7% |
Affordable housing 4.0% | | | | |
Schools (Government) 13.7% | | | | |
Schools (Non-government) 30.0% | | | | |
Source: Australian Government Budget Papers and Queensland Treasury and Trade estimates
National Health Reform funding
The National Healthcare SPP expired on 1 July 2012 and has been replaced by a new payment stream as set out in the National Health Reform Agreement. Under the previous National Healthcare SPP, states had discretion on how to allocate health funds between hospital and other health services. Under the new arrangement, Australian Government health payments are made direct to Hospital and Health Services with state governments having less flexibility over how to allocate health funding.
Health system funding in Queensland requires certainty so that hospitals and health services can meet the health needs of Queensland communities in a timely manner. This certainty was undermined in October 2012 with the Australian Government’s decision to claw back $103 million in health funding in 2012-13 which had a significant impact on the ability of the newly created Hospital and Health Services to plan and deliver services. Further reductions announced in the 2013-14 Budget mean that the Australian Government will claw back approximately $476 million in funding across the forward estimates, since the 2012-13 Budget.
New reform initiatives
The Australian Government is proposing significant reforms to disability services and school education which will impact the National Disability SPP and the National Schools SPP. The reforms include:
DisabilityCare Australia
In December 2012, the Queensland Government announced a commitment to provide an additional $868 million over the period to 2018-19 to address the historical under-funding of disability services in Queensland and to support implementation of DisabilityCare Australia in Queensland.
This funding, coupled with the Australian Government’s commitment to provide the states with a share of the proposed 0.5% Medicare Levy increase, will contribute to the Queensland Government funding of $2.03 billion of scheme costs in 2019-20 with the Australian Government funding the balance.
The roll out of DisabilityCare Australia in Queensland will impact the National Disability SPP payments currently paid to Queensland. The exact impact is yet to be determined and will be negotiated prior to the commencement of the scheme’s roll out in Queensland in July 2016.
National Education Reform
The Australian Government is proposing that the National Schools SPP and the National Education Agreement be replaced by National Education Reform funding and a new National Education Reform Agreement from 1 January 2014. The National Education Reform funding will also include some redirected National Partnership funding. States have until 30 June 2013 to agree to the National Education Reform Agreement and new funding arrangements. The proposed reforms will require significant additional Queensland contributions and will give the Australian Government greater control over Queensland own sourced education funding and its distribution.
The Queensland Government will continue to work through the detail of the Australian
Government’s proposal, to determine whether it is in Queensland’s best interests to implement the reforms.
The 2013-14 Queensland Budget reflects the continuation of current arrangements for education funding as there are still a number of issues that need to be resolved.
National Partnership payments
National Partnership (NP) payments are paid to states to implement specific NP agreements. These agreements are usually time limited and support the delivery of projects, facilitate reforms or reward states that deliver on national reforms or achieve service delivery improvements.
NP payments are an important source of revenue for Queensland. In 2013-14, proposed NP payments to Queensland will be 10.2% ($1.995 billion) of total Australian Government funding to Queensland.
Number of agreements and funding by sector
The education and health sectors have the largest number of NPs, collectively representing just under half of the 74 agreements for Queensland as at 30 April 2013.
The large number of agreements within these two sectors is problematic as it can obscure the real priorities of Government in these important areas. It also creates difficulties in correctly attributing outcomes to individual initiatives when there is duplication or overlap across agreements. In terms of payments, NP payments for infrastructure, health and education account for 72.7% of the total NP funding in 2013-14 (refer Chart 6.4).
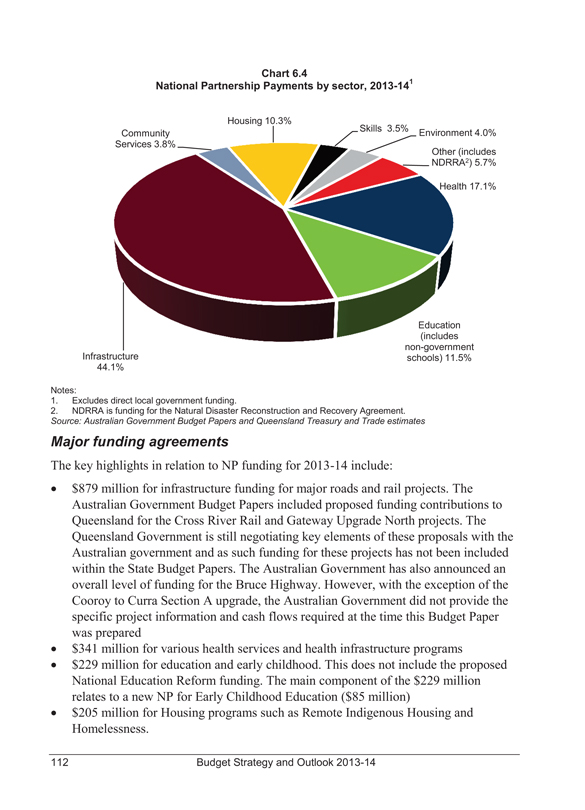
Chart 6.4
National Partnership Payments by sector, 2013-141
| | | | |
| | | Housing 10.3% | | |
| | | | | Skills 3.5% |
Community Services 3.8% | | | | Environment 4.0% Other (includes NDRRA2) 5.7% |
| | | | | Health 17.1% |
Infrastructure 44.1% | | | | Education (includes non-government
schools) 11.5% |
Notes:
1. Excludes direct local government funding.
2. NDRRA is funding for the Natural Disaster Reconstruction and Recovery Agreement.
Source: Australian Government Budget Papers and Queensland Treasury and Trade estimates
Major funding agreements
The key highlights in relation to NP funding for 2013-14 include:
• $879 million for infrastructure funding for major roads and rail projects. The Australian Government Budget Papers included proposed funding contributions to Queensland for the Cross River Rail and Gateway Upgrade North projects. The Queensland Government is still negotiating key elements of these proposals with the Australian government and as such funding for these projects has not been included within the State Budget Papers. The Australian Government has also announced an overall level of funding for the Bruce Highway. However, with the exception of the Cooroy to Curra Section A upgrade, the Australian Government did not provide the specific project information and cash flows required at the time this Budget Paper was prepared
• $341 million for various health services and health infrastructure programs
• $229 million for education and early childhood. This does not include the proposed National Education Reform funding. The main component of the $229 million relates to a new NP for Early Childhood Education ($85 million)
• $205 million for Housing programs such as Remote Indigenous Housing and Homelessness.
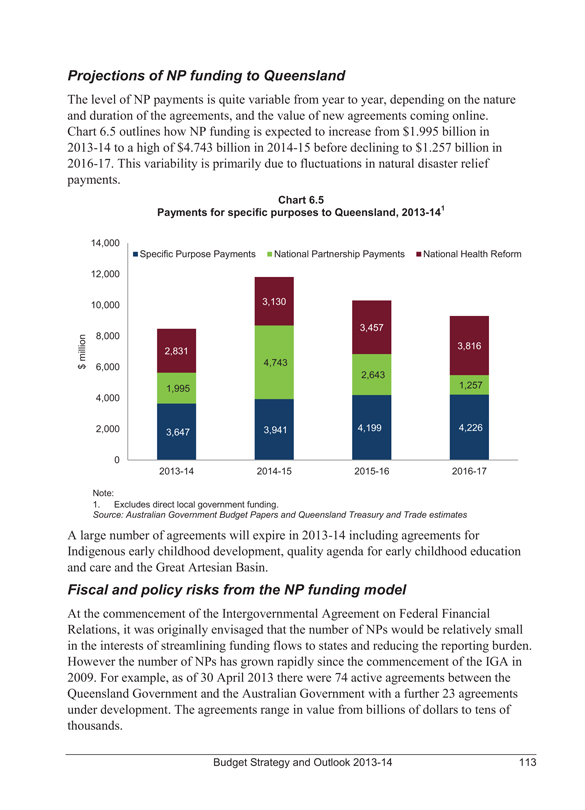
Projections of NP funding to Queensland
The level of NP payments is quite variable from year to year, depending on the nature and duration of the agreements, and the value of new agreements coming online. Chart 6.5 outlines how NP funding is expected to increase from $1.995 billion in 2013-14 to a high of $4.743 billion in 2014-15 before declining to $1.257 billion in 2016-17. This variability is primarily due to fluctuations in natural disaster relief payments.
Chart 6.5
Payments for specific purposes to Queensland, 2013-141
14,000
Specific Purpose Payments National Partnership Payments National Health Reform
12,000 10,000 3,130 3,457 8,000 3,816
$ million
2,831 6,000 4,743 2,643 1,995 1,257 4,000 2,000 3,647 3,941 4,199 4,226 0
2013-14
2014-15
2015-16
2016-17
Note:
1. Excludes direct local government funding.
Source: Australian Government Budget Papers and Queensland Treasury and Trade estimates
A large number of agreements will expire in 2013-14 including agreements for Indigenous early childhood development, quality agenda for early childhood education and care and the Great Artesian Basin.
Fiscal and policy risks from the NP funding model
At the commencement of the Intergovernmental Agreement on Federal Financial Relations, it was originally envisaged that the number of NPs would be relatively small in the interests of streamlining funding flows to states and reducing the reporting burden. However the number of NPs has grown rapidly since the commencement of the IGA in 2009. For example, as of 30 April 2013 there were 74 active agreements between the Queensland Government and the Australian Government with a further 23 agreements under development. The agreements range in value from billions of dollars to tens of thousands.
The large number of agreements is compromising the integrity of the IGA by maintaining tied funding as a significant part of the federal financial relations framework. More recently, NPs are being used to deliver minor Australian Government initiatives in areas of state service delivery that come with prescriptions about how the project or program is to be delivered.
In addition, administering these numerous agreements is costly, and the reporting burden is growing.
The use of time limited funding agreements particularly where the agreements assist in achieving increased service delivery levels poses an inherent risk for the State as these agreements build capacity and expectations leaving states with a difficult decision if the Australian Government ceases funding. In these cases, states either have to find new funding sources to continue programs, or discontinue services.
There is no constructive process for dealing with expiring NPs and often there is no commitment to ongoing Australian Government funding. Ideally, Queensland’s view is that expiring NPs should be rolled into a relevant SPP or a new SPP should be created.
States have little capacity to influence the continuation of expiring agreements except to provide annual advice to the federal Treasurer. The final decision on expiring agreements is ultimately made through the Australian Government’s budget process and announced with the release of the Australian Government Budget, giving states little advance warning on whether funding will be continued. This flawed process impacts state budget planning and service delivery. The Queensland Government, along with other state and territory governments, will continue to actively work with the Australian Government to improve budget certainty concerning expiring agreements.
States need reliable and unfettered revenue sources for their service delivery responsibilities. NPs too often fail to provide the required funding certainty and frequently include unnecessary prescription, input controls and reporting requirements which can reduce Queensland’s flexibility and resource availability.
GST REVENUE PAYMENTS
The Commonwealth Grants Commission (CGC) advises the Australian Government on the distribution of GST revenue among the states. The IGA requires GST revenue to be distributed on the basis of horizontal fiscal equalisation (HFE) principles. Consistent with this, the CGC aims to give all states the same fiscal capacity to deliver services to their populations after the distribution of the GST, taking into account states’ capacities to raise revenue from their own sources, as well as their different expenditure needs.
In March 2011, the Australian Government announced a review of the distribution of GST revenue to the states. The Review’s final report was released in November 2012.
The Review’s final report contains 23 findings and 31 recommendations. The recommendations propose changes to the current CGC processes and governance of HFE arrangements, and the consideration by the CGC of issues in a future methodology review (including the development of a new mining revenue assessment).
The GST Distribution Review’s Final Report also makes a finding about a vision for HFE and federal financial relations in the longer term. More information on the long term vision is provided in Box 6.1.
Federal and State Treasurers have agreed that the CGC would commence a methodology review this year. This review is to report by February 2015, and will incorporate consideration of the recommendations of the GST Distribution Review. More information on the 2015 Review of Methodology is provided in Box 6.2.
In addition, the CGC conducts annual updates of the financial, economic and demographic data that underpin its recommendations. More information on HFE and the GST distribution can be accessed through the CGC website (www.cgc.gov.au).
Box 6.1
The Future of Horizontal Fiscal Equalisation
The Australian Government announced a review of the distribution of GST revenue to the states in March 2011, with a final report released in November 2012. The purpose of the GST Distribution Review was to examine the system of distributing the GST revenue to the states, with regard to efficiency, equity, simplicity and stability.
Chapter 12 of the GST Distribution Review Final Report outlines a long term vision for federal financial relations. This deals with a wide range of issues, including roles and responsibilities and vertical fiscal imbalance (VFI), as well as HFE.
The report identifies that states and the Australian Government face long term, underlying economic and demographic pressures, such as an ageing population, higher community expectations for government service delivery and slower revenue growth. To manage long term fiscal pressures, the report finds that federal finances would benefit from:
• tax reform to put greater focus on more efficient taxes
• reducing VFI and states’ reliance on the Australian Government by more closely aligning national tax bases and service responsibilities.
If the above reforms were to be implemented, the report suggests that reforms to HFE could follow. With a reduced level of VFI, transfers from the Australian Government to the states could largely be addressed through untied general revenue assistance, reducing the level of transfers for specific purposes as responsibilities become better aligned with revenue bases.
Rather than implementing HFE by redistributing states’ GST revenue, the Australian Government could take responsibility for funding equalisation payments to states where this is required. In this case, general revenue assistance (such as GST revenue) might most simply be distributed to states on an equal per capita (EPC) basis.
During the GST Distribution Review, New South Wales, Victoria, Queensland and Western Australia made a joint submission advocating the EPC distribution of GST as a long term objective with the Australian Government funding the additional support required for states with lower fiscal capacities so no state is financially worse off.
While welcoming many elements of the Review’s long term vision for federal financial relations, Queensland will continue to vigorously support reform of the mining revenue assessment as a more immediate reform objective (refer Box 6.2), along with greater ongoing Commonwealth action to protect the GST pool, as articulated in the State’s submissions to the GST Distribution Review.
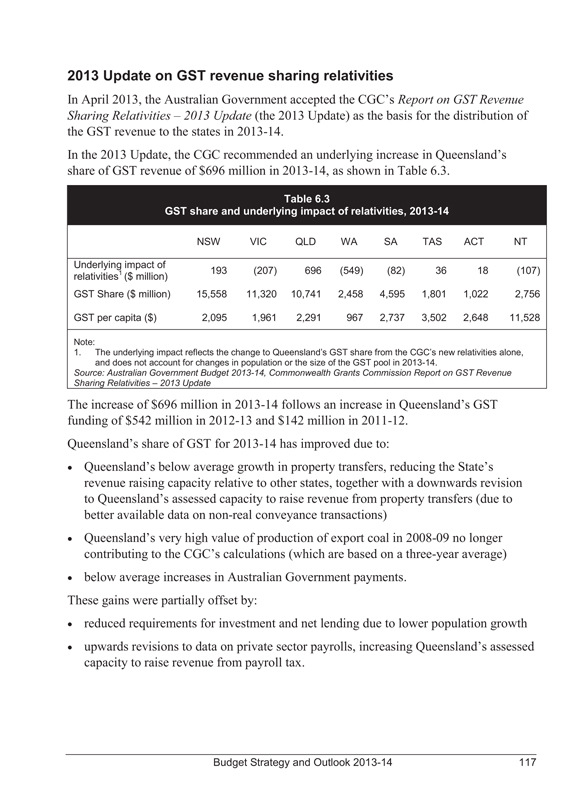
2013 Update on GST revenue sharing relativities
In April 2013, the Australian Government accepted the CGC’s Report on GST Revenue Sharing Relativities – 2013 Update (the 2013 Update) as the basis for the distribution of the GST revenue to the states in 2013-14.
In the 2013 Update, the CGC recommended an underlying increase in Queensland’s share of GST revenue of $696 million in 2013-14, as shown in Table 6.3.
Table 6.3
GST share and underlying impact of relativities, 2013-14
| | | | | | | | | | | | | | | | |
| | | NSW | | VIC | | QLD | | WA | | SA | | TAS | | ACT | | NT |
Underlying impact of relativities1 ($ million) | | 193 | | (207) | | 696 | | (549) | | (82) | | 36 | | 18 | | (107) |
GST Share ($ million) | | 15,558 | | 11,320 | | 10,741 | | 2,458 | | 4,595 | | 1,801 | | 1,022 | | 2,756 |
GST per capita ($) | | 2,095 | | 1,961 | | 2,291 | | 967 | | 2,737 | | 3,502 | | 2,648 | | 11,528 |
Note:
1. The underlying impact reflects the change to Queensland’s GST share from the CGC’s new relativities alone, and does not account for changes in population or the size of the GST pool in 2013-14.
Source: Australian Government Budget 2013-14, Commonwealth Grants Commission Report on GST Revenue Sharing Relativities – 2013 Update
The increase of $696 million in 2013-14 follows an increase in Queensland’s GST funding of $542 million in 2012-13 and $142 million in 2011-12.
Queensland’s share of GST for 2013-14 has improved due to:
• Queensland’s below average growth in property transfers, reducing the State’s revenue raising capacity relative to other states, together with a downwards revision to Queensland’s assessed capacity to raise revenue from property transfers (due to better available data on non-real conveyance transactions)
• Queensland’s very high value of production of export coal in 2008-09 no longer contributing to the CGC’s calculations (which are based on a three-year average)
• below average increases in Australian Government payments.
These gains were partially offset by:
• reduced requirements for investment and net lending due to lower population growth
• upwards revisions to data on private sector payrolls, increasing Queensland’s assessed capacity to raise revenue from payroll tax.
Box 6.2
2015 Review of CGC Methodology
Federal and State Treasurers have agreed that the CGC would commence a review of the methodology used to determine the distribution of the GST revenue, to report in February 2015.
The 2015 Review will aim to improve the current methodology in the context of:
• the recommendations of the final report of the GST Distribution Review, including the development of a new assessment of mining revenue
• major reforms in federal financial relations that have occurred since the last review of the methodology (2010), including National Health Reform, the National Disability Insurance Scheme and the National Education Reform Agreement
• the ongoing need to ensure that the assessments are as simple and robust as possible, and consistent with the quality and fitness for purpose of the available data.
A key issue for Queensland in this review is the assessment of mining revenue. The GST Distribution Review recommended that a new assessment of mining revenue be developed at the earliest opportunity. It recognised that there are problems with the current assessment; in particular, the division of minerals into two groups (high and low royalty minerals) can produce excessively large GST share effects when a commodity moves between groups. For example, under the current methodology, Western Australia’s decision to increase its royalty rates for iron ore fines would see it lose far more in GST revenue than it gained in additional royalties, were it not for a terms of reference directive to continue assessing iron ore fines as a “low” royalty rate mineral.
Queensland also welcomes the CGC’s consideration of the expenses incurred by states in the development of the mining industry and the provision of economic and social infrastructure. In its final submission to the GST Distribution Review, Queensland documented the significant direct expenditures, opportunity costs and risks associated with the development of mining in Queensland. These costs are not currently recognised in the CGC’s methodology, but at the same time, the royalties resulting from Queensland’s investment in its industry are redistributed to other states through the GST. A new mining assessment must recognise the costs to governments of the mining industry, and restore the appropriate incentives to governments to develop the industry in their states.
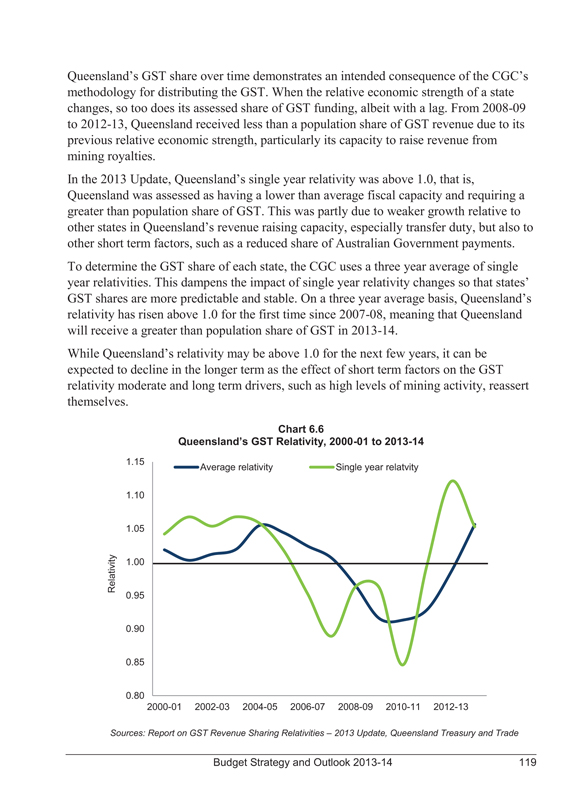
Queensland’s GST share over time demonstrates an intended consequence of the CGC’s methodology for distributing the GST. When the relative economic strength of a state changes, so too does its assessed share of GST funding, albeit with a lag. From 2008-09 to 2012-13, Queensland received less than a population share of GST revenue due to its previous relative economic strength, particularly its capacity to raise revenue from mining royalties.
In the 2013 Update, Queensland’s single year relativity was above 1.0, that is,
Queensland was assessed as having a lower than average fiscal capacity and requiring a greater than population share of GST. This was partly due to weaker growth relative to other states in Queensland’s revenue raising capacity, especially transfer duty, but also to other short term factors, such as a reduced share of Australian Government payments.
To determine the GST share of each state, the CGC uses a three year average of single year relativities. This dampens the impact of single year relativity changes so that states’
GST shares are more predictable and stable. On a three year average basis, Queensland’s relativity has risen above 1.0 for the first time since 2007-08, meaning that Queensland will receive a greater than population share of GST in 2013-14.
While Queensland’s relativity may be above 1.0 for the next few years, it can be expected to decline in the longer term as the effect of short term factors on the GST relativity moderate and long term drivers, such as high levels of mining activity, reassert themselves.
Chart 6.6
Queensland’s GST Relativity, 2000-01 to 2013-14
| | | | | | | | | | | | | | | | |
| | | 1.15 | | | | | | | | | | | | | | |
| | | | | | | Average relativity | | | | Single year relatvity | | | | | | |
| | | 1.10 | | | | | | | | | | | | | | |
| | | 1.05 | | | | | | | | | | | | | | |
Relativity | | 1.00 | | | | | | | | | | | | | | |
| | | 0.95 | | | | | | | | | | | | | | |
| | | 0.90 | | | | | | | | | | | | | | |
| | | 0.85 | | | | | | | | | | | | | | |
| | | 0.80 | | | | | | | | | | | | | | |
| | | | | 2000-01 | | 2002-03 | | 2004-05 | | 2006-07 | | 2008-09 | | 2010-11 | | 2012-13 |
Sources: Report on GST Revenue Sharing Relativities – 2013 Update, Queensland Treasury and Trade
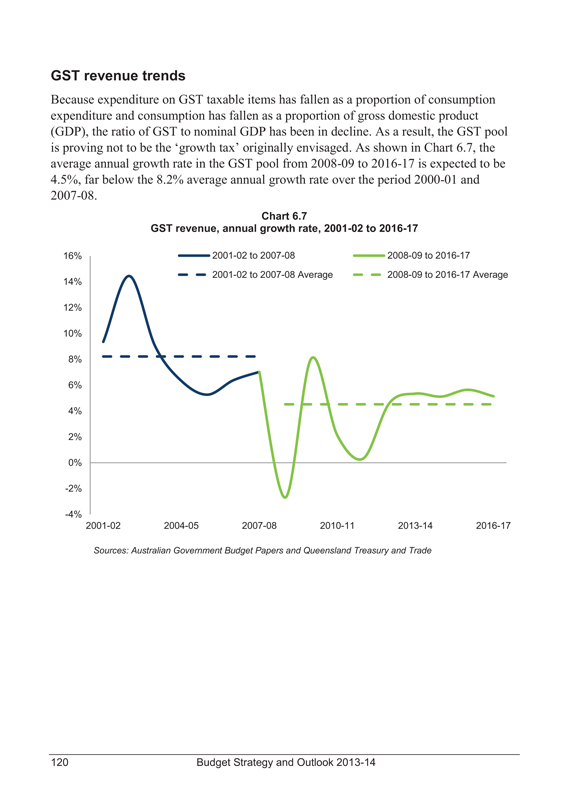
GST revenue trends
Because expenditure on GST taxable items has fallen as a proportion of consumption expenditure and consumption has fallen as a proportion of gross domestic product (GDP), the ratio of GST to nominal GDP has been in decline. As a result, the GST pool is proving not to be the ‘growth tax’ originally envisaged. As shown in Chart 6.7, the average annual growth rate in the GST pool from 2008-09 to 2016-17 is expected to be 4.5%, far below the 8.2% average annual growth rate over the period 2000-01 and 2007-08.
Chart 6.7
GST revenue, annual growth rate, 2001-02 to 2016-17
| | | | | | | | | | | | |
16% | | | | | | 2001-02 to 2007-08 | | | | 2008-09 to 2016-17 | | |
| | | | | | | 2001-02 to 2007-08 Average | | | | 2008-09 to 2016-17 Average | | |
14% | | | | | | | | | | | | |
12% | | | | | | | | | | | | |
10% | | | | | | | | | | | | |
8% | | | | | | | | | | | | |
6% | | | | | | | | | | | | |
4% | | | | | | | | | | | | |
2% | | | | | | | | | | | | |
0% | | | | | | | | | | | | |
-2% | | | | | | | | | | | | |
-4% | | | | | | | | | | | | |
| | | 2001-02 | | 2004-05 | | 2007-08 | | 2010-11 | | 2013-14 | | 2016-17 |
Sources: Australian Government Budget Papers and Queensland Treasury and Trade
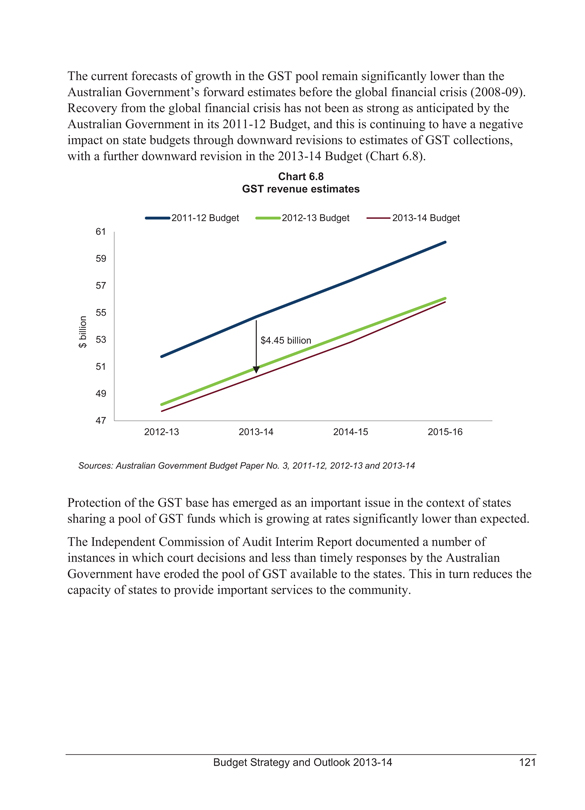
The current forecasts of growth in the GST pool remain significantly lower than the
Australian Government’s forward estimates before the global financial crisis (2008-09). Recovery from the global financial crisis has not been as strong as anticipated by the Australian Government in its 2011-12 Budget, and this is continuing to have a negative impact on state budgets through downward revisions to estimates of GST collections, with a further downward revision in the 2013-14 Budget (Chart 6.8).
Chart 6.8
GST revenue estimates
| | | | | | | | | | |
| | | | | 2011-12 Budget | | 2012-13 Budget | | 2013-14 Budget | | |
| | | 61 | | | | | | | | |
| | | 59 | | | | | | | | |
| | | 57 | | | | | | | | |
$ billion | | 55 | | | | | | | | |
| | | 53 | | | | $4.45 billion | | | | |
| | | 51 | | | | | | | | |
| | | 49 | | | | | | | | |
| | | 47 | | | | | | | | |
| | | | | 2012-13 | | 2013-14 | | 2014-15 | | 2015-16 |
Sources: Australian Government Budget Paper No. 3, 2011-12, 2012-13 and 2013-14
Protection of the GST base has emerged as an important issue in the context of states sharing a pool of GST funds which is growing at rates significantly lower than expected.
The Independent Commission of Audit Interim Report documented a number of instances in which court decisions and less than timely responses by the Australian Government have eroded the pool of GST available to the states. This in turn reduces the capacity of states to provide important services to the community.
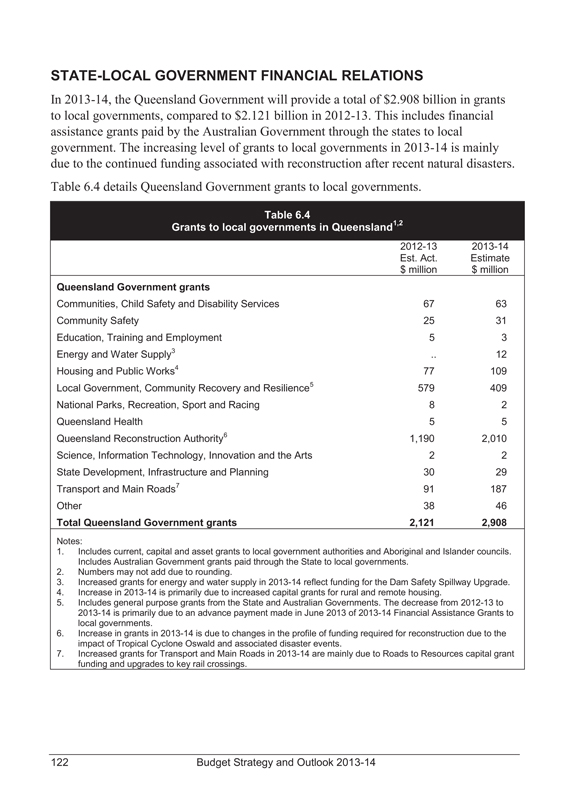
STATE-LOCAL GOVERNMENT FINANCIAL RELATIONS
In 2013-14, the Queensland Government will provide a total of $2.908 billion in grants to local governments, compared to $2.121 billion in 2012-13. This includes financial assistance grants paid by the Australian Government through the states to local government. The increasing level of grants to local governments in 2013-14 is mainly due to the continued funding associated with reconstruction after recent natural disasters.
Table 6.4 details Queensland Government grants to local governments.
Table 6.4
Grants to local governments in Queensland1,2
2012-13 2013-14
Est. Act. Estimate
$ million $ million
Queensland Government grants
Communities, Child Safety and Disability Services 67 63
Community Safety 25 31
Education, Training and Employment 5 3
Energy and Water Supply3 .. 12
Housing and Public Works4 77 109
Local Government, Community Recovery and Resilience5 579 409
National Parks, Recreation, Sport and Racing 8 2
Queensland Health 5 5
Queensland Reconstruction Authority6 1,190 2,010
Science, Information Technology, Innovation and the Arts 2 2
State Development, Infrastructure and Planning 30 29
Transport and Main Roads7 91 187
Other 38 46
Total Queensland Government grants 2,121 2,908
Notes:
1. Includes current, capital and asset grants to local government authorities and Aboriginal and Islander councils. Includes Australian Government grants paid through the State to local governments.
2. Numbers may not add due to rounding.
3. Increased grants for energy and water supply in 2013-14 reflect funding for the Dam Safety Spillway Upgrade.
4. Increase in 2013-14 is primarily due to increased capital grants for rural and remote housing.
5. Includes general purpose grants from the State and Australian Governments. The decrease from 2012-13 to 2013-14 is primarily due to an advance payment made in June 2013 of 2013-14 Financial Assistance Grants to local governments.
6. Increase in grants in 2013-14 is due to changes in the profile of funding required for reconstruction due to the impact of Tropical Cyclone Oswald and associated disaster events.
7. Increased grants for Transport and Main Roads in 2013-14 are mainly due to Roads to Resources capital grant funding and upgrades to key rail crossings.
7 PUBLIC NON-FINANCIAL CORPORATIONS SECTOR
FEATURES
• In 2013-14, Public Non-financial Corporations will continue to drive greater efficiencies across all activities and cut unnecessary expenditure in order to minimise the cost of delivering their services while maintaining reliable performance.
• In 2013-14, the Queensland Bulk Water Supply Authority (Seqwater) will further consolidate improved efficiencies of its bulk water operations and cost reductions expected from the 2012-13 merger of the three former bulk water entities.
• Queensland Rail will continue to implement revised governance arrangements during 2013-14 that respond to the new corporate structure announced on 3 May 2013.
• During 2013-14, a number of Government-owned corporations will work with
Government on the implementation of the Queensland Government’s response to the Independent Commission of Audit Final Report.
CONTEXT
The entities comprising the Public Non-financial Corporations (PNFC) sector operate across a range of industries including energy, rail, port and water delivery services. A significant part of the PNFC sector is the State’s Government-owned corporations (GOCs) declared by regulation to be GOCs under the Government Owned Corporations Act 1993. This sector does not incorporate QIC Limited as it forms part of the Public Financial Corporations sector. The PNFC sector also includes non-GOC entities including Seqwater, Queensland Rail and some local water boards. A full list of PNFC sector entities is available in Chapter 8.
Under the Government Owned Corporations Act 1993, GOCs are required to operate to realise commercial success and efficiency and are accountable for their performance. GOC business activities target needs identified within their relevant market sector.
Revenues generated by the PNFC sector are predominantly from the sale of services or basic commodities. In more limited cases, part of a PNFC’s revenue may comprise Community Service Obligation payments from the Government. These payments subsidise the provision of a service or commodity supplied on a non-commercial basis in order to deliver the Government’s broader policy objectives.
REFORM
In 2013-14, the Queensland Government will continue to focus the PNFC sector on driving value for money for Queensland taxpayers, maintaining effective accountability frameworks and the reliable delivery of essential services. This aims to build on the progress and achievements made in 2012-13.
Capital investment
GOCs and other major PNFC sector entities will focus on strategies that result in stronger profitability and greater asset efficiency in order to generate improved returns on the State’s substantial equity investment in these businesses. In addition, their future capital programs will continue to be assessed to ensure efficient investment that balances reliability with the lowest long-run cost. The Government is already seeing benefits of this strategy with capital expenditure reducing over the forward estimates.
Water
In 2012, the Government began reform of the South East Queensland water entities with the objective of improving the efficiency of water operations and reducing the costs of the South East Queensland Water Grid. A key element of that reform was the merger of the three South East Queensland water entities into one.
On 1 January 2013, the Queensland Bulk Water Transport Authority (LinkWater) and the SEQ Water Grid Manager (WGM) were merged into the existing operations of the Queensland Bulk Water Supply Authority (Seqwater). From this date, Seqwater has taken over all the assets and operations of the three former SEQ water entities (including itself). LinkWater and the WGM ceased trading on 1 January 2013.
The new Seqwater board immediately identified savings of $80 million per annum from the new structure and after a review of the capital and operational budgets, identified a further reduction of $291 million in expenditure over 2013-14 to 2016-17. Overall there is a forecast improvement in the operating position of $333 million by the end of 2016-17 compared to the pre-merger position.
Reviews and reports
During 2012-13 the Government released a number of reports that significantly impact the PNFC entities, including the Independent Commission of Audit. Further details on how the Independent Commission’s Final Report impacts the PNFC sector can be found later in this Chapter.
The Inter-Departmental Committee on Energy Sector Reform (IDC) was tasked with ensuring:
1. electricity in Queensland is delivered in a cost-effective manner for customers
2. Queensland has a viable, sustainable and competitive electricity industry
3. electricity is delivered in a financially sustainable manner from the Queensland
Government’s perspective.
The IDC has undertaken a substantial review of the electricity sector, in consultation with industry, with a view to developing a strategy for reform. Cabinet is yet to consider the IDC final report.
In 2013-14, Government will progress its review of ports’ governance. This review will consider the most appropriate governance model for Queensland ports to ensure efficient and effective delivery of port services. The review will focus on determining an optimal governance model for Queensland ports, addressing improved productivity, minimisation of operational costs, maintaining service levels at the lowest cost and efficient and effective port services.
INDEPENDENT COMMISSION OF AUDIT
The Independent Commission of Audit’s Final Report made a series of recommendations relevant to the PNFC sector.
It recommended, when market conditions are favourable, the Government divest its electricity generation assets. The Independent Commission identified a number of factors that would impact the optimal timing of divestment, including the uncertainty regarding the carbon tax and generation capacity in the National Electricity Market.
The Government does not currently have a policy to sell Government businesses, and remains fully committed to seeking a mandate from the Queensland people before divesting itself of any Government business. However, the Government believes such a proposal is worthy of an open and transparent community debate to establish its viability and to inform stakeholders of the costs and benefits of Government owning such businesses, noting these also come with significant financial risks in the context of a modern economy.
Regardless of any consideration of the merits of selling the assets, the Government’s expectation of these operations is they are open for business as usual and the Government will adopt a prudent approach in ensuring decisions are not taken that could erode the value of these assets.
The Independent Commission also recommended the electricity distribution and transmission assets be divested. The Government has decided not to seek a mandate to do so at the next election. However, the Government believes that the Independent Commission’s recommendation that residual retail electricity functions be divested warrants further consideration and debate with the community.
The Independent Commission also recommended that the electricity distribution and transmission businesses be required to achieve higher rates of return through increased efficiencies, better capital management and operational cost savings. It also recommends they divest themselves of non-core business where there are significant bring forward benefits for the State from doing so. The 2013-14 Budget reflects the adoption of these recommendations while at the same time ensuring impacts on prices, reliability and standards are minimised.
The Independent Commission made a number of recommendations directly relating to Queensland Rail and the port assets held by GOCs. Of these recommendations, the Government has accepted those relating to increased contestability and competition for services. The Government has also accepted in principle, in part, or for further consideration, a number of other recommendations, acknowledging that these matters will be reviewed as part of the ongoing reform activities being undertaken by the Department of Transport and Main Roads.
Specifically, the Independent Commission recommended that the commercial operations of the Gladstone Ports Corporation Limited (GPC) and Port of Townsville Limited (PoTL) be offered for long term lease to private operators. While the Government does not currently have a policy to sell Government businesses, it believes this proposal is worthy of an open and transparent community debate to establish its viability and to inform stakeholders of the costs and benefits involved. It should also be noted that the offering of a long-term lease for the operation of the commercial enterprises means the Government would still retain ownership of these ports. The Government commits to undertake further detailed investigation of this particular proposal to ensure that the debate is fully informed before making any decision.
The Government has accepted in principle the Independent Commission’s recommendation that ownership and control of remaining government owned, low volume regional ports be offered to local authorities, in view of the significant role they play in their local communities. The Government notes that local authorities are an important stakeholder in ports and will consider each proposal on a case by case basis.
The Independent Commission’s report recommended a number of initiatives regarding regional bulk water supply, including the transfer of SunWater Limited’s (SunWater) irrigation channels to private irrigators and offering dedicated water supply infrastructure servicing commercial and industrial clients for private ownership and/or private operation, depending on which solution provides the best value for money outcome for the Government. The Independent Commission also recommended that while SunWater should retain ownership of regional bulk water assets, any new bulk water assets should be privately funded and owned (subject to compelling public benefit or market failure factors).
The Government has accepted the recommendations relating to SunWater, and has initiated an investigation into the divestment and transfer of the irrigation channels to irrigators under local management plans. The Government has also undertaken to evaluate proposals to divest dedicated water infrastructure servicing industrial and commercial clients.
The Government’s response to the Independent Commission report recognised the benefits that flow from a number of recommendations and committed to further work on how to effectively and efficiently capture these benefits. In 2013-14, GOCs affected by these recommendations will work with the Government to ensure the businesses are positioned to meet the expectations of Government in this regard.
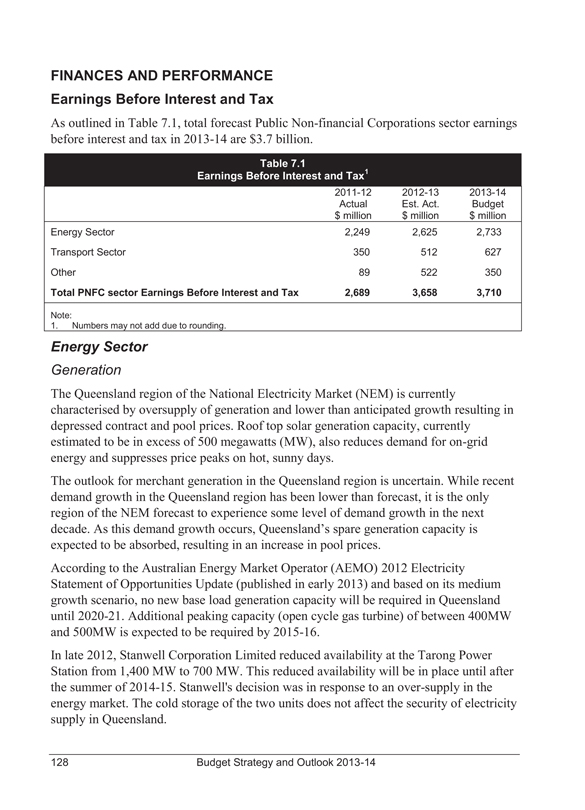
FINANCES AND PERFORMANCE
Earnings Before Interest and Tax
As outlined in Table 7.1, total forecast Public Non-financial Corporations sector earnings before interest and tax in 2013-14 are $3.7 billion.
Table 7.1
Earnings Before Interest and Tax1
| | | | | | |
| | | 2011-12 | | 2012-13 | | 2013-14 |
| | | Actual | | Est. Act. | | Budget |
| | | $ million | | $ million | | $ million |
Energy Sector | | 2,249 | | 2,625 | | 2,733 |
Transport Sector | | 350 | | 512 | | 627 |
Other | | 89 | | 522 | | 350 |
Total PNFC sector Earnings Before Interest and Tax | | 2,689 | | 3,658 | | 3,710 |
Note:
1. Numbers may not add due to rounding.
Energy Sector
Generation
The Queensland region of the National Electricity Market (NEM) is currently characterised by oversupply of generation and lower than anticipated growth resulting in depressed contract and pool prices. Roof top solar generation capacity, currently estimated to be in excess of 500 megawatts (MW), also reduces demand for on-grid energy and suppresses price peaks on hot, sunny days.
The outlook for merchant generation in the Queensland region is uncertain. While recent demand growth in the Queensland region has been lower than forecast, it is the only region of the NEM forecast to experience some level of demand growth in the next decade. As this demand growth occurs, Queensland’s spare generation capacity is expected to be absorbed, resulting in an increase in pool prices.
According to the Australian Energy Market Operator (AEMO) 2012 Electricity Statement of Opportunities Update (published in early 2013) and based on its medium growth scenario, no new base load generation capacity will be required in Queensland until 2020-21. Additional peaking capacity (open cycle gas turbine) of between 400MW and 500MW is expected to be required by 2015-16.
In late 2012, Stanwell Corporation Limited reduced availability at the Tarong Power Station from 1,400 MW to 700 MW. This reduced availability will be in place until after the summer of 2014-15. Stanwell’s decision was in response to an over-supply in the energy market. The cold storage of the two units does not affect the security of electricity supply in Queensland.
The liquefied natural gas (LNG) industry will be important to any change to market fundamentals in the Queensland region. The LNG industry is expected to create additional base load demand and also move the domestic gas price towards international parity. In these circumstances the competitiveness of coal-fired generation, being the main type of generation within the Queensland government-owned generators, is expected to improve.
Networks
The financial positions of the network energy GOCs (Powerlink, Energex and Ergon) continue to reflect the significant amounts of deferred and/or delayed capital investment which have arisen as a result of estimates of ongoing low demand.
All three network entities are undertaking significant cost containment activities which are reflected in the 2013-14 Budget.
The only significant market based change is the completion of Powerlink’s divestment of its equity interest in ElectraNet Pty Ltd, which primarily impacted returns in 2012-13. Although there have been limited changes in the market environment for network energy GOCs, significant risks remain which could impact the forecast outcomes of these entities, including:
• changes to the timing and profile of expected large load projects (such as LNG and other mining and infrastructure projects) which will influence energy growth
• significant changes to forecast electricity demand and volume growth profiles.
However, the most significant risk remains the commencement of the new regulatory period for Energex and Ergon which begins on 1 July 2015. The current regulatory environment presents some uncertainty due to expected significant rule changes and public focus on the decisions of the Australian Energy Regulator making it difficult to estimate the expected financial performance and position of Energex and Ergon post 2015-16.
Transport Sector
Queensland Rail
Queensland Rail (QR) is a provider of rail transport services which are predominantly supported by the Queensland Government through the provision of Community Service Obligation payments. QR maintains a focus on efficient and effective delivery of its services in order to improve its performance and reduce the overall cost of transport services.
The establishment of the QR efficiency program was a key initiative of the 2012-13 Budget. The efficiency program initially estimated a $42 million per annum reduction in consumable spending in addition to a management restructure and Voluntary Redundancy scheme. Total savings of approximately $60 million per annum are expected from these three initiatives. QR has successfully met the forecast cost reduction and continues to progress the efficiency program with further cost savings and efficiency measures identified for implementation in 2013-14.
In 2013-14, the Government will continue to improve the governance arrangements associated with the delivery of rail public transport services following from the recent institutional restructure in which a new statutory authority was created. This restructure is designed to provide an organisational platform for future reforms in rail service delivery. In addition, the contractual arrangements between the Department of Transport and Main Roads as purchaser, and QR as the service provider, are in the process of being renegotiated to ensure the best value outcome for rail commuters in Queensland.
Ports
Queensland’s ports service a number of communities and regions and a multi-faceted industry base throughout the State. Other than the Port of Brisbane, all Queensland ports are owned by the Queensland Government with a mixture of both private and public ownership of terminals and berths.
Thermal and metallurgical coals are Queensland’s largest export, and drive profitability at a number of Queensland ports. Nominal port capacity of up to 399 mt is expected by 2017-18 with completion of current and planned port expansion works, including the Wiggins Island Coal Export Terminal Stages 1 and 2 at the Port of Gladstone, Abbot Point Coal Terminal T0 and T3 expansions at the Port of Abbot Point and Hay Point Coal Terminal’s Stage 3 expansion at the Port of Hay Point.
Water Infrastructure
SunWater
SunWater, in conjunction with the Department of Energy and Water Supply and irrigators, is investigating the viability of local management arrangements of channel irrigation schemes. A final decision is expected to occur in 2013-14.
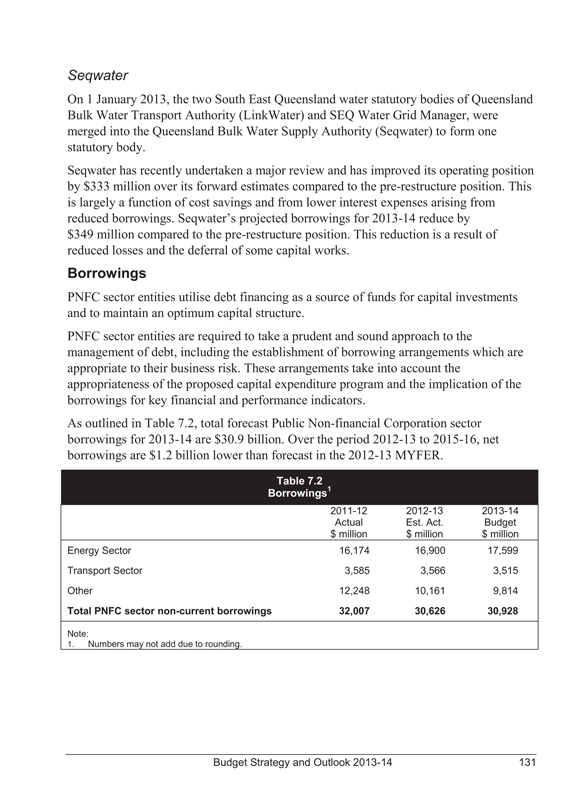
Seqwater
On 1 January 2013, the two South East Queensland water statutory bodies of Queensland Bulk Water Transport Authority (LinkWater) and SEQ Water Grid Manager, were merged into the Queensland Bulk Water Supply Authority (Seqwater) to form one statutory body.
Seqwater has recently undertaken a major review and has improved its operating position by $333 million over its forward estimates compared to the pre-restructure position. This is largely a function of cost savings and from lower interest expenses arising from reduced borrowings. Seqwater’s projected borrowings for 2013-14 reduce by $349 million compared to the pre-restructure position. This reduction is a result of reduced losses and the deferral of some capital works.
Borrowings
PNFC sector entities utilise debt financing as a source of funds for capital investments and to maintain an optimum capital structure.
PNFC sector entities are required to take a prudent and sound approach to the management of debt, including the establishment of borrowing arrangements which are appropriate to their business risk. These arrangements take into account the appropriateness of the proposed capital expenditure program and the implication of the borrowings for key financial and performance indicators.
As outlined in Table 7.2, total forecast Public Non-financial Corporation sector borrowings for 2013-14 are $30.9 billion. Over the period 2012-13 to 2015-16, net borrowings are $1.2 billion lower than forecast in the 2012-13 MYFER.
Table 7.2
Borrowings1
| | | | | | |
| | | 2011-12 | | 2012-13 | | 2013-14 |
| | | Actual | | Est. Act. | | Budget |
| | | $ million | | $ million | | $ million |
Energy Sector | | 16,174 | | 16,900 | | 17,599 |
Transport Sector | | 3,585 | | 3,566 | | 3,515 |
Other | | 12,248 | | 10,161 | | 9,814 |
Total PNFC sector non-current borrowings | | 32,007 | | 30,626 | | 30,928 |
Note:
1. Numbers may not add due to rounding.
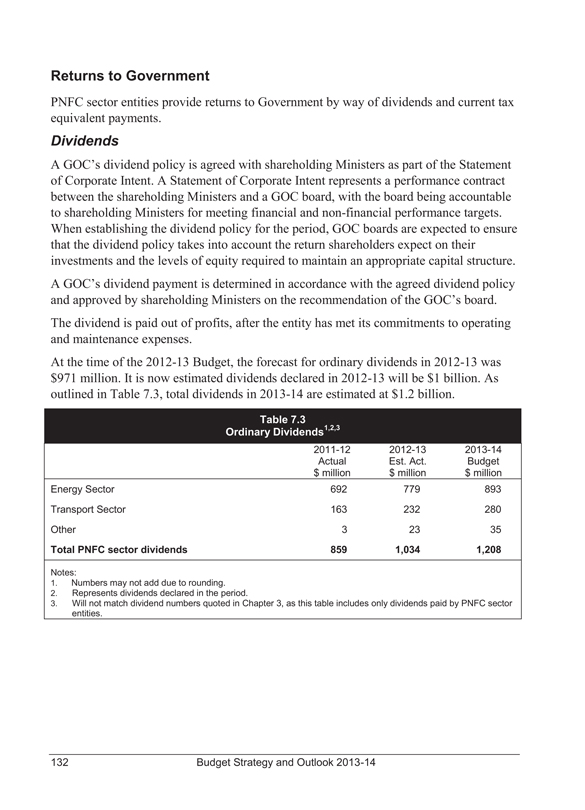
Returns to Government
PNFC sector entities provide returns to Government by way of dividends and current tax equivalent payments.
Dividends
A GOC’s dividend policy is agreed with shareholding Ministers as part of the Statement of Corporate Intent. A Statement of Corporate Intent represents a performance contract between the shareholding Ministers and a GOC board, with the board being accountable to shareholding Ministers for meeting financial and non-financial performance targets. When establishing the dividend policy for the period, GOC boards are expected to ensure that the dividend policy takes into account the return shareholders expect on their investments and the levels of equity required to maintain an appropriate capital structure.
A GOC’s dividend payment is determined in accordance with the agreed dividend policy and approved by shareholding Ministers on the recommendation of the GOC’s board.
The dividend is paid out of profits, after the entity has met its commitments to operating and maintenance expenses.
At the time of the 2012-13 Budget, the forecast for ordinary dividends in 2012-13 was $971 million. It is now estimated dividends declared in 2012-13 will be $1 billion. As outlined in Table 7.3, total dividends in 2013-14 are estimated at $1.2 billion.
Table 7.3
Ordinary Dividends1,2,3
| | | | | | |
| | | 2011-12 | | 2012-13 | | 2013-14 |
| | | Actual | | Est. Act. | | Budget |
| | | $ million | | $ million | | $ million |
Energy Sector | | 692 | | 779 | | 893 |
Transport Sector | | 163 | | 232 | | 280 |
Other | | 3 | | 23 | | 35 |
Total PNFC sector dividends | | 859 | | 1,034 | | 1,208 |
Notes:
1. Numbers may not add due to rounding.
2. Represents dividends declared in the period.
3. Will not match dividend numbers quoted in Chapter 3, as this table includes only dividends paid by PNFC sector
entities.
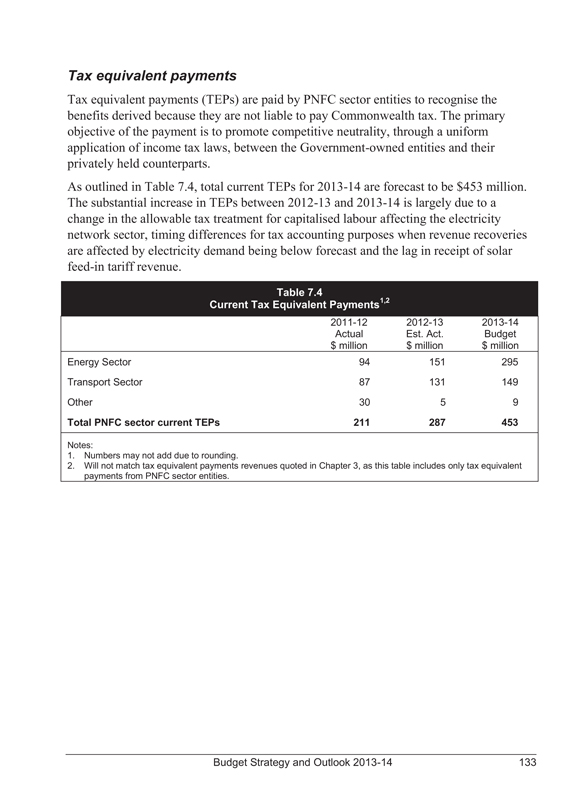
Tax equivalent payments
Tax equivalent payments (TEPs) are paid by PNFC sector entities to recognise the benefits derived because they are not liable to pay Commonwealth tax. The primary objective of the payment is to promote competitive neutrality, through a uniform application of income tax laws, between the Government-owned entities and their privately held counterparts.
As outlined in Table 7.4, total current TEPs for 2013-14 are forecast to be $453 million. The substantial increase in TEPs between 2012-13 and 2013-14 is largely due to a change in the allowable tax treatment for capitalised labour affecting the electricity network sector, timing differences for tax accounting purposes when revenue recoveries are affected by electricity demand being below forecast and the lag in receipt of solar feed-in tariff revenue.
Table 7.4
Current Tax Equivalent Payments1,2
| | | | | | |
| | | 2011-12 | | 2012-13 | | 2013-14 |
| | | Actual | | Est. Act. | | Budget |
| | | $ million | | $ million | | $ million |
Energy Sector | | 94 | | 151 | | 295 |
Transport Sector | | 87 | | 131 | | 149 |
Other | | 30 | | 5 | | 9 |
Total PNFC sector current TEPs | | 211 | | 287 | | 453 |
Notes:
1. Numbers may not add due to rounding.
2. Will not match tax equivalent payments revenues quoted in Chapter 3, as this table includes only tax equivalent
payments from PNFC sector entities.
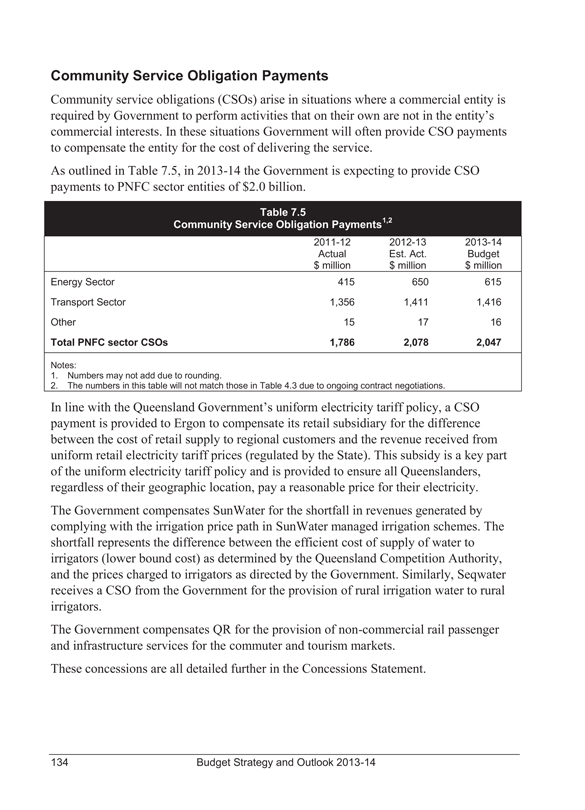
Community Service Obligation Payments
Community service obligations (CSOs) arise in situations where a commercial entity is required by Government to perform activities that on their own are not in the entity’s commercial interests. In these situations Government will often provide CSO payments to compensate the entity for the cost of delivering the service.
As outlined in Table 7.5, in 2013-14 the Government is expecting to provide CSO payments to PNFC sector entities of $2.0 billion.
Table 7.5
Community Service Obligation Payments1,2
| | | | | | |
| | | 2011-12 | | 2012-13 | | 2013-14 |
| | | Actual | | Est. Act. | | Budget |
| | | $ million | | $ million | | $ million |
Energy Sector | | 415 | | 650 | | 615 |
Transport Sector | | 1,356 | | 1,411 | | 1,416 |
Other | | 15 | | 17 | | 16 |
Total PNFC sector CSOs | | 1,786 | | 2,078 | | 2,047 |
Notes:
1. Numbers may not add due to rounding.
2. The numbers in this table will not match those in Table 4.3 due to ongoing contract negotiations.
In line with the Queensland Government’s uniform electricity tariff policy, a CSO payment is provided to Ergon to compensate its retail subsidiary for the difference between the cost of retail supply to regional customers and the revenue received from uniform retail electricity tariff prices (regulated by the State). This subsidy is a key part of the uniform electricity tariff policy and is provided to ensure all Queenslanders, regardless of their geographic location, pay a reasonable price for their electricity.
The Government compensates SunWater for the shortfall in revenues generated by complying with the irrigation price path in SunWater managed irrigation schemes. The shortfall represents the difference between the efficient cost of supply of water to irrigators (lower bound cost) as determined by the Queensland Competition Authority, and the prices charged to irrigators as directed by the Government. Similarly, Seqwater receives a CSO from the Government for the provision of rural irrigation water to rural irrigators.
The Government compensates QR for the provision of non-commercial rail passenger and infrastructure services for the commuter and tourism markets.
These concessions are all detailed further in the Concessions Statement.
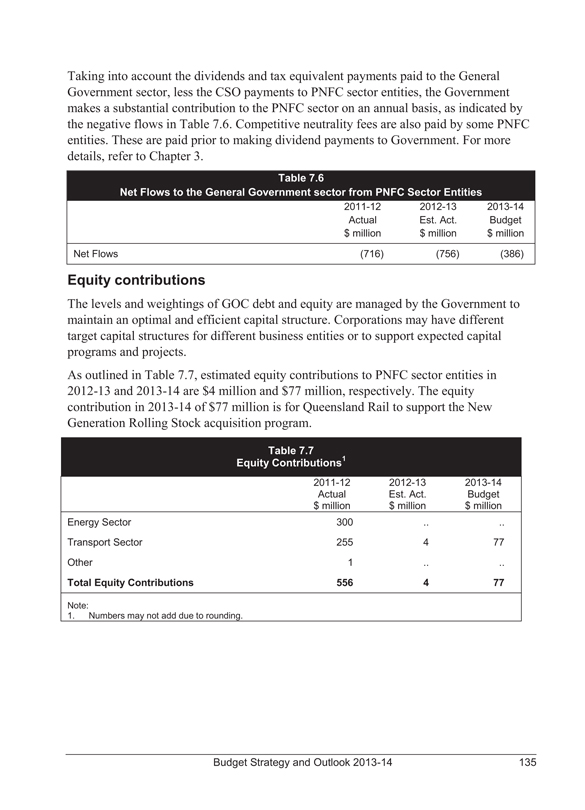
Taking into account the dividends and tax equivalent payments paid to the General Government sector, less the CSO payments to PNFC sector entities, the Government makes a substantial contribution to the PNFC sector on an annual basis, as indicated by the negative flows in Table 7.6. Competitive neutrality fees are also paid by some PNFC entities. These are paid prior to making dividend payments to Government. For more details, refer to Chapter 3.
Table 7.6
Net Flows to the General Government sector from PNFC Sector Entities
| | | | | | |
| | | 2011-12 | | 2012-13 | | 2013-14 |
| | | Actual | | Est. Act. | | Budget |
| | | $ million | | $ million | | $ million |
Net Flows | | (716) | | (756) | | (386) |
Equity contributions
The levels and weightings of GOC debt and equity are managed by the Government to maintain an optimal and efficient capital structure. Corporations may have different target capital structures for different business entities or to support expected capital programs and projects.
As outlined in Table 7.7, estimated equity contributions to PNFC sector entities in 2012-13 and 2013-14 are $4 million and $77 million, respectively. The equity contribution in 2013-14 of $77 million is for Queensland Rail to support the New Generation Rolling Stock acquisition program.
Table 7.7
Equity Contributions1
| | | | | | |
| | | 2011-12 | | 2012-13 | | 2013-14 |
| | | Actual | | Est. Act. | | Budget |
| | | $ million | | $ million | | $ million |
Energy Sector | | 300 | | .. | | .. |
Transport Sector | | 255 | | 4 | | 77 |
Other | | 1 | | .. | | .. |
Total Equity Contributions | | 556 | | 4 | | 77 |
Note:
1. Numbers may not add due to rounding.
136 Budget Strategy and Outlook 2013-14
8 UNIFORM PRESENTATION FRAMEWORK
INTRODUCTION
This chapter contains detailed financial statements for the Queensland Public Sector prepared under the Uniform Presentation Framework (UPF) of reporting as required under the Australian Loan Council arrangements.
The UPF was reviewed following the release in October 2007 of the Australian
Accounting Standards Board’s (AASB) accounting standard, AASB 1049 Whole of Government and General Government Sector Financial Reporting. The standard aims to harmonise Government Finance Statistics (GFS) and Generally Accepted Accounting Principles (GAAP) with the objective of improving the clarity and transparency of government financial statements.
In addition, the chapter provides:
• a reconciliation of the General Government sector net operating balance to the accounting operating result
• a time series for the General Government sector using the revised UPF
• details of General Government grant revenue and expenses
• details of General Government sector dividend and income tax equivalent income
• data on General Government expenses and purchases of non-financial assets by function
• details of taxation revenue collected by the General Government sector
• the State’s revised Loan Council Budget allocation
• details of contingent liabilities
• background information on the revised UPF and disclosure differences arising from it, including the conceptual basis, sector definitions and a list of reporting entities.
UNIFORM PRESENTATION FRAMEWORK FINANCIAL INFORMATION
The tables on the following pages present operating statements, balance sheets and cash flow statements prepared on a harmonised basis for the General Government, Public Non-financial Corporations (PNFC) and Non-financial Public sectors.
Under the UPF requirements, budgeted financial information for the Public Financial Corporations sector is not included.
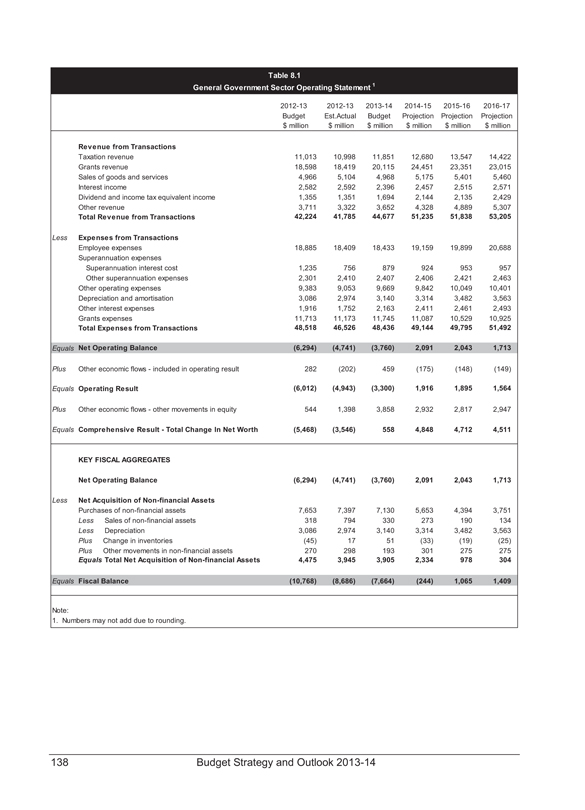
Table 8.1
General Government Sector Operating Statement1
2012-13 2012-13 2013-14 2014-15 2015-16 2016-17
Budget Est.Actual Budget Projection Projection Projection
$ million $ million $ million $ million $ million $ million
Revenue from Transactions
Taxation revenue 11,013 10,998 11,851 12,680 13,547 14,422
Grants revenue 18,598 18,419 20,115 24,451 23,351 23,015
Sales of goods and services 4,966 5,104 4,968 5,175 5,401 5,460
Interest income 2,582 2,592 2,396 2,457 2,515 2,571
Dividend and income tax equivalent income 1,355 1,351 1,694 2,144 2,135 2,429
Other revenue 3,711 3,322 3,652 4,328 4,889 5,307
Total Revenue from Transactions 42,224 41,785 44,677 51,235 51,838 53,205
Less Expenses from Transactions
Employee expenses 18,885 18,409 18,433 19,159 19,899 20,688
Superannuation expenses
Superannuation interest cost 1,235 756 879 924 953 957
Other superannuation expenses 2,301 2,410 2,407 2,406 2,421 2,463
Other operating expenses 9,383 9,053 9,669 9,842 10,049 10,401
Depreciation and amortisation 3,086 2,974 3,140 3,314 3,482 3,563
Other interest expenses 1,916 1,752 2,163 2,411 2,461 2,493
Grants expenses 11,713 11,173 11,745 11,087 10,529 10,925
Total Expenses from Transactions 48,518 46,526 48,436 49,144 49,795 51,492
Equals Net Operating Balance (6,294) (4,741) (3,760) 2,091 2,043 1,713
Plus Other economic flows - included in operating result 282 (202) 459 (175) (148) (149)
Equals Operating Result (6,012) (4,943) (3,300) 1,916 1,895 1,564
Plus Other economic flows - other movements in equity 544 1,398 3,858 2,932 2,817 2,947
Equals Comprehensive Result - Total Change In Net Worth (5,468) (3,546) 558 4,848 4,712 4,511
KEY FISCAL AGGREGATES
Net Operating Balance (6,294) (4,741) (3,760) 2,091 2,043 1,713
Less Net Acquisition of Non-financial Assets
Purchases of non-financial assets 7,653 7,397 7,130 5,653 4,394 3,751
Less Sales of non-financial assets 318 794 330 273 190 134
Less Depreciation 3,086 2,974 3,140 3,314 3,482 3,563
Plus Change in inventories (45) 17 51 (33) (19) (25)
Plus Other movements in non-financial assets 270 298 193 301 275 275
Equals Total Net Acquisition of Non-financial Assets 4,475 3,945 3,905 2,334 978 304
Equals Fiscal Balance (10,768) (8,686) (7,664) (244) 1,065 1,409
Note:
1. Numbers may not add due to rounding.
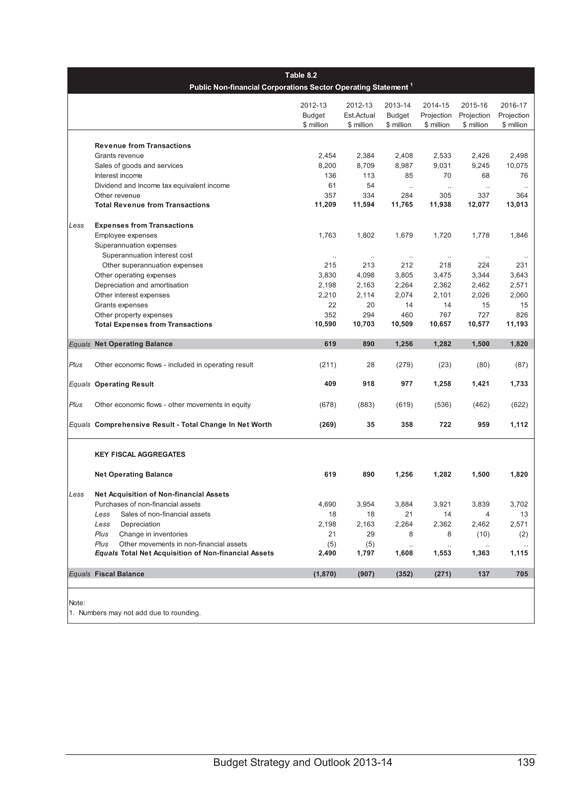
Table 8.2
Public Non-financial Corporations Sector Operating Statement 1
2012-13 Budget $ million
2012-13 Est.Actual $ million
2013-14 Budget $ million
2014-15 Projection $ million
2015-16 Projection $ million
2016-17 Projection $ million
Revenue from Transactions
Grants revenue
2,454
2,384
2,408
2,533
2,426
2,498
Sales of goods and services
8,200
8,709
8,987
9,031
9,245
10,075
Interest income
136
113
85
70
68
76
Dividend and income tax equivalent income
61
54
..
..
..
..
Other revenue
357
334
284
305
337
364
Total Revenue from Transactions
11,209
11,594
11,765
11,938
12,077
13,013
Less
Expenses from Transactions
Employee expenses
1,763
1,802
1,679
1,720
1,778
1,846
Superannuation expenses
Superannuation interest cost
..
..
..
..
..
..
Other superannuation expenses
215
213
212
218
224
231
Other operating expenses
3,830
4,098
3,805
3,475
3,344
3,643
Depreciation and amortisation
2,198
2,163
2,264
2,362
2,462
2,571
Other interest expenses
2,210
2,114
2,074
2,101
2,026
2,060
Grants expenses
22
20
14
14
15
15
Other property expenses
352
294
460
767
727
826
Total Expenses from Transactions
10,590
10,703
10,509
10,657
10,577
11,193
Equals
Net Operating Balance
619
890
1,256
1,282
1,500
1,820
Plus
Other economic flows - included in operating result
(211)
28
(279)
(23)
(80)
(87)
Equals
Operating Result
409
918
977
1,258
1,421
1,733
Plus
Other economic flows - other movements in equity
(678)
(883)
(619)
(536)
(462)
(622)
Equals
Comprehensive Result - Total Change In Net Worth
(269)
35
358
722
959
1,112
KEY FISCAL AGGREGATES
Net Operating Balance
619
890
1,256
1,282
1,500
1,820
Less
Net Acquisition of Non-financial Assets
Purchases of non-financial assets
4,690
3,954
3,884
3,921
3,839
3,702
Less Sales of non-financial assets
18
18
21
14
4
13
Less Depreciation
2,198
2,163
2,264
2,362
2,462
2,571
Plus Change in inventories
21
29
8
8
(10)
(2)
Plus Other movements in non-financial assets
(5)
(5)
..
..
..
..
Equals Total Net Acquisition of Non-financial Assets
2,490
1,797
1,608
1,553
1,363
1,115
Equals
Fiscal Balance
(1,870)
(907)
(352)
(271)
137
705
Note:
1. Numbers may not add due to rounding.
Budget Strategy and Outlook 2013-14 139
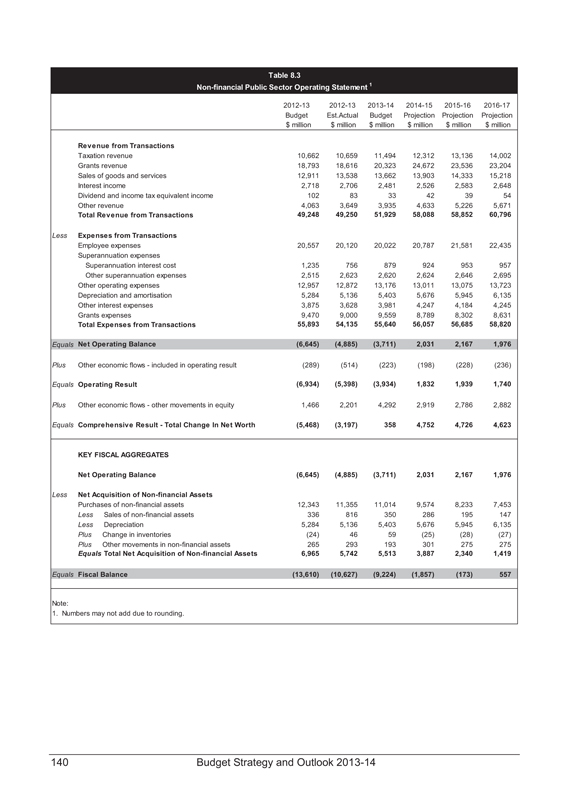
Table 8.3
Non-financial Public Sector Operating Statement 1
2012-13 Budget $ million
2012-13 Est.Actual $ million
2013-14 Budget $ million
2014-15 Projection $ million
2015-16 Projection $ million
2016-17 Projection $ million
Revenue from Transactions
Taxation revenue
10,662
10,659
11,494
12,312
13,136
14,002
Grants revenue
18,793
18,616
20,323
24,672
23,536
23,204
Sales of goods and services
12,911
13,538
13,662
13,903
14,333
15,218
Interest income
2,718
2,706
2,481
2,526
2,583
2,648
Dividend and income tax equivalent income
102
83
33
42
39
54
Other revenue
4,063
3,649
3,935
4,633
5,226
5,671
Total Revenue from Transactions
49,248
49,250
51,929
58,088
58,852
60,796
Less
Expenses from Transactions
Employee expenses
20,557
20,120
20,022
20,787
21,581
22,435
Superannuation expenses
Superannuation interest cost
1,235
756
879
924
953
957
Other superannuation expenses
2,515
2,623
2,620
2,624
2,646
2,695
Other operating expenses
12,957
12,872
13,176
13,011
13,075
13,723
Depreciation and amortisation
5,284
5,136
5,403
5,676
5,945
6,135
Other interest expenses
3,875
3,628
3,981
4,247
4,184
4,245
Grants expenses
9,470
9,000
9,559
8,789
8,302
8,631
Total Expenses from Transactions
55,893
54,135
55,640
56,057
56,685
58,820
Equals
Net Operating Balance
(6,645)
(4,885)
(3,711)
2,031
2,167
1,976
Plus
Other economic flows - included in operating result
(289)
(514)
(223)
(198)
(228)
(236)
Equals
Operating Result
(6,934)
(5,398)
(3,934)
1,832
1,939
1,740
Plus
Other economic flows - other movements in equity
1,466
2,201
4,292
2,919
2,786
2,882
Equals
Comprehensive Result - Total Change In Net Worth
(5,468)
(3,197)
358
4,752
4,726
4,623
KEY FISCAL AGGREGATES
Net Operating Balance
(6,645)
(4,885)
(3,711)
2,031
2,167
1,976
Less
Net Acquisition of Non-financial Assets
Purchases of non-financial assets
12,343
11,355
11,014
9,574
8,233
7,453
Less Sales of non-financial assets
336
816
350
286
195
147
Less Depreciation
5,284
5,136
5,403
5,676
5,945
6,135
Plus Change in inventories
(24)
46
59
(25)
(28)
(27)
Plus Other movements in non-financial assets
265
293
193
301
275
275
Equals Total Net Acquisition of Non-financial Assets
6,965
5,742
5,513
3,887
2,340
1,419
Equals
Fiscal Balance
(13,610)
(10,627)
(9,224)
(1,857)
(173)
557
Note:
1. Numbers may not add due to rounding.
140 Budget Strategy and Outlook 2013-14
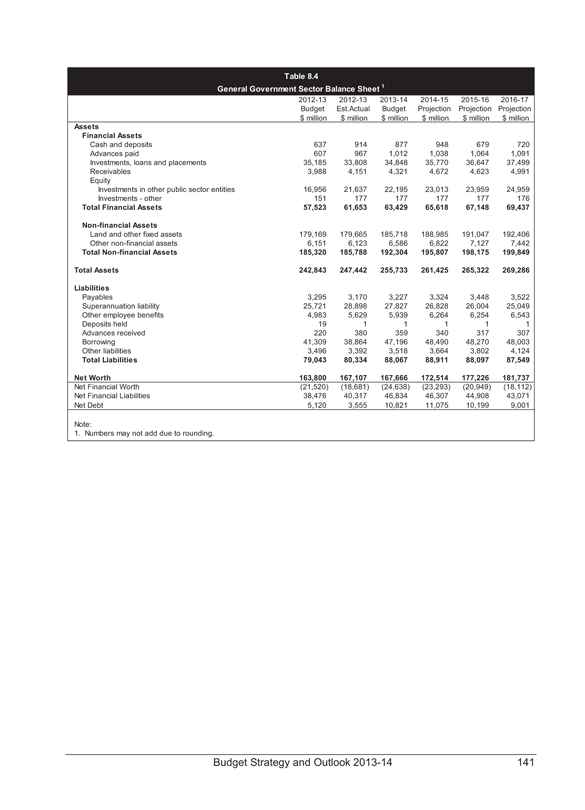
Table 8.4
General Government Sector Balance Sheet 1
2012-13 Budget $ million
2012-13 Est.Actual $ million
2013-14 Budget $ million
2014-15 Projection $ million
2015-16 Projection $ million
2016-17 Projection $ million
Assets
Financial Assets
Cash and deposits
637
914
877
948
679
720
Advances paid
607
967
1,012
1,038
1,064
1,091
Investments, loans and placements
35,185
33,808
34,848
35,770
36,647
37,499
Receivables
3,988
4,151
4,321
4,672
4,623
4,991
Equity
Investments in other public sector entities
16,956
21,637
22,195
23,013
23,959
24,959
Investments - other
151
177
177
177
177
176
Total Financial Assets
57,523
61,653
63,429
65,618
67,148
69,437
Non-financial Assets
Land and other fixed assets
179,169
179,665
185,718
188,985
191,047
192,406
Other non-financial assets
6,151
6,123
6,586
6,822
7,127
7,442
Total Non-financial Assets
185,320
185,788
192,304
195,807
198,175
199,849
Total Assets
242,843
247,442
255,733
261,425
265,322
269,286
Liabilities
Payables
3,295
3,170
3,227
3,324
3,448
3,522
Superannuation liability
25,721
28,898
27,827
26,828
26,004
25,049
Other employee benefits
4,983
5,629
5,939
6,264
6,254
6,543
Deposits held
19
1
1
1
1
1
Advances received
220
380
359
340
317
307
Borrowing
41,309
38,864
47,196
48,490
48,270
48,003
Other liabilities
3,496
3,392
3,518
3,664
3,802
4,124
Total Liabilities
79,043
80,334
88,067
88,911
88,097
87,549
Net Worth
163,800
167,107
167,666
172,514
177,226
181,737
Net Financial Worth
(21,520)
(18,681)
(24,638)
(23,293)
(20,949)
(18,112)
Net Financial Liabilities
38,476
40,317
46,834
46,307
44,908
43,071
Net Debt
5,120
3,555
10,821
11,075
10,199
9,001
Note:
1. Numbers may not add due to rounding.
Budget Strategy and Outlook 2013-14 141
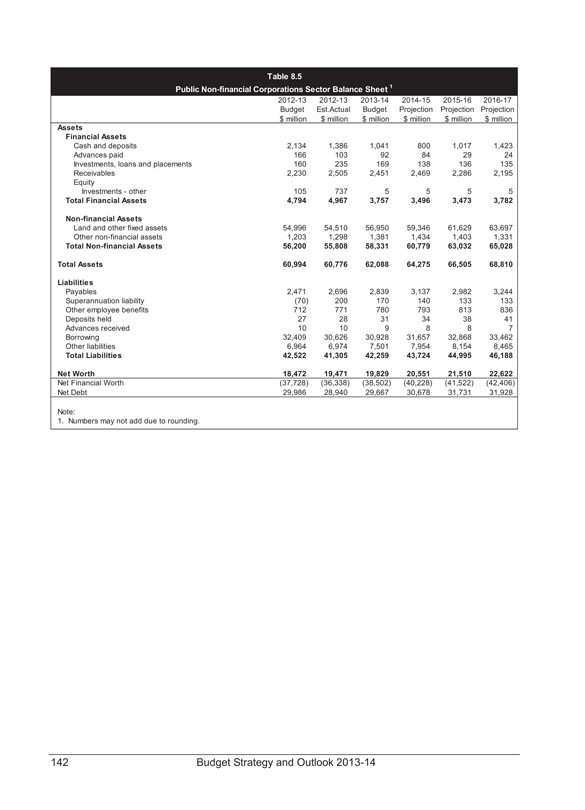
Table 8.5
Public Non-financial Corporations Sector Balance Sheet 1
2012-13 Budget $ million
2012-13 Est.Actual $ million
2013-14 Budget $ million
2014-15 Projection $ million
2015-16 Projection $ million
2016-17 Projection $ million
Assets
Financial Assets
Cash and deposits
2,134
1,386
1,041
800
1,017
1,423
Advances paid
166
103
92
84
29
24
Investments, loans and placements
160
235
169
138
136
135
Receivables
2,230
2,505
2,451
2,469
2,286
2,195
Equity
Investments - other
105
737
5
5
5
5
Total Financial Assets
4,794
4,967
3,757
3,496
3,473
3,782
Non-financial Assets
Land and other fixed assets
54,996
54,510
56,950
59,346
61,629
63,697
Other non-financial assets
1,203
1,298
1,381
1,434
1,403
1,331
Total Non-financial Assets
56,200
55,808
58,331
60,779
63,032
65,028
Total Assets
60,994
60,776
62,088
64,275
66,505
68,810
Liabilities
Payables
2,471
2,696
2,839
3,137
2,982
3,244
Superannuation liability
(70)
200
170
140
133
133
Other employee benefits
712
771
780
793
813
836
Deposits held
27
28
31
34
38
41
Advances received
10
10
9
8
8
7
Borrowing
32,409
30,626
30,928
31,657
32,868
33,462
Other liabilities
6,964
6,974
7,501
7,954
8,154
8,465
Total Liabilities
42,522
41,305
42,259
43,724
44,995
46,188
Net Worth
18,472
19,471
19,829
20,551
21,510
22,622
Net Financial Worth
(37,728)
(36,338)
(38,502)
(40,228)
(41,522)
(42,406)
Net Debt
29,986
28,940
29,667
30,678
31,731
31,928
Note:
1. Numbers may not add due to rounding.
142 Budget Strategy and Outlook 2013-14

Table 8.6
Non-financial Public Sector Balance Sheet 1
2012-13 Budget $ million
2012-13 Est.Actual $ million
2013-14 Budget $ million
2014-15 Projection $ million
2015-16 Projection $ million
2016-17 Projection $ million
Assets
Financial Assets
Cash and deposits
2,771
2,300
1,918
1,748
1,696
2,143
Advances paid
762
1,060
1,094
1,114
1,085
1,108
Investments, loans and placements
35,344
34,043
35,016
35,908
36,782
37,634
Receivables
4,802
5,045
4,986
5,070
5,026
5,092
Equity
Investments in other public sector entities
(1,419)
1,000
1,000
1,000
1,000
1,000
Investments - other
160
914
182
182
182
182
Total Financial Assets
42,421
44,363
44,196
45,021
45,771
47,158
Non-financial Assets
Land and other fixed assets
234,165
234,175
242,667
248,330
252,675
256,103
Other non-financial assets
692
742
774
776
748
709
Total Non-financial Assets
234,857
234,917
243,441
249,106
253,423
256,812
Total Assets
277,277
279,281
287,638
294,128
299,195
303,971
Liabilities
Payables
4,389
4,295
4,322
4,430
4,588
4,712
Superannuation liability
25,651
29,098
27,997
26,969
26,137
25,182
Other employee benefits
5,695
6,400
6,718
7,056
7,067
7,379
Deposits held
47
29
33
36
39
42
Advances received
220
380
359
340
317
307
Borrowing
73,717
69,490
78,125
80,147
81,137
81,465
Other liabilities
3,758
3,647
3,786
4,099
4,132
4,485
Total Liabilities
113,477
113,340
121,339
123,077
123,419
123,572
Net Worth
163,800
165,941
166,299
171,051
175,776
180,399
Net Financial Worth
(71,056)
(68,976)
(77,143)
(78,056)
(77,647)
(76,413)
Net Financial Liabilities
69,638
69,976
78,143
79,056
78,647
77,414
Net Debt
35,106
32,495
40,488
41,753
41,930
40,929
Note:
1. Numbers may not add due to rounding.
Budget Strategy and Outlook 2013-14 143
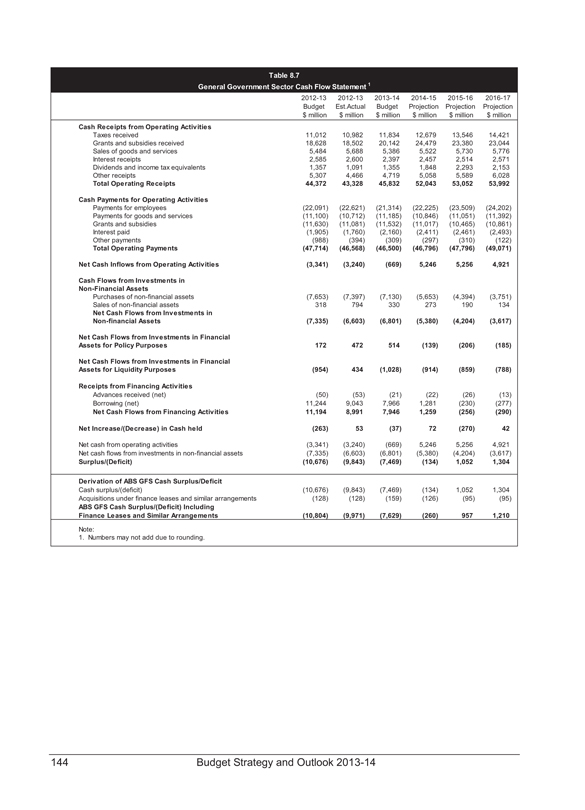
Table 8.7
General Government Sector Cash Flow Statement 1
2012-13 Budget $ million
2012-13 Est.Actual $ million
2013-14 Budget $ million
2014-15 Projection $ million
2015-16 Projection $ million
2016-17 Projection $ million
Cash Receipts from Operating Activities
Taxes received
11,012
10,982
11,834
12,679
13,546
14,421
Grants and subsidies received
18,628
18,502
20,142
24,479
23,380
23,044
Sales of goods and services
5,484
5,688
5,386
5,522
5,730
5,776
Interest receipts
2,585
2,600
2,397
2,457
2,514
2,571
Dividends and income tax equivalents
1,357
1,091
1,355
1,848
2,293
2,153
Other receipts
5,307
4,466
4,719
5,058
5,589
6,028
Total Operating Receipts
44,372
43,328
45,832
52,043
53,052
53,992
Cash Payments for Operating Activities
Payments for employees
(22,091)
(22,621)
(21,314)
(22,225)
(23,509)
(24,202)
Payments for goods and services
(11,100)
(10,712)
(11,185)
(10,846)
(11,051)
(11,392)
Grants and subsidies
(11,630)
(11,081)
(11,532)
(11,017)
(10,465)
(10,861)
Interest paid
(1,905)
(1,760)
(2,160)
(2,411)
(2,461)
(2,493)
Other payments
(988)
(394)
(309)
(297)
(310)
(122)
Total Operating Payments
(47,714)
(46,568)
(46,500)
(46,796)
(47,796)
(49,071)
Net Cash Inflows from Operating Activities
(3,341)
(3,240)
(669)
5,246
5,256
4,921
Cash Flows from Investments in Non-Financial Assets
Purchases of non-financial assets
(7,653)
(7,397)
(7,130)
(5,653)
(4,394)
(3,751)
Sales of non-financial assets
318
794
330
273
190
134
Net Cash Flows from Investments in Non-financial Assets
(7,335)
(6,603)
(6,801)
(5,380)
(4,204)
(3,617)
Net Cash Flows from Investments in Financial Assets for Policy Purposes
172
472
514
(139)
(206)
(185)
Net Cash Flows from Investments in Financial Assets for Liquidity Purposes
(954)
434
(1,028)
(914)
(859)
(788)
Receipts from Financing Activities
Advances received (net)
(50)
(53)
(21)
(22)
(26)
(13)
Borrowing (net)
11,244
9,043
7,966
1,281
(230)
(277)
Net Cash Flows from Financing Activities
11,194
8,991
7,946
1,259
(256)
(290)
Net Increase/(Decrease) in Cash held
(263)
53
(37)
72
(270)
42
Net cash from operating activities
(3,341)
(3,240)
(669)
5,246
5,256
4,921
Net cash flows from investments in non-financial assets
(7,335)
(6,603)
(6,801)
(5,380)
(4,204)
(3,617)
Surplus/(Deficit)
(10,676)
(9,843)
(7,469)
(134)
1,052
1,304
Derivation of ABS GFS Cash Surplus/Deficit
Cash surplus/(deficit)
(10,676)
(9,843)
(7,469)
(134)
1,052
1,304
Acquisitions under finance leases and similar arrangements
(128)
(128)
(159)
(126)
(95)
(95)
ABS GFS Cash Surplus/(Deficit) Including
Finance Leases and Similar Arrangements
(10,804)
(9,971)
(7,629)
(260)
957
1,210
Note:
1. Numbers may not add due to rounding.
144 Budget Strategy and Outlook 2013-14
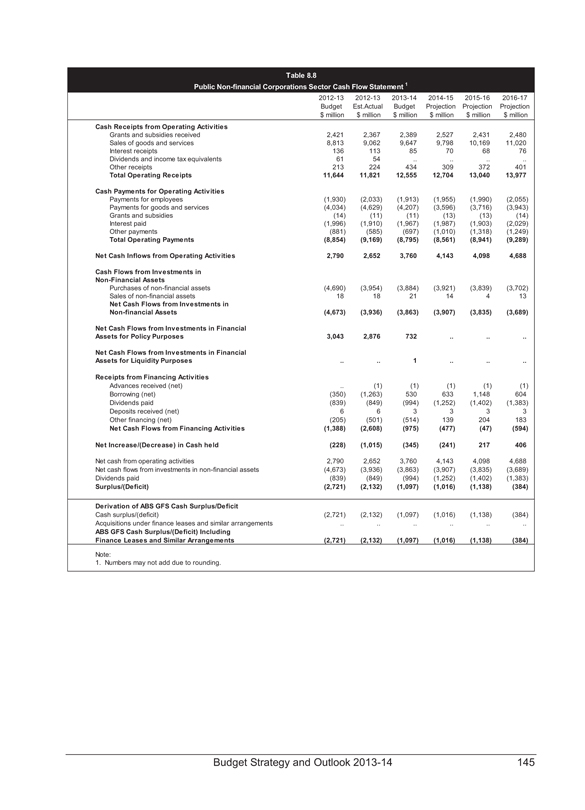
Table 8.8
Public Non-financial Corporations Sector Cash Flow Statement 1
2012-13 Budget $ million
2012-13 Est.Actual $ million
2013-14 Budget $ million
2014-15 Projection $ million
2015-16 Projection $ million
2016-17 Projection $ million
Cash Receipts from Operating Activities
Grants and subsidies received
2,421
2,367
2,389
2,527
2,431
2,480
Sales of goods and services
8,813
9,062
9,647
9,798
10,169
11,020
Interest receipts
136
113
85
70
68
76
Dividends and income tax equivalents
61
54
..
..
..
..
Other receipts
213
224
434
309
372
401
Total Operating Receipts
11,644
11,821
12,555
12,704
13,040
13,977
Cash Payments for Operating Activities
Payments for employees
(1,930)
(2,033)
(1,913)
(1,955)
(1,990)
(2,055)
Payments for goods and services
(4,034)
(4,629)
(4,207)
(3,596)
(3,716)
(3,943)
Grants and subsidies
(14)
(11)
(11)
(13)
(13)
(14)
Interest paid
(1,996)
(1,910)
(1,967)
(1,987)
(1,903)
(2,029)
Other payments
(881)
(585)
(697)
(1,010)
(1,318)
(1,249)
Total Operating Payments
(8,854)
(9,169)
(8,795)
(8,561)
(8,941)
(9,289)
Net Cash Inflows from Operating Activities
2,790
2,652
3,760
4,143
4,098
4,688
Cash Flows from Investments in Non-Financial Assets
Purchases of non-financial assets
(4,690)
(3,954)
(3,884)
(3,921)
(3,839)
(3,702)
Sales of non-financial assets
18
18
21
14
4
13
Net Cash Flows from Investments in Non-financial Assets
(4,673)
(3,936)
(3,863)
(3,907)
(3,835)
(3,689)
Net Cash Flows from Investments in Financial Assets for Policy Purposes
3,043
2,876
732
..
..
..
Net Cash Flows from Investments in Financial Assets for Liquidity Purposes
..
..
1
..
..
..
Receipts from Financing Activities
Advances received (net)
..
(1)
(1)
(1)
(1)
(1)
Borrowing (net)
(350)
(1,263)
530
633
1,148
604
Dividends paid
(839)
(849)
(994)
(1,252)
(1,402)
(1,383)
Deposits received (net)
6
6
3
3
3
3
Other financing (net)
(205)
(501)
(514)
139
204
183
Net Cash Flows from Financing Activities
(1,388)
(2,608)
(975)
(477)
(47)
(594)
Net Increase/(Decrease) in Cash held
(228)
(1,015)
(345)
(241)
217
406
Net cash from operating activities
2,790
2,652
3,760
4,143
4,098
4,688
Net cash flows from investments in non-financial assets
(4,673)
(3,936)
(3,863)
(3,907)
(3,835)
(3,689)
Dividends paid
(839)
(849)
(994)
(1,252)
(1,402)
(1,383)
Surplus/(Deficit)
(2,721)
(2,132)
(1,097)
(1,016)
(1,138)
(384)
Derivation of ABS GFS Cash Surplus/Deficit
Cash surplus/(deficit)
(2,721)
(2,132)
(1,097)
(1,016)
(1,138)
(384)
Acquisitions under finance leases and similar arrangements
..
..
..
..
..
..
ABS GFS Cash Surplus/(Deficit) Including Finance Leases and Similar Arrangements
(2,721)
(2,132)
(1,097)
(1,016)
(1,138)
(384)
Note:
1. Numbers may not add due to rounding.
Budget Strategy and Outlook 2013-14 145
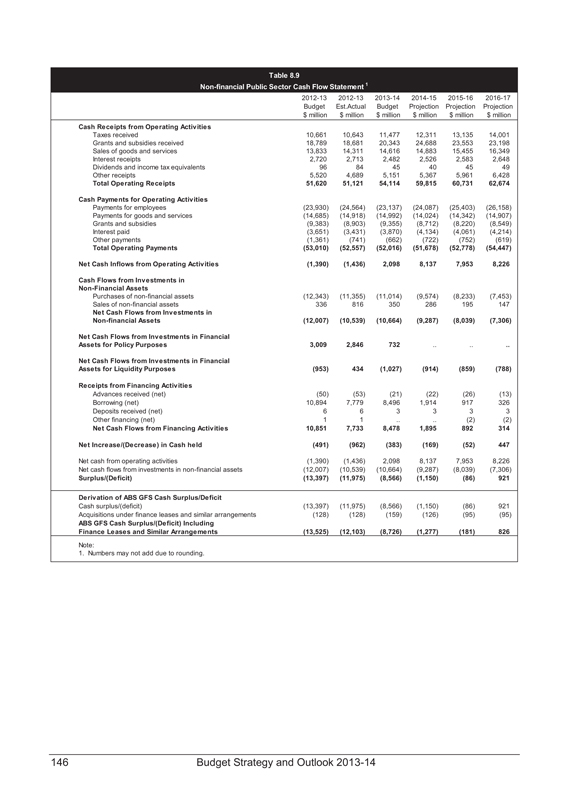
Table 8.9
Non-financial Public Sector Cash Flow Statement 1
2012-13 Budget $ million
2012-13 Est.Actual $ million
2013-14 Budget $ million
2014-15 Projection $ million
2015-16 Projection $ million
2016-17 Projection $ million
Cash Receipts from Operating Activities
Taxes received
10,661
10,643
11,477
12,311
13,135
14,001
Grants and subsidies received
18,789
18,681
20,343
24,688
23,553
23,198
Sales of goods and services
13,833
14,311
14,616
14,883
15,455
16,349
Interest receipts
2,720
2,713
2,482
2,526
2,583
2,648
Dividends and income tax equivalents
96
84
45
40
45
49
Other receipts
5,520
4,689
5,151
5,367
5,961
6,428
Total Operating Receipts
51,620
51,121
54,114
59,815
60,731
62,674
Cash Payments for Operating Activities
Payments for employees
(23,930)
(24,564)
(23,137)
(24,087)
(25,403)
(26,158)
Payments for goods and services
(14,685)
(14,918)
(14,992)
(14,024)
(14,342)
(14,907)
Grants and subsidies
(9,383)
(8,903)
(9,355)
(8,712)
(8,220)
(8,549)
Interest paid
(3,651)
(3,431)
(3,870)
(4,134)
(4,061)
(4,214)
Other payments
(1,361)
(741)
(662)
(722)
(752)
(619)
Total Operating Payments
(53,010)
(52,557)
(52,016)
(51,678)
(52,778)
(54,447)
Net Cash Inflows from Operating Activities
(1,390)
(1,436)
2,098
8,137
7,953
8,226
Cash Flows from Investments in Non-Financial Assets
Purchases of non-financial assets
(12,343)
(11,355)
(11,014)
(9,574)
(8,233)
(7,453)
Sales of non-financial assets
336
816
350
286
195
147
Net Cash Flows from Investments in Non-financial Assets
(12,007)
(10,539)
(10,664)
(9,287)
(8,039)
(7,306)
Net Cash Flows from Investments in Financial Assets for Policy Purposes
3,009
2,846
732
..
..
..
Net Cash Flows from Investments in Financial Assets for Liquidity Purposes
(953)
434
(1,027)
(914)
(859)
(788)
Receipts from Financing Activities
Advances received (net)
(50)
(53)
(21)
(22)
(26)
(13)
Borrowing (net)
10,894
7,779
8,496
1,914
917
326
Deposits received (net)
6
6
3
3
3
3
Other financing (net)
1
1
..
..
(2)
(2)
Net Cash Flows from Financing Activities
10,851
7,733
8,478
1,895
892
314
Net Increase/(Decrease) in Cash held
(491)
(962)
(383)
(169)
(52)
447
Net cash from operating activities
(1,390)
(1,436)
2,098
8,137
7,953
8,226
Net cash flows from investments in non-financial assets
(12,007)
(10,539)
(10,664)
(9,287)
(8,039)
(7,306)
Surplus/(Deficit)
(13,397)
(11,975)
(8,566)
(1,150)
(86)
921
Derivation of ABS GFS Cash Surplus/Deficit
Cash surplus/(deficit)
(13,397)
(11,975)
(8,566)
(1,150)
(86)
921
Acquisitions under finance leases and similar arrangements
(128)
(128)
(159)
(126)
(95)
(95)
ABS GFS Cash Surplus/(Deficit) Including Finance Leases and Similar Arrangements
(13,525)
(12,103)
(8,726)
(1,277)
(181)
826
Note:
1. Numbers may not add due to rounding.
146 Budget Strategy and Outlook 2013-14
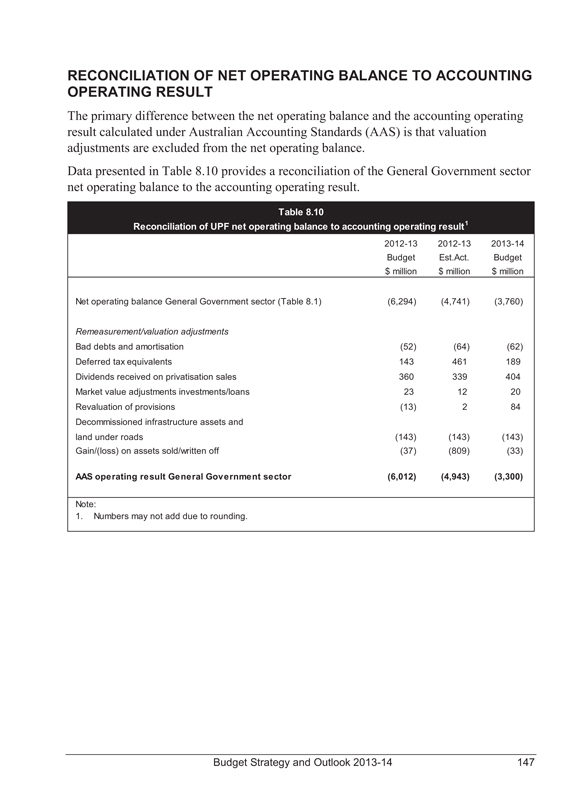
RECONCILIATION OF NET OPERATING BALANCE TO ACCOUNTING OPERATING RESULT
The primary difference between the net operating balance and the accounting operating result calculated under Australian Accounting Standards (AAS) is that valuation adjustments are excluded from the net operating balance.
Data presented in Table 8.10 provides a reconciliation of the General Government sector net operating balance to the accounting operating result.
Table 8.10
Reconciliation of UPF net operating balance to accounting operating result1
| | | | | | |
| | | 2012-13 Budget $ million | | 2012-13 Est.Act. $ million | | 2013-14 Budget $ million |
Net operating balance General Government sector (Table 8.1) | | (6,294) | | (4,741) | | (3,760) |
Remeasurement/valuation adjustments | | | | | | |
Bad debts and amortisation | | (52) | | (64) | | (62) |
Deferred tax equivalents | | 143 | | 461 | | 189 |
Dividends received on privatisation sales | | 360 | | 339 | | 404 |
Market value adjustments investments/loans | | 23 | | 12 | | 20 |
Revaluation of provisions | | (13) | | 2 | | 84 |
Decommissioned infrastructure assets and land under roads | | (143) | | (143) | | (143) |
Gain/(loss) on assets sold/written off | | (37) | | (809) | | (33) |
AAS operating result General Government sector | | (6,012) | | (4,943) | | (3,300) |
Note:
1. Numbers may not add due to rounding.
Budget Strategy and Outlook 2013-14 147
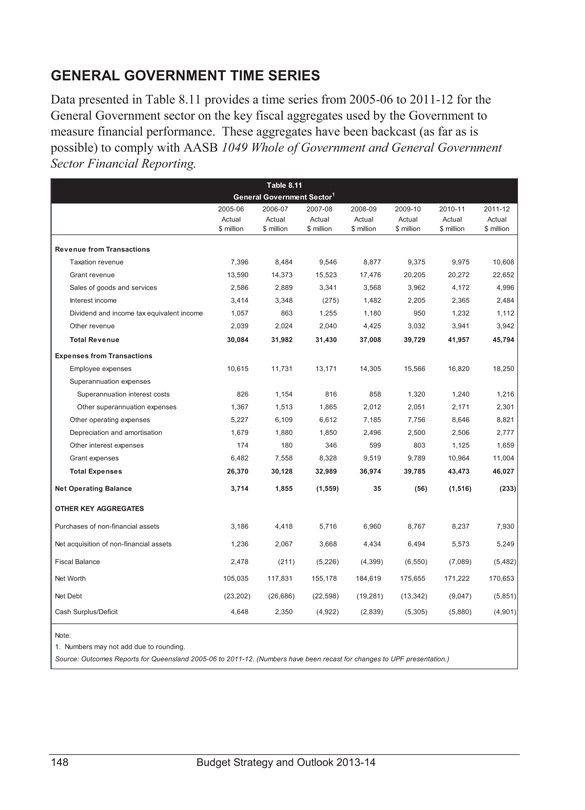
GENERAL GOVERNMENT TIME SERIES
Data presented in Table 8.11 provides a time series from 2005-06 to 2011-12 for the General Government sector on the key fiscal aggregates used by the Government to measure financial performance. These aggregates have been backcast (as far as is possible) to comply with AASB 1049 Whole of Government and General Government Sector Financial Reporting.
Table 8.11
General Government Sector1
2005-06 Actual $ million
2006-07 Actual $ million
2007-08 Actual $ million
2008-09 Actual $ million
2009-10 Actual $ million
2010-11 Actual $ million
2011-12 Actual $ million
Revenue from Transactions
Taxation revenue
7,396
8,484
9,546
8,877
9,375
9,975
10,608
Grant revenue
13,590
14,373
15,523
17,476
20,205
20,272
22,652
Sales of goods and services
2,586
2,889
3,341
3,568
3,962
4,172
4,996
Interest income
3,414
3,348
(275)
1,482
2,205
2,365
2,484
Dividend and income tax equivalent income
1,057
863
1,255
1,180
950
1,232
1,112
Other revenue
2,039
2,024
2,040
4,425
3,032
3,941
3,942
Total Revenue
30,084
31,982
31,430
37,008
39,729
41,957
45,794
Expenses from Transactions
Employee expenses
10,615
11,731
13,171
14,305
15,566
16,820
18,250
Superannuation expenses
Superannuation interest costs
826
1,154
816
858
1,320
1,240
1,216
Other superannuation expenses
1,367
1,513
1,865
2,012
2,051
2,171
2,301
Other operating expenses
5,227
6,109
6,612
7,185
7,756
8,646
8,821
Depreciation and amortisation
1,679
1,880
1,850
2,496
2,500
2,506
2,777
Other interest expenses
174
180
346
599
803
1,125
1,659
Grant expenses
6,482
7,558
8,328
9,519
9,789
10,964
11,004
Total Expenses
26,370
30,128
32,989
36,974
39,785
43,473
46,027
Net Operating Balance
3,714
1,855
(1,559)
35
(56)
(1,516)
(233)
OTHER KEY AGGREGATES
Purchases of non-financial assets
3,186
4,418
5,716
6,960
8,767
8,237
7,930
Net acquisition of non-financial assets
1,236
2,067
3,668
4,434
6,494
5,573
5,249
Fiscal Balance
2,478
(211)
(5,226)
(4,399)
(6,550)
(7,089)
(5,482)
Net Worth
105,035
117,831
155,178
184,619
175,655
171,222
170,653
Net Debt
(23,202)
(26,686)
(22,598)
(19,281)
(13,342)
(9,047)
(5,851)
Cash Surplus/Deficit
4,648
2,350
(4,922)
(2,839)
(5,305)
(5,880)
(4,901)
Note:
1. Numbers may not add due to rounding.
Source: Outcomes Reports for Queensland 2005-06 to 2011-12. (Numbers have been recast for changes to UPF presentation.)
148 Budget Strategy and Outlook 2013-14
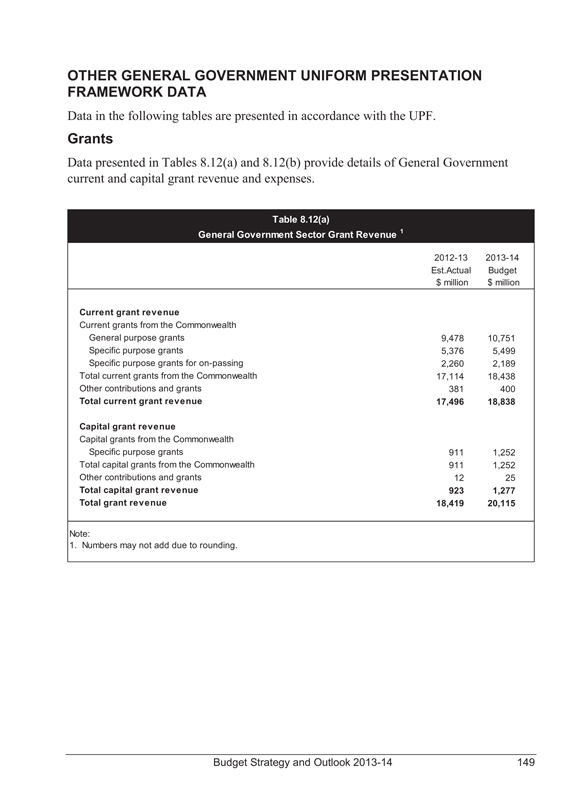
OTHER GENERAL GOVERNMENT UNIFORM PRESENTATION FRAMEWORK DATA
Data in the following tables are presented in accordance with the UPF.
Grants
Data presented in Tables 8.12(a) and 8.12(b) provide details of General Government current and capital grant revenue and expenses.
Table 8.12(a)
General Government Sector Grant Revenue 1
2012-13 Est.Actual $ million
2013-14 Budget $ million
Current grant revenue
Current grants from the Commonwealth
General purpose grants
9,478
10,751
Specific purpose grants
5,376
5,499
Specific purpose grants for on-passing
2,260
2,189
Total current grants from the Commonwealth
17,114
18,438
Other contributions and grants
381
400
Total current grant revenue
17,496
18,838
Capital grant revenue
Capital grants from the Commonwealth
Specific purpose grants
911
1,252
Total capital grants from the Commonwealth
911
1,252
Other contributions and grants
12
25
Total capital grant revenue
923
1,277
Total grant revenue
18,419
20,115
Note:
1. Numbers may not add due to rounding.
Budget Strategy and Outlook 2013-14 149
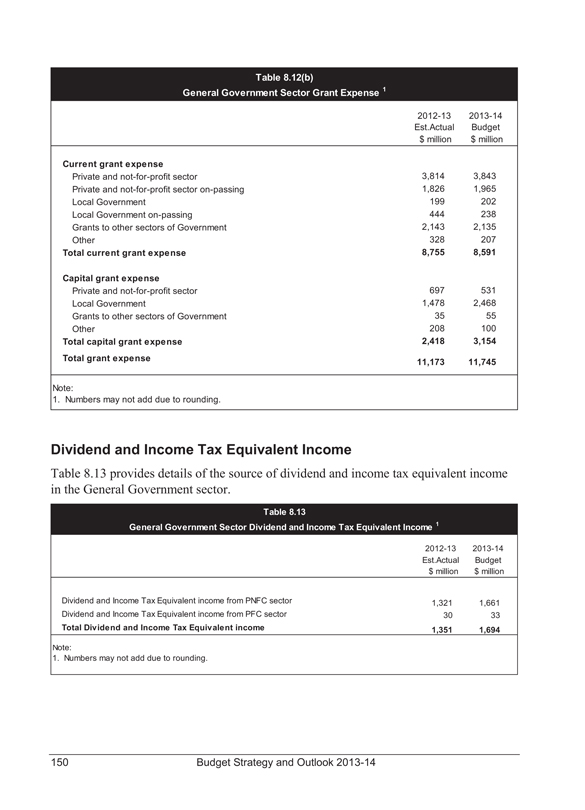
Table 8.12(b)
General Government Sector Grant Expense 1
2012-13 Est.Actual $ million
2013-14 Budget $ million
Current grant expense
Private and not-for-profit sector
3,814
3,843
Private and not-for-profit sector on-passing
1,826
1,965
Local Government
199
202
Local Government on-passing
444
238
Grants to other sectors of Government
2,143
2,135
Other
328
207
Total current grant expense
8,755
8,591
Capital grant expense
Private and not-for-profit sector
697
531
Local Government
1,478
2,468
Grants to other sectors of Government
35
55
Other
208
100
Total capital grant expense
2,418
3,154
Total grant expense
11,173
11,745
Note:
1. Numbers may not add due to rounding.
Dividend and Income Tax Equivalent Income
Table 8.13 provides details of the source of dividend and income tax equivalent income in the General Government sector.
Table 8.13
General Government Sector Dividend and Income Tax Equivalent Income 1
2012-13 Est.Actual $ million
2013-14 Budget $ million
Dividend and Income Tax Equivalent income from PNFC sector
1,321
1,661
Dividend and Income Tax Equivalent income from PFC sector
30
33
Total Dividend and Income Tax Equivalent income
1,351
1,694
Note:
1. Numbers may not add due to rounding.
150 Budget Strategy and Outlook 2013-14
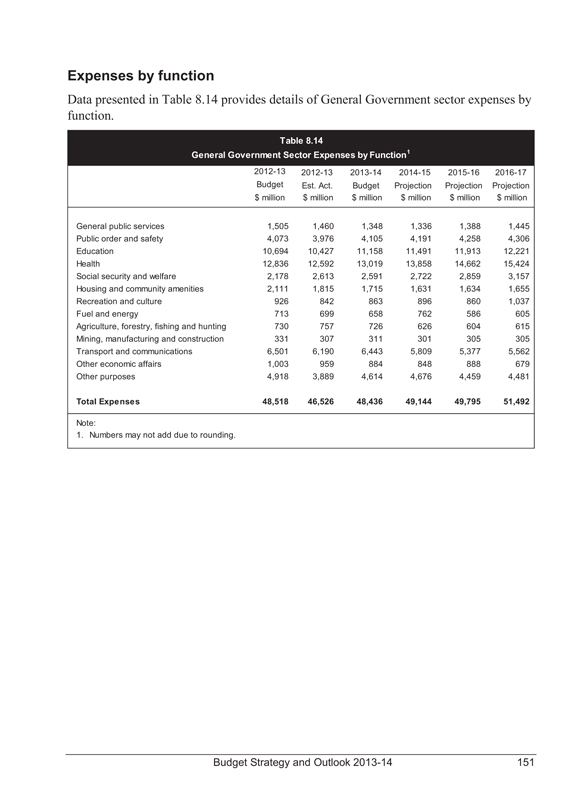
Expenses by function
Data presented in Table 8.14 provides details of General Government sector expenses by function.
Table 8.14
General Government Sector Expenses by Function1
| | | | | | | | | | | | |
| | | 2012-13 Budget $ million | | 2012-13 Est. Act. $ million | | 2013-14 Budget $ million | | 2014-15 Projection $ million | | 2015-16 Projection $ million | | 2016-17 Projection $ million |
General public services | | 1,505 | | 1,460 | | 1,348 | | 1,336 | | 1,388 | | 1,445 |
Public order and safety | | 4,073 | | 3,976 | | 4,105 | | 4,191 | | 4,258 | | 4,306 |
Education | | 10,694 | | 10,427 | | 11,158 | | 11,491 | | 11,913 | | 12,221 |
Health | | 12,836 | | 12,592 | | 13,019 | | 13,858 | | 14,662 | | 15,424 |
Social security and welfare | | 2,178 | | 2,613 | | 2,591 | | 2,722 | | 2,859 | | 3,157 |
Housing and community amenities | | 2,111 | | 1,815 | | 1,715 | | 1,631 | | 1,634 | | 1,655 |
Recreation and culture | | 926 | | 842 | | 863 | | 896 | | 860 | | 1,037 |
Fuel and energy | | 713 | | 699 | | 658 | | 762 | | 586 | | 605 |
Agriculture, forestry, fishing and hunting | | 730 | | 757 | | 726 | | 626 | | 604 | | 615 |
Mining, manufacturing and construction | | 331 | | 307 | | 311 | | 301 | | 305 | | 305 |
Transport and communications | | 6,501 | | 6,190 | | 6,443 | | 5,809 | | 5,377 | | 5,562 |
Other economic affairs | | 1,003 | | 959 | | 884 | | 848 | | 888 | | 679 |
Other purposes | | 4,918 | | 3,889 | | 4,614 | | 4,676 | | 4,459 | | 4,481 |
Total Expenses | | 48,518 | | 46,526 | | 48,436 | | 49,144 | | 49,795 | | 51,492 |
Note:
1. Numbers may not add due to rounding.
Budget Strategy and Outlook 2013-14 151
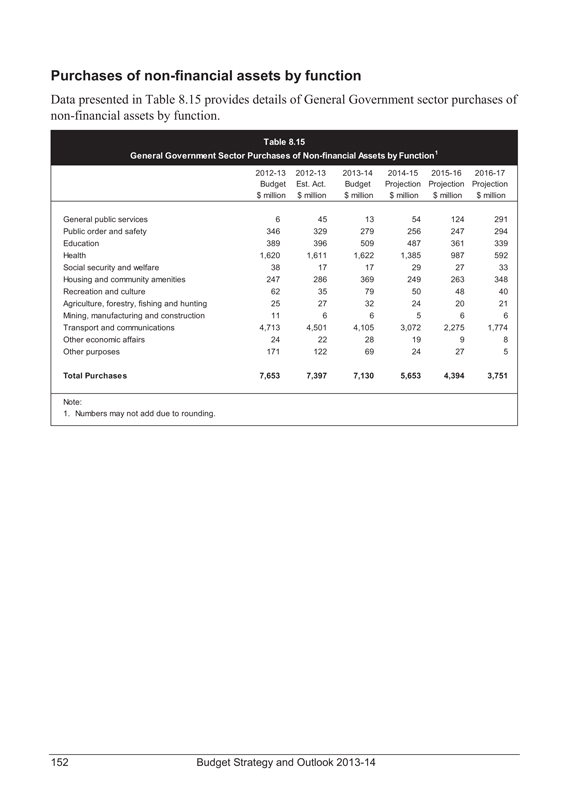
Purchases of non-financial assets by function
Data presented in Table 8.15 provides details of General Government sector purchases of non-financial assets by function.
Table 8.15
General Government Sector Purchases of Non-financial Assets by Function1
| | | | | | | | | | | | |
| | | 2012-13 Budget $ million | | 2012-13 Est. Act. $ million | | 2013-14 Budget $ million | | 2014-15 Projection $ million | | 2015-16 Projection $ million | | 2016-17 Projection $ million |
General public services | | 6 | | 45 | | 13 | | 54 | | 124 | | 291 |
Public order and safety | | 346 | | 329 | | 279 | | 256 | | 247 | | 294 |
Education | | 389 | | 396 | | 509 | | 487 | | 361 | | 339 |
Health | | 1,620 | | 1,611 | | 1,622 | | 1,385 | | 987 | | 592 |
Social security and welfare | | 38 | | 17 | | 17 | | 29 | | 27 | | 33 |
Housing and community amenities | | 247 | | 286 | | 369 | | 249 | | 263 | | 348 |
Recreation and culture | | 62 | | 35 | | 79 | | 50 | | 48 | | 40 |
Agriculture, forestry, fishing and hunting | | 25 | | 27 | | 32 | | 24 | | 20 | | 21 |
Mining, manufacturing and construction | | 11 | | 6 | | 6 | | 5 | | 6 | | 6 |
Transport and communications | | 4,713 | | 4,501 | | 4,105 | | 3,072 | | 2,275 | | 1,774 |
Other economic affairs | | 24 | | 22 | | 28 | | 19 | | 9 | | 8 |
Other purposes | | 171 | | 122 | | 69 | | 24 | | 27 | | 5 |
Total Purchases | | 7,653 | | 7,397 | | 7,130 | | 5,653 | | 4,394 | | 3,751 |
Note:
1. Numbers may not add due to rounding.
152 Budget Strategy and Outlook 2013-14
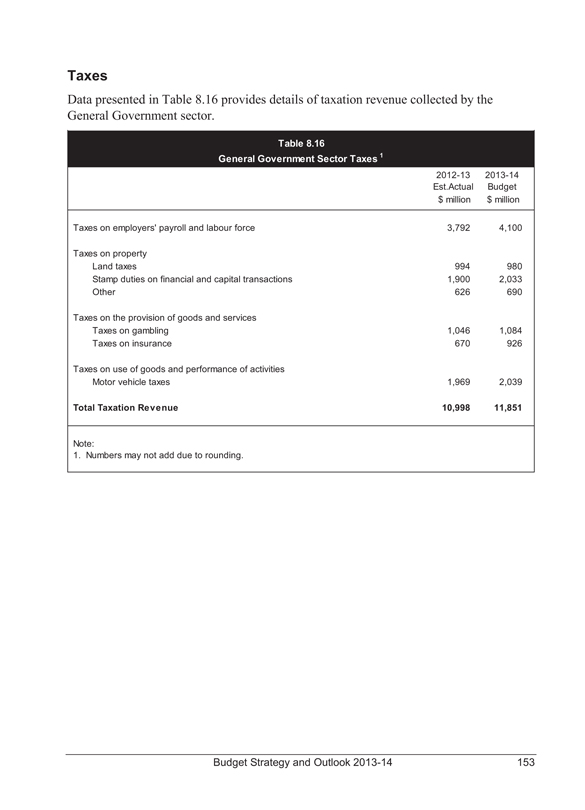
Taxes
Data presented in Table 8.16 provides details of taxation revenue collected by the General Government sector.
Table 8.16
General Government Sector Taxes 1
| | | | |
| | | 2012-13 Est.Actual $ million | | 2013-14 Budget $ million |
Taxes on employers’ payroll and labour force | | 3,792 | | 4,100 |
Taxes on property | | | | |
Land taxes | | 994 | | 980 |
Stamp duties on financial and capital transactions | | 1,900 | | 2,033 |
Other | | 626 | | 690 |
Taxes on the provision of goods and services | | | | |
Taxes on gambling | | 1,046 | | 1,084 |
Taxes on insurance | | 670 | | 926 |
Taxes on use of goods and performance of activities | | | | |
Motor vehicle taxes | | 1,969 | | 2,039 |
Total Taxation Revenue | | 10,998 | | 11,851 |
Note:
1. Numbers may not add due to rounding.
Budget Strategy and Outlook 2013-14 153
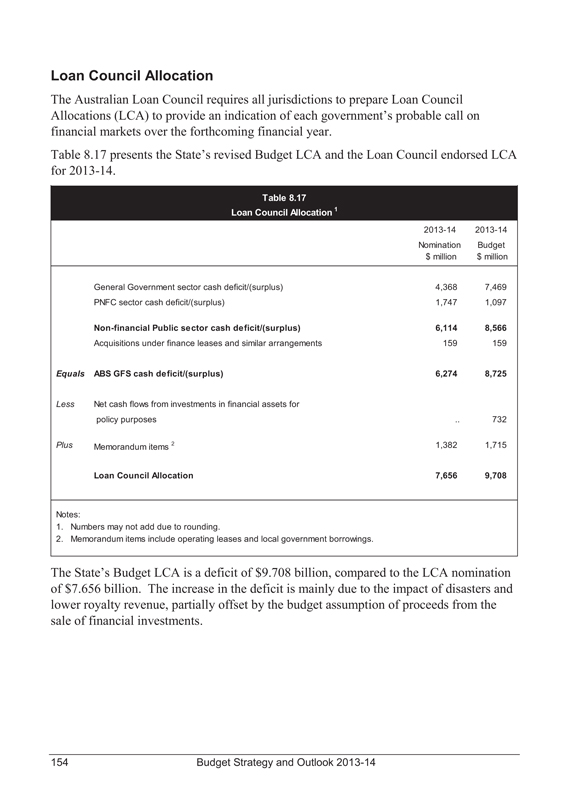
Loan Council Allocation
The Australian Loan Council requires all jurisdictions to prepare Loan Council Allocations (LCA) to provide an indication of each government’s probable call on financial markets over the forthcoming financial year.
Table 8.17 presents the State’s revised Budget LCA and the Loan Council endorsed LCA for 2013-14.
Table 8.17
Loan Council Allocation 1
| | | | | | |
| | | | | 2013-14 Nomination $ million | | 2013-14 Budget $ million |
| | | General Government sector cash deficit/(surplus) | | 4,368 | | 7,469 |
| | | PNFC sector cash deficit/(surplus) | | 1,747 | | 1,097 |
| | | Non-financial Public sector cash deficit/(surplus) | | 6,114 | | 8,566 |
| | | Acquisitions under finance leases and similar arrangements | | 159 | | 159 |
Equals | | ABS GFS cash deficit/(surplus) | | 6,274 | | 8,725 |
Less | | Net cash flows from investments in financial assets for | | | | |
| | | policy purposes | | | | 732 |
Plus | | Memorandum items 2 | | 1,382 | | 1,715 |
| | | Loan Council Allocation | | 7,656 | | 9,708 |
Notes:
1. Numbers may not add due to rounding.
2. Memorandum items include operating leases and local government borrowings.
The State’s Budget LCA is a deficit of $9.708 billion, compared to the LCA nomination of $7.656 billion. The increase in the deficit is mainly due to the impact of disasters and lower royalty revenue, partially offset by the budget assumption of proceeds from the sale of financial investments.
154 Budget Strategy and Outlook 2013-14
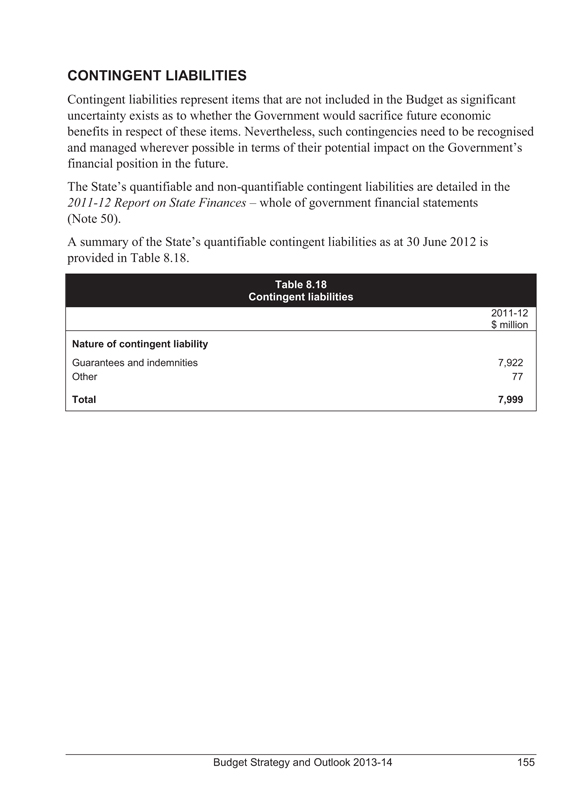
CONTINGENT LIABILITIES
Contingent liabilities represent items that are not included in the Budget as significant uncertainty exists as to whether the Government would sacrifice future economic benefits in respect of these items. Nevertheless, such contingencies need to be recognised and managed wherever possible in terms of their potential impact on the Government’s financial position in the future.
The State’s quantifiable and non-quantifiable contingent liabilities are detailed in the 2011-12 Report on State Finances – whole of government financial statements (Note 50).
A summary of the State’s quantifiable contingent liabilities as at 30 June 2012 is provided in Table 8.18.
Table 8.18
Contingent liabilities
| | |
| | | 2011-12 |
| | | $ million |
Nature of contingent liability | | |
Guarantees and indemnities | | 7,922 |
Other | | 77 |
Total | | 7,999 |
Budget Strategy and Outlook 2013-14 155
BACKGROUND AND INTERPRETATION OF UNIFORM PRESENTATION FRAMEWORK
As mentioned in the introduction to this chapter, the UPF was reviewed in 2007 following the release of the AASB new accounting standard, AASB 1049 Whole of Government and General Government Sector Financial Reporting.
This standard aims to harmonise Government Finance Statistics (GFS) and Generally Accepted Accounting Principles (GAAP) with the objective of improving the clarity and transparency of government financial statements.
Accrual Government Finance Statistics framework
The GFS reporting framework, developed by the Australian Bureau of Statistics (ABS), is based on international statistical standards (the International Monetary Fund Manual on Government Finance Statistics and the United Nations System of National Accounts). This allows comprehensive assessments to be made of the economic impact of government.
The accrual GFS framework is based on an integrated recording of stocks and flows.
Stocks refer to a unit’s holdings of assets, liabilities and net worth at a point in time, whilst flows represent the movement in the stock of assets and liabilities between two points in time. Flows comprise two separate types, transactions and other economic flows. Transactions come about as a result of mutually agreed interactions between units or within a single unit. Other economic flows would include revaluations and destruction or discovery of assets that do not result from a transaction. In GFS operating statements, other economic flows, being outside of the control of government, are excluded and do not affect the net operating balance or fiscal balance.
Generally Accepted Accounting Principles
In addition to the GFS framework, public sector entities were previously required to report at year end against AAS 31 Financial Reporting by Government, which meant complying with the Accounting Standards issued by the AASB.
156 Budget Strategy and Outlook 2013-14
Harmonisation under AASB 1049
This dual reporting regime caused confusion for financial report users and the Financial Reporting Council asked the AASB to develop a framework harmonising GAAP and GFS and to issue an Australian accounting standard for a single set of government reports.
In the development of AASB 1049, the AASB adopted the following approaches:
• adoption of GAAP definition, recognition and measurement principles in almost all cases
• amending presentation requirements to encompass a comprehensive result that retains GAAP classification system but overlays it with a transactions and other economic flows classification system based on GFS
• expanding the disclosure requirements to incorporate key fiscal aggregates required by GFS.
Revisions to the Uniform Presentation Framework
Following the introduction of AASB 1049, the Australian, state and territory governments consider that the UPF will continue to be an important framework for ensuring comparability of financial information across jurisdictions. There are a number of important areas where the UPF provides either additional information or clearer guidance on the preparation of government financial statements to that of AASB 1049. For example, the Australian, state and territory governments agree that net debt, a fiscal indicator not required by the standard, continues to be an important indicator in transparent budget reporting and should continue to be presented on the face of the financial statements as a fiscal aggregate. Further, the UPF shall continue to apply to financial statements produced by government in budgets, mid-year budget updates and final budget outcome reports, whereas the accounting standard applies only to outcome reports.
Therefore, rather than replacing the UPF with the accounting standard, the framework was updated to align with AASB 1049. Australian, state and territory governments agreed that the updated framework would continue to provide a common core of comparable financial information in their budget papers and comparable data amongst jurisdictions while maintaining at least the current level of transparency.
Aligning the framework with AASB 1049 was not intended to create a UPF that complies with all the reporting requirements of AASB 1049. For example, the UPF does not include the same level of detail in relation to disclosure requirements as AASB 1049. Instead, the revised UPF allows jurisdictions to utilise the framework as the base set of statements and add additional relevant information in order to comply with AASB 1049.
Budget Strategy and Outlook 2013-14 157
SECTOR CLASSIFICATION
GFS data is presented by institutional sector, distinguishing between the General Government sector and the PNFC sector.
Budget reporting focuses on the General Government sector, which provides regulatory services and goods and services of a non-market nature that are provided at less than cost or at no cost. These services are largely financed by general revenue (Australian Government grants and state taxation). This sector comprises government departments, their commercialised business units/shared service providers and certain statutory bodies.
The PNFC sector comprises bodies that provide mainly market goods and services that are of a non-regulatory and non-financial nature. PNFCs are financed through sales to consumers of their goods and services and may be supplemented by explicit government subsidy to satisfy community service obligations. In general, PNFCs are legally distinguishable from the governments that own them. Examples of PNFCs include the energy entities and Queensland Rail.
Together, the General Government sector and the PNFC sector comprise the Non-financial Public sector.
Further discussion of the GFS framework of reporting, including definitions of GFS terms, can be obtained from the webpage of the Australian Bureau of Statistics at www.abs.gov.au.
158 Budget Strategy and Outlook 2013-14
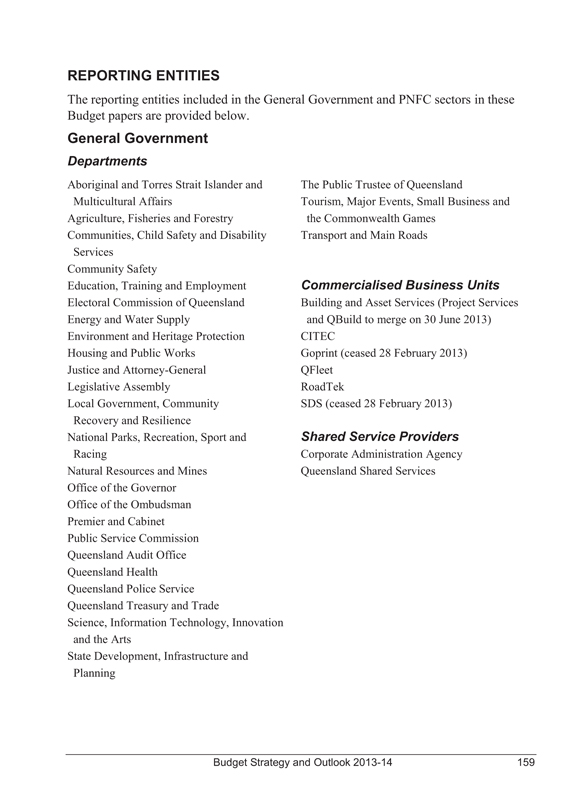
REPORTING ENTITIES
The reporting entities included in the General Government and PNFC sectors in these Budget papers are provided below.
General Government
Departments
Aboriginal and Torres Strait Islander and Multicultural Affairs
Agriculture, Fisheries and Forestry
Communities, Child Safety and Disability Services
Community Safety
Education, Training and Employment
Electoral Commission of Queensland
Energy and Water Supply
Environment and Heritage Protection
Housing and Public Works
Justice and Attorney-General
Legislative Assembly
Local Government, Community Recovery and Resilience
National Parks, Recreation, Sport and Racing
Natural Resources and Mines
Office of the Governor
Office of the Ombudsman
Premier and Cabinet
Public Service Commission
Queensland Audit Office
Queensland Health
Queensland Police Service
Queensland Treasury and Trade
Science, Information Technology, Innovation and the Arts
State Development, Infrastructure and Planning
The Public Trustee of Queensland
Tourism, Major Events, Small Business and the Commonwealth Games
Transport and Main Roads
Commercialised Business Units
Building and Asset Services (Project Services and QBuild to merge on 30 June 2013)
CITEC
Goprint (ceased 28 February 2013)
QFleet
RoadTek
SDS (ceased 28 February 2013)
Shared Service Providers
Corporate Administration Agency
Queensland Shared Services
Budget Strategy and Outlook 2013-14 159
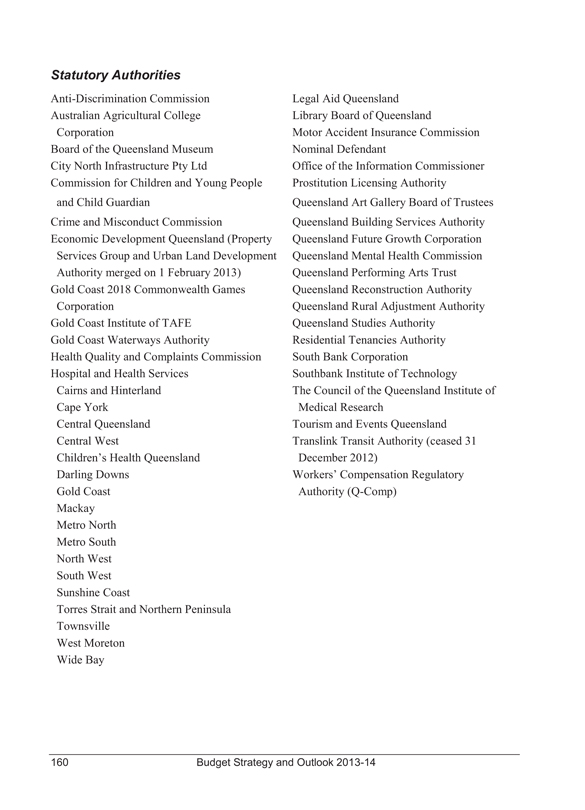
Statutory Authorities
Anti-Discrimination Commission
Australian Agricultural College Corporation
Board of the Queensland Museum
City North Infrastructure Pty Ltd
Commission for Children and Young People and Child Guardian
Crime and Misconduct Commission
Economic Development Queensland (Property Services Group and Urban Land Development Authority merged on 1 February 2013)
Gold Coast 2018 Commonwealth Games Corporation
Gold Coast Institute of TAFE
Gold Coast Waterways Authority
Health Quality and Complaints Commission
Hospital and Health Services
Cairns and Hinterland
Cape York
Central Queensland
Central West
Children’s Health Queensland
Darling Downs
Gold Coast
Mackay
Metro North
Metro South
North West
South West
Sunshine Coast
Torres Strait and Northern Peninsula
Townsville
West Moreton
Wide Bay
Legal Aid Queensland
Library Board of Queensland
Motor Accident Insurance Commission
Nominal Defendant
Office of the Information Commissioner
Prostitution Licensing Authority
Queensland Art Gallery Board of Trustees
Queensland Building Services Authority
Queensland Future Growth Corporation
Queensland Mental Health Commission
Queensland Performing Arts Trust
Queensland Reconstruction Authority
Queensland Rural Adjustment Authority
Queensland Studies Authority
Residential Tenancies Authority
South Bank Corporation
Southbank Institute of Technology
The Council of the Queensland Institute of Medical Research
Tourism and Events Queensland
Translink Transit Authority (ceased 31 December 2012)
Workers’ Compensation Regulatory Authority (Q-Comp)
160 Budget Strategy and Outlook 2013-14
Public Non-financial Corporations
Brisbane Port Holdings Pty Ltd
CS Energy Ltd
DBCT Holdings Pty Ltd
Energex Ltd
Ergon Energy Corporation Limited
Far North Queensland Ports Corporation Limited
Gladstone Area Water Board
Gladstone Ports Corporation Limited
Mount Isa Water Board
North Queensland Bulk Ports Corporation Limited
Port of Townsville Limited
Powerlink Queensland
Qld Airport Holdings (Cairns) Pty Ltd
Qld Airport Holdings (Mackay) Pty Ltd
Queensland Bulk Water Supply Authority (Seqwater)
Queensland Bulk Water Transport Authority (ceased 31 December 2012)
Queensland Lottery Corporation Pty Ltd
Queensland Rail
Queensland Treasury Holdings Pty Ltd
SEQ Water Grid Manager (ceased 31 December 2012)
Stadiums Queensland
Stanwell Corporation Limited
SunWater Limited
The Trustees of Parklands Gold Coast
Budget Strategy and Outlook 2013-14 161

162 Budget Strategy and Outlook 2013-14
APPENDIX A – TAX EXPENDITURE STATEMENT
OVERVIEW
Governments employ a range of policy tools to achieve social and economic objectives. These include the use of direct budgetary outlays, regulatory mechanisms and taxation. This Tax Expenditure Statement (TES) details revenue foregone as a result of Government decisions relating to the provision of tax exemptions or concessions. The TES is designed to improve transparency in the use of tax expenditures and increase public understanding of the fiscal process.
Tax expenditures are reductions in tax revenue that result from the use of the taxation system as a policy tool to deliver Government policy objectives. Tax expenditures are provided through a range of measures, including:
• tax exemptions
• the application of reduced tax rates to certain groups or sectors of the community
• tax rebates
• tax deductions
• provisions which defer payment of a tax liability to a future period.
Labelling an exemption or concession as a tax expenditure does not necessarily imply any judgement as to its appropriateness. It merely makes the amount of the exemption or concession explicit and thereby facilitates its scrutiny as part of the annual Budget process.
Methodology
Revenue foregone approach
The method used almost exclusively by governments to quantify the value of their tax expenditures is the revenue foregone approach. This method estimates the revenue foregone through use of the concession by applying the benchmark rate of taxation to the volume of activities or assets affected by the concession. One of the deficiencies of the revenue foregone approach is that the effect on taxpayer behaviour resulting from the removal of the particular tax expenditure is not factored into the estimate. Consequently, the aggregation of costings for individual tax expenditure items presented in the TES will not necessarily provide an accurate estimate of the total level of assistance provided through tax expenditures.
Budget Strategy and Outlook 2013-14 163
Measuring tax expenditures requires the identification of:
• a benchmark tax base
• concessionally taxed components of the benchmark tax base such as a specific activity or class of taxpayer
• a benchmark tax rate to apply to the concessionally taxed components of the tax base.
Defining the tax benchmark
The most important step in the preparation of a TES is the establishment of a benchmark for each tax included in the statement. The benchmark provides a basis against which each tax concession can be evaluated. The aim of the benchmark is to determine which concessions are tax expenditures as opposed to structural elements of the tax. The key features of a tax benchmark are:
• the tax rate structure
• any specific accounting conventions applicable to the tax
• the deductibility of compulsory payments
• any provisions to facilitate administration
• provisions relating to any fiscal obligations.
By definition, tax expenditures are those tax concessions not included as part of the tax benchmark.
Identification of benchmark revenue bases and rates requires a degree of judgement and is not definitive. Furthermore, data limitations mean that the tax expenditures are approximations and are not exhaustive. This statement does not include estimates of revenue foregone from exemptions or concessions provided to Government agencies. Very small exemptions or concessions are also excluded.
THE TAX EXPENDITURE STATEMENT
This year’s statement includes estimates of tax expenditures in 2011-12 and 2012-13 for payroll tax, land tax, duties and gambling taxes. A summary of the major tax expenditures valued on the basis of revenue foregone is presented in Table A.1. Not all expenditures can be quantified at this time. Accordingly, the total value of tax expenditures should be considered as indicative only.
164 Budget Strategy and Outlook 2013-14
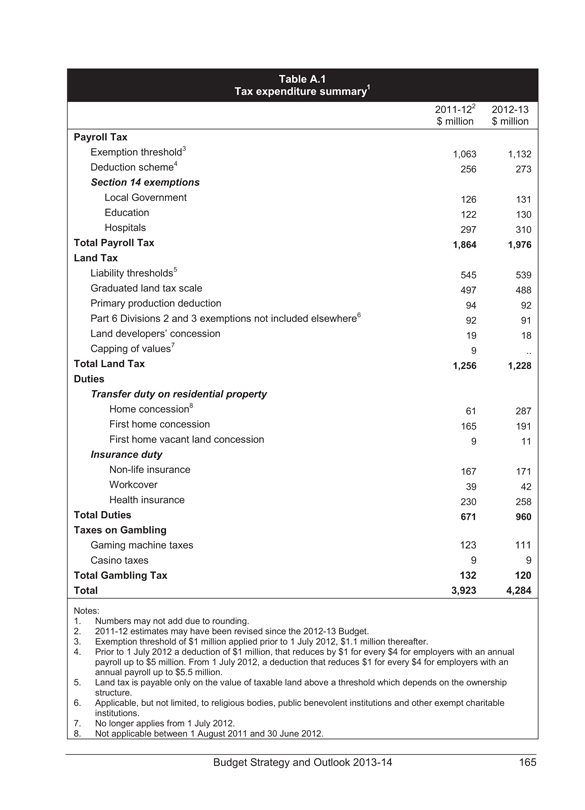
Table A.1
Tax expenditure summary1
2011-122
2012-13
$ million
$ million
Payroll Tax
Exemption threshold3
1,063
1,132
Deduction scheme4
256
273
Section 14 exemptions
Local Government
126
131
Education
122
130
Hospitals
297
310
Total Payroll Tax
1,864
1,976
Land Tax
Liability thresholds5
545
539
Graduated land tax scale
497
488
Primary production deduction
94
92
Part 6 Divisions 2 and 3 exemptions not included elsewhere6
92
91
Land developers’ concession
19
18
Capping of values7
9
Total Land Tax
1,256
1,228
Duties
Transfer duty on residential property
Home concession8
61
287
First home concession
165
191
First home vacant land concession
9
11
Insurance duty
Non-life insurance
167
171
Workcover
39
42
Health insurance
230
258
Total Duties
671
960
Taxes on Gambling
Gaming machine taxes
123
111
Casino taxes
9
9
Total Gambling Tax
132
120
Total
3,923
4,284
Notes:
1. Numbers may not add due to rounding.
2. 2011-12 estimates may have been revised since the 2012-13 Budget.
3. Exemption threshold of $1 million applied prior to 1 July 2012, $1.1 million thereafter.
4. Prior to 1 July 2012 a deduction of $1 million, that reduces by $1 for every $4 for employers with an annual payroll up to $5 million. From 1 July 2012, a deduction that reduces $1 for every $4 for employers with an annual payroll up to $5.5 million.
5. Land tax is payable only on the value of taxable land above a threshold which depends on the ownership structure.
6. Applicable, but not limited, to religious bodies, public benevolent institutions and other exempt charitable institutions.
7. No longer applies from 1 July 2012.
8. Not applicable between 1 August 2011 and 30 June 2012.
Budget Strategy and Outlook 2013-14 165
DISCUSSION OF INDIVIDUAL TAXES
Payroll tax
The benchmark tax base for payroll tax is assumed to be all wages, salaries and supplements (including employer superannuation contributions) paid in Queensland, as defined in the Payroll Tax Act 1971. The benchmark tax rate for payroll tax is assumed to be the statutory rate applying in each financial year.
Payroll tax exemption threshold
Employers who employ in Queensland with an annual Australian payroll of $1.1 million or less are exempt from payroll tax ($1 million prior to 1 July 2012). On the basis of 2012-13 average weekly earnings, this threshold corresponded to approximately 15 full-time equivalent employees. This exemption is designed to assist small and medium sized businesses.
Deduction scheme
Employers who employed in Queensland with Australian payrolls between $1.1 million and $5.5 million benefited from a deduction of $1.1 million, which reduced by $1 for every $4 by which the annual payroll exceeded $1.1 million. The deduction is pro-rated for interstate wages. There was no deduction for employers or groups that had an annual payroll in excess of $5.5 million.
Section 14 exemptions
A number of organisations are provided with exemptions from payroll tax under Section 14 of the Payroll Tax Act 1971. The activities for which estimates have been calculated are wages paid by public hospitals, non-tertiary private educational institutions and local governments (excluding commercial activities).
Land tax
The benchmark tax base is assumed to be all freehold land within Queensland, excluding residential land used as a principal place of residence and land owned by individuals with a value for that year below the threshold. The benchmark tax rate for land tax is assumed to be the top rate of land tax applicable in Queensland in each financial year.
Liability thresholds
Land tax is payable on the value of taxable land equal to or above a threshold which depends on the land’s ownership. The threshold for companies, trusts and absentees is $350,000 and for resident individuals the threshold is $600,000.
166 Budget Strategy and Outlook 2013-14
Land owned by resident individuals as their principal place of residence is excluded from the estimate. The exemption from paying below a minimum amount is not included as a tax expenditure as it is regarded as the application of an administration threshold.
Graduated land tax scale
A graduated (concessional) scale of land tax rates is applicable to land with a taxable value of less than $5 million for resident individuals and companies, trustees and absentees. The benchmark rates used for estimating the tax expenditures were 1.75% for individuals and 2.0% for companies, trustees and absentees.
Primary production deduction
The taxable value of land owned by a resident individual, trustee or some absentees and companies does not include all or part of their land that is used for the business of agriculture, pasturage or dairy farming.
Part 6 Divisions 2 and 3 exemptions (not elsewhere included)
A number of land tax exemptions are granted in Part 6 Divisions 2 and 3 of the Land Tax Act 2010 to eligible organisations. These include, but are not limited to, public benevolent institutions, religious institutions and other exempt charitable institutions, retirement villages, trade unions and showgrounds.
Land developers’ concession
From 1 July 1998, land tax payable by land developers has been worked out on the basis that the unimproved value of (undeveloped) land subdivided in the previous financial year and which remains unsold at 30 June of that year is 60% of the Valuer-General’s value. This concession is outlined in Section 30 of the Land Tax Act 2010.
Land Tax – Capping of Land Values
Land tax is levied on the unimproved value of the landowner’s aggregated holdings of freehold land owned in Queensland as at midnight on 30 June each year. A 50% cap on the annual increase in land values used for the purpose of calculating land tax liabilities applied between 1 July 2007 and 30 June 2012.
Transfer duty concession on residential property
The benchmark tax base is assumed to be all sales of residential property within Queensland. The benchmark tax scale is assumed to be the scale that actually applied in each financial year.
Budget Strategy and Outlook 2013-14 167
Home concession
A concessional rate of duty applies to purchases of a principal place of residence. This concession was not available between 1 August 2011 and 30 June 2012 but was reinstated on 1 July 2012 in accordance with the incoming Government’s election commitment. A 1% concessional rate applies on dutiable values up to $350,000, rather than the normal schedule of rates between 1.5% and 3.5%. For properties valued over $350,000, the scheduled rates of transfer duty apply on the excess.
First home concession
Where a purchaser has not previously owned a residence in Queensland or elsewhere, the purchaser of a home receives a more generous concession on duty. This concession comprises a rebate in addition to the home concession on properties (this concession may not be applicable if the purchase price is less than the full market value of the property). The size of the rebate depends on the value of the property. A full concession is provided to purchases of a first principal place of residence valued up to $500,000.
First home vacant land concession
A first home concession is available for the purchase of certain vacant land up to the value of $400,000, with a full concession available on certain vacant land up to the value of $250,000.
Insurance duty
The benchmark tax base is assumed to be all premiums for general insurance policies (not for life insurance). The benchmark tax scale is assumed to be the scale that actually applied in each financial year.
The rate of duty applicable to most types of general insurance is 7.5%. Concessional rates apply to some other general insurance types (5% for motor vehicle insurance other than compulsory third party (CTP), workers’ compensation and professional indemnity insurance and 10c on a premium for CTP insurance). Data limitations mean that these insurance types are categorised into non-life insurance cover and WorkCover. An exemption from duty is also provided for private health insurance.
The rate of duty applicable to general insurance will increase to 9% from 1 August 2013.
168 Budget Strategy and Outlook 2013-14
Gambling taxes
Gaming machine tax concessions for licensed clubs
The benchmark tax base is assumed to be all gaming machines operated by licensed clubs and hotels in Queensland. The benchmark tax rate is assumed to be the highest marginal tax rate (as is applied to hotels) that actually applied in each financial year.
A progressive tax rate scale applies to gaming machines operated by licensed clubs. The tax rate is calculated monthly on the gaming machine taxable metered win and the top tax rate is only applied to the portion of gaming machine revenue where the monthly metered win exceeds $1.4 million for any licensed club.
Casino tax concessions
The benchmark tax base is assumed to be all casinos operating in Queensland. The benchmark tax rate is assumed to be the highest tax rate that is actually applied in each financial year.
A tax rate of 20% of gross revenue applies for standard transactions in the Brisbane and Gold Coast casinos. A concessional tax rate of 10% applies for gross revenue from standard transactions in the Cairns and Townsville casinos. The tax rate applicable to gaming machines in casinos is 30% of gross revenue in Brisbane and Gold Coast casinos and 20% in the Cairns and Townsville casinos.
In addition concessional rates of 10% also apply for revenue from high rollers in all casinos. A GST credit is provided to casinos that approximates a reduction in the above tax rates of 9.09%.
Budget Strategy and Outlook 2013-14 169

170 Budget Strategy and Outlook 2013-14
APPENDIX B – REVENUE AND EXPENSE ASSUMPTIONS AND SENSITIVITY ANALYSIS
The Queensland Budget, like those of other states, is based in part on assumptions made about future elements of uncertainty, both internal and external to the State, which can impact directly on economic and fiscal forecasts.
This appendix outlines the assumptions underlying the revenue and expense estimates and analyses the sensitivity of the estimates to changes in the economic and other assumptions. This analysis is provided to enhance the level of transparency and accountability of the Government.
The forward estimates in the Budget are framed on a no policy change basis. That is, the expenditure and revenue policies in place at the time of the Budget (including those announced in the Budget) are applied consistently throughout the forward estimates period.
The following discussion provides details of some of the key assumptions, estimates and risks associated with revenue and expenditure and, where a direct link can be established, the indicative impact on forecasts resulting from a movement in those variables.
Budget Strategy and Outlook 2013-14 171
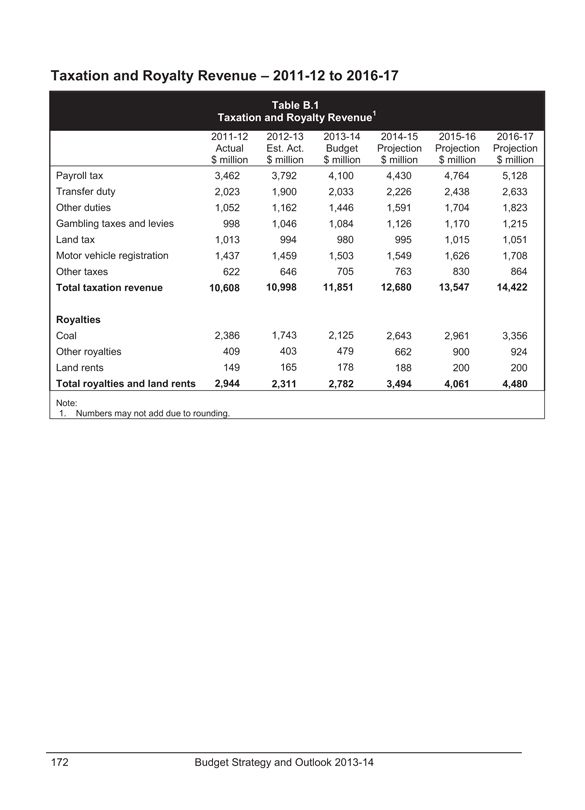
Taxation and Royalty Revenue – 2011-12 to 2016-17
Table B.1
Taxation and Royalty Revenue1
2011-12
2012-13
2013-14
2014-15
2015-16
2016-17
Actual
Est. Act.
Budget
Projection
Projection
Projection
$ million
$ million
$ million
$ million
$ million
$ million
Payroll tax
3,462
3,792
4,100
4,430
4,764
5,128
Transfer duty
2,023
1,900
2,033
2,226
2,438
2,633
Other duties
1,052
1,162
1,446
1,591
1,704
1,823
Gambling taxes and levies
998
1,046
1,084
1,126
1,170
1,215
Land tax
1,013
994
980
995
1,015
1,051
Motor vehicle registration
1,437
1,459
1,503
1,549
1,626
1,708
Other taxes
622
646
705
763
830
864
Total taxation revenue
10,608
10,998
11,851
12,680
13,547
14,422
Royalties
Coal
2,386
1,743
2,125
2,643
2,961
3,356
Other royalties
409
403
479
662
900
924
Land rents
149
165
178
188
200
200
Total royalties and land rents
2,944
2,311
2,782
3,494
4,061
4,480
Note:
1. Numbers may not add due to rounding.
172 Budget Strategy and Outlook 2013-14
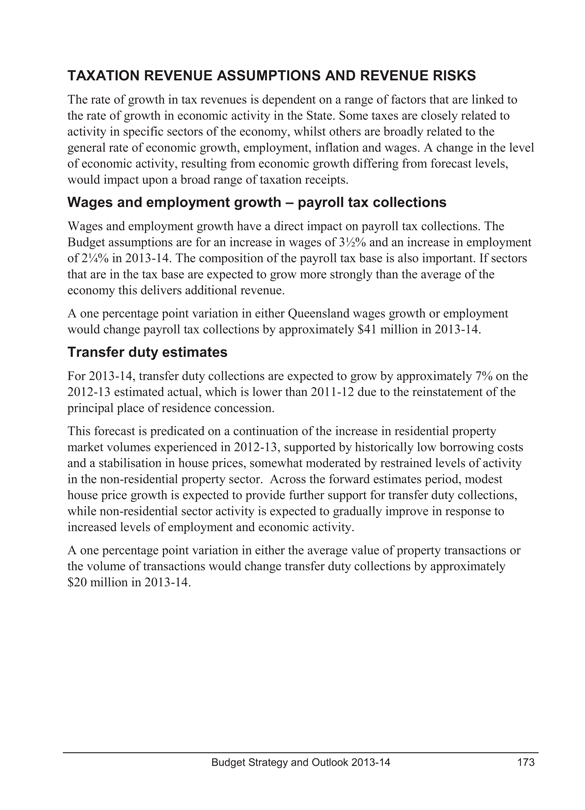
TAXATION REVENUE ASSUMPTIONS AND REVENUE RISKS
The rate of growth in tax revenues is dependent on a range of factors that are linked to the rate of growth in economic activity in the State. Some taxes are closely related to activity in specific sectors of the economy, whilst others are broadly related to the general rate of economic growth, employment, inflation and wages. A change in the level of economic activity, resulting from economic growth differing from forecast levels, would impact upon a broad range of taxation receipts.
Wages and employment growth – payroll tax collections
Wages and employment growth have a direct impact on payroll tax collections. The Budget assumptions are for an increase in wages of 3 1/2% and an increase in employment of 2 1/4% in 2013-14. The composition of the payroll tax base is also important. If sectors that are in the tax base are expected to grow more strongly than the average of the economy this delivers additional revenue.
A one percentage point variation in either Queensland wages growth or employment would change payroll tax collections by approximately $41 million in 2013-14.
Transfer duty estimates
For 2013-14, transfer duty collections are expected to grow by approximately 7% on the 2012-13 estimated actual, which is lower than 2011-12 due to the reinstatement of the principal place of residence concession.
This forecast is predicated on a continuation of the increase in residential property market volumes experienced in 2012-13, supported by historically low borrowing costs and a stabilisation in house prices, somewhat moderated by restrained levels of activity in the non-residential property sector. Across the forward estimates period, modest house price growth is expected to provide further support for transfer duty collections, while non-residential sector activity is expected to gradually improve in response to increased levels of employment and economic activity.
A one percentage point variation in either the average value of property transactions or the volume of transactions would change transfer duty collections by approximately $20 million in 2013-14.
Budget Strategy and Outlook 2013-14 173
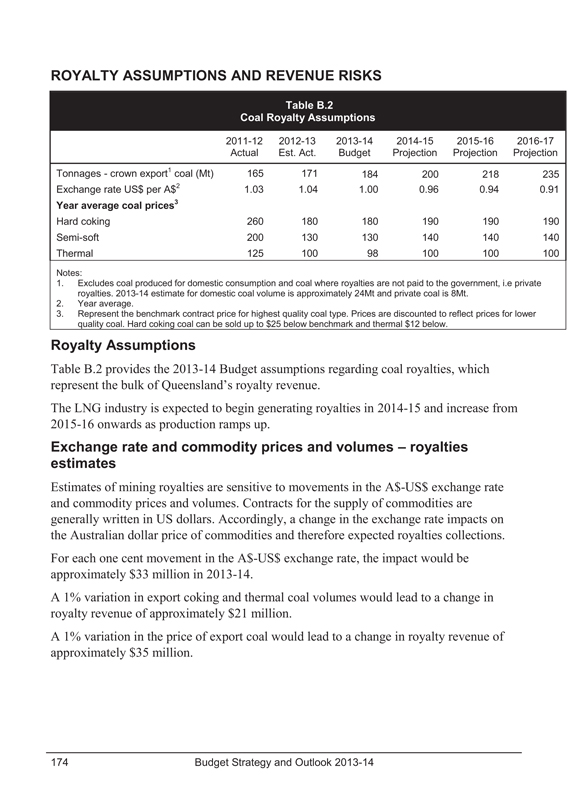
ROYALTY ASSUMPTIONS AND REVENUE RISKS
Table B.2
Coal Royalty Assumptions
| | | | | | | | | | | | |
| | | 2011-12 | | 2012-13 | | 2013-14 | | 2014-15 | | 2015-16 | | 2016-17 |
| | | Actual | | Est. Act. | | Budget | | Projection | | Projection | | Projection |
Tonnages - crown export1 coal (Mt) | | 165 | | 171 | | 184 | | 200 | | 218 | | 235 |
Exchange rate US$ per A$2 | | 1.03 | | 1.04 | | 1.00 | | 0.96 | | 0.94 | | 0.91 |
Year average coal prices3 | | | | | | | | | | | | |
Hard coking | | 260 | | 180 | | 180 | | 190 | | 190 | | 190 |
Semi-soft | | 200 | | 130 | | 130 | | 140 | | 140 | | 140 |
Thermal | | 125 | | 100 | | 98 | | 100 | | 100 | | 100 |
Notes:
1. Excludes coal produced for domestic consumption and coal where royalties are not paid to the government, i.e private royalties. 2013-14 estimate for domestic coal volume is approximately 24Mt and private coal is 8Mt.
2. Year average.
3. Represent the benchmark contract price for highest quality coal type. Prices are discounted to reflect prices for lower quality coal. Hard coking coal can be sold up to $25 below benchmark and thermal $12 below.
Royalty Assumptions
Table B.2 provides the 2013-14 Budget assumptions regarding coal royalties, which represent the bulk of Queensland’s royalty revenue.
The LNG industry is expected to begin generating royalties in 2014-15 and increase from 2015-16 onwards as production ramps up.
Exchange rate and commodity prices and volumes – royalties estimates
Estimates of mining royalties are sensitive to movements in the A$-US$ exchange rate and commodity prices and volumes. Contracts for the supply of commodities are generally written in US dollars. Accordingly, a change in the exchange rate impacts on the Australian dollar price of commodities and therefore expected royalties collections.
For each one cent movement in the A$-US$ exchange rate, the impact would be approximately $33 million in 2013-14.
A 1% variation in export coking and thermal coal volumes would lead to a change in royalty revenue of approximately $21 million.
A 1% variation in the price of export coal would lead to a change in royalty revenue of approximately $35 million.
174 Budget Strategy and Outlook 2013-14
Parameters influencing Australian Government GST payments to Queensland
The Queensland Budget incorporates the estimates of GST revenue grants to Queensland made by the Australian Government, based on its estimates of national GST collections and Queensland’s share. The estimates of collections are primarily determined by the value of consumption subject to GST.
Since the Australian Government payments are based on the amount actually collected, it is Queensland’s Budget that bears the risks of fluctuations in GST collections. As with all other tax estimates, there is a risk of lower collections than estimated if economic growth and consumption are weaker than expected.
Due to the complexities associated with the GST base, the information provided in the Australian Government Budget Papers is not sufficient to prepare indicative forecasts of the sensitivity of GST estimates to key variables.
Budget Strategy and Outlook 2013-14 175
SENSITIVITY OF EXPENDITURE ESTIMATES AND EXPENDITURE RISKS
Public sector wage costs
Salaries and wages form a large proportion of General Government operating expenses. Increases in salaries and wages are negotiated through enterprise bargaining agreements.
The 2013-14 Budget and forward estimates includes funding for wage increases as per existing agreements and reflect the Government’s wages policy where outcomes are yet to be finalised.
A general 1% increase in wage outcomes in a particular year would increase expenses by around $200 million to $250 million per annum.
Interest rates
The General Government sector has a total debt servicing cost estimated at $2.2 billion in 2013-14.
The current average duration of General Government debt is between five and six years. The majority of General Government debt is held under fixed interest rates and therefore the impact of interest rate variations on debt servicing costs in 2013-14 would be relatively modest, with the impact occurring progressively across the forward estimates.
Actuarial estimates of superannuation and long service leave
Liabilities for superannuation and long service leave are estimated by the State Actuary with reference to, among other things, assumed rates of investment returns, salary growth, inflation and discount rate. These liabilities are therefore subject to changes in these parameters. Similarly, the long service leave liabilities are subject to the risk that the actual rates of employee retention will vary from those assumed in the liability calculation.
While these impacts have been estimated and allowances made in the Budget and forward estimates to accommodate them, the actual outcome may differ from the estimates calculated for the Budget.
Demographic and demand based risks
Unforeseen changes in the size, location and composition of Queensland’s population can impact on the demand for goods and services and therefore on the cost of maintaining existing policies. This is particularly evident in the health, education, community services and criminal justice sectors.
176 Budget Strategy and Outlook 2013-14
State government expenditure is often more closely associated with socio-demographic factors, such as the number of school age children or the number of elderly residents, than with economic activity. However, such changes are unlikely to impact significantly in the short term.
For this reason, the composition, size and location of the State’s population are more significant in projecting the State’s expenditure needs across the forward estimates period than for the current or budget year.
Budget Strategy and Outlook 2013-14 177

178 Budget Strategy and Outlook 2013-14

State Budget 2013–14 Budget Strategy and Outlook Budget Paper No.2 www.budget.qld.gov.au

State Budget 2013–14 Budget Strategy and Outlook Budget Paper No.2 www.budget.qld.gov.au
State Budget 2013-14
Capital Statement
Budget Paper No.3
AUDAX · AT · FIDELIS
Great state. Great opportunity.
AUDAX AT FIDELIS
Queensland
Government
2013–14 State Budget Papers
1. Budget Speech
2. Budget Strategy and Outlook
3. Capital Statement
4. Budget Measures
5. Service Delivery Statements Appropriation Bills Concessions Statement
The suite of Budget Papers is similar to that published in 2012-13.
The Budget Papers are available online at www.budget.qld.gov.au
© Crown copyright
All rights reserved
Queensland Government 2013
Excerpts from this publication may be reproduced, with appropriate acknowledgement, as permitted under the Copyright Act.
Capital Statement
Budget Paper No.3
ISSN 1445-4890 (Print)
ISSN 1445-4904 (Online)
Queensland
Government
STATE BUDGET
2013-14
CAPITAL STATEMENT
Budget Paper No. 3

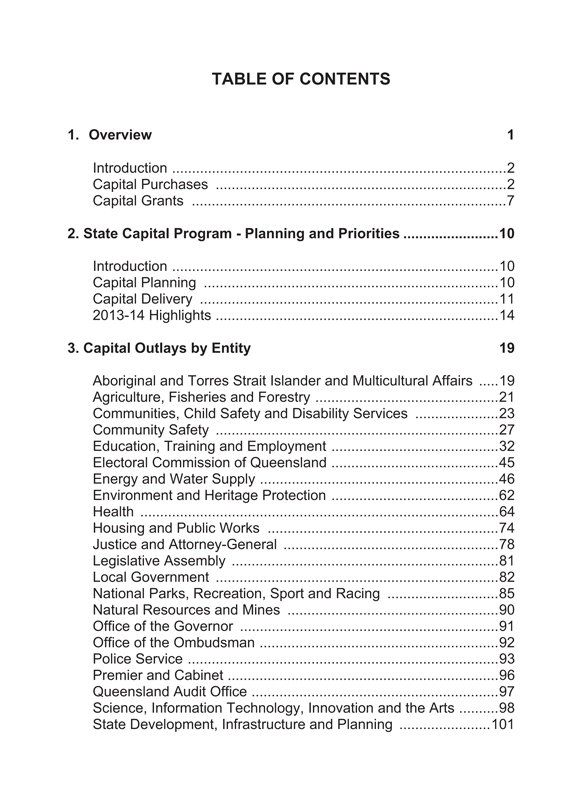
TABLE OF CONTENTS
1. Overview 1
Introduction 2
Capital Purchases 2
Capital Grants 7
2. State Capital Program - Planning and Priorities 10
Introduction 10
Capital Planning 10
Capital Delivery 11
2013-14 Highlights 14
3. Capital Outlays by Entity 19
Aboriginal and Torres Strait Islander and Multicultural Affairs 19
Agriculture, Fisheries and Forestry 21
Communities, Child Safety and Disability Services 23
Community Safety 27
Education, Training and Employment 32
Electoral Commission of Queensland 45
Energy and Water Supply 46
Environment and Heritage Protection 62
Health 64
Housing and Public Works 74
Justice and Attorney-General 78
Legislative Assembly 81
Local Government 82
National Parks, Recreation, Sport and Racing 85
Natural Resources and Mines 90
Office of the Governor 91
Office of the Ombudsman 92
Police Service 93
Premier and Cabinet 96
Queensland Audit Office 97
Science, Information Technology, Innovation and the Arts 98
State Development, Infrastructure and Planning 101
Tourism, Major Events, Small Business and the Commonwealth Games 104
Transport and Main Roads 105
Treasury and Trade 124
Appendix A- Entities included in Capital Outlays 2013-14 125
Appendix B - Key Concepts and Coverage 128
Appendix C - Capital purchases by agency by region 129
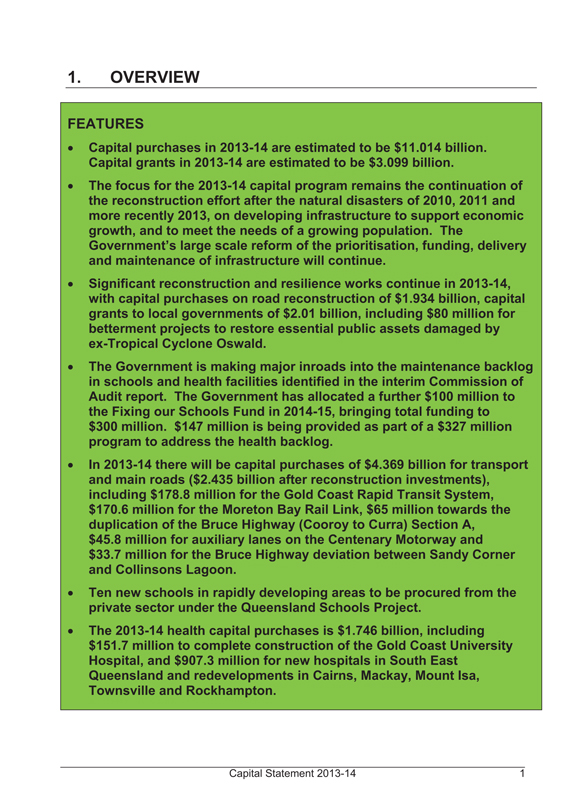
1. OVERVIEW
FEATURES
• Capital purchases in 2013-14 are estimated to be $11.014 billion. Capital grants in 2013-14 are estimated to be $3.099 billion.
• The focus for the 2013-14 capital program remains the continuation of the reconstruction effort after the natural disasters of 2010, 2011 and more recently 2013, on developing infrastructure to support economic growth, and to meet the needs of a growing population. The Government’s large scale reform of the prioritisation, funding, delivery and maintenance of infrastructure will continue.
• Significant reconstruction and resilience works continue in 2013-14, with capital purchases on road reconstruction of $1.934 billion, capital grants to local governments of $2.01 billion, including $80 million for betterment projects to restore essential public assets damaged by ex-Tropical Cyclone Oswald.
• The Government is making major inroads into the maintenance backlog in schools and health facilities identified in the interim Commission of Audit report. The Government has allocated a further $100 million to the Fixing our Schools Fund in 2014-15, bringing total funding to $300 million. $147 million is being provided as part of a $327 million program to address the health backlog.
• In 2013-14 there will be capital purchases of $4.369 billion for transport and main roads ($2.435 billion after reconstruction investments), including $178.8 million for the Gold Coast Rapid Transit System, $170.6 million for the Moreton Bay Rail Link, $65 million towards the duplication of the Bruce Highway (Cooroy to Curra) Section A, $45.8 million for auxiliary lanes on the Centenary Motorway and $33.7 million for the Bruce Highway deviation between Sandy Corner and Collinsons Lagoon.
• Ten new schools in rapidly developing areas to be procured from the private sector under the Queensland Schools Project.
• The 2013-14 health capital purchases is $1.746 billion, including $151.7 million to complete construction of the Gold Coast University Hospital, and $907.3 million for new hospitals in South East Queensland and redevelopments in Cairns, Mackay, Mount Isa, Townsville and Rockhampton.
Capital Statement 2013-14 1
INTRODUCTION
This capital statement provides an overview of the Queensland Government’s approach to capital planning and delivery and the capital program for 2013-14. Capital purchases in 2013-14 are expected to be $11.014 billion, with capital grants totalling $3.099 billion.
The 2013-14 capital program continues the rebuilding effort following natural disasters of 2010, 2011 and most recently 2013, with $1.934 billion in roads and transport reconstruction and $2.01 billion in capital grants to local government across Queensland for reconstruction purposes.
In addition to this rebuilding, the Government is making significant investments in health, transport infrastructure, education and housing, to address population growth and to improve the productivity and prosperity of the State.
Each year, part of the Queensland Government’s capital program is undertaken through the Public Non-financial Corporations (PNFC) sector (that is, commercial entities of Government, including Government owned corporations and other authorities such as the water bodies). For 2013-14, capital purchases by the PNFC sector will comprise 38% of the State capital program, reflecting major investments in port and rail infrastructure and in the energy sector.
CAPITAL PURCHASES
The Queensland Government purchases capital assets to support the services it provides to the community and to improve the productivity of the Queensland economy.
Capital purchases by purpose in 2013-14 are shown in Chart 1.1 below. Capital purchases by State Government entity are listed in Table 1.1, while Table 1.2 lists capital purchases by region with greater detail provided in appendix C.
2 Capital Statement 2013-14
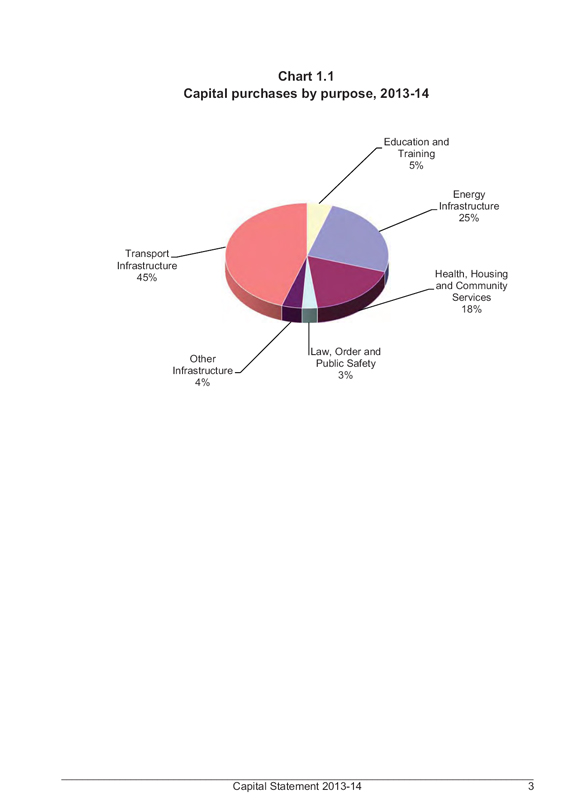
Chart 1.1
Capital purchases by purpose, 2013-14
Education and Training 5%
Energy Infrastructure 25%
Health, Housing and Community Services 18%
Law, Order and Public Safety 3%
Other Infrastructure 4%
Transport Infrastructure 45%
Capital Statement 2013-14 3
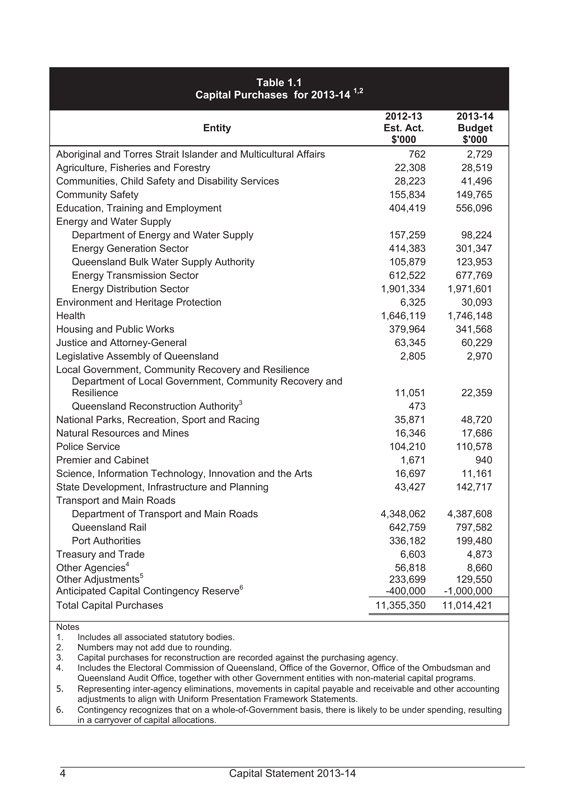
Table 1.1
Capital Purchases for 2013-14 1,2
Entity
2012-13 Est. Act. $’000
2013-14 Budget $’000
Aboriginal and Torres Strait Islander and Multicultural Affairs 762 2,729
Agriculture, Fisheries and Forestry 22,308 28,519
Communities, Child Safety and Disability Services 28,223 41,496
Community Safety 155,834 149,765
Education, Training and Employment 404,419 556,096
Energy and Water Supply
Department of Energy and Water Supply 157,259 98,224
Energy Generation Sector 414,383 301,347
Queensland Bulk Water Supply Authority 105,879 123,953
Energy Transmission Sector 612,522 677,769
Energy Distribution Sector 1,901,334 1,971,601
Environment and Heritage Protection 6,325 30,093
Health 1,646,119 1,746,148
Housing and Public Works 379,964 341,568
Justice and Attorney-General 63,345 60,229
Legislative Assembly of Queensland 2,805 2,970
Local Government, Community Recovery and Resilience
Department of Local Government, Community Recovery and
Resilience 11,051 22,359
Queensland Reconstruction Authority3 473
National Parks, Recreation, Sport and Racing 35,871 48,720
Natural Resources and Mines 16,346 17,686
Police Service 104,210 110,578
Premier and Cabinet 1,671 940
Science, Information Technology, Innovation and the Arts 16,697 11,161
State Development, Infrastructure and Planning 43,427 142,717
Transport and Main Roads
Department of Transport and Main Roads 4,348,062 4,387,608
Queensland Rail 642,759 797,582
Port Authorities 336,182 199,480
Treasury and Trade 6,603 4,873
Other Agencies4 56,818 8,660
Other Adjustments5 233,699 129,550
Anticipated Capital Contingency Reserve6 -400,000 -1,000,000
Total Capital Purchases 11,355,350 11,014,421
Notes
1. Includes all associated statutory bodies.
2. Numbers may not add due to rounding.
3. Capital purchases for reconstruction are recorded against the purchasing agency.
4. Includes the Electoral Commission of Queensland, Office of the Governor, Office of the Ombudsman and Queensland Audit Office, together with other Government entities with non-material capital programs.
5. Representing inter-agency eliminations, movements in capital payable and receivable and other accounting adjustments to align with Uniform Presentation Framework Statements.
6. Contingency recognizes that on a whole-of-Government basis, there is likely to be under spending, resulting in a carryover of capital allocations.
4 Capital Statement 2013-14
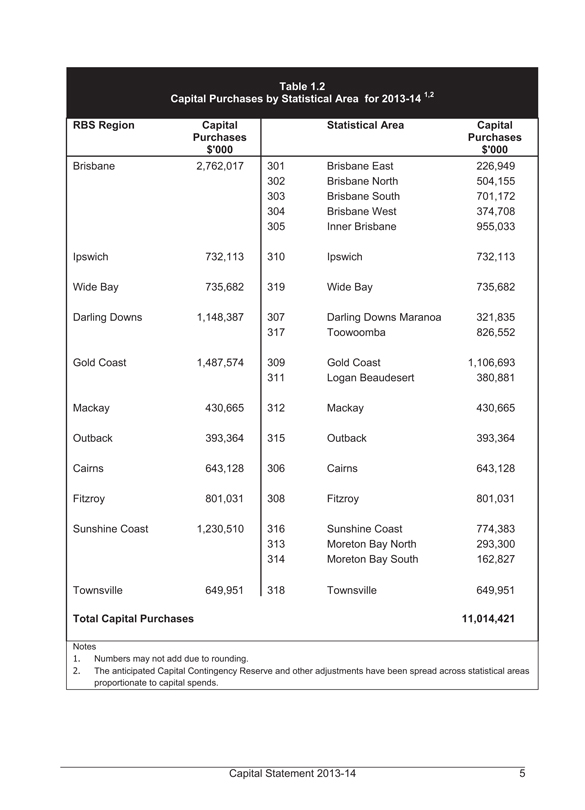
Table 1.2
Capital Purchases by Statistical Area for 2013-14 1,2
RBS Region
Capital Purchases $’000
Statistical Area
Capital Purchases $’000
Brisbane 2,762,017 301 Brisbane East 226,949
302 Brisbane North 504,155
303 Brisbane South 701,172
304 Brisbane West 374,708
305 Inner Brisbane 955,033
Ipswich 732,113 310 Ipswich 732,113
Wide Bay 735,682 319 Wide Bay 735,682
Darling Downs 1,148,387 307
Darling Downs Maranoa 321,835
317 Toowoomba 826,552
Gold Coast 1,487,574 309 Gold Coast 1,106,693
311 Logan Beaudesert 380,881
Mackay 430,665 312 Mackay 430,665
Outback 393,364 315 Outback 393,364
Cairns 643,128 306 Cairns 643,128
Fitzroy 801,031 308 Fitzroy 801,031
Sunshine Coast 1,230,510 316 Sunshine Coast 774,383
313 Moreton Bay North 293,300
314 Moreton Bay South 162,827
Townsville 649,951 318 Townsville 649,951
Total Capital Purchases 11,014,421
Notes
1. Numbers may not add due to rounding.
2. The anticipated Capital Contingency Reserve and other adjustments have been spread across statistical areas proportionate to capital spends.
Capital Statement 2013-14 5
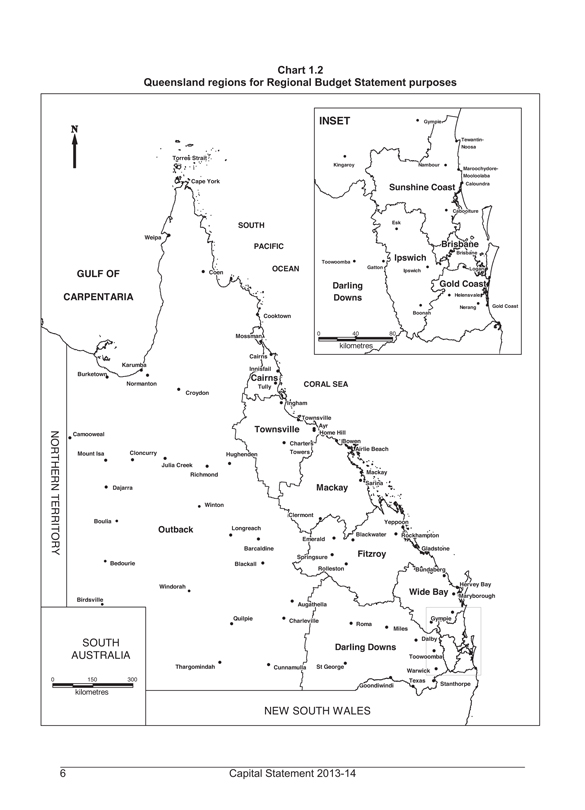
Chart 1.2
Queensland regions for Regional Budget Statement purposes
INSET
Kingaroy Gympie
Toowoomba Gatton Darling Downs 0 40 80 kilometres
Nambour Sunshine Coast
Esk Ipswich Ipswich Boonah
Tewantin-Noosa Maroochydore-Mooloolaba Caloundra
Caboolture
Brisbane Brisbane Logan
Gold Coast Helensvale Nerang
Gold Coast
0 40 80 kilometres
N
GULF OF CARPENTARIA
Karumba Weipa Torres Strait Cape York SOUTH PACIFIC OCEAN Cooktown CORAL SEA Ingham Townsville Ayr
Home Hill Bowen Airlie Beach Mackay Sarina Rockhampton Gladstone Hervey Bay Maryborough
Coen NORTHERN TERRITORY Burketown Camooweal Mount Isa Dajarra Boulia Bedourie Birdsville
Normanton Cloncurry Croydon Julia Creek Outback Windorah Thargomindah
Hughenden Richmond Winton Longreach Barcaldine Blackall Quilpie
Mossman Cairns Innisfall Cairns Tully
Townsville Charters Towers
Mackay Clermont Emerald Springsure Rolleston Blackwater Yeppoon Fitzroy
Augathella Charleville Cunnamulla St George Darling Downs Roma Miles
Bundaberg Wide Bay Gympie
Dalby Toowoomba Warwick Texas
NEW SOUTH WALES Goondiwindi Stanthorpe
SOUTH AUSTRALIA 0 150 300 kilometres
6 Capital Statement 2013-14
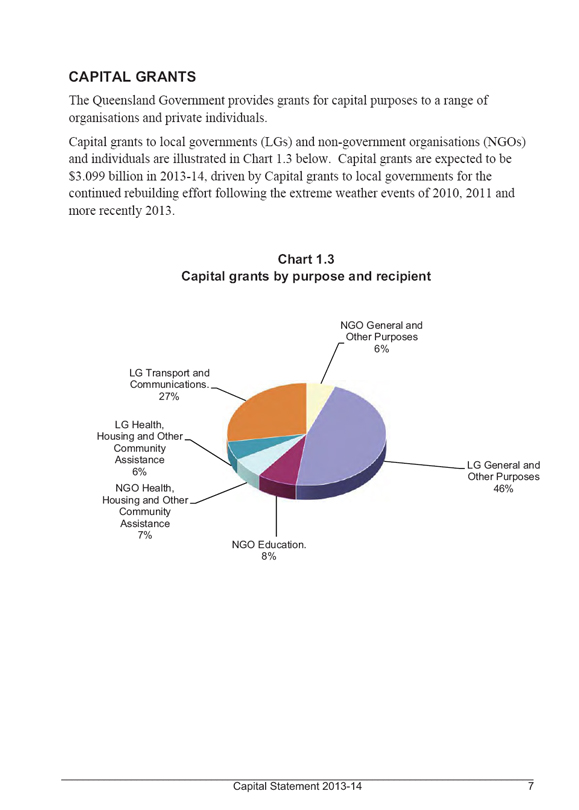
CAPITAL GRANTS
The Queensland Government provides grants for capital purposes to a range of organisations and private individuals.
Capital grants to local governments (LGs) and non-government organisations (NGOs) and individuals are illustrated in Chart 1.3 below. Capital grants are expected to be $3.099 billion in 2013-14, driven by Capital grants to local governments for the continued rebuilding effort following the extreme weather events of 2010, 2011 and more recently 2013.
Chart 1.3
Capital grants by purpose and recipient
NGO General and
Other Purposes
6%
LG Transport and
Communications.
27%
LG Health,
Housing and Other
Community
Assistance
6%
NGO Health,
Housing and Other
Community
Assistance
7%
NGO Education.
8%
LG General and
Other Purposes
46%
Capital Statement 2013-14 7
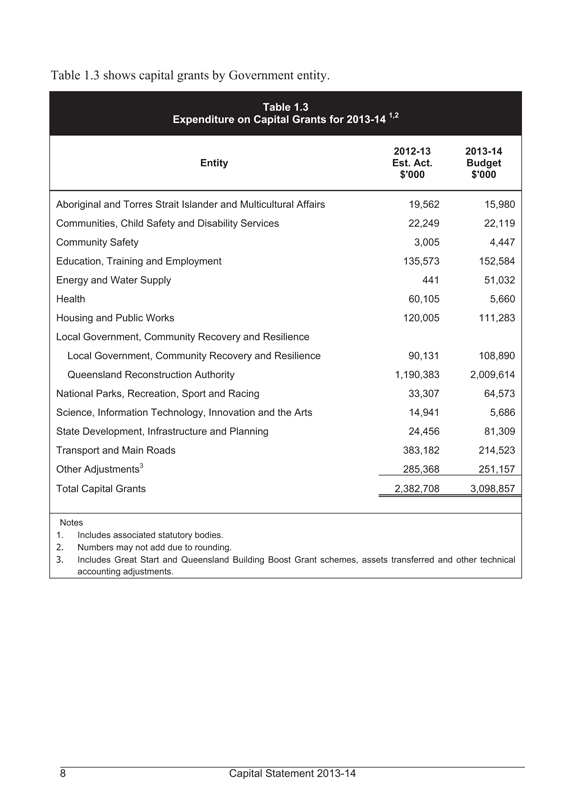
Table 1.3 shows capital grants by Government entity.
Table 1.3
Expenditure on Capital Grants for 2013-14 1,2
Entity
2012-13 Est. Act. $’000
2013-14 Budget $’000
Aboriginal and Torres Strait Islander and Multicultural Affairs 19,562 15,980
Communities, Child Safety and Disability Services 22,249 22,119
Community Safety 3,005 4,447
Education, Training and Employment 135,573 152,584
Energy and Water Supply 441 51,032
Health 60,105 5,660
Housing and Public Works 120,005 111,283
Local Government, Community Recovery and Resilience
Local Government, Community Recovery and Resilience 90,131 108,890
Queensland Reconstruction Authority 1,190,383 2,009,614
National Parks, Recreation, Sport and Racing 33,307 64,573
Science, Information Technology, Innovation and the Arts 14,941 5,686
State Development, Infrastructure and Planning 24,456 81,309
Transport and Main Roads 383,182 214,523
Other Adjustments3 285,368 251,157
Total Capital Grants 2,382,708 3,098,857
Notes
1. Includes associated statutory bodies.
2. Numbers may not add due to rounding.
3. Includes Great Start and Queensland Building Boost Grant schemes, assets transferred and other technical accounting adjustments.
8 Capital Statement 2013-14
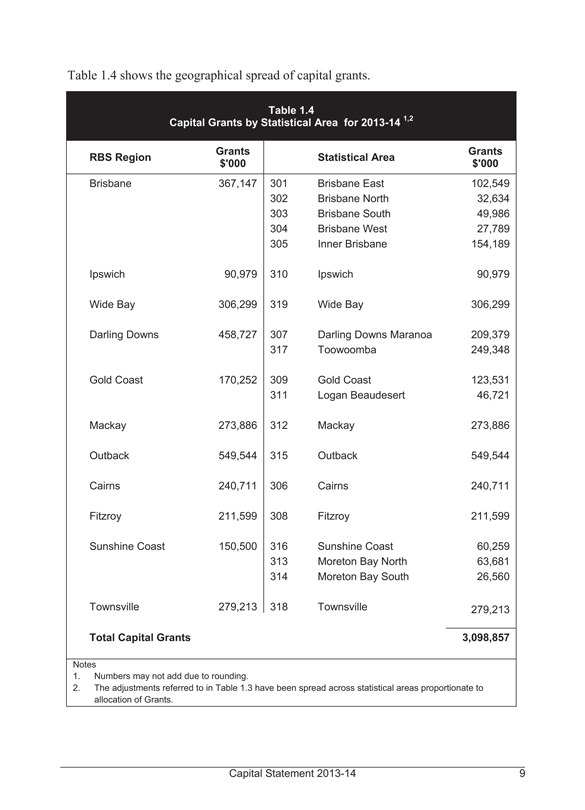
Table 1.4 shows the geographical spread of capital grants.
Table 1.4
Capital Grants by Statistical Area for 2013-14 1,2
RBS Region
Grants $’000
Statistical Area
Grants $’000
Brisbane 367,147 301 Brisbane East 102,549
302 Brisbane North 32,634
303 Brisbane South 49,986
304 Brisbane West 27,789
305 Inner Brisbane 154,189
Ipswich 90,979 310 Ipswich 90,979
Wide Bay 306,299 319 Wide Bay 306,299
Darling Downs 458,727 307 Darling Downs Maranoa 209,379
317 Toowoomba 249,348
Gold Coast 170,252 309 Gold Coast 123,531
311 Logan Beaudesert 46,721
Mackay 273,886 312 Mackay 273,886
Outback 549,544 315 Outback 549,544
Cairns 240,711 306 Cairns 240,711
Fitzroy 211,599 308 Fitzroy 211,599
Sunshine Coast 150,500 316 Sunshine Coast 60,259
313 Moreton Bay North 63,681
314 Moreton Bay South 26,560
Townsville 279,213 318 Townsville 279,213
Total Capital Grants 3,098,857
Notes
1. Numbers may not add due to rounding.
2. The adjustments referred to in Table 1.3 have been spread across statistical areas proportionate to allocation of Grants.
Capital Statement 2013-14 9
2. STATE CAPITAL PROGRAM – PLANNING AND PRIORITIES
INTRODUCTION
The Queensland Government is delivering critical infrastructure, at the same time as dealing with the State’s financial position, with a comprehensive approach to delivering an efficient capital program, to ensure the community receives the maximum benefit from its investments. This involves comprehensive planning and prioritisation of the capital program, rigorous evaluation of the value for money of proposed capital investments and innovative and efficient funding and delivery solutions.
CAPITAL PLANNING
Infrastructure for Economic Development
The Queensland Government is addressing economic challenges by moving ahead with large scale reform of prioritisation, funding, delivery and maintenance of economic infrastructure. In the next 12 months, the government plans to:
• better utilise current infrastructure assets through practices such as demand management and other non-build service solutions
• use an Expert Panel to review infrastructure needs of South East Queensland according to an Economic Infrastructure Prioritisation Framework
• revise the Project Assurance Framework, to ensure the application of an Economic Infrastructure Prioritisation Framework
• review regional infrastructure plans and supply chain requirements to best equip regional areas for economic development
• finalise a Queensland Ports Strategy and an Economic Development Directions Statement for Queensland Airports
• develop 30 year electricity and water strategies
• update statutory transport coordination plans
• complete the preliminary evaluation review and consider findings for the Gateway Upgrade North Project to ensure that the best options are put forward to Projects Queensland for detailed funding analysis.
The Queensland Government’s actions on economic infrastructure reform together with real regulatory reform, including streamlining project approval processes and other red tape, will position Queensland as a more productive, highly developed economy that will reap the benefits of the Asian century.
10 Capital Statement 2013-14
CAPITAL DELIVERY – PROJECTS QUEENSLAND
Projects Queensland is a unit within Queensland Treasury and Trade, established to enhance the Queensland Government’s infrastructure delivery capability. Over the last 12 months, Projects Queensland has led the development of some of the State’s most significant infrastructure projects, such as Queensland Schools, Government Wireless Network and 1 William Street.
The key role of Projects Queensland is to engage with the private sector to explore opportunities for investment in public infrastructure and service delivery. Projects Queensland plays an important part in the Government’s strategy to provide greater value and assist in regaining Queensland’s AAA credit rating, while providing infrastructure and services for future growth.
Projects Queensland also plays an important role, in conjunction with Government owned corporations, in the development and delivery of finance solutions for resource related infrastructure projects where the potential for private finance exists.
The specific responsibilities of Projects Queensland are to:
• prepare preliminary evaluations for key projects with the greatest potential as public private partnerships (PPPs)
• prepare business cases for all projects approved as potential PPPs
• manage tender processes and contract negotiations for all projects approved to proceed as PPPs
• actively engage with the private sector to develop funding models to encourage private investment in infrastructure
• prepare business cases and manage tender processes and contract negotiations for all traditional government financed infrastructure where the expected capital cost is greater than $100 million (or other projects identified as very high risk)
• for traditional government financed projects with an estimated cost below $100 million, assist line agencies in project assessment, tendering and contract negotiations, and other advisory and review services
• develop and deliver finance solutions for Government owned corporation infrastructure projects where the potential for private finance exists
• review and maintain the government’s key infrastructure policies (currently the Project Assurance Framework and the Value for Money Framework).
Capital Statement 2013-14 11
The scope of Projects Queensland’s responsibilities ensures a consistent approach to the assessment of projects, resulting in more effective prioritisation, selection of the appropriate procurement and financing options, and better targeting of projects as potential PPPs. This supports the establishment of a pipeline of privately financed projects and ensures consistency of dealings with the private sector on government projects.
Key Projects
Toowoomba Second Range Crossing
The 2012 Toowoomba Second Range Crossing (TSRC) Business Case seeks to identify an affordable new road crossing of the Toowoomba Range, to provide safer and more efficient passenger and freight movements on this important part of the National Land Transport Network.
The business case was considered by the Government in late 2012 and subsequently progressed to Infrastructure Australia for consideration. Infrastructure Australia is determining whether to include the project on its priority list, as part of the process to seek Australian Government funding.
Royal Children’s Hospital Site
With the transfer of services to the new Queensland Children’s Hospital in South Brisbane due in late 2014, Projects Queensland is currently developing a business case to assess uses for the existing Royal Children’s Hospital (RCH) Site in Herston.
A Preliminary Assessment for the RCH Site identified a Planned Procedure Centre as the preferred public health related use for the site. The proposed Centre will allow for the separation of elective and emergency surgery which will improve the efficiency of service delivery and help reduce elective surgery waiting times.
As the Planned Procedure Centre will only cover a small portion of the existing RCH Site, the business case will also consider future development opportunities for the balance of the Site.
A decision as to whether to proceed with the project, including the Planned Procedure Centre, and in what form, will be made by Government when it considers the business case.
12 Capital Statement 2013-14
Government Wireless Network
The proposed Government Wireless Network (GWN) is intended to deliver enhanced digital radio voice and narrowband data communications for Queensland’s public safety agencies, with improved communications security, interoperability between public safety agencies, added functionality and a foundation to support effective front-line public safety services.
An early priority for the project is to deliver the communications needs for the G20 Leaders’ Summit in 2014.
Over time, other Queensland Government agencies, local governments and public safety providers will potentially use the GWN’s services as it is progressively deployed throughout the State.
It is expected that the GWN Project will transition from the competitive tender phase to the implementation phase in the third quarter of 2013. The competitive tender phase will enable the State to determine project scope and cost and will inform negotiations with the Commonwealth Government regarding their promised funding contribution.
Queensland Schools Project
Projects Queensland, on behalf of the Department of Education, Training and Employment, is delivering the Queensland Schools Project. This project involves a package of 10 schools – eight Prep to Year 6 primary schools and two Year 7 to Year 12 secondary schools – located in rapidly developing areas in South East Queensland.
The project, currently in the procurement stage, is seeking a private sector provider to design, construct, commission, finance, maintain and provide facilities management services for the package of schools. Projects Queensland will manage the project through to the finalisation of the procurement phase in December 2013.
The first schools will open for the commencement of the 2015 academic year.
New Generation Rollingstock
The New Generation Rollingstock project will deliver passenger trains by taking a partnership approach with the private sector to design, build, provide ongoing maintenance and provide financing. The objectives of the project are to deliver additional passenger trains to meet the growing demand for rail services in South East Queensland, address the transport needs of a growing population, achieve value for money in the delivery of new trains and to utilise the benefits of private finance in the delivery of public transport capacity.
The project is currently in the final bidding phase with two committed proponents.
Capital Statement 2013-14 13
1 William Street
The strategic objectives of the State in the development of 1 William Street in the Brisbane CBD are to act as a catalyst for the activation of the Government Administrative Precinct and to meet the accommodation demands of the Queensland Public Service.
In December 2012, the State entered into an agreement with a developer to lease accommodation within a 75,000 m2 office tower. Construction works commenced on the site in early 2013, with the 45 level tower due for completion by December 2016.
The development includes an activated ground level with retail and garden areas. It will enhance Brisbane’s reputation as a vibrant city with modern, landmark architecture in a well planned urban environment and provide for the accommodation of the Queensland Public Service in a high quality, contemporary environment that will achieve value for money for the State.
2013-14 HIGHLIGHTS
Health
In 2013-14, the Government continues its significant investment in health infrastructure (including Queensland Health, Hospital and Health Services and Queensland Institute of Medical Research) with $1.746 billion in capital purchases. The focus for 2013-14 includes investment in new hospitals, hospital redevelopments and expansions, development of community health infrastructure, pathology, research and scientific services, mental health services and investment in information and health technology to support the delivery of health services.
Highlights of the 2013-14 capital program for Queensland Health include:
• $151.7 million to complete construction of the $1.762 billion Gold Coast University Hospital due to open in 2013
• $330 million to continue delivery of the Queensland Children’s Hospital and $24.2 million towards its Academic and Research Facility, at a total estimated cost of $1.513 billion
• $115.6 million to continue delivery of the Sunshine Coast University Hospital and its Skills, Academic and Research Centre as a public private partnership, at a total estimated cost of $1.872 billion
• $289.2 million to continue with the redevelopment of hospitals in Cairns, Mackay, Mount Isa, Townsville and Rockhampton, at a total estimated cost of $1.408 billion
14 Capital Statement 2013-14
• $135.1 million to continue the replacement, upgrade and state wide roll out of information and technology equipment to support the eHealth strategy and the National Health Reform Agenda
• $45.9 million to improve and upgrade health facilities in regional and remote areas: Atherton, Ayr, Biloela, Charleville, Charters Towers, Emerald, Kingaroy, Longreach, Mareeba, Roma, Sarina and Thursday Island.
Queensland Health will commence a Backlog Maintenance program of $327 million over four years involving both maintenance expenses and capital investment to address high priority and critical operational maintenance, life cycle replacements and upgrades. The program will include replacement of elevator systems at Toowoomba and Cairns Base hospitals, replacement and upgrades to switchboards at Gladstone, Toowoomba and Richmond Hospitals, and replacement of asbestos roofing at Ayr Hospital.
Transport and Main Roads
In 2013-14, the total capital program for the Transport and Main Roads Portfolio is forecast to be $5.599 billion including total capital grants. The Transport and Main Roads portfolio includes the Department, Roadtek, Queensland Rail Limited, Far North Queensland Ports Corporation Limited, Gladstone Ports Corporation Limited, North Queensland Bulk Ports Corporation Limited and the Port of Townsville Limited.
Roads and public transport infrastructure
Highlights of the 2013-14 roads and public transport infrastructure program are:
• $1.934 billion for capital recovery and reconstruction works resulting from natural disaster events throughout the State over the last three years
• $178.8 million to continue the construction of the Gold Coast Rapid Transit System, a light rail project from Southport to Broadbeach, at a total estimated cost of $1.296 billion, which will be delivered as a public private partnership jointly funded by Australian, Queensland and local government
• $170.6 million to continue the construction of the Moreton Bay Rail Link, a dual-track passenger rail line from Petrie to Kippa-Ring, at a total estimated cost of $1.147 billion, which is jointly Australian, Queensland and local government funded
• $65 million towards the duplication of the Bruce Highway (Cooroy to Curra) from Cooroy Southern Interchange to Sankeys Road (Section A). The State contribution towards the $790 million upgrade of the Cooroy to Curra section of the Bruce Highway is the first project to be funded under the $1 billion Bruce Highway State election commitment
Capital Statement 2013-14 15
• $45.8 million to continue the construction of auxiliary lanes on the Centenary Motorway, adjacent to the Darra to Springfield rail project, at a total estimated cost of $90.1 million
• $33.7 million to complete the construction of a deviation between Sandy Corner and Collinsons Lagoon on the Bruce Highway, between Ayr and Townsville, at a total estimated cost of $50 million, which is jointly Australian and Queensland government funded
• $54.4 million as part of the $128.4 million commitment to fund the upgrade of key rail crossings at Telegraph Road, Bracken Ridge and Robinson Road, Geebung, in partnership with Brisbane City Council
• $31.8 million for transport infrastructure development grants for upgrades to local government controlled roads
• $22.6 million to upgrade school bus fleets across Queensland.
Rail and Ports
The rail and ports 2013-14 capital program totals purchases of $997 million. Highlights of this program are:
• Queensland Rail – as part of an $797.6 million capital program, $151.7 million will be allocated to deliver new, and upgrade existing, rollingstock across Queensland, with $110 million allocated to New Generation Rollingstock acquisition and $30.7 million for replacement of Sunlander Rollingstock
• Far North Queensland Ports Corporation Limited - as part of a $5.5 million capital program, $2.7 million will be allocated to the development of the Environmental Impact Statement for the Cairns Shipping Development Project
• Gladstone Ports Corporation Limited - as part of a $151.6 million capital program, $50.9 million is allocated towards continuing works at the RG Tanna Coal Terminal at the Port of Gladstone and $28.2 million towards the completion of the Tug Harbour facility
• North Queensland Bulk Ports Corporation Limited - as part of a $19 million capital program, $6 million will be allocated to continue the development of the Port of Hay Point Master Plan and Environmental Impact Statement
• Port of Townsville Limited - as part of a $23.3 million capital program, $12.5 million is allocated to complete the lengthening the Berth 10A in the Port of Townsville to accommodate the Royal Australian Navy and cruise ships. This project is being jointly funded with the Australian Government and Townsville City Council.
16 Capital Statement 2013-14
Energy
The independent Commission of Audit (CoA) Final Report made a series of recommendations relevant to the Government owned corporations Energy sector including that, when market conditions are favourable, the Government divest its electricity generation assets.
The Government does not currently have a policy to sell Government businesses, and remains fully committed to seeking a mandate from the Queensland people before divesting itself of any Government business. However, the Government believes such a proposal is worthy of an open and transparent community debate to establish its viability and to inform stakeholders of the costs and benefits of Government owning such businesses, noting these also come with significant financial risks in the context of a modern economy.
The Government believes that the CoA recommendation that residual retail electricity functions be divested warrants further consideration and debate with the community.
The CoA also recommended that the electricity distribution and transmission businesses be required to achieve higher rates of return through increased efficiencies, better capital management and operational cost savings. It also recommends they divest themselves of non-core business where there are significant bring-forward benefits for the State from doing so.
Generation
The outlook for merchant generators in Queensland remains challenging. The market has experienced significant surplus generation capacity and lower than anticipated growth. This has resulted in less buoyant contract and pool prices. Vertically integrated retailers use their generation capacity to reduce price volatility. Roof top solar generation capacity, currently estimated to be in excess of 500 mega watts (MW), also reduces demand for on-grid energy and suppresses price peaks on hot sunny days.
CS Energy Limited and Stanwell Corporation Limited will spend $301.3 million in 2013-14 on the maintenance of existing plant and supporting operations. Their focus in 2013-14 will remain on the efficient, reliable and safe operation of their existing plant and equipment.
Transmission and distribution
Queensland Electricity Transmission Corporation Limited (Powerlink), Energex Limited (Energex) and Ergon Energy Corporation Limited (Ergon) operate in regulated environments where their levels of capital expenditure, operational expenditure and revenue are largely determined by the Australian Energy Regulator.
Capital Statement 2013-14 17
The companies provide reliable transmission and distribution services and continue to focus on cost control to deliver the best possible financial outcomes for Queenslanders.
The Government has also established the Independent Review Panel on Network Costs and the Interdepartmental Committee on Energy to investigate and make recommendations on the efficiency of current network capital (and operational) expenditure, among other key tasks. The Government’s decisions in relation to recommendations for reform are expected to be known later this year.
Within this context, capital programs have been closely examined to ensure expenditure is prudent. Budgeted capital expenditure in 2013-14 of $2.649 billion will continue the provision of a reliable transmission and distribution network. In the face of continued softening in electricity demand in Queensland, capital expenditure on the electricity network is expected to remain moderate over the coming years.
Education and Training
The Department of Education, Training and Employment will make capital purchases of $556.1 million in 2013-14. This includes $506.4 million for education (including early childhood education) and $29.7 million for training. The department will make capital grant payments of $152.6 million to other organisations.
Highlights of the department’s capital program include:
• $158.5 million to commence planning for a new secondary school at Highfields, undertake staged works at 10 schools, buy land and provide additional classrooms at existing schools in growth areas throughout the State, as well as to commence the new Queensland Schools Public Private Partnerships project
• $173.2 million to continue preparations to introduce Year 7 as the first year of secondary schooling from 2015 by building, refurbishing and reconfiguring state school classrooms and flexible learning areas
• $21.5 million to establish 15 new kindergarten services, a new pre-Prep facility at Aurukun and finalising construction of the children and family centre in Mackay
• $25.1 million to continue the delivery of the Australian Government Trade Training Centres in Schools Program.
18 Capital Statement 2013-14
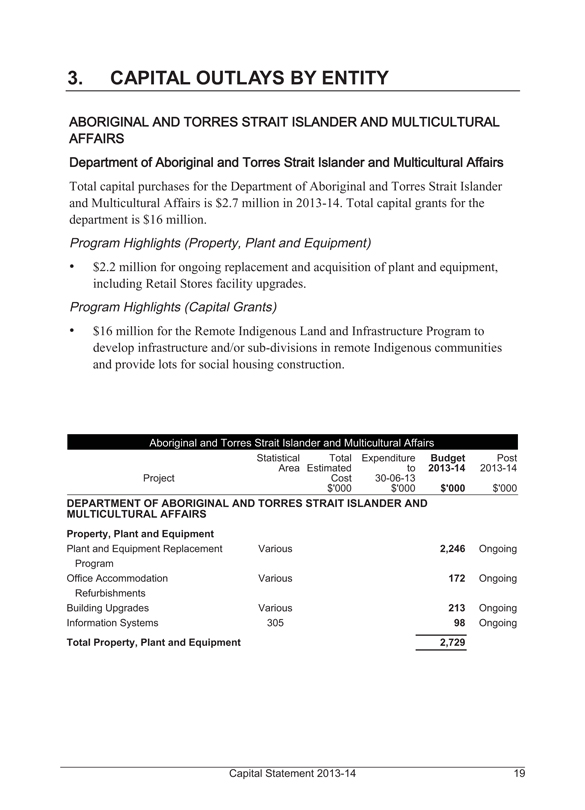
3. CAPITAL OUTLAYS BY ENTITY
ABORIGINAL AND TORRES STRAIT ISLANDER AND MULTICULTURAL AFFAIRS
Department of Aboriginal and Torres Strait Islander and Multicultural Affairs
Total capital purchases for the Department of Aboriginal and Torres Strait Islander and Multicultural Affairs is $2.7 million in 2013-14. Total capital grants for the department is $16 million.
Program Highlights (Property, Plant and Equipment)
• $2.2 million for ongoing replacement and acquisition of plant and equipment, including Retail Stores facility upgrades.
Program Highlights (Capital Grants)
• $16 million for the Remote Indigenous Land and Infrastructure Program to develop infrastructure and/or sub-divisions in remote Indigenous communities and provide lots for social housing construction.
Aboriginal and Torres Strait Islander and Multicultural Affairs
Project
Statistical Area
Total Estimated Cost $’000
Expenditure to 30-06-13 $’000
Budget 2013-14 $’000
Post 2013-14 $’000
DEPARTMENT OF ABORIGINAL AND TORRES STRAIT ISLANDER AND MULTICULTURAL AFFAIRS
Property, Plant and Equipment
Plant and Equipment Replacement Program Various 2,246 Ongoing
Office Accommodation Refurbishments Various 172 Ongoing
Building Upgrades Various 213 Ongoing
Information Systems 305 98 Ongoing
Total Property, Plant and Equipment 2,729
Capital Statement 2013-14 19
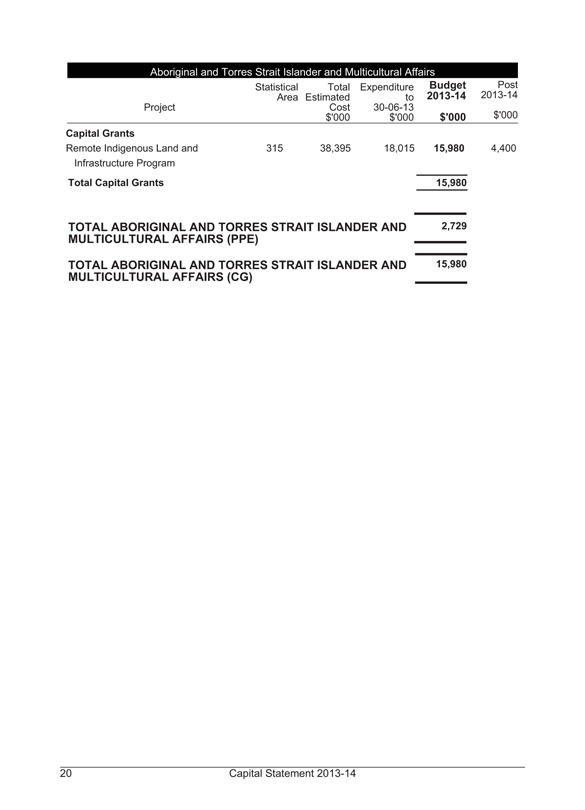
Aboriginal and Torres Strait Islander and Multicultural Affairs
Project
Statistical Area
Total Estimated Cost $’000
Expenditure to 30-06-13 $’000
Budget 2013-14 $’000
Post 2013-14 $’000
Capital Grants
Remote Indigenous Land and Infrastructure Program 315 38,395 18,015 15,980 4,400
Total Capital Grants 15,980
TOTAL ABORIGINAL AND TORRES STRAIT ISLANDER AND MULTICULTURAL AFFAIRS (PPE) 2,729
TOTAL ABORIGINAL AND TORRES STRAIT ISLANDER AND MULTICULTURAL AFFAIRS (CG) 15,980
20 Capital Statement 2013-14
AGRICULTURE, FISHERIES AND FORESTRY
Total capital purchases for the Agriculture, Fisheries and Forestry portfolio including statutory bodies reporting to the Minister for Agriculture, Fisheries and Forestry are $28.5 million in 2013-14.
Department of Agriculture, Fisheries and Forestry
Capital purchases for the Department of Agriculture, Fisheries and Forestry (DAFF) in 2013-14 are $19.6 million. DAFF’s capital program is focussed on developing and upgrading research facilities to deliver outcomes for agriculture, fisheries and forestry.
DAFF has facilities throughout rural and regional Queensland. These require a significant level of minor works, mechanical items and other plant and equipment upgrades to keep them operating effectively.
Program Highlights (Property, Plant and Equipment)
• $2 million is allocated to continue upgrading the Spyglass Beef Research property.
• $1.5 million is provided for the enhancement of existing biosecurity laboratory facilities at the Health and Food Sciences Precinct at Coopers Plains as part of the Agriculture Strategy range of initiatives.
• $4.5 million is allocated to continue upgrades to the Department’s research and operational facilities through the Research Facilities Development, Scientific Equipment and Minor Works Programs.
• $1.5 million is provided to continue the replacement of key vessels and marine equipment for fisheries research and regulatory functions.
• $1 million is allocated to provide new and replacement heavy plant and equipment including trucks, tractors and other machinery.
Australian Agricultural College Corporation
Capital purchases for the Australian Agricultural College Corporation (AACC) are $1.9 million in 2013-14. The capital program focusses on campus upgrades to provide educational pathways for students and lifelong learning options for the agricultural, pastoral and agribusiness workforce.
QRAA
QRAA’s 2013-14 capital expenditure of $7.1 million will be used primarily for computer hardware and software upgrades.
Capital Statement 2013-14 21
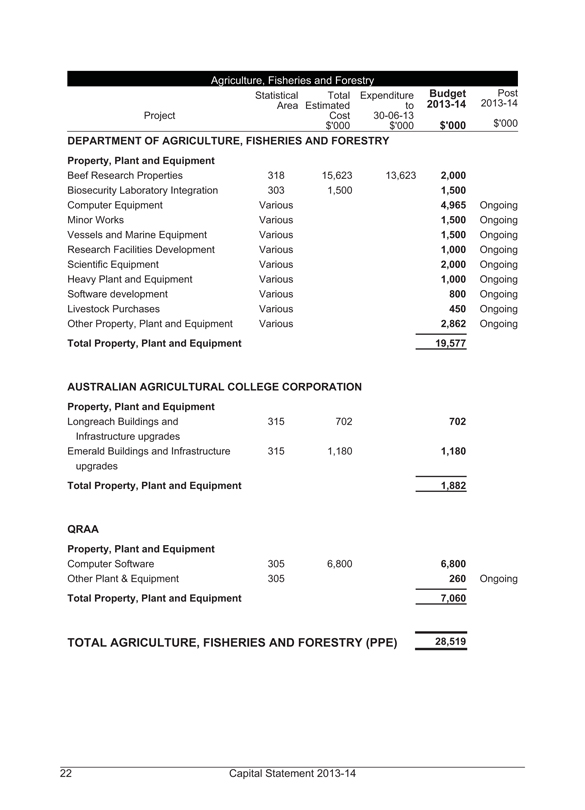
Agriculture, Fisheries and Forestry
Project
Statistical Area
Total Estimated Cost $’000
Expenditure to 30-06-13 $’000
Budget 2013-14 $’000
Post 2013-14 $’000
DEPARTMENT OF AGRICULTURE, FISHERIES AND FORESTRY
Property, Plant and Equipment
Beef Research Properties 318 15,623 13,623 2,000
Biosecurity Laboratory Integration 303 1,500 1,500
Computer Equipment Various 4,965 Ongoing
Minor Works Various 1,500 Ongoing
Vessels and Marine Equipment Various 1,500 Ongoing
Research Facilities Development Various 1,000 Ongoing
Scientific Equipment Various 2,000 Ongoing
Heavy Plant and Equipment Various 1,000 Ongoing
Software development Various 800 Ongoing
Livestock Purchases Various 450 Ongoing
Other Property, Plant and Equipment Various 2,862 Ongoing
Total Property, Plant and Equipment 19,577
AUSTRALIAN AGRICULTURAL COLLEGE CORPORATION
Property, Plant and Equipment
Longreach Buildings and Infrastructure upgrades 315 702 702
Emerald Buildings and Infrastructure upgrades 315 1,180 1,180
Total Property, Plant and Equipment 1,882
QRAA
Property, Plant and Equipment
Computer Software 305 6,800 6,800
Other Plant & Equipment 305 260 Ongoing
Total Property, Plant and Equipment 7,060
TOTAL AGRICULTURE, FISHERIES AND FORESTRY (PPE) 28,519
22 Capital Statement 2013-14
COMMUNITIES, CHILD SAFETY AND DISABILITY SERVICES
In 2013-14, total capital purchases for Communities, Child Safety and Disability Services portfolio is $41.5 million. This expenditure includes the Department of Communities, Child Safety and Disability Services and the Commission for Children and Young People and Child Guardian. The Department will also expend $22.1 million on capital grants.
Department of Communities, Child Safety and Disability Services
The capital purchases for the Department of Communities, Child Safety and Disability Services is $40.3 million in 2013-14. Total capital grants for the Department is $22.1 million. These funds provide for integrated community services and to strengthen and protect the well-being of Queenslanders, particularly those who are vulnerable and most in need.
Program Highlights (Property, Plant and Equipment)
• $12.2 million to continue infrastructure upgrades and construct purpose built accommodation as part of a targeted response for people with an intellectual and/or cognitive disability who exhibit severely challenging behaviours.
• $2.3 million for neighbourhood centres in Mount Isa and Chinchilla to provide access to universal community support services, and an entry point to more targeted support services.
• $1.2 million to continue construction activities and the establishment of facilities to support the Safe Haven Program. This program provides culturally appropriate services to respond to the safety needs of children, young people and their families experiencing or witnessing domestic or family violence in the communities of Mornington Island, Coen, Cherbourg and Palm Island.
• $3.6 million for remote Indigenous service delivery, including:
- $1.8 million to continue establishing Safe Houses in the Torres Strait to provide a safe place for Indigenous children in the statutory child protection system to remain in their communities, while their longer term needs are assessed; and
- $0.9 million to continue establishing employee housing and office accommodation in Cooktown to service remote Indigenous communities.
• $3.3 million to continue investment in Residential Care Facilities, expanding the range of placement options for children and young people in the child protection system.
Capital Statement 2013-14 23
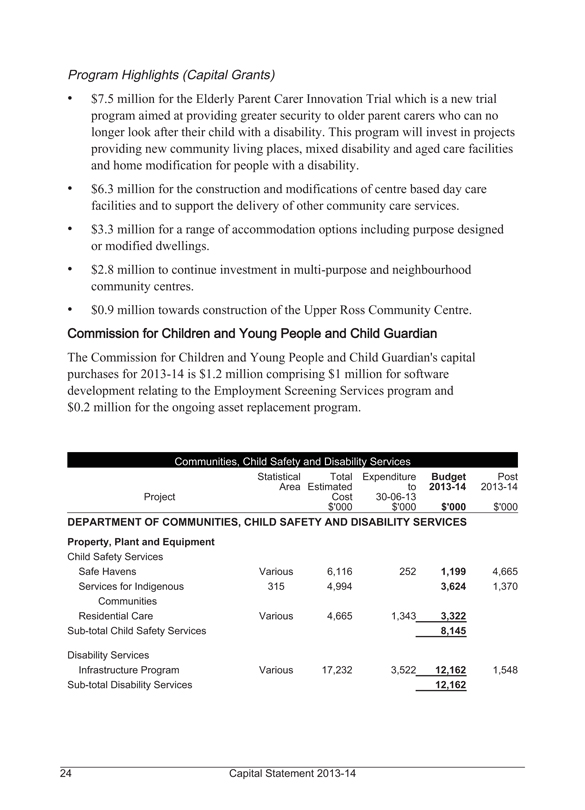
Program Highlights (Capital Grants)
• $7.5 million for the Elderly Parent Carer Innovation Trial which is a new trial program aimed at providing greater security to older parent carers who can no longer look after their child with a disability. This program will invest in projects providing new community living places, mixed disability and aged care facilities and home modification for people with a disability.
• $6.3 million for the construction and modifications of centre based day care facilities and to support the delivery of other community care services.
• $3.3 million for a range of accommodation options including purpose designed or modified dwellings.
• $2.8 million to continue investment in multi-purpose and neighbourhood community centres.
• $0.9 million towards construction of the Upper Ross Community Centre.
Commission for Children and Young People and Child Guardian
The Commission for Children and Young People and Child Guardian’s capital purchases for 2013-14 is $1.2 million comprising $1 million for software development relating to the Employment Screening Services program and $0.2 million for the ongoing asset replacement program.
Communities, Child Safety and Disability Services
Project
Statistical Area
Total Estimated Cost $’000
Expenditure to 30-06-13 $’000
Budget 2013-14 $’000
Post 2013-14 $’000
DEPARTMENT OF COMMUNITIES, CHILD SAFETY AND DISABILITY SERVICES
Property, Plant and Equipment
Child Safety Services
Safe Havens Various 6,116 252 1,199 4,665
Services for Indigenous Communities 315 4,994 3,624 1,370
Residential Care Various 4,665 1,343 3,322
Sub-total Child Safety Services 8,145
Disability Services Infrastructure Program Various 17,232 3,522 12,162 1,548
Sub-total Disability Services 12,162
24 Capital Statement 2013-14
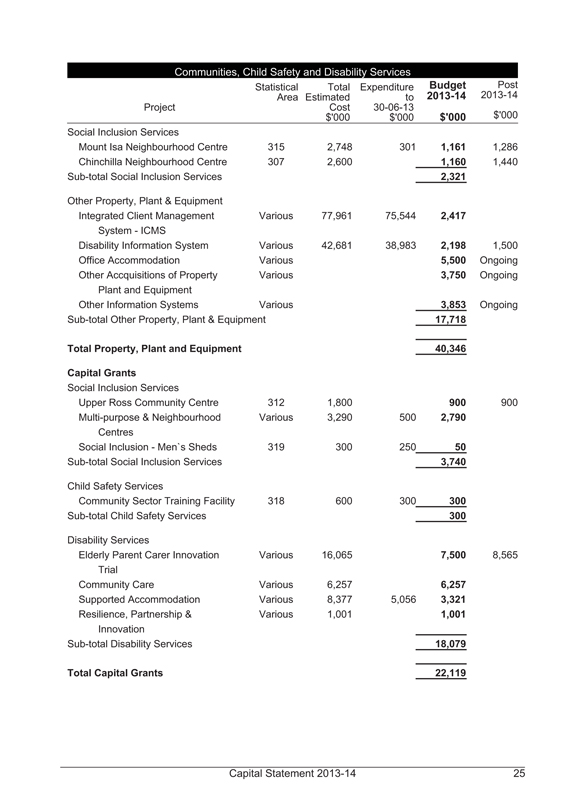
Communities, Child Safety and Disability Services
Project
Statistical Area
Total Estimated Cost $’000
Expenditure to 30-06-13 $’000
Budget 2013-14 $’000
Post 2013-14 $’000
Social Inclusion Services
Mount Isa Neighbourhood Centre 315 2,748 301 1,161 1,286
Chinchilla Neighbourhood Centre 307 2,600 1,160 1,440
Sub-total Social Inclusion Services 2,321
Other Property, Plant & Equipment
Integrated Client Management System - ICMS Various 77,961 75,544 2,417
Disability Information System Various 42,681 38,983 2,198 1,500
Office Accommodation Various 5,500 Ongoing
Other Accquisitions of Property Plant and Equipment Various 3,750 Ongoing
Other Information Systems Various 3,853 Ongoing
Sub-total Other Property, Plant & Equipment 17,718
Total Property, Plant and Equipment 40,346
Capital Grants
Social Inclusion Services
Upper Ross Community Centre 312 1,800 900 900
Multi-purpose & Neighbourhood Centres Various 3,290 500 2,790
Social Inclusion - Men’s Sheds 319 300 250 50
Sub-total Social Inclusion Services 3,740
Child Safety Services
Community Sector Training Facility 318 600 300 300
Sub-total Child Safety Services 300
Disability Services
Elderly Parent Carer Innovation Trial Various 16,065 7,500 8,565
Community Care Various 6,257 6,257
Supported Accommodation Various 8,377 5,056 3,321
Resilience, Partnership & Innovation Various 1,001 1,001
Sub-total Disability Services 18,079
Total Capital Grants 22,119
Capital Statement 2013-14 25
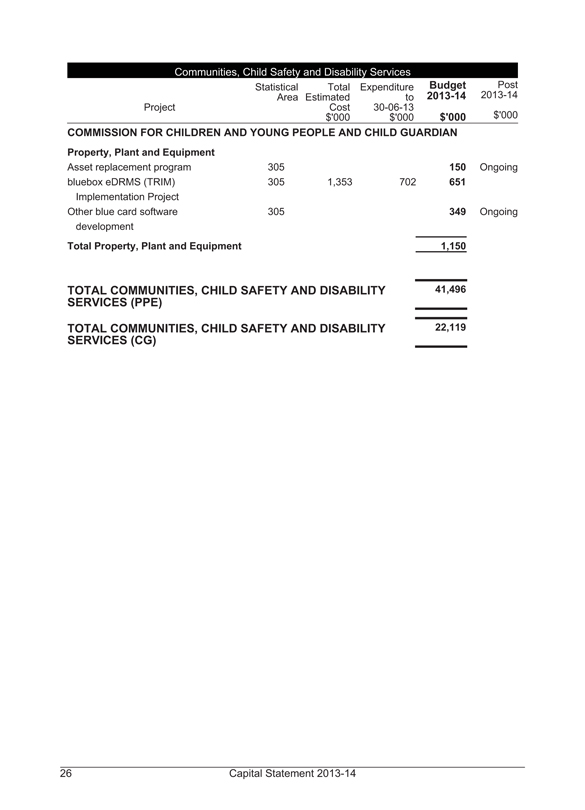
Communities, Child Safety and Disability Services
Project
Statistical Area
Total Estimated Cost $’000
Expenditure to 30-06-13 $’000
Budget 2013-14 $’000
Post 2013-14 $’000
COMMISSION FOR CHILDREN AND YOUNG PEOPLE AND CHILD GUARDIAN
Property, Plant and Equipment
Asset replacement program 305 150 Ongoing
bluebox eDRMS (TRIM) Implementation Project 305 1,353 702 651
Other blue card software development 305 349 Ongoing
Total Property, Plant and Equipment 1,150
TOTAL COMMUNITIES, CHILD SAFETY AND DISABILITY SERVICES (PPE) 41,496
TOTAL COMMUNITIES, CHILD SAFETY AND DISABILITY SERVICES (CG) 22,119
26 Capital Statement 2013-14
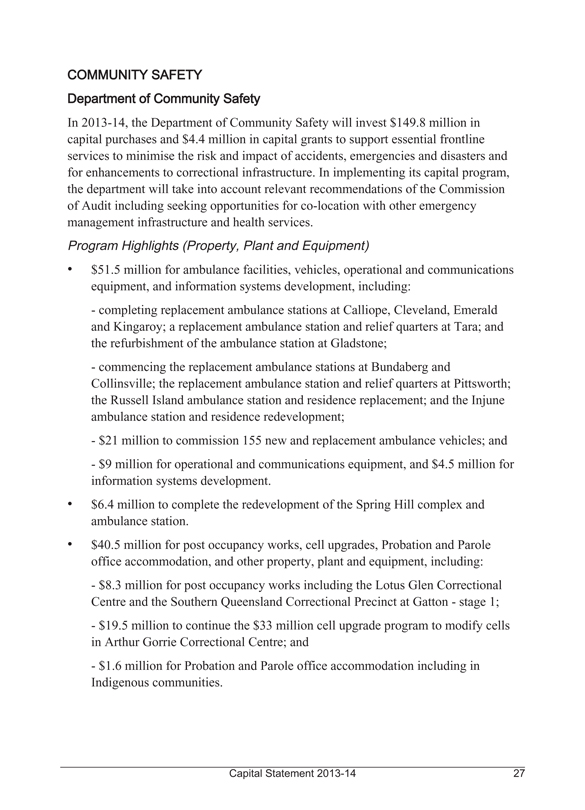
COMMUNITY SAFETY
Department of Community Safety
In 2013-14, the Department of Community Safety will invest $149.8 million in capital purchases and $4.4 million in capital grants to support essential frontline services to minimise the risk and impact of accidents, emergencies and disasters and for enhancements to correctional infrastructure. In implementing its capital program, the department will take into account relevant recommendations of the Commission of Audit including seeking opportunities for co-location with other emergency management infrastructure and health services.
Program Highlights (Property, Plant and Equipment)
• $51.5 million for ambulance facilities, vehicles, operational and communications equipment, and information systems development, including:
- completing replacement ambulance stations at Calliope, Cleveland, Emerald and Kingaroy; a replacement ambulance station and relief quarters at Tara; and the refurbishment of the ambulance station at Gladstone;
- commencing the replacement ambulance stations at Bundaberg and Collinsville; the replacement ambulance station and relief quarters at Pittsworth; the Russell Island ambulance station and residence replacement; and the Injune ambulance station and residence redevelopment;
- $21 million to commission 155 new and replacement ambulance vehicles; and
- $9 million for operational and communications equipment, and $4.5 million for information systems development.
• $6.4 million to complete the redevelopment of the Spring Hill complex and ambulance station.
• $40.5 million for post occupancy works, cell upgrades, Probation and Parole office accommodation, and other property, plant and equipment, including:
- $8.3 million for post occupancy works including the Lotus Glen Correctional Centre and the Southern Queensland Correctional Precinct at Gatton - stage 1;
- $19.5 million to continue the $33 million cell upgrade program to modify cells in Arthur Gorrie Correctional Centre; and
- $1.6 million for Probation and Parole office accommodation including in Indigenous communities.
Capital Statement 2013-14 27
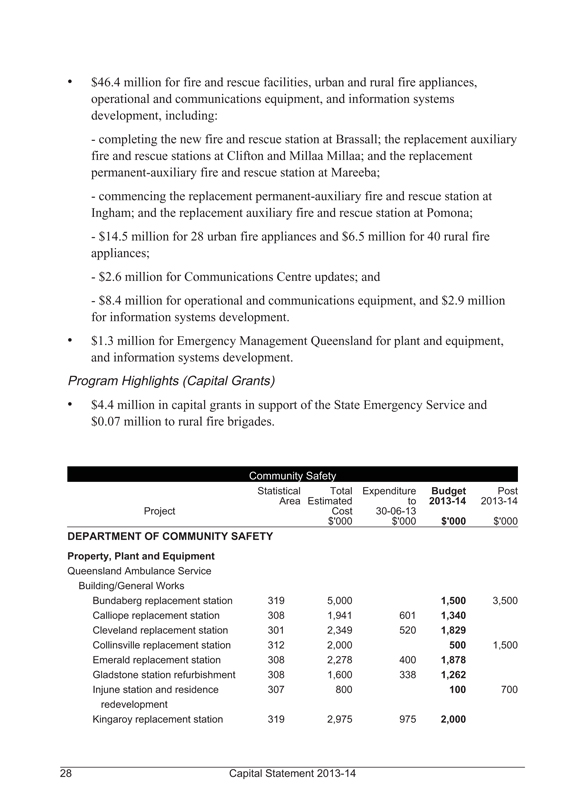
• $46.4 million for fire and rescue facilities, urban and rural fire appliances, operational and communications equipment, and information systems development, including:
- completing the new fire and rescue station at Brassall; the replacement auxiliary fire and rescue stations at Clifton and Millaa Millaa; and the replacement permanent-auxiliary fire and rescue station at Mareeba;
- commencing the replacement permanent-auxiliary fire and rescue station at Ingham; and the replacement auxiliary fire and rescue station at Pomona;
- $14.5 million for 28 urban fire appliances and $6.5 million for 40 rural fire appliances;
- $2.6 million for Communications Centre updates; and
- $8.4 million for operational and communications equipment, and $2.9 million for information systems development.
• $1.3 million for Emergency Management Queensland for plant and equipment, and information systems development.
Program Highlights (Capital Grants)
• $4.4 million in capital grants in support of the State Emergency Service and $0.07 million to rural fire brigades.
Community Safety
Project
Statistical Area
Total Estimated Cost $’000
Expenditure to 30-06-13 $’000
Budget 2013-14 $’000
Post 2013-14 $’000
DEPARTMENT OF COMMUNITY SAFETY
Property, Plant and Equipment
Queensland Ambulance Service Building/General Works
Bundaberg replacement station 319 5,000 1,500 3,500
Calliope replacement station 308 1,941 601 1,340
Cleveland replacement station 301 2,349 520 1,829
Collinsville replacement station 312 2,000 500 1,500
Emerald replacement station 308 2,278 400 1,878
Gladstone station refurbishment 308 1,600 338 1,262
Injune station and residence redevelopment 307 800 100 700
Kingaroy replacement station 319 2,975 975 2,000
28 Capital Statement 2013-14
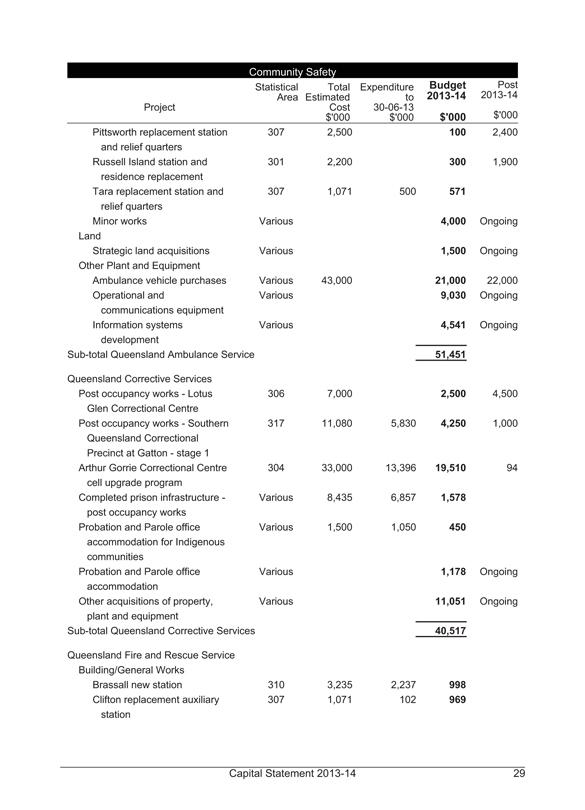
Community Safety
Project
Statistical Area
Total Estimated Cost $’000
Expenditure to 30-06-13 $’000
Budget 2013-14 $’000
Post 2013-14 $’000
Pittsworth replacement station and relief quarters 307 2,500 100 2,400
Russell Island station and residence replacement 301 2,200 300 1,900
Tara replacement station and relief quarters 307 1,071 500 571
Minor works Various 4,000 Ongoing
Land
Strategic land acquisitions Various 1,500 Ongoing
Other Plant and Equipment
Ambulance vehicle purchases Various 43,000 21,000 22,000
Operational and communications equipment Various 9,030 Ongoing
Information systems development Various 4,541 Ongoing
Sub-total Queensland Ambulance Service 51,451
Queensland Corrective Services
Post occupancy works - Lotus Glen Correctional Centre 306 7,000 2,500 4,500
Post occupancy works - Southern Queensland Correctional Precinct at Gatton - stage 1 317 11,080 5,830 4,250 1,000
Arthur Gorrie Correctional Centre cell upgrade program 304 33,000 13,396 19,510 94
Completed prison infrastructure - post occupancy works Various 8,435 6,857 1,578
Probation and Parole office accommodation for Indigenous communities Various 1,500 1,050 450
Probation and Parole office accommodation Various 1,178 Ongoing
Other acquisitions of property, plant and equipment Various 11,051 Ongoing
Sub-total Queensland Corrective Services 40,517
Queensland Fire and Rescue Service
Building/General Works
Brassall new station 310 3,235 2,237 998
Clifton replacement auxiliary station 307 1,071 102 969
Capital Statement 2013-14 29
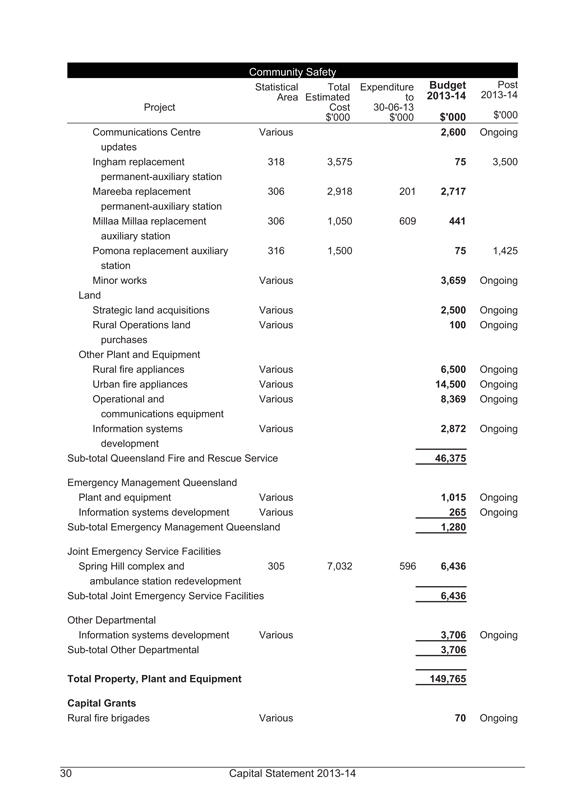
Community Safety
Project
Statistical Area
Total Estimated Cost $’000
Expenditure to 30-06-13 $’000
Budget 2013-14 $’000
Post 2013-14 $’000
Communications Centre updates Various 2,600 Ongoing
Ingham replacement permanent-auxiliary station 318 3,575 75 3,500
Mareeba replacement permanent-auxiliary station 306 2,918 201 2,717
Millaa Millaa replacement auxiliary station 306 1,050 609 441
Pomona replacement auxiliary station 316 1,500 75 1,425
Minor works Various 3,659 Ongoing
Land
Strategic land acquisitions Various 2,500 Ongoing
Rural Operations land purchases Various 100 Ongoing
Other Plant and Equipment
Rural fire appliances Various 6,500 Ongoing
Urban fire appliances Various 14,500 Ongoing
Operational and communications equipment Various 8,369 Ongoing
Information systems development Various 2,872 Ongoing
Sub-total Queensland Fire and Rescue Service 46,375
Emergency Management Queensland
Plant and equipment Various 1,015 Ongoing
Information systems development Various 265 Ongoing
Sub-total Emergency Management Queensland 1,280
Joint Emergency Service Facilities
Spring Hill complex and ambulance station redevelopment 305 7,032 596 6,436
Sub-total Joint Emergency Service Facilities 6,436
Other Departmental
Information systems development Various 3,706 Ongoing
Sub-total Other Departmental 3,706
Total Property, Plant and Equipment 149,765
Capital Grants
Rural fire brigades Various 70 Ongoing
30 Capital Statement 2013-14
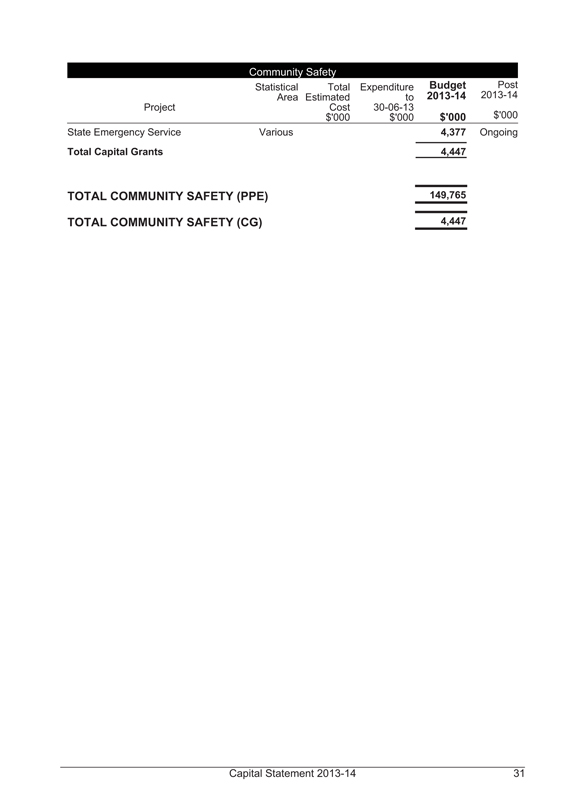
Community Safety
Project
Statistical Area
Total Estimated Cost $’000
Expenditure to 30-06-13 $’000
Budget 2013-14 $’000
Post 2013-14 $’000
State Emergency Service Various 4,377 Ongoing
Total Capital Grants 4,447
TOTAL COMMUNITY SAFETY (PPE) 149,765
TOTAL COMMUNITY SAFETY (CG) 4,447
Capital Statement 2013-14 31
EDUCATION, TRAINING AND EMPLOYMENT
Total capital purchases for the Education, Training and Employment portfolio (including the Department of Education, Training and Employment and related entities) is $556.1 million in 2013-14. Total capital grants for the portfolio is $152.6 million in 2013-14.
Department of Education, Training and Employment
Education
The 2013-14 capital purchases of $453.8 million is directed towards the construction and refurbishment of educational facilities and kindergarten services.
There will be $173.2 million of capital investment in 2013-14 to continue to prepare Queensland for the introduction of Year 7 as the first year of secondary school from 2015 by building, refurbishing and reconfiguring state school classrooms and flexible learning areas.
Planning for capital works meets the Government’s priorities and needs by considering population growth and shifts and consequential impacts on enrolments, changes in educational standards and delivery methods, and addressing high priority needs such as student and staff health and safety.
The department has also been provided increased funding of $100 million in 2014-15 to address maintenance backlogs in Queensland State Schools. This spending is expensed and hence does not appear in this Capital Statement.
Program Highlights (Property, Plant and Equipment)
• $158.5 million to commence planning for the new secondary school at Highfields, undertake staged works at 10 schools, buy land, and to provide additional classrooms at existing schools in growth areas throughout the State, as well as to commence the new Queensland Schools Public Private Partnerships project.
• $46.7 million to replace and enhance facilities at existing schools.
• $25.1 million to continue delivery of the Australian Government Trade Training Centres in Schools Program.
• $2.9 million to complete construction of the children and family centre in Mackay.
• $2.5 million to complete construction of new employee housing.
• $21.5 million to continue the construction of kindergartens, including 15 new kindergartens on state school sites at Blackwater North, Brightwater, Calen,
32 Capital Statement 2013-14
Collingwood Park, Fernvale, Glenden, Gordonvale, Jinibara, Lakes Creek, Mango Hill, Marian, Serviceton South, Undurba, Waraburra and Wynnum and one new Pre-Prep facility at Aurukun Campus of Cape York Aboriginal Australian Academy.
• $10.7 million to continue delivery of the Building Our Future Schools initiative on school sites at Cairns, Gladstone, Gympie, Helensvale, Kingaroy, Lockyer District, Marsden, Mirani, Pimlico, Tamborine Mountain, The Gap, Urangan, Wavell and Woodridge.
Training
The 2013-14 capital purchases of $27.8 million is directed towards the construction and refurbishment of TAFE training facilities.
Program Highlights (Property, Plant and Equipment)
• $3.9 million to continue planning of the redevelopment of the Pimlico Campus of the Barrier Reef Institute of TAFE.
Gold Coast Institute of TAFE
Gold Coast Institute of TAFE’s 2013-14 capital purchases of $15.6 million is directed towards the redevelopment of campus facilities and improved equipment and resources for students.
Program Highlights (Property, Plant and Equipment)
• $9 million for the acquisition and development of new and improved campus facilities for the Institute.
• $1.8 million for the upgrade of existing teaching and learning facilities and provide the latest equipment to enhance service delivery across the Institute and improve outcomes for students.
• $2.5 million for the upgrade, improvement and development in ICT systems and technology to ensure service delivery and provide reporting and operational efficiencies across the Institute.
• $1.5 million for the development of new on-line course offerings to ensure students receive the most up to date training across a range of courses in a format that meets their needs.
Capital Statement 2013-14 33
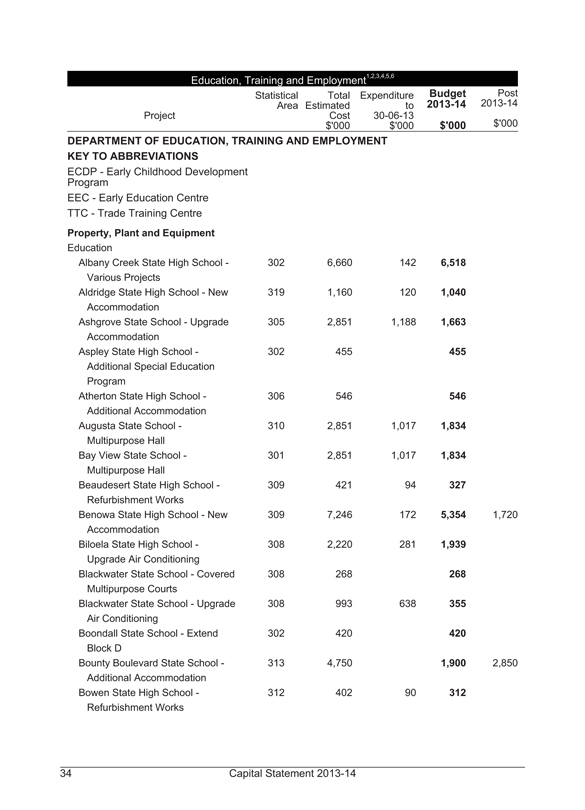
Education, Training and Employment1,2,3,4,5,6
Project
Statistical Area
Total Estimated Cost $’000
Expenditure to 30-06-13 $’000
Budget 2013-14 $’000
Post 2013-14 $’000
DEPARTMENT OF EDUCATION, TRAINING AND EMPLOYMENT KEY TO ABBREVIATIONS
ECDP - Early Childhood Development Program
EEC - Early Education Centre
TTC - Trade Training Centre
Property, Plant and Equipment
Education
Albany Creek State High School - Various Projects 302 6,660 142 6,518
Aldridge State High School - New Accommodation 319 1,160 120 1,040
Ashgrove State School - Upgrade Accommodation 305 2,851 1,188 1,663
Aspley State High School - Additional Special Education Program 302 455 455
Atherton State High School - Additional Accommodation 306 546 546
Augusta State School - Multipurpose Hall 310 2,851 1,017 1,834
Bay View State School - Multipurpose Hall 301 2,851 1,017 1,834
Beaudesert State High School - Refurbishment Works 309 421 94 327
Benowa State High School - New Accommodation 309 7,246 172 5,354 1,720
Biloela State High School - Upgrade Air Conditioning 308 2,220 281 1,939
Blackwater State School - Covered Multipurpose Courts 308 268 268
Blackwater State School - Upgrade Air Conditioning 308 993 638 355
Boondall State School - Extend Block D 302 420 420
Bounty Boulevard State School - Additional Accommodation 313 4,750 1,900 2,850
Bowen State High School - Refurbishment Works 312 402 90 312
34 Capital Statement 2013-14
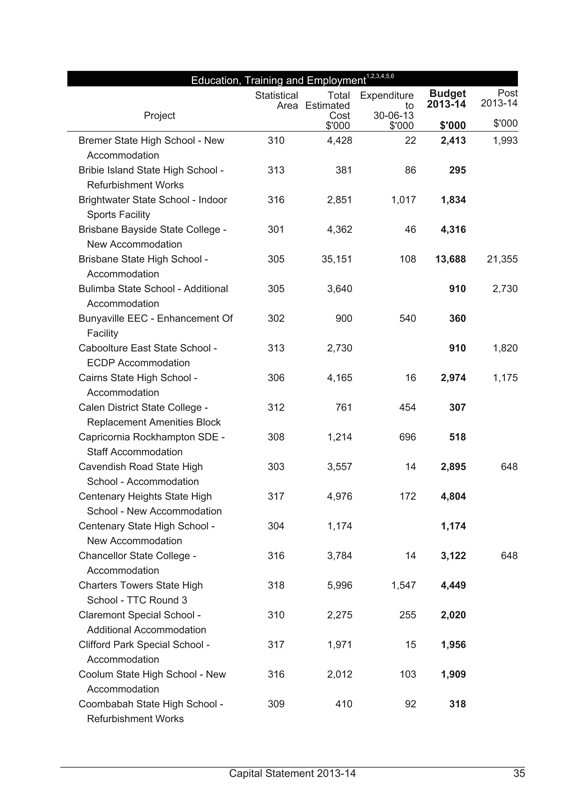
Education, Training and Employment1,2,3,4,5,6
Project
Statistical Area
Total Estimated Cost $’000
Expenditure to 30-06-13 $’000
Budget 2013-14 $’000
Post 2013-14 $’000
Bremer State High School - New Accommodation 310 4,428 22 2,413 1,993
Bribie Island State High School - Refurbishment Works 313 381 86 295
Brightwater State School - Indoor Sports Facility 316 2,851 1,017 1,834
Brisbane Bayside State College - New Accommodation 301 4,362 46 4,316
Brisbane State High School - Accommodation 305 35,151 108 13,688 21,355
Bulimba State School - Additional Accommodation 305 3,640 910 2,730
Bunyaville EEC - Enhancement Of Facility 302 900 540 360
Caboolture East State School - ECDP Accommodation 313 2,730 910 1,820
Cairns State High School - Accommodation 306 4,165 16 2,974 1,175
Calen District State College - Replacement Amenities Block 312 761 454 307
Capricornia Rockhampton SDE - Staff Accommodation 308 1,214 696 518
Cavendish Road State High School - Accommodation 303 3,557 14 2,895 648
Centenary Heights State High School - New Accommodation 317 4,976 172 4,804
Centenary State High School - New Accommodation 304 1,174 1,174
Chancellor State College - Accommodation 316 3,784 14 3,122 648
Charters Towers State High School - TTC Round 3 318 5,996 1,547 4,449
Claremont Special School - Additional Accommodation 310 2,275 255 2,020
Clifford Park Special School - Accommodation 317 1,971 15 1,956
Coolum State High School - New Accommodation 316 2,012 103 1,909
Coombabah State High School - Refurbishment Works 309 410 92 318
Capital Statement 2013-14 35
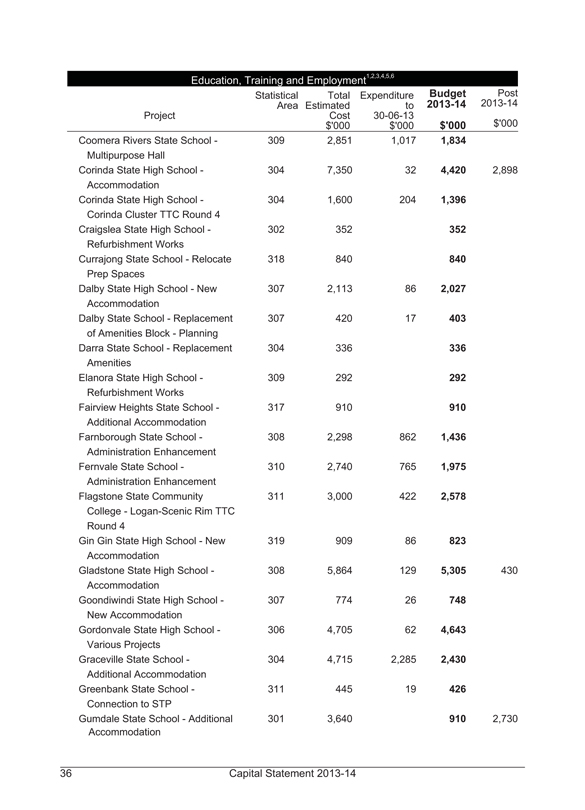
Education, Training and Employment1,2,3,4,5,6
Project
Statistical Area
Total Estimated Cost $’000
Expenditure to 30-06-13 $’000
Budget 2013-14 $’000
Post 2013-14 $’000
Coomera Rivers State School - Multipurpose Hall 309 2,851 1,017 1,834
Corinda State High School - Accommodation 304 7,350 32 4,420 2,898
Corinda State High School - Corinda Cluster TTC Round 4 304 1,600 204 1,396
Craigslea State High School - Refurbishment Works 302 352 352
Currajong State School - Relocate Prep Spaces 318 840 840
Dalby State High School - New Accommodation 307 2,113 86 2,027
Dalby State School - Replacement of Amenities Block - Planning 307 420 17 403
Darra State School - Replacement Amenities 304 336 336
Elanora State High School - Refurbishment Works 309 292 292
Fairview Heights State School - Additional Accommodation 317 910 910
Farnborough State School - Administration Enhancement 308 2,298 862 1,436
Fernvale State School - Administration Enhancement 310 2,740 765 1,975
Flagstone State Community College - Logan-Scenic Rim TTC Round 4 311 3,000 422 2,578
Gin Gin State High School - New Accommodation 319 909 86 823
Gladstone State High School - Accommodation 308 5,864 129 5,305 430
Goondiwindi State High School - New Accommodation 307 774 26 748
Gordonvale State High School - Various Projects 306 4,705 62 4,643
Graceville State School - Additional Accommodation 304 4,715 2,285 2,430
Greenbank State School - Connection to STP 311 445 19 426
Gumdale State School - Additional Accommodation 301 3,640 910 2,730
36 Capital Statement 2013-14
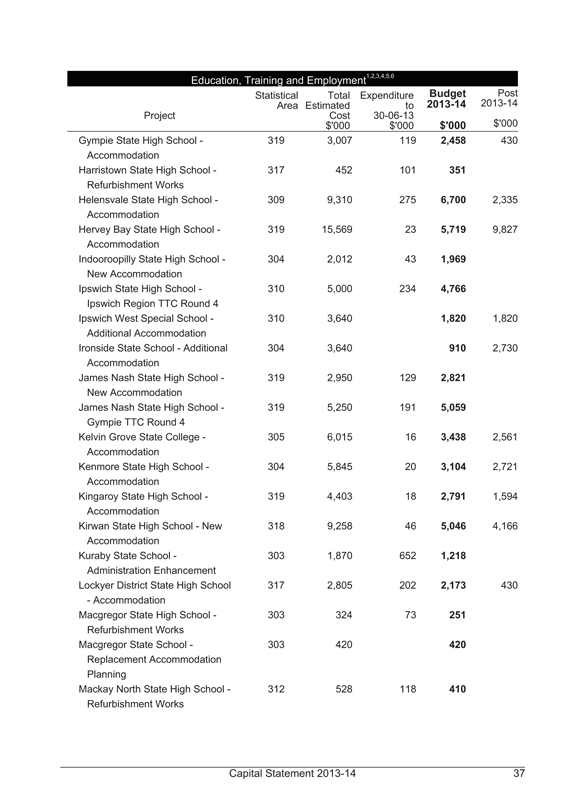
Education, Training and Employment1,2,3,4,5,6
Project
Statistical Area
Total Estimated Cost $’000
Expenditure to 30-06-13 $’000
Budget 2013-14 $’000
Post 2013-14 $’000
Gympie State High School - Accommodation 319 3,007 119 2,458 430
Harristown State High School - Refurbishment Works 317 452 101 351
Helensvale State High School - Accommodation 309 9,310 275 6,700 2,335
Hervey Bay State High School - Accommodation 319 15,569 23 5,719 9,827
Indooroopilly State High School - New Accommodation 304 2,012 43 1,969
Ipswich State High School - Ipswich Region TTC Round 4 310 5,000 234 4,766
Ipswich West Special School - Additional Accommodation 310 3,640 1,820 1,820
Ironside State School - Additional Accommodation 304 3,640 910 2,730
James Nash State High School - New Accommodation 319 2,950 129 2,821
James Nash State High School - Gympie TTC Round 4 319 5,250 191 5,059
Kelvin Grove State College - Accommodation 305 6,015 16 3,438 2,561
Kenmore State High School - Accommodation 304 5,845 20 3,104 2,721
Kingaroy State High School - Accommodation 319 4,403 18 2,791 1,594
Kirwan State High School - New Accommodation 318 9,258 46 5,046 4,166
Kuraby State School - Administration Enhancement 303 1,870 652 1,218
Lockyer District State High School - Accommodation 317 2,805 202 2,173 430
Macgregor State High School - Refurbishment Works 303 324 73 251
Macgregor State School - Replacement Accommodation Planning 303 420 420
Mackay North State High School - Refurbishment Works 312 528 118 410
Capital Statement 2013-14 37
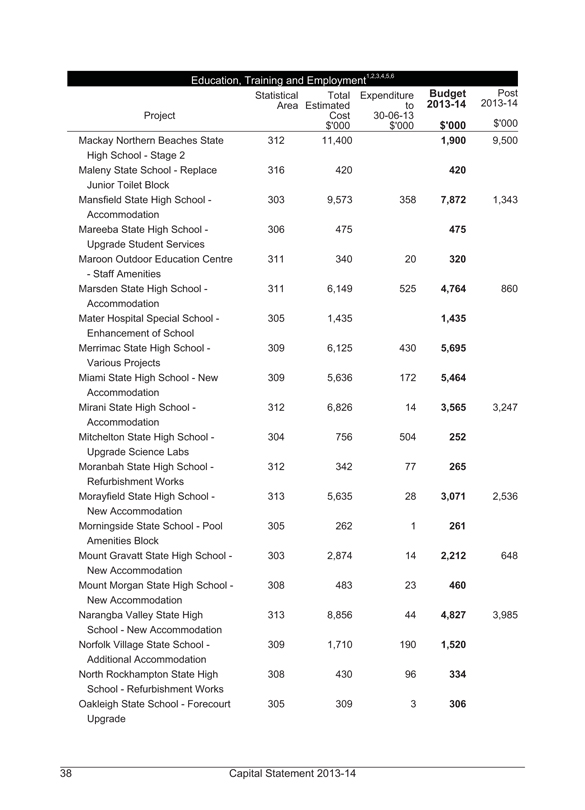
Education, Training and Employment1,2,3,4,5,6
Project
Statistical Area
Total Estimated Cost $’000
Expenditure to 30-06-13 $’000
Budget 2013-14 $’000
Post 2013-14 $’000
Mackay Northern Beaches State High School - Stage 2 312 11,400 1,900 9,500
Maleny State School - Replace Junior Toilet Block 316 420 420
Mansfield State High School - Accommodation 303 9,573 358 7,872 1,343
Mareeba State High School - Upgrade Student Services 306 475 475
Maroon Outdoor Education Centre - Staff Amenities 311 340 20 320
Marsden State High School - Accommodation 311 6,149 525 4,764 860
Mater Hospital Special School - Enhancement of School 305 1,435 1,435
Merrimac State High School - Various Projects 309 6,125 430 5,695
Miami State High School - New Accommodation 309 5,636 172 5,464
Mirani State High School - Accommodation 312 6,826 14 3,565 3,247
Mitchelton State High School - Upgrade Science Labs 304 756 504 252
Moranbah State High School - Refurbishment Works 312 342 77 265
Morayfield State High School - New Accommodation 313 5,635 28 3,071 2,536
Morningside State School - Pool Amenities Block 305 262 1 261
Mount Gravatt State High School - New Accommodation 303 2,874 14 2,212 648
Mount Morgan State High School - New Accommodation 308 483 23 460
Narangba Valley State High School - New Accommodation 313 8,856 44 4,827 3,985
NorfolkVillage State School - Additional Accommodation 309 1,710 190 1,520
North Rockhampton State High School - Refurbishment Works 308 430 96 334
Oakleigh State School - Forecourt Upgrade 305 309 3 306
38 Capital Statement 2013-14
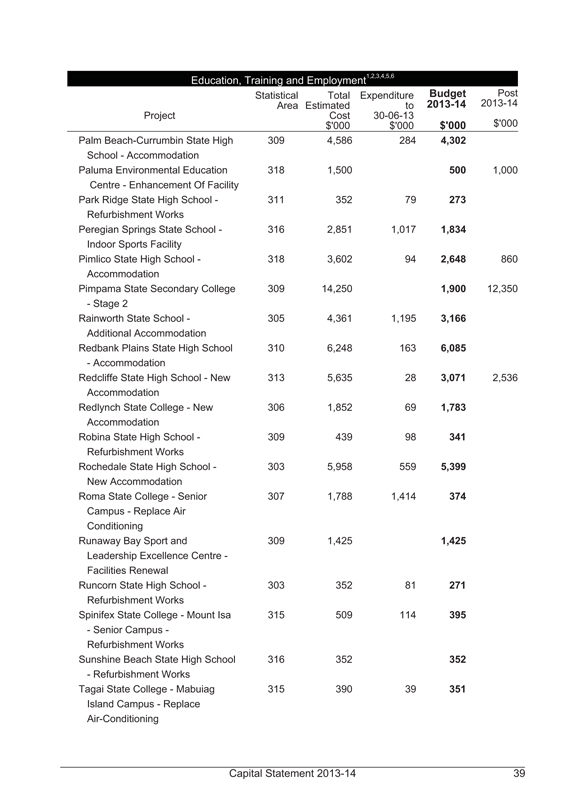
Education, Training and Employment1,2,3,4,5,6
Project
Statistical Area
Total Estimated Cost $’000
Expenditure to 30-06-13 $’000
Budget 2013-14 $’000
Post 2013-14 $’000
Palm Beach-Currumbin State High School - Accommodation 309 4,586 284 4,302
Paluma Environmental Education Centre - Enhancement Of Facility 318 1,500 500 1,000
Park Ridge State High School - Refurbishment Works 311 352 79 273
Peregian Springs State School - Indoor Sports Facility 316 2,851 1,017 1,834
Pimlico State High School - Accommodation 318 3,602 94 2,648 860
Pimpama State Secondary College - Stage 2 309 14,250 1,900 12,350
Rainworth State School - Additional Accommodation 305 4,361 1,195 3,166
Redbank Plains State High School - Accommodation 310 6,248 163 6,085
Redcliffe State High School - New Accommodation 313 5,635 28 3,071 2,536
Redlynch State College - New Accommodation 306 1,852 69 1,783
Robina State High School - Refurbishment Works 309 439 98 341
Rochedale State High School - New Accommodation 303 5,958 559 5,399
Roma State College - Senior Campus - Replace Air Conditioning 307 1,788 1,414 374
Runaway Bay Sport and Leadership Excellence Centre - Facilities Renewal 309 1,425 1,425
Runcorn State High School - Refurbishment Works 303 352 81 271
Spinifex State College - Mount Isa - Senior Campus - Refurbishment Works 315 509 114 395
Sunshine Beach State High School - Refurbishment Works 316 352 352
Tagai State College - Mabuiag Island Campus - Replace Air-Conditioning 315 390 39 351
Capital Statement 2013-14 39
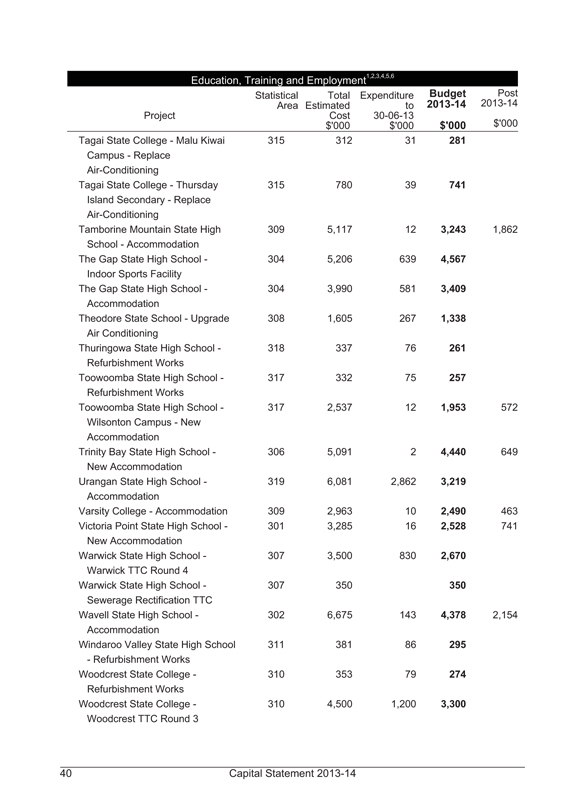
Education, Training and Employment1,2,3,4,5,6
Project
Statistical Area
Total Estimated Cost $’000
Expenditure to 30-06-13 $’000
Budget 2013-14 $’000
Post 2013-14 $’000
Tagai State College - Malu Kiwai Campus - Replace Air-Conditioning 315 312 31 281
Tagai State College - Thursday Island Secondary - Replace Air-Conditioning 315 780 39 741
Tamborine Mountain State High School - Accommodation 309 5,117 12 3,243 1,862
The Gap State High School - Indoor Sports Facility 304 5,206 639 4,567
The Gap State High School - Accommodation 304 3,990 581 3,409
Theodore State School - Upgrade Air Conditioning 308 1,605 267 1,338
Thuringowa State High School - Refurbishment Works 318 337 76 261
Toowoomba State High School - Refurbishment Works 317 332 75 257
Toowoomba State High School - Wilsonton Campus - New Accommodation 317 2,537 12 1,953 572
Trinity Bay State High School - New Accommodation 306 5,091 2 4,440 649
Urangan State High School - Accommodation 319 6,081 2,862 3,219
Varsity College - Accommodation 309 2,963 10 2,490 463
Victoria Point State High School - New Accommodation 301 3,285 16 2,528 741
Warwick State High School - Warwick TTC Round 4 307 3,500 830 2,670
Warwick State High School - Sewerage Rectification TTC 307 350 350
Wavell State High School - Accommodation 302 6,675 143 4,378 2,154
Windaroo Valley State High School - Refurbishment Works 311 381 86 295
Woodcrest State College - Refurbishment Works 310 353 79 274
Woodcrest State College - Woodcrest TTC Round 3 310 4,500 1,200 3,300
40 Capital Statement 2013-14
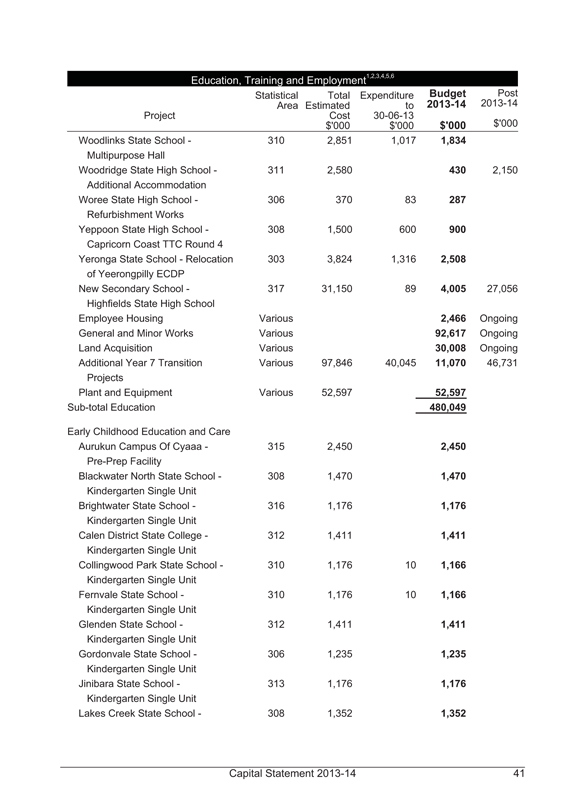
Education, Training and Employment1,2,3,4,5,6
Project
Statistical Area
Total Estimated Cost $’000
Expenditure to 30-06-13 $’000
Budget 2013-14 $’000
Post 2013-14 $’000
Woodlinks State School - Multipurpose Hall 310 2,851 1,017 1,834
Woodridge State High School - Additional Accommodation 311 2,580 430 2,150
Woree State High School - Refurbishment Works 306 370 83 287
Yeppoon State High School - Capricorn Coast TTC Round 4 308 1,500 600 900
Yeronga State School - Relocation of Yeerongpilly ECDP 303 3,824 1,316 2,508
New Secondary School - Highfields State High School 317 31,150 89 4,005 27,056
Employee Housing Various 2,466 Ongoing
General and Minor Works Various 92,617 Ongoing
Land Acquisition Various 30,008 Ongoing
Additional Year 7 Transition Projects Various 97,846 40,045 11,070 46,731
Plant and Equipment Various 52,597 52,597
Sub-total Education 480,049
Early Childhood Education and Care
Aurukun Campus Of Cyaaa - Pre-Prep Facility 315 2,450 2,450
Blackwater North State School - Kindergarten Single Unit 308 1,470 1,470
Brightwater State School - Kindergarten Single Unit 316 1,176 1,176
Calen District State College - Kindergarten Single Unit 312 1,411 1,411
Collingwood Park State School - Kindergarten Single Unit 310 1,176 10 1,166
Fernvale State School - Kindergarten Single Unit 310 1,176 10 1,166
Glenden State School - Kindergarten Single Unit 312 1,411 1,411
Gordonvale State School - Kindergarten Single Unit 306 1,235 1,235
Jinibara State School - Kindergarten Single Unit 313 1,176 1,176
Lakes Creek State School - 308 1,352 1,352
Capital Statement 2013-14 41
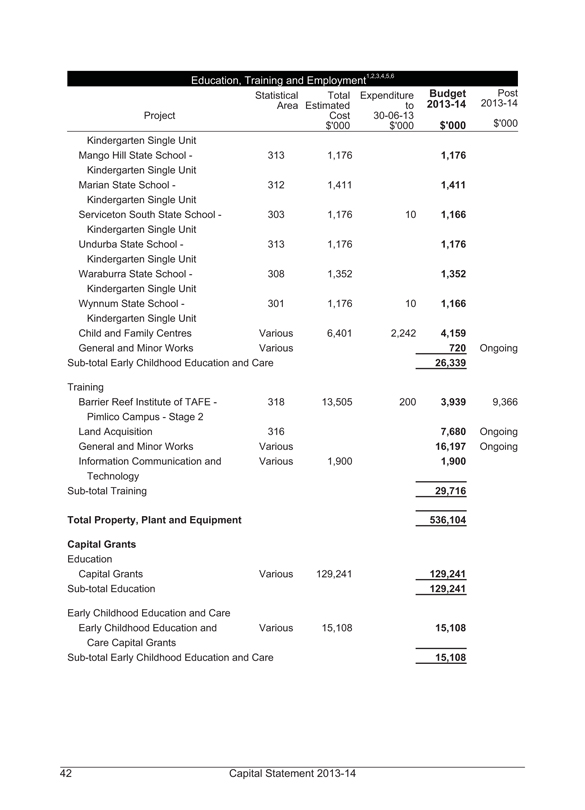
Education, Training and Employment1,2,3,4,5,6
Project
Statistical Area
Total Estimated Cost $’000
Expenditure to 30-06-13 $’000
Budget 2013-14 $’000
Post 2013-14 $’000
Kindergarten Single Unit
Mango Hill State School - Kindergarten Single Unit 313 1,176 1,176
Marian State School - Kindergarten Single Unit 312 1,411 1,411
Serviceton South State School - Kindergarten Single Unit 303 1,176 10 1,166
Undurba State School - Kindergarten Single Unit 313 1,176 1,176
Waraburra State School - Kindergarten Single Unit 308 1,352 1,352
Wynnum State School - Kindergarten Single Unit 301 1,176 10 1,166
Child and Family Centres Various 6,401 2,242 4,159
General and Minor Works Various 720 Ongoing
Sub-total Early Childhood Education and Care 26,339
Training
Barrier Reef Institute of TAFE - Pimlico Campus - Stage 2 318 13,505 200 3,939 9,366
Land Acquisition 316 7,680 Ongoing
General and Minor Works Various 16,197 Ongoing
Information Communication and Technology Various 1,900 1,900
Sub-total Training 29,716
Total Property, Plant and Equipment 536,104
Capital Grants
Education
Capital Grants Various 129,241 129,241
Sub-total Education 129,241
Early Childhood Education and Care
Early Childhood Education and Care Capital Grants Various 15,108 15,108
Sub-total Early Childhood Education and Care 15,108
42 Capital Statement 2013-14
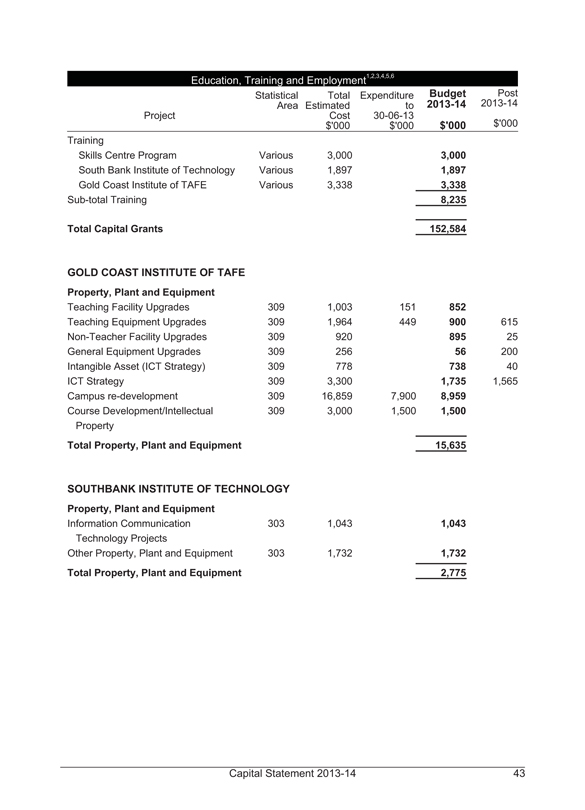
Education, Training and Employment1,2,3,4,5,6
Project
Statistical Area
Total Estimated Cost $’000
Expenditure to 30-06-13 $’000
Budget 2013-14 $’000
Post 2013-14 $’000
Training
Skills Centre Program Various 3,000 3,000
South Bank Institute of Technology Various 1,897 1,897
Gold Coast Institute of TAFE Various 3,338 3,338
Sub-total Training 8,235
Total Capital Grants 152,584
GOLD COAST INSTITUTE OF TAFE
Property, Plant and Equipment
Teaching Facility Upgrades 309 1,003 151 852
Teaching Equipment Upgrades 309 1,964 449 900 615
Non-Teacher Facility Upgrades 309 920 895 25
General Equipment Upgrades 309 256 56 200
Intangible Asset (ICT Strategy) 309 778 738 40
ICT Strategy 309 3,300 1,735 1,565
Campus re-development 309 16,859 7,900 8,959
Course Development/Intellectual 309 3,000 1,500 1,500
Property
Total Property, Plant and Equipment 15,635
SOUTHBANK INSTITUTE OF TECHNOLOGY
Property, Plant and Equipment
Information Communication 303 1,043 1,043
Technology Projects
Other Property, Plant and Equipment 303 1,732 1,732
Total Property, Plant and Equipment 2,775
Capital Statement 2013-14 43
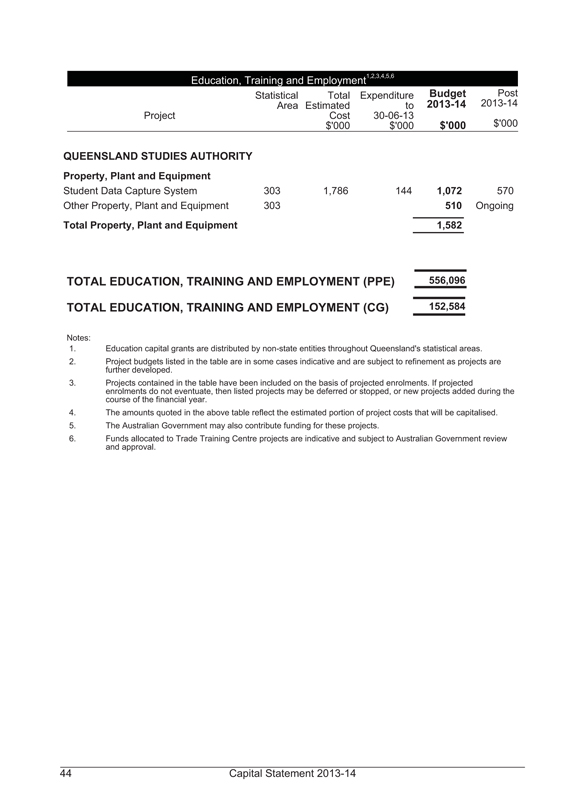
Education, Training and Employment1,2,3,4,5,6
Project
Statistical Area
Total Estimated Cost $’000
Expenditure to 30-06-13 $’000
Budget 2013-14 $’000
Post 2013-14 $’000
QUEENSLAND STUDIES AUTHORITY
Property, Plant and Equipment
Student Data Capture System 303 1,786 144 1,072 570
Other Property, Plant and Equipment 303 510 Ongoing
Total Property, Plant and Equipment 1,582
TOTAL EDUCATION, TRAINING AND EMPLOYMENT (PPE) 556,096
TOTAL EDUCATION, TRAINING AND EMPLOYMENT (CG) 152,584
Notes:
1. Education capital grants are distributed by non-state entities throughout Queensland’s statistical areas.
2. Project budgets listed in the table are in some cases indicative and are subject to refinement as projects are further developed.
3. Projects contained in the table have been included on the basis of projected enrolments. If projected enrolments do not eventuate, then listed projects may be deferred or stopped, or new projects added during the course of the financial year.
4. The amounts quoted in the above table reflect the estimated portion of project costs that will be capitalised.
5. The Australian Government may also contribute funding for these projects.
6. Funds allocated to Trade Training Centre projects are indicative and subject to Australian Government review and approval.
44 Capital Statement 2013-14
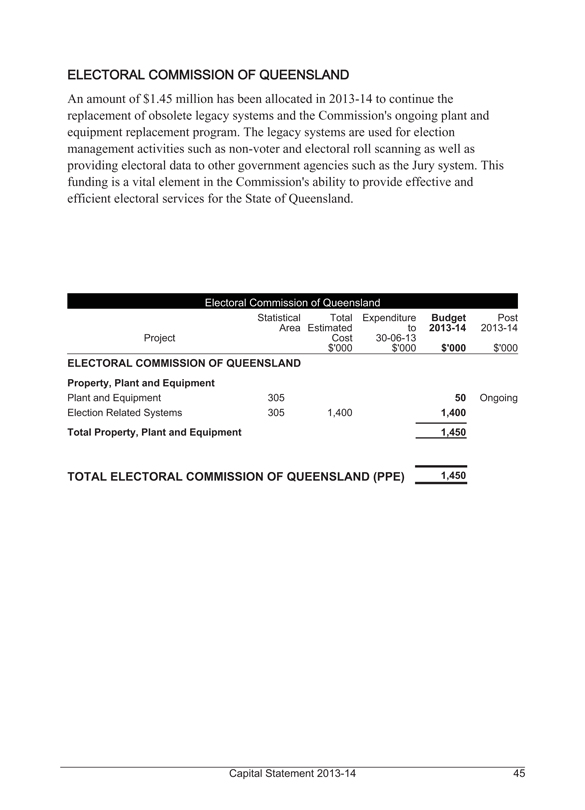
ELECTORAL COMMISSION OF QUEENSLAND
An amount of $1.45 million has been allocated in 2013-14 to continue the replacement of obsolete legacy systems and the Commission’s ongoing plant and equipment replacement program. The legacy systems are used for election management activities such as non-voter and electoral roll scanning as well as providing electoral data to other government agencies such as the Jury system. This funding is a vital element in the Commission’s ability to provide effective and efficient electoral services for the State of Queensland.
Electoral Commission of Queensland
Project
Statistical Area
Total Estimated Cost $’000
Expenditure to 30-06-13 $’000
Budget 2013-14 $’000
Post 2013-14 $’000
ELECTORAL COMMISSION OF QUEENSLAND
Property, Plant and Equipment
Plant and Equipment 305 50 Ongoing
Election Related Systems 305 1,400 1,400
Total Property, Plant and Equipment 1,450
TOTAL ELECTORAL COMMISSION OF QUEENSLAND (PPE) 1,450
Capital Statement 2013-14 45
ENERGY AND WATER SUPPLY
The Energy and Water Supply portfolio includes the Department of Energy and Water Supply, statutory bodies reporting to the Minister for Energy and Water Supply, and energy and water supply Government-owned Corporations. The portfolio capital program for the 2013-14 is $3.173 billion for capital purchases and $51 million for capital grants. The capital works program supports the Government’s commitment to deliver cost effective, safe, secure and reliable energy and water supply.
Department of Energy and Water Supply
The Department of Energy and Water Supply (DEWS) benefits Queensland by delivering economic and social prosperity through lower cost energy and water supply services. The capital program of $62.9 million includes $56.6 million to continue the state-wide dam spillway upgrade program, $4 million relating to upgrades on non-commercial water assets and $2.2 million to be invested for the finalisation of work associated with the Water Industry Asset Management system which supports the regulation of referable dams, drinking water quality and recycled water.
CS Energy Limited
Capital purchases of $105.2 million is planned for 2013-14. This reflects the continued commitment to the ongoing reliability and efficiency of generation plant.
Program Highlights (Property, Plant and Equipment)
• $37.8 million for improvements to the Callide power stations including overhaul work.
• $21.4 million for improvements to the Kogan Creek power station and mine including overhaul work.
• $31.2 million for construction of the Kogan Creek Solar Boost Project.
• $9.0 million for improvements to the Wivenhoe power station including overhaul work.
• $3.8 million for information systems.
• $2.0 million for strategic projects to monetise CS Energy’s surplus coal assets.
46 Capital Statement 2013-14
Stanwell Corporation Limited
Stanwell Corporation’s capital purchases for 2013-14 is $196.1 million, which primarily relates to maintaining operations at the various Queensland power station sites.
Program Highlights (Property, Plant and Equipment)
• $55.6 million for Meandu Mine projects including $29.6 million for the replacement of mine fleet equipment and $8.1 million for mine exploration and development.
• $24.0 million for Tarong Power Station projects including $2.9 million for a minor overhaul of Unit 3 and $6.1 million for the Black Creek Diversion project.
• $41.3 million for Stanwell Power Station projects including $27.2 million for the major overhaul of Unit 3.
• $6.7 million for Mica Creek Power Station sustaining projects.
• $4.6 million for Swanbank Power Station projects including $4.2 million for the overhaul of E station.
• $3.1 million for Stanwell’s Hydro Power Stations including $2.3 million for Kareeya Power Station.
• $13.9 million for Tarong North Power Station projects including $8.4 million for the overhaul of Unit 1.
• $46.9 million for Other Corporate Capital Outlays including $35.9 million for Information Communication and Technology projects and $11.0 million for Fuel Strategy projects.
Energex Limited
Energex has capital purchases of $973.1 million as part of its commitment to providing a safe, secure and highly reliable, cost effective electricity delivery to its customers. The capital program aims to improve and reinforce electricity supplies across South East Queensland, especially to meet peak electricity demand periods, and to support the increased use of residential solar power and lifestyle enhancing appliances, such as air conditioners and flat screen televisions.
Capital Statement 2013-14 47
Included in the program are:
• electricity upgrades to support commercial infrastructure expansion in Brisbane
• electricity upgrades in growing areas in Brisbane’s northern, southern and western gateways and to improve and reinforce electricity supply across South East Queensland
• continuing major upgrades on the Sunshine Coast and Gold Coast.
The regulated electricity capital purchases for 2013-14 is $902 million. This comprises $490 million on the sub transmission system, and $412 million on the distribution network, including customer-funded capital projects. A further $71 million is allocated for non-system capital programs including vehicles, building and tools and equipment.
Program Highlights (Property, Plant and Equipment)
Capital purchases for 2013-14 will contribute to increased network capacity and the improved level of reliability of electricity distribution and includes the following projects:
• $28.0 million to continue the development of a new electricity substation at Kelvin Grove. The total estimated cost of the project is $50.7 million
• $31.6 million to continue the redevelopment of the Victoria Park substation at Herston. The total estimated cost of the project is $53.8 million
• $16.4 million to establish a new electricity substation at Parkinson. The total estimated cost of the project is $18 million
• $28.6 million to establish a high voltage sub-transmission in the southern Logan-northern Scenic Rim area. The total estimated cost of the project is $45.9 million
• $20.2 million to establish a new electricity substation at Springfield. The total estimated cost of the project is $50.9 million
• $3.5 million to upgrade the existing Gympie North substation. The total estimated cost of the project is $4.2 million.
48 Capital Statement 2013-14
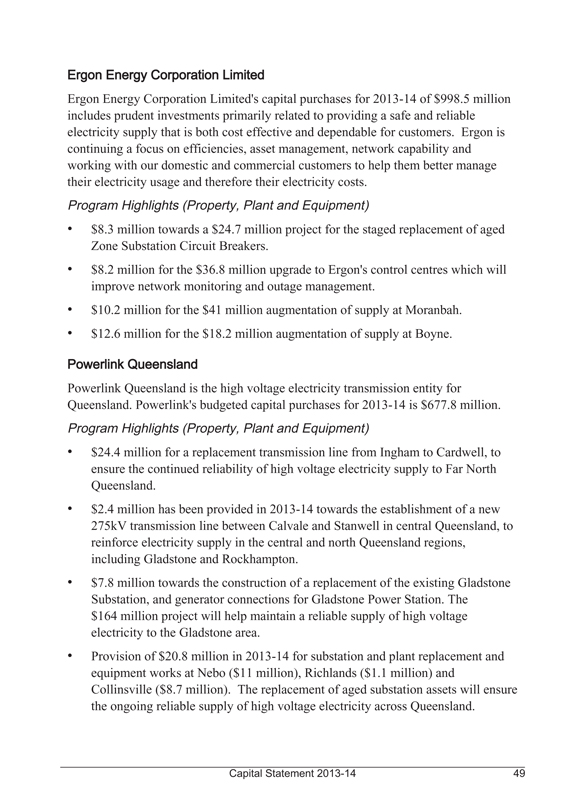
Ergon Energy Corporation Limited
Ergon Energy Corporation Limited’s capital purchases for 2013-14 of $998.5 million includes prudent investments primarily related to providing a safe and reliable electricity supply that is both cost effective and dependable for customers. Ergon is continuing a focus on efficiencies, asset management, network capability and working with our domestic and commercial customers to help them better manage their electricity usage and therefore their electricity costs.
Program Highlights (Property, Plant and Equipment)
• $8.3 million towards a $24.7 million project for the staged replacement of aged Zone Substation Circuit Breakers.
• $8.2 million for the $36.8 million upgrade to Ergon’s control centres which will improve network monitoring and outage management.
• $10.2 million for the $41 million augmentation of supply at Moranbah.
• $12.6 million for the $18.2 million augmentation of supply at Boyne.
Powerlink Queensland
Powerlink Queensland is the high voltage electricity transmission entity for Queensland. Powerlink’s budgeted capital purchases for 2013-14 is $677.8 million.
Program Highlights (Property, Plant and Equipment)
• $24.4 million for a replacement transmission line from Ingham to Cardwell, to ensure the continued reliability of high voltage electricity supply to Far North Queensland.
• $2.4 million has been provided in 2013-14 towards the establishment of a new 275kV transmission line between Calvale and Stanwell in central Queensland, to reinforce electricity supply in the central and north Queensland regions, including Gladstone and Rockhampton.
• $7.8 million towards the construction of a replacement of the existing Gladstone Substation, and generator connections for Gladstone Power Station. The $164 million project will help maintain a reliable supply of high voltage electricity to the Gladstone area.
• Provision of $20.8 million in 2013-14 for substation and plant replacement and equipment works at Nebo ($11 million), Richlands ($1.1 million) and Collinsville ($8.7 million). The replacement of aged substation assets will ensure the ongoing reliable supply of high voltage electricity across Queensland.
Capital Statement 2013-14 49
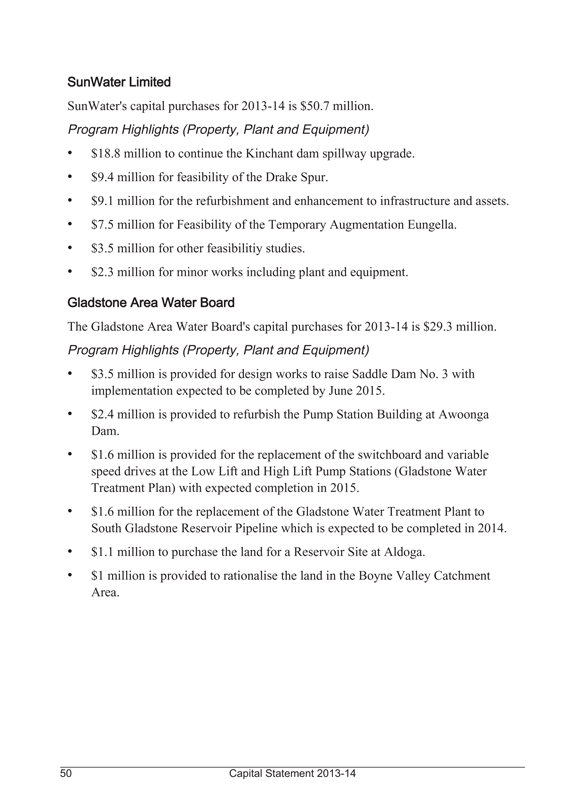
SunWater Limited
SunWater’s capital purchases for 2013-14 is $50.7 million.
Program Highlights (Property, Plant and Equipment)
• $18.8 million to continue the Kinchant dam spillway upgrade.
• $9.4 million for feasibility of the Drake Spur.
• $9.1 million for the refurbishment and enhancement to infrastructure and assets.
• $7.5 million for Feasibility of the Temporary Augmentation Eungella.
• $3.5 million for other feasibilitiy studies.
• $2.3 million for minor works including plant and equipment.
Gladstone Area Water Board
The Gladstone Area Water Board’s capital purchases for 2013-14 is $29.3 million.
Program Highlights (Property, Plant and Equipment)
• $3.5 million is provided for design works to raise Saddle Dam No. 3 with implementation expected to be completed by June 2015.
• $2.4 million is provided to refurbish the Pump Station Building at Awoonga Dam.
• $1.6 million is provided for the replacement of the switchboard and variable speed drives at the Low Lift and High Lift Pump Stations (Gladstone Water Treatment Plan) with expected completion in 2015.
• $1.6 million for the replacement of the Gladstone Water Treatment Plant to South Gladstone Reservoir Pipeline which is expected to be completed in 2014.
• $1.1 million to purchase the land for a Reservoir Site at Aldoga.
• $1 million is provided to rationalise the land in the Boyne Valley Catchment Area.
50 Capital Statement 2013-14
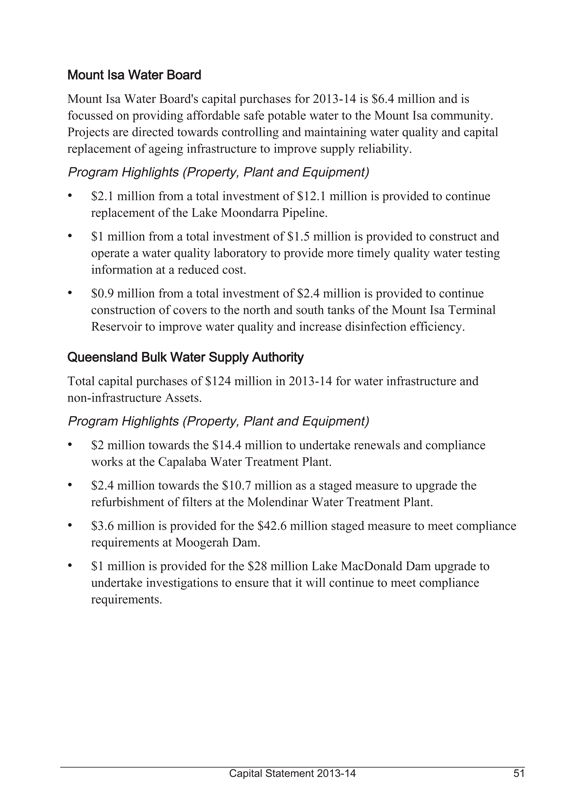
Mount Isa Water Board
Mount Isa Water Board’s capital purchases for 2013-14 is $6.4 million and is focussed on providing affordable safe potable water to the Mount Isa community. Projects are directed towards controlling and maintaining water quality and capital replacement of ageing infrastructure to improve supply reliability.
Program Highlights (Property, Plant and Equipment)
• $2.1 million from a total investment of $12.1 million is provided to continue replacement of the Lake Moondarra Pipeline.
• $1 million from a total investment of $1.5 million is provided to construct and operate a water quality laboratory to provide more timely quality water testing information at a reduced cost.
• $0.9 million from a total investment of $2.4 million is provided to continue construction of covers to the north and south tanks of the Mount Isa Terminal Reservoir to improve water quality and increase disinfection efficiency.
Queensland Bulk Water Supply Authority
Total capital purchases of $124 million in 2013-14 for water infrastructure and non-infrastructure Assets.
Program Highlights (Property, Plant and Equipment)
• $2 million towards the $14.4 million to undertake renewals and compliance works at the Capalaba Water Treatment Plant.
• $2.4 million towards the $10.7 million as a staged measure to upgrade the refurbishment of filters at the Molendinar Water Treatment Plant.
• $3.6 million is provided for the $42.6 million staged measure to meet compliance requirements at Moogerah Dam.
• $1 million is provided for the $28 million Lake MacDonald Dam upgrade to undertake investigations to ensure that it will continue to meet compliance requirements.
Capital Statement 2013-14 51
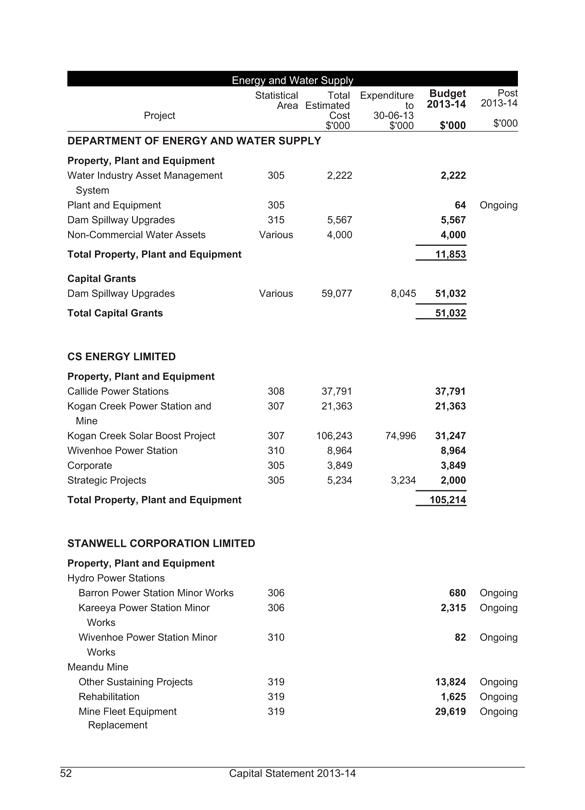
Energy and Water Supply
Project
Statistical Area
Total Estimated Cost $’000
Expenditure to 30-06-13 $’000
Budget 2013-14 $’000
Post 2013-14 $’000
DEPARTMENT OF ENERGY AND WATER SUPPLY
Property, Plant and Equipment
Water Industry Asset Management System 305 2,222 2,222
Plant and Equipment 305 64 Ongoing
Dam Spillway Upgrades 315 5,567 5,567
Non-Commercial Water Assets Various 4,000 4,000
Total Property, Plant and Equipment 11,853
Capital Grants
Dam Spillway Upgrades Various 59,077 8,045 51,032
Total Capital Grants 51,032
CS ENERGY LIMITED
Property, Plant and Equipment
Callide Power Stations 308 37,791 37,791
Kogan Creek Power Station and Mine 307 21,363 21,363
Kogan Creek Solar Boost Project 307 106,243 74,996 31,247
Wivenhoe Power Station 310 8,964 8,964
Corporate 305 3,849 3,849
Strategic Projects 305 5,234 3,234 2,000
Total Property, Plant and Equipment 105,214
STANWELL CORPORATION LIMITED
Property, Plant and Equipment
Hydro Power Stations
Barron Power Station Minor Works 306 680 Ongoing
Kareeya Power Station Minor Works 306 2,315 Ongoing
Wivenhoe Power Station Minor Works 310 82 Ongoing
Meandu Mine
Other Sustaining Projects 319 13,824 Ongoing
Rehabilitation 319 1,625 Ongoing
Mine Fleet Equipment Replacement 319 29,619 Ongoing
52 Capital Statement 2013-14
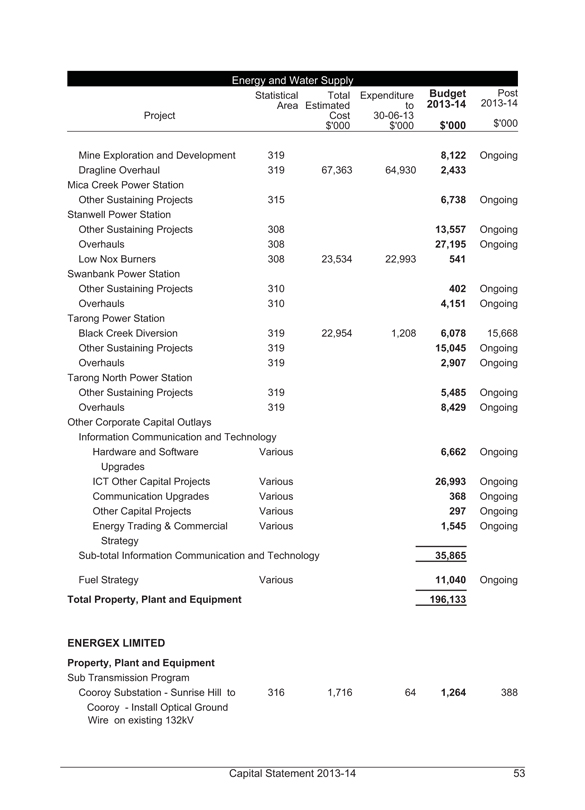
Energy and Water Supply
Project
Statistical Area
Total Estimated Cost $’000
Expenditure to 30-06-13 $’000
Budget 2013-14 $’000
Post 2013-14 $’000
Mine Exploration and Development 319 8,122 Ongoing
Dragline Overhaul 319 67,363 64,930 2,433
Mica Creek Power Station
Other Sustaining Projects 315 6,738 Ongoing
Stanwell Power Station
Other Sustaining Projects 308 13,557 Ongoing
Overhauls 308 27,195 Ongoing
Low Nox Burners 308 23,534 22,993 541
Swanbank Power Station
Other Sustaining Projects 310 402 Ongoing
Overhauls 310 4,151 Ongoing
Tarong Power Station
Black Creek Diversion 319 22,954 1,208 6,078 15,668
Other Sustaining Projects 319 15,045 Ongoing
Overhauls 319 2,907 Ongoing
Tarong North Power Station
Other Sustaining Projects 319 5,485 Ongoing
Overhauls 319 8,429 Ongoing
Other Corporate Capital Outlays
Information Communication and Technology
Hardware and Software Upgrades Various 6,662 Ongoing
ICT Other Capital Projects Various 26,993 Ongoing
Communication Upgrades Various 368 Ongoing
Other Capital Projects Various 297 Ongoing
Energy Trading & Commercial Strategy Various 1,545 Ongoing
Sub-total Information Communication and Technology 35,865
Fuel Strategy Various 11,040 Ongoing
Total Property, Plant and Equipment 196,133
ENERGEX LIMITED
Property, Plant and Equipment
Sub Transmission Program
Cooroy Substation - Sunrise Hill to Cooroy - Install Optical Ground Wire on existing 132kV 316 1,716 64 1,264 388
Capital Statement 2013-14 53
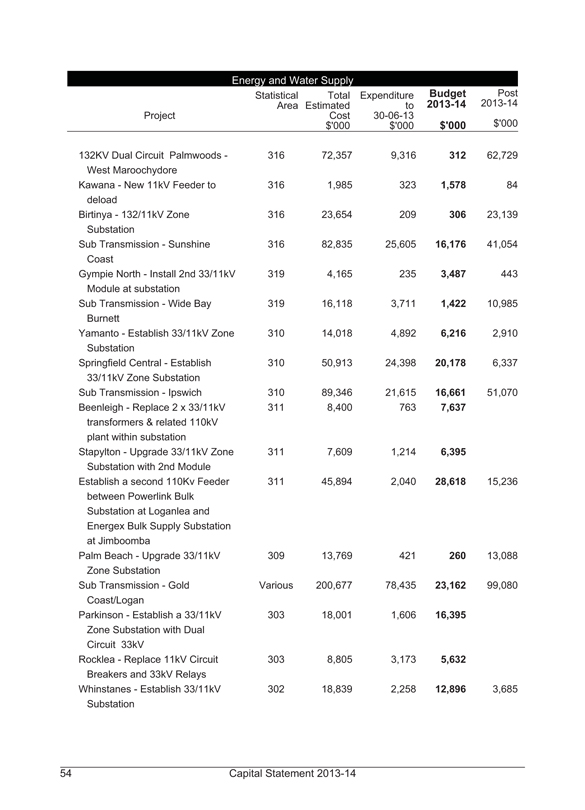
Energy and Water Supply
Project
Statistical Area
Total Estimated Cost $’000
Expenditure to 30-06-13 $’000
Budget 2013-14 $’000
Post 2013-14 $’000
132KV Dual Circuit Palmwoods - West Maroochydore 316 72,357 9,316 312 62,729
Kawana - New 11kV Feeder to deload 316 1,985 323 1,578 84
Birtinya - 132/11kV Zone Substation 316 23,654 209 306 23,139
Sub Transmission - Sunshine Coast 316 82,835 25,605 16,176 41,054
Gympie North - Install 2nd 33/11kV Module at substation 319 4,165 235 3,487 443
Sub Transmission - Wide Bay Burnett 319 16,118 3,711 1,422 10,985
Yamanto - Establish 33/11kV Zone Substation 310 14,018 4,892 6,216 2,910
Springfield Central - Establish 33/11kV Zone Substation 310 50,913 24,398 20,178 6,337
Sub Transmission - Ipswich 310 89,346 21,615 16,661 51,070
Beenleigh - Replace 2 x 33/11kV transformers & related 110kV plant within substation 311 8,400 763 7,637
Stapylton - Upgrade 33/11kV Zone Substation with 2nd Module 311 7,609 1,214 6,395
Establish a second 110Kv Feeder between Powerlink Bulk Substation at Loganlea and Energex Bulk Supply Substation at Jimboomba
311 45,894 2,040 28,618 15,236
Palm Beach - Upgrade 33/11kV Zone Substation 309 13,769 421 260 13,088
Sub Transmission - Gold Coast/Logan Various 200,677 78,435 23,162 99,080
Parkinson - Establish a 33/11kV Zone Substation with Dual Circuit 33kV 303 18,001 1,606 16,395
Rocklea - Replace 11kV Circuit Breakers and 33kV Relays 303 8,805 3,173 5,632
Whinstanes - Establish 33/11kV Substation 302 18,839 2,258 12,896 3,685
54 Capital Statement 2013-14
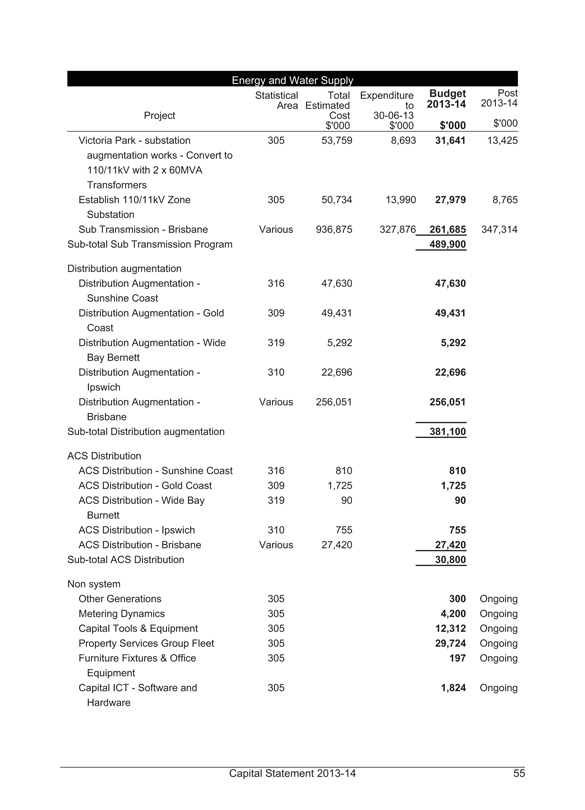
Energy and Water Supply
Project
Statistical Area
Total Estimated Cost $’000
Expenditure to 30-06-13 $’000
Budget 2013-14 $’000
Post 2013-14 $’000
Victoria Park - substation augmentation works - Convert to 110/11kV with 2 x 60MVA Transformers 305 53,759 8,693 31,641 13,425
Establish 110/11kV Zone Substation 305 50,734 13,990 27,979 8,765
Sub Transmission - Brisbane Various 936,875 327,876 261,685 347,314
Sub-total Sub Transmission Program 489,900
Distribution augmentation
Distribution Augmentation - Sunshine Coast 316 47,630 47,630
Distribution Augmentation - Gold Coast 309 49,431 49,431
Distribution Augmentation - Wide Bay Bernett 319 5,292 5,292
Distribution Augmentation - Ipswich 310 22,696 22,696
Distribution Augmentation - Brisbane Various 256,051 256,051
Sub-total Distribution augmentation 381,100
ACS Distribution
ACS Distribution - Sunshine Coast 316 810 810
ACS Distribution - Gold Coast 309 1,725 1,725
ACS Distribution - Wide Bay Burnett 319 90 90
ACS Distribution - Ipswich 310 755 755
ACS Distribution - Brisbane Various 27,420 27,420
Sub-total ACS Distribution 30,800
Non system
Other Generations 305 300 Ongoing
Metering Dynamics 305 4,200 Ongoing
Capital Tools & Equipment 305 12,312 Ongoing
Property Services Group Fleet 305 29,724 Ongoing
Furniture Fixtures & Office Equipment 305 197 Ongoing
Capital ICT - Software and Hardware 305 1,824 Ongoing
Capital Statement 2013-14 55
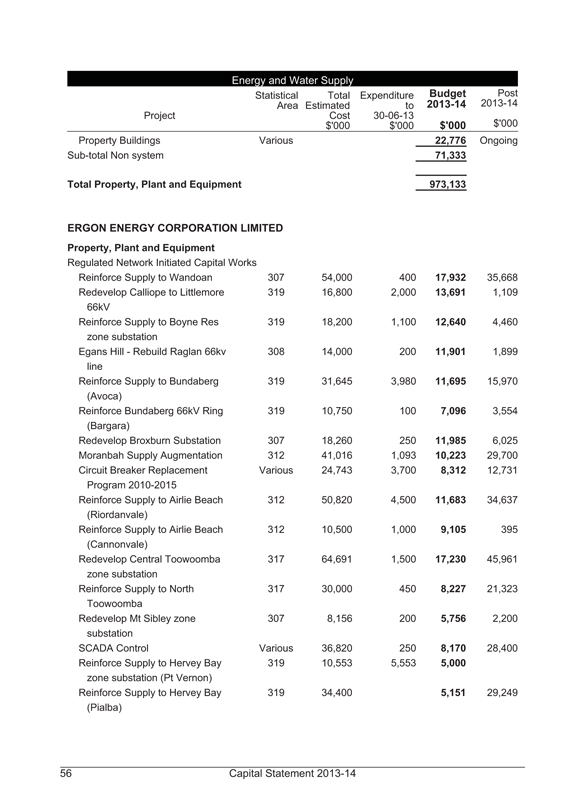
Energy and Water Supply
Project
Statistical Area
Total Estimated Cost $’000
Expenditure to 30-06-13 $’000
Budget 2013-14 $’000
Post 2013-14 $’000
Property Buildings Various 22,776 Ongoing
Sub-total Non system 71,333
Total Property, Plant and Equipment 973,133
ERGON ENERGY CORPORATION LIMITED
Property, Plant and Equipment
Regulated Network Initiated Capital Works
Reinforce Supply to Wandoan 307 54,000 400 17,932 35,668
Redevelop Calliope to Littlemore 66kV 319 16,800 2,000 13,691 1,109
Reinforce Supply to Boyne Res zone substation 319 18,200 1,100 12,640 4,460
Egans Hill - Rebuild Raglan 66kv line 308 14,000 200 11,901 1,899
Reinforce Supply to Bundaberg (Avoca) 319 31,645 3,980 11,695 15,970
Reinforce Bundaberg 66kV Ring (Bargara) 319 10,750 100 7,096 3,554
Redevelop Broxburn Substation 307 18,260 250 11,985 6,025
Moranbah Supply Augmentation 312 41,016 1,093 10,223 29,700
Circuit Breaker Replacement Program 2010-2015 Various 24,743 3,700 8,312 12,731
Reinforce Supply to Airlie Beach (Riordanvale) 312 50,820 4,500 11,683 34,637
Reinforce Supply to Airlie Beach (Cannonvale) 312 10,500 1,000 9,105 395
Redevelop Central Toowoomba zone substation 317 64,691 1,500 17,230 45,961
Reinforce Supply to North Toowoomba 317 30,000 450 8,227 21,323
Redevelop Mt Sibley zone substation 307 8,156 200 5,756 2,200
SCADA Control Various 36,820 250 8,170 28,400
Reinforce Supply to Hervey Bay zone substation (Pt Vernon) 319 10,553 5,553 5,000
Reinforce Supply to Hervey Bay (Pialba) 319 34,400 5,151 29,249
56 Capital Statement 2013-14
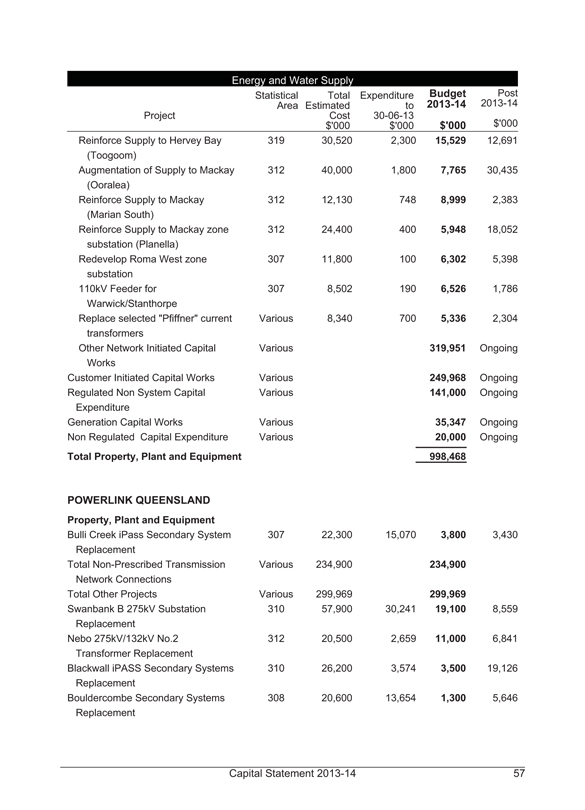
Energy and Water Supply
Project
Statistical Area
Total Estimated Cost $’000
Expenditure to 30-06-13 $’000
Budget 2013-14 $’000
Post 2013-14 $’000
Reinforce Supply to Hervey Bay (Toogoom) 319 30,520 2,300 15,529 12,691
Augmentation of Supply to Mackay (Ooralea) 312 40,000 1,800 7,765 30,435
Reinforce Supply to Mackay (Marian South) 312 12,130 748 8,999 2,383
Reinforce Supply to Mackay zone substation (Planella) 312 24,400 400 5,948 18,052
Redevelop Roma West zone substation 307 11,800 100 6,302 5,398
110kV Feeder for Warwick/Stanthorpe 307 8,502 190 6,526 1,786
Replace selected “Pfiffner” current transformers Various 8,340 700 5,336 2,304
Other Network Initiated Capital Various Works 319,951 Ongoing
Customer Initiated Capital Works Various 249,968 Ongoing
Regulated Non System Capital Expenditure Various 141,000 Ongoing
Generation Capital Works Various 35,347 Ongoing
Non Regulated Capital Expenditure Various 20,000 Ongoing
Total Property, Plant and Equipment 998,468
POWERLINK QUEENSLAND
Property, Plant and Equipment
Bulli Creek iPass Secondary System Replacement 307 22,300 15,070 3,800 3,430
Total Non-Prescribed Transmission Network Connections Various 234,900 234,900
Total Other Projects Various 299,969 299,969
Swanbank B 275kV Substation Replacement 310 57,900 30,241 19,100 8,559
Nebo 275kV/132kV No.2 Transformer Replacement 312 20,500 2,659 11,000 6,841
Blackwall iPASS Secondary Systems Replacement 310 26,200 3,574 3,500 19,126
Bouldercombe Secondary Systems Replacement 308 20,600 13,654 1,300 5,646
Capital Statement 2013-14 57
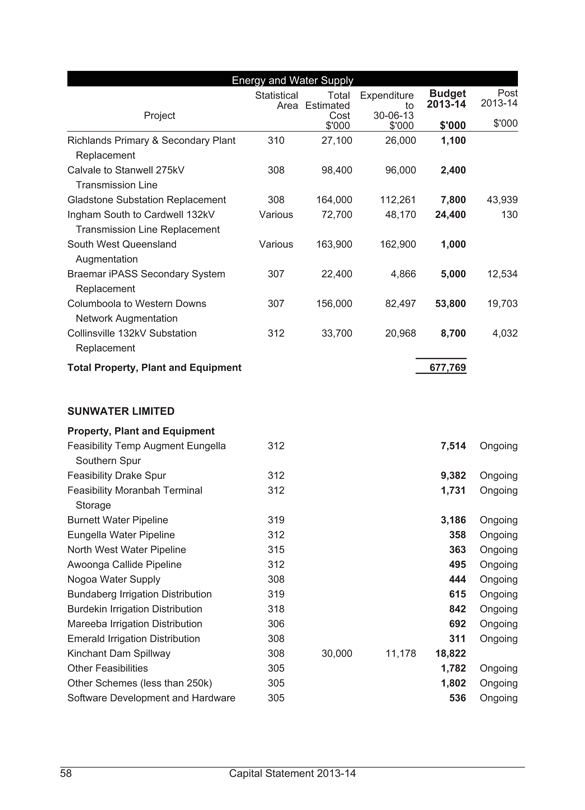
Energy and Water Supply
Project
Statistical Area
Total Estimated Cost $’000
Expenditure to 30-06-13 $’000
Budget 2013-14 $’000
Post 2013-14 $’000
Richlands Primary & Secondary Plant Replacement 310 27,100 26,000 1,100
Calvale to Stanwell 275kV Transmission Line 308 98,400 96,000 2,400
Gladstone Substation Replacement 308 164,000 112,261 7,800 43,939
Ingham South to Cardwell 132kV Transmission Line Replacement Various 72,700 48,170 24,400 130
South West Queensland Augmentation Various 163,900 162,900 1,000
Braemar iPASS Secondary System Replacement 307 22,400 4,866 5,000 12,534
Columboola to Western Downs Network Augmentation 307 156,000 82,497 53,800 19,703
Collinsville 132kV Substation Replacement 312 33,700 20,968 8,700 4,032
Total Property, Plant and Equipment 677,769
SUNWATER LIMITED
Property, Plant and Equipment
Feasibility Temp Augment Eungella Southern Spur 312 7,514 Ongoing
Feasibility Drake Spur 312 9,382 Ongoing
Feasibility Moranbah Terminal Storage 312 1,731 Ongoing
Burnett Water Pipeline 319 3,186 Ongoing
Eungella Water Pipeline 312 358 Ongoing
North West Water Pipeline 315 363 Ongoing
Awoonga Callide Pipeline 312 495 Ongoing
Nogoa Water Supply 308 444 Ongoing
Bundaberg Irrigation Distribution 319 615 Ongoing
Burdekin Irrigation Distribution 318 842 Ongoing
Mareeba Irrigation Distribution 306 692 Ongoing
Emerald Irrigation Distribution 308 311 Ongoing
Kinchant Dam Spillway 308 30,000 11,178 18,822
Other Feasibilities 305 1,782 Ongoing
Other Schemes (less than 250k) 305 1,802 Ongoing
Software Development and Hardware 305 536 Ongoing
58 Capital Statement 2013-14
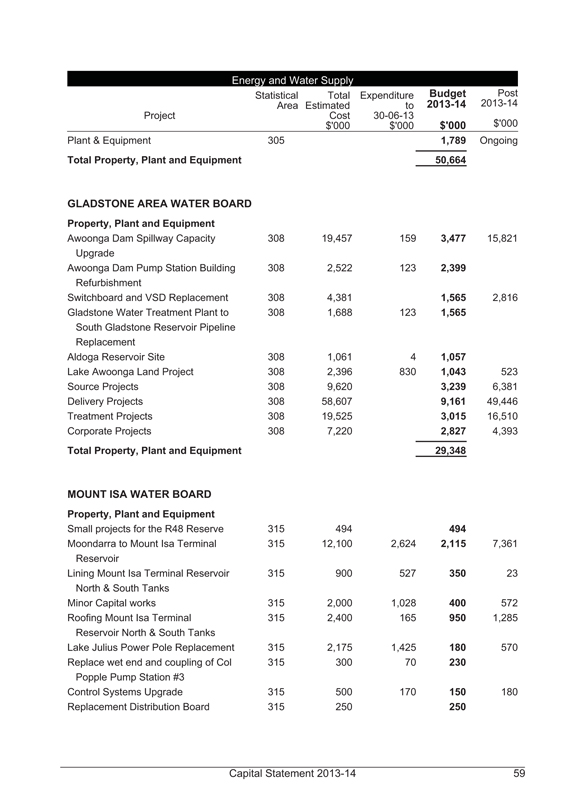
Energy and Water Supply
Project
Statistical Area
Total Estimated Cost $’000
Expenditure to 30-06-13 $’000
Budget 2013-14 $’000
Post 2013-14 $’000
Plant & Equipment 305 1,789 Ongoing
Total Property, Plant and Equipment 50,664
GLADSTONE AREA WATER BOARD
Property, Plant and Equipment
Awoonga Dam Spillway Capacity Upgrade 308 19,457 159 3,477 15,821
Awoonga Dam Pump Station Building Refurbishment 308 2,522 123 2,399
Switchboard and VSD Replacement 308 4,381 1,565 2,816
Gladstone Water Treatment Plant to South Gladstone Reservoir Pipeline Replacement 308 1,688 123 1,565
Aldoga Reservoir Site 308 1,061 4 1,057
Lake Awoonga Land Project 308 2,396 830 1,043 523
Source Projects 308 9,620 3,239 6,381
Delivery Projects 308 58,607 9,161 49,446
Treatment Projects 308 19,525 3,015 16,510
Corporate Projects 308 7,220 2,827 4,393
Total Property, Plant and Equipment 29,348
MOUNT ISA WATER BOARD
Property, Plant and Equipment
Small projects for the R48 Reserve 315 494 494
Moondarra to Mount Isa Terminal Reservoir 315 12,100 2,624 2,115 7,361
Lining Mount Isa Terminal Reservoir North & South Tanks 315 900 527 350 23
Minor Capital works 315 2,000 1,028 400 572
Roofing Mount Isa Terminal Reservoir North & South Tanks 315 2,400 165 950 1,285
Lake Julius Power Pole Replacement 315 2,175 1,425 180 570
Replace wet end and coupling of Col Popple Pump Station #3 315 300 70 230
Control Systems Upgrade 315 500 170 150 180
Replacement Distribution Board 315 250 250
Capital Statement 2013-14 59
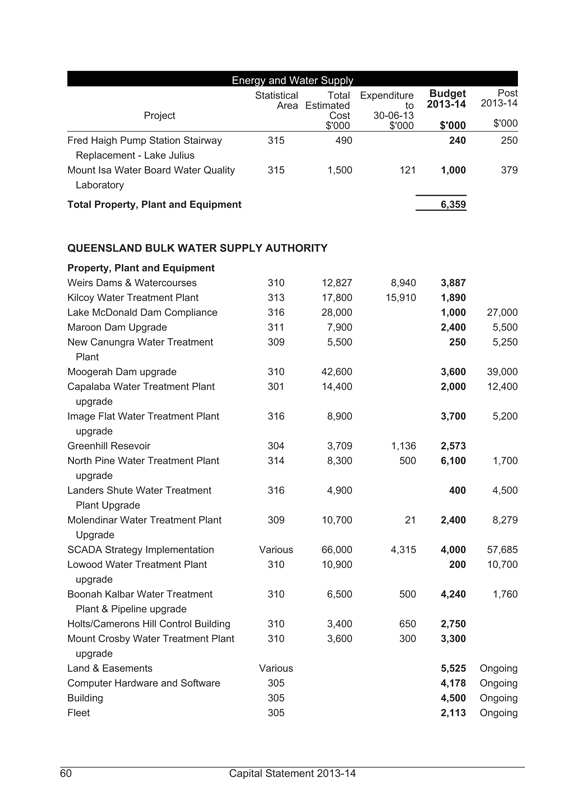
Energy and Water Supply
Project
Statistical Area
Total Estimated Cost $’000
Expenditure to 30-06-13 $’000
Budget 2013-14 $’000
Post 2013-14 $’000
Fred Haigh Pump Station Stairway Replacement - Lake Julius 315 490 240 250
Mount Isa Water Board Water Quality Laboratory 315 1,500 121 1,000 379
Total Property, Plant and Equipment 6,359
QUEENSLAND BULK WATER SUPPLY AUTHORITY
Property, Plant and Equipment
Weirs Dams & Watercourses 310 12,827 8,940 3,887
Kilcoy Water Treatment Plant 313 17,800 15,910 1,890
Lake McDonald Dam Compliance 316 28,000 1,000 27,000
Maroon Dam Upgrade 311 7,900 2,400 5,500
New Canungra Water Treatment Plant 309 5,500 250 5,250
Moogerah Dam upgrade 310 42,600 3,600 39,000
Capalaba Water Treatment Plant upgrade 301 14,400 2,000 12,400
Image Flat Water Treatment Plant upgrade 316 8,900 3,700 5,200
Greenhill Resevoir 304 3,709 1,136 2,573
North Pine Water Treatment Plant upgrade 314 8,300 500 6,100 1,700
Landers Shute Water Treatment Plant Upgrade 316 4,900 400 4,500
Molendinar Water Treatment Plant Upgrade 309 10,700 21 2,400 8,279
SCADA Strategy Implementation Various 66,000 4,315 4,000 57,685
Lowood Water Treatment Plant upgrade 310 10,900 200 10,700
Boonah Kalbar Water Treatment Plant & Pipeline upgrade 310 6,500 500 4,240 1,760
Holts/Camerons Hill Control Building 310 3,400 650 2,750
Mount Crosby Water Treatment Plant upgrade 310 3,600 300 3,300
Land & Easements Various 5,525 Ongoing
Computer Hardware and Software 305 4,178 Ongoing
Building 305 4,500 Ongoing
Fleet 305 2,113 Ongoing
60 Capital Statement 2013-14
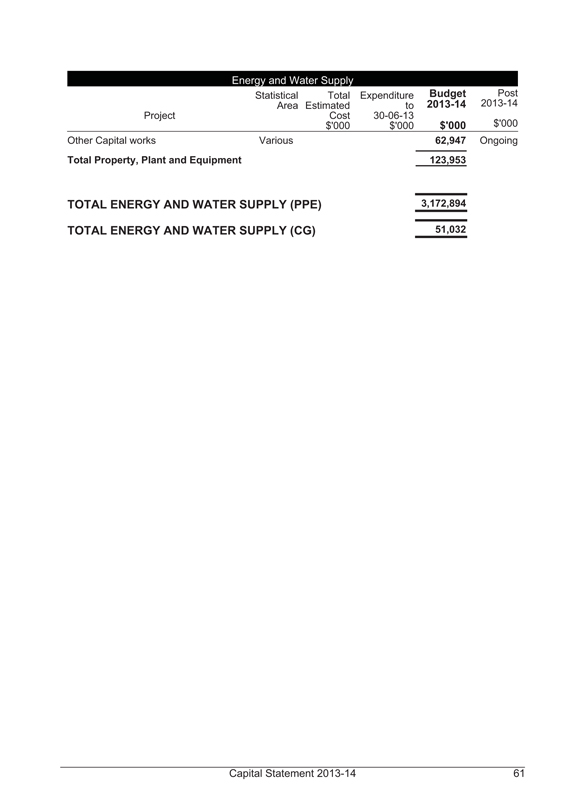
Energy and Water Supply
Project
Statistical Area
Total Estimated Cost $’000
Expenditure to 30-06-13 $’000
Budget 2013-14 $’000
Post 2013-14 $’000
Other Capital works Various 62,947 Ongoing
Total Property, Plant and Equipment 123,953
TOTAL ENERGY AND WATER SUPPLY (PPE) 3,172,894
TOTAL ENERGY AND WATER SUPPLY (CG) 51,032
Capital Statement 2013-14 61
ENVIRONMENT AND HERITAGE PROTECTION
In 2013-14, total capital purchases for the Department of Environment and Heritage Protection is $30.1 million. The capital purchases demonstrate the Department’s commitment to delivering strong environmental management while supporting the State’s sustainable economic development.
Department of Environment and Heritage Protection
The 2013-14 capital purchases contribute to the conservation of the State’s natural environment through the Department’s sustainable land acquisition activities focused on increasing available koala habitat and the conservation of high value biodiversity ecosystems for future generations.
Program Highlights (Property, Plant and Equipment)
• $11.7 million in 2013-14 of a total of $19.4 million over three years to continue to increase available koala habitat through the acquisition of suitable land under the Government’s Investing to Protect Our Koalas election commitment.
• $10.7 million in 2013-14 of a total $17.2 million over three years to support the Government’s Investing in Our Environment for the Future election commitment through the protected area land acquisitions program.
• $5.5 million in other land acquisition program funding including $5 million from the Australian Government to support the department’s land acquisitions.
• $1.2 million in 2013-14 to provide the plant and equipment and leased accommodation fit out required to support the department’s ongoing service delivery.
• $1 million in system development and enhancements to information technology such as the Queensland Waste Data System.
62 Capital Statement 2013-14
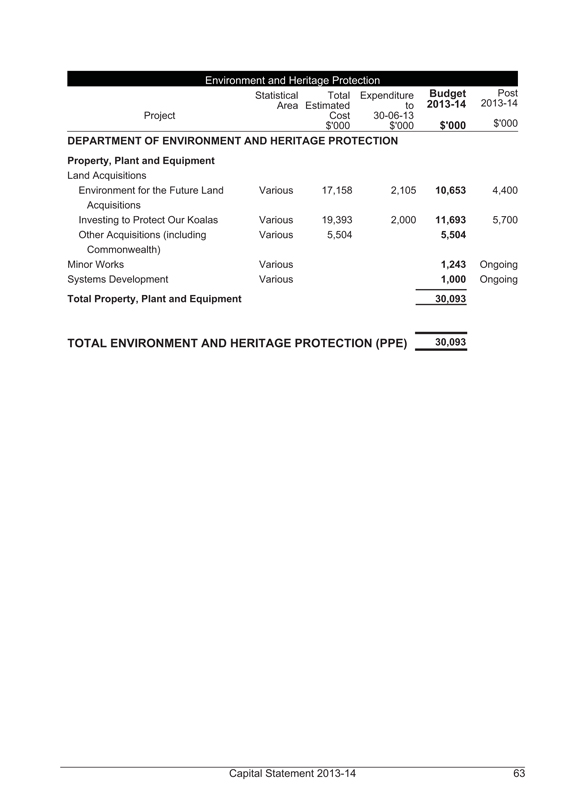
Environment and Heritage Protection
Project
Statistical Area
Total Estimated Cost $’000
Expenditure to 30-06-13 $’000
Budget 2013-14 $’000
Post 2013-14 $’000
DEPARTMENT OF ENVIRONMENT AND HERITAGE PROTECTION
Property, Plant and Equipment
Land Acquisitions
Environment for the Future Land Acquisitions Various 17,158 2,105 10,653 4,400
Investing to Protect Our Koalas Various 19,393 2,000 11,693 5,700
Other Acquisitions (including Commonwealth) Various 5,504 5,504
Minor Works Various 1,243 Ongoing
Systems Development Various 1,000 Ongoing
Total Property, Plant and Equipment 30,093
TOTAL ENVIRONMENT AND HERITAGE PROTECTION (PPE) 30,093
Capital Statement 2013-14 63
HEALTH
The Queensland Public Healthcare system collectively known as ‘Queensland Health’ comprises the Department of Health and 17 independent Hospital and Health Services. The total capital purchases for the Health Portfolio including Queensland Health and the Council of the Queensland Institute of Medical Research is $1.746 billion, and $5.7 million in capital grants.
Queensland Health
Queensland Health capital purchases is an important input into the delivery of health services and outputs that underpin the provision of better services for patients and better healthcare in the community.
In 2013-14, Queensland Health will continue its capital purchases across a broad range of health infrastructure including hospitals, health technology, pathology, research and scientific services, mental health services, residential care, staff accommodation, and information and communication technologies.
Program Highlights (Property, Plant and Equipment)
A total of $1.376 billion will be invested in health facility projects in 2013-14 including:
• $151.7 million to complete the construction of the Gold Coast University Hospital due to open in 2013
• $330 million to continue the development of the Queensland Children’s Hospital and $24.2 million to ensure it is supported by a world class Academic and Research Facility with both projects expecting to cost a total of $1.513 billion
• $115.6 million to continue delivery of the Sunshine Coast University Hospital and its Skills, Academic and Research Centre as a public private partnership, at a total estimated cost of $1.872 billion
• $104 million in 2013-14 to continue the $446.3 million Cairns Base Hospital Redevelopment
• $89.3 million in 2013-14 to continue the $334 million Queensland and Australian Government funded Townville Hospital Expansion
• $86.5 million in Australian Government funding in 2013-14 to construct planned procedure centres at Townsville Hospital and Cairns Base Hospital and the continuation of Regional Cancer Centres at Bundaberg, Hervey Bay, Rockhampton, and Townsville
64 Capital Statement 2013-14
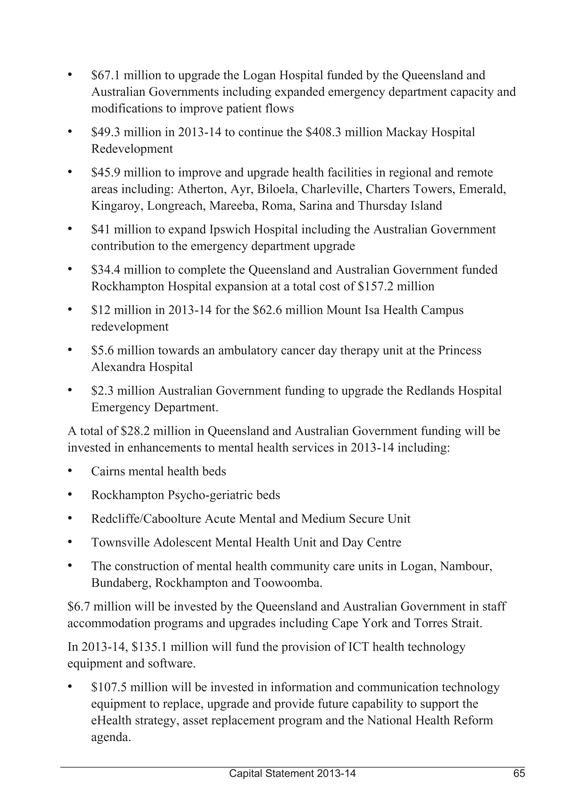
• $67.1 million to upgrade the Logan Hospital funded by the Queensland and Australian Governments including expanded emergency department capacity and modifications to improve patient flows
• $49.3 million in 2013-14 to continue the $408.3 million Mackay Hospital Redevelopment
• $45.9 million to improve and upgrade health facilities in regional and remote areas including: Atherton, Ayr, Biloela, Charleville, Charters Towers, Emerald, Kingaroy, Longreach, Mareeba, Roma, Sarina and Thursday Island
• $41 million to expand Ipswich Hospital including the Australian Government contribution to the emergency department upgrade
• $34.4 million to complete the Queensland and Australian Government funded Rockhampton Hospital expansion at a total cost of $157.2 million
• $12 million in 2013-14 for the $62.6 million Mount Isa Health Campus redevelopment
• $5.6 million towards an ambulatory cancer day therapy unit at the Princess Alexandra Hospital
• $2.3 million Australian Government funding to upgrade the Redlands Hospital Emergency Department.
A total of $28.2 million in Queensland and Australian Government funding will be invested in enhancements to mental health services in 2013-14 including:
• Cairns mental health beds
• Rockhampton Psycho-geriatric beds
• Redcliffe/Caboolture Acute Mental and Medium Secure Unit
• Townsville Adolescent Mental Health Unit and Day Centre
• The construction of mental health community care units in Logan, Nambour, Bundaberg, Rockhampton and Toowoomba.
$6.7 million will be invested by the Queensland and Australian Government in staff accommodation programs and upgrades including Cape York and Torres Strait.
In 2013-14, $135.1 million will fund the provision of ICT health technology equipment and software.
• $107.5 million will be invested in information and communication technology equipment to replace, upgrade and provide future capability to support the eHealth strategy, asset replacement program and the National Health Reform agenda.
Capital Statement 2013-14 65
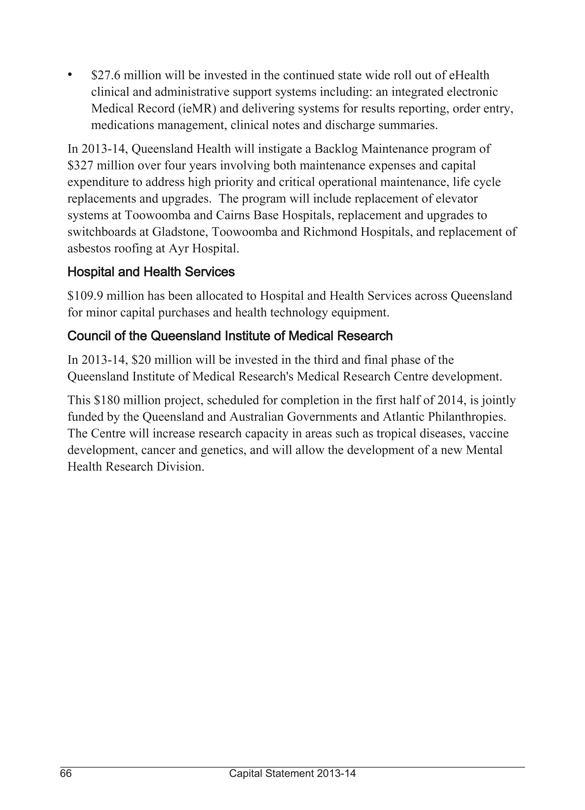
• $27.6 million will be invested in the continued state wide roll out of eHealth clinical and administrative support systems including: an integrated electronic Medical Record (ieMR) and delivering systems for results reporting, order entry, medications management, clinical notes and discharge summaries.
In 2013-14, Queensland Health will instigate a Backlog Maintenance program of $327 million over four years involving both maintenance expenses and capital expenditure to address high priority and critical operational maintenance, life cycle replacements and upgrades. The program will include replacement of elevator systems at Toowoomba and Cairns Base Hospitals, replacement and upgrades to switchboards at Gladstone, Toowoomba and Richmond Hospitals, and replacement of asbestos roofing at Ayr Hospital.
Hospital and Health Services
$109.9 million has been allocated to Hospital and Health Services across Queensland for minor capital purchases and health technology equipment.
Council of the Queensland Institute of Medical Research
In 2013-14, $20 million will be invested in the third and final phase of the Queensland Institute of Medical Research’s Medical Research Centre development.
This $180 million project, scheduled for completion in the first half of 2014, is jointly funded by the Queensland and Australian Governments and Atlantic Philanthropies. The Centre will increase research capacity in areas such as tropical diseases, vaccine development, cancer and genetics, and will allow the development of a new Mental Health Research Division.
66 Capital Statement 2013-14
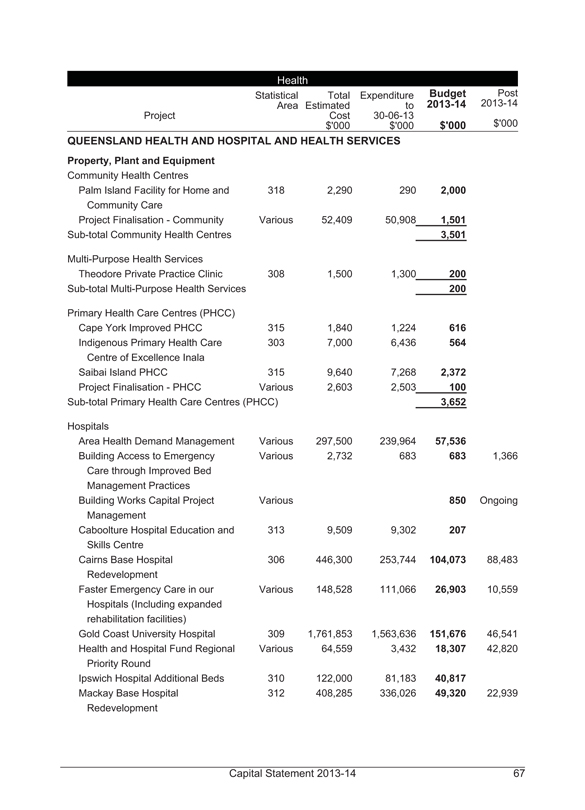
Health
Project
Statistical Area
Total Estimated Cost $’000
Expenditure to 30-06-13 $’000
Budget 2013-14 $’000
Post 2013-14 $’000
QUEENSLAND HEALTH AND HOSPITAL AND HEALTH SERVICES
Property, Plant and Equipment
Community Health Centres
Palm Island Facility for Home and Community Care 318 2,290 290 2,000
Project Finalisation - Community Various 52,409 50,908 1,501
Sub-total Community Health Centres 3,501
Multi-Purpose Health Services
Theodore Private Practice Clinic 308 1,500 1,300 200
Sub-total Multi-Purpose Health Services 200
Primary Health Care Centres (PHCC)
Cape York Improved PHCC 315 1,840 1,224 616
Indigenous Primary Health Care Centre of Excellence Inala 303 7,000 6,436 564
Saibai Island PHCC 315 9,640 7,268 2,372
Project Finalisation - PHCC Various 2,603 2,503 100
Sub-total Primary Health Care Centres (PHCC) 3,652
Hospitals
Area Health Demand Management Various 297,500 239,964 57,536
Building Access to Emergency Care through Improved Bed Management Practices Various 2,732 683 683 1,366
Building Works Capital Project Management Various 850 Ongoing
Caboolture Hospital Education and Skills Centre 313 9,509 9,302 207
Cairns Base Hospital Redevelopment 306 446,300 253,744 104,073 88,483
Faster Emergency Care in our Hospitals (Including expanded rehabilitation facilities) Various 148,528 111,066 26,903 10,559
Gold Coast University Hospital 309 1,761,853 1,563,636 151,676 46,541
Health and Hospital Fund Regional Priority Round Various 64,559 3,432 18,307 42,820
Ipswich Hospital Additional Beds 310 122,000 81,183 40,817
Mackay Base Hospital Redevelopment 312 408,285 336,026 49,320 22,939
Capital Statement 2013-14 67
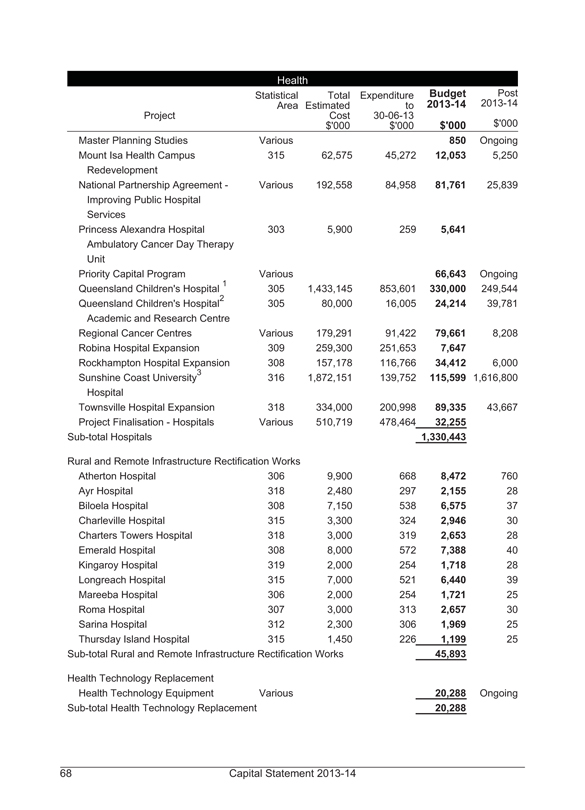
Health
Project
Statistical Area
Total Estimated Cost $’000
Expenditure to 30-06-13 $’000
Budget 2013-14 $’000
Post 2013-14 $’000
Master Planning Studies Various 850 Ongoing
Mount Isa Health Campus Redevelopment 315 62,575 45,272 12,053 5,250
National Partnership Agreement - Improving Public Hospital Services Various 192,558 84,958 81,761 25,839
Princess Alexandra Hospital Ambulatory Cancer Day Therapy Unit 303 5,900 259 5,641
Priority Capital Program Various 66,643 Ongoing
Queensland Children’s Hospital 1 305 1,433,145 853,601 330,000 249,544
Queensland Children’s Hospital2 Academic and Research Centre 305 80,000 16,005 24,214 39,781
Regional Cancer Centres Various 179,291 91,422 79,661 8,208
Robina Hospital Expansion 309 259,300 251,653 7,647
Rockhampton Hospital Expansion 308 157,178 116,766 34,412 6,000
Sunshine Coast University3 Hospital 316 1,872,151 139,752 115,599 1,616,800
Townsville Hospital Expansion 318 334,000 200,998 89,335 43,667
Project Finalisation - Hospitals Various 510,719 478,464 32,255
Sub-total Hospitals 1,330,443
Rural and Remote Infrastructure Rectification Works
Atherton Hospital 306 9,900 668 8,472 760
Ayr Hospital 318 2,480 297 2,155 28
Biloela Hospital 308 7,150 538 6,575 37
Charleville Hospital 315 3,300 324 2,946 30
Charters Towers Hospital 318 3,000 319 2,653 28
Emerald Hospital 308 8,000 572 7,388 40
Kingaroy Hospital 319 2,000 254 1,718 28
Longreach Hospital 315 7,000 521 6,440 39
Mareeba Hospital 306 2,000 254 1,721 25
Roma Hospital 307 3,000 313 2,657 30
Sarina Hospital 312 2,300 306 1,969 25
Thursday Island Hospital 315 1,450 226 1,199 25
Sub-total Rural and Remote Infrastructure Rectification Works 45,893
Health Technology Replacement
Health Technology Equipment Various 20,288 Ongoing
Sub-total Health Technology Replacement 20,288
68 Capital Statement 2013-14
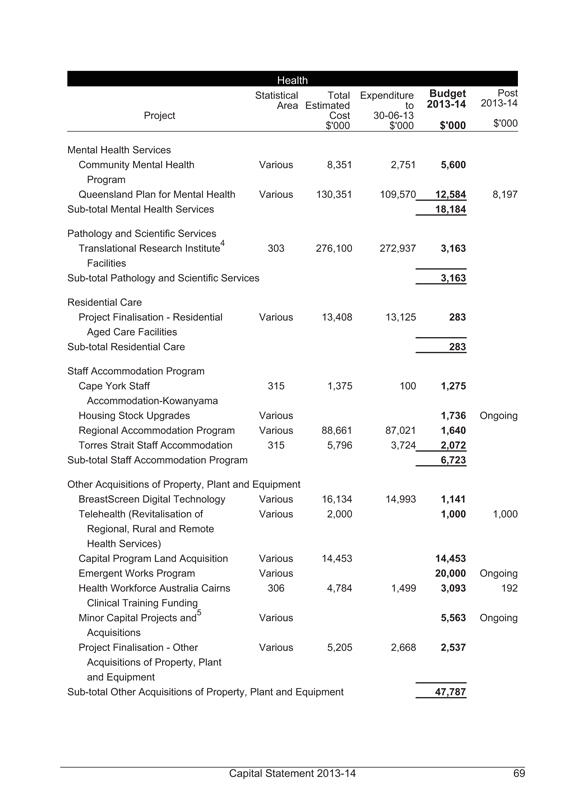
Health
Project
Statistical Area
Total Estimated Cost $’000
Expenditure to 30-06-13 $’000
Budget 2013-14 $’000
Post 2013-14 $’000
Mental Health Services
Community Mental Health Program Various 8,351 2,751 5,600
Queensland Plan for Mental Health Various 130,351 109,570 12,584 8,197
Sub-total Mental Health Services 18,184
Pathology and Scientific Services
Translational Research Institute4 Facilities 303 276,100 272,937 3,163
Sub-total Pathology and Scientific Services 3,163
Residential Care
Project Finalisation - Residential Aged Care Facilities Various 13,408 13,125 283
Sub-total Residential Care 283
Staff Accommodation Program
Cape York Staff Accommodation-Kowanyama 315 1,375 100 1,275
Housing Stock Upgrades Various 1,736 Ongoing
Regional Accommodation Program Various 88,661 87,021 1,640
Torres Strait Staff Accommodation 315 5,796 3,724 2,072
Sub-total Staff Accommodation Program 6,723
Other Acquisitions of Property, Plant and Equipment
BreastScreen Digital Technology Various 16,134 14,993 1,141
Telehealth (Revitalisation of Regional, Rural and Remote Health Services) Various 2,000 1,000 1,000
Capital Program Land Acquisition Various 14,453 14,453
Emergent Works Program Various 20,000 Ongoing
Health Workforce Australia Cairns Clinical Training Funding 306 4,784 1,499 3,093 192
Minor Capital Projects and5 Acquisitions Various 5,563 Ongoing
Project Finalisation - Other Acquisitions of Property, Plant and Equipment Various 5,205 2,668 2,537
Sub-total Other Acquisitions of Property, Plant and Equipment 47,787
Capital Statement 2013-14 69
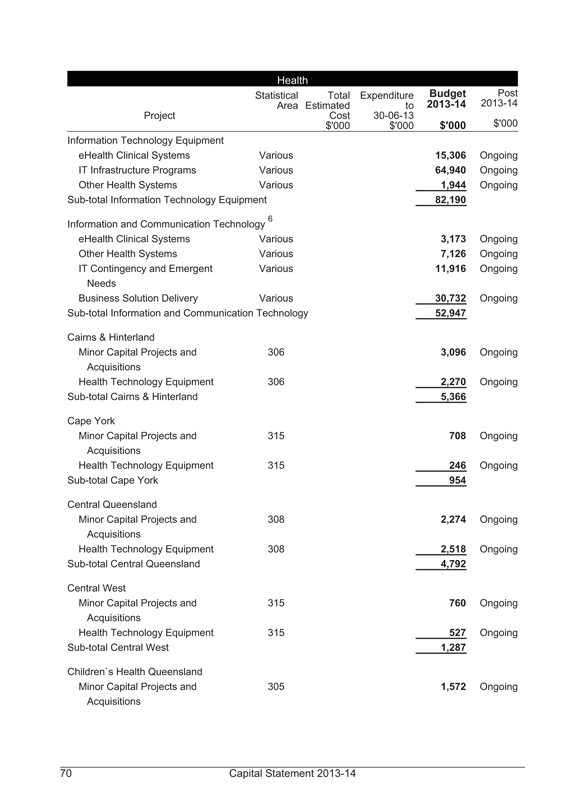
Health
Project
Statistical Area
Total Estimated Cost $’000
Expenditure to 30-06-13 $’000
Budget 2013-14 $’000
Post 2013-14 $’000
Information Technology Equipment
eHealth Clinical Systems Various 15,306 Ongoing
IT Infrastructure Programs Various 64,940 Ongoing
Other Health Systems Various 1,944 Ongoing
Sub-total Information Technology Equipment 82,190
Information and Communication Technology 6
eHealth Clinical Systems Various 3,173 Ongoing
Other Health Systems Various 7,126 Ongoing
IT Contingency and Emergent Needs Various 11,916 Ongoing
Business Solution Delivery Various 30,732 Ongoing
Sub-total Information and Communication Technology 52,947
Cairns & Hinterland
Minor Capital Projects and Acquisitions 306 3,096 Ongoing
Health Technology Equipment 306 2,270 Ongoing
Sub-total Cairns & Hinterland 5,366
Cape York
Minor Capital Projects and Acquisitions 315 708 Ongoing
Health Technology Equipment 315 246 Ongoing
Sub-total Cape York 954
Central Queensland
Minor Capital Projects and Acquisitions 308 2,274 Ongoing
Health Technology Equipment 308 2,518 Ongoing
Sub-total Central Queensland 4,792
Central West
Minor Capital Projects and Acquisitions 315 760 Ongoing
Health Technology Equipment 315 527 Ongoing
Sub-total Central West 1,287
Children’s Health Queensland
Minor Capital Projects and Acquisitions 305 1,572 Ongoing
70 Capital Statement 2013-14
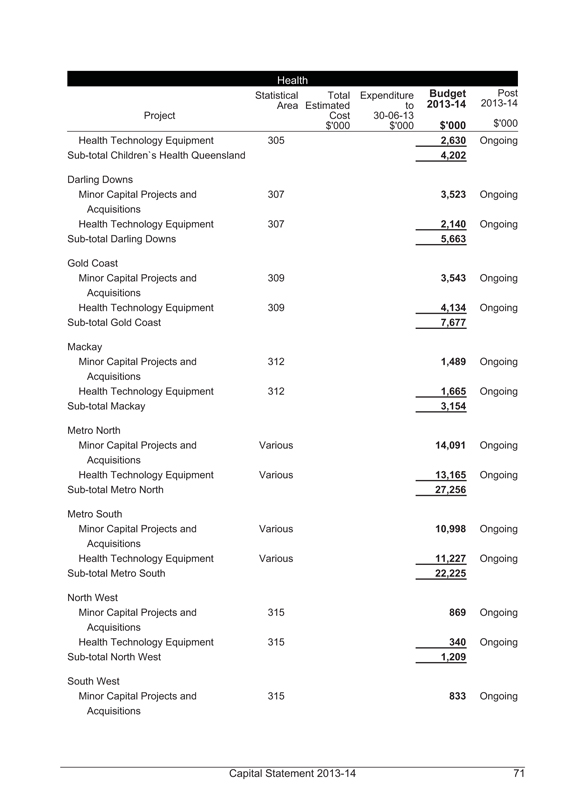
Health
Project
Statistical Area
Total Estimated Cost $’000
Expenditure to 30-06-13 $’000
Budget 2013-14 $’000
Post 2013-14 $’000
Health Technology Equipment 305 2,630 Ongoing
Sub-total Children’s Health Queensland 4,202
Darling Downs
Minor Capital Projects and Acquisitions 307 3,523 Ongoing
Health Technology Equipment 307 2,140 Ongoing
Sub-total Darling Downs 5,663
Gold Coast
Minor Capital Projects and Acquisitions 309 3,543 Ongoing
Health Technology Equipment 309 4,134 Ongoing
Sub-total Gold Coast 7,677
Mackay
Minor Capital Projects and Acquisitions 312 1,489 Ongoing
Health Technology Equipment 312 1,665 Ongoing
Sub-total Mackay 3,154
Metro North
Minor Capital Projects and Acquisitions Various 14,091 Ongoing
Health Technology Equipment Various 13,165 Ongoing
Sub-total Metro North 27,256
Metro South
Minor Capital Projects and Acquisitions Various 10,998 Ongoing
Health Technology Equipment Various 11,227 Ongoing
Sub-total Metro South 22,225
North West
Minor Capital Projects and Acquisitions 315 869 Ongoing
Health Technology Equipment 315 340 Ongoing
Sub-total North West 1,209
South West
Minor Capital Projects and Acquisitions 315 833 Ongoing
Capital Statement 2013-14 71
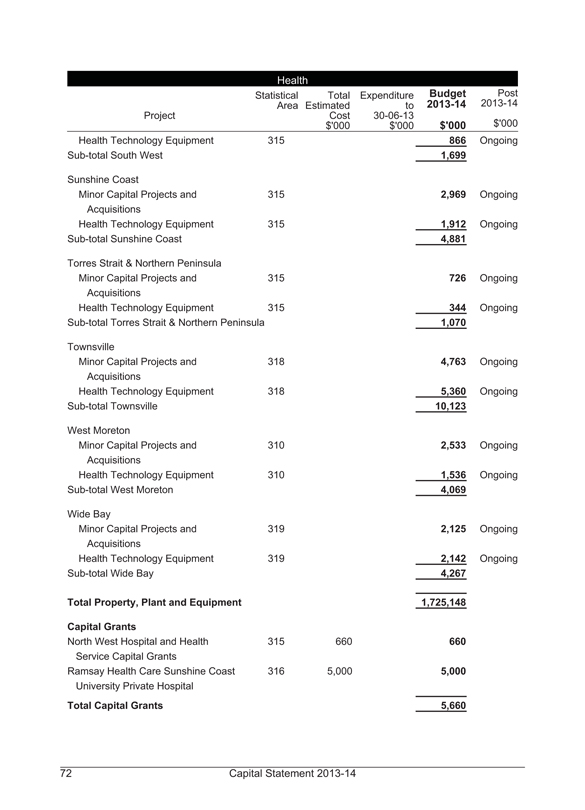
Health
Project
Statistical Area
Total Estimated Cost $’000
Expenditure to 30-06-13 $’000
Budget 2013-14 $’000
Post 2013-14 $’000
Health Technology Equipment 315 866 Ongoing
Sub-total South West 1,699
Sunshine Coast
Minor Capital Projects and Acquisitions 315 2,969 Ongoing
Health Technology Equipment 315 1,912 Ongoing
Sub-total Sunshine Coast 4,881
Torres Strait & Northern Peninsula
Minor Capital Projects and Acquisitions 315 726 Ongoing
Health Technology Equipment 315 344 Ongoing
Sub-total Torres Strait & Northern Peninsula 1,070
Townsville
Minor Capital Projects and Acquisitions 318 4,763 Ongoing
Health Technology Equipment 318 5,360 Ongoing
Sub-total Townsville 10,123
West Moreton
Minor Capital Projects and Acquisitions 310 2,533 Ongoing
Health Technology Equipment 310 1,536 Ongoing
Sub-total West Moreton 4,069
Wide Bay
Minor Capital Projects and Acquisitions 319 2,125 Ongoing
Health Technology Equipment 319 2,142 Ongoing
Sub-total Wide Bay 4,267
Total Property, Plant and Equipment 1,725,148
Capital Grants
North West Hospital and Health Service Capital Grants 315 660 660
Ramsay Health Care Sunshine Coast University Private Hospital 316 5,000 5,000
Total Capital Grants 5,660
72 Capital Statement 2013-14
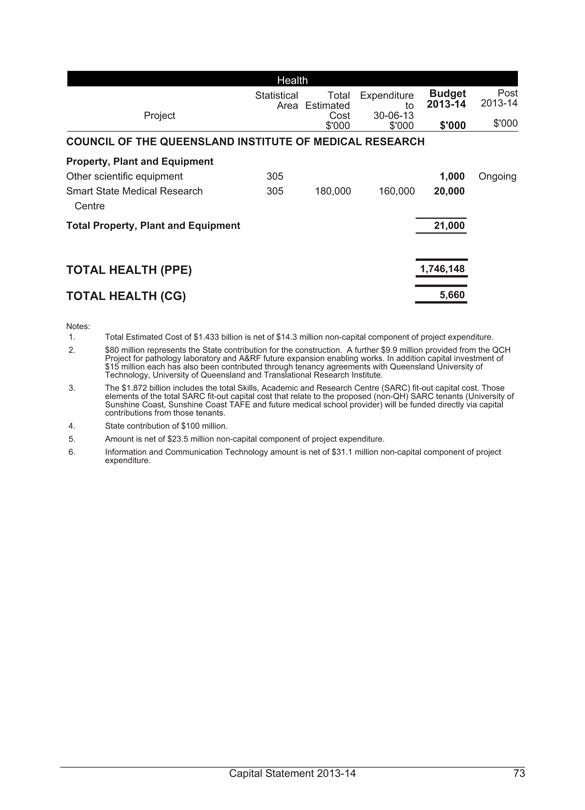
Health
Project
Statistical Area
Total Estimated Cost $’000
Expenditure to 30-06-13 $’000
Budget 2013-14 $’000
Post 2013-14 $’000
COUNCIL OF THE QUEENSLAND INSTITUTE OF MEDICAL RESEARCH
Property, Plant and Equipment
Other scientific equipment 305 1,000 Ongoing
Smart State Medical Research Centre 305 180,000 160,000 20,000
Total Property, Plant and Equipment 21,000
TOTAL HEALTH (PPE) 1,746,148
TOTAL HEALTH (CG) 5,660
Notes:
1. Total Estimated Cost of $1.433 billion is net of $14.3 million non-capital component of project expenditure.
2. $80 million represents the State contribution for the construction. A further $9.9 million provided from the QCH Project for pathology laboratory and A&RF future expansion enabling works. In addition capital investment of $15 million each has also been contributed through tenancy agreements with Queensland University of Technology, University of Queensland and Translational Research Institute.
3. The $1.872 billion includes the total Skills, Academic and Research Centre (SARC) fit-out capital cost. Those elements of the total SARC fit-out capital cost that relate to the proposed (non-QH) SARC tenants (University of Sunshine Coast, Sunshine Coast TAFE and future medical school provider) will be funded directly via capital contributions from those tenants.
4. State contribution of $100 million.
5. Amount is net of $23.5 million non-capital component of project expenditure.
6. Information and Communication Technology amount is net of $31.1 million non-capital component of project expenditure.
Capital Statement 2013-14 73
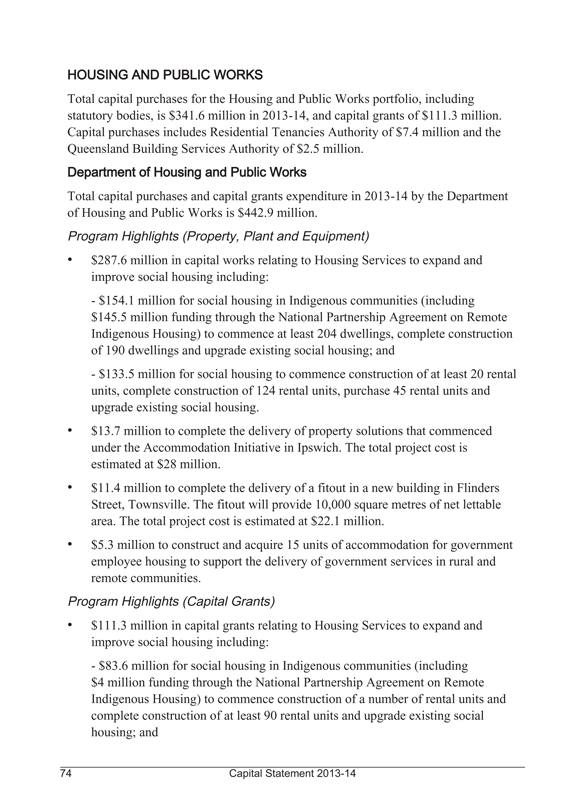
HOUSING AND PUBLIC WORKS
Total capital purchases for the Housing and Public Works portfolio, including statutory bodies, is $341.6 million in 2013-14, and capital grants of $111.3 million. Capital purchases includes Residential Tenancies Authority of $7.4 million and the Queensland Building Services Authority of $2.5 million.
Department of Housing and Public Works
Total capital purchases and capital grants expenditure in 2013-14 by the Department of Housing and Public Works is $442.9 million.
Program Highlights (Property, Plant and Equipment)
• $287.6 million in capital works relating to Housing Services to expand and improve social housing including:
- $154.1 million for social housing in Indigenous communities (including $145.5 million funding through the National Partnership Agreement on Remote Indigenous Housing) to commence at least 204 dwellings, complete construction of 190 dwellings and upgrade existing social housing; and
- $133.5 million for social housing to commence construction of at least 20 rental units, complete construction of 124 rental units, purchase 45 rental units and upgrade existing social housing.
• $13.7 million to complete the delivery of property solutions that commenced under the Accommodation Initiative in Ipswich. The total project cost is estimated at $28 million.
• $11.4 million to complete the delivery of a fitout in a new building in Flinders Street, Townsville. The fitout will provide 10,000 square metres of net lettable area. The total project cost is estimated at $22.1 million.
• $5.3 million to construct and acquire 15 units of accommodation for government employee housing to support the delivery of government services in rural and remote communities.
Program Highlights (Capital Grants)
• $111.3 million in capital grants relating to Housing Services to expand and improve social housing including:
- $83.6 million for social housing in Indigenous communities (including $4 million funding through the National Partnership Agreement on Remote Indigenous Housing) to commence construction of a number of rental units and complete construction of at least 90 rental units and upgrade existing social housing; and
74 Capital Statement 2013-14
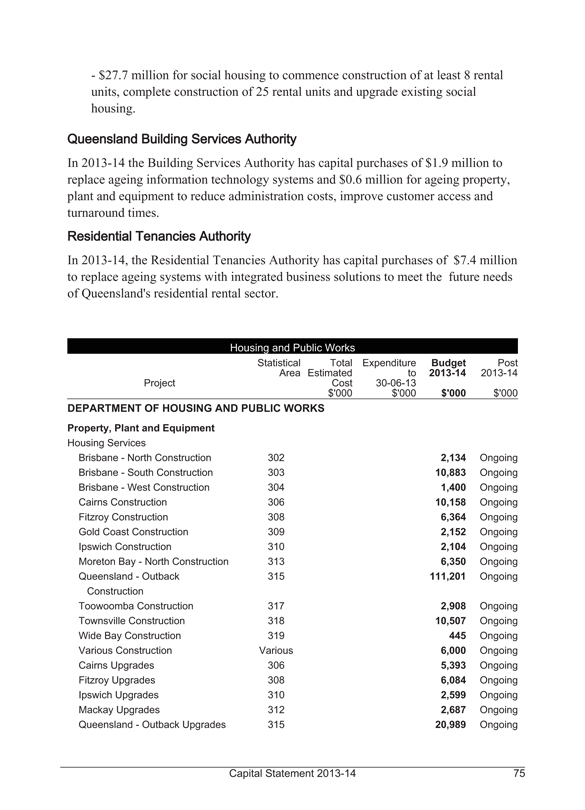
- $27.7 million for social housing to commence construction of at least 8 rental units, complete construction of 25 rental units and upgrade existing social housing.
Queensland Building Services Authority
In 2013-14 the Building Services Authority has capital purchases of $1.9 million to replace ageing information technology systems and $0.6 million for ageing property, plant and equipment to reduce administration costs, improve customer access and turnaround times.
Residential Tenancies Authority
In 2013-14, the Residential Tenancies Authority has capital purchases of $7.4 million to replace ageing systems with integrated business solutions to meet the future needs of Queensland’s residential rental sector.
Housing and Public Works
Project
Statistical Area
Total Estimated Cost $’000
Expenditure to 30-06-13 $’000
Budget 2013-14 $’000
Post 2013-14 $’000
DEPARTMENT OF HOUSING AND PUBLIC WORKS
Property, Plant and Equipment
Housing Services
Brisbane - North Construction 302 2,134 Ongoing
Brisbane - South Construction 303 10,883 Ongoing
Brisbane - West Construction 304 1,400 Ongoing
Cairns Construction 306 10,158 Ongoing
Fitzroy Construction 308 6,364 Ongoing
Gold Coast Construction 309 2,152 Ongoing
Ipswich Construction 310 2,104 Ongoing
Moreton Bay - North Construction 313 6,350 Ongoing
Queensland - Outback Construction 315 111,201 Ongoing
Toowoomba Construction 317 2,908 Ongoing
Townsville Construction 318 10,507 Ongoing
Wide Bay Construction 319 445 Ongoing
Various Construction Various 6,000 Ongoing
Cairns Upgrades 306 5,393 Ongoing
Fitzroy Upgrades 308 6,084 Ongoing
Ipswich Upgrades 310 2,599 Ongoing
Mackay Upgrades 312 2,687 Ongoing
Queensland - Outback Upgrades 315 20,989 Ongoing
Capital Statement 2013-14 75
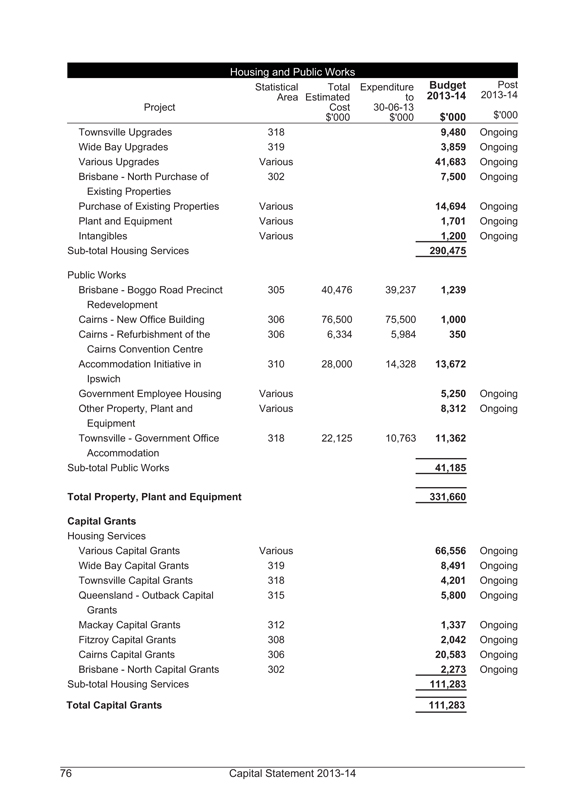
Housing and Public Works
Project
Statistical Area
Total Estimated Cost $’000
Expenditure to 30-06-13 $’000
Budget 2013-14 $’000
Post 2013-14 $’000
Townsville Upgrades 318 9,480 Ongoing
Wide Bay Upgrades 319 3,859 Ongoing
Various Upgrades Various 41,683 Ongoing
Brisbane - North Purchase of Existing Properties 302 7,500 Ongoing
Purchase of Existing Properties Various 14,694 Ongoing
Plant and Equipment Various 1,701 Ongoing
Intangibles Various 1,200 Ongoing
Sub-total Housing Services 290,475
Public Works
Brisbane - Boggo Road Precinct Redevelopment 305 40,476 39,237 1,239
Cairns - New Office Building 306 76,500 75,500 1,000
Cairns - Refurbishment of the Cairns Convention Centre 306 6,334 5,984 350
Accommodation Initiative in Ipswich 310 28,000 14,328 13,672
Government Employee Housing Various 5,250 Ongoing
Other Property, Plant and Equipment Various 8,312 Ongoing
Townsville - Government Office Accommodation 318 22,125 10,763 11,362
Sub-total Public Works 41,185
Total Property, Plant and Equipment 331,660
Capital Grants
Housing Services
Various Capital Grants Various 66,556 Ongoing
Wide Bay Capital Grants 319 8,491 Ongoing
Townsville Capital Grants 318 4,201 Ongoing
Queensland - Outback Capital Grants 315 5,800 Ongoing
Mackay Capital Grants 312 1,337 Ongoing
Fitzroy Capital Grants 308 2,042 Ongoing
Cairns Capital Grants 306 20,583 Ongoing
Brisbane - North Capital Grants 302 2,273 Ongoing
Sub-total Housing Services 111,283
Total Capital Grants 111,283
76 Capital Statement 2013-14
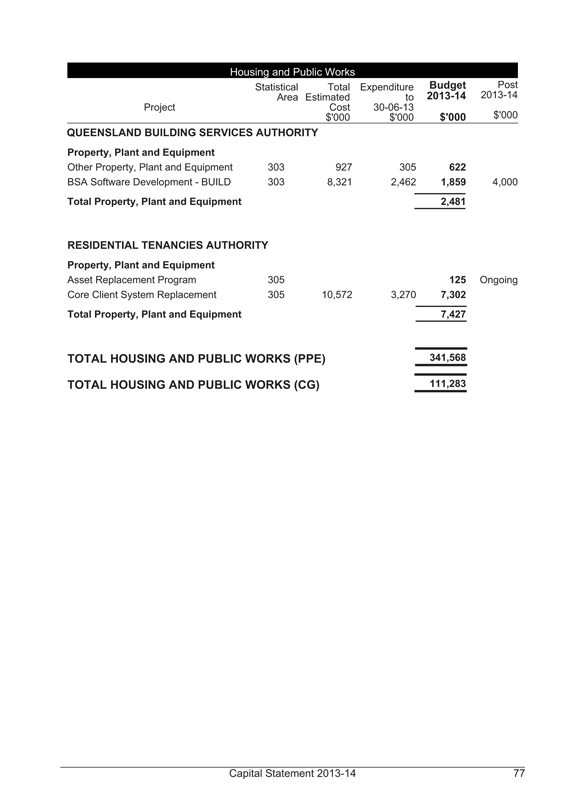
Housing and Public Works
Project
Statistical Area
Total Estimated Cost $’000
Expenditure to 30-06-13 $’000
Budget 2013-14 $’000
Post 2013-14 $’000
QUEENSLAND BUILDING SERVICES AUTHORITY
Property, Plant and Equipment
Other Property, Plant and Equipment 303 927 305 622
BSA Software Development - BUILD 303 8,321 2,462 1,859 4,000
Total Property, Plant and Equipment 2,481
RESIDENTIAL TENANCIES AUTHORITY
Property, Plant and Equipment
Asset Replacement Program 305 125 Ongoing
Core Client System Replacement 305 10,572 3,270 7,302
Total Property, Plant and Equipment 7,427
TOTAL HOUSING AND PUBLIC WORKS (PPE) 341,568
TOTAL HOUSING AND PUBLIC WORKS (CG) 111,283
Capital Statement 2013-14 77
JUSTICE AND ATTORNEY-GENERAL
The 2013-14 capital purchases for Justice and Attorney-General (including Public Trust Office, Legal Aid Queensland and Crime and Misconduct Commission) is $60.2 million.
Department of Justice and Attorney-General
The Department of Justice and Attorney-General capital purchases for 2013-14 is $47 million. The department’s capital purchases will primarily focus on the expansion and refurbishment of Cleveland Youth Detention Centre, the enhancement, maintenance and upgrade of Youth Justice facilities and the programmed renewal and maintenance of courthouses.
Program Highlights (Property, Plant and Equipment)
• $15.9 million for the continuation of the Cleveland Youth Detention Centre expansion in Townsville.
• $13.7 million for enhancement, maintenance and upgrade of Youth Justice facilities.
• $7.3 million for programmed renewal and maintenance of courthouses.
Public Trust Office
During 2013-14 the Public Trustee is proposing to spend $5.7 million on capital purchases. The Public Trustee is committed to meeting the Government objectives to provide quality and efficient services to clients in the Queensland community. The Public Trustee continues to re-develop regional offices to improve front line services and accessibility to all clients, as well as continuing to maintain appropriate workplace health and safety standards for staff and clients.
Program Highlights (Property, Plant and Equipment)
• $2.3 million on existing regional offices to provide efficient front line services for regional Queensland communities.
• $1.6 million as part of the strategy to upgrade business systems on an on going basis.
• $1.4 million on the refurbishment of the Brisbane office to provide efficient front line services to the community.
78 Capital Statement 2013-14
Legal Aid Queensland
Legal Aid Queensland’s 2013-14 capital purchases program is $6.3 million. Legal Aid Queensland will invest $5.5 million on major property, plant and equipment projects including the finalisation of the Grants Management System Modernisation project and the refurbishment of the Brisbane, Ipswich, Bundaberg and other offices. A further $0.8 million will be invested to maintain Legal Aid Queensland’s business systems and replace motor vehicles.
Crime and Misconduct Commission
The Crime and Misconduct Commission will spend $1.2 million on its capital purchases in 2013-14. The Commission will invest $0.71 million in computer and other equipment replacement and $0.45 million on vehicle replacement.
Justice and Attorney-General
Project
Statistical Area
Total Estimated Cost $’000
Expenditure to 30-06-13 $’000
Budget 2013-14 $’000
Post 2013-14 $’000
DEPARTMENT OF JUSTICE AND ATTORNEY-GENERAL
Property, Plant and Equipment
Cleveland Youth Detention Centre -
318
183,828
139,837
15,877
28,114
Expansion
Youth Justice facilities
Various
11,459
Ongoing
Youth Justice facilities, minor capital
Various
2,232
Ongoing
works
Courthouses, programmed renewal
Various
5,670
Ongoing
Courthouses, minor capital works
Various
1,630
Ongoing
Other acquistions of property, plant
Various
2,895
Ongoing
and equipment
Leasehold improvements
Various
1,140
Ongoing
Minor capital works, software
305
4,858
Ongoing
Queensland Wide Integrated Courts
305
1,221
Ongoing
(QWIC) system
Total Property, Plant and Equipment
46,982
PUBLIC TRUST OFFICE
Property, Plant and Equipment
Building improvements
Various
2,295
Ongoing
Brisbane office refurbishment
305
1,399
Ongoing
Computer hardware
305
432
Ongoing
Capital Statement 2013-14 79
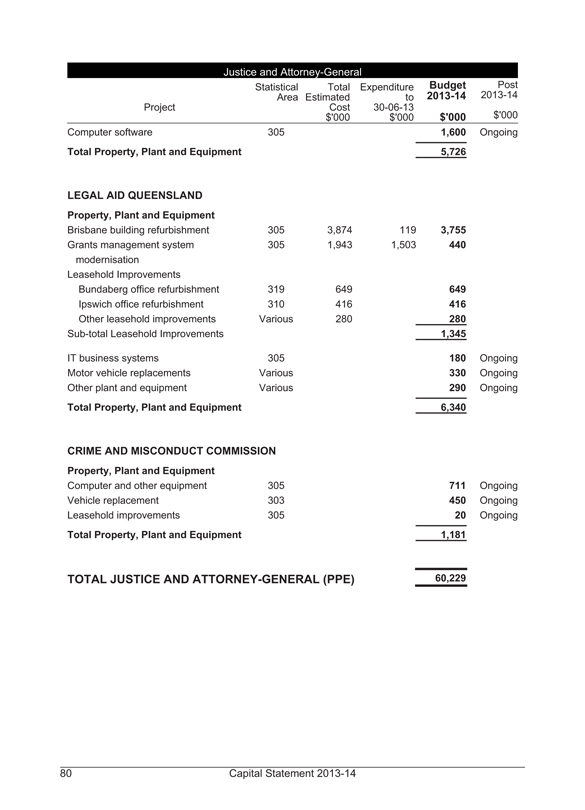
Justice and Attorney-General
Project
Statistical Area
Total Estimated Cost $’000
Expenditure to 30-06-13 $’000
Budget 2013-14 $’000
Post 2013-14 $’000
Computer software
305
1,600
Ongoing
Total Property, Plant and Equipment
5,726
LEGAL AID QUEENSLAND
Property, Plant and Equipment
Brisbane building refurbishment
305
3,874
119
3,755
Grants management system
305
1,943
1,503
440
modernisation
Leasehold Improvements
Bundaberg office refurbishment
319
649
649
Ipswich office refurbishment
310
416
416
Other leasehold improvements
Various
280
280
Sub-total Leasehold Improvements
1,345
IT business systems
305
180
Ongoing
Motor vehicle replacements
Various
330
Ongoing
Other plant and equipment
Various
290
Ongoing
Total Property, Plant and Equipment
6,340
CRIME AND MISCONDUCT COMMISSION
Property, Plant and Equipment
Computer and other equipment
305
711
Ongoing
Vehicle replacement
303
450
Ongoing
Leasehold improvements
305
20
Ongoing
Total Property, Plant and Equipment
1,181
TOTAL JUSTICE AND ATTORNEY-GENERAL (PPE)
60,229
80 Capital Statement 2013-14
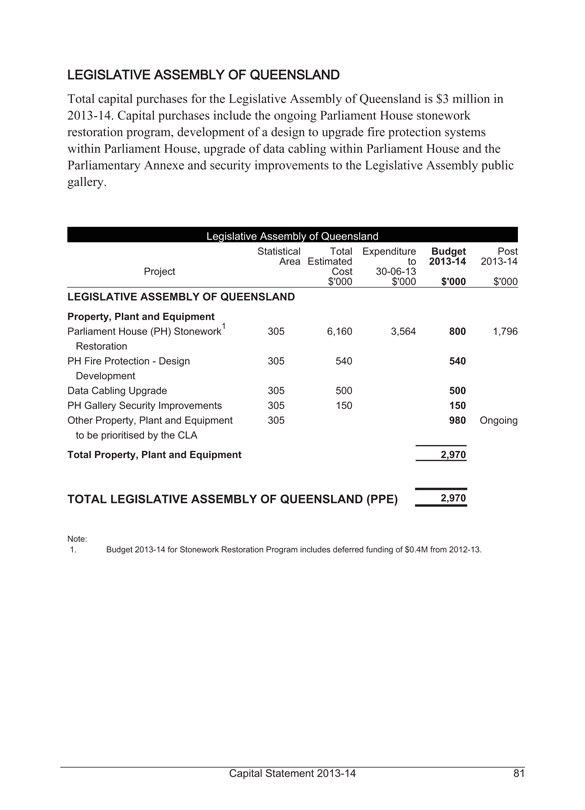
LEGISLATIVE ASSEMBLY OF QUEENSLAND
Total capital purchases for the Legislative Assembly of Queensland is $3 million in 2013-14. Capital purchases include the ongoing Parliament House stonework restoration program, development of a design to upgrade fire protection systems within Parliament House, upgrade of data cabling within Parliament House and the Parliamentary Annexe and security improvements to the Legislative Assembly public gallery.
Legislative Assembly of Queensland
Project
Statistical Area
Total Estimated Cost $’000
Expenditure to 30-06-13 $’000
Budget 2013-14 $’000
Post 2013-14 $’000
LEGISLATIVE ASSEMBLY OF QUEENSLAND
Property, Plant and Equipment
Parliament House (PH) Stonework1
305
6,160
3,564
800
1,796
Restoration
PH Fire Protection - Design
305
540
540
Development
Data Cabling Upgrade
305
500
500
PH Gallery Security Improvements
305
150
150
Other Property, Plant and Equipment
305
980
Ongoing
to be prioritised by the CLA
Total Property, Plant and Equipment
2,970
TOTAL LEGISLATIVE ASSEMBLY OF QUEENSLAND (PPE)
2,970
Note:
1. Budget 2013-14 for Stonework Restoration Program includes deferred funding of $0.4M from 2012-13.
Capital Statement 2013-14 81
LOCAL GOVERNMENT, COMMUNITY RECOVERY AND RESILIENCE
Department of Local Government, Community Recovery and Resilience
For 2013-14, the Department of Local Government, Community Recovery and Resilience total capital purchases is $22.4 million and total capital grants is $108.9 million. The department is committed to supporting and promoting the critical role of local governments in delivering services and infrastructure to their communities, and assisting with implementing recovery and resilience initiatives in areas affected by natural disasters. Strong, sustainable and resilient local governments are a key focus of the department. The department is working with councils and peak bodies to enhance and guide local government systems that bring long term social and economic benefits to communities across Queensland.
Program Highlights (Property, Plant and Equipment)
• $22.3 million for the Indigenous State Infrastructure Program.
Program Highlights (Capital Grants)
• $66.9 million for the Local Government Grants and Subsidies Program delivered as $47.1 million supporting priority infrastructure projects to meet identified community needs; and $19.8 million under the Local Government Floods Response Subsidy to support projects that will protect communities and infrastructure from future floods.
• $16.9 million distributed under the Royalties for the Regions program.
Queensland Reconstruction Authority
The capital expenditure for the Queensland Reconstruction Authority in 2013-14 consists of capital grants of $2.01 billion. For the most part, this is funded 75 percent by the Australian Government (under the Natural Disaster Relief and Recovery Arrangements) and 25 percent by the State Government.
Program Highlights (Capital Grants)
• In 2013-14, $1.93 billion is being provided to Local Government Authorities to undertake recovery and reconstruction projects following the 2010-11 Floods, Tropical Cyclone Yasi, ex-Tropical Cyclone Oswald and other recovery and reconstruction projects relating to natural disaster events of 2011 to 2013.
• In 2013-14, $80 million is being provided to Local Government Authorities to undertake Betterment projects to restore or replace essential public assets damaged by the ex-Tropical Cyclone Oswald disaster event of early 2013 to a more resilient standard.
82 Capital Statement 2013-14
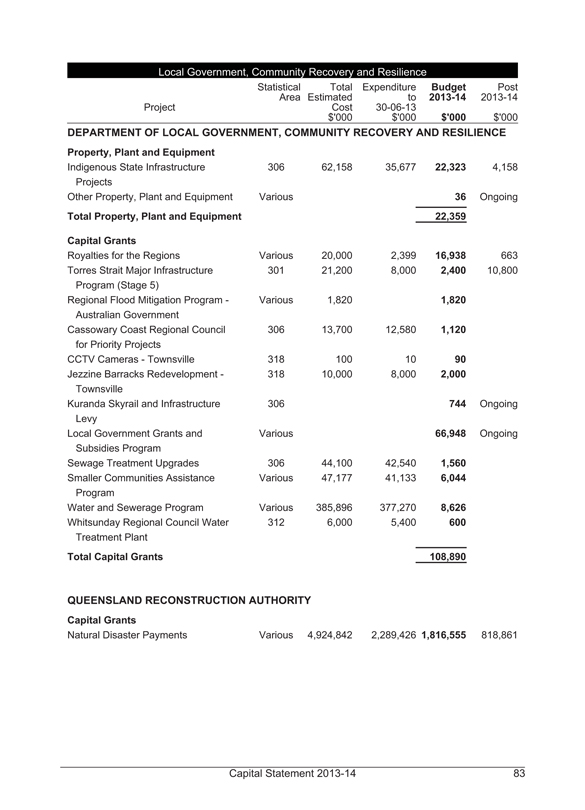
Local Government, Community Recovery and Resilience
Project
Statistical Area
Total Estimated Cost $’000
Expenditure to 30-06-13 $’000
Budget 2013-14 $’000
Post 2013-14 $’000
DEPARTMENT OF LOCAL GOVERNMENT, COMMUNITY RECOVERY AND RESILIENCE
Property, Plant and Equipment
Indigenous State Infrastructure
306
62,158
35,677
22,323
4,158
Projects
Other Property, Plant and Equipment
Various
36
Ongoing
Total Property, Plant and Equipment
22,359
Capital Grants
Royalties for the Regions
Various
20,000
2,399
16,938
663
Torres Strait Major Infrastructure
301
21,200
8,000
2,400
10,800
Program (Stage 5)
Regional Flood Mitigation Program -
Various
1,820
1,820
Australian Government
Cassowary Coast Regional Council
306
13,700
12,580
1,120
for Priority Projects
CCTV Cameras - Townsville
318
100
10
90
Jezzine Barracks Redevelopment -
318
10,000
8,000
2,000
Townsville
Kuranda Skyrail and Infrastructure
306
744
Ongoing
Levy
Local Government Grants and
Various
66,948
Ongoing
Subsidies Program
Sewage Treatment Upgrades
306
44,100
42,540
1,560
Smaller Communities Assistance
Various
47,177
41,133
6,044
Program
Water and Sewerage Program
Various
385,896
377,270
8,626
Whitsunday Regional Council Water
312
6,000
5,400
600
Treatment Plant
Total Capital Grants
108,890
QUEENSLAND RECONSTRUCTION AUTHORITY
Capital Grants
Natural Disaster Payments
Various
4,924,842
2,289,426
1,816,555
818,861
Capital Statement 2013-14 83
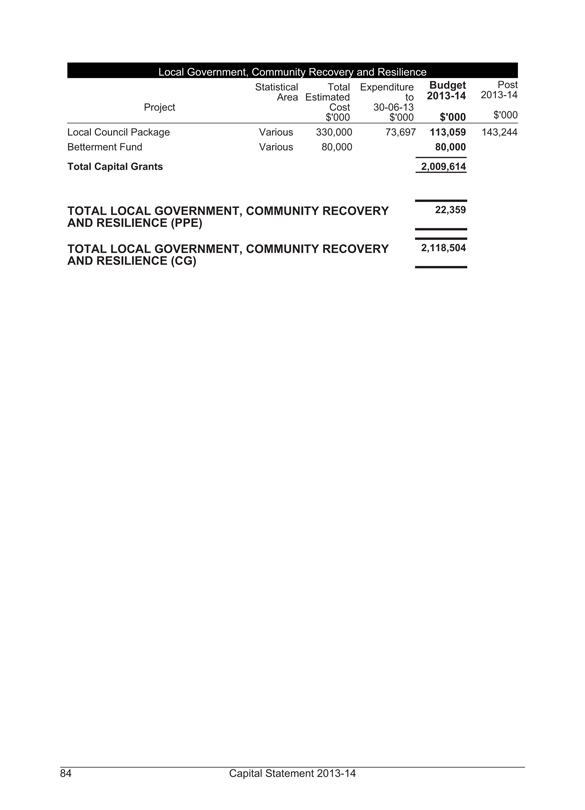
Local Government, Community Recovery and Resilience
Project
Statistical Area
Total Estimated Cost $’000
Expenditure to 30-06-13 $’000
Budget 2013-14 $’000
Post 2013-14 $’000
Local Council Package
Various
330,000
73,697
113,059
143,244
Betterment Fund
Various
80,000
80,000
Total Capital Grants
2,009,614
TOTAL LOCAL GOVERNMENT, COMMUNITY RECOVERY AND RESILIENCE (PPE)
22,359
TOTAL LOCAL GOVERNMENT, COMMUNITY RECOVERY AND RESILIENCE (CG)
2,118,504
84 Capital Statement 2013-14
NATIONAL PARKS, RECREATION, SPORT AND RACING
Capital purchases for the Department of National Parks, Recreation, Sport and Racing for 2013-14 is $32.1 million, with $64.6 million in capital grants.
Department of National Parks, Recreation, Sport and Racing
The purpose of the Department is to manage protected areas to ensure its sustainability, encourage active participation in recreation and sport and ensure the integrity of the racing industry across the state. The Department has three service areas working towards this purpose: National Parks; Recreation and Sport; and Racing.
The 2013-14 capital program directly supports these objectives through significant capital grant programs, a significant capital works program in National Parks and Recreation and Sport, ongoing replacement of plant and equipment and development of systems to support delivery of its frontline services.
Program Highlights (Property, Plant and Equipment)
• $9.4 million in various capital works and property plant and equipment purchases for National Parks.
• $6.3 million towards various projects within National Parks to improve visitor access.
• $6.1 million to maintain and upkeep Active Recreation Centres, Sport Reserves and Sports Houses throughout the State.
• $4.5 million towards the building of a replacement vessel for the Kerra-Lyn at a total cost of $5.5 million jointly with the Australian Government to patrol and service the Great Barrier Reef Marine Park.
• $3.4 million to replace various amenity blocks and upgrade septic systems within National Parks.
• $2.2 million towards visitor centre upgrades at Carnarvon, Fleay’s, D’Aguilar and Mon Repos.
Program Highlights (Capital Grants)
• $35.1 million in capital grants under the Racing Industry Capital Development Scheme from an approved $110 million over the life of the program will be used to assist the racing industry state-wide to improve racing infrastructure.
• $15.8 million under the Get in the Game program (Get Playing) to increase participation in sport and recreation through developing infrastructure.
Capital Statement 2013-14 85
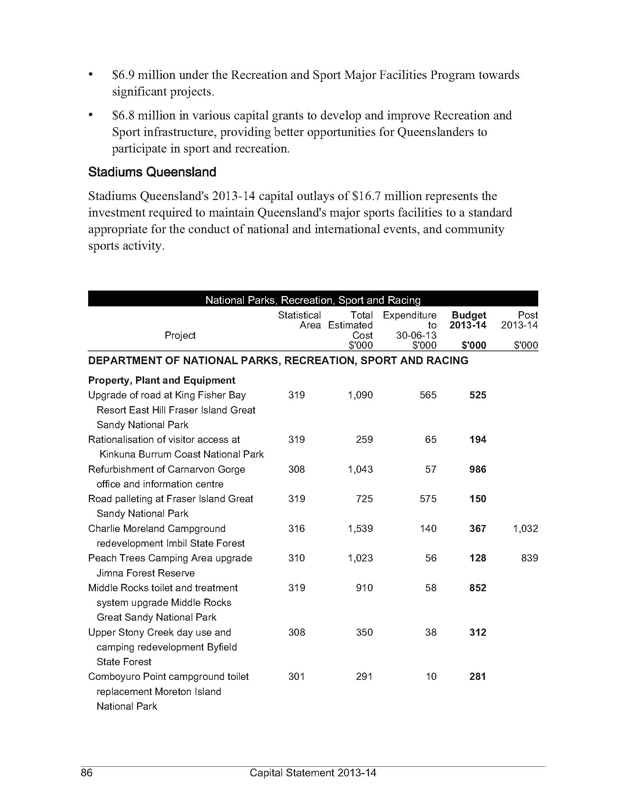
• $6.9 million under the Recreation and Sport Major Facilities Program towards significant projects.
• $6.8 million in various capital grants to develop and improve Recreation and Sport infrastructure, providing better opportunities for Queenslanders to participate in sport and recreation.
Stadiums Queensland
Stadiums Queensland’s 2013-14 capital outlays of $16.7 million represents the investment required to maintain Queensland’s major sports facilities to a standard appropriate for the conduct of national and international events, and community sports activity.
National Parks, Recreation, Sport and Racing
Project
Statistical Area
Total Estimated Cost $’000
Expenditure to 30-06-13 $’000
Budget 2013-14 $’000
Post 2013-14 $’000
DEPARTMENT OF NATIONAL PARKS, RECREATION, SPORT AND RACING
Property, Plant and Equipment
Upgrade of road at King Fisher Bay
319
1,090
565
525
Resort East Hill Fraser Island Great
Sandy National Park
Rationalisation of visitor access at
319
259
65
194
Kinkuna Burrum Coast National Park
Refurbishment of Carnarvon Gorge
308
1,043
57
986
office and information centre
Road palleting at Fraser Island Great
319
725
575
150
Sandy National Park
Charlie Moreland Campground
316
1,539
140
367
1,032
redevelopment Imbil State Forest
Peach Trees Camping Area upgrade
310
1,023
56
128
839
Jimna Forest Reserve
Middle Rocks toilet and treatment
319
910
58
852
system upgrade Middle Rocks
Great Sandy National Park
Upper Stony Creek day use and
308
350
38
312
camping redevelopment Byfield
State Forest
Comboyuro Point campground toilet
301
291
10
281
replacement Moreton Island
National Park
86 Capital Statement 2013-14
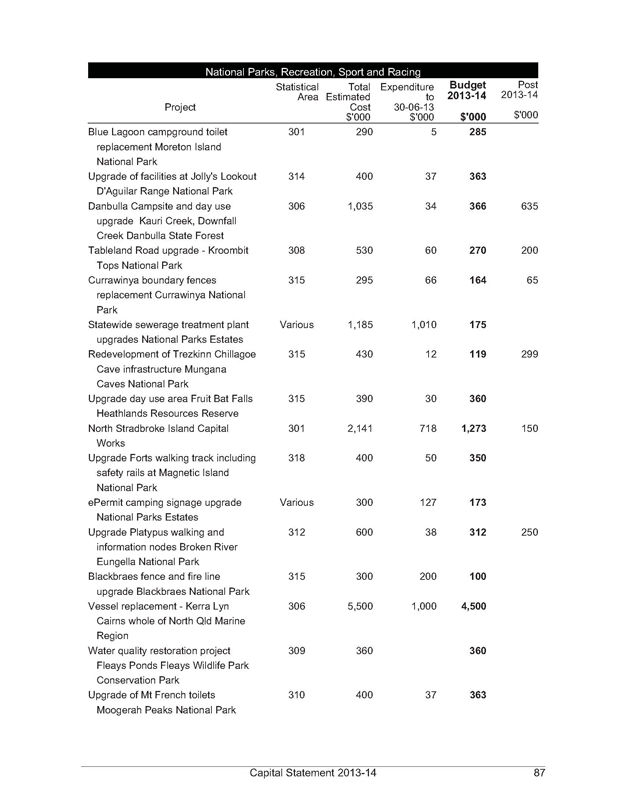
National Parks, Recreation, Sport and Racing
Project
Statistical Area
Total Estimated Cost $’000
Expenditure to 30-06-13 $’000
Budget 2013-14 $’000
Post 2013-14 $’000
Blue Lagoon campground toilet
301
290
5
285
replacement Moreton Island
National Park
Upgrade of facilities at Jolly’s Lookout
314
400
37
363
D’Aguilar Range National Park
Danbulla Campsite and day use
306
1,035
34
366
635
upgrade Kauri Creek, Downfall
Creek Danbulla State Forest
Tableland Road upgrade - Kroombit
308
530
60
270
200
Tops National Park
Currawinya boundary fences
315
295
66
164
65
replacement Currawinya National
Park
Statewide sewerage treatment plant
Various
1,185
1,010
175
upgrades National Parks Estates
Redevelopment of Trezkinn Chillagoe
315
430
12
119
299
Cave infrastructure Mungana
Caves National Park
Upgrade day use area Fruit Bat Falls
315
390
30
360
Heathlands Resources Reserve
North Stradbroke Island Capital
301
2,141
718
1,273
150
Works
Upgrade Forts walking track including
318
400
50
350
safety rails at Magnetic Island
National Park ePermit camping signage upgrade
Various
300
127
173
National Parks Estates
Upgrade Platypus walking and
312
600
38
312
250
information nodes Broken River
Eungella National Park
Blackbraes fence and fire line
315
300
200
100
upgrade Blackbraes National Park
Vessel replacement - Kerra Lyn
306
5,500
1,000
4,500
Cairns whole of North Qld Marine
Region
Water quality restoration project
309
360
360
Fleays Ponds Fleays Wildlife Park
Conservation Park
Upgrade of Mt French toilets
310
400
37
363
Moogerah Peaks National Park
Capital Statement 2013-14 87
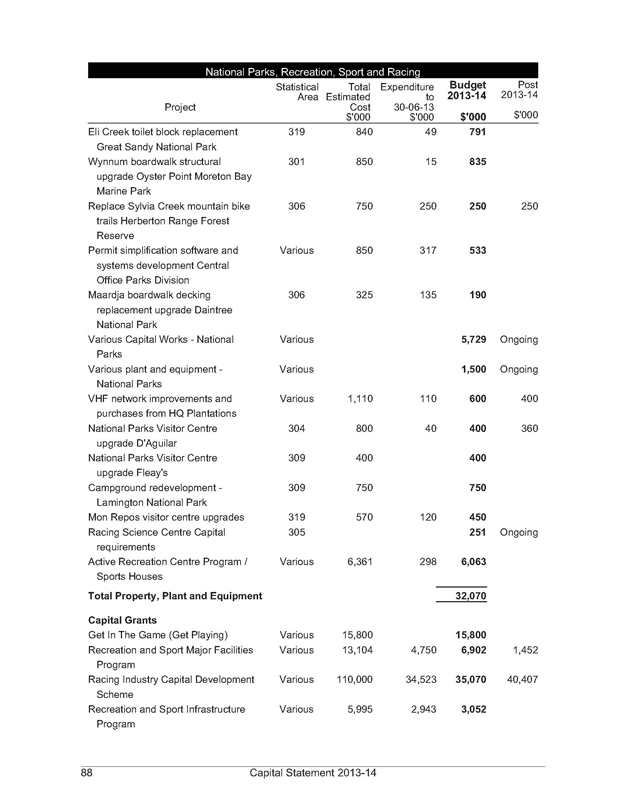
National Parks, Recreation, Sport and Racing
Project Statistical Area Total Estimated Cost $’000 Expenditure to 30-06-13 $’000 Budget 2013-14 $’000 Post 2013-14 $’000
Eli Creek toilet block replacement Great Sandy National Park 319 840 49 791
Wynnum boardwalk structural 301 850 15 835
upgrade Oyster Point Moreton Bay
Marine Park
Replace Sylvia Creek mountain bike 306 750 250 250 250
trails Herberton Range Forest
Reserve
Permit simplification software and Various 850 317 533
systems development Central
Office Parks Division
Maardja boardwalk decking 306 325 135 190
replacement upgrade Daintree
National Park
Various Capital Works - National Various 5,729 Ongoing
Parks
Various plant and equipment - Various 1,500 Ongoing
National Parks
VHF network improvements and purchases from HQ Plantations Various 1,110 110 600 400
National Parks Visitor Centre 304 800 40 400 360
upgrade D’Aguilar
National Parks Visitor Centre 309 400 400
upgrade Fleay’s
Campground redevelopment - 309 750 750
Lamington National Park
Mon Repos visitor centre upgrades 319 570 120 450
Racing Science Centre Capital 305 251 Ongoing
requirements
Active Recreation Centre Program / Various 6,361 298 6,063
Sports Houses
Total Property, Plant and Equipment 32,070
Capital Grants
Get In The Game (Get Playing) Various 15,800 15,800
Recreation and Sport Major Facilities Various 13,104 4,750 6,902 1,452
Program
Racing Industry Capital Development Various 110,000 34,523 35,070 40,407
Scheme
Recreation and Sport Infrastructure Various 5,995 2,943 3,052
Program
88 Capital Statement 2013-14
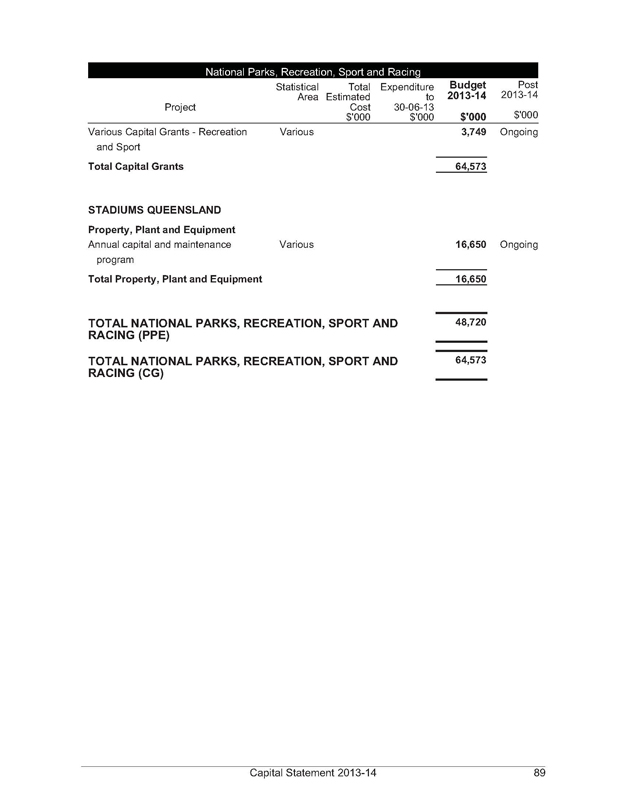
National Parks, Recreation, Sport and Racing
Project Statistical Area Total Estimated Cost $’000 Expenditure to 30-06-13 $’000 Budget 2013-14 $’000 Post 2013-14 $’000
Various Capital Grants - Recreation and Sport Various 3,749 Ongoing
Total Capital Grants 64,573
STADIUMS QUEENSLAND
Property, Plant and Equipment
Annual capital and maintenance program Various 16,650 Ongoing
Total Property, Plant and Equipment 16,650
TOTAL NATIONAL PARKS, RECREATION, SPORT AND RACING (PPE) 48,720
TOTAL NATIONAL PARKS, RECREATION, SPORT AND RACING (CG) 64,573
Capital Statement 2013-14 89
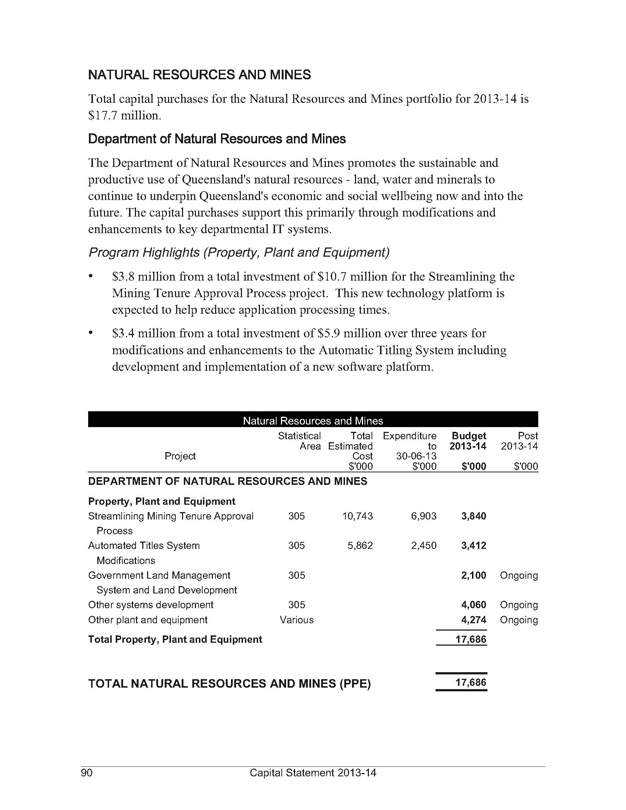
NATURAL RESOURCES AND MINES
Total capital purchases for the Natural Resources and Mines portfolio for 2013-14 is $17.7 million.
Department of Natural Resources and Mines
The Department of Natural Resources and Mines promotes the sustainable and productive use of Queensland’s natural resources - land, water and minerals to continue to underpin Queensland’s economic and social wellbeing now and into the future. The capital purchases support this primarily through modifications and enhancements to key departmental IT systems.
Program Highlights (Property, Plant and Equipment)
• $3.8 million from a total investment of $10.7 million for the Streamlining the Mining Tenure Approval Process project. This new technology platform is expected to help reduce application processing times.
• $3.4 million from a total investment of $5.9 million over three years for modifications and enhancements to the Automatic Titling System including development and implementation of a new software platform.
Natural Resources and Mines
Project Statistical Area Total Estimated Cost $’000 Expenditure to 30-06-13 $’000 Budget 2013-14 $’000 Post 2013-14 $’000
DEPARTMENT OF NATURAL RESOURCES AND MINES
Property, Plant and Equipment
Streamlining Mining Tenure Approval 305 10,743 6,903 3,840
Process
Automated Titles System 305 5,862 2,450 3,412
Modifications
Government Land Management 305 2,100 Ongoing
System and Land Development
Other systems development 305 4,060 Ongoing
Other plant and equipment Various 4,274 Ongoing
Total Property, Plant and Equipment 17,686
TOTAL NATURAL RESOURCES AND MINES (PPE) 17,686
90 Capital Statement 2013-14
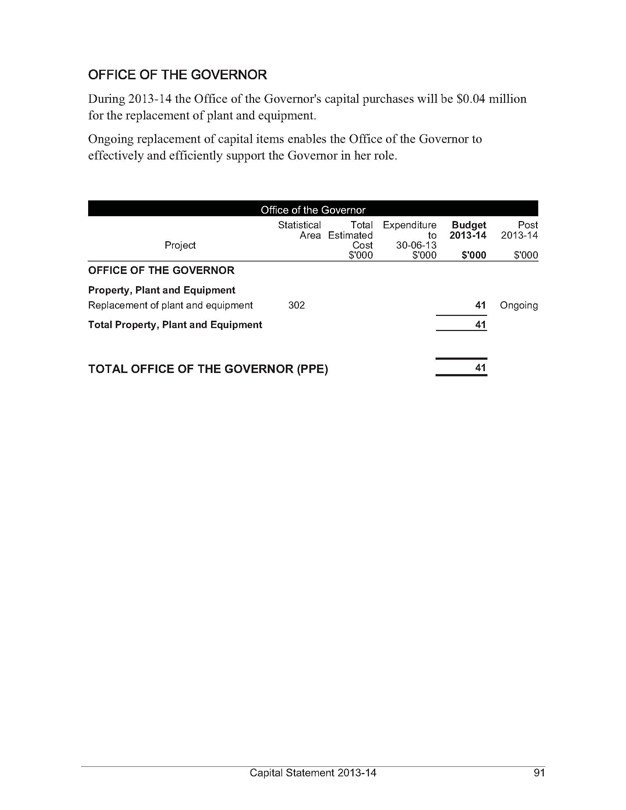
OFFICE OF THE GOVERNOR
During 2013-14 the Office of the Governor’s capital purchases will be $0.04 million for the replacement of plant and equipment.
Ongoing replacement of capital items enables the Office of the Governor to effectively and efficiently support the Governor in her role.
Office of the Governor
Project Statistical Area Total Estimated Cost $’000 Expenditure to 30-06-13 $’000 Budget 2013-14 $’000 Post 2013-14 $’000
OFFICE OF THE GOVERNOR
Property, Plant and Equipment
Replacement of plant and equipment 302 41 Ongoing
Total Property, Plant and Equipment 41
TOTAL OFFICE OF THE GOVERNOR (PPE) 41
Capital Statement 2013-14
91
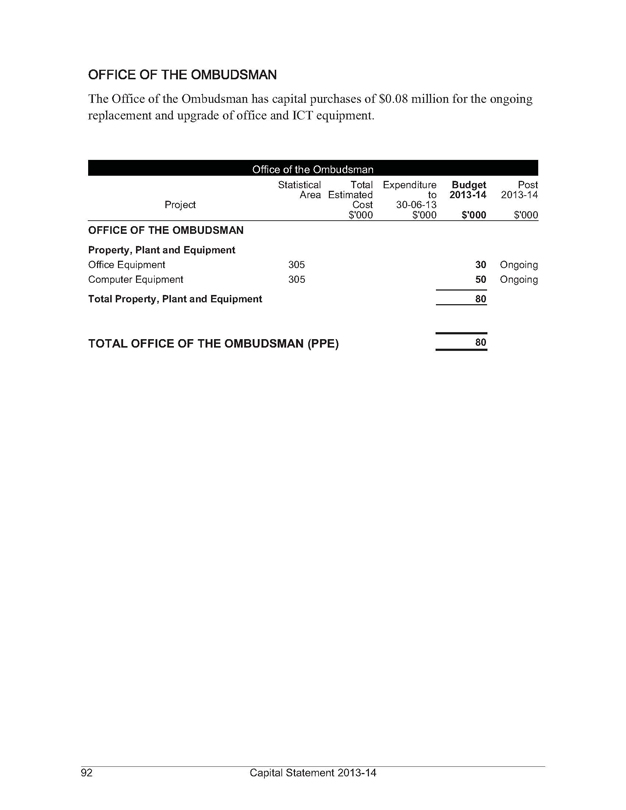
OFFICE OF THE OMBUDSMAN
The Office of the Ombudsman has capital purchases of $0.08 million for the ongoing replacement and upgrade of office and ICT equipment.
Office of the Ombudsman
Project Statistical Area Total Estimated Cost $’000 Expenditure to 30-06-13 $’000 Budget 2013-14 $’000 Post 2013-14 $’000
OFFICE OF THE OMBUDSMAN
Property, Plant and Equipment
Office Equipment 305 30 Ongoing
Computer Equipment 305 50 Ongoing
Total Property, Plant and Equipment 80
TOTAL OFFICE OF THE OMBUDSMAN (PPE) 80
92 Capital Statement 2013-14
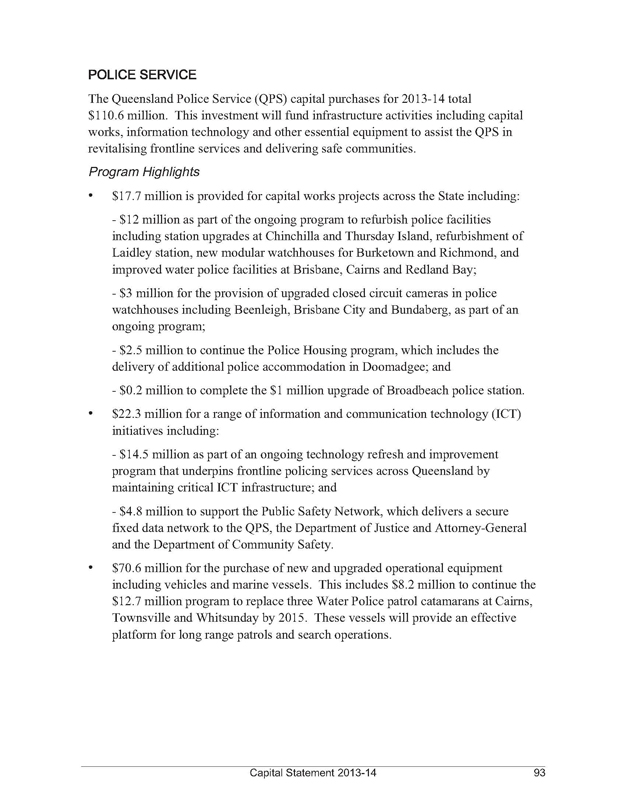
POLICE SERVICE
The Queensland Police Service (QPS) capital purchases for 2013-14 total $110.6 million. This investment will fund infrastructure activities including capital works, information technology and other essential equipment to assist the QPS in revitalising frontline services and delivering safe communities.
Program Highlights
• $17.7 million is provided for capital works projects across the State including:
- $12 million as part of the ongoing program to refurbish police facilities
including station upgrades at Chinchilla and Thursday Island, refurbishment of Laidley station, new modular watchhouses for Burketown and Richmond, and improved water police facilities at Brisbane, Cairns and Redland Bay;
- $3 million for the provision of upgraded closed circuit cameras in police
watchhouses including Beenleigh, Brisbane City and Bundaberg, as part of an ongoing program;
- $2.5 million to continue the Police Housing program, which includes the
delivery of additional police accommodation in Doomadgee; and
- $0.2 million to complete the $1 million upgrade of Broadbeach police station.
• $22.3 million for a range of information and communication technology (ICT) initiatives including:
- $14.5 million as part of an ongoing technology refresh and improvement
program that underpins frontline policing services across Queensland by maintaining critical ICT infrastructure; and
- $4.8 million to support the Public Safety Network, which delivers a secure
fixed data network to the QPS, the Department of Justice and Attorney-General and the Department of Community Safety.
• $70.6 million for the purchase of new and upgraded operational equipment including vehicles and marine vessels. This includes $8.2 million to continue the $12.7 million program to replace three Water Police patrol catamarans at Cairns, Townsville and Whitsunday by 2015. These vessels will provide an effective platform for long range patrols and search operations.
Capital Statement 2013-14 93
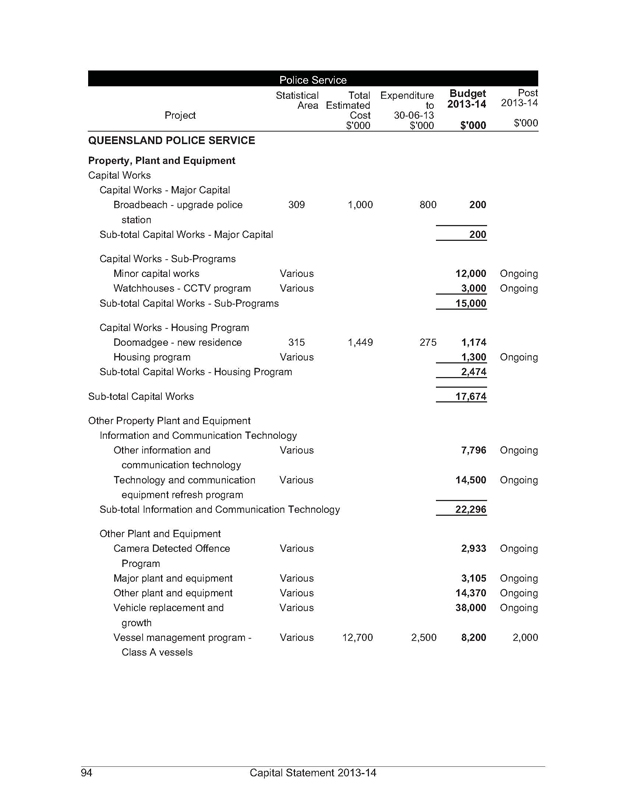
Police Service
Project Statistical Area Total Estimated Cost $’000 Expenditure to 30-06-13 $’000 Budget 2013-14 $’000 Post 2013-14 $’000
QUEENSLAND POLICE SERVICE
Property, Plant and Equipment
Capital Works
Capital Works - Major Capital
Broadbeach - upgrade police 309 1,000 800 200
station
Sub-total Capital Works - Major Capital 200
Capital Works - Sub-Programs
Minor capital works Various 12,000 Ongoing
Watchhouses - CCTV program Various 3,000 15,000 Ongoing
Sub-total Capital Works - Sub-Programs
Capital Works - Housing Program
Doomadgee - new residence 315 1,449 275 1,174
Housing program Various 1,300 Ongoing
Sub-total Capital Works - Housing Program 2,474
Sub-total Capital Works 17,674
Other Property Plant and Equipment
Information and Communication Technology
Other information and Various 7,796 Ongoing
communication technology
Technology and communication Various 14,500 Ongoing
equipment refresh program
Sub-total Information and Communication Technology 22,296
Other Plant and Equipment
Camera Detected Offence Various 2,933 Ongoing
Program
Major plant and equipment Various 3,105 Ongoing
Other plant and equipment Various 14,370 Ongoing
Vehicle replacement and Various 38,000 Ongoing
growth
Vessel management program - Various 12,700 2,500 8,200 2,000
Class A vessels
94 Capital Statement 2013-14
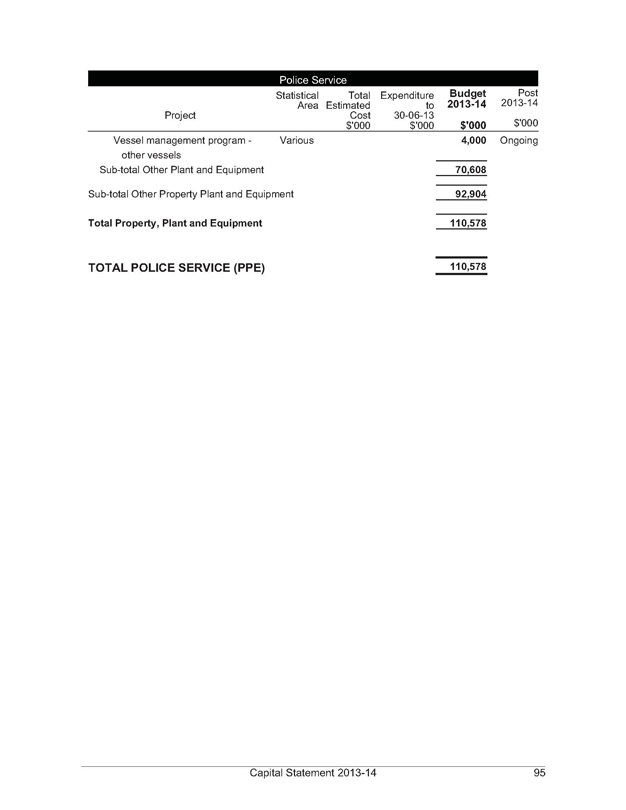
Police Service
Project Statistical Area Total Estimated Cost $’000 Expenditure to 30-06-13 $’000 Budget 2013-14 $’000 Post 2013-14 $’000
Vessel management program - Various 4,000 Ongoing
other vessels
Sub-total Other Plant and Equipment 70,608
Sub-total Other Property Plant and Equipment 92,904
Total Property, Plant and Equipment 110,578
TOTAL POLICE SERVICE (PPE) 110,578
Capital Statement 2013-14 95
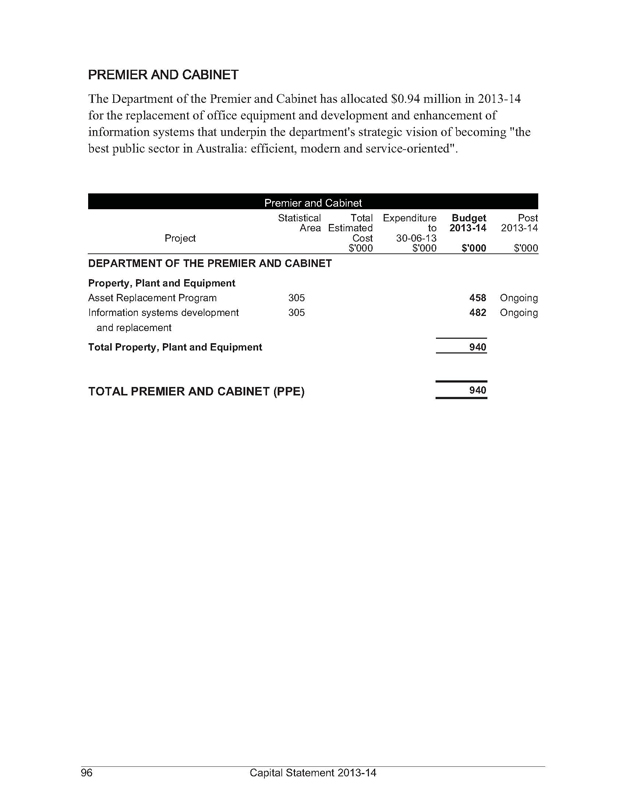
PREMIER AND CABINET
The Department of the Premier and Cabinet has allocated $0.94 million in 2013-14 for the replacement of office equipment and development and enhancement of information systems that underpin the department’s strategic vision of becoming “the best public sector in Australia: efficient, modern and service-oriented”.
Premier and Cabinet
Project Statistical Area Total Estimated Cost $’000 Expenditure to 30-06-13 $’000 Budget 2013-14 $’000 Post 2013-14 $’000
DEPARTMENT OF THE PREMIER AND CABINET
Property, Plant and Equipment
Asset Replacement Program 305 458 Ongoing
Information systems development 305 482 Ongoing
and replacement
Total Property, Plant and Equipment 940
TOTAL PREMIER AND CABINET (PPE) 940
96 Capital Statement 2013-14
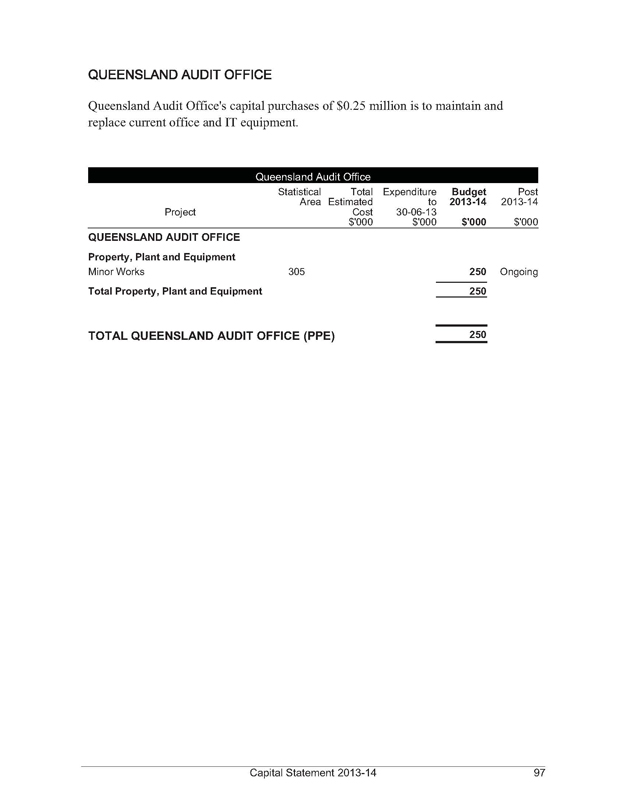
QUEENSLAND AUDIT OFFICE
Queensland Audit Office’s capital purchases of $0.25 million is to maintain and replace current office and IT equipment.
Queensland Audit Office
Project Statistical Area Total Estimated Cost $’000 Expenditure to 30-06-13 $’000 Budget 2013-14 $’000 Post 2013-14 $’000
QUEENSLAND AUDIT OFFICE
Property, Plant and Equipment
Minor Works 305 250 Ongoing
Total Property, Plant and Equipment 250
TOTAL QUEENSLAND AUDIT OFFICE (PPE) 250
Capital Statement 2013-14 97
SCIENCE, INFORMATION TECHNOLOGY, INNOVATION AND THE ARTS
In 2013-14, total capital purchases is $11.2 million and capital grants is $5.7 million for the Science, Information Technology, Innovation and the Arts portfolio including its statutory bodies, commercialised business unit and shared service providers.
Department of Science, Information Technology, Innovation and the Arts
The capital purchases and grants for the Department of Science, Information Technology, Innovation and the Arts invests in and maintains the State’s art and cultural assets, its science research facilities and equipment, and provides reliable information systems, technologies and infrastructure to support service delivery across Government and to the community.
Program Highlights (Property, Plant and Equipment)
• $2.9 million for the procurement and replacement of essential scientific equipment used for environmental and natural resource projects undertaken by the department for a wide range of Queensland Government departments.
• $2.1 million to the Library Board of Queensland for the purchase of heritage and other library collections as well as plant and equipment replacement.
• $1 million towards the installation of a supplementary lift at the Queensland Performing Arts Centre and upgrade works to the function spaces.
Program Highlights (Capital Grants)
• $5.1 million to the Australian Institute of Tropical Health and Medicine as part of the $42.1 million election commitment comprising $7.8 million in operating and $34.3 million in capital grants over 3 years. This investment by Government will support the establishment of the Institute and strengthen the State’s readiness to combat biosecurity risks.
98 Capital Statement 2013-14
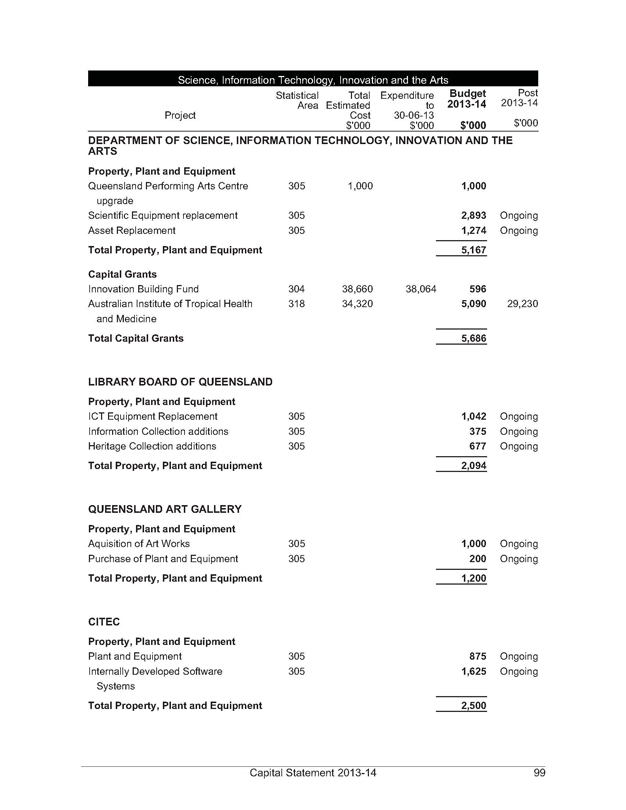
Science, Information Technology, Innovation and the Arts
Project Statistical Area Total Estimated Cost $’000 Expenditure to 30-06-13 $’000 Budget 2013-14 $’000 Post 2013-14 $’000
DEPARTMENT OF SCIENCE, INFORMATION TECHNOLOGY, INNOVATION AND THE ARTS
Property, Plant and Equipment
Queensland Performing Arts Centre 305 1,000 1,000
upgrade
Scientific Equipment replacement 305 2,893 Ongoing
Asset Replacement 305 1,274 Ongoing
Total Property, Plant and Equipment 5,167
Capital Grants
Innovation Building Fund 304 38,660 38,064 596
Australian Institute of Tropical Health 318 34,320 5,090 29,230
and Medicine
Total Capital Grants 5,686
LIBRARY BOARD OF QUEENSLAND
Property, Plant and Equipment
ICT Equipment Replacement 305 1,042 Ongoing
Information Collection additions 305 375 Ongoing
Heritage Collection additions 305 677 Ongoing
Total Property, Plant and Equipment 2,094
QUEENSLAND ART GALLERY
Property, Plant and Equipment
Aquisition of Art Works 305 1,000 Ongoing
Purchase of Plant and Equipment 305 200 Ongoing
Total Property, Plant and Equipment 1,200
CITEC
Property, Plant and Equipment
Plant and Equipment 305 875 Ongoing
Internally Developed Software 305 1,625 Ongoing
Systems
Total Property, Plant and Equipment 2,500
Capital Statement 2013-14 99
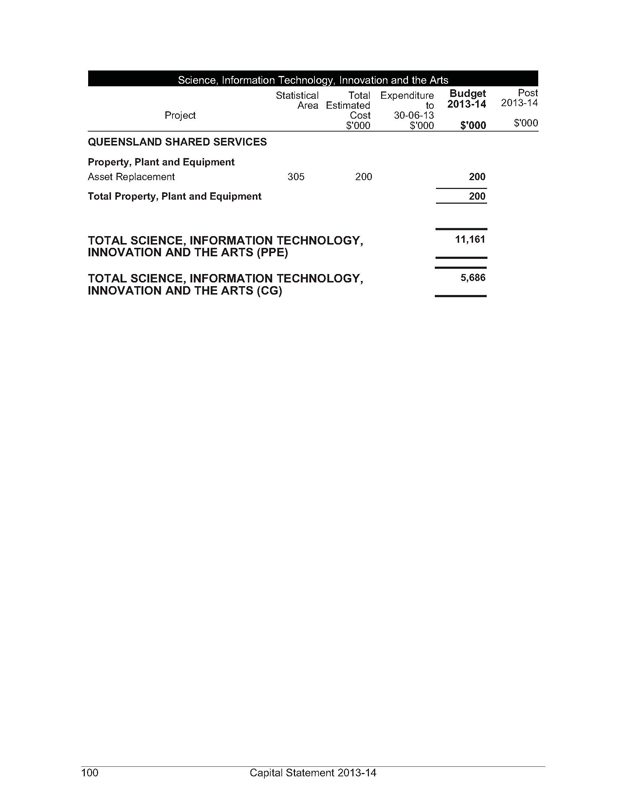
Science, Information Technology, Innovation and the Arts
Project Statistical Area Total Estimated Cost $’000 Expenditure to 30-06-13 $’000 Budget 2013-14 $’000 Post 2013-14 $’000
QUEENSLAND SHARED SERVICES
Property, Plant and Equipment
Asset Replacement 305 200 200
Total Property, Plant and Equipment 200
TOTAL SCIENCE, INFORMATION TECHNOLOGY, INNOVATION AND THE ARTS (PPE) 11,161
TOTAL SCIENCE, INFORMATION TECHNOLOGY, INNOVATION AND THE ARTS (CG) 5,686
100 Capital Statement 2013-14

STATE DEVELOPMENT, INFRASTRUCTURE AND PLANNING
In 2013-14, the State Development, Infrastructure and Planning portfolio, including the commercialised business unit, has capital purchases of $142.7 million and capital grants of $81.3 million.
Department of State Development, Infrastructure and Planning
In 2013-14, capital expenditure for the Department of State Development, Infrastructure and Planning includes capital purchases of $38.9 million and capital grants of $81.3 million to support the economic development of Queensland.
Program Highlights (Property, Plant and Equipment)
• $10.9 million for Gold Coast showground relocation.
• $5.8 million for land acquisition in the Targinie Precinct, in the Gladstone State Development Area.
• $5 million for land acquisition in the Materials Transport and Services Corridor.
• $4.2 million for land acquisition in the Surat Basin Rail Corridor.
• $4.2 million for environmental impact studies associated with future dredging of Trinity Inlet.
• $3.8 million for land acquisition in the Townsville Eastern Access Corridor.
Program Highlights (Capital Grants)
• $61 million investment in regional community, infrastructure, roads and floodplain security projects through the Royalties for the Regions Program.
• $19.1 million to meet existing commitments under the Queensland Fluoridation Assistance Program.
Economic Development Queensland
In 2013-14, Economic Development Queensland has capital purchases of $83.5 million.
Program Highlights (Property, Plant and Equipment)
• $46.1 million for early works on the Commonwealth Games Village (demolition, bulk earthworks and trunk infrastructure).
• $37.4 million for catalyst trunk infrastructure to facilitate the delivery of new satellite communities in Ripley Valley, Yarrabilba and Greater Flagstone.
Capital Statement 2013-14 101
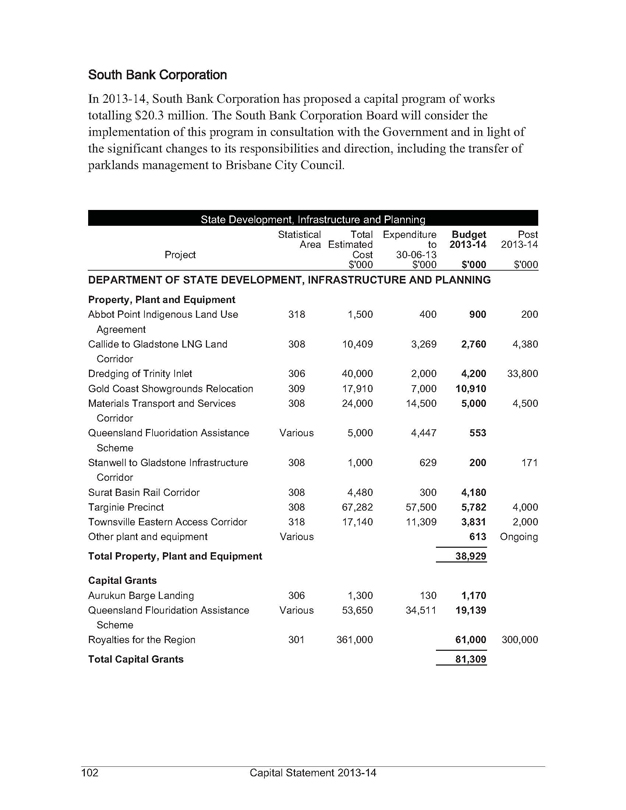
South Bank Corporation
In 2013-14, South Bank Corporation has proposed a capital program of works totalling $20.3 million. The South Bank Corporation Board will consider the implementation of this program in consultation with the Government and in light of the significant changes to its responsibilities and direction, including the transfer of parklands management to Brisbane City Council.
State Development, Infrastructure and Planning
Project Statistical Area Total Estimated Cost $’000 Expenditure to 30-06-13 $’000 Budget 2013-14 $’000 Post 2013-14 $’000
DEPARTMENT OF STATE DEVELOPMENT, INFRASTRUCTURE AND PLANNING
Property, Plant and Equipment
Abbot Point Indigenous Land Use 318 1,500 400 900 200
Agreement
Callide to Gladstone LNG Land 308 10,409 3,269 2,760 4,380
Corridor
Dredging of Trinity Inlet 306 40,000 2,000 4,200 33,800
Gold Coast Showgrounds Relocation 309 17,910 7,000 10,910
Materials Transport and Services 308 24,000 14,500 5,000 4,500
Corridor
Queensland Fluoridation Assistance Various 5,000 4,447 553
Scheme
Stanwell to Gladstone Infrastructure 308 1,000 629 200 171
Corridor
Surat Basin Rail Corridor 308 4,480 300 4,180
Targinie Precinct 308 67,282 57,500 5,782 4,000
Townsville Eastern Access Corridor 318 17,140 11,309 3,831 2,000
Other plant and equipment Various 613 Ongoing
Total Property, Plant and Equipment 38,929
Capital Grants
Aurukun Barge Landing 306 1,300 130 1,170
Queensland Flouridation Assistance Various 53,650 34,511 19,139
Scheme
Royalties for the Region 301 361,000 61,000 300,000
Total Capital Grants 81,309
102 Capital Statement 2013-14
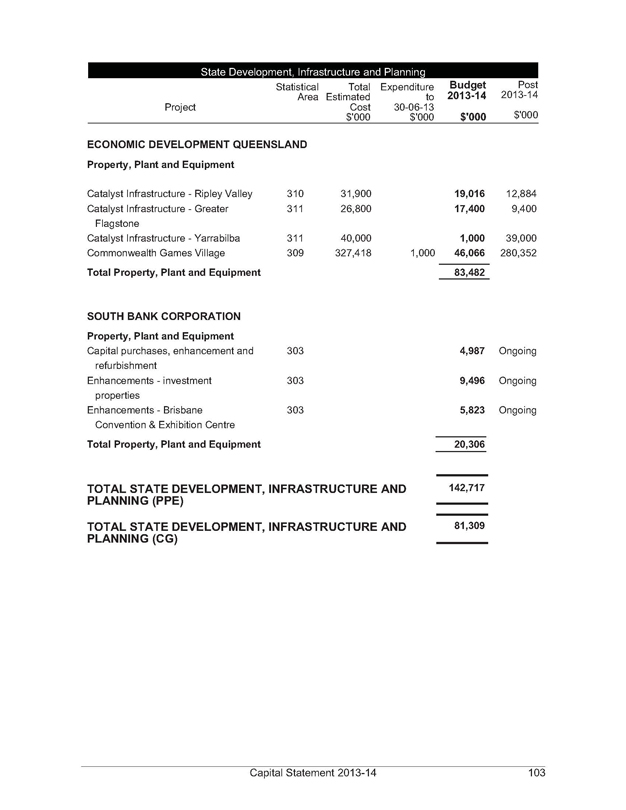
State Development, Infrastructure and Planning
Project Statistical Area Total Estimated Cost $’000 Expenditure to 30-06-13 $’000 Budget 2013-14 $’000 Post 2013-14 $’000
ECONOMIC DEVELOPMENT QUEENSLAND
Property, Plant and Equipment
Catalyst Infrastructure - Ripley Valley 310 31,900 19,016 12,884
Catalyst Infrastructure - Greater 311 26,800 17,400 9,400
Flagstone
Catalyst Infrastructure - Yarrabilba 311 40,000 1,000 39,000
Commonwealth Games Village 309 327,418 1,000 46,066 280,352
Total Property, Plant and Equipment 83,482
SOUTH BANK CORPORATION
Property, Plant and Equipment
Capital purchases, enhancement and 303 4,987 Ongoing
refurbishment
Enhancements - investment 303 9,496 Ongoing
properties
Enhancements - Brisbane 303 5,823 Ongoing
Convention & Exhibition Centre
Total Property, Plant and Equipment 20,306
TOTAL STATE DEVELOPMENT, INFRASTRUCTURE AND PLANNING (PPE) 142,717
TOTAL STATE DEVELOPMENT, INFRASTRUCTURE AND PLANNING (CG) 81,309
Capital Statement 2013-14 103
TOURISM, MAJOR EVENTS, SMALL BUSINESS AND THE COMMONWEALTH GAMES
Department of Tourism, Major Events, Small Business and the Commonwealth Games
The Department of Tourism, Major Events, Small Business and the Commonwealth Games has no capital purchases in 2013-14. Funding previously held by the department for the construction of the Commonwealth Games Village has been transferred to the Department of State Development, Infrastructure and Planning.
104 Capital Statement 2013-14
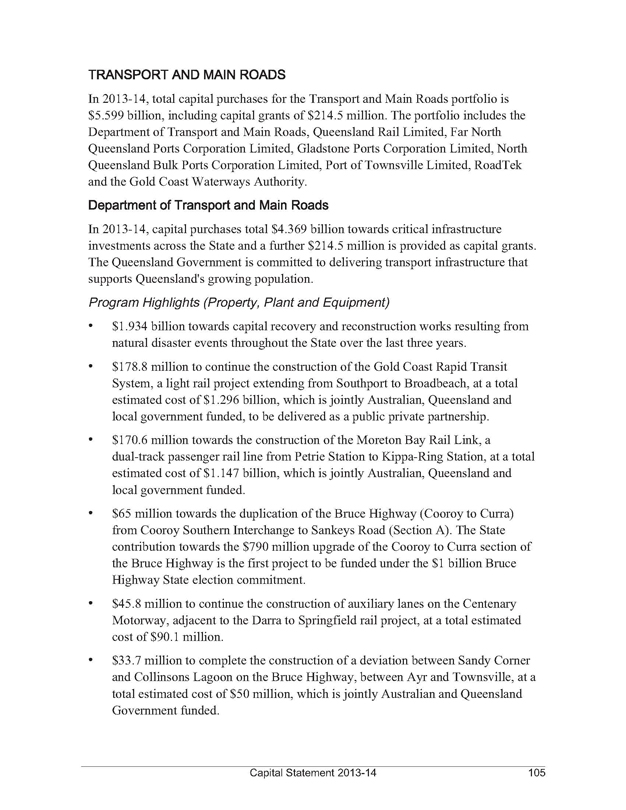
TRANSPORT AND MAIN ROADS
In 2013-14, total capital purchases for the Transport and Main Roads portfolio is $5.599 billion, including capital grants of $214.5 million. The portfolio includes the Department of Transport and Main Roads, Queensland Rail Limited, Far North Queensland Ports Corporation Limited, Gladstone Ports Corporation Limited, North Queensland Bulk Ports Corporation Limited, Port of Townsville Limited, RoadTek and the Gold Coast Waterways Authority.
Department of Transport and Main Roads
In 2013-14, capital purchases total $4.369 billion towards critical infrastructure investments across the State and a further $214.5 million is provided as capital grants. The Queensland Government is committed to delivering transport infrastructure that supports Queensland’s growing population.
Program Highlights (Property, Plant and Equipment)
• $1.934 billion towards capital recovery and reconstruction works resulting from natural disaster events throughout the State over the last three years.
• $178.8 million to continue the construction of the Gold Coast Rapid Transit System, a light rail project extending from Southport to Broadbeach, at a total estimated cost of $1.296 billion, which is jointly Australian, Queensland and local government funded, to be delivered as a public private partnership.
• $170.6 million towards the construction of the Moreton Bay Rail Link, a dual-track passenger rail line from Petrie Station to Kippa-Ring Station, at a total estimated cost of $1.147 billion, which is jointly Australian, Queensland and local government funded.
• $65 million towards the duplication of the Bruce Highway (Cooroy to Curra) from Cooroy Southern Interchange to Sankeys Road (Section A). The State contribution towards the $790 million upgrade of the Cooroy to Curra section of the Bruce Highway is the first project to be funded under the $1 billion Bruce Highway State election commitment.
• $45.8 million to continue the construction of auxiliary lanes on the Centenary Motorway, adjacent to the Darra to Springfield rail project, at a total estimated cost of $90.1 million.
• $33.7 million to complete the construction of a deviation between Sandy Corner and Collinsons Lagoon on the Bruce Highway, between Ayr and Townsville, at a total estimated cost of $50 million, which is jointly Australian and Queensland Government funded.
Capital Statement 2013-14 105
• $15.8 million to continue the extension of the South East Busway from Eight Mile Plains Station to Priestdale Road, Rochedale South, at a total estimated cost of $35.8 million.
Program Highlights (Capital Grants)
• $31.8 million of transport infrastructure development grants for upgrades to local government controlled roads.
• $54.4 million as part of the $128.4 million commitment to fund the upgrade of key rail crossings at Telegraph Road, Bracken Ridge and Robinson Road, Geebung, in partnership with Brisbane City Council.
• $22.6 million to upgrade school bus fleets across Queensland.
• $13.7 million towards the development of cycle networks throughout Queensland.
• $12.1 million to provide improvements for sites with identified safety concerns, funded under the Australian Government Black Spot program.
• $ 2.3 million as part of the $7.5 million commitment over four years towards the installation of flashing lights in school zones.
Gold Coast Waterways Authority
In 2013-14, $8.9 million is allocated to the Gold Coast Waterways Authority to oversee and improve access to Gold Coast waterways, canals and rivers.
Queensland Rail Limited
In 2013-14, $797.6 million is allocated towards capital outlays for Queensland Rail.
Program Highlights (Property, Plant and Equipment)
$151.7 million is provided to deliver new and upgrade existing rollingstock across Queensland, including:
• $110 million towards the New Generation Rollingstock program
• $30.7 million towards the Sunlander Rollingstock replacement
• $11 million towards Automatic Train Protection to prevent unsafe situations on interurban carriages.
A further $645.9 million is provided towards capital infrastructure upgrades, including:
• $68.4 million towards construction of a third track from Lawton to Petrie, at a total estimated cost of $168.6 million
106 Capital Statement 2013-14
• $50.8 million to continue construction of a 9.5 kilometre new dual rail track on the Springfield Line, from Richlands to Springfield, at a total estimated cost of $384.9 million
• $3.7 million to continue construction of a third track between Corinda and Darra, at a total estimated cost of $218 million.
Far North Queensland Ports Corporation Limited
In 2013-14, Far North Queensland Ports Corporation Limited has allocated $5.5 million towards new and continuing developments at Cairns and Horn Island.
Program Highlights (Property, Plant and Equipment)
• $2.7 million towards the Cairns Shipping Development Project, at a total estimated cost of $4.8 million.
Gladstone Ports Corporation Limited
In 2013-14, Gladstone Ports Corporation Limited has allocated $151.6 million towards ongoing development at the Port of Gladstone and additional works at the Port of Bundaberg and Port Alma.
Program Highlights (Property, Plant and Equipment)
• $50.9 million towards continuing upgrades of the RG Tanna Coal Terminal at Gladstone, at a total estimated cost of $118.6 million.
• $28.2 million to increase capacity for additional tugs, at a total estimated cost of $38.8 million.
North Queensland Bulk Ports Corporation Limited
In 2013-14, North Queensland Bulk Ports Corporation Limited has allocated $19 million for various port development projects.
Program Highlights (Property, Plant and Equipment)
• $6 million to continue development of the Hay Point Master Plan and Environmental Impact Statement.
Port of Townsville Limited
In 2013-14, Port of Townsville Limited has allocated $23.3 million towards ongoing development at the Port of Townsville and additional works at the Port of Lucinda.
Capital Statement 2013-14 107
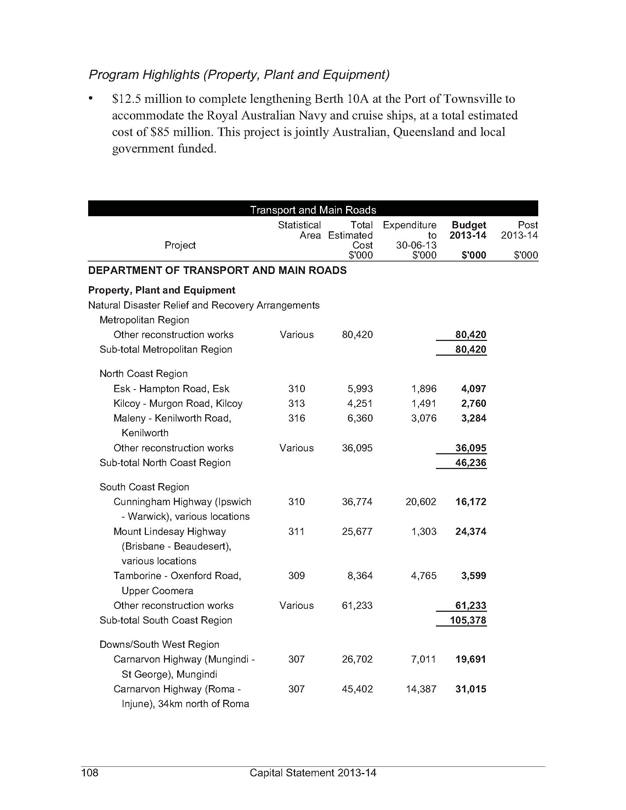
Program Highlights (Property, Plant and Equipment)
$12.5 million to complete lengthening Berth 10A at the Port of Townsville to accommodate the Royal Australian Navy and cruise ships, at a total estimated cost of $85 million. This project is jointly Australian, Queensland and local government funded.
Transport and Main Roads
Project Statistical Area Total Estimated Cost $’000 Expenditure to 30-06-13 $’000 Budget 2013-14 $’000 Post 2013-14 $’000
DEPARTMENT OF TRANSPORT AND MAIN ROADS
Property, Plant and Equipment
Natural Disaster Relief and Recovery Arrangements
Metropolitan Region
Other reconstruction works Various 80,420 80,420
Sub-total Metropolitan Region 80,420
North Coast Region
Esk - Hampton Road, Esk 310 5,993 1,896 4,097
Kilcoy - Murgon Road, Kilcoy 313 4,251 1,491 2,760
Maleny - Kenilworth Road, 316 6,360 3,076 3,284
Kenilworth
Other reconstruction works Various 36,095 36,095
Sub-total North Coast Region 46,236
South Coast Region
Cunningham Highway (Ipswich 310 36,774 20,602 16,172
- Warwick), various locations
Mount Lindesay Highway 311 25,677 1,303 24,374
(Brisbane - Beaudesert), various locations
Tamborine - Oxenford Road, 309 8,364 4,765 3,599
Upper Coomera
Other reconstruction works Various 61,233 61,233
Sub-total South Coast Region 105,378
Downs/South West Region
Carnarvon Highway (Mungindi - 307 26,702 7,011 19,691
St George), Mungindi
Carnarvon Highway (Roma - 307 45,402 14,387 31,015
Injune), 34km north of Roma
108 Capital Statement 2013-14
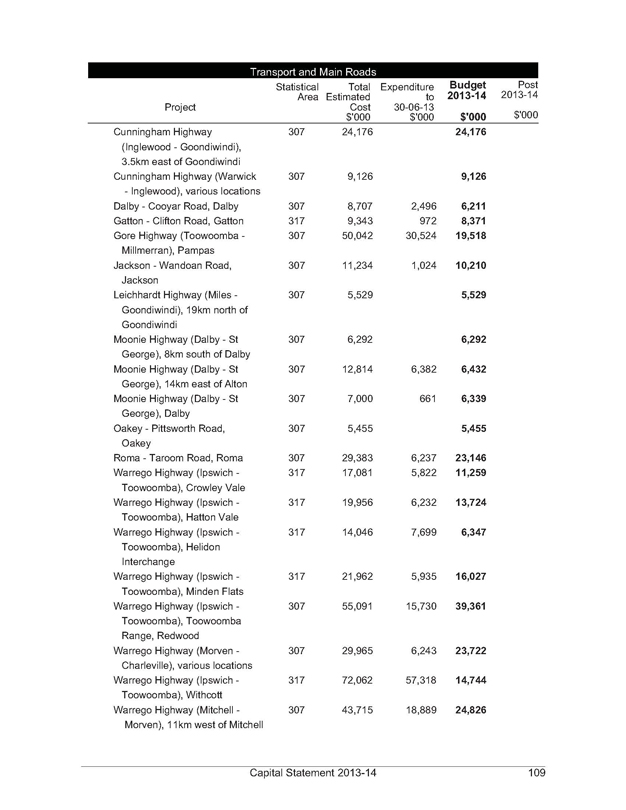
Transport and Main Roads
Project Statistical Area Total Estimated Cost $’000 Expenditure to 30-06-13 $’000 Budget 2013-14 $’000 Post 2013-14 $’000
Cunningham Highway 307 24,176 24,176
(Inglewood - Goondiwindi),
3.5km east of Goondiwindi
Cunningham Highway (Warwick 307 9,126 9,126
- Inglewood), various locations
Dalby - Cooyar Road, Dalby 307 8,707 2,496 6,211
Gatton - Clifton Road, Gatton 317 9,343 972 8,371
Gore Highway (Toowoomba - 307 50,042 30,524 19,518
Millmerran), Pampas
Jackson - Wandoan Road, 307 11,234 1,024 10,210
Jackson
Leichhardt Highway (Miles - Goondiwindi), 19km north of 307 5,529 5,529
Goondiwindi
Moonie Highway (Dalby - St 307 6,292 6,292
George), 8km south of Dalby
Moonie Highway (Dalby - St 307 12,814 6,382 6,432
George), 14km east of Alton
Moonie Highway (Dalby - St 307 7,000 661 6,339
George), Dalby
Oakey - Pittsworth Road, 307 5,455 5,455
Oakey
Roma - Taroom Road, Roma 307 29,383 6,237 23,146
Warrego Highway (Ipswich - 317 17,081 5,822 11,259
Toowoomba), Crowley Vale
Warrego Highway (Ipswich - 317 19,956 6,232 13,724
Toowoomba), Hatton Vale
Warrego Highway (Ipswich - 317 14,046 7,699 6,347
Toowoomba), Helidon
Interchange
Warrego Highway (Ipswich - 317 21,962 5,935 16,027
Toowoomba), Minden Flats
Warrego Highway (Ipswich - 307 55,091 15,730 39,361
Toowoomba), Toowoomba
Range, Redwood
Warrego Highway (Morven - 307 29,965 6,243 23,722
Charleville), various locations
Warrego Highway (Ipswich - 317 72,062 57,318 14,744
Toowoomba), Withcott
Warrego Highway (Mitchell - 307 43,715 18,889 24,826
Morven), 11km west of Mitchell
Capital Statement 2013-14 109
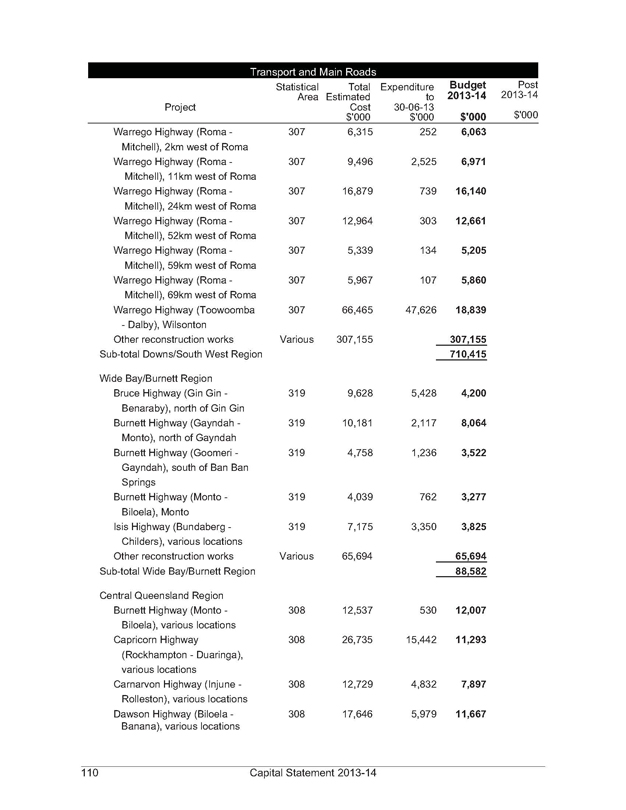
Transport and Main Roads
Project Statistical Area Total Estimated Cost $’000 Expenditure to 30-06-13 $’000 Budget 2013-14 $’000 Post 2013-14 $’000
Warrego Highway (Roma - 307 6,315 252 6,063
Mitchell), 2km west of Roma
Warrego Highway (Roma - 307 9,496 2,525 6,971
Mitchell), 11km west of Roma
Warrego Highway (Roma - 307 16,879 739 16,140
Mitchell), 24km west of Roma
Warrego Highway (Roma - 307 12,964 303 12,661
Mitchell), 52km west of Roma
Warrego Highway (Roma - 307 5,339 134 5,205
Mitchell), 59km west of Roma
Warrego Highway (Roma - 307 5,967 107 5,860
Mitchell), 69km west of Roma
Warrego Highway (Toowoomba 307 66,465 47,626 18,839
- Dalby), Wilsonton
Other reconstruction works Various 307,155 307,155
Sub-total Downs/South West Region 710,415
Wide Bay/Burnett Region
Bruce Highway (Gin Gin - Benaraby), north of Gin Gin 319 9,628 5,428 4,200
Burnett Highway (Gayndah - 319 10,181 2,117 8,064
Monto), north of Gayndah
Burnett Highway (Goomeri - 319 4,758 1,236 3,522
Gayndah), south of Ban Ban
Springs
Burnett Highway (Monto - 319 4,039 762 3,277
Biloela), Monto
Isis Highway (Bundaberg - 319 7,175 3,350 3,825
Childers), various locations
Other reconstruction works Various 65,694 65,694
Sub-total Wide Bay/Burnett Region 88,582
Central Queensland Region
Burnett Highway (Monto - 308 12,537 530 12,007
Biloela), various locations Capricorn Highway 308 26,735 15,442 11,293
(Rockhampton - Duaringa),various locations
Carnarvon Highway (Injune - 308 12,729 4,832 7,897
Rolleston), various locations
Dawson Highway (Biloela - 308 17,646 5,979 11,667
Banana), various locations
110 Capital Statement 2013-14
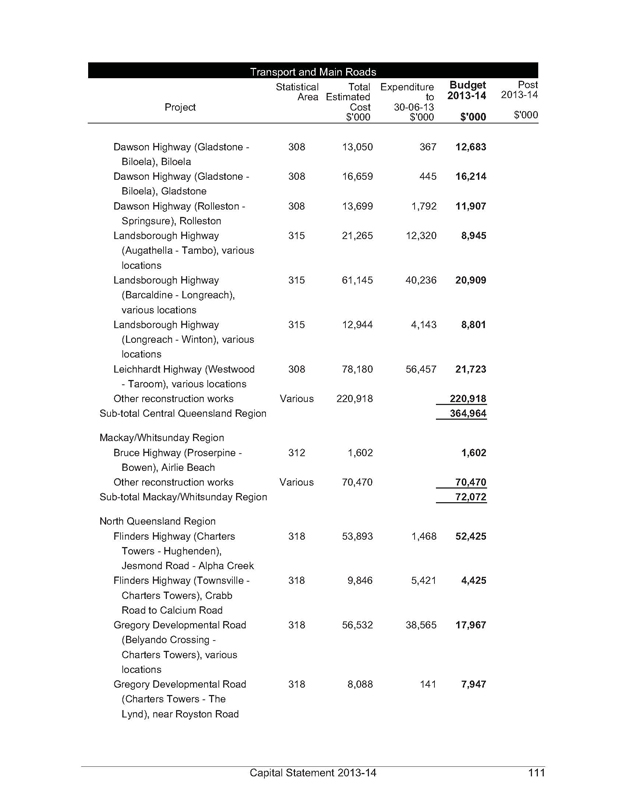
Transport and Main Roads
Project Statistical Area Total Estimated Cost $’000 Expenditure to 30-06-13 $’000 Budget 2013-14 $’000 Post 2013-14 $’000
Dawson Highway (Gladstone - Biloela), Biloela 308 13,050 367 12,683
Dawson Highway (Gladstone - 308 16,659 445 16,214
Biloela), Gladstone Dawson Highway (Rolleston - Springsure), Rolleston 308 13,699 1,792 11,907
Landsborough Highway (Augathella - Tambo), various locations 315 21,265 12,320 8,945
Landsborough Highway (Barcaldine - Longreach), various locations 315 61,145 40,236 20,909
Landsborough Highway (Longreach - Winton), various locations 315 12,944 4,143 8,801
Leichhardt Highway (Westwood - Taroom), various locations 308 78,180 56,457 21,723
Other reconstruction works Various 220,918 220,918
Sub-total Central Queensland Region 364,964
Mackay/Whitsunday Region
Bruce Highway (Proserpine - Bowen), Airlie Beach 312 1,602 1,602
Other reconstruction works Various 70,470 70,470
Sub-total Mackay/Whitsunday Region 72,072
North Queensland Region
Flinders Highway (Charters Towers - Hughenden), Jesmond Road - Alpha Creek 318 53,893 1,468 52,425
Flinders Highway (Townsville - Charters Towers), Crabb Road to Calcium Road 318 9,846 5,421 4,425
Gregory Developmental Road (Belyando Crossing - Charters Towers), various locations 318 56,532 38,565 17,967
Gregory Developmental Road (Charters Towers - The Lynd), near Royston Road 318 8,088 141 7,947
Capital Statement 2013-14 111
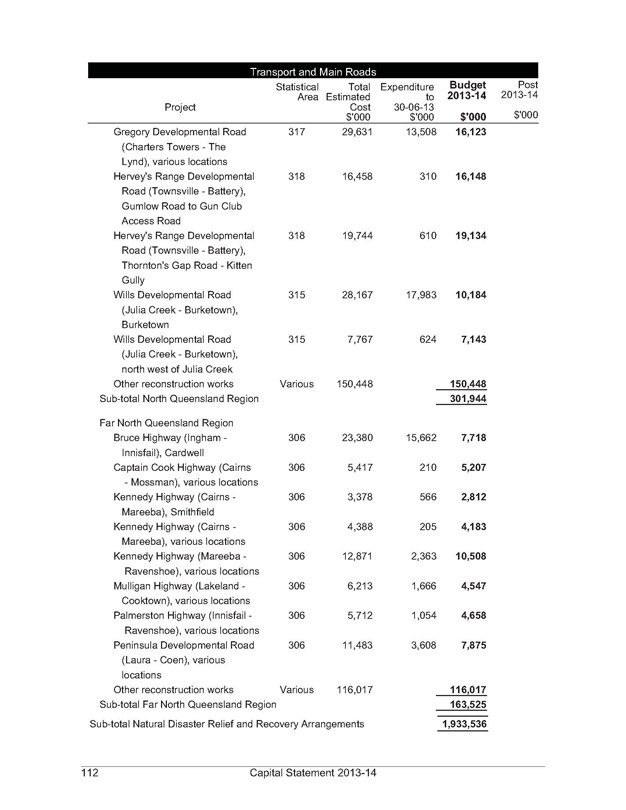
Transport and Main Roads
Project Statistical Area Total Estimated Cost $’000 Expenditure to 30-06-13 $’000 Budget 2013-14 $’000 Post 2013-14 $’000
Gregory Developmental Road (Charters Towers - The Lynd), various locations 317 29,631 13,508 16,123
Hervey’s Range Developmental Road (Townsville - Battery), Gumlow Road to Gun Club Access Road 318 16,458 310 16,148
Hervey’s Range Developmental Road (Townsville - Battery), Thornton’s Gap Road - Kitten Gully 318 19,744 610 19,134
Wills Developmental Road (Julia Creek - Burketown), Burketown 315 28,167 17,983 10,184
Wills Developmental Road (Julia Creek - Burketown), north west of Julia Creek 315 7,767 624 7,143
Other reconstruction works Various 150,448 150,448
Sub-total North Queensland Region 301,944
Far North Queensland Region
Bruce Highway (Ingham - Innisfail), Cardwell 306 23,380 15,662 7,718
Captain Cook Highway (Cairns - Mossman), various locations 306 5,417 210 5,207
Kennedy Highway (Cairns - Mareeba), Smithfield 306 3,378 566 2,812
Kennedy Highway (Cairns - Mareeba), various locations 306 4,388 205 4,183
Kennedy Highway (Mareeba - Ravenshoe), various locations 306 12,871 2,363 10,508
Mulligan Highway (Lakeland - Cooktown), various locations 306 6,213 1,666 4,547
Palmerston Highway (Innisfail - Ravenshoe), various locations 306 5,712 1,054 4,658
Peninsula Developmental Road (Laura - Coen), various locations 306 11,483 3,608 7,875
Other reconstruction works Various 116,017 116,017
Sub-total Far North Queensland Region 163,525
Sub-total Natural Disaster Relief and Recovery Arrangements 1,933,536
112 Capital Statement 2013-14
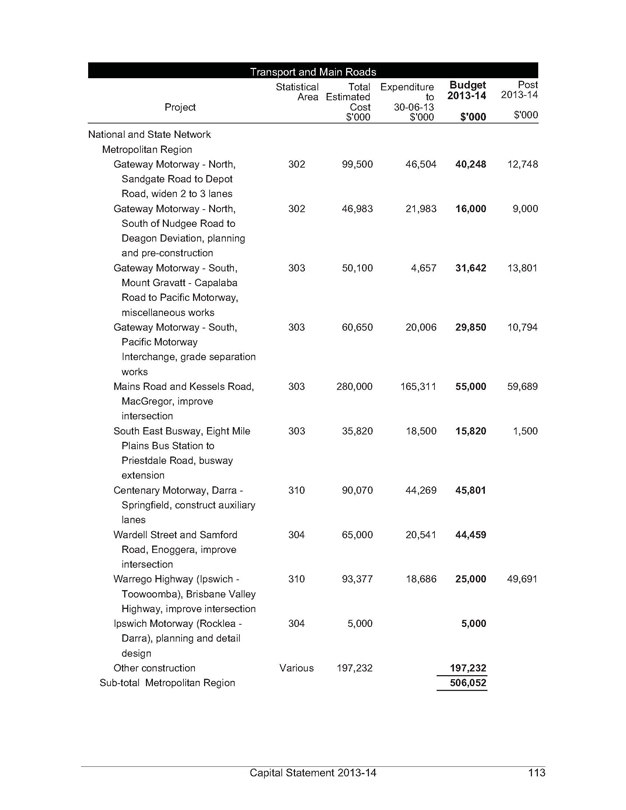
Transport and Main Roads
Project Statistical Area Total Estimated Cost $’000 Expenditure to 30-06-13 $’000 Budget 2013-14 $’000 Post 2013-14 $’000
National and State Network
Metropolitan Region
Gateway Motorway - North, 302 99,500 46,504 40,248 12,748
Sandgate Road to Depot
Road, widen 2 to 3 lanes
Gateway Motorway - North, 302 46,983 21,983 16,000 9,000
South of Nudgee Road to
Deagon Deviation, planning and pre-construction
Gateway Motorway - South, 303 50,100 4,657 31,642 13,801
Mount Gravatt - Capalaba
Road to Pacific Motorway, miscellaneous works
Gateway Motorway - South, 303 60,650 20,006 29,850 10,794
Pacific Motorway
Interchange, grade separation works
Mains Road and Kessels Road, 303 280,000 165,311 55,000 59,689
MacGregor, improve intersection South East Busway, Eight Mile 303 35,820 18,500 15,820 1,500
Plains Bus Station to
Priestdale Road, busway extension
Centenary Motorway, Darra - 310 90,070 44,269 45,801
Springfield, construct auxiliary lanes
Wardell Street and Samford 304 65,000 20,541 44,459
Road, Enoggera, improve intersection
Warrego Highway (Ipswich - 310 93,377 18,686 25,000 49,691
Toowoomba), Brisbane Valley
Highway, improve intersection
Ipswich Motorway (Rocklea - 304 5,000 5,000
Darra), planning and detail design Other construction Various 197,232 197,232
Sub-total Metropolitan Region 506,052
Capital Statement 2013-14 113
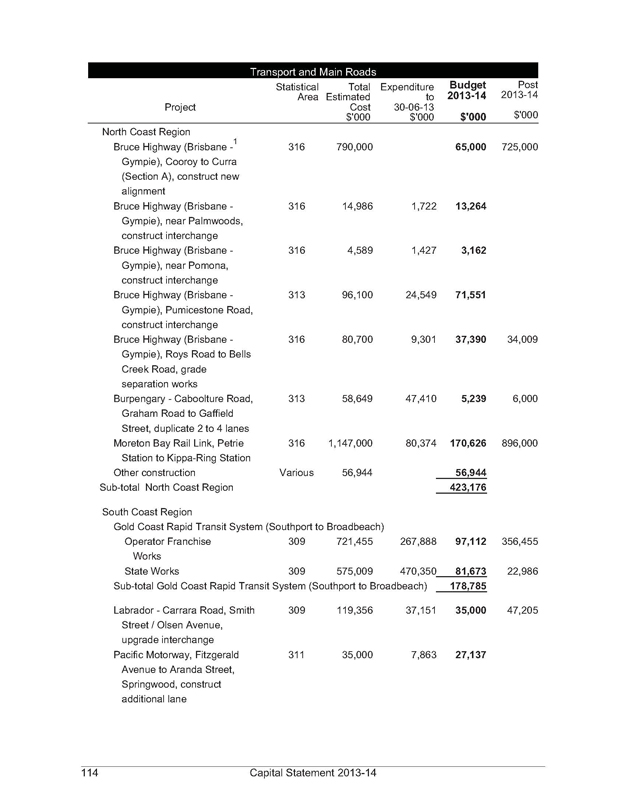
Transport and Main Roads
Project Statistical Area Total Estimated Cost $’000 Expenditure to 30-06-13 $’000 Budget 2013-14 $’000 Post 2013-14 $’000
North Coast Region
Bruce Highway (Brisbane -1 Gympie), Cooroy to Curra (Section A), construct new alignment 316 790,000 65,000 725,000
Bruce Highway (Brisbane - Gympie), near Palmwoods, construct interchange 316 14,986 1,722 13,264
Bruce Highway (Brisbane - Gympie), near Pomona, construct interchange 316 4,589 1,427 3,162
Bruce Highway (Brisbane - Gympie), Pumicestone Road, construct interchange 313 96,100 24,549 71,551
Bruce Highway (Brisbane - Gympie), Roys Road to Bells Creek Road, grade separation works 316 80,700 9,301 37,390 34,009
Burpengary - Caboolture Road, Graham Road to Gaffield Street, duplicate 2 to 4 lanes 313 58,649 47,410 5,239 6,000
Moreton Bay Rail Link, Petrie Station to Kippa-Ring Station 316 1,147,000 80,374 170,626 896,000
Other construction Various 56,944 56,944
Sub-total North Coast Region 423,176
South Coast Region Gold Coast Rapid Transit System (Southport to Broadbeach)
Operator Franchise Works 309 721,455 267,888 97,112 356,455
State Works 309 575,009 470,350 81,673 22,986
Sub-total Gold Coast Rapid Transit System (Southport to Broadbeach) 178,785
Labrador - Carrara Road, Smith Street / Olsen Avenue, upgrade interchange 309 119,356 37,151 35,000 47,205
Pacific Motorway, Fitzgerald Avenue to Aranda Street, Springwood, construct additional lane 311 35,000 7,863 27,137
114 Capital Statement 2013-14
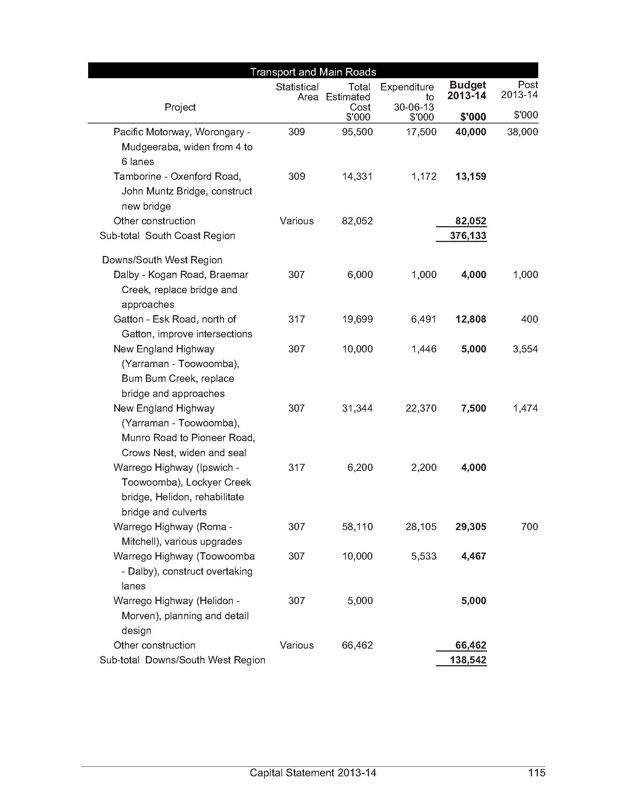
Transport and Main Roads
Project Statistical Area Total Estimated Cost $’000 Expenditure to 30-06-13 $’000 Budget 2013-14 $’000 Post 2013-14 $’000
Pacific Motorway, Worongary - Mudgeeraba, widen from 4 to 6 lanes 309 95,500 17,500 40,000 38,000
Tamborine - Oxenford Road, John Muntz Bridge, construct new bridge 309 14,331 1,172 13,159
Other construction Various 82,052 82,052
Sub-total South Coast Region 376,133
Downs/South West Region
Dalby - Kogan Road, Braemar Creek, replace bridge and approaches 307 6,000 1,000 4,000 1,000
Gatton - Esk Road, north of Gatton, improve intersections 317 19,699 6,491 12,808 400
New England Highway (Yarraman - Toowoomba), Bum Bum Creek, replace bridge and approaches 307 10,000 1,446 5,000 3,554
New England Highway (Yarraman - Toowoomba), Munro Road to Pioneer Road, Crows Nest, widen and seal 307 31,344 22,370 7,500 1,474
Warrego Highway (Ipswich - Toowoomba), Lockyer Creek bridge, Helidon, rehabilitate bridge and culverts 317 6,200 2,200 4,000
Warrego Highway (Roma - Mitchell), various upgrades 307 58,110 28,105 29,305 700
Warrego Highway (Toowoomba - Dalby), construct overtaking lanes 307 10,000 5,533 4,467
Warrego Highway (Helidon - Morven), planning and detail design 307 5,000 5,000
Other construction Various 66,462 66,462
Sub-total Downs/South West Region 138,542
Capital Statement 2013-14 115
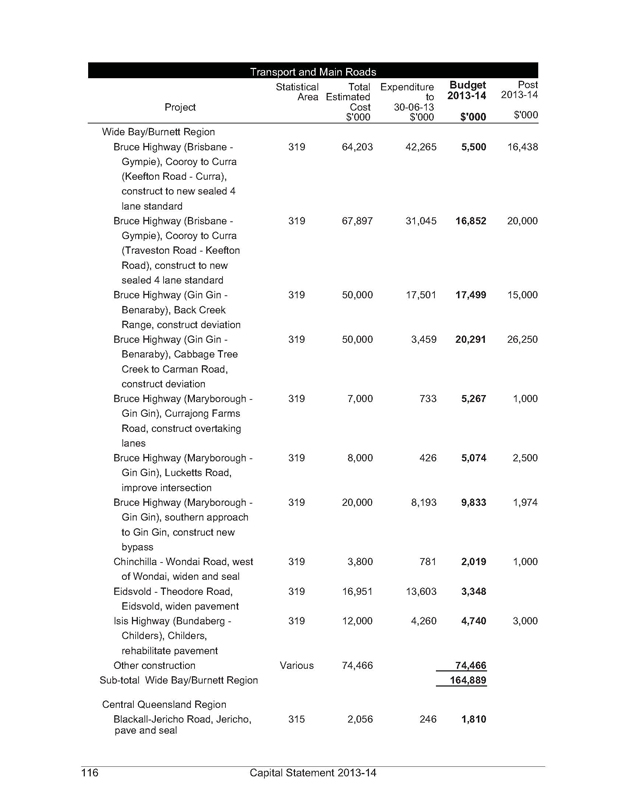
Transport and Main Roads
Project Statistical Area Total Estimated Cost $’000 Expenditure to 30-06-13 $’000 Budget 2013-14 $’000 Post 2013-14 $’000
Wide Bay/Burnett Region
Bruce Highway (Brisbane - Gympie), Cooroy to Curra (Keefton Road - Curra), construct to new sealed 4 lane standard 319 64,203 42,265 5,500 16,438
Bruce Highway (Brisbane - Gympie), Cooroy to Curra (Traveston Road - Keefton Road), construct to new sealed 4 lane standard 319 67,897 31,045 16,852 20,000
Bruce Highway (Gin Gin - Benaraby), Back Creek Range, construct deviation 319 50,000 17,501 17,499 15,000
Bruce Highway (Gin Gin - Benaraby), Cabbage Tree Creek to Carman Road, construct deviation 319 50,000 3,459 20,291 26,250
Bruce Highway (Maryborough - Gin Gin), Currajong Farms Road, construct overtaking lanes 319 7,000 733 5,267 1,000
Bruce Highway (Maryborough - Gin Gin), Lucketts Road, improve intersection 319 8,000 426 5,074 2,500
Bruce Highway (Maryborough - Gin Gin), southern approach to Gin Gin, construct new bypass 319 20,000 8,193 9,833 1,974
Chinchilla - Wondai Road, west of Wondai, widen and seal 319 3,800 781 2,019 1,000
Eidsvold - Theodore Road, Eidsvold, widen pavement 319 16,951 13,603 3,348
Isis Highway (Bundaberg - Childers), Childers, rehabilitate pavement 319 12,000 4,260 4,740 3,000
Other construction Various 74,466 74,466
Sub-total Wide Bay/Burnett Region 164,889
Central Queensland Region
Blackall-Jericho Road, Jericho, pave and seal 315 2,056 246 1,810
116 Capital Statement 2013-14
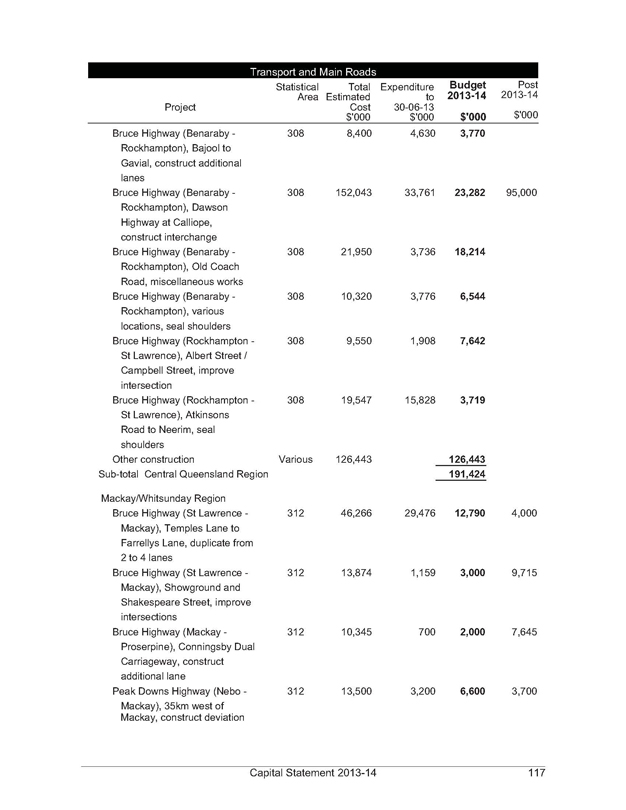
Transport and Main Roads
Project Statistical Area Total Estimated Cost $’000 Expenditure to 30-06-13 $’000 Budget 2013-14 $’000 Post 2013-14 $’000
Bruce Highway (Benaraby - Rockhampton), Bajool to Gavial, construct additional lanes 308 8,400 4,630 3,770
Bruce Highway (Benaraby - 308 152,043 33,761 23,282 95,000
Rockhampton), Dawson Highway at Calliope, construct interchange
Bruce Highway (Benaraby - Rockhampton), Old Coach Road, miscellaneous works 308 21,950 3,736 18,214
Bruce Highway (Benaraby - Rockhampton), various locations, seal shoulders 308 10,320 3,776 6,544
Bruce Highway (Rockhampton - St Lawrence), Albert Street / Campbell Street, improve intersection 308 9,550 1,908 7,642
Bruce Highway (Rockhampton - St Lawrence), Atkinsons Road to Neerim, seal shoulders 308 19,547 15,828 3,719
Other construction Various 126,443 126,443
Sub-total Central Queensland Region 191,424
Mackay/Whitsunday Region
Bruce Highway (St Lawrence - Mackay), Temples Lane to Farrellys Lane, duplicate from 2 to 4 lanes 312 46,266 29,476 12,790 4,000
Bruce Highway (St Lawrence - Mackay), Showground and Shakespeare Street, improve intersections 312 13,874 1,159 3,000 9,715
Bruce Highway (Mackay - Proserpine), Conningsby Dual Carriageway, construct additional lane 312 10,345 700 2,000 7,645
Peak Downs Highway (Nebo - Mackay), 35km west of Mackay, construct deviation 312 13,500 3,200 6,600 3,700
Capital Statement 2013-14 117
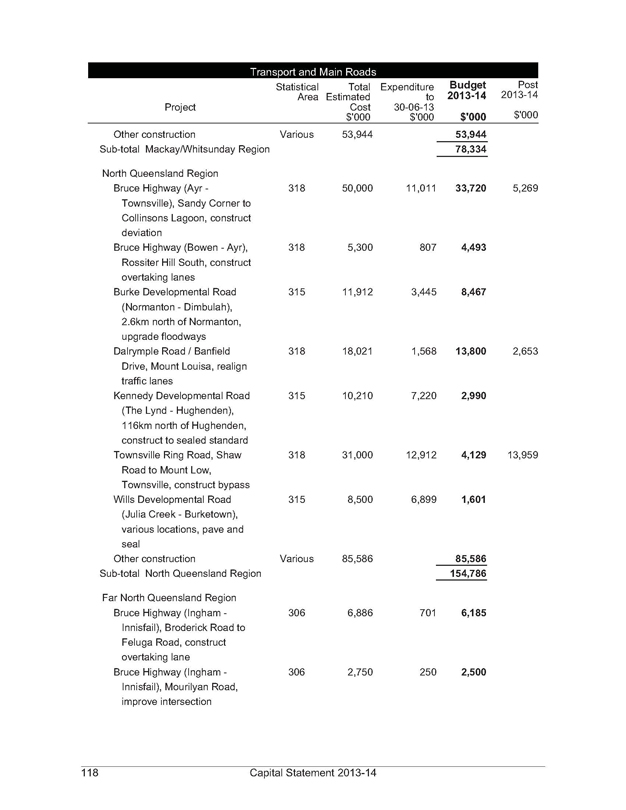
Transport and Main Roads
Project Statistical Area Total Estimated Cost $’000 Expenditure to 30-06-13 $’000 Budget 2013-14 $’000 Post 2013-14 $’000
Other construction Various 53,944 53,944
Sub-total Mackay/Whitsunday Region 78,334
North Queensland Region
Bruce Highway (Ayr - Townsville), Sandy Corner to Collinsons Lagoon, construct deviation 318 50,000 11,011 33,720 5,269
Bruce Highway (Bowen - Ayr), Rossiter Hill South, construct overtaking lanes 318 5,300 807 4,493
Burke Developmental Road (Normanton - Dimbulah), 2.6km north of Normanton, upgrade floodways 315 11,912 3,445 8,467
Dalrymple Road / Banfield Drive, Mount Louisa, realign traffic lanes 318 18,021 1,568 13,800 2,653
Kennedy Developmental Road (The Lynd - Hughenden), 116km north of Hughenden, construct to sealed standard 315 10,210 7,220 2,990
Townsville Ring Road, Shaw Road to Mount Low, Townsville, construct bypass 318 31,000 12,912 4,129 13,959
Wills Developmental Road (Julia Creek - Burketown), various locations, pave and seal 315 8,500 6,899 1,601
Other construction Various 85,586 85,586
Sub-total North Queensland Region 154,786
Far North Queensland Region
Bruce Highway (Ingham - Innisfail), Broderick Road to Feluga Road, construct overtaking lane 306 6,886 701 6,185
Bruce Highway (Ingham - Innisfail), Mourilyan Road, improve intersection 306 2,750 250 2,500
118 Capital Statement 2013-14

Transport and Main Roads
Project
Statistical Area
Total Estimated Cost $’000
Expenditure to 30-06-13 $’000
Budget 2013-14 $’000
Post 2013-14 $’000
Bruce Highway (Ingham - Innisfail), south of Dundonald Creek, construct overtaking lane
306
6,223
2,067
4,156
Bruce Highway (Innisfail - Cairns), southern approach to Cairns, grade separation works
306
150,150
107,522
42,628
Kennedy Developmental Road (The Lynd - Hughenden), Lyndhurst, construct to sealed standard
318
10,020
7,103
2,917
Kennedy Developmental Road (Mount Garnet - The Lynd), widen and seal
306
1,806
180
1,626
Other construction
Various
62,840
62,840
Sub-total Far North Queensland Region
122,852
State Wide
Boating Infrastructure Minor Works
Various
14,811
Ongoing
Passenger Transport Facilities Program
Various
51,022
Ongoing
Transport Corridor Acquisition Fund
Various
80,068
Ongoing
Other construction
Various
89,886
89,886
Sub-total State Wide
235,787
Sub-total National and State Network
2,391,975
Other Property, Plant and Equipment
Corporate Buildings
Various
14,339
Ongoing
Information Technology
Various
11,621
Ongoing
Plant and Equipment
Various
17,236
Ongoing
Sub-total Other Property, Plant and Equipment
43,196
Total Property, Plant and Equipment
4,368,707
Capital Grants
Black Spot
Various
12,078
Ongoing
Boating Capital Grants
Various
500
Ongoing
Cycle Program
Various
13,729
Ongoing
Capital Statement 2013-14
119
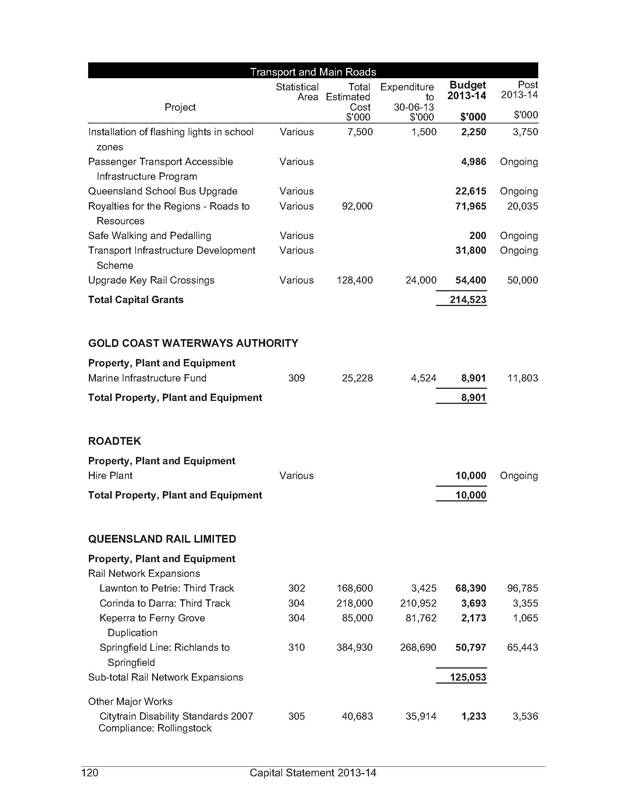
Transport and Main Roads
Project
Statistical Area
Total Estimated Cost $’000
Expenditure to 30-06-13 $’000
Budget 2013-14 $’000
Post 2013-14 $’000
Installation of flashing lights in school zones
Various
7,500
1,500
2,250
3,750
Passenger Transport Accessible Infrastructure Program
Various
4,986
Ongoing
Queensland School Bus Upgrade
Various
22,615
Ongoing
Royalties for the Regions - Roads to Resources
Various
92,000
71,965
20,035
Safe Walking and Pedalling
Various
200
Ongoing
Transport Infrastructure Development Scheme
Various
31,800
Ongoing
Upgrade Key Rail Crossings
Various
128,400
24,000
54,400
50,000
Total Capital Grants
214,523
GOLD COAST WATERWAYS AUTHORITY
Property, Plant and Equipment
Marine Infrastructure Fund
309
25,228
4,524
8,901
11,803
Total Property, Plant and Equipment
8,901
ROADTEK
Property, Plant and Equipment
Hire Plant
Various
10,000
Ongoing
Total Property, Plant and Equipment
10,000
QUEENSLAND RAIL LIMITED Property, Plant and Equipment
Rail Network Expansions
Lawnton to Petrie: Third Track
302
168,600
3,425
68,390
96,785
Corinda to Darra: Third Track
304
218,000
210,952
3,693
3,355
Keperra to Ferny Grove
304
85,000
81,762
2,173
1,065
Duplication
Springfield Line: Richlands to
310
384,930
268,690
50,797
65,443
Springfield
Sub-total Rail Network Expansions
125,053
Other Major Works
Citytrain Disability Standards 2007
305
40,683
35,914
1,233
3,536
Compliance: Rollingstock
120
Capital Statement 2013-14
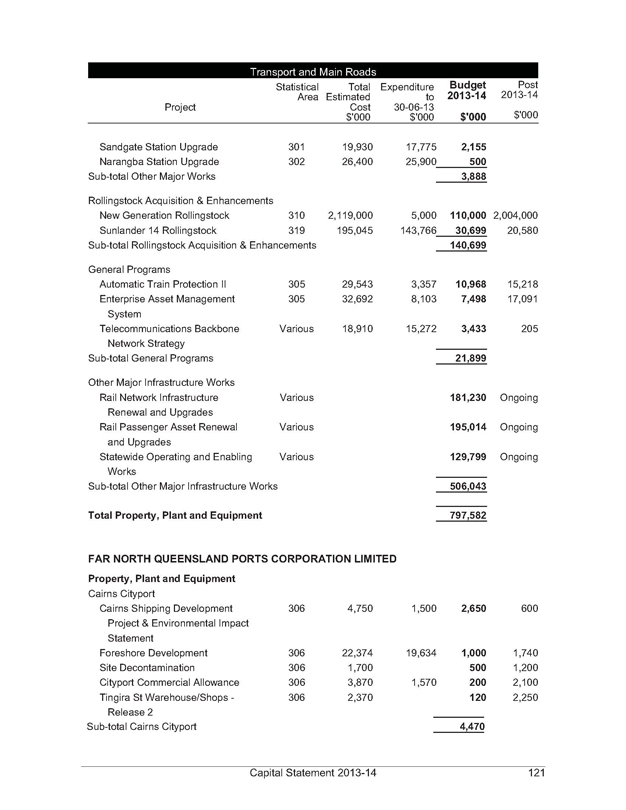
Transport and Main Roads
Project
Statistical
Area
Total
Estimated
Cost
$’000
Expenditure
to
30-06-13
$’000
Budget
2013-14
$’000
Post
2013-14
$’000
Sandgate Station Upgrade
301
19,930
17,775
2,155
Narangba Station Upgrade
302
26,400
25,900
500
Sub-total Other Major Works
3,888
Rollingstock Acquisition & Enhancements New Generation Rollingstock
310
2,119,000
5,000
110,000
2,004,000
Sunlander 14 Rollingstock
319
195,045
143,766
30,699
20,580
Sub-total Rollingstock Acquisition & Enhancements
140,699
General Programs
Automatic Train Protection II
305
29,543
3,357
10,968
15,218
Enterprise Asset Management System
305
32,692
8,103
7,498
17,091
Telecommunications Backbone Network Strategy
Various
18,910
15,272
3,433
205
Sub-total General Programs
21,899
Other Major Infrastructure Works
Rail Network Infrastructure Renewal and Upgrades
Various
181,230
Ongoing
Rail Passenger Asset Renewal and Upgrades
Various
195,014
Ongoing
Statewide Operating and Enabling Works
Various
129,799
Ongoing
Sub-total Other Major Infrastructure Works
506,043
Total Property, Plant and Equipment
797,582
FAR NORTH QUEENSLAND PORTS CORPORATION LIMITED
Property, Plant and Equipment
Cairns Cityport
Cairns Shipping Development Project & Environmental Impact Statement
306
4,750
1,500
2,650
600
Foreshore Development
306
22,374
19,634
1,000
1,740
Site Decontamination
306
1,700
500
1,200
Cityport Commercial Allowance
306
3,870
1,570
200
2,100
Tingira St Warehouse/Shops - Release 2
306
2,370
120
2,250
Sub-total Cairns Cityport
4,470
Capital Statement 2013-14
121
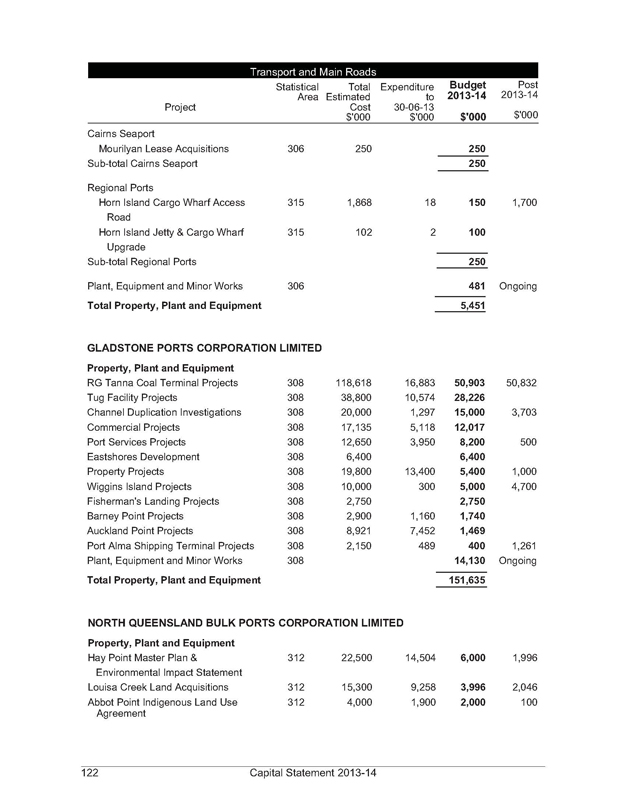
Transport and Main Roads
Project
Statistical
Area
Total
Estimated
Cost
$’000
Expenditure
to
30-06-13
$’000
Budget
2013-14
$’000
Post
2013-14
$’000
Cairns Seaport
Mourilyan Lease Acquisitions
306
250
250
Sub-total Cairns Seaport
250
Regional Ports
Horn Island Cargo Wharf Access Road
315
1,868
18
150
1,700
Horn Island Jetty & Cargo Wharf Upgrade
315
102
2
100
Sub-total Regional Ports
250
Plant, Equipment and Minor Works
306
481
Ongoing
Total Property, Plant and Equipment
5,451
GLADSTONE PORTS CORPORATION LIMITED
Property, Plant and Equipment
RG Tanna Coal Terminal Projects
308
118,618
16,883
50,903
50,832
Tug Facility Projects
308
38,800
10,574
28,226
Channel Duplication Investigations
308
20,000
1,297
15,000
3,703
Commercial Projects
308
17,135
5,118
12,017
Port Services Projects
308
12,650
3,950
8,200
500
Eastshores Development
308
6,400
6,400
Property Projects
308
19,800
13,400
5,400
1,000
Wiggins Island Projects
308
10,000
300
5,000
4,700
Fisherman’s Landing Projects
308
2,750
2,750
Barney Point Projects
308
2,900
1,160
1,740
Auckland Point Projects
308
8,921
7,452
1,469
Port Alma Shipping Terminal Projects
308
2,150
489
400
1,261
Plant, Equipment and Minor Works
308
14,130
Ongoing
Total Property, Plant and Equipment
151,635
NORTH QUEENSLAND BULK PORTS CORPORATION LIMITED
Property, Plant and Equipment
Hay Point Master Plan & Environmental Impact Statement
312
22,500
14,504
6,000
1,996
Louisa Creek Land Acquisitions
312
15,300
9,258
3,996
2,046
Abbot Point Indigenous Land Use Agreement
312
4,000
1,900
2,000
100
122
Capital Statement 2013-14
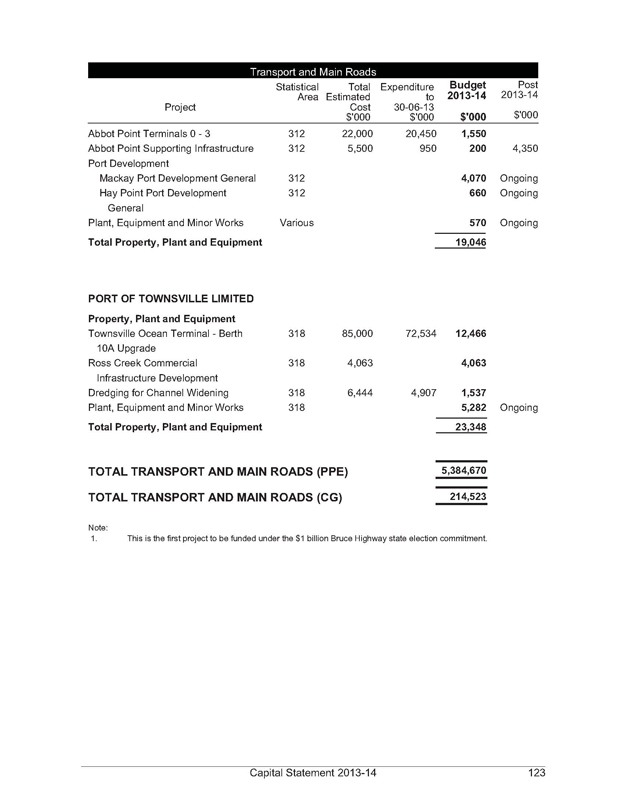
Transport and Main Roads
Project
Statistical
Area
Total
Estimated
Cost
$’000
Expenditure
to
30-06-13
$’000
Budget
2013-14
$’000
Post
2013-14
$’000
Abbot Point Terminals 0 - 3
312
22,000
20,450
1,550
Abbot Point Supporting Infrastructure Port Development
312
5,500
950
200
4,350
Mackay Port Development General
312
4,070
Ongoing
Hay Point Port Development General
312
660
Ongoing
Plant, Equipment and Minor Works
Various
570
Ongoing
Total Property, Plant and Equipment
19,046
PORT OF TOWNSVILLE LIMITED
Property, Plant and Equipment
Townsville Ocean Terminal - Berth 10A Upgrade
318
85,000
72,534
12,466
Ross Creek Commercial Infrastructure Development
318
4,063
4,063
Dredging for Channel Widening
318
6,444
4,907
1,537
Plant, Equipment and Minor Works
318
5,282
Ongoing
Total Property, Plant and Equipment
23,348
TOTAL TRANSPORT AND MAIN ROADS (PPE)
5,384,670
TOTAL TRANSPORT AND MAIN ROADS (CG)
214,523
Note:
1. This is the first project to be funded under the $1 billion Bruce Highway state election commitment.
Capital Statement 2013-14
123
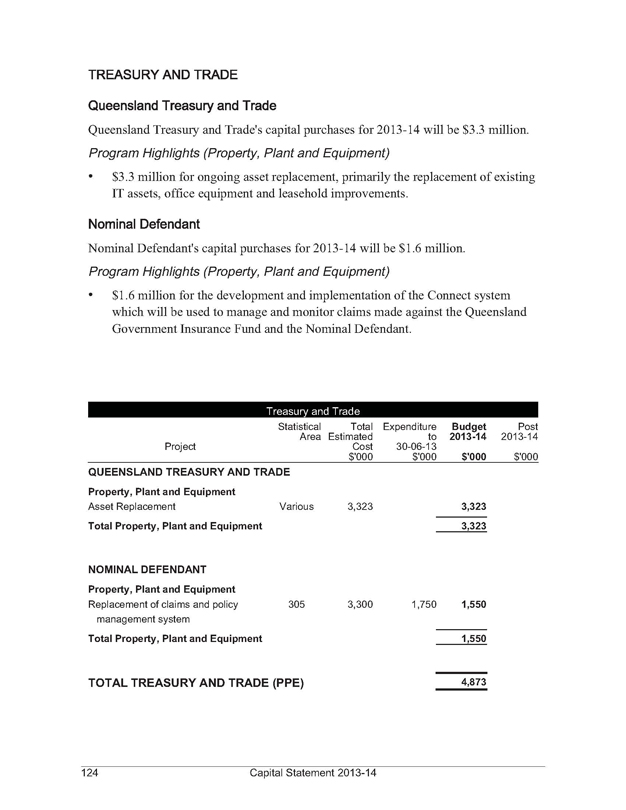
TREASURY AND TRADE
Queensland Treasury and Trade
Queensland Treasury and Trade’s capital purchases for 2013-14 will be $3.3 million.
Program Highlights (Property, Plant and Equipment)
$3.3 million for ongoing asset replacement, primarily the replacement of existing IT assets, office equipment and leasehold improvements.
Nominal Defendant
Nominal Defendant’s capital purchases for 2013-14 will be $1.6 million.
Program Highlights (Property, Plant and Equipment)
$1.6 million for the development and implementation of the Connect system which will be used to manage and monitor claims made against the Queensland Government Insurance Fund and the Nominal Defendant.
Treasury and Trade
Project
Statistical Area
Total Estimated Cost $’000
Expenditure to 30-06-13 $’000
Budget 2013-14 $’000
Post 2013-14 $’000
QUEENSLAND TREASURY AND TRADE
Property, Plant and Equipment
Asset Replacement Various 3,323 3,323
Total Property, Plant and Equipment 3,323
NOMINAL DEFENDANT
Property, Plant and Equipment
Replacement of claims and policy management system 305 3,300 1,750 1,550
Total Property, Plant and Equipment 1,550
TOTAL TREASURY AND TRADE (PPE) 4,873
124 Capital Statement 2013-14
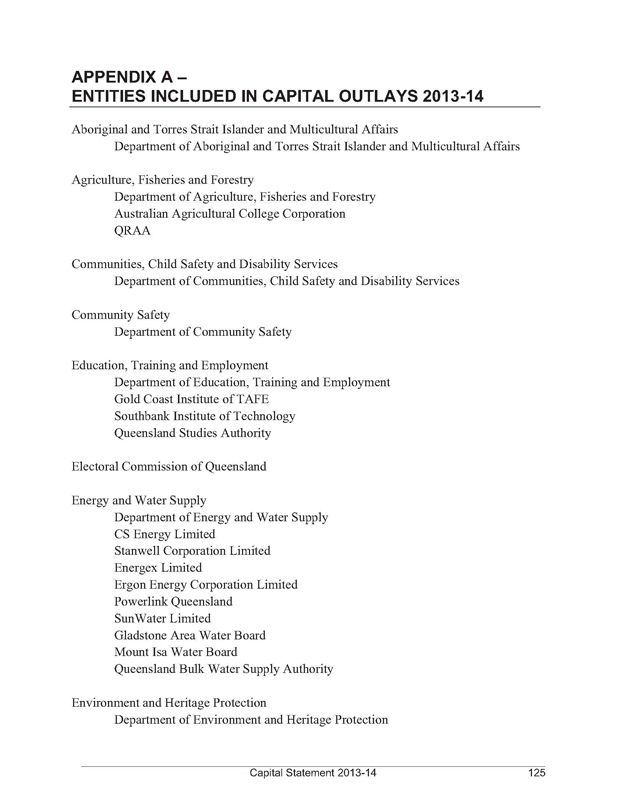
APPENDIX A –
ENTITIES INCLUDED IN CAPITAL OUTLAYS 2013-14
Aboriginal and Torres Strait Islander and Multicultural Affairs
Department of Aboriginal and Torres Strait Islander and Multicultural Affairs
Agriculture, Fisheries and Forestry
Department of Agriculture, Fisheries and Forestry
Australian Agricultural College Corporation QRAA
Communities, Child Safety and Disability Services
Department of Communities, Child Safety and Disability Services
Community Safety
Department of Community Safety
Education, Training and Employment
Department of Education, Training and Employment
Gold Coast Institute of TAFE
Southbank Institute of Technology
Queensland Studies Authority
Electoral Commission of Queensland
Energy and Water Supply
Department of Energy and Water Supply
CS Energy Limited
Stanwell Corporation Limited
Energex Limited
Ergon Energy Corporation Limited
Powerlink Queensland
SunWater Limited
Gladstone Area Water Board
Mount Isa Water Board
Queensland Bulk Water Supply Authority
Environment and Heritage Protection
Department of Environment and Heritage Protection
Capital Statement 2013-14 125
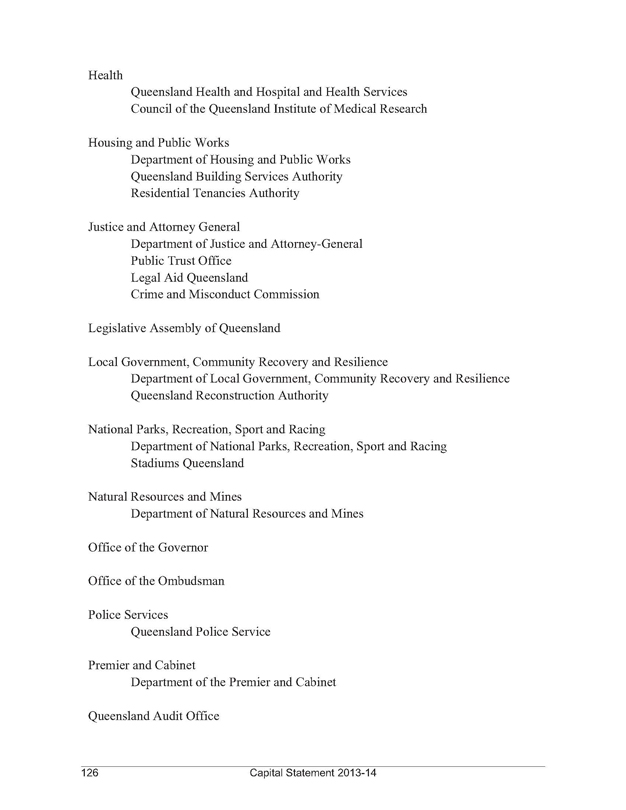
Health
Queensland Health and Hospital and Health Services
Council of the Queensland Institute of Medical Research
Housing and Public Works
Department of Housing and Public Works
Queensland Building Services Authority
Residential Tenancies Authority
Justice and Attorney General
Department of Justice and Attorney-General
Public Trust Office
Legal Aid Queensland
Crime and Misconduct Commission
Legislative Assembly of Queensland
Local Government, Community Recovery and Resilience
Department of Local Government, Community Recovery and Resilience
Queensland Reconstruction Authority
National Parks, Recreation, Sport and Racing
Department of National Parks, Recreation, Sport and Racing
Stadiums Queensland
Natural Resources and Mines
Department of Natural Resources and Mines
Office of the Governor
Office of the Ombudsman
Police Services
Queensland Police Service
Premier and Cabinet
Department of the Premier and Cabinet
Queensland Audit Office
126 Capital Statement 2013-14
Science, Information Technology, Innovation and the Arts
Department of Science, Information Technology, Innovation and the Arts
Library Board of Queensland
CITEC
Queensland Shared Services
State Development, Infrastructure and Planning
Department of State Development, Infrastructure and Planning
Economic Development Queensland
South Bank Corporation
Tourism, Major Events, Small Business and the Commonwealth Games
Department of Tourism, Major Events, Small Business and the Commonwealth Games
Transport and Main Roads
Department of Transport and Main Roads
Gold Coast Waterways Authority
RoadTek
Queensland Rail Limited
Far North Queensland Ports Corporation Limited
Gladstone Ports Corporation Limited
North Queensland Bulk Ports Corporation Limited
Port of Townsville Limited
Treasury and Trade
Queensland Treasury and Trade
Nominal Defendant
Capital Statement 2013-14 127
APPENDIX B –
KEY CONCEPTS AND COVERAGE
COVERAGE OF THE CAPITAL STATEMENT
Under accrual output budgeting, capital is the stock of assets including property, plant and equipment and intangible assets that an agency owns and/or controls and uses in the delivery of services, as well as capital grants made to other entities. The following definitions are applicable throughout this document:
• capital purchases – property, plant and equipment outlays as per the financial statements excluding asset sales, depreciation and revaluations; and
• capital grants – capital grants to other entities and individuals (excluding grants to other Government departments and statutory bodies).
Capital purchases and capital grants include information for all bodies defined as reporting entities for the purpose of whole-of-Government financial reporting requirements, excluding Public Financial Corporations. Projects without a recorded total estimated cost are ongoing. The entities included in scope for the Capital Statement are listed in Appendix A.
CAPITAL CONTINGENCY
Consistent with the approach adopted in previous years, a capital contingency reserve has been included. This reserve recognises that while agencies budget to fully use their capital works allocation, circumstances such as project lead-in times, project management constraints, unexpected weather conditions and capacity constraints such as the supply of labour and materials may prevent full usage. On a whole-of-Government basis, there is likely to be underspending, resulting in a carryover of capital allocations.
128 Capital Statement 2013-14
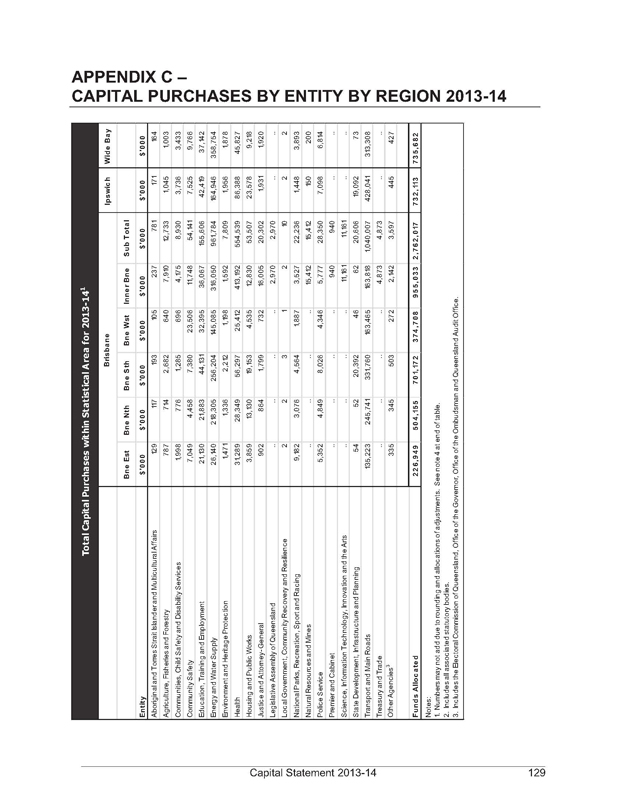
APPENDIX C –
CAPITAL PURCHASES BY ENTITY BY REGION 2013-14
Total Capital Purchases within Statistical Area for 2013-141
Brisbane
Ipswich
Wide Bay
Entity
Bne Est $’000
Bne Nth $’000
Bne Sth $’000
Bne Wst $’000
Inner Bne $’000
Sub Total $’000
$’000
$’000
Aboriginal and Torres Strait Islander and Multicultural Affairs
129
117
193
105
237
781
171
164
Agriculture, Fisheries and Forestry
787
714
2,682
640
7,910
12,733
1,045
1,003
Communities, Child Safety and Disability Services
1,998
776
1,285
696
4,175
8,930
3,736
3,433
Community Safety
7,049
4,458
7,380
23,506
11,748
54,141
7,525
9,766
Education, Training and Employment
21,130
21,883
44,131
32,395
36,067
155,606
42,419
37,142
Energy and Water Supply
26,140
218,305
256,204
145,085
316,050
961,784
164,946
358,754
Environment and Heritage Protection
1,471
1,336
2,212
1,198
1,592
7,809
1,956
1,878
Health
31,289
28,349
56,297
25,412
413,192
554,539
86,388
45,827
Housing and Public Works
3,859
13,130
19,153
4,535
12,830
53,507
23,578
9,218
Justice and Attorney-General
902
864
1,799
732
16,005
20,302
1,931
1,920
Legislative Assembly of Queensland
..
..
..
..
2,970
2,970
..
..
Local Government, Community Recovery and Resilience
2
2
3
1
2
10
2
2
National Parks, Recreation, Sport and Racing
9,182
3,076
4,564
1,887
3,527
22,236
1,448
3,893
Natural Resources and Mines
..
..
..
..
15,412
15,412
150
200
Police Service
5,352
4,849
8,026
4,346
5,777
28,350
7,098
6,814
Premier and Cabinet
..
..
..
..
940
940
..
..
Science, Information Technology, Innovation and the Arts
..
..
..
..
11,161
11,161
..
..
State Development, Infrastructure and Planning
54
52
20,392
46
62
20,606
19,092
73
Transport and Main Roads
135,223
245,741
331,760
163,465
163,818
1,040,007
428,041
313,308
Treasury and Trade
..
..
..
..
4,873
4,873
..
..
Other Agencies3
335
345
503
272
2,142
3,597
445
427
Funds Allocated
226,949
504,155
701,172
374,708
955,033
2,762,017
732,113
735,682
Notes:
1. Numbers may not add due to rounding and allocations of adjustments. See note 4 at end of table.
2. Includes all associated statutory bodies.
3. Includes the Electoral Commission of Queensland, Office of the Governor, Office of the Ombudsman and Queensland Audit Office.
Capital Statement 2013-14
129
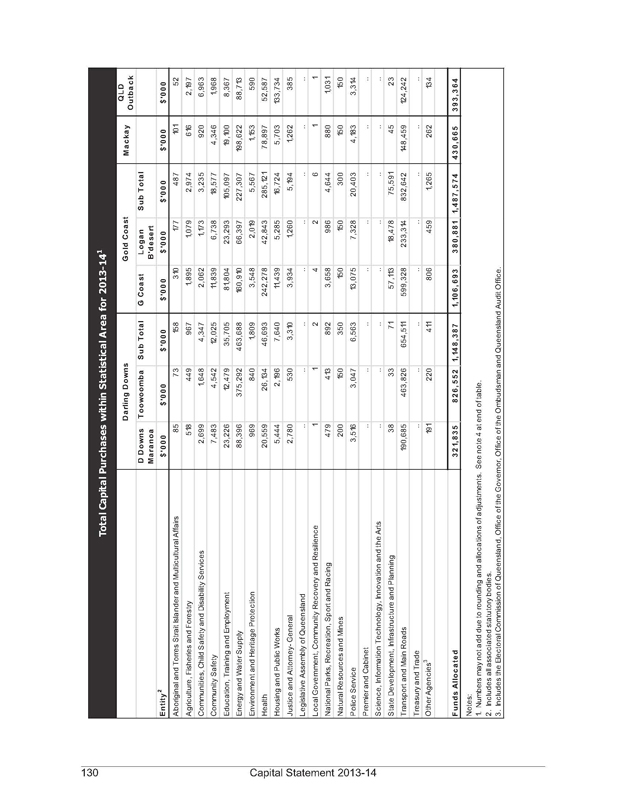
Total Capital Purchases within Statistical Area for 2013-141
Darling Downs
Gold Coast
Mackay
QLD Outback
Entity2
D Downs Maranoa $’000
Toowoomba $’000
Sub Total $’000
G Coast $’000
Logan B’desert $’000
Sub Total $’000
$’000
$’000
Aboriginal and Torres Strait Islander and Multicultural Affairs
85
73
158
310
177
487
101
52
Agriculture, Fisheries and Forestry
518
449
967
1,895
1,079
2,974
616
2,197
Communities, Child Safety and Disability Services
2,699
1,648
4,347
2,062
1,173
3,235
920
6,963
Community Safety
7,483
4,542
12,025
11,839
6,738
18,577
4,346
1,968
Education, Training and Employment
23,226
12,479
35,705
81,804
23,293
105,097
19,100
8,367
Energy and Water Supply
88,396
375,292
463,688
160,910
66,397
227,307
198,622
88,713
Environment and Heritage Protection
969
840
1,809
3,548
2,019
5,567
1,153
590
Health
20,559
26,134
46,693
242,278
42,843
285,121
78,897
52,587
Housing and Public Works
5,444
2,196
7,640
11,439
5,285
16,724
5,703
133,734
Justice and Attorney-General
2,780
530
3,310
3,934
1,260
5,194
1,262
385
Legislative Assembly of Queensland
..
..
..
..
..
..
..
..
Local Government, Community Recovery and Resilience
1
1
2
4
2
6
1
1
National Parks, Recreation, Sport and Racing
479
413
892
3,658
986
4,644
880
1,031
Natural Resources and Mines
200
150
350
150
150
300
150
150
Police Service
3,516
3,047
6,563
13,075
7,328
20,403
4,183
3,314
Premier and Cabinet
..
..
..
..
..
..
..
..
Science, Information Technology, Innovation and the Arts
..
..
..
..
..
..
..
..
State Development, Infrastructure and Planning
38
33
71
57,113
18,478
75,591
45
23
Transport and Main Roads
190,685
463,826
654,511
599,328
233,314
832,642
148,459
124,242
Treasury and Trade
..
..
..
..
..
..
..
..
Other Agencies3
191
220
411
806
459
1,265
262
134
Funds Allocated
321,835
826,552
1,148,387
1,106,693
380,881
1,487,574
430,665
393,364
Notes:
1. Numbers may not add due to rounding and allocations of adjustments. See note 4 at end of table.
2. Includes all associated statutory bodies.
3. Includes the Electoral Commission of Queensland, Office of the Governor, Office of the Ombudsman and Queensland Audit Office.
130
Capital Statement 2013-14
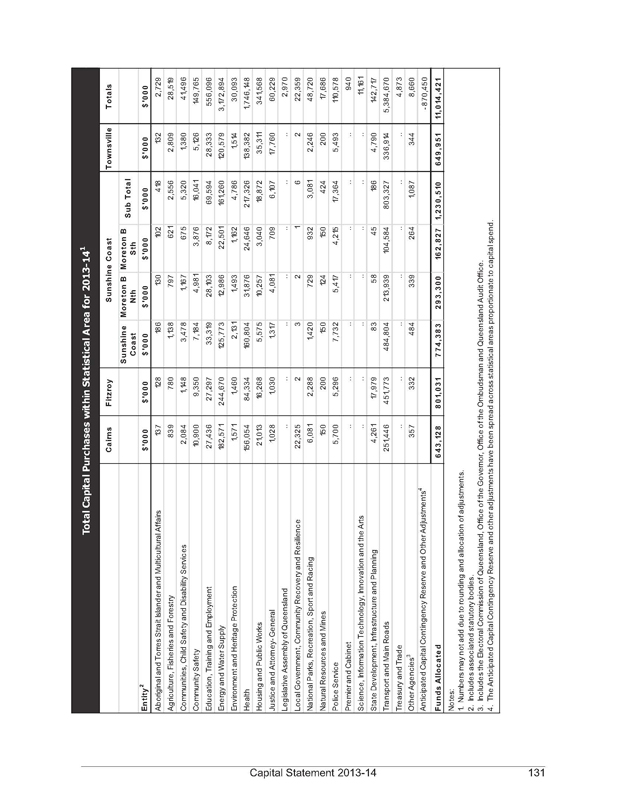
Total Capital Purchases within Statistical Area for 2013-141
Cairns
Fitzroy
Sunshine Coast
Townsville
Totals
$’000
$’000
Sunshine Coast $’000
Moreton B Nth $’000
Moreton B Sth $’000
Sub Total $’000
$’000
$’000
Entity2
Aboriginal and Torres Strait Islander and Multicultural Affairs
137
128
186
130
102
418
132
2,729
Agriculture, Fisheries and Forestry
839
780
1,138
797
621
2,556
2,809
28,519
Communities, Child Safety and Disability Services
2,084
1,148
3,478
1,167
675
5,320
1,380
41,496
Community Safety
10,900
9,350
7,184
4,981
3,876
16,041
5,126
149,765
Education, Training and Employment
27,436
27,297
33,319
28,103
8,172
69,594
28,333
556,096
Energy and Water Supply
182,571
244,670
125,773
12,986
22,501
161,260
120,579
3,172,894
Environment and Heritage Protection
1,571
1,460
2,131
1,493
1,162
4,786
1,514
30,093
Health
156,054
84,334
160,804
31,876
24,646
217,326
138,382
1,746,148
Housing and Public Works
21,013
16,268
5,575
10,257
3,040
18,872
35,311
341,568
Justice and Attorney-General
1,028
1,030
1,317
4,081
709
6,107
17,760
60,229
Legislative Assembly of Queensland
..
..
..
..
..
..
..
2,970
Local Government, Community Recovery and Resilience
22,325
2
3
2
1
6
2
22,359
National Parks, Recreation, Sport and Racing
6,081
2,288
1,420
729
932
3,081
2,246
48,720
Natural Resources and Mines
150
200
150
124
150
424
200
17,686
Police Service
5,700
5,296
7,732
5,417
4,215
17,364
5,493
110,578
Premier and Cabinet
..
..
..
..
..
..
..
940
Science, Information Technology, Innovation and the Arts
..
..
..
..
..
..
..
11,161
State Development, Infrastructure and Planning
4,261
17,979
83
58
45
186
4,790
142,717
Transport and Main Roads
251,446
451,773
484,804
213,939
104,584
803,327
336,914
5,384,670
Treasury and Trade
..
..
..
..
..
..
..
4,873
Other Agencies3
357
332
484
339
264
1,087
344
8,660
Anticipated Capital Contingency Reserve and Other Adjustments4
-870,450
Funds Allocated
643,128
801,031
774,383
293,300
162,827
1,230,510
649,951
11,014,421
Notes:
1. Numbers may not add due to rounding and allocation of adjustments.
2. Includes associated statutory bodies.
3. Includes the Electoral Commission of Queensland, Office of the Governor, Office of the Ombudsman and Queensland Audit Office.
4. The Anticipated Capital Contingency Reserve and other adjustments have been spread across statistical areas proportionate to capital spend.
Capital Statement 2013-14
131

State Budget 2013-14 Capital Statement Budget Paper No.3 www.budget.qld.gov.au

State Budget 2013–14 Capital Statement Budget Paper No.3 www.budget.qld.gov.au
State Budget 2013-14
Budget Measures
Budget Paper No.4
AUDAX AT FIDELIS
Great state. Great opportunity.
QUEENSLAND GOVERNMENT
2013-14 State Budget Papers
1. Budget Speech
2. Budget Strategy and Outlook
3. Capital Statement
4. Budget Measures
5. Service Delivery Statements
Appropriation Bills
Concessions Statement
The suite of Budget Papers is similar to that published in 2012-13. The Budget Papers are available online at www.budget.qld.gov.au
© Crown copyright
All rights reserved
Queensland Government 2013
Excerpts from this publication may be reproduced, with appropriate acknowledgement, as permitted under the Copyright Act.
Budget Measures
Budget Paper No.4
ISSN 1445-4890 (Print)
ISSN 1445-4904 (Online)
AUDAX AT FIDELIS
Queensland Government
STATE BUDGET 2013-14
BUDGET MEASURES
Budget Paper No. 4

TABLE OF CONTENTS
1. Overview 1
Introduction 1
Explanation of Scope and Terms 2
Whole of Government Measures 3
Summary Tables 6
2. Expense Measures 13
Department of Aboriginal and Torres Strait Islander and Multicultural Affairs 14
Department of Agriculture, Fisheries and Forestry 15
Department of Communities, Child Safety and Disability Services 17
Department of Community Safety 20
Department of Education, Training and Employment 21
Department of Energy and Water Supply 22
Department of Environment and Heritage Protection 23
Department of Housing and Public Works 25
Department of Justice and Attorney-General 26
Department of Local Government, Community Recovery and Resilience 29
Department of National Parks, Recreation, Sport and Racing 31
Department of Natural Resources and Mines 32
Department of Science, Information Technology, Innovation and the Arts 34
Department of State Development, Infrastructure and Planning 35
Department of the Premier and Cabinet 37
Department of Tourism, Major Events, Small Business and the Commonwealth Games 38
Department of Transport and Main Roads 39
Public Service Commission 41
Queensland Health 42
Queensland Treasury and Trade 44
3. Capital Measures 45
Department of Agriculture, Fisheries and Forestry 46
Department of Education, Training and Employment 47
Department of Housing and Public Works 48
Department of National Parks, Recreation, Sport and Racing 49
Department of Natural Resources and Mines 50
Department of Transport and Main Roads 51
Legislative Assembly of Queensland 52
Queensland Health 53
4. Revenue Measures 54
Department of Community Safety 55
Department of Justice and Attorney-General 56
Queensland Treasury and Trade 57
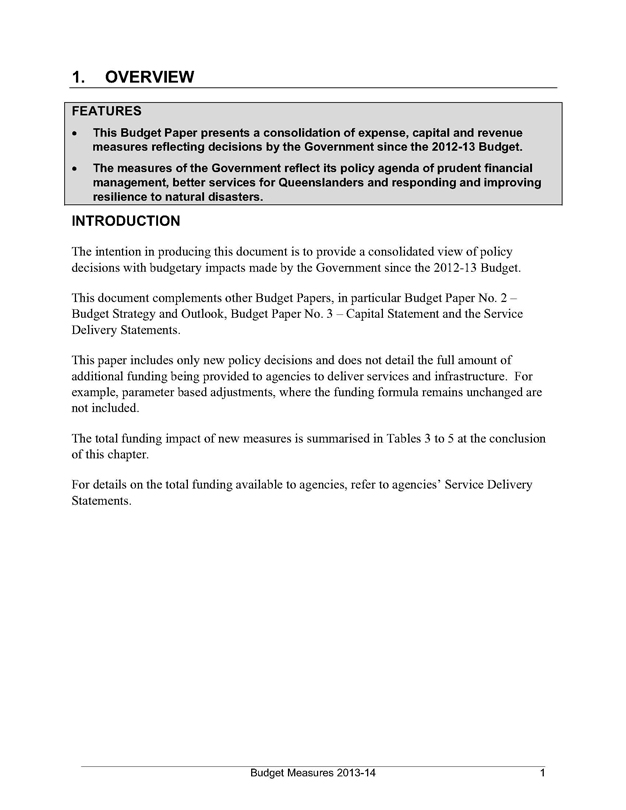
1. OVERVIEW
FEATURES
This Budget Paper presents a consolidation of expense, capital and revenue measures reflecting decisions by the Government since the 2012-13 Budget.
The measures of the Government reflect its policy agenda of prudent financial management, better services for Queenslanders and responding and improving resilience to natural disasters.
INTRODUCTION
The intention in producing this document is to provide a consolidated view of policy decisions with budgetary impacts made by the Government since the 2012-13 Budget.
This document complements other Budget Papers, in particular Budget Paper No. 2 – Budget Strategy and Outlook, Budget Paper No. 3 – Capital Statement and the Service Delivery Statements.
This paper includes only new policy decisions and does not detail the full amount of additional funding being provided to agencies to deliver services and infrastructure. For example, parameter based adjustments, where the funding formula remains unchanged are not included.
The total funding impact of new measures is summarised in Tables 3 to 5 at the conclusion of this chapter.
For details on the total funding available to agencies, refer to agencies’ Service Delivery Statements.
Budget Measures 2013-14
1
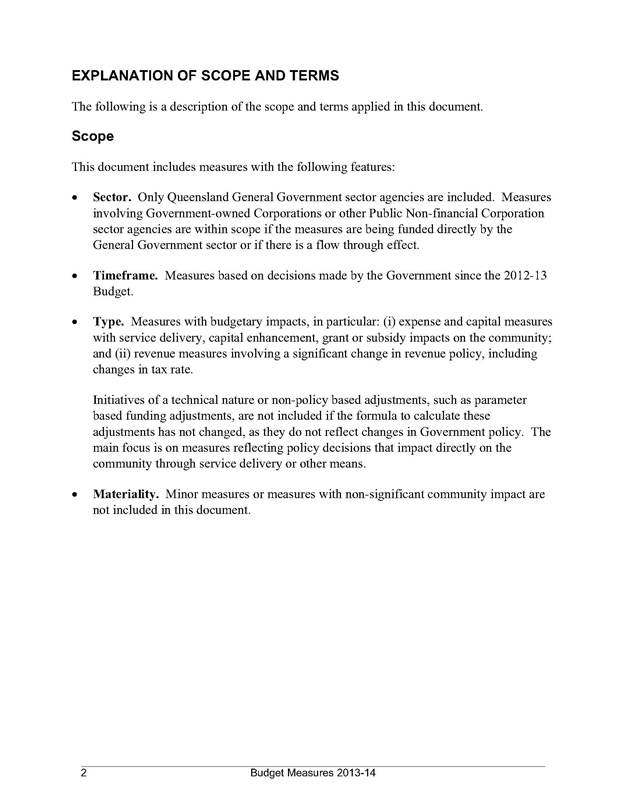
EXPLANATION OF SCOPE AND TERMS
The following is a description of the scope and terms applied in this document.
Scope
This document includes measures with the following features:
Sector. Only Queensland General Government sector agencies are included. Measures involving Government-owned Corporations or other Public Non-financial Corporation sector agencies are within scope if the measures are being funded directly by the General Government sector or if there is a flow through effect.
Timeframe. Measures based on decisions made by the Government since the 2012-13 Budget.
Type. Measures with budgetary impacts, in particular: (i) expense and capital measures with service delivery, capital enhancement, grant or subsidy impacts on the community; and (ii) revenue measures involving a significant change in revenue policy, including changes in tax rate.
Initiatives of a technical nature or non-policy based adjustments, such as parameter based funding adjustments, are not included if the formula to calculate these adjustments has not changed, as they do not reflect changes in Government policy. The main focus is on measures reflecting policy decisions that impact directly on the community through service delivery or other means.
Materiality. Minor measures or measures with non-significant community impact are not included in this document.
2 Budget Measures 2013-14
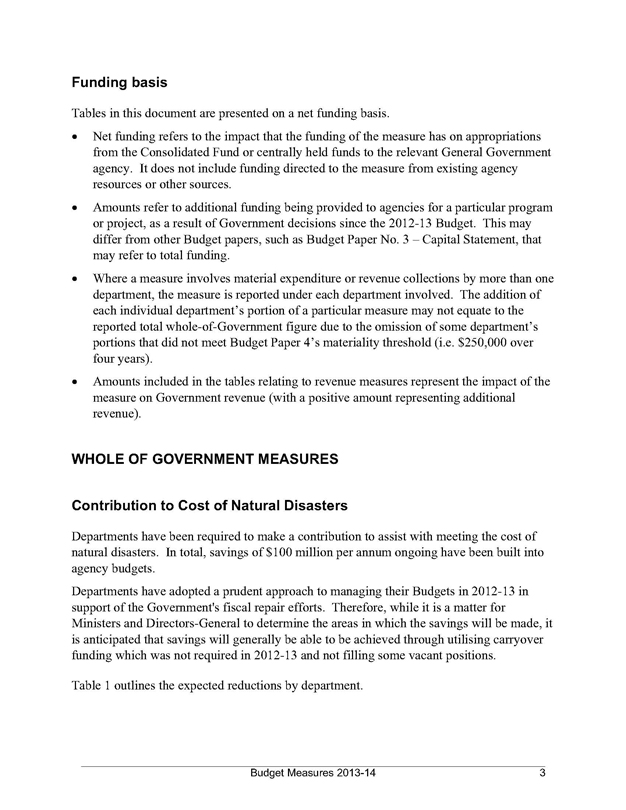
Funding basis
Tables in this document are presented on a net funding basis.
Net funding refers to the impact that the funding of the measure has on appropriations from the Consolidated Fund or centrally held funds to the relevant General Government agency. It does not include funding directed to the measure from existing agency resources or other sources.
Amounts refer to additional funding being provided to agencies for a particular program or project, as a result of Government decisions since the 2012-13 Budget. This may differ from other Budget papers, such as Budget Paper No. 3 – Capital Statement, that may refer to total funding.
Where a measure involves material expenditure or revenue collections by more than one department, the measure is reported under each department involved. The addition of each individual department’s portion of a particular measure may not equate to the reported total whole-of-Government figure due to the omission of some department’s portions that did not meet Budget Paper 4’s materiality threshold (i.e. $250,000 over four years).
Amounts included in the tables relating to revenue measures represent the impact of the measure on Government revenue (with a positive amount representing additional revenue).
WHOLE OF GOVERNMENT MEASURES
Contribution to Cost of Natural Disasters
Departments have been required to make a contribution to assist with meeting the cost of natural disasters. In total, savings of $100 million per annum ongoing have been built into agency budgets.
Departments have adopted a prudent approach to managing their Budgets in 2012-13 in support of the Government’s fiscal repair efforts. Therefore, while it is a matter for Ministers and Directors-General to determine the areas in which the savings will be made, it is anticipated that savings will generally be able to be achieved through utilising carryover funding which was not required in 2012-13 and not filling some vacant positions.
Table 1 outlines the expected reductions by department.
Budget Measures 2013-14
3
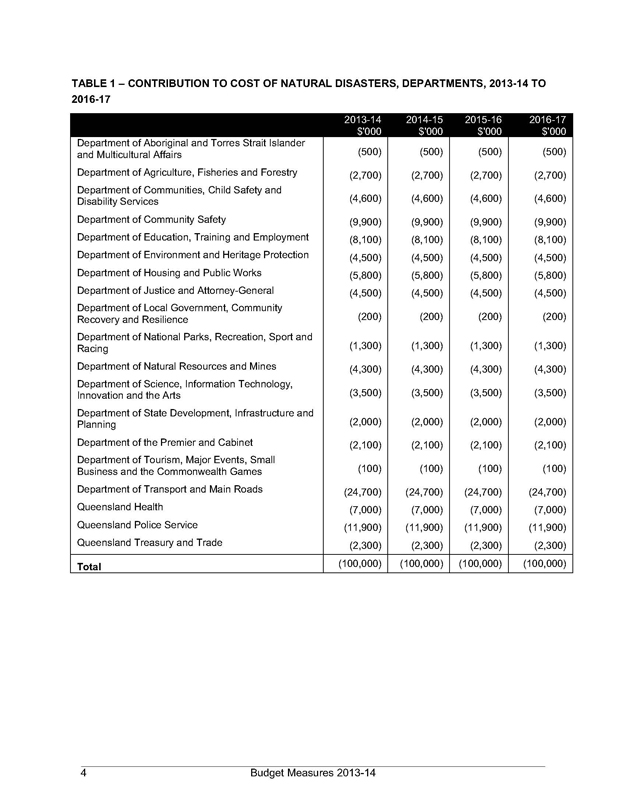
TABLE 1 – CONTRIBUTION TO COST OF NATURAL DISASTERS, DEPARTMENTS, 2013-14 TO 2016-17
2013-14
2014-15
2015-16
2016-17
$‘000
$‘000
$‘000
$‘000
Department of Aboriginal and Torres Strait Islander and Multicultural Affairs (500) (500) (500) (500)
Department of Agriculture, Fisheries and Forestry (2,700) (2,700) (2,700) (2,700)
Department of Communities, Child Safety and Disability Services (4,600) (4,600) (4,600) (4,600)
Department of Community Safety (9,900) (9,900) (9,900) (9,900)
Department of Education, Training and Employment (8,100) (8,100) (8,100) (8,100)
Department of Environment and Heritage Protection (4,500) (4,500) (4,500) (4,500)
Department of Housing and Public Works (5,800) (5,800) (5,800) (5,800)
Department of Justice and Attorney-General (4,500) (4,500) (4,500) (4,500)
Department of Local Government, Community Recovery and Resilience (200) (200) (200) (200)
Department of National Parks, Recreation, Sport and Racing (1,300) (1,300) (1,300) (1,300)
Department of Natural Resources and Mines (4,300) (4,300) (4,300) (4,300)
Department of Science, Information Technology, Innovation and the Arts (3,500) (3,500) (3,500) (3,500)
Department of State Development, Infrastructure and Planning (2,000) (2,000) (2,000) (2,000)
Department of the Premier and Cabinet (2,100) (2,100) (2,100) (2,100)
Department of Tourism, Major Events, Small Business and the Commonwealth Games (100) (100) (100) (100)
Department of Transport and Main Roads (24,700) (24,700) (24,700) (24,700)
Queensland Health (7,000) (7,000) (7,000) (7,000)
Queensland Police Service (11,900) (11,900) (11,900) (11,900)
Queensland Treasury and Trade (2,300) (2,300) (2,300) (2,300)
Total (100,000) (100,000) (100,000) (100,000)
4 Budget Measures 2013-14
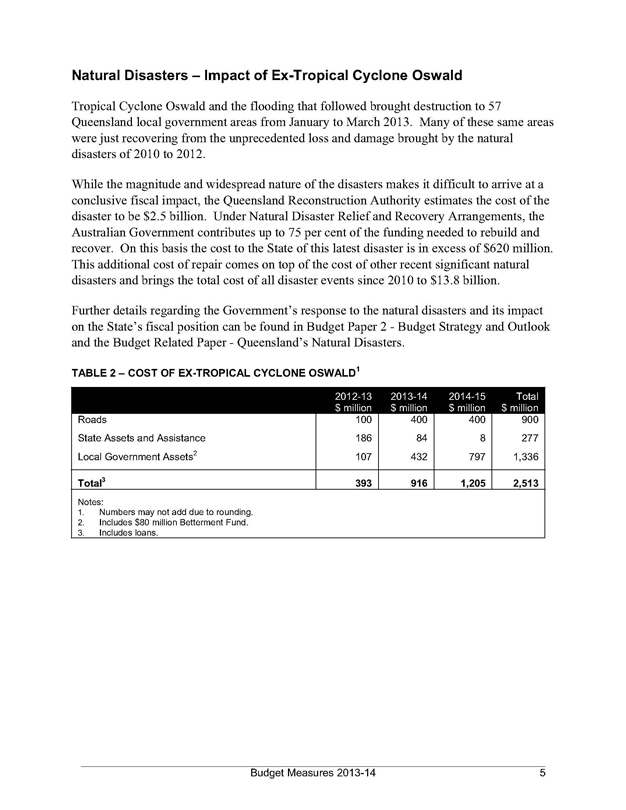
Natural Disasters – Impact of Ex-Tropical Cyclone Oswald
Tropical Cyclone Oswald and the flooding that followed brought destruction to 57
Queensland local government areas from January to March 2013. Many of these same areas were just recovering from the unprecedented loss and damage brought by the natural disasters of 2010 to 2012.
While the magnitude and widespread nature of the disasters makes it difficult to arrive at a conclusive fiscal impact, the Queensland Reconstruction Authority estimates the cost of the disaster to be $2.5 billion. Under Natural Disaster Relief and Recovery Arrangements, the Australian Government contributes up to 75 per cent of the funding needed to rebuild and recover. On this basis the cost to the State of this latest disaster is in excess of $620 million. This additional cost of repair comes on top of the cost of other recent significant natural disasters and brings the total cost of all disaster events since 2010 to $13.8 billion.
Further details regarding the Government’s response to the natural disasters and its impact on the State’s fiscal position can be found in Budget Paper 2 - Budget Strategy and Outlook and the Budget Related Paper - Queensland’s Natural Disasters.
TABLE 2 – COST OF EX-TROPICAL CYCLONE OSWALD1
2012-13
2013-14
2014-15
Total
$ million
$ million
$ million
$ million
Roads 100 400 400 900
State Assets and Assistance 186 84 8 277
Local Government Assets2 107 432 797 1,336
Total3 393 916 1,205 2,513
Notes:
1. Numbers may not add due to rounding.
2. Includes $80 million Betterment Fund.
3. Includes loans.
Budget Measures 2013-14
5
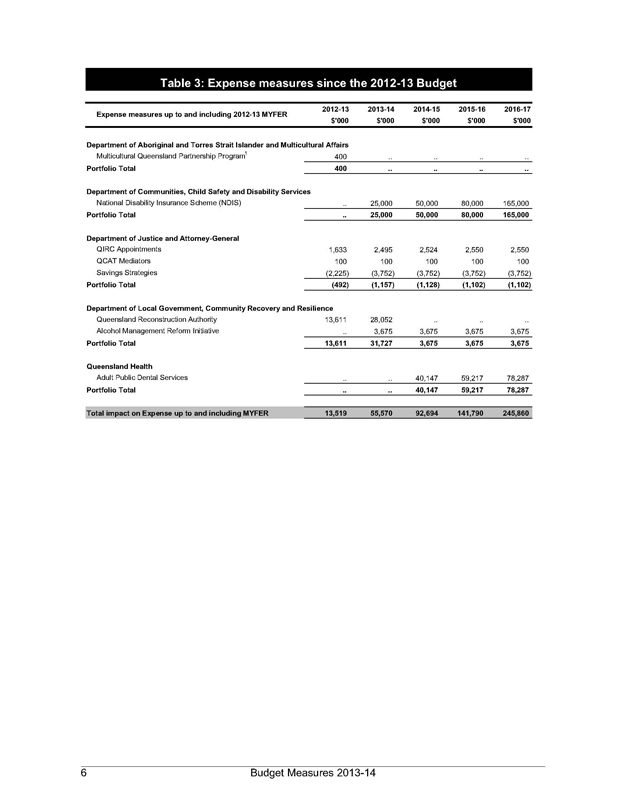
Table 3: Expense measures since the 2012-13 Budget
Expense measures up to and including 2012-13 MYFER
2012-13
2013-14
2014-15
2015-16
2016-17
$‘000
$‘000
$‘000
$‘000
$‘000
Department of Aboriginal and Torres Strait Islander and Multicultural Affairs
Multicultural Queensland Partnership Program1 400 .. .. .. ..
Portfolio Total 400 .. .. .. ..
Department of Communities, Child Safety and Disability Services
National Disability Insurance Scheme (NDIS) .. 25,000 50,000 80,000 165,000
Portfolio Total .. 25,000 50,000 80,000 165,000
Department of Justice and Attorney-General
QIRC Appointments 1,633 2,495 2,524 2,550 2,550
QCAT Mediators 100 100 100 100 100
Savings Strategies (2,225) (3,752) (3,752) (3,752) (3,752)
Portfolio Total (492) (1,157) (1,128) (1,102) (1,102)
Department of Local Government, Community Recovery and Resilience
Queensland Reconstruction Authority 13,611 28,052 .. .. ..
Alcohol Management Reform Initiative .. 3,675 3,675 3,675 3,675
Portfolio Total 13,611 31,727 3,675 3,675 3,675
Queensland Health
Adult Public Dental Services .. .. 40,147 59,217 78,287
Portfolio Total .. .. 40,147 59,217 78,287
Total impact on Expense up to and including MYFER 13,519 55,570 92,694 141,790 245,860
6 Budget Measures 2013-14
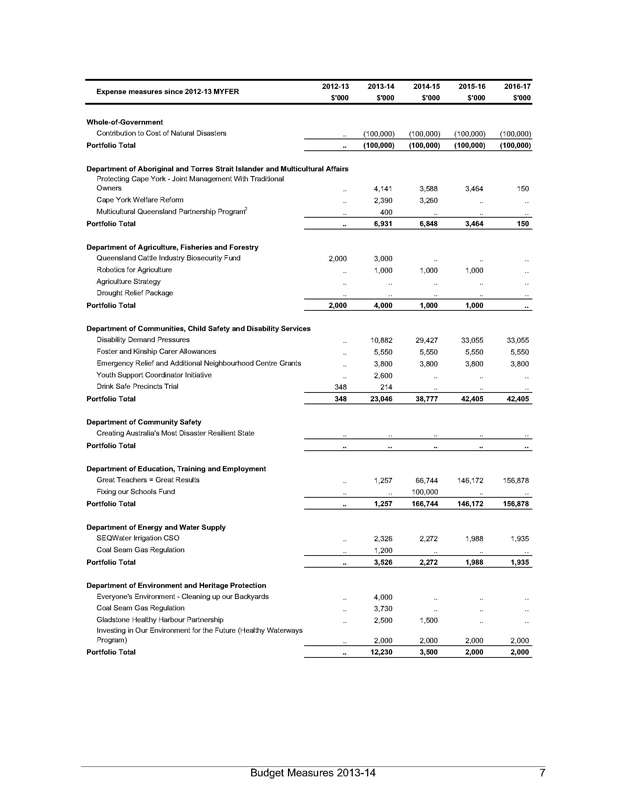
Expense measures since 2012-13 MYFER
2012-13
2013-14
2014-15
2015-16
2016-17
$‘000
$‘000
$‘000
$‘000
$‘000
Whole-of-Government
Contribution to Cost of Natural Disasters .. (100,000) (100,000) (100,000) (100,000)
Portfolio Total .. (100,000) (100,000) (100,000) (100,000)
Department of Aboriginal and Torres Strait Islander and Multicultural Affairs
Protecting Cape York - Joint Management With Traditional Owners .. 4,141 3,588 3,464 150
Cape York Welfare Reform .. 2,390 3,260 .. ..
Multicultural Queensland Partnership Program2 .. 400 .. .. ..
Portfolio Total .. 6,931 6,848 3,464 150
Department of Agriculture, Fisheries and Forestry
Queensland Cattle Industry Biosecurity Fund 2,000 3,000 .. .. ..
Robotics for Agriculture .. 1,000 1,000 1,000 ..
Agriculture Strategy .. .. .. .. ..
Drought Relief Package .. .. .. .. ..
Portfolio Total 2,000 4,000 1,000 1,000 ..
Department of Communities, Child Safety and Disability Services
Disability Demand Pressures .. 10,882 29,427 33,055 33,055
Foster and Kinship Carer Allowances .. 5,550 5,550 5,550 5,550
Emergency Relief and Additional Neighbourhood Centre Grants .. 3,800 3,800 3,800 3,800
Youth Support Coordinator Initiative .. 2,600 .. .. ..
Drink Safe Precincts Trial 348 214 .. .. ..
Portfolio Total 348 23,046 38,777 42,405 42,405
Department of Community Safety
Creating Australia’s Most Disaster Resilient State .. .. .. .. ..
Portfolio Total .. .. .. .. ..
Department of Education, Training and Employment
Great Teachers = Great Results .. 1,257 66,744 146,172 156,878
Fixing our Schools Fund .. .. 100,000 .. ..
Portfolio Total .. 1,257 166,744 146,172 156,878
Department of Energy and Water Supply
SEQWater Irrigation CSO .. 2,326 2,272 1,988 1,935
Coal Seam Gas Regulation .. 1,200 .. .. ..
Portfolio Total .. 3,526 2,272 1,988 1,935
Department of Environment and Heritage Protection
Everyone’s Environment - Cleaning up our Backyards .. 4,000 .. .. ..
Coal Seam Gas Regulation .. 3,730 .. .. ..
Gladstone Healthy Harbour Partnership .. 2,500 1,500 .. ..
Investing in Our Environment for the Future (Healthy Waterways Program)
.. 2,000 2,000 2,000 2,000
Portfolio Total .. 12,230 3,500 2,000 2,000
Budget Measures 2013-14
7
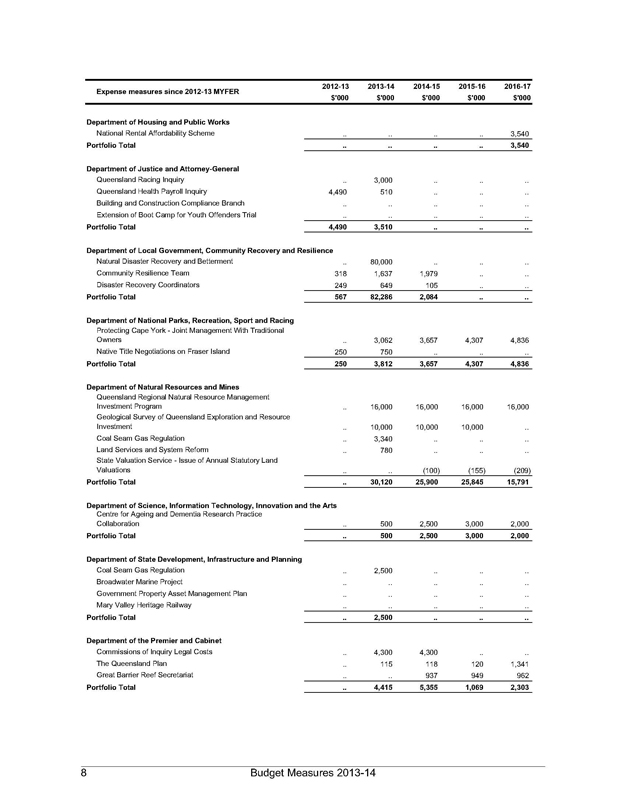
Expense measures since 2012-13 MYFER
2012-13 2013-14 2014-15 2015-16 2016-17
$‘000 $‘000 $‘000 $‘000 $‘000
Department of Housing and Public Works
National Rental Affordability Scheme
.. .. .. .. 3,540
Portfolio Total
.. .. .. .. 3,540
Department of Justice and Attorney-General
Queensland Racing Inquiry
.. 3,000 .. .. ..
Queensland Health Payroll Inquiry
4,490 510 .. .. ...
.. .. .. .. ..
.. .. .. .. ..
Building and Construction Compliance Branch
Extension of Boot Camp for Youth Offenders Trial
Portfolio Total
4,490 3,510 .. .. ..
Department of Local Government, Community Recovery and Resilience
Natural Disaster Recovery and Betterment
.. 80,000 .. .. ..
Community Resilience Team
318 1,637 1,979 .. ..
Disaster Recovery Coordinators
249 649 105 .. ..
Portfolio Total
567 82,286 2,084 .. ..
Department of National Parks, Recreation, Sport and Racing
Protecting Cape York - Joint Management With Traditional
Owners
.. 3,062 3,657 4,307 4,836
Native Title Negotiations on Fraser Island
250 750 .. .. ..
Portfolio Total
250 3,812 3,657 4,307 4,836
Department of Natural Resources and Mines
Queensland Regional Natural Resource Management
Investment Program
.. 16,000 16,000 16,000 16,000
Geological Survey of Queensland Exploration and Resource Investment
.. 10,000 10,000 10,000 ..
Coal Seam Gas Regulation
.. 3,340 .. .. ..
Land Services and System Reform
.. 780 .. .. ..
State Valuation Service - Issue of Annual Statutory Land
Valuations
.. .. (100) (155) (209)
Portfolio Total
.. 30,120 25,900 25,845 15,791
Department of Science, Information Technology, Innovation and the Arts
Centre for Ageing and Dementia Research Practice
Collaboration
.. 500 2,500 3,000 2,000
Portfolio Total
.. 500 2,500 3,000 2,000
Department of State Development, Infrastructure and Planning
Coal Seam Gas Regulation
.. 2,500 .. .. ..
.. .. .. .. ..
.. .. .. .. ..
.. .. .. .. ..
Broadwater Marine Project
Government Property Asset Management Plan
Mary Valley Heritage Railway
Portfolio Total
.. 2,500 .. .. ..
Department of the Premier and Cabinet
Commissions of Inquiry Legal Costs
.. 4,300 4,300 .. ..
The Queensland Plan
.. 115 118 120 1,341
Great Barrier Reef Secretariat
.. .. 937 949 962
Portfolio Total
.. 4,415 5,355 1,069 2,303
8 Budget Measures 2013-14
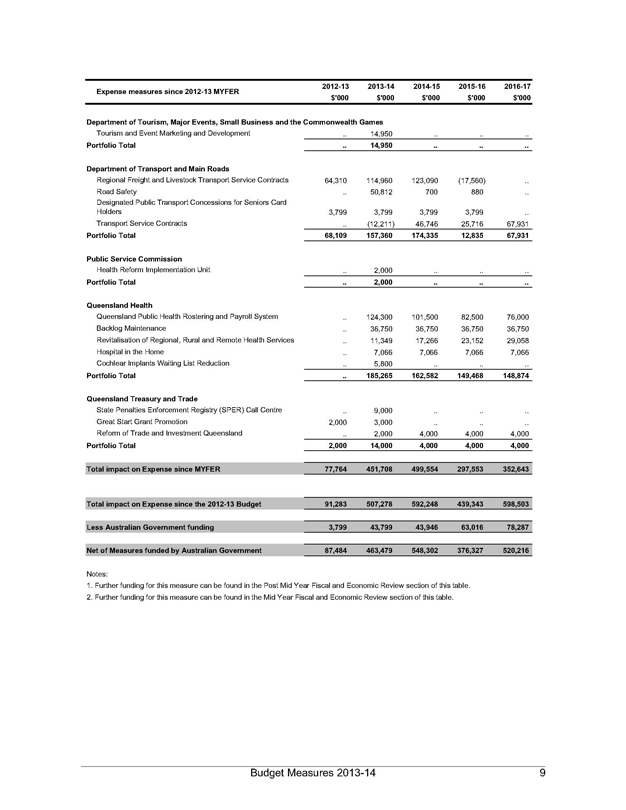
Expense measures since 2012-13 MYFER 2012-13 2013-14 2014-15 2015-16 2016-17
$‘000 $‘000 $‘000 $‘000 $‘000
Department of Tourism, Major Events, Small Business and the Commonwealth Games
Tourism and Event Marketing and Development .. 14,950 .. .. ..
Portfolio Total .. 14,950 .. .. ..
Department of Transport and Main Roads
Regional Freight and Livestock Transport Service Contracts 64,310 114,960 123,090 (17,560) ..
Road Safety .. 50,812 700 880 ..
Designated Public Transport Concessions for Seniors Card
Holders 3,799 3,799 3,799 3,799 ..
Transport Service Contracts .. (12,211) 46,746 25,716 67,931
Portfolio Total 68,109 157,360 174,335 12,835 67,931
Public Service Commission
Health Reform Implementation Unit .. 2,000 .. .. ..
Portfolio Total .. 2,000 .. .. ..
Queensland Health
Queensland Public Health Rostering and Payroll System .. 124,300 101,500 82,500 76,000
Backlog Maintenance .. 36,750 36,750 36,750 36,750
Revitalisation of Regional, Rural and Remote Health Services .. 11,349 17,266 23,152 29,058
Hospital in the Home .. 7,066 7,066 7,066 7,066
Cochlear Implants Waiting List Reduction .. 5,800 .. .. ..
Portfolio Total .. 185,265 162,582 149,468 148,874
Queensland Treasury and Trade
State Penalties Enforcement Registry (SPER) Call Centre .. 9,000 .. .. ..
Great Start Grant Promotion 2,000 3,000 .. .. ..
Reform of Trade and Investment Queensland .. 2,000 4,000 4,000 4,000
Portfolio Total 2,000 14,000 4,000 4,000 4,000
Total impact on Expense since MYFER 77,764 451,708 499,554 297,553 352,643
Total impact on Expense since the 2012-13 Budget 91,283 507,278 592,248 439,343 598,503
Less Australian Government funding 3,799 43,799 43,946 63,016 78,287
Net of Measures funded by Australian Government 87,484 463,479 548,302 376,327 520,216
Notes:
1. Further funding for this measure can be found in the Post Mid Year Fiscal and Economic Review section of this table.
2. Further funding for this measure can be found in the Mid Year Fiscal and Economic Review section of this table.
Budget Measures 2013-14
9
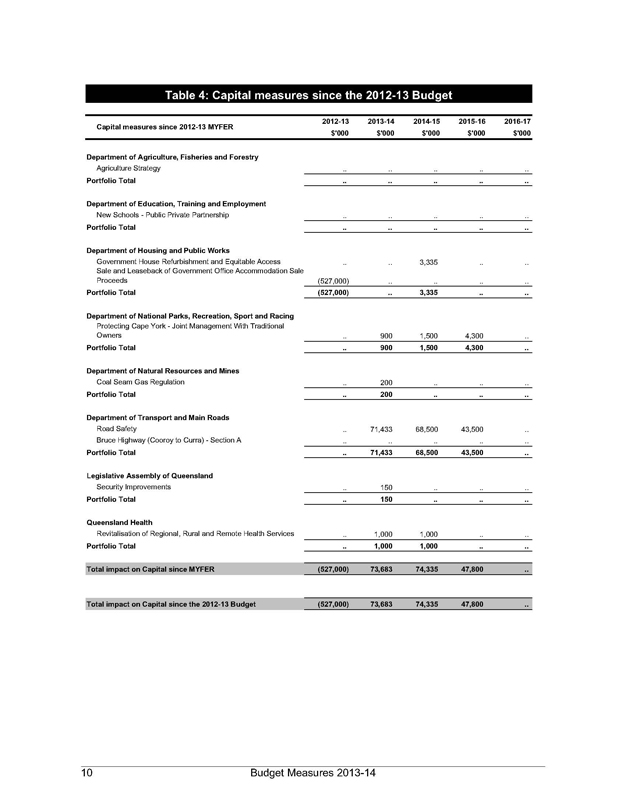
Table 4: Capital measures since the 2012-13 Budget
Capital measures since 2012-13 MYFER
2012-13 2013-14 2014-15 2015-16 2016-17
$‘000 $‘000 $‘000 $‘000 $‘000
Department of Agriculture, Fisheries and Forestry
Agriculture Strategy .. .. .. .. ..
Department of Education, Training and Employment
New Schools - Public Private Partnership .. .. .. .. ..
Portfolio Total .. .. .. .. ..
Department of Housing and Public Works
Government House Refurbishment and Equitable Access
.. .. 3,335 .. ..
Sale and Leaseback of Government Office Accommodation Sale
Proceeds
(527,000) .. .. .. ..
Portfolio Total (527,000) ... 3,335 .. ..
Department of National Parks, Recreation, Sport and Racing
Protecting Cape York - Joint Management With Traditional
Owners .. 900 1,500 4,300 ..
Portfolio Total .. 900 1,500 4,300 ..
Department of Natural Resources and Mines
Coal Seam Gas Regulation .. 200 .. .. ..
Portfolio Total .. 200 .. .. ..
Department of Transport and Main Roads
Road Safety .. 71,433 68,500 43,500 ..
Bruce Highway (Cooroy to Curra) - Section A .. .. .. .. ..
Portfolio Total .. 71,433 68,500 43,500 ..
Legislative Assembly of Queensland
Security Improvements .. 150 .. .. ..
Portfolio Total .. 150 .. .. ..
Queensland Health
Revitalisation of Regional, Rural and Remote Health Services .. 1,000 1,000 .. ..
Portfolio Total .. 1,000 1,000 .. ..
Total impact on Capital since MYFER (527,000) 73,683 74,335 47,800 ..
Total impact on Capital since the 2012-13 Budget (527,000) 73,683 74,335 47,800 ..
10 Budget Measures 2013-14
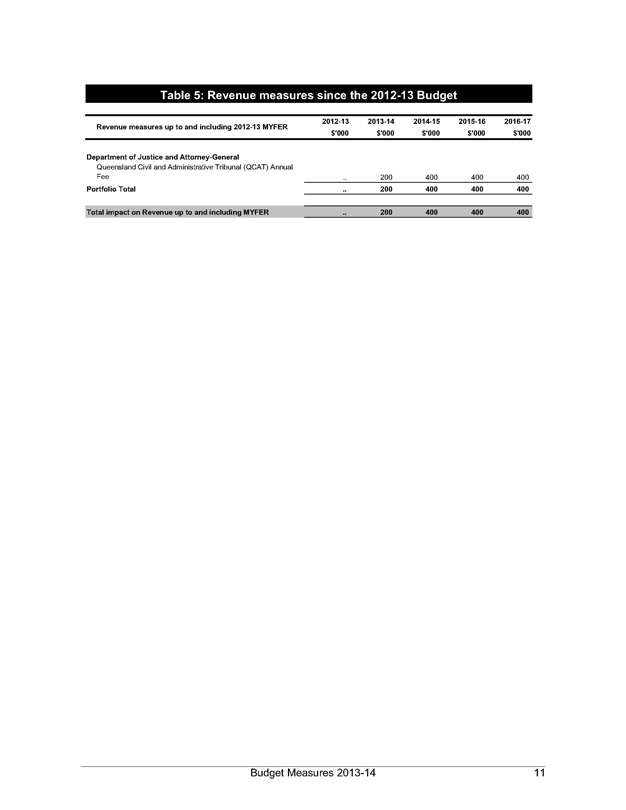
Table 5: Revenue measures since the 2012-13 Budget
Revenue measures up to and including 2012-13 MYFER
2012-13 2013-14 2014-15 2015-16 2016-17
$‘000
$‘000
$‘000
$‘000
$‘000
Department of Justice and Attorney-General
Queensland Civil and Administrative Tribunal (QCAT) Annual
Fee .. 200 400 400 400
Portfolio Total
..
200
400
400
400
Total impact on Revenue up to and including MYFER
..
200
400
400
400
Budget Measures 2013-14
11
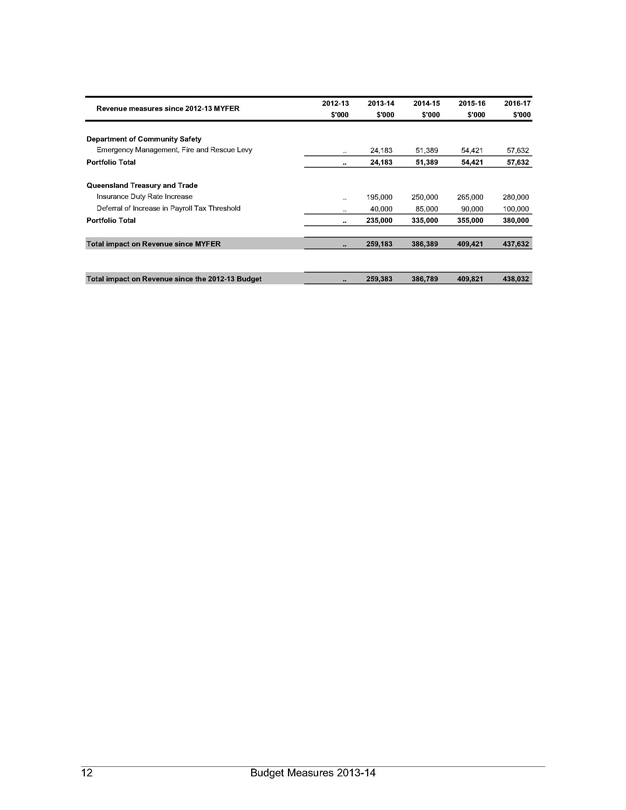
Revenue measures since 2012-13 MYFER
2012-13
2013-14
2014-15
2015-16
2016-17
$‘000
$‘000
$‘000
$‘000
$‘000
Department of Community Safety
Emergency Management, Fire and Rescue Levy
..
24,183
51,389
54,421
57,632
Portfolio Total ..
24,183
51,389
54,421
57,632
Queensland Treasury and Trade
..
Insurance Duty Rate Increase
..
195,000
250,000
265,000
280,000
Deferral of Increase in Payroll Tax Threshold
..
40,000
85,000
90,000 100,000
Portfolio Total ..
235,000
335,000
355,000
380,000
Total impact on Revenue since MYFER
..
259,183
386,389
409,421
437,632
Total impact on Revenue since the 2012-13 Budget
..
259,383
386,789
409,821
438,032
12
Budget Measures 2013-14
2. EXPENSE MEASURES
Introduction
The following tables present the relevant portfolio expense measures relating to decisions taken since the 2012-13 Budget. This does not represent the full amount of additional funding provided to agencies since the 2012-13 Budget. For further explanation, refer to Explanation of Scope and Terms in Chapter 1.
Budget Measures 2013-14
13
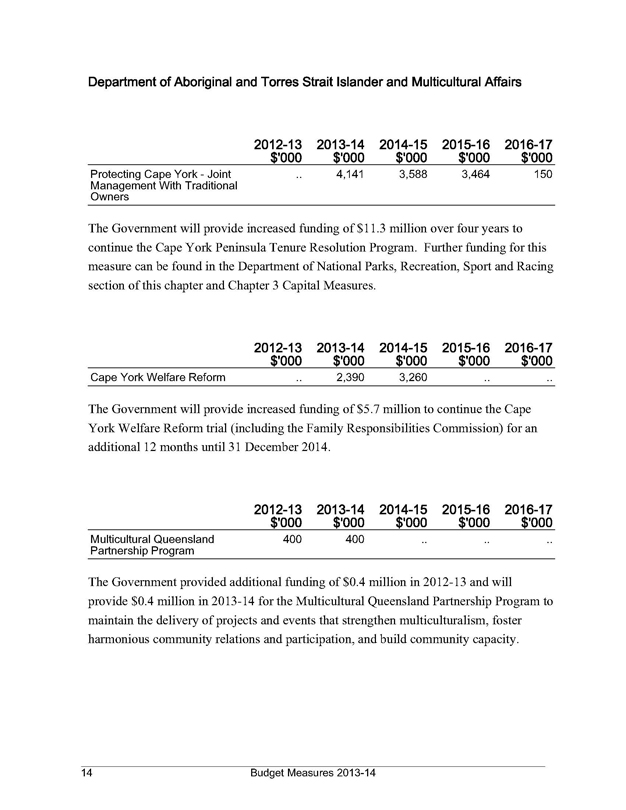
Department of Aboriginal and Torres Strait Islander and Multicultural Affairs
2012-13
2013-14
2014-15
2015-16
2016-17
$‘000
$‘000
$‘000
$‘000
$‘000
Protecting Cape York - Joint
..
4,141
3,588
3,464
150
Management With Traditional
Owners
The Government will provide increased funding of $11.3 million over four years to continue the Cape York Peninsula Tenure Resolution Program. Further funding for this measure can be found in the Department of National Parks, Recreation, Sport and Racing section of this chapter and Chapter 3 Capital Measures.
2012-13
2013-14
2014-15
2015-16
2016-17
$‘000
$‘000
$‘000
$‘000
$‘000
Cape York Welfare Reform
..
2,390 3,260 .. ..
The Government will provide increased funding of $5.7 million to continue the Cape York Welfare Reform trial (including the Family Responsibilities Commission) for an additional 12 months until 31 December 2014.
2012-13
2013-14
2014-15
2015-16
2016-17
$‘000
$‘000
$‘000
$‘000
$‘000
Multicultural Queensland
400
400 Partnership Program
.. .. ..
The Government provided additional funding of $0.4 million in 2012-13 and will provide $0.4 million in 2013-14 for the Multicultural Queensland Partnership Program to maintain the delivery of projects and events that strengthen multiculturalism, foster harmonious community relations and participation, and build community capacity.
14
Budget Measures 2013-14
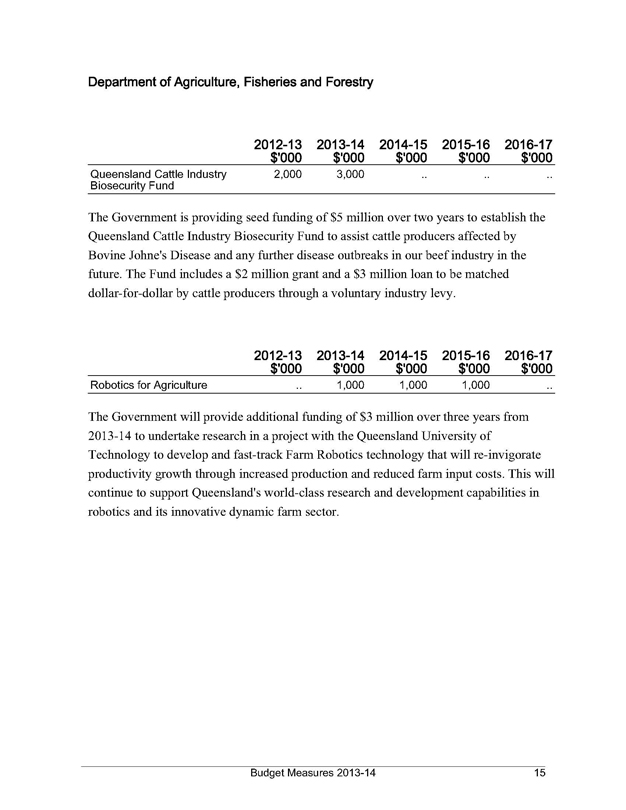
Department of Agriculture, Fisheries and Forestry
2012-13
2013-14
2014-15
2015-16
2016-17
$‘000
$‘000
$‘000
$‘000
$‘000
Queensland Cattle Industry
2,000
3,000
..
..
..
Biosecurity Fund
The Government is providing seed funding of $5 million over two years to establish the Queensland Cattle Industry Biosecurity Fund to assist cattle producers affected by Bovine Johne’s Disease and any further disease outbreaks in our beef industry in the future. The Fund includes a $2 million grant and a $3 million loan to be matched dollar-for-dollar by cattle producers through a voluntary industry levy.
2012-13
2013-14
2014-15
2015-16
2016-17
$‘000
$‘000
$‘000
$‘000
$‘000
Robotics for Agriculture
..
1,000
1,000
1,000
The Government will provide additional funding of $3 million over three years from 2013-14 to undertake research in a project with the Queensland University of Technology to develop and fast-track Farm Robotics technology that will re-invigorate productivity growth through increased production and reduced farm input costs. This will continue to support Queensland’s world-class research and development capabilities in robotics and its innovative dynamic farm sector.
Budget Measures 2013-14
15
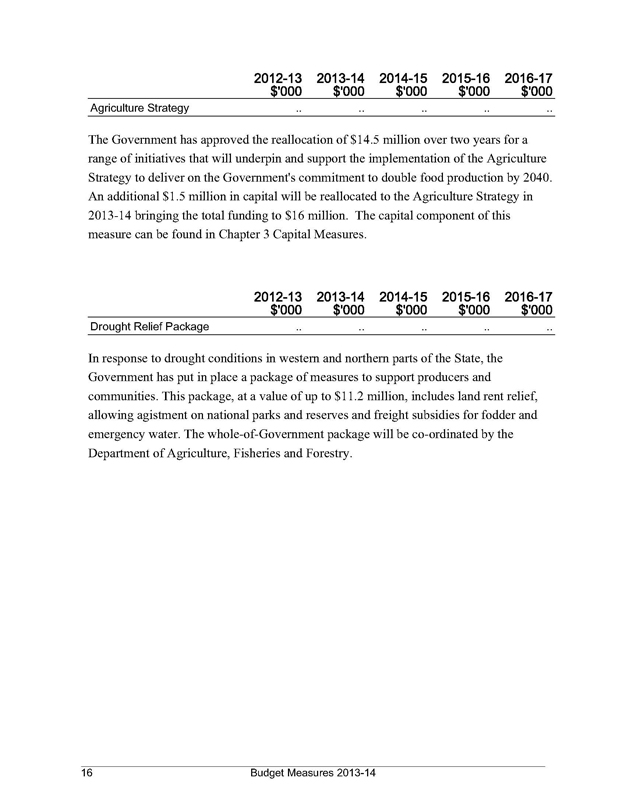
2012-13
2013-14
2014-15
2015-16
2016-17
$‘000
$‘000
$‘000
$‘000
$‘000
Agriculture Strategy
..
..
..
..
..
The Government has approved the reallocation of $14.5 million over two years for a range of initiatives that will underpin and support the implementation of the Agriculture Strategy to deliver on the Government’s commitment to double food production by 2040. An additional $1.5 million in capital will be reallocated to the Agriculture Strategy in 2013-14 bringing the total funding to $16 million. The capital component of this measure can be found in Chapter 3 Capital Measures.
2012-13
2013-14
2014-15
2015-16
2016-17
$‘000
$‘000
$‘000
$‘000
$‘000
Drought Relief Package
..
..
..
..
..
In response to drought conditions in western and northern parts of the State, the Government has put in place a package of measures to support producers and communities. This package, at a value of up to $11.2 million, includes land rent relief, allowing agistment on national parks and reserves and freight subsidies for fodder and emergency water. The whole-of-Government package will be co-ordinated by the Department of Agriculture, Fisheries and Forestry.
16
Budget Measures 2013-14
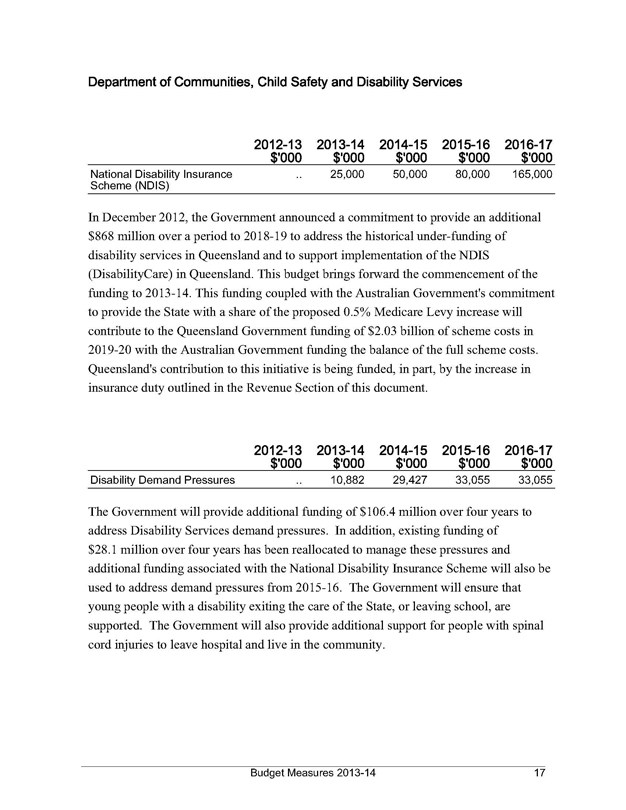
Department of Communities, Child Safety and Disability Services
2012-13
2013-14
2014-15
2015-16
2016-17
$‘000
$‘000
$‘000
$‘000
$‘000
National Disability Insurance
..
25,000
50,000
80,000
165,000
Scheme (NDIS)
In December 2012, the Government announced a commitment to provide an additional $868 million over a period to 2018-19 to address the historical under-funding of disability services in Queensland and to support implementation of the NDIS (DisabilityCare) in Queensland. This budget brings forward the commencement of the funding to 2013-14. This funding coupled with the Australian Government’s commitment to provide the State with a share of the proposed 0.5% Medicare Levy increase will contribute to the Queensland Government funding of $2.03 billion of scheme costs in 2019-20 with the Australian Government funding the balance of the full scheme costs. Queensland’s contribution to this initiative is being funded, in part, by the increase in insurance duty outlined in the Revenue Section of this document.
2012-13
2013-14
2014-15
2015-16
2016-17
$‘000
$‘000
$‘000
$‘000
$‘000
Disability Demand Pressures
..
10,882
29,427
33,055
33,055
The Government will provide additional funding of $106.4 million over four years to address Disability Services demand pressures. In addition, existing funding of $28.1 million over four years has been reallocated to manage these pressures and additional funding associated with the National Disability Insurance Scheme will also be used to address demand pressures from 2015-16. The Government will ensure that young people with a disability exiting the care of the State, or leaving school, are supported. The Government will also provide additional support for people with spinal cord injuries to leave hospital and live in the community.
Budget Measures 2013-14
17
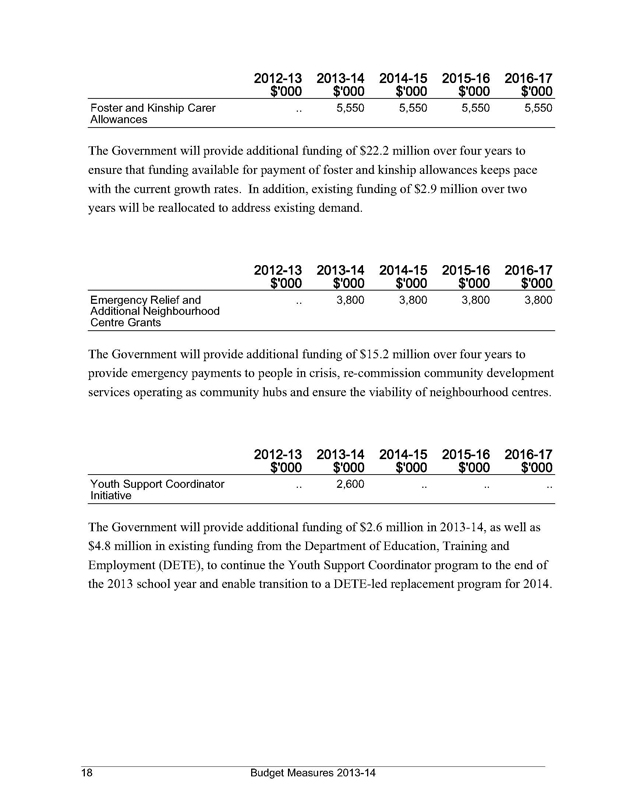
2012-13
2013-14
2014-15
2015-16
2016-17
$‘000
$‘000
$‘000
$‘000
$‘000
Foster and Kinship Carer
..
5,550
5,550
5,550
5,550
Allowances
The Government will provide additional funding of $22.2 million over four years to ensure that funding available for payment of foster and kinship allowances keeps pace with the current growth rates. In addition, existing funding of $2.9 million over two years will be reallocated to address existing demand.
2012-13
2013-14
2014-15
2015-16
2016-17
$‘000
$‘000
$‘000
$‘000
$‘000
Emergency Relief and
..
3,800
3,800
3,800
3,800
Additional Neighbourhood
Centre Grants
The Government will provide additional funding of $15.2 million over four years to provide emergency payments to people in crisis, re-commission community development services operating as community hubs and ensure the viability of neighbourhood centres.
2012-13
2013-14
2014-15
2015-16
2016-17
$‘000
$‘000
$‘000
$‘000
$‘000
Youth Support Coordinator
..
2,600
..
..
..
Initiative
The Government will provide additional funding of $2.6 million in 2013-14, as well as $4.8 million in existing funding from the Department of Education, Training and Employment (DETE), to continue the Youth Support Coordinator program to the end of the 2013 school year and enable transition to a DETE-led replacement program for 2014.
18
Budget Measures 2013-14
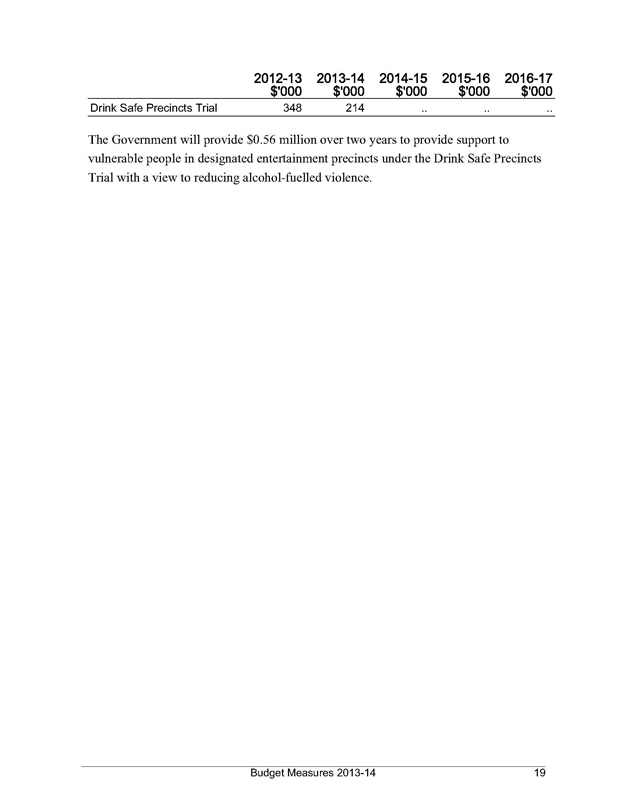
2012-13
2013-14
2014-15
2015-16
2016-17
$‘000
$‘000
$‘000
$‘000
$‘000
Drink Safe Precincts Trial
348
214
..
..
..
The Government will provide $0.56 million over two years to provide support to vulnerable people in designated entertainment precincts under the Drink Safe Precincts Trial with a view to reducing alcohol-fuelled violence.
Budget Measures 2013-14
19
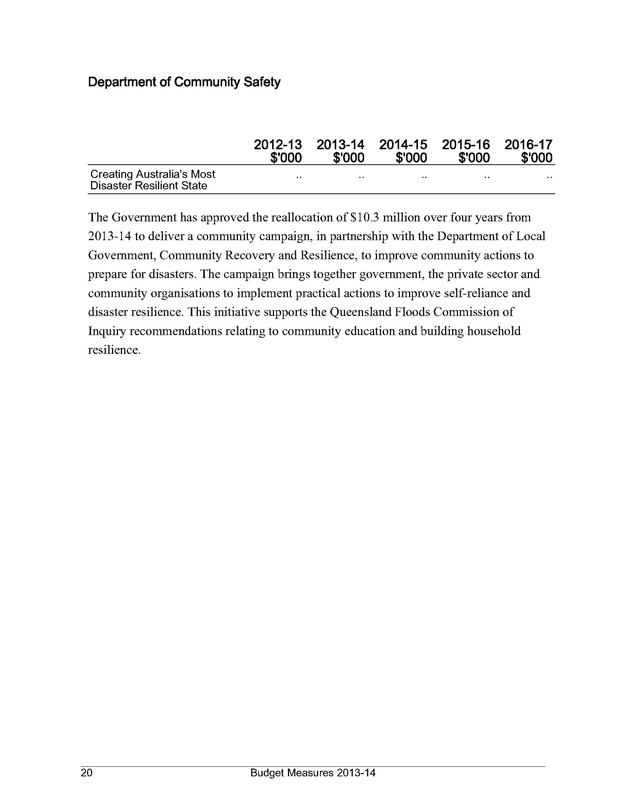
Department of Community Safety
2012-13
2013-14
2014-15
2015-16
2016-17
$‘000
$‘000
$‘000
$‘000
$‘000
..
..
..
..
..
Creating Australia’s Most
Disaster Resilient State
The Government has approved the reallocation of $10.3 million over four years from 2013-14 to deliver a community campaign, in partnership with the Department of Local Government, Community Recovery and Resilience, to improve community actions to prepare for disasters. The campaign brings together government, the private sector and community organisations to implement practical actions to improve self-reliance and disaster resilience. This initiative supports the Queensland Floods Commission of Inquiry recommendations relating to community education and building household resilience.
20 Budget Measures 2013-14
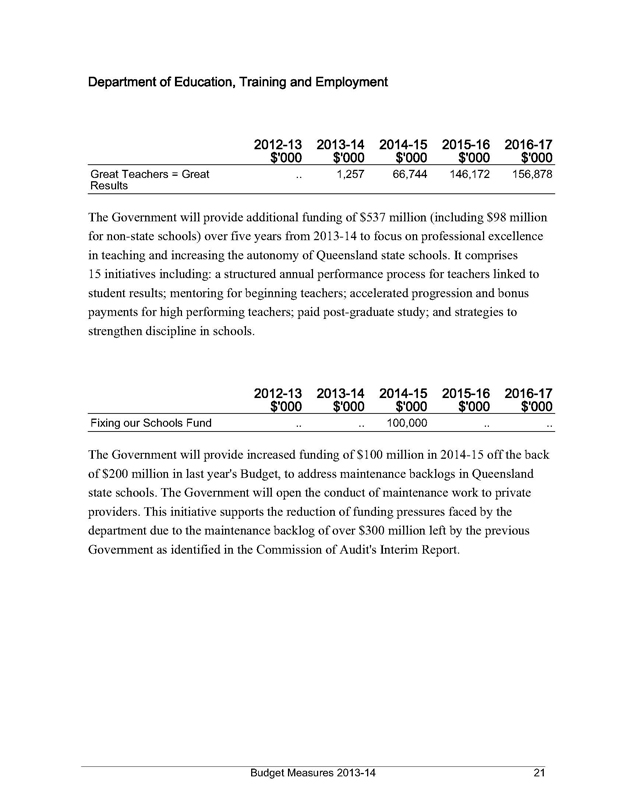
Department of Education, Training and Employment
2012-13
2013-14
2014-15
2015-16
2016-17
$‘000
$‘000
$‘000
$‘000
$‘000
Great Teachers = Great
..
1,257
66,744
146,172
156,878
Results
The Government will provide additional funding of $537 million (including $98 million for non-state schools) over five years from 2013-14 to focus on professional excellence in teaching and increasing the autonomy of Queensland state schools. It comprises 15 initiatives including: a structured annual performance process for teachers linked to student results; mentoring for beginning teachers; accelerated progression and bonus payments for high performing teachers; paid post-graduate study; and strategies to strengthen discipline in schools.
2012-13
2013-14
2014-15
2015-16
2016-17
$‘000
$‘000
$‘000
$‘000
$‘000
Fixing our Schools Fund
..
..
100,000
..
..
The Government will provide increased funding of $100 million in 2014-15 off the back of $200 million in last year’s Budget, to address maintenance backlogs in Queensland state schools. The Government will open the conduct of maintenance work to private providers. This initiative supports the reduction of funding pressures faced by the department due to the maintenance backlog of over $300 million left by the previous Government as identified in the Commission of Audit’s Interim Report.
Budget Measures 2013-14 21
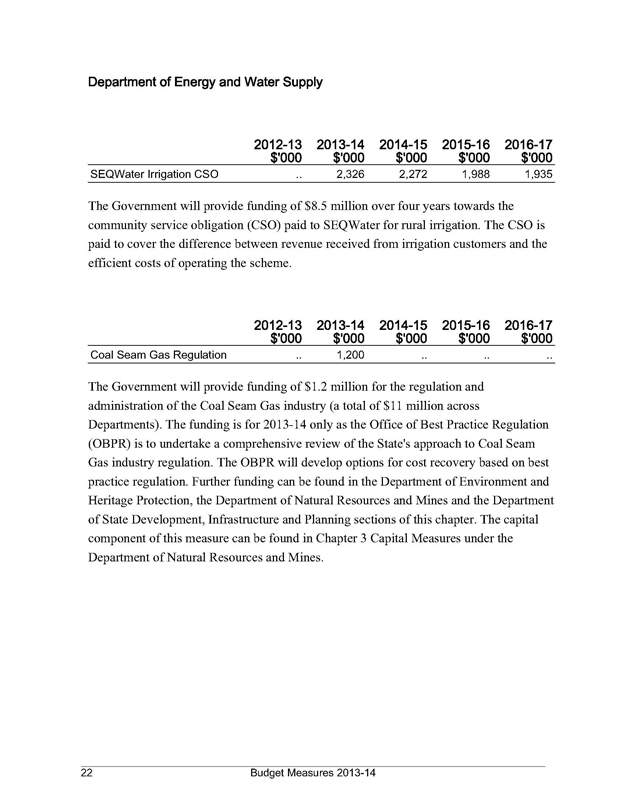
Department of Energy and Water Supply
2012-13
2013-14
2014-15
2015-16
2016-17
$‘000
$‘000
$‘000
$‘000
$‘000
SEQWater Irrigation CSO
..
2,326
2,272
1,988
1,935
The Government will provide funding of $8.5 million over four years towards the community service obligation (CSO) paid to SEQWater for rural irrigation. The CSO is paid to cover the difference between revenue received from irrigation customers and the efficient costs of operating the scheme.
2012-13
2013-14
2014-15
2015-16
2016-17
$‘000
$‘000
$‘000
$‘000
$‘000
Coal Seam Gas Regulation
.. 1,200 .. .. ..
The Government will provide funding of $1.2 million for the regulation and administration of the Coal Seam Gas industry (a total of $11 million across
Departments). The funding is for 2013-14 only as the Office of Best Practice Regulation (OBPR) is to undertake a comprehensive review of the State’s approach to Coal Seam Gas industry regulation. The OBPR will develop options for cost recovery based on best practice regulation. Further funding can be found in the Department of Environment and Heritage Protection, the Department of Natural Resources and Mines and the Department of State Development, Infrastructure and Planning sections of this chapter. The capital component of this measure can be found in Chapter 3 Capital Measures under the Department of Natural Resources and Mines.
Budget Measures 2013-14
22
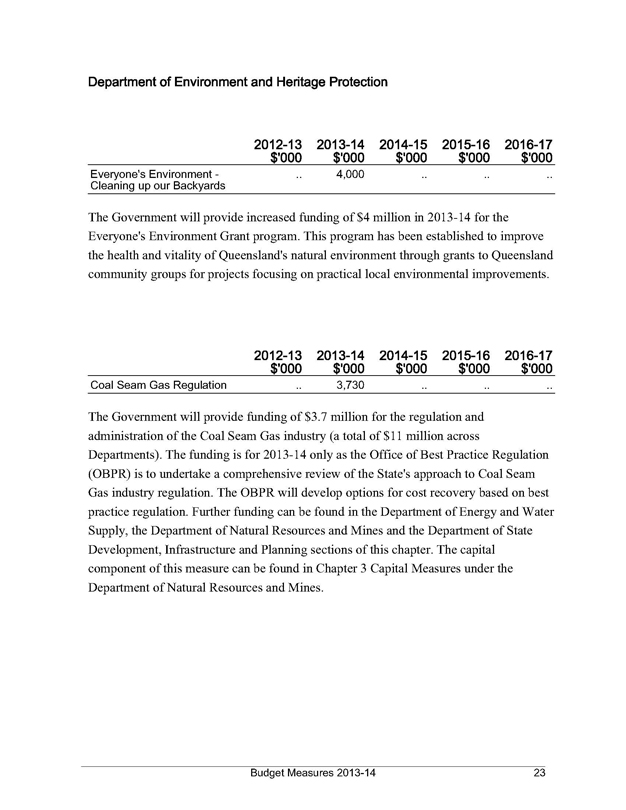
Department of Environment and Heritage Protection
2012-13
2013-14
2014-15
2015-16
2016-17
$‘000
$‘000
$‘000
$‘000
$‘000
Everyone’s Environment - Cleaning up our Backyards
.. 4,000 .. .. ..
The Government will provide increased funding of $4 million in 2013-14 for the Everyone’s Environment Grant program. This program has been established to improve the health and vitality of Queensland’s natural environment through grants to Queensland community groups for projects focusing on practical local environmental improvements.
2012-13
2013-14
2014-15
2015-16
2016-17
$‘000
$‘000
$‘000
$‘000
$‘000
Coal Seam Gas Regulation .. 3,730 .. ... ..
The Government will provide funding of $3.7 million for the regulation and administration of the Coal Seam Gas industry (a total of $11 million across
Departments). The funding is for 2013-14 only as the Office of Best Practice Regulation (OBPR) is to undertake a comprehensive review of the State’s approach to Coal Seam Gas industry regulation. The OBPR will develop options for cost recovery based on best practice regulation. Further funding can be found in the Department of Energy and Water Supply, the Department of Natural Resources and Mines and the Department of State Development, Infrastructure and Planning sections of this chapter. The capital component of this measure can be found in Chapter 3 Capital Measures under the Department of Natural Resources and Mines.
Budget Measures 2013-14
23
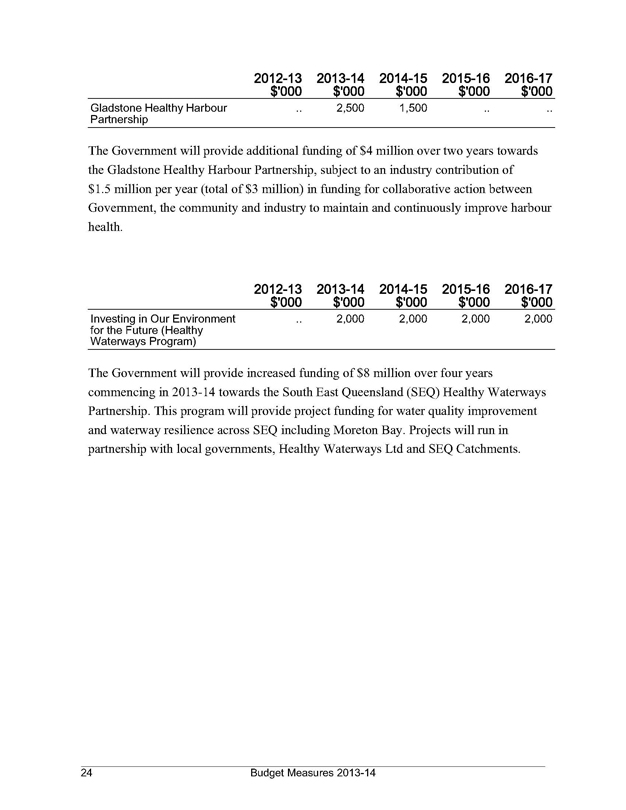
2012-13
2013-14
2014-15
2015-16
2016-17
$‘000
$‘000
$‘000
$‘000
$‘000
Gladstone Healthy Harbour Partnership
.. 2,500 1,500 .. ..
The Government will provide additional funding of $4 million over two years towards the Gladstone Healthy Harbour Partnership, subject to an industry contribution of $1.5 million per year (total of $3 million) in funding for collaborative action between Government, the community and industry to maintain and continuously improve harbour health.
2012-13
2013-14
2014-15
2015-16
2016-17
$‘000
$‘000
$‘000
$‘000
$‘000
Investing in Our Environment for the Future (Healthy Waterways Program)
.. 2,000 2,000 2,000 2,000
The Government will provide increased funding of $8 million over four years commencing in 2013-14 towards the South East Queensland (SEQ) Healthy Waterways Partnership. This program will provide project funding for water quality improvement and waterway resilience across SEQ including Moreton Bay. Projects will run in partnership with local governments, Healthy Waterways Ltd and SEQ Catchments.
Budget Measures 2013-14
24
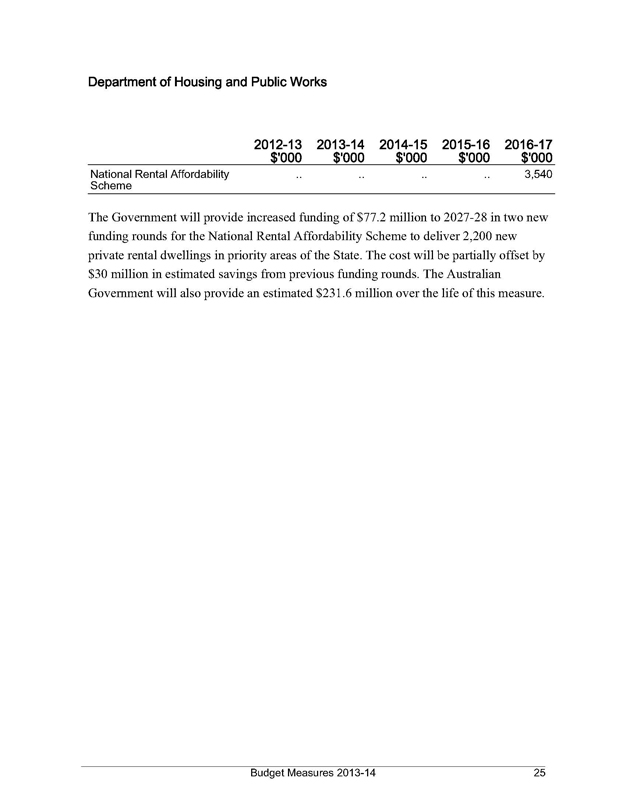
Department of Housing and Public Works
2012-13
2013-14
2014-15
2015-16
2016-17
$‘000
$‘000
$‘000
$‘000
$‘000
National Rental Affordability Scheme
.. .. .. .. 3,540
The Government will provide increased funding of $77.2 million to 2027-28 in two new funding rounds for the National Rental Affordability Scheme to deliver 2,200 new private rental dwellings in priority areas of the State. The cost will be partially offset by $30 million in estimated savings from previous funding rounds. The Australian Government will also provide an estimated $231.6 million over the life of this measure.
Budget Measures 2013-14
25
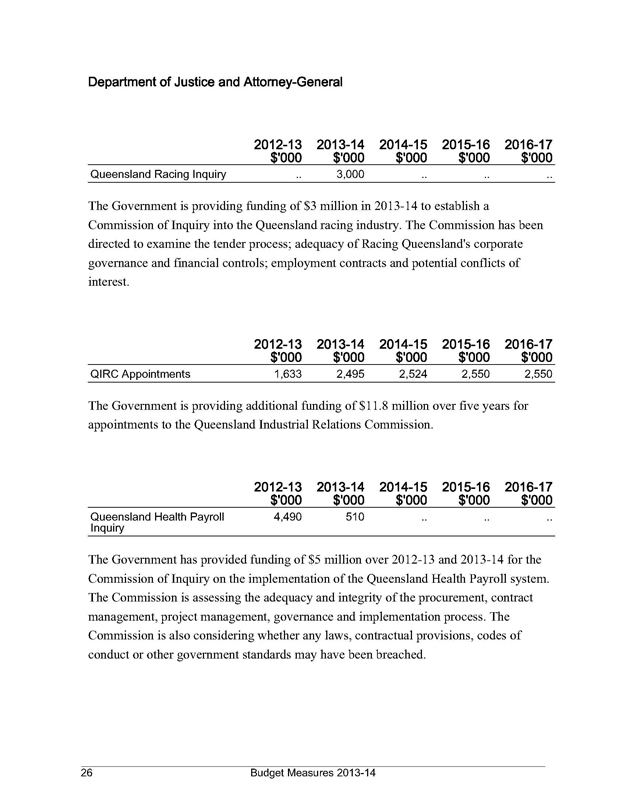
Department of Justice and Attorney-General
2012-13
2013-14
2014-15
2015-16
2016-17
$‘000
$‘000
$‘000
$‘000
$‘000
Queensland Racing Inquiry
.. 3,000 .. .. ..
The Government is providing funding of $3 million in 2013-14 to establish a Commission of Inquiry into the Queensland racing industry. The Commission has been directed to examine the tender process; adequacy of Racing Queensland’s corporate governance and financial controls; employment contracts and potential conflicts of interest.
2012-13
2013-14
2014-15
2015-16
2016-17
$‘000
$‘000
$‘000
$‘000
$‘000
QIRC Appointments
1,633
2,495
2,524
2,550
2,550
The Government is providing additional funding of $11.8 million over five years for appointments to the Queensland Industrial Relations Commission.
2012-13
2013-14
2014-15
2015-16
2016-17
$‘000
$‘000
$‘000
$‘000
$‘000
Queensland Health Payroll Inquiry
4,490 510 .. .. ..
The Government has provided funding of $5 million over 2012-13 and 2013-14 for the Commission of Inquiry on the implementation of the Queensland Health Payroll system. The Commission is assessing the adequacy and integrity of the procurement, contract management, project management, governance and implementation process. The Commission is also considering whether any laws, contractual provisions, codes of conduct or other government standards may have been breached.
26 Budget Measures 2013-14
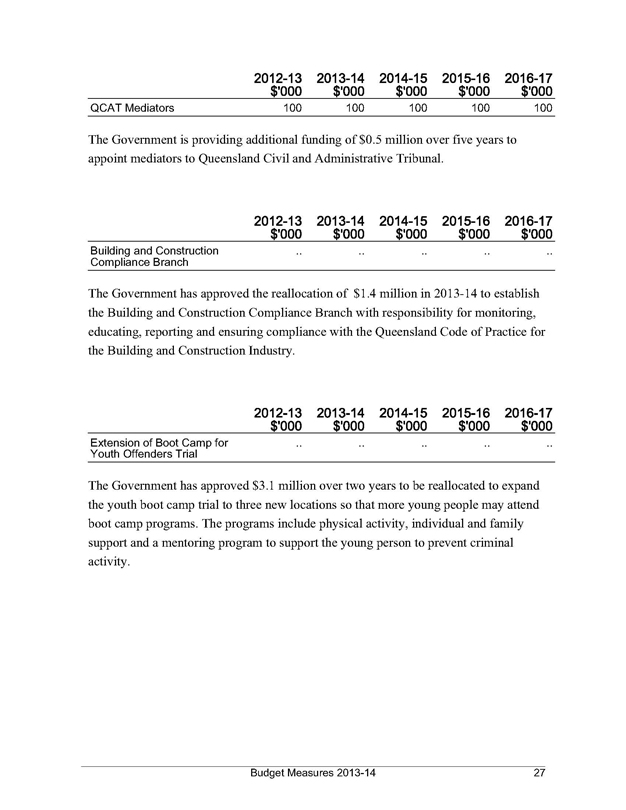
2012-13
2013-14
2014-15
2015-16
2016-17
$‘000
$‘000
$‘000
$‘000
$‘000
QCAT Mediators
100 100 100 100 100
The Government is providing additional funding of $0.5 million over five years to appoint mediators to Queensland Civil and Administrative Tribunal.
2012-13
2013-14
2014-15
2015-16
2016-17
$‘000
$‘000
$‘000
$‘000
$‘000
Building and Construction Compliance Branch
.. .. .. .. ..
The Government has approved the reallocation of $1.4 million in 2013-14 to establish the Building and Construction Compliance Branch with responsibility for monitoring, educating, reporting and ensuring compliance with the Queensland Code of Practice for the Building and Construction Industry.
2012-13
2013-14
2014-15
2015-16
2016-17
$‘000
$‘000
$‘000
$‘000
$‘000
Extension of Boot Camp for Youth Offenders Trial
.. .. .. .. ..
The Government has approved $3.1 million over two years to be reallocated to expand the youth boot camp trial to three new locations so that more young people may attend boot camp programs. The programs include physical activity, individual and family support and a mentoring program to support the young person to prevent criminal activity.
Budget Measures 2013-14
27
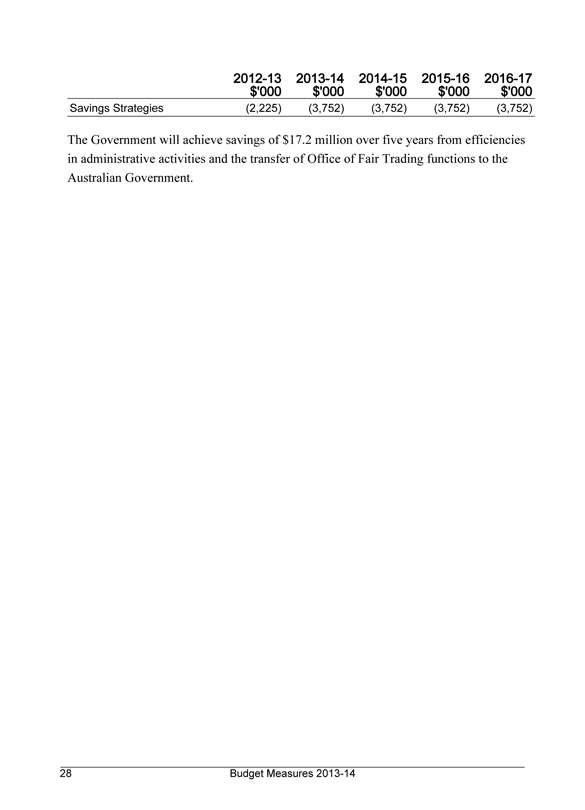
2012-13
2013-14
2014-15
2015-16
2016-17
$‘000
$‘000
$‘000
$‘000
$‘000
Savings Strategies
(2,225) (3,752) (3,752) (3,752) (3,752)
The Government will achieve savings of $17.2 million over five years from efficiencies in administrative activities and the transfer of Office of Fair Trading functions to the Australian Government.
28 Budget Measures 2013-14
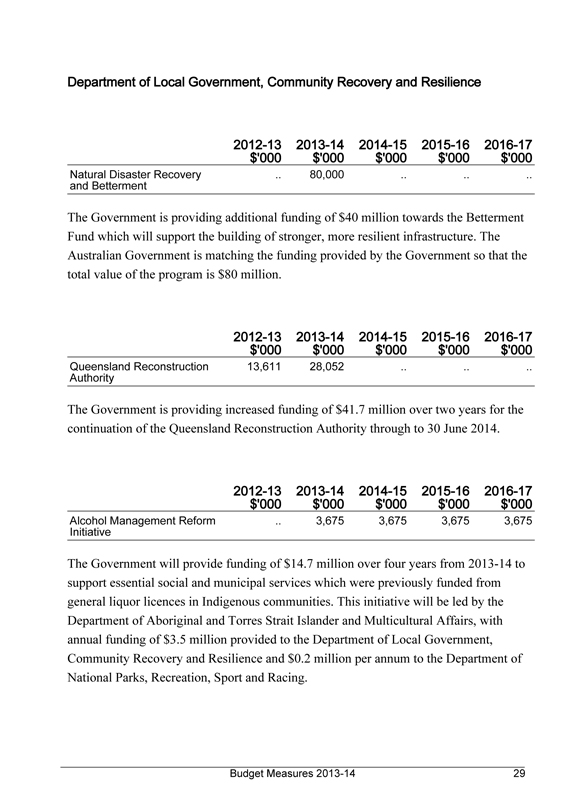
Department of Local Government, Community Recovery and Resilience
2012-13
2013-14
2014-15
2015-16
2016-17
$‘000
$‘000
$‘000
$‘000
$‘000
Natural Disaster Recovery and Betterment
.. 80,000 .. .. ..
The Government is providing additional funding of $40 million towards the Betterment Fund which will support the building of stronger, more resilient infrastructure. The Australian Government is matching the funding provided by the Government so that the total value of the program is $80 million.
2012-13
2013-14
2014-15
2015-16
2016-17
$‘000
$‘000
$‘000
$‘000
$‘000
Queensland Reconstruction Authority
13,611 28,052 ... .. ..
The Government is providing increased funding of $41.7 million over two years for the continuation of the Queensland Reconstruction Authority through to 30 June 2014.
2012-13
2013-14
2014-15
2015-16
2016-17
$‘000
$‘000
$‘000
$‘000
$‘000
Alcohol Management Reform Initiative
.. 3,675 3,675 3,675 3,675
The Government will provide funding of $14.7 million over four years from 2013-14 to support essential social and municipal services which were previously funded from general liquor licences in Indigenous communities. This initiative will be led by the Department of Aboriginal and Torres Strait Islander and Multicultural Affairs, with annual funding of $3.5 million provided to the Department of Local Government, Community Recovery and Resilience and $0.2 million per annum to the Department of National Parks, Recreation, Sport and Racing.
Budget Measures 2013-14
29
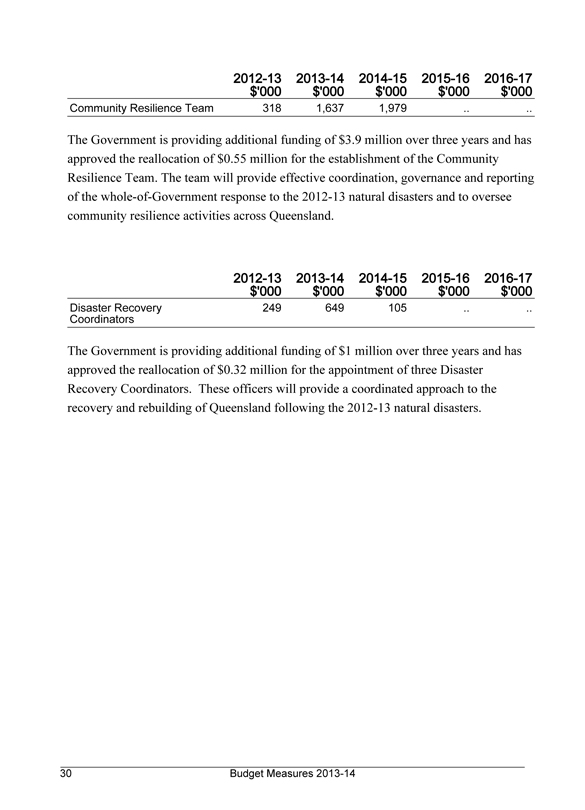
2012-13
2013-14
2014-15
2015-16
2016-17
$‘000
$‘000
$‘000
$‘000
$‘000
Community Resilience Team
318 1,637 1,979 .. ..
The Government is providing additional funding of $3.9 million over three years and has approved the reallocation of $0.55 million for the establishment of the Community Resilience Team. The team will provide effective coordination, governance and reporting of the whole-of-Government response to the 2012-13 natural disasters and to oversee community resilience activities across Queensland.
2012-13
2013-14
2014-15
2015-16
2016-17
$‘000
$‘000
$‘000
$‘000
$‘000
Disaster Recovery Coordinators
249 649 105 .. ..
The Government is providing additional funding of $1 million over three years and has approved the reallocation of $0.32 million for the appointment of three Disaster Recovery Coordinators. These officers will provide a coordinated approach to the recovery and rebuilding of Queensland following the 2012-13 natural disasters.
30 Budget Measures 2013-14
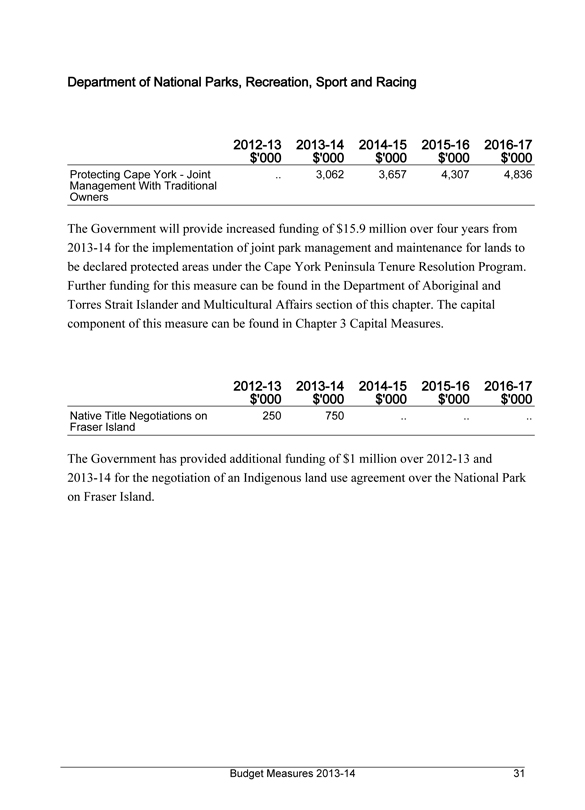
Department of National Parks, Recreation, Sport and Racing
2012-13
2013-14
2014-15
2015-16
2016-17
$‘000
$‘000
$‘000
$‘000
$‘000
Protecting Cape York - Joint Management With Traditional Owners
.. 3,062 3,657 4,307 4,836
The Government will provide increased funding of $15.9 million over four years from 2013-14 for the implementation of joint park management and maintenance for lands to be declared protected areas under the Cape York Peninsula Tenure Resolution Program. Further funding for this measure can be found in the Department of Aboriginal and Torres Strait Islander and Multicultural Affairs section of this chapter. The capital component of this measure can be found in Chapter 3 Capital Measures.
2012-13
2013-14
2014-15
2015-16
2016-17
$‘000
$‘000
$‘000
$‘000
$‘000
Native Title Negotiations on Fraser Island
250 750 .. .. ..
The Government has provided additional funding of $1 million over 2012-13 and 2013-14 for the negotiation of an Indigenous land use agreement over the National Park on Fraser Island.
Budget Measures 2013-14
31
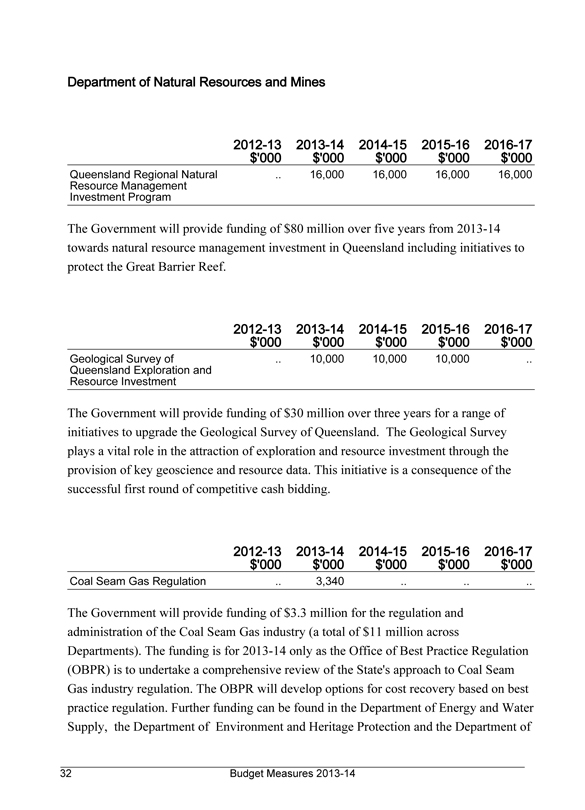
Department of Natural Resources and Mines
2012-13
2013-14
2014-15
2015-16
2016-17
$‘000
$‘000
$‘000
$‘000
$‘000
Queensland Regional Natural Resource Management Investment Program
.. 16,000 16,000 16,000 16,000
The Government will provide funding of $80 million over five years from 2013-14 towards natural resource management investment in Queensland including initiatives to protect the Great Barrier Reef.
2012-13
2013-14
2014-15
2015-16
2016-17
$‘000
$‘000
$‘000
$‘000
$‘000
Geological Survey of Queensland Exploration and Resource Investment
.. 10,000 10,000 10,000 ..
The Government will provide funding of $30 million over three years for a range of initiatives to upgrade the Geological Survey of Queensland. The Geological Survey plays a vital role in the attraction of exploration and resource investment through the provision of key geoscience and resource data. This initiative is a consequence of the successful first round of competitive cash bidding.
2012-13
2013-14
2014-15
2015-16
2016-17
$‘000
$‘000
$‘000
$‘000
$‘000
Coal Seam Gas Regulation
.. 3,340 .. .. ..
The Government will provide funding of $3.3 million for the regulation and administration of the Coal Seam Gas industry (a total of $11 million across
Departments). The funding is for 2013-14 only as the Office of Best Practice Regulation (OBPR) is to undertake a comprehensive review of the State’s approach to Coal Seam Gas industry regulation. The OBPR will develop options for cost recovery based on best practice regulation. Further funding can be found in the Department of Energy and Water Supply, the Department of Environment and Heritage Protection and the Department of
32 Budget Measures 2013-14
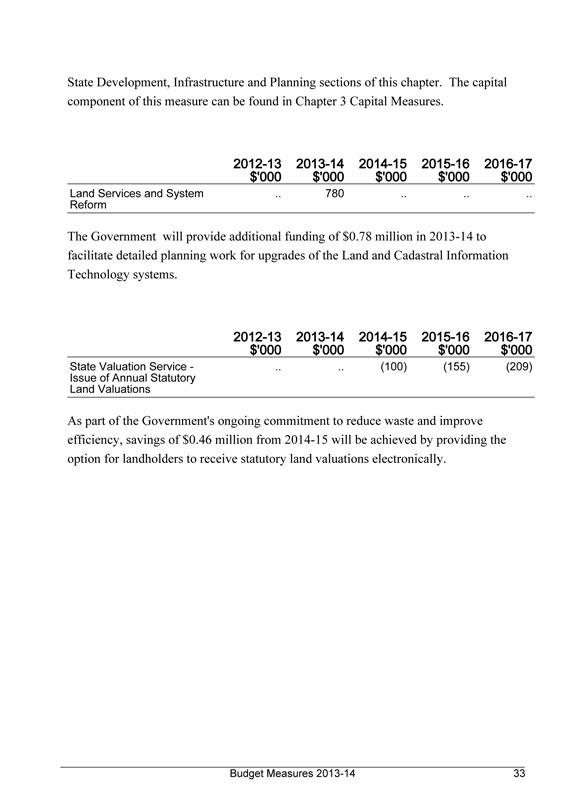
State Development, Infrastructure and Planning sections of this chapter. The capital component of this measure can be found in Chapter 3 Capital Measures.
2012-13
2013-14
2014-15
2015-16
2016-17
$‘000
$‘000
$‘000
$‘000
$‘000
Land Services and System Reform
.. 780 .. .. ..
The Government will provide additional funding of $0.78 million in 2013-14 to facilitate detailed planning work for upgrades of the Land and Cadastral Information Technology systems.
2012-13
2013-14
2014-15
2015-16
2016-17
$‘000
$‘000
$‘000
$‘000
$‘000
State Valuation Service - Issue of Annual Statutory Land Valuations
.. .. (100) (155) (209)
As part of the Government’s ongoing commitment to reduce waste and improve efficiency, savings of $0.46 million from 2014-15 will be achieved by providing the option for landholders to receive statutory land valuations electronically.
Budget Measures 2013-14
33
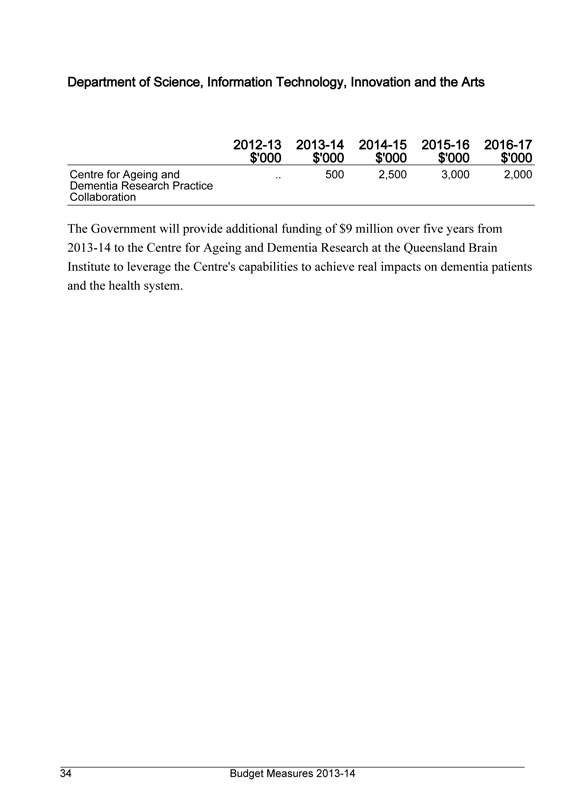
Department of Science, Information Technology, Innovation and the Arts
2012-13
2013-14
2014-15
2015-16
2016-17
$‘000
$‘000
$‘000
$‘000
$‘000
Centre for Ageing and Dementia Research Practice Collaboration
.. 500 2,500 3,000 2,000
The Government will provide additional funding of $9 million over five years from 2013-14 to the Centre for Ageing and Dementia Research at the Queensland Brain Institute to leverage the Centre’s capabilities to achieve real impacts on dementia patients and the health system.
34 Budget Measures 2013-14
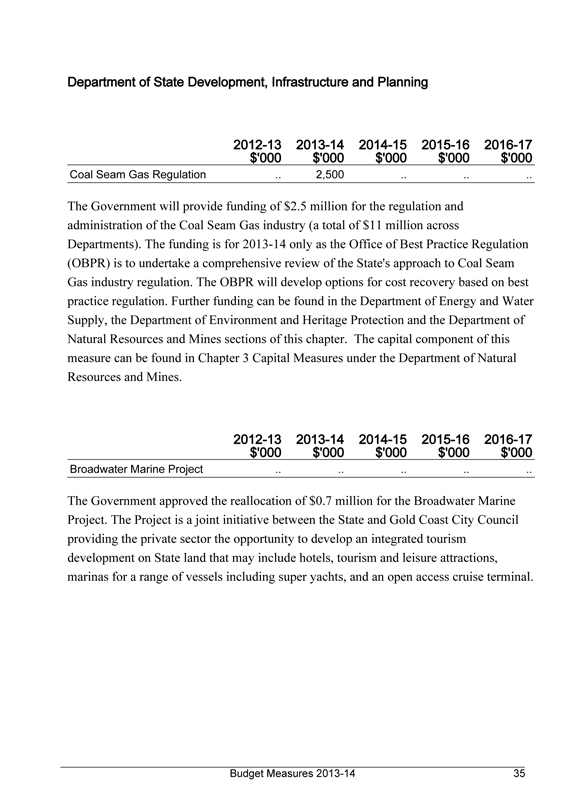
Department of State Development, Infrastructure and Planning
2012-13
2013-14
2014-15
2015-16
2016-17
$‘000
$‘000
$‘000
$‘000
$‘000
Coal Seam Gas Regulation
..
2,500
..
..
..
The Government will provide funding of $2.5 million for the regulation and administration of the Coal Seam Gas industry (a total of $11 million across Departments). The funding is for 2013-14 only as the Office of Best Practice Regulation (OBPR) is to undertake a comprehensive review of the State’s approach to Coal Seam Gas industry regulation. The OBPR will develop options for cost recovery based on best practice regulation. Further funding can be found in the Department of Energy and Water Supply, the Department of Environment and Heritage Protection and the Department of Natural Resources and Mines sections of this chapter. The capital component of this measure can be found in Chapter 3 Capital Measures under the Department of Natural Resources and Mines.
2012-13
2013-14
2014-15
2015-16
2016-17
$‘000
$‘000
$‘000
$‘000
$‘000
Broadwater Marine Project
..
..
..
..
..
The Government approved the reallocation of $0.7 million for the Broadwater Marine Project. The Project is a joint initiative between the State and Gold Coast City Council providing the private sector the opportunity to develop an integrated tourism development on State land that may include hotels, tourism and leisure attractions, marinas for a range of vessels including super yachts, and an open access cruise terminal.
Budget Measures 2013-14
35
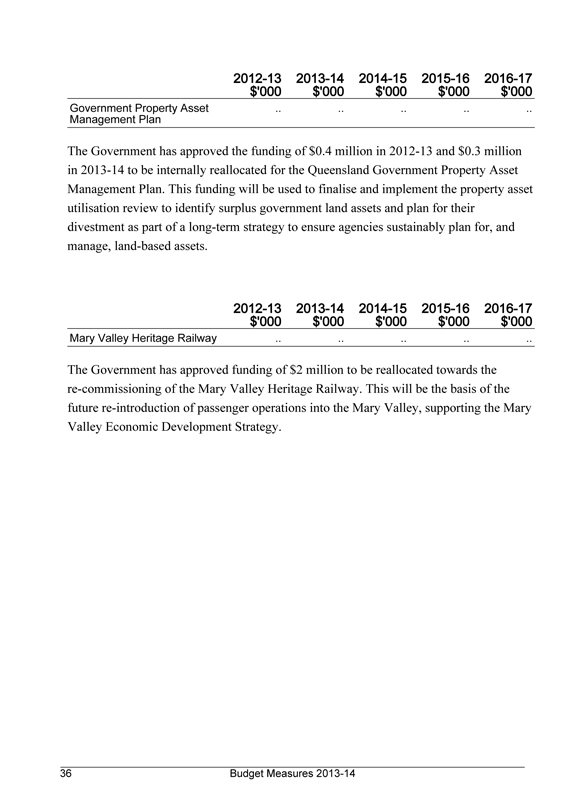
2012-13
2013-14
2014-15
2015-16
2016-17
$‘000
$‘000
$‘000
$‘000
$‘000
Government Property Asset Management Plan
..
..
..
..
..
The Government has approved the funding of $0.4 million in 2012-13 and $0.3 million in 2013-14 to be internally reallocated for the Queensland Government Property Asset Management Plan. This funding will be used to finalise and implement the property asset utilisation review to identify surplus government land assets and plan for their divestment as part of a long-term strategy to ensure agencies sustainably plan for, and manage, land-based assets.
2012-13
2013-14
2014-15
2015-16
2016-17
$‘000
$‘000
$‘000
$‘000
$‘000
Mary Valley Heritage Railway
..
..
..
..
..
The Government has approved funding of $2 million to be reallocated towards the re-commissioning of the Mary Valley Heritage Railway. This will be the basis of the future re-introduction of passenger operations into the Mary Valley, supporting the Mary Valley Economic Development Strategy.
Budget Measures 2013-14
36
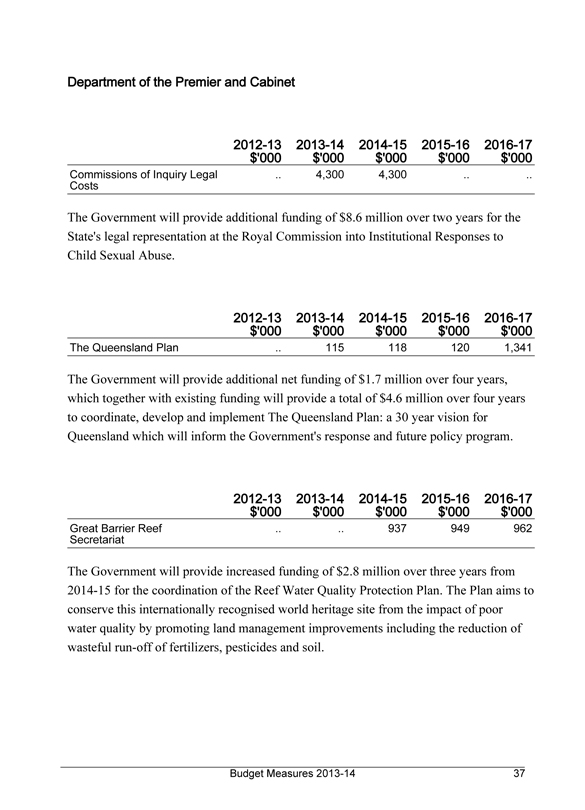
Department of the Premier and Cabinet
2012-13
2013-14
2014-15
2015-16
2016-17
$‘000
$‘000
$‘000
$‘000
$‘000
Commissions of Inquiry Legal Costs
..
4,300
4,300
..
..
The Government will provide additional funding of $8.6 million over two years for the State’s legal representation at the Royal Commission into Institutional Responses to Child Sexual Abuse.
2012-13
2013-14
2014-15
2015-16
2016-17
$‘000
$‘000
$‘000
$‘000
$‘000
The Queensland Plan
..
115
118
120
1,341
The Government will provide additional net funding of $1.7 million over four years, which together with existing funding will provide a total of $4.6 million over four years to coordinate, develop and implement The Queensland Plan: a 30 year vision for Queensland which will inform the Government’s response and future policy program.
2012-13
2013-14
2014-15
2015-16
2016-17
$‘000
$‘000
$‘000
$‘000
$‘000
Great Barrier Reef Secretariat
..
..
937
949
962
The Government will provide increased funding of $2.8 million over three years from 2014-15 for the coordination of the Reef Water Quality Protection Plan. The Plan aims to conserve this internationally recognised world heritage site from the impact of poor water quality by promoting land management improvements including the reduction of wasteful run-off of fertilizers, pesticides and soil.
Budget Measures 2013-14
37
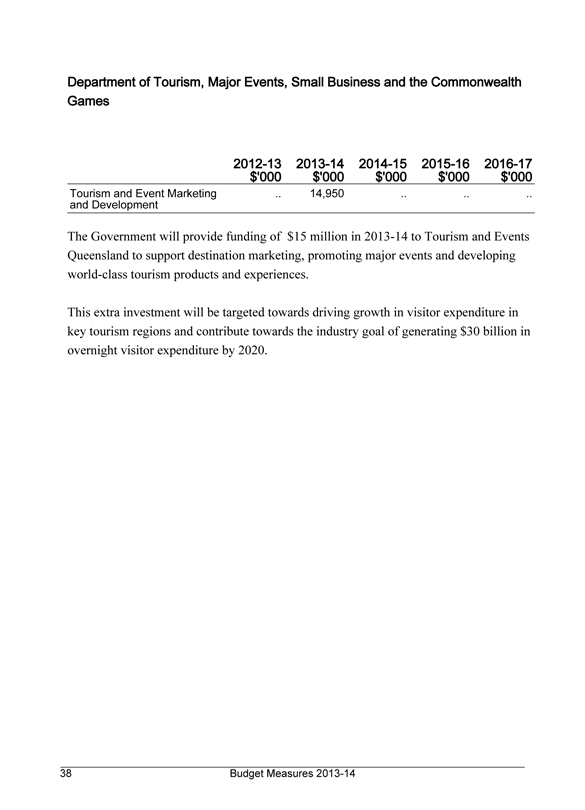
Department of Tourism, Major Events, Small Business and the Commonwealth Games
2012-13
2013-14
2014-15
2015-16
2016-17
$‘000
$‘000
$‘000
$‘000
$‘000
Tourism and Event Marketing and Development
..
14,950
..
..
..
The Government will provide funding of $15 million in 2013-14 to Tourism and Events Queensland to support destination marketing, promoting major events and developing world-class tourism products and experiences.
This extra investment will be targeted towards driving growth in visitor expenditure in key tourism regions and contribute towards the industry goal of generating $30 billion in overnight visitor expenditure by 2020.
Budget Measures 2013-14
38
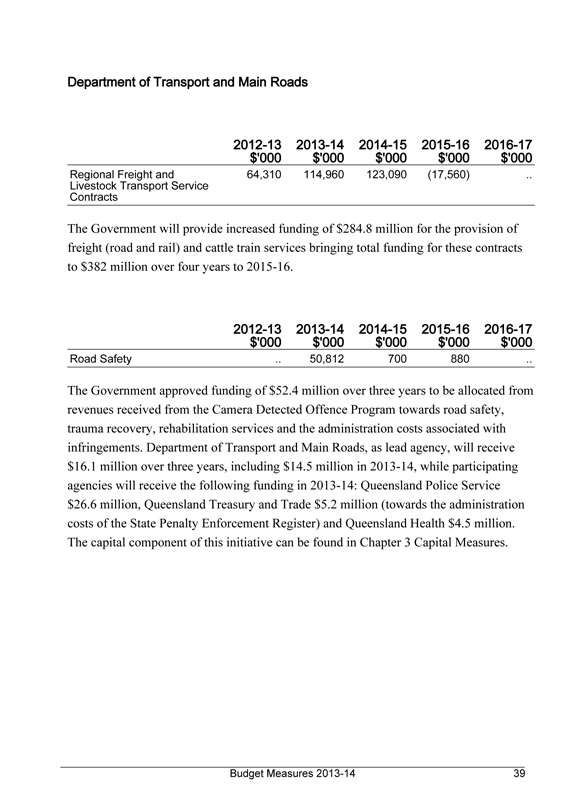
Department of Transport and Main Roads
2012-13
2013-14
2014-15
2015-16
2016-17
$‘000
$‘000
$‘000
$‘000
$‘000
Regional Freight and Livestock Transport Service Contracts
64,310
114,960
123,090
(17,560)
..
The Government will provide increased funding of $284.8 million for the provision of freight (road and rail) and cattle train services bringing total funding for these contracts to $382 million over four years to 2015-16.
2012-13
2013-14
2014-15
2015-16
2016-17
$‘000
$‘000
$‘000
$‘000
$‘000
Road Safety
..
50,812
700
880
..
The Government approved funding of $52.4 million over three years to be allocated from revenues received from the Camera Detected Offence Program towards road safety, trauma recovery, rehabilitation services and the administration costs associated with infringements. Department of Transport and Main Roads, as lead agency, will receive $16.1 million over three years, including $14.5 million in 2013-14, while participating agencies will receive the following funding in 2013-14: Queensland Police Service $26.6 million, Queensland Treasury and Trade $5.2 million (towards the administration costs of the State Penalty Enforcement Register) and Queensland Health $4.5 million. The capital component of this initiative can be found in Chapter 3 Capital Measures.
Budget Measures 2013-14
39
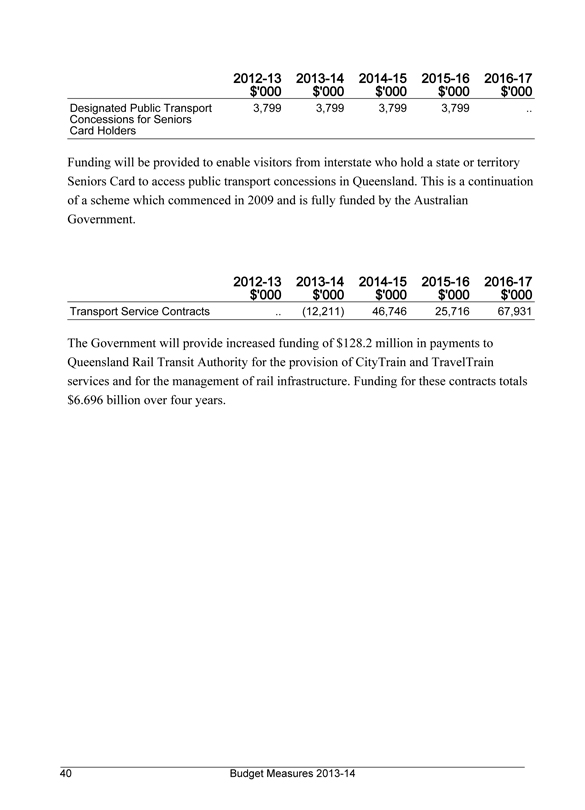
2012-13
2013-14
2014-15
2015-16
2016-17
$‘000
$‘000
$‘000
$‘000
$‘000
Designated Public Transport Concessions for Seniors Card Holders
3,799
3,799
3,799
3,799
..
Funding will be provided to enable visitors from interstate who hold a state or territory Seniors Card to access public transport concessions in Queensland. This is a continuation of a scheme which commenced in 2009 and is fully funded by the Australian Government.
2012-13
2013-14
2014-15
2015-16
2016-17
$‘000
$‘000
$‘000
$‘000
$‘000
Transport Service Contracts
..
(12,211)
46,746
25,716
67,931
The Government will provide increased funding of $128.2 million in payments to Queensland Rail Transit Authority for the provision of CityTrain and TravelTrain services and for the management of rail infrastructure. Funding for these contracts totals $6.696 billion over four years.
Budget Measures 2013-14
40
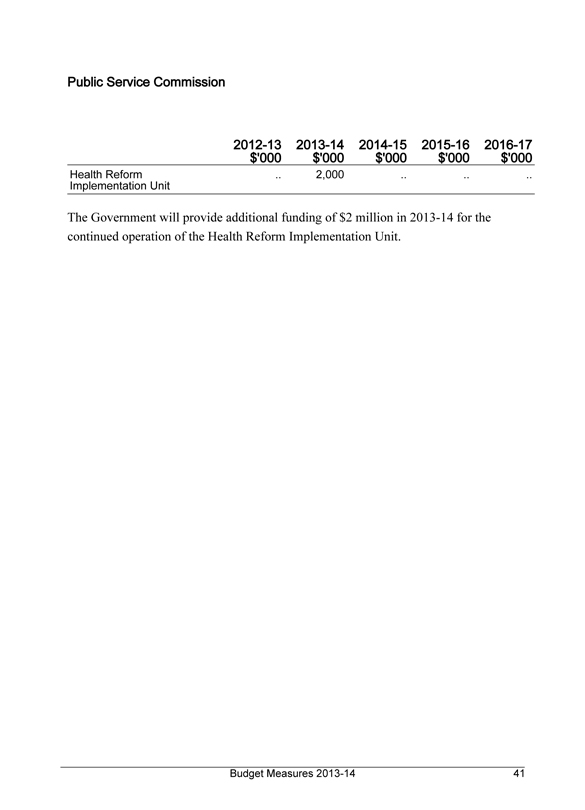
Public Service Commission
2012-13
2013-14
2014-15
2015-16
2016-17
$‘000
$‘000
$‘000
$‘000
$‘000
Health Reform Implementation Unit
..
2,000
..
..
..
The Government will provide additional funding of $2 million in 2013-14 for the continued operation of the Health Reform Implementation Unit.
Budget Measures 2013-14
41
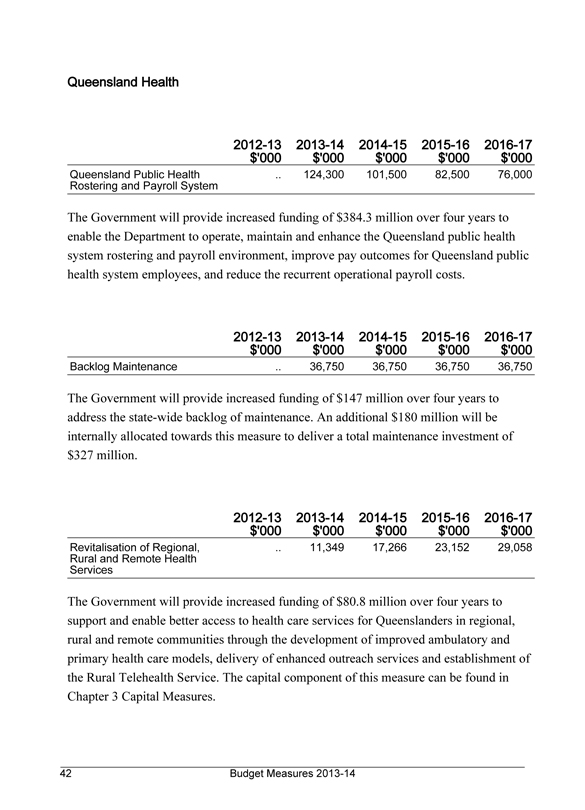
Queensland Health
2012-13
2013-14
2014-15
2015-16
2016-17
$‘000
$‘000
$‘000
$‘000
$‘000
Queensland Public Health Rostering and Payroll System
..
124,300
101,500
82,500
76,000
The Government will provide increased funding of $384.3 million over four years to enable the Department to operate, maintain and enhance the Queensland public health system rostering and payroll environment, improve pay outcomes for Queensland public health system employees, and reduce the recurrent operational payroll costs.
2012-13
2013-14
2014-15
2015-16
2016-17
$‘000
$‘000
$‘000
$‘000
$‘000
Backlog Maintenance
..
36,750
36,750
36,750
36,750
The Government will provide increased funding of $147 million over four years to address the state-wide backlog of maintenance. An additional $180 million will be internally allocated towards this measure to deliver a total maintenance investment of $327 million.
2012-13
2013-14
2014-15
2015-16
2016-17
$‘000
$‘000
$‘000
$‘000
$‘000
Revitalisation of Regional, Rural and Remote Health Services
..
11,349
17,266
23,152
29,058
The Government will provide increased funding of $80.8 million over four years to support and enable better access to health care services for Queenslanders in regional, rural and remote communities through the development of improved ambulatory and primary health care models, delivery of enhanced outreach services and establishment of the Rural Telehealth Service. The capital component of this measure can be found in Chapter 3 Capital Measures.
Budget Measures 2013-14
42
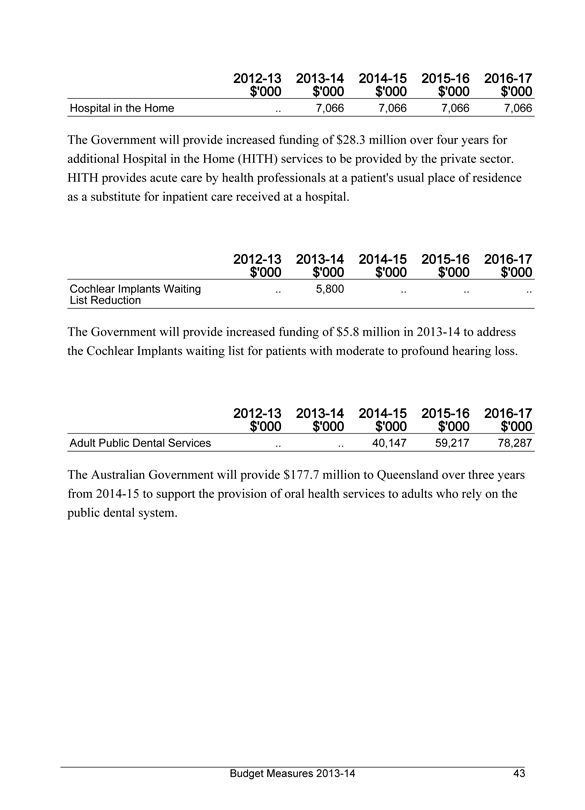
2012-13
2013-14
2014-15
2015-16
2016-17
$‘000
$‘000
$‘000
$‘000
$‘000
Hospital in the Home
..
7,066
7,066
7,066
7,066
The Government will provide increased funding of $28.3 million over four years for additional Hospital in the Home (HITH) services to be provided by the private sector. HITH provides acute care by health professionals at a patient’s usual place of residence as a substitute for inpatient care received at a hospital.
2012-13
2013-14
2014-15
2015-16
2016-17
$‘000
$‘000
$‘000
$‘000
$‘000
Cochlear Implants Waiting List Reduction
..
5,800
..
..
..
The Government will provide increased funding of $5.8 million in 2013-14 to address the Cochlear Implants waiting list for patients with moderate to profound hearing loss.
2012-13
2013-14
2014-15
2015-16
2016-17
$‘000
$‘000
$‘000
$‘000
$‘000
Adult Public Dental Services
..
..
40,147
59,217
78,287
The Australian Government will provide $177.7 million to Queensland over three years from 2014-15 to support the provision of oral health services to adults who rely on the public dental system.
Budget Measures 2013-14
43
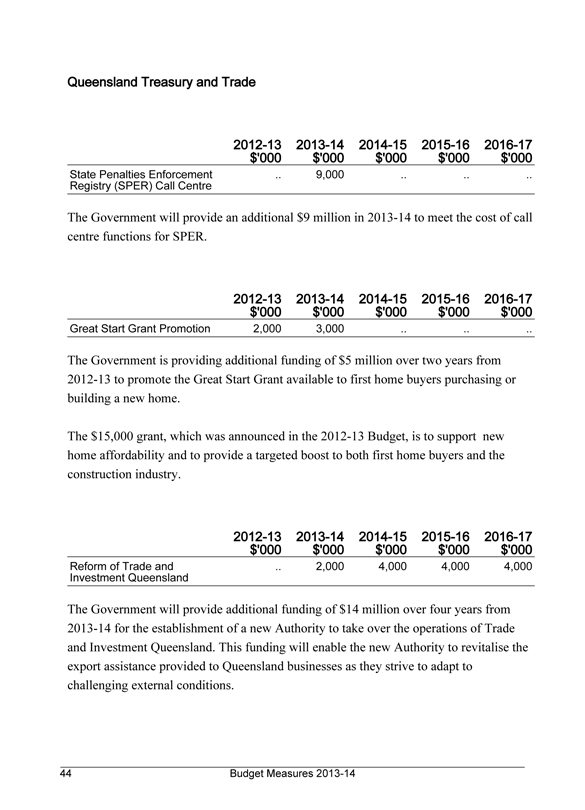
Queensland Treasury and Trade
2012-13
2013-14
2014-15
2015-16
2016-17
$‘000
$‘000
$‘000
$‘000
$‘000
State Penalties Enforcement Registry (SPER) Call Centre
..
9,000
..
..
..
The Government will provide an additional $9 million in 2013-14 to meet the cost of call centre functions for SPER.
2012-13
2013-14
2014-15
2015-16
2016-17
$‘000
$‘000
$‘000
$‘000
$‘000
Great Start Grant Promotion
2,000
3,000
..
..
..
The Government is providing additional funding of $5 million over two years from 2012-13 to promote the Great Start Grant available to first home buyers purchasing or building a new home.
The $15,000 grant, which was announced in the 2012-13 Budget, is to support new home affordability and to provide a targeted boost to both first home buyers and the construction industry.
2012-13
2013-14
2014-15
2015-16
2016-17
$‘000
$‘000
$‘000
$‘000
$‘000
Reform of Trade and Investment Queensland
..
2,000
4,000
4,000
4,000
The Government will provide additional funding of $14 million over four years from 2013-14 for the establishment of a new Authority to take over the operations of Trade and Investment Queensland. This funding will enable the new Authority to revitalise the export assistance provided to Queensland businesses as they strive to adapt to challenging external conditions.
Budget Measures 2013-14
44
3. CAPITAL MEASURES
Introduction
The following tables present the relevant portfolio capital measures relating to decisions taken since the 2012-13 Budget. This does not represent the full amount of additional funding provided to agencies since the 2012-13 Budget. For further explanation, refer to Explanation of Scope and Terms in Chapter 1.
Budget Measures 2013-14
45
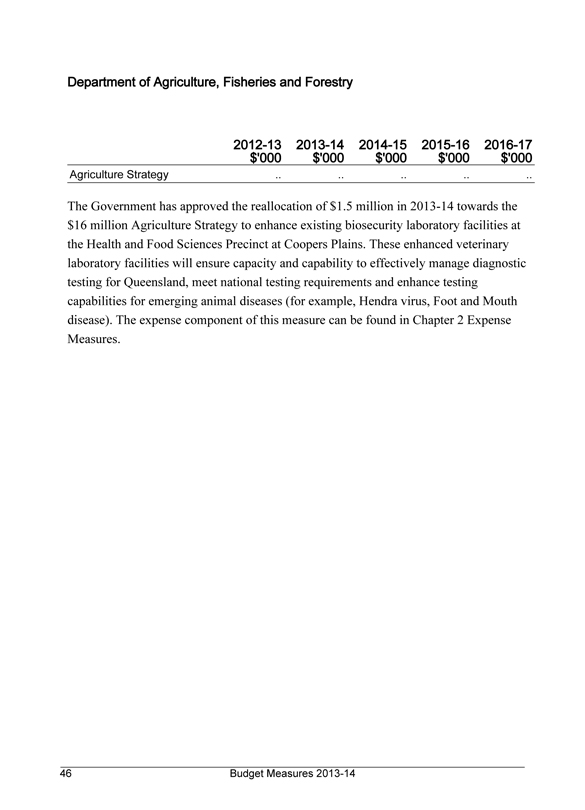
Department of Agriculture, Fisheries and Forestry
2012-13
2013-14
2014-15
2015-16
2016-17
$‘000
$‘000
$‘000
$‘000
$‘000
Agriculture Strategy
..
..
..
..
..
The Government has approved the reallocation of $1.5 million in 2013-14 towards the $16 million Agriculture Strategy to enhance existing biosecurity laboratory facilities at the Health and Food Sciences Precinct at Coopers Plains. These enhanced veterinary laboratory facilities will ensure capacity and capability to effectively manage diagnostic testing for Queensland, meet national testing requirements and enhance testing capabilities for emerging animal diseases (for example, Hendra virus, Foot and Mouth disease). The expense component of this measure can be found in Chapter 2 Expense Measures.
Budget Measures 2013-14
46
Department of Education, Training and Employment
2012-13
2013-14
2014-15
2015-16
2016-17
$‘000
$‘000
$‘000
$‘000
$‘000
New Schools - Public Private Partnership
..
..
..
..
..
The Government is currently in a tender process with interested parties to participate in a Public Private Partnership (PPP) to deliver ten new state schools to meet Queensland’s growing education needs. The first of these new state schools is to open for the start of the 2015 school year. The ten new schools will consist of two secondary and eight primary schools, catering for up to 10,800 students and employing up to 540 teachers and 130 non-teaching positions. Funding for the new schools is already contained in the department’s capital program forward estimates.
Budget Measures 2013-14
47
Department of Housing and Public Works
2012-13 2013-14 2014-15 2015-16 2016-17
$‘000 $‘000 $‘000 $‘000 $‘000
Government House .. .. 3,335 .. ..
Refurbishment and Equitable
Access
The Government will provide additional funding of $3.3 million in 2014-15 to deliver equitable access and facilities at Government House for persons with disabilities.
2012-13 2013-14 2014-15 2015-16 2016-17
$‘000 $‘000 $‘000 $‘000 $‘000
Sale and Leaseback of (527,000) .. .. .. ..
Government Office
Accommodation Sale
Proceeds
The Government sold seven Government office buildings to private and public investors of the Queensland Investment Corporation for $527 million in 2012-13. The proceeds from this sale will be used to pay down debt.
48 Budget Measures 2013-14
Department of National Parks, Recreation, Sport and Racing
2012-13 2013-14 2014-15 2015-16 2016-17
$‘000 $‘000 $‘000 $‘000 $‘000
Protecting Cape York - Joint .. 900 1,500 4,300 ..
Management With Traditional
Owners
The Government will provide increased funding of $6.7 million over three years from 2013-14 for the implementation of joint park management for lands to be declared protected areas under the Cape York Peninsula Tenure Resolution Program. Further funding for this measure can be found in the Department of Aboriginal and Torres Strait Islander and Multicultural Affairs and the Department of National Parks, Recreation, Sport and Racing sections of Chapter 2 Expense Measures.
Budget Measures 2013-14 49
Department of Natural Resources and Mines
2012-13 2013-14 2014-15 2015-16 2016-17
$‘000 $‘000 $‘000 $‘000 $‘000
Coal Seam Gas Regulation .. 200 .. .. ..
The Government will provide funding of $0.2 million for the regulation and administration of the Coal Seam Gas industry (a total of $11 million across Departments). The funding is for 2013-14 only as the Office of Best Practice Regulation (OBPR) is to undertake a comprehensive review of the State’s approach to Coal Seam Gas industry regulation. The OBPR will develop options for cost recovery based on best practice regulation. The expense component of this measure can be found in Chapter 2 Expense Measures including the Department of Energy and Water Supply, the Department of Environment and Heritage Protection and the Department of State Development, Infrastructure and Planning sections.
50 Budget Measures 2013-14
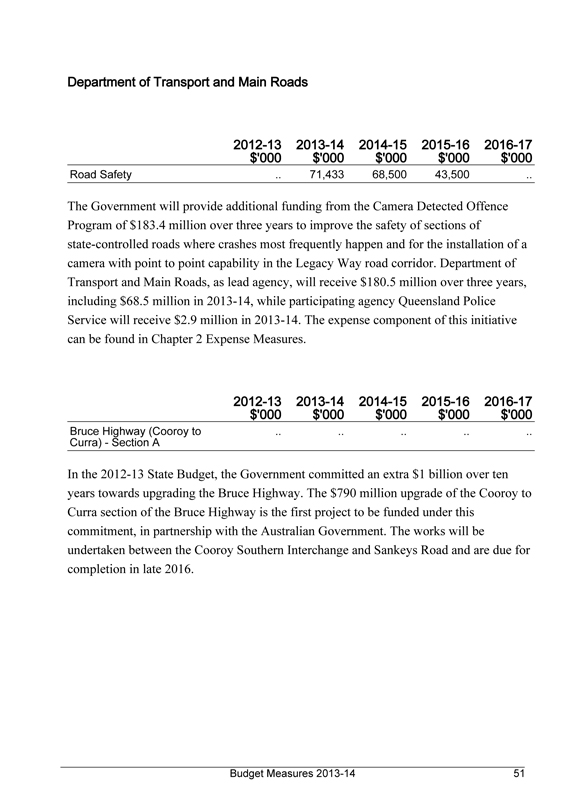
Department of Transport and Main Roads
2012-13 2013-14 2014-15 2015-16 2016-17
$‘000 $‘000 $‘000 $‘000 $‘000
Road Safety .. 71,433 68,500 43,500 ..
The Government will provide additional funding from the Camera Detected Offence Program of $183.4 million over three years to improve the safety of sections of state-controlled roads where crashes most frequently happen and for the installation of a camera with point to point capability in the Legacy Way road corridor. Department of Transport and Main Roads, as lead agency, will receive $180.5 million over three years, including $68.5 million in 2013-14, while participating agency Queensland Police Service will receive $2.9 million in 2013-14. The expense component of this initiative can be found in Chapter 2 Expense Measures.
2012-13 2013-14 2014-15 2015-16 2016-17
$‘000 $‘000 $‘000 $‘000 $‘000
Bruce Highway (Cooroy to Curra) - Section A .. .. .. .. ..
In the 2012-13 State Budget, the Government committed an extra $1 billion over ten years towards upgrading the Bruce Highway. The $790 million upgrade of the Cooroy to Curra section of the Bruce Highway is the first project to be funded under this commitment, in partnership with the Australian Government. The works will be undertaken between the Cooroy Southern Interchange and Sankeys Road and are due for completion in late 2016.
Budget Measures 2013-14 51
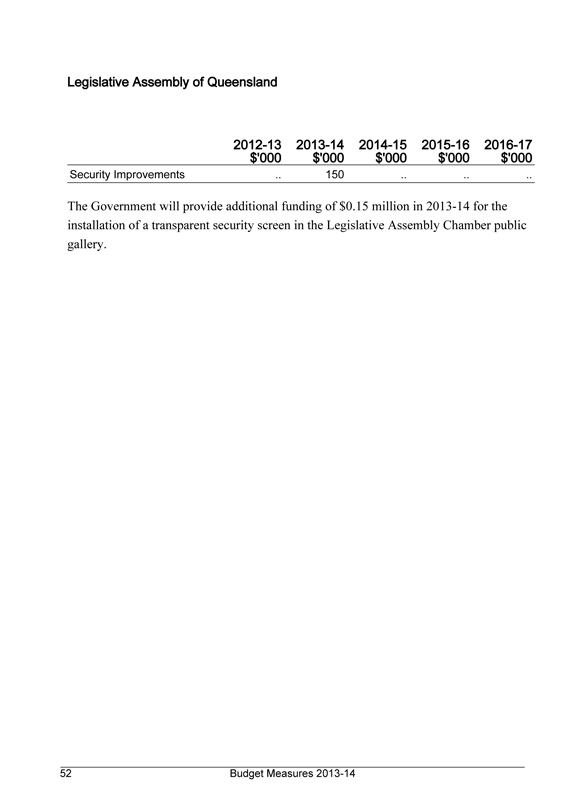
Legislative Assembly of Queensland
2012-13 2013-14 2014-15 2015-16 2016-17
$‘000 $‘000 $‘000 $‘000 $‘000
Security Improvements .. 150 .. .. ..
The Government will provide additional funding of $0.15 million in 2013-14 for the installation of a transparent security screen in the Legislative Assembly Chamber public gallery.
52 Budget Measures 2013-14
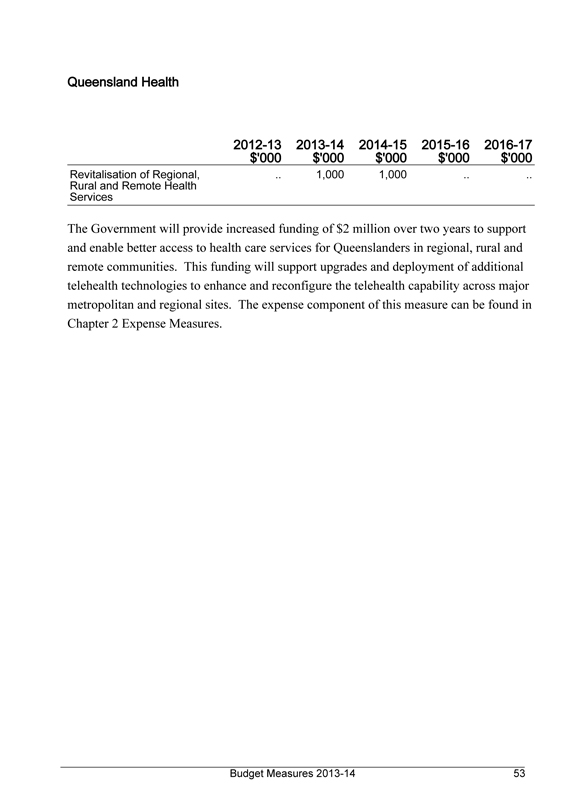
Queensland Health
2012-13 2013-14 2014-15 2015-16 2016-17
$‘000 $‘000 $‘000 $‘000 $‘000
Revitalisation of Regional, .. 1,000 1,000 .. ..
Rural and Remote Health
Services
The Government will provide increased funding of $2 million over two years to support and enable better access to health care services for Queenslanders in regional, rural and remote communities. This funding will support upgrades and deployment of additional telehealth technologies to enhance and reconfigure the telehealth capability across major metropolitan and regional sites. The expense component of this measure can be found in Chapter 2 Expense Measures.
Budget Measures 2013-14 53
4. REVENUE MEASURES
Introduction
The following tables present the relevant portfolio revenue measures relating to decisions taken since the 2012-13 Budget. For further explanation, refer to Explanation of Scope and Terms in Chapter 1.
54 Budget Measures 2013-14
Department of Community Safety
2012-13 2013-14 2014-15 2015-16 2016-17
$‘000 $‘000 $‘000 $‘000 $‘000
Emergency Management, .. 24,183 51,389 54,421 57,632
Fire and Rescue Levy
From 1 January 2014, the Government is increasing and broadening the coverage of the Urban Fire Levy to ensure a sustainable funding base for emergency services. The levy will be known as the Emergency Management, Fire and Rescue Levy and will be applied to all rateable properties. Local governments affected for the first time will be provided with transitional assistance.
Budget Measures 2013-14 55
Department of Justice and Attorney-General
2012-13 2013-14 2014-15 2015-16 2016-17
$‘000 $‘000 $‘000 $‘000 $‘000
Queensland Civil and .. 200 400 400 400
Administrative Tribunal
(QCAT) Annual Fee
The Government is introducing an annual fee to oversee appointments of administrators for adults with impaired capacity where an affected adult has assets of more than $50,000.
56 Budget Measures 2013-14
Queensland Treasury and Trade
2012-13 2013-14 2014-15 2015-16 2016-17
$‘000 $‘000 $‘000 $‘000 $‘000
Insurance Duty Rate .. 195,000 250,000 265,000 280,000
Increase
The Government has determined that the rate of duty applicable to insurance premiums for general insurance products will increase to 9% from 1 August 2013. There will be no increase in the duty rate applicable to workers’ compensation insurance premiums or Compulsory Third Party motor vehicle insurance premiums. Queensland’s insurance duty regime will remain competitive with other states. This measure will assist in meeting the State’s contribution to implementation of the National Disability Insurance Scheme (DisabilityCare). Further details of this measure, along with interstate comparisons, are provided in the Revenue Chapter of Budget Paper 2.
2012-13 2013-14 2014-15 2015-16 2016-17
$‘000 $‘000 $‘000 $‘000 $‘000
Deferral of Increase in Payroll .. 40,000 85,000 90,000 100,000
Tax Threshold
Queensland has a highly competitive payroll tax regime, with the lowest rate of payroll tax in Australia (4.75%) and the highest threshold of any mainland state ($1.1 million). The Government has committed to further enhancing Queensland’s competitiveness by increasing the payroll tax threshold to $1.6 million. The next increase in the payroll tax threshold, to $1.2 million, which had been intended to take effect from 1 July 2013, will now be deferred until 1 July 2015. Further details of this measure, along with interstate comparisons, are provided in the Revenue Chapter of Budget Paper 2.
Budget Measures 2013-14 57

State Budget 2013-14 Budget Measures Budget Paper No.4 www.budget.qld.gov.au

State Budget 2013-14 Budget Measures Budget Paper No.4 www.budget.qld.gov.au
State Budget 2013-14
Concessions Statement
Great state. Great opportunity.
Queensland
Government
2013-14 State Budget Papers
1. Budget Speech
2. Budget Strategy and Outlook
3. Capital Statement
4. Budget Measures
5. Service Delivery Statements Appropriation Bills Concessions Statement
The suite of Budget Papers is similar to that published in 2012-13. The Budget Papers are available online at www.budget.qld.gov.au
© Crown copyright All rights reserved
Queensland Government 2013
Excerpts from this publication may be reproduced, with appropriate acknowledgement, as permitted under the Copyright Act.
Concessions Statement
ISSN 1445-4890 (Print)
ISSN 1445-4904 (Online)
Queensland
Government
STATE BUDGET 2013-14
CONCESSIONS STATEMENT
TABLE OF CONTENTS
1. Overview 1
Introduction 1
Focus 2
Explanation of Scope 2
Summary Table 4
2. Concessions by Agency 8
Department of Agriculture, Fisheries and Forestry 8
Department of Communities, Child Safety and Disability Services 9
Commission for Children and Young People and Child Guardian 11
Department of Community Safety 11
Department of Education, Training and Employment 12
Department of Energy and Water Supply 19
Department of Housing and Public Works 21
Department of Justice and Attorney-General 23
Department of National Parks, Recreation, Sport and Racing 24
Department of Science, Information Technology, Innovation and the Arts 25
Department of Transport and Main Roads 27
Queensland Health 31
CS Energy Limited 33
ENERGEX Limited 33
Far North Queensland Ports Corporation Limited 34
Gladstone Ports Corporation Limited 34
North Queensland Bulk Ports Corporation Limited 35
Port of Townsville Limited 35
Queensland Rail 35
Stanwell Corporation Limited 36
SunWater Limited 37
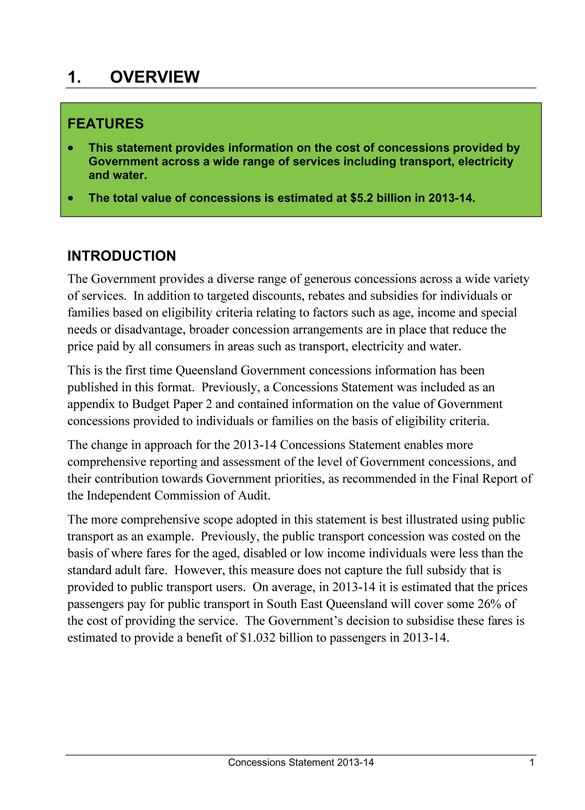
1. OVERVIEW
FEATURES
· This statement provides information on the cost of concessions provided by Government across a wide range of services including transport, electricity and water.
· The total value of concessions is estimated at $5.2 billion in 2013-14.
INTRODUCTION
The Government provides a diverse range of generous concessions across a wide variety of services. In addition to targeted discounts, rebates and subsidies for individuals or families based on eligibility criteria relating to factors such as age, income and special needs or disadvantage, broader concession arrangements are in place that reduce the price paid by all consumers in areas such as transport, electricity and water.
This is the first time Queensland Government concessions information has been published in this format. Previously, a Concessions Statement was included as an appendix to Budget Paper 2 and contained information on the value of Government concessions provided to individuals or families on the basis of eligibility criteria.
The change in approach for the 2013-14 Concessions Statement enables more comprehensive reporting and assessment of the level of Government concessions, and their contribution towards Government priorities, as recommended in the Final Report of the Independent Commission of Audit.
The more comprehensive scope adopted in this statement is best illustrated using public transport as an example. Previously, the public transport concession was costed on the basis of where fares for the aged, disabled or low income individuals were less than the standard adult fare. However, this measure does not capture the full subsidy that is provided to public transport users. On average, in 2013-14 it is estimated that the prices passengers pay for public transport in South East Queensland will cover some 26% of the cost of providing the service. The Government’s decision to subsidise these fares is estimated to provide a benefit of $1.032 billion to passengers in 2013-14.
Concessions Statement 2013-14
1
The majority of people will benefit from at least one concession and in many cases will benefit from multiple concessions each year. For example, an aged pensioner is eligible for a number of State Government concessions, including discounts on their council rates, water, gas and electricity bills, vehicle registration fees as well as subsidised optometry and dental services. The total value of these concessions alone is up to $1,511 per year and would increase significantly with the use of public transport, long distance train travel entitlements and other eligible concessions.
It is acknowledged that the document still does not cover the full range of concessions offered by the Government (for example, not all fees and charges that are below full cost recovery have been able to be included). The Government will continue to refine its approach to reporting concessions in order to include the full range of concessions. More information on the eligibility requirements and benefits of a range of Government concessions can be found at: http://www.communities.qld.gov.au/communityservices/community-support/queensland-government-concessions/
FOCUS
This statement highlights the cost and nature of concessions covering those that are reflected as outlays in the Budget (for example, direct subsidy payments) and revenue foregone through fees and charges that are set at a lower rate than applies to the wider community or, in the case of broader concessions, the full cost of service provision.
Table 1 sets out the cost of concessions by agency. The total value of these concessions is estimated at $5.2 billion in 2013-14. This represents a significant Government and taxpayer commitment to improving the accessibility and affordability of a diverse range of services and reducing the price paid by consumers of those services.
EXPLANATION OF SCOPE
For the purposes of this document, concessions include:
· discounts, rebates and subsidies to improve access to, and the affordability of, a range of services for individuals or families based on eligibility criteria relating to factors such as age, income and special needs or disadvantage
· concessional prices for Government services, where the price charged to all consumers is less than the full cost of service provision.
Concessions Statement 2013-14
2
Both General Government (GG) and Public Non-financial Corporation (PNFC) sector concessions are included. Where a payment is made from a GG sector agency to a PNFC entity for a concession arrangement, the expenditure is reported against the GG sector agency only to avoid double counting.
Varying methods have been used to estimate the cost of concessions depending on the nature of the concession, including:
· direct Budget outlay cost (for example, direct subsidy or rebate payments or Government’s contribution in the case of items such as rental subsidies)
· revenue foregone (for example, concessional fees and charges)
· cost of goods and services provided.
For the purposes of illustration, the document often uses averages to demonstrate the value of the concession to consumers. However, averages are not reflective of individual circumstances, meaning the actual dollar value of the concession to consumers will vary from person to person.
This Concessions Statement does not include Tax Expenditures (for example, tax exemptions, reduced tax rates, tax rebates and deductions) which continue to be provided as an appendix to Budget Paper 2.
Concessions Statement 2013-14
3
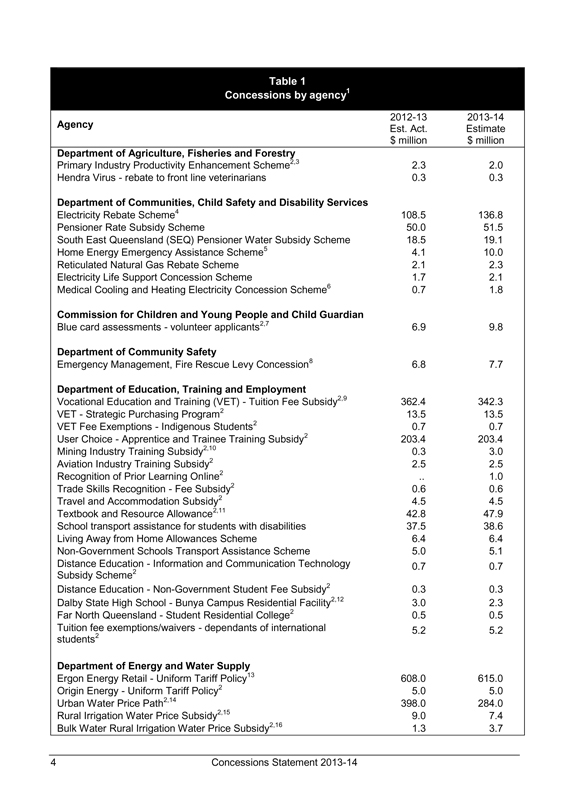
Table 1
Concessions by agency1
2012-13 2013-14
Agency Est. Act. Estimate
$ million $ million
Department of Agriculture, Fisheries and Forestry
Primary Industry Productivity Enhancement Scheme2,3 2.3 2.0
Hendra Virus - rebate to front line veterinarians 0.3 0.3
Department of Communities, Child Safety and Disability Services
Electricity Rebate Scheme4 108.5 136.8
Pensioner Rate Subsidy Scheme 50.0 51.5
South East Queensland (SEQ) Pensioner Water Subsidy Scheme 18.5 19.1
Home Energy Emergency Assistance Scheme5 4.1 10.0
Reticulated Natural Gas Rebate Scheme 2.1 2.3
Electricity Life Support Concession Scheme 1.7 2.1
Medical Cooling and Heating Electricity Concession Scheme6 0.7 1.8
Commission for Children and Young People and Child Guardian
Blue card assessments - volunteer applicants2,7 6.9 9.8
Department of Community Safety Emergency Management, Fire Rescue Levy Concession8 6.8 7.7
Department of Education, Training and Employment
Vocational Education and Training (VET) - Tuition Fee Subsidy2,9 362.4 342.3
VET - Strategic Purchasing Program2 13.5 13.5
VET Fee Exemptions - Indigenous Students2 0.7 0.7
User Choice - Apprentice and Trainee Training Subsidy2 203.4 203.4
Mining Industry Training Subsidy2,10 0.3 3.0
Aviation Industry Training Subsidy2 2.5 2.5
Recognition of Prior Learning Online2 .. 1.0
Trade Skills Recognition - Fee Subsidy2 0.6 0.6
Travel and Accommodation Subsidy2 4.5 4.5
Textbook and Resource Allowance2,11 42.8 47.9
School transport assistance for students with disabilities 37.5 38.6
Living Away from Home Allowances Scheme 6.4 6.4
Non-Government Schools Transport Assistance Scheme 5.0 5.1
Distance Education - Information and Communication Technology 0.7 0.7
Subsidy Scheme2
Distance Education - Non-Government Student Fee Subsidy2 0.3 0.3
Dalby State High School - Bunya Campus Residential Facility2,12 3.0 2.3
Far North Queensland - Student Residential College2 0.5 0.5
Tuition fee exemptions/waivers - dependants of international 5.2 5.2
students2
Department of Energy and Water Supply
Ergon Energy Retail - Uniform Tariff Policy13 608.0 615.0
Origin Energy - Uniform Tariff Policy2 5.0 5.0
Urban Water Price Path2,14 398.0 284.0
Rural Irrigation Water Price Subsidy2,15 9.0 7.4
Bulk Water Rural Irrigation Water Price Subsidy2,16 1.3 3.7
Concessions Statement 2013-14
4
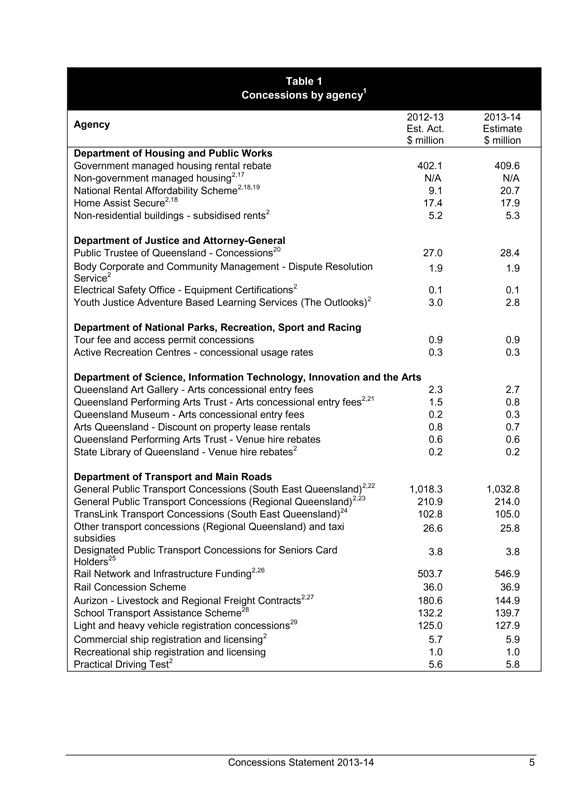
Table 1
Concessions by agency1
2012-13 2013-14
Agency Est. Act. Estimate
$ million $ million
Department of Housing and Public Works
Government managed housing rental rebate 402.1 409.6
Non-government managed housing2,17 N/A N/A
National Rental Affordability Scheme2,18,19 9.1 20.7
Home Assist Secure2,18 17.4 17.9
Non-residential buildings - subsidised rents2 5.2 5.3
Department of Justice and Attorney-General
Public Trustee of Queensland - Concessions20 27.0 28.4
Body Corporate and Community Management - Dispute Resolution 1.9 1.9
Service2
Electrical Safety Office - Equipment Certifications2 0.1 0.1
Youth Justice Adventure Based Learning Services (The Outlooks)2 3.0 2.8
Department of National Parks, Recreation, Sport and Racing
Tour fee and access permit concessions 0.9 0.9
Active Recreation Centres - concessional usage rates 0.3 0.3
Department of Science, Information Technology, Innovation and the Arts
Queensland Art Gallery - Arts concessional entry fees 2.3 2.7
Queensland Performing Arts Trust - Arts concessional entry fees2,21 1.5 0.8
Queensland Museum - Arts concessional entry fees 0.2 0.3
Arts Queensland - Discount on property lease rentals 0.8 0.7
Queensland Performing Arts Trust - Venue hire rebates 0.6 0.6
State Library of Queensland - Venue hire rebates2 0.2 0.2
Department of Transport and Main Roads
General Public Transport Concessions (South East Queensland)2,22 1,018.3 1,032.8
General Public Transport Concessions (Regional Queensland)2,23 210.9 214.0
TransLink Transport Concessions (South East Queensland)24 102.8 105.0
Other transport concessions (Regional Queensland) and taxi 26.6 25.8
subsidies
Designated Public Transport Concessions for Seniors Card 3.8 3.8
Holders25
Rail Network and Infrastructure Funding2,26 503.7 546.9
Rail Concession Scheme 36.0 36.9
Aurizon - Livestock and Regional Freight Contracts2,27 180.6 144.9
School Transport Assistance Scheme28 132.2 139.7
Light and heavy vehicle registration concessions29 125.0 127.9
Commercial ship registration and licensing2 5.7 5.9
Recreational ship registration and licensing 1.0 1.0
Practical Driving Test2 5.6 5.8
Concessions Statement 2013-14
5
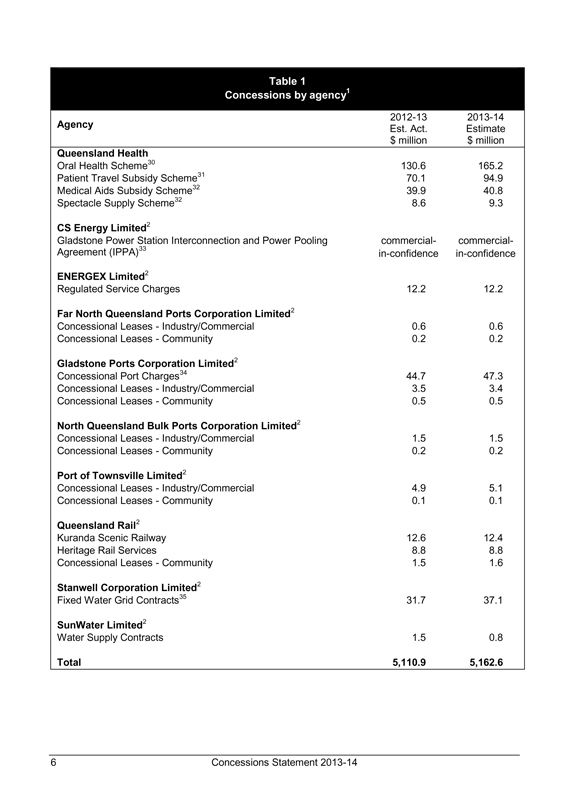
Table 1
Concessions by agency1
Agency 2012-13 Est. Act. $ million 2013-14 Estimate $ million
Queensland Health
Oral Health Scheme30 130.6 165.2
Patient Travel Subsidy Scheme31 70.1 94.9
Medical Aids Subsidy Scheme32 39.9 40.8
Spectacle Supply Scheme32 8.6 9.3
CS Energy Limited2
Gladstone Power Station Interconnection and Power Pooling Agreement (IPPA)33 commercial-in-confidence commercial-in-confidence
ENERGEX Limited2
Regulated Service Charges 12.2 12.2
Far North Queensland Ports Corporation Limited2
Concessional Leases - Industry/Commercial 0.6 0.6
Concessional Leases - Community 0.2 0.2
Gladstone Ports Corporation Limited2
Concessional Port Charges34 44.7 47.3
Concessional Leases - Industry/Commercial 3.5 3.4
Concessional Leases - Community 0.5 0.5
North Queensland Bulk Ports Corporation Limited2
Concessional Leases - Industry/Commercial 1.5 1.5
Concessional Leases - Community 0.2 0.2
Port of Townsville Limited2
Concessional Leases - Industry/Commercial 4.9 5.1
Concessional Leases - Community 0.1 0.1
Queensland Rail2
Kuranda Scenic Railway 12.6 12.4
Heritage Rail Services 8.8 8.8
Concessional Leases - Community 1.5 1.6
Stanwell Corporation Limited2
Fixed Water Grid Contracts35 31.7 37.1
SunWater Limited2
Water Supply Contracts 1.5 0.8
Total 5,110.9 5,162.6
Concessions Statement 2013-14
6
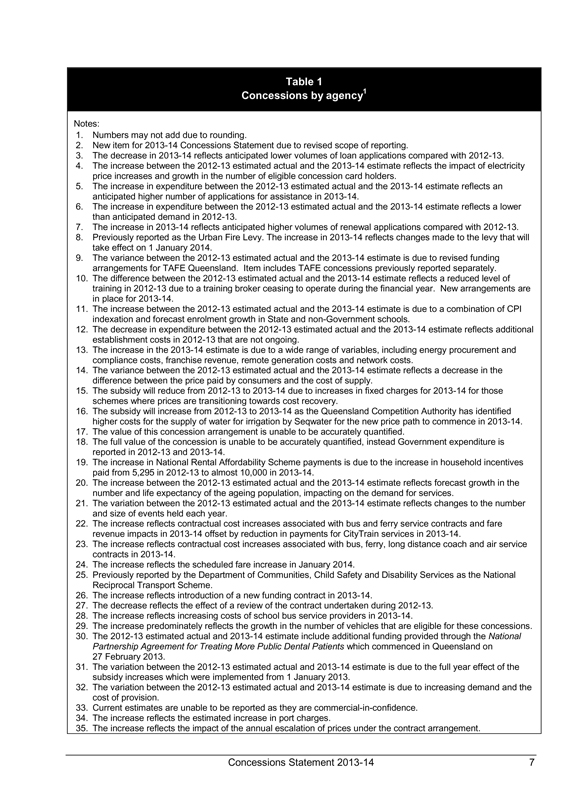
Table 1
Concessions by agency1
Notes:
1. Numbers may not add due to rounding.
2. New item for 2013-14 Concessions Statement due to revised scope of reporting.
3. The decrease in 2013-14 reflects anticipated lower volumes of loan applications compared with 2012-13.
4. The increase between the 2012-13 estimated actual and the 2013-14 estimate reflects the impact of electricity price increases and growth in the number of eligible concession card holders.
5. The increase in expenditure between the 2012-13 estimated actual and the 2013-14 estimate reflects an anticipated higher number of applications for assistance in 2013-14.
6. The increase in expenditure between the 2012-13 estimated actual and the 2013-14 estimate reflects a lower than anticipated demand in 2012-13.
7. The increase in 2013-14 reflects anticipated higher volumes of renewal applications compared with 2012-13.
8. Previously reported as the Urban Fire Levy. The increase in 2013-14 reflects changes made to the levy that will take effect on 1 January 2014.
9. The variance between the 2012-13 estimated actual and the 2013-14 estimate is due to revised funding arrangements for TAFE Queensland. Item includes TAFE concessions previously reported separately.
10. The difference between the 2012-13 estimated actual and the 2013-14 estimate reflects a reduced level of training in 2012-13 due to a training broker ceasing to operate during the financial year. New arrangements are in place for 2013-14.
11. The increase between the 2012-13 estimated actual and the 2013-14 estimate is due to a combination of CPI indexation and forecast enrolment growth in State and non-Government schools.
12. The decrease in expenditure between the 2012-13 estimated actual and the 2013-14 estimate reflects additional establishment costs in 2012-13 that are not ongoing.
13. The increase in the 2013-14 estimate is due to a wide range of variables, including energy procurement and compliance costs, franchise revenue, remote generation costs and network costs.
14. The variance between the 2012-13 estimated actual and the 2013-14 estimate reflects a decrease in the difference between the price paid by consumers and the cost of supply.
15. The subsidy will reduce from 2012-13 to 2013-14 due to increases in fixed charges for 2013-14 for those schemes where prices are transitioning towards cost recovery.
16. The subsidy will increase from 2012-13 to 2013-14 as the Queensland Competition Authority has identified higher costs for the supply of water for irrigation by Seqwater for the new price path to commence in 2013-14.
17. The value of this concession arrangement is unable to be accurately quantified.
18. The full value of the concession is unable to be accurately quantified, instead Government expenditure is reported in 2012-13 and 2013-14.
19. The increase in National Rental Affordability Scheme payments is due to the increase in household incentives paid from 5,295 in 2012-13 to almost 10,000 in 2013-14.
20. The increase between the 2012-13 estimated actual and the 2013-14 estimate reflects forecast growth in the number and life expectancy of the ageing population, impacting on the demand for services.
21. The variation between the 2012-13 estimated actual and the 2013-14 estimate reflects changes to the number and size of events held each year.
22. The increase reflects contractual cost increases associated with bus and ferry service contracts and fare revenue impacts in 2013-14 offset by reduction in payments for CityTrain services in 2013-14.
23. The increase reflects contractual cost increases associated with bus, ferry, long distance coach and air service contracts in 2013-14.
24. The increase reflects the scheduled fare increase in January 2014.
25. Previously reported by the Department of Communities, Child Safety and Disability Services as the National Reciprocal Transport Scheme.
26. The increase reflects introduction of a new funding contract in 2013-14.
27. The decrease reflects the effect of a review of the contract undertaken during 2012-13.
28. The increase reflects increasing costs of school bus service providers in 2013-14.
29. The increase predominately reflects the growth in the number of vehicles that are eligible for these concessions.
30. The 2012-13 estimated actual and 2013-14 estimate include additional funding provided through the National
Partnership Agreement for Treating More Public Dental Patients which commenced in Queensland on
27 February 2013.
31. The variation between the 2012-13 estimated actual and 2013-14 estimate is due to the full year effect of the subsidy increases which were implemented from 1 January 2013.
32. The variation between the 2012-13 estimated actual and 2013-14 estimate is due to increasing demand and the cost of provision.
33. Current estimates are unable to be reported as they are commercial-in-confidence.
34. The increase reflects the estimated increase in port charges.
35. The increase reflects the impact of the annual escalation of prices under the contract arrangement.
Concessions Statement 2013-14
7
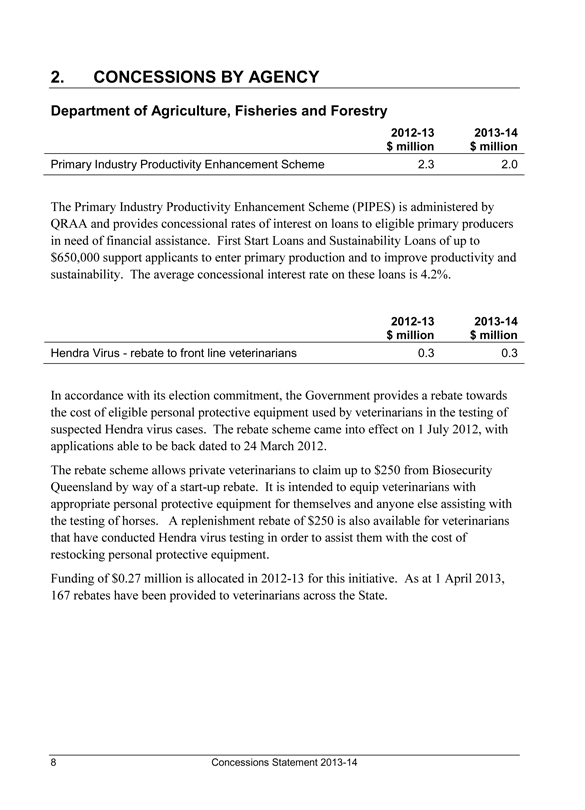
2. CONCESSIONS BY AGENCY
Department of Agriculture, Fisheries and Forestry
Primary Industry Productivity Enhancement Scheme
2012-13 $ million 2.3
2013-14 $ million 2.0
The Primary Industry Productivity Enhancement Scheme (PIPES) is administered by QRAA and provides concessional rates of interest on loans to eligible primary producers in need of financial assistance. First Start Loans and Sustainability Loans of up to $650,000 support applicants to enter primary production and to improve productivity and sustainability. The average concessional interest rate on these loans is 4.2%.
Hendra Virus - rebate to front line veterinarians
2012-13 $ million 0.3
2013-14 $ million 0.3
In accordance with its election commitment, the Government provides a rebate towards the cost of eligible personal protective equipment used by veterinarians in the testing of suspected Hendra virus cases. The rebate scheme came into effect on 1 July 2012, with applications able to be back dated to 24 March 2012.
The rebate scheme allows private veterinarians to claim up to $250 from Biosecurity Queensland by way of a start-up rebate. It is intended to equip veterinarians with appropriate personal protective equipment for themselves and anyone else assisting with the testing of horses. A replenishment rebate of $250 is also available for veterinarians that have conducted Hendra virus testing in order to assist them with the cost of restocking personal protective equipment.
Funding of $0.27 million is allocated in 2012-13 for this initiative. As at 1 April 2013, 167 rebates have been provided to veterinarians across the State.
Concessions Statement 2013-14
8
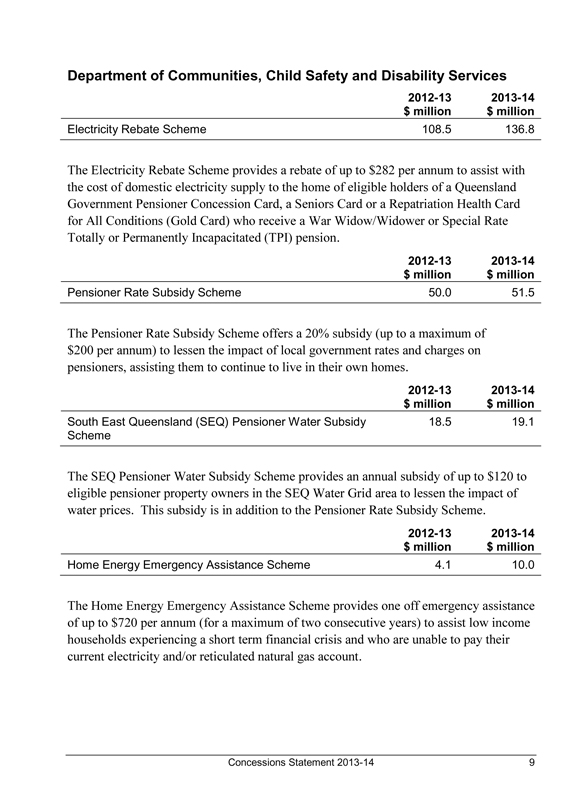
Department of Communities, Child Safety and Disability Services
Electricity Rebate Scheme
2012-13 $ million 108.5
2013-14 $ million 136.8
The Electricity Rebate Scheme provides a rebate of up to $282 per annum to assist with the cost of domestic electricity supply to the home of eligible holders of a Queensland Government Pensioner Concession Card, a Seniors Card or a Repatriation Health Card for All Conditions (Gold Card) who receive a War Widow/Widower or Special Rate Totally or Permanently Incapacitated (TPI) pension.
Pensioner Rate Subsidy Scheme
2012-13 $ million 50.0
2013-14 $ million 51.5
The Pensioner Rate Subsidy Scheme offers a 20% subsidy (up to a maximum of $200 per annum) to lessen the impact of local government rates and charges on pensioners, assisting them to continue to live in their own homes.
South East Queensland (SEQ) Pensioner Water Subsidy Scheme
2012-13 $ million 18.5
2013-14 $ million 19.1
The SEQ Pensioner Water Subsidy Scheme provides an annual subsidy of up to $120 to eligible pensioner property owners in the SEQ Water Grid area to lessen the impact of water prices. This subsidy is in addition to the Pensioner Rate Subsidy Scheme.
Home Energy Emergency Assistance Scheme
2012-13 $ million 4.1
2013-14 $ million 10.0
The Home Energy Emergency Assistance Scheme provides one off emergency assistance of up to $720 per annum (for a maximum of two consecutive years) to assist low income households experiencing a short term financial crisis and who are unable to pay their current electricity and/or reticulated natural gas account.
Concessions Statement 2013-14
9
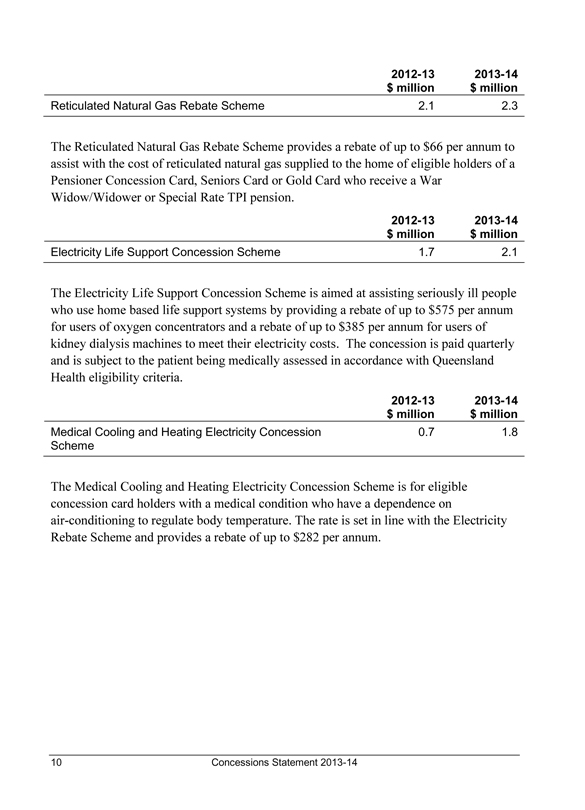
Reticulated Natural Gas Rebate Scheme
2012-13 $ million 2.1
2013-14 $ million 2.3
The Reticulated Natural Gas Rebate Scheme provides a rebate of up to $66 per annum to assist with the cost of reticulated natural gas supplied to the home of eligible holders of a Pensioner Concession Card, Seniors Card or Gold Card who receive a War Widow/Widower or Special Rate TPI pension.
Electricity Life Support Concession Scheme
2012-13 $ million 1.7
2013-14 $ million 2.1
The Electricity Life Support Concession Scheme is aimed at assisting seriously ill people who use home based life support systems by providing a rebate of up to $575 per annum for users of oxygen concentrators and a rebate of up to $385 per annum for users of kidney dialysis machines to meet their electricity costs. The concession is paid quarterly and is subject to the patient being medically assessed in accordance with Queensland Health eligibility criteria.
Medical Cooling and Heating Electricity Concession Scheme
2012-13 $ million 0.7
2013-14 $ million 1.8
The Medical Cooling and Heating Electricity Concession Scheme is for eligible concession card holders with a medical condition who have a dependence on air-conditioning to regulate body temperature. The rate is set in line with the Electricity Rebate Scheme and provides a rebate of up to $282 per annum.
Concessions Statement 2013-14
10
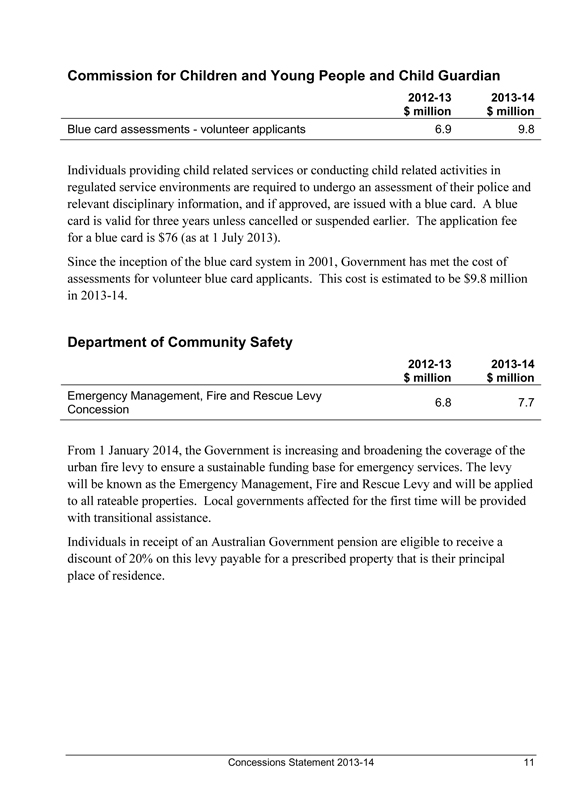
Commission for Children and Young People and Child Guardian
Blue card assessments - volunteer applicants
2012-13 $ million 6.9
2013-14 $ million 9.8
Individuals providing child related services or conducting child related activities in regulated service environments are required to undergo an assessment of their police and relevant disciplinary information, and if approved, are issued with a blue card. A blue card is valid for three years unless cancelled or suspended earlier. The application fee for a blue card is $76 (as at 1 July 2013).
Since the inception of the blue card system in 2001, Government has met the cost of assessments for volunteer blue card applicants. This cost is estimated to be $9.8 million in 2013-14.
Department of Community Safety
Emergency Management, Fire and Rescue Levy Concession
2012-13 $ million 6.8
2013-14 $ million 7.7
From 1 January 2014, the Government is increasing and broadening the coverage of the urban fire levy to ensure a sustainable funding base for emergency services. The levy will be known as the Emergency Management, Fire and Rescue Levy and will be applied to all rateable properties. Local governments affected for the first time will be provided with transitional assistance.
Individuals in receipt of an Australian Government pension are eligible to receive a discount of 20% on this levy payable for a prescribed property that is their principal place of residence.
Concessions Statement 2013-14
11
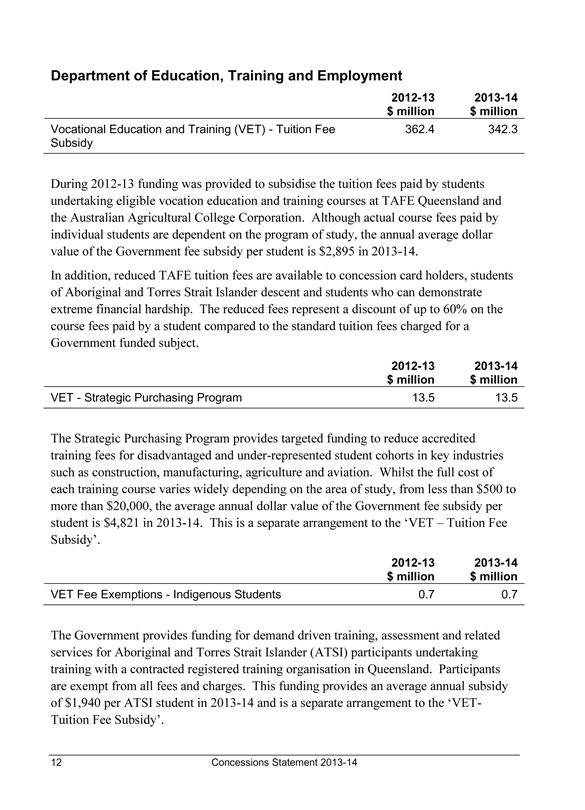
Department of Education, Training and Employment
Vocational Education and Training (VET) - Tuition Fee Subsidy
2012-13 $ million 362.4
2013-14 $ million 342.3
During 2012-13 funding was provided to subsidise the tuition fees paid by students undertaking eligible vocation education and training courses at TAFE Queensland and the Australian Agricultural College Corporation. Although actual course fees paid by individual students are dependent on the program of study, the annual average dollar value of the Government fee subsidy per student is $2,895 in 2013-14.
In addition, reduced TAFE tuition fees are available to concession card holders, students of Aboriginal and Torres Strait Islander descent and students who can demonstrate extreme financial hardship. The reduced fees represent a discount of up to 60% on the course fees paid by a student compared to the standard tuition fees charged for a Government funded subject.
VET - Strategic Purchasing Program
2012-13 $ million 13.5
2013-14 $ million 13.5
The Strategic Purchasing Program provides targeted funding to reduce accredited training fees for disadvantaged and under-represented student cohorts in key industries such as construction, manufacturing, agriculture and aviation. Whilst the full cost of each training course varies widely depending on the area of study, from less than $500 to more than $20,000, the average annual dollar value of the Government fee subsidy per student is $4,821 in 2013-14. This is a separate arrangement to the ‘VET – Tuition Fee Subsidy’.
VET Fee Exemptions - Indigenous Students
2012-13 $ million 0.7
2013-14 $ million 0.7
The Government provides funding for demand driven training, assessment and related services for Aboriginal and Torres Strait Islander (ATSI) participants undertaking training with a contracted registered training organisation in Queensland. Participants are exempt from all fees and charges. This funding provides an average annual subsidy of $1,940 per ATSI student in 2013-14 and is a separate arrangement to the ‘VET-Tuition Fee Subsidy’.
Concessions Statement 2013-14
12
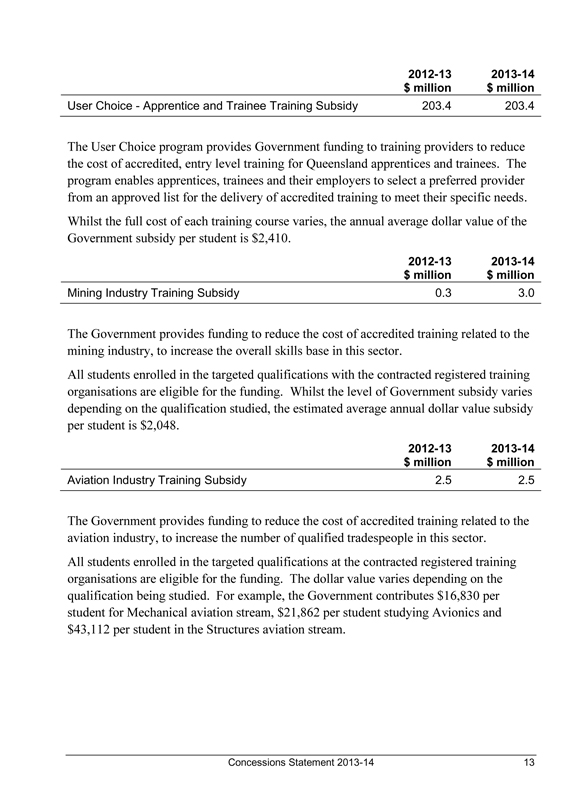
2012-13 $ million
2013-14 $ million
User Choice - Apprentice and Trainee Training Subsidy
203.4
203.4
The User Choice program provides Government funding to training providers to reduce the cost of accredited, entry level training for Queensland apprentices and trainees. The program enables apprentices, trainees and their employers to select a preferred provider from an approved list for the delivery of accredited training to meet their specific needs. Whilst the full cost of each training course varies, the annual average dollar value of the Government subsidy per student is $2,410.
2012-13 $ million
2013-14 $ million
Mining Industry Training Subsidy
0.3
3.0
The Government provides funding to reduce the cost of accredited training related to the mining industry, to increase the overall skills base in this sector.
All students enrolled in the targeted qualifications with the contracted registered training organisations are eligible for the funding. Whilst the level of Government subsidy varies depending on the qualification studied, the estimated average annual dollar value subsidy per student is $2,048.
2012-13 $ million
2013-14 $ million
Aviation Industry Training Subsidy
2.5
2.5
The Government provides funding to reduce the cost of accredited training related to the aviation industry, to increase the number of qualified tradespeople in this sector.
All students enrolled in the targeted qualifications at the contracted registered training organisations are eligible for the funding. The dollar value varies depending on the qualification being studied. For example, the Government contributes $16,830 per student for Mechanical aviation stream, $21,862 per student studying Avionics and $43,112 per student in the Structures aviation stream.
Concessions Statement 2013-14
13
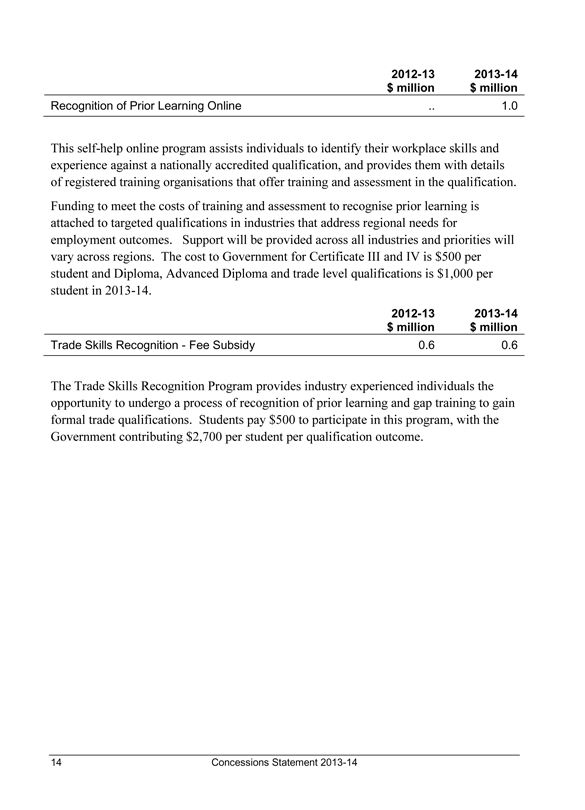
2012-13 $ million
2013-14 $ million
Recognition of Prior Learning Online
.. 1.0
This self-help online program assists individuals to identify their workplace skills and experience against a nationally accredited qualification, and provides them with details of registered training organisations that offer training and assessment in the qualification.
Funding to meet the costs of training and assessment to recognise prior learning is attached to targeted qualifications in industries that address regional needs for employment outcomes. Support will be provided across all industries and priorities will vary across regions. The cost to Government for Certificate III and IV is $500 per student and Diploma, Advanced Diploma and trade level qualifications is $1,000 per student in 2013-14.
2012-13 $ million
2013-14 $ million
Trade Skills Recognition - Fee Subsidy
0.6
0.6
The Trade Skills Recognition Program provides industry experienced individuals the opportunity to undergo a process of recognition of prior learning and gap training to gain formal trade qualifications. Students pay $500 to participate in this program, with the Government contributing $2,700 per student per qualification outcome.
Concessions Statement 2013-14
14
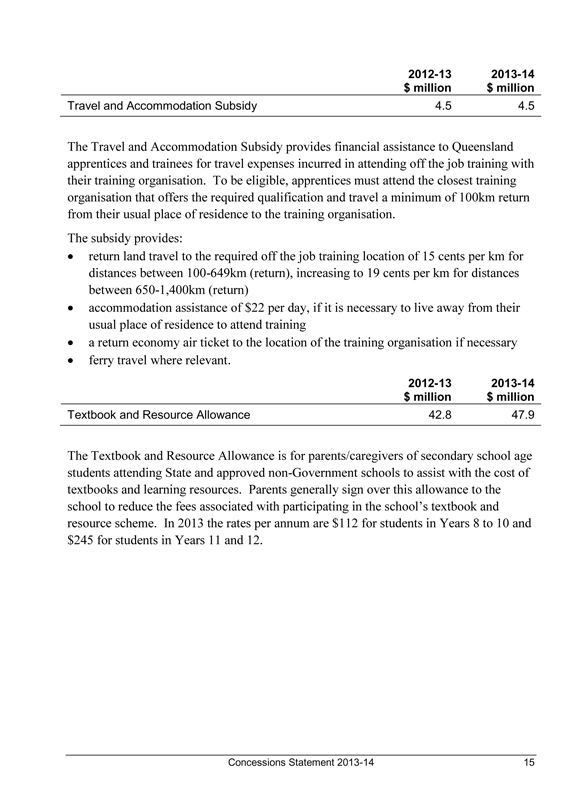
2012-13 $ million
2013-14 $ million
Travel and Accommodation Subsidy
4.5
4.5
The Travel and Accommodation Subsidy provides financial assistance to Queensland apprentices and trainees for travel expenses incurred in attending off the job training with their training organisation. To be eligible, apprentices must attend the closest training organisation that offers the required qualification and travel a minimum of 100km return from their usual place of residence to the training organisation.
The subsidy provides:
· return land travel to the required off the job training location of 15 cents per km for distances between 100-649km (return), increasing to 19 cents per km for distances between 650-1,400km (return)
· accommodation assistance of $22 per day, if it is necessary to live away from their usual place of residence to attend training
· a return economy air ticket to the location of the training organisation if necessary
· ferry travel where relevant.
2012-13 $ million
2013-14 $ million
Textbook and Resource Allowance
42.8
47.9
The Textbook and Resource Allowance is for parents/caregivers of secondary school age students attending State and approved non-Government schools to assist with the cost of textbooks and learning resources. Parents generally sign over this allowance to the school to reduce the fees associated with participating in the school’s textbook and resource scheme. In 2013 the rates per annum are $112 for students in Years 8 to 10 and $245 for students in Years 11 and 12.
Concessions Statement 2013-14
15
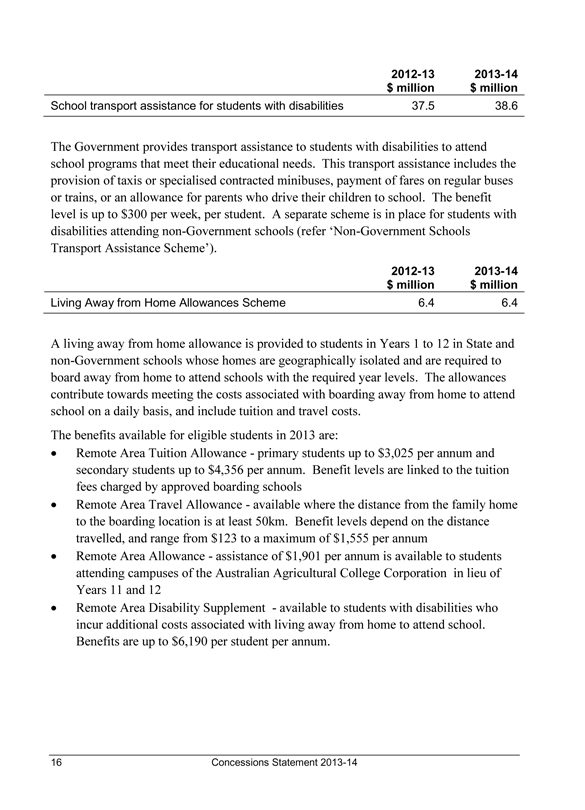
2012-13 $ million
2013-14 $ million
School transport assistance for students with disabilities
37.5
38.6
The Government provides transport assistance to students with disabilities to attend school programs that meet their educational needs. This transport assistance includes the provision of taxis or specialised contracted minibuses, payment of fares on regular buses or trains, or an allowance for parents who drive their children to school. The benefit level is up to $300 per week, per student. A separate scheme is in place for students with disabilities attending non-Government schools (refer ‘Non-Government Schools Transport Assistance Scheme’).
2012-13 $ million
2013-14 $ million
Living Away from Home Allowances Scheme
6.4
6.4
A living away from home allowance is provided to students in Years 1 to 12 in State and non-Government schools whose homes are geographically isolated and are required to board away from home to attend schools with the required year levels. The allowances contribute towards meeting the costs associated with boarding away from home to attend school on a daily basis, and include tuition and travel costs.
The benefits available for eligible students in 2013 are:
· Remote Area Tuition Allowance - primary students up to $3,025 per annum and secondary students up to $4,356 per annum. Benefit levels are linked to the tuition fees charged by approved boarding schools
· Remote Area Travel Allowance - available where the distance from the family home to the boarding location is at least 50km. Benefit levels depend on the distance travelled, and range from $123 to a maximum of $1,555 per annum
· Remote Area Allowance - assistance of $1,901 per annum is available to students attending campuses of the Australian Agricultural College Corporation in lieu of Years 11 and 12
· Remote Area Disability Supplement - available to students with disabilities who incur additional costs associated with living away from home to attend school.
Benefits are up to $6,190 per student per annum.
Concessions Statement 2013-14
16
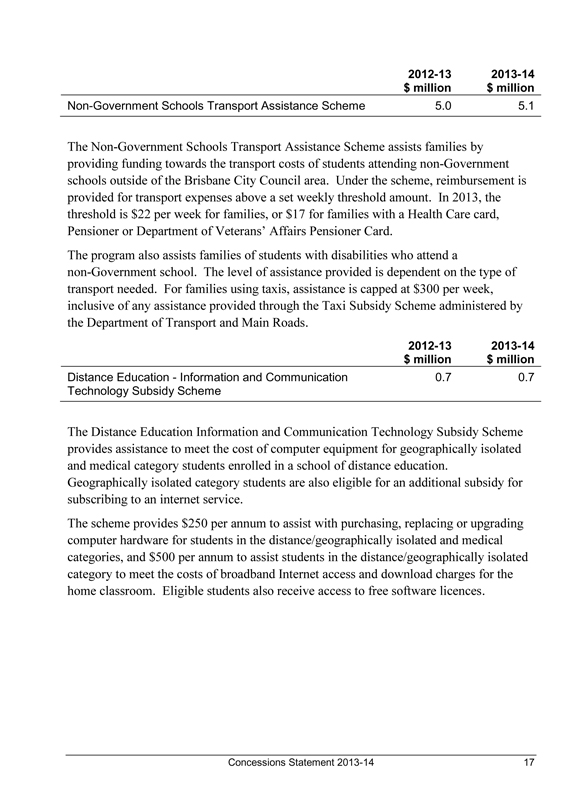
2012-13 $ million
2013-14 $ million
Non-Government Schools Transport Assistance Scheme
5.0
5.1
The Non-Government Schools Transport Assistance Scheme assists families by providing funding towards the transport costs of students attending non-Government schools outside of the Brisbane City Council area. Under the scheme, reimbursement is provided for transport expenses above a set weekly threshold amount. In 2013, the threshold is $22 per week for families, or $17 for families with a Health Care card, Pensioner or Department of Veterans’ Affairs Pensioner Card.
The program also assists families of students with disabilities who attend a non-Government school. The level of assistance provided is dependent on the type of transport needed. For families using taxis, assistance is capped at $300 per week, inclusive of any assistance provided through the Taxi Subsidy Scheme administered by the Department of Transport and Main Roads.
2012-13 $ million
2013-14 $ million
Distance Education - Information and Communication
0.7
0.7
Technology Subsidy Scheme
The Distance Education Information and Communication Technology Subsidy Scheme provides assistance to meet the cost of computer equipment for geographically isolated and medical category students enrolled in a school of distance education.
Geographically isolated category students are also eligible for an additional subsidy for subscribing to an internet service.
The scheme provides $250 per annum to assist with purchasing, replacing or upgrading computer hardware for students in the distance/geographically isolated and medical categories, and $500 per annum to assist students in the distance/geographically isolated category to meet the costs of broadband Internet access and download charges for the home classroom. Eligible students also receive access to free software licences.
Concessions Statement 2013-14
17
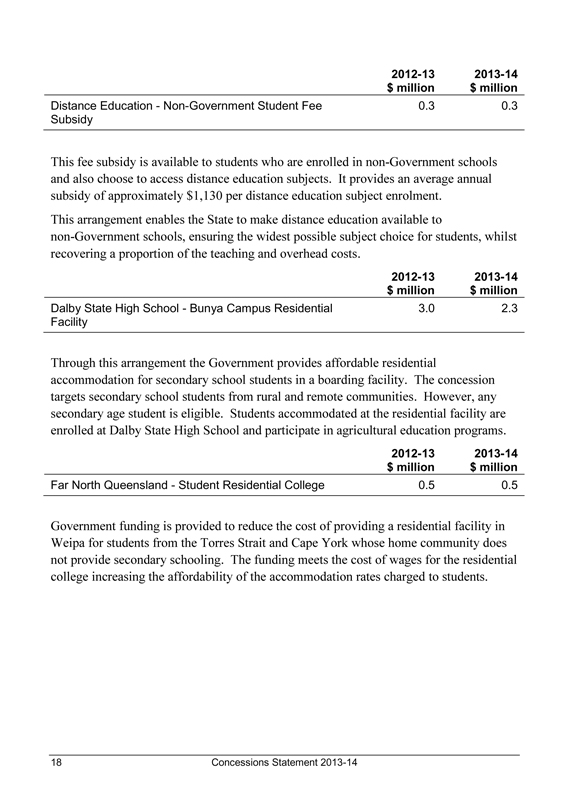
2012-13 $ million
2013-14 $ million
Distance Education - Non-Government Student Fee Subsidy
0.3
0.3
This fee subsidy is available to students who are enrolled in non-Government schools and also choose to access distance education subjects. It provides an average annual subsidy of approximately $1,130 per distance education subject enrolment. This arrangement enables the State to make distance education available to non-Government schools, ensuring the widest possible subject choice for students, whilst recovering a proportion of the teaching and overhead costs.
2012-13 $ million
2013-14 $ million
Dalby State High School - Bunya Campus Residential
3.0
2.3
Facility
Through this arrangement the Government provides affordable residential accommodation for secondary school students in a boarding facility. The concession targets secondary school students from rural and remote communities. However, any secondary age student is eligible. Students accommodated at the residential facility are enrolled at Dalby State High School and participate in agricultural education programs.
2012-13 $ million
2013-14 $ million
Far North Queensland - Student Residential College
0.5
0.5
Government funding is provided to reduce the cost of providing a residential facility in Weipa for students from the Torres Strait and Cape York whose home community does not provide secondary schooling. The funding meets the cost of wages for the residential college increasing the affordability of the accommodation rates charged to students.
Concessions Statement 2013-14
18
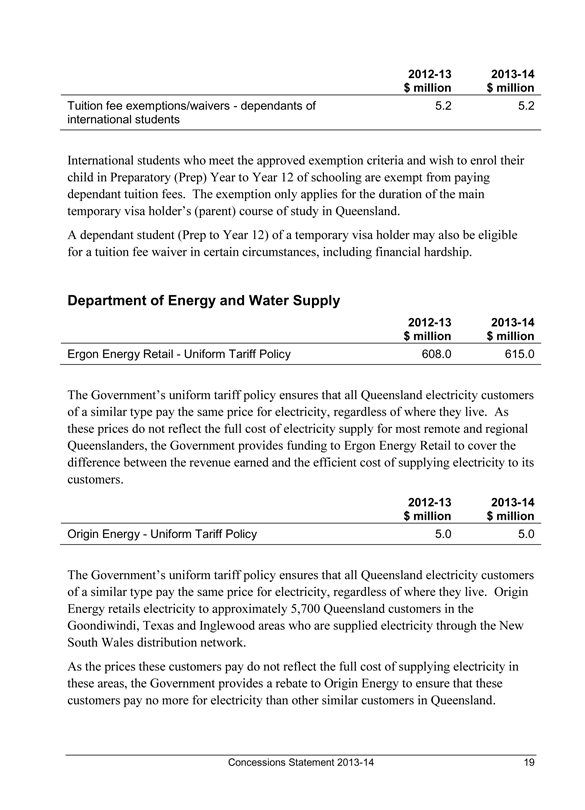
2012-13 2013-14
$ million $ million
Tuition fee exemptions/waivers - dependants of 5.2 5.2
international students
International students who meet the approved exemption criteria and wish to enrol their child in Preparatory (Prep) Year to Year 12 of schooling are exempt from paying dependant tuition fees. The exemption only applies for the duration of the main temporary visa holder’s (parent) course of study in Queensland.
A dependant student (Prep to Year 12) of a temporary visa holder may also be eligible for a tuition fee waiver in certain circumstances, including financial hardship.
Department of Energy and Water Supply
2012-13 2013-14
$ million $ million
Ergon Energy Retail - Uniform Tariff Policy 608.0 615.0
The Government’s uniform tariff policy ensures that all Queensland electricity customers of a similar type pay the same price for electricity, regardless of where they live. As these prices do not reflect the full cost of electricity supply for most remote and regional Queenslanders, the Government provides funding to Ergon Energy Retail to cover the difference between the revenue earned and the efficient cost of supplying electricity to its customers.
2012-13 2013-14
$ million $ million
Origin Energy - Uniform Tariff Policy 5.0 5.0
The Government’s uniform tariff policy ensures that all Queensland electricity customers of a similar type pay the same price for electricity, regardless of where they live. Origin Energy retails electricity to approximately 5,700 Queensland customers in the Goondiwindi, Texas and Inglewood areas who are supplied electricity through the New South Wales distribution network.
As the prices these customers pay do not reflect the full cost of supplying electricity in these areas, the Government provides a rebate to Origin Energy to ensure that these customers pay no more for electricity than other similar customers in Queensland.
Concessions Statement 2013-14
19
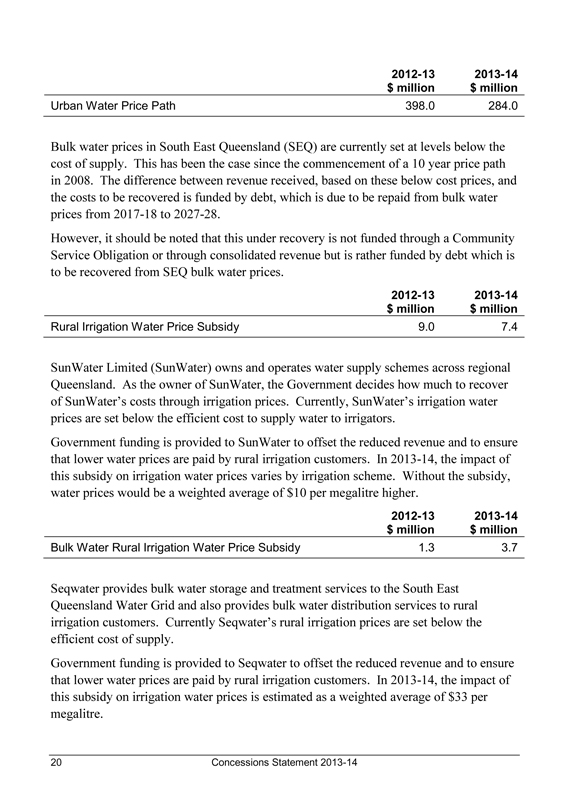
2012-13 2013-14
$ million $ million
Urban Water Price Path 398.0 284.0
Bulk water prices in South East Queensland (SEQ) are currently set at levels below the cost of supply. This has been the case since the commencement of a 10 year price path in 2008. The difference between revenue received, based on these below cost prices, and the costs to be recovered is funded by debt, which is due to be repaid from bulk water prices from 2017-18 to 2027-28.
However, it should be noted that this under recovery is not funded through a Community Service Obligation or through consolidated revenue but is rather funded by debt which is to be recovered from SEQ bulk water prices.
2012-13 2013-14
$ million $ million
Rural Irrigation Water Price Subsidy 9.0 7.4
SunWater Limited (SunWater) owns and operates water supply schemes across regional Queensland. As the owner of SunWater, the Government decides how much to recover of SunWater’s costs through irrigation prices. Currently, SunWater’s irrigation water prices are set below the efficient cost to supply water to irrigators.
Government funding is provided to SunWater to offset the reduced revenue and to ensure that lower water prices are paid by rural irrigation customers. In 2013-14, the impact of this subsidy on irrigation water prices varies by irrigation scheme. Without the subsidy, water prices would be a weighted average of $10 per megalitre higher.
2012-13 2013-14
$ million $ million
Bulk Water Rural Irrigation Water Price Subsidy 1.3 3.7
Seqwater provides bulk water storage and treatment services to the South East Queensland Water Grid and also provides bulk water distribution services to rural irrigation customers. Currently Seqwater’s rural irrigation prices are set below the efficient cost of supply.
Government funding is provided to Seqwater to offset the reduced revenue and to ensure that lower water prices are paid by rural irrigation customers. In 2013-14, the impact of this subsidy on irrigation water prices is estimated as a weighted average of $33 per megalitre.
Concessions Statement 2013-14
20
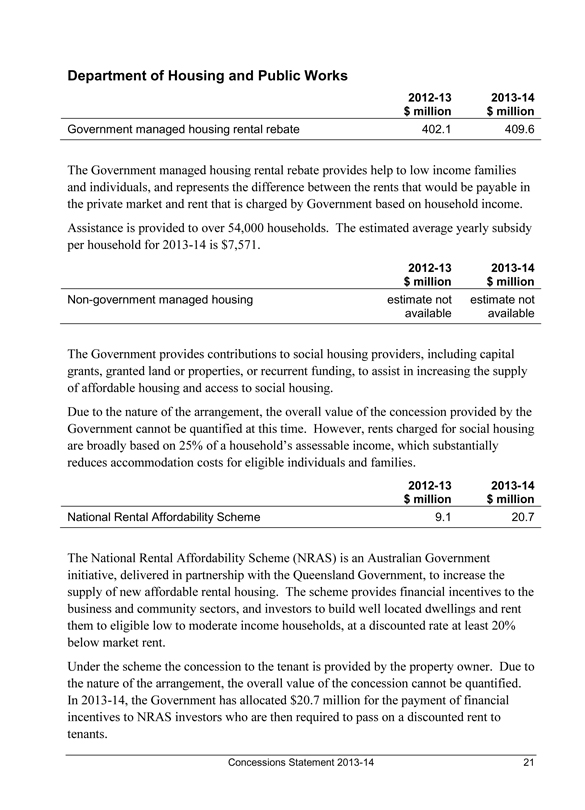
Department of Housing and Public Works
2012-13 2013-14
$ million $ million
Government managed housing rental rebate 402.1 409.6
The Government managed housing rental rebate provides help to low income families and individuals, and represents the difference between the rents that would be payable in the private market and rent that is charged by Government based on household income. Assistance is provided to over 54,000 households. The estimated average yearly subsidy per household for 2013-14 is $7,571.
2012-13 2013-14
$ million $ million
Non-government managed housing estimate not estimate not
available available
The Government provides contributions to social housing providers, including capital grants, granted land or properties, or recurrent funding, to assist in increasing the supply of affordable housing and access to social housing.
Due to the nature of the arrangement, the overall value of the concession provided by the Government cannot be quantified at this time. However, rents charged for social housing are broadly based on 25% of a household’s assessable income, which substantially reduces accommodation costs for eligible individuals and families.
2012-13 2013-14
$ million $ million
National Rental Affordability Scheme 9.1 20.7
The National Rental Affordability Scheme (NRAS) is an Australian Government initiative, delivered in partnership with the Queensland Government, to increase the supply of new affordable rental housing. The scheme provides financial incentives to the business and community sectors, and investors to build well located dwellings and rent them to eligible low to moderate income households, at a discounted rate at least 20% below market rent.
Under the scheme the concession to the tenant is provided by the property owner. Due to the nature of the arrangement, the overall value of the concession cannot be quantified. In 2013-14, the Government has allocated $20.7 million for the payment of financial incentives to NRAS investors who are then required to pass on a discounted rent to tenants.
Concessions Statement 2013-14
21
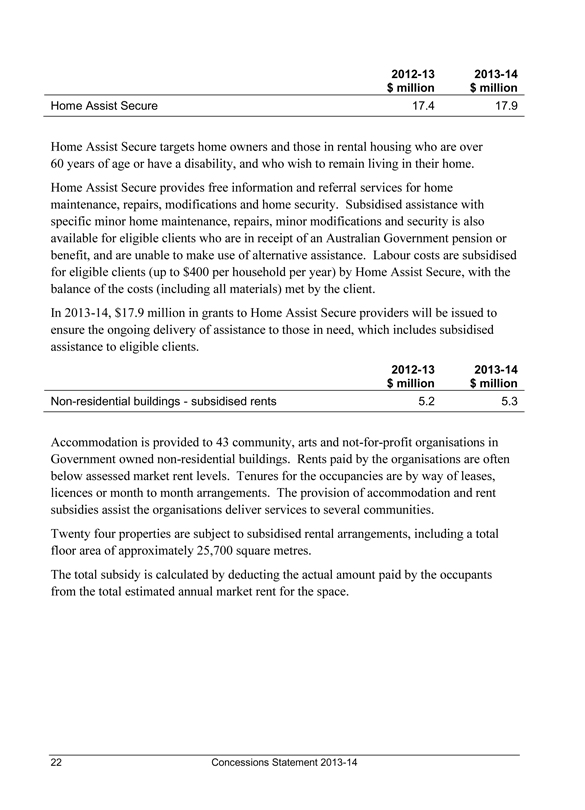
2012-13 2013-14
$ million $ million
Home Assist Secure 17.4 17.9
Home Assist Secure targets home owners and those in rental housing who are over 60 years of age or have a disability, and who wish to remain living in their home. Home Assist Secure provides free information and referral services for home maintenance, repairs, modifications and home security. Subsidised assistance with specific minor home maintenance, repairs, minor modifications and security is also available for eligible clients who are in receipt of an Australian Government pension or benefit, and are unable to make use of alternative assistance. Labour costs are subsidised for eligible clients (up to $400 per household per year) by Home Assist Secure, with the balance of the costs (including all materials) met by the client.
In 2013-14, $17.9 million in grants to Home Assist Secure providers will be issued to ensure the ongoing delivery of assistance to those in need, which includes subsidised assistance to eligible clients.
2012-13 2013-14
$ million $ million
Non-residential buildings - subsidised rents 5.2 5.3
Accommodation is provided to 43 community, arts and not-for-profit organisations in Government owned non-residential buildings. Rents paid by the organisations are often below assessed market rent levels. Tenures for the occupancies are by way of leases, licences or month to month arrangements. The provision of accommodation and rent subsidies assist the organisations deliver services to several communities.
Twenty four properties are subject to subsidised rental arrangements, including a total floor area of approximately 25,700 square metres.
The total subsidy is calculated by deducting the actual amount paid by the occupants from the total estimated annual market rent for the space.
Concessions Statement 2013-14
22
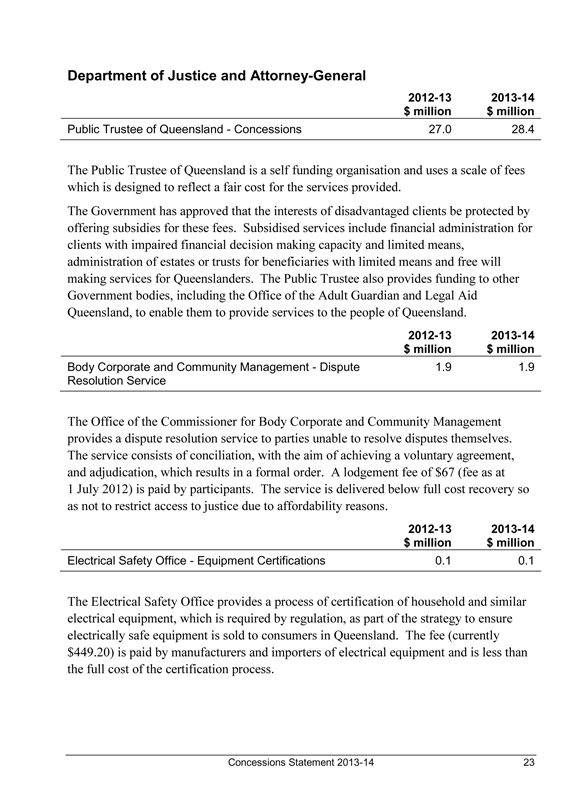
Department of Justice and Attorney-General
2012-13 2013-14
$ million $ million
Public Trustee of Queensland - Concessions 27.0 28.4
The Public Trustee of Queensland is a self funding organisation and uses a scale of fees which is designed to reflect a fair cost for the services provided.
The Government has approved that the interests of disadvantaged clients be protected by offering subsidies for these fees. Subsidised services include financial administration for clients with impaired financial decision making capacity and limited means, administration of estates or trusts for beneficiaries with limited means and free will making services for Queenslanders. The Public Trustee also provides funding to other Government bodies, including the Office of the Adult Guardian and Legal Aid Queensland, to enable them to provide services to the people of Queensland.
2012-13 2013-14
$ million $ million
Body Corporate and Community Management - Dispute 1.9 1.9
Resolution Service
The Office of the Commissioner for Body Corporate and Community Management provides a dispute resolution service to parties unable to resolve disputes themselves. The service consists of conciliation, with the aim of achieving a voluntary agreement, and adjudication, which results in a formal order. A lodgement fee of $67 (fee as at
1 July 2012) is paid by participants. The service is delivered below full cost recovery so as not to restrict access to justice due to affordability reasons.
2012-13 2013-14
$ million $ million
Electrical Safety Office - Equipment Certifications 0.1 0.1
The Electrical Safety Office provides a process of certification of household and similar electrical equipment, which is required by regulation, as part of the strategy to ensure electrically safe equipment is sold to consumers in Queensland. The fee (currently $449.20) is paid by manufacturers and importers of electrical equipment and is less than the full cost of the certification process.
Concessions Statement 2013-14
23
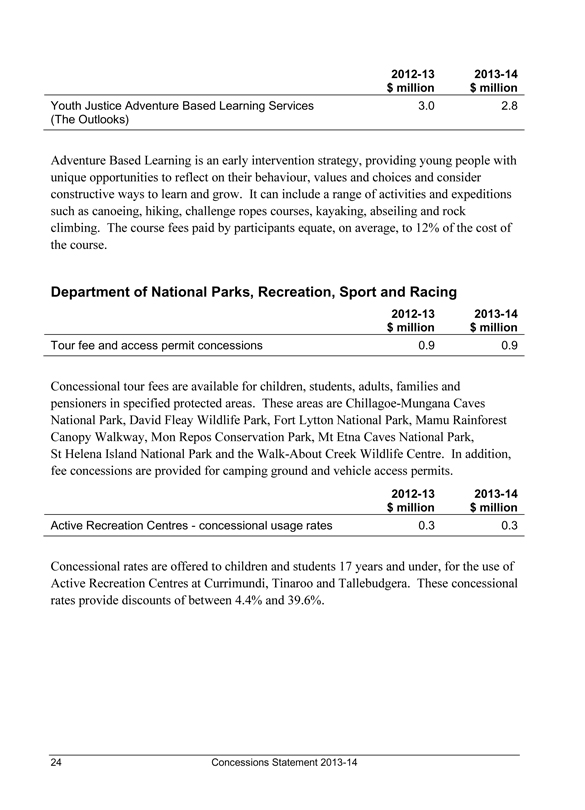
2012-13 2013-14
$ million $ million
Youth Justice Adventure Based Learning Services
3.0 2.8
(The Outlooks)
Adventure Based Learning is an early intervention strategy, providing young people with unique opportunities to reflect on their behaviour, values and choices and consider constructive ways to learn and grow. It can include a range of activities and expeditions such as canoeing, hiking, challenge ropes courses, kayaking, abseiling and rock climbing. The course fees paid by participants equate, on average, to 12% of the cost of the course.
Department of National Parks, Recreation, Sport and Racing
2012-13 2013-14
$ million $ million
Tour fee and access permit concessions
0.9 0.9
Concessional tour fees are available for children, students, adults, families and pensioners in specified protected areas. These areas are Chillagoe-Mungana Caves National Park, David Fleay Wildlife Park, Fort Lytton National Park, Mamu Rainforest Canopy Walkway, Mon Repos Conservation Park, Mt Etna Caves National Park, St Helena Island National Park and the Walk-About Creek Wildlife Centre. In addition, fee concessions are provided for camping ground and vehicle access permits.
2012-13 2013-14
$ million $ million
Active Recreation Centres - concessional usage rates
0.3 0.3
Concessional rates are offered to children and students 17 years and under, for the use of Active Recreation Centres at Currimundi, Tinaroo and Tallebudgera. These concessional rates provide discounts of between 4.4% and 39.6%.
Concessions Statement 2013-14
24
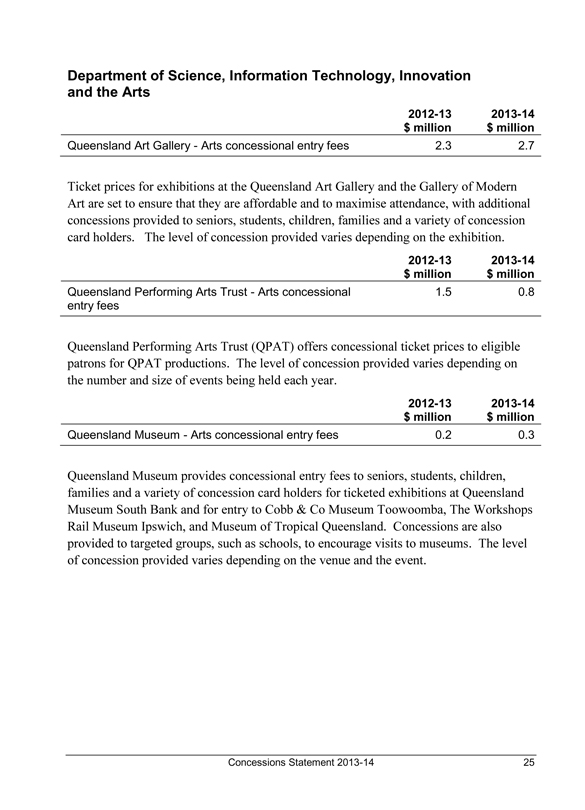
Department of Science, Information Technology, Innovation and the Arts
2012-13 2013-14
$ million $ million
Queensland Art Gallery - Arts concessional entry fees
2.3 2.7
Ticket prices for exhibitions at the Queensland Art Gallery and the Gallery of Modern Art are set to ensure that they are affordable and to maximise attendance, with additional concessions provided to seniors, students, children, families and a variety of concession card holders. The level of concession provided varies depending on the exhibition.
2012-13 2013-14
$ million $ million
Queensland Performing Arts Trust - Arts concessional
1.5 0.8
entry fees
Queensland Performing Arts Trust (QPAT) offers concessional ticket prices to eligible patrons for QPAT productions. The level of concession provided varies depending on the number and size of events being held each year.
2012-13 2013-14
$ million $ million
Queensland Museum - Arts concessional entry fees
0.2 0.3
Queensland Museum provides concessional entry fees to seniors, students, children, families and a variety of concession card holders for ticketed exhibitions at Queensland Museum South Bank and for entry to Cobb & Co Museum Toowoomba, The Workshops Rail Museum Ipswich, and Museum of Tropical Queensland. Concessions are also provided to targeted groups, such as schools, to encourage visits to museums. The level of concession provided varies depending on the venue and the event.
Concessions Statement 2013-14
25
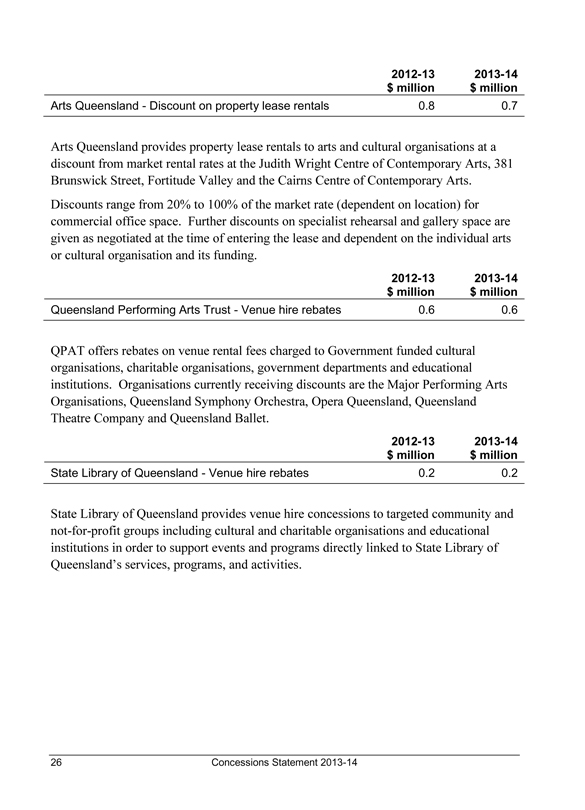
2012-13 2013-14
$ million $ million
Arts Queensland - Discount on property lease rentals
0.8 0.7
Arts Queensland provides property lease rentals to arts and cultural organisations at a discount from market rental rates at the Judith Wright Centre of Contemporary Arts, 381 Brunswick Street, Fortitude Valley and the Cairns Centre of Contemporary Arts. Discounts range from 20% to 100% of the market rate (dependent on location) for commercial office space. Further discounts on specialist rehearsal and gallery space are given as negotiated at the time of entering the lease and dependent on the individual arts or cultural organisation and its funding.
2012-13 2013-14
$ million $ million
Queensland Performing Arts Trust - Venue hire rebates
0.6 0.6
QPAT offers rebates on venue rental fees charged to Government funded cultural organisations, charitable organisations, government departments and educational institutions. Organisations currently receiving discounts are the Major Performing Arts Organisations, Queensland Symphony Orchestra, Opera Queensland, Queensland Theatre Company and Queensland Ballet.
2012-13 2013-14
$ million $ million
State Library of Queensland - Venue hire rebates
0.2 0.2
State Library of Queensland provides venue hire concessions to targeted community and not-for-profit groups including cultural and charitable organisations and educational institutions in order to support events and programs directly linked to State Library of Queensland’s services, programs, and activities.
Concessions Statement 2013-14
26
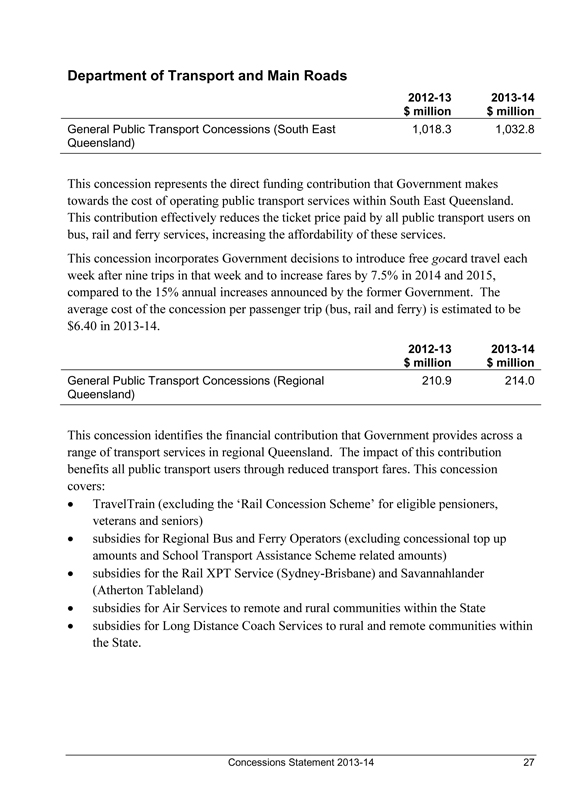
Department of Transport and Main Roads
2012-13 2013-14
$ million $ million
General Public Transport Concessions (South East 1,018.3 1,032.8
Queensland)
This concession represents the direct funding contribution that Government makes towards the cost of operating public transport services within South East Queensland. This contribution effectively reduces the ticket price paid by all public transport users on bus, rail and ferry services, increasing the affordability of these services.
This concession incorporates Government decisions to introduce free gocard travel each week after nine trips in that week and to increase fares by 7.5% in 2014 and 2015, compared to the 15% annual increases announced by the former Government. The average cost of the concession per passenger trip (bus, rail and ferry) is estimated to be $6.40 in 2013-14.
2012-13 2013-14
$ million $ million
General Public Transport Concessions (Regional 210.9 214.0
Queensland)
This concession identifies the financial contribution that Government provides across a range of transport services in regional Queensland. The impact of this contribution benefits all public transport users through reduced transport fares. This concession covers:
· TravelTrain (excluding the ‘Rail Concession Scheme’ for eligible pensioners, veterans and seniors)
· subsidies for Regional Bus and Ferry Operators (excluding concessional top up amounts and School Transport Assistance Scheme related amounts)
· subsidies for the Rail XPT Service (Sydney-Brisbane) and Savannahlander (Atherton Tableland)
· subsidies for Air Services to remote and rural communities within the State
· subsidies for Long Distance Coach Services to rural and remote communities within the State.
Concessions Statement 2013-14
27
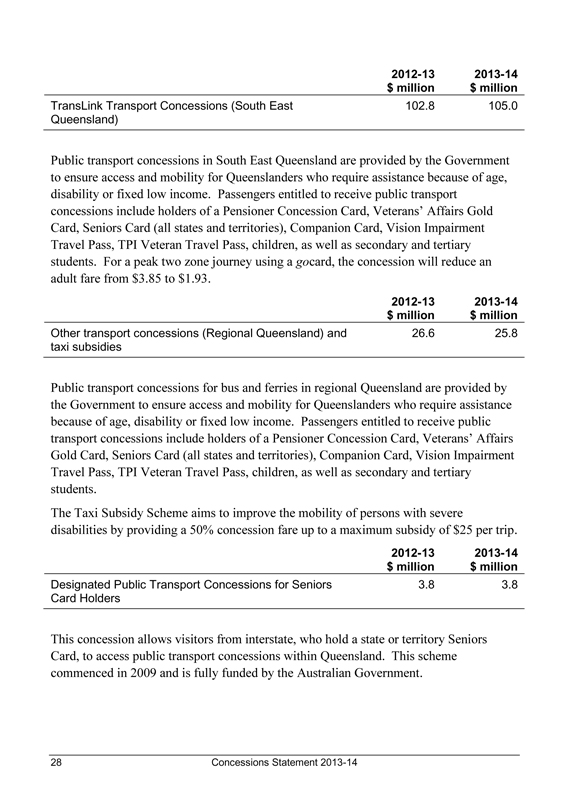
2012-13 2013-14
$ million $ million
TransLink Transport Concessions (South East 102.8 105.0
Queensland)
Public transport concessions in South East Queensland are provided by the Government to ensure access and mobility for Queenslanders who require assistance because of age, disability or fixed low income. Passengers entitled to receive public transport concessions include holders of a Pensioner Concession Card, Veterans’ Affairs Gold Card, Seniors Card (all states and territories), Companion Card, Vision Impairment Travel Pass, TPI Veteran Travel Pass, children, as well as secondary and tertiary students. For a peak two zone journey using a gocard, the concession will reduce an adult fare from $3.85 to $1.93.
2012-13 2013-14
$ million $ million
Other transport concessions (Regional Queensland) and 26.6 25.8
taxi subsidies
Public transport concessions for bus and ferries in regional Queensland are provided by the Government to ensure access and mobility for Queenslanders who require assistance because of age, disability or fixed low income. Passengers entitled to receive public transport concessions include holders of a Pensioner Concession Card, Veterans’ Affairs Gold Card, Seniors Card (all states and territories), Companion Card, Vision Impairment Travel Pass, TPI Veteran Travel Pass, children, as well as secondary and tertiary students.
The Taxi Subsidy Scheme aims to improve the mobility of persons with severe disabilities by providing a 50% concession fare up to a maximum subsidy of $25 per trip.
2012-13 2013-14
$ million $ million
Designated Public Transport Concessions for Seniors 3.8 3.8
Card Holders
This concession allows visitors from interstate, who hold a state or territory Seniors Card, to access public transport concessions within Queensland. This scheme commenced in 2009 and is fully funded by the Australian Government.
Concessions Statement 2013-14
28
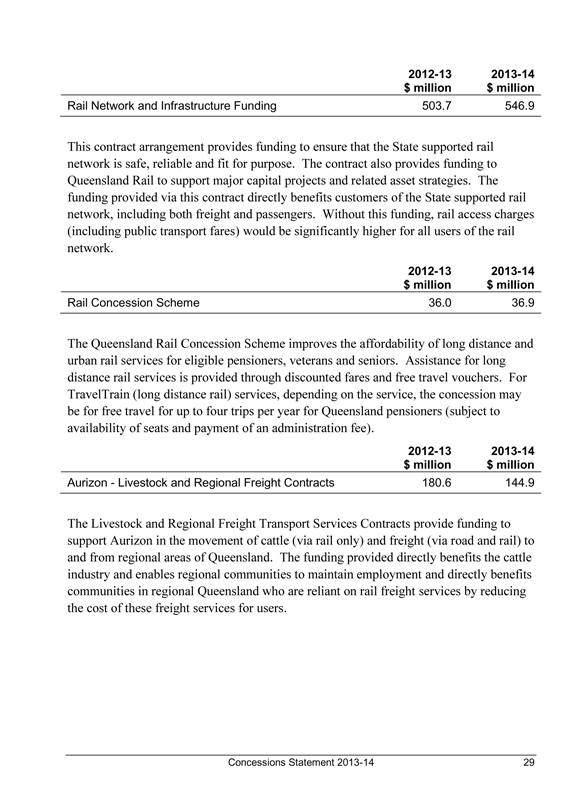
2012-13 2013-14
$ million $ million
Rail Network and Infrastructure Funding
503.7 546.9
This contract arrangement provides funding to ensure that the State supported rail network is safe, reliable and fit for purpose. The contract also provides funding to Queensland Rail to support major capital projects and related asset strategies. The funding provided via this contract directly benefits customers of the State supported rail network, including both freight and passengers. Without this funding, rail access charges (including public transport fares) would be significantly higher for all users of the rail network.
2012-13 2013-14
$ million $ million
Rail Concession Scheme
36.0 36.9
The Queensland Rail Concession Scheme improves the affordability of long distance and urban rail services for eligible pensioners, veterans and seniors. Assistance for long distance rail services is provided through discounted fares and free travel vouchers. For TravelTrain (long distance rail) services, depending on the service, the concession may be for free travel for up to four trips per year for Queensland pensioners (subject to availability of seats and payment of an administration fee).
2012-13 2013-14
$ million $ million
Aurizon - Livestock and Regional Freight Contracts
180.6 144.9
The Livestock and Regional Freight Transport Services Contracts provide funding to support Aurizon in the movement of cattle (via rail only) and freight (via road and rail) to and from regional areas of Queensland. The funding provided directly benefits the cattle industry and enables regional communities to maintain employment and directly benefits communities in regional Queensland who are reliant on rail freight services by reducing the cost of these freight services for users.
Concessions Statement 2013-14
29
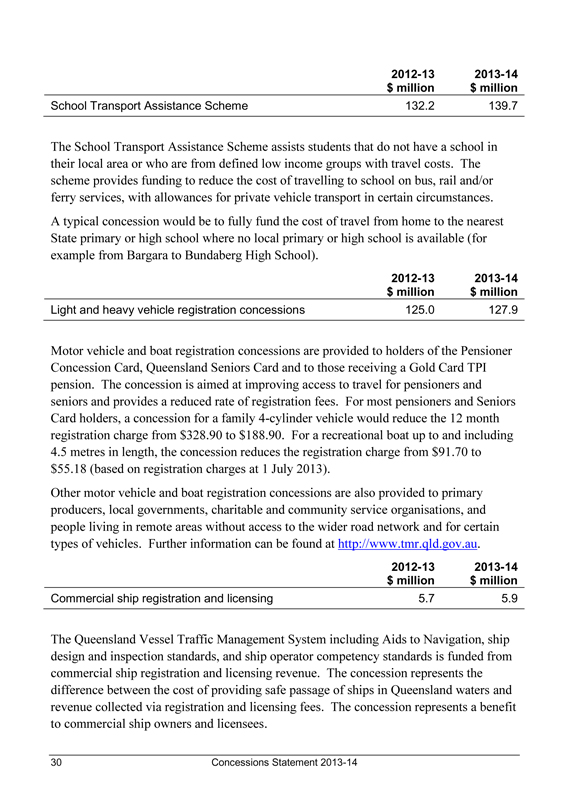
2012-13 2013-14
$ million $ million
School Transport Assistance Scheme 132.2 139.7
The School Transport Assistance Scheme assists students that do not have a school in their local area or who are from defined low income groups with travel costs. The scheme provides funding to reduce the cost of travelling to school on bus, rail and/or ferry services, with allowances for private vehicle transport in certain circumstances. A typical concession would be to fully fund the cost of travel from home to the nearest State primary or high school where no local primary or high school is available (for example from Bargara to Bundaberg High School).
2012-13 2013-14
$ million $ million
Light and heavy vehicle registration concessions 125.0 127.9
Motor vehicle and boat registration concessions are provided to holders of the Pensioner Concession Card, Queensland Seniors Card and to those receiving a Gold Card TPI pension. The concession is aimed at improving access to travel for pensioners and seniors and provides a reduced rate of registration fees. For most pensioners and Seniors Card holders, a concession for a family 4-cylinder vehicle would reduce the 12 month registration charge from $328.90 to $188.90. For a recreational boat up to and including 4.5 metres in length, the concession reduces the registration charge from $91.70 to $55.18 (based on registration charges at 1 July 2013).
Other motor vehicle and boat registration concessions are also provided to primary producers, local governments, charitable and community service organisations, and people living in remote areas without access to the wider road network and for certain types of vehicles. Further information can be found at http://www.tmr.qld.gov.au.
2012-13 2013-14
$ million $ million
Commercial ship registration and licensing 5.7 5.9
The Queensland Vessel Traffic Management System including Aids to Navigation, ship design and inspection standards, and ship operator competency standards is funded from commercial ship registration and licensing revenue. The concession represents the difference between the cost of providing safe passage of ships in Queensland waters and revenue collected via registration and licensing fees. The concession represents a benefit to commercial ship owners and licensees.
Concessions Statement 2013-14
30
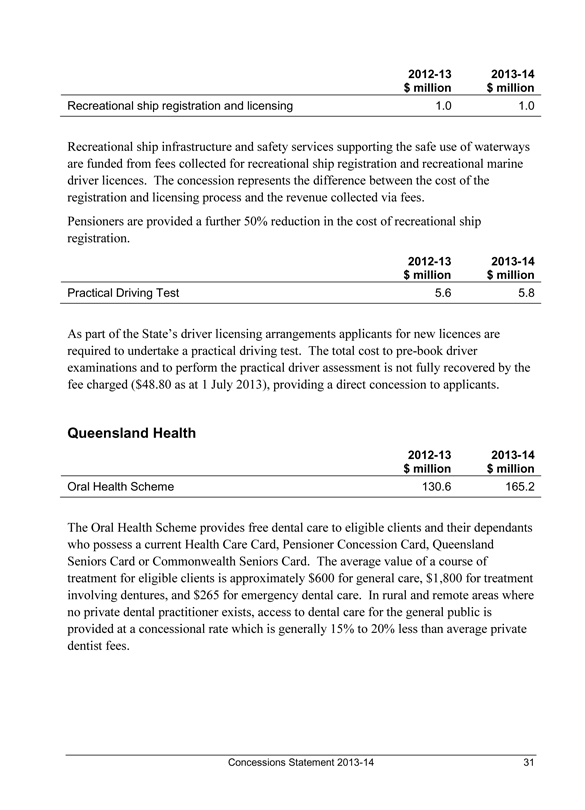
2012-13 2013-14
$ million $ million
Recreational ship registration and licensing 1.0 1.0
Recreational ship infrastructure and safety services supporting the safe use of waterways are funded from fees collected for recreational ship registration and recreational marine driver licences. The concession represents the difference between the cost of the registration and licensing process and the revenue collected via fees.
Pensioners are provided a further 50% reduction in the cost of recreational ship registration.
2012-13 2013-14
$ million $ million
Practical Driving Test 5.6 5.8
As part of the State’s driver licensing arrangements applicants for new licences are required to undertake a practical driving test. The total cost to pre-book driver examinations and to perform the practical driver assessment is not fully recovered by the fee charged ($48.80 as at 1 July 2013), providing a direct concession to applicants.
Queensland Health
2012-13 2013-14
$ million $ million
Oral Health Scheme 130.6 165.2
The Oral Health Scheme provides free dental care to eligible clients and their dependants who possess a current Health Care Card, Pensioner Concession Card, Queensland Seniors Card or Commonwealth Seniors Card. The average value of a course of treatment for eligible clients is approximately $600 for general care, $1,800 for treatment involving dentures, and $265 for emergency dental care. In rural and remote areas where no private dental practitioner exists, access to dental care for the general public is provided at a concessional rate which is generally 15% to 20% less than average private dentist fees.
Concessions Statement 2013-14
31
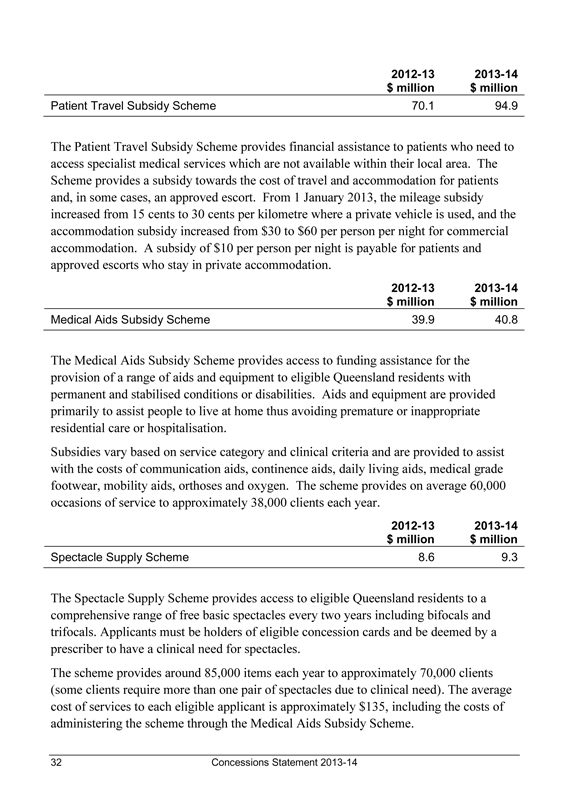
2012-13 2013-14
$ million $ million
Patient Travel Subsidy Scheme 70.1 94.9
The Patient Travel Subsidy Scheme provides financial assistance to patients who need to access specialist medical services which are not available within their local area. The Scheme provides a subsidy towards the cost of travel and accommodation for patients and, in some cases, an approved escort. From 1 January 2013, the mileage subsidy increased from 15 cents to 30 cents per kilometre where a private vehicle is used, and the accommodation subsidy increased from $30 to $60 per person per night for commercial accommodation. A subsidy of $10 per person per night is payable for patients and approved escorts who stay in private accommodation.
2012-13 2013-14
$ million $ million
Medical Aids Subsidy Scheme 39.9 40.8
The Medical Aids Subsidy Scheme provides access to funding assistance for the provision of a range of aids and equipment to eligible Queensland residents with permanent and stabilised conditions or disabilities. Aids and equipment are provided primarily to assist people to live at home thus avoiding premature or inappropriate residential care or hospitalisation.
Subsidies vary based on service category and clinical criteria and are provided to assist with the costs of communication aids, continence aids, daily living aids, medical grade footwear, mobility aids, orthoses and oxygen. The scheme provides on average 60,000 occasions of service to approximately 38,000 clients each year.
2012-13 2013-14
$ million $ million
Spectacle Supply Scheme 8.6 9.3
The Spectacle Supply Scheme provides access to eligible Queensland residents to a comprehensive range of free basic spectacles every two years including bifocals and trifocals. Applicants must be holders of eligible concession cards and be deemed by a prescriber to have a clinical need for spectacles.
The scheme provides around 85,000 items each year to approximately 70,000 clients (some clients require more than one pair of spectacles due to clinical need). The average cost of services to each eligible applicant is approximately $135, including the costs of administering the scheme through the Medical Aids Subsidy Scheme.
Concessions Statement 2013-14
32
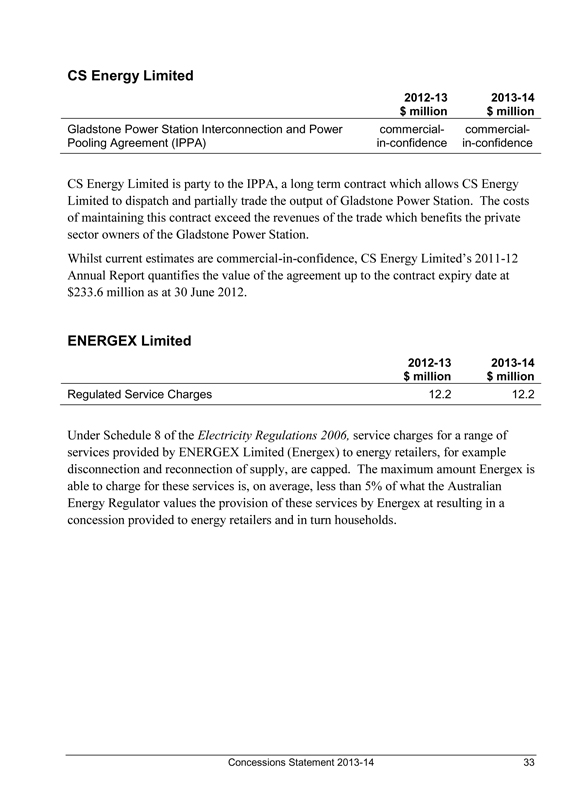
CS Energy Limited
2012-13 2013-14
$ million $ million
Gladstone Power Station Interconnection and Power Pooling Agreement (IPPA) commercial-in-confidence
commercial-in-confidence
CS Energy Limited is party to the IPPA, a long term contract which allows CS Energy Limited to dispatch and partially trade the output of Gladstone Power Station. The costs of maintaining this contract exceed the revenues of the trade which benefits the private sector owners of the Gladstone Power Station.
Whilst current estimates are commercial-in-confidence, CS Energy Limited’s 2011-12 Annual Report quantifies the value of the agreement up to the contract expiry date at $233.6 million as at 30 June 2012.
ENERGEX Limited
2012-13 2013-14
$ million $ million
Regulated Service Charges 12.2 12.2
Under Schedule 8 of the Electricity Regulations 2006, service charges for a range of services provided by ENERGEX Limited (Energex) to energy retailers, for example disconnection and reconnection of supply, are capped. The maximum amount Energex is able to charge for these services is, on average, less than 5% of what the Australian Energy Regulator values the provision of these services by Energex at resulting in a concession provided to energy retailers and in turn households.
Concessions Statement 2013-14
33
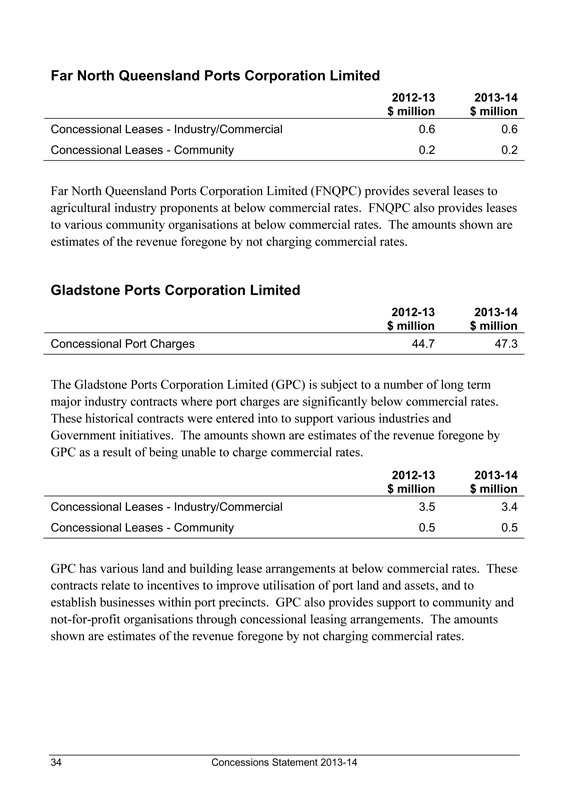
Far North Queensland Ports Corporation Limited
2012-13 2013-14
$ million $ million
Concessional Leases - Industry/Commercial 0.6 0.6
Concessional Leases - Community 0.2 0.2
Far North Queensland Ports Corporation Limited (FNQPC) provides several leases to agricultural industry proponents at below commercial rates. FNQPC also provides leases to various community organisations at below commercial rates. The amounts shown are estimates of the revenue foregone by not charging commercial rates.
Gladstone Ports Corporation Limited
2012-13 2013-14
$ million $ million
Concessional Port Charges 44.7 47.3
The Gladstone Ports Corporation Limited (GPC) is subject to a number of long term major industry contracts where port charges are significantly below commercial rates. These historical contracts were entered into to support various industries and Government initiatives. The amounts shown are estimates of the revenue foregone by GPC as a result of being unable to charge commercial rates.
2012-13 2013-14
$ million $ million
Concessional Leases - Industry/Commercial 3.5 3.4
Concessional Leases - Community 0.5 0.5
GPC has various land and building lease arrangements at below commercial rates. These contracts relate to incentives to improve utilisation of port land and assets, and to establish businesses within port precincts. GPC also provides support to community and not-for-profit organisations through concessional leasing arrangements. The amounts shown are estimates of the revenue foregone by not charging commercial rates.
Concessions Statement 2013-14
34
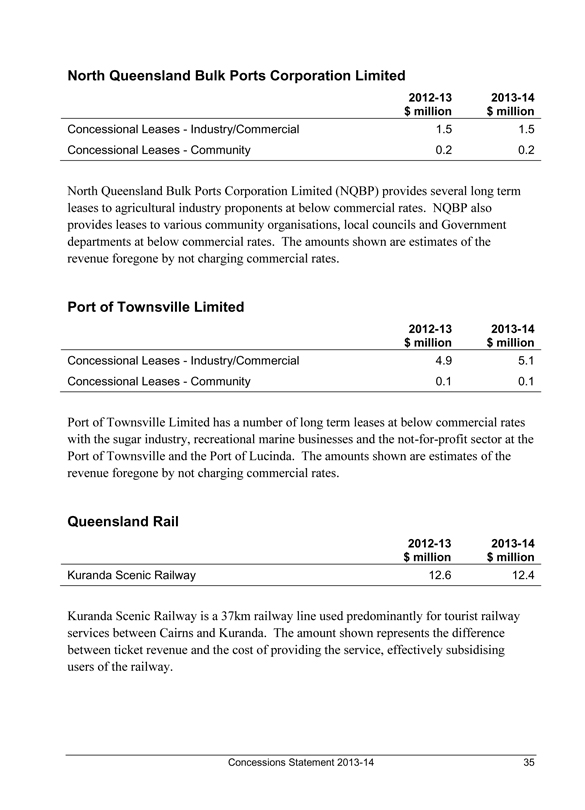
North Queensland Bulk Ports Corporation Limited
2012-13 2013-14
$ million $ million
Concessional Leases - Industry/Commercial 1.5 1.5
Concessional Leases - Community 0.2 0.2
North Queensland Bulk Ports Corporation Limited (NQBP) provides several long term leases to agricultural industry proponents at below commercial rates. NQBP also provides leases to various community organisations, local councils and Government departments at below commercial rates. The amounts shown are estimates of the revenue foregone by not charging commercial rates.
Port of Townsville Limited
2012-13 2013-14
$ million $ million
Concessional Leases - Industry/Commercial 4.9 5.1
Concessional Leases - Community 0.1 0.1
Port of Townsville Limited has a number of long term leases at below commercial rates with the sugar industry, recreational marine businesses and the not-for-profit sector at the Port of Townsville and the Port of Lucinda. The amounts shown are estimates of the revenue foregone by not charging commercial rates.
Queensland Rail
2012-13 2013-14
$ million $ million
Kuranda Scenic Railway 12.6 12.4
Kuranda Scenic Railway is a 37km railway line used predominantly for tourist railway services between Cairns and Kuranda. The amount shown represents the difference between ticket revenue and the cost of providing the service, effectively subsidising users of the railway.
Concessions Statement 2013-14
35
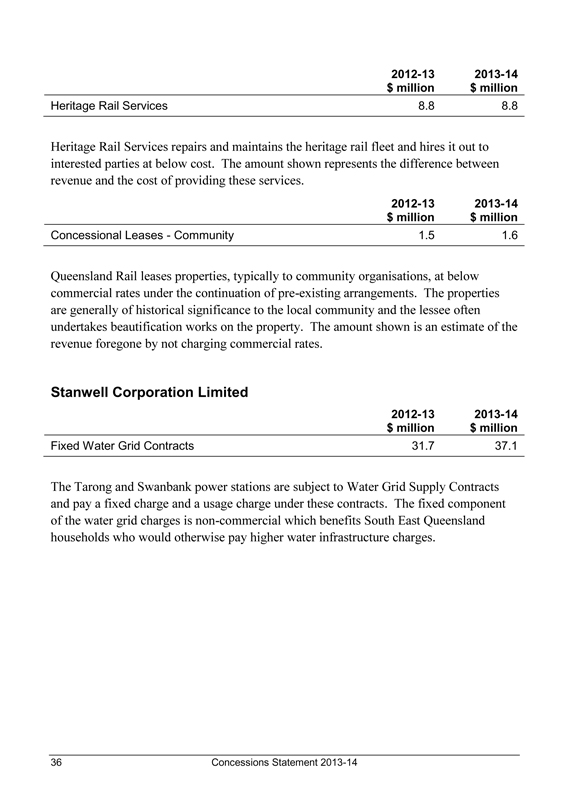
2012-13 2013-14
$ million $ million
Heritage Rail Services 8.8 8.8
Heritage Rail Services repairs and maintains the heritage rail fleet and hires it out to interested parties at below cost. The amount shown represents the difference between revenue and the cost of providing these services.
2012-13 2013-14
$ million $ million
Concessional Leases - Community 1.5 1.6
Queensland Rail leases properties, typically to community organisations, at below commercial rates under the continuation of pre-existing arrangements. The properties are generally of historical significance to the local community and the lessee often undertakes beautification works on the property. The amount shown is an estimate of the revenue foregone by not charging commercial rates.
Stanwell Corporation Limited
2012-13 2013-14
$ million $ million
Fixed Water Grid Contracts 31.7 37.1
The Tarong and Swanbank power stations are subject to Water Grid Supply Contracts and pay a fixed charge and a usage charge under these contracts. The fixed component of the water grid charges is non-commercial which benefits South East Queensland households who would otherwise pay higher water infrastructure charges.
Concessions Statement 2013-14
36
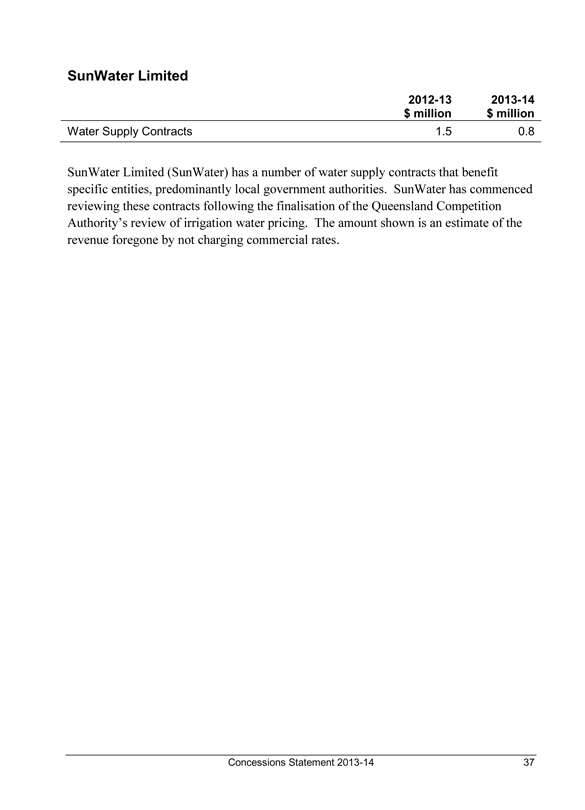
SunWater Limited
2012-13 2013-14
$ million $ million
Water Supply Contracts 1.5 0.8
SunWater Limited (SunWater) has a number of water supply contracts that benefit specific entities, predominantly local government authorities. SunWater has commenced reviewing these contracts following the finalisation of the Queensland Competition Authority’s review of irrigation water pricing. The amount shown is an estimate of the revenue foregone by not charging commercial rates.
Concessions Statement 2013-14
37

State Budget 2013-14 Concessions Statement www.budget.qld.gov.au

State Budget 2013–14 Concessions Statement www.budget.qld.gov.au