EXHIBIT (c)(ix)
Queensland Treasury Corporation Annual Report for the Year Ended June 30, 2013.
AUDAX AT FIDELIS
QUEENSLAND
TREASURY
CORPORATION
CELEBRATING
25 YEARS
EST. 1988
ANNUAL REPORT 2012-13
VISION Securing Queensland’s financial success
MISSION To deliver optimal financial outcomes through sound funding and financial risk management
VALUES We are focused on our clients
We are passionate about Queensland
We value and respect our people
We are collaborative and seek continuous improvement
Above all else, we value integrity
Queensland Treasury Corporation is the Queensland Government’s central financing authority and corporate treasury services provider, with responsibility for:
sourcing and managing the debt funding to finance Queensland’s infrastructure requirements in the most cost-effective manner
providing financial and risk management advice to the
Queensland Government and its public sector clients on financial risk issues, and
investing the State’s and clients’ short- to medium-term cash holdings, to maximise returns through a conservative risk management framework.
QTC does not formulate Government policy, but works within the policy frameworks developed by the Government.
Debt funding and management
QTC borrows funds in the domestic and international markets in a way that minimises the State’s and QTC’s liquidity and refinancing risk. We then lend these funds to our clients, or use them to manage our clients’ debt or refinance maturing debt. With responsibility for virtually all of the State’s debt raising, QTC is able to capture significant economies of scale and scope to issue, manage and administer debt.
Financial advisory and risk management services
QTC works closely with its public sector clients to assist in managing their risk in financial transactions and achieve the best financial solutions for their organisations and for Queensland. In assisting clients, QTC does not provide advice that is contrary to the interests of the State. We encourage Queensland Treasury and Trade, our major stakeholder, and our clients to use our organisation as an extension of their resources, by:
providing access, on a cost-recovery basis, to professional skills and resources to ensure that their financial risks are identified and managed on a consistent basis
acting as a central store of knowledge and expertise on financial structures and transactions, and the risks and benefits they encompass
providing Queensland Treasury and Trade with advice on matters of financial and commercial policy and risk relating to the State and its entities
working as a conduit between the Government and the private sector, and
using our economies of scale and scope to ensure that the best possible solutions are obtained.
Short- to medium-term investments
QTC uses its financial markets expertise, enhanced by strong relationships with the domestic and international markets, together with its understanding of debt management and the management of financial risk, to provide clients with investment solutions that achieve a high return within a conservative risk environment. Clients can choose from an overnight facility, a managed short-term fund or fixed-term facility. Alternatively, we can assist them to source appropriate solutions from the marketplace.
CONTENTS
Queensland Treasury
Corporation 1
Letter of Compliance 2
Key Performance Highlights 3
Five-Year Business Summary 4
Chairman’s & Chief Executive’s Report 6
Corporate Performance Report 8
Corporate Governance 12
Investor Report 17
Financial Statements 23
Appendices 63
ANNUAL REPORT 2012–13 QUEENSLAND TREASURY CORPORATION 1
AUDAX AT FIDELIS
QUEENSLAND
TREASURY
CORPORATION
10 September 2013
The Honourable Tim Nicholls MP
Treasurer and Minister for Trade
GPO Box 611
Brisbane Qld 4001
Dear Treasurer
I am pleased to present the Annual Report 2012-13 and financial statements for Queensland Treasury Corporation.
I certify that this Annual Report complies with:
the prescribed requirements of the Financial Accountability Act 2009 and the Financial and Performance Management Standard 2009, and
the requirements set out in the Annual Report requirements for Queensland Government agencies.
A checklist outlining the annual reporting requirements can be accessed via our website at qtc.com.au.
Sincerely,
Gerard Bradley
Chairman
LEVEL 6, 123 ALBERT STREET, BRISBANE QUEENSLAND AUSTRALIA 4000
GPO BOX 1096, BRISBANE QUEENSLAND AUSTRALIA 4001
T: 07 3842 4600 F: 07 3221 4122 QTC.COM.AU
2 QUEENSLAND TREASURY CORPORATION ANNUAL REPORT 2012–13
KEY
PERFORMANCE
HIGHLIGHTS
Raised $17.9 billion to meet the State’s funding requirements, issuing three new, well-subscribed bond lines to complement our existing offering
Managed QTC’s Capital Guaranteed Cash Fund, which outperformed its benchmark, the UBS Australian Bank Bill Index, by 86 basis points
Provided analysis and advice to the Boundaries Commissioner on the financial impacts of proposed local government de-amalgamations
Supported the Commission of Audit in its review of the State’s financial position with the objective of improving Queensland’s economy and financial position
Seconded specialist staff to the Government’s Projects
Queensland initiative to deliver key infrastructure for the State, including the 1 William Street development and the Queensland Schools Project
Continued to support, through our Local Government
Infrastructure Services (LGIS) operation, the State’s recovery from natural disasters, assisting councils with funding applications
Played a central role in managing two partial sell-downs of the State’s shareholding in Aurizon Holdings Ltd, realising a net value of $400 million to the State
Developed a series of submissions to the Australian Energy Market Commission’s review of electricity network economic regulations, in support of the State’s energy Government-owned corporations
Launched the secure QTC Connect website, enhancing clients’ access to account data, business intelligence and financial toolkit
Implemented an integrated suite of HR programs to encourage and promote individual, team and corporate high performance
ANNUAL REPORT 2012–13 QUEENSLAND TREASURY CORPORATION 3
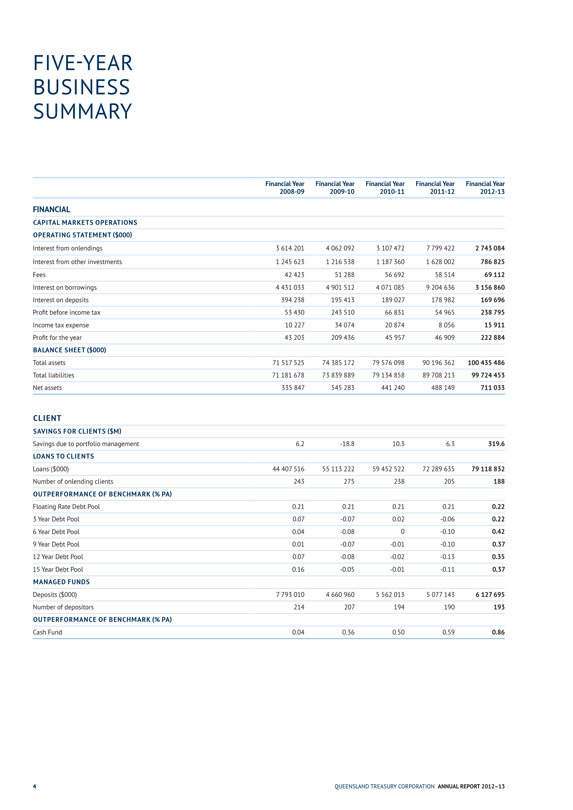
FIVE-YEAR
BUSINESS
SUMMARY
Financial Year 2008-09
Financial Year 2009-10
Financial Year 2010-11
Financial Year 2011-12
Financial Year 2012-13
FINANCIAL
CAPITAL MARKETS OPERATIONS
OPERATING STATEMENT ($000)
Interest from onlendings 3 614 201 4 062 092 3 107 472 7 799 422 2 743 084
Interest from other investments 1 245 623 1 216 538 1 187 360 1 628 002 786 825
Fees 42 423 51 288 56 692 58 514 69 112
Interest on borrowings 4 431 033 4 901 512 4 071 085 9 204 636 3 156 860
Interest on deposits 394 238 195 413 189 027 178 982 169 696
Profit before income tax 53 430 243 510 66 831 54 965 238 795
Income tax expense 10 227 34 074 20 874 8 056 15 911
Profit for the year 43 203 209 436 45 957 46 909 222 884
BALANCE SHEET ($000)
Total assets 71 517 525 74 385 172 79 576 098 90 196 362 100 435 486
Total liabilities 71 181 678 73 839 889 79 134 858 89 708 213 99 724 453
Net assets 335 847 545 283 441 240 488 149 711 033
CLIENT
SAVINGS FOR CLIENTS ($M)
Savings due to portfolio management 6.2 -18.8 10.3 6.3 319.6
LOANS TO CLIENTS
Loans ($000) 44 407 516 55 113 222 59 452 522 72 289 635 79 118 832
Number of onlending clients 243 275 238 205 188
OUTPERFORMANCE OF BENCHMARK (% PA)
Floating Rate Debt Pool 0.21 0.21 0.21 0.21 0.22
3 Year Debt Pool 0.07 -0.07 0.02 -0.06 0.22
6 Year Debt Pool 0.04 -0.08 0 -0.10 0.42
9 Year Debt Pool 0.01 -0.07 -0.01 -0.10 0.37
12 Year Debt Pool 0.07 -0.08 -0.02 -0.13 0.35
15 Year Debt Pool 0.16 -0.05 -0.01 -0.11 0.37
MANAGED FUNDS
Deposits ($000) 7 793 010 4 660 960 5 562 013 5 077 143 6 127 695
Number of depositors 214 207 194 190 193
OUTPERFORMANCE OF BENCHMARK (% PA)
Cash Fund 0.04 0.36 0.50 0.59 0.86
4 QUEENSLAND TREASURY CORPORATION ANNUAL REPORT 2012–13
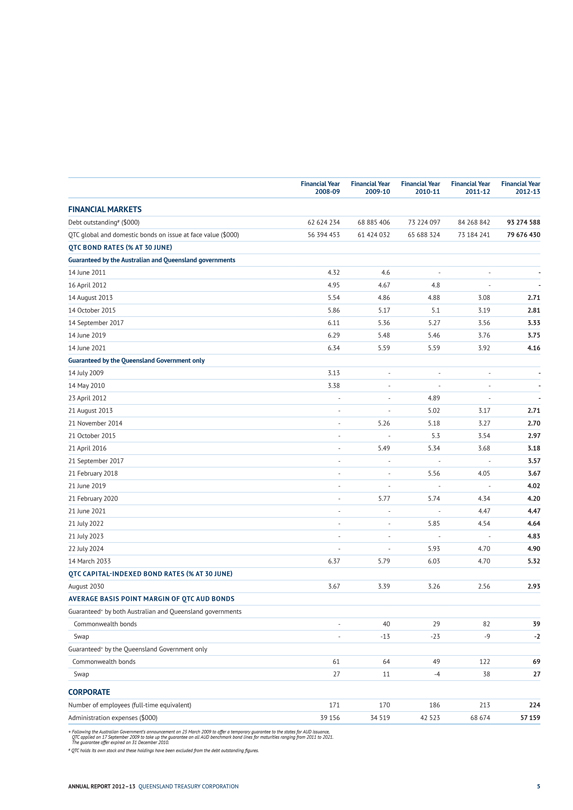
Financial Year 2008-09 Financial Year 2009-10 Financial Year 2010-11 Financial Year 2011-12 Financial Year 2012-13
FINANCIAL MARKETS
Debt outstanding# ($000) 62 624 234 68 885 406 73 224 097 84 268 842 93 274 588
QTC global and domestic bonds on issue at face value ($000) 56 394 453 61 424 032 65 688 324 73 184 241 79 676 430
QTC BOND RATES (% AT 30 JUNE)
Guaranteed by the Australian and Queensland governments
14 June 2011 4.32 4.6 — — —
16 April 2012 4.95 4.67 4.8 — —
14 August 2013 5.54 4.86 4.88 3.08 2.71
14 October 2015 5.86 5.17 5.1 3.19 2.81
14 September 2017 6.11 5.36 5.27 3.56 3.33
14 June 2019 6.29 5.48 5.46 3.76 3.75
14 June 2021 6.34 5.59 5.59 3.92 4.16
Guaranteed by the Queensland Government only
14 July 2009 3.13 — — — —
14 May 2010 3.38 — — — —
23 April 2012 — — 4.89 — —
21 August 2013 — — 5.02 3.17 2.71
21 November 2014 — 5.26 5.18 3.27 2.70
21 October 2015 — — 5.3 3.54 2.97
21 April 2016 — 5.49 5.34 3.68 3.18
21 September 2017 — — — — 3.57
21 February 2018 — — 5.56 4.05 3.67
21 June 2019 — — — — 4.02
21 February 2020 — 5.77 5.74 4.34 4.20
21 June 2021 — — — 4.47 4.47
21 July 2022 — — 5.85 4.54 4.64
21 July 2023 — — — — 4.83
22 July 2024 — — 5.93 4.70 4.90
14 March 2033 6.37 5.79 6.03 4.70 5.32
QTC CAPITAL-INDEXED BOND RATES (% AT 30 JUNE)
August 2030 3.67 3.39 3.26 2.56 2.93
AVERAGE BASIS POINT MARGIN OF QTC AUD BONDS
Guaranteed+ by both Australian and Queensland governments
Commonwealth bonds — 40 29 82 39
Swap — -13 -23 -9 -2
Guaranteed+ by the Queensland Government only
Commonwealth bonds 61 64 49 122 69
Swap 27 11 -4 38 27
CORPORATE
Number of employees (full-time equivalent) 171 170 186 213 224
Administration expenses ($000) 39 156 34 519 42 523 68 674 57 159
+ Following the Australian Government’s announcement on 25 March 2009 to offer a temporary guarantee to the states for AUD issuance, QTC applied on 17 September 2009 to take up the guarantee on all AUD benchmark bond lines for maturities ranging from 2011 to 2021. The guarantee offer expired on 31 December 2010.
# QTC holds its own stock and these holdings have been excluded from the debt outstanding figures.
ANNUAL REPORT 2012–13 QUEENSLAND TREASURY CORPORATION 5
CHAIRMAN’S & CHIEF EXECUTIVE’S REPORT 2012-13
In the context of a new political and economic landscape, QTC re-focused on its core mandate of providing debt funding for the State’s infrastructure needs in the most cost-effective manner, and supporting the public sector with specialist financial and risk management advice and support.
Enhancements to our products and services supported the programs of our clients and assisted them to increase their efficiency and effectiveness.
We also realigned our strategy, structure and operations in support of the Government’s primary fiscal objectives to restore the State’s financial strength and regain its AAA credit rating.
Funding objectives met
In a global economic environment that remained challenging, albeit marginally less volatile than in previous financial years, QTC’s strong reputation and relationship with investors helped ensure it met the State’s funding requirements.
QTC raised a total of $17.9 billion and launched three new benchmark bond lines, which attracted considerable investor interest. Issuance throughout the year contributed to stable benchmark bond spreads, as well as increased participation in each new bond line from investors based in the US, following the incorporation of US Rule 144A into our cornerstone Australian dollar benchmark bond program.
At 30 June 2013, 66 per cent of QTC’s new term debt raised had a duration of eight years or longer. Supporting its long-term debt programs, QTC maintained approximately $5 billion of short-term debt, with commercial paper being issued at an average seven basis points below bank bill levels.
In tandem with the issuance of new debt, we took the opportunity to lengthen the duration of clients’ debt portfolios to benefit from historically low interest rates. Active management of the debt portfolios, improved market risk management and a reduction in QTC’s cost-recovery fees also contributed to savings for clients.
On the investment side, clients investing surplus cash received strong returns from QTC’s Capital Guaranteed Cash Fund, which outperformed the benchmark UBS Bank Bill Index by 86 basis points, a saving of $60.7 million.
QTC continued its commitment to ensuring transparent communication and collaborative relationships with the markets, via the 15 domestic and global banks that make up its Fixed Income Distribution Group (FIDG). In July, QTC joined the State’s new Treasurer on a joint Treasury and Trade mission, meeting with institutional investors as part of our annual investor relations program. QTC will continue to build its relationship with its markets in order to maintain and diversify its investor base providing access to the most cost-effective funding.
Operating result
For the 2012-13 year, QTC recorded an operating profit after tax from its capital markets operations of $222.9 million (2011-12: $46.9 million) primarily due to fair value accounting gains, which, depending on market changes, may reverse in subsequent accounting periods. Separate from QTC’s capital markets operations, the long-term assets operations recorded a profit of $990.3 million (2011-12: $187.2 million). This segment comprises the investments that fund the State’s defined benefit superannuation and other long-term obligations.
6 QUEENSLAND TREASURY CORPORATION ANNUAL REPORT 2012–13

Managed by QIC, these obligations were transferred to QTC by the Queensland Government under an administrative arrangement in 2008; in return, QTC issued the State with fixed-rate notes that provide a fixed rate of return. While QTC bears the fluctuations in the value and returns on the asset portfolio, there is no cash flow effect for QTC. Any accumulated losses incurred by this segment have no impact on QTC’s capital markets activities or its ability to meet its obligations.
Refocus and restructure
A substantial refocusing of our four-year strategic plan—underpinned by a new management framework that assesses performance against strategic priorities, and a reorganisation of our management structure—were two key initiatives undertaken to align our operations to the Government’s new priorities.
A renewed emphasis on delivering whole-of-State benefits, including the creation of a team specifically tasked with addressing financial risk management issues in this space, has already delivered real benefits.
In addition to the savings generated for clients from funding and liquidity management activities noted above, whole-of-State outcomes included the provision of resources to assist the Government’s Projects Queensland initiative and the Queensland Commission of Audit, and financial analysis to support the work of the local government Boundaries Commission.
The realignment of our client service groups, to ensure they are best placed to meet client priorities, puts QTC in a strong position to deliver tangible, structured and unique financial outcomes that support clients in the attainment of their objectives. Refinements to a number of products and services also offered benefits to clients.
QTC undertook an extensive program to strengthen collaborative relationships with clients that will enable it to identify and leverage opportunities to add value through product, service and organisational innovation. This also gave us an opportunity to reaffirm our role as the State’s provider of debt funding and financial risk management solutions.
These initiatives contributed to a notable increase in clients’ perceptions of QTC and the value we can add, revealed in our annual survey.
Operational efficiencies and enhancements
A particular emphasis of our drive to create operational efficiencies was on better managing our technology to improve quality and cost-effectiveness.
The enhancement of a ‘high-performance’ culture across the workplace to support our strategic objectives underpinned our human resources activities. Significant workplace improvement initiatives to enhance skills, build team capacity, develop employees, recognise superior performance and relocate all staff into one workplace combined to deliver a pleasing increase in both corporate performance and staff engagement.
Changes to the Board
In the year under review, we farewelled two long-standing Board members and welcomed two new ones.
Our sincere thanks and best wishes went to Marian Micalizzi and Shauna Tomkins for their significant contributions to QTC over the past twelve and a half years when they resigned from the Board in January.
To fill those vacancies, we were delighted to welcome two new Board members—Stephen Bizzell and Tonianne Dwyer— who have brought new skill sets, perspectives and more than four decades of experience in the executive management of public and private entities in Australia and internationally to the Board.
Looking ahead
QTC bonds remain a highly appealing proposition for investors given the attractive yield and the fact that they are guaranteed by the Queensland Government. We will continue to monitor offshore bond issuance opportunities, and in support of our markets activities, we will maintain our program of investor engagement activities with the objective of diversifying our investor base and accessing the most cost-effective funding for the State.
G P BRADLEY
Chairman
P C NOBLE
Chief Executive
ANNUAL REPORT 2012–13 QUEENSLAND TREASURY CORPORATION 7
CORPORATE PERFORMANCE REPORT 2012-13
This Corporate Performance Report details QTC’s progress towards achieving its strategic goals in 2012-13 (see page 11 for Strategic Goals and Key Performance Indicators).
Funding the State
During the year under review, we raised $17.9 billion to meet the State’s funding requirements.
We issued approximately $1 billion of term debt each month, bringing the total term debt raised to $12.6 billion for the fiscal year. We funded the remaining $5.3 billion via our commercial paper programs. More than 66 per cent of the long-term debt raised as part of QTC’s borrowing program had a maturity of longer than eight years, providing funding to the State at historically low rates. QTC bond spreads narrowed by 0.53 per cent on average to Australian Government bonds.
QTC employed a variety of issuance methods during the year. Three new benchmark bond lines, with 144A capability, were successfully launched via syndication. The bonds, maturing 2017, 2019 and 2023, collectively raised significant volumes on issue (between $750 million and $1.65 billion). In addition to syndicated issuance, we conducted two online tenders to add to existing bond lines.
Our success in financial markets can be attributed in part to our consistent approach of being open and transparent with institutional investors—both domestically and across the globe—through the 15 global banks who act as our market intermediaries in the markets.
We continued to deliver significant quantitative and qualitative results for our clients and the State through our financial markets activities by:
lengthening client debt portfolios to enable them to take advantage of historically low interest rates
aligning debt issuance opportunities and the timing of client drawdowns, reducing transaction costs
identifying and monitoring opportunistic funding alternatives for clients (eg, foreign currency denominated private placements)
facilitating market soundings to gauge appetite for alternative financing solutions to alleviate pressure on the State’s balance sheet
providing pricing and market information in various financial markets (including swaps, foreign exchange, commodities and interest rates)
sourcing global financial market risk expertise through QTC’s Fixed Income Distribution Group (FIDG) members and continuing to develop these broader, strategic relationships, and
facilitating bespoke economic presentations (including those provided by QTC’s FIDG members), research pieces and market updates on a regular and ad-hoc basis.
We continue to offer a range of products that enable clients to maximise the value of surplus funds. This past year, our Capital Guaranteed Cash Fund outperformed its benchmark, the UBS Australian Bank Bill Index, by 86 basis points.
We successfully completed approximately 88,000 transactions with a turnover $1.2 trillion.
8 QUEENSLAND TREASURY CORPORATION ANNUAL REPORT 2012–13
Advising the State and clients
In the year under review, QTC concentrated on aligning its activities to the Government’s new strategic approach and we undertook a significant corporate reorganisation to re-align our structure and resources and better position us to address client needs.
In particular, our commitment to supporting the Government to achieve whole-of-State objectives was strengthened to complement our ongoing focus on the needs of individual public sector clients.
Whole-of-State outcomes
A key priority for the year has been supporting the State to complete its major State-wide programs of work and meet its fiscal priorities and objectives.
To support the Government to address a range of financial risk management issues on a whole-of-State basis in order to achieve its aim of restoring the
State’s finances and returning the State to AAA, QTC established a Whole-of-State Solutions practice and contributed significantly to a number of whole-of-State outcomes, including:
supporting the Queensland Commission of Audit in its review of the State’s financial position. This work will be a key input into future
Government economic and fiscal policy with a view to improving and strengthening the State’s economy
supporting the Boundaries Commissioner to evaluate the financial impacts of proposed local government de-amalgamations on the councils and their ratepayers, with a public commendation for this work by the Minister for Local Government, Community Recovery & Resilience (DLGCRR)
seconding 17 commercial and financial specialists to Projects Queensland, a key election commitment of the new State Government. These employees have been involved in a number of projects that have delivered tangible outcomes for Government, including the 1 William Street development, Toowoomba Second Range Crossing Project, the Queensland Schools Project, the Port of Abbot Point development
playing a central role in managing two partial sell-downs of the State’s shareholding in Aurizon Holdings Ltd that realised a net value to the State’s bottom line of $400 million, and
simplifying the cost-recovery fee structures of its debt funding products, including the abolition of the capital markets fee, generating $7.5 million in net savings to our clients and the State.
Client advisory
Following the significant post-2012 election changes at both State and local government levels, QTC implemented an extensive client relationship program. This priority program was undertaken to ensure robust, collaborative relationships were in place, enabling QTC to assist and leverage opportunities to add value to its clients through product, service and organisational innovation.
The success of these programs was indicated by pleasing results from our annual client survey: positive sentiment towards QTC was 8.3 out of 10 (against a target of 7 and compared with 8.2 in the previous survey).
We also saw an increase in the number of advisory assignments, the most significant of which included:
developing a series of submissions to the Australian Energy Market Commission’s review of the national rules governing the economic regulation of electricity network service providers, to help achieve a positive result in the long-term for the State’s energy Government-owned corporations (GOCs)
assisting the State’s three bulk water providers to plan and manage the consolidation of their debt and investment facilities into a single entity
completing the first two phases of the Logan Renewal Initiative Assessment for the Department of Housing and Public Works
providing modelling support to the Department of Energy and Water Supply for its 30-year energy plans
implementing an innovative funding strategy to allow Brisbane City Council to construct a regional public transport hub in the Trade Coast Industrial Precinct at Eagle Farm in the most cost-effective manner
advising SunWater and the Department of Energy and Water Supply on the proposed transfer of irrigation channel assets to local management
completing a commercial advisory assignment on the Aurukun Bauxite Lease tender for the Department of State Development, Infrastructure and Planning
providing the Department of Transport and Main Roads with commercial advice in relation to the competitive tender process for Private Plates Queensland
participating in the Mine Leases
Competitive Cash bidding financial advisory panel for the Department of Natural Resources and Mines
ANNUAL REPORT 2012–13 QUEENSLAND TREASURY CORPORATION 9
providing financial and electricity market modelling to Queensland Treasury and Trade and the Department of Energy and Water Supply on a range of electricity and energy reform matters, and
developing and delivering bespoke training to clients on cost of capital calculation, project evaluation and business case development.
Client services
Improvements were made to the support services we offer clients, including the:
launch of QTC Connect, our secure client website that offers a range of new online functionality, including account and transaction information, the QTC Cash Management platform for agencies required to provide daily cash flow forecasts, and a range of useful tools such as the QTC loan calculator, and
streamlining of client reports, such as market and economic reviews, to enhance the timeliness, quality and dissemination of business information.
Local government
The year saw a growing emphasis on connecting with local government, highlighting the value QTC can add through its advisory and training services, as well as the services of its associated entity, Local Government Infrastructure Services (LGIS) in the areas of infrastructure procurement, tendering and waste management.
Key projects completed for local government clients included:
developing and delivering, in collaboration with the Department of Local Government, Community Recovery and Resilience and the Local Government Association of Queensland:
a State-wide series of training events for elected officials, including the large number of first-time councillors, following the local government elections in March 2012, and
a financial management course for the State’s 17 Indigenous and Torres Strait Island councils
conducting comprehensive sustainability reviews of 10 councils to give them a better view of their financial health, assist them to more effectively plan for the future, and sharpen the sector’s focus on financial sustainability
providing financial and strategic advice to local governments to assist them in preparing for the implementation of the carbon pricing scheme, including options to limit their financial liability
continuing to assist councils with natural disaster recovery by supporting their applications for National Disaster Relief and Recovery Arrangements (NDRRA) funding assistance and subsequent infrastructure procurement, and
reviewing and updating pro forma financial statements in relation to IFRS 7 disclosures for use by local government.
Managing risk and services
During the year, QTC promoted a strong risk management culture with a continued focus on improving risk management practices, particularly in relation to portfolio management and market risk management, and the completion of a review to more succinctly identify QTC’s most significant risks.
The QTC Board approved the 2013 Risk
Appetite Statement, which clearly defines
QTC’s appetite for risk and provides clear organisational definitions on risk tolerance in setting and understanding its key strategic and business objectives. Improvements to enterprise-wide practices for reviewing, monitoring and reporting risk support the achievement of strategic objectives by ensuring risks are effectively identified, evaluated, managed and reported using a consistent and well-understood approach.
A key priority has been the work to procure a new market and credit risk system. Given the importance of this system, QTC has implemented an external gateway review process for critical stages of this project, including the development of the business case. A request for proposals was issued in July 2013, and it is anticipated that the project will be completed in 2014-15.
Significant portfolio market risk exposures have been managed within Board-approved limits.
In the changing climate of global financial markets, QTC will continue to review its processes and practices to protect the integrity of our risk management environment and support our business objectives.
Creating operational efficiencies
QTC’s commitment to efficiency continued throughout the year, with an emphasis on improving the quality and cost-effectiveness of both client services and administrative activities.
A key initiative was the co-location of all employees into a single premises, providing greater efficiency in the use of space, improved organisational productivity due to better cross-collaboration, availability of efficient technologies and improved staff amenity.
Sixty per cent of office furniture and equipment was reused to minimise fit-out costs.
The project to develop and implement a self-service platform for clients was completed using internal resources. Its launch as the secure QTC Connect website offers clients enhanced access to quality information and tools to support our client relationship management initiatives, as well as creating efficiencies for QTC.
A business information strategy will see development of a data warehouse to provide a single central source of data, reducing QTC’s reliance on a network of databases and spreadsheets while improving performance and reporting. Finally, a number of initiatives to support mobile device usage were rolled out, including new policies and work practices to maximise the benefits while reducing costs.
QTC remains committed to continuous improvement in the way it does business and its capacity to add value in the services provided to clients.
10 QUEENSLAND TREASURY CORPORATION ANNUAL REPORT 2012-13
Driving a ‘high-performance’ culture
Work continued to embed a high-performance culture at QTC, with projects around communication, remuneration, recognition, career development and work-life balance contributing to the ‘investing in our people’ portfolio.
The development of a new performance framework, and introduction of a new online performance management system, supports performance improvement by clarifying objectives and measures at an individual, group and organisational level. Individual development plans support employees to meet their targets and develop skills in readiness for future career opportunities.
During the year, a new organisation-wide learning and development framework was developed and the first component, an online learning management system, was implemented to streamline access to learning-related information, activities and online resources.
Our people leaders participated in a leadership program aimed at building capability in setting expectations, recognising and encouraging high performance, and supporting career development. This program will be further enhanced with additional capability development for leaders in the coming year.
In 2013-14, we will focus on strategic workforce planning to ensure we remain flexible and responsive to the changing environment and that we have ready successors for key leadership and business critical roles. Supporting this is the development of a promotions framework to ensure a formal, transparent and consistent approach to employee promotion.
External professional development is also encouraged, with QTC investing in its people through the provision of study support. Employees also benefit from our corporate health program, which supports participation in a range of activities including exercise, nutrition and wellbeing programs.
QTC continues to benefit from providing flexible work practices that support employees to balance work and life commitments. These practices contribute to our high retention rates.
Early indications are that these programs are beginning to have an impact, with the regular employee survey recording a significant-14 per cent-increase in engagement across employee categories, including people leaders. Results showed a higher positive perception of our employees’ work experience, including rewards, communication and performance and change management.
QTC maintains its commitment to increasing employee engagement, with action plans focused on career opportunities, change management and innovation, and performance management.
QTC regularly reviews and updates its policies and procedures to comply with changes in the legislative and regulatory environment, and to ensure employees have access to avenues through which to raise concerns, including an internal grievance process. QTC employees are employed under individual employment agreements, which adhere to the legislated provisions of the Fair Work Act 2009.
Workforce profile FY 2012-13
Establishment 226
Full-time equivalent staff 224
Permanent retention rate 94.26%
Permanent separation rate 5.23%
Permanent average tenure 6.29 years
QTC’s Strategic Goals, as outlined in its Strategic Plan 2012-16.
Maintain organisational sustainability Achieve sustainable access to funding Create client value Deliver whole-of- State benefits
KPI 1: QTC operates efficiently and effectively
KPI 4: The State’s funding objectives are met, following Board-approved funding principles
KPI 5: Clients acknowledge QTC’s positive contribution to their businesses
KPI 6: Evidence that QTC has delivered whole-of-State benefits, through:
KPI 2: Risks are managed within QTC’s risk appetite
quantifiable savings generated for clients from core funding and liquidity management activities, and
KPI 3: QTC’s employee engagement scores trend positive
positive acknowledgement of QTC’s contribution to the success of the State’s major programs
ANNUAL REPORT 2012–13 QUEENSLAND TREASURY CORPORATION 11
CORPORATE
GOVERNANCE
2012-13
QTC is committed to maintaining high standards of corporate governance to support its strong market reputation and ensure that organisational goals are met and risks are monitored and appropriately addressed.
QTC’s corporate governance practices are continually reviewed and updated in line with industry guidelines and standards.
QTC and its Boards
QTC was established by the Queensland
Treasury Corporation Act 1988 (the QTC Act) as a corporation sole (ie, a corporation that consists solely of a nominated office holder). The Under Treasurer of Queensland is QTC’s nominated office holder. QTC has delegated its powers to its two boards:
the Queensland Treasury Corporation Capital Markets Board (the Board), which was established in 1991 and manages all of QTC’s operations except those relating to certain superannuation and other long-term assets, and
the Long Term Asset Advisory Board, which was established in July 2008 and advises in relation to certain superannuation and other long-term assets that were transferred to QTC from Queensland Treasury on 1 July 2008.
QTC Capital Markets Board
QTC and the Capital Markets Board have agreed the terms and administrative arrangements for the exercise of the powers that have been delegated to the Board by QTC (as the corporation sole). The Board operates in accordance with its charter, which sets out its commitment to various corporate governance principles and standards, the roles and responsibilities of the Board and its members (based on its delegated powers), and the conduct of meetings. The charter provides that the role and functions of the Board include:
overseeing QTC’s operations, including its control and accountability systems
developing and monitoring QTC’s strategic and corporate plans, operational policy and yearly budget
monitoring and measuring financial and operational performance
monitoring and measuring organisational and staff performance
monitoring key risks and risk management processes, and
ensuring that QTC’s compliance is appropriate for an organisation of its type.
The Board holds monthly meetings (except in January) and may, whenever necessary, hold additional meetings.
Board appointments
The Board comprises seven directors who are appointed by the Governor-in-Council, pursuant to section 10(2) of the QTC Act, with consideration given to each
Board member’s qualifications, experience, skills, strategic ability and commitment to contribute to QTC’s performance and achievement of its corporate objectives. QTC’s Board is entirely constituted of non-executive directors.
Conflict of interest
Board members are required to monitor and disclose any actual or potential conflicts of interest. Unless the Board determines otherwise, a conflicted Board member may not receive any Board papers, attend any meetings or take part in any decisions relating to declared interests.
Performance and remuneration
To ensure continuous improvement and to enhance overall effectiveness, the Board conducts an annual assessment of its performance as a whole. Board members’ remuneration is determined by the Governor-in-Council (details are disclosed in QTC’s financial statements).
Board committees
The Board has established three committees, each with its own terms of reference, to assist it in overseeing and governing various QTC activities.
12 QUEENSLAND TREASURY CORPORATION ANNUAL REPORT 2012–13
Accounts and Audit Committee
The Accounts and Audit Committee has responsibility for the:
adequacy and effectiveness of internal controls, including for the prevention of fraud integrity of financial statements adequacy and effectiveness of compliance monitoring, and audit effectiveness.
The Accounts and Audit Committee must have at least three members and meet at least four times a year.
During the year the Accounts and Audit Committee recommended the adoption of the half year and annual financial statements, reviewed external and internal audit reports and the progress in implementing the recommendations from those reports, and reviewed the Queensland Audit Office’s Client Service Plan and Queensland Treasury and Trade’s Internal Audit Plan.
As required by the Audit Committee
Guidelines: Improving Accountability and Performance issued by Queensland Treasury, QTC’s Accounts and Audit Committee has observed its terms of reference and has had due regard to the Audit Committee Guidelines.
Human Resources Committee The Human Resources Committee has responsibility for:
the appropriateness of any new or amended human resources policy
the framework for, and review of, employee remuneration and performance, and employment terms and conditions.
The Human Resources Committee must have at least two members and meet at least two times a year.
The Human Resources Committee has observed its terms of reference.
Funding and Markets Committee
The Funding and Markets Committee has responsibility for monitoring and reviewing the management of the following key market areas and to make recommendations as it considers appropriate for changes to the strategy and policy for these areas:
funding accessibility (including liquidity) pool performance, and market counterparty credit to support QTC’s risk appetite with a focus on effectiveness and performance.
The Committee must have at least three members and meet at least six times a year. The Funding and Markets Committee has observed its terms of reference.
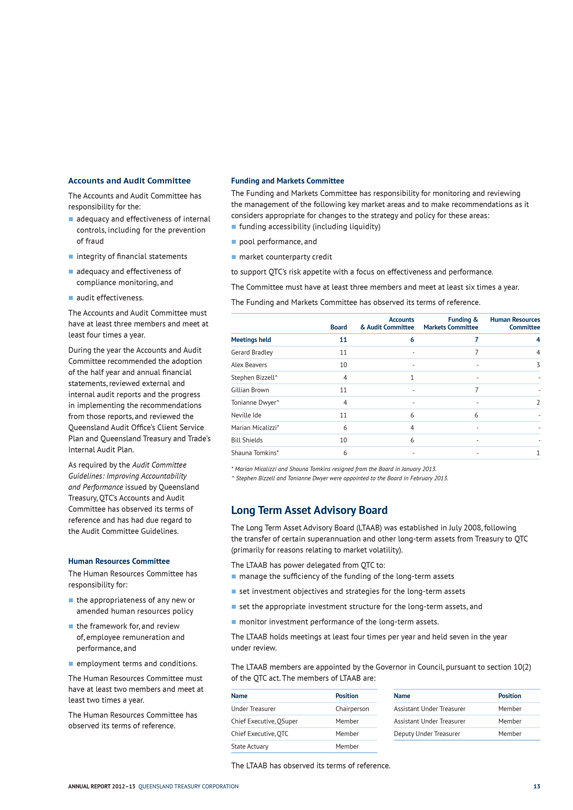
Accounts Funding & Human Resources Board & Audit Committee Markets Committee Committee Meetings held
11 6 7 4 Gerard Bradley
11 — 7 4 Alex Beavers
10 — — 3 Stephen Bizzell^
4 1 — — Gillian Brown
11 — 7 — Tonianne Dwyer^
4 — — 2 Neville Ide
11 6 6 — Marian Micalizzi*
6 4 — — Bill Shields
10 6 — — Shauna Tomkins*
6 — — 1 * Marian Micalizzi and Shauna Tomkins resigned from the Board in January 2013.
^ Stephen Bizzell and Tonianne Dwyer were appointed to the Board in February 2013.
Long Term Asset Advisory Board
The Long Term Asset Advisory Board (LTAAB) was established in July 2008, following the transfer of certain superannuation and other long-term assets from Treasury to QTC (primarily for reasons relating to market volatility).
The LTAAB has power delegated from QTC to:
manage the sufficiency of the funding of the long-term assets
set investment objectives and strategies for the long-term assets
set the appropriate investment structure for the long-term assets, and
monitor investment performance of the long-term assets.
The LTAAB holds meetings at least four times per year and held seven in the year under review.
The LTAAB members are appointed by the Governor in Council, pursuant to section 10(2) of the QTC act. The members of LTAAB are:
Name Position
Under Treasurer Chairperson
Chief Executive, QSuper Member
Chief Executive, QTC Member
State Actuary Member
Name Position
Assistant Under Treasurer Member
Assistant Under Treasurer Member
Deputy Under Treasurer Member
The LTAAB has observed its terms of reference.
ANNUAL REPORT 2012–13 QUEENSLAND TREASURY CORPORATION 13
QTC Board members 2012-13
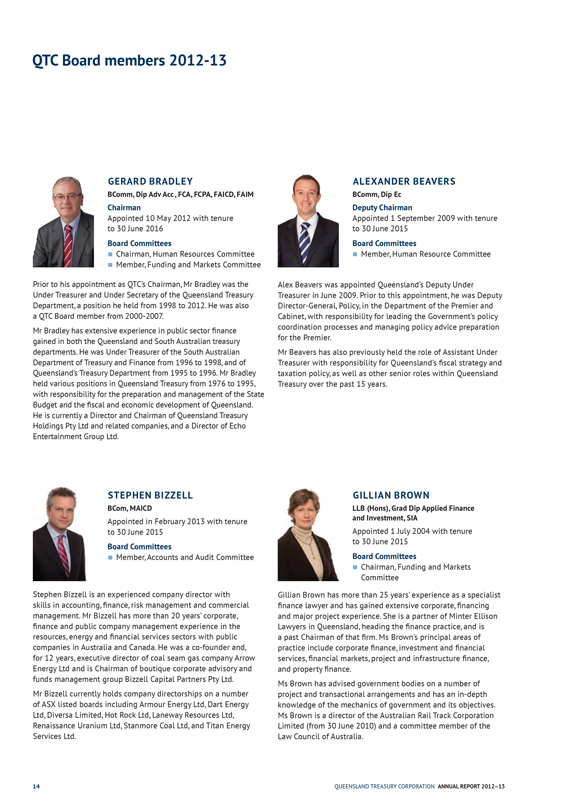
GERARD BRADLEY
BComm, Dip Adv Acc , FCA, FCPA, FAICD, FAIM
Chairman
Appointed 10 May 2012 with tenure to 30 June 2016
Board Committees
Chairman, Human Resources Committee
Member, Funding and Markets Committee
Prior to his appointment as QTC’s Chairman, Mr Bradley was the Under Treasurer and Under Secretary of the Queensland Treasury Department, a position he held from 1998 to 2012. He was also a QTC Board member from 2000-2007.
Mr Bradley has extensive experience in public sector finance gained in both the Queensland and South Australian treasury departments. He was Under Treasurer of the South Australian Department of Treasury and Finance from 1996 to 1998, and of Queensland’s Treasury Department from 1995 to 1996. Mr Bradley held various positions in Queensland Treasury from 1976 to 1995, with responsibility for the preparation and management of the State
Budget and the fiscal and economic development of Queensland.
He is currently a Director and Chairman of Queensland Treasury Holdings Pty Ltd and related companies, and a Director of Echo Entertainment Group Ltd.
ALEXANDER BEAVERS
BComm, Dip Ec
Deputy Chairman
Appointed 1 September 2009 with tenure to 30 June 2015
Board Committees
Member, Human Resource Committee
Alex Beavers was appointed Queensland’s Deputy Under Treasurer in June 2009. Prior to this appointment, he was Deputy Director-General, Policy, in the Department of the Premier and Cabinet, with responsibility for leading the Government’s policy coordination processes and managing policy advice preparation for the Premier.
Mr Beavers has also previously held the role of Assistant Under
Treasurer with responsibility for Queensland’s fiscal strategy and taxation policy, as well as other senior roles within Queensland Treasury over the past 15 years.
STEPHEN BIZZELL
BCom, MAICD
Appointed in February 2013 with tenure to 30 June 2015
Board Committees
Member, Accounts and Audit Committee
Stephen Bizzell is an experienced company director with skills in accounting, finance, risk management and commercial management. Mr Bizzell has more than 20 years’ corporate, finance and public company management experience in the resources, energy and financial services sectors with public companies in Australia and Canada. He was a co-founder and, for 12 years, executive director of coal seam gas company Arrow Energy Ltd and is Chairman of boutique corporate advisory and funds management group Bizzell Capital Partners Pty Ltd. Mr Bizzell currently holds company directorships on a number of ASX listed boards including Armour Energy Ltd, Dart Energy Ltd, Diversa Limited, Hot Rock Ltd, Laneway Resources Ltd, Renaissance Uranium Ltd, Stanmore Coal Ltd, and Titan Energy Services Ltd.
GILLIAN BROWN
LLB (Hons), Grad Dip Applied Finance and Investment, SIA
Appointed 1 July 2004 with tenure to 30 June 2015
Board Committees
Chairman, Funding and Markets Committee
Gillian Brown has more than 25 years’ experience as a specialist finance lawyer and has gained extensive corporate, financing and major project experience. She is a partner of Minter Ellison
Lawyers in Queensland, heading the finance practice, and is a past Chairman of that firm. Ms Brown’s principal areas of practice include corporate finance, investment and financial services, financial markets, project and infrastructure finance, and property finance.
Ms Brown has advised government bodies on a number of project and transactional arrangements and has an in-depth knowledge of the mechanics of government and its objectives. Ms Brown is a director of the Australian Rail Track Corporation Limited (from 30 June 2010) and a committee member of the Law Council of Australia.
14 QUEENSLAND TREASURY CORPORATION ANNUAL REPORT 2012–13

TONIANNE DWYER
B Juris (Hons), B Laws (Hons), GAICD
Appointed 14 February 2013 with tenure to 30 June 2015
Board Committees
Member, Human Resources Committee
Tonianne Dwyer is a lawyer by profession with a career of more than 25 years in international investment and finance in both executive management and board positions.
She has held senior roles with Harnbros Bank Limited and Societe Generale and was an Executive Director of Quintain Estates & Development PLC, a listed United Kingdom property company involved in investment and urban regeneration.
Ms Dwyer’s executive experience covers a broad range of sectors, including real estate investment and development, financial services, health and aged care, education, research and development, and media, including a role with the finance division of the UK Department of Health. She has extensive experience of financing social infrastructure and of leading teams on public private partnership bids. Her operational experience includes UK, Europe and Wall Street.
Ms Dwyer currently holds directorships on DEXUS Property Group, DEXUS Wholesale Property Fund and Cardno Limited.
NEVILLE IDE
BBus, MCom, FCPA, FAICD
Appointed 1 July 2011 with tenure to 30 June 2015
Board Committees
Member, Accounts and Audit Committee
Member, Funding and Markets Committee
Neville Ide has more than 30 years’ experience in the financial services industry, predominantly banking and insurance; his most recent executive position was as Suncorp Metway Group’s Treasurer. He has extensive commercial experience in liquidity management, debt funding, capital management and balance sheet structuring.
From 2010, Mr Ide has served on a number of boards and provided financial risk management advisory services. He is also a non-executive director of RACQ Insurance Ltd, Queensland Motorways Pty Limited and Queensland Police Credit Union Ltd.
BILL SHIELDS
BEcon (Hons), MEc, MAICD
Appointed 1 July 2004 with tenure to 30 June 2015
Board Committees
Chairman, Accounts and Audit Committee
Bill Shields has extensive experience in the banking and finance industry, as well as government policy advice, specialising in economics. His career responsibilities have included economic and financial market research in Australia and overseas, and the provision of analytical and strategic advice on the Australian financial system and monetary policy, Australia’s exchange rate arrangements and international financial developments, as well as oversight of energy markets in Australia, New Zealand and Singapore. Mr Shields was previously Chief Economist and Executive Director of Macquarie Bank Limited (1987–2001), and he has also held positions with the Reserve Bank of Australia (1983–1985), the International Monetary Fund (1973–75 and 1977–83), and the Australian Treasury. He was a Visiting Professor at the Macquarie Graduate School of Management of Macquarie University from 2001-09 and has recently taught at the Australian Catholic University in Brisbane. He is currently a director of the Sydney Anglican Schools Corporation and is Chair of its Education and Strategic Development Committee.
ANNUAL REPORT 2012–13 QUEENSLAND TREASURY CORPORATION
15
Auditors
In accordance with the provisions of the
Auditor-General Act 2009, the Queensland
Audit Office is the external auditor for QTC. The Queensland Audit Office has the responsibility for providing Queensland’s Parliament with assurances as to the adequacy of QTC’s discharge of its financial and administrative obligations.
QTC has an independent Internal Audit function that is currently outsourced to KPMG and reports to the Board’s Accounts and Audit Committee. Internal audit is conducted under an Internal Audit Charter that is consistent with the relevant audit and ethical standards. The role of internal audit is to support QTC’s corporate governance framework by providing the Board (through the Accounts and Audit Committee) with:
assurance that QTC has effective, efficient and economical internal controls in place to support the achievement of its objectives, including the management of risk, and
advice with respect to QTC’s internal controls and business processes.
Internal Audit is responsible for:
developing an annual audit plan, based on the assessment of financial and business risks (based on QTC’s approved significant risks and internal workshops) aligned with QTC’s strategic goals and objectives, and approved by the QTC Accounts and Audit Committee
providing regular audit reports and periodic program management reports to the management team and the QTC Accounts and Audit Committee, and
working constructively with QTC’s management team to challenge and improve established and proposed practices and to put forward ideas for process improvement.
In the year under review, KPMG completed its internal audits in accordance with the approved annual audit plan.
QTC has had due regard to Treasury’s Audit Committee guidelines, in establishing and supervising its outsourced internal audit function and, together with the Accounts and Audit Committee, in overseeing and monitoring the internal audit function.
In the 2012-13 financial year, the Queensland Audit Office (QAO) audited controls and conducted some substantive testing of QTC’s systems used to complete the half year and full year annual financial statements. The QAO raised four low-rated issues that have been considered by the Accounts and Audit Committee. These issues have now been addressed.
Risk management QTC manages its risks within an enterprise-wide risk management framework (EwRM). The framework supports the achievement of QTC’s corporate strategies and objectives by providing assurance that QTC’s risks are being appropriately and effectively identified and managed, using a consistent and well-understood approach for evaluating and reporting risks.
As part of this framework, QTC periodically identifies its key or significant risks, which are reported to its Risk Management Team and to the Board through structured reporting processes.
QTC’s Chief Risk Officer is responsible for embedding QTC’s risk management policy and program in its business processes, to ensure a consistent organisation-wide approach to risk mitigation and an enhanced individual employee understanding of EwRM and what it means in their day-to-day work.
Strategy and structure
Our operating model links the strategy, culture, processes, people, leadership and systems of our organisation and outlines the key business processes we use to create value for our clients.
QTC’s organisational structure supports its operating model and achievement of the organisation’s strategies creating alignment throughout the organisation, linking appropriate staff expertise and accountabilities to the client value-creation process.
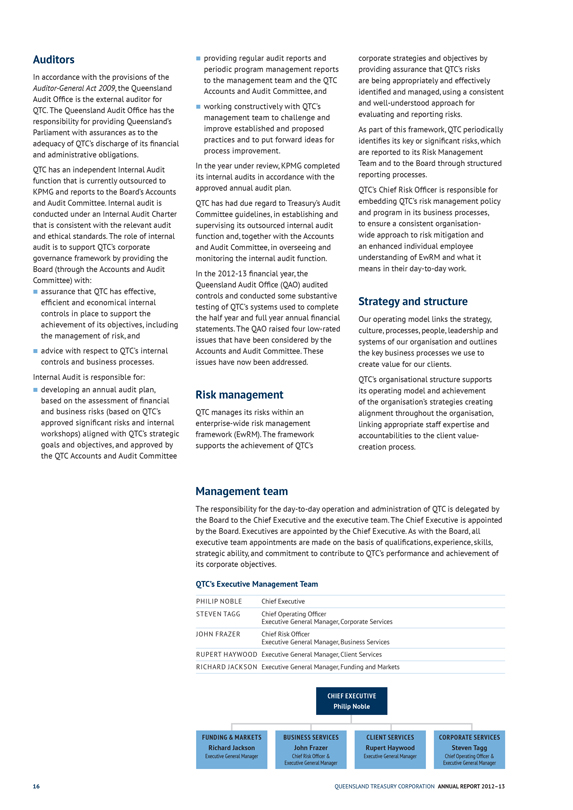
Management team
The responsibility for the day-to-day operation and administration of QTC is delegated by the Board to the Chief Executive and the executive team. The Chief Executive is appointed by the Board. Executives are appointed by the Chief Executive. As with the Board, all executive team appointments are made on the basis of qualifications, experience, skills, strategic ability, and commitment to contribute to QTC’s performance and achievement of its corporate objectives.
QTC’s Executive Management Team
PHILIP NOBLE Chief Executive
STEVEN TAGG Chief Operating Officer
Executive General Manager, Corporate Services
JOHN FRAZER Chief Risk Officer
Executive General Manager, Business Services
RUPERT HAYWOOD Executive General Manager, Client Services
RICHARD JACKSON Executive General Manager, Funding and Markets
CHIEF EXECUTIVE Philip Noble
FUNDING & MARKETS Richard Jackson
Executive General Manager BUSINESS SERVICES
John Frazer Chief Risk Officer & Executive General Manager
CLIENT SERVICES Rupert Haywood Executive General Manager
CORPORATE SERVICES Steven Tagg
Chief Operating Officer & Executive General Manager
16 QUEENSLAND TREASURY CORPORATION ANNUAL REPORT 2012–13

INVESTOR
REPORT
AUDAX AT FIDELIS
QUEENSLAND
TREASURY
CORPORATION
CELEBRATING
25 YEARS
EST.1988
17
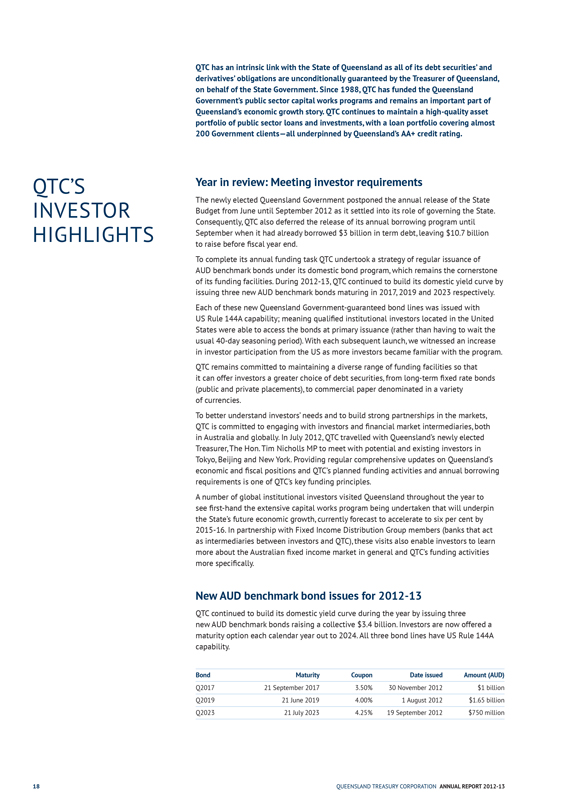
QTC’S INVESTOR HIGHLIGHTS
QTC has an intrinsic link with the State of Queensland as all of its debt securities’ and derivatives’ obligations are unconditionally guaranteed by the Treasurer of Queensland, on behalf of the State Government. Since 1988, QTC has funded the Queensland Government’s public sector capital works programs and remains an important part of Queensland’s economic growth story. QTC continues to maintain a high-quality asset portfolio of public sector loans and investments, with a loan portfolio covering almost 200 Government clients—all underpinned by Queensland’s AA+ credit rating.
Year in review: Meeting investor requirements
The newly elected Queensland Government postponed the annual release of the State Budget from June until September 2012 as it settled into its role of governing the State. Consequently, QTC also deferred the release of its annual borrowing program until September when it had already borrowed $3 billion in term debt, leaving $10.7 billion to raise before fiscal year end.
To complete its annual funding task QTC undertook a strategy of regular issuance of
AUD benchmark bonds under its domestic bond program, which remains the cornerstone of its funding facilities. During 2012-13, QTC continued to build its domestic yield curve by issuing three new AUD benchmark bonds maturing in 2017, 2019 and 2023 respectively.
Each of these new Queensland Government-guaranteed bond lines was issued with US Rule 144A capability; meaning qualified institutional investors located in the United States were able to access the bonds at primary issuance (rather than having to wait the usual 40-day seasoning period). With each subsequent launch, we witnessed an increase in investor participation from the US as more investors became familiar with the program.
QTC remains committed to maintaining a diverse range of funding facilities so that it can offer investors a greater choice of debt securities, from long-term fixed rate bonds (public and private placements), to commercial paper denominated in a variety of currencies.
To better understand investors’ needs and to build strong partnerships in the markets, QTC is committed to engaging with investors and financial market intermediaries, both in Australia and globally. In July 2012, QTC travelled with Queensland’s newly elected Treasurer, The Hon. Tim Nicholls MP to meet with potential and existing investors in Tokyo, Beijing and New York. Providing regular comprehensive updates on Queensland’s economic and fiscal positions and QTC’s planned funding activities and annual borrowing requirements is one of QTC’s key funding principles.
A number of global institutional investors visited Queensland throughout the year to see first-hand the extensive capital works program being undertaken that will underpin the State’s future economic growth, currently forecast to accelerate to six per cent by 2015-16. In partnership with Fixed Income Distribution Group members (banks that act as intermediaries between investors and QTC), these visits also enable investors to learn more about the Australian fixed income market in general and QTC’s funding activities more specifically.
New AUD benchmark bond issues for 2012-13
QTC continued to build its domestic yield curve during the year by issuing three new AUD benchmark bonds raising a collective $3.4 billion. Investors are now offered a maturity option each calendar year out to 2024. All three bond lines have US Rule 144A capability.
| | | | | | | | |
Bond | | Maturity | | Coupon | | Date issued | | Amount (AUD) |
Q2017 | | 21 September 2017 | | 3.50% | | 30 November 2012 | | $1 billion |
Q2019 | | 21 June 2019 | | 4.00% | | 1 August 2012 | | $1.65 billion |
Q2023 | | 21 July 2023 | | 4.25% | | 19 September 2012 | | $750 million |
18 | | | | | | | | QUEENSLAND
TREASURY
CORPORATION
ANNUAL REPORT
2012-13 |
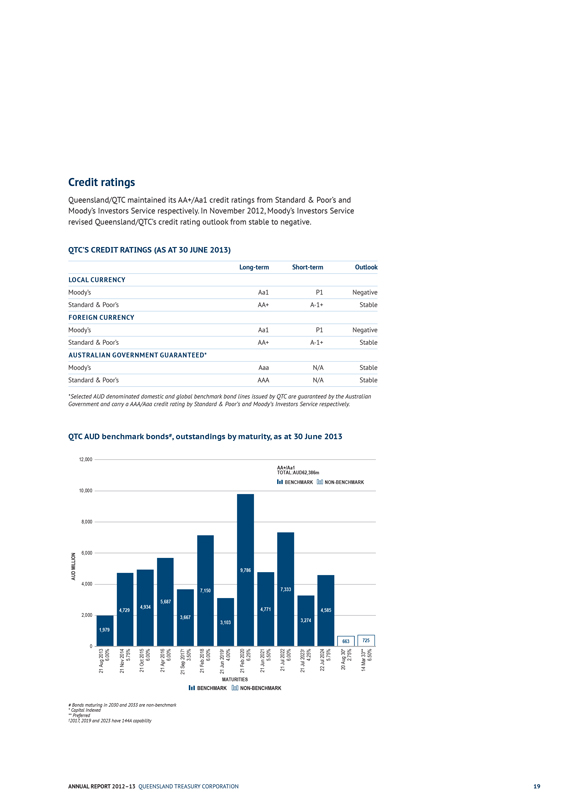
Credit ratings
Queensland/QTC maintained its AA+/Aa1 credit ratings from Standard & Poor’s and Moody’s Investors Service respectively. In November 2012, Moody’s Investors Service revised Queensland/QTC’s credit rating outlook from stable to negative.
QTC’S CREDIT RATINGS (AS AT 30 JUNE 2013)
Long-term Short-term Outlook
LOCAL CURRENCY
Moody’s Aa1 P1 Negative
Standard & Poor’s AA+ A-1+ Stable
FOREIGN CURRENCY
Moody’s Aa1 P1 Negative
Standard & Poor’s AA+ A-1+ Stable
AUSTRALIAN GOVERNMENT GUARANTEED*
Moody’s Aaa N/A Stable
Standard & Poor’s AAA N/A Stable
*Selected AUD denominated domestic and global benchmark bond lines issued by QTC are guaranteed by the Australian Government and carry a AAA/Aaa credit rating by Standard & Poor’s and Moody’s Investors Service respectively.
QTC AUD benchmark bonds#, outstandings by maturity, as at 30 June 2013
AUD MILLION
0
2,000
4,000
6,000
8,000
10,000
12,000
21 Aug 2013
6.00%
1,979
21 Nov 2014
5.75%
4,729
21 Oct 2015
6.00%
4,934
21 Apr 2016
6.00%
5,687
21 Sep 2017†
3.50%
3,667
21 Feb 2018
6.00%
7,150
BENCHMARK
21 Jun 2019†
4.00%
3,103
MATURITIES
Feb 2020
NON
21 6.25%
9,786
—
21 Jun 2021
BENCHMARK
5.50%
4,771
21 Jul 2022
6.00%
7,333
AA+/Aa1
21 Jul 2023†
4.25%
3,274
BENCHMARK TOTAL:AUD62,386m
22 Jul 2024
5.75%
4,585
NON
—
20 Aug 30*
2.75%
663
BENCHMARK
14 Mar 33**
6.50%
725
# Bonds maturing in 2030 and 2033 are non-benchmark
* Capital Indexed
** Preferred
†2017, 2019 and 2023 have 144A capability
| | |
ANNUAL REPORT 2012–13 QUEENSLAND TREASURY CORPORATION | | 19 |
| | |
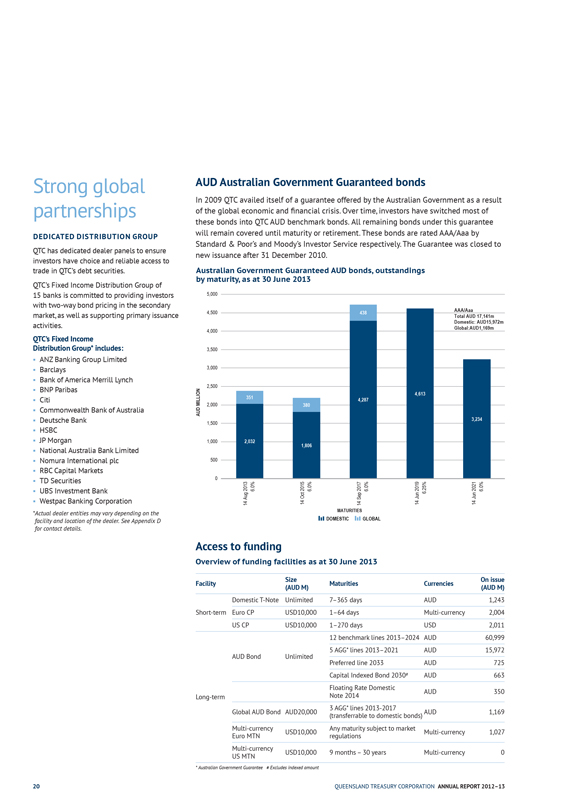
Strong global partnerships DEDICATED DISTRIBUTION GROUP QTC has dedicated dealer panels to ensure investors have choice and reliable access to trade in QTC’s debt securities. QTC’s Fixed Income Distribution Group of 15 banks is committed to providing investors with two-way bond pricing in the secondary market, as well as supporting primary issuance activities. QTC’s Fixed Income Distribution Group* includes: n ANZ Banking Group Limited n Barclays n Bank of America Merrill Lynch n BNP Paribas n Citi n Commonwealth Bank of Australia n Deutsche Bank n HSBC n JP Morgan | | n National Australia Bank Limited n Nomura International plc n RBC Capital Markets n TD Securities n UBS Investment Bank n Westpac Banking Corporation *Actual dealer entities may vary depending on the facility and location of the dealer. See Appendix D for contact details. AUD Australian Government Guaranteed bonds In 2009 QTC availed itself of a guarantee offered by the Australian Government as a result of the global economic and financial crisis. Over time, investors have switched most of these bonds into QTC AUD benchmark bonds. All remaining bonds under this guarantee will remain covered until maturity or retirement. These bonds are rated AAA/Aaa by Standard & Poor’s and Moody’s Investor Service respectively. The Guarantee was closed to new issuance after 31 December 2010. Australian Government Guaranteed AUD bonds, outstandings by maturity, as at 30 June 2013 |
| | |
Access to funding Overview of funding facilities as at 30 June 2013 Size On issue Facility Maturities Currencies (AUD M) (AUD M) Domestic T-Note Unlimited 7–365 days AUD 1,243 Short-term Euro CP USD10,000 1–64 days Multi-currency 2,004 US CP USD10,000 1–270 days USD 2,011 12 benchmark lines 2013–2024 AUD 60,999 5 AGG* lines 2013–2021 AUD 15,972 | | AUD Bond Unlimited Preferred line 2033 AUD 725 Capital Indexed Bond 2030# AUD 663 Floating Rate Domestic Long-term Note 2014 AUD 350 3 AGG* lines 2013-2017 Global AUD Bond AUD20,000 AUD 1,169 (transferrable to domestic bonds) Multi-currency Any maturity subject to market USD10,000 Multi-currency 1,027 Euro MTN regulations Multi-currency |
* Australian Government Guarantee # Excludes indexed amount
20 QUEENSLAND TREASURY CORPORATION ANNUAL REPORT 2012–13
Liquidity
n QTC’s AUD benchmark bonds are its principal source of funding.
n QTC provides investors with a choice of 12 benchmark bonds, ranging in maturity from 2013 to 2024.
n Issuance is executed on a tap, tender, reverse enquiry, and/or syndication basis, depending on market conditions.
n As the largest sub-sovereign issuer in Australia, QTC has significant depth in the Australian fixed income market.
Funding strategy
QTC has a diverse range of funding facilities in a variety of markets and currencies.
The majority of QTC’s funding is sourced through long-term debt facilities, with QTC’s
AUD benchmark bonds being the principal source of funding. QTC continues to issue into existing benchmark bond lines using a variety of methods. Funding is undertaken to meet clients’ borrowing requirements.
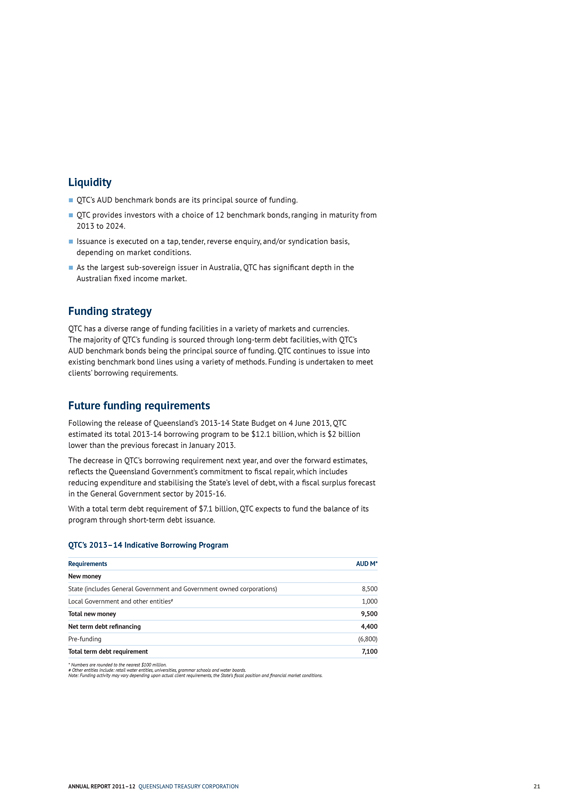
Future funding requirements
Following the release of Queensland’s 2013-14 State Budget on 4 June 2013, QTC estimated its total 2013-14 borrowing program to be $12.1 billion, which is $2 billion lower than the previous forecast in January 2013.
The decrease in QTC’s borrowing requirement next year, and over the forward estimates, reflects the Queensland Government’s commitment to fiscal repair, which includes reducing expenditure and stabilising the State’s level of debt, with a fiscal surplus forecast in the General Government sector by 2015-16.
With a total term debt requirement of $7.1 billion, QTC expects to fund the balance of its program through short-term debt issuance.
QTC’s 2013–14 Indicative Borrowing Program
| | |
Requirements | | AUD
M* |
New money | | |
State (includes General Government and Government owned corporations) | | 8,500 |
Local Government and other entities# | | 1,000 |
Total new money | | 9,500 |
Net term debt refinancing | | 4,400 |
Pre-funding | | (6,800) |
Total term debt requirement | | 7,100 |
* Numbers are rounded to the nearest $100 million.
# Other entities include: retail water entities, universities, grammar schools and water boards.
Note: Funding activity may vary depending upon actual client requirements, the State’s fiscal position and financial market conditions.
| | |
ANNUAL REPORT 2011–12 QUEENSLAND TREASURY CORPORATION | | 21 |
Funding principles
CONSERVATIVE: Balanced debt maturity profile supported by liquid reserves
PRUDENT: Disciplined approach to financial risk management
TRANSPARENT: Comprehensive, regular market updates
COMMITTED: Valued long-term investor and intermediary relationships
Australian Government fiscal support
Australia is one of only eight countries currently rated AAA with a stable outlook from all three major credit rating agencies.
The Australian Government provides explicit financial support to all Australian states and territories in the form of:
n the payment of grants under the principle of the Horizontal Fiscal Equalisation scheme, which seeks to reduce the revenue-raising and cost disparities between the Australian states and territories
n National Disaster Relief and Recovery Arrangements, which provides reimbursement for eligible costs for natural disasters, and
n the offer of a time-limited, voluntary guarantee over Australian state and territory borrowings from July 2009 to December 2010.
Information for institutional investors Core to its key funding principles, QTC is committed to being open and transparent with investors and its partners in the financial markets.
Through its website, QTC provides a range of information for investors on its various funding facilities and annual borrowing program. The website also hosts an analyst centre with information and links about Australia and Queensland to help investors gain a better understanding of:
n the different levels of government in Australia
n the forms of fiscal support the Australian Government provides to the states and territories
n relevant governance practices, legislation and polices
n financial data and budget information, and
n economic and trade data.
Understanding that many investors now use iPads as part of their daily business, a digital version of QTC’s investor booklet is available for iPad users from the iTunes store.
QTC also offers investor the ability to subscribe to quarterly funding updates in English, Japanese, as well as Modern and Traditional Chinese.
Quarterly investor updates: Email investorupdate@qtc.com.au to subscribe
Website: www.qtc.qld.gov.au/qtc/public/web/investors
Analyst centre: www.qtc.qld.gov.au/qtc/public/web/investors/analystcentre
Invest in QTC for iPad users: https://itunes.apple.com/au/app/queensland-treasury-corporation/id539372974?mt=8&uo=4
Bloomberg ticker: qtc Reuters: qtc1
Note: Investors with a US-based iTunes account do not have access to the Invest in QTC iPad application.
| | |
22 | | QUEENSLAND
TREASURY
CORPORATION
ANNUAL
REPORT 2012-
13 |
FINANCIAL
STATEMENTS
FOR THE YEAR ENDED 30 JUNE 2013
| | |
CONTENTS | | |
Statement of comprehensive income | | 24 |
Balance sheet | | 25 |
Statement of changes in equity | | 26 |
Statement of cash flows | | 27 |
Notes to and forming part of the Financial Statements | | 28 |
Certificate of the | | |
Queensland Treasury Corporation | | 58 |
Independent auditor’s report | | 59 |
Management report | | 61 |
AUDAX AT FIDELIS
QUEENSLAND
TREASURY
CORPORATION
CELEBRATING
25 YEARS EST.1988
23
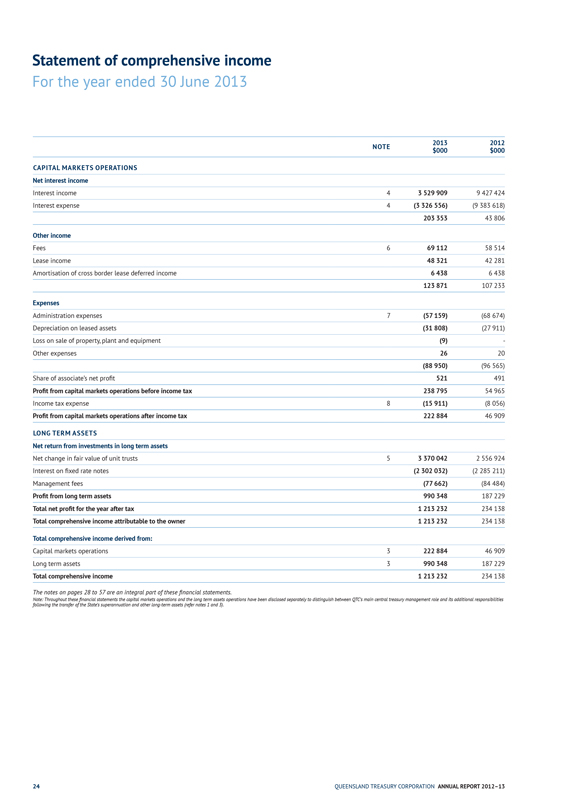
Statement of comprehensive income
For the year ended 30 June 2013
NOTE
2013
2012
$000
$000
CAPITAL MARKETS OPERATIONS
Net interest income
Interest income
4
3 529 909
9 427 424
Interest expense
4
(3 326 556)
(9 383 618)
203 353
43 806
Other income
Fees
6
69 112
58 514
Lease income
48 321
42 281
Amortisation of cross border lease deferred income
6 438
6 438
123 871
107 233
Expenses
Administration expenses
7
(57 159)
(68 674)
Depreciation on leased assets
(31 808)
(27 911)
Loss on sale of property, plant and equipment
(9)
—
Other expenses
26
20
(88 950)
(96 565)
Share of associate’s net profit
521
491
Profit from capital markets operations before income tax
238 795
54 965
Income tax expense
8
(15 911)
(8 056)
Profit from capital markets operations after income tax
222 884
46 909
LONG TERM ASSETS
Net return from investments in long term assets
Net change in fair value of unit trusts
5
3 370 042
2 556 924
Interest on fixed rate notes
(2 302 032)
(2 285 211)
Management fees
(77 662)
(84 484)
Profit from long term assets
990 348
187 229
Total net profit for the year after tax
1 213 232
234 138
Total comprehensive income attributable to the owner
1 213 232
234 138
Total comprehensive income derived from:
Capital markets operations
3
222 884
46 909
Long term assets
3
990 348
187 229
Total comprehensive income
1 213 232
234 138
The notes on pages 28 to 57 are an integral part of these financial statements.
Note: Throughout these financial statements the capital markets operations and the long term assets operations have been disclosed separately to distinguish between QTC’s main central treasury management role and its additional responsibilities following the transfer of the State’s superannuation and other long-term assets (refer notes 1 and 3).
| | |
24 | | QUEENSLAND
TREASURY
CORPORATION
ANNUAL
REPORT 2012–
13 |
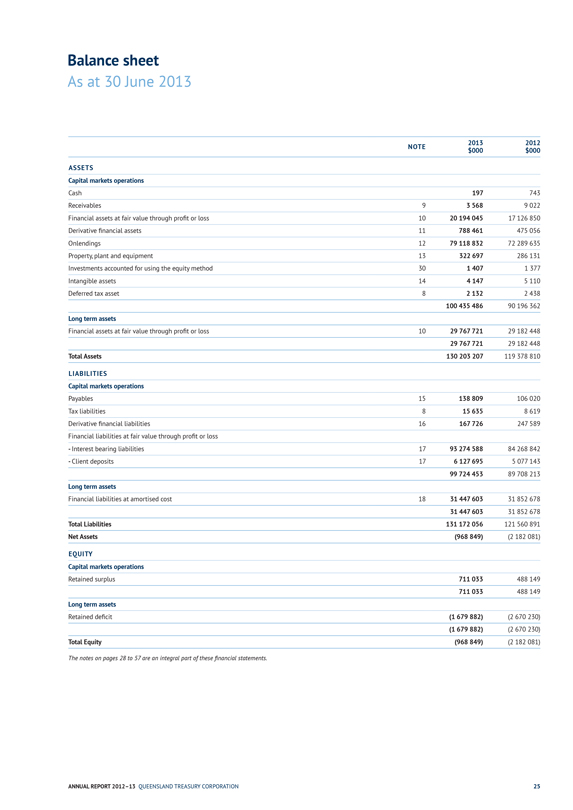
Balance sheet
As at 30 June 2013
NOTE
2013
2012
$000
$000
ASSETS
Capital markets operations
Cash
197
743
Receivables
9
3 568
9 022
Financial assets at fair value through profit or loss
10
20 194 045
17 126 850
Derivative financial assets
11
788 461
475 056
Onlendings
12
79 118 832
72 289 635
Property, plant and equipment
13
322 697
286 131
Investments accounted for using the equity method
30
1 407
1 377
Intangible assets
14
4 147
5 110
Deferred tax asset
8
2 132
2 438
100 435 486
90 196 362
Long term assets
Financial assets at fair value through profit or loss
10
29 767 721
29 182 448
29 767 721
29 182 448
Total Assets
130 203 207
119 378 810
LIABILITIES
Capital markets operations
Payables
15
138 809
106 020
Tax liabilities
8
15 635
8 619
Derivative financial liabilities
16
167 726
247 589
Financial liabilities at fair value through profit or loss
- Interest bearing liabilities
17
93 274 588
84 268 842
- Client deposits
17
6 127 695
5 077 143
99 724 453
89 708 213
Long term assets
Financial liabilities at amortised cost
18
31 447 603
31 852 678
31 447 603
31 852 678
Total Liabilities
131 172 056
121 560 891
Net Assets
(968 849)
(2 182 081)
EQUITY
Capital markets operations
Retained surplus
711 033
488 149
711 033
488 149
Long term assets
Retained deficit
(1 679 882)
(2 670 230)
(1 679 882)
(2 670 230)
Total Equity
(968 849)
(2 182 081)
The notes on pages 28 to 57 are an integral part of these financial statements.
| | |
ANNUAL REPORT 2012–13 QUEENSLAND TREASURY CORPORATION | | 25 |
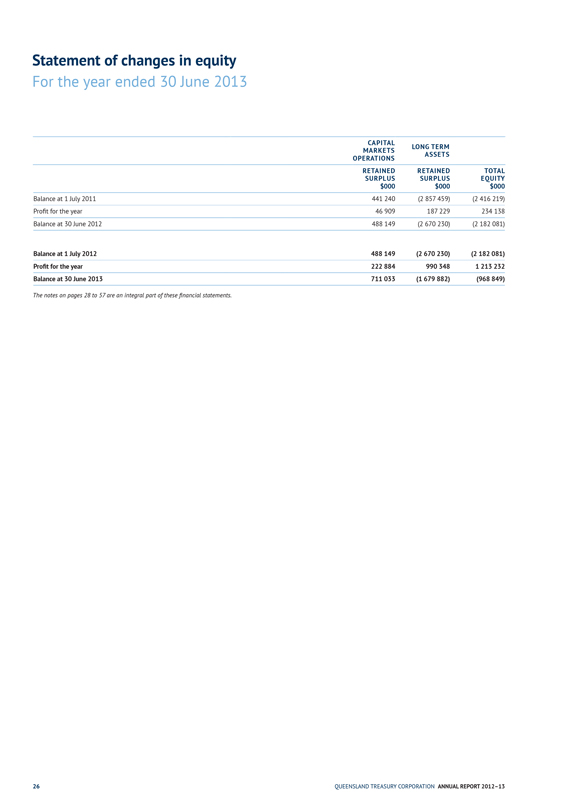
Statement of changes in equity
For the year ended 30 June 2013
CAPITAL
MARKETS
LONG TERM
OPERATIONS
ASSETS
RETAINED
RETAINED
TOTAL
SURPLUS
SURPLUS
EQUITY
$000
$000
$000
Balance at 1 July 2011
441 240
(2 857 459)
(2 416 219)
Profit for the year
46 909
187 229
234 138
Balance at 30 June 2012
488 149
(2 670 230)
(2 182 081)
Balance at 1 July 2012
488 149
(2 670 230)
(2 182 081)
Profit for the year
222 884
990 348
1 213 232
Balance at 30 June 2013
711 033
(1 679 882)
(968 849)
The notes on pages 28 to 57 are an integral part of these financial statements.
| | |
26 | | QUEENSLAND TREASURY CORPORATION ANNUAL REPORT 2012–13 |
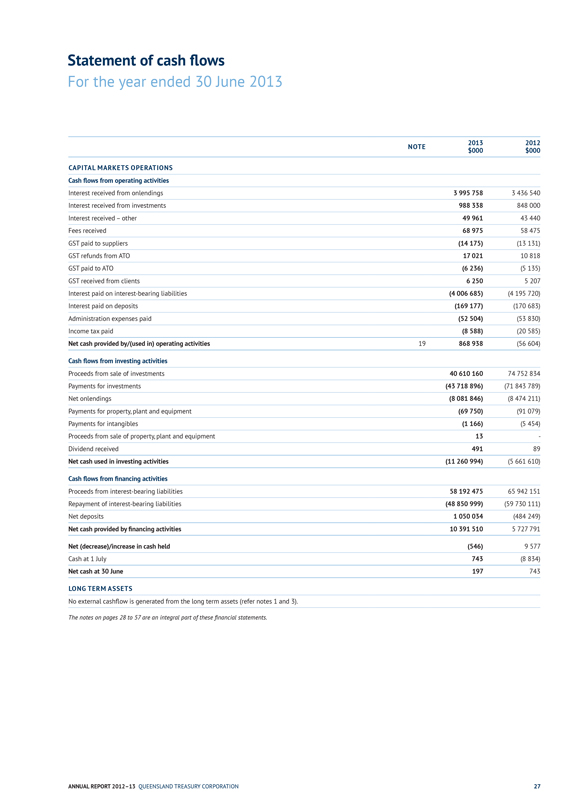
Statement of cash flows
For the year ended 30 June 2013
NOTE
2013
2012
$000
$000
CAPITAL MARKETS OPERATIONS
Cash flows from operating activities
Interest received from onlendings
3 995 758
3 436 540
Interest received from investments
988 338
848 000
Interest received – other
49 961
43 440
Fees received
68 975
58 475
GST paid to suppliers
(14 175)
(13 131)
GST refunds from ATO
17 021
10 818
GST paid to ATO
(6 236)
(5 135)
GST received from clients
6 250
5 207
Interest paid on interest-bearing liabilities
(4 006 685)
(4 195 720)
Interest paid on deposits
(169 177)
(170 683)
Administration expenses paid
(52 504)
(53 830)
Income tax paid
(8 588)
(20 585)
Net cash provided by/(used in) operating activities
19
868 938
(56 604)
Cash flows from investing activities
Proceeds from sale of investments
40 610 160
74 752 834
Payments for investments
(43 718 896)
(71 843 789)
Net onlendings
(8 081 846)
(8 474 211)
Payments for property, plant and equipment
(69 750)
(91 079)
Payments for intangibles
(1 166)
(5 454)
Proceeds from sale of property, plant and equipment
13
—
Dividend received
491
89
Net cash used in investing activities
(11 260 994)
(5 661 610)
Cash flows from financing activities
Proceeds from interest-bearing liabilities
58 192 475
65 942 151
Repayment of interest-bearing liabilities
(48 850 999)
(59 730 111)
Net deposits
1 050 034
(484 249)
Net cash provided by financing activities
10 391 510
5 727 791
Net (decrease)/increase in cash held
(546)
9 577
Cash at 1 July
743
(8 834)
Net cash at 30 June
197
743
LONG TERM ASSETS
No external cashflow is generated from the long term assets (refer notes 1 and 3).
The notes on pages 28 to 57 are an integral part of these financial statements.
| | |
ANNUAL REPORT 2012–13 QUEENSLAND TREASURY CORPORATION | | 27 |
| | |
Notes to and forming part of the Financial Statements For the year ended 30 June 2013 CONTENTS 1 General information 28 2 Summary of significant accounting policies 28 3 Segment reporting 31 4 Interest income and interest expense from capital markets operations 32 5 Net change in fair value of unit trusts 34 6 Fees 34 7 Administration expenses 35 8 Income tax expense 36 9 Receivables 36 10 Financial assets at fair value through profit or loss 37 11 Derivative financial assets 38 12 Onlendings 38 13 Property, plant and equipment 39 14 Intangible assets 39 15 Payables 40 16 Derivative financial liabilities 40 17 Financial liabilities at fair value through profit or loss 40 | | 18 Financial liabilities at amortised cost 42 19 Notes to the statement of cash flows 42 20 Financial risk management 43 21 Fair value hierarchy 49 22 Concentrations of borrowings and deposits 51 23 Contingent liabilities 51 24 Leases 51 25 Commitments 52 26 Funding facilities 52 27 Related party transactions 53 28 Key management personnel 53 29 Auditor’s remuneration 56 30 Investment in joint venture entity 56 31 Investments in companies 57 32 Dividends 57 33 Events subsequent to balance date 57 |
Queensland Treasury Corporation (QTC) is constituted under the Queensland Treasury Corporation Act 1988
(the Act), with the Under Treasurer designated as the Corporation Sole under section 5 (2) of the Act.
QTC is the State’s central financing authority and corporate treasury services provider, with responsibility for providing debt funding, liability management, cash management and financial risk management advice to public sector clients. These services, which form part of QTC’s Capital Markets Operations segment, are undertaken on a cost-recovery basis with QTC lending at an interest rate based on its cost of funds and with the benefits/costs of liability and asset management being passed on to its clients being Queensland public sector entities.
QTC’s Capital Markets Operations can generate a profit, however, largely reflecting the interest earned from the investment of its equity. In undertaking its Capital Markets activities, QTC maintains adequate capital to manage its risks.
QTC holds a portfolio of assets which were transferred to QTC by the State Government. These assets are the investments of QTC’s Long Term Assets segment and are held to fund superannuation and other long-term obligations of the State such as insurance and long service leave. In return, QTC has issued to the State fixed rate notes which has resulted in the State receiving a fixed rate of return on the notes, while QTC bears the impact of fluctuations in the value and returns on the asset portfolio (refer notes 3 & 5).
The Long Term Asset Advisory Board is responsible for the oversight of the Long Term Assets which do not form part of QTC’s day-to-day Capital Markets Operations. The Long Term Assets are held in unit trusts managed by QIC Limited (QIC).
2 Summary accounting of policies significant
(a) Basis of preparation
These general purpose financial statements for the year ended 30 June 2013 have been prepared in accordance with the requirements of the Financial Accountability Act 2009 and Australian Accounting Standards and Interpretations, adopted by the Australian Accounting Standards Board.
Compliance with International Financial Reporting Standards
QTC’s financial statements comply with International Financial Reporting Standards (IFRS) as issued by the International AccountingStandards Board.
While QTC is designated as a not-for-profit entity, the Corporation has elected to comply with the requirements of IFRS as if it is a for-profit entity.
New accounting standards
A number of new and amended accounting standards are mandatory from 1 July 2012. None of these have been deemed to have a material impact on the financial statements or the performance of the Corporation.
Standards and interpretations not yet adopted
Certain new accounting standards have been published that are not mandatory for the current reporting period. The Corporation’s assessment of the impact of these standards and interpretations are set out below.
Effective for annual periods beginning on or after 1 January 2013:
n AASB 10 Consolidated Financial Statements requires a parent to present consolidated financial statements as those of a single economic entity and introduces a single model of control. This is wider than the current definition of control and is based on an entity’s exposure to the rights and variability of returns through power to direct the activities of an investee.
n AASB 11 Joint Arrangements clarifies all joint arrangements as either joint operations or joint ventures based on the rights and obligations of the arrangement. It requires joint ventures where each party has rights to the net assets of the arrangement to be accounted for using the equity method. This is consistent with QTC’s current accounting policy for joint venture entities.
n AASB 12 Disclosure of Involvement with Other Entities requires qualitative and quantitative disclosures on an entity’s interest in, and judgements applied to subsidiaries, joint arrangements, associates and other structured entities.
n AASB 13 Fair Value Measurement replaces the guidance on fair value measurement in existing AASB accounting literature with a single standard.
For all assets and liabilities which are measured at fair value, entities are required to disclose how fair value measurement is determined based on the three level hierarchy system currently used for financial assets and financial liabilities.
Effective for annual periods beginning on or after 1 January 2015:
n AASB 9 Financial Instruments, replaces AASB 139 Financial Instruments. The new standard specifies new recognition and measurement requirements for financial assets within the scope of AASB 139. The amendments require financial assets to
be measured at fair value through profit or loss unless they meet the criteria for amortised cost measurement. For financial liabilities, AASB 9 has largely adopted the recognition and measurement criteria currently contained in AASB 139. One key difference is in relation to the recognition of “own credit” movements for liabilities measured at fair value. Under the revised standard, any change in fair value attributable to an entity’s own credit risk is to be shown in other comprehensive income, not as part of profit or loss. An exemption applies to entities which have offsetting risk profiles which allows QTC to measure both financial assets and financial liabilities at fair value through profit or loss. Therefore this is not expected to change the current practice of measuring changes in fair value movements of financial instruments through profit or loss.
Other than as noted above, the adoption of various Australian Accounting Standards and Interpretations on issue but not yet effective is not expected to have a material impact on the financial statements of the Corporation. However, the pronouncements may result in changes to how information is currently disclosed.
Basis of measurement
The financial statements are prepared on the basis of fair value measurement of assets and liabilities except where otherwise stated.
Functional and presentation currency
These financial statements are presented in Australian dollars, which is QTC’s functional currency.
Classification of assets and liabilities
The balance sheet is presented on a liquidity basis.
Assets and liabilities are presented in decreasing order of liquidity and are not distinguished between current and non-current.
(b) Change in accounting policy
On 1 July 2012, the Corporation changed its accounting policy in relation to the recognition of reserves. At 30 June 2012, QTC held $160.819 million in a reserve for credit risk and $27.0 million in a reserve for basis risk. These reserves are measured for
capital adequacy purposes but are not required to be recognised for accounting purposes under Australian
Accounting Standards. The change in accounting policy has been made voluntarily to provide greater consistency with market practice around the presentation of these reserves. There is no impact on the financial position of QTC as the change is simply a
reclassification to retained earnings within equity.
Comparative figures for 2011-12 have been restated, as required under AASB 108. However, there are no changes to the Statement of Comprehensive Income, Statement of Cash Flows or net assets in the Balance Sheet of QTC due to the reclassification of reserves to retained earnings within equity.
(c) Investment in joint venture entity
QTC’s investment in Local Government Infrastructure Services Pty Ltd is accounted for using the equity method in the financial statements. Under the equity method, the share of the profits or losses of the joint venture is recognised in the statement of
comprehensive income, and the share of movement in equity is recognised in the balance sheet. Investments in joint venture entities are carried at the equity accounted amount (refer note 30).
(d) Investments in other companies
Investments in other companies are accounted for at cost (refer note 31). The principal activity of QTC’s main investment company, Queensland Treasury Holdings Pty Ltd (QTH), is to act as a corporate vehicle through which the Queensland Government undertakes activities of strategic importance to the State.
Queensland Treasury holds a 60 per cent beneficial interest in QTH. The remaining 40 per cent is held
by QTC for and on behalf of the Under Treasurer as Corporation Sole of QTC.
| | |
28 | | QUEENSLAND TREASURY CORPORATION ANNUAL REPORT 2012–13 |
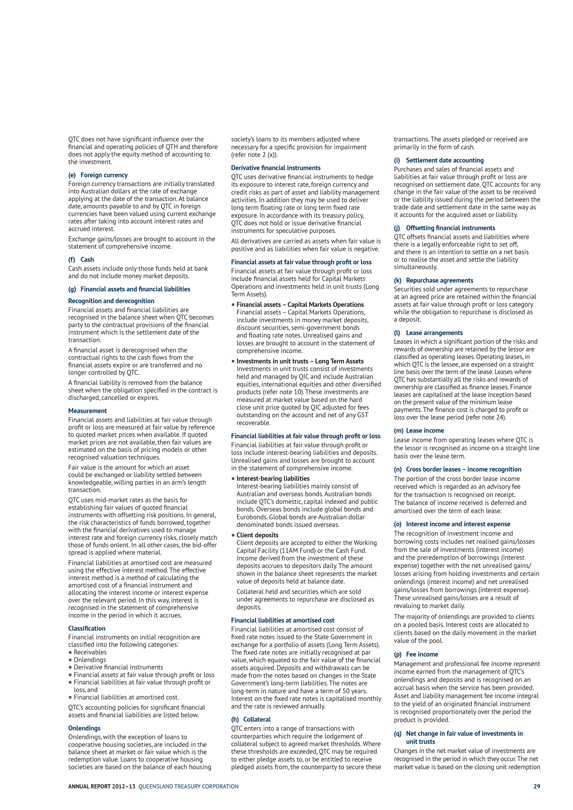
QTC does not have significant influence over the financial and operating policies of QTH and therefore does not apply the equity method of accounting to the investment.
(e) Foreign currency
Foreign currency transactions are initially translated into Australian dollars at the rate of exchange applying at the date of the transaction. At balance date, amounts payable to and by QTC in foreign currencies have been valued using current exchange rates after taking into account interest rates and accrued interest. Exchange gains/losses are brought to account in the statement of comprehensive income.
(f) Cash
Cash assets include only those funds held at bank and do not include money market deposits.
(g) Financial assets and financial liabilities
Recognition and derecognition
Financial assets and financial liabilities are recognised in the balance sheet when QTC becomes party to the contractual provisions of the financial instrument which is the settlement date of the transaction.
A financial asset is derecognised when the contractual rights to the cash flows from the financial assets expire or are transferred and no longer controlled by QTC.
A financial liability is removed from the balance sheet when the obligation specified in the contract is discharged, cancelled or expires.
Measurement
Financial assets and liabilities at fair value through profit or loss are measured at fair value by reference to quoted market prices when available. If quoted market prices are not available, then fair values are estimated on the basis of pricing models or other recognised valuation techniques.
Fair value is the amount for which an asset could be exchanged or liability settled between knowledgeable, willing parties in an arm’s length transaction.
QTC uses mid-market rates as the basis for establishing fair values of quoted financial instruments with offsetting risk positions. In general, the risk characteristics of funds borrowed, together with the financial derivatives used to manage interest rate and foreign currency risks, closely match those of funds onlent. In all other cases, the bid-offer spread is applied where material.
Financial liabilities at amortised cost are measured using the effective interest method. The effective interest method is a method of calculating the amortised cost of a financial instrument and allocating the interest income or interest expense over the relevant period. In this way, interest is recognised in the statement of comprehensive income in the period in which it accrues.
Classification
Financial instruments on initial recognition are
classified into the following categories:
Receivables
Onlendings
Derivative financial instruments
Financial assets at fair value through profit or loss
Financial liabilities at fair value through profit or
loss, and
Financial liabilities at amortised cost.
QTC’s accounting policies for significant financial assets and financial liabilities are listed below.
Onlendings
Onlendings, with the exception of loans to cooperative housing societies, are included in the balance sheet at market or fair value which is the redemption value. Loans to cooperative housing societies are based on the balance of each housing society’s loans to its members adjusted where necessary for a specific provision for impairment (refer note 2 (x)).
Derivative financial instruments
QTC uses derivative financial instruments to hedge its exposure to interest rate, foreign currency and credit risks as part of asset and liability management activities. In addition they may be used to deliver long term floating rate or long term fixed rate exposure. In accordance with its treasury policy, QTC does not hold or issue derivative financial instruments for speculative purposes.
All derivatives are carried as assets when fair value is positive and as liabilities when fair value is negative.
Financial assets at fair value through profit or loss
Financial assets at fair value through profit or loss include financial assets held for Capital Markets Operations and investments held in unit trusts (Long Term Assets).
Financial assets – Capital Markets Operations
Financial assets – Capital Markets Operations, include investments in money market deposits, discount securities, semi-government bonds and floating rate notes. Unrealised gains and losses are brought to account in the statement of
comprehensive income.
Investments in unit trusts – Long Term Assets
Investments in unit trusts consist of investments held and managed by QIC and include Australian equities, international equities and other diversified products (refer note 10). These investments are measured at market value based on the hard close unit price quoted by QIC adjusted for fees outstanding on the account and net of any GST
recoverable.
Financial liabilities at fair value through profit or loss
Financial liabilities at fair value through profit or loss include interest-bearing liabilities and deposits. Unrealised gains and losses are brought to account in the statement of comprehensive income.
Interest-bearing liabilities
Interest-bearing liabilities mainly consist of Australian and overseas bonds. Australian bonds include QTC’s domestic, capital indexed and public bonds. Overseas bonds include global bonds and Eurobonds. Global bonds are Australian dollar denominated bonds issued overseas.
Client deposits
Client deposits are accepted to either the Working Capital Facility (11AM Fund) or the Cash Fund.
Income derived from the investment of these deposits accrues to depositors daily. The amount shown in the balance sheet represents the market value of deposits held at balance date.
Collateral held and securities which are sold under agreements to repurchase are disclosed as
deposits.
Financial liabilities at amortised cost
Financial liabilities at amortised cost consist of fixed rate notes issued to the State Government in exchange for a portfolio of assets (Long Term Assets). The fixed rate notes are initially recognised at par value, which equated to the fair value of the financial assets acquired. Deposits and withdrawals can be made from the notes based on changes in the State Government’s long-term liabilities. The notes are long-term in nature and have a term of 50 years. Interest on the fixed rate notes is capitalised monthly and the rate is reviewed annually.
(h) Collateral
QTC enters into a range of transactions with counterparties which require the lodgement of collateral subject to agreed market thresholds. Where these thresholds are exceeded, QTC may be required to either pledge assets to, or be entitled to receive pledged assets from, the counterparty to secure these transactions. The assets pledged or received are primarily in the form of cash.
(i) Settlement date accounting
Purchases and sales of financial assets and liabilities at fair value through profit or loss are recognised on settlement date. QTC accounts for any change in the fair value of the asset to be received or the liability issued during the period between the trade date and settlement date in the same way as it accounts for the acquired asset or liability.
(j) Offsetting financial instruments
QTC offsets financial assets and liabilities where there is a legally enforceable right to set off, and there is an intention to settle on a net basis or to realise the asset and settle the liability simultaneously.
(k) Repurchase agreements
Securities sold under agreements to repurchase at an agreed price are retained within the financial assets at fair value through profit or loss category while the obligation to repurchase is disclosed as a deposit.
(l) Lease arrangements
Leases in which a significant portion of the risks and rewards of ownership are retained by the lessor are classified as operating leases. Operating leases, in which QTC is the lessee, are expensed on a straight line basis over the term of the lease. Leases where QTC has substantially all the risks and rewards of ownership are classified as finance leases. Finance leases are capitalised at the lease inception based on the present value of the minimum lease payments. The finance cost is charged to profit or loss over the lease period (refer note 24).
(m) Lease income
Lease income from operating leases where QTC is the lessor is recognised as income on a straight line basis over the lease term.
(n) Cross border leases – income recognition
The portion of the cross border lease income received which is regarded as an advisory fee for the transaction is recognised on receipt.
The balance of income received is deferred and amortised over the term of each lease.
(o) Interest income and interest expense
The recognition of investment income and borrowing costs includes net realised gains/losses from the sale of investments (interest income) and the preredemption of borrowings (interest expense) together with the net unrealised gains/ losses arising from holding investments and certain onlendings (interest income) and net unrealised gains/losses from borrowings (interest expense). These unrealised gains/losses are a result of revaluing to market daily.
The majority of onlendings are provided to clients on a pooled basis. Interest costs are allocated to clients based on the daily movement in the market value of the pool.
(p) Fee income
Management and professional fee income represent income earned from the management of QTC’s onlendings and deposits and is recognised on an accrual basis when the service has been provided. Asset and liability management fee income integral to the yield of an originated financial instrument is recognised proportionately over the period the product is provided.
(q) Net change in fair value of investments in unit trusts
Changes in the net market value of investments are recognised in the period in which they occur. The net market value is based on the closing unit redemption
ANNUAL REPORT 2012–13 QUEENSLAND TREASURY CORPORATION
29
Notes to and forming part of the Financial Statements
For the year ended 30 June 2013 price and includes both realised and unrealised movements, net of allowances for costs expected to be incurred in realising these investments. Distributions are reinvested into the trusts.
(r) Profits/losses
Unless otherwise determined by the Governor in Council, the Queensland Treasury Corporation Act 1988 requires that all profits shall accrue to the benefit of the State Consolidated Fund and all losses shall be the responsibility of the State Consolidated Fund.
(s) Property, plant and equipment
Property, plant and equipment are measured at cost less accumulated depreciation and accumulated impairment losses. Costs are recognised where asset values exceed $5,000 and includes expenditure that is directly attributable to the acquisition of the asset. Depreciation is calculated on a straight line basis over the estimated useful life of the assets. Where depreciation relates to plant and equipment held to generate lease revenue, depreciation expenditure has been classified separately in the statement of comprehensive income as depreciation on leased assets. Land is held at fair value and is not depreciated as it has an indefinite useful life.
Revaluations are undertaken with sufficient regularity to ensure the carrying value does not differ materially from that which would be determined using fair value at reporting date. A comprehensive revaluation is conducted at least once every three to five years.
Assets under construction are held at cost. Costs include expenditure that is directly attributable to the acquisition of the asset.
Depreciation rates for each class of asset are as follows:
ASSET CLASS DEPRECIATION
RATE
Land 0%
Information technology & office equipment 6 – 40%
Plant and machinery 10 – 30%
The assets’ residual values, useful lives and depreciation methods are reviewed and adjusted, if appropriate, at each financial year end.
Derecognition
An item of property, plant and equipment is derecognised upon disposal or when no further future economic benefits are expected from its use. Any gain or loss arising on derecognition of the asset (calculated as the difference between the net disposal proceeds and the carrying amount of the asset) is included in the statement of comprehensive income in the year the asset is derecognised.
(t) Intangible assets
Software
Acquired computer software licences are capitalised on the basis of the costs incurred to acquire and bring to use the specific software. These costs are amortised over their estimated useful lives which are between two and five years.
Costs associated with the development of internally generated software are capitalised only when the designated project is technically and commercially feasible and is expected to generate future economic benefits to QTC. The expenditure capitalised comprises all directly attributable costs including some labour costs. All other costs associated with the development of software are expensed as incurred. Following initial recognition of the development expenditure as an asset, the asset is carried at cost less accumulated amortisation and impairment losses. Amortisation of the asset begins when the development is complete and the asset is available for use.
Computer software development costs recognised as assets are amortised on a straight-line basis over the period of expected benefit, which is usually between three and five years.
(u) Impairment
The carrying values of non-financial assets are reviewed at each reporting date or where there is an indication of impairment. Where an asset is no longer expected to provide substantial service
potential or there are significant reductions in the capabilities, functions or intended use, the asset is written down to its recoverable amount. For the purpose of impairment testing, assets are grouped by the lowest level of cash-generating unit applicable with impairment losses recorded in the statement of comprehensive income.
(v) Income tax
QTC is exempt from the payment of income tax under section 50-25 of the Income Tax Assessment Act 1997 (as amended). QTC makes a payment in lieu of income tax to the Queensland Government’s Consolidated Fund. The calculation of the income tax liability is based on the income of certain activities controlled by QTC’s Capital Markets Operations. No income tax is payable on the Long Term Assets. In calculating the payment in lieu of income tax expense, tax effect accounting principles are adopted for income received and expenses paid in relation to the management and administration of clients’ borrowings and deposits as well as for advisory services and structured finance transactions. For all other QTC operations on which a payment in lieu of income tax is made, tax effect accounting principles are not applied.
Deferred income tax is provided in full, using the liability method, on all temporary differences arising between the tax bases of assets and liabilities and their carrying amounts in the financial statements. Deferred income tax liabilities are recognised for all taxable temporary differences arising from prepayments of expenditure of QTC. Deferred
income tax assets are recognised for deductible temporary differences arising from accruals of expenditure, employee benefits and depreciation charged on property, plant and equipment.
Deferred tax assets are recognised where it is probable that future taxable income will be available against which the temporary differences can be utilised. QTC’s controlled and jointly controlled entities are defined as State and Territory bodies under section 24AO of the Income Tax Assessment Act 1936 and as a consequence, are exempt from Commonwealth tax under section 24AM of this Act.
(w) Employee benefits
Employee benefit obligations such as annual leave and long service leave entitlements are measured on an undiscounted basis where the amounts are due to be settled at balance date.
A liability is recognised for short-term bonuses based on the amount expected to be paid where there is a present or constructive obligation to pay this amount as a result of past services provided by the employee and the obligation can be estimated reliably.
Wages, salaries, annual and long service leave due but unpaid at reporting date are recognised in other creditors and include related on-costs such as payroll tax, worker’s compensation premiums and employer superannuation contributions. As sick leave is non-vesting, this is recognised as and when this leave is taken. Contributions made by QTC to employee contributory superannuation funds (to provide benefits for employees and their dependants on retirement, disability or death) are charged to the statement of comprehensive income. QTC is not responsible for any shortfalls. Key executive management personnel and remuneration disclosures are made in accordance with the Financial Reporting Requirements for Queensland Government Agencies issued by Queensland Treasury (refer note 28) and in accordance with AASB 124 Related Party Disclosures.
(x) Provisions
Impaired loans
Over the period 1996 to 2000, QTC, at the direction of the Queensland Government, acquired loans provided by financial institutions to a number of cooperative housing societies at a cost equivalent to book value. At the time of acquisition, there were a number of non-performing loans. Specific provisions have been made where full recovery of principal and interest is considered doubtful based on the net realisable value of the underlying security.
(y) Rounding
Amounts have been rounded to the nearest thousand dollars except for note 26, which is rounded to the nearest million dollars, and notes 28 and 29, which are in whole dollars.
(z) Comparative figures
Where necessary, comparative figures have been adjusted to conform with changes in presentation in the current year.
(aa) Judgements and assumptions
The preparation of the financial statements requires the use of accounting estimates. The areas involving a higher degree of judgement or complexity, or areas where assumptions or estimates may be significant to the financial statements are shown below:
Fair value of financial assets and financial liabilities
Financial assets and financial liabilities at fair value through profit or loss are measured at fair value by reference to quoted market prices where available. The fair value of financial instruments that are not traded in an active market is determined by reference to market quotes for similar instruments or by use of valuation techniques. Judgement may be needed in selecting valuation methods or assumptions where an active market quote is not available.
Estimates and underlying assumptions are reviewed on an ongoing basis. Revisions to accounting estimates are recognised in the period in which the estimate is revised and in any future period affected.
(ab) Operating result
The operating profit after tax for the year ended 30 June 2013 for the Capital Markets Operations segment was $222.9 million. QTC recorded an operating profit of $990.3 million for the Long Term Assets segment. The accumulated net losses of $968.8 million (2012 $2.2 billion) have no impact on QTC’s capacity to meet its obligations as there is no cash flow effect for QTC (refer note 19). In addition, under the Queensland Treasury Corporation Act 1988, any losses of the Corporation shall be the responsibility of the
Consolidated Fund of the Queensland Government.
30
QUEENSLAND TREASURY CORPORATION ANNUAL REPORT 2012–13
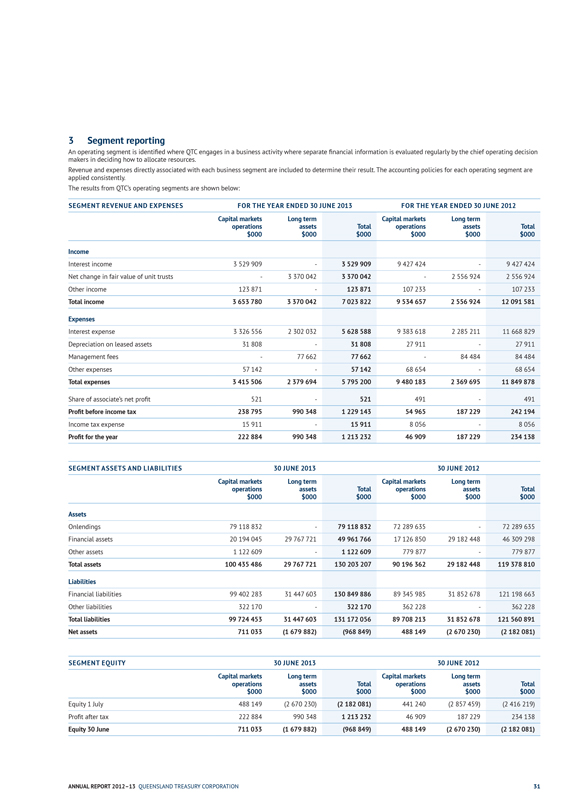
3 Segment reporting
An operating segment is identified where QTC engages in a business activity where separate financial information is evaluated regularly by the chief operating decision makers in deciding how to allocate resources.
Revenue and expenses directly associated with each business segment are included to determine their result. The accounting policies for each operating segment are applied consistently.
The results from QTC’s operating segments are shown below:
SEGMENT REVENUE AND EXPENSES FOR THE YEAR ENDED 30 JUNE 2013 FOR THE YEAR ENDED 30 JUNE 2012
Capital markets Long term Capital markets Long term
operations assets Total operations assets Total
$000 $000 $000 $000 $000 $000
Income
Interest income 3 529 909 - 3 529 909 9 427 424 - 9 427 424
Net change in fair value of unit trusts - 3 370 042 3 370 042 - 2 556 924 2 556 924
Other income 123 871 - 123 871 107 233 - 107 233
Total income 3 653 780 3 370 042 7 023 822 9 534 657 2 556 924 12 091 581
Expenses
Interest expense 3 326 556 2 302 032 5 628 588 9 383 618 2 285 211 11 668 829
Depreciation on leased assets 31 808 - 31 808 27 911 - 27 911
Management fees - 77 662 77 662 - 84 484 84 484
Other expenses 57 142 - 57 142 68 654 - 68 654
Total expenses 3 415 506 2 379 694 5 795 200 9 480 183 2 369 695 11 849 878
Share of associate’s net profit 521 - 521 491 - 491
Profit before income tax 238 795 990 348 1 229 143 54 965 187 229 242 194
Income tax expense 15 911 - 15 911 8 056 - 8 056
Profit for the year 222 884 990 348 1 213 232 46 909 187 229 234 138
SEGMENT ASSETS AND LIABILITIES 30 JUNE 2013 30 JUNE 2012
Capital markets Long term Capital markets Long term
operations assets Total operations assets Total
$000 $000 $000 $000 $000 $000
Assets
Onlendings 79 118 832 - 79 118 832 72 289 635 - 72 289 635
Financial assets 20 194 045 29 767 721 49 961 766 17 126 850 29 182 448 46 309 298
Other assets 1 122 609 - 1 122 609 779 877 - 779 877
Total assets 100 435 486 29 767 721 130 203 207 90 196 362 29 182 448 119 378 810
Liabilities
Financial liabilities 99 402 283 31 447 603 130 849 886 89 345 985 31 852 678 121 198 663
Other liabilities 322 170 - 322 170 362 228 - 362 228
Total liabilities 99 724 453 31 447 603 131 172 056 89 708 213 31 852 678 121 560 891
Net assets 711 033 (1 679 882) (968 849) 488 149 (2 670 230) (2 182 081)
SEGMENT EQUITY 30 JUNE 2013 30 JUNE 2012
Capital markets Long term Capital markets Long term
operations assets Total operations assets Total
$000 $000 $000 $000 $000 $000
Equity 1 July 488 149 (2 670 230) (2 182 081) 441 240 (2 857 459) (2 416 219)
Profit after tax 222 884 990 348 1 213 232 46 909 187 229 234 138
Equity 30 June 711 033 (1 679 882) (968 849) 488 149 (2 670 230) (2 182 081)
ANNUAL REPORT 2012–13 QUEENSLAND TREASURY CORPORATION
31
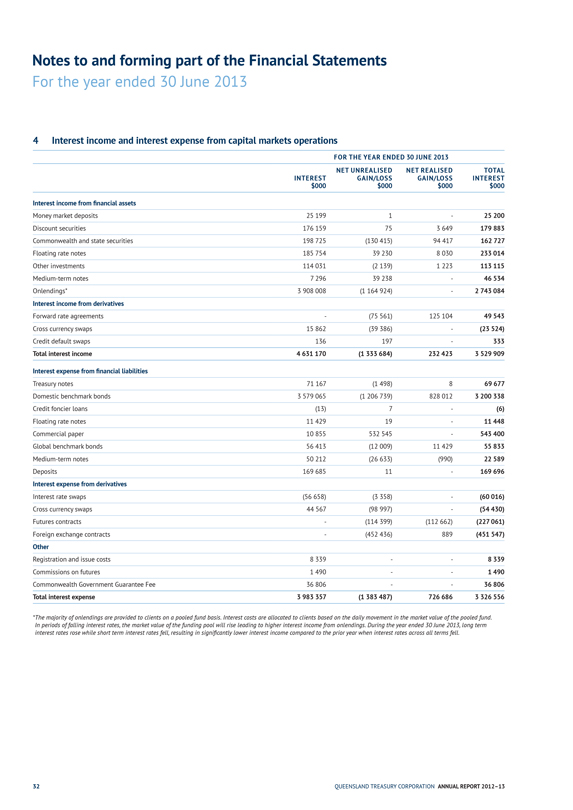
Notes to and forming part of the Financial Statements
For the year ended 30 June 2013
4 Interest income and interest expense from capital markets operations
FOR THE YEAR ENDED 30 JUNE 2013
NET UNREALISED NET REALISED TOTAL
INTEREST GAIN/LOSS GAIN/LOSS INTEREST
$000 $000 $000 $000
Interest income from financial assets
Money market deposits 25 199 1 - 25 200
Discount securities 176 159 75 3 649 179 883
Commonwealth and state securities 198 725 (130 415) 94 417 162 727
Floating rate notes 185 754 39 230 8 030 233 014
Other investments 114 031 (2 139) 1 223 113 115
Medium-term notes 7 296 39 238 - 46 534
Onlendings* 3 908 008 (1 164 924) - 2 743 084
Interest income from derivatives
Forward rate agreements - (75 561) 125 104 49 543
Cross currency swaps 15 862 (39 386) - (23 524)
Credit default swaps 136 197 - 333
Total interest income 4 631 170 (1 333 684) 232 423 3 529 909
Interest expense from financial liabilities
Treasury notes 71 167 (1 498) 8 69 677
Domestic benchmark bonds 3 579 065 (1 206 739) 828 012 3 200 338
Credit foncier loans (13) 7 - (6)
Floating rate notes 11 429 19 - 11 448
Commercial paper 10 855 532 545 - 543 400
Global benchmark bonds 56 413 (12 009) 11 429 55 833
Medium-term notes 50 212 (26 633) (990) 22 589
Deposits 169 685 11 - 169 696
Interest expense from derivatives
Interest rate swaps (56 658) (3 358) - (60 016)
Cross currency swaps 44 567 (98 997) - (54 430)
Futures contracts - (114 399) (112 662) (227 061)
Foreign exchange contracts - (452 436) 889 (451 547)
Other
Registration and issue costs 8 339 - - 8 339
Commissions on futures 1 490 - - 1 490
Commonwealth Government Guarantee Fee 36 806 - - 36 806
Total interest expense 3 983 357 (1 383 487) 726 686 3 326 556
*The majority of onlendings are provided to clients on a pooled fund basis. Interest costs are allocated to clients based on the daily movement in the market value of the pooled fund. In periods of falling interest rates, the market value of the funding pool will rise leading to higher interest income from onlendings. During the year ended 30 June 2013, long term interest rates rose while short term interest rates fell, resulting in significantly lower interest income compared to the prior year when interest rates across all terms fell.
32
QUEENSLAND TREASURY CORPORATION ANNUAL REPORT 2012–13
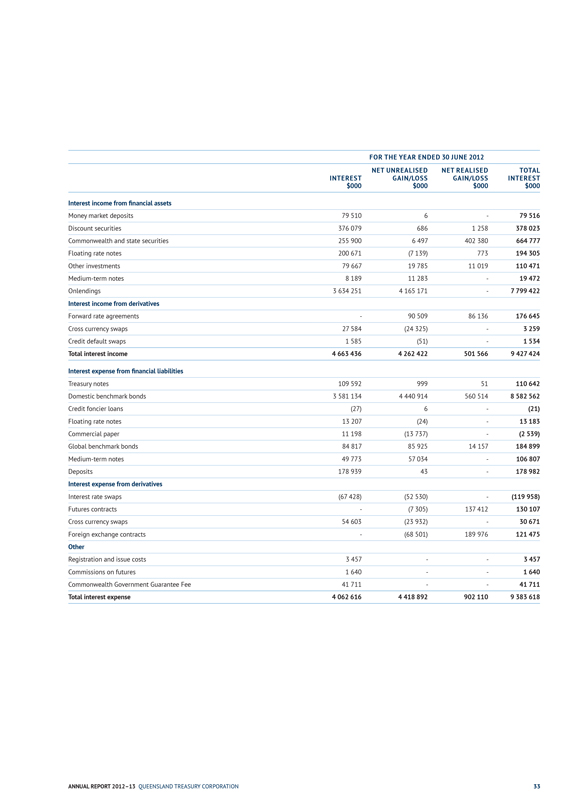
FOR THE YEAR ENDED 30 JUNE 2012
NET UNREALISED NET REALISED TOTAL
INTEREST GAIN/LOSS GAIN/LOSS INTEREST
$000 $000 $000 $000
Interest income from financial assets
Money market deposits 79 510 6 - 79 516
Discount securities 376 079 686 1 258 378 023
Commonwealth and state securities 255 900 6 497 402 380 664 777
Floating rate notes 200 671 (7 139) 773 194 305
Other investments 79 667 19 785 11 019 110 471
Medium-term notes 8 189 11 283 - 19 472
Onlendings 3 634 251 4 165 171 - 7 799 422
Interest income from derivatives
Forward rate agreements - 90 509 86 136 176 645
Cross currency swaps 27 584 (24 325) - 3 259
Credit default swaps 1 585 (51) - 1 534
Total interest income 4 663 436 4 262 422 501 566 9 427 424
Interest expense from financial liabilities
Treasury notes 109 592 999 51 110 642
Domestic benchmark bonds 3 581 134 4 440 914 560 514 8 582 562
Credit foncier loans (27) 6 - (21)
Floating rate notes 13 207 (24) - 13 183
Commercial paper 11 198 (13 737) - (2 539)
Global benchmark bonds 84 817 85 925 14 157 184 899
Medium-term notes 49 773 57 034 - 106 807
Deposits 178 939 43 - 178 982
Interest expense from derivatives
Interest rate swaps (67 428) (52 530) - (119 958)
Futures contracts - (7 305) 137 412 130 107
Cross currency swaps 54 603 (23 932) - 30 671
Foreign exchange contracts - (68 501) 189 976 121 475
Other
Registration and issue costs 3 457 - - 3 457
Commissions on futures 1 640 - - 1 640
Commonwealth Government Guarantee Fee 41 711 - - 41 711
Total interest expense 4 062 616 4 418 892 902 110 9 383 618
ANNUAL REPORT 2012–13 QUEENSLAND TREASURY CORPORATION
33
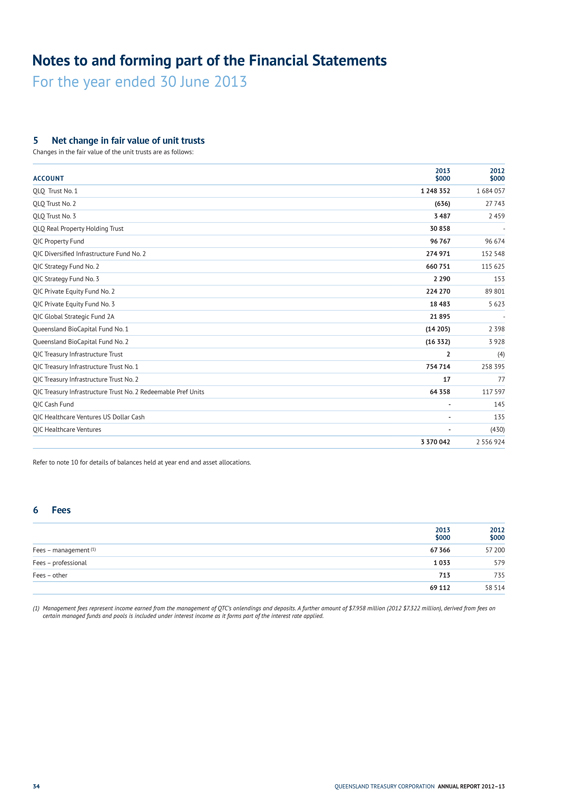
Notes to and forming part of the Financial Statements
For the year ended 30 June 2013
5 Net change in fair value of unit trusts
Changes in the fair value of the unit trusts are as follows:
2013 2012
ACCOUNT $000 $000
QLQ Trust No. 1 1 248 352 1 684 057
QLQ Trust No. 2 (636) 27 743
QLQ Trust No. 3 3 487 2 459
QLQ Real Property Holding Trust 30 858 -
QIC Property Fund 96 767 96 674
QIC Diversified Infrastructure Fund No. 2 274 971 152 548
QIC Strategy Fund No. 2 660 751 115 625
QIC Strategy Fund No. 3 2 290 153
QIC Private Equity Fund No. 2 224 270 89 801
QIC Private Equity Fund No. 3 18 483 5 623
QIC Global Strategic Fund 2A 21 895 -
Queensland BioCapital Fund No. 1 (14 205) 2 398
Queensland BioCapital Fund No. 2 (16 332) 3 928
QIC Treasury Infrastructure Trust 2 (4)
QIC Treasury Infrastructure Trust No. 1 754 714 258 395
QIC Treasury Infrastructure Trust No. 2 17 77
QIC Treasury Infrastructure Trust No. 2 Redeemable Pref Units 64 358 117 597
QIC Cash Fund - 145
QIC Healthcare Ventures US Dollar Cash - 135
QIC Healthcare Ventures - (430)
3 370 042 2 556 924
Refer to note 10 for details of balances held at year end and asset allocations.
6 Fees
2013 2012
$000 $000
Fees – management (1) 67 366 57 200
Fees – professional 1 033 579
Fees – other 713 735
69 112 58 514
(1) Management fees represent income earned from the management of QTC’s onlendings and deposits. A further amount of $7.958 million (2012 $7.322 million), derived from fees on certain managed funds and pools is included under interest income as it forms part of the interest rate applied.
34 QUEENSLAND TREASURY CORPORATION ANNUAL REPORT 2012–13
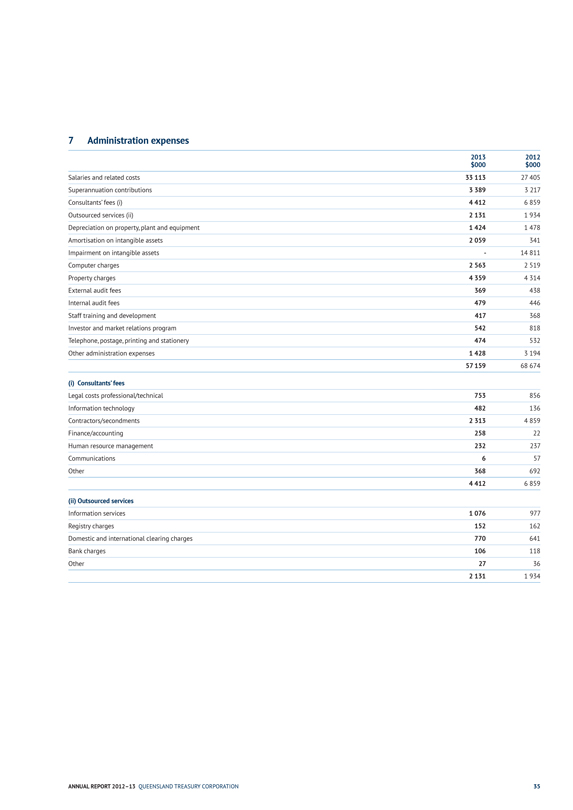
7 Administration expenses
2013 2012
$000 $000
Salaries and related costs 33 113 27 405
Superannuation contributions 3 389 3 217
Consultants’ fees (i) 4 412 6 859
Outsourced services (ii) 2 131 1 934
Depreciation on property, plant and equipment 1 424 1 478
Amortisation on intangible assets 2 059 341
Impairment on intangible assets - 14 811
Computer charges 2 563 2 519
Property charges 4 359 4 314
External audit fees 369 438
Internal audit fees 479 446
Staff training and development 417 368
Investor and market relations program 542 818
Telephone, postage, printing and stationery 474 532
Other administration expenses 1 428 3 194
57 159 68 674
(i) Consultants’ fees
Legal costs professional/technical 753 856
Information technology 482 136
Contractors/secondments 2 313 4 859
Finance/accounting 258 22
Human resource management 232 237
Communications 6 57
Other 368 692
4 412 6 859
(ii) Outsourced services
Information services 1 076 977
Registry charges 152 162
Domestic and international clearing charges 770 641
Bank charges 106 118
Other 27 36
2 131 1 934
ANNUAL REPORT 2012–13 QUEENSLAND TREASURY CORPORATION
35
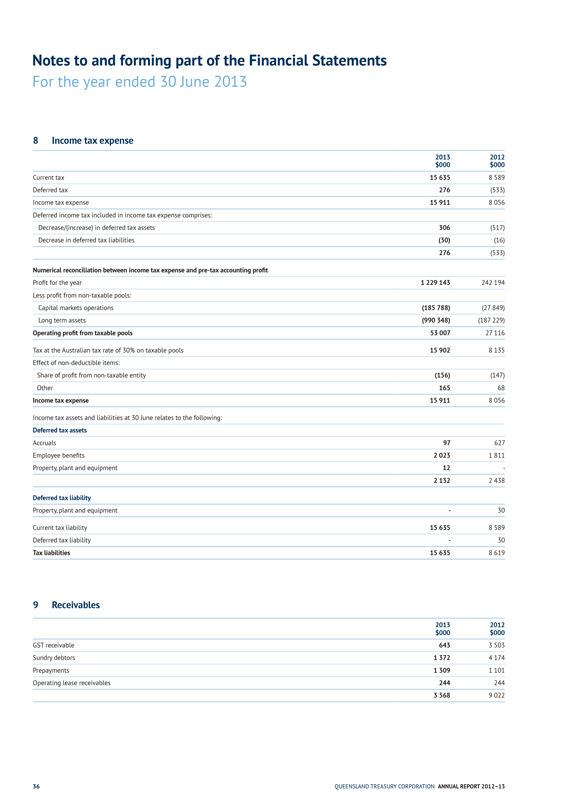
Notes to and forming part of the Financial Statements
For the year ended 30 June 2013
8 Income tax expense
2013 2012
$000 $000
Current tax 15 635 8 589
Deferred tax 276 (533)
Income tax expense 15 911 8 056
Deferred income tax included in income tax expense comprises:
Decrease/(increase) in deferred tax assets 306 (517)
Decrease in deferred tax liabilities (30) (16)
276 (533)
Numerical reconciliation between income tax expense and pre-tax accounting profit
Profit for the year 1 229 143 242 194
Less profit from non-taxable pools:
Capital markets operations (185 788) (27 849)
Long term assets (990 348) (187 229)
Operating profit from taxable pools 53 007 27 116
Tax at the Australian tax rate of 30% on taxable pools 15 902 8 135
Effect of non-deductible items:
Share of profit from non-taxable entity (156) (147)
Other 165 68
Income tax expense 15 911 8 056
Income tax assets and liabilities at 30 June relates to the following:
Deferred tax assets
Accruals 97 627
Employee benefits 2 023 1 811
Property, plant and equipment 12 -
2 132 2 438
Deferred tax liability
Property, plant and equipment - 30
Current tax liability 15 635 8 589
Deferred tax liability - 30
Tax liabilities 15 635 8 619
9 Receivables
2013 2012
$000 $000
GST receivable 643 3 503
Sundry debtors 1 372 4 174
Prepayments 1 309 1 101
Operating lease receivables 244 244
3 568 9 022
36
QUEENSLAND TREASURY CORPORATION ANNUAL REPORT 2012–13
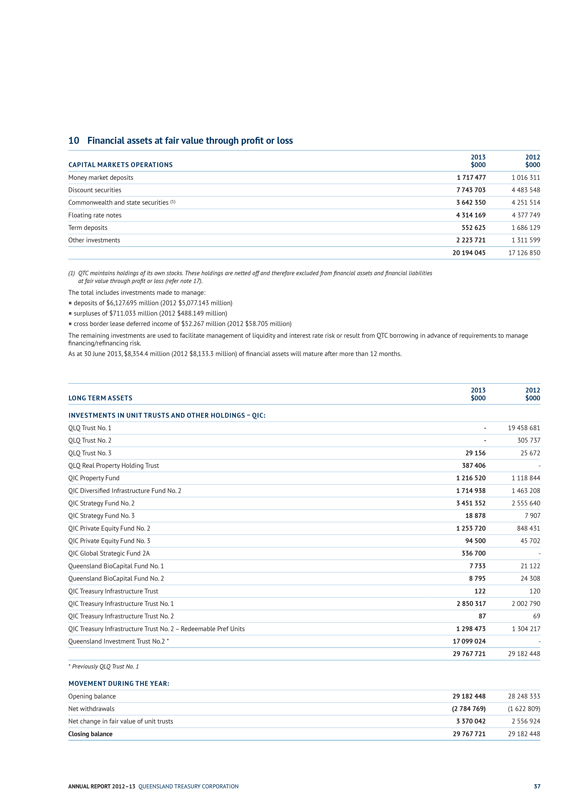
10 Financial assets at fair value through profit or loss
2013 2012
CAPITAL MARKETS OPERATIONS $000 $000
Money market deposits 1 717 477 1 016 311
Discount securities 7 743 703 4 483 548
Commonwealth and state securities (1) 3 642 350 4 251 514
Floating rate notes 4 314 169 4 377 749
Term deposits 552 625 1 686 129
Other investments 2 223 721 1 311 599
20 194 045 17 126 850
(1) QTC maintains holdings of its own stocks. These holdings are netted off and therefore excluded from financial assets and financial liabilities at fair value through profit or loss (refer note 17).
The total includes investments made to manage:
deposits of $6,127.695 million (2012 $5,077.143 million)
surpluses of $711.033 million (2012 $488.149 million)
cross border lease deferred income of $52.267 million (2012 $58.705 million)
The remaining investments are used to facilitate management of liquidity and interest rate risk or result from QTC borrowing in advance of requirements to manage financing/refinancing risk.
As at 30 June 2013, $8,354.4 million (2012 $8,133.3 million) of financial assets will mature after more than 12 months.
2013 2012
LONG TERM ASSETS $000 $000
INVESTMENTS IN UNIT TRUSTS AND OTHER HOLDINGS – QIC:
QLQ Trust No. 1 - 19 458 681
QLQ Trust No. 2 - 305 737
QLQ Trust No. 3 29 156 25 672
QLQ Real Property Holding Trust 387 406 -
QIC Property Fund 1 216 520 1 118 844
QIC Diversified Infrastructure Fund No. 2 1 714 938 1 463 208
QIC Strategy Fund No. 2 3 451 352 2 555 640
QIC Strategy Fund No. 3 18 878 7 907
QIC Private Equity Fund No. 2 1 253 720 848 431
QIC Private Equity Fund No. 3 94 500 45 702
QIC Global Strategic Fund 2A 336 700 -
Queensland BioCapital Fund No. 1 7 733 21 122
Queensland BioCapital Fund No. 2 8 795 24 308
QIC Treasury Infrastructure Trust 122 120
QIC Treasury Infrastructure Trust No. 1 2 850 317 2 002 790
QIC Treasury Infrastructure Trust No. 2 87 69
QIC Treasury Infrastructure Trust No. 2 – Redeemable Pref Units 1 298 473 1 304 217
Queensland Investment Trust No.2 * 17 099 024 -
29 767 721 29 182 448
* Previously QLQ Trust No. 1
MOVEMENT DURING THE YEAR:
Opening balance 29 182 448 28 248 333
Net withdrawals (2 784 769) (1 622 809)
Net change in fair value of unit trusts 3 370 042 2 556 924
Closing balance 29 767 721 29 182 448
ANNUAL REPORT 2012–13 QUEENSLAND TREASURY CORPORATION
37
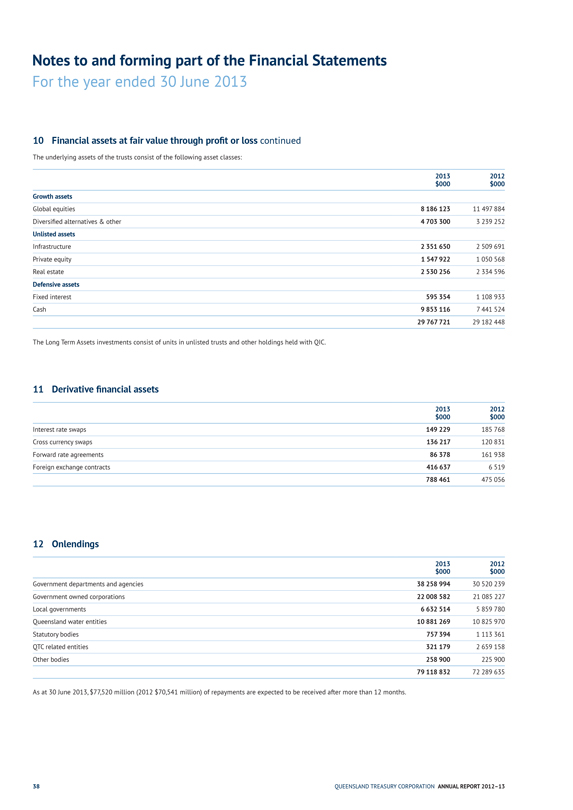
Notes to and forming part of the Financial Statements
For the year ended 30 June 2013
10 Financial assets at fair value through profit or loss continued
The underlying assets of the trusts consist of the following asset classes:
2013 2012
$000 $000
Growth assets
Global equities 8 186 123 11 497 884
Diversified alternatives & other 4 703 300 3 239 252
Unlisted assets
Infrastructure 2 351 650 2 509 691
Private equity 1 547 922 1 050 568
Real estate 2 530 256 2 334 596
Defensive assets
Fixed interest 595 354 1 108 933
Cash 9 853 116 7 441 524
29 767 721 29 182 448
The Long Term Assets investments consist of units in unlisted trusts and other holdings held with QIC.
11 Derivative financial assets
2013 2012
$000 $000
Interest rate swaps 149 229 185 768
Cross currency swaps 136 217 120 831
Forward rate agreements 86 378 161 938
Foreign exchange contracts 416 637 6 519
788 461 475 056
12 Onlendings
2013 2012
$000 $000
Government departments and agencies 38 258 994 30 520 239
Government owned corporations 22 008 582 21 085 227
Local governments 6 632 514 5 859 780
Queensland water entities 10 881 269 10 825 970
Statutory bodies 757 394 1 113 361
QTC related entities 321 179 2 659 158
Other bodies 258 900 225 900
79 118 832 72 289 635
As at 30 June 2013, $77,520 million (2012 $70,541 million) of repayments are expected to be received after more than 12 months.
38
QUEENSLAND TREASURY CORPORATION ANNUAL REPORT 2012–13
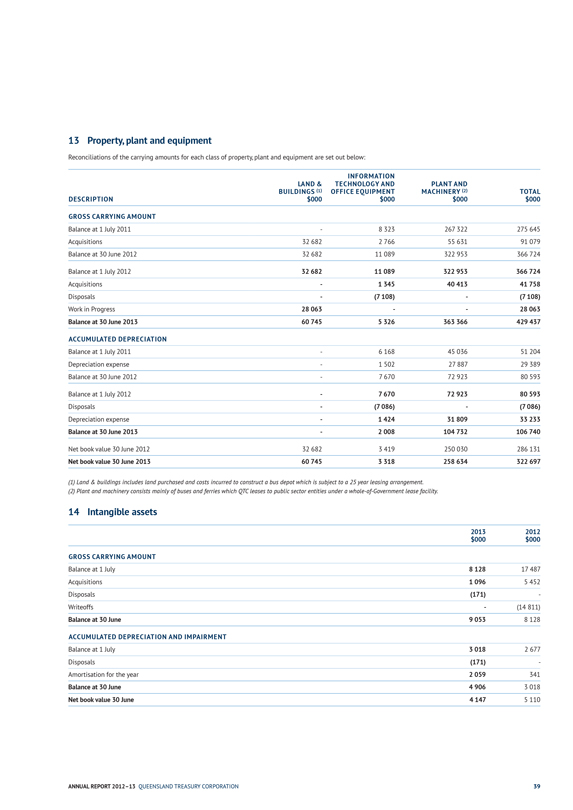
13 Property, plant and equipment
Reconciliations of the carrying amounts for each class of property, plant and equipment are set out below:
LAND & BUILDINGS (1) INFORMATION TECHNOLOGY AND OFFICE EQUIPMENT PLANT AND MACHINERY (2) TOTAL
DESCRIPTION $000 $000 $000 $000
GROSS CARRYING AMOUNT
Balance at 1 July 2011 - 8 323 267 322 275 645
Acquisitions 32 682 2 766 55 631 91 079
Balance at 30 June 2012 32 682 11 089 322 953 366 724
Balance at 1 July 2012 32 682 11 089 322 953 366 724
Acquisitions - 1 345 40 413 41 758
Disposals - (7 108) - (7 108)
Work in Progress 28 063 - - 28 063
Balance at 30 June 2013 60 745 5 326 363 366 429 437
ACCUMULATED DEPRECIATION
Balance at 1 July 2011 - 6 168 45 036 51 204
Depreciation expense - 1 502 27 887 29 389
Balance at 30 June 2012 - 7 670 72 923 80 593
Balance at 1 July 2012 - 7 670 72 923 80 593
Disposals - (7 086) - (7 086)
Depreciation expense - 1 424 31 809 33 233
Balance at 30 June 2013 - 2 008 104 732 106 740
Net book value 30 June 2012 32 682 3 419 250 030 286 131
Net book value 30 June 2013 60 745 3 318 258 634 322 697
(1) Land & buildings includes land purchased and costs incurred to construct a bus depot which is subject to a 25 year leasing arrangement. (2) Plant and machinery consists mainly of buses and ferries which QTC leases to public sector entities under a whole-of-Government lease facility.
14 Intangible assets
2013 2012
$000 $000
GROSS CARRYING AMOUNT
Balance at 1 July 8 128 17 487
Acquisitions 1 096 5 452
Disposals (171) -
Writeoffs - (14 811)
Balance at 30 June 9 053 8 128
ACCUMULATED DEPRECIATION AND IMPAIRMENT
Balance at 1 July 3 018 2 677
Disposals (171) -
Amortisation for the year 2 059 341
Balance at 30 June 4 906 3 018
Net book value 30 June 4 147 5 110
ANNUAL REPORT 2012–13 QUEENSLAND TREASURY CORPORATION
39
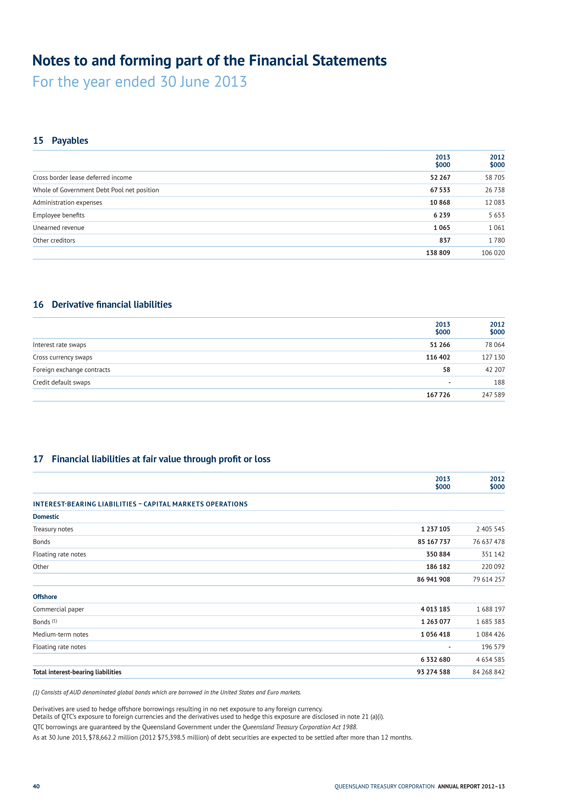
Notes to and forming part of the Financial Statements
For the year ended 30 June 2013
15 Payables
2013 2012
$000 $000
Cross border lease deferred income 52 267 58 705
Whole of Government Debt Pool net position 67 533 26 738
Administration expenses 10 868 12 083
Employee benefits 6 239 5 653
Unearned revenue 1 065 1 061
Other creditors 837 1 780
138 809 106 020
16 Derivative financial liabilities
2013 2012
$000 $000
Interest rate swaps 51 266 78 064
Cross currency swaps 116 402 127 130
Foreign exchange contracts 58 42 207
Credit default swaps - 188
167 726 247 589
17 Financial liabilities at fair value through profit or loss
2013 2012
$000 $000
INTEREST-BEARING LIABILITIES – CAPITAL MARKETS OPERATIONS
Domestic
Treasury notes 1 237 105 2 405 545
Bonds 85 167 737 76 637 478
Floating rate notes 350 884 351 142
Other 186 182 220 092
86 941 908 79 614 257
Offshore
Commercial paper 4 013 185 1 688 197
Bonds (1) 1 263 077 1 685 383
Medium-term notes 1 056 418 1 084 426
Floating rate notes - 196 579
6 332 680 4 654 585
Total interest-bearing liabilities 93 274 588 84 268 842
(1) Consists of AUD denominated global bonds which are borrowed in the United States and Euro markets.
Derivatives are used to hedge offshore borrowings resulting in no net exposure to any foreign currency.
Details of QTC’s exposure to foreign currencies and the derivatives used to hedge this exposure are disclosed in note 21 (a)(i). QTC borrowings are guaranteed by the Queensland Government under the Queensland Treasury Corporation Act 1988.
As at 30 June 2013, $78,662.2 million (2012 $75,398.5 million) of debt securities are expected to be settled after more than 12 months.
40
QUEENSLAND TREASURY CORPORATION ANNUAL REPORT 2012–13
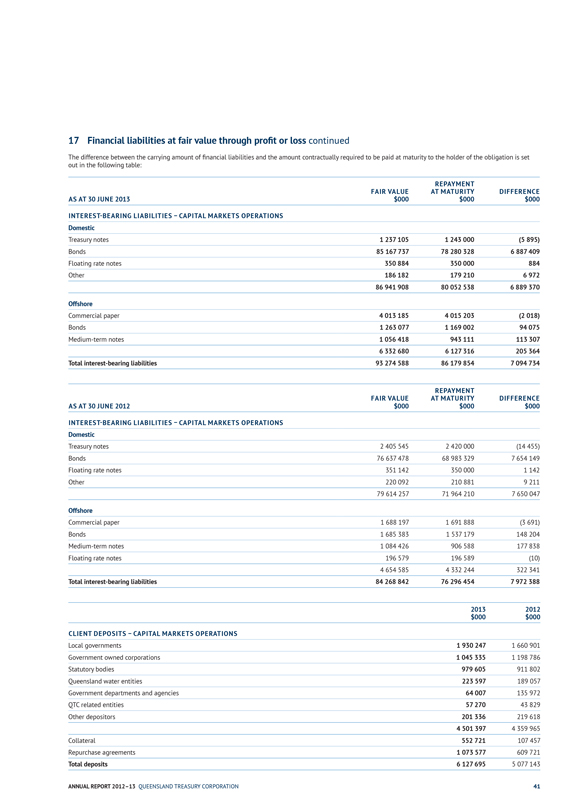
17 Financial liabilities at fair value through profit or loss continued
The difference between the carrying amount of financial liabilities and the amount contractually required to be paid at maturity to the holder of the obligation is set out in the following table:
FAIR VALUE
REPAYMENT AT MATURITY
DIFFERENCE
AS AT 30 JUNE 2013
$000
$000
$000
INTEREST-BEARING LIABILITIES – CAPITAL MARKETS OPERATIONS
Domestic
Treasury notes
1 237 105
1 243 000
(5 895)
Bonds
85 167 737
78 280 328
6 887 409
Floating rate notes
350 884
350 000
884
Other
186 182
179 210
6 972
86 941 908
80 052 538
6 889 370
Offshore
Commercial paper
4 013 185
4 015 203
(2 018)
Bonds
1 263 077
1 169 002
94 075
Medium-term notes
1 056 418
943 111
113 307
6 332 680
6 127 316
205 364
Total interest-bearing liabilities
93 274 588
86 179 854
7 094 734
FAIR VALUE
REPAYMENT AT MATURITY
DIFFERENCE
AS AT 30 JUNE 2012
$000
$000
$000
INTEREST-BEARING LIABILITIES – CAPITAL MARKETS OPERATIONS
Domestic
Treasury notes
2 405 545
2 420 000
(14 455)
Bonds
76 637 478
68 983 329
7 654 149
Floating rate notes
351 142
350 000
1 142
Other
220 092
210 881
9 211
79 614 257
71 964 210
7 650 047
Offshore
Commercial paper
1 688 197
1 691 888
(3 691)
Bonds
1 685 383
1 537 179
148 204
Medium-term notes
1 084 426
906 588
177 838
Floating rate notes
196 579
196 589
(10)
4 654 585
4 332 244
322 341
Total interest-bearing liabilities
84 268 842
76 296 454
7 972 388
2013
2012
$000
$000
CLIENT DEPOSITS – CAPITAL MARKETS OPERATIONS
Local governments
1 930 247
1 660 901
Government owned corporations
1 045 335
1 198 786
Statutory bodies
979 605
911 802
Queensland water entities
223 597
189 057
Government departments and agencies
64 007
135 972
QTC related entities
57 270
43 829
Other depositors
201 336
219 618
4 501 397
4 359 965
Collateral
552 721
107 457
Repurchase agreements
1 073 577
609 721
Total deposits
6 127 695
5 077 143
ANNUAL REPORT 2012–13 QUEENSLAND TREASURY CORPORATION 41

Notes to and forming part of the Financial Statements
For the year ended 30 June 2013
18 Financial liabilities at amortised cost
2012
2011
$000
$000
FIXED RATE NOTES – LONG TERM ASSETS
State Government
31 447 603
31 852 678
The Board considers that the carrying value of financial liabilities recorded at amortised cost in the financial statements approximates their fair value.
19 Notes to the statement of cash flows
(a) Reconciliation of profit after tax to net cash provided by operating activities – capital markets operations
2012
2011
$000
$000
Profit for the year
222 884
46 909
NON-CASH FLOWS IN OPERATING SURPLUS
Interest-bearing liabilities - net unrealised (gain)/loss
(1 309 368)
1 991 771
Interest-bearing liabilities - net unrealised exchange (gain)/loss
5 664
29 722
Deposits - net unrealised loss
11
43
Onlendings net unrealised loss/(gain)
1 255 992
(4 358 197)
Financial assets at fair value through profit or loss - net unrealised loss/(gain)
284 430
(339 138)
Financial assets at fair value through profit or loss - net unrealised exchange gain
(73 985)
(11 879)
Depreciation of property, plant and equipment
33 233
29 389
Amortisation of intangibles
2 059
341
Net gain on sale of property, plant and equipment
9
-
Impairment of intangibles
-
14 811
Doubtful debts writeback cooperative housing societies
(26)
(20)
Share of profit from investments accounted for using the equity method
(521)
(491)
CHANGES IN ASSETS AND LIABILITIES
Decrease in financial assets at fair value through profit or loss - net accrued interest
43 878
10 685
Increase in financial assets at fair value through profit or loss - net discount/premium
(51 160)
(438 485)
Decrease/(increase) in deferred tax asset
306
(518)
Increase in onlendings - net accrued interest
(3 317)
(4 684)
Decrease in receivables
5 661
4 265
Increase in prepayments
(208)
(53)
Increase in interest-bearing liabilities - net accrued interest
107 526
97 325
Increase in interest-bearing liabilities - net discount/premium
305 558
2 937 019
Decrease/(Increase) in deposits - net accrued interest
507
(665)
Increase/(decrease) in payables
32 788
(52 742)
Decrease in deferred tax liability
(30)
(16)
Increase/(decrease) in income tax payable
7 047
(11 996)
Net cash provided by/(used in) operating activities
868 938
(56 604)
42 QUEENSLAND TREASURY CORPORATION ANNUAL REPORT 2012–13
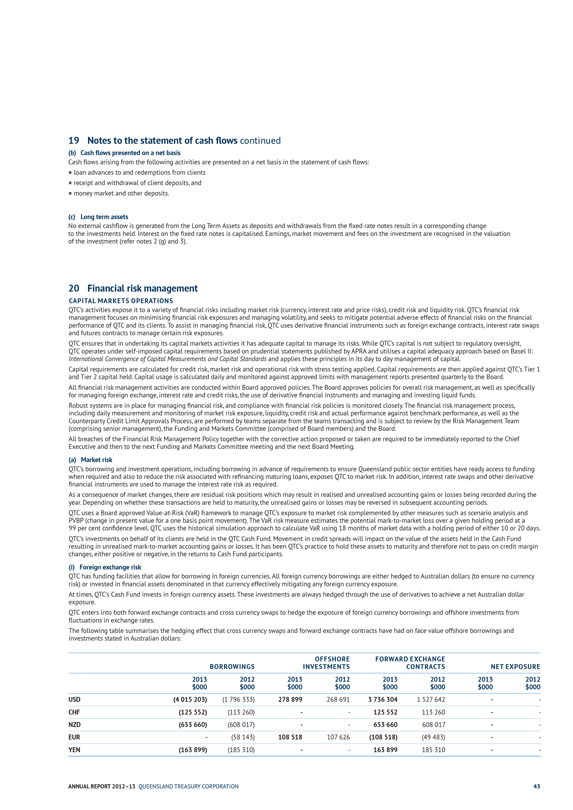
19 Notes to the statement of cash flows continued
(b) Cash flows presented on a net basis
Cash flows arising from the following activities are presented on a net basis in the statement of cash flows:
loan advances to and redemptions from clients
receipt and withdrawal of client deposits, and
money market and other deposits.
(c) Long term assets
No external cashflow is generated from the Long Term Assets as deposits and withdrawals from the fixed rate notes result in a corresponding change to the investments held. Interest on the fixed rate notes is capitalised. Earnings, market movement and fees on the investment are recognised in the valuation of the investment (refer notes 2 (g) and 3).
20 Financial risk management
CAPITAL MARKETS OPERATIONS
QTC’s activities expose it to a variety of financial risks including market risk (currency, interest rate and price risks), credit risk and liquidity risk. QTC’s financial risk management focuses on minimising financial risk exposures and managing volatility, and seeks to mitigate potential adverse effects of financial risks on the financial performance of QTC and its clients. To assist in managing financial risk, QTC uses derivative financial instruments such as foreign exchange contracts, interest rate swaps and futures contracts to manage certain risk exposures.
QTC ensures that in undertaking its capital markets activities it has adequate capital to manage its risks. While QTC’s capital is not subject to regulatory oversight, QTC operates under self-imposed capital requirements based on prudential statements published by APRA and utilises a capital adequacy approach based on Basel II:
International Convergence of Capital Measurements and Capital Standards and applies these principles in its day to day management of capital.
Capital requirements are calculated for credit risk, market risk and operational risk with stress testing applied. Capital requirements are then applied against QTC’s Tier 1 and Tier 2 capital held. Capital usage is calculated daily and monitored against approved limits with management reports presented quarterly to the Board.
All financial risk management activities are conducted within Board approved policies. The Board approves policies for overall risk management, as well as specifically for managing foreign exchange, interest rate and credit risks, the use of derivative financial instruments and managing and investing liquid funds.
Robust systems are in place for managing financial risk, and compliance with financial risk policies is monitored closely. The financial risk management process, including daily measurement and monitoring of market risk exposure, liquidity, credit risk and actual performance against benchmark performance, as well as the Counterparty Credit Limit Approvals Process, are performed by teams separate from the teams transacting and is subject to review by the Risk Management Team (comprising senior management), the Funding and Markets Committee (comprised of Board members) and the Board.
All breaches of the Financial Risk Management Policy together with the corrective action proposed or taken are required to be immediately reported to the Chief Executive and then to the next Funding and Markets Committee meeting and the next Board Meeting.
(a) Market risk
QTC’s borrowing and investment operations, including borrowing in advance of requirements to ensure Queensland public sector entities have ready access to funding when required and also to reduce the risk associated with refinancing maturing loans, exposes QTC to market risk. In addition, interest rate swaps and other derivative financial instruments are used to manage the interest rate risk as required.
As a consequence of market changes, there are residual risk positions which may result in realised and unrealised accounting gains or losses being recorded during the year. Depending on whether these transactions are held to maturity, the unrealised gains or losses may be reversed in subsequent accounting periods.
QTC uses a Board approved Value-at-Risk (VaR) framework to manage QTC’s exposure to market risk complemented by other measures such as scenario analysis and PVBP (change in present value for a one basis point movement). The VaR risk measure estimates the potential mark-to-market loss over a given holding period at a
99 per cent confidence level. QTC uses the historical simulation approach to calculate VaR using 18 months of market data with a holding period of either 10 or 20 days.
QTC’s investments on behalf of its clients are held in the QTC Cash Fund. Movement in credit spreads will impact on the value of the assets held in the Cash Fund resulting in unrealised mark-to-market accounting gains or losses. It has been QTC’s practice to hold these assets to maturity and therefore not to pass on credit margin changes, either positive or negative, in the returns to Cash Fund participants.
(i) Foreign exchange risk
QTC has funding facilities that allow for borrowing in foreign currencies. All foreign currency borrowings are either hedged to Australian dollars (to ensure no currency risk) or invested in financial assets denominated in that currency effectively mitigating any foreign currency exposure.
At times, QTC’s Cash Fund invests in foreign currency assets. These investments are always hedged through the use of derivatives to achieve a net Australian dollar exposure.
QTC enters into both forward exchange contracts and cross currency swaps to hedge the exposure of foreign currency borrowings and offshore investments from fluctuations in exchange rates.
The following table summarises the hedging effect that cross currency swaps and forward exchange contracts have had on face value offshore borrowings and investments stated in Australian dollars:
| | | | | | | | | | | | | | | | |
| | | | | BORROWINGS | | | | OFFSHORE INVESTMENTS | | FORWARD EXCHANGE CONTRACTS | | | | NET EXPOSURE | | |
| | | 2013 | | 2012 | | 2013 | | 2012 | | 2013 | | 2012 | | 2013 | | 2012 |
| | | $000 | | $000 | | $000 | | $000 | | $000 | | $000 | | $000 | | $000 |
USD | | (4 015 203) | | (1 796 333) | | 278 899 | | 268 691 | | 3 736 304 | | 1 527 642 | | - | | - |
CHF | | (125 552) | | (113 260) | | - | | - | | 125 552 | | 113 260 | | - | | - |
NZD | | (653 660) | | (608 017) | | - | | - | | 653 660 | | 608 017 | | - | | - |
EUR | | - | | (58 143) | | 108 518 | | 107 626 | | (108 518) | | (49 483) | | - | | - |
YEN | | (163 899) | | (185 310) | | - | | - | | 163 899 | | 185 310 | | - | | - |
ANNUAL REPORT 2012–13 QUEENSLAND TREASURY CORPORATION 43
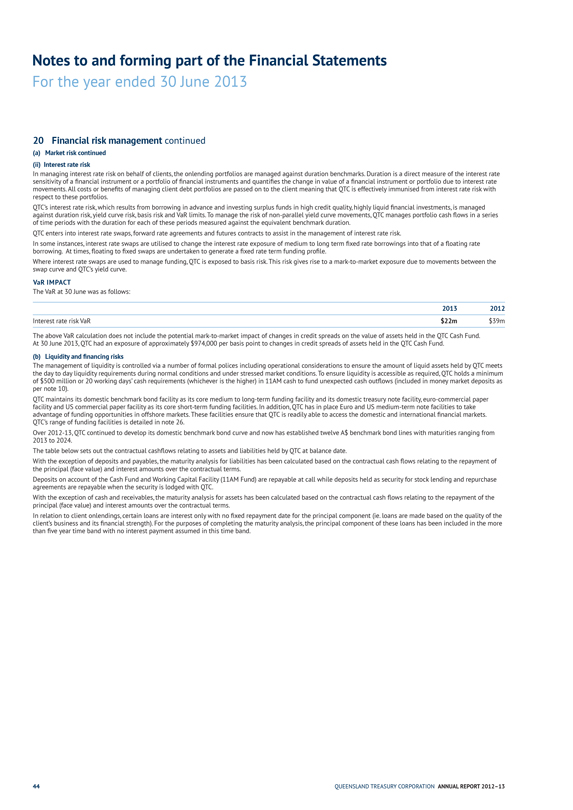
Notes to and forming part of the Financial Statements
For the year ended 30 June 2013
20 Financial risk management continued
(a) Market risk continued (ii) Interest rate risk
In managing interest rate risk on behalf of clients, the onlending portfolios are managed against duration benchmarks. Duration is a direct measure of the interest rate sensitivity of a financial instrument or a portfolio of financial instruments and quantifies the change in value of a financial instrument or portfolio due to interest rate movements. All costs or benefits of managing client debt portfolios are passed on to the client meaning that QTC is effectively immunised from interest rate risk with respect to these portfolios.
QTC’s interest rate risk, which results from borrowing in advance and investing surplus funds in high credit quality, highly liquid financial investments, is managed against duration risk, yield curve risk, basis risk and VaR limits. To manage the risk of non-parallel yield curve movements, QTC manages portfolio cash flows in a series of time periods with the duration for each of these periods measured against the equivalent benchmark duration.
QTC enters into interest rate swaps, forward rate agreements and futures contracts to assist in the management of interest rate risk.
In some instances, interest rate swaps are utilised to change the interest rate exposure of medium to long term fixed rate borrowings into that of a floating rate borrowing. At times, floating to fixed swaps are undertaken to generate a fixed rate term funding profile.
Where interest rate swaps are used to manage funding, QTC is exposed to basis risk. This risk gives rise to a mark-to-market exposure due to movements between the swap curve and QTC’s yield curve.
VaR IMPACT
The VaR at 30 June was as follows:
2013
2012
Interest rate risk VaR
$22m
$39m
The above VaR calculation does not include the potential mark-to-market impact of changes in credit spreads on the value of assets held in the QTC Cash Fund. At 30 June 2013, QTC had an exposure of approximately $974,000 per basis point to changes in credit spreads of assets held in the QTC Cash Fund.
(b) Liquidity and financing risks
The management of liquidity is controlled via a number of formal polices including operational considerations to ensure the amount of liquid assets held by QTC meets the day to day liquidity requirements during normal conditions and under stressed market conditions. To ensure liquidity is accessible as required, QTC holds a minimum of $500 million or 20 working days’ cash requirements (whichever is the higher) in 11AM cash to fund unexpected cash outflows (included in money market deposits as per note 10).
QTC maintains its domestic benchmark bond facility as its core medium to long-term funding facility and its domestic treasury note facility, euro-commercial paper facility and US commercial paper facility as its core short-term funding facilities. In addition, QTC has in place Euro and US medium-term note facilities to take advantage of funding opportunities in offshore markets. These facilities ensure that QTC is readily able to access the domestic and international financial markets.
QTC’s range of funding facilities is detailed in note 26.
Over 2012-13, QTC continued to develop its domestic benchmark bond curve and now has established twelve A$ benchmark bond lines with maturities ranging from 2013 to 2024.
The table below sets out the contractual cashflows relating to assets and liabilities held by QTC at balance date.
With the exception of deposits and payables, the maturity analysis for liabilities has been calculated based on the contractual cash flows relating to the repayment of the principal (face value) and interest amounts over the contractual terms.
Deposits on account of the Cash Fund and Working Capital Facility (11AM Fund) are repayable at call while deposits held as security for stock lending and repurchase agreements are repayable when the security is lodged with QTC.
With the exception of cash and receivables, the maturity analysis for assets has been calculated based on the contractual cash flows relating to the repayment of the principal (face value) and interest amounts over the contractual terms.
In relation to client onlendings, certain loans are interest only with no fixed repayment date for the principal component (ie. loans are made based on the quality of the client’s business and its financial strength). For the purposes of completing the maturity analysis, the principal component of these loans has been included in the more than five year time band with no interest payment assumed in this time band.
44 QUEENSLAND TREASURY CORPORATION ANNUAL REPORT 2012–13
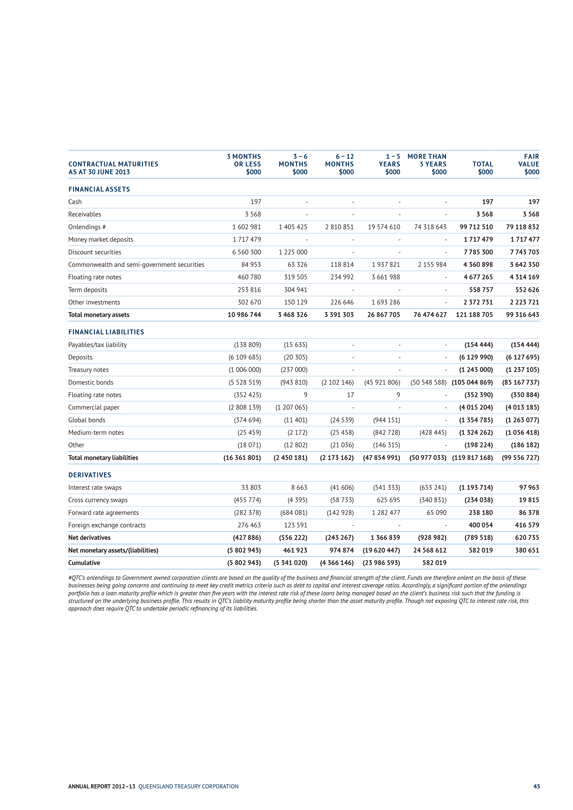
CONTRACTUAL MATURITIES
3 MONTHS OR LESS
3 – 6 MONTHS
6 – 12 MONTHS
1 – 5 YEARS
MORE THAN 5 YEARS
TOTAL
FAIR VALUE
AS AT 30 JUNE 2013
$000
$000
$000
$000
$000
$000
$000
FINANCIAL ASSETS
Cash
197
-
-
-
-
197
197
Receivables
3 568
-
-
-
-
3 568
3 568
Onlendings #
1 602 981
1 405 425
2 810 851
19 574 610
74 318 643
99 712 510
79 118 832
Money market deposits
1 717 479
-
-
-
-
1 717 479
1 717 477
Discount securities
6 560 300
1 225 000
-
-
-
7 785 300
7 743 703
Commonwealth and semi-government securities
84 953
63 326
118 814
1 937 821
2 155 984
4 360 898
3 642 350
Floating rate notes
460 780
319 505
234 992
3 661 988
-
4 677 265
4 314 169
Term deposits
253 816
304 941
-
-
-
558 757
552 626
Other investments
302 670
150 129
226 646
1 693 286
-
2 372 731
2 223 721
Total monetary assets
10 986 744
3 468 326
3 391 303
26 867 705
76 474 627
121 188 705
99 316 643
FINANCIAL LIABILITIES
Payables/tax liability
(138 809)
(15 635)
-
-
-
(154 444)
(154 444)
Deposits
(6 109 685)
(20 305)
-
-
-
(6 129 990)
(6 127 695)
Treasury notes
(1 006 000)
(237 000)
-
-
-
(1 243 000)
(1 237 105)
Domestic bonds
(5 528 519)
(943 810)
(2 102 146)
(45 921 806)
(50 548 588)
(105 044 869)
(85 167 737)
Floating rate notes
(352 425)
9
17
9
-
(352 390)
(350 884)
Commercial paper
(2 808 139)
(1 207 065)
-
-
-
(4 015 204)
(4 013 185)
Global bonds
(374 694)
(11 401)
(24 539)
(944 151)
-
(1 354 785)
(1 263 077)
Medium-term notes
(25 459)
(2 172)
(25 458)
(842 728)
(428 445)
(1 324 262)
(1 056 418)
Other
(18 071)
(12 802)
(21 036)
(146 315)
-
(198 224)
(186 182)
Total monetary liabilities
(16 361 801)
(2 450 181)
(2 173 162)
(47 854 991)
(50 977 033)
(119 817 168)
(99 556 727)
DERIVATIVES
Interest rate swaps
33 803
8 663
(41 606)
(541 333)
(653 241)
(1 193 714)
97 963
Cross currency swaps
(455 774)
(4 395)
(58 733)
625 695
(340 831)
(234 038)
19 815
Forward rate agreements
(282 378)
(684 081)
(142 928)
1 282 477
65 090
238 180
86 378
Foreign exchange contracts
276 463
123 591
-
-
-
400 054
416 579
Net derivatives
(427 886)
(556 222)
(243 267)
1 366 839
(928 982)
(789 518)
620 735
Net monetary assets/(liabilities)
(5 802 943)
461 923
974 874
(19 620 447)
24 568 612
582 019
380 651
Cumulative
(5 802 943)
(5 341 020)
(4 366 146)
(23 986 593)
582 019
#QTC’s onlendings to Government owned corporation clients are based on the quality of the business and financial strength of the client. Funds are therefore onlent on the basis of these businesses being going concerns and continuing to meet key credit metrics criteria such as debt to capital and interest coverage ratios. Accordingly, a significant portion of the onlendings portfolio has a loan maturity profile which is greater than five years with the interest rate risk of these loans being managed based on the client’s business risk such that the funding is structured on the underlying business profile. This results in QTC’s liability maturity profile being shorter than the asset maturity profile. Though not exposing QTC to interest rate risk, this approach does require QTC to undertake periodic refinancing of its liabilities.
ANNUAL REPORT 2012–13 QUEENSLAND TREASURY CORPORATION 45
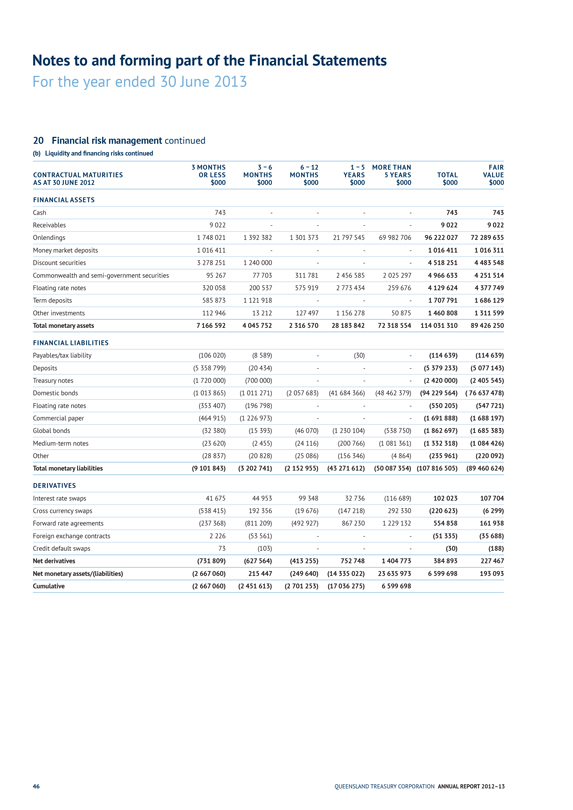
Notes to and forming part of the Financial Statements
For the year ended 30 June 2013
20 Financial risk management continued
(b) Liquidity and financing risks continued
CONTRACTUAL MATURITIES
3 MONTHS OR LESS
3 – 6 MONTHS
6 – 12 MONTHS
1 – 5 YEARS
MORE THAN 5 YEARS
TOTAL
FAIR VALUE
AS AT 30 JUNE 2012
$000
$000
$000
$000
$000
$000
$000
FINANCIAL ASSETS
Cash
743
-
-
-
-
743
743
Receivables
9 022
-
-
-
-
9 022
9 022
Onlendings
1 748 021
1 392 382
1 301 373
21 797 545
69 982 706
96 222 027
72 289 635
Money market deposits
1 016 411
-
-
-
-
1 016 411
1 016 311
Discount securities
3 278 251
1 240 000
-
-
-
4 518 251
4 483 548
Commonwealth and semi-government securities
95 267
77 703
311 781
2 456 585
2 025 297
4 966 633
4 251 514
Floating rate notes
320 058
200 537
575 919
2 773 434
259 676
4 129 624
4 377 749
Term deposits
585 873
1 121 918
-
-
-
1 707 791
1 686 129
Other investments
112 946
13 212
127 497
1 156 278
50 875
1 460 808
1 311 599
Total monetary assets
7 166 592
4 045 752
2 316 570
28 183 842
72 318 554
114 031 310
89 426 250
FINANCIAL LIABILITIES
Payables/tax liability
(106 020)
(8 589)
-
(30)
-
(114 639)
(114 639)
Deposits
(5 358 799)
(20 434)
-
-
-
(5 379 233)
(5 077 143)
Treasury notes
(1 720 000)
(700 000)
-
-
-
(2 420 000)
(2 405 545)
Domestic bonds
(1 013 865)
(1 011 271)
(2 057 683)
(41 684 366)
(48 462 379)
(94 229 564)
(76 637 478)
Floating rate notes
(353 407)
(196 798)
-
-
-
(550 205)
(547 721)
Commercial paper
(464 915)
(1 226 973)
-
-
-
(1 691 888)
(1 688 197)
Global bonds
(32 380)
(15 393)
(46 070)
(1 230 104)
(538 750)
(1 862 697)
(1 685 383)
Medium-term notes
(23 620)
(2 455)
(24 116)
(200 766)
(1 081 361)
(1 332 318)
(1 084 426)
Other
(28 837)
(20 828)
(25 086)
(156 346)
(4 864)
(235 961)
(220 092)
Total monetary liabilities
(9 101 843)
(3 202 741)
(2 152 955)
(43 271 612)
(50 087 354)
(107 816 505)
(89 460 624)
DERIVATIVES
Interest rate swaps
41 675
44 953
99 348
32 736
(116 689)
102 023
107 704
Cross currency swaps
(538 415)
192 356
(19 676)
(147 218)
292 330
(220 623)
(6 299)
Forward rate agreements
(237 368)
(811 209)
(492 927)
867 230
1 229 132
554 858
161 938
Foreign exchange contracts
2 226
(53 561)
-
-
-
(51 335)
(35 688)
Credit default swaps
73
(103)
-
-
-
(30)
(188)
Net derivatives
(731 809)
(627 564)
(413 255)
752 748
1 404 773
384 893
227 467
Net monetary assets/(liabilities)
(2 667 060)
215 447
(249 640)
(14 335 022)
23 635 973
6 599 698
193 093
Cumulative
(2 667 060)
(2 451 613)
(2 701 253)
(17 036 275)
6 599 698
46 QUEENSLAND TREASURY CORPORATION ANNUAL REPORT 2012–13
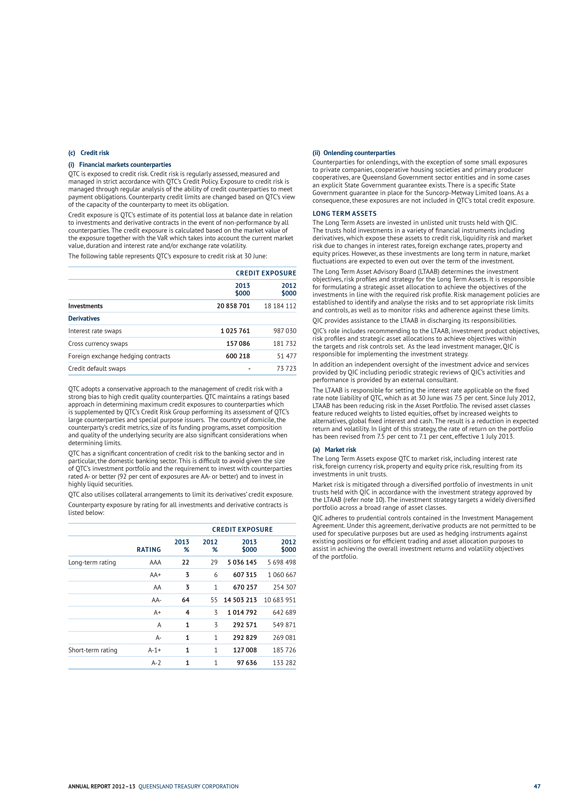
(i) | | Financial markets counterparties |
QTC is exposed to credit risk. Credit risk is regularly assessed, measured and managed in strict accordance with QTC’s Credit Policy. Exposure to credit risk is managed through regular analysis of the ability of credit counterparties to meet payment obligations. Counterparty credit limits are changed based on QTC’s view of the capacity of the counterparty to meet its obligation.
Credit exposure is QTC’s estimate of its potential loss at balance date in relation to investments and derivative contracts in the event of non-performance by all counterparties. The credit exposure is calculated based on the market value of the exposure together with the VaR which takes into account the current market value, duration and interest rate and/or exchange rate volatility.
The following table represents QTC’s exposure to credit risk at 30 June:
CREDIT EXPOSURE
2013
2012
$000
$000
Investments
20 858 701
18 184 112
Derivatives
Interest rate swaps
1 025 761
987 030
Cross currency swaps
157 086
181 732
Foreign exchange hedging contracts
600 218
51 477
Credit default swaps
-
73 723
QTC adopts a conservative approach to the management of credit risk with a strong bias to high credit quality counterparties. QTC maintains a ratings based approach in determining maximum credit exposures to counterparties which is supplemented by QTC’s Credit Risk Group performing its assessment of QTC’s large counterparties and special purpose issuers. The country of domicile, the counterparty’s credit metrics, size of its funding programs, asset composition and quality of the underlying security are also significant considerations when determining limits.
QTC has a significant concentration of credit risk to the banking sector and in particular, the domestic banking sector. This is difficult to avoid given the size of QTC’s investment portfolio and the requirement to invest with counterparties rated A- or better (92 per cent of exposures are AA- or better) and to invest in highly liquid securities.
QTC also utilises collateral arrangements to limit its derivatives’ credit exposure. Counterparty exposure by rating for all investments and derivative contracts is listed below:
CREDIT EXPOSURE
2013
2012
2013
2012
RATING
%
%
$000
$000
Long-term rating
AAA
22
29
5 036 145
5 698 498
AA+
3
6
607 315
1 060 667
AA
3
1
670 257
254 307
AA-
64
55
14 503 213
10 683 951
A+
4
3
1 014 792
642 689
A
1
3
292 571
549 871
A-
1
1
292 829
269 081
Short-term rating
A-1+
1
1
127 008
185 726
A-2
1
1
97 636
133 282
(ii) Onlending counterparties
Counterparties for onlendings, with the exception of some small exposures to private companies, cooperative housing societies and primary producer cooperatives, are Queensland Government sector entities and in some cases an explicit State Government guarantee exists. There is a specific State
Government guarantee in place for the Suncorp-Metway Limited loans. As a consequence, these exposures are not included in QTC’s total credit exposure.
LONG TERM ASSETS
The Long Term Assets are invested in unlisted unit trusts held with QIC.
The trusts hold investments in a variety of financial instruments including derivatives, which expose these assets to credit risk, liquidity risk and market risk due to changes in interest rates, foreign exchange rates, property and equity prices. However, as these investments are long term in nature, market fluctuations are expected to even out over the term of the investment.
The Long Term Asset Advisory Board (LTAAB) determines the investment objectives, risk profiles and strategy for the Long Term Assets. It is responsible for formulating a strategic asset allocation to achieve the objectives of the investments in line with the required risk profile. Risk management policies are established to identify and analyse the risks and to set appropriate risk limits and controls, as well as to monitor risks and adherence against these limits. QIC provides assistance to the LTAAB in discharging its responsibilities. QIC’s role includes recommending to the LTAAB, investment product objectives, risk profiles and strategic asset allocations to achieve objectives within the targets and risk controls set. As the lead investment manager, QIC is responsible for implementing the investment strategy.
In addition an independent oversight of the investment advice and services provided by QIC including periodic strategic reviews of QIC’s activities and performance is provided by an external consultant.
The LTAAB is responsible for setting the interest rate applicable on the fixed rate note liability of QTC, which as at 30 June was 7.5 per cent. Since July 2012, LTAAB has been reducing risk in the Asset Portfolio. The revised asset classes feature reduced weights to listed equities, offset by increased weights to alternatives, global fixed interest and cash. The result is a reduction in expected return and volatility. In light of this strategy, the rate of return on the portfolio has been revised from 7.5 per cent to 7.1 per cent, effective 1 July 2013.
(a) Market risk
The Long Term Assets expose QTC to market risk, including interest rate risk, foreign currency risk, property and equity price risk, resulting from its investments in unit trusts.
Market risk is mitigated through a diversified portfolio of investments in unit trusts held with QIC in accordance with the investment strategy approved by the LTAAB (refer note 10). The investment strategy targets a widely diversified portfolio across a broad range of asset classes.
QIC adheres to prudential controls contained in the Investment Management Agreement. Under this agreement, derivative products are not permitted to be used for speculative purposes but are used as hedging instruments against existing positions or for efficient trading and asset allocation purposes to assist in achieving the overall investment returns and volatility objectives of the portfolio.
ANNUAL REPORT 2012–13 QUEENSLAND TREASURY CORPORATION 47
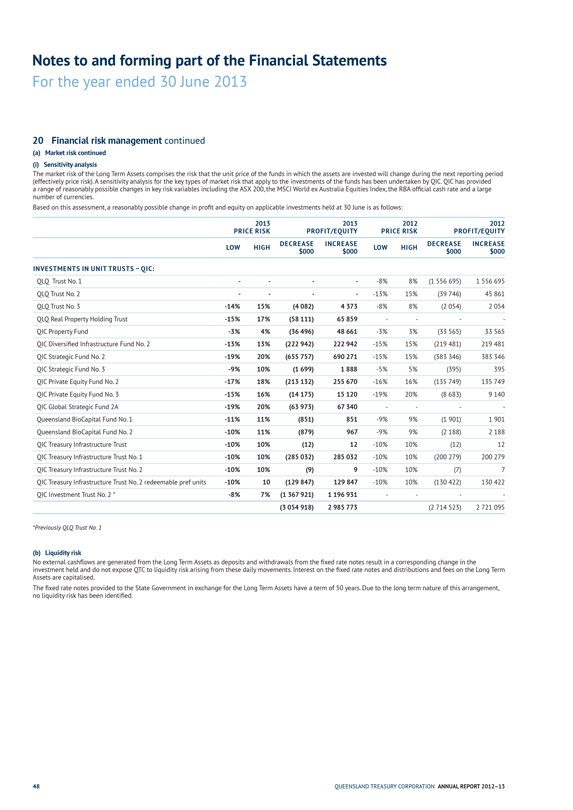
Notes to and forming part of the Financial Statements
For the year ended 30 June 2013
20 Financial risk management continued
(a) Market risk continued (i) Sensitivity analysis
The market risk of the Long Term Assets comprises the risk that the unit price of the funds in which the assets are invested will change during the next reporting period (effectively price risk). A sensitivity analysis for the key types of market risk that apply to the investments of the funds has been undertaken by QIC. QIC has provided a range of reasonably possible changes in key risk variables including the ASX 200, the MSCI World ex Australia Equities Index, the RBA official cash rate and a large number of currencies.
Based on this assessment, a reasonably possible change in profit and equity on applicable investments held at 30 June is as follows:
2013
2013
2012
2012
PRICE RISK
PROFIT/EQUITY
PRICE RISK
PROFIT/EQUITY
LOW
HIGH
DECREASE $000
INCREASE $000
LOW
HIGH
DECREASE $000
INCREASE $000
INVESTMENTS IN UNIT TRUSTS – QIC:
QLQ Trust No. 1
-
-
-
-
-8%
8%
(1 556 695)
1 556 695
QLQ Trust No. 2
-
-
-
-
-13%
15%
(39 746)
45 861
QLQ Trust No. 3
-14%
15%
(4 082)
4 373
-8%
8%
(2 054)
2 054
QLQ Real Property Holding Trust
-15%
17%
(58 111)
65 859
-
-
-
-
QIC Property Fund
-3%
4%
(36 496)
48 661
-3%
3%
(33 565)
33 565
QIC Diversified Infrastructure Fund No. 2
-13%
13%
(222 942)
222 942
-15%
15%
(219 481)
219 481
QIC Strategic Fund No. 2
-19%
20%
(655 757)
690 271
-15%
15%
(383 346)
383 346
QIC Strategic Fund No. 3
-9%
10%
(1 699)
1 888
-5%
5%
(395)
395
QIC Private Equity Fund No. 2
-17%
18%
(213 132)
255 670
-16%
16%
(135 749)
135 749
QIC Private Equity Fund No. 3
-15%
16%
(14 175)
15 120
-19%
20%
(8 683)
9 140
QIC Global Strategic Fund 2A
-19%
20%
(63 973)
67 340
-
-
-
-
Queensland BioCapital Fund No. 1
-11%
11%
(851)
851
-9%
9%
(1 901)
1 901
Queensland BioCapital Fund No. 2
-10%
11%
(879)
967
-9%
9%
(2 188)
2 188
QIC Treasury Infrastructure Trust
-10%
10%
(12)
12
-10%
10%
(12)
12
QIC Treasury Infrastructure Trust No. 1
-10%
10%
(285 032)
285 032
-10%
10%
(200 279)
200 279
QIC Treasury Infrastructure Trust No. 2
-10%
10%
(9)
9
-10%
10%
(7)
7
QIC Treasury Infrastructure Trust No. 2 redeemable pref units
-10%
10
(129 847)
129 847
-10%
10%
(130 422)
130 422
QIC Investment Trust No. 2 *
-8%
7%
(1 367 921)
1 196 931
-
-
-
-
(3 054 918)
2 985 773
(2 714 523)
2 721 095
*Previously QLQ Trust No. 1
(b) Liquidity risk
No external cashflows are generated from the Long Term Assets as deposits and withdrawals from the fixed rate notes result in a corresponding change in the investment held and do not expose QTC to liquidity risk arising from these daily movements. Interest on the fixed rate notes and distributions and fees on the Long Term
Assets are capitalised.
The fixed rate notes provided to the State Government in exchange for the Long Term Assets have a term of 50 years. Due to the long term nature of this arrangement, no liquidity risk has been identified.
48 QUEENSLAND TREASURY CORPORATION ANNUAL REPORT 2012–13
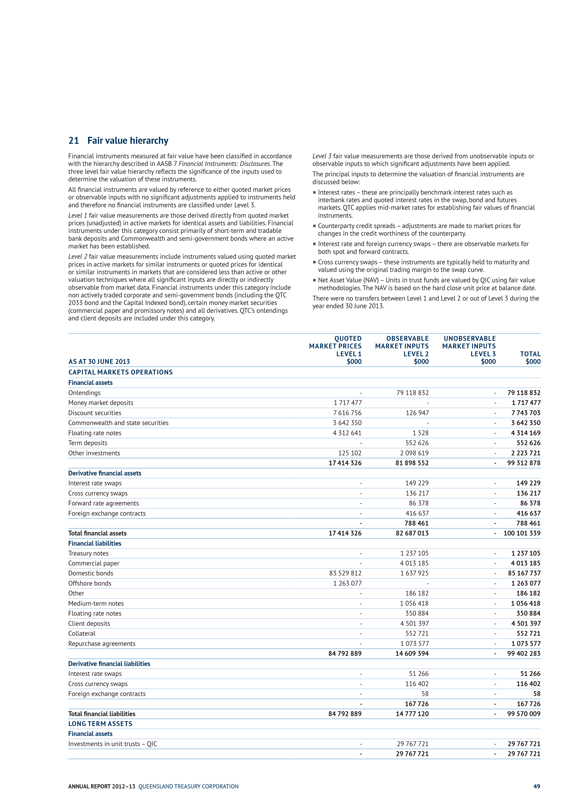
21 Fair value hierarchy
Financial instruments measured at fair value have been classified in accordance with the hierarchy described in AASB 7 Financial Instruments: Disclosures. The three level fair value hierarchy reflects the significance of the inputs used to determine the valuation of these instruments.
All financial instruments are valued by reference to either quoted market prices or observable inputs with no significant adjustments applied to instruments held and therefore no financial instruments are classified under Level 3.
Level 1 fair value measurements are those derived directly from quoted market prices (unadjusted) in active markets for identical assets and liabilities. Financial instruments under this category consist primarily of short-term and tradable bank deposits and Commonwealth and semi-government bonds where an active market has been established.
Level 2 fair value measurements include instruments valued using quoted market prices in active markets for similar instruments or quoted prices for identical or similar instruments in markets that are considered less than active or other valuation techniques where all significant inputs are directly or indirectly observable from market data. Financial instruments under this category include non actively traded corporate and semi-government bonds (including the QTC 2033 bond and the Capital Indexed bond), certain money market securities (commercial paper and promissory notes) and all derivatives. QTC’s onlendings and client deposits are included under this category.
Level 3 fair value measurements are those derived from unobservable inputs or observable inputs to which significant adjustments have been applied. The principal inputs to determine the valuation of financial instruments are discussed below:
Interest rates – these are principally benchmark interest rates such as interbank rates and quoted interest rates in the swap, bond and futures markets. QTC applies mid-market rates for establishing fair values of financial instruments.
Counterparty credit spreads – adjustments are made to market prices for changes in the credit worthiness of the counterparty.
Interest rate and foreign currency swaps – there are observable markets for both spot and forward contracts.
Cross currency swaps – these instruments are typically held to maturity and valued using the original trading margin to the swap curve.
Net Asset Value (NAV) – Units in trust funds are valued by QIC using fair value methodologies. The NAV is based on the hard close unit price at balance date.
There were no transfers between Level 1 and Level 2 or out of Level 3 during the year ended 30 June 2013.
QUOTED MARKET PRICES LEVEL 1
OBSERVABLE MARKET INPUTS LEVEL 2
UNOBSERVABLE MARKET INPUTS LEVEL 3
TOTAL
AS AT 30 JUNE 2013
$000
$000
$000
$000
CAPITAL MARKETS OPERATIONS
Financial assets
Onlendings
-
79 118 832
-
79 118 832
Money market deposits
1 717 477
-
-
1 717 477
Discount securities
7 616 756
126 947
-
7 743 703
Commonwealth and state securities
3 642 350
-
-
3 642 350
Floating rate notes
4 312 641
1 528
-
4 314 169
Term deposits
-
552 626
-
552 626
Other investments
125 102
2 098 619
-
2 223 721
17 414 326
81 898 552
-
99 312 878
Derivative financial assets
Interest rate swaps
-
149 229
-
149 229
Cross currency swaps
-
136 217
-
136 217
Forward rate agreements
-
86 378
-
86 378
Foreign exchange contracts
-
416 637
-
416 637
-
788 461
-
788 461
Total financial assets
17 414 326
82 687 013
-
100 101 339
Financial liabilities
Treasury notes
-
1 237 105
-
1 237 105
Commercial paper
-
4 013 185
-
4 013 185
Domestic bonds
83 529 812
1 637 925
-
85 167 737
Offshore bonds
1 263 077
-
-
1 263 077
Other
-
186 182
-
186 182
Medium-term notes
-
1 056 418
-
1 056 418
Floating rate notes
-
350 884
-
350 884
Client deposits
-
4 501 397
-
4 501 397
Collateral
-
552 721
-
552 721
Repurchase agreements
-
1 073 577
-
1 073 577
84 792 889
14 609 394
-
99 402 283
Derivative financial liabilities
Interest rate swaps
-
51 266
-
51 266
Cross currency swaps
-
116 402
-
116 402
Foreign exchange contracts
-
58
-
58
-
167 726
-
167 726
Total financial liabilities
84 792 889
14 777 120
-
99 570 009
LONG TERM ASSETS
Financial assets
Investments in unit trusts – QIC
-
29 767 721
-
29 767 721
-
29 767 721
-
29 767 721
ANNUAL REPORT 2012–13 QUEENSLAND TREASURY CORPORATION 49
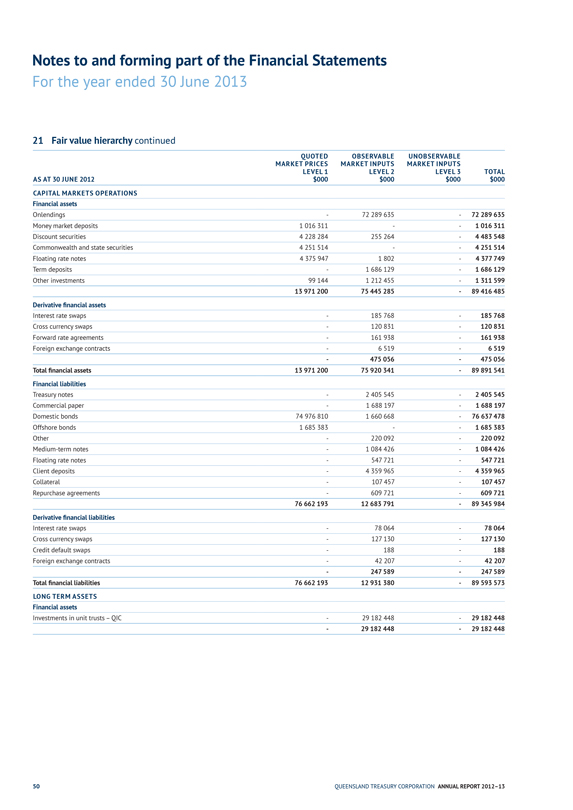
Notes to and forming part of the Financial Statements
For the year ended 30 June 2013
21 Fair value hierarchy continued
QUOTED MARKET PRICES LEVEL 1
OBSERVABLE MARKET INPUTS LEVEL 2
UNOBSERVABLE MARKET INPUTS LEVEL 3
TOTAL
AS AT 30 JUNE 2012
$000
$000
$000
$000
CAPITAL MARKETS OPERATIONS
Financial assets
Onlendings
-
72 289 635
-
72 289 635
Money market deposits
1 016 311
-
-
1 016 311
Discount securities
4 228 284
255 264
-
4 483 548
Commonwealth and state securities
4 251 514
-
-
4 251 514
Floating rate notes
4 375 947
1 802
-
4 377 749
Term deposits
-
1 686 129
-
1 686 129
Other investments
99 144
1 212 455
-
1 311 599
13 971 200
75 445 285
-
89 416 485
Derivative financial assets
Interest rate swaps
-
185 768
-
185 768
Cross currency swaps
-
120 831
-
120 831
Forward rate agreements
-
161 938
-
161 938
Foreign exchange contracts
-
6 519
-
6 519
-
475 056
-
475 056
Total financial assets
13 971 200
75 920 341
-
89 891 541
Financial liabilities
Treasury notes
-
2 405 545
-
2 405 545
Commercial paper
-
1 688 197
-
1 688 197
Domestic bonds
74 976 810
1 660 668
-
76 637 478
Offshore bonds
1 685 383
-
-
1 685 383
Other
-
220 092
-
220 092
Medium-term notes
-
1 084 426
-
1 084 426
Floating rate notes
-
547 721
-
547 721
Client deposits
-
4 359 965
-
4 359 965
Collateral
-
107 457
-
107 457
Repurchase agreements
-
609 721
-
609 721
76 662 193
12 683 791
-
89 345 984
Derivative financial liabilities
Interest rate swaps
-
78 064
-
78 064
Cross currency swaps
-
127 130
-
127 130
Credit default swaps
-
188
-
188
Foreign exchange contracts
-
42 207
-
42 207
-
247 589
-
247 589
Total financial liabilities
76 662 193
12 931 380
-
89 593 573
LONG TERM ASSETS
Financial assets
Investments in unit trusts – QIC
-
29 182 448
-
29 182 448
-
29 182 448
-
29 182 448
50 QUEENSLAND TREASURY CORPORATION ANNUAL REPORT 2012–13
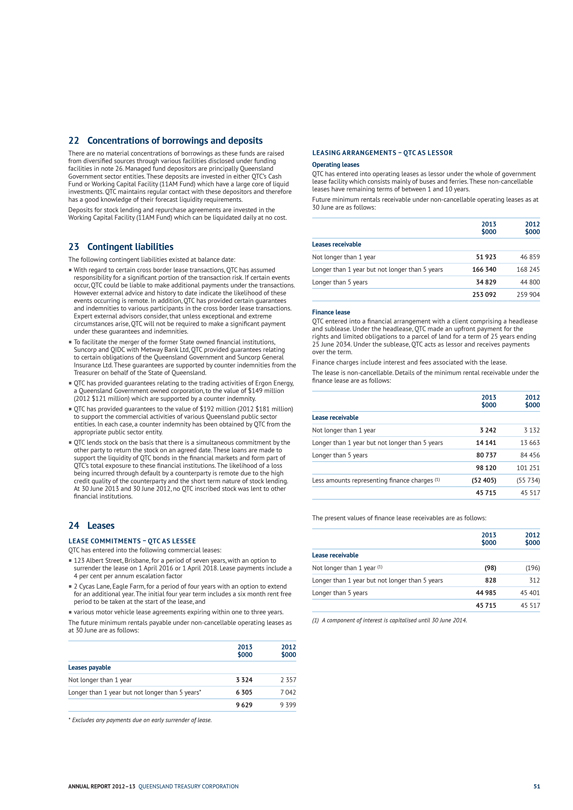
22 Concentrations of borrowings and deposits
There are no material concentrations of borrowings as these funds are raised from diversified sources through various facilities disclosed under funding facilities in note 26. Managed fund depositors are principally Queensland Government sector entities. These deposits are invested in either QTC’s Cash Fund or Working Capital Facility (11AM Fund) which have a large core of liquid investments. QTC maintains regular contact with these depositors and therefore has a good knowledge of their forecast liquidity requirements.
Deposits for stock lending and repurchase agreements are invested in the Working Capital Facility (11AM Fund) which can be liquidated daily at no cost.
23 Contingent liabilities
The following contingent liabilities existed at balance date:
With regard to certain cross border lease transactions, QTC has assumed responsibility for a significant portion of the transaction risk. If certain events occur, QTC could be liable to make additional payments under the transactions. However external advice and history to date indicate the likelihood of these events occurring is remote. In addition, QTC has provided certain guarantees and indemnities to various participants in the cross border lease transactions. Expert external advisors consider, that unless exceptional and extreme circumstances arise, QTC will not be required to make a significant payment under these guarantees and indemnities.
To facilitate the merger of the former State owned financial institutions,
Suncorp and QIDC with Metway Bank Ltd, QTC provided guarantees relating to certain obligations of the Queensland Government and Suncorp General Insurance Ltd. These guarantees are supported by counter indemnities from the Treasurer on behalf of the State of Queensland.
QTC has provided guarantees relating to the trading activities of Ergon Energy, a Queensland Government owned corporation, to the value of $149 million (2012 $121 million) which are supported by a counter indemnity.
QTC has provided guarantees to the value of $192 million (2012 $181 million) to support the commercial activities of various Queensland public sector entities. In each case, a counter indemnity has been obtained by QTC from the appropriate public sector entity.
QTC lends stock on the basis that there is a simultaneous commitment by the other party to return the stock on an agreed date. These loans are made to support the liquidity of QTC bonds in the financial markets and form part of QTC’s total exposure to these financial institutions. The likelihood of a loss being incurred through default by a counterparty is remote due to the high credit quality of the counterparty and the short term nature of stock lending. At 30 June 2013 and 30 June 2012, no QTC inscribed stock was lent to other financial institutions.
24 Leases
LEASE COMMITMENTS – QTC AS LESSEE
QTC has entered into the following commercial leases:
123 Albert Street, Brisbane, for a period of seven years, with an option to surrender the lease on 1 April 2016 or 1 April 2018. Lease payments include a 4 per cent per annum escalation factor
2 Cycas Lane, Eagle Farm, for a period of four years with an option to extend for an additional year. The initial four year term includes a six month rent free period to be taken at the start of the lease, and
various motor vehicle lease agreements expiring within one to three years. The future minimum rentals payable under non-cancellable operating leases as at 30 June are as follows:
2013
2012
$000
$000
Leases payable
Not longer than 1 year
3 324
2 357
Longer than 1 year but not longer than 5 years*
6 305
7 042
9 629
9 399
* Excludes any payments due on early surrender of lease.
LEASING ARRANGEMENTS – QTC AS LESSOR Operating leases
QTC has entered into operating leases as lessor under the whole of government lease facility which consists mainly of buses and ferries. These non-cancellable leases have remaining terms of between 1 and 10 years.
Future minimum rentals receivable under non-cancellable operating leases as at
30 June are as follows:
2013
2012
$000
$000
Leases receivable
Not longer than 1 year
51 923
46 859
Longer than 1 year but not longer than 5 years
166 340
168 245
Longer than 5 years
34 829
44 800
253 092
259 904
Finance lease
QTC entered into a financial arrangement with a client comprising a headlease and sublease. Under the headlease, QTC made an upfront payment for the rights and limited obligations to a parcel of land for a term of 25 years ending
25 June 2034. Under the sublease, QTC acts as lessor and receives payments over the term.
Finance charges include interest and fees associated with the lease.
The lease is non-cancellable. Details of the minimum rental receivable under the finance lease are as follows:
2013
2012
$000
$000
Lease receivable
Not longer than 1 year
3 242
3 132
Longer than 1 year but not longer than 5 years
14 141
13 663
Longer than 5 years
80 737
84 456
98 120
101 251
Less amounts representing finance charges (1)
(52 405)
(55 734)
45 715
45 517
The present values of finance lease receivables are as follows:
2013
2012
$000
$000
Lease receivable
Not longer than 1 year (1)
(98)
(196)
Longer than 1 year but not longer than 5 years
828
312
Longer than 5 years
44 985
45 401
45 715
45 517
(1) A component of interest is capitalised until 30 June 2014.
ANNUAL REPORT 2012–13 QUEENSLAND TREASURY CORPORATION 51
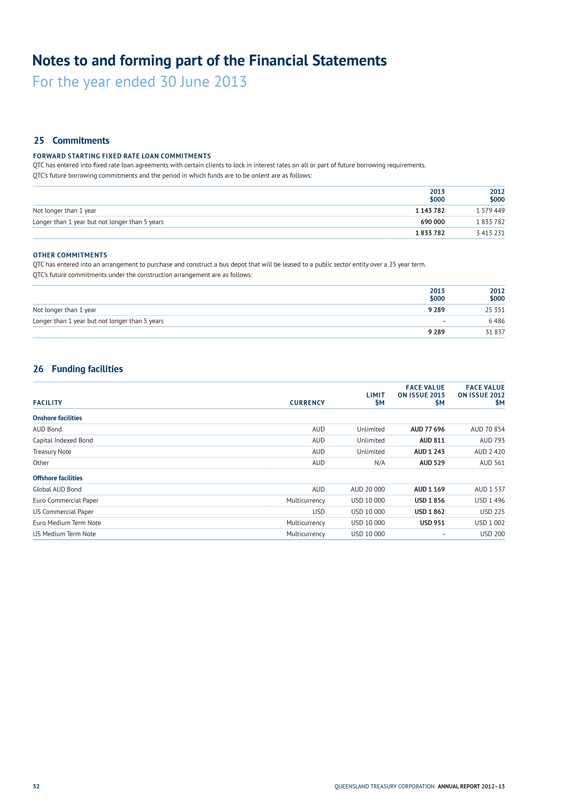
Notes to and forming part of the Financial Statements
For the year ended 30 June 2013
25 Commitments
FORWARD STARTING FIXED RATE LOAN COMMITMENTS
QTC has entered into fixed rate loan agreements with certain clients to lock in interest rates on all or part of future borrowing requirements.
QTC’s future borrowing commitments and the period in which funds are to be onlent are as follows:
2013
2012
$000
$000
Not longer than 1 year
1 143 782
1 579 449
Longer than 1 year but not longer than 5 years
690 000
1 833 782
1 833 782
3 413 231
OTHER COMMITMENTS
QTC has entered into an arrangement to purchase and construct a bus depot that will be leased to a public sector entity over a 25 year term.
QTC’s future commitments under the construction arrangement are as follows:
2013
2012
$000
$000
Not longer than 1 year
9 289
25 351
Longer than 1 year but not longer than 5 years
-
6 486
9 289
31 837
26 Funding facilities
FACILITY
CURRENCY
LIMIT $M
FACE VALUE ON ISSUE 2013 $M
FACE VALUE ON ISSUE 2012 $M
Onshore facilities
AUD Bond
AUD
Unlimited
AUD 77 696
AUD 70 854
Capital Indexed Bond
AUD
Unlimited
AUD 811
AUD 793
Treasury Note
AUD
Unlimited
AUD 1 243
AUD 2 420
Other
AUD
N/A
AUD 529
AUD 561
Offshore facilities
Global AUD Bond
AUD
AUD 20 000
AUD 1 169
AUD 1 537
Euro Commercial Paper
Multicurrency
USD 10 000
USD 1 856
USD 1 496
US Commercial Paper
USD
USD 10 000
USD 1 862
USD 225
Euro Medium Term Note
Multicurrency
USD 10 000
USD 951
USD 1 002
US Medium Term Note
Multicurrency
USD 10 000
-
USD 200
52 QUEENSLAND TREASURY CORPORATION ANNUAL REPORT 2012–13
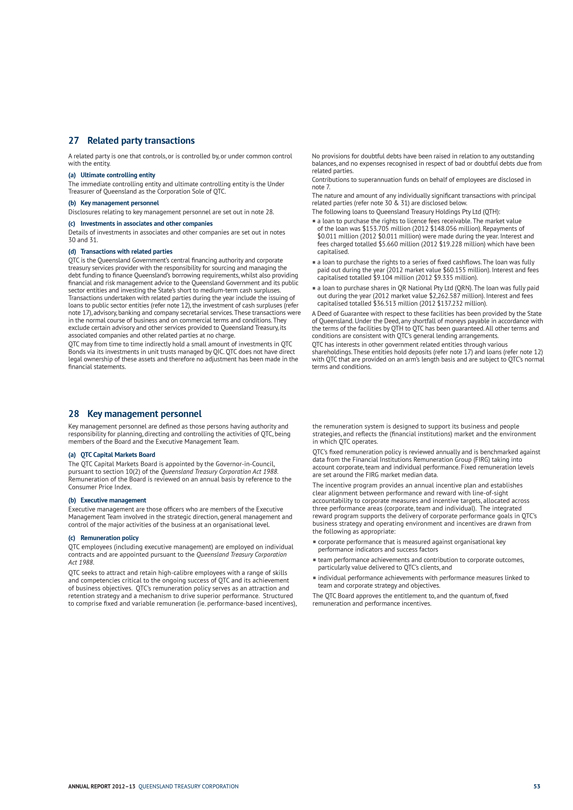
27 Related party transactions
A related party is one that controls, or is controlled by, or under common control with the entity.
(a) Ultimate controlling entity
The immediate controlling entity and ultimate controlling entity is the Under Treasurer of Queensland as the Corporation Sole of QTC.
(b) Key management personnel
Disclosures relating to key management personnel are set out in note 28.
(c) Investments in associates and other companies
Details of investments in associates and other companies are set out in notes 30 and 31.
(d) Transactions with related parties
QTC is the Queensland Government’s central financing authority and corporate treasury services provider with the responsibility for sourcing and managing the debt funding to finance Queensland’s borrowing requirements, whilst also providing financial and risk management advice to the Queensland Government and its public sector entities and investing the State’s short to medium-term cash surpluses. Transactions undertaken with related parties during the year include the issuing of loans to public sector entities (refer note 12), the investment of cash surpluses (refer note 17), advisory, banking and company secretarial services. These transactions were in the normal course of business and on commercial terms and conditions. They exclude certain advisory and other services provided to Queensland Treasury, its associated companies and other related parties at no charge.
QTC may from time to time indirectly hold a small amount of investments in QTC Bonds via its investments in unit trusts managed by QIC. QTC does not have direct legal ownership of these assets and therefore no adjustment has been made in the financial statements.
No provisions for doubtful debts have been raised in relation to any outstanding balances, and no expenses recognised in respect of bad or doubtful debts due from related parties.
Contributions to superannuation funds on behalf of employees are disclosed in note 7.
The nature and amount of any individually significant transactions with principal related parties (refer note 30 & 31) are disclosed below.
The following loans to Queensland Treasury Holdings Pty Ltd (QTH):
n a loan to purchase the rights to licence fees receivable. The market value of the loan was $153.705 million (2012 $148.056 million). Repayments of $0.011 million (2012 $0.011 million) were made during the year. Interest and fees charged totalled $5.660 million (2012 $19.228 million) which have been capitalised.
n a loan to purchase the rights to a series of fixed cashflows. The loan was fully paid out during the year (2012 market value $60.155 million). Interest and fees capitalised totalled $9.104 million (2012 $9.335 million).
n a loan to purchase shares in QR National Pty Ltd (QRN). The loan was fully paid out during the year (2012 market value $2,262.587 million). Interest and fees capitalised totalled $36.513 million (2012 $137.232 million).
A Deed of Guarantee with respect to these facilities has been provided by the State of Queensland. Under the Deed, any shortfall of moneys payable in accordance with the terms of the facilities by QTH to QTC has been guaranteed. All other terms and conditions are consistent with QTC’s general lending arrangements.
QTC has interests in other government related entities through various shareholdings. These entities hold deposits (refer note 17) and loans (refer note 12) with QTC that are provided on an arm’s length basis and are subject to QTC’s normal terms and conditions.
28 Key management personnel
Key management personnel are defined as those persons having authority and responsibility for planning, directing and controlling the activities of QTC, being members of the Board and the Executive Management Team.
(a) QTC Capital Markets Board
The QTC Capital Markets Board is appointed by the Governor-in-Council, pursuant to section 10(2) of the Queensland Treasury Corporation Act 1988. Remuneration of the Board is reviewed on an annual basis by reference to the Consumer Price Index.
(b) Executive management
Executive management are those officers who are members of the Executive
Management Team involved in the strategic direction, general management and control of the major activities of the business at an organisational level.
(c) Remuneration policy
QTC employees (including executive management) are employed on individual contracts and are appointed pursuant to the Queensland Treasury Corporation Act 1988.
QTC seeks to attract and retain high-calibre employees with a range of skills and competencies critical to the ongoing success of QTC and its achievement of business objectives. QTC’s remuneration policy serves as an attraction and retention strategy and a mechanism to drive superior performance. Structured to comprise fixed and variable remuneration (ie. performance-based incentives), the remuneration system is designed to support its business and people strategies, and reflects the (financial institutions) market and the environment in which QTC operates.
QTC’s fixed remuneration policy is reviewed annually and is benchmarked against data from the Financial Institutions Remuneration Group (FIRG) taking into account corporate, team and individual performance. Fixed remuneration levels are set around the FIRG market median data.
The incentive program provides an annual incentive plan and establishes clear alignment between performance and reward with line-of-sight accountability to corporate measures and incentive targets, allocated across three performance areas (corporate, team and individual). The integrated reward program supports the delivery of corporate performance goals in QTC’s business strategy and operating environment and incentives are drawn from the following as appropriate:
n corporate performance that is measured against organisational key performance indicators and success factors
n team performance achievements and contribution to corporate outcomes, particularly value delivered to QTC’s clients, and
n individual performance achievements with performance measures linked to team and corporate strategy and objectives.
The QTC Board approves the entitlement to, and the quantum of, fixed remuneration and performance incentives.
ANNUAL REPORT 2012–13 QUEENSLAND TREASURY CORPORATION
53
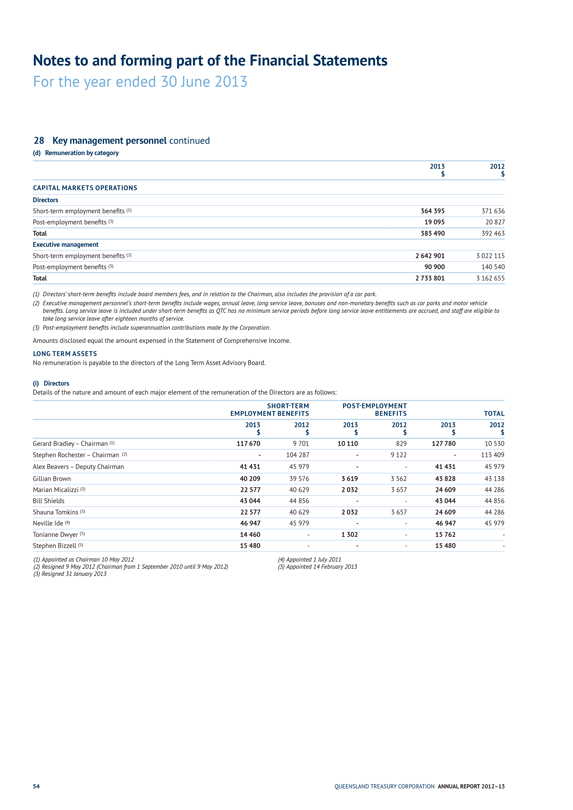
Notes to and forming part of the Financial Statements
For the year ended 30 June 2013
28 Key management personnel continued
(d) Remuneration by category
2013 $ 2012 $
CAPITAL MARKETS OPERATIONS
Directors
Short-term employment benefits (1) 364 395 371 636
Post-employment benefits (3) 19 095 20 827
Total 383 490 392 463
Executive management
Short-term employment benefits (2) 2 642 901 3 022 115
Post-employment benefits (3) 90 900 140 540
Total 2 733 801 3 162 655
(1) Directors’ short-term benefits include board members fees, and in relation to the Chairman, also includes the provision of a car park.
(2) Executive management personnel’s short-term benefits include wages, annual leave, long service leave, bonuses and non-monetary benefits such as car parks and motor vehicle benefits. Long service leave is included under short-term benefits as QTC has no minimum service periods before long service leave entitlements are accrued, and staff are eligible to take long service leave after eighteen months of service.
(3) Post-employment benefits include superannuation contributions made by the Corporation.
Amounts disclosed equal the amount expensed in the Statement of Comprehensive Income.
LONG TERM ASSETS
No remuneration is payable to the directors of the Long Term Asset Advisory Board.
(i) Directors
Details of the nature and amount of each major element of the remuneration of the Directors are as follows:
SHORT-TERM EMPLOYMENT BENEFITS POST-EMPLOYMENT BENEFITS TOTAL
2013 $ 2012 $ 2013 $ 2012 $ 2013 $ 2012 $
Gerard Bradley – Chairman (1) 117 670 9 701 10 110 829 127 780 10 530
Stephen Rochester – Chairman (2) — 104 287 — 9 122 — 113 409
Alex Beavers – Deputy Chairman 41 431 45 979 — — 41 431 45 979
Gillian Brown 40 209 39 576 3 619 3 562 43 828 43 138
Marian Micalizzi (3) 22 577 40 629 2 032 3 657 24 609 44 286
Bill Shields 43 044 44 856 — — 43 044 44 856
Shauna Tomkins (3) 22 577 40 629 2 032 3 657 24 609 44 286
Neville Ide (4) 46 947 45 979 — — 46 947 45 979
Tonianne Dwyer (5) 14 460 — 1 302 — 15 762 —
Stephen Bizzell (5) 15 480 — — — 15 480 —
(1) Appointed as Chairman 10 May 2012
(2) Resigned 9 May 2012 (Chairman from 1 September 2010 until 9 May 2012)
(3) Resigned 31 January 2013
(4) Appointed 1 July 2011
(5) Appointed 14 February 2013
54 QUEENSLAND TREASURY CORPORATION ANNUAL REPORT 2012–13
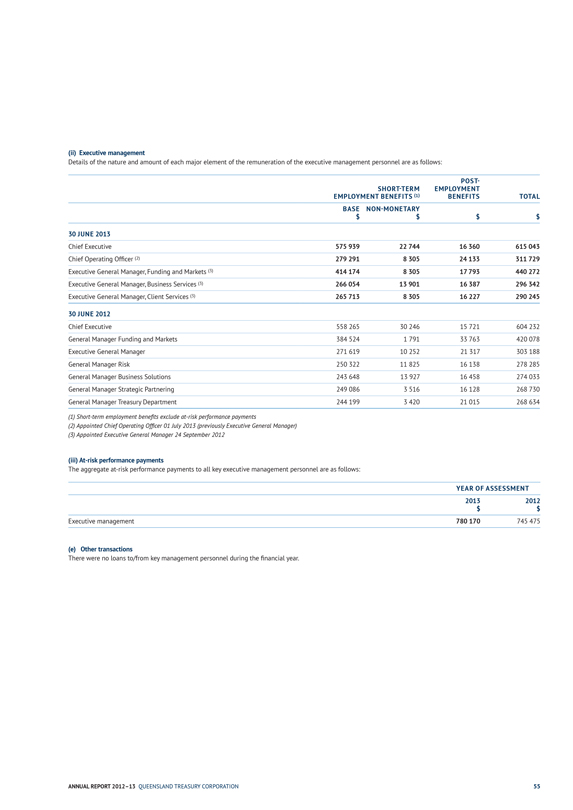
(ii) Executive management
Details of the nature and amount of each major element of the remuneration of the executive management personnel are as follows:
SHORT-TERM EMPLOYMENT BENEFITS (1) POST- EMPLOYMENT BENEFITS TOTAL
BASE $ NON-MONETARY $ $ $
30 JUNE 2013
Chief Executive 575 939 22 744 16 360 615 043
Chief Operating Officer (2) 279 291 8 305 24 133 311 729
Executive General Manager, Funding and Markets (3) 414 174 8 305 17 793 440 272
Executive General Manager, Business Services (3) 266 054 13 901 16 387 296 342
Executive General Manager, Client Services (3) 265 713 8 305 16 227 290 245
30 JUNE 2012
Chief Executive 558 265 30 246 15 721 604 232
General Manager Funding and Markets 384 524 1 791 33 763 420 078
Executive General Manager 271 619 10 252 21 317 303 188
General Manager Risk 250 322 11 825 16 138 278 285
General Manager Business Solutions 243 648 13 927 16 458 274 033
General Manager Strategic Partnering 249 086 3 516 16 128 268 730
General Manager Treasury Department 244 199 3 420 21 015 268 634
(1) Short-term employment benefits exclude at-risk performance payments (2) Appointed Chief Operating Officer 01 July 2013 (previously Executive General Manager)
(3) Appointed Executive General Manager 24 September 2012
(iii) At-risk performance payments
The aggregate at-risk performance payments to all key executive management personnel are as follows:
YEAR OF ASSESSMENT
2013 $ 2012 $
Executive management 780 170 745 475
(e) Other transactions
There were no loans to/from key management personnel during the financial year.
ANNUAL REPORT 2012–13 QUEENSLAND TREASURY CORPORATION 55
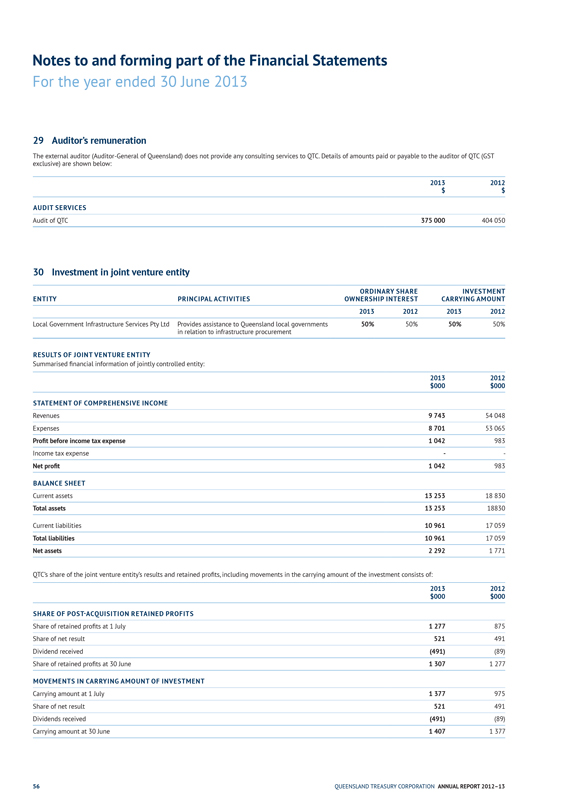
Notes to and forming part of the Financial Statements
For the year ended 30 June 2013
29 Auditor’s remuneration
The external auditor (Auditor-General of Queensland) does not provide any consulting services to QTC. Details of amounts paid or payable to the auditor of QTC (GST exclusive) are shown below:
2013 $ 2012 $
AUDIT SERVICES
Audit of QTC 375 000 404 050
30 Investment in joint venture entity
ENTITY PRINCIPAL ACTIVITIES ORDINARY SHARE OWNERSHIP INTEREST INVESTMENT CARRYING AMOUNT
2013 2012 2013 2012
Local Government Infrastructure Services Pty Ltd Provides assistance to Queensland local governments in relation to infrastructure procurement 50% 50% 50% 50%
RESULTS OF JOINT VENTURE ENTITY
Summarised financial information of jointly controlled entity:
2013 $000 2012 $000
STATEMENT OF COMPREHENSIVE INCOME
Revenues 9 743 54 048
Expenses 8 701 53 065
Profit before income tax expense 1 042 983
Income tax expense — —
Net profit 1 042 983
BALANCE SHEET
Current assets 13 253 18 830
Total assets 13 253 18 830
Current liabilities 10 961 17 059
Total liabilities 10 961 17 059
Net assets 2 292 1 771
QTC’s share of the joint venture entity’s results and retained profits, including movements in the carrying amount of the investment consists of:
2013 $000 2012 $000
SHARE OF POST-ACQUISITION RETAINED PROFITS
Share of retained profits at 1 July 1 277 875
Share of net result 521 491
Dividend received (491) (89)
Share of retained profits at 30 June 1 307 1 277
MOVEMENTS IN CARRYING AMOUNT OF INVESTMENT
Carrying amount at 1 July 1 377 975
Share of net result 521 491
Dividends received (491) (89)
Carrying amount at 30 June 1 407 1 377
56 QUEENSLAND TREASURY CORPORATION ANNUAL REPORT 2012–13
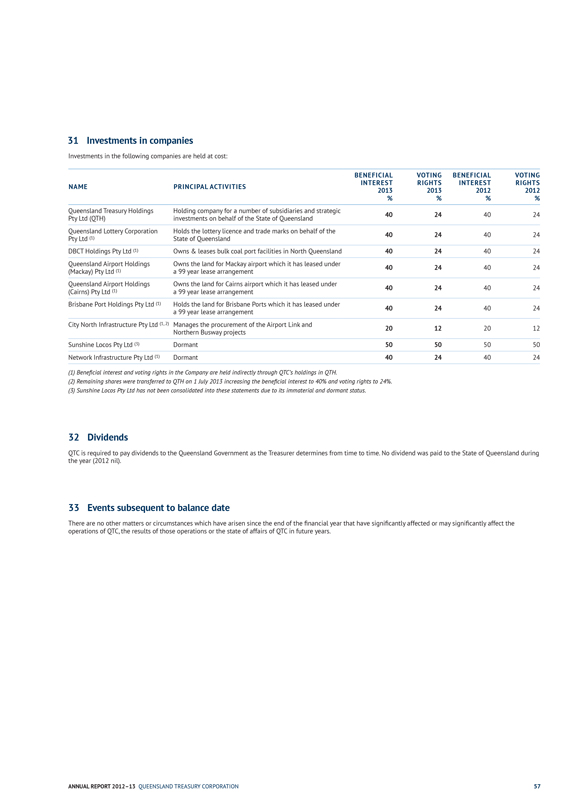
31 Investments in companies
Investments in the following companies are held at cost:
NAME PRINCIPAL ACTIVITIES BENEFICIAL INTEREST 2013 % VOTING RIGHTS 2013 % BENEFICIAL INTEREST 2012 % VOTING RIGHTS 2012 %
Queensland Treasury Holdings Pty Ltd (QTH) Holding company for a number of subsidiaries and strategic investments on behalf of the State of Queensland 40 24 40 24
Queensland Lottery Corporation Pty Ltd (1) Holds the lottery licence and trade marks on behalf of the State of Queensland 40 24 40 24
DBCT Holdings Pty Ltd (1) Owns & leases bulk coal port facilities in North Queensland 40 24 40 24
Queensland Airport Holdings (Mackay) Pty Ltd (1) Owns the land for Mackay airport which it has leased under a 99 year lease arrangement 40 24 40 24
Queensland Airport Holdings (Cairns) Pty Ltd (1) Owns the land for Cairns airport which it has leased under a 99 year lease arrangement 40 24 40 24
Brisbane Port Holdings Pty Ltd (1) Holds the land for Brisbane Ports which it has leased under a 99 year lease arrangement 40 24 40 24
City North Infrastructure Pty Ltd (1, 2) Manages the procurement of the Airport Link and Northern Busway projects 20 12 20 12
Sunshine Locos Pty Ltd (3) Dormant 50 50 50 50
Network Infrastructure Pty Ltd (1) Dormant 40 24 40 24
(1) Beneficial interest and voting rights in the Company are held indirectly through QTC’s holdings in QTH.
(2) Remaining shares were transferred to QTH on 1 July 2013 increasing the beneficial interest to 40% and voting rights to 24%.
(3) Sunshine Locos Pty Ltd has not been consolidated into these statements due to its immaterial and dormant status.
32 Dividends
QTC is required to pay dividends to the Queensland Government as the Treasurer determines from time to time. No dividend was paid to the State of Queensland during the year (2012 nil).
33 Events subsequent to balance date
There are no other matters or circumstances which have arisen since the end of the financial year that have significantly affected or may significantly affect the operations of QTC, the results of those operations or the state of affairs of QTC in future years.
ANNUAL REPORT 2012–13 QUEENSLAND TREASURY CORPORATION 57
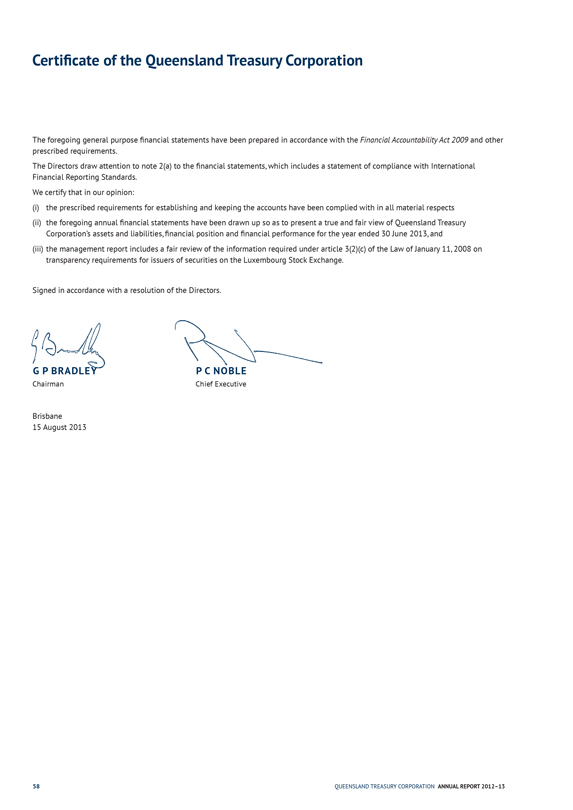
Certificate of the Queensland Treasury Corporation
The foregoing general purpose financial statements have been prepared in accordance with the Financial Accountability Act 2009 and other prescribed requirements.
The Directors draw attention to note 2(a) to the financial statements, which includes a statement of compliance with International
Financial Reporting Standards.
We certify that in our opinion:
(i) the prescribed requirements for establishing and keeping the accounts have been complied with in all material respects
(ii) the foregoing annual financial statements have been drawn up so as to present a true and fair view of Queensland Treasury Corporation’s assets and liabilities, financial position and financial performance for the year ended 30 June 2013, and
(iii) the management report includes a fair review of the information required under article 3(2)(c) of the Law of January 11, 2008 on transparency requirements for issuers of securities on the Luxembourg Stock Exchange.
Signed in accordance with a resolution of the Directors.
G P BRADLEY Chairman
P C NOBLE Chief Executive
Brisbane
15 August 2013
58 QUEENSLAND TREASURY CORPORATION ANNUAL REPORT 2012–13
Independent auditor’s report
To the Capital Markets Board of Queensland Treasury Corporation
Report on the Financial Report
I have audited the accompanying financial report of Queensland Treasury Corporation, which comprises the balance sheet as at 30 June 2013, the statement of comprehensive income, statement of changes in equity and statement of cash flows for the year then ended, notes comprising a summary of significant accounting policies and other explanatory information, and certificates given by the
Chairman and Chief Executive.
The Board’s Responsibility for the Financial Report
The Capital Markets Board (the Board), as delegated by the Corporation Sole, is responsible for the preparation of the financial report that gives a true and fair view in accordance with prescribed accounting requirements identified in the Financial Accountability Act 2009 and the Financial and Performance Management Standard 2009, including compliance with Australian Accounting Standards. The Board’s responsibility also includes such internal control as the Board determines is necessary to enable the preparation of the financial report that gives a true and fair view and is free from material misstatement, whether due to fraud or error. In Note 2(a), the Board also states, in accordance with Accounting Standard AASB 101 Presentation of Financial Statements, that the financial statements comply with International Financial Reporting Standards.
Auditor’s Responsibility
My responsibility is to express an opinion on the financial report based on the audit. The audit was conducted in accordance with the Auditor-General of Queensland Auditing Standards, which incorporate the Australian Auditing Standards. Those standards require compliance with relevant ethical requirements relating to audit engagements and that the audit is planned and performed to obtain reasonable assurance about whether the financial report is free from material misstatement.
An audit involves performing procedures to obtain audit evidence about the amounts and disclosures in the financial report. The procedures selected depend on the auditor’s judgement, including the assessment of the risks of material misstatement of the financial report, whether due to fraud or error. In making those risk assessments, the auditor considers internal control relevant to the entity’s preparation of the financial report that gives a true and fair view in order to design audit procedures that are appropriate in the circumstances, but not for the purpose of expressing an opinion on the effectiveness of the entity’s internal control, other than in expressing an opinion on compliance with prescribed requirements. An audit also includes evaluating the appropriateness of accounting policies used and the reasonableness of accounting estimates made by the Board, as well as evaluating the overall presentation of the financial report including any mandatory financial reporting requirements approved by the Treasurer for application in Queensland.
I believe that the audit evidence obtained is sufficient and appropriate to provide a basis for my audit opinion.
Independence
The Auditor-General Act 2009 promotes the independence of the Auditor General and all authorised auditors. The Auditor-General is the auditor of all Queensland public sector entities and can be removed only by Parliament.
The Auditor-General may conduct an audit in any way considered appropriate and is not subject to direction by any person about the way in which audit powers are to be exercised. The Auditor-General has for the purposes of conducting an audit, access to all documents and property and can report to Parliament matters which in the Auditor-General’s opinion are significant.
ANNUAL REPORT 2012–13 QUEENSLAND TREASURY CORPORATION 59
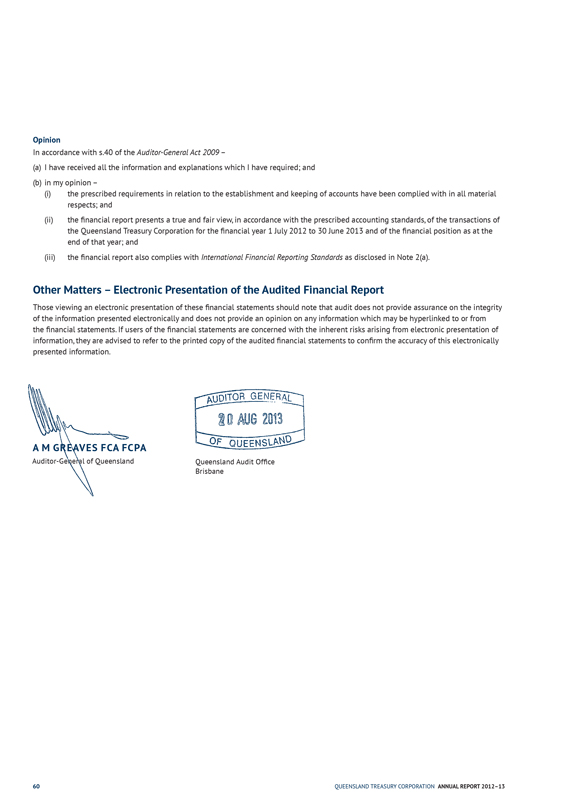
Opinion
In accordance with s.40 of the Auditor-General Act 2009 –
(a) I have received all the information and explanations which I have required; and (b) in my opinion –
(i) the prescribed requirements in relation to the establishment and keeping of accounts have been complied with in all material respects; and
(ii) the financial report presents a true and fair view, in accordance with the prescribed accounting standards, of the transactions of the Queensland Treasury Corporation for the financial year 1 July 2012 to 30 June 2013 and of the financial position as at the end of that year; and
(iii) the financial report also complies with International Financial Reporting Standards as disclosed in Note 2(a).
Other Matters – Electronic Presentation of the Audited Financial Report
Those viewing an electronic presentation of these financial statements should note that audit does not provide assurance on the integrity of the information presented electronically and does not provide an opinion on any information which may be hyperlinked to or from the financial statements. If users of the financial statements are concerned with the inherent risks arising from electronic presentation of information, they are advised to refer to the printed copy of the audited financial statements to confirm the accuracy of this electronically presented information.
A M GREAVES FCA FCPA Auditor-General of Queensland
AUDITOR GENERAL
20 AUG 2013
OF QUEENSLAND
Queensland Audit Office Brisbane
60 QUEENSLAND TREASURY CORPORATION ANNUAL REPORT 2012–13
Management report for the year ended 30 June 2013
Review of Operations
QTC made an operating profit after tax for the year ended 30 June 2013 of AUD1,213.2 million consisting of the following operating segment results:
n Capital Markets Operations
During the period from 1 July 2012 to 30 June 2013, QTC continued in its ordinary course of business as the State of Queensland’s central financing authority and corporate treasury services provider. The operating profit after tax for the year ended 30 June 2013 for the Capital
Markets Operations segment was AUD222.9 million.
n Long Term Assets
QTC holds a portfolio of assets which were transferred to QTC by the State Government under an administrative arrangement. These assets are the investments of QTC’s Long Term Assets segment and were accumulated to fund superannuation and other long-term obligations of the State such as insurance and long service leave. In return, QTC issued to the State fixed rate notes which has resulted in the State receiving a fixed rate of return on the notes, while QTC bears the impact of fluctuations in the value and returns on the asset portfolio.
The operating profit after tax for the Long Term Assets segment was AUD990.3 million. The accumulated net losses incurred by the Long Term Assets segment to date have no impact on QTC’s capacity to meet its obligations as there is no cash flow effect for QTC. In addition, under the Queensland Treasury Corporation Act 1988, any losses of the Corporation shall be the responsibility of the Consolidated Fund of the Queensland Government.
Principal risks and uncertainties
Financial market conditions improved over the course of 2012-13. Some uncertainty still exists in global financial markets, particularly in relation to US monetary policy and the performance of the Chinese economy which is not expected to impact on QTC’s performance or its ability to fund the State’s borrowing requirement in 2013-14.
G P BRADLEY Chairman
P C NOBLE Chief Executive
Brisbane
15 August 2013
ANNUAL REPORT 2012–13 QUEENSLAND TREASURY CORPORATION 61

62 QUEENSLAND TREASURY CORPORATION ANNUAL REPORT 2012–13
APPENDICES
CONTENTS
Appendix A 64
Appendix B 68
Appendix C 69
Appendix D 70
AUDAX AT FIDELIS
QUEENSLAND TREASURY CORPORATION
CELEBRATING 25YEARS EST. 1988
63
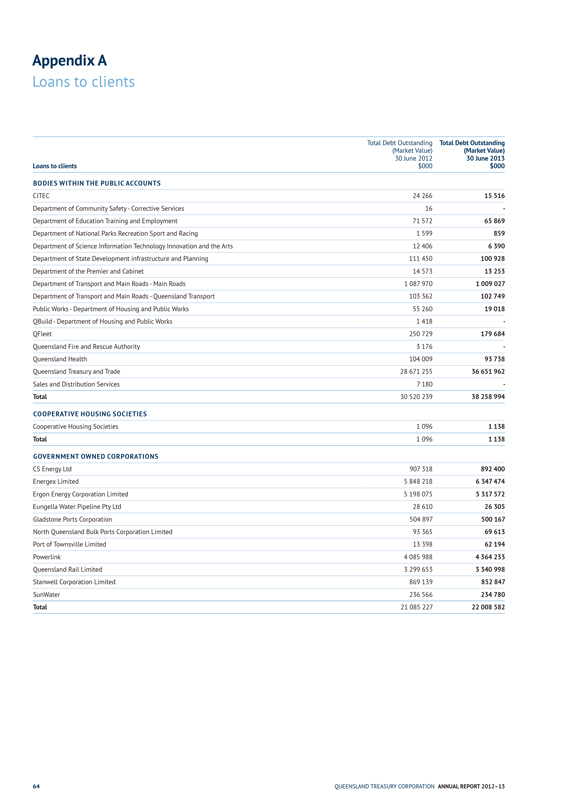
Appendix A
Loans to clients
Loans to clients
Total Debt Outstanding (Market Value) 30 June 2012 $000 Total Debt Outstanding (Market Value) 30 June 2013 $000
BODIES WITHIN THE PUBLIC ACCOUNTS
CITEC 24 266 15 516
Department of Community Safety — Corrective Services 16 —
Department of Education Training and Employment 71 572 65 869
Department of National Parks Recreation Sport and Racing 1 599 859
Department of Science Information Technology Innovation and the Arts 12 406 6 390
Department of State Development infrastructure and Planning 111 450 100 928
Department of the Premier and Cabinet 14 573 13 253
Department of Transport and Main Roads — Main Roads 1 087 970 1 009 027
Department of Transport and Main Roads — Queensland Transport 103 362 102 749
Public Works — Department of Housing and Public Works 55 260 19 018
QBuild — Department of Housing and Public Works 1 418 —
QFleet 250 729 179 684
Queensland Fire and Rescue Authority 3 176 —
Queensland Health 104 009 93 738
Queensland Treasury and Trade 28 671 255 36 651 962
Sales and Distribution Services 7 180 —
Total 30 520 239 38 258 994
COOPERATIVE HOUSING SOCIETIES
Cooperative Housing Societies 1 096 1 138
Total 1 096 1 138
GOVERNMENT OWNED CORPORATIONS
CS Energy Ltd 907 318 892 400
Energex Limited 5 848 218 6 347 474
Ergon Energy Corporation Limited 5 198 075 5 317 572
Eungella Water Pipeline Pty Ltd 28 610 26 305
Gladstone Ports Corporation 504 897 500 167
North Queensland Bulk Ports Corporation Limited 93 365 69 613
Port of Townsville Limited 13 398 62 194
Powerlink 4 085 988 4 364 233
Queensland Rail Limited 3 299 653 3 340 998
Stanwell Corporation Limited 869 139 852 847
SunWater 236 566 234 780
Total 21 085 227 22 008 582
64 QUEENSLAND TREASURY CORPORATION ANNUAL REPORT 2012–13
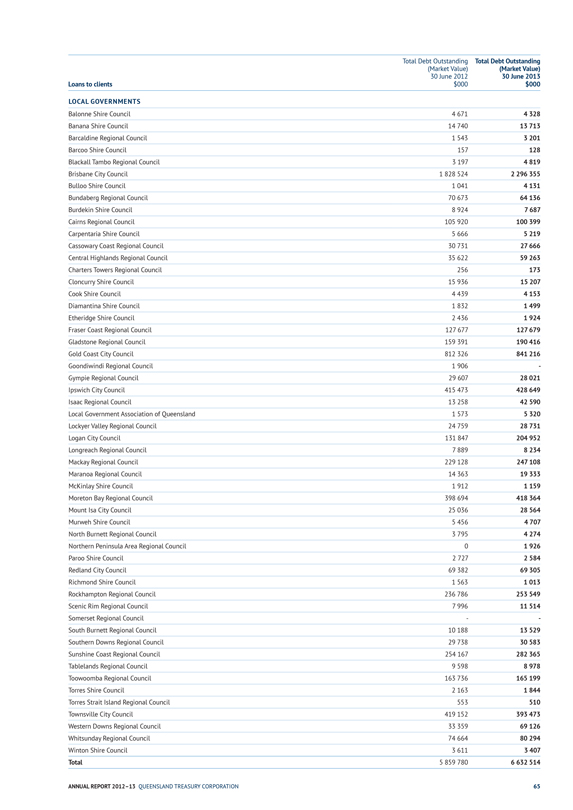
Loans to clients Total Debt Outstanding (Market Value) 30 June 2012 $000 Total Debt Outstanding (Market Value) 30 June 2013 $000
LOCAL GOVERNMENTS
Balonne Shire Council 4 671 4 328
Banana Shire Council 14 740 13 713
Barcaldine Regional Council 1 543 3 201
Barcoo Shire Council 157 128
Blackall Tambo Regional Council 3 197 4 819
Brisbane City Council 1 828 524 2 296 355
Bulloo Shire Council 1 041 4 131
Bundaberg Regional Council 70 673 64 136
Burdekin Shire Council 8 924 7 687
Cairns Regional Council 105 920 100 399
Carpentaria Shire Council 5 666 5 219
Cassowary Coast Regional Council 30 731 27 666
Central Highlands Regional Council 35 622 59 263
Charters Towers Regional Council 256 173
Cloncurry Shire Council 15 936 15 207
Cook Shire Council 4 439 4 153
Diamantina Shire Council 1 832 1 499
Etheridge Shire Council 2 436 1 924
Fraser Coast Regional Council 127 677 127 679
Gladstone Regional Council 159 391 190 416
Gold Coast City Council 812 326 841 216
Goondiwindi Regional Council 1 906 —
Gympie Regional Council 29 607 28 021
Ipswich City Council 415 473 428 649
Isaac Regional Council 13 258 42 590
Local Government Association of Queensland 1 573 5 320
Lockyer Valley Regional Council 24 759 28 731
Logan City Council 131 847 204 952
Longreach Regional Council 7 889 8 234
Mackay Regional Council 229 128 247 108
Maranoa Regional Council 14 363 19 333
McKinlay Shire Council 1 912 1 159
Moreton Bay Regional Council 398 694 418 364
Mount Isa City Council 25 036 28 564
Murweh Shire Council 5 456 4 707
North Burnett Regional Council 3 795 4 274
Northern Peninsula Area Regional Council 0 1 926
Paroo Shire Council 2 727 2 584
Redland City Council 69 382 69 305
Richmond Shire Council 1 563 1 013
Rockhampton Regional Council 236 786 253 549
Scenic Rim Regional Council 7 996 11 514
Somerset Regional Council — —
South Burnett Regional Council 10 188 13 529
Southern Downs Regional Council 29 738 30 583
Sunshine Coast Regional Council 254 167 282 365
Tablelands Regional Council 9 598 8 978
Toowoomba Regional Council 163 736 165 199
Torres Shire Council 2 163 1 844
Torres Strait Island Regional Council 553 510
Townsville City Council 419 152 393 473
Western Downs Regional Council 33 359 69 126
Whitsunday Regional Council 74 664 80 294
Winton Shire Council 3 611 3 407
Total 5 859 780 6 632 514
ANNUAL REPORT 2012–13 QUEENSLAND TREASURY CORPORATION 65
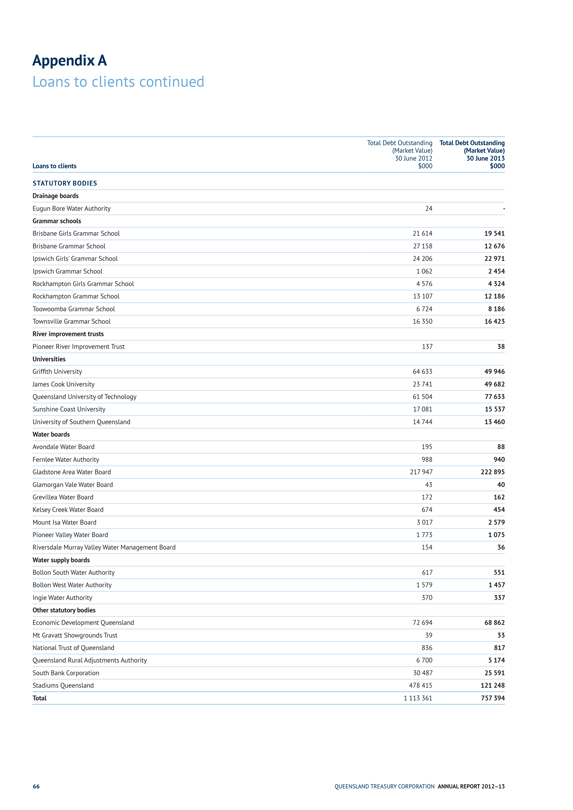
Appendix A
Loans to clients continued
Total Debt Outstanding Total Debt Outstanding
(Market Value) (Market Value)
30 June 2012 30 June 2013
Loans to clients $000 $000
STATUTORY BODIES
Drainage boards
Eugun Bore Water Authority 24 —
Grammar schools
Brisbane Girls Grammar School 21 614 19 541
Brisbane Grammar School 27 158 12 676
Ipswich Girls’ Grammar School 24 206 22 971
Ipswich Grammar School 1 062 2 454
Rockhampton Girls Grammar School 4 576 4 324
Rockhampton Grammar School 13 107 12 186
Toowoomba Grammar School 6 724 8 186
Townsville Grammar School 16 350 16 423
River improvement trusts
Pioneer River Improvement Trust 137 38
Universities
Griffith University 64 633 49 946
James Cook University 23 741 49 682
Queensland University of Technology 61 504 77 633
Sunshine Coast University 17 081 15 537
University of Southern Queensland 14 744 13 460
Water boards
Avondale Water Board 195 88
Fernlee Water Authority 988 940
Gladstone Area Water Board 217 947 222 895
Glamorgan Vale Water Board 43 40
Grevillea Water Board 172 162
Kelsey Creek Water Board 674 454
Mount Isa Water Board 3 017 2 579
Pioneer Valley Water Board 1 773 1 075
Riversdale Murray Valley Water Management Board 154 36
Water supply boards
Bollon South Water Authority 617 551
Bollon West Water Authority 1 579 1 457
Ingie Water Authority 370 337
Other statutory bodies
Economic Development Queensland 72 694 68 862
Mt Gravatt Showgrounds Trust 39 33
National Trust of Queensland 836 817
Queensland Rural Adjustments Authority 6 700 5 174
South Bank Corporation 30 487 25 591
Stadiums Queensland 478 415 121 248
Total 1 113 361 757 394
66 QUEENSLAND TREASURY CORPORATION ANNUAL REPORT 2012–13
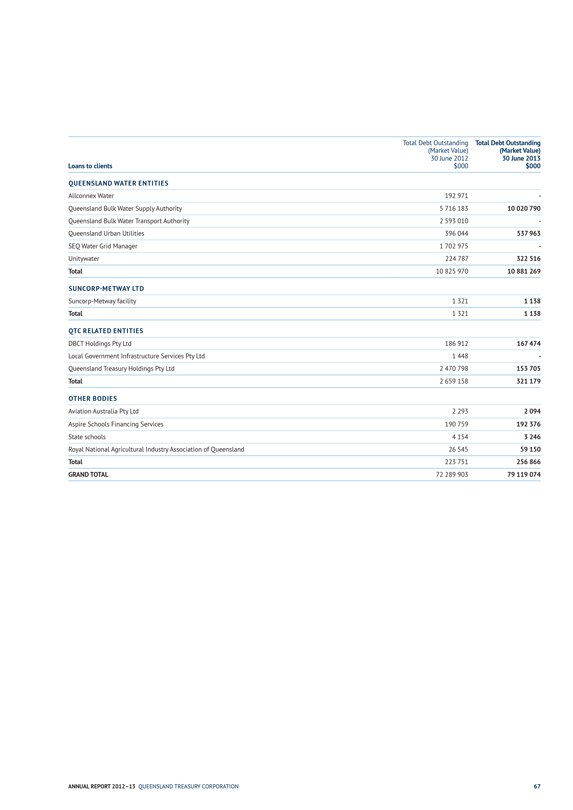
Total Debt Outstanding
Total Debt Outstanding
(Market Value)
(Market Value)
30 June 2012
30 June 2013
Loans to clients
$000
$000
QUEENSLAND WATER ENTITIES
Allconnex Water
192 971
—
Queensland Bulk Water Supply Authority
5 716 183
10 020 790
Queensland Bulk Water Transport Authority
2 593 010
—
Queensland Urban Utilities
396 044
537 963
SEQ Water Grid Manager
1 702 975
—
Unitywater
224 787
322 516
Total
10 825 970
10 881 269
SUNCORP-METWAY LTD
Suncorp-Metway facility
1 321
1 138
Total
1 321
1 138
QTC RELATED ENTITIES
DBCT Holdings Pty Ltd
186 912
167 474
Local Government Infrastructure Services Pty Ltd
1 448
—
Queensland Treasury Holdings Pty Ltd
2 470 798
153 705
Total
2 659 158
321 179
OTHER BODIES
Aviation Australia Pty Ltd
2 293
2 094
Aspire Schools Financing Services
190 759
192 376
State schools
4 154
3 246
Royal National Agricultural Industry Association of Queensland
26 545
59 150
Total
223 751
256 866
GRAND TOTAL
72 289 903
79 119 074
ANNUAL REPORT 2012–13 QUEENSLAND TREASURY CORPORATION 67
Appendix B
Statutory and mandatory disclosures
QTC is required to make various disclosures in its Annual Report. QTC is also required to make various disclosures on the Queensland Government’s Open Data website (qld.gov.au/data) in lieu of inclusion in its Annual Report. This Appendix sets out those mandatory disclosure statements that are not included elsewhere in the report or made available on the Open Data website.
Information systems and record keeping
During the year, QTC continued its compliance with the provisions of the Public Records Act 2002, and its implementation of the
Information Standard 40: Recordkeeping and Information Standard 31: Retention and Disposal of Public Records.
QTC is currently working with State Archives to draft a QTC-specific
Local Retention and Disposal Schedule.
During the year, QTC’s record keeping systems and capabilities largely continued unchanged. However, QTC has begun preliminary steps to investigate the procurement and implementation of an electronic document management system. It is expected that implementation will be some time away as a timeframe has yet to be developed given other important organisation projects.
Public Sector Ethics Act
QTC provides the following information pursuant to obligations under section 23 of the Public Sector Ethics Act 1994 (Qld) to report on action taken to comply with certain sections of the Act.
QTC employees are required to comply with QTC’s Code of Conduct for employees, which aligns with the ethics principles and values in the Public Sector Ethics Act 1994, as well as the Code of Ethics and Code of Conduct established by the Australian Financial Markets Association of which QTC is a member. Both codes are available to employees via QTC’s intranet. Copies of these codes can be inspected by contacting QTC’s Human Resources Group (see Appendix D for contact details). Appropriate education and training about the code of conduct has been provided to QTC staff.
QTC’s corporate governance policies and practices ensure that QTC:
n acts ethically, within appropriate law, policy and convention, and
n addresses the systems and processes necessary for the proper direction and management of its business and affairs.
QTC is committed to:
n observing high standards of integrity and fair-dealing in the conduct of its business, and
n acting with due care, diligence and skill.
QTC’s Compliance Policy requires that QTC and all employees comply with the letter and the spirit of all relevant laws and regulations, industry standards, and relevant government policies, as well as QTC’s own policies and procedures.
Remuneration: Board and Committee
For the year ending 30 June 2013, the remuneration and committee fees of the QTC Capital Market Board members were as follows:
| | | | | | |
BOARD | | | | COMMITTEE | | |
Chairperson | | $100,527 | | Chairperson | | $6,658 |
Member | | $33,551 | | Member | | $5,152 |
The total remuneration payments made to the members of the QTC Capital Market Board was $383, 490 and the total on-costs (including travel, accommodation, and hiring of motor vehicles for the members) was $56, 494.
No payments in relation to remuneration or on-costs (including travel, accommodation, and hiring of motor vehicles for the members) were made to members of the Long Term Asset Advisory Board in the year ending 30 June 2013.
Related entities
The related entities in Note 31 (except Sunshine Locos Pty Ltd) are consolidated into Queensland Treasury’s financial report.
68 QUEENSLAND TREASURY CORPORATION ANNUAL REPORT 2012–13
Appendix C
Glossary
Australian Government Guarantee (AGG): Also known as the
Commonwealth Government Guarantee. In response to the global financial crisis, on 25 March 2009, the Australian Government provided a time-limited, voluntary guarantee over existing and new Australian state and territory government borrowing. On 16 June 2009, the Queensland Government took up the guarantee on all existing QTC AUD denominated benchmark bond lines (global and domestic) with a maturity date of between 12 months and 180 months (1-15 years). The RBA approved QTC’s application on 11 December 2009. The AGG was withdrawn for new borrowings after 31 December 2010.
Basis point: One hundredth of one per cent (0.01%).
Bond: A financial instrument where the borrower agrees to pay the investor a rate of interest for a fixed period of time. A typical bond will involve regular interest payments and a return of principal at maturity.
Commonwealth Government Guarantee (CGG): See Australian
Government Guarantee above.
CP (commercial paper): A short-term money market instrument issued at a discount with the full face value repaid at maturity. CP can be issued in various currencies with a term to maturity of less than one year.
Credit rating: Measures a borrower’s creditworthiness and provides an international framework for comparing the credit quality of issuers and rated debt securities. Rating agencies allocate three kinds of ratings: issuer credit ratings, long-term debt and short-term debt. Issuer credit ratings are among the most widely watched. They measure the creditworthiness of the borrower including its capacity and willingness to meet financial obligations. QTC has a strong rating from two rating agencies—Standard & Poor’s, and Moody’s.
Distribution group: A group of financial intermediaries who market and make prices in QTC’s debt instruments.
GOC: Government-owned corporation.
Issue price: The price at which a new security is issued in the primary market.
Liquid: Markets or instruments are described as being liquid, and having depth, if there are enough buyers and sellers to absorb sudden shifts in supply and demand without price distortions. Market value: The price at which an instrument can be purchased or sold in the current market.
MTN (Medium-Term Note): A financial debt instrument that can be structured to meet an investor’s requirements in regards to interest rate basis, currency and maturity. MTNs usually have maturities between 9 months and 30 years.
QTC: Queensland Treasury Corporation. RBA: Reserve Bank of Australia.
T-Note (Treasury Note): A short-term money market instrument issued at a discount with the full face value repaid at maturity. T-Notes are issued in Australian dollars with a term to maturity of less than 1 year.
ANNUAL REPORT 2012–13 QUEENSLAND TREASURY CORPORATION 69
Appendix D
Contacts
QUEENSLAND TREASURY CORPORATION
Level 6, 123 Albert Street Brisbane Queensland Australia GPO Box 1096 Brisbane Queensland Australia 4001 Telephone: +61 7 3842 4600 Facsimile: +61 7 3221 4122 Email: enquiry@qtc.com.au Internet: www.qtc.com.au
Queensland Treasury Corporation’s annual and half-yearly reports (ISSN 1837-1256 print; ISSN 1837-1264 online) are available on QTC’s website at www.qtc.com.au/qtc/public/annual-reports. If you would like a copy of a report posted to you, please call QTC’s Communication and Marketing Group on +61 7 3842 4714.
If you would like to comment on a report, please complete the online enquiry form located on our website.
Telephone
EXECUTIVE
+61 7 3842 4611
BUSINESS SERVICES DIVISION
Human Resources Group
+61 7 3842 4761
Risk Services Group
+61 7 3842 4704
CLIENT SERVICES DIVISION
Local Government & Statutory Bodies Group
+61 7 3842 4743
Strategic Partners Group
+61 7 3842 4901
Treasury & Departments Group
+61 7 3842 4798
CORPORATE SERVICES DIVISION
Client & Market Solutions Delivery
+61 7 3842 4644
Communication & Marketing Group
+61 73842 4714
Financial Solutions Group
+61 73842 4833
Operations Group
+61 73842 4877
FUNDING & MARKETS DIVISION
Funding & Liquidity Group
+61 7 3842 4789
Market Strategy & Risk Group
+61 7 3842 4789
STOCK REGISTRY (LINK MARKET SERVICES LTD)
1800 777 166
Interpreter
QTC is committed to providing accessible services to Queensland residents from culturally and linguistically diverse backgrounds. If you have difficulty understanding this report, please contact QTC’s Communication and Marketing Group on +61 7 3842 4714 and we will arrange for an interpreter to assist you.
70 QUEENSLAND TREASURY CORPORATION ANNUAL REPORT 2012–13
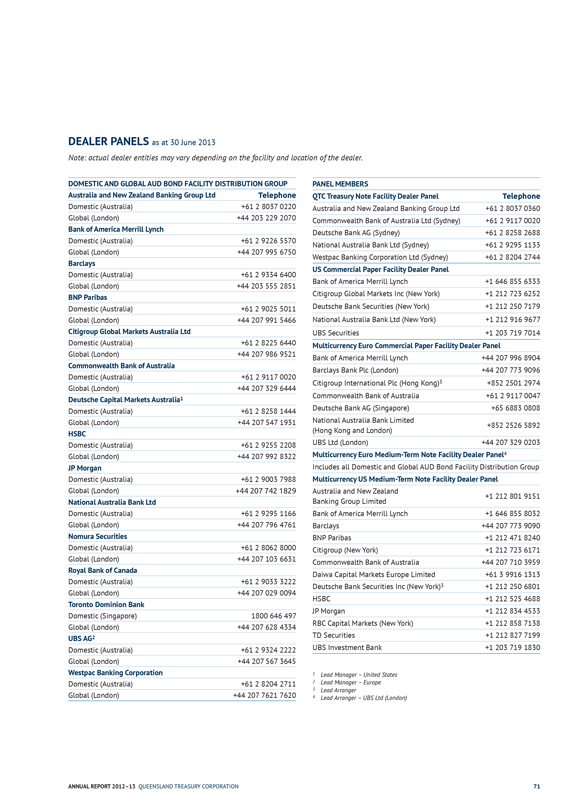
DEALER PANELS as at 30 June 2013
Note: actual dealer entities may vary depending on the facility and location of the dealer.
DOMESTIC AND GLOBAL AUD BOND FACILITY DISTRIBUTION GROUP
Australia and New Zealand Banking Group Ltd
Telephone Domestic (Australia) +61 2 8037 0220 Global (London) +44 203 229 2070
Bank of America Merrill Lynch Domestic (Australia) +61 2 9226 5570 Global (London) +44 207 995 6750
Barclays Domestic (Australia) +61 2 9334 6400 Global (London) +44 203 555 2851
BNP Paribas Domestic (Australia) +61 2 9025 5011 Global (London) +44 207 991 5466
Citigroup Global Markets Australia Ltd Domestic (Australia) +61 2 8225 6440 Global (London) +44 207 986 9521
Commonwealth Bank of Australia Domestic (Australia) +61 2 9117 0020 Global (London) +44 207 329 6444
Deutsche Capital Markets Australia1 Domestic (Australia) +61 2 8258 1444 Global (London) +44 207 547 1931
HSBC Domestic (Australia) +61 2 9255 2208 Global (London) +44 207 992 8322
JP Morgan Domestic (Australia) +61 2 9003 7988 Global (London) +44 207 742 1829
National Australia Bank Ltd Domestic (Australia) +61 2 9295 1166 Global (London) +44 207 796 4761
Nomura Securities Domestic (Australia) +61 2 8062 8000 Global (London) +44 207 103 6631
Royal Bank of Canada Domestic (Australia) +61 2 9033 3222 Global (London) +44 207 029 0094
Toronto Dominion Bank Domestic (Singapore) 1800 646 497 Global (London) +44 207 628 4334
UBS AG2 Domestic (Australia) +61 2 9324 2222 Global (London) +44 207 567 3645
Westpac Banking Corporation Domestic (Australia) +61 2 8204 2711 Global (London) +44 207 7621 7620
PANEL MEMBERS
QTC Treasury Note Facility Dealer Panel
Telephone
Australia and New Zealand Banking Group Ltd +61 2 8037 0360 Commonwealth Bank of Australia Ltd (Sydney) +61 2 9117 0020
Deutsche Bank AG (Sydney) +61 2 8258 2688 National Australia Bank Ltd (Sydney) +61 2 9295 1133 Westpac Banking Corporation Ltd (Sydney) +61 2 8204 2744
US Commercial Paper Facility Dealer Panel Bank of America Merrill Lynch +1 646 855 6333 Citigroup Global Markets Inc (New York) +1 212 723 6252 Deutsche Bank Securities (New York) +1 212 250 7179 National Australia Bank Ltd (New York) +1 212 916 9677 UBS Securities +1 203 719 7014
Multicurrency Euro Commercial Paper Facility Dealer Panel Bank of America Merrill Lynch +44 207 996 8904 Barclays Bank Plc (London) +44 207 773 9096 Citigroup International Plc (Hong Kong)3 +852 2501 2974 Commonwealth Bank of Australia +61 2 9117 0047 Deutsche Bank AG (Singapore) +65 6883 0808 National Australia Bank Limited +852 2526 5892
(Hong Kong and London) UBS Ltd (London) +44 207 329 0203 Multicurrency Euro Medium-Term Note Facility Dealer Panel4
Includes all Domestic and Global AUD Bond Facility Distribution Group Multicurrency US Medium-Term Note Facility Dealer Panel Australia and New Zealand +1 212 801 9151 Banking Group Limited Bank of America Merrill Lynch +1 646 855 8032 Barclays +44 207 773 9090 BNP Paribas +1 212 471 8240
Citigroup (New York) +1 212 723 6171 Commonwealth Bank of Australia +44 207 710 3959 Daiwa Capital Markets Europe Limited +61 3 9916 1313 Deutsche Bank Securities Inc (New York)3 +1 212 250 6801 HSBC +1 212 525 4688 JP Morgan +1 212 834 4533
RBC Capital Markets (New York) +1 212 858 7138 TD Securities +1 212 827 7199 UBS Investment Bank +1 203 719 1830
1 Lead Manager – United States 2 Lead Manager – Europe 3 Lead Arranger 4 Lead Arranger – UBS Ltd (London)
ANNUAL REPORT 2012–13 QUEENSLAND TREASURY CORPORATION 71
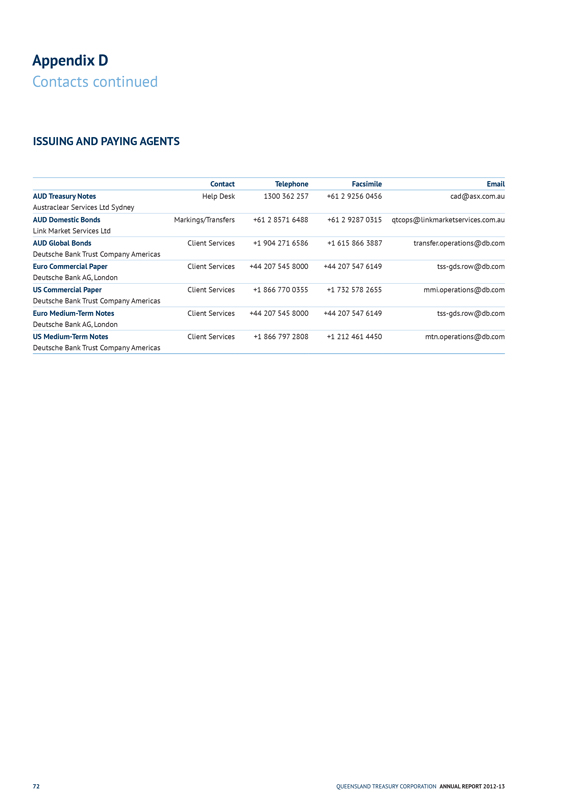
Appendix D
Contacts continued
ISSUING AND PAYING AGENTS
Contact
Telephone
Facsimile
Email
AUD Treasury Notes
Help Desk
1300 362 257
+61 2 9256 0456
cad@asx.com.au
Austraclear Services Ltd Sydney
AUD Domestic Bonds
Markings/Transfers
+61 2 8571 6488
+61 2 9287 0315
qtcops@linkmarketservices.com.au
Link Market Services Ltd
AUD Global Bonds
Client Services
+1 904 271 6586
+1 615 866 3887
transfer.operations@db.com
Deutsche Bank Trust Company Americas
Euro Commercial Paper
Client Services
+44 207 545 8000
+44 207 547 6149
tss-gds.row@db.com
Deutsche Bank AG, London
US Commercial Paper
Client Services
+1 866 770 0355
+1 732 578 2655
mmi.operations@db.com
Deutsche Bank Trust Company Americas
Euro Medium-Term Notes
Client Services
+44 207 545 8000
+44 207 547 6149
tss-gds.row@db.com
Deutsche Bank AG, London
US Medium-Term Notes
Client Services
+1 866 797 2808
+1 212 461 4450
mtn.operations@db.com
Deutsche Bank Trust Company Americas
72 QUEENSLAND TREASURY CORPORATION ANNUAL REPORT 2012-13

AUDAX AT FIDELIS
QUEENSLAND
TREASURY
CORPORATION
Level 6 123 Albert Street Brisbane GPO Box 1096 Brisbane Queensland Australia 4001
Telephone: +61 7 3842 4600
Facsimile: +61 7 3221 4122 www.qtc.com.au
© Queensland Treasury Corporation 2013