EXHIBIT (c)(vi)
The Queensland Treasury Corporation Half-Yearly Report for the half-year ended December 31, 2013

AUDAX AT FIDELIS
QUEENSLAND
TREASURY CORPORATION
HALF-YEARLY REPORT DECEMBER 2013
VISION
Securing Queensland’s financial success
MISSION
To deliver optimal financial outcomes through sound funding and financial risk management
VALUES
We are focused on our clients We are passionate about Queensland We value and respect our people We are collaborative and seek continuous improvement Above all else, we value integrity
As the Queensland Government’s central financing authority, Queensland Treasury Corporation (QTC) plays a pivotal role in securing the State’s financial success.
QTC provides a range of financial services to the State and its public sector entities, including local governments. These services include debt funding and management, short- to medium-term cash management facilities, financial risk management advisory, and specialist public finance training.
Debt funding and management
QTC borrows funds in the domestic and global markets in the most cost-effective manner and in a way that minimises liquidity risk and refinancing risk. QTC achieves significant economies of scale and scope by issuing, managing and administering the State’s debt funding.
QTC works closely with Queensland’s public sector entities, including local governments, to assist them to most effectively manage their financial transactions, minimise their financial risk and achieve the best financial solutions for their organisation and the State.
Short- to medium-term cash management facilities
QTC assists the State’s public sector entities to make the best use of their short- to medium-term cash balances within a conservative risk management framework. It offers overnight and fixed-term facilities and a managed short-term fund.
Financial risk management advisory
QTC offers a range of financial risk management advisory services to clients, including:
n support to ensure financial risks are identified and effectively managed
n advice on financial and commercial considerations
n expertise in financial transactions and structures
n project management support to deliver key fiscal outcomes, and
n collaboration with the financial markets and private sector institutions.
Specialist public finance training
QTC offers a range of training courses that complement its products and advisory services and allow it to share its specialist financial, commercial, treasury management and risk management expertise with clients. Courses are developed and delivered by QTC’s experienced professionals and industry experts.
QUEENSLAND TREASURY CORPORATION
CONTENTS
Queensland Treasury Corporation
1
Update from the Chairman & Chief Executive
2
Financial Statements
3
Appendices
23
HALF-YEARLY REPORT DECEMBER 2013 QUEENSLAND TREASURY CORPORATION
1
UPDATE FROM THE CHAIRMAN & CHIEF EXECUTIVE
Borrowing program
In response to the State Government’s Mid-Year Fiscal and Economic Review, QTC released its mid-year update of its 2013-14 borrowing program on 19 December 2013. In this update, QTC’s borrowing task was reduced by $1 billion, as a result of better operating performance in the General Government sector, lower borrowing requirements across Government, and use of surplus liquidity.
The revised $11.1 billion borrowing program for 2013-14 consists of $6.1 billion of term debt, $3 billion of which had been raised by the end of the calendar year via:
n a syndicated $1.2 billion 2016 floating-rate note issue in September, which was QTC’s first issue of a floating-rate note since 2011
n a syndicated tap of its existing 2019 benchmark bond line, raising $1.1 billion and bringing this line to $4 billion, and
n an additional $500 million of its 2016 floating rate note via syndication in October.
In the period under review, QTC’s bond spreads contracted to those of the other Australian semi-government and Commonwealth issuers.
AUD benchmark bonds will remain QTC’s principal source of funding with other instruments, including floating rate notes, considered subject to funding requirements and investor preference. QTC also plans to maintain approximately $5 billion of short-term debt under its commercial paper and treasury-note programs.
Credit rating
In November, Standard & Poor’s affirmed Queensland and QTC’s credit rating at AA+/A-1+ with the outlook remaining stable, citing Australia’s strong institutional framework, together with Queensland’s strengthening economy, positive financial management and strong liquidity.
Whole-of-State benefits
QTC’s capital markets activities, together with its ability to leverage economies of scale, have delivered an estimated $162 million worth of benefits for clients in the six months to 31 December 2013. On the financial advisory side of its business, QTC is working with the State to deliver its wider fiscal priorities and support the Public Sector Commission’s implementation of the Commission of Audit recommendations.
Operating profit
For the half-year ended 31 December 2013, Queensland Treasury Corporation (QTC) achieved an operating profit from its capital markets operations of $97.9 million (HY2012: $225.4 million). In addition to these capital markets activities, QTC’s long-term assets operations recorded a $446.0 million profit (HY2012: $1,154.5 million)*.
G P BRADLEY
P C NOBLE
Chairman
Chief Executive
*Under an administrative arrangement, QTC on behalf of the State receives returns from investments held to meet the State’s long-term obligations, primarily superannuation, which are managed by QIC Limited. In return, QTC has issued to the State fixed-rate notes that provide a stable return. While QTC bears the fluctuations in the value of and returns on the long-term asset portfolio, there is no cash flow effect; any losses incurred would have no impact on QTC’s capital markets activities or its ability to meet its obligations.
2
QUEENSLAND TREASURY CORPORATION HALF-YEARLY REPORT DECEMBER 2013
FINANCIAL STATEMENTS
FOR THE HALF-YEAR ENDED
31 DECEMBER 2013
CONTENTS
Statement of comprehensive income
4
Balance sheet
5
Statement of changes in equity
6
Statement of cash flows
7
Notes to and forming part of the Financial Statements
8
Certificate of the
Queensland Treasury Corporation
19
Independent Auditor’s review report
20
Management report
21
QUEENSLAND TREASURY CORPORATION
3
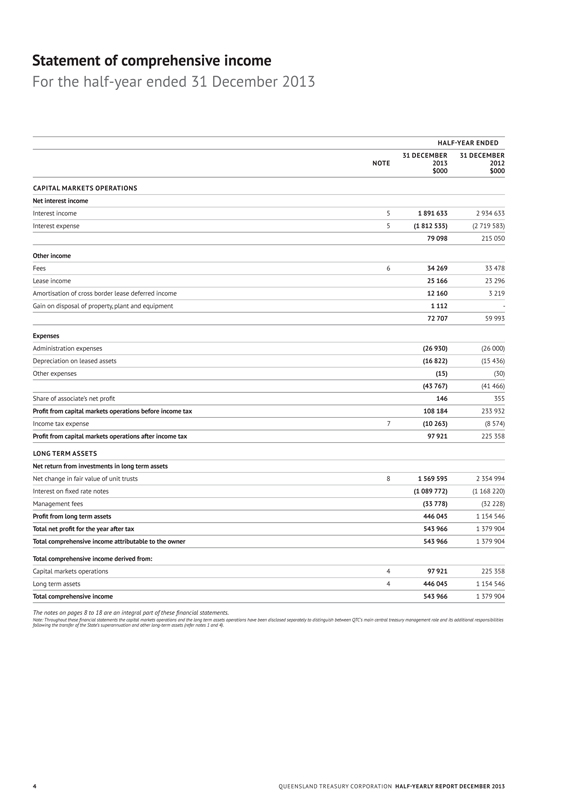
Statement of comprehensive income
For the half-year ended 31 December 2013
HALF-YEAR ENDED
NOTE
31 DECEMBER 2013 31 DECEMBER 2012
$000 $000
CAPITAL MARKETS OPERATIONS
Net interest income
Interest income 5 1 891 633 2 934 633
Interest expense 5 (1 812 535) (2 719 583)
79 098 215 050
Other income
Fees 6 34 269 33 478
Lease income 25 166 23 296
Amortisation of cross border lease deferred income 12 160 3 219
Gain on disposal of property, plant and equipment 1 112 —
72 707 59 993
Expenses
Administration expenses (26 930) (26 000)
Depreciation on leased assets (16 822) (15 436)
Other expenses (15) (30)
(43 767) (41 466)
Share of associate’s net profit 146 355
Profit from capital markets operations before income tax 108 184 233 932
Income tax expense 7 (10 263) (8 574)
Profit from capital markets operations after income tax 97 921 225 358
LONG TERM ASSETS
Net return from investments in long term assets
Net change in fair value of unit trusts 8 1 569 595 2 354 994
Interest on fixed rate notes (1 089 772) (1 168 220)
Management fees (33 778) (32 228)
Profit from long term assets 446 045 1 154 546
Total net profit for the year after tax 543 966 1 379 904
Total comprehensive income attributable to the owner 543 966 1 379 904
Total comprehensive income derived from:
Capital markets operations 4 97 921 225 358
Long term assets 4 446 045 1 154 546
Total comprehensive income 543 966 1 379 904
The notes on pages 8 to 18 are an integral part of these financial statements.
Note: Throughout these financial statements the capital markets operations and the long term assets operations have been disclosed separately to distinguish between QTC’s main central treasury management role and its additional responsibilities following the transfer of the State’s superannuation and other long-term assets (refer notes 1 and 4).
QUEENSLAND TREASURY CORPORATION HALF-YEARLY REPORT DECEMBER 2013
4
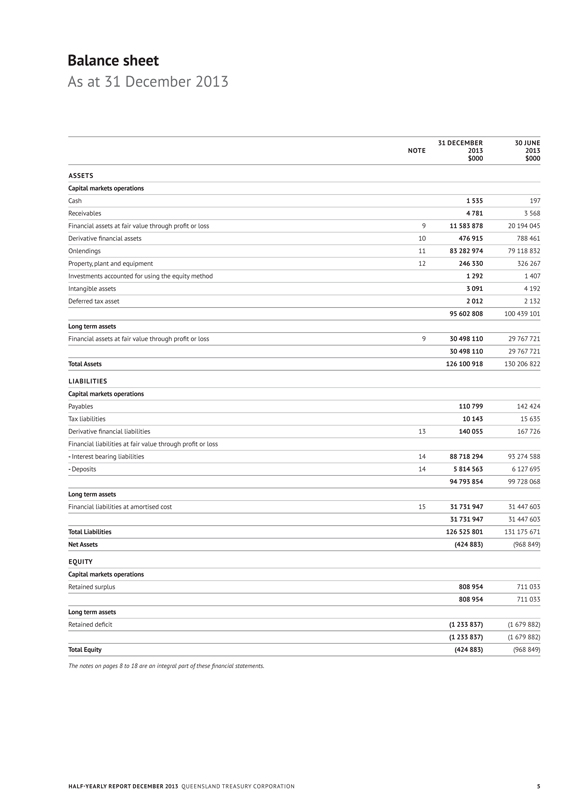
Balance sheet
As at 31 December 2013
NOTE
31 DECEMBER 2013 $000
30 JUNE 2013 $000
ASSETS
Capital markets operations
Cash 1 535 197
Receivables 4 781 3 568
Financial assets at fair value through profit or loss 9 11 583 878 20 194 045
Derivative financial assets 10 476 915 788 461
Onlendings 11 83 282 974 79 118 832
Property, plant and equipment 12 246 330 326 267
Investments accounted for using the equity method 1 292 1 407
Intangible assets 3 091 4 192
Deferred tax asset 2 012 2 132
95 602 808 100 439 101
Long term assets
Financial assets at fair value through profit or loss 9 30 498 110 29 767 721
30 498 110 29 767 721
Total Assets 126 100 918 130 206 822
LIABILITIES
Capital markets operations
Payables 110 799 142 424
Tax liabilities 10 143 15 635
Derivative financial liabilities 13 140 055 167 726
Financial liabilities at fair value through profit or loss
- Interest bearing liabilities 14 88 718 294 93 274 588
- Deposits 14 5 814 563 6 127 695
94 793 854 99 728 068
Long term assets
Financial liabilities at amortised cost 15 31 731 947 31 447 603
31 731 947 31 447 603
Total Liabilities 126 525 801 131 175 671
Net Assets (424 883) (968 849)
EQUITY
Capital markets operations
Retained surplus 808 954 711 033
808 954 711 033
Long term assets
Retained deficit (1 233 837) (1 679 882)
(1 233 837) (1 679 882)
Total Equity (424 883) (968 849)
The notes on pages 8 to 18 are an integral part of these financial statements.
HALF-YEARLY REPORT DECEMBER 2013 QUEENSLAND TREASURY CORPORATION
5
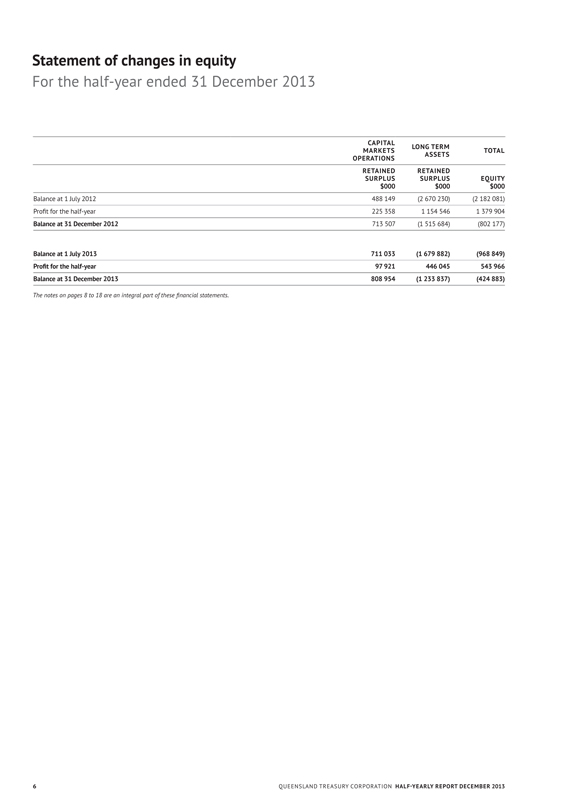
Statement of changes in equity
For the half-year ended 31 December 2013
CAPITAL MARKETS OPERATIONS
LONG TERM ASSETS
TOTAL
RETAINED SURPLUS $000
RETAINED SURPLUS $000
EQUITY $000
Balance at 1 July 2012
488 149
(2 670 230)
(2 182 081)
Profit for the half-year
225 358
1 154 546
1 379 904
Balance at 31 December 2012
713 507
(1 515 684)
(802 177)
Balance at 1 July 2013
711 033
(1 679 882)
(968 849)
Profit for the half-year
97 921
446 045
543 966
Balance at 31 December 2013
808 954
(1 233 837)
(424 883)
The notes on pages 8 to 18 are an integral part of these financial statements.
6
QUEENSLAND TREASURY CORPORATION HALF-YEARLY REPORT DECEMBER 2013
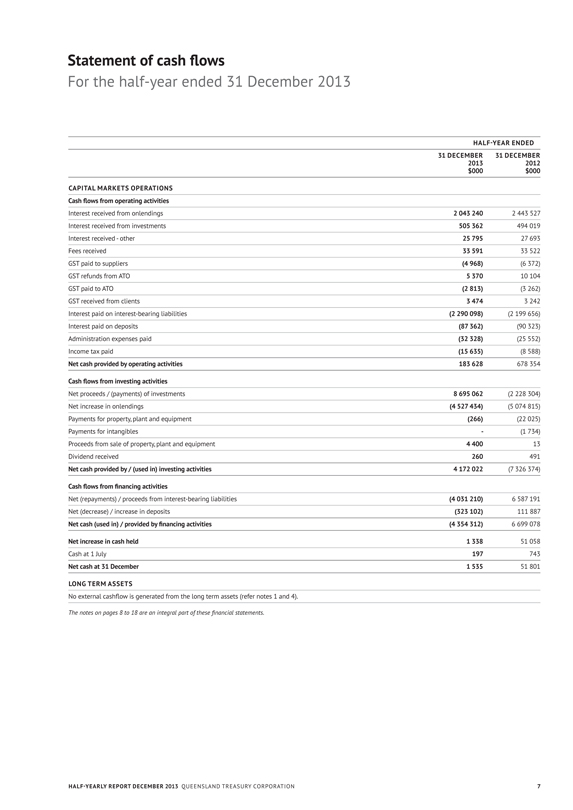
Statement of cash flows
For the half-year ended 31 December 2013
HALF-YEAR ENDED
31 DECEMBER 31 DECEMBER
2013 2012
$000 $000
CAPITAL MARKETS OPERATIONS
Cash flows from operating activities
Interest received from onlendings 2 043 240 2 443 527
Interest received from investments 505 362 494 019
Interest received - other 25 795 27 693
Fees received 33 591 33 522
GST paid to suppliers (4 968) (6 372)
GST refunds from ATO 5 370 10 104
GST paid to ATO (2 813) (3 262)
GST received from clients 3 474 3 242
Interest paid on interest-bearing liabilities (2 290 098) (2 199 656)
Interest paid on deposits (87 362) (90 323)
Administration expenses paid (32 328) (25 552)
Income tax paid (15 635) (8 588)
Net cash provided by operating activities 183 628 678 354
Cash flows from investing activities
Net proceeds / (payments) of investments 8 695 062 (2 228 304)
Net increase in onlendings (4 527 434) (5 074 815)
Payments for property, plant and equipment (266) (22 025)
Payments for intangibles — (1 734)
Proceeds from sale of property, plant and equipment 4 400 13
Dividend received 260 491
Net cash provided by / (used in) investing activities 4 172 022 (7 326 374)
Cash flows from financing activities
Net (repayments) / proceeds from interest-bearing liabilities (4 031 210) 6 587 191
Net (decrease) / increase in deposits (323 102) 111 887
Net cash (used in) / provided by financing activities (4 354 312) 6 699 078
Net increase in cash held 1 338 51 058
Cash at 1 July 197 743
Net cash at 31 December 1 535 51 801
LONG TERM ASSETS
No external cashflow is generated from the long term assets (refer notes 1 and 4).
The notes on pages 8 to 18 are an integral part of these financial statements.
HALF-YEARLY REPORT DECEMBER 2013 QUEENSLAND TREASURY CORPORATION 7
Notes to and forming part of the Financial Statements
For the half-year ended 31 December 2013
CONTENTS
1 General information 8
2 Summary of significant accounting policies 8
3 Operating result 8
4 Segment reporting 9
5 Interest income and interest expense from capital markets operations 10
6 Fees 11
7 Income tax expense 11
8 Net change in fair value of unit trusts 11
9 Financial assets at fair value through profit or loss 12
10 Derivative financial assets 13
11 Onlendings 13
12 Property, plant and equipment 13
13 Derivative financial liabilities 13
14 Financial liabilities at fair value through profit or loss 14
15 Financial liabilities at amortised cost 15
16 Dividends 15
17 Notes to the statement of cash flows 15
18 Fair value hierarchy 16
18 Fair value hierarchy continued 17
19 Contingent liabilities 18
20 Funding facilities 18
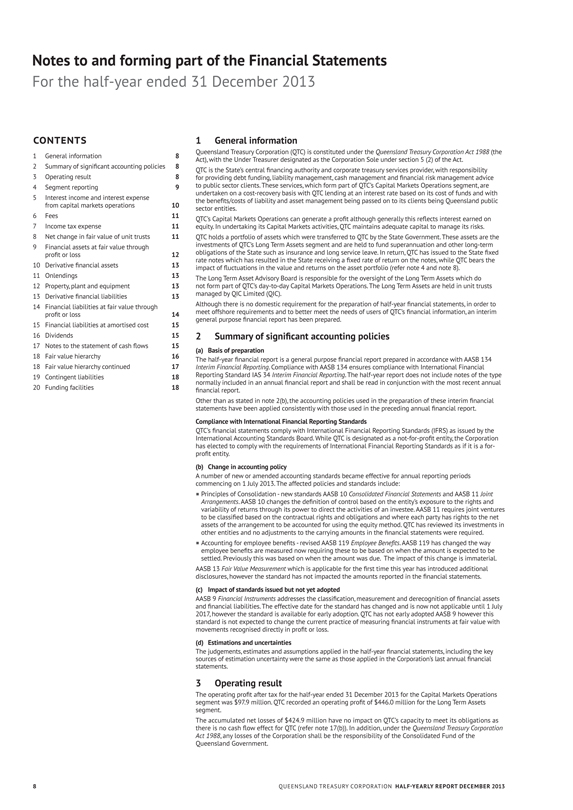
1 General information
Queensland Treasury Corporation (QTC) is constituted under the Queensland Treasury Corporation Act 1988 (the Act), with the Under Treasurer designated as the Corporation Sole under section 5 (2) of the Act. QTC is the State’s central financing authority and corporate treasury services provider, with responsibility for providing debt funding, liability management, cash management and financial risk management advice to public sector clients. These services, which form part of QTC’s Capital Markets Operations segment, are undertaken on a cost-recovery basis with QTC lending at an interest rate based on its cost of funds and with the benefits/costs of liability and asset management being passed on to its clients being Queensland public sector entities.
QTC’s Capital Markets Operations can generate a profit although generally this reflects interest earned on equity. In undertaking its Capital Markets activities, QTC maintains adequate capital to manage its risks. QTC holds a portfolio of assets which were transferred to QTC by the State Government. These assets are the investments of QTC’s Long Term Assets segment and are held to fund superannuation and other long-term obligations of the State such as insurance and long service leave. In return, QTC has issued to the State fixed rate notes which has resulted in the State receiving a fixed rate of return on the notes, while QTC bears the impact of fluctuations in the value and returns on the asset portfolio (refer note 4 and note 8).
The Long Term Asset Advisory Board is responsible for the oversight of the Long Term Assets which do not form part of QTC’s day-to-day Capital Markets Operations. The Long Term Assets are held in unit trusts managed by QIC Limited (QIC).
Although there is no domestic requirement for the preparation of half-year financial statements, in order to meet offshore requirements and to better meet the needs of users of QTC’s financial information, an interim general purpose financial report has been prepared.
2 Summary of significant accounting policies
(a) Basis of preparation
The half-year financial report is a general purpose financial report prepared in accordance with AASB 134 Interim Financial Reporting. Compliance with AASB 134 ensures compliance with International Financial Reporting Standard IAS 34 Interim Financial Reporting. The half-year report does not include notes of the type normally included in an annual financial report and shall be read in conjunction with the most recent annual financial report.
Other than as stated in note 2(b), the accounting policies used in the preparation of these interim financial statements have been applied consistently with those used in the preceding annual financial report.
Compliance with International Financial Reporting Standards
QTC’s financial statements comply with International Financial Reporting Standards (IFRS) as issued by the International Accounting Standards Board. While QTC is designated as a not-for-profit entity, the Corporation has elected to comply with the requirements of International Financial Reporting Standards as if it is a for-profit entity.
(b) Change in accounting policy
A number of new or amended accounting standards became effective for annual reporting periods commencing on 1 July 2013. The affected policies and standards include:
¡ Principles of Consolidation - new standards AASB 10 Consolidated Financial Statements and AASB 11 Joint
Arrangements. AASB 10 changes the definition of control based on the entity’s exposure to the rights and variability of returns through its power to direct the activities of an investee. AASB 11 requires joint ventures to be classified based on the contractual rights and obligations and where each party has rights to the net assets of the arrangement to be accounted for using the equity method. QTC has reviewed its investments in other entities and no adjustments to the carrying amounts in the financial statements were required. ¡ Accounting for employee benefits - revised AASB 119 Employee Benefits. AASB 119 has changed the way employee benefits are measured now requiring these to be based on when the amount is expected to be settled. Previously this was based on when the amount was due. The impact of this change is immaterial. AASB 13 Fair Value Measurement which is applicable for the first time this year has introduced additional disclosures, however the standard has not impacted the amounts reported in the financial statements.
(c) Impact of standards issued but not yet adopted
AASB 9 Financial Instruments addresses the classification, measurement and derecognition of financial assets and financial liabilities. The effective date for the standard has changed and is now not applicable until 1 July 2017, however the standard is available for early adoption. QTC has not early adopted AASB 9 however this standard is not expected to change the current practice of measuring financial instruments at fair value with movements recognised directly in profit or loss.
(d) Estimations and uncertainties
The judgements, estimates and assumptions applied in the half-year financial statements, including the key sources of estimation uncertainty were the same as those applied in the Corporation’s last annual financial statements.
3 Operating result
The operating profit after tax for the half-year ended 31 December 2013 for the Capital Markets Operations segment was $97.9 million. QTC recorded an operating profit of $446.0 million for the Long Term Assets segment.
The accumulated net losses of $424.9 million have no impact on QTC’s capacity to meet its obligations as there is no cash flow effect for QTC (refer note 17(b)). In addition, under the Queensland Treasury Corporation Act 1988, any losses of the Corporation shall be the responsibility of the Consolidated Fund of the Queensland Government.
8 QUEENSLAND TREASURY CORPORATION HALF-YEARLY REPORT DECEMBER 2013
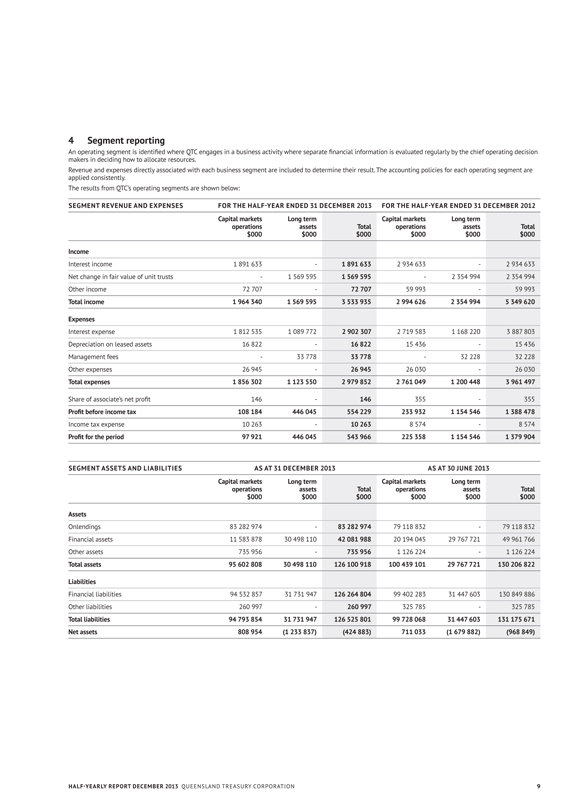
4 Segment reporting
An operating segment is identified where QTC engages in a business activity where separate financial information is evaluated regularly by the chief operating decision makers in deciding how to allocate resources.
Revenue and expenses directly associated with each business segment are included to determine their result. The accounting policies for each operating segment are applied consistently.
The results from QTC’s operating segments are shown below:
SEGMENT REVENUE AND EXPENSES FOR THE HALF-YEAR ENDED 31 DECEMBER 2013 FOR THE HALF-YEAR ENDED 31 DECEMBER 2012
Capital markets Long term Capital markets Long term operations assets Total operations assets Total
$000 $000 $000 $000 $000 $000
Income
Interest income 1 891 633 — 1 891 633 2 934 633 — 2 934 633
Net change in fair value of unit trusts — 1 569 595 1 569 595 — 2 354 994 2 354 994
Other income 72 707 — 72 707 59 993 — 59 993
Total income 1 964 340 1 569 595 3 533 935 2 994 626 2 354 994 5 349 620
Expenses
Interest expense 1 812 535 1 089 772 2 902 307 2 719 583 1 168 220 3 887 803
Depreciation on leased assets 16 822 — 16 822 15 436 — 15 436
Management fees — 33 778 33 778 — 32 228 32 228
Other expenses 26 945 — 26 945 26 030 — 26 030
Total expenses 1 856 302 1 123 550 2 979 852 2 761 049 1 200 448 3 961 497
Share of associate’s net profit 146 — 146 355 — 355
Profit before income tax 108 184 446 045 554 229 233 932 1 154 546 1 388 478
Income tax expense 10 263 — 10 263 8 574 — 8 574
Profit for the period 97 921 446 045 543 966 225 358 1 154 546 1 379 904
SEGMENT ASSETS AND LIABILITIES AS AT 31 DECEMBER 2013 AS AT 30 JUNE 2013
Capital markets Long term Capital markets Long term
operations assets Total operations assets Total
$000 $000 $000 $000 $000 $000
Assets
Onlendings 83 282 974 — 83 282 974 79 118 832 — 79 118 832
Financial assets 11 583 878 30 498 110 42 081 988 20 194 045 29 767 721 49 961 766
Other assets 735 956 — 735 956 1 126 224 — 1 126 224
Total assets 95 602 808 30 498 110 126 100 918 100 439 101 29 767 721 130 206 822
Liabilities
Financial liabilities 94 532 857 31 731 947 126 264 804 99 402 283 31 447 603 130 849 886
Other liabilities 260 997 — 260 997 325 785 — 325 785
Total liabilities 94 793 854 31 731 947 126 525 801 99 728 068 31 447 603 131 175 671
Net assets 808 954 (1 233 837) (424 883) 711 033 (1 679 882) (968 849)
HALF-YEARLY REPORT DECEMBER 2013 QUEENSLAND TREASURY CORPORATION 9
Notes to and forming part of the Financial Statements
For the half-year ended 31 December 2013
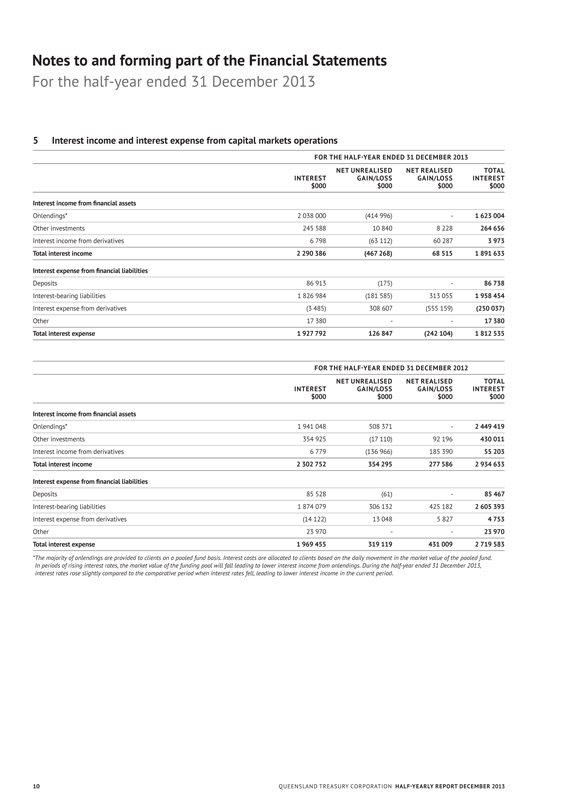
5 Interest income and interest expense from capital markets operations
FOR THE HALF-YEAR ENDED 31 DECEMBER 2013
NET UNREALISED NET REALISED TOTAL
INTEREST GAIN/LOSS GAIN/LOSS INTEREST
$000 $000 $000 $000
Interest income from financial assets
Onlendings* 2 038 000 (414 996) — 1 623 004
Other investments 245 588 10 840 8 228 264 656
Interest income from derivatives 6 798 (63 112) 60 287 3 973
Total interest income 2 290 386 (467 268) 68 515 1 891 633
Interest expense from financial liabilities
Deposits 86 913 (175) — 86 738
Interest-bearing liabilities 1 826 984 (181 585) 313 055 1 958 454
Interest expense from derivatives (3 485) 308 607 (555 159) (250 037)
Other 17 380 — — 17 380
Total interest expense 1 927 792 126 847 (242 104) 1 812 535
FOR THE HALF-YEAR ENDED 31 DECEMBER 2012
NET UNREALISED NET REALISED TOTAL
INTEREST GAIN/LOSS GAIN/LOSS INTEREST
$000 $000 $000 $000
Interest income from financial assets
Onlendings* 1 941 048 508 371 — 2 449 419
Other investments 354 925 (17 110) 92 196 430 011
Interest income from derivatives 6 779 (136 966) 185 390 55 203
Total interest income 2 302 752 354 295 277 586 2 934 633
Interest expense from financial liabilities
Deposits 85 528 (61) — 85 467
Interest-bearing liabilities 1 874 079 306 132 425 182 2 605 393
Interest expense from derivatives (14 122) 13 048 5 827 4 753
Other 23 970 — — 23 970
Total interest expense 1 969 455 319 119 431 009 2 719 583
*The majority of onlendings are provided to clients on a pooled fund basis. Interest costs are allocated to clients based on the daily movement in the market value of the pooled fund. In periods of rising interest rates, the market value of the funding pool will fall leading to lower interest income from onlendings. During the half-year ended 31 December 2013, interest rates rose slightly compared to the comparative period when interest rates fell, leading to lower interest income in the current period.
10 QUEENSLAND TREASURY CORPORATION HALF-YEARLY REPORT DECEMBER 2013
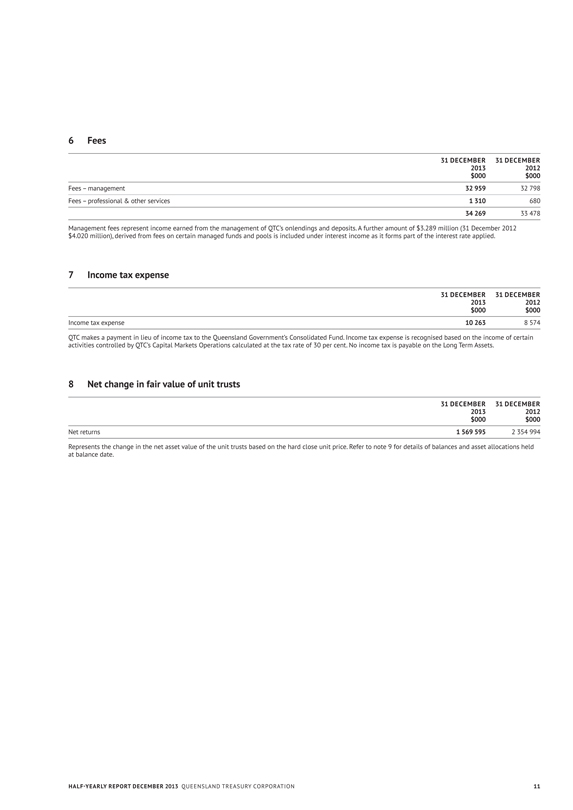
6 Fees
31 DECEMBER 31 DECEMBER
2013 2012
$000 $000
Fees – management 32 959 32 798
Fees – professional & other services 1 310 680
34 269 33 478
Management fees represent income earned from the management of QTC’s onlendings and deposits. A further amount of $3.289 million (31 December 2012 $4.020 million), derived from fees on certain managed funds and pools is included under interest income as it forms part of the interest rate applied.
7 Income tax expense
31 DECEMBER 31 DECEMBER
2013 2012
$000 $000
Income tax expense 10 263 8 574
QTC makes a payment in lieu of income tax to the Queensland Government’s Consolidated Fund. Income tax expense is recognised based on the income of certain activities controlled by QTC’s Capital Markets Operations calculated at the tax rate of 30 per cent. No income tax is payable on the Long Term Assets.
8 Net change in fair value of unit trusts
31 DECEMBER 31 DECEMBER
2013 2012
$000 $000
Net returns 1 569 595 2 354 994
Represents the change in the net asset value of the unit trusts based on the hard close unit price. Refer to note 9 for details of balances and asset allocations held at balance date.
HALF-YEARLY REPORT DECEMBER 2013 QUEENSLAND TREASURY CORPORATION 11
Notes to and forming part of the Financial Statements
For the half-year ended 31 December 2013
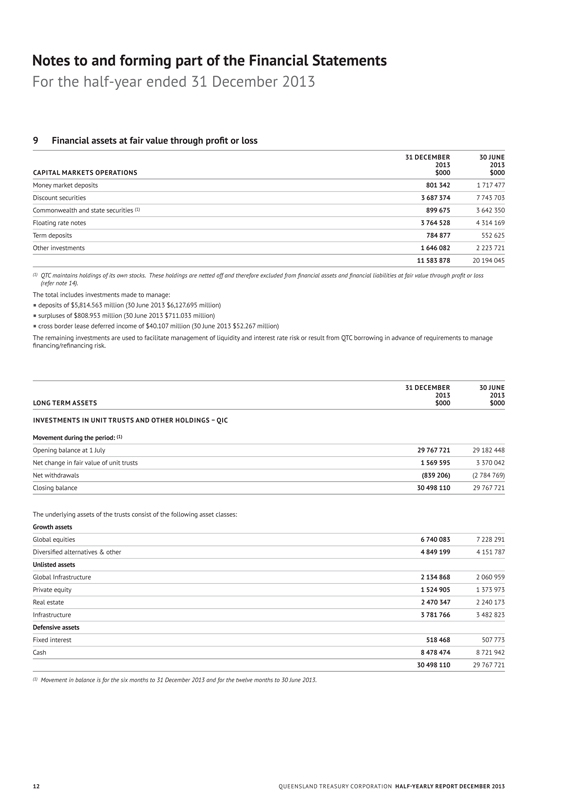
9 Financial assets at fair value through profit or loss
31 DECEMBER 30 JUNE
2013 2013
CAPITAL MARKETS OPERATIONS $000 $000
Money market deposits 801 342 1 717 477
Discount securities 3 687 374 7 743 703
Commonwealth and state securities (1) 899 675 3 642 350
Floating rate notes 3 764 528 4 314 169
Term deposits 784 877 552 625
Other investments 1 646 082 2 223 721
11 583 878 20 194 045
(1) QTC maintains holdings of its own stocks. These holdings are netted off and therefore excluded from financial assets and financial liabilities at fair value through profit or loss (refer note 14).
The total includes investments made to manage:
¡ deposits of $5,814.563 million (30 June 2013 $6,127.695 million)
¡ surpluses of $808.953 million (30 June 2013 $711.033 million)
¡ cross border lease deferred income of $40.107 million (30 June 2013 $52.267 million)
The remaining investments are used to facilitate management of liquidity and interest rate risk or result from QTC borrowing in advance of requirements to manage financing/refinancing risk.
31 DECEMBER 30 JUNE
2013 2013
LONG TERM ASSETS $000 $000
INVESTMENTS IN UNIT TRUSTS AND OTHER HOLDINGS – QIC
Movement during the period: (1)
Opening balance at 1 July 29 767 721 29 182 448
Net change in fair value of unit trusts 1 569 595 3 370 042
Net withdrawals (839 206) (2 784 769)
Closing balance 30 498 110 29 767 721
The underlying assets of the trusts consist of the following asset classes:
Growth assets
Global equities 6 740 083 7 228 291
Diversified alternatives & other 4 849 199 4 151 787
Unlisted assets
Global Infrastructure 2 134 868 2 060 959
Private equity 1 524 905 1 373 973
Real estate 2 470 347 2 240 173
Infrastructure 3 781 766 3 482 823
Defensive assets
Fixed interest 518 468 507 773
Cash 8 478 474 8 721 942
30 498 110 29 767 721
(1) Movement in balance is for the six months to 31 December 2013 and for the twelve months to 30 June 2013.
12 QUEENSLAND TREASURY CORPORATION HALF-YEARLY REPORT DECEMBER 2013
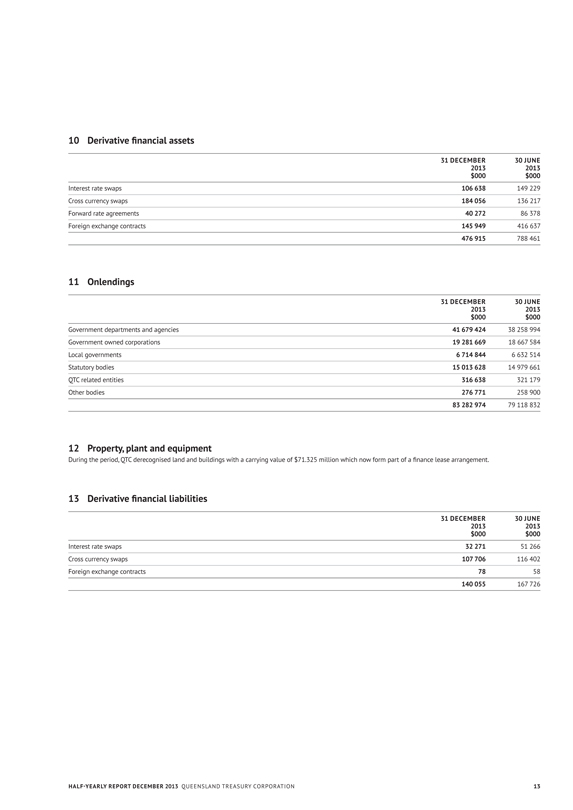
10 Derivative financial assets
31 DECEMBER 30 JUNE
2013 2013
$000 $000
Interest rate swaps 106 638 149 229
Cross currency swaps 184 056 136 217
Forward rate agreements 40 272 86 378
Foreign exchange contracts 145 949 416 637
476 915 788 461
11 Onlendings
31 DECEMBER 30 JUNE
2013 2013
$000 $000
Government departments and agencies 41 679 424 38 258 994
Government owned corporations 19 281 669 18 667 584
Local governments 6 714 844 6 632 514
Statutory bodies 15 013 628 14 979 661
QTC related entities 316 638 321 179
Other bodies 276 771 258 900
83 282 974 79 118 832
12 Property, plant and equipment
During the period, QTC derecognised land and buildings with a carrying value of $71.325 million which now form part of a finance lease arrangement.
13 Derivative financial liabilities
31 DECEMBER 30 JUNE
2013 2013
$000 $000
Interest rate swaps 32 271 51 266
Cross currency swaps 107 706 116 402
Foreign exchange contracts 78 58
140 055 167 726
HALF-YEARLY REPORT DECEMBER 2013 QUEENSLAND TREASURY CORPORATION 13
Notes to and forming part of the Financial Statements
For the half-year ended 31 December 2013
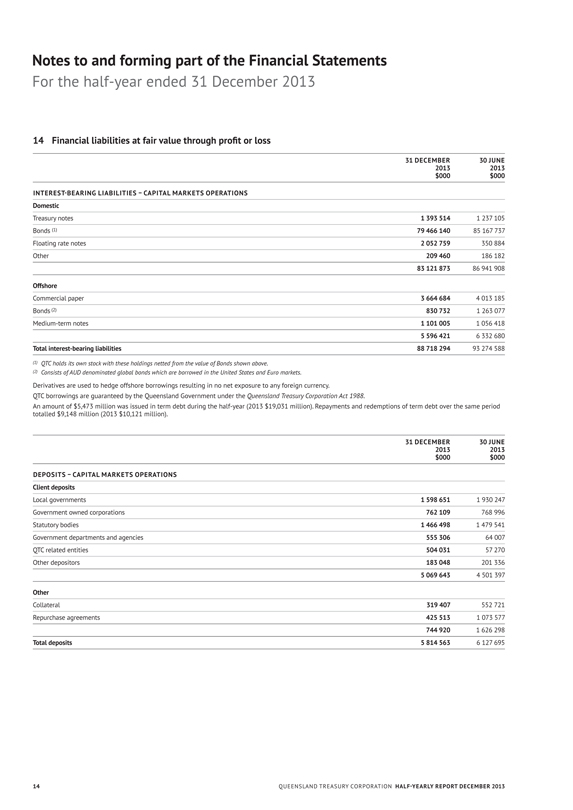
14 Financial liabilities at fair value through profit or loss
31 DECEMBER 30 JUNE
2013 2013
$000 $000
INTEREST-BEARING LIABILITIES – CAPITAL MARKETS OPERATIONS
Domestic
Treasury notes 1 393 514 1 237 105
Bonds (1) 79 466 140 85 167 737
Floating rate notes 2 052 759 350 884
Other 209 460 186 182
83 121 873 86 941 908
Offshore
Commercial paper 3 664 684 4 013 185
Bonds (2) 830 732 1 263 077
Medium-term notes 1 101 005 1 056 418
5 596 421 6 332 680
Total interest-bearing liabilities 88 718 294 93 274 588
(1) QTC holds its own stock with these holdings netted from the value of Bonds shown above.
(2) Consists of AUD denominated global bonds which are borrowed in the United States and Euro markets.
Derivatives are used to hedge offshore borrowings resulting in no net exposure to any foreign currency.
QTC borrowings are guaranteed by the Queensland Government under the Queensland Treasury Corporation Act 1988.
An amount of $5,473 million was issued in term debt during the half-year (2013 $19,031 million). Repayments and redemptions of term debt over the same period totalled $9,148 million (2013 $10,121 million).
31 DECEMBER 30 JUNE
2013 2013
$000 $000
DEPOSITS – CAPITAL MARKETS OPERATIONS
Client deposits
Local governments 1 598 651 1 930 247
Government owned corporations 762 109 768 996
Statutory bodies 1 466 498 1 479 541
Government departments and agencies 555 306 64 007
QTC related entities 504 031 57 270
Other depositors 183 048 201 336
5 069 643 4 501 397
Other
Collateral 319 407 552 721
Repurchase agreements 425 513 1 073 577
744 920 1 626 298
Total deposits 5 814 563 6 127 695
14 QUEENSLAND TREASURY CORPORATION HALF-YEARLY REPORT DECEMBER 2013
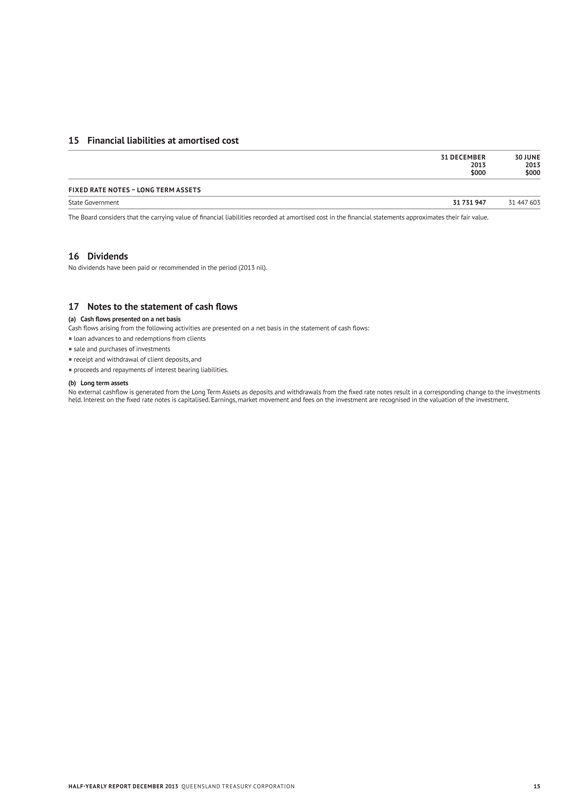
15 Financial liabilities at amortised cost
31 DECEMBER 30 JUNE
2013 2013
$000 $000
FIXED RATE NOTES – LONG TERM ASSETS
State Government 31 731 947 31 447 603
The Board considers that the carrying value of financial liabilities recorded at amortised cost in the financial statements approximates their fair value.
16 Dividends
No dividends have been paid or recommended in the period (2013 nil).
17 Notes to the statement of cash flows
(a) Cash flows presented on a net basis
Cash flows arising from the following activities are presented on a net basis in the statement of cash flows:
¡ loan advances to and redemptions from clients
¡ sale and purchases of investments
¡ receipt and withdrawal of client deposits, and
¡ proceeds and repayments of interest bearing liabilities.
(b) Long term assets
No external cashflow is generated from the Long Term Assets as deposits and withdrawals from the fixed rate notes result in a corresponding change to the investments held. Interest on the fixed rate notes is capitalised. Earnings, market movement and fees on the investment are recognised in the valuation of the investment.
HALF-YEARLY REPORT DECEMBER 2013 QUEENSLAND TREASURY CORPORATION 15
Notes to and forming part of the Financial Statements
For the half-year ended 31 December 2013
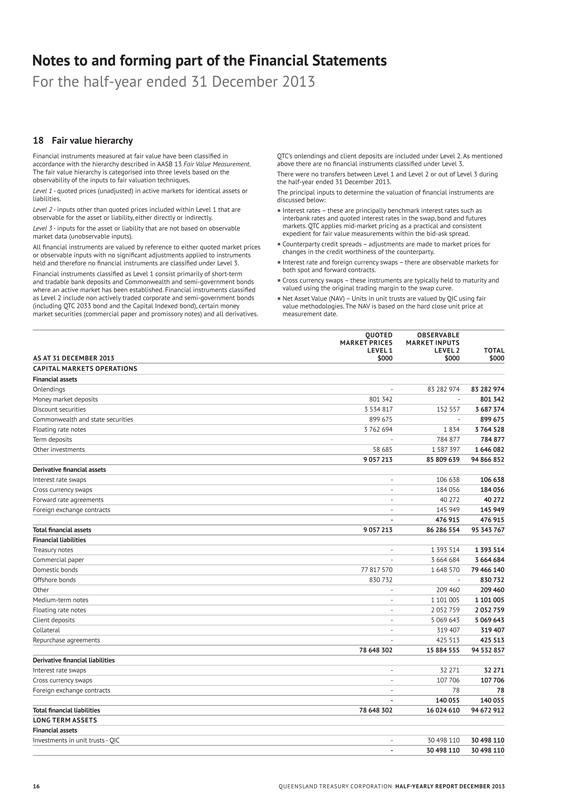
18 Fair value hierarchy
Financial instruments measured at fair value have been classified in accordance with the hierarchy described in AASB 13 Fair Value Measurement. The fair value hierarchy is categorised into three levels based on the observability of the inputs to fair valuation techniques.
Level 1 - quoted prices (unadjusted) in active markets for identical assets or liabilities.
Level 2 - inputs other than quoted prices included within Level 1 that are observable for the asset or liability, either directly or indirectly.
Level 3 - inputs for the asset or liability that are not based on observable market data (unobservable inputs).
All financial instruments are valued by reference to either quoted market prices or observable inputs with no significant adjustments applied to instruments held and therefore no financial instruments are classified under Level 3. Financial instruments classified as Level 1 consist primarily of short-term and tradable bank deposits and Commonwealth and semi-government bonds where an active market has been established. Financial instruments classified as Level 2 include non actively traded corporate and semi-government bonds (including QTC 2033 bond and the Capital Indexed bond), certain money market securities (commercial paper and promissory notes) and all derivatives.
QTC’s onlendings and client deposits are included under Level 2. As mentioned above there are no financial instruments classified under Level 3.
There were no transfers between Level 1 and Level 2 or out of Level 3 during the half-year ended 31 December 2013.
The principal inputs to determine the valuation of financial instruments are discussed below:
¡ Interest rates – these are principally benchmark interest rates such as interbank rates and quoted interest rates in the swap, bond and futures markets. QTC applies mid-market pricing as a practical and consistent expedient for fair value measurements within the bid-ask spread.
¡ Counterparty credit spreads – adjustments are made to market prices for changes in the credit worthiness of the counterparty.
¡ Interest rate and foreign currency swaps – there are observable markets for both spot and forward contracts.
¡ Cross currency swaps – these instruments are typically held to maturity and valued using the original trading margin to the swap curve.
¡ Net Asset Value (NAV) – Units in unit trusts are valued by QIC using fair value methodologies. The NAV is based on the hard close unit price at measurement date.
QUOTED OBSERVABLE
MARKET PRICES MARKET INPUTS
LEVEL 1 LEVEL 2 TOTAL
AS AT 31 DECEMBER 2013 $000 $000 $000
CAPITAL MARKETS OPERATIONS
Financial assets
Onlendings — 83 282 974 83 282 974
Money market deposits 801 342 — 801 342
Discount securities 3 534 817 152 557 3 687 374
Commonwealth and state securities 899 675 — 899 675
Floating rate notes 3 762 694 1 834 3 764 528
Term deposits — 784 877 784 877
Other investments 58 685 1 587 397 1 646 082
9 057 213 85 809 639 94 866 852
Derivative financial assets
Interest rate swaps — 106 638 106 638
Cross currency swaps — 184 056 184 056
Forward rate agreements — 40 272 40 272
Foreign exchange contracts — 145 949 145 949
— 476 915 476 915
Total financial assets 9 057 213 86 286 554 95 343 767
Financial liabilities
Treasury notes — 1 393 514 1 393 514
Commercial paper — 3 664 684 3 664 684
Domestic bonds 77 817 570 1 648 570 79 466 140
Offshore bonds 830 732 — 830 732
Other — 209 460 209 460
Medium-term notes — 1 101 005 1 101 005
Floating rate notes — 2 052 759 2 052 759
Client deposits — 5 069 643 5 069 643
Collateral — 319 407 319 407
Repurchase agreements — 425 513 425 513
78 648 302 15 884 555 94 532 857
Derivative financial liabilities
Interest rate swaps — 32 271 32 271
Cross currency swaps — 107 706 107 706
Foreign exchange contracts — 78 78
— 140 055 140 055
Total financial liabilities 78 648 302 16 024 610 94 672 912
LONG TERM ASSETS
Financial assets
Investments in unit trusts - QIC — 30 498 110 30 498 110
— 30 498 110 30 498 110
16 QUEENSLAND TREASURY CORPORATION HALF-YEARLY REPORT DECEMBER 2013
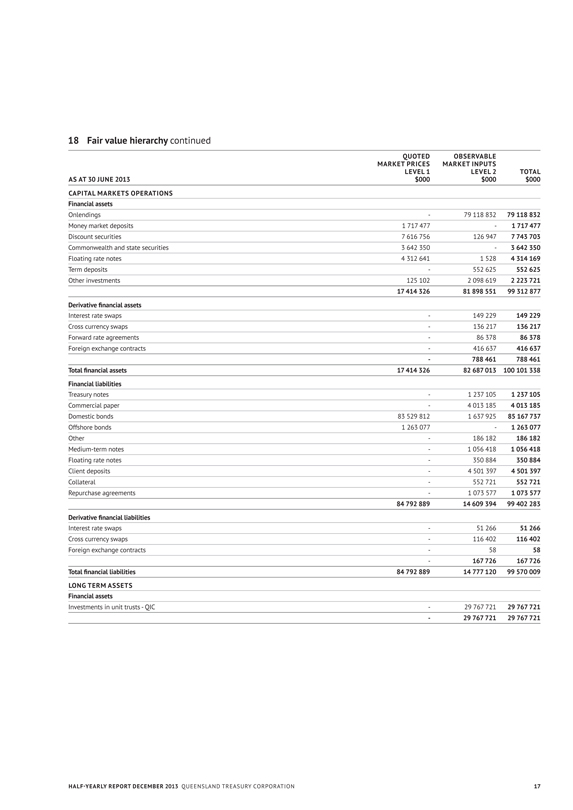
18 Fair value hierarchy continued
QUOTED OBSERVABLE
MARKET PRICES MARKET INPUTS
LEVEL 1 LEVEL 2 TOTAL
AS AT 30 JUNE 2013 $000 $000 $000
CAPITAL MARKETS OPERATIONS
Financial assets
Onlendings — 79 118 832 79 118 832
Money market deposits 1 717 477 — 1 717 477
Discount securities 7 616 756 126 947 7 743 703
Commonwealth and state securities 3 642 350 — 3 642 350
Floating rate notes 4 312 641 1 528 4 314 169
Term deposits — 552 625 552 625
Other investments 125 102 2 098 619 2 223 721
17 414 326 81 898 551 99 312 877
Derivative financial assets
Interest rate swaps — 149 229 149 229
Cross currency swaps — 136 217 136 217
Forward rate agreements — 86 378 86 378
Foreign exchange contracts — 416 637 416 637
— 788 461 788 461
Total financial assets 17 414 326 82 687 013 100 101 338
Financial liabilities
Treasury notes — 1 237 105 1 237 105
Commercial paper — 4 013 185 4 013 185
Domestic bonds 83 529 812 1 637 925 85 167 737
Offshore bonds 1 263 077 — 1 263 077
Other — 186 182 186 182
Medium-term notes — 1 056 418 1 056 418
Floating rate notes — 350 884 350 884
Client deposits — 4 501 397 4 501 397
Collateral — 552 721 552 721
Repurchase agreements — 1 073 577 1 073 577
84 792 889 14 609 394 99 402 283
Derivative financial liabilities
Interest rate swaps — 51 266 51 266
Cross currency swaps — 116 402 116 402
Foreign exchange contracts — 58 58
— 167 726 167 726
Total financial liabilities 84 792 889 14 777 120 99 570 009
LONG TERM ASSETS
Financial assets
Investments in unit trusts - QIC — 29 767 721 29 767 721
— 29 767 721 29 767 721
HALF-YEARLY REPORT DECEMBER 2013 QUEENSLAND TREASURY CORPORATION 17
Notes to and forming part of the Financial Statements
For the half-year ended 31 December 2013
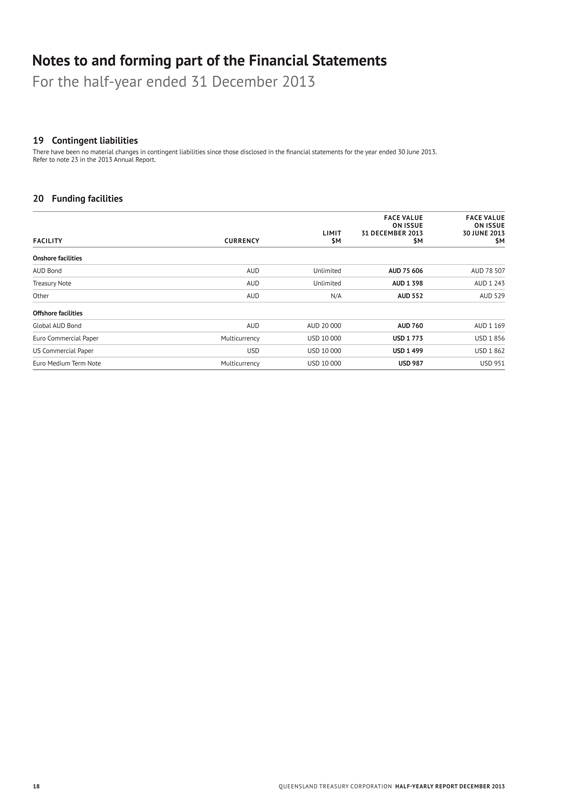
19 Contingent liabilities
There have been no material changes in contingent liabilities since those disclosed in the financial statements for the year ended 30 June 2013. Refer to note 23 in the 2013 Annual Report.
20 Funding facilities
FACE VALUE FACE VALUE
ON ISSUE ON ISSUE
LIMIT 31 DECEMBER 2013 30 JUNE 2013
FACILITY CURRENCY $M $M $M
Onshore facilities
AUD Bond AUD Unlimited AUD 75 606 AUD 78 507
Treasury Note AUD Unlimited AUD 1 398 AUD 1 243
Other AUD N/A AUD 552 AUD 529
Offshore facilities
Global AUD Bond AUD AUD 20 000 AUD 760 AUD 1 169
Euro Commercial Paper Multicurrency USD 10 000 USD 1 773 USD 1 856
US Commercial Paper USD USD 10 000 USD 1 499 USD 1 862
Euro Medium Term Note Multicurrency USD 10 000 USD 987 USD 951
18 QUEENSLAND TREASURY CORPORATION HALF-YEARLY REPORT DECEMBER 2013
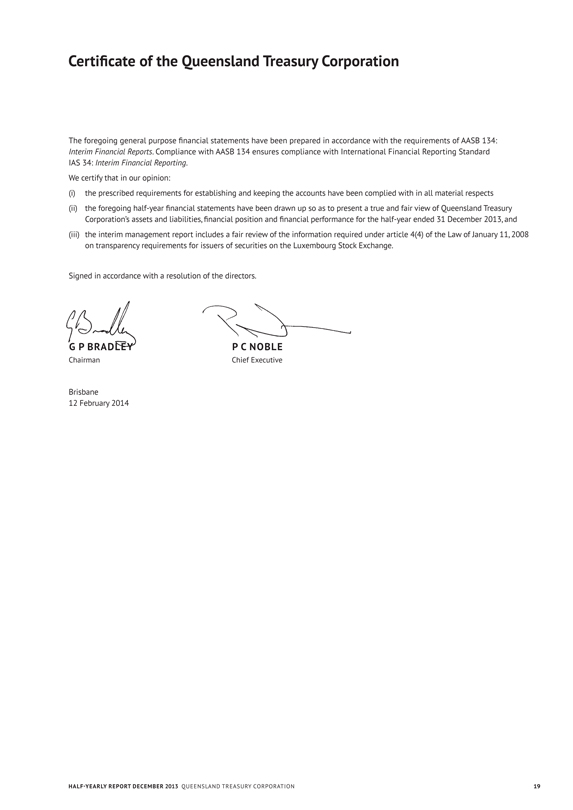
Certificate of the Queensland Treasury Corporation
The foregoing general purpose financial statements have been prepared in accordance with the requirements of AASB 134: Interim Financial Reports. Compliance with AASB 134 ensures compliance with International Financial Reporting Standard
IAS 34: Interim Financial Reporting. We certify that in our opinion:
(i) the prescribed requirements for establishing and keeping the accounts have been complied with in all material respects
(ii) the foregoing half-year financial statements have been drawn up so as to present a true and fair view of Queensland Treasury Corporation’s assets and liabilities, financial position and financial performance for the half-year ended 31 December 2013, and
(iii) the interim management report includes a fair review of the information required under article 4(4) of the Law of January 11, 2008 on transparency requirements for issuers of securities on the Luxembourg Stock Exchange.
Signed in accordance with a resolution of the directors.
G P BRADLEY P C NOBLE
Chairman Chief Executive
Brisbane
12 February 2014
HALF-YEARLY REPORT DECEMBER 2013 QUEENSLAND TREASURY CORPORATION 19
Independent Auditor’s review report
To the Capital Markets Board of Queensland Treasury Corporation
Review Report on the Half-year Financial Report
I have reviewed the accompanying half-year financial report of Queensland Treasury Corporation, which comprises the balance sheet as at 31 December 2013, and the statement of comprehensive income, statement of changes in equity and statement of cash flows for the half-year ended on that date, notes comprising a summary of significant accounting policies and other explanatory information, and the certificates given by the Chairman and Chief Executive.
The Corporation Sole’s responsibility for the Half-year Financial Report
The Corporation Sole is responsible for the preparation of the half-year financial report that gives a true and fair view in accordance with Australian Accounting Standards and for such internal control as the Corporation Sole determines is necessary to enable the preparation of the half-year financial report that gives a true and fair view and is free from material misstatement, whether due to fraud or error.
Auditor’s Responsibility
My responsibility is to express a conclusion on the half-year financial report based on my review. I conducted my review in accordance with the Auditor-General of Queensland Auditing Standards and Auditing Standard on Review Engagements ASRE 2410 Review of a Financial Report Performed by the Independent Auditor of the Entity, in order to state whether, on the basis of the procedures described, I have become aware of any matter that makes me believe that the half-year financial report is not in accordance with Australian Accounting Standards including: giving a true and fair view of Queensland Treasury Corporation’s financial position as at 31 December 2013 and its performance for the half-year ended on that date and complying with Accounting Standard AASB 134 Interim Financial Reporting. As the auditor of Queensland Treasury Corporation, ASRE 2410 requires that I comply with the ethical requirements relevant to the audit of the annual financial report.
A review of a half-year financial report consists of making enquiries, primarily of persons responsible for financial and accounting matters, and applying analytical and other review procedures. A review is substantially less in scope than an audit conducted in accordance with Australian Auditing Standards and consequently does not enable me to obtain assurance that I would become aware of all significant matters that might be identified in an audit. Accordingly, I do not express an audit opinion.
Independence
The Auditor-General Act 2009 promotes the independence of the Auditor-General and all authorised auditors. The Auditor-General is the auditor of all Queensland public sector entities and can be removed only by Parliament.
The Auditor-General may conduct a review in any way considered appropriate and is not subject to direction by any person about the way in which audit powers are to be exercised. The Auditor-General has for the purposes of conducting a review, access to all documents and property and can report to Parliament matters which in the Auditor-General’s opinion are significant.
Conclusion
Based on my review, which is not an audit, I have not become aware of any matter that makes me believe that the half-year financial report of Queensland Treasury Corporation does not present a true and fair view, in all material respects, of the financial position of Queensland Treasury Corporation as at 31 December 2013 and of its financial performance for the half-year ended on that date; and comply with Australian Accounting Standard AASB 134 Interim Financial Reporting.
Other Matters – Electronic Presentation of the Reviewed Financial Report
Those viewing an electronic presentation of these financial statements should note that the review does not provide assurance on the integrity of the information presented electronically and does not provide an opinion on any information which may be hyperlinked to or from the financial statements. If users of the financial statements are concerned with the inherent risks arising from electronic presentation of information, they are advised to refer to the printed copy of the reviewed financial statements to confirm the accuracy of this electronically presented information.
A M GREAVES FCA FCPA
Auditor-General of Queensland
Queensland Audit Office
Brisbane
20 QUEENSLAND TREASURY CORPORATION HALF-YEARLY REPORT DECEMBER 2013
Management report for the half-year ended 31 December 2013
Review of operations
QTC made an operating profit after tax for the half-year ended 31 December 2013 of AUD544.0 million consisting of the following operating segment results:
n Capital Markets Operations
During the period from 1 July 2013 to 31 December 2013, QTC continued in its ordinary course of business as the State of Queensland’s central financing authority and corporate treasury services provider. The operating profit after tax for the half-year ended 31 December 2013 for the Capital Markets Operations segment was AUD97.9 million.
n Long Term Assets
QTC holds a portfolio of assets which were transferred to QTC by the State Government under an administrative arrangement. These assets are the investments of QTC’s Long Term Assets segment and were accumulated to fund superannuation and other long-term obligations of the State such as insurance and long service leave. In return, QTC issued to the State fixed rate notes which has resulted in the State receiving a fixed rate of return on the notes, while QTC bears the impact of fluctuations in the value and returns on the asset portfolio. The operating profit after tax for the Long Term Assets segment was AUD446.0 million. The accumulated net losses incurred by the Long Term Assets segment to date have no impact on QTC’s capacity to meet its obligations as there is no cash flow effect for QTC. In addition, under the Queensland Treasury Corporation Act 1988, any losses of the Corporation shall be the responsibility of the Consolidated Fund of the Queensland Government.
Principal risks and uncertainties
After some volatility in the latter part of 2012-13, financial market conditions were generally favourable during the first half of 2013-14.
The key risks and uncertainties over the remainder of the year include how smoothly US monetary policy is normalised and how effectively the Australian economy re-balances away from investment in the resource sector, neither of which are expected to impact on QTC’s performance or its ability to fund the State’s borrowing requirement.
G P BRADLEY
Chairman
P C NOBLE
Chief Executive
Brisbane
12 February 2014
HALF-YEARLY REPORT DECEMBER 2013 QUEENSLAND TREASURY CORPORATION 21

22 QUEENSLAND TREASURY CORPORATION HALF-YEARLY REPORT DECEMBER 2013
APPENDICES
CONTENTS
Appendix A: Loans to clients 24
Appendix B: QTC’s 2013-14 indicative borrowing program 28
Appendix C: Contacts 29
AUDAX AT FIDELIS
QUEENSLAND TREASURY CORPORATION
23
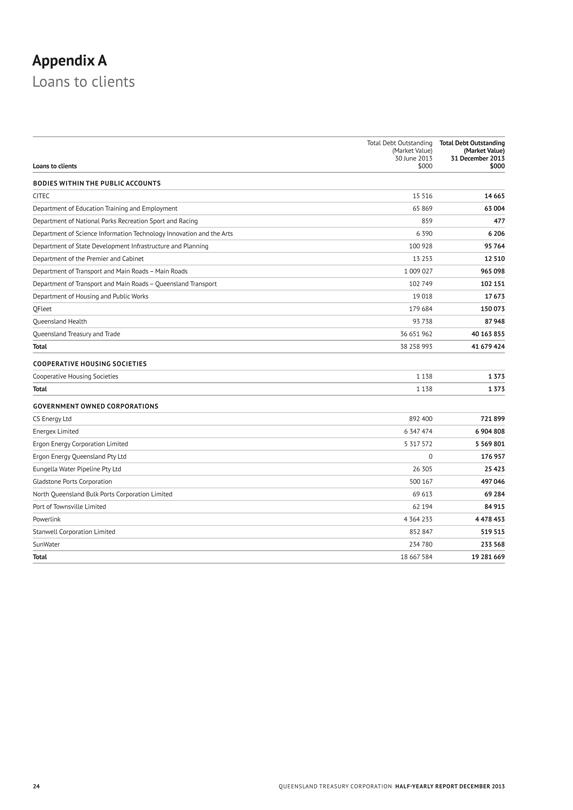
Appendix A
Loans to clients
Total Debt Outstanding (Market Value) 30 June 2013 $000
Total Debt Outstanding (Market Value) 31 December 2013 $000
Loans to clients
BODIES WITHIN THE PUBLIC ACCOUNTS
CITEC 15 516 14 665
Department of Education Training and Employment 65 869 63 004
Department of National Parks Recreation Sport and Racing 859 477
Department of Science Information Technology Innovation and the Arts 6 390 6 206
Department of State Development Infrastructure and Planning 100 928 95 764
Department of the Premier and Cabinet 13 253 12 510
Department of Transport and Main Roads – Main Roads 1 009 027 965 098
Department of Transport and Main Roads – Queensland Transport 102 749 102 151
Department of Housing and Public Works 19 018 17 673
QFleet 179 684 150 073
Queensland Health 93 738 87 948
Queensland Treasury and Trade 36 651 962 40 163 855
Total 38 258 993 41 679 424
COOPERATIVE HOUSING SOCIETIES
Cooperative Housing Societies 1 138 1 373
Total 1 138 1 373
GOVERNMENT OWNED CORPORATIONS
CS Energy Ltd 892 400 721 899
Energex Limited 6 347 474 6 904 808
Ergon Energy Corporation Limited 5 317 572 5 569 801
Ergon Energy Queensland Pty Ltd 0 176 957
Eungella Water Pipeline Pty Ltd 26 305 25 423
Gladstone Ports Corporation 500 167 497 046
North Queensland Bulk Ports Corporation Limited 69 613 69 284
Port of Townsville Limited 62 194 84 915
Powerlink 4 364 233 4 478 453
Stanwell Corporation Limited 852 847 519 515
SunWater 234 780 233 568
Total 18 667 584 19 281 669
24 QUEENSLAND TREASURY CORPORATION HALF-YEARLY REPORT DECEMBER 2013
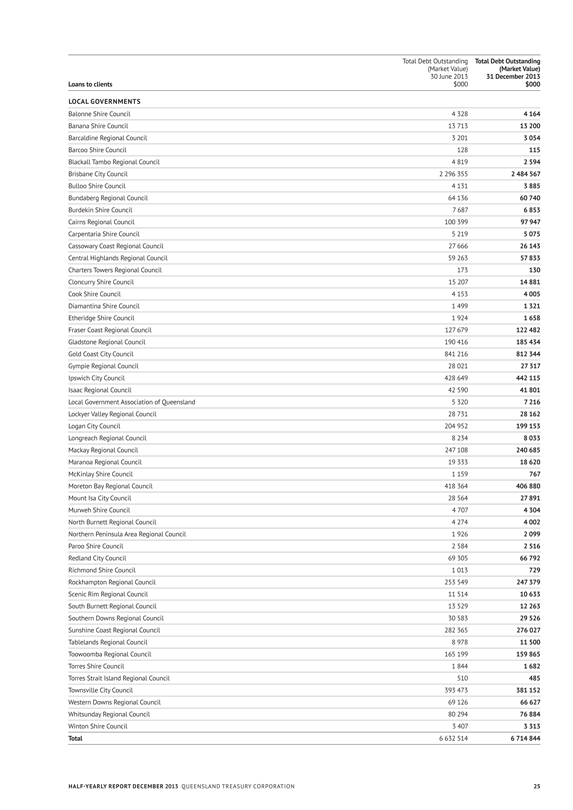
Total Debt Outstanding (Market Value) 30 June 2013
Total Debt Outstanding (Market Value) 31 December 2013
Loans to clients $000 $000
LOCAL GOVERNMENTS
Balonne Shire Council 4 328 4 164
Banana Shire Council 13 713 13 200
Barcaldine Regional Council 3 201 3 054
Barcoo Shire Council 128 115
Blackall Tambo Regional Council 4 819 2 594
Brisbane City Council 2 296 355 2 484 567
Bulloo Shire Council 4 131 3 885
Bundaberg Regional Council 64 136 60 740
Burdekin Shire Council 7 687 6 853
Cairns Regional Council 100 399 97 947
Carpentaria Shire Council 5 219 5 075
Cassowary Coast Regional Council 27 666 26 143
Central Highlands Regional Council 59 263 57 833
Charters Towers Regional Council 173 130
Cloncurry Shire Council 15 207 14 881
Cook Shire Council 4 153 4 005
Diamantina Shire Council 1 499 1 321
Etheridge Shire Council 1 924 1 658
Fraser Coast Regional Council 127 679 122 482
Gladstone Regional Council 190 416 185 434
Gold Coast City Council 841 216 812 344
Gympie Regional Council 28 021 27 317
Ipswich City Council 428 649 442 115
Isaac Regional Council 42 590 41 801
Local Government Association of Queensland 5 320 7 216
Lockyer Valley Regional Council 28 731 28 162
Logan City Council 204 952 199 153
Longreach Regional Council 8 234 8 033
Mackay Regional Council 247 108 240 685
Maranoa Regional Council 19 333 18 620
McKinlay Shire Council 1 159 767
Moreton Bay Regional Council 418 364 406 880
Mount Isa City Council 28 564 27 891
Murweh Shire Council 4 707 4 304
North Burnett Regional Council 4 274 4 002
Northern Peninsula Area Regional Council 1 926 2 099
Paroo Shire Council 2 584 2 516
Redland City Council 69 305 66 792
Richmond Shire Council 1 013 729
Rockhampton Regional Council 253 549 247 379
Scenic Rim Regional Council 11 514 10 633
South Burnett Regional Council 13 529 12 263
Southern Downs Regional Council 30 583 29 526
Sunshine Coast Regional Council 282 365 276 027
Tablelands Regional Council 8 978 11 500
Toowoomba Regional Council 165 199 159 865
Torres Shire Council 1 844 1 682
Torres Strait Island Regional Council 510 485
Townsville City Council 393 473 381 152
Western Downs Regional Council 69 126 66 627
Whitsunday Regional Council 80 294 76 884
Winton Shire Council 3 407 3 313
Total 6 632 514 6 714 844
HALF-YEARLY REPORT DECEMBER 2013 QUEENSLAND TREASURY CORPORATION 25
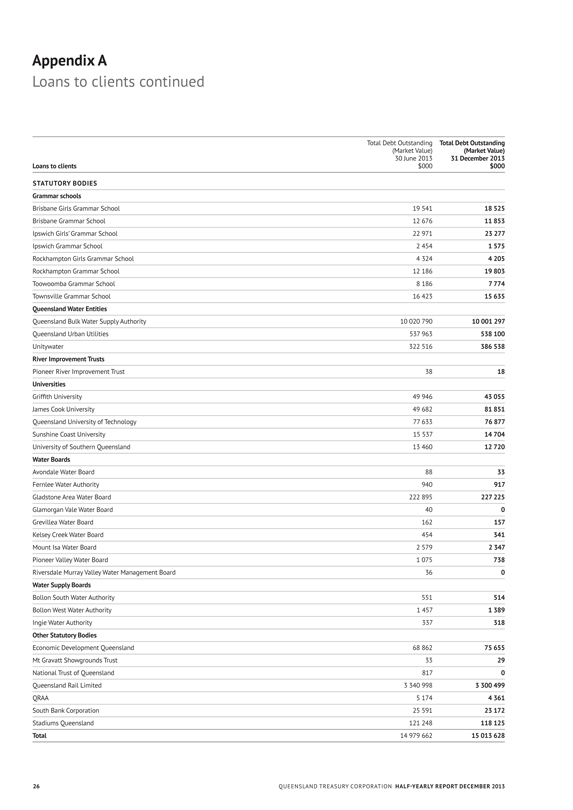
Appendix A
Loans to clients continued
Total Debt Outstanding (Market Value) 30 June 2013
Total Debt Outstanding (Market Value) 31 December 2013
Loans to clients $000 $000
STATUTORY BODIES
Grammar schools
Brisbane Girls Grammar School 19 541 18 525
Brisbane Grammar School 12 676 11 853
Ipswich Girls’ Grammar School 22 971 23 277
Ipswich Grammar School 2 454 1 575
Rockhampton Girls Grammar School 4 324 4 205
Rockhampton Grammar School 12 186 19 803
Toowoomba Grammar School 8 186 7 774
Townsville Grammar School 16 423 15 635
Queensland Water Entities
Queensland Bulk Water Supply Authority 10 020 790 10 001 297
Queensland Urban Utilities 537 963 538 100
Unitywater 322 516 386 538
River Improvement Trusts
Pioneer River Improvement Trust 38 18
Universities
Griffith University 49 946 43 055
James Cook University 49 682 81 851
Queensland University of Technology 77 633 76 877
Sunshine Coast University 15 537 14 704
University of Southern Queensland 13 460 12 720
Water Boards
Avondale Water Board 88 33
Fernlee Water Authority 940 917
Gladstone Area Water Board 222 895 227 225
Glamorgan Vale Water Board 40 0
Grevillea Water Board 162 157
Kelsey Creek Water Board 454 341
Mount Isa Water Board 2 579 2 347
Pioneer Valley Water Board 1 075 738
Riversdale Murray Valley Water Management Board 36 0
Water Supply Boards
Bollon South Water Authority 551 514
Bollon West Water Authority 1 457 1 389
Ingie Water Authority 337 318
Other Statutory Bodies
Economic Development Queensland 68 862 75 655
Mt Gravatt Showgrounds Trust 33 29
National Trust of Queensland 817 0
Queensland Rail Limited 3 340 998 3 300 499
QRAA 5 174 4 361
South Bank Corporation 25 591 23 172
Stadiums Queensland 121 248 118 125
Total 14 979 662 15 013 628
26 QUEENSLAND TREASURY CORPORATION HALF-YEARLY REPORT DECEMBER 2013
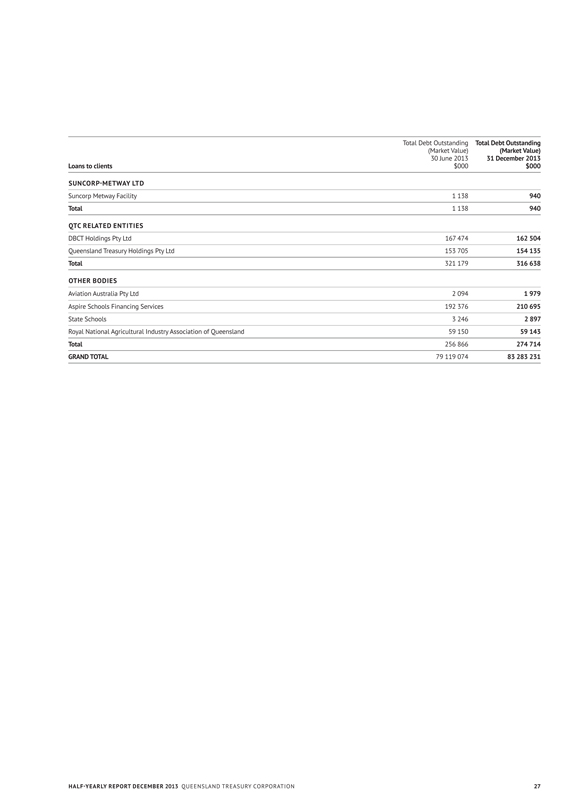
Total Debt Outstanding (Market Value) 30 June 2013
Total Debt Outstanding (Market Value) 31 December 2013
Loans to clients $000 $000
SUNCORP-METWAY LTD
Suncorp Metway Facility 1 138 940
Total 1 138 940
QTC RELATED ENTITIES
DBCT Holdings Pty Ltd 167 474 162 504
Queensland Treasury Holdings Pty Ltd 153 705 154 135
Total 321 179 316 638
OTHER BODIES
Aviation Australia Pty Ltd 2 094 1 979
Aspire Schools Financing Services 192 376 210 695
State Schools 3 246 2 897
Royal National Agricultural Industry Association of Queensland 59 150 59 143
Total 256 866 274 714
GRAND TOTAL 79 119 074 83 283 231
HALF-YEARLY REPORT DECEMBER 2013 QUEENSLAND TREASURY CORPORATION 27
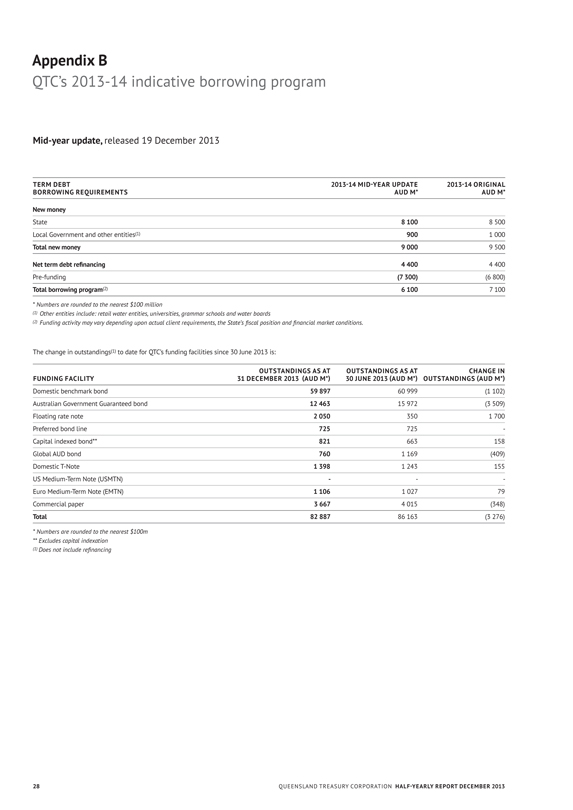
Appendix B
QTC’s 2013-14 indicative borrowing program
Mid-year update, released 19 December 2013
TERM DEBT 2013-14 MID-YEAR UPDATE 2013-14 ORIGINAL
BORROWING REQUIREMENTS AUD M* AUD M*
New money
State 8 100 8 500
Local Government and other entities(1) 900 1 000
Total new money 9 000 9 500
Net term debt refinancing 4 400 4 400
Pre-funding (7 300) (6 800)
Total borrowing program(2) 6 100 7 100
* Numbers are rounded to the nearest $100 million
(1) Other entities include: retail water entities, universities, grammar schools and water boards
(2) Funding activity may vary depending upon actual client requirements, the State’s fiscal position and financial market conditions.
The change in outstandings(1) to date for QTC’s funding facilities since 30 June 2013 is:
FUNDING FACILITY
OUTSTANDINGS AS AT 31 DECEMBER 2013 (AUD M*)
OUTSTANDINGS AS AT 30 JUNE 2013 (AUD M*)
CHANGE IN OUTSTANDINGS (AUD M*)
Domestic benchmark bond 59 897 60 999 (1 102)
Australian Government Guaranteed bond 12 463 15 972 (3 509)
Floating rate note 2 050 350 1 700
Preferred bond line 725 725 —
Capital indexed bond** 821 663 158
Global AUD bond 760 1 169 (409)
Domestic T-Note 1 398 1 243 155
US Medium-Term Note (USMTN) — — —
Euro Medium-Term Note (EMTN) 1 106 1 027 79
Commercial paper 3 667 4 015 (348)
Total 82 887 86 163 (3 276)
* Numbers are rounded to the nearest $100m
** Excludes capital indexation (1) Does not include refinancing
28 QUEENSLAND TREASURY CORPORATION HALF-YEARLY REPORT DECEMBER 2013
Appendix C
Contacts
QUEENSLAND TREASURY CORPORATION
Level 6, 123 Albert Street
Brisbane Queensland Australia
GPO Box 1096
Brisbane Queensland Australia 4001
Telephone: +61 7 3842 4600 Facsimile: +61 7 3221 4122 Email: enquiry@qtc.com.au Internet: www.qtc.com.au
Queensland Treasury Corporation’s annual and half-yearly reports (ISSN 1837-1256 print; ISSN 1837-1264 online) are available on QTC’s website at www.qtc.com.au/ qtc/public/annual-reports. If you would like a copy of a report posted to you, please call QTC’s Communication and Marketing Group on +61 7 3842 4714.
If you would like to comment on a report, please complete the online enquiry form located on our website.
Telephone
EXECUTIVE +61 7 3842 4611
BUSINESS SERVICES DIVISION
Risk Services Group +61 7 3842 4704
CLIENT SERVICES DIVISION
Local Government & Statutory Bodies Group +61 7 3842 4743
Strategic Partners Group +61 7 3842 4901
Treasury & Departments Group +61 7 3842 4798
CORPORATE SERVICES DIVISION
Client & Market Solutions Delivery +61 7 3842 4644
Communication & Marketing Group +61 7 3842 4714
Financial Solutions Group +61 7 3842 4833
Human Resources Group +61 7 3842 4761
Operations Group +61 7 3842 4877
FUNDING & MARKETS DIVISION
Funding & Liquidity Group +61 7 3842 4789
Market Strategy & Risk Group +61 7 3842 4789
STOCK REGISTRY (LINK MARKET SERVICES LTD) 1800 777 166
Interpreter
QTC is committed to providing accessible services to Queensland residents from culturally and linguistically diverse backgrounds. If you have difficulty understanding this report, please contact QTC’s Communication and Marketing Group on
+61 7 3842 4714 and we will arrange for an interpreter to assist you.
HALF-YEARLY REPORT DECEMBER 2013 QUEENSLAND TREASURY CORPORATION 29
Appendix C
Contacts continued
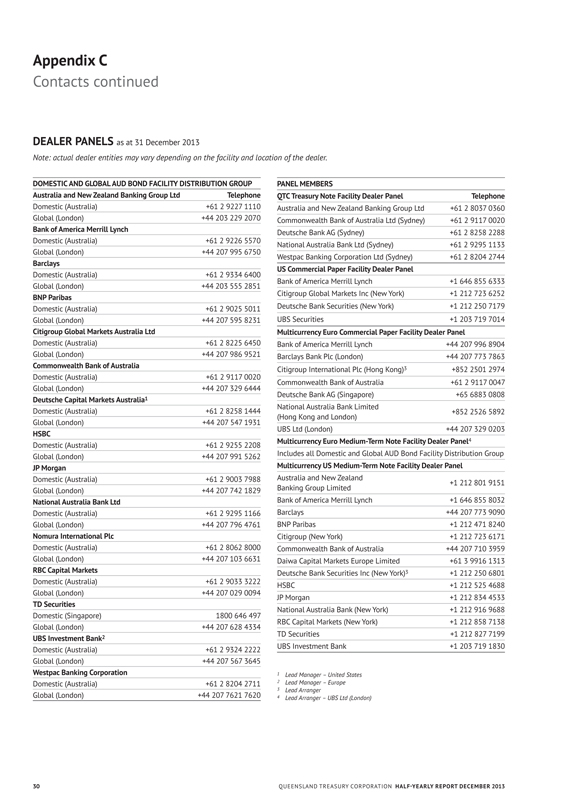
DEALER PANELS as at 31 December 2013
Note: actual dealer entities may vary depending on the facility and location of the dealer.
DOMESTIC AND GLOBAL AUD BOND FACILITY DISTRIBUTION GROUP
Australia and New Zealand Banking Group Ltd Telephone
Domestic (Australia) +61 2 9227 1110
Global (London) +44 203 229 2070
Bank of America Merrill Lynch
Domestic (Australia) +61 2 9226 5570
Global (London) +44 207 995 6750
Barclays
Domestic (Australia) +61 2 9334 6400
Global (London) +44 203 555 2851
BNP Paribas
Domestic (Australia) +61 2 9025 5011
Global (London) +44 207 595 8231
Citigroup Global Markets Australia Ltd
Domestic (Australia) +61 2 8225 6450
Global (London) +44 207 986 9521
Commonwealth Bank of Australia
Domestic (Australia) +61 2 9117 0020
Global (London) +44 207 329 6444
Deutsche Capital Markets Australia1
Domestic (Australia) +61 2 8258 1444
Global (London) +44 207 547 1931
HSBC
Domestic (Australia) +61 2 9255 2208
Global (London) +44 207 991 5262
JP Morgan
Domestic (Australia) +61 2 9003 7988
Global (London) +44 207 742 1829
National Australia Bank Ltd
Domestic (Australia) +61 2 9295 1166
Global (London) +44 207 796 4761
Nomura International Plc
Domestic (Australia) +61 2 8062 8000
Global (London) +44 207 103 6631
RBC Capital Markets
Domestic (Australia) +61 2 9033 3222
Global (London) +44 207 029 0094
TD Securities
Domestic (Singapore) 1800 646 497
Global (London) +44 207 628 4334
UBS Investment Bank2
Domestic (Australia) +61 2 9324 2222
Global (London) +44 207 567 3645
Westpac Banking Corporation
Domestic (Australia) +61 2 8204 2711
Global (London) +44 207 7621 7620
PANEL MEMBERS
QTC Treasury Note Facility Dealer Panel Telephone
Australia and New Zealand Banking Group Ltd +61 2 8037 0360
Commonwealth Bank of Australia Ltd (Sydney) +61 2 9117 0020
Deutsche Bank AG (Sydney) +61 2 8258 2288
National Australia Bank Ltd (Sydney) +61 2 9295 1133
Westpac Banking Corporation Ltd (Sydney) +61 2 8204 2744
US Commercial Paper Facility Dealer Panel
Bank of America Merrill Lynch +1 646 855 6333
Citigroup Global Markets Inc (New York) +1 212 723 6252
Deutsche Bank Securities (New York) +1 212 250 7179
UBS Securities +1 203 719 7014
Multicurrency Euro Commercial Paper Facility Dealer Panel
Bank of America Merrill Lynch +44 207 996 8904
Barclays Bank Plc (London) +44 207 773 7863
Citigroup International Plc (Hong Kong)3 +852 2501 2974
Commonwealth Bank of Australia +61 2 9117 0047
Deutsche Bank AG (Singapore) +65 6883 0808
National Australia Bank Limited +852 2526 5892
(Hong Kong and London)
UBS Ltd (London) +44 207 329 0203
Multicurrency Euro Medium-Term Note Facility Dealer Panel4
Includes all Domestic and Global AUD Bond Facility Distribution Group
Multicurrency US Medium-Term Note Facility Dealer Panel
Australia and New Zealand +1 212 801 9151
Banking Group Limited
Bank of America Merrill Lynch +1 646 855 8032
Barclays +44 207 773 9090
BNP Paribas +1 212 471 8240
Citigroup (New York) +1 212 723 6171
Commonwealth Bank of Australia +44 207 710 3959
Daiwa Capital Markets Europe Limited +61 3 9916 1313
Deutsche Bank Securities Inc (New York)3 +1 212 250 6801
HSBC +1 212 525 4688
JP Morgan +1 212 834 4533
National Australia Bank (New York) +1 212 916 9688
RBC Capital Markets (New York) +1 212 858 7138
TD Securities +1 212 827 7199
UBS Investment Bank +1 203 719 1830
1 Lead Manager – United States
2 Lead Manager – Europe
3 Lead Arranger
4 Lead Arranger – UBS Ltd (London)
30 QUEENSLAND TREASURY CORPORATION HALF-YEARLY REPORT DECEMBER 2013
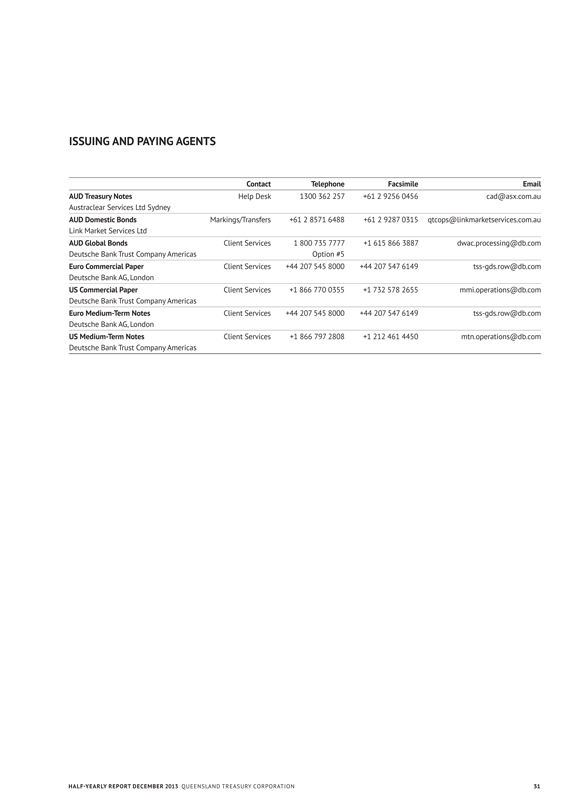
ISSUING AND PAYING AGENTS
Contact Telephone Facsimile Email
AUD Treasury Notes Help Desk 1300 362 257 +61 2 9256 0456 cad@asx.com.au
Austraclear Services Ltd Sydney
AUD Domestic Bonds Markings/Transfers +61 2 8571 6488 +61 2 9287 0315 qtcops@linkmarketservices.com.au
Link Market Services Ltd
AUD Global Bonds Client Services 1 800 735 7777 +1 615 866 3887 dwac.processing@db.com
Deutsche Bank Trust Company Americas
Option #5
Euro Commercial Paper Client Services +44 207 545 8000 +44 207 547 6149 tss-gds.row@db.com
Deutsche Bank AG, London
US Commercial Paper Client Services +1 866 770 0355 +1 732 578 2655 mmi.operations@db.com
Deutsche Bank Trust Company Americas
Euro Medium-Term Notes Client Services +44 207 545 8000 +44 207 547 6149 tss-gds.row@db.com
Deutsche Bank AG, London
US Medium-Term Notes Client Services +1 866 797 2808 +1 212 461 4450 mtn.operations@db.com
Deutsche Bank Trust Company Americas
HALF-YEARLY REPORT DECEMBER 2013 QUEENSLAND TREASURY CORPORATION 31

AUDAX AT FIDELIS
QUEENSLAND TREASURY CORPORATION
Level 6 123 Albert Street Brisbane GPO Box 1096 Brisbane
Queensland Australia 4001
Telephone: +61 7 3842 4600
Facsimile: +61 7 3221 4122 www.qtc.com.au
© Queensland Treasury Corporation 2014