EXHIBIT (c)(xii)
Report entitled “State Budget 2014-15 Mid Year Fiscal and Economic Review”.
| | |
| | Queensland Treasury and Trade |
| |
The 2014-15 Mid Year Fiscal and Economic Review (MYFER) demonstrates the benefits of the Government’s continuing expenditure discipline, with fiscal surpluses projected from 2015-16 onwards, despite further write-downs in revenue forecasts. However, the outlook for relatively modest revenue growth, and the risks to the revenue outlook, indicate the need for ongoing control of spending.
Projected debt levels have been revised down since the 2014-15 Budget, reflecting the tight expenditure control, and lower than estimated debt levels in 2013-14. However, debt continues to increase in each year beyond 2013-14 and remains substantially higher than in other states.
The Government’s Strongest and Smartest Choice Final Plan to reduce this debt anticipates proceeds of $37 billion associated with the lease of certain electricity, port and water assets. The plan proposes that $25 billion of this amount be utilised to reduce State debt, with $8.6 billion to be allocated to fund the Strong Choices Future Investment Program and $3.4 billion to fund the Strong Choices Cost of Living Fund. The Government’s plan is contingent on receiving a mandate at the next State election. Accordingly, the plan has not been incorporated into the 2014-15 MYFER.
As the Independent Queensland Commission of Audit found in its Interim Report in June 2012, Queensland’s debt levels were low and stable up until 2006-07, with the majority of the State’s debt held by Government owned corporations. Between 2006-07 and 2013-14, General Government sector debt increased from $2.3 billion to $41.4 billion, as shown in Chart 1.
Chart 1: Queensland’s debt, 2001-02 to 2017-18
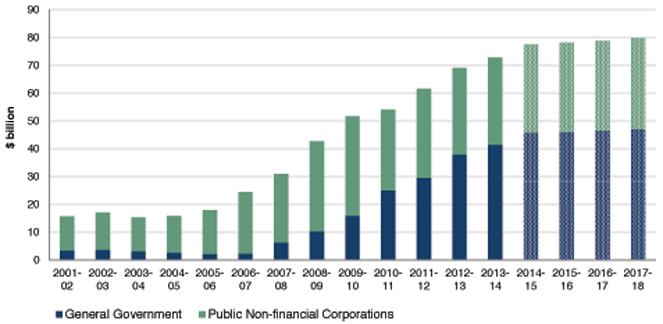
Source: Queensland Report on State Finances until 2013-14. 2014-15 onwards are MYFER projections.
| | | | |
| | Mid Year Fiscal and Economic Review | | 1 |
| | |
The driver of the debt increases has been the accumulation of fiscal deficits, as shown in Chart 2.
Chart 2: General Government fiscal balance
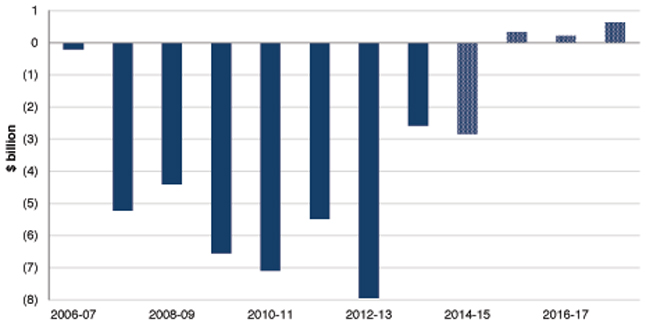
Source: Queensland Report on State Finances until 2013-14. 2014-15 onwards are MYFER projections.
In response to the rapid deterioration in Queensland’s debt and deficit position, the Government implemented a new fiscal strategy in the 2012-13 Budget and has undertaken significant fiscal repair measures. These measures totalled $7.8 billion over the 2012-13 to 2015-16 period ($6.9 billion since the Government came to power, including those in the 2014-15 MYFER).
As a result of these measures, and associated expenditure control, 2013-14 represented the smallest fiscal deficit since 2006-07. A deficit of a similar magnitude is forecast in 2014-15, with fiscal surpluses projected from 2015-16 onwards.
The return to surplus in 2015-16 is projected despite reductions in key revenue sources of $5.9 billion in underlying terms, over the period 2012-13 to 2015-16, since the 2012-13 Budget.
Effective control of expenditure is a critical element of fiscal repair, especially in an environment of subdued revenue growth. Actual expenses in the General Government sector in 2013-14 were $198 million lower than in 2012-13. While controlling expenses growth, productivity improvements have allowed for the delivery of enhanced services.
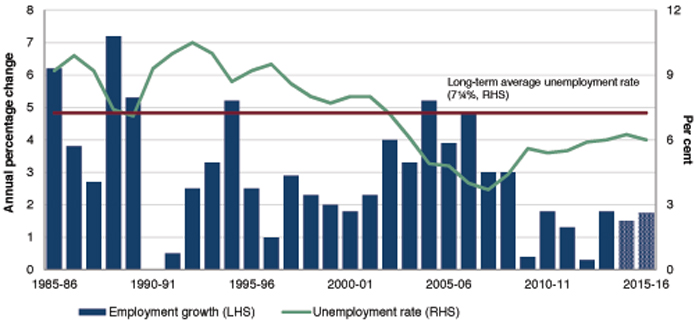
This is the first decline in expenses since accrual accounting commenced in 1998-99 and contrasts with average expenses growth of 8.9% per annum in the decade to 2011-12, as shown in Chart 3. A fall in actual employee expenses in 2013-14 of 1.7% (or $313 million) has made a major contribution to this outcome, and contrasts with average employee expenses growth of 8.6% per annum in the decade to 2011-12.
Chart 3: Average General Government expense growth
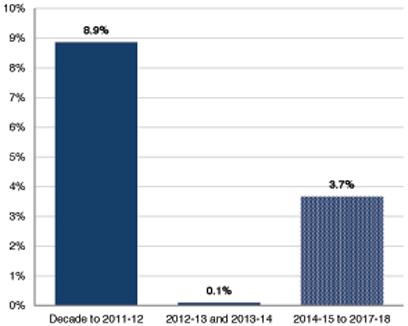
Source: Queensland Treasury and Trade.
| | |
| | Queensland Treasury and Trade |
| |
The Government’s fiscal principles, especially achieving and maintaining a General Government sector fiscal balance, and stabilising then significantly reducing debt, have provided a clear focus and objective for policy.
The 2014-15 MYFER consolidates fiscal repair, and demonstrates that announced measures are showing results, albeit under the burden of high levels of debt. Chart 4 shows the improvement in the General Government fiscal balance over the period 2012-13 to 2015-16 attributable to fiscal repair measures implemented by the Government.
Chart 4: Improvement in fiscal balance with Government measures
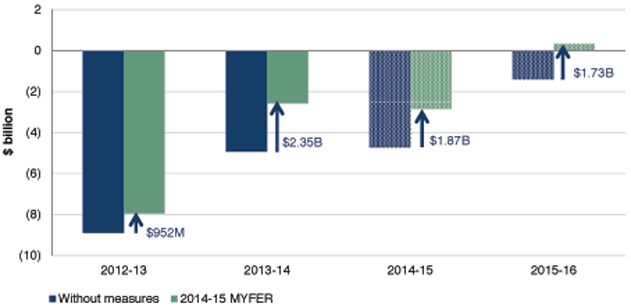
Source: Queensland Treasury and Trade.
Net measures since the election in March 2012 are delivering savings of around $6.9 billion in the General Government sector over the period 2012-13 to 2015-16. These measures, in combination with ongoing expenditure control, have resulted in Non-financial Public sector (NFPS) borrowings at 30 June 2016 being projected to be $11.6 billion lower than the comparable estimate in the Independent Commission of Audit’s Interim Report, as shown in Table 1.
| | | | | | | | | | | | |
| Table 1: Non-financial Public sector – revisions to gross borrowings | | | | | | | | | |
| | | 2013-14
$ million | | | 2014-15
$ million | | | 2015-16
$ million | |
CoA Interim Report1 | | | 82,293 | | | | 86,326 | | | | 89,838 | |
2014-15 Budget | | | 76,123 | | | | 79,956 | | | | 80,619 | |
2014-15 MYFER2 | | | 72,716 | | | | 77,553 | | | | 78,241 | |
Reduction since CoA | | | 9,577 | | | | 8,773 | | | | 11,597 | |
Notes: 1. Independent Commission of Audit (CoA) Interim Report borrowing numbers have been adjusted to ensure comparability with the 2014-15 Budget and MYFER. 2. 2013-14 figure is as per the 2013-14 Outcomes Report. | |
The improvement in the 2013-14 outcome provides a positive base effect, which means that General Government borrowings are now expected to remain lower than projected in the 2014-15 Budget, despite the 2014-15 MYFER projecting a small deterioration in the fiscal balance across the forward estimates.
| | | | |
| | Mid Year Fiscal and Economic Review | | 3 |
| | |
Although debt is forecast to grow slowly over the forward estimates, a significant reduction in debt level is not projected under current policy settings. Consequently, as shown in Charts 5 and 6, Queensland currently has, and will continue to have, considerably more debt than its peers, again noting that these projections do not incorporate the Government’s Strongest and Smartest Choice Final Plan.
Chart 5: Interstate comparison of debt to revenue ratios1
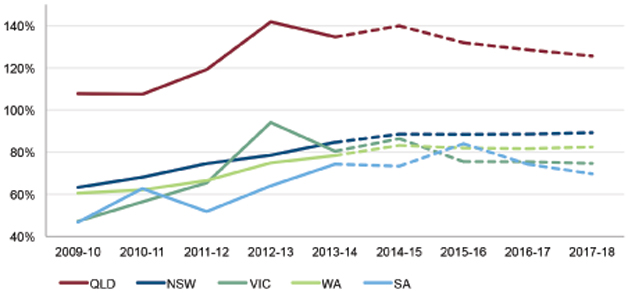
Note:
1. Borrowings divided by total revenue (NFPS).
Source: ABS 5512.0, Report on State Finances and latest Budget Updates.
Chart 6: Borrowings per capita at 30 June 2014
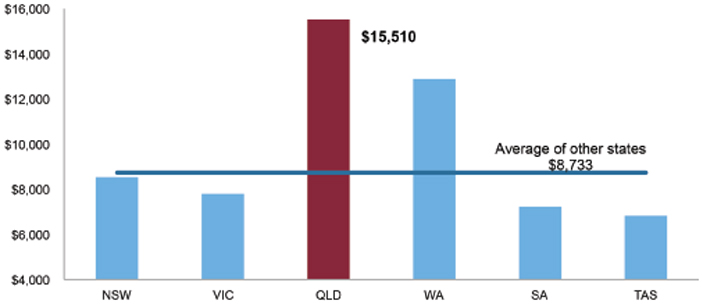
Source: State 2013-14 Final Budget Outcomes – NFPS borrowings. Population from ABS 3101.0.
| | |
| | Queensland Treasury and Trade |
| |
Many of the risks to the Queensland economic outlook identified in the 2014-15 Budget have materialised over the second half of 2014. In particular, the growth outlook in major advanced economies has weakened and commodity prices have fallen, constraining household income and spending growth and tempering the expected recovery in labour market conditions.
The Queensland economy is in a period of transition, as construction of the large liquefied natural gas (LNG) projects nears completion ahead of the production and export phase. While there continues to be a significant amount of investment in these projects, the level has begun to decline, detracting from growth. Reflecting these domestic and global trends, economic growth in Queensland slowed to 2.3% in 2013-14, slightly below the national average, following two consecutive years of stronger growth (Chart 7).
The Queensland economy is forecast to grow by 2 1⁄2% in 2014-15, strengthening to 5 3⁄4% in 2015-16. This compares to Commonwealth Treasury forecasts for national growth of 2 1⁄2% for 2014-15 and 3% for 2015-16 in the 2014-15 Mid Year Economic and Fiscal Outlook. Based on the latest state government publications, as at 17 December 2014, Queensland is expected to have the fastest growing state economy in 2015-16.
While the recovery in dwelling investment in Queensland is expected to be broadly in line with that forecast in the 2014-15 Budget, household consumption growth is now likely to be softer. Resources and agricultural exports are also expected to be weaker than at Budget time, the latter reflecting the impact of the ongoing drought. A slowdown in population growth is a further restraint on overall growth.
Consistent with the outlook in the 2014-15 Budget, the resources sector is shifting from the investment phase towards the export phase. For three years, business investment has been boosted by capital investment in LNG projects, totalling more than $60 billion. With investment having peaked in 2013, other sectors of the economy, especially exports, will increasingly contribute to growth in coming years.
Chart 7: Real economic growth1, Queensland and Australia (annual percentage change)
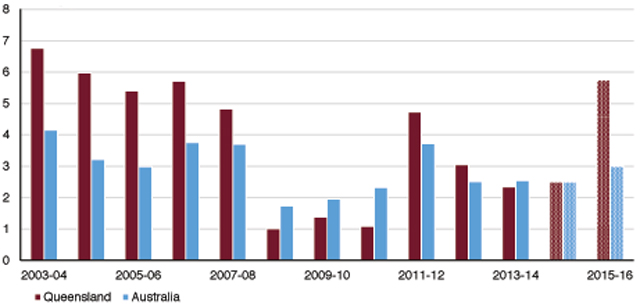
Note:
1. CVM, 2012-13 reference year. 2014-15 and 2015-16 are forecasts.
Source: ABS 5220.0; Queensland Treasury and Trade, Australian Treasury 2014-15 MYEFO.
| | | | |
| | Mid Year Fiscal and Economic Review | | 5 |
| | |
| 3.1 | International conditions |
The growth outlook for Queensland’s major trading partners for 2014 and 2015 has softened slightly since the 2014-15 Budget, to be 3.5% and 3.9% respectively. This compares to an average annual rate of growth of 4.8% over the decade to 2007, the year before the onset of the GFC. As shown in Table 2, the main reason for this revision is lower growth in the major advanced economies of Japan, Europe and the US in 2014, and non-Japan Asia.
| | | | | | | | | | | | | | | | | | | | |
| Table 2: Queensland’s major trading partner GDP forecasts1 | | | | | | | | | | | | | | | |
| | | 2013 | | | 2014 | | | 2015 | |
| | | Estimate
% | | | Budget
% | | | Current
% | | | Budget
% | | | Current
% | |
Non-Japan Asia2 | | | 5.0 | | | | 5.3 | | | | 5.2 | | | | 5.5 | | | | 5.4 | |
China | | | 7.7 | | | | 7.3 | | | | 7.3 | | | | 7.2 | | | | 7.0 | |
India | | | 4.7 | | | | 5.4 | | | | 5.6 | | | | 6.0 | | | | 6.3 | |
Japan | | | 1.5 | | | | 1.3 | | | | 0.3 | | | | 1.3 | | | | 1.2 | |
Europe3 | | | 0.1 | | | | 1.6 | | | | 1.3 | | | | 1.7 | | | | 1.6 | |
US | | | 2.2 | | | | 2.5 | | | | 2.3 | | | | 3.1 | | | | 3.0 | |
Total | | | 3.5 | | | | 3.8 | | | | 3.5 | | | | 4.0 | | | | 3.9 | |
Notes: 1. Country weights have been updated since the 2014-15 budget, now based on average export values for the five year period to June 2014. 2. Includes New Zealand. Note that forecasts for India are based on India’s fiscal year (starting April 1). 3. Includes United Kingdom. Source: Queensland Treasury and Trade; Consensus Economics. | |
As the global outlook has softened, commodity prices have fallen during 2014. The fall in oil prices since mid-2014 will be reflected in lower prices for LNG exports (which are directly linked to oil prices). While the Australian dollar (A$) has depreciated during 2014, this has not matched the fall in commodity prices, resulting in constrained growth in domestic income and profits from exports.
Changes in international conditions have, in turn, led to slower growth in household income and consumption. In 2013-14, household consumption grew by 2.2% compared with an historical average of 4.2%. Continued modest income growth and ongoing consumer caution are likely to see household consumption grow more slowly in 2014-15 and 2015-16 than expected at Budget. With household consumption accounting for more than half of gross state product (GSP), this will have a material impact on overall economic growth.
Dwelling investment grew by 4.5% in 2013-14, after six consecutive years of decline. Growth in 2014-15 and 2015-16 is likely to be similar to the Budget forecasts, with favourable yields relative to Sydney and Melbourne and continued low borrowing costs encouraging strong investment in medium to high density dwellings. Residential property prices in Brisbane have recovered to be 4.2% above their last peak in June 2010, however, the rate of price increases has been moderate.
As a result, incentives for participants to enter the owner-occupier market - to avoid increases in prices - are not as strong as in episodes in the previous decade and so investment growth in this segment of the market is expected to be more modest.
Construction of the three large CSG-to-LNG projects is reaching completion and low commodity prices have meant that no significant new projects have commenced elsewhere in the resources sector. As a result, resources investment will continue to fall over the forecast period. Growth in non-resources investment is anticipated to gradually strengthen from 2014-15, but not enough to prevent further falls in total business investment.
| | |
| | Queensland Treasury and Trade |
| |
Coal prices are forecast to be lower than expected at the time of the 2014-15 Budget, as weaker than expected global growth has adversely affected coal prices in 2014. Prices are forecast to remain subdued in the near term, before recovering somewhat in the medium term in line with expected improvements in global economic growth. Coal export volumes are forecast to increase at a softer pace than previously expected due, in part, to a reduction in exports to China as its government addresses pollution concerns.
Base metal exports are forecast to be somewhat lower than expected in the 2014-15 Budget due to the impact on output of lower than expected mine grades.
The ramp up in LNG production will drive a surge in overseas exports in 2015-16. However, the recent slump in oil prices and delays in production have lowered expected LNG export values relative to Budget over the forecast period.
After posting a strong rebound of 13.3% in 2012-13, overseas tourist nights remained at elevated levels in 2013-14. Overseas tourism exports are expected to grow, supported by the easing in the A$ and increasing popularity of overseas travel by Chinese tourists. Exports of education services are also expected to continue to pick up over the forecast period.
With the outcomes and forecasts of overall economic growth now below those published in the 2014-15 Budget, the pace of recovery in the labour market will also be weaker than previously expected.
Employment conditions are still expected to continue to improve in the remainder of 2014-15, although the extent of improvement is unlikely to be strong enough to achieve the Budget forecasts. Year-average employment growth is now expected to be around 1 1⁄2% in 2014-15 and 1 3⁄4% in 2015-16.
Recent labour market data have also revealed a lower than expected labour force participation rate, although not enough to prevent the forecast year-average unemployment rate in 2014-15 and 2015-16 being higher than in the Budget.
Chart 8: Queensland labour market1
Note:
1. 2014-15 and 2015-16 are forecasts.
Source: ABS 6202.0; Queensland Treasury and Trade.
| | | | |
| | Mid Year Fiscal and Economic Review | | 7 |
| | |
Reflecting the overall softer economic conditions, forecasts for wages growth have also been revised down since the Budget, while the 1⁄4 percentage point reduction in inflation in 2014-15 reflects the removal of the carbon tax.
Table 3 shows the MYFER forecasts for key economic variables in 2014-15 and 2015-16, compared with Budget forecasts.
| | | | | | | | | | | | | | | | | | | | |
| Table 3: Economic forecasts, Queensland (year average, original terms) | |
| | | 2013-14 | | | 2014-15 | | | 2015-16 | |
| Parameter | | Outcome | | | Budget | | | MYFER | | | Budget | | | MYFER | |
Real GSP | | | 2.3 | | | | 3 | | | | 2 1⁄2 | | | | 6 | | | | 5 3⁄4 | |
Employment | | | 1.8 | | | | 2 | | | | 1 1⁄2 | | | | 2 1⁄4 | | | | 1 3⁄4 | |
Unemployment rate | | | 6.0 | | | | 6 | | | | 6 1⁄4 | | | | 5 3⁄4 | | | | 6 | |
CPI | | | 2.8 | | | | 2 3⁄4 | | | | 2 1⁄2 | | | | 2 1⁄2 | | | | 2 1⁄2 | |
Wage Price Index | | | 2.6 | | | | 3 | | | | 2 1⁄2 | | | | 3 1⁄4 | | | | 3 | |
Population1 | | | 1 3⁄4 | | | | 2 | | | | 1 3⁄4 | | | | 2 | | | | 1 3⁄4 | |
Note: 1. Population growth in 2013-14 is the Budget forecast, as June quarter 2014 data were not available at the time of printing. Source: ABS 3101.0, 5220.0, 6202.0, 6345.0, 6401.0, and Queensland Treasury and Trade. | |
| | |
| | Queensland Treasury and Trade |
| |
| | | | | | | | | | | | | | | | | | | | | | | | |
| Table 4: General Government sector – key financial aggregates1 | |
| | | 2013-14 | | | 2014-15 | | | 2014-15 | | | 2015-16 | | | 2016-17 | | | 2017-18 | |
| | | Actual | | | Budget | | | Revised | | | Projection | | | Projection | | | Projection | |
| | | $ million | | | $ million | | | $ million | | | $ million | | | $ million | | | $ million | |
Revenue | | | 46,734 | | | | 50,120 | | | | 49,149 | | | | 52,951 | | | | 54,510 | | | | 56,270 | |
Expenses | | | 46,115 | | | | 49,933 | | | | 49,213 | | | | 49,873 | | | | 51,390 | | | | 53,259 | |
Net operating balance | | | 619 | | | | 188 | | | | (64 | ) | | | 3,078 | | | | 3,120 | | | | 3,011 | |
Fiscal balance | | | (2,581 | ) | | | (2,271 | ) | | | (2,842 | ) | | | 331 | | | | 216 | | | | 634 | |
Gross Borrowing (NFPS)2 | | | 72,716 | | | | 79,956 | | | | 77,553 | | | | 78,241 | | | | 78,840 | | | | 79,792 | |
Notes: 1. Numbers may not add due to rounding. 2. NFPS: Non-financial Public sector. | |
The 2013-14 fiscal balance improved by $3.502 billion from the estimated actual included in the 2014-15 Budget. This improvement reflected revenue being $1.883 billion higher than estimated, primarily associated with the Australian Government providing a $1.5 billion prepayment of Natural Disaster Relief and Recovery Arrangements (NDRRA) funding. In addition, expenses were $1.034 billion lower than estimated in the 2014-15 Budget, while capital purchases were $312 million lower.
The General Government fiscal balance expected for 2014-15 is a deficit of $2.842 billion compared to a forecast deficit of $2.271 billion at the time of the 2014-15 Budget. The deterioration in the 2014-15 fiscal balance position primarily reflects the change in timing of NDRRA funding from 2014-15 to 2013-14, and the consequent mismatch with NDRRA expenditure.
The forecast General Government sector fiscal balances are expected to be weaker than published in the 2014-15 Budget, but nevertheless remain on track to return to surpluses in 2015-16 and the further two years of the forward estimates period. Table 5 provides a breakdown of the movements in the net operating and fiscal balances since the 2014-15 Budget.
| | | | | | | | | | | | | | | | |
| Table 5: Reconciliation of net operating balance and fiscal balance, 2014-15 Budget to 2014-15 MYFER1 | |
| | | 2014-15 | | | 2015-16 | | | 2016-17 | | | 2017-18 | |
| | | $ million | | | $ million | | | $ million | | | $ million | |
| Net Operating Balance | |
2014-15 Budget net operating balance | | | 188 | | | | 3,188 | | | | 3,534 | | | | 2,968 | |
Taxation revisions | | | 143 | | | | (52 | ) | | | (170 | ) | | | (294 | ) |
Royalty revisions | | | (340 | ) | | | (464 | ) | | | (461 | ) | | | (185 | ) |
Natural disaster revisions | | | (1,233 | ) | | | (168 | ) | | | (417 | ) | | | - | |
Net flows from PNFC and PFC entities | | | 301 | | | | 180 | | | | 198 | | | | 90 | |
Policy measures | | | (98 | ) | | | (54 | ) | | | (36 | ) | | | (27 | ) |
Other parameter adjustments2 | | | 974 | | | | 448 | | | | 471 | | | | 459 | |
2014-15 MYFER net operating balance | | | (64 | ) | | | 3,078 | | | | 3,120 | | | | 3,011 | |
| Fiscal Balance | |
2014-15 Budget fiscal balance | | | (2,271 | ) | | | 862 | | | | 508 | | | | 883 | |
Change in net operating balance | | | (252 | ) | | | (110 | ) | | | (414 | ) | | | 43 | |
Other capital movements | | | (319 | ) | | | (421 | ) | | | 122 | | | | (292 | ) |
2014-15 MYFER fiscal balance | | | (2,842 | ) | | | 331 | | | | 216 | | | | 634 | |
Note: 1. Numbers may not add due to rounding. Denotes impact on the operating and fiscal balances. 2. Refers to adjustments largely of a non-policy nature, primarily changes in interest expenses, depreciation, growth funding, swaps, deferrals and administered revenue. | |
| | | | |
| | Mid Year Fiscal and Economic Review | | 9 |
| | |
Royalty revenue has been revised down across the forward estimates, reflecting a weaker outlook for coal prices, a delay in the commencement of LNG exports and a weaker outlook for LNG export prices, which are linked to the price of oil. These factors are partly offset by a decline in the Australian Dollar – US Dollar exchange rate.
Taxation revenue has been revised up in 2014-15, reflecting strength in the property market. However, from 2015-16 onwards this is more than offset by a weaker outlook for payroll tax, consistent with a more subdued outlook for employment and wages growth.
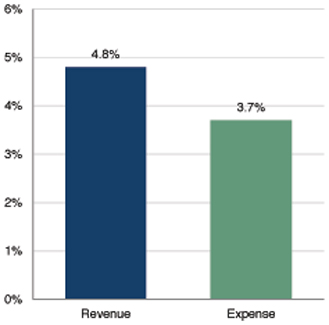
Tight spending control and lower interest expenses are partly offsetting the softening in revenue. Nevertheless, as shown in Chart 9, average revenue growth outpaces average expense growth across the forward estimates.
The return to fiscal surplus continues to be driven by the savings measures contained in the 2012-13 Budget. This is supported by the Government continuing to actively manage spending, with General Government expenses expected to grow by an average of 3.7% per annum from 2014-15 to 2017-18, compared with average expenses growth of 8.9% per annum in the decade to 2011-12.
Chart 9: General Government average revenue and expense growth rates, 2014-15 to 2017-18
Source: Queensland Treasury and Trade.
Expenses in 2014-15 are expected to be $49.213 billion, $720 million (or 1.4%) lower than the Budget estimates.
Expenses over the period 2014-15 to 2017-18 are expected to be $2.034 billion less than expected at the 2014-15 Budget. This is due to a combination of factors, including the base effect of lower than estimated expenditure in 2013-14, tight spending control and lower estimates of interest expenses, reflecting both lower debt levels and interest rates.
The Government continues to ensure that expenses growth is contained. General Government expenses are forecast to grow by an average of 3.7% per annum for the four years 2014-15 to 2017-18, significantly less than the 8.9% of the decade to 2011-12.
For the four years 2014-15 to 2017-18, employee expenses are expected to grow by 3.8% per annum on average, after having fallen for the past two years.
General Government revenue in 2014-15 is estimated to be $49.149 billion, $971 million less than the 2014-15 Budget estimate. This primarily reflects downward revisions to grants from the Australian Government due to the prepayment of NDRRA funding in 2013-14 and also coal royalties, associated with the weaker outlook for coal prices. Nevertheless, revenue is expected to grow by 5.2% in 2014-15, following growth of 11.9% in 2013-14. For the four years 2014-15 to 2017-18 revenue is estimated to grow by an average of 4.8% per annum.
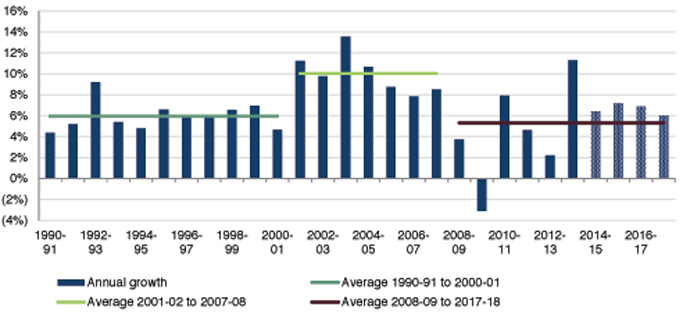
For most of the previous decade, driven by strong conditions in the housing market and mining sector, Queensland enjoyed strong growth in key revenue sources, namely GST, taxation and mining royalties.
| | |
| | Queensland Treasury and Trade |
| |
As shown in Chart 10, these key revenue sources are expected to grow by 6.4% in 2014-15 and average a similar rate in the four years 2014-15 to 2017-18, well below levels of growth during most of the last decade. Nevertheless, the growth in revenue is projected to be higher than the growth in population and inflation.
Chart 10: Growth in key revenues
Source: Queensland Treasury and Trade.
Royalties continue to be a very volatile source of revenue, with contract prices, the exchange rate, and trading partner demand being key drivers of royalty collections.
Coal export volumes have been slightly above forecasts so far in 2014-15, but this has been more than offset by coal prices continuing to be weaker than forecast. The weakness in prices has been sharper and more sustained than expected.
The estimated premium hard coking coal price in the 2014-15 Budget was US$142 per tonne in 2014-15, consistent with the Consensus Economics forecasts available at the time the Budget was finalised. However, the current contract prices have been settled around US$20 lower, reflecting a 14% decline in the price.
Recognising this weaker price outlook, there are downward revisions to coal royalties totalling $1.153 billion (10.2%) across the forward estimates, with the largest reductions in 2015-16 and 2016-17. There has also been a decline in the royalty estimates for LNG, most notably in 2014-15 and 2015-16 reflecting recently announced production delays and significant reductions in LNG export prices, which are linked to the price of oil.
Partly offsetting these factors, the depreciation of the Australian Dollar has been faster than expected, with the assumption for 2014-15 revised down from 91 cents in the 2014-15 Budget to 87 cents at MYFER, and 84 cents in the medium term.
Over the period 2014-15 to 2017-18, taxation revenue has been revised down by $372 million, largely due to a weaker outlook for payroll tax associated with the more subdued outlook for employment and wages growth forecasts. This has been partially offset by expected stronger transfer duty collections due to the additional strength in the residential property market, supported by large commercial transactions. Taxation revenue is now expected to grow at an average annual rate of 4.8% in the four years 2014-15 to 2017-18, down from 5.3% in the 2014-15 Budget.
Taxation and royalty projections for 2014-15 and the forward estimates are outlined in Table 18 with royalty assumptions provided in Table 19.
| | | | |
| | Mid Year Fiscal and Economic Review | | 11 |
| | |
| 4.4 | Australian Government payments |
The 2014-15 Commonwealth Budget, released on 13 May 2014, included increases in infrastructure funding to the states over the forward estimates. However, it also incorporated a number of revisions to funding agreements to states that were unilaterally determined by the Australian Government. The most significant changes are reduced indexation for public hospitals and schools funding, and the removal of the funding guarantees to public hospitals. The Commonwealth Budget also unilaterally terminated agreements not due to expire, most notably, the National Partnership Agreement on Certain Concessions for Pensioner Concession Card and Senior Card Holders.
These measures have significant implications for the structural positions of state budgets and the sustainability of longer term funding agreements. The unilateral termination of agreements placed states in the unsustainable position of having to intervene to moderate the impact of sudden funding reductions on vulnerable members of the community. This was the case for concession payments where the Queensland Government announced Queenslanders who benefit from concession payments would not suffer any payment reductions from the Commonwealth Budget cuts.
Following the federal election in September 2013, the Australian Government initiated a review of federal financial arrangements through the establishment of the National Commission of Audit and the white paper processes on federalism and tax reform. The measures in the 2014-15 Commonwealth Budget have heightened the need for states to be closely involved in the proposed reforms. Queensland is actively engaging in the white paper processes as they present an ideal opportunity to make real and lasting improvements to Commonwealth-state relations and address the key challenges facing the Australian Federation to strengthen productivity and economic growth.
The Commonwealth Grants Commission is currently conducting a review of the methodology for distributing GST revenue between the states, and is due to report by the end of February 2015. The 2015 Methodology Review aims to take into consideration the recommendations of the GST Distribution Review and major changes in federal financial relations that have occurred since the last methodology review, including National Health Reform, National Disability Insurance Scheme and potential impacts of national school funding reform. There is a risk that Queensland‘s share of GST revenue will be adversely impacted by the review.
| 4.5 | National Disaster Relief and Recovery Arrangements |
The timing of revenue and expenditure in relation to natural disasters has significantly impacted Queensland’s headline fiscal balance estimate and will continue to do so. A risk remains that the revenue and spending currently built into the forward estimates shown in Table 6 below, will ultimately occur in other years, changing the profile of the fiscal balance.
Table 6 outlines the impact of natural disaster arrangements on Queensland’s fiscal balance and calculates the underlying fiscal balance. The steady improvement in the underlying fiscal balance across the forward estimates is apparent in these figures.
| | | | | | | | | | | | | | | | |
Table 6: Impact of NDRRA funding on the fiscal balance1 | |
| | | 2014-15
MYFER
$ million | | | 2015-16
Projection
$ million | | | 2016-17
Projection
$ million | | | 2017-18
Projection
$ million | |
Published fiscal balance | | | (2,842) | | | | 331 | | | | 216 | | | | 634 | |
| | | | | |
less Disaster revenue2,3 | | | 950 | | | | 1,828 | | | | 82 | | | | - | |
| | | | | |
add Disaster expenditure | | | 1,556 | | | | 333 | | | | - | | | | - | |
| | | | | |
Underlying fiscal balance | | | (2,236) | | | | (1,164) | | | | 134 | | | | 634 | |
Notes: 1. Includes revenue and expenditure in relation to 2010-11 floods and Cyclone Yasi as well as prior events and more recent events. 2. Revenue is expected in the financial year following the delivery of the works to which it relates. 3. Excludes loans provided through the State, which are not treated as revenue. | |
| | |
| | Queensland Treasury and Trade |
| |
Non-financial Public sector
The NFPS is the consolidation of the General Government and Public Non-financial Corporations (i.e. commercial) sectors, with transactions between these sectors eliminated.
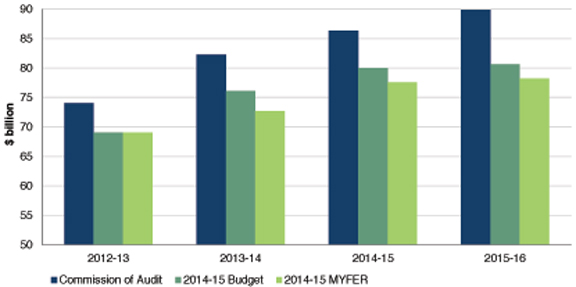
Borrowings of $77.553 billion are projected at 30 June 2015 in the NFPS, $2.403 billion less than the 2014-15 Budget estimate. By 2015-16, borrowings are expected to reach $78.241 billion, $2.378 billion less than the 2014-15 Budget estimate, and $11.597 billion less than the comparable figure published in the Interim Report of the Independent Commission of Audit. This reflects the improvements in the Budget position through the Government‘s disciplined fiscal strategy.
Chart 11: Comparison of borrowing in Non-financial Public sector1
Note:
| 1. | Independent Commission of Audit borrowing numbers have been adjusted to ensure comparability in relation to the treatment of the reclassification of |
| | Queensland Treasury Holdings into the PNFC sector. |
Source: Independent Commission of Audit Interim Report and Queensland Treasury and Trade.
Purchases of non-financial assets (capital spending) of $9.329 billion are expected in the NFPS sector in 2014-15, $72 million less than the 2014-15 Budget estimate.
The 2014-15 MYFER does not incorporate the cost of the proposed Bus and Train project beyond the costs of preparing the business case. The details of the project and associated cash flows are still to be determined, including how much would fall within the forward estimates, although previous assessments show most of the cost occurring in 2018-19 and 2019-20.
Further optimisation of the project is being undertaken and $1 billion is proposed to be allocated to the project through the Strong Choices Investment Program, which is subject to the government receiving a mandate for its asset transactions. A final business case is expected to be presented to Government in mid-2015. This will allow an assessment of the cash flows of the project and its impact on the forward estimates to be incorporated into the 2015-16 Budget.
General Government Sector
Borrowings in the General Government sector were $41.403 billion at 30 June 2014, $3.576 billion lower than forecast in the 2014-15 Budget. General Government borrowings are forecast at $45.801 billion at 30 June 2015, $2.340 billion less than forecast in the 2014-15 Budget. General Government borrowings are expected to rise slowly from 2014-15, and are forecast to reach $47.072 billion at 30 June 2018. Although the fiscal balance for 2014-15 to 2017-18 has deteriorated since the 2014-15 Budget, the lower level of debt at 30 June 2014 has resulted in borrowings being lower in each year of the forward estimates than the 2014-15 Budget estimates.
| | | | |
| | Mid Year Fiscal and Economic Review | | 13 |
| | |
| 4.7 | Achievement of the Government’s fiscal principles |
The Government’s fiscal consolidation efforts have allowed it to make significant progress in achieving its fiscal principles. Table 7 outlines the progress towards achieving the principles.
| | | | | | |
Table 7: The fiscal principles of the Queensland Government |
Principle | | Indicator |
| | | Debt to Revenue Ratio |
| | | | | 2014-15 Budget per cent | | 2014-15 MYFER per cent |
| Stabilise then significantly reduce debt (Non-financial Public sector) | | 2013-14 | | 146 | | 135 |
| | 2014-15 | | 141 | | 140 |
| | | 2015-16 | | 134 | | 132 |
| | | 2016-17 | | 130 | | 129 |
| | | 2017-18 | | 128 | | 126 |
| | | General Government Fiscal Balance |
| | | | | 2014-15 Budget ($ million) | | 2014-15 MYFER ($ million) |
| Achieve and maintain a General Government sector fiscal balance by 2014-15 | | 2013-14 | | (6,083) | | (2,581) |
| | 2014-15 | | (2,271) | | (2,842) |
| | 2015-16 | | 862 | | 331 |
| | | 2016-17 | | 508 | | 216 |
| | | 2017-18 | | 883 | | 634 |
| | | Taxation revenue per capita, 2014-15 |
| Maintain a competitive tax environment for business | | Queensland: | | $2,638 |
| | | Average of other states and territories: | | $3,177 |
Target full funding of long term liabilities such as superannuation in accordance with actuarial advice | | As at last actuarial review (released June 2014), accruing superannuation liabilities were fully funded. The State Actuary reviews the scheme every three years. |
The debt to revenue ratio is expected to peak at 140% in 2014-15, and is expected to gradually improve as debt is projected to grow modestly and revenue continues to grow.
The profile of this ratio is heavily influenced by the timing of NDRRA revenue and expenditure, which impact both the revenue and debt aspects of the ratio. This is evident from the much lower than expected ratio in 2013-14, which was associated with the $1.5 billion prepayment.
The fiscal balance projections have deteriorated slightly since the 2014-15 Budget, partly driven by revisions to the timing of NDRRA flows and also significant revenue write-downs. Despite this, a surplus of $331 million is currently projected for 2015-16, the first fiscal surplus in a decade. Fiscal surpluses are projected in each year from 2015-16 to 2017-18.
| | |
| | Queensland Treasury and Trade |
| |
| 5. | Uniform Presentation Framework and Loan Council allocation |
| 5.1 | Uniform Presentation Framework information |
| | | | | | | | | | | | | | | | | | | | | | |
Table 8: General Government Sector Operating Statement 1 | |
| | | | | 2014-15
Budget
$ million | | | 2014-15
Revised
$ million | | | 2015-16
Projection
$ million | | | 2016-17
Projection
$ million | | | 2017-18
Projection
$ million | |
| | | Revenue from Transactions | | | | | | | | | | | | | | | | | | | | |
| | | Taxation revenue | | | 12,455 | | | | 12,598 | | | | 12,990 | | | | 13,613 | | | | 14,273 | |
| | | Grants revenue | | | 24,043 | | | | 22,916 | | | | 25,399 | | | | 25,429 | | | | 25,808 | |
| | | Sales of goods and services | | | 5,187 | | | | 5,308 | | | | 5,468 | | | | 5,544 | | | | 5,693 | |
| | | Interest income | | | 2,429 | | | | 2,457 | | | | 2,528 | | | | 2,592 | | | | 2,656 | |
| | | Dividend and income tax equivalent income | | | 2,148 | | | | 2,331 | | | | 2,255 | | | | 2,451 | | | | 2,549 | |
| | | Other revenue | | | 3,859 | | | | 3,539 | | | | 4,312 | | | | 4,880 | | | | 5,291 | |
| | | Total Revenue from Transactions | | | 50,120 | | | | 49,149 | | | | 52,951 | | | | 54,510 | | | | 56,270 | |
| | | | | | | |
Less | | Expenses from Transactions | | | | | | | | | | | | | | | | | | | | |
| | | Employee expenses | | | 18,585 | | | | 18,610 | | | | 19,436 | | | | 20,038 | | | | 20,698 | |
| | | Superannuation expenses | | | | | | | | | | | | | | | | | | | | |
| | | Superannuation interest cost | | | 932 | | | | 874 | | | | 842 | | | | 865 | | | | 900 | |
| | | Other superannuation expenses | | | 2,364 | | | | 2,417 | | | | 2,499 | | | | 2,513 | | | | 2,506 | |
| | | Other operating expenses | | | 15,249 | | | | 14,637 | | | | 15,125 | | | | 16,158 | | | | 16,869 | |
| | | Depreciation and amortisation | | | 3,226 | | | | 3,178 | | | | 3,367 | | | | 3,506 | | | | 3,621 | |
| | | Other interest expenses | | | 2,379 | | | | 2,288 | | | | 2,286 | | | | 2,266 | | | | 2,291 | |
| | | Grants expenses | | | 7,198 | | | | 7,209 | | | | 6,317 | | | | 6,044 | | | | 6,373 | |
| | | Total Expenses from Transactions | | | 49,933 | | | | 49,213 | | | | 49,873 | | | | 51,390 | | | | 53,259 | |
Equals | | Net Operating Balance | | | 188 | | | | (64) | | | | 3,078 | | | | 3,120 | | | | 3,011 | |
| | | | | | | |
Plus | | Other economic flows - included in operating result | | | 158 | | | | (148) | | | | 39 | | | | (156) | | | | (155) | |
| | | | | | | |
Equals | | Operating Result | | | 345 | | | | (212) | | | | 3,117 | | | | 2,963 | | | | 2,856 | |
| | | | | | | |
Plus | | Other economic flows - other movements in equity | | | 3,079 | | | | 1,171 | | | | 2,346 | | | | 3,122 | | | | 2,978 | |
| | | | | | | |
Equals | | Comprehensive Result - Total Change In Net Worth | | | 3,424 | | | | 959 | | | | 5,463 | | | | 6,085 | | | | 5,834 | |
| | | | | | | |
| | | KEY FISCAL AGGREGATES | | | | | | | | | | | | | | | | | | | | |
| | | | | | | |
| | | Net Operating Balance | | | 188 | | | | (64) | | | | 3,078 | | | | 3,120 | | | | 3,011 | |
| | | | | | | |
Less | | Net Acquisition of Non-financial Assets | | | | | | | | | | | | | | | | | | | | |
| | | Purchases of non-financial assets | | | 5,972 | | | | 5,903 | | | | 6,089 | | | | 5,768 | | | | 5,496 | |
| | | Less Sales of non-financial assets | | | 292 | | | | 314 | | | | 273 | | | | 219 | | | | 247 | |
| | | Less Depreciation | | | 3,226 | | | | 3,178 | | | | 3,367 | | | | 3,506 | | | | 3,621 | |
| | | Plus Change in inventories | | | (2) | | | | (9) | | | | (72) | | | | (50) | | | | (12) | |
| | | Plus Other movements in non-financial assets | | | 6 | | | | 377 | | | | 370 | | | | 909 | | | | 760 | |
| | | Equals Total Net Acquisition of Non-financial Assets | | | 2,458 | | | | 2,778 | | | | 2,747 | | | | 2,903 | | | | 2,376 | |
| | | | | | | |
| | | Equals Fiscal Balance | | | (2,271) | | | | (2,842) | | | | 331 | | | | 216 | | | | 634 | |
| | | | | | | | | | | | | | | | | | | | | | | |
| | | | | | |
Note: 1. Numbers may not add due to rounding. | | | | | | | | | | | | | | | | | | | | |
| | | | |
| | Mid Year Fiscal and Economic Review | | 15 |
| | |
| | | | | | | | | | | | | | | | | | | | | | |
Table 9: Public Non-financial Corporations Sector Operating Statement1 | |
| | | | | 2014-15
Budget
$ million | | | 2014-15
Revised
$ million | | | 2015-16
Projection
$ million | | | 2016-17
Projection
$ million | | | 2017-18
Projection
$ million | |
| | | Revenue from Transactions | | | | | | | | | | | | | | | | | | | | |
| | | Grants revenue | | | 989 | | | | 990 | | | | 872 | | | | 875 | | | | 874 | |
| | | Sales of goods and services | | | 10,164 | | | | 10,043 | | | | 10,210 | | | | 10,871 | | | | 11,438 | |
| | | Interest income | | | 86 | | | | 132 | | | | 119 | | | | 86 | | | | 85 | |
| | | Dividend and income tax equivalent income | | | - | | | | 9 | | | | - | | | | - | | | | - | |
| | | Other revenue | | | 292 | | | | 221 | | | | 321 | | | | 387 | | | | 367 | |
| | | Total Revenue from Transactions | | | 11,531 | | | | 11,396 | | | | 11,522 | | | | 12,219 | | | | 12,764 | |
| | | | | | | |
Less | | Expenses from Transactions | | | | | | | | | | | | | | | | | | | | |
| | | Employee expenses | | | 1,705 | | | | 1,713 | | | | 1,732 | | | | 1,766 | | | | 1,820 | |
| | | Superannuation expenses | | | | | | | | | | | | | | | | | | | | |
| | | Other superannuation expenses | | | 211 | | | | 211 | | | | 216 | | | | 220 | | | | 225 | |
| | | Other operating expenses | | | 3,188 | | | | 2,937 | | | | 2,992 | | | | 3,169 | | | | 3,216 | |
| | | Depreciation and amortisation | | | 2,255 | | | | 2,318 | | | | 2,406 | | | | 2,489 | | | | 2,605 | |
| | | Other interest expenses | | | 2,009 | | | | 1,950 | | | | 1,891 | | | | 1,901 | | | | 1,975 | |
| | | Grants expenses | | | 15 | | | | 15 | | | | 15 | | | | 15 | | | | 15 | |
| | | Other property expenses | | | 607 | | | | 711 | | | | 785 | | | | 870 | | | | 881 | |
| | | Total Expenses from Transactions | | | 9,990 | | | | 9,854 | | | | 10,037 | | | | 10,430 | | | | 10,738 | |
Equals | | Net Operating Balance | | | 1,541 | | | | 1,542 | | | | 1,484 | | | | 1,789 | | | | 2,026 | |
| | | | | | | |
Plus | | Other economic flows - included in operating result | | | (109) | | | | (82) | | | | 2 | | | | (38) | | | | (66) | |
| | | | | | | |
Equals | | Operating Result | | | 1,433 | | | | 1,460 | | | | 1,486 | | | | 1,752 | | | | 1,960 | |
| | | | | | | |
Plus | | Other economic flows - other movements in equity | | | (921) | | | | (1,027) | | | | (1,140) | | | | (1,002) | | | | (1,052) | |
| | | | | | | |
Equals | | Comprehensive Result - Total Change In Net Worth | | | 512 | | | | 433 | | | | 346 | | | | 749 | | | | 907 | |
| | | | | | | |
| | | KEY FISCAL AGGREGATES | | | | | | | | | | | | | | | | | | | | |
| | | | | | | |
| | | Net Operating Balance | | | 1,541 | | | | 1,542 | | | | 1,484 | | | | 1,789 | | | | 2,026 | |
| | | | | | | |
Less | | Net Acquisition of Non-financial Assets | | | | | | | | | | | | | | | | | | | | |
| | | Purchases of non-financial assets | | | 3,429 | | | | 3,426 | | | | 3,755 | | | | 3,564 | | | | 3,525 | |
| | | Less Sales of non-financial assets | | | 56 | | | | 83 | | | | 38 | | | | 40 | | | | 40 | |
| | | Less Depreciation | | | 2,255 | | | | 2,318 | | | | 2,406 | | | | 2,489 | | | | 2,605 | |
| | | Plus Change in inventories | | | (14) | | | | (27) | | | | 6 | | | | 8 | | | | 11 | |
| | | Equals Total Net Acquisition of Non-financial Assets | | | 1,104 | | | | 998 | | | | 1,316 | | | | 1,044 | | | | 890 | |
| | | | | | | |
| | | Equals Fiscal Balance | | | 438 | | | | 544 | | | | 168 | | | | 746 | | | | 1,135 | |
| | | | | | | | | | | | | | | | | | | | | | | |
| | | | | | |
Note: 1. Numbers may not add due to rounding. | | | | | | | | | | | | | | | | | | | | |
| | |
| | Queensland Treasury and Trade |
| |
| | | | | | | | | | | | | | | | | | | | | | |
Table 10: Non-financial Public Sector Operating Statement1 | |
| | | | | 2014-15 Budget $ million | | | 2014-15 Revised $ million | | | 2015-16 Projection $ million | | | 2016-17 Projection $ million | | | 2017-18 Projection $ million | |
| | | Revenue from Transactions | | | | | | | | | | | | | | | | | | | | |
| | | Taxation revenue | | | 12,109 | | | | 12,254 | | | | 12,652 | | | | 13,271 | | | | 13,927 | |
| | | Grants revenue | | | 24,281 | | | | 23,154 | | | | 25,564 | | | | 25,599 | | | | 25,983 | |
| | | Sales of goods and services | | | 13,513 | | | | 13,542 | | | | 13,729 | | | | 14,413 | | | | 15,114 | |
| | | Interest income | | | 2,515 | | | | 2,589 | | | | 2,647 | | | | 2,678 | | | | 2,740 | |
| | | Dividend and income tax equivalent income | | | 123 | | | | 119 | | | | 72 | | | | 82 | | | | 94 | |
| | | Other revenue | | | 4,147 | | | | 3,756 | | | | 4,633 | | | | 5,267 | | | | 5,658 | |
| | | Total Revenue from Transactions | | | 56,687 | | | | 55,413 | | | | 59,298 | | | | 61,310 | | | | 63,515 | |
| | | | | | | |
Less | | Expenses from Transactions | | | | | | | | | | | | | | | | | | | | |
| | | Employee expenses | | | 20,198 | | | | 20,231 | | | | 21,074 | | | | 21,707 | | | | 22,420 | |
| | | Superannuation expenses | | | | | | | | | | | | | | | | | | | | |
| | | Superannuation interest cost | | | 932 | | | | 874 | | | | 842 | | | | 865 | | | | 900 | |
| | | Other superannuation expenses | | | 2,574 | | | | 2,628 | | | | 2,715 | | | | 2,733 | | | | 2,732 | |
| | | Other operating expenses | | | 16,589 | | | | 15,754 | | | | 16,162 | | | | 17,316 | | | | 18,058 | |
| | | Depreciation and amortisation | | | 5,480 | | | | 5,496 | | | | 5,774 | | | | 5,995 | | | | 6,227 | |
| | | Other interest expenses | | | 4,143 | | | | 3,995 | | | | 3,944 | | | | 3,933 | | | | 4,030 | |
| | | Grants expenses | | | 6,462 | | | | 6,471 | | | | 5,625 | | | | 5,353 | | | | 5,689 | |
| | | Total Expenses from Transactions | | | 56,379 | | | | 55,449 | | | | 56,136 | | | | 57,903 | | | | 60,056 | |
Equals | | Net Operating Balance | | | 309 | | | | (36 | ) | | | 3,162 | | | | 3,407 | | | | 3,459 | |
| | | | | | | |
Plus | | Other economic flows - included in operating result | | | (104 | ) | | | (230 | ) | | | (175 | ) | | | (194 | ) | | | (220 | ) |
| | | | | | | |
Equals | | Operating Result | | | 205 | | | | (265 | ) | | | 2,987 | | | | 3,213 | | | | 3,239 | |
| | | | | | | |
Plus | | Other economic flows - other movements in equity | | | 3,223 | | | | 1,224 | | | | 2,476 | | | | 2,872 | | | | 2,595 | |
| | | | | | | |
Equals | | Comprehensive Result - Total Change In Net Worth | | | 3,428 | | | | 959 | | | | 5,463 | | | | 6,085 | | | | 5,834 | |
| | | | | | | |
| | | KEY FISCAL AGGREGATES | | | | | | | | | | | | | | | | | | | | |
| | | | | | | |
| | | Net Operating Balance | | | 309 | | | | (36 | ) | | | 3,162 | | | | 3,407 | | | | 3,459 | |
| | | | | | | |
Less | | Net Acquisition of Non-financial Assets | | | | | | | | | | | | | | | | | | | | |
| | | Purchases of non-financial assets | | | 9,401 | | | | 9,329 | | | | 9,844 | | | | 9,332 | | | | 9,021 | |
| | | Less Sales of non-financial assets | | | 348 | | | | 397 | | | | 311 | | | | 259 | | | | 287 | |
| | | Less Depreciation | | | 5,480 | | | | 5,496 | | | | 5,774 | | | | 5,995 | | | | 6,227 | |
| | | Plus Change in inventories | | | (17 | ) | | | (36 | ) | | | (66 | ) | | | (41 | ) | | | (1 | ) |
| | | Plus Other movements in non-financial assets | | | 6 | | | | 377 | | | | 370 | | | | 909 | | | | 760 | |
| | | Equals Total Net Acquisition of Non-financial Assets | | | 3,562 | | | | 3,776 | | | | 4,064 | | | | 3,947 | | | | 3,266 | |
| | | | | | | |
| | | Equals Fiscal Balance | | | (3,253 | ) | | | (3,812 | ) | | | (902 | ) | | | (540 | ) | | | 193 | |
| | | | | | | | | | | | | | | | | | | | | | | |
Note: 1. Numbers may not add due to rounding. | | | | | | | | | | | | | | | | | | | | |
| | | | |
| | Mid Year Fiscal and Economic Review | | 17 |
| | |
| | | | | | | | | | | | | | | | | | | | | | | | | | | | |
Table 11: General Government Sector Balance Sheet1 | |
| | | 2014-15 Budget $ million | | | | | 2014-15 Revised $ million | | | | | 2015-16 Projection $ million | | | | | 2016-17 Projection $ million | | | | | 2017-18 Projection $ million | |
| | | | | | | | | | |
Assets | | | | | | | | | | | | | | | | | | | | | | | | | | | | |
Financial Assets | | | | | | | | | | | | | | | | | | | | | | | | | | | | |
Cash and deposits | | | 1,056 | | | | | | 1,256 | | | | | | 1,124 | | | | | | 1,093 | | | | | | 1,034 | |
Advances paid | | | 878 | | | | | | 956 | | | | | | 1,111 | | | | | | 1,245 | | | | | | 1,348 | |
Investments, loans and placements | | | 35,810 | | | | | | 36,213 | | | | | | 37,127 | | | | | | 38,036 | | | | | | 38,855 | |
Receivables | | | 4,022 | | | | | | 4,392 | | | | | | 4,338 | | | | | | 4,494 | | | | | | 4,684 | |
Equity | | | | | | | | | | | | | | | | | | | | | | | | | | | | |
Investments in other public sector entities | | | 25,029 | | | | | | 26,854 | | | | | | 27,201 | | | | | | 27,950 | | | | | | 28,857 | |
Investments - other | | | 167 | | | | | | 160 | | | | | | 160 | | | | | | 160 | | | | | | 160 | |
Total Financial Assets | | | 66,962 | | | | | | 69,832 | | | | | | 71,060 | | | | | | 72,978 | | | | | | 74,938 | |
| | | | | | | | | | |
Non-financial Assets | | | | | | | | | | | | | | | | | | | | | | | | | | | | |
Land and other fixed assets | | | 190,033 | | | | | | 177,910 | | | | | | 181,576 | | | | | | 185,333 | | | | | | 188,649 | |
Other non-financial assets | | | 7,524 | | | | | | 6,798 | | | | | | 6,952 | | | | | | 7,000 | | | | | | 7,149 | |
Total Non-financial Assets | | | 197,556 | | | | | | 184,708 | | | | | | 188,528 | | | | | | 192,332 | | | | | | 195,799 | |
| | | | | | | | | | |
Total Assets | | | 264,518 | | | | | | 254,539 | | | | | | 259,589 | | | | | | 265,311 | | | | | | 270,737 | |
| | | | | | | | | | |
Liabilities | | | | | | | | | | | | | | | | | | | | | | | | | | | | |
Payables | | | 3,405 | | | | | | 3,164 | | | | | | 3,280 | | | | | | 3,318 | | | | | | 3,379 | |
Superannuation liability | | | 23,641 | | | | | | 25,794 | | | | | | 24,763 | | | | | | 23,283 | | | | | | 22,022 | |
Other employee benefits | | | 5,611 | | | | | | 5,499 | | | | | | 5,518 | | | | | | 5,751 | | | | | | 5,982 | |
Deposits held | | | - | | | | | | 1 | | | | | | 1 | | | | | | 1 | | | | | | 1 | |
Advances received | | | 544 | | | | | | 644 | | | | | | 690 | | | | | | 743 | | | | | | 796 | |
Borrowing | | | 48,141 | | | | | | 45,801 | | | | | | 46,097 | | | | | | 46,630 | | | | | | 47,072 | |
Other liabilities | | | 4,085 | | | | | | 3,415 | | | | | | 3,557 | | | | | | 3,817 | | | | | | 3,884 | |
Total Liabilities | | | 85,428 | | | | | | 84,318 | | | | | | 83,904 | | | | | | 83,542 | | | | | | 83,134 | |
| | | | | | | | | | |
Net Worth | | | 179,091 | | | | | | 170,222 | | | | | | 175,684 | | | | | | 181,769 | | | | | | 187,603 | |
Net Financial Worth | | | (18,466) | | | | | | (14,486) | | | | | | (12,844) | | | | | | (10,563) | | | | | | (8,196) | |
Net Financial Liabilities | | | 43,495 | | | | | | 41,340 | | | | | | 40,045 | | | | | | 38,513 | | | | | | 37,053 | |
Net Debt | | | 10,942 | | | | | | 8,021 | | | | | | 7,426 | | | | | | 6,999 | | | | | | 6,630 | |
Notes: | | | | | | | | | | | | | | | | | | | | | | | | | | | | |
1. Numbers may not add due to rounding. | | | | | | | | | | | | | | | | | | | | | | | | | | | | |
| | |
| | Queensland Treasury and Trade |
| |
| | | | | | | | | | | | | | | | | | | | | | | | | | | | |
Table 12: Public Non-financial Corporations Sector Balance Sheet1 | |
| | | 2014-15
Budget $ million | | | | | 2014-15 Revised $ million | | | | | 2015-16 Projection $ million | | | | | 2016-17 Projection $ million | | | | | 2017-18 Projection $ million | |
| | | | | | | | | | |
Assets | | | | | | | | | | | | | | | | | | | | | | | | | | | | |
Financial Assets | | | | | | | | | | | | | | | | | | | | | | | | | | | | |
Cash and deposits | | | 1,143 | | | | | | 1,328 | | | | | | 1,021 | | | | | | 1,103 | | | | | | 1,197 | |
Advances paid | | | 41 | | | | | | 41 | | | | | | 33 | | | | | | 26 | | | | | | 18 | |
Investments, loans and placements | | | 91 | | | | | | 310 | | | | | | 278 | | | | | | 268 | | | | | | 267 | |
Receivables | | | 2,959 | | | | | | 2,892 | | | | | | 2,338 | | | | | | 1,799 | | | | | | 1,799 | |
Equity | | | | | | | | | | | | | | | | | | | | | | | | | | | | |
Investments - other | | | 4 | | | | | | 253 | | | | | | 4 | | | | | | 4 | | | | | | 4 | |
Total Financial Assets | | | 4,238 | | | | | | 4,824 | | | | | | 3,675 | | | | | | 3,200 | | | | | | 3,285 | |
| | | | | | | | | | |
Non-financial Assets | | | | | | | | | | | | | | | | | | | | | | | | | | | | |
Land and other fixed assets | | | 58,708 | | | | | | 59,789 | | | | | | 61,734 | | | | | | 63,383 | | | | | | 64,940 | |
Other non-financial assets | | | 2,504 | | | | | | 1,604 | | | | | | 1,688 | | | | | | 1,633 | | | | | | 1,586 | |
Total Non-financial Assets | | | 61,212 | | | | | | 61,393 | | | | | | 63,422 | | | | | | 65,016 | | | | | | 66,526 | |
| | | | | | | | | | |
Total Assets | | | 65,451 | | | | | | 66,216 | | | | | | 67,097 | | | | | | 68,216 | | | | | | 69,811 | |
| | | | | | | | | | |
Liabilities | | | | | | | | | | | | | | | | | | | | | | | | | | | | |
Payables | | | 2,491 | | | | | | 2,850 | | | | | | 2,661 | | | | | | 2,748 | | | | | | 2,798 | |
Superannuation liability | | | (61) | | | | | | (148) | | | | | | (141) | | | | | | (135) | | | | | | (135) | |
Other employee benefits | | | 846 | | | | | | 620 | | | | | | 639 | | | | | | 657 | | | | | | 674 | |
Deposits held | | | 28 | | | | | | 28 | | | | | | 29 | | | | | | 30 | | | | | | 31 | |
Advances received | | | 8 | | | | | | 8 | | | | | | 8 | | | | | | 7 | | | | | | 6 | |
Borrowing | | | 31,814 | | | | | | 31,752 | | | | | | 32,144 | | | | | | 32,210 | | | | | | 32,720 | |
Other liabilities | | | 8,578 | | | | | | 8,061 | | | | | | 8,367 | | | | | | 8,560 | | | | | | 8,671 | |
Total Liabilities | | | 43,705 | | | | | | 43,172 | | | | | | 43,707 | | | | | | 44,076 | | | | | | 44,764 | |
| | | | | | | | | | |
Net Worth | | | 21,745 | | | | | | 23,044 | | | | | | 23,390 | | | | | | 24,139 | | | | | | 25,047 | |
Net Financial Worth | | | (39,467) | | | | | | (38,349) | | | | | | (40,032) | | | | | | (40,876) | | | | | | (41,479) | |
Net Debt | | | 30,575 | | | | | | 30,110 | | | | | | 30,848 | | | | | | 30,850 | | | | | | 31,275 | |
Notes: | | | | | | | | | | | | | | | | | | | | | | | | | | | | |
1. Numbers may not add due to rounding. | | | | | | | | | | | | | | | | | | | | | | | | | | | | |
| | | | |
| | Mid Year Fiscal and Economic Review | | 19 |
| | |
| | | | | | | | | | | | | | | | | | | | | | | | | | | | |
Table 13: Non-financial Public Sector Balance Sheet1 | |
| | | 2014-15 Budget $ million | | | | | 2014-15 Revised $ million | | | | | 2015-16 Projection $ million | | | | | 2016-17 Projection $ million | | | | | 2017-18 Projection $ million | |
| | | | | | | | | | |
Assets | | | | | | | | | | | | | | | | | | | | | | | | | | | | |
Financial Assets | | | | | | | | | | | | | | | | | | | | | | | | | | | | |
Cash and deposits | | | 2,199 | | | | | | 2,584 | | | | | | 2,145 | | | | | | 2,196 | | | | | | 2,231 | |
Advances paid | | | 911 | | | | | | 989 | | | | | | 1,136 | | | | | | 1,264 | | | | | | 1,360 | |
Investments, loans and placements | | | 35,902 | | | | | | 36,523 | | | | | | 37,405 | | | | | | 38,304 | | | | | | 39,122 | |
Receivables | | | 4,868 | | | | | | 5,133 | | | | | | 4,703 | | | | | | 4,260 | | | | | | 4,357 | |
Equity | | | | | | | | | | | | | | | | | | | | | | | | | | | | |
Investments in other public sector entities | | | 3,186 | | | | | | 3,811 | | | | | | 3,811 | | | | | | 3,811 | | | | | | 3,811 | |
Investments - other | | | 171 | | | | | | 413 | | | | | | 164 | | | | | | 164 | | | | | | 164 | |
Total Financial Assets | | | 47,237 | | | | | | 49,453 | | | | | | 49,365 | | | | | | 49,999 | | | | | | 51,046 | |
| | | | | | | | | | |
Non-financial Assets | | | | | | | | | | | | | | | | | | | | | | | | | | | | |
Land and other fixed assets | | | 248,740 | | | | | | 237,698 | | | | | | 243,309 | | | | | | 248,715 | | | | | | 253,588 | |
Other non-financial assets | | | 956 | | | | | | 1,003 | | | | | | 1,058 | | | | | | 945 | | | | | | 921 | |
Total Non-financial Assets | | | 249,695 | | | | | | 238,701 | | | | | | 244,367 | | | | | | 249,660 | | | | | | 254,509 | |
| | | | | | | | | | |
Total Assets | | | 296,932 | | | | | | 288,153 | | | | | | 293,732 | | | | | | 299,659 | | | | | | 305,555 | |
| | | | | | | | | | |
Liabilities | | | | | | | | | | | | | | | | | | | | | | | | | | | | |
Payables | | | 3,832 | | | | | | 3,911 | | | | | | 4,016 | | | | | | 4,082 | | | | | | 4,101 | |
Superannuation liability | | | 23,580 | | | | | | 25,646 | | | | | | 24,622 | | | | | | 23,148 | | | | | | 21,887 | |
Other employee benefits | | | 6,458 | | | | | | 6,119 | | | | | | 6,157 | | | | | | 6,408 | | | | | | 6,655 | |
Deposits held | | | 28 | | | | | | 29 | | | | | | 30 | | | | | | 30 | | | | | | 31 | |
Advances received | | | 544 | | | | | | 644 | | | | | | 689 | | | | | | 743 | | | | | | 796 | |
Borrowing | | | 79,956 | | | | | | 77,553 | | | | | | 78,241 | | | | | | 78,840 | | | | | | 79,792 | |
Other liabilities | | | 3,542 | | | | | | 4,030 | | | | | | 4,293 | | | | | | 4,640 | | | | | | 4,691 | |
Total Liabilities | | | 117,940 | | | | | | 117,932 | | | | | | 118,048 | | | | | | 117,890 | | | | | | 117,952 | |
| | | | | | | | | | |
Net Worth | | | 178,992 | | | | | | 170,222 | | | | | | 175,684 | | | | | | 181,769 | | | | | | 187,603 | |
Net Financial Worth | | | (70,703 | ) | | | | | (68,479 | ) | | | | | (68,683 | ) | | | | | (67,891 | ) | | | | | (66,906 | ) |
Net Financial Liabilities | | | 73,889 | | | | | | 72,290 | | | | | | 72,494 | | | | | | 71,702 | | | | | | 70,717 | |
Net Debt | | | 41,517 | | | | | | 38,130 | | | | | | 38,274 | | | | | | 37,849 | | | | | | 37,905 | |
Notes: 1. Numbers may not add due to rounding. | | | | | | | |
| | |
| | Queensland Treasury and Trade |
| |
| | | | | | | | | | | | | | | | | | | | | | | | | | | | |
| Table 14: General Government Sector Cash Flow Statement 1 | |
| | | 2014-15
Budget
$ million | | | | | 2014-15
Revised
$ million | | | | | 2015-16
Projection
$ million | | | | | 2016-17
Projection
$ million | | | | | 2017-18
Projection
$ million | |
Cash Receipts from Operating Activities | | | | | | | | | | | | | | | | | | | | | | | | | | | | |
Taxes received | | | 12,453 | | | | | | 12,596 | | | | | | 12,988 | | | | | | 13,611 | | | | | | 14,272 | |
Grants and subsidies received | | | 24,117 | | | | | | 23,037 | | | | | | 25,475 | | | | | | 25,506 | | | | | | 25,885 | |
Sales of goods and services | | | 5,435 | | | | | | 5,540 | | | | | | 5,605 | | | | | | 5,740 | | | | | | 5,901 | |
Interest receipts | | | 2,429 | | | | | | 2,457 | | | | | | 2,528 | | | | | | 2,592 | | | | | | 2,656 | |
Dividends and income tax equivalents | | | 1,887 | | | | | | 2,026 | | | | | | 2,505 | | | | | | 2,339 | | | | | | 2,441 | |
Other receipts | | | 4,929 | | | | | | 4,572 | | | | | | 5,138 | | | | | | 5,716 | | | | | | 6,140 | |
Total Operating Receipts | | | 51,251 | | | | | | 50,227 | | | | | | 54,238 | | | | | | 55,504 | | | | | | 57,294 | |
| | | | | | | | | | |
Cash Payments for Operating Activities | | | | | | | | | | | | | | | | | | | | | | | | | | | | |
Payments for employees | | | (21,579 | ) | | | | | (21,379 | ) | | | | | (22,877 | ) | | | | | (23,409 | ) | | | | | (24,232 | ) |
Payments for goods and services | | | (16,585 | ) | | | | | (16,010 | ) | | | | | (16,078 | ) | | | | | (17,153 | ) | | | | | (17,879 | ) |
Grants and subsidies | | | (7,019 | ) | | | | | (7,047 | ) | | | | | (6,248 | ) | | | | | (5,980 | ) | | | | | (6,308 | ) |
Interest paid | | | (2,378 | ) | | | | | (2,287 | ) | | | | | (2,286 | ) | | | | | (2,266 | ) | | | | | (2,291 | ) |
Other payments | | | (351 | ) | | | | | (349 | ) | | | | | (361 | ) | | | | | (181 | ) | | | | | (422 | ) |
Total Operating Payments | | | (47,912 | ) | | | | | (47,072 | ) | | | | | (47,851 | ) | | | | | (48,990 | ) | | | | | (51,132 | ) |
| | | | | | | | | | |
Net Cash Inflows from Operating Activities | | | 3,338 | | | | | | 3,155 | | | | | | 6,388 | | | | | | 6,513 | | | | | | 6,162 | |
| | | | | | | | | | |
Cash Flows from Investments in Non-Financial Assets | | | | | | | | | | | | | | | | | | | | | | | | | | | | |
Purchases of non-financial assets | | | (5,972 | ) | | | | | (5,903 | ) | | | | | (6,089 | ) | | | | | (5,768 | ) | | | | | (5,496 | ) |
Sales of non-financial assets | | | 292 | | | | | | 314 | | | | | | 273 | | | | | | 219 | | | | | | 247 | |
Net Cash Flows from Investments in Non-financial Assets | | | (5,680 | ) | | | | | (5,589 | ) | | | | | (5,816 | ) | | | | | (5,549 | ) | | | | | (5,249 | ) |
| | | | | | | | | | |
Net Cash Flows from Investments in Financial Assets for Policy Purposes | | | 169 | | | | | | (17 | ) | | | | | 207 | | | | | | 33 | | | | | | - | |
| | | | | | | | | | |
Net Cash Flows from Investments in Financial Assets for Liquidity Purposes | | | (866 | ) | | | | | (1,030 | ) | | | | | (897 | ) | | | | | (837 | ) | | | | | (804 | ) |
| | | | | | | | | | |
Receipts from Financing Activities | | | | | | | | | | | | | | | | | | | | | | | | | | | | |
Advances received (net) | | | (52 | ) | | | | | (152 | ) | | | | | (49 | ) | | | | | (40 | ) | | | | | (37 | ) |
Borrowing (net) | | | 3,107 | | | | | | 3,989 | | | | | | 35 | | | | | | (150 | ) | | | | | (131 | ) |
Net Cash Flows from Financing Activities | | | 3,055 | | | | | | 3,837 | | | | | | (14 | ) | | | | | (190 | ) | | | | | (168 | ) |
| | | | | | | | | | |
Net Increase/(Decrease) in Cash held | | | 16 | | | | | | 357 | | | | | | (132 | ) | | | | | (30 | ) | | | | | (59 | ) |
| | | | | | | | | | |
Net cash from operating activities | | | 3,338 | | | | | | 3,155 | | | | | | 6,388 | | | | | | 6,513 | | | | | | 6,162 | |
Net cash flows from investments in non-financial assets | | | (5,680 | ) | | | | | (5,589 | ) | | | | | (5,816 | ) | | | | | (5,549 | ) | | | | | (5,249 | ) |
Surplus/(Deficit) | | | (2,342 | ) | | | | | (2,434 | ) | | | | | 571 | | | | | | 964 | | | | | | 913 | |
Derivation of ABS GFS Cash Surplus/Deficit | | | | | | | | | | | | | | | | | | | | | | | | | | | | |
Cash surplus/(deficit) | | | (2,342 | ) | | | | | (2,434 | ) | | | | | 571 | | | | | | 964 | | | | | | 913 | |
Acquisitions under finance leases and similar arrangements | | | (14 | ) | | | | | (371 | ) | | | | | (195 | ) | | | | | (729 | ) | | | | | (580 | ) |
ABS GFS Cash Surplus/(Deficit) Including Finance Leases and Similar Arrangements | | | (2,356 | ) | | | | | (2,804 | ) | | | | | 377 | | | | | | 235 | | | | | | 333 | |
Note: 1. Numbers may not add due to rounding. | | | | | | | | | | | | | | | | | | | |
| | | | |
| | Mid Year Fiscal and Economic Review | | 21 |
| | |
| | | | | | | | | | | | | | | | | | | | | | | | | | | | |
| Table 15: Public Non-financial Corporations Sector Cash Flow Statement 1 | |
| | | 2014-15
Budget
$ million | | | | | 2014-15
Revised
$ million | | | | | 2015-16
Projection
$ million | | | | | 2016-17
Projection
$ million | | | | | 2017-18
Projection
$ million | |
Cash Receipts from Operating Activities | | | | | | | | | | | | | | | | | | | | | | | | | | | | |
Grants and subsidies received | | | 1,005 | | | | | | 982 | | | | | | 871 | | | | | | 862 | | | | | | 861 | |
Sales of goods and services | | | 10,839 | | | | | | 10,942 | | | | | | 11,704 | | | | | | 12,570 | | | | | | 12,621 | |
Interest receipts | | | 86 | | | | | | 133 | | | | | | 119 | | | | | | 86 | | | | | | 85 | |
Dividends and income tax equivalents | | | - | | | | | | 9 | | | | | | - | | | | | | - | | | | | | - | |
Other receipts | | | 375 | | | | | | 300 | | | | | | 471 | | | | | | 404 | | | | | | 374 | |
Total Operating Receipts | | | 12,305 | | | | | | 12,365 | | | | | | 13,166 | | | | | | 13,921 | | | | | | 13,942 | |
| | | | | | | | | | |
Cash Payments for Operating Activities | | | | | | | | | | | | | | | | | | | | | | | | | | | | |
Payments for employees | | | (1,905 | ) | | | | | (1,998 | ) | | | | | (1,922 | ) | | | | | (1,962 | ) | | | | | (2,029 | ) |
Payments for goods and services | | | (3,830 | ) | | | | | (3,754 | ) | | | | | (3,450 | ) | | | | | (3,645 | ) | | | | | (3,854 | ) |
Grants and subsidies | | | (13 | ) | | | | | (12 | ) | | | | | (14 | ) | | | | | (14 | ) | | | | | (14 | ) |
Interest paid | | | (1,897 | ) | | | | | (1,821 | ) | | | | | (1,785 | ) | | | | | (1,893 | ) | | | | | (1,987 | ) |
Other payments | | | (954 | ) | | | | | (985 | ) | | | | | (1,428 | ) | | | | | (1,457 | ) | | | | | (1,493 | ) |
Total Operating Payments | | | (8,599 | ) | | | | | (8,569 | ) | | | | | (8,599 | ) | | | | | (8,971 | ) | | | | | (9,377 | ) |
| | | | | | | | | | |
Net Cash Inflows from Operating Activities | | | 3,706 | | | | | | 3,796 | | | | | | 4,567 | | | | | | 4,950 | | | | | | 4,565 | |
| | | | | | | | | | |
Cash Flows from Investments in Non-Financial Assets | | | | | | | | | | | | | | | | | | | | | | | | | | | | |
Purchases of non-financial assets | | | (3,429 | ) | | | | | (3,426 | ) | | | | | (3,755 | ) | | | | | (3,564 | ) | | | | | (3,525 | ) |
Sales of non-financial assets | | | 56 | | | | | | 83 | | | | | | 38 | | | | | | 40 | | | | | | 40 | |
Net Cash Flows from Investments in Non-financial Assets | | | (3,373 | ) | | | | | (3,343 | ) | | | | | (3,717 | ) | | | | | (3,524 | ) | | | | | (3,485 | ) |
| | | | | | | | | | |
Net Cash Flows from Investments in Financial Assets for Policy Purposes | | | 180 | | | | | | - | | | | | | 249 | | | | | | - | | | | | | - | |
| | | | | | | | | | |
Net Cash Flows from Investments in Financial Assets for Liquidity Purposes | | | - | | | | | | - | | | | | | - | | | | | | - | | | | | | - | |
| | | | | | | | | | |
Receipts from Financing Activities | | | | | | | | | | | | | | | | | | | | | | | | | | | | |
Advances received (net) | | | (1 | ) | | | | | (1 | ) | | | | | (1 | ) | | | | | (1 | ) | | | | | (1 | ) |
Borrowing (net) | | | 716 | | | | | | 651 | | | | | | 319 | | | | | | 91 | | | | | | 518 | |
Dividends paid | | | (1,293 | ) | | | | | (1,364 | ) | | | | | (1,518 | ) | | | | | (1,403 | ) | | | | | (1,505 | ) |
Deposits received (net) | | | 2 | | | | | | 2 | | | | | | 1 | | | | | | 1 | | | | | | 1 | |
Other financing (net) | | | (185 | ) | | | | | 17 | | | | | | (207 | ) | | | | | (33 | ) | | | | | - | |
Net Cash Flows from Financing Activities | | | (760 | ) | | | | | (694 | ) | | | | | (1,406 | ) | | | | | (1,344 | ) | | | | | (986 | ) |
| | | | | | | | | | |
Net Increase/(Decrease) in Cash held | | | (248 | ) | | | | | (241 | ) | | | | | (307 | ) | | | | | 82 | | | | | | 94 | |
| | | | | | | | | | |
Net cash from operating activities | | | 3,706 | | | | | | 3,796 | | | | | | 4,567 | | | | | | 4,950 | | | | | | 4,565 | |
Net cash flows from investments in non-financial assets | | | (3,373 | ) | | | | | (3,343 | ) | | | | | (3,717 | ) | | | | | (3,524 | ) | | | | | (3,485 | ) |
Dividends paid | | | (1,293 | ) | | | | | (1,364 | ) | | | | | (1,518 | ) | | | | | (1,403 | ) | | | | | (1,505 | ) |
Surplus/(Deficit) | | | (960 | ) | | | | | (911 | ) | | | | | (667 | ) | | | | | 23 | | | | | | (424 | ) |
Derivation of ABS GFS Cash Surplus/Deficit | | | | | | | | | | | | | | | | | | | | | | | | | | | | |
Cash surplus/(deficit) | | | (960 | ) | | | | | (911 | ) | | | | | (667 | ) | | | | | 23 | | | | | | (424 | ) |
Acquisitions under finance leases and similar arrangements | | | - | | | | | | - | | | | | | - | | | | | | - | | | | | | - | |
ABS GFS Cash Surplus/(Deficit) Including Finance Leases and Similar Arrangements | | | (960 | ) | | | | | (911 | ) | | | | | (667 | ) | | | | | 23 | | | | | | (424 | ) |
Note: 1. Numbers may not add due to rounding. | | | | | | | | | | | | | | | | | | | |
| | |
| | Queensland Treasury and Trade |
| |
| | | | | | | | | | | | | | | | | | | | | | | | | | | | |
| Table 16: Non-financial Public Sector Cash Flow Statement 1 | |
| | | 2014-15
Budget
$ million | | | | | 2014-15
Revised
$ million | | | | | 2015-16
Projection
$ million | | | | | 2016-17
Projection
$ million | | | | | 2017-18
Projection
$ million | |
Cash Receipts from Operating Activities | | | | | | | | | | | | | | | | | | | | | | | | | | | | |
Taxes received | | | 12,108 | | | | | | 12,253 | | | | | | 12,651 | | | | | | 13,270 | | | | | | 13,926 | |
Grants and subsidies received | | | 24,343 | | | | | | 23,263 | | | | | | 25,628 | | | | | | 25,663 | | | | | | 26,048 | |
Sales of goods and services | | | 14,237 | | | | | | 14,474 | | | | | | 15,168 | | | | | | 16,114 | | | | | | 16,312 | |
Interest receipts | | | 2,515 | | | | | | 2,589 | | | | | | 2,647 | | | | | | 2,678 | | | | | | 2,740 | |
Dividends and income tax equivalents | | | 217 | | | | | | 249 | | | | | | 118 | | | | | | 76 | | | | | | 86 | |
Other receipts | | | 5,299 | | | | | | 4,867 | | | | | | 5,609 | | | | | | 6,119 | | | | | | 6,515 | |
Total Operating Receipts | | | 58,719 | | | | | | 57,695 | | | | | | 61,823 | | | | | | 63,921 | | | | | | 65,628 | |
| | | | | | | | | | |
Cash Payments for Operating Activities | | | | | | | | | | | | | | | | | | | | | | | | | | | | |
Payments for employees | | | (23,392 | ) | | | | | (23,284 | ) | | | | | (24,705 | ) | | | | | (25,275 | ) | | | | | (26,162 | ) |
Payments for goods and services | | | (18,391 | ) | | | | | (17,768 | ) | | | | | (17,400 | ) | | | | | (18,615 | ) | | | | | (19,536 | ) |
Grants and subsidies | | | (6,252 | ) | | | | | (6,304 | ) | | | | | (5,544 | ) | | | | | (5,290 | ) | | | | | (5,624 | ) |
Interest paid | | | (4,032 | ) | | | | | (3,866 | ) | | | | | (3,838 | ) | | | | | (3,926 | ) | | | | | (4,042 | ) |
Other payments | | | (903 | ) | | | | | (885 | ) | | | | | (898 | ) | | | | | (754 | ) | | | | | (1,040 | ) |
Total Operating Payments | | | (52,969 | ) | | | | | (52,107 | ) | | | | | (52,385 | ) | | | | | (53,860 | ) | | | | | (56,404 | ) |
| | | | | | | | | | |
Net Cash Inflows from Operating Activities | | | 5,751 | | | | | | 5,587 | | | | | | 9,437 | | | | | | 10,061 | | | | | | 9,223 | |
| | | | | | | | | | |
Cash Flows from Investments in Non-Financial Assets | | | | | | | | | | | | | | | | | | | | | | | | | | | | |
Purchases of non-financial assets | | | (9,401 | ) | | | | | (9,329 | ) | | | | | (9,844 | ) | | | | | (9,332 | ) | | | | | (9,021 | ) |
Sales of non-financial assets | | | 348 | | | | | | 397 | | | | | | 311 | | | | | | 259 | | | | | | 287 | |
Net Cash Flows from Investments in | | | | | | | | | | | | | | | | | | | | | | | | | | | | |
Non-financial Assets | | | (9,053 | ) | | | | | (8,931 | ) | | | | | (9,533 | ) | | | | | (9,074 | ) | | | | | (8,734 | ) |
| | | | | | | | | | |
Net Cash Flows from Investments in Financial Assets for Policy Purposes | | | 174 | | | | | | - | | | | | | 249 | | | | | | - | | | | | | - | |
| | | | | | | | | | |
Net Cash Flows from Investments in Financial Assets for Liquidity Purposes | | | (866 | ) | | | | | (1,030 | ) | | | | | (897 | ) | | | | | (837 | ) | | | | | (804 | ) |
| | | | | | | | | | |
Receipts from Financing Activities | | | | | | | | | | | | | | | | | | | | | | | | | | | | |
Advances received (net) | | | (53 | ) | | | | | (153 | ) | | | | | (50 | ) | | | | | (41 | ) | | | | | (37 | ) |
Borrowing (net) | | | 3,823 | | | | | | 4,640 | | | | | | 354 | | | | | | (58 | ) | | | | | 387 | |
Deposits received (net) | | | 2 | | | | | | 2 | | | | | | 1 | | | | | | 1 | | | | | | 1 | |
Other financing (net) | | | (10 | ) | | | | | - | | | | | | - | | | | | | - | | | | | | - | |
Net Cash Flows from Financing Activities | | | 3,763 | | | | | | 4,490 | | | | | | 305 | | | | | | (99 | ) | | | | | 350 | |
| | | | | | | | | | |
Net Increase/(Decrease) in Cash held | | | (232 | ) | | | | | 116 | | | | | | (439 | ) | | | | | 51 | | | | | | 35 | |
| | | | | | | | | | |
Net cash from operating activities | | | 5,751 | | | | | | 5,587 | | | | | | 9,437 | | | | | | 10,061 | | | | | | 9,223 | |
Net cash flows from investments in non-financial assets | | | (9,053 | ) | | | | | (8,931 | ) | | | | | (9,533 | ) | | | | | (9,074 | ) | | | | | (8,734 | ) |
Surplus/(Deficit) | | | (3,302 | ) | | | | | (3,344 | ) | | | | | (96 | ) | | | | | 987 | | | | | | 489 | |
Derivation of ABS GFS Cash Surplus/Deficit | | | | | | | | | | | | | | | | | | | | | | | | | | | | |
Cash surplus/(deficit) | | | (3,302 | ) | | | | | (3,344 | ) | | | | | (96 | ) | | | | | 987 | | | | | | 489 | |
Acquisitions under finance leases and similar arrangements | | | (14 | ) | | | | | (371 | ) | | | | | (195 | ) | | | | | (729 | ) | | | | | (580 | ) |
ABS GFS Cash Surplus/(Deficit) Including Finance Leases and Similar Arrangements | | | (3,316 | ) | | | | | (3,715 | ) | | | | | (290 | ) | | | | | 258 | | | | | | (91 | ) |
Note: 1. Numbers may not add due to rounding. | | | | | | | | | | | | | | | | | | | |
| | | | |
| | Mid Year Fiscal and Economic Review | | 23 |
| | |
| 5.2 | Loan Council Allocation |
The Australian Loan Council requires all jurisdictions to prepare Loan Council Allocations (LCA) to provide an indication of each government’s probable call on financial markets over the forthcoming financial year.
| | | | | | | | | | | | |
Table 17: Loan Council Allocation1 | |
| | | | | 2014-15 | | | | | 2014-15 | |
| | | | | Budget | | | | | Revised | |
| | | | | $ million | | | | | $ million | |
| | | General Government sector cash deficit | | | 2,342 | | | | | | 2,434 | |
| | | PNFC sector cash deficit | | | 960 | | | | | | 911 | |
| | | | | |
| | | Non-Financial Public sector cash deficit | | | 3,302 | | | | | | 3,344 | |
| | | Acquisitions under finance leases and similar arrangements | | | 14 | | | | | | 371 | |
| | | | | |
Equals | | ABS GFS cash deficit | | | 3,316 | | | | | | 3,715 | |
Less | | Net cash flows from investments in financial assets for policy purposes | | | 174 | | | | | | - | |
Plus | | Memorandum Items2 | | | 1,029 | | | | | | 873 | |
| | | Loan Council Allocation | | | 4,171 | | | | | | 4,588 | |
Notes: 1. Numbers may not add due to rounding. 2. Memorandum items include operating leases and local government borrowings. | |
| | |
| | Queensland Treasury and Trade |
| |
| 6. | Taxation and royalty revenue and assumptions |
| | | | | | | | | | | | | | | | | | | | | | | | |
Table 18: Taxation and royalty revenue1 | |
| | | 2013-14 | | | 2014-15 | | | 2014-15 | | | 2015-16 | | | 2016-17 | | | 2017-18 | |
| | | Actual | | | Budget | | | Revised | | | Projection | | | Projection | | | Projection | |
| | | $ million | | | $ million | | | $ million | | | $ million | | | $ million | | | $ million | |
Payroll tax | | | 3,914 | | | | 4,014 | | | | 3,955 | | | | 4,073 | | | | 4,278 | | | | 4,537 | |
Transfer duty | | | 2,403 | | | | 2,653 | | | | 2,883 | | | | 2,919 | | | | 3,067 | | | | 3,183 | |
Other duties | | | 1,281 | | | | 1,394 | | | | 1,365 | | | | 1,435 | | | | 1,519 | | | | 1,607 | |
Gambling taxes and levies | | | 1,044 | | | | 1,084 | | | | 1,081 | | | | 1,122 | | | | 1,164 | | | | 1,209 | |
Land tax | | | 986 | | | | 995 | | | | 995 | | | | 1,035 | | | | 1,076 | | | | 1,120 | |
Motor vehicle registration | | | 1,543 | | | | 1,578 | | | | 1,584 | | | | 1,655 | | | | 1,728 | | | | 1,806 | |
Other taxes | | | 674 | | | | 736 | | | | 735 | | | | 751 | | | | 780 | | | | 811 | |
Total taxation revenue | | | 11,845 | | | | 12,455 | | | | 12,598 | | | | 12,990 | | | | 13,613 | | | | 14,273 | |
| | | | | | | |
Royalties | | | | | | | | | | | | | | | | | | | | | | | | |
Coal | | | 1,947 | | | | 2,078 | | | | 1,806 | | | | 2,378 | | | | 2,792 | | | | 3,127 | |
Petroleum and Gas | | | 69 | | | | 199 | | | | 71 | | | | 411 | | | | 584 | | | | 638 | |
Other royalties | | | 363 | | | | 395 | | | | 455 | | | | 379 | | | | 346 | | | | 356 | |
Land rents | | | 158 | | | | 174 | | | | 174 | | | | 180 | | | | 186 | | | | 192 | |
Total royalties and land rents | | | 2,537 | | | | 2,846 | | | | 2,506 | | | | 3,348 | | | | 3,909 | | | | 4,313 | |
Note: 1. Numbers may not add due to rounding. | | | | | | | | | | | | | | | | | | | | | | | | |
| | | | | | | | | | | | | | | | |
Table 19: Royalty assumptions | |
| | | 2014-15 | | | 2015-16 | | | 2016-17 | | | 2017-18 | |
| | | Revised | | | Projection | | | Projection | | | Projection | |
Tonnages – Crown Export Coal1 (Mt) | | | 203 | | | | 212 | | | | 222 | | | | 230 | |
Exchange Rate US$ per A$2 | | | 0.87 | | | | 0.84 | | | | 0.84 | | | | 0.84 | |
Year Average Coal Prices3 (US$ per tonne) | | | | | | | | | | | | | | | | |
Hard coking | | | 124 | | | | 140 | | | | 150 | | | | 156 | |
Semi-soft | | | 100 | | | | 109 | | | | 119 | | | | 125 | |
Thermal | | | 81 | | | | 80 | | | | 84 | | | | 89 | |
Notes: 1. Excludes coal produced for domestic consumption and coal where royalties are not paid to the government, i.e private royalties. 2014-15 estimate for domestic coal volume is approximately 24Mt and private coal is 10Mt. 2. Year average. 3. Represent the benchmark contract price for highest quality coal type. Prices are discounted to reflect prices for lower quality coal. Hard coking coal can be sold up to $16 below benchmark and thermal $9 below. | |
| | | | |
| | Mid Year Fiscal and Economic Review | | 25 |
| | |
| | | | | | | | | | | | | | | | | | | | | | | | | | | | | | | | | | | | | | | | | | | | |
| Table 20: Key fiscal aggregates, 2007-08 to 2017-18 | |
| | | 2007-08 | | | 2008-09 | | | 2009-10 | | | 2010-11 | | | 2011-12 | | | 2012-13 | | | 2013-14 | | | 2014-15 | | | 2015-16 | | | 2016-17 | | | 2017-18 | |
| | | Actual | | | Actual | | | Actual | | | Actual | | | Actual | | | Actual | | | Actual | | | MYFER | | | Projection | | | Projection | | | Projection | |
| | | $ million | | | $ million | | | $ million | | | $ million | | | $ million | | | $ million | | | $ million | | | $ million | | | $ million | | | $ million | | | $ million | |
General Government | | | | | | | | | | | | | | | | | | | | | | | | | | | | | | | | | | | | | | | | | | | | |
| | | | | | | | | | | | |
Total Revenue | | | 31,430 | | | | 37,008 | | | | 39,729 | | | | 41,957 | | | | 45,794 | | | | 41,755 | | | | 46,734 | | | | 49,149 | | | | 52,951 | | | | 54,510 | | | | 56,270 | |
| | | | | | | | | | | | |
Tax Revenue | | | 9,546 | | | | 8,877 | | | | 9,375 | | | | 9,975 | | | | 10,608 | | | | 10,937 | | | | 11,845 | | | | 12,598 | | | | 12,990 | | | | 13,613 | | | | 14,273 | |
| | | | | | | | | | | | |
Total Expenses | | | 32,989 | | | | 36,974 | | | | 39,785 | | | | 43,473 | | | | 46,027 | | | | 46,313 | | | | 46,115 | | | | 49,213 | | | | 49,873 | | | | 51,390 | | | | 53,259 | |
| | | | | | | | | | | | |
Employee Expenses | | | 13,171 | | | | 14,305 | | | | 15,566 | | | | 16,820 | | | | 18,250 | | | | 18,130 | | | | 17,817 | | | | 18,610 | | | | 19,436 | | | | 20,038 | | | | 20,698 | |
| | | | | | | | | | | | |
Net Operating Balance | | | (1,559 | ) | | | 35 | | | | (56 | ) | | | (1,516 | ) | | | (233 | ) | | | (4,558 | ) | | | 619 | | | | (64 | ) | | | 3,078 | | | | 3,120 | | | | 3,011 | |
| | | | | | | | | | | | |
Capital Purchases | | | 5,716 | | | | 6,960 | | | | 8,767 | | | | 8,237 | | | | 7,930 | | | | 7,001 | | | | 6,322 | | | | 5,903 | | | | 6,089 | | | | 5,768 | | | | 5,496 | |
| | | | | | | | | | | | |
Net Capital Purchases | | | 3,668 | | | | 4,434 | | | | 6,494 | | | | 5,573 | | | | 5,249 | | | | 3,389 | | | | 3,200 | | | | 2,778 | | | | 2,747 | | | | 2,903 | | | | 2,376 | |
| | | | | | | | | | | | |
Fiscal Balance | | | (5,226 | ) | | | (4,399 | ) | | | (6,550 | ) | | | (7,089 | ) | | | (5,482 | ) | | | (7,947 | ) | | | (2,581 | ) | | | (2,842 | ) | | | 331 | | | | 216 | | | | 634 | |
| | | | | | | | | | | | |
Borrowings | | | 6,328 | | | | 10,278 | | | | 15,916 | | | | 25,089 | | | | 29,513 | | | | 37,879 | | | | 41,403 | | | | 45,801 | | | | 46,097 | | | | 46,630 | | | | 47,072 | |
| | | | | | | | | | | | |
Non-financial Public sector | | | | | | | | | | | | | | | | | | | | | | | | | | | | | | | | | | | | | | | | | | | | |
| | | | | | | | | | | | |
Total Revenue | | | 38,363 | | | | 43,659 | | | | 47,882 | | | | 48,984 | | | | 52,300 | | | | 49,175 | | | | 54,008 | | | | 55,413 | | | | 59,298 | | | | 61,310 | | | | 63,515 | |
| | | | | | | | | | | | |
Capital Purchases | | | 13,865 | | | | 15,265 | | | | 14,818 | | | | 13,344 | | | | 11,939 | | | | 10,719 | | | | 9,312 | | | | 9,329 | | | | 9,844 | | | | 9,332 | | | | 9,021 | |
| | | | | | | | | | | | |
Borrowings | | | 30,925 | | | | 42,645 | | | | 51,697 | | | | 52,618 | | | | 61,521 | | | | 69,031 | | | | 72,716 | | | | 77,553 | | | | 78,241 | | | | 78,840 | | | | 79,792 | |
| | |
| | Queensland Treasury and Trade |
| |
| | | | | | | | | | | | | | | | | | | | | | | | | | | | | | | | | | | | | | | | | | | | |
| Table 21: Key fiscal indicators, 2007-08 to 2017-18 | |
| | | 2007-08 | | | 2008-09 | | | 2009-10 | | | 2010-11 | | | 2011-12 | | | 2012-13 | | | 2013-14 | | | 2014-15 | | | 2015-16 | | | 2016-17 | | | 2017-18 | |
| | | Actual | | | Actual | | | Actual | | | Actual | | | Actual | | | Actual | | | Actual | | | MYFER | | | Projection | | | Projection | | | Projection | |
| | | % | | | % | | | % | | | % | | | % | | | % | | | % | | | % | | | % | | | % | | | % | |
General Government | | | | | | | | | | | | | | | | | | | | | | | | | | | | | | | | | | | | | | | | | | | | |
| | | | | | | | | | | | |
Revenue/GSP | | | 13.6 | | | | 14.3 | | | | 15.8 | | | | 15.6 | | | | 16.1 | | | | 14.5 | | | | 15.8 | | | | 15.8 | | | | 15.7 | | | | 15.2 | | | | 14.7 | |
| | | | | | | | | | | | |
Tax/GSP | | | 4.1 | | | | 3.4 | | | | 3.7 | | | | 3.7 | | | | 3.7 | | | | 3.8 | | | | 4.0 | | | | 4.0 | | | | 3.8 | | | | 3.8 | | | | 3.7 | |
| | | | | | | | | | | | |
Expenses/GSP | | | 14.3 | | | | 14.3 | | | | 15.8 | | | | 16.2 | | | | 16.2 | | | | 16.1 | | | | 15.6 | | | | 15.8 | | | | 14.8 | | | | 14.3 | | | | 14.0 | |
| | | | | | | | | | | | |
Employee Expenses/GSP | | | 5.7 | | | | 5.5 | | | | 6.2 | | | | 6.3 | | | | 6.4 | | | | 6.3 | | | | 6.0 | | | | 6.0 | | | | 5.8 | | | | 5.6 | | | | 5.4 | |
| | | | | | | | | | | | |
Net Operating Balance/GSP | | | (0.7 | ) | | | 0.0 | | | | (0.0 | ) | | | (0.6 | ) | | | (0.1 | ) | | | (1.6 | ) | | | 0.2 | | | | (0.0 | ) | | | 0.9 | | | | 0.9 | | | | 0.8 | |
| | | | | | | | | | | | |
Capital Purchases/GSP | | | 2.5 | | | | 2.7 | | | | 3.5 | | | | 3.1 | | | | 2.8 | | | | 2.4 | | | | 2.1 | | | | 1.9 | | | | 1.8 | | | | 1.6 | | | | 1.4 | |
| | | | | | | | | | | | |
Fiscal Balance/GSP | | | (2.3 | ) | | | (1.7 | ) | | | (2.6 | ) | | | (2.6 | ) | | | (1.9 | ) | | | (2.8 | ) | | | (0.9 | ) | | | (0.9 | ) | | | 0.1 | | | | 0.1 | | | | 0.2 | |
| | | | | | | | | | | | |
Borrowings/GSP | | | 2.7 | | | | 4.0 | | | | 6.3 | | | | 9.4 | | | | 10.4 | | | | 13.1 | | | | 14.0 | | | | 14.7 | | | | 13.7 | | | | 13.0 | | | | 12.3 | |
| | | | | | | | | | | | |
Borrowings/Revenue | | | 20.1 | | | | 27.8 | | | | 40.1 | | | | 59.8 | | | | 64.4 | | | | 90.7 | | | | 88.6 | | | | 93.2 | | | | 87.1 | | | | 85.5 | | | | 83.7 | |
| | | | | | | | | | | | |
Revenue Growth | | | (1.7 | ) | | | 17.7 | | | | 7.4 | | | | 5.6 | | | | 9.1 | | | | (8.8 | ) | | | 11.9 | | | | 5.2 | | | | 7.7 | | | | 2.9 | | | | 3.2 | |
| | | | | | | | | | | | |
Tax Growth | | | 12.5 | | | | (7.0 | ) | | | 5.6 | | | | 6.4 | | | | 6.3 | | | | 3.1 | | | | 8.3 | | | | 6.4 | | | | 3.1 | | | | 4.8 | | | | 4.9 | |
| | | | | | | | | | | | |
Expenses Growth | | | 9.5 | | | | 12.1 | | | | 7.6 | | | | 9.3 | | | | 5.9 | | | | 0.6 | | | | (0.4 | ) | | | 6.7 | | | | 1.3 | | | | 3.0 | | | | 3.6 | |
| | | | | | | | | | | | |
Employee Expenses Growth | | | 12.3 | | | | 8.6 | | | | 8.8 | | | | 8.1 | | | | 8.5 | | | | (0.7 | ) | | | (1.7 | ) | | | 4.5 | | | | 4.4 | | | | 3.1 | | | | 3.3 | |
| | | | | | | | | | | | |
Non-financial Public sector | | | | | | | | | | | | | | | | | | | | | | | | | | | | | | | | | | | | | | | | | | | | |
| | | | | | | | | | | | |
Capital Purchases/GSP | | | 6.0 | | | | 5.9 | | | | 5.9 | | | | 5.0 | | | | 4.2 | | | | 3.7 | | | | 3.1 | | | | 3.0 | | | | 2.9 | | | | 2.6 | | | | 2.4 | |
| | | | | | | | | | | | |
Borrowings/GSP | | | 13.4 | | | | 16.5 | | | | 20.6 | | | | 19.6 | | | | 21.6 | | | | 23.9 | | | | 24.5 | | | | 24.9 | | | | 23.2 | | | | 21.9 | | | | 20.9 | |
| | | | | | | | | | | | |
Borrowings/Revenue | | | 80.6 | | | | 97.7 | | | | 108.0 | | | | 107.4 | | | | 117.6 | | | | 140.4 | | | | 134.6 | | | | 140.0 | | | | 131.9 | | | | 128.6 | | | | 125.6 | |
| | | | | | | | | | | | |
Net Financial Liabilities/Revenue | | | 75.4 | | | | 97.6 | | | | 112.5 | | | | 102.2 | | | | 115.5 | | | | 131.9 | | | | 125.9 | | | | 130.5 | | | | 122.3 | | | | 116.9 | | | | 111.3 | |
| | | | |
| | Mid Year Fiscal and Economic Review | | 27 |
| | |