EXHIBIT (c)(i)
Consolidated Financial Statements of the Registrant

|
VISION |
Securing Queensland’s financial success |
MISSION |
To deliver optimal financial outcomes through sound funding and financial risk management |
VALUES |
We are focused on our clients We are passionate about Queensland We value and respect our people We are collaborative and seek continuous improvement Above all else, we value integrity |
As the Queensland Government’s central financing authority, Queensland Treasury Corporation (QTC) plays a pivotal role in securing the State’s financial success.
With a focus on whole-of-State outcomes, QTC provides a range of financial services to the State and its public sector entities, including local governments. These services include debt funding and management, cash management facilities, financial risk management advisory services, and specialist public finance education.
DEBT FUNDING AND MANAGEMENT
QTC borrows funds in the domestic and global markets in the most cost-effective manner and in a way that minimises liquidity risk and refinancing risk. QTC achieves significant economies of scale and scope by issuing, managing and administering the State’s debt funding.
QTC works closely with Queensland’s public sector entities, including local governments, to assist them to effectively manage their financial transactions, minimise their financial risk and achieve the best financial solutions for their organisation and the State.
CASH MANAGEMENT FACILITIES
QTC assists the State’s public sector entities to make the best use of their surplus cash balances within a conservative risk management framework. It offers overnight and fixed-term facilities and a managed short-term fund.
FINANCIAL RISK MANAGEMENT ADVISORY SERVICES
QTC offers a range of financial risk management advisory services to clients, including:
| § | | support to ensure financial risks are identified and effectively managed |
| § | | advice on financial and commercial considerations |
| § | | expertise in financial transactions and structures |
| § | | project management support to deliver key fiscal outcomes, and |
| § | | collaboration with the financial markets and private sector institutions. |
SPECIALIST PUBLIC FINANCE EDUCATION
QTC offers a range of education and training courses that complements its products and advisory services and allows it to share its specialist financial, commercial, treasury management and risk management expertise with clients. Courses are developed and delivered by QTC’s experienced professionals and industry experts.
| | | | |
| |
CONTENTS | | | | |
| |
| Queensland Treasury Corporation | | | 1 | |
| |
| Letter of Compliance | | | 2 | |
| |
| Key Performance Highlights | | | 3 | |
| |
| Five-Year Business Summary | | | 4 | |
| |
| Chairman’s & Chief Executive’s Report | | | 6 | |
| |
| Corporate Performance Report | | | 8 | |
| |
| Corporate Governance | | | 11 | |
| |
| Investor Report | | | 16 | |
| |
| Financial Statements | | | 20 | |
| |
Appendices | | | 61 | |
| |
QUEENSLAND TREASURY CORPORATION  ANNUAL REPORT 2013–14 1
| | | | | | | | |
23 September 2014 | | | | | |  | | |
The Honourable Tim Nicholls MP | | | | | | |
Treasurer and Minister for Trade | | | | | | |
GPO Box 611 | | | | | | |
Brisbane Qld 4001 | | | | | | |
Dear Treasurer I am pleased to present the Annual Report 2013-14 and financial statements for Queensland Treasury Corporation. I certify that this Annual Report complies with: § the prescribed requirements of the Financial Accountability Act 2009 and the Financial and Performance Management Standard 2009, and § the requirements set out in the Annual Report requirements for Queensland Government agencies. | | | | | | | | |
A checklist outlining the annual reporting requirements will be available on our website immediately following the tabling of this report in Parliament. Sincerely 
Gerard Bradley Chairman | | | | | | |
| | |
LEVEL 6, 123 ALBERT STREET, BRISBANE QUEENSLAND AUSTRALIA 4000 GPO BOX 1096, BRISBANE QUEENSLAND AUSTRALIA 4001 T: 07 3842 4600 † F: 07 3221 4122 † QTC.COM.AU | | |
2 QUEENSLAND TREASURY CORPORATION ANNUAL REPORT 2013–14
Key performance highlights
| n | Raised $11.1 billion to meet the State’s funding requirements, issuing two new benchmark-sized floating rate notes to complement existing fixed rate benchmark bonds |
| n | Declared a dividend of $120 million to Government |
| n | Generated savings for the State and clients of $152 million through portfolio management, funding strategy execution and debt management advice |
| n | Managed QTC’s Capital Guaranteed Cash Fund, which outperformed its benchmark, the UBS Australian Bank Bill Index, by 0.80 percentage points, and was ranked first in the CPG Research & Advisory Pty Ltd performance report |
| n | Completed 122 significant advisory assignments for clients, helping them meet their individual objectives in relation to the Government’s reform agenda, as well as improve their business-as-usual outcomes |
| n | Trained more than 700 employees from 50 public sector organisations through QTC’s targeted and tailored education program |
| n | Maintained a mature, strong and well-understood risk management culture and firmly established enterprise-wide risk management program as the foundations for all corporate activities |
| n | Appointed to conduct the pre-work and preliminary due diligence activities for the Government’s proposed assets transactions initiative |
| n | Seconded specialist staff to the Government’s Projects Queensland office to deliver key infrastructure for the State |
| n | Continued the implementation of an integrated suite of HR programs to enhance the agility, capability, capacity and engagement of QTC’s workforce |
QUEENSLAND TREASURY CORPORATION ANNUAL REPORT 2013–14 3
Five-year business summary
| | | | | | | | | | | | | | | | | | | | |
| |
| | | FINANCIAL
YEAR
2009-10 | | | FINANCIAL
YEAR
2010-11 | | | FINANCIAL
YEAR
2011-12 | | | FINANCIAL
YEAR
2012-13 | | | FINANCIAL
YEAR
2013-14 | |
| |
FINANCIAL | | | | | | | | | | | | | | | | | | | | |
| |
| CAPITAL MARKETS OPERATIONS | | | | | | | | | | | | | | | | | | | | |
| |
| OPERATING STATEMENT ($000) | | | | | | | | | | | | | | | | | | | | |
| |
| Interest from onlendings | | | 4 062 092 | | | | 3 107 472 | | | | 7 799 422 | | | | 2 743 084 | | | | 6 376 784 | |
| |
| Interest from other investments | | | 1 216 538 | | | | 1 187 360 | | | | 1 628 002 | | | | 786 825 | | | | 537 661 | |
| |
| Other Income | | | 110 344 | | | | 96 426 | | | | 107 233 | | | | 123 871 | | | | 132 628 | |
| |
| Interest on borrowings | | | 4 901 512 | | | | 4 071 085 | | | | 9 204 636 | | | | 3 156 860 | | | | 6 641 909 | |
| |
| Interest on deposits | | | 195 413 | | | | 189 027 | | | | 178 982 | | | | 169 696 | | | | 172 946 | |
| |
| Profit before income tax | | | 243 510 | | | | 66 831 | | | | 54 965 | | | | 238 795 | | | | 133 685 | |
| |
| Income tax expense | | | 34 074 | | | | 20 874 | | | | 8 056 | | | | 15 911 | | | | 14 465 | |
| |
| Profit for the year | | | 209 436 | | | | 45 957 | | | | 46 909 | | | | 222 884 | | | | 119 220 | |
| |
| BALANCE SHEET ($000) | | | | | | | | | | | | | | | | | | | | |
| |
| Total assets | | | 74 385 172 | | | | 79 576 098 | | | | 90 196 362 | | | | 100 439 101 | | | | 100 798 745 | |
| |
| Total liabilities | | | 73 839 889 | | | | 79 134 858 | | | | 89 708 213 | | | | 99 728 068 | | | | 100 088 492 | |
| |
| Net assets | | | 545 283 | | | | 441 240 | | | | 488 149 | | | | 711 033 | | | | 710 253 | |
| |
| | | | | |
CLIENT | | | | | | | | | | | | | | | | | | | | |
| |
| SAVINGS FOR CLIENTS ($M) | | | | | | | | | | | | | | | | | | | | |
| |
Savings due to portfolio management and
debt management advice and execution | | | -18.8 | | | | 10.3 | | | | 6.3 | | | | 319.6 | | | | 151.7 | |
| |
| LOANS TO CLIENTS | | | | | | | | | | | | | | | | | | | | |
| |
| Loans ($000) | | | 55 113 222 | | | | 59 452 522 | | | | 72 289 635 | | | | 79 118 832 | | | | 85 609 405 | |
| |
| Number of onlending clients | | | 275 | | | | 238 | | | | 205 | | | | 188 | | | | 174 | |
| |
| PERFORMANCE AGAINST BENCHMARK (% PA) | | | | | | | | | | | | | | | | | | | | |
| |
| Floating Rate Debt Pool | | | 0.21 | | | | 0.21 | | | | 0.21 | | | | 0.22 | | | | 0.14 | |
| |
| 3 Year Debt Pool | | | -0.07 | | | | 0.02 | | | | -0.06 | | | | 0.22 | | | | -0.10 | |
| |
| 6 Year Debt Pool | | | -0.08 | | | | 0 | | | | -0.10 | | | | 0.42 | | | | -0.20 | |
| |
| 9 Year Debt Pool | | | -0.07 | | | | -0.01 | | | | -0.10 | | | | 0.37 | | | | -0.22 | |
| |
| 12 Year Debt Pool | | | -0.08 | | | | -0.02 | | | | -0.13 | | | | 0.35 | | | | -0.18 | |
| |
| 15 Year Debt Pool | | | -0.05 | | | | -0.01 | | | | -0.11 | | | | 0.37 | | | | -0.2 | |
| |
| MANAGED FUNDS | | | | | | | | | | | | | | | | | | | | |
| |
| Deposits ($000) | | | 4 660 960 | | | | 5 562 013 | | | | 5 077 143 | | | | 6 127 695 | | | | 5 477 942 | |
| |
| Number of depositors | | | 207 | | | | 194 | | | | 190 | | | | 193 | | | | 187 | |
| |
| PERFORMANCE AGAINST BENCHMARK (% PA) | | | | | | | | | | | | | | | | | | | | |
| |
| Cash Fund | | | 0.36 | | | | 0.50 | | | | 0.59 | | | | 0.86 | | | | 0.80 | |
| |
4 QUEENSLAND TREASURY CORPORATION ANNUAL REPORT 2013–14
| | | | | | | | | | | | | | | | | | | | |
| |
| | | FINANCIAL
YEAR
2009-10 | | | FINANCIAL
YEAR
2010-11 | | | FINANCIAL
YEAR
2011-12 | | | FINANCIAL
YEAR
2012-13 | | | FINANCIAL
YEAR
2013-14 | |
| |
FINANCIAL MARKETS | | | | | | | | | | | | | | | | | | | | |
| |
| Debt outstanding# ($000) | | | 68 885 406 | | | | 73 224 097 | | | | 84 268 842 | | | | 93 274 588 | | | | 94 026 880 | |
| |
QTC AUD bonds (includes global bonds & FRNs)
on issue at face value ($000) | | | 61 424 032 | | | | 65 688 324 | | | | 73 184 241 | | | | 80 026 930 | | | | 80 603 375 | |
| |
| QTC BOND RATES (% AT 30 JUNE) | | | | | | | | | | | | | | | | | | | | |
| |
| Guaranteed by the Australian and Queensland governments | | | | | | | | | | | | | | | | | | | | |
| |
| 14 June 2011 | | | 4.60 | | | | - | | | | - | | | | - | | | | - | |
| |
| 16 April 2012 | | | 4.67 | | | | 4.80 | | | | - | | | | - | | | | - | |
| |
| 14 August 2013 | | | 4.86 | | | | 4.88 | | | | 3.08 | | | | 2.71 | | | | 2.52 | |
| |
| 14 October 2015 | | | 5.17 | | | | 5.10 | | | | 3.19 | | | | 2.81 | | | | 2.79 | |
| |
| 14 September 2017 | | | 5.36 | | | | 5.27 | | | | 3.56 | | | | 3.33 | | | | 3.13 | |
| |
| 14 June 2019 | | | 5.48 | | | | 5.46 | | | | 3.76 | | | | 3.75 | | | | 3.43 | |
| |
| 14 June 2021 | | | 5.59 | | | | 5.59 | | | | 3.92 | | | | 4.16 | | | | 2.52 | |
| |
| Guaranteed by the Queensland Government only | | | | | | | | | | | | | | | | | | | | |
| |
| 23 April 2012 | | | - | | | | 4.89 | | | | - | | | | - | | | | - | |
| |
| 21 August 2013 | | | - | | | | 5.02 | | | | 3.17 | | | | 2.71 | | | | - | |
| |
| 21 November 2014 | | | 5.26 | | | | 5.18 | | | | 3.27 | | | | 2.70 | | | | 2.53 | |
| |
| 21 October 2015 | | | - | | | | 5.30 | | | | 3.54 | | | | 2.97 | | | | 2.60 | |
| |
| 21 April 2016 | | | 5.49 | | | | 5.34 | | | | 3.68 | | | | 3.18 | | | | 2.65 | |
| |
| 21 September 2017 | | | - | | | | - | | | | - | | | | 3.57 | | | | 2.95 | |
| |
| 21 February 2018 | | | - | | | | 5.56 | | | | 4.05 | | | | 3.67 | | | | 3.03 | |
| |
| 21 June 2019 | | | - | | | | - | | | | - | | | | 4.02 | | | | 3.28 | |
| |
| 21 February 2020 | | | 5.77 | | | | 5.74 | | | | 4.34 | | | | 4.20 | | | | 3.38 | |
| |
| 21 June 2021 | | | - | | | | - | | | | 4.47 | | | | 4.47 | | | | 3.62 | |
| |
| 21 July 2022 | | | - | | | | 5.85 | | | | 4.54 | | | | 4.64 | | | | 3.75 | |
| |
| 21 July 2023 | | | - | | | | - | | | | - | | | | 4.83 | | | | 3.91 | |
| |
| 22 July 2024 | | | - | | | | 5.93 | | | | 4.70 | | | | 4.90 | | | | 3.97 | |
| |
| 14 March 2033 | | | 5.79 | | | | 6.03 | | | | 4.70 | | | | 5.32 | | | | 4.09 | |
| |
| QTC CAPITAL-INDEXED BOND RATES (% AT 30 JUNE) | | | | | | | | | | | | | | | | | | | | |
| |
| August 2030 | | | 3.39 | | | | 3.26 | | | | 2.56 | | | | 2.93 | | | | 2.01 | |
| |
| AVERAGE BASIS POINT MARGIN OF QTC AUD BONDS | | | | | | | | | | | | | | | | | | | | |
| |
| Guaranteed+ by both Australian and Queensland governments | | | | | | | | | | | | | | | | | | | | |
| |
Commonwealth bonds | | | 40 | | | | 29 | | | | 82 | | | | 39 | | | | 11 | |
| |
Swap | | | -13 | | | | -23 | | | | -9 | | | | -2 | | | | -14 | |
| |
| Guaranteed+ by the Queensland Government only | | | | | | | | | | | | | | | | | | | | |
| |
Commonwealth bonds | | | 64 | | | | 49 | | | | 122 | | | | 69 | | | | 31 | |
| |
Swap | | | 11 | | | | -4 | | | | 38 | | | | 27 | | | | 2 | |
| |
CORPORATE | | | | | | | | | | | | | | | | | | | | |
| |
| Number of employees (full-time equivalent) | | | 170 | | | | 186 | | | | 213 | | | | 224 | | | | 217 | |
| |
| Administration expenses ($000) | | | 34 519 | | | | 42 523 | | | | 68 674 | | | | 57 159 | | | | 64 095 | |
| |
| + | Following the Australian Government’s announcement on 25 March 2009 to offer a temporary guarantee to the states for AUD issuance, QTC applied on 17 September 2009 to take up the guarantee on all AUD benchmark bond lines for maturities ranging from 2011 to 2021. The guarantee offer expired on 31 December 2010. |
| # | QTC holds its own stock and these holdings have been excluded from the debt outstanding figures. |
QUEENSLAND TREASURY CORPORATION ANNUAL REPORT 2013–14 5
Chairman’s and
Chief Executive’s report
As conditions settled in the global financial markets, lowering uncertainty and volatility to post-crisis lows, and the Queensland Government continued the implementation of its primary fiscal objectives, Queensland Treasury Corporation (QTC) successfully funded the State’s borrowing program, contributed to many of the State’s priority projects, and provided significant whole-of-State benefits.
FUNDING OBJECTIVES MET
Buoyed by lower levels of volatility in the financial markets and the State’s progress towards fiscal reform, 2013-14 saw QTC bond spreads compress to pre-financial crisis levels for short- and mid-curve bonds, with a number of new investors attracted to QTC bonds.
QTC raised $11.1 billion to fund its borrowing program with the launch of a new 2025 benchmark bond in April 2014, and two benchmark-sized floating rate notes with maturities in 2016 and 2017, and driven by investor demand. This was supplemented with short-term issuance, which was maintained with an average of $5 billion on issue throughout the year.
On the cash management side, QTC’s Capital Guaranteed Cash Fund outperformed its benchmark, the UBS Bank Bill Index, by 0.80 percentage points and was ranked first in the CPG Research & Advisory Pty Ltd performance report, providing QTC’s clients with strong returns.
QTC’s long-standing commitment to openness and transparency continued, with its investor relationship program delivered in partnership with the domestic and global banks of its Fixed Income Distribution Group to enhance existing market relationships and attract new investors.
OPERATING RESULT POSITIVE
For the 2013-14 year, QTC recorded an operating profit after tax from its capital markets operations of $119.2 million (2012-13: $222.9 million) primarily due to fair value accounting gains associated with the management of QTC’s funding task and balance sheet.
QTC borrows in advance of requirements to ensure public sector entities have ready access to funding when required, to reduce the risk associated with refinancing maturing loans, and for liquidity management purposes. As a consequence of market changes, realised and unrealised accounting gains or losses may be recorded during the year which, depending on whether these transactions are held to maturity, may be reversed in subsequent accounting periods.
Separate from QTC’s capital markets operations, the long-term assets operations recorded a profit of $3,128.0 million (2012-13: $990.3 million). This segment comprises the investments that fund the State’s defined benefit superannuation and other long-term employee obligations.
Managed by QIC, these obligations were transferred to QTC by the Queensland Government under an administrative arrangement in 2008; in return, QTC issued the State with fixed-rate notes that provide a fixed rate of return. While QTC bears the fluctuations in the value and returns on the asset portfolio, there is no cash flow effect for QTC. Any losses incurred by this segment have no impact on QTC’s capital markets activities or its ability to meet its obligations.
6 QUEENSLAND TREASURY CORPORATION ANNUAL REPORT 2013–14
WHOLE-OF STATE CONTRIBUTION PRIORITISED
QTC supported the Government’s central agencies with their implementation of its fiscal reform agenda, with the:
| § | | completion of the first stage of the Government’s proposed asset transactions, which are subject to a mandate from Queensland voters at the 2015 election |
| § | | secondment of staff to enable Treasury’s Projects Queensland office to deliver some of the State’s most significant infrastructure projects, and |
| § | | enhancement of the financial and risk management capabilities of Government agencies through a range of education and training initiatives. |
CLIENT ADVISORY INCREASED
In the year under review, QTC prioritised the delivery of its collaborative, value-adding assignments for the State’s public sector, increasing the breadth of assignments and agencies. Assignments helped deliver cost-effective social housing and public schools; assess EOIs for several major developments; plan for the introduction of the NDIS; and support councils to deliver financially sustainable services to their communities.
The positive outcomes generated by these activities saw a continuing lift in clients’ sentiment towards QTC and perception of its ability to add value through advisory work.
TWO BOARD MEMBERS FAREWELLED
QTC farewelled two Board members—Neville Ide, whose resignation was effective 1 July 2014, and Gillian Brown, whose resignation was effective 21 August 2014—with best wishes and sincere thanks for their significant contributions to QTC over the years.
LOOKING AHEAD
In 2014-15, with its talented and committed staff, QTC will make the most of the global opportunities for bond issuance to cost-effectively fund Queensland’s infrastructure requirements; maintain its operational focus on improving efficiency and ensuring prudent risk management; and continue its partnership with Government to deliver fiscal reform and secure the State’s financial success.
|
 |
| G P BRADLEY |
Chairman |
|
 |
| P C NOBLE |
Chief Executive |
QUEENSLAND TREASURY CORPORATION ANNUAL REPORT 2013–14 7
Corporate performance report
FUNDING THE STATE
In 2013-14, QTC raised $11.1 billion to fund the State’s borrowing program. The borrowing program was reduced by $1 billion following the Government’s mid-year fiscal and economic update in December 2013, as a result of better operating performance in the general government sector, lower borrowing requirements across Government, and the deployment of surplus liquidity.
The majority of term debt funding was raised through public issuance using a variety of methods including syndicated primary transactions, taps and online tenders. For the first time since 2011, QTC issued floating rate notes (two maturities) in response to investor demand.
QTC’s Australian dollar benchmark bonds remained the cornerstone of its funding activities and in April, QTC lengthened the profile of its curve by issuing a new benchmark bond line maturing in 2025. This line was issued with 144A capability and, as a result, a number of US-based investors participated in the primary transaction.
In the period under review, QTC delivered a lower borrowing cost for the State, as bond spreads narrowed significantly; contracting, on average over the year, by 0.40 percentage points against Australian Government bonds and 0.30 percentage points to the benchmark swap rate.
In addition to providing its clients with a lower cost of funds, QTC also used its financial markets expertise to reduce transaction costs by further aligning debt issuance with client drawdowns, and to provide quality assurance of the risk analysis and pricing for public private partnerships.
QTC continued to offer a range of products that enabled clients to maximise the value of their surplus funds. This past year, QTC’s Capital Guaranteed Cash Fund outperformed its benchmark, the UBS Australian Bank Bill Index, by 0.80 percentage points and was ranked number one in the CPG Research & Advisory Pty Ltd performance report.
FINANCIAL ADVICE FOR THE STATE’S PUBLIC SECTOR
In the year under review, QTC completed a broad range of financial advisory assignments to assist clients and the State in addressing financial risk management issues and delivering meaningful whole-of-State outcomes that contribute to the achievement of the Government’s fiscal priorities and objectives, including:
| § | | the Logan Renewal Initiative for the Department of Housing and Public Works, to assist with the cost-effective delivery of social housing throughout south- east Queensland |
| § | | the development of new funding arrangements for the Department of Environment and Heritage Protection and the Department of Natural Resources and Mines to secure mine rehabilitation |
| § | | the development of a financial model to assist Queensland Treasury and Trade with the introduction of the National Disability Insurance Scheme |
| § | | the representation of the interests of the State’s energy sector through the provision of detailed submissions to the review of the National Energy Rules, to inform and influence the Australian Energy Regulator’s determination, the outcomes of which will result in a significant reduction in refinancing risk for the State, and |
| § | | the completion of 30 credit reviews of Government-owned corporations and local governments for Queensland Treasury and Trade and other shareholding departments to support their funding determinations. |
In addition, QTC provided significant support for the Projects Queensland initiative within Queensland Treasury and Trade, with the secondment of 14 specialist staff. QTC employees within Projects Queensland are leading the evaluation and procurement of some of the State’s most important infrastructure and service delivery initiatives to achieve value-for-money outcomes, deliver projects within tight time frames, and enable an appropriate transfer of risk to the private sector.
8 QUEENSLAND TREASURY CORPORATION ANNUAL REPORT 2013–14
QTC was also appointed to conduct the pre-work and preliminary due diligence activities for the Government’s proposed assets transactions initiative; the ‘Strong Choices Draft Plan’, which proposes to sell some assets, lease others and introduce an innovative option of private sector participation. While the Government will seek a mandate from Queensland voters at its next election before any divestment occurs, the completion of this work will help ensure that transactions are able to be completed in a timely manner, should the Government be given the mandate to proceed.
QTC’s role in equipping clients with specialist financial knowledge and capabilities was expanded during the year, with the development and implementation of a range of new financial education courses tailored to meet the strategic needs of clients and support the Government’s renewal and contestability initiatives.
In 2013-14, more than 700 employees from more than 50 of its client organisations participated in QTC’s targeted and tailored education program. QTC is now working with the Public Service Commission’s Commission of Audit (CoA) Implementation Team to develop and implement a financial skills training strategy for the Queensland Government workforce, as recommended by the CoA.
CORPORATE RISK MANAGEMENT AND EFFICIENCY
QTC’s mature, strong and well-understood risk management culture is supported by its firmly established enterprise-wide risk management program, and provides the foundation for all corporate activities.
In the year under review, QTC implemented an assurance framework for internal controls, identifying the organisation’s most important internal controls across all functions. The framework provides for periodic assurance from management—as well as independent assurance providers, such as internal audit—that each control is operating effectively.
Significant progress was also made towards the improvement of our tools and applications for managing market risk, credit risk and collateral for derivative transactions. This included initiatives to centralise market risk data to ensure data consistency across reports and improved visibility of business logic, which has further increased QTC’s capability to measure market risk.
QTC’s managed its portfolio market risk exposures, including interest rate, foreign exchange and counterparty risk, within Board-approved risk parameters. It also managed its financial markets risks in line with industry best practice and Basel Committee recommendations. In line with its internal and external policies, QTC continues to hold a portfolio of diverse, liquid financial securities to meet the State’s liquidity requirements.
In the year under review, significant priority was placed on the identification and implementation of opportunities to improve the efficiency and effectiveness of operations.
Planning is also underway for the longer-term strategy to ensure sustainability in our products, processes and systems, with a particular focus on the opportunities available in the changing technology environment. To support this, QTC restructured its information technology team to better enable it to respond to QTC’s corporate requirements, and established a division to ensure that all change initiatives align with QTC’s strategic and corporate direction and to provide support for the successful implementation of change projects.
QUEENSLAND TREASURY CORPORATION ANNUAL REPORT 2013–14 9
TARGETING AN AGILE, RESULTS-FOCUSED WORKFORCE
The focus on entrenching a high-performance culture within the organisation continued, centred on activities to enhance the agility, capability, capacity and engagement of QTC’s workforce. With a KPI to ensure a positive trend, staff engagement rose to 60 per cent, an increase of eight percentage points on last year and three percentage points above target. The result was supported by leaders championing the organisational agenda and by all employees participating in action workshops to remove barriers and develop solutions.
A number of initiatives to support the achievement of a high performance culture were delivered, including:
| § | | A Talent, Succession and Promotions framework was introduced with the objective of retaining, developing and most effectively deploying key talent. Succession planning focused on developing strong talent pipelines for key leadership and business-critical roles. |
| § | | A Leadership Development Program was delivered, enhancing leaders’ skills in conducting high-performance conversations and coaching. In parallel, accountability and responsibility was pushed down through the organisation through a review of HR policies, to enable greater delegation, and empowerment in decision making, for our leaders. |
| § | | A cross-organisation learning and development council was established to guide the delivery of technical and transferable skill training. |
| § | | QTC’s inaugural employee recognition program—the Chief Executive’s Awards—was launched. |
| § | | A new remuneration framework, along with updated position descriptions, was implemented to foster high performance. The new framework is more transparent, easier to understand and more effective in driving robust performance conversations. |
| § | | Strategic workforce planning was undertaken to forecast future demand for resourcing and capability mix across the business. |
QTC continued its practice of regularly reviewing and updating its policies and procedures to comply with changes in the legislative and regulatory environment and to ensure employees have access to avenues through which to raise concerns, including an internal grievance process. QTC employees are employed under individual employment agreements, which adhere to the legislated provisions of the Fair Work Act 2009.
| | | | |
| |
Workforce profile | | | FY 2013-14 | |
| |
Full-time equivalent staff | | | 217 | |
| |
Permanent retention rate | | | 85.96% | |
| |
Permanent separation rate | | | 14.25% | |
| |
Permanent average tenure | | | 6.67 years | |
| |
10 QUEENSLAND TREASURY CORPORATION ANNUAL REPORT 2013–14
Corporate governance
QTC is committed to maintaining high standards of corporate governance to support its strong market reputation and ensure that organisational goals are met and risks are monitored and appropriately addressed. QTC’s corporate governance practices are continually reviewed and updated in line with industry guidelines and standards.
QTC AND ITS BOARDS
QTC was established by the Queensland Treasury Corporation Act 1988 (the QTC Act) as a corporation sole (ie, a corporation that consists solely of a nominated office holder). The Under Treasurer of Queensland is QTC’s nominated office holder.
QTC has delegated its powers to its two boards:
| § | | the Queensland Treasury Corporation Capital Markets Board (the Board), which was established in 1991 and manages all of QTC’s operations except those relating to certain superannuation and other long-term assets, and |
| § | | the Long Term Asset Advisory Board, which was established in July 2008 and advises in relation to certain superannuation and other long-term assets that were transferred to QTC from Queensland Treasury on 1 July 2008. |
QTC Capital Markets Board
QTC and the Capital Markets Board have agreed the terms and administrative arrangements for the exercise of the powers that have been delegated to the Board by QTC (as the corporation sole).
The Board operates in accordance with its charter, which sets out its commitment to various corporate governance principles and standards, the roles and responsibilities of the Board and its members (based on its delegated powers), and the conduct of meetings. The charter provides that the role and functions of the Board include:
| § | | overseeing QTC’s operations, including its control and accountability systems |
| § | | developing and monitoring QTC’s strategic and corporate plans, operational policy and yearly budget |
| § | | monitoring and measuring financial and operational performance |
| § | | monitoring and measuring organisational and staff performance |
| § | | monitoring key risks and risk management processes, and |
| § | | ensuring that QTC’s compliance is appropriate for an organisation of its type. |
The Board holds monthly meetings (except in January) and may, whenever necessary, hold additional meetings.
Board appointments
The Board comprises directors who are appointed by the Governor-in-Council, pursuant to section 10(2) of the QTC Act, with consideration given to each Board member’s qualifications, experience, skills, strategic ability and commitment to contribute to QTC’s performance and achievement of its corporate objectives. QTC’s Board is entirely constituted of non-executive directors.
Conflict of interest
Board members are required to monitor and disclose any actual or potential conflicts of interest. Unless the Board determines otherwise, a conflicted Board member may not receive any Board papers, attend any meetings or take part in any decisions relating to declared interests.
Performance and remuneration
To ensure continuous improvement and to enhance overall effectiveness, the Board conducts an annual assessment of its performance as a whole. Board members’ remuneration is determined by the Governor in Council (details are disclosed in QTC’s financial statements).
Board committees
The Board has established three committees, each with its own terms of reference, to assist it in overseeing and governing various QTC activities.
Accounts and Audit Committee
The Accounts and Audit Committee has responsibility for the:
| § | | adequacy and effectiveness of internal controls, including for the prevention of fraud |
| § | | integrity of financial statements |
| § | | adequacy and effectiveness of compliance monitoring, and |
The Accounts and Audit Committee must have at least three members and meet at least four times a year.
|
| QUEENSLAND TREASURY CORPORATION ANNUAL REPORT 2013–14 11 |
During the year the Accounts and Audit Committee recommended the adoption of the half year and annual financial statements, reviewed external and internal audit reports and the progress in implementing the recommendations from those reports, and reviewed the Queensland Audit Office’s Client Service Plan and QTC’s Internal Audit Plan.
As required by the Audit Committee Guidelines: Improving Accountability and Performance issued by Queensland Treasury, QTC’s Accounts and Audit Committee has observed its terms of reference and has had due regard to the Audit Committee Guidelines.
Human Resources Committee
The Human Resources Committee has responsibility for:
| § | | the appropriateness of any new or amended human resources policy |
| § | | the framework for, and review of, employee remuneration and performance, and |
| § | | employment terms and conditions. |
The Human Resources Committee must have at least two members and meet at least four times a year. The Human Resources Committee has observed its terms of reference.
Funding and Markets Committee
In February 2014, the Funding & Markets Committee reviewed its Terms of Reference. The amendments reflect the refocus of the Committee away from an operational review of funding and pool performance towards a focus on assisting the Board to consider the performance and risk management of QTC’s funding and markets activities.
The core responsibilities of the Committee is to assist the Board by making recommendations about the policy to enhance the performance and management of risk in the areas of funding accessibility (including liquidity), and pool performance and to support QTC’s risk appetite with a focus on effectiveness and performance.
The Committee must have at least three members and meet at least four times a year. The Funding and Markets Committee has observed its terms of reference.
| | | | | | | | | | | | | | | | |
| |
| | | Board | | | Accounts & Audit
Committee | | | Funding
& Markets
Committee | | | Human
Resources
Committee | |
| |
Meetings held | | | 11 | | | | 6 | | | | 4 | | | | 4 | |
| |
| Gerard Bradley | | | 11 | | | | - | | | | 3 | | | | 4 | |
| |
| Alex Beavers | | | 8 | | | | - | | | | - | | | | 2 | |
| |
| Stephen Bizzell | | | 11 | | | | 6 | | | | 3 | | | | - | |
| |
| Gillian Brown* | | | 11 | | | | - | | | | 4 | | | | - | |
| |
| Tonianne Dwyer | | | 11 | | | | - | | | | - | | | | 4 | |
| |
| Neville Ide** | | | 10 | | | | 6 | | | | 4 | | | | - | |
| |
| Bill Shields | | | 11 | | | | 6 | | | | - | | | | - | |
| |
*Gillian Brown resigned from the QTC Board on 20 August 2014.
**Neville Ide resigned from the QTC Board on 30 June 2014.
LONG TERM ASSET ADVISORY BOARD
The Long Term Asset Advisory Board (LTAAB) was established in July 2008, following the transfer of certain superannuation and other long-term assets from Treasury to QTC (primarily for reasons relating to market volatility).
The LTAAB has power delegated from QTC to:
| § | | manage the sufficiency of the funding of the long-term assets |
| § | | set investment objectives and strategies for the long-term assets |
| § | | set the appropriate investment structure for the long-term assets, and |
| § | | monitor investment performance of the long-term assets. |
The LTAAB holds meetings at least four times per year and held five in the year under review.
The LTAAB members are appointed by the Governor in Council, pursuant to section 10(2) of the QTC Act.
The members of LTAAB are:
| | |
|
| Name | | Position |
|
| Under Treasurer | | Chairperson |
|
| Chief Executive, QSuper | | Member |
|
| Chief Executive, QTC | | Member |
|
| State Actuary | | Member |
|
| Assistant Under Treasurer | | Member |
|
| Assistant Under Treasurer | | Member |
|
| Deputy Under Treasurer | | Member |
|
The LTAAB has observed its terms of reference.
12 QUEENSLAND TREASURY CORPORATION ANNUAL REPORT 2013–14
AUDITORS
In accordance with the provisions of the Auditor-General Act 2009, the Queensland Audit Office is the external auditor for QTC. The Queensland Audit Office has the responsibility for providing Queensland’s Parliament with assurances as to the adequacy of QTC’s discharge of its financial and administrative obligations.
QTC has an independent Internal Audit function that was outsourced to KPMG for the 2013-2014 financial year, and is outsourced to Ernst and Young for the 2014-2015 financial year. Internal Audit reports to the Accounts and Audit Committee. Internal audit is conducted under an Internal Audit Charter that is consistent with the relevant audit and ethical standards. The role of internal audit is to support QTC’s corporate governance framework by providing the Board (through the Accounts and Audit Committee) with:
| § | | assurance that QTC has effective, efficient and economical internal controls in place to support the achievement of its objectives, including the management of risk, and |
| § | | advice with respect to QTC’s internal controls and business processes. |
Internal Audit is responsible for:
| § | | developing an annual audit plan, based on the assessment of financial and business risks (based on QTC’s approved significant risks and internal workshops) aligned with QTC’s strategic goals and objectives, and approved by the Accounts and Audit Committee |
| § | | providing regular audit reports and periodic program management reports to the management team and the Accounts and Audit Committee, and |
| § | | working constructively with QTC’s management team to challenge and improve established and proposed practices and to put forward ideas for process improvement. |
In the year under review, KPMG completed its internal audits in accordance with the approved annual audit plan.
QTC has had due regard to Treasury’s Audit Committee guidelines, in establishing and supervising its outsourced internal audit function and, together with the Accounts and Audit Committee, in overseeing and monitoring the internal audit function.
In the 2013-14 financial year, the Queensland Audit Office (QAO) audited controls and conducted some substantive testing of QTC’s systems used to complete the half year and full year annual financial statements. The QAO raised five low-rated issues that have been considered by the Accounts and Audit Committee, and addressed.
RISK MANAGEMENT
QTC manages its risks within an enterprise-wide risk management framework (EwRM). The framework supports the achievement of QTC’s corporate strategies and objectives by providing assurance that QTC’s risks are being appropriately and effectively identified and managed, using a consistent and well-understood approach for evaluating and reporting risks.
As part of this framework, QTC periodically identifies its key or significant risks, which are reported to its Risk Management Team and to the Board through structured reporting processes.
QTC’s Chief Risk Officer is responsible for embedding QTC’s risk management policy and program in its business processes, to ensure a consistent organisation-wide approach to risk mitigation and an enhanced individual employee understanding of EwRM and what it means in their day-to-day work.
STRATEGY AND STRUCTURE
Our operating model links the strategy, culture, processes, people, leadership and systems of our organisation and outlines the key business processes we use to create value for our clients.
QTC’s organisational structure supports its operating model and achievement of the organisation’s strategies creating alignment throughout the organisation, linking appropriate staff expertise and accountabilities to the client value-creation process.
MANAGEMENT TEAM
The responsibility for the day-to-day operation and administration of QTC is delegated by the Board to the Chief Executive and the Executive Management Team. The Chief Executive is appointed by the Board. Executives are appointed by the Chief Executive. As with the Board, all Executive Management Team appointments are made on the basis of qualifications, experience, skills, strategic ability, and commitment to contribute to QTC’s performance and achievement of its corporate objectives.
QTC’s Executive Management Team 2013-14
| | |
|
| Philip Noble | | Chief Executive |
|
| Steven Tagg | | Chief Operating Officer Executive General Manager, Corporate Services |
|
| Sandie Angus | | Acting Executive General Manager, Business Services (from December 2013) |
|
| John Frazer | | Executive General Manager, Business Services (to December 2013) |
|
| Rupert Haywood | | Executive General Manager, Client Services |
|
| Richard Jackson | | Executive General Manager, Funding and Markets |
|
QUEENSLAND TREASURY CORPORATION ANNUAL REPORT 2013–14 13
QTC BOARD MEMBERS 2013-14
| | |
 | | GERARD BRADLEY |
| | BComm, Dip Adv Acc , FCA, FCPA, FAICD, FAIM |
| | Chairman |
| | Appointed 10 May 2012 |
| | with tenure to 30 June 2016 |
| | |
Board Committees
| § | | Member, Human Resources Committee |
| § | | Member, Funding and Markets Committee |
Prior to his appointment as QTC’s Chairman, Mr Bradley was the Under Treasurer and Under Secretary of the Queensland Treasury Department, a position he held from 1998 to 2012. He was also a QTC Board member from 2000-2007.
Mr Bradley has extensive experience in public sector finance gained in both the Queensland and South Australian treasury departments. He was Under Treasurer of the South Australian Department of Treasury and Finance from 1996 to 1998, and of Queensland’s Treasury Department from 1995 to 1996. Mr Bradley held various positions in Queensland Treasury from 1976 to 1995, with responsibility for the preparation and management of the State Budget and the fiscal and economic development of Queensland. He is currently a Director and Chairman of Queensland Treasury Holdings Pty Ltd and related companies, and a Director of Echo Entertainment Group Ltd.
| | |
 | | ALEXANDER BEAVERS |
| | BComm, Dip Ec |
| | Deputy Chairman |
| | Appointed 1 September 2009 |
| | with tenure to 30 June 2015 |
| | |
| | |
Board Committees
| § | | Member, Human Resources Committee |
Alex Beavers was appointed Queensland’s Deputy Under Treasurer in June 2009. Prior to this appointment, he was Deputy Director-General, Policy, in the Department of the Premier and Cabinet, with responsibility for leading the Government’s policy coordination processes and managing policy advice preparation for the Premier.
Mr Beavers has also previously held the role of Assistant Under Treasurer with responsibility for Queensland’s fiscal strategy and taxation policy, as well as other senior roles within Queensland Treasury over the past 15 years.
| | |
 | | STEPHEN BIZZELL BCom, MAICD |
| |
| | Appointed in February 2013 |
| | with tenure to 30 June 2015 |
| | |
| | |
| | |
| | |
Board Committees
| § | | Member, Accounts and Audit Committee |
| § | | Member, Funding and Markets Committee |
Stephen Bizzell is an experienced company director with skills in accounting, finance, risk management and commercial management. Mr Bizzell has more than 20 years’ corporate, finance and public company management experience in the resources, energy and financial services sectors with public companies in Australia and Canada. He was a co-founder and, for 12 years, executive director of coal seam gas company Arrow Energy Ltd and is Chairman of boutique corporate advisory and funds management group Bizzell Capital Partners Pty Ltd.
Mr Bizzell currently holds company directorships on a number of ASX listed boards including Armour Energy Ltd, Diversa Limited, Laneway Resources Ltd, Renascour Resources Ltd, Stanmore Coal Ltd, and Titan Energy Services Ltd.
| | |
 | | GILLIAN BROWN |
| | LLB (Hons), Grad Dip Applied Finance |
| | and Investment, SIA |
| | Appointed 1 July 2004; |
| | resigned 20 August 2014 |
| | |
| | |
| | |
Board Committees
| § | | Chair, Funding and Markets Committee |
Gillian Brown has more than 25 years’ experience as a specialist finance lawyer and has gained extensive corporate, financing and major project experience. She is a partner of Minter Ellison Lawyers in Queensland, heading the finance practice, and is a past Chairman of that firm. Ms Brown’s principal areas of practice include corporate finance, investment and financial services, financial markets, project and infrastructure finance, and property finance.
Ms Brown has advised government bodies on a number of project and transactional arrangements and has an in-depth knowledge of the mechanics of government and its objectives. Ms Brown is a director of the Australian Rail Track Corporation Limited.
14 QUEENSLAND TREASURY CORPORATION ANNUAL REPORT 2013–14
QTC BOARD MEMBERS 2013-14 CONTINUED
| | |
 | | TONIANNE DWYER |
| | B Juris (Hons), B Laws (Hons), GAICD |
| | Appointed 14 February 2013 |
| | with tenure to 30 June 2015 |
| | |
| | |
| | |
| | |
Board Committees
| § | | Chair, Human Resources Committee |
Tonianne Dwyer is a lawyer by profession with a career of more than 25 years in international investment and finance in both executive management and board positions.
She has held senior roles with Harnbros Bank Limited and Societe Generale and was an Executive Director of Quintain Estates & Development PLC.
Ms Dwyer’s executive experience covers a broad range of sectors, including real estate investment and development, financial services, health and aged care, education, research and development, and media, including a role with the finance division of the UK Department of Health. She has extensive experience of financing social infrastructure and of leading teams on public private partnership bids. Her operational experience includes UK, Europe and Wall Street.
Ms Dwyer currently holds directorships on DEXUS Property Group, DEXUS Wholesale Property Fund, Cardno Limited and Metcash Ltd and is appointed to the Senate of the University of Queensland.
| | |
 | | BILL SHIELDS |
| | BEcon (Hons), MEc, MAICD |
| | Appointed 1 July 2004 |
| | with tenure to 30 June 2015 |
| | |
| | |
| | |
| | |
Board Committees
| § | | Chair Accounts and Audit Committee |
Bill Shields has extensive experience in the banking and finance industry, as well as government policy advice, specialising in economics. His career responsibilities have included economic and financial market research in Australia and overseas, and the provision of analytical and strategic advice on the Australian financial system and monetary policy, Australia’s exchange rate arrangements and international financial developments, as well as oversight of energy markets in Australia, New Zealand and Singapore.
Mr Shields was previously Chief Economist and Executive Director of Macquarie Bank Limited (1987–2001), and he has also held positions with the Reserve Bank of Australia (1983–1985), the International Monetary Fund (1973–75 and 1977–83), and the Australian Treasury. He was a Visiting Professor at the Macquarie Graduate School of Management of Macquarie University from 2001-09 and has recently taught at the Australian Catholic University in Brisbane. He is currently a director of the Sydney Anglican Schools Corporation and is Chair of its Education and Strategic Development Committee.
| | |
 | | NEVILLE IDE |
| | BBus, MCom, FCPA, FAICD |
| | Appointed 1 July 2011; |
| | resigned 30 June 2014 |
| | |
| | |
| | |
| | |
Board Committees
| § | | Member, Accounts and Audit Committee |
| § | | Member, Funding and Markets Committee |
Neville Ide has more than 30 years’ experience in the financial services industry, predominantly banking and insurance; his most recent executive position was as Suncorp Metway Group’s Treasurer. He has extensive commercial experience in liquidity management, debt funding, capital management and balance sheet structuring.
From 2010, Mr Ide has served on a number of boards and provided financial risk management advisory services. He is also a non-executive director of RACQ Insurance Ltd, Queensland Motorways Pty Limited, Queensland Police Credit Union Ltd and Public Trust Office Investment Board.
QUEENSLAND TREASURY CORPORATION ANNUAL REPORT 2013–14 15
Investor report
QTC has an intrinsic link with the State of Queensland, as all of its obligations with regard to debt securities and derivatives are unconditionally guaranteed by the Treasurer of Queensland on behalf of the State Government.
Since 1988, QTC has funded the Queensland Government’s public sector capital works programs and remains an important part of Queensland’s economic growth story. QTC continues to maintain a high-quality asset portfolio of public sector loans and investments, with a loan portfolio covering 174 Government clients – all underpinned by Queensland’s AA+/Aa1 credit rating.
YEAR IN REVIEW
In December 2013, QTC revised its original $12.1 billion 2013-14 estimated borrowing program down to $11.1 billion as a result of better operating performance in the general government sector, lower borrowing requirements across government and the deployment of surplus liquidity. The target borrowing program was achieved by 30 June 2014, with funds borrowed from global markets used to refinance maturing debt, as well as meet the new funding requirements of QTC’s clients–Queensland Government public sector entities–for their additional capital expenditure requirements.
In the Australian fixed income sector, QTC outperformed its peers with a significant narrowing of bond spreads over the year. On average, spreads contracted by 0.40 percentage points compared to Australian Government bonds and 0.30 percentage points to the benchmark swap rate.
To lengthen QTC’s debt maturity profile, and provide investors with a maturity in each calendar year out to 2025, QTC issued $1 billion of a new AUD denominated benchmark bond maturing in July 2025. A further $1 billion was tapped via syndication a month following the primary issuance. Investors viewed both of these public issues favourably, evidenced by the diversity of investor type and geographic distribution. Having US Rule 144A capability imbedded into QTC’s AUD domestic benchmark bond program continues to see an increased participation from the US market in primary market issuances.
While AUD benchmark bonds remain the cornerstone of QTC’s funding program, QTC also issued two benchmark-sized floating rate notes maturing in 2016 and 2017 respectively in response to investor demand for floating rate note instruments at the shorter end of the curve. These were the first floating rate instruments QTC had issued since 2011, and by year-end, aggregate outstandings were valued at more than $4 billion.
To complement its term debt issuance, QTC also maintained approximately $5 billion of commercial paper outstandings throughout the year under its Domestic Treasury-Note and US and Euro Commercial Paper programs.
In August, more than $4 billion of QTC term debt matured in both the benchmark bond program and QTC’s Australian Government Guaranteed bonds.
QTC’s Fixed Income Distribution Group (FIDG) comprising fourteen global and domestic banks act as QTC’s intermediaries in debt capital markets by supporting secondary market activity, as well as primary market issuance. As in previous years, QTC continued to work closely with its FIDG members to broaden its global investor base to support liquidity across its benchmark lines. Turnover of benchmark bonds during the year increased from the previous period.
QTC values its diverse, global investor base, estimating that almost half of its investors are domiciled in offshore jurisdictions. To help market participants stay up-to-date with QTC’s funding activities, investors can now subscribe to receive quarterly funding updates, market announcements for all public issues, as well as relevant market information about Queensland and QTC.
16 QUEENSLAND TREASURY CORPORATION ANNUAL REPORT 2013–14
CREDIT RATINGS
In 2013-14, Queensland/QTC maintained its Aa1/P1/ Negative and AA+/A-1+/Stable credit ratings from Moody’s Investors’ Service and Standard & Poor’s respectively. In June 2014, both rating agencies affirmed their ratings following the 2014-15 Queensland State Budget release.
QTC’s credit ratings (as at 30 June 2014)
| | | | | | |
|
| | | Long-term | | Short-term | | Outlook |
|
| LOCAL CURRENCY |
|
| Moody’s | | Aa1 | | P1 | | Negative |
|
| Standard & Poor’s | | AA+ | | A-1+ | | Stable |
|
| FOREIGN CURRENCY |
|
| Moody’s | | Aa1 | | P1 | | Negative |
|
| Standard & Poor’s | | AA+ | | A-1+ | | Stable |
|
| AUSTRALIAN GOVERNMENT GUARANTEED |
|
| Moody’s | | Aaa | | N/A | | Stable |
|
| Standard & Poor’s | | AAA | | N/A | | Stable |
|
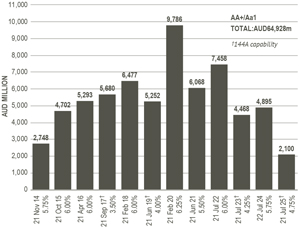
AUD BENCHMARK BONDS
QTC continued to build its AUD yield curve during the year by issuing a new benchmark bond with US Rule 144A capability maturing in 2025.
| | | | | | | | | | | | | | | | |
| |
| Bond | | Maturity | | | Coupon | | | Date issued | | | Amount issued at launch (AUD) | |
| |
| Q2025 | | | 21 July 2025 | | | | 4.75% | | | | 2 April 2014 | | | | $1.0 billion | |
| |
QTC AUD benchmark bonds, outstandings by maturity,
as at 30 June 2014
NON-BENCHMARK PUBLICLY ISSUED AUD BONDS
QTC issued two benchmark-sized floating rate notes maturing in 2016 and 2017.
| | | | | | | | | | |
| |
| FRN | | Maturity | | BBSW + margin | | Date issued | | Amount issued at launch (AUD) | |
| |
| 2016 | | 19 September
2016 | | 3mBBSW
+ 8bp | | 19 September
2013 | | | $ 1.2 billion | |
| |
| 2017 | | 06 March
2017 | | 3mBBSW
+ 9bp | | 6 March
2014 | | | $ 1.0 billion | |
| |
Non-benchmark publicly issued AUD bonds,
outstandings by maturity as at 30 June 2014
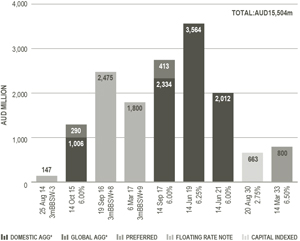
* Australian Government Guaranteed
Note: The 20 August 2030 Capital Index Bond outstandings do not include indexation of $171.3 million. The 19 Sep 2016, 06 Mar 2017 and 19 Nov 2018 FRNs all carry 144A capability.
ABOUT THE AUSTRALIAN
GOVERNMENT GUARANTEE
In 2009 QTC accepted the offer of a guarantee from the Australian Government (in addition to the guarantee provided by the Queensland Government) as a result of the global economic and financial crisis. All remaining benchmark bond lines under this guarantee will remain covered until maturity or retirement. These bonds are rated Aaa/AAA by Moody’s Investors Service and Standard & Poor’s respectively. The Guarantee was closed to new issuance after 31 December 2010.
Through its Fixed Income Distribution Group, QTC offers investors the opportunity to switch Australian Government Guaranteed AUD bonds into equivalent AUD benchmark bonds. During the year, investors chose to switch $5 billion into QTC’s AUD benchmark bonds.
QUEENSLAND TREASURY CORPORATION ANNUAL REPORT 2013–14 17
LIQUIDITY
| § | | QTC is the largest sub-sovereign Australian fixed income issuer. |
| § | | QTC’s AUD benchmark bonds are its principal source of funding. |
| § | | QTC provides investors with a choice of 12 benchmark bonds, ranging in maturity from 2014 to 2025. |
| § | | QTC works closely with its Fixed Income Distribution Group to actively support secondary market activity in its bonds. |
| § | | Issuance is executed on a tap, tender, reverse enquiry, and/or syndication basis, depending on market conditions. |
| | |
| | STRONG GLOBAL PARTNERSHIPS DEDICATED DISTRIBUTION GROUP QTC has dedicated dealer panels to ensure investors have choice and reliable access to trade in QTC’s debt securities. QTC’s Fixed Income Distribution Group is committed to providing investors with two-way bond pricing in the secondary market, as well as supporting primary issuance activities. QTC’s Fixed Income Distribution Group* comprises: § ANZ Banking Group Limited § Bank of America Merrill Lynch § Barclays (withdrew 30 June 2014) § BNP Paribas § Citi § Commonwealth Bank of Australia § Deutsche Bank § HSBC § JP Morgan § National Australia Bank Limited § Nomura International plc § RBC Capital Markets § TD Securities § UBS Investment Bank § Westpac Banking Corporation *Actual dealer entities may vary depending on the facility and location of the dealer. See Appendix D for contact details. |
FUTURE FUNDING REQUIREMENTS
Following the release of Queensland’s 2014-15 State Budget on 3 June 2014, QTC announced its estimated 2014-15 borrowing program to be $13 billion: $8 billion term debt and approximately $5 billion of short-term debt (primarily commercial paper).
QTC expects to fund its term debt issuance by supporting liquidity in its benchmark bonds, which will continue to remain QTC’s principal source of funding. QTC will consider further issuance of floating rate notes, and issuance will be targeted to smooth the benchmark bond maturity profile.
Investors will again be offered the opportunity to switch Australian Government Guaranteed bonds into QTC’s AUD benchmark bonds guaranteed by the State of Queensland.
As part of the Queensland State Budget release, the Government announced a ‘Strong Choices Draft Plan’ of asset transactions – including sale, long-term leases and private sector participation.
The final plan is expected to be announced in September 2014 and the Government has indicated that this plan will form part of its policy agenda for the next State Government election expected in early 2015. The Government has made it clear that no assets will be sold or leased prior to a mandate being obtained at the election.
As a result, QTC’s 2014-15 borrowing program does not take into account any proceeds from potential asset transactions. QTC will continue to keep the market informed on any outcomes relating to the proposed asset transactions and impact on its funding requirements.
QTC’s 2014-15 term debt indicative borrowing program
| | | | |
| |
| | | AUD M* | |
| |
New money | | | | |
| |
State (includes General Government and Government owned corporations) | | | 3,800 | |
| |
Local Government and other entities# | | | 900 | |
| |
Total new money | | | 4,700 | |
| |
Net term debt refinancing | | | 3,300 | |
| |
Total term debt requirement | | | 8,000 | |
| |
*Numbers are rounded to the nearest $100 million.
#Other entities include: retail water entities, universities, grammar schools and water boards.
Note: Funding activity may vary depending upon actual client requirements, the State’s fiscal position and financial market conditions.
18 QUEENSLAND TREASURY CORPORATION ANNUAL REPORT 2013–14
ACCESS TO FUNDING
Overview of funding facilities as at 30 June 2014
| | | | | | | | | | | | |
| |
| Facility | | | | Size ($M) | | Maturities | | Currencies | | On issue
(AUD M) | |
| |
| Short-term | | Domestic T-Note | | Unlimited | | 7–365 days | | AUD | | | 2,164 | |
| | | |
| | Euro CP | | USD10,000 | | 1–364 days | | Multi-currency | | | 1,573 | |
| | | |
| | US CP | | USD10,000 | | 1–270 days | | USD | | | 752 | |
| |
| Long-term | | AUD Bond | | Unlimited | | 12 benchmark lines: 2014–2025 | | AUD | | | 64,928 | |
| | | | | |
| | | | 4 AGG* lines: 2015–2021 | | AUD | | | 8,916 | |
| | | | | |
| | | | Preferred line: 2033 | | AUD | | | 800 | |
| | | | | |
| | | | Capital Indexed Bond: 2030 | | AUD | | | 834 | |
| | | | | |
| | | | 3 floating rate notes: 2014, 2016, 2017 | | AUD | | | 4,422 | |
| | | |
| | Global AUD Bond | | AUD20,000 | | 2 AGG* lines 2015 &2017 (transferrable to domestic bonds) | | AUD | | | 703 | |
| | | |
| | Multi-currency Euro MTN | | USD10,000 | | Any maturity subject to market regulations | | Multi-currency | | | 1,101 | |
| | | |
| | Multi-currency US MTN | | USD10,000 | | 9 months – 30 years | | Multi-currency | | | 0 | |
| |
* Australian Government Guaranteed
FUNDING PRINCIPLES
| | |
| CONSERVATIVE: | | Balanced debt maturity profile supported by liquid reserves |
| |
| PRUDENT: | | Disciplined approach to financial risk management |
| |
| TRANSPARENT: | | Comprehensive, regular market updates |
| |
| COMMITTED: | | Valued long-term investor and intermediary relationships |
AUSTRALIAN GOVERNMENT FISCAL SUPPORT
Australia is one of only eight countries globally rated AAA/ Aaa/AAA with a stable outlook from all three major credit ratings agencies.
The Australian Government provides explicit financial support to all Australian states and territories in the form of:
| § | | the payment of grants under the principle of the Horizontal Fiscal Equalisation scheme, which seeks to reduce the revenue-raising and cost disparities between the Australian states and territories |
| § | | National Disaster Relief and Recovery Arrangements, which provides reimbursement for eligible costs for natural disasters, and |
| § | | the offer of a time-limited, voluntary guarantee over Australian state and territory borrowings from July 2009 to December 2010. |
INFORMATION FOR INSTITUTIONAL INVESTORS
Core to its key funding principles, QTC is committed to being open and transparent with investors and its partners in the financial markets.
Through its website, QTC provides a range of information for investors on its various funding facilities and annual borrowing program. The website also hosts an analysts’ centre with information and links about Australia and Queensland to help investors gain a better understanding of:
| § | | the different levels of government in Australia |
| § | | the forms of fiscal support the Australian Government provides to the states and territories |
| § | | relevant governance practices, legislation and polices |
| § | | financial data and budget information, and |
| § | | economic and trade data. |
A digital version of QTC’s investor booklet is available for iPad users from the iTunes store.
QTC also offers investors the ability to subscribe to quarterly funding updates in English, Japanese, as well as Modern Chinese and Traditional Chinese.
Website: qtc.qld.gov.au/qtc/public/web/investors
Quarterly investor updates: Subscribe from the institutional investor section of the website
Analysts’ centre: qtc.qld.gov.au/qtc/public/web/investors/ analystcentre
Invest in QTC for iPad users: itunes.apple.com/au/app/ queensland-treasurycorporation/id539372974?mt=8&uo=4
Bloomberg ticker: qtc
Note: Investors with a US-based iTunes account do not have access to the Invest in QTC iPad application.
QUEENSLAND TREASURY CORPORATION ANNUAL REPORT 2013–14 19
Financial
Statements
FOR THE YEAR ENDED 30 JUNE 2014
| | |
CONTENTS | | |
| |
| Statement of comprehensive income | | 21 |
| |
| Balance sheet | | 22 |
| |
| Statement of changes in equity | | 23 |
| |
| Statement of cash flows | | 24 |
| |
Notes to and forming part of the Financial Statements | | 25 |
| |
Certificate of the Queensland Treasury Corporation | | 57 |
| |
| Independent auditor’s report | | 58 |
| |
| Management report | | 60 |
20 QUEENSLAND TREASURY CORPORATION ANNUAL REPORT 2013–14
STATEMENT OF COMPREHENSIVE INCOME
FOR THE YEAR ENDED 30 JUNE 2014
| | | | | | | | | | | | |
| |
| | | NOTE | | | 2014 $000 | | | 2013
$000 | |
| |
| | | |
| CAPITAL MARKETS OPERATIONS | | | | | | | | | | | | |
| |
| Net interest income | | | | | | | | | | | | |
| |
| Interest income | | | 4 | | | | 6 914 445 | | | | 3 529 909 | |
| |
| Interest expense | | | 4 | | | | (6 814 855) | | | | (3 326 556) | |
| |
| | | | | | | 99 590 | | | | 203 353 | |
| |
| | | |
| Other income | | | | | | | | | | | | |
| |
| Fees | | | 5 | | | | 67 164 | | | | 69 112 | |
| |
| Lease income | | | | | | | 49 983 | | | | 48 321 | |
| |
| Amortisation of cross border lease deferred income | | | | | | | 14 322 | | | | 6 438 | |
| |
| Gain on sale of property, plant and equipment | | | | | | | 1 159 | | | | - | |
| |
| | | | | | | 132 628 | | | | 123 871 | |
| |
| | | |
| Expenses | | | | | | | | | | | | |
| |
| Administration expenses | | | 6 | | | | (64 095) | | | | (57 159) | |
| |
| Depreciation on leased assets | | | | | | | (33 292) | | | | (31 808) | |
| |
| Loss on sale of property, plant and equipment | | | | | | | - | | | | (9) | |
| |
| Other expenses | | | | | | | - | | | | 26 | |
| |
| | | | | | | (97 387) | | | | (88 950) | |
| |
| | | |
| Share of associate’s net (loss)/profit | | | | | | | (140) | | | | 521 | |
| |
| Loss on transfer of associate | | | | | | | (1 006) | | | | - | |
| |
| | | | | | | (1 146) | | | | 521 | |
| |
| | | |
| Profit from capital markets operations before income tax | | | | | | | 133 685 | | | | 238 795 | |
| |
| Income tax expense | | | 7 | | | | (14 465) | | | | (15 911) | |
| |
| Profit from capital markets operations after income tax | | | | | | | 119 220 | | | | 222 884 | |
| |
| | | |
| LONG TERM ASSETS | | | | | | | | | | | | |
| |
| Net return from investments in long term assets | | | | | | | | | | | | |
| |
| Net change in fair value of unit trusts | | | | | | | 5 386 325 | | | | 3 370 042 | |
| |
| Interest on fixed rate notes | | | | | | | (2 166 897) | | | | (2 302 032) | |
| |
| Management fees | | | | | | | (91 471) | | | | (77 662) | |
| |
| Profit from long term assets | | | | | | | 3 127 957 | | | | 990 348 | |
| |
| | | |
| Total net profit for the year after tax | | | | | | | 3 247 177 | | | | 1 213 232 | |
| |
| Total comprehensive income attributable to the owner | | | | | | | 3 247 177 | | | | 1 213 232 | |
| |
| | | |
| Total comprehensive income derived from: | | | | | | | | | | | | |
| |
| Capital markets operations | | | 3 | | | | 119 220 | | | | 222 884 | |
| |
| Long term assets | | | 3 | | | | 3 127 957 | | | | 990 348 | |
| |
| Total comprehensive income | | | | | | | 3 247 177 | | | | 1 213 232 | |
| |
The notes on pages 25 to 56 are an integral part of these financial statements.
Note: Throughout these financial statements the capital markets operations and the long term assets operations have been disclosed separately to distinguish between QTC’s main central treasury management role and its additional responsibilities following the transfer of the State’s superannuation and other long-term assets (refer notes 1 and 3).
QUEENSLAND TREASURY CORPORATION ANNUAL REPORT 2013–14 21
BALANCE SHEET
AS AT 30 JUNE 2014
| | | | | | | | | | | | |
| |
| | | NOTE | | | 2014
$000 | | | 2013 $000 | |
| |
| | | |
| ASSETS | | | | | | | | | | | | |
| |
| Capital markets operations | | | | | | | | | | | | |
| |
| Cash | | | | | | | 546 | | | | 197 | |
| |
| Receivables | | | 8 | | | | 4 384 | | | | 3 568 | |
| |
| Financial assets at fair value through profit or loss | | | 9 | | | | 14 698 901 | | | | 20 194 045 | |
| |
| Derivative financial assets | | | 10 | | | | 252 543 | | | | 788 461 | |
| |
| Onlendings | | | 11 | | | | 85 609 405 | | | | 79 118 832 | |
| |
| Property, plant and equipment | | | 12 | | | | 227 714 | | | | 326 270 | |
| |
| Investments accounted for using the equity method | | | 29 | | | | - | | | | 1 407 | |
| |
| Intangible assets | | | 13 | | | | 2 118 | | | | 4 189 | |
| |
| Deferred tax asset | | | 7 | | | | 3 134 | | | | 2 132 | |
| |
| | | | | | | 100 798 745 | | | | 100 439 101 | |
| |
| Long term assets | | | | | | | | | | | | |
| |
| Financial assets at fair value through profit or loss | | | 9 | | | | 33 431 249 | | | | 29 767 721 | |
| |
| | | | | | | 33 431 249 | | | | 29 767 721 | |
| |
| Total Assets | | | | | | | 134 229 994 | | | | 130 206 822 | |
| |
| | | |
| LIABILITIES | | | | | | | | | | | | |
| |
| Capital markets operations | | | | | | | | | | | | |
| |
| Payables | | | 14 | | | | 148 167 | | | | 27 218 | |
| |
| Derivative financial liabilities | | | 10 | | | | 344 827 | | | | 167 726 | |
| |
| Financial liabilities at fair value through profit or loss | | | | | | | | | | | | |
| |
| - Interest bearing liabilities | | | 15 | | | | 94 026 880 | | | | 93 274 588 | |
| |
| - Deposits | | | 15 | | | | 5 477 942 | | | | 6 127 695 | |
| |
| Other liabilities | | | 16 | | | | 90 676 | | | | 130 841 | |
| |
| | | | | | | 100 088 492 | | | | 99 728 068 | |
| |
| Long term assets | | | | | | | | | | | | |
| |
| Financial liabilities at amortised cost | | | 17 | | | | 31 983 174 | | | | 31 447 603 | |
| |
| | | | | | | 31 983 174 | | | | 31 447 603 | |
| |
| Total Liabilities | | | | | | | 132 071 666 | | | | 131 175 671 | |
| |
| Net Assets | | | | | | | 2 158 328 | | | | (968 849) | |
| |
| | | |
| EQUITY | | | | | | | | | | | | |
| |
| Capital markets operations | | | | | | | | | | | | |
| |
| Retained surplus | | | | | | | 710 253 | | | | 711 033 | |
| |
| | | | | | | 710 253 | | | | 711 033 | |
| |
| Long term assets | | | | | | | | | | | | |
| |
| Retained surplus/(deficit) | | | | | | | 1 448 075 | | | | (1 679 882) | |
| |
| | | | | | | 1 448 075 | | | | (1 679 882) | |
| |
| Total Equity | | | | | | | 2 158 328 | | | | (968 849) | |
| |
The notes on pages 25 to 56 are an integral part of these financial statements.
22 QUEENSLAND TREASURY CORPORATION ANNUAL REPORT 2013–14
STATEMENT OF CHANGES IN EQUITY
FOR THE YEAR ENDED 30 JUNE 2014
| | | | | | | | | | | | | | | | |
| |
| | | NOTE | | | CAPITAL
MARKETS
OPERATIONS | | | LONG TERM
ASSETS | | | | |
| |
| | | | | | RETAINED
SURPLUS $000 | | | RETAINED
SURPLUS
$000 | | | TOTAL
EQUITY
$000 | |
| |
| Balance at 1 July 2012 | | | | | | | 488 149 | | | | (2 670 230) | | | | (2 182 081) | |
| |
| Profit for the year | | | | | | | 222 884 | | | | 990 348 | | | | 1 213 232 | |
| |
| Balance at 30 June 2013 | | | | | | | 711 033 | | | | (1 679 882) | | | | (968 849) | |
| |
| | | | |
| Balance at 1 July 2013 | | | | | | | 711 033 | | | | (1 679 882) | | | | (968 849) | |
| |
| Profit for the year | | | | | | | 119 220 | | | | 3 127 957 | | | | 3 247 177 | |
| |
| Transactions with owners in their capacity as owners: | | | | | | | | | | | | | | | | |
| Dividends provided for or paid | | | 31 | | | | (120 000) | | | | - | | | | (120 000) | |
| |
| Balance at 30 June 2014 | | | | | | | 710 253 | | | | 1 448 075 | | | | 2 158 328 | |
| |
The notes on pages 25 to 56 are an integral part of these financial statements.
QUEENSLAND TREASURY CORPORATION ANNUAL REPORT 2013–14 23
STATEMENT OF CASH FLOWS
FOR THE YEAR ENDED 30 JUNE 2014
| | | | | | | | | | | | |
| |
| | | | | | 2014 | | | 2013 | |
| | | NOTE | | | $000 | | | $000 | |
| |
| | | |
| CAPITAL MARKETS OPERATIONS | | | | | | | | | | | | |
| |
| Cash flows from operating activities | | | | | | | | | | | | |
| |
| Interest received from onlendings | | | | | | | 4 181 238 | | | | 3 995 758 | |
| |
| Interest received from investments | | | | | | | 807 729 | | | | 988 338 | |
| |
| Interest received - other | | | | | | | 50 089 | | | | 49 961 | |
| |
| Fees received | | | | | | | 66 934 | | | | 68 975 | |
| |
| GST paid to suppliers | | | | | | | (9 050) | | | | (14 175) | |
| |
| GST refunds from ATO | | | | | | | 10 048 | | | | 17 021 | |
| |
| GST paid to ATO | | | | | | | (6 355) | | | | (6 236) | |
| |
| GST received from clients | | | | | | | 6 357 | | | | 6 250 | |
| |
| Interest paid on interest-bearing liabilities | | | | | | | (4 442 515) | | | | (4 006 685) | |
| |
| Interest paid on deposits | | | | | | | (172 857) | | | | (169 177) | |
| |
| Administration expenses paid | | | | | | | (60 090) | | | | (48 104) | |
| |
| Income tax paid | | | | | | | (15 635) | | | | (8 588) | |
| |
| Net cash provided by operating activities | | | 18 | | | | 415 893 | | | | 873 338 | |
| |
| | | |
| Cash flows from investing activities | | | | | | | | | | | | |
| |
| Proceeds from sale of investments | | | | | | | 35 689 977 | | | | 40 610 160 | |
| |
| Payments for investments | | | | | | | (30 471 584) | | | | (43 718 896) | |
| |
| Net onlendings | | | | | | | (4 212 638) | | | | (8 081 846) | |
| |
| Payments for property, plant and equipment | | | | | | | (11 245) | | | | (74 150) | |
| |
| Payments for intangibles | | | | | | | (252) | | | | (1 166) | |
| |
| Proceeds from sale of property, plant and equipment | | | | | | | 4 595 | | | | 13 | |
| |
| Dividend received | | | | | | | 261 | | | | 491 | |
| |
| Net cash provided by / (used in) investing activities | | | | | | | 999 114 | | | | (11 265 394) | |
| |
| | | |
| Cash flows from financing activities | | | | | | | | | | | | |
| |
| Proceeds from interest-bearing liabilities | | | | | | | 55 621 832 | | | | 58 192 475 | |
| |
| Repayment of interest-bearing liabilities | | | | | | | (56 386 648) | | | | (48 850 999) | |
| |
| Net deposits | | | | | | | (649 842) | | | | 1 050 034 | |
| |
| Net cash (used in) / provided by financing activities | | | | | | | (1 414 658) | | | | 10 391 510 | |
| |
| | | |
| Net increase / (decrease) in cash held | | | | | | | 349 | | | | (546) | |
| |
| Cash at 1 July | | | | | | | 197 | | | | 743 | |
| |
| Net cash at 30 June | | | | | | | 546 | | | | 197 | |
| |
| | | |
| LONG TERM ASSETS | | | | | | | | | | | | |
| |
| No external cashflow is generated from the long term assets (refer notes 1 and 3). | | | | | | | | | | | | |
| |
The notes on pages 25 to 56 are an integral part of these financial statements.
24 QUEENSLAND TREASURY CORPORATION ANNUAL REPORT 2013–14
NOTES TO AND FORMING PART OF THE FINANCIAL STATEMENTS
FOR THE YEAR ENDED 30 JUNE 2014
CONTENTS
| | | | |
| 1 | | General information | | 25 |
| 2 | | Summary of significant accounting policies | | 25 |
| 3 | | Segment reporting | | 28 |
| 4 | | Interest income and interest expense | | |
| | from capital markets operations | | 29 |
| 5 | | Fees | | 31 |
| 6 | | Administration expenses | | 31 |
| 7 | | Income tax expense | | 32 |
| 8 | | Receivables | | 32 |
| 9 | | Financial assets at fair value through profit or loss | | 33 |
| 10 | | Derivative financial assets and derivative financial liabilities | | 34 |
| 11 | | Onlendings | | 34 |
| 12 | | Property, plant and equipment | | 35 |
| 13 | | Intangible assets | | 36 |
| 14 | | Payables | | 36 |
| 15 | | Financial liabilities at fair value through profit or loss | | 37 |
| 16 | | Other liabilities | | 39 |
| 17 | | Financial liabilities at amortised cost | | 39 |
| 18 | | Notes to the statement of cash flows | | 40 |
| 19 | | Financial risk management | | 41 |
| 20 | | Fair value hierarchy | | 48 |
| 21 | | Concentrations of borrowings and deposits | | 49 |
| 22 | | Contingent liabilities | | 50 |
| 23 | | Leases | | 50 |
| 24 | | Commitments | | 51 |
| 25 | | Funding facilities | | 51 |
| 26 | | Related party transactions | | 52 |
| 27 | | Key management personnel | | 52 |
| 28 | | Auditor’s remuneration | | 54 |
| 29 | | Investment in joint venture entity | | 55 |
| 30 | | Investments in companies | | 56 |
| 31 | | Dividends | | 56 |
| 32 | | Events subsequent to balance date | | 56 |
Queensland Treasury Corporation (QTC) is constituted under the Queensland Treasury Corporation Act 1988 (the Act), with the Under Treasurer designated as the Corporation Sole under section 5 (2) of the Act.
QTC is the State’s central financing authority and corporate treasury services provider, with responsibility for providing debt funding, liability management, cash management and financial risk management advice to public sector clients. These services, which form part of QTC’s Capital Markets Operations segment, are undertaken on a cost-recovery basis with QTC lending at an interest rate based on its cost of funds and with the benefits/costs of liability and asset management being passed on to its clients being Queensland public sector entities. However QTC’s Capital Markets Operations can generate a profit largely reflecting the interest earned from the investment of its equity. In undertaking its Capital Markets activities, QTC maintains adequate capital to manage its risks.
QTC holds a portfolio of assets which were transferred to QTC by the State Government. These assets are the investments of QTC’s Long Term Assets segment and are held to fund superannuation and other long-term obligations of the State such as insurance and long service leave. In return, QTC has issued to the State fixed rate notes which has resulted in the State receiving a fixed rate of return on the notes, while QTC bears the impact of fluctuations in the value and returns on the asset portfolio (refer note 3).
The Long Term Asset Advisory Board is responsible for the oversight of the Long Term Assets which do not form part of QTC’s day-to-day Capital Markets Operations. The Long Term Assets are held in unit trusts managed by QIC Limited (QIC).
(a) Basis of preparation
These general purpose financial statements for the year ended 30 June 2014 have been prepared in accordance with the requirements of the Financial Accountability Act 2009 and Australian Accounting Standards adopted by the Australian Accounting Standards Board.
Compliance with International Financial Reporting Standards: QTC’s financial statements comply with International Financial Reporting Standards (IFRS) as issued by the International Accounting Standards Board. While QTC is designated as a not-for-profit entity, the Corporation has elected to comply with the requirements of International Financial Reporting Standards as if it is a for-profit entity.
New accounting standards: A number of new and amended accounting standards were mandatory from 1 July 2013. The affected policies and standards including the impact on the financial statements are as follows:
| § | | Principles of Consolidation - new standards AASB 10 Consolidated Financial Statements and AASB 11 Joint Arrangements. AASB 10 changes the definition of control based on the entity’s exposure to the rights and variability of returns through its power to direct the activities of an investee. AASB 11 requires joint ventures to be classified based on the contractual rights and obligations and where each party has rights to the net assets of the arrangement to be accounted for using the equity method. QTC has reviewed its investments in other entities and no adjustments to the carrying amounts in the financial statements were required. |
| § | | Revised AASB 119 Employee Benefits - AASB 119 has changed the way employee benefits are measured now requiring these to be based on when the amount is expected to be settled. Previously this was based on when the amount was due. The impact of this change is immaterial. |
| § | | AASB 13 Fair Value Measurement which is applicable for the first time this year establishes a single source of guidance for fair value measurement and disclosures about fair value. Other than additional disclosures, the application of AASB 13 does not have any material impact on the amounts recognised in the financial statements. |
| § | | AASB 2011-4 Amendments to Australian Accounting Standards to Remove Individual Key Management Personnel Disclosure Requirements has removed the specific requirements for reporting individual key management personnel disclosures. |
| § | | AASB 7 Financial Instruments: Disclosures regarding the right to offset and related arrangements (such as collateral requirements) for financial instruments under an enforceable master netting arrangement or similar arrangements. This has added new financial risk management disclosures (refer note 19). |
Standards and interpretations not yet adopted: Certain new accounting standards have been published that are not mandatory for the current reporting period. The Corporation’s assessment of the impact of material changes from these standards and interpretations are set out below.
Effective for annual periods beginning on or after 1 January 2017:
| § | | AASB 9 Financial Instruments will replace AASB 139 Financial Instruments: Recognition and measurement. The new standard specifies new recognition and measurement requirements for financial assets within the scope of AASB 139. The amendments require financial assets to be measured at fair value through profit or loss unless they meet the criteria for amortised cost measurement. For financial liabilities, AASB 9 has largely adopted the recognition and measurement criteria currently contained in AASB 139. One key difference is in relation to the recognition of “own credit” movements for liabilities measured at fair value. Under the revised standard, any change in fair value attributable to an entity’s own credit risk is to be shown in other comprehensive income, not as part of profit or loss. An exemption applies to entities which have offsetting risk profiles which allows QTC to measure both financial assets and financial liabilities at fair value through profit or loss. Therefore this is not expected to change the current practice of measuring changes in fair value movements of financial instruments through profit or loss. |
Other than as noted above, the adoption of various Australian Accounting Standards and Interpretations on issue but not yet effective is not expected to have a material impact on the financial statements of the Corporation. However, the pronouncements may result in changes to how information is currently disclosed.
Basis of measurement: The financial statements are prepared on the basis of fair value measurement of assets and liabilities except where otherwise stated.
Functional and presentation currency: These financial statements are presented in Australian dollars, which is QTC’s functional currency.
QUEENSLAND TREASURY CORPORATION ANNUAL REPORT 2013–14 25
Classification of assets and liabilities: The balance sheet is presented on a liquidity basis. Assets and liabilities are presented in decreasing order of liquidity and are not distinguished between current and non-current.
(b) Investment in joint venture entity
QTC’s investment in Local Government Infrastructure Services Pty Ltd (LGIS) was accounted for using the equity method in the financial statements. Under the equity method, the share of the profits or losses of the joint venture is recognised in the statement of comprehensive income, and the share of movement in equity is recognised in the balance sheet. Investments in joint venture entities are carried at the equity accounted amount adjusted for the realisable value where the asset is held for sale (refer note 29). At 1 July 2014, QTC transferred its shares in LGIS to Local Government Association of Queensland for nominal consideration. QTC has written down its investment in LGIS at 30 June 2014 to reflect the assets recoverable value at that date.
(c) Investments in other companies
Investments in other companies are accounted for at cost (refer note 30). The principal activity of QTC’s main investment company, Queensland Treasury Holdings Pty Ltd (QTH), is to act as a corporate vehicle through which the Queensland Government undertakes activities of strategic importance to the State.
Queensland Treasury and Trade holds a 60 per cent beneficial interest in QTH. The remaining 40 per cent is held by QTC for and on behalf of the Under Treasurer as Corporation Sole of QTC.
QTC does not apply the equity method to its investment in QTH as it does not have power over the entity, exposure or rights to variable returns or power to affect those returns.
(d) Foreign currency
Foreign currency transactions are initially translated into Australian dollars at the rate of exchange applying at the date of the transaction. At balance date, amounts payable to and by QTC in foreign currencies have been valued using current exchange rates after taking into account interest rates and accrued interest.
Exchange gains/losses are brought to account in the statement of comprehensive income.
(e) Cash
Cash assets include only those funds held at bank and do not include money market deposits.
(f) Financial assets and financial liabilities
Recognition and derecognition: Financial assets and financial liabilities are recognised in the balance sheet when QTC becomes party to the contractual provisions of the financial instrument which is the settlement date of the transaction.
A financial asset is derecognised when the contractual rights to the cash flows from the financial assets expire or are transferred and no longer controlled by QTC.
A financial liability is removed from the balance sheet when the obligation specified in the contract is discharged, cancelled or expires.
Measurement: Financial assets and liabilities at fair value through profit or loss are measured at fair value by reference to quoted market exit prices when available. If quoted market prices are not available, then fair values are estimated on the basis of pricing models or other recognised valuation techniques with consideration for the effect of counterparty credit.
Fair value is the amount for which an asset could be exchanged or liability settled between knowledgeable, willing parties in an arm’s length transaction.
QTC uses mid-market rates as the basis for establishing fair values of quoted financial instruments with offsetting risk positions. In general, the risk characteristics of funds borrowed, together with the financial derivatives used to manage interest rate and foreign currency risks, closely match those of funds onlent. In all other cases, the bid-offer spread is applied where material.
Financial liabilities at amortised cost are measured using the effective interest method. The effective interest method is a method of calculating the amortised cost of a financial instrument and allocating the interest income or interest expense over the relevant period. In this way, interest is recognised in the statement of comprehensive income in the period in which it accrues.
Classification: Financial instruments on initial recognition are classified into the following categories:
| • | | Derivative financial instruments |
| • | | Financial assets at fair value through profit or loss |
| • | | Financial liabilities at fair value through profit or loss, and |
| • | | Financial liabilities at amortised cost. |
QTC’s accounting policies for significant financial assets and financial liabilities are listed below.
Onlendings: Onlendings, with the exception of loans to cooperative housing societies, are included in the balance sheet at market or fair value which is the redemption value. Loans to cooperative housing societies are based on the balance of each housing society’s loans to its members adjusted where necessary for a specific provision for impairment (refer note 2 (t)).
Derivative financial instruments: QTC uses derivative financial instruments to hedge its exposure to interest rate, foreign currency and credit risks as part of asset and liability management activities. In addition they may be used to deliver long term floating rate or long term fixed rate exposure. In accordance with its treasury policy, QTC does not hold or issue derivative financial instruments for speculative purposes.
All derivatives are carried as assets when fair value is positive and as liabilities when fair value is negative.
Financial assets at fair value through profit or loss: Financial assets at fair value through profit or loss include financial assets held for Capital Markets Operations and investments held in unit trusts (Long Term Assets).
| § | | Financial assets – Capital Markets Operations Financial assets – Capital Markets Operations, include investments in money market deposits, discount securities, semi-government bonds and floating rate notes. Unrealised gains and losses are brought to account in the statement of comprehensive income. |
| § | | Investments in unit trusts – Long Term Assets Investments in unit trusts consist of investments held and managed by QIC and include cash, Australian equities, international equities and other diversified products (refer note 9). These investments are measured at market value based on the hard close unit price quoted by QIC adjusted for fees outstanding on the account and net of any GST recoverable. |
Financial liabilities at fair value through profit or loss: Financial liabilities at fair value through profit or loss include interest-bearing liabilities and deposits. Unrealised gains and losses are brought to account in the statement of comprehensive income.
| § | | Interest-bearing liabilities Interest-bearing liabilities mainly consist of Australian and overseas bonds. Australian bonds include QTC’s domestic, capital indexed and public bonds. Overseas bonds include global bonds and Eurobonds. Global bonds are Australian dollar denominated bonds issued overseas. |
| § | | Deposits Client deposits are accepted to either the Working Capital Facility (11AM Fund) or the QTC Cash Fund. Income derived from the investment of these deposits accrues to depositors daily. The amount shown in the balance sheet represents the market value of deposits held at balance date. |
| | Collateral held and securities which are sold under agreements to repurchase are disclosed as deposits. |
Financial liabilities at amortised cost: Financial liabilities at amortised cost consist of fixed rate notes issued to the State Government in exchange for a portfolio of assets (Long Term Assets). The fixed rate notes are initially recognised at par value, which equated to the fair value of the financial assets acquired. Deposits and withdrawals can be made from the notes based on changes in the State Government’s long-term liabilities. The notes have a term of 50 years. Interest on the fixed rate notes is capitalised monthly and the rate is reviewed annually.
(g) Collateral
QTC enters into a range of transactions with counterparties which require the lodgement of collateral subject to agreed market thresholds. Where these thresholds are exceeded, QTC may be required to either pledge assets to, or be entitled to receive pledged assets from, the counterparty to secure these transactions. The assets pledged or received are primarily in the form of cash.
(h) Settlement date accounting
Purchases and sales of financial assets and liabilities at fair value through profit or loss are recognised on settlement date. QTC accounts for any change in the fair value of the asset to be received or the liability issued during the period between the trade date and settlement date in the same way as it accounts for the acquired asset or liability.
(i) Offsetting financial instruments
QTC offsets financial assets and liabilities where there is a legally enforceable right to set-off, and there is an intention to settle on a net basis or to realise the asset and settle the liability simultaneously (refer note 19).
(j) Repurchase agreements
Securities sold under agreements to repurchase at an agreed price are retained within the financial assets at fair value through profit or loss category while the obligation to repurchase is disclosed as a deposit.
(k) Lease arrangements
Leases in which a significant portion of the risks and rewards of ownership are retained by the lessor are classified as operating leases. Operating leases, in which QTC is the lessee, are expensed on a straight line basis over the term of the lease. Leases where QTC has substantially all the risks and rewards of ownership are classified as finance leases. Finance leases are capitalised at the lease inception based on the present value of the minimum lease payments. The finance cost is charged to profit or loss over the lease period (refer note 23).
|
| 26 QUEENSLAND TREASURY CORPORATION ANNUAL REPORT 2013–14 |
(l) Lease income
Lease income from operating leases where QTC is the lessor is recognised as income on a straight line basis over the lease term.
(m) Cross border leases – income recognition
The portion of the cross border lease income received which is regarded as an advisory fee for the transaction is recognised on receipt. The balance of income received is deferred and amortised over the term of each lease.
(n) Interest income and interest expense
The recognition of investment income and borrowing costs includes net realised gains/losses from the sale of investments (interest income) and the preredemption of borrowings (interest expense) together with the net unrealised gains/losses arising from holding investments and certain onlendings (interest income) and net unrealised gains/losses from borrowings (interest expense). These unrealised gains/losses are a result of revaluing to market daily.
The majority of onlendings are provided to clients on a pooled basis. Interest costs are allocated to clients based on the daily movement in the market value of the pool.
(o) Fee income
Management fee income represent income earned from the management of QTC’s onlendings and deposits and is recognised on an accrual basis when the service has been provided. Asset and liability management fee income integral to the yield of an originated financial instrument is recognised proportionately over the period the product is provided.
(p) Net change in fair value of investments in unit trusts
Changes in the net market value of investments are recognised in the period in which they occur. The net market value is based on the closing unit redemption price and includes both realised and unrealised movements, net of allowances for costs expected to be incurred in realising these investments. Distributions are reinvested into the trusts.
(q) Profits/losses
Unless otherwise determined by the Governor in Council, the Queensland Treasury Corporation Act 1988 requires that all profits shall accrue to the benefit of the State Consolidated Fund and all losses shall be the responsibility of the State Consolidated Fund.
(r) Property, plant and equipment
Property, plant and equipment are measured at cost less accumulated depreciation and accumulated impairment losses. Costs are recognised where asset values exceed $5,000 and include expenditure that is directly attributable to the acquisition of the asset. Depreciation is calculated on a straight line basis over the estimated useful life of the assets. Where depreciation relates to plant and equipment held to generate lease revenue, depreciation expenditure has been classified separately in the statement of comprehensive income as depreciation on leased assets.
Depreciation rates for each class of asset are as follows:
| | | | |
| |
| ASSET CLASS | | DEPRECIATION RATE | |
| |
| Land | | | 0% | |
| |
| Information technology & office equipment | | | 6 – 40% | |
| |
| Plant and machinery | | | 10 – 30% | |
| |
The assets’ residual values, useful lives and depreciation methods are reviewed and adjusted, if appropriate, at each financial year end.
Derecognition: An item of property, plant and equipment is derecognised upon disposal or when no further future economic benefits are expected from its use. Any gain or loss arising on derecognition of the asset (calculated as the difference between the net disposal proceeds and the carrying amount of the asset) is included in the statement of comprehensive income in the year the asset is derecognised.
(s) Intangible assets
Software: Acquired computer software licences are capitalised on the basis of the costs incurred to acquire and bring to use the specific software. These costs are amortised over their estimated useful lives which are between two and five years.
Costs associated with the development of internally generated software are capitalised only when the designated project is technically and commercially feasible and is expected to generate future economic benefits to QTC. The expenditure capitalised comprises all directly attributable costs including some labour costs. All other costs associated with the development of software are expensed as incurred. Following initial recognition of the development expenditure as an asset, the asset is carried at cost less accumulated amortisation and impairment losses. Amortisation of the asset begins when the development is complete and the asset is available for use.
Computer software development costs recognised as assets are amortised on a straight-line basis over the period of expected benefit, which is usually between three and five years.
(t) Impairment
The carrying values of non-financial assets are reviewed at each reporting date or where there is an indication of impairment. Where an asset is no longer expected to provide substantial service potential or there are significant reductions in the capabilities, functions or intended use, the asset is written down to its recoverable amount. For the purpose of impairment testing, assets are grouped by the lowest level of cash-generating unit applicable with impairment losses recorded in the statement of comprehensive income.
(u) Income tax
QTC is exempt from the payment of income tax under section 50-25 of the Income Tax Assessment Act 1997 (as amended).
QTC makes a payment in lieu of income tax to the Queensland Government’s Consolidated Fund. The calculation of the income tax liability is based on the income of certain activities controlled by QTC’s Capital Markets Operations. No income tax is payable on the Long Term Assets.
In calculating the payment in lieu of income tax expense, tax effect accounting principles are adopted for income received and expenses paid in relation to the management and administration of clients’ borrowings and deposits as well as for advisory services and structured finance transactions. For all other QTC operations on which a payment in lieu of income tax is made, tax effect accounting principles are not applied.
Deferred income tax is provided in full, using the liability method, on all temporary differences arising between the tax bases of assets and liabilities and their carrying amounts in the financial statements.
Deferred income tax liabilities are recognised for all taxable temporary differences arising from prepayments of expenditure of QTC. Deferred income tax assets are recognised for deductible temporary differences arising from lease incentives, accruals of expenditure, employee benefits and depreciation charged on property, plant and equipment.
QTC’s controlled and jointly controlled entities are defined as State and Territory bodies under section 24AO of the Income Tax Assessment Act 1936 and as a consequence, are exempt from Commonwealth tax under section 24AM of this Act.
(v) Employee benefits
A liability is recognised for benefits accruing to employees in respect of salaries, annual leave, long service leave and short-term incentives based on the amount expected to be paid where there is a present or constructive obligation to pay this amount as a result of past service and the obligation is capable of being measured reliably. These are measured on an undiscounted basis where the amounts are expected to be paid within the next 12 months. For amounts where the payment date is expected to exceed 12 months such as long service leave, future pay increases are projected and then discounted using a high quality bond rate.
Salaries, short-term incentives, annual and long service leave unpaid at reporting date are recognised as a liability and include related on-costs such as payroll tax, worker’s compensation premiums and employer superannuation contributions. As sick leave is non-vesting, this is recognised as and when this leave is taken.
(w) Rounding
Amounts have been rounded to the nearest thousand dollars except for note 25, which is rounded to the nearest million dollars, and notes 27 and 28, which are in whole dollars.
(x) Comparative figures
Where necessary, comparative figures have been adjusted to conform with changes in presentation in the current year.
(y) Judgements and assumptions
The preparation of the financial statements requires the use of accounting estimates. The areas involving a higher degree of judgement or complexity, or areas where assumptions or estimates may be significant to the financial statements are shown below:
Fair value of financial assets and financial liabilities: Financial assets and financial liabilities at fair value through profit or loss are measured at fair value by reference to quoted market prices where available. The fair value of financial instruments that are not traded in an active market is determined by reference to market quotes for similar instruments or by use of valuation techniques. Judgement may be needed in selecting valuation methods or assumptions where an active market quote is not available.
Estimates and underlying assumptions are reviewed on an ongoing basis. Revisions to accounting estimates are recognised in the period in which the estimate is revised and in any future period affected.
|
| QUEENSLAND TREASURY CORPORATION ANNUAL REPORT 2013–14 27 |
NOTES TO AND FORMING PART OF THE FINANCIAL STATEMENTS
FOR THE YEAR ENDED 30 JUNE 2014
An operating segment is identified where QTC engages in a business activity where separate financial information is evaluated regularly by the chief operating decision makers in deciding how to allocate resources.
Revenue and expenses directly associated with each business segment are included to determine their result. The accounting policies for each operating segment are applied consistently.
The results from QTC’s operating segments are shown below:
| | | | | | | | | | | | | | | | | | | | | | | | |
| |
| SEGMENT REVENUE AND EXPENSES | | FOR THE YEAR ENDED 30 JUNE 2014 | | | FOR THE YEAR ENDED 30 JUNE 2013 | |
| |
| | | Capital markets operations $000 | | | Long term assets $000 | | | Total $000 | | | Capital markets operations $000 | | | Long term assets $000 | | | Total $000 | |
| |
| | | | | | |
| Income | | | | | | | | | | | | | | | | | | | | | | | | |
| |
| Interest income | | | 6 914 445 | | | | - | | | | 6 914 445 | | | | 3 529 909 | | | | - | | | | 3 529 909 | |
| |
| Net change in fair value of unit trusts | | | - | | | | 5 386 325 | | | | 5 386 325 | | | | - | | | | 3 370 042 | | | | 3 370 042 | |
| |
| Other income | | | 132 628 | | | | - | | | | 132 628 | | | | 123 871 | | | | - | | | | 123 871 | |
| |
| Total income | | | 7 047 073 | | | | 5 386 325 | | | | 12 433 398 | | | | 3 653 780 | | | | 3 370 042 | | | | 7 023 822 | |
| |
| | | | | | |
| Expenses | | | | | | | | | | | | | | | | | | | | | | | | |
| |
| Interest expense | | | 6 814 855 | | | | 2 166 897 | | | | 8 981 752 | | | | 3 326 556 | | | | 2 302 032 | | | | 5 628 588 | |
| |
| Depreciation on leased assets | | | 33 292 | | | | - | | | | 33 292 | | | | 31 808 | | | | - | | | | 31 808 | |
| |
| Management fees | | | - | | | | 91 471 | | | | 91 471 | | | | - | | | | 77 662 | | | | 77 662 | |
| |
| Other expenses | | | 64 095 | | | | - | | | | 64 095 | | | | 57 142 | | | | - | | | | 57 142 | |
| |
| Total expenses | | | 6 912 242 | | | | 2 258 368 | | | | 9 170 610 | | | | 3 415 506 | | | | 2 379 694 | | | | 5 795 200 | |
| |
| | | | | | |
| Net (loss)/ profit from associate | | | (1 146) | | | | - | | | | (1 146) | | | | 521 | | | | - | | | | 521 | |
| |
| Profit before income tax | | | 133 685 | | | | 3 127 957 | | | | 3 261 642 | | | | 238 795 | | | | 990 348 | | | | 1 229 143 | |
| |
| Income tax expense | | | 14 465 | | | | - | | | | 14 465 | | | | 15 911 | | | | - | | | | 15 911 | |
| |
| Profit for the year | | | 119 220 | | | | 3 127 957 | | | | 3 247 177 | | | | 222 884 | | | | 990 348 | | | | 1 213 232 | |
| |
|
| |
| |
| SEGMENT ASSETS AND LIABILITIES | | 30 JUNE 2014 | | | 30 JUNE 2013 | |
| |
| | | Capital markets operations $000 | | | Long term assets $000 | | | Total $000 | | | Capital markets operations $000 | | | Long term assets $000 | | | Total $000 | |
| |
| | | | | | |
| Assets | | | | | | | | | | | | | | | | | | | | | | | | |
| |
| Onlendings | | | 85 609 405 | | | | - | | | | 85 609 405 | | | | 79 118 832 | | | | - | | | | 79 118 832 | |
| |
| Financial assets at FVPL (1) | | | 14 698 901 | | | | 33 431 249 | | | | 48 130 150 | | | | 20 194 045 | | | | 29 767 721 | | | | 49 961 766 | |
| |
| Other assets | | | 490 439 | | | | - | | | | 490 439 | | | | 1 126 224 | | | | - | | | | 1 126 224 | |
| |
| Total assets | | | 100 798 745 | | | | 33 431 249 | | | | 134 229 994 | | | | 100 439 101 | | | | 29 767 721 | | | | 130 206 822 | |
| |
| | | | | | |
| Liabilities | | | | | | | | | | | | | | | | | | | | | | | | |
| |
| Financial liabilities at FVPL (1) | | | 99 504 822 | | | | - | | | | 99 504 822 | | | | 99 402 283 | | | | - | | | | 99 402 283 | |
| |
| Financial liabilities at amortised cost | | | - | | | | 31 983 174 | | | | 31 983 174 | | | | - | | | | 31 447 603 | | | | 31 447 603 | |
| |
| Other liabilities | | | 583 670 | | | | - | | | | 583 670 | | | | 325 785 | | | | - | | | | 325 785 | |
| |
| Total liabilities | | | 100 088 492 | | | | 31 983 174 | | | | 132 071 666 | | | | 99 728 068 | | | | 31 447 603 | | | | 131 175 671 | |
| |
| Net assets | | | 710 253 | | | | 1 448 075 | | | | 2 158 328 | | | | 711 033 | | | | (1 679 882) | | | | (968 849) | |
| |
(1) Includes non-derivative financial instruments at fair value through profit or loss | | | | | | | | | |
|
| |
| |
| SEGMENT EQUITY | | 30 JUNE 2014 | | | 30 JUNE 2013 | |
| |
| | | Capital markets operations $000 | | | Long term assets $000 | | | Total $000 | | | Capital markets operations $000 | | | Long term assets $000 | | | Total $000 | |
| |
| Equity 1 July | | | 711 033 | | | | (1 679 882) | | | | (968 849) | | | | 488 149 | | | | (2 670 230) | | | | (2 182 081) | |
| |
| Profit after tax | | | 119 220 | | | | 3 127 957 | | | | 3 247 177 | | | | 222 884 | | | | 990 348 | | | | 1 213 232 | |
| |
| Dividends provided for | | | (120 000) | | | | - | | | | (120 000) | | | | - | | | | - | | | | - | |
| |
| Equity 30 June | | | 710 253 | | | | 1 448 075 | | | | 2 158 328 | | | | 711 033 | | | | (1 679 882) | | | | (968 849) | |
| |
28 QUEENSLAND TREASURY CORPORATION ANNUAL REPORT 2013–14
NOTES TO AND FORMING PART OF THE FINANCIAL STATEMENTS
FOR THE YEAR ENDED 30 JUNE 2014
| 4 | INTEREST INCOME AND INTEREST EXPENSE FROM CAPITAL MARKETS OPERATIONS |
| | | | | | | | | | | | | | | | |
| |
| | | FOR THE YEAR ENDED 30 JUNE 2014 | |
| |
| | | INTEREST
$000 | | | NET UNREALISED
GAIN/LOSS $000 | | | NET REALISED
GAIN/LOSS
$000 | | | TOTAL
INTEREST
$000 | |
| |
| | | | |
| Interest income from financial assets | | | | | | | | | | | | | | | | |
| |
| Money market deposits | | | 33 028 | | | | 2 | | | | - | | | | 33 030 | |
| |
| Discount securities | | | 132 225 | | | | (1 057) | | | | 867 | | | | 132 035 | |
| |
| Commonwealth and state securities | | | 47 410 | | | | 35 525 | | | | 2 755 | | | | 85 690 | |
| |
| Floating rate notes | | | 147 548 | | | | (38) | | | | 8 718 | | | | 156 228 | |
| |
| Term deposits | | | 23 870 | | | | (136) | | | | - | | | | 23 734 | |
| |
| Other investments | | | 66 303 | | | | 3 172 | | | | 1 784 | | | | 71 259 | |
| |
| Onlendings * | | | 4 175 727 | | | | 2 201 057 | | | | - | | | | 6 376 784 | |
| |
| Interest income from derivatives | | | | | | | | | | | | | | | | |
| |
| Forward rate agreements | | | - | | | | (47 674) | | | | 76 326 | | | | 28 652 | |
| |
| Cross currency swaps | | | 11 838 | | | | (4 808) | | | | - | | | | 7 030 | |
| |
| Credit default swaps | | | 3 | | | | - | | | | - | | | | 3 | |
| |
| Total interest income | | | 4 637 952 | | | | 2 186 043 | | | | 90 450 | | | | 6 914 445 | |
| |
| | | | |
| Interest expense from financial liabilities | | | | | | | | | | | | | | | | |
| |
| Treasury notes | | | 50 561 | | | | 62 | | | | 57 | | | | 50 680 | |
| |
| Commercial paper | | | 14 399 | | | | (10 471) | | | | - | | | | 3 928 | |
| |
| AUD Bonds | | | 3 392 511 | | | | 1 987 895 | | | | 686 977 | | | | 6 067 383 | |
| |
| Floating rate notes | | | 58 017 | | | | 3 195 | | | | 22 | | | | 61 234 | |
| |
| Global AUD Bonds | | | 31 556 | | | | (24 966) | | | | 28 612 | | | | 35 202 | |
| |
| Medium-term notes | | | 55 748 | | | | 49 054 | | | | - | | | | 104 802 | |
| |
| Deposits | | | 173 093 | | | | (147) | | | | - | | | | 172 946 | |
| |
| Interest expense from derivatives | | | | | | | | | | | | | | | | |
| |
| Interest rate swaps | | | (5 847) | | | | 196 264 | | | | - | | | | 190 417 | |
| |
| Cross currency swaps | | | 37 119 | | | | (77 093) | | | | - | | | | (39 974) | |
| |
| Futures contracts | | | - | | | | - | | | | 46 986 | | | | 46 986 | |
| |
| Foreign exchange contracts | | | - | | | | 87 063 | | | | - | | | | 87 063 | |
| |
| Other | | | | | | | | | | | | | | | | |
| |
| Registration and issue costs | | | 6 339 | | | | - | | | | - | | | | 6 339 | |
| |
| Commissions on futures | | | 1 493 | | | | - | | | | - | | | | 1 493 | |
| |
| Commonwealth Government Guarantee Fee | | | 26 356 | | | | - | | | | - | | | | 26 356 | |
| |
| Total interest expense | | | 3 841 345 | | | | 2 210 856 | | | | 762 654 | | | | 6 814 855 | |
| |
| * | The majority of onlendings are provided to clients on a pooled fund basis. Interest costs are allocated to clients based on the daily movement in the market value of the pooled fund. In periods of falling interest rates, the market value of the funding pool will rise leading to higher interest income from onlendings. During the year ended 30 June 2014, interest rates fell across all terms, resulting in higher interest income compared to the prior year when long term interest rates rose and short term interest rates fell. |
QUEENSLAND TREASURY CORPORATION ANNUAL REPORT 2013–14 29
NOTES TO AND FORMING PART OF THE FINANCIAL STATEMENTS
FOR THE YEAR ENDED 30 JUNE 2014
| 4 | INTEREST INCOME AND INTEREST EXPENSE FROM CAPITAL MARKETS OPERATIONS CONTINUED |
| | | | | | | | | | | | | | | | |
| |
| | | FOR THE YEAR ENDED 30 JUNE 2013 | |
| |
| | | INTEREST
$000 | | | NET UNREALISED
GAIN/LOSS $000 | | | NET REALISED
GAIN/LOSS
$000 | | | TOTAL
INTEREST
$000 | |
| |
| | | | |
| Interest income from financial assets | | | | | | | | | | | | | | | | |
| |
| Money market deposits | | | 25 199 | | | | 1 | | | | - | | | | 25 200 | |
| |
| Discount securities | | | 176 159 | | | | 75 | | | | 3 649 | | | | 179 883 | |
| |
| Commonwealth and state securities | | | 198 725 | | | | (130 415) | | | | 94 417 | | | | 162 727 | |
| |
| Floating rate notes | | | 186 691 | | | | 50 134 | | | | 8 030 | | | | 244 855 | |
| |
| Term deposits | | | 58 878 | | | | (1 091) | | | | - | | | | 57 787 | |
| |
| Other investments | | | 61 512 | | | | 27 286 | | | | 1 223 | | | | 90 021 | |
| |
| Onlendings | | | 3 908 008 | | | | (1 164 924) | | | | - | | | | 2 743 084 | |
| |
| Interest income from derivatives | | | | | | | | | | | | | | | | |
| |
| Forward rate agreements | | | - | | | | (75 561) | | | | 125 104 | | | | 49 543 | |
| |
| Cross currency swaps | | | 15 862 | | | | (39 386) | | | | - | | | | (23 524) | |
| |
| Credit default swaps | | | 136 | | | | 197 | | | | - | | | | 333 | |
| |
| Total interest income | | | 4 631 170 | | | | (1 333 684) | | | | 232 423 | | | | 3 529 909 | |
| |
| | | | |
| Interest expense from financial liabilities | | | | | | | | | | | | | | | | |
| |
| Treasury notes | | | 71 167 | | | | (1 498) | | | | 8 | | | | 69 677 | |
| |
| Commercial paper | | | 10 855 | | | | 532 545 | | | | - | | | | 543 400 | |
| |
| AUD Bonds | | | 3 579 052 | | | | (1 206 732) | | | | 828 012 | | | | 3 200 332 | |
| |
| Floating rate notes | | | 11 809 | | | | 126 | | | | - | | | | 11 935 | |
| |
| Global AUD Bonds | | | 56 413 | | | | (12 009) | | | | 11 429 | | | | 55 833 | |
| |
| Medium-term notes | | | 49 832 | | | | (26 740) | | | | (990) | | | | 22 102 | |
| |
| Deposits | | | 169 685 | | | | 11 | | | | - | | | | 169 696 | |
| |
| Interest expense from derivatives | | | | | | | | | | | | | | | | |
| |
| Interest rate swaps | | | (56 658) | | | | (3 358) | | | | - | | | | (60 016) | |
| |
| Cross currency swaps | | | 44 567 | | | | (98 997) | | | | - | | | | (54 430) | |
| |
| Futures contracts | | | - | | | | - | | | | (227 061) | | | | (227 061) | |
| |
| Foreign exchange contracts | | | - | | | | (452 436) | | | | 889 | | | | (451 547) | |
| |
| Other | | | | | | | | | | | | | | | | |
| |
| Registration and issue costs | | | 8 339 | | | | - | | | | - | | | | 8 339 | |
| |
| Commissions on futures | | | 1 490 | | | | - | | | | - | | | | 1 490 | |
| |
| Commonwealth Government Guarantee Fee | | | 36 806 | | | | - | | | | - | | | | 36 806 | |
| |
| Total interest expense | | | 3 983 357 | | | | (1 269 088) | | | | 612 287 | | | | 3 326 556 | |
| |
30 QUEENSLAND TREASURY CORPORATION ANNUAL REPORT 2013–14
NOTES TO AND FORMING PART OF THE FINANCIAL STATEMENTS
FOR THE YEAR ENDED 30 JUNE 2014
| | | | | | | | |
| |
| | | 2014
$000 | | | 2013
$000 | |
| |
| Fees – management (1) | | | 65 088 | | | | 67 366 | |
| |
| Fees – professional & other services | | | 2 076 | | | | 1 746 | |
| |
| | | 67 164 | | | | 69 112 | |
| |
| (1) | Management fees represent income earned from the management of QTC’s onlendings and deposits. A further amount of $6.604 million (2013 $7.958 million), derived from fees on certain managed funds and pools is included under interest income as it forms part of the interest rate applied. |
| | | | | | | | |
| |
| | | 2014
$000 | | | 2013
$000 | |
| |
| Salaries and related costs | | | 37 352 | | | | 33 113 | |
| |
| Superannuation contributions | | | 3 649 | | | | 3 389 | |
| |
| Contractors | | | 2 280 | | | | 2 313 | |
| |
| Consultants’ fees (i) | | | 3 676 | | | | 2 099 | |
| |
| Outsourced services | | | 2 236 | | | | 2 131 | |
| |
| Depreciation on property, plant and equipment | | | 1 904 | | | | 2 209 | |
| |
| Amortisation on intangible assets | | | 2 167 | | | | 2 059 | |
| |
| Computer charges | | | 2 489 | | | | 2 563 | |
| |
| Property charges | | | 3 650 | | | | 3 574 | |
| |
| External audit fees | | | 414 | | | | 369 | |
| |
| Internal audit fees | | | 486 | | | | 479 | |
| |
| Staff training and development | | | 649 | | | | 417 | |
| |
| Investor and market relations program | | | 450 | | | | 542 | |
| |
| Telephone, postage, printing and stationery | | | 388 | | | | 474 | |
| |
| Other administration expenses | | | 2 305 | | | | 1 428 | |
| |
| | | 64 095 | | | | 57 159 | |
| |
| | |
| (i) Consultants’ fees | | | | | | | | |
| |
| Professional, technical and legal | | | 1 508 | | | | 753 | |
| |
| Information technology | | | 1 372 | | | | 482 | |
| |
| Finance and accounting | | | 231 | | | | 258 | |
| |
| Human resource management | | | 284 | | | | 232 | |
| |
| Other | | | 281 | | | | 374 | |
| |
| | | 3 676 | | | | 2 099 | |
| |
QUEENSLAND TREASURY CORPORATION ANNUAL REPORT 2013–14 31
NOTES TO AND FORMING PART OF THE FINANCIAL STATEMENTS
FOR THE YEAR ENDED 30 JUNE 2014
| | | | | | | | |
| |
| | | 2014 $000 | | | 2013
$000 | |
| |
| Current tax | | | 15 467 | | | | 15 635 | |
| |
| Deferred tax | | | (1 002) | | | | 276 | |
| |
| Total income tax expense recognised in the current year | | | 14 465 | | | | 15 911 | |
| |
| Deferred income tax included in income tax expense comprises: | | | | | | | | |
| |
(Increase)/decrease in deferred tax assets | | | (1 002) | | | | 306 | |
| |
Decrease in deferred tax liabilities | | | - | | | | (30) | |
| |
| | | (1 002) | | | | 276 | |
| |
| | |
| Numerical reconciliation between income tax expense and pre-tax accounting profit | | | | | | | | |
| |
| Profit for the year | | | 3 261 642 | | | | 1 229 143 | |
| |
| Less profit from non-taxable pools: | | | | | | | | |
| |
Capital markets operations | | | (86 886) | | | | (185 788) | |
| |
Long term assets | | | (3 127 957) | | | | (990 348) | |
| |
| Operating profit from taxable pools | | | 46 799 | | | | 53 007 | |
| |
| | |
| Tax at the Australian tax rate of 30% on taxable pools | | | 14 040 | | | | 15 902 | |
| |
| Effect of non-deductible items: | | | | | | | | |
| |
Share of loss/ (profit) from non-taxable entity | | | 42 | | | | (156) | |
| |
Write down of investment in non-taxable entity | | | 302 | | | | - | |
| |
Other | | | 81 | | | | 165 | |
| |
| Income tax expense | | | 14 465 | | | | 15 911 | |
| |
| | |
| Income tax assets and liabilities at 30 June relates to the following: | | | | | | | | |
| |
| Deferred tax assets | | | | | | | | |
| |
| Accruals | | | 72 | | | | 64 | |
| |
| Employee benefits | | | 2 076 | | | | 2 023 | |
| |
| Property, plant and equipment | | | 67 | | | | 12 | |
| |
| Provisions | | | 919 | | | | 33 | |
| |
| | | 3 134 | | | | 2 132 | |
| |
| | |
| Current tax liability – income tax payable | | | 15 467 | | | | 15 635 | |
| |
| Tax liabilities | | | 15 467 | | | | 15 635 | |
| |
| | | | | | | | |
| |
| | | 2014
$000 | | | 2013
$000 | |
| |
| GST receivable | | | - | | | | 643 | |
| |
| Sundry debtors | | | 3 178 | | | | 1 372 | |
| |
| Prepayments | | | 1 079 | | | | 1 309 | |
| |
| Operating lease receivables | | | 127 | | | | 244 | |
| |
| | | 4 384 | | | | 3 568 | |
| |
32 QUEENSLAND TREASURY CORPORATION ANNUAL REPORT 2013–14
NOTES TO AND FORMING PART OF THE FINANCIAL STATEMENTS
FOR THE YEAR ENDED 30 JUNE 2014
| 9 | FINANCIAL ASSETS AT FAIR VALUE THROUGH PROFIT OR LOSS |
| | | | | | | | |
| |
| CAPITAL MARKETS OPERATIONS | | 2014 $000 | | | 2013 $000 | |
| |
| Money market deposits | | | 2 674 416 | | | | 1 717 477 | |
| |
| Discount securities | | | 4 738 190 | | | | 7 743 703 | |
| |
| Commonwealth and state securities (1) | | | 1 151 874 | | | | 3 642 350 | |
| |
| Floating rate notes | | | 4 105 618 | | | | 4 314 169 | |
| |
| Term deposits | | | 729 476 | | | | 552 625 | |
| |
| Other investments | | | 1 299 327 | | | | 2 223 721 | |
| |
| | | 14 698 901 | | | | 20 194 045 | |
�� | |
| (1) | QTC maintains holdings of its own stocks. These holdings are netted off and therefore excluded from financial assets and financial liabilities at fair value through profit or loss. | |
The total includes investments made to manage:
| § | | deposits of $5,477.942 million (2013 $6,127.695 million) |
| § | | surpluses of $710.253 million (2013 $711.033 million), and |
| § | | cross border lease deferred income of $37.946 million (2013 $52.267 million). |
The remaining investments are used to facilitate management of liquidity and interest rate risk or result from QTC borrowing in advance of requirements to manage financing/refinancing risk.
As at 30 June 2014, $5,083.1 million (2013 $8,354.4 million) of financial assets will mature after more than 12 months.
| | | | | | | | |
| |
| LONG TERM ASSETS | | 2014 $000 | | | 2013 $000 | |
| |
| | |
| INVESTMENTS IN UNIT TRUSTS AND OTHER HOLDINGS – QIC: | | | | | | | | |
| |
| Movement during the year: | | | | | | | | |
| |
| Opening balance | | | 29 767 721 | | | | 29 182 448 | |
| |
| Net withdrawals | | | (1 722 797) | | | | (2 784 769) | |
| |
| Net change in fair value of unit trusts | | | 5 386 325 | | | | 3 370 042 | |
| |
| Closing balance | | | 33 431 249 | | | | 29 767 721 | |
| |
| Comprised of the following asset classes: | | | | | | | | |
| |
| Growth assets | | | | | | | | |
| |
| Equities | | | 4 967 124 | | | | 5 360 520 | |
| |
| Diversified alternatives and other | | | 6 134 448 | | | | 4 764 906 | |
| |
| Unlisted assets | | | | | | | | |
| |
| Infrastructure | | | 8 199 928 | | | | 6 242 689 | |
| |
| Private equities | | | 1 903 027 | | | | 1 487 340 | |
| |
| Real estate | | | 1 938 863 | | | | 1 489 033 | |
| |
| Defensive assets | | | | | | | | |
| |
| Fixed interest | | | 584 281 | | | | 893 420 | |
| |
| Cash | | | 9 703 578 | | | | 9 529 813 | |
| |
| | | 33 431 249 | | | | 29 767 721 | |
| |
Prior year comparatives have been restated to reflect the revised asset classes.
QUEENSLAND TREASURY CORPORATION ANNUAL REPORT 2013–14 33
NOTES TO AND FORMING PART OF THE FINANCIAL STATEMENTS
FOR THE YEAR ENDED 30 JUNE 2014
| 10 | DERIVATIVE FINANCIAL ASSETS AND DERIVATIVE FINANCIAL LIABILITIES |
| | | | | | | | |
| |
| | | 2014 | | | 2013 | |
| | | $000 | | | $000 | |
| |
| | |
| DERIVATIVE FINANCIAL ASSETS | | | | | | | | |
| |
| Interest rate swaps | | | 32 701 | | | | 149 229 | |
| |
| Cross currency swaps | | | 180 966 | | | | 136 217 | |
| |
| Forward rate agreements | | | 38 704 | | | | 86 378 | |
| |
| Foreign exchange contracts | | | 172 | | | | 416 637 | |
| |
| | | 252 543 | | | | 788 461 | |
| |
| | |
| DERIVATIVE FINANCIAL LIABILITIES | | | | | | | | |
| |
| Interest rate swaps | | | 167 855 | | | | 51 266 | |
| |
| Cross currency swaps | | | 112 149 | | | | 116 402 | |
| |
| Foreign exchange contracts | | | 64 823 | | | | 58 | |
| |
| | | 344 827 | | | | 167 726 | |
| |
| Net derivatives | | | (92 284) | | | | 620 735 | |
| |
As at 30 June 2014, $590.4 million (2013 $89.3 million) of these derivatives have maturity dates exceeding 12 months.
| | | | | | | | |
| |
| | | 2014 | | | 2013 | |
| | | $000 | | | $000 | |
| |
| Government departments and agencies | | | 42 933 073 | | | | 38 258 994 | |
| |
| Government owned corporations | | | 19 053 525 | | | | 18 667 584 | |
| |
| Local governments | | | 7 478 377 | | | | 6 632 514 | |
| |
| Statutory bodies | | | 15 680 569 | | | | 14 979 661 | |
| |
| QTC related entities | | | 157 520 | | | | 321 179 | |
| |
| Other bodies | | | 306 341 | | | | 258 900 | |
| |
| | | 85 609 405 | | | | 79 118 832 | |
| |
As at 30 June 2014, $84,531.6 million (2013 $77,520.0 million) of repayments are expected to be received after more than 12 months.
34 QUEENSLAND TREASURY CORPORATION ANNUAL REPORT 2013–14
NOTES TO AND FORMING PART OF THE FINANCIAL STATEMENTS
FOR THE YEAR ENDED 30 JUNE 2014
| 12 | PROPERTY, PLANT AND EQUIPMENT |
Reconciliations of the carrying amounts for each class of property, plant and equipment are set out below:
| | | | | | | | | | | | | | | | |
| |
| DESCRIPTION | | LAND & BUILDINGS (1) $000 | | | INFORMATION TECHNOLOGY AND OFFICE EQUIPMENT $000 | | | PLANT AND MACHINERY (2)
$000 | | | TOTAL
$000 | |
| |
| | | | |
| GROSS CARRYING AMOUNT | | | | | | | | | | | | | | | | |
| |
| Balance at 1 July 2012 | | | 32 682 | | | | 11 089 | | | | 322 953 | | | | 366 724 | |
| |
| Acquisitions | | | - | | | | 5 700 | | | | 40 413 | | | | 46 113 | |
| |
| Disposals | | | - | | | | (7 108) | | | | - | | | | (7 108) | |
| |
| Work in progress | | | 28 063 | | | | - | | | | - | | | | 28 063 | |
| |
| Balance at 30 June 2013 | | | 60 745 | | | | 9 681 | | | | 363 366 | | | | 433 792 | |
| |
| | | | |
| Balance at 1 July 2013 | | | 60 745 | | | | 9 681 | | | | 363 366 | | | | 433 792 | |
| |
| Acquisitions | | | 10 580 | | | | 575 | | | | 245 | | | | 11 400 | |
| |
| Disposals | | | (71 325) | | | | (54) | | | | (8 813) | | | | (80 192) | |
| |
| Work in progress | | | - | | | | - | | | | - | | | | - | |
| |
| Balance at 30 June 2014 | | | - | | | | 10 202 | | | | 354 798 | | | | 365 000 | |
| |
| | | | |
| ACCUMULATED DEPRECIATION | | | | | | | | | | | | | | | | |
| |
| Balance at 1 July 2012 | | | - | | | | 7 670 | | | | 72 923 | | | | 80 593 | |
| |
| Disposals | | | - | | | | (7 086) | | | | - | | | | (7 086) | |
| |
| Depreciation expense | | | - | | | | 2 206 | | | | 31 809 | | | | 34 015 | |
| |
| Balance at 30 June 2013 | | | - | | | | 2 790 | | | | 104 732 | | | | 107 522 | |
| |
| | | | |
| Balance at 1 July 2013 | | | - | | | | 2 790 | | | | 104 732 | | | | 107 522 | |
| |
| Disposals | | | - | | | | (54) | | | | (5 378) | | | | (5 432) | |
| |
| Depreciation expense | | | - | | | | 1 904 | | | | 33 292 | | | | 35 196 | |
| |
| Balance at 30 June 2014 | | | - | | | | 4 640 | | | | 132 646 | | | | 137 286 | |
| |
| | | | |
| Net book value 30 June 2013 | | | 60 745 | | | | 6 891 | | | | 258 634 | | | | 326 270 | |
| |
| Net book value 30 June 2014 | | | - | | | | 5 562 | | | | 222 152 | | | | 227 714 | |
| |
| (1) | Land and buildings included land purchased and costs incurred to construct a bus depot which is subject to a 25 year leasing arrangement. During the year, QTC derecognised land and buildings with a carrying value of $71.325 million which now forms part of a finance lease arrangement. | |
| (2) | Plant and machinery consists mainly of buses and ferries which QTC leases to public sector entities under a whole-of-Government lease facility. | |
QUEENSLAND TREASURY CORPORATION ANNUAL REPORT 2013–14 35
NOTES TO AND FORMING PART OF THE FINANCIAL STATEMENTS
FOR THE YEAR ENDED 30 JUNE 2014
| | | | | | | | |
| |
| | | 2014 | | | 2013 | |
| | | $000 | | | $000 | |
| |
| | |
| GROSS CARRYING AMOUNT | | | | | | | | |
| |
| Balance at 1 July | | | 9 098 | | | | 8 128 | |
| |
| Acquisitions | | | 97 | | | | 1 141 | |
| |
| Disposals | | | (103) | | | | (171) | |
| |
| Balance at 30 June | | | 9 092 | | | | 9 098 | |
| |
| | |
| ACCUMULATED DEPRECIATION | | | | | | | | |
| |
| Balance at 1 July | | | 4 909 | | | | 3 018 | |
| |
| Disposals | | | (103) | | | | (171) | |
| |
| Amortisation | | | 2 168 | | | | 2 062 | |
| |
| Balance at 30 June | | | 6 974 | | | | 4 909 | |
| |
| Net book value 30 June (1) | | | 2 118 | | | | 4 189 | |
| |
| (1) | The amount of fully depreciated software at balance date totalled $2.679 million (2013 $2.607 million). |
| | | | | | | | |
| |
| | | 2014 | | | 2013 | |
| | | $000 | | | $000 | |
| |
| Administration expenses | | | 11 858 | | | | 10 868 | |
| |
| Dividends payable | | | 120 000 | | | | - | |
| |
| Tax payable | | | 15 467 | | | | 15 635 | |
| |
| GST payable | | | 357 | | | | - | |
| |
| Other creditors | | | 485 | | | | 715 | |
| |
| | | 148 167 | | | | 27 218 | |
| |
36 QUEENSLAND TREASURY CORPORATION ANNUAL REPORT 2013–14
NOTES TO AND FORMING PART OF THE FINANCIAL STATEMENTS
FOR THE YEAR ENDED 30 JUNE 2014
| 15 | FINANCIAL LIABILITIES AT FAIR VALUE THROUGH PROFIT OR LOSS |
| | | | | | | | |
| |
| | | 2014 | | | 2013 | |
| | | $000 | | | $000 | |
| |
| | |
| INTEREST-BEARING LIABILITIES – CAPITAL MARKETS OPERATIONS | | | | | | | | |
| |
| Short-term | | | | | | | | |
| |
| Treasury notes | | | 2 152 166 | | | | 1 237 105 | |
| |
| Commercial paper | | | 2 223 522 | | | | 4 013 185 | |
| |
| | | 4 375 688 | | | | 5 250 290 | |
| |
| | |
| Long-term | | | | | | | | |
| |
| AUD Bonds | | | 83 123 358 | | | | 85 167 737 | |
| |
| Floating rate notes | | | 4 433 159 | | | | 350 884 | |
| |
| Global AUD Bonds (1) | | | 766 982 | | | | 1 263 077 | |
| |
| Medium-term notes | | | 1 104 502 | | | | 1 056 418 | |
| |
| Other | | | 223 191 | | | | 186 182 | |
| |
| | | 89 651 192 | | | | 88 024 298 | |
| |
| Total interest-bearing liabilities | | | 94 026 880 | | | | 93 274 588 | |
| |
| (1) | Consists of AUD denominated bonds which are borrowed in the United States and Euro markets. |
Derivatives are used to hedge offshore borrowings resulting in no net exposure to any foreign currency. Details of QTC’s exposure to foreign currencies and the derivatives used to hedge this exposure are disclosed in note 19 (a)(i).
QTC borrowings are guaranteed by the Queensland Government under the Queensland Treasury Corporation Act 1988.
As at 30 June 2014, $78,451.9 million (2013 $78,662.2 million) of debt securities are expected to be settled after more than 12 months.
QUEENSLAND TREASURY CORPORATION ANNUAL REPORT 2013–14 37
NOTES TO AND FORMING PART OF THE FINANCIAL STATEMENTS
FOR THE YEAR ENDED 30 JUNE 2014
| 15 | FINANCIAL LIABILITIES AT FAIR VALUE THROUGH PROFIT OR LOSS CONTINUED |
The difference between the carrying amount of financial liabilities and the amount contractually required to be paid at maturity to the holder of the obligation is set out in the following table:
| | | | | | | | | | | | |
| |
| AS AT 30 JUNE 2014 | | FAIR VALUE $000 | | | REPAYMENT AT MATURITY $000 | | | DIFFERENCE $000 | |
| |
| | | |
| INTEREST-BEARING LIABILITIES – CAPITAL MARKETS OPERATIONS | | | | | | | | | | | | |
| |
| Short-term | | | | | | | | | | | | |
| |
| Treasury notes | | | 2 152 166 | | | | 2 164 000 | | | | (11 834) | |
| |
| Commercial paper | | | 2 223 522 | | | | 2 224 995 | | | | (1 473) | |
| |
| | | 4 375 688 | | | | 4 388 995 | | | | (13 307) | |
| |
| | | |
| Long-term | | | | | | | | | | | | |
| |
| AUD Bonds | | | 83 123 358 | | | | 74 954 343 | | | | 8 169 015 | |
| |
| Floating rate notes | | | 4 433 159 | | | | 4 422 000 | | | | 11 159 | |
| |
| Global AUD Bonds | | | 766 982 | | | | 702 972 | | | | 64 010 | |
| |
| Medium-term notes | | | 1 104 502 | | | | 1 008 477 | | | | 96 025 | |
| |
| Other | | | 223 191 | | | | 216 606 | | | | 6 585 | |
| |
| | | 89 651 192 | | | | 81 304 398 | | | | 8 346 794 | |
| |
| Total interest-bearing liabilities | | | 94 026 880 | | | | 85 693 393 | | | | 8 333 487 | |
| |
| | | | | | | | | | | | |
| |
| AS AT 30 JUNE 2013 | | FAIR VALUE $000 | | | REPAYMENT AT MATURITY $000 | | | DIFFERENCE $000 | |
| |
| INTEREST-BEARING LIABILITIES – CAPITAL MARKETS OPERATIONS | | | | | | | | | | | | |
| |
| Short-term | | | | | | | | | | | | |
| |
| Treasury notes | | | 1 237 105 | | | | 1 243 000 | | | | (5 895) | |
| |
| Commercial paper | | | 4 013 185 | | | | 4 015 203 | | | | (2 018) | |
| |
| | | 5 250 290 | | | | 5 258 203 | | | | (7 913) | |
| |
| | | |
| Long-term | | | | | | | | | | | | |
| |
| AUD Bonds | | | 85 167 737 | | | | 78 280 328 | | | | 6 887 409 | |
| |
| Floating rate notes | | | 350 884 | | | | 350 000 | | | | 884 | |
| |
| Global AUD Bonds | | | 1 263 077 | | | | 1 169 002 | | | | 94 075 | |
| |
| Medium-term notes | | | 1 056 418 | | | | 943 111 | | | | 113 307 | |
| |
| Other | | | 186 182 | | | | 179 210 | | | | 6 972 | |
| |
| | | 88 024 298 | | | | 80 921 651 | | | | 7 102 647 | |
| |
| Total interest-bearing liabilities | | | 93 274 588 | | | | 86 179 854 | | | | 7 094 734 | |
| |
38 QUEENSLAND TREASURY CORPORATION ANNUAL REPORT 2013–14
NOTES TO AND FORMING PART OF THE FINANCIAL STATEMENTS
FOR THE YEAR ENDED 30 JUNE 2014
| 15 | FINANCIAL LIABILITIES AT FAIR VALUE THROUGH PROFIT OR LOSS CONTINUED |
| | | | | | | | |
| |
| | | 2014 | | | 2013 | |
| | | $000 | | | $000 | |
| |
| | |
| CLIENT DEPOSITS – CAPITAL MARKETS OPERATIONS | | | | | | | | |
| |
| Local governments | | | 1 801 076 | | | | 1 930 247 | |
| |
| Statutory bodies | | | 1 729 109 | | | | 1 479 541 | |
| |
| Government owned corporations | | | 594 740 | | | | 768 996 | |
| |
| Government departments and agencies | | | 61 806 | | | | 64 007 | |
| |
| QTC related entities | | | 68 817 | | | | 57 270 | |
| |
| Other depositors | | | 201 170 | | | | 201 336 | |
| |
| | | 4 456 718 | | | | 4 501 397 | |
| |
| Collateral held | | | 73 196 | | | | 552 721 | |
| |
| Repurchase agreements | | | 948 028 | | | | 1 073 577 | |
| |
| | | 1 021 224 | | | | 1 626 298 | |
| |
| Total deposits | | | 5 477 942 | | | | 6 127 695 | |
| |
| | | | | | | | |
| |
| | | 2014 | | | 2013 | |
| | | $000 | | | $000 | |
| |
| Cross border lease deferred income | | | 37 946 | | | | 52 267 | |
| |
| Whole of Government Debt Pool net position | | | 43 318 | | | | 67 533 | |
| |
| Employee benefits | | | 6 347 | | | | 6 239 | |
| |
| Other | | | 3 065 | | | | 4 802 | |
| |
| | | 90 676 | | | | 130 841 | |
| |
| 17 | FINANCIAL LIABILITIES AT AMORTISED COST |
| | | | | | | | |
| |
| | | 2014 | | | 2013 | |
| | | $000 | | | $000 | |
| |
| | |
| FIXED RATE NOTES – LONG TERM ASSETS | | | | | | | | |
| |
| State Government | | | 31 983 174 | | | | 31 447 603 | |
| |
The Board considers that the carrying value of financial liabilities recorded at amortised cost in the financial statements approximates their fair value. For the purposes of the fair value hierarchy, the fixed rate notes are categorised as level 3 (refer note 20).
QUEENSLAND TREASURY CORPORATION ANNUAL REPORT 2013–14 39
NOTES TO AND FORMING PART OF THE FINANCIAL STATEMENTS
FOR THE YEAR ENDED 30 JUNE 2014
| 18 | NOTES TO THE STATEMENT OF CASH FLOWS |
(a) Reconciliation of profit after tax to net cash provided by operating activities – capital markets operations
| | | | | | | | |
| |
| | | 2014 | | | 2013 | |
| | | $000 | | | $000 | |
| |
| | |
| Profit for the year | | | 119 220 | | | | 222 884 | |
| |
| | |
| NON-CASH FLOWS IN OPERATING SURPLUS | | | | | | | | |
| |
| Interest-bearing liabilities - net unrealised loss/(gain) | | | 2 123 944 | | | | (1 309 368) | |
| |
| Interest-bearing liabilities - net unrealised exchange loss | | | 87 063 | | | | 5 664 | |
| |
| Deposits - net unrealised (gain)/loss | | | (147) | | | | 11 | |
| |
| Onlendings net unrealised (gain)/loss | | | (2 201 057) | | | | 1 255 992 | |
| |
| Financial assets at fair value through profit or loss – net unrealised loss | | | 17 879 | | | | 284 430 | |
| |
| Financial assets at fair value through profit or loss – net unrealised exchange gain | | | (2 865) | | | | (73 985) | |
| |
| Depreciation of property, plant and equipment | | | 35 196 | | | | 34 018 | |
| |
| Amortisation of intangibles | | | 2 168 | | | | 2 059 | |
| |
| Net (gain)/loss on sale of property, plant and equipment | | | (1 159) | | | | 9 | |
| |
| Doubtful debts writeback cooperative housing societies | | | - | | | | (26) | |
| |
| Net loss /(gain) from investment accounted for using the equity method | | | 1 146 | | | | (521) | |
| |
| | |
| CHANGES IN ASSETS AND LIABILITIES | | | | | | | | |
| |
| Decrease in financial assets at fair value through profit or loss - net accrued interest | | | 27 247 | | | | 43 878 | |
| |
| Decrease/(increase) in financial assets at fair value through profit or loss - net discount/premium | | | 227 806 | | | | (51 160) | |
| |
| (Increase)/decrease in deferred tax asset | | | (1 002) | | | | 306 | |
| |
| Decrease /(increase) in onlendings - net accrued interest | | | 5 512 | | | | (3 317) | |
| |
| Decrease in receivables | | | 1 448 | | | | 5 661 | |
| |
| Decrease/(increase) in prepayments | | | 230 | | | | (208) | |
| |
| Increase in interest-bearing liabilities - net accrued interest | | | 64 173 | | | | 107 526 | |
| |
| (Decrease)/increase in interest-bearing liabilities - net discount/premium | | | (51 571) | | | | 305 558 | |
| |
| Increase in deposits - net accrued interest | | | 236 | | | | 507 | |
| |
| (Decrease)/ increase in payables | | | (39 406) | | | | 36 403 | |
| |
| Decrease in deferred tax liability | | | - | | | | (30) | |
| |
| (Decrease)/increase in income tax payable | | | (168) | | | | 7 047 | |
| |
| Net cash provided by operating activities | | | 415 893 | | | | 873 338 | |
| |
(b) Cash flows presented on a net basis
Cash flows arising from the following activities are presented on a net basis in the statement of cash flows:
| § | | loan advances to and redemptions from clients |
| § | | receipt and withdrawal of client deposits, and |
| § | | money market and other deposits. |
(c) Long term assets
No external cashflow is generated from the Long Term Assets as deposits and withdrawals from the fixed rate notes result in a corresponding change to the investments held. Interest on the fixed rate notes is capitalised. Earnings, market movement and fees on the investment are recognised in the valuation of the investment (refer notes 2 (f) and 3).
40 QUEENSLAND TREASURY CORPORATION ANNUAL REPORT 2013–14
NOTES TO AND FORMING PART OF THE FINANCIAL STATEMENTS
FOR THE YEAR ENDED 30 JUNE 2014
| 19 | FINANCIAL RISK MANAGEMENT |
CAPITAL MARKETS OPERATIONS
QTC’s activities expose it to a variety of financial risks including market risk (interest rate, currency and price risks), credit risk and liquidity risk. QTC’s financial risk management focuses on minimising financial risk exposures and managing volatility, and seeks to mitigate potential adverse effects of financial risks on the financial performance of QTC and its clients. To assist in managing financial risk, QTC uses derivative financial instruments such as foreign exchange contracts, interest rate swaps and futures contracts to manage certain risk exposures.
QTC ensures that in undertaking its capital markets activities it has adequate capital to manage its risks. While QTC’s capital is not subject to regulatory oversight, QTC operates under self-imposed capital requirements based on prudential statements published by APRA and utilises a capital adequacy approach based on Basel II: International Convergence of Capital Measurements and Capital Standards and applies these principles in its day to day management of capital.
Capital requirements are calculated for credit risk, market risk and operational risk with stress testing applied. Capital requirements are then applied against QTC’s Tier 1 and Tier 2 capital held. Capital usage is calculated daily and monitored against approved limits with reports presented monthly to the Board.
All financial risk management activities are conducted within Board approved policies, as set out in the Financial Markets Risk Policy. The Board approves policies for overall risk management, as well as specifically for managing market risk, liquidity risk and credit risk. New financial instruments must be approved by the QTC Board.
Robust systems are in place for managing financial risk, and compliance with financial risk policies is monitored daily. The financial risk management process, including daily measurement and monitoring of market risk, liquidity risk, credit risk and portfolio performance and limit reviews, are performed by teams separate from the teams transacting and is subject to review by the Risk Management Team (comprising senior management), the Funding and Markets Committee (comprised of Board members) and the Board.
All breaches of the Financial Markets Risk Policy together with the corrective action proposed or taken are required to be immediately reported to the Chief Executive and then to the next Funding and Markets Committee meeting and the next Board meeting.
(a) Market risk
QTC’s borrowing and investment activities, including borrowing in advance of requirements to ensure Queensland public sector entities have ready access to funding when required and also to reduce the risk associated with refinancing maturing loans, exposes QTC to market risk.
As a consequence of market changes, there are residual risk positions which may result in realised and unrealised accounting gains or losses being recorded during the year. Depending on whether these transactions are held to maturity, the unrealised gains or losses may be reversed in subsequent accounting periods.
QTC uses a Board approved Value-at-Risk (VaR) framework to manage QTC’s exposure to market risk complemented by other measures such as defined stress tests and PVBP (change in the present value for a one basis point movement). The VaR risk measure estimates the potential mark-to-market loss over a given holding period at a 99 per cent confidence level. QTC uses the historical simulation approach to calculate VaR using 18 months of market data with a holding period of 10 business days.
QTC’s investments on behalf of its clients are held in the QTC Cash Fund. Movement in credit spreads will impact on the value of the assets held in the Cash Fund resulting in unrealised mark-to-market accounting gains or losses. QTC generally holds these assets to maturity and therefore QTC does not pass on the mark-to-market impact of credit margin changes, either positive or negative, in the returns to Cash Fund participants.
(i) Foreign exchange risk
QTC has funding facilities that allow for borrowing in foreign currencies. At times, QTC’s Cash Fund invests in foreign currency assets. QTC enters into both forward exchange contracts and cross currency swaps to hedge the exposure of foreign currency borrowings and offshore investments from fluctuations in exchange rates.
The following table summarises the hedging effect that cross currency swaps and forward exchange contracts have had on face value offshore borrowings and investments stated in Australian dollars:
| | | | | | | | | | | | | | | | | | | | | | | | | | | | | | | | |
| |
| | | BORROWINGS | | |
| OFFSHORE
INVESTMENTS |
| | | DERIVATIVE CONTRACTS | | | | NET EXPOSURE | |
| |
| | | 2014 | | | 2013 | | | 2014 | | | 2013 | | | 2014 | | | 2013 | | | 2014 | | | 2013 | |
| | | $000 | | | $000 | | | $000 | | | $000 | | | $000 | | | $000 | | | $000 | | | $000 | |
| |
| USD | | | (1 639 017) | | | | (4 015 203) | | | | 104 217 | | | | 278 899 | | | | 1 534 800 | | | | 3 736 304 | | | | - | | | | - | |
| |
| NZD | | | (737 554) | | | | (653 660) | | | | - | | | | - | | | | 737 554 | | | | 653 660 | | | | - | | | | - | |
| |
| GBP | | | (253 328) | | | | - | | | | 27 142 | | | | - | | | | 226 186 | | | | - | | | | - | | | | - | |
| |
| YEN | | | (157 320) | | | | (163 899) | | | | - | | | | - | | | | 157 320 | | | | 163 899 | | | | - | | | | - | |
| |
| CHF | | | (131 251) | | | | (125 552) | | | | - | | | | - | | | | 131 251 | | | | 125 552 | | | | - | | | | - | |
| |
| EUR | | | - | | | | - | | | | 58 036 | | | | 108 518 | | | | (58 036) | | | | (108 518) | | | | - | | | | - | |
| |
QUEENSLAND TREASURY CORPORATION ANNUAL REPORT 2013–14 41
NOTES TO AND FORMING PART OF THE FINANCIAL STATEMENTS
FOR THE YEAR ENDED 30 JUNE 2014
| 19 | FINANCIAL RISK MANAGEMENT CONTINUED |
(a) Market risk continued
(ii) Interest rate risk
In managing interest rate risk on behalf of clients, the onlending portfolios are managed against duration benchmarks. Duration is a direct measure of the interest rate sensitivity of a financial instrument or a portfolio of financial instruments and quantifies the change in value of a financial instrument or portfolio due to interest rate movements. All costs or benefits of managing client debt portfolios are passed on to the client meaning that QTC is effectively immunised from interest rate risk with respect to these portfolios.
QTC’s interest rate risk, which results from borrowing in advance and investing surplus funds in high credit quality, highly liquid assets, is managed with consideration given to duration risk, yield curve risk, basis risk and VaR. To manage the risk of non-parallel yield curve movements, QTC manages portfolio cash flows in a series of time periods so that the net interest rate risk in each time period can be measured.
QTC enters into interest rate swaps, forward rate agreements and futures contracts to assist in the management of interest rate risk.
In QTC’s Funding and Liquidity portfolios, interest rate swaps may be utilised to change the interest rate exposure of medium to long term fixed rate borrowings into that of a floating rate borrowing. Also, at times, floating to fixed swaps may be undertaken to generate a fixed rate term funding profile.
QTC is exposed to basis risk when interest rate swaps are used in the Funding and Liquidity portfolios. Basis risk represents a mark-to-market exposure due to movements between the swap curve and QTC’s yield curve.
VaR IMPACT
The VaR at 30 June was as follows:
| | | | | | | | |
| |
| | | 2014 | | | 2013 | |
| |
| Interest rate risk VaR | | | $6m | | | | $22m | |
| |
The above VaR calculation does not include the potential mark-to-market impact of changes in credit spreads on the value of assets held in the QTC Cash Fund and the Cross Border Lease portfolio. At 30 June 2014, QTC had an exposure of approximately $0.8 million per basis point to changes in credit spreads of assets held in the QTC Cash Fund.
(b) Liquidity and financing risks
QTC has a robust internal framework whereby extensive liquidity scenario analysis and forecasting is undertaken to understand assumption sensitivities to ensure there is appropriate forward looking visibility of the State’s liquidity position.
QTC debt is a Level 1 (prudentially required) asset for Australian banks under Basel III reforms with a 0% capital risk weighting. In normal and difficult market circumstances, QTC debt is likely to be in high demand. The ability to issue debt is considered a potential source of liquidity.
QTC holds appropriate liquidity (allowing for suitable haircuts of liquid assets) to meet minimum liquidity requirements as estimated today and as forecast into the future. QTC measures the minimum liquidity requirement to comfortably meet the following four scenarios simultaneously:
| § | | Going Concern – progressively pre-fund term maturities 6 months from maturity |
| § | | Market Disruption - 90 days survival horizon (severe market circumstances) |
| § | | Name Crisis – 30 days survival horizon (extreme market circumstances) |
| § | | Standard & Poor’s Liquidity Ratio – maintain a ratio greater than 80% |
Further to this QTC holds liquid assets to support Queensland Public Sector (QPS) deposits and the State’s Long Term Assets. QTC considers these liquid assets as potential sources of liquidity in a liquidity crisis.
To ensure liquidity is accessible as required, QTC holds a minimum of 5 working days’ net cash requirements in 11AM cash to fund the net cash flows from assets and liabilities on QTC’s balance sheet (included in money market deposits as per note 9).
QTC maintains its AUD benchmark bond facility as its core medium to long-term funding facility and its domestic treasury note facility, euro-commercial paper facility and US commercial paper facility as its core short-term funding facilities. In addition, QTC has in place Euro and US medium-term note facilities to take advantage of funding opportunities in offshore markets. These facilities ensure that QTC is readily able to access the domestic and international financial markets. QTC’s range of funding facilities is detailed in note 25.
The table on the following page sets out the contractual cashflows relating to assets and liabilities held by QTC at balance date.
With the exception of deposits and payables, the maturity analysis for liabilities has been calculated based on the contractual cash flows relating to the repayment of the principal (face value) and interest amounts over the contractual terms.
Deposits on account of the Cash Fund and Working Capital Facility (11AM Fund) are repayable at call while deposits held as security for stock lending and repurchase agreements are repayable when the security is lodged with QTC.
With the exception of cash and receivables, the maturity analysis for assets has been calculated based on the contractual cash flows relating to the repayment of the principal (face value) and interest amounts over the contractual terms.
In relation to client onlendings, certain loans are interest only with no fixed repayment date for the principal component (ie. loans are made based on the quality of the client’s business and its financial strength). For the purposes of completing the maturity analysis, the principal component of these loans has been included in the more than five year time band with no interest payment assumed in this time band.
42 QUEENSLAND TREASURY CORPORATION ANNUAL REPORT 2013–14
NOTES TO AND FORMING PART OF THE FINANCIAL STATEMENTS
FOR THE YEAR ENDED 30 JUNE 2014
| 19 | FINANCIAL RISK MANAGEMENT CONTINUED |
(b) Liquidity and financing risks continued
| | | | | | | | | | | | | | | | | | | | | | | | | | | | |
| |
CONTRACTUAL MATURITIES AS AT 30 JUNE 2014 | | 3 MONTHS
OR LESS
$000 | | | 3 – 6
MONTHS
$000 | | | 6 – 12
MONTHS
$000 | | | 1 – 5
YEARS
$000 | | | MORE THAN
5 YEARS
$000 | | | TOTAL $000 | | | FAIR
VALUE
$000 | |
| |
| | | | | | | |
| FINANCIAL ASSETS | | | | | | | | | | | | | | | | | | | | | | | | | | | | |
| |
| Cash | | | 546 | | | | - | | | | - | | | | - | | | | - | | | | 546 | | | | 546 | |
| |
| Receivables | | | 4 384 | | | | - | | | | - | | | | - | | | | - | | | | 4 384 | | | | 4 384 | |
| |
| Onlendings # | | | 1 360 947 | | | | 1 338 062 | | | | 2 692 737 | | | | 19 566 983 | | | | 78 295 529 | | | | 103 254 258 | | | | 85 609 405 | |
| |
| Money market deposits | | | 2 674 416 | | | | - | | | | - | | | | - | | | | - | | | | 2 674 416 | | | | 2 674 416 | |
| |
| Discount securities | | | 4 261 500 | | | | 500 000 | | | | - | | | | - | | | | - | | | | 4 761 500 | | | | 4 738 190 | |
| |
Commonwealth and semi-government securities | | | (42 234) | | | | 19 359 | | | | 58 334 | | | | 617 213 | | | | 724 015 | | | | 1 376 687 | | | | 1 151 874 | |
| |
| Floating rate notes | | | 158 876 | | | | 192 194 | | | | 470 053 | | | | 3 575 871 | | | | - | | | | 4 396 994 | | | | 4 105 618 | |
| |
| Term deposits | | | 733 066 | | | | - | | | | - | | | | - | | | | - | | | | 733 066 | | | | 729 476 | |
| |
| Other investments | | | 410 078 | | | | 133 267 | | | | 211 841 | | | | 530 638 | | | | 74 588 | | | | 1 360 412 | | | | 1 299 327 | |
| |
| Total monetary assets | | | 9 561 579 | | | | 2 182 882 | | | | 3 432 965 | | | | 24 290 705 | | | | 79 094 132 | | | | 118 562 263 | | | | 100 313 236 | |
| |
| | | | | | | |
| FINANCIAL LIABILITIES | | | | | | | | | | | | | | | | | | | | | | | | | | | | |
| |
| Payables | | | (132 700) | | | | (15 467) | | | | - | | | | - | | | | - | | | | (148 167) | | | | (148 167) | |
| |
| Deposits | | | (5 461 658) | | | | (20 273) | | | | - | | | | - | | | | - | | | | (5 481 931) | | | | (5 477 942) | |
| |
| Treasury notes | | | (1 314 000) | | | | (850 000) | | | | - | | | | - | | | | - | | | | (2 164 000) | | | | (2 152 166) | |
| |
| Commercial paper | | | (2 125 640) | | | | (100 001) | | | | - | | | | - | | | | - | | | | (2 225 641) | | | | (2 223 522) | |
| |
| AUD Bonds | | | (1 112 388) | | | | (3 604 705) | | | | (1 980 643) | | | | (46 776 900) | | | | (45 408 695) | | | | (98 883 331) | | | | (83 123 358) | |
| |
| Floating rate notes | | | (178 244) | | | | (533) | | | | (1 068) | | | | (4 278 121) | | | | - | | | | (4 457 966) | | | | (4 433 159) | |
| |
| Global AUD Bonds | | | (12 377) | | | | (8 712) | | | | (21 089) | | | | (773 569) | | | | - | | | | (815 747) | | | | (766 982) | |
| |
| Medium-term notes | | | (27 917) | | | | (2 084) | | | | (27 731) | | | | (873 896) | | | | (419 635) | | | | (1 351 263) | | | | (1 104 502) | |
| |
| Other interest bearing liabilities | | | (12 331) | | | | (11 779) | | | | (28 001) | | | | (185 151) | | | | - | | | | (237 262) | | | | (223 191) | |
| |
| Total monetary liabilities | | | (10 377 255) | | | | (4 613 554) | | | | (2 058 532) | | | | (52 887 637) | | | | (45 828 330) | | | | (115 765 308) | | | | (99 652 989) | |
| |
| | | | | | | |
| DERIVATIVES | | | | | | | | | | | | | | | | | | | | | | | | | | | | |
| |
| Interest rate swaps | | | (9 735) | | | | 489 | | | | (19 570) | | | | (91 777) | | | | (19 966) | | | | (140 559) | | | | (135 154) | |
| |
| Cross currency swaps | | | (473 915) | | | | (4 268) | | | | (45 713) | | | | 693 579 | | | | (329 898) | | | | (160 215) | | | | 68 817 | |
| |
| Forward rate agreements | | | (280 000) | | | | (314 276) | | | | (72 365) | | | | 747 750 | | | | - | | | | 81 109 | | | | 38 704 | |
| |
| Foreign exchange contracts | | | (69 139) | | | | - | | | | - | | | | - | | | | - | | | | (69 139) | | | | (64 651) | |
| |
| Net derivatives | | | (832 789) | | | | (318 055) | | | | (137 648) | | | | 1 349 552 | | | | (349 864) | | | | (288 804) | | | | (92 484) | |
| |
| Net monetary assets/(liabilities) | | | (1 648 465) | | | | (2 748 727) | | | | 1 236 785 | | | | (27 247 380) | | | | 32 915 938 | | | | 2 508 151 | | | | 567 963 | |
| |
| Cumulative | | | (1 648 465) | | | | (4 397 192) | | | | (3 160 407) | | | | (30 407 787) | | | | 2 508 151 | | | | | | | | | |
| |
QUEENSLAND TREASURY CORPORATION ANNUAL REPORT 2013–14 43
NOTES TO AND FORMING PART OF THE FINANCIAL STATEMENTS
FOR THE YEAR ENDED 30 JUNE 2014
| 19 | FINANCIAL RISK MANAGEMENT CONTINUED |
| | | | | | | | | | | | | | | | | | | | | | | | | | | | |
| |
| CONTRACTUAL MATURITIES | | 3 MONTHS
OR LESS | | | 3 – 6
MONTHS | | | 6 – 12
MONTHS | | | 1 – 5
YEARS | | | MORE THAN
5 YEARS | | | TOTAL | | | FAIR
VALUE | |
| AS AT 30 JUNE 2013 | | $000 | | | $000 | | | $000 | | | $000 | | | $000 | | | $000 | | | $000 | |
| |
| | | | | | | |
| FINANCIAL ASSETS | | | | | | | | | | | | | | | | | | | | | | | | | | | | |
| |
| Cash | | | 197 | | | | - | | | | - | | | | - | | | | - | | | | 197 | | | | 197 | |
| |
| Receivables | | | 3 568 | | | | - | | | | - | | | | - | | | | - | | | | 3 568 | | | | 3 568 | |
| |
| Onlendings # | | | 1 602 981 | | | | 1 405 425 | | | | 2 810 851 | | | | 19 574 610 | | | | 74 318 643 | | | | 99 712 510 | | | | 79 118 832 | |
| |
| Money market deposits | | | 1 717 479 | | | | - | | | | - | | | | - | | | | - | | | | 1 717 479 | | | | 1 717 477 | |
| |
| Discount securities | | | 6 560 300 | | | | 1 225 000 | | | | - | | | | - | | | | - | | | | 7 785 300 | | | | 7 743 703 | |
| |
Commonwealth and semi-government securities | | | 84 953 | | | | 63 326 | | | | 118 814 | | | | 1 937 821 | | | | 2 155 984 | | | | 4 360 898 | | | | 3 642 350 | |
| |
| Floating rate notes | | | 460 780 | | | | 319 505 | | | | 234 992 | | | | 3 661 988 | | | | - | | | | 4 677 265 | | | | 4 314 169 | |
| |
| Term deposits | | | 253 816 | | | | 304 941 | | | | - | | | | - | | | | - | | | | 558 757 | | | | 552 625 | |
| |
| Other investments | | | 302 670 | | | | 150 129 | | | | 226 646 | | | | 1 693 286 | | | | - | | | | 2 372 731 | | | | 2 223 721 | |
| |
| Total monetary assets | | | 10 986 744 | | | | 3 468 326 | | | | 3 391 303 | | | | 26 867 705 | | | | 76 474 627 | | | | 121 188 705 | | | | 99 316 642 | |
| |
| | | | | | | |
| FINANCIAL LIABILITIES | | | | | | | | | | | | | | | | | | | | | | | | | | | | |
| |
| Payables | | | (11 583) | | | | (15 635) | | | | - | | | | - | | | | - | | | | (27 218) | | | | (27 218) | |
| |
| Deposits | | | (6 109 685) | | | | (20 305) | | | | - | | | | - | | | | - | | | | (6 129 990) | | | | (6 127 695) | |
| |
| Treasury notes | | | (1 006 000) | | | | (237 000) | | | | - | | | | - | | | | - | | | | (1 243 000) | | | | (1 237 105) | |
| |
| Commercial paper | | | (2 808 138) | | | | (1 207 065) | | | | - | | | | - | | | | - | | | | (4 015 203) | | | | (4 013 185) | |
| |
| AUD Bonds | | | (5 528 519) | | | | (943 810) | | | | (2 102 146) | | | | (45 921 806) | | | | (50 548 588) | | | | (105 044 869) | | | | (85 167 737) | |
| |
| Floating rate notes | | | (352 425) | | | | 9 | | | | 17 | | | | 9 | | | | - | | | | (352 390) | | | | (350 884) | |
| |
| Global AUD Bonds | | | (374 694) | | | | (11 401) | | | | (24 539) | | | | (944 151) | | | | - | | | | (1 354 785) | | | | (1 263 077) | |
| |
| Medium-term notes | | | (25 459) | | | | (2 172) | | | | (25 458) | | | | (842 728) | | | | (428 445) | | | | (1 324 262) | | | | (1 056 418) | |
| |
| Other interest bearing liabilities | | | (18 071) | | | | (12 802) | | | | (21 036) | | | | (146 315) | | | | - | | | | (198 224) | | | | (186 182) | |
| |
| Total monetary liabilities | | | (16 234 574) | | | | (2 450 181) | | | | (2 173 162) | | | | (47 854 991) | | | | (50 977 033) | | | | (119 689 941) | | | | (99 429 501) | |
| |
| | | | | | | |
| DERIVATIVES | | | | | | | | | | | | | | | | | | | | | | | | | | | | |
| |
| Interest rate swaps | | | 32 505 | | | | (890) | | | | (16 463) | | | | (49 128) | | | | 210 392 | | | | 176 416 | | | | 97 963 | |
| |
| Cross currency swaps | | | (455 774) | | | | (4 395) | | | | (58 733) | | | | 625 695 | | | | (340 831) | | | | (234 038) | | | | 19 815 | |
| |
| Forward rate agreements | | | (282 378) | | | | (684 081) | | | | (142 928) | | | | 1 282 477 | | | | 65 090 | | | | 238 180 | | | | 86 378 | |
| |
| Foreign exchange contracts | | | 276 463 | | | | 123 591 | | | | - | | | | - | | | | - | | | | 400 054 | | | | 416 579 | |
| |
| Net derivatives | | | (429 184) | | | | (565 775) | | | | (218 124) | | | | 1 859 044 | | | | (65 349) | | | | 580 612 | | | | 620 735 | |
| |
| Net monetary assets/(liabilities) | | | (5 677 014) | | | | 452 370 | | | | 1 000 017 | | | | (19 128 242) | | | | 25 432 245 | | | | 2 079 376 | | | | 507 876 | |
| |
| Cumulative | | | (5 677 014) | | | | (5 224 644) | | | | (4 224 627) | | | | (23 352 869) | | | | 2 079 376 | | | | | | | | | |
| |
# QTC’s onlendings to Government owned corporation clients are based on the quality of the business and financial strength of the client. Funds are therefore onlent on the basis of these businesses being going concerns and continuing to meet key credit metrics criteria such as debt to capital and interest coverage ratios. Accordingly, a significant portion of the onlendings portfolio has a loan maturity profile which is greater than five years with the interest rate risk of these loans being managed based on the client’s business risk such that the funding is structured on the underlying business profile. This results in QTC’s liability maturity profile being shorter than the asset maturity profile. Though not exposing QTC to interest rate risk, this approach does require QTC to undertake periodic refinancing of its liabilities.
44 QUEENSLAND TREASURY CORPORATION ANNUAL REPORT 2013–14
NOTES TO AND FORMING PART OF THE FINANCIAL STATEMENTS
FOR THE YEAR ENDED 30 JUNE 2014
| 19 | FINANCIAL RISK MANAGEMENT CONTINUED |
(c) Credit risk
(i) Financial markets counterparties
Credit risk is regularly assessed, measured and managed in strict accordance with QTC’s credit policy. Exposure to credit risk is managed through regular analysis of the ability of credit counterparties to meet payment obligations. Counterparty credit limits are changed based on QTC’s view of the capacity of the counterparty to meet its obligation.
Credit exposure is QTC’s estimate of the potential loss at balance date in relation to investments and derivative contracts in the event of non-performance by all counterparties. The credit exposure for non-derivative investments is calculated based on the market value of the exposure together with the VaR while exposure to derivative contracts is based only on VaR.
The following table represents QTC’s exposure to credit risk at 30 June:
| | | | | | | | |
| |
| | | CREDIT EXPOSURE | |
| |
| | | 2014 | | | 2013 | |
| | | $000 | | | $000 | |
| |
| Investments | | | 14 789 899 | | | | 20 858 701 | |
| |
| Derivatives | | | | | | | | |
| |
| Interest rate swaps | | | 480 003 | | | | 1 025 761 | |
| |
| Cross currency swaps | | | 212 300 | | | | 157 086 | |
| |
| Foreign exchange contracts | | | 36 294 | | | | 600 218 | |
| |
QTC adopts a conservative approach to the management of credit risk with a strong bias to high credit quality counterparties. QTC maintains a ratings based approach in determining maximum credit exposures to counterparties which is supplemented by QTC’s credit risk team performing its own credit assessment of QTC’s capital markets counterparties. The country of domicile, the counterparty’s credit metrics, size of its funding programs, asset composition and quality of the underlying security are also significant considerations when determining limits.
QTC has a significant concentration of credit risk to the banking sector and in particular, the domestic banking sector. This is difficult to avoid given the size of QTC’s investment portfolio and the requirement to invest with counterparties rated A- or better (88 per cent of exposures are AA- or better) and to invest in highly liquid securities.
QTC also utilises collateral arrangements to limit its derivatives’ credit exposure (refer (iii) master netting arrangements).
Counterparty exposure by rating for all investments and derivative contracts is listed below:
| | | | | | | | | | | | | | | | | | | | |
| |
| | | | | | CREDIT EXPOSURE | |
| |
| | | | | | 2014 | | | 2013 | | | 2014 | | | 2013 | |
| | | RATING | | | % | | | % | | | $000 | | | $000 | |
| |
| Long-term rating | | | AAA | | | | 17 | | | | 22 | | | | 2 680 978 | | | | 5 036 145 | |
| |
| | | AA+ | | | | 4 | | | | 3 | | | | 593 640 | | | | 607 315 | |
| |
| | | AA | | | | - | | | | 3 | | | | 23 547 | | | | 670 257 | |
| |
| | | AA- | | | | 67 | | | | 64 | | | | 10 421 762 | | | | 14 503 213 | |
| |
| | | A+ | | | | 8 | | | | 4 | | | | 1 192 850 | | | | 1 014 792 | |
| |
| | | A | | | | 2 | | | | 1 | | | | 282 754 | | | | 292 571 | |
| |
| | | A- | | | | 2 | | | | 1 | | | | 296 581 | | | | 292 829 | |
| |
| Short-term rating | | | A-1+ | | | | - | | | | 1 | | | | 26 384 | | | | 127 008 | |
| |
| | | A-2 | | | | - | | | | 1 | | | | - | | | | 97 636 | |
| |
(ii) Onlending counterparties
Counterparties for onlendings, with the exception of some small exposures to private companies, cooperative housing societies and primary producer cooperatives, are Queensland Government sector entities and in some cases an explicit State Government guarantee exists. As a consequence, these exposures are not included in QTC’s total credit exposure.
QUEENSLAND TREASURY CORPORATION ANNUAL REPORT 2013–14 45
NOTES TO AND FORMING PART OF THE FINANCIAL STATEMENTS
FOR THE YEAR ENDED 30 JUNE 2014
| 19 | FINANCIAL RISK MANAGEMENT CONTINUED |
(c) Credit risk continued
(iii) Master netting arrangements
QTC enters into all derivative transactions under International Swaps and Derivatives Association (ISDA) Master Agreements. QTC does not currently have any master netting arrangements where a default event has occurred, and has therefore presented all derivative financial instruments on a gross basis in the statement of financial position. QTC also has Credit Support Annexes (CSAs) in place with each ISDA, under which collateral is transferred every business day. This further reduces QTC’s credit exposure.
The following table presents the financial instruments that are offset, or subject to enforceable master netting arrangements and other similar agreements but not offset. The column ‘net amount’ shows the impact on QTC’s balance sheet if all set-off rights were exercised.
| | | | | | | | |
|
| | | GROSS AND NET AMOUNTS
ON THE BALANCE SHEET
$000 | | EFFECT OF COLLATERAL
AND NETTING $000 | | | NET AMOUNT
$000 |
|
| 2014 | | | | | | | | |
|
| Derivative assets | | | | | | | | |
|
subject to master netting arrangements | | 213 838 | | | (213 838) | | | - |
|
not subject to master netting arrangements | | 38 704 | | | - | | | 38 704 |
|
| Derivative assets | | 252 543 | | | (213 838) | | | 38 704 |
|
| Derivative liabilities | | | | | | | | |
|
subject to master netting arrangements | | (344 827) | | | 311 738 | | | (33 089) |
|
| Derivative liabilities | | (344 827) | | | 311 738 | | | (33 089) |
|
| Net exposure | | (92 285) | | | 97 900 | | | 5 615 |
|
| 2013 (1) | | | | | | | | |
|
| Derivative assets | | | | | | | | |
|
subject to master netting arrangements | | 702 083 | | | (696 275) | | | 5 808 |
|
not subject to master netting arrangements | | 86 378 | | | - | | | 86 378 |
|
| Derivative assets | | 788 461 | | | (696 275) | | | 92 186 |
|
| Derivative liabilities | | | | | | | | |
|
subject to master netting arrangements | | (167 726) | | | 166 024 | | | (1 702) |
|
| Derivative liabilities | | (167 726) | | | 166 024 | | | (1 702) |
|
| Net exposure | | 620 735 | | | (530 251) | | | 90 484 |
|
| (1) | QTC transitioned from credit-based to zero-threshold CSAs during the 2013 calendar year, further reducing credit exposure. |
LONG TERM ASSETS
The Long Term Assets are invested in unlisted unit trusts held with QIC. The trusts hold investments in a variety of financial instruments including derivatives, which expose these assets to credit risk, liquidity risk and market risk due to changes in interest rates, foreign exchange rates, property and equity prices. However, as these investments are long term in nature, market fluctuations are expected to even out over the term of the investment.
The Long Term Asset Advisory Board (LTAAB) determines the investment objectives, risk profiles and strategy for the Long Term Assets within the framework provided by the Government. It is responsible for formulating a strategic asset allocation to achieve the objectives of the investments in line with the required risk profile. Risk management policies are established to identify and analyse the risks and to set appropriate risk limits and controls, as well as to monitor risks and adherence against these limits.
QIC provides assistance to the LTAAB in discharging its responsibilities. QIC’s role includes recommending to the LTAAB, investment product objectives, risk profiles and strategic asset allocations to achieve objectives within the targets and risk controls set. As the lead investment manager, QIC is responsible for implementing the investment strategy.
In addition, independent oversight of the investment advice and services provided by QIC, including periodic strategic reviews of QIC’s activities and performance, is provided by an external consultant.
The LTAAB is responsible for setting the interest rate applicable on the fixed rate note liability of QTC. Since July 2012, LTAAB has been reducing risk in the Asset Portfolio. The revised asset classes feature reduced weights to listed equities, offset by increased weights to alternatives, global fixed interest and cash. The result was a reduction in expected return and volatility. In light of this strategy, the expected rate of return on the portfolio on which the interest rate on the fixed rate notes is set was revised from 7.5 per cent to 7.1 per cent, effective 1 July 2013.
(a) Market risk
The Long Term Assets expose QTC to market risk, including interest rate risk, foreign currency risk, property and equity price risk, resulting from its investments in unit trusts.
Market risk is mitigated through a diversified portfolio of investments in unit trusts held with QIC in accordance with the investment strategy approved by the LTAAB (refer note 9). The investment strategy targets a widely diversified portfolio across a broad range of asset classes.
QIC adheres to prudential controls contained in the Investment Management Agreement. Under this agreement, derivative products are not permitted to be used for speculative purposes but are used as hedging instruments against existing positions or for efficient trading and asset allocation purposes to assist in achieving the overall investment returns and volatility objectives of the portfolio.
46 QUEENSLAND TREASURY CORPORATION ANNUAL REPORT 2013–14
NOTES TO AND FORMING PART OF THE FINANCIAL STATEMENTS
FOR THE YEAR ENDED 30 JUNE 2014
| 19 | FINANCIAL RISK MANAGEMENT CONTINUED |
(a) Market risk continued
(i) Sensitivity analysis
The market risk of the Long Term Assets comprises the risk that the unit price of the funds in which the assets are invested will change during the next reporting period (effectively price risk). A sensitivity analysis for the key types of market risk that apply to the investments of the funds has been undertaken by QIC. QIC has provided a range of reasonably possible changes in key risk variables including the ASX 200, the MSCI World ex Australia Equities Index, the RBA official cash rate and a large number of currencies.
Based on these changes to key risk variables, and applying a range of valuation methodologies, a reasonably possible change in profit and equity on applicable investments held at 30 June is as follows:
| | | | | | | | | | | | | | | | | | | | | | | | | | | | | | | | |
| |
| | | 2014
CHANGE | | | 2014 PROFIT/EQUITY | | | 2013 CHANGE | | | 2013 PROFIT/EQUITY | |
| |
| | | LOW | | | HIGH | | | DECREASE
$000 | | | INCREASE
$000 | | | LOW | | | HIGH | | | DECREASE
$000 | | | INCREASE
$000 | |
| |
| Equities | | | -19% | | | | 21% | | | | (956 965) | | | | 1 042 900 | | | | -18% | | | | 20% | | | | (991 019) | | | | 1 058 644 | |
| |
| Diversified alternatives | | | -19% | | | | 20% | | | | (1 148 342) | | | | 1 214 763 | | | | -20% | | | | 21% | | | | (949 279) | | | | 999 907 | |
| |
| Infrastructure | | | -11% | | | | 11% | | | | (868 197) | | | | 877 636 | | | | -11% | | | | 11% | | | | (701 638) | | | | 714 615 | |
| |
| Private equities | | | -16% | | | | 17% | | | | (296 750) | | | | 325 170 | | | | -16% | | | | 16% | | | | (231 117) | | | | 239 624 | |
| |
| Real estate | | | -9% | | | | 9% | | | | (173 010) | | | | 183 288 | | | | -5% | | | | 6% | | | | (77 462) | | | | 95 851 | |
| |
| Cash and fixed interest (1) | | | -13% | | | | 12% | | | | (1 343 540) | | | | 1 227 686 | | | | -13% | | | | 12% | | | | (1 338 766) | | | | 1 250 336 | |
| |
| | | | | | | | | | | (4 786 804) | | | | 4 871 443 | | | | | | | | | | | | (4 289 281) | | | | 4 358 977 | |
| |
| (1) | Cash and fixed interest includes exposure to interest rate and foreign currency sensitivity, including interest rate and inflation overlays on hedging instruments. |
(b) Liquidity risk
No external cashflows are generated from the Long Term Assets as deposits and withdrawals from the fixed rate notes result in a corresponding change in the investment held and do not expose QTC to liquidity risk arising from these daily movements. Interest on the fixed rate notes and distributions and fees on the Long Term Assets are capitalised.
The fixed rate notes provided to the State Government in exchange for the Long Term Assets have a term of 50 years. Due to the long term nature of this arrangement, no liquidity risk has been identified.
QUEENSLAND TREASURY CORPORATION ANNUAL REPORT 2013–14 47
NOTES TO AND FORMING PART OF THE FINANCIAL STATEMENTS
FOR THE YEAR ENDED 30 JUNE 2014
Financial instruments measured at fair value have been classified in accordance with the hierarchy described in AASB 13 Fair Value Measurement. The fair value hierarchy is categorised into three levels based on the observability of the inputs used.
Level 1 – quoted prices (unadjusted) in active markets that QTC can access at measurement date for identical assets and liabilities.
Level 2 – inputs other than quoted prices included within Level 1 that are observable for the asset or liability, either directly or indirectly.
Level 3 – inputs for the asset or liability that are not based on observable market data (unobservable inputs).
All financial instruments at fair value through profit or loss are valued by reference to either quoted market prices or observable inputs with no significant adjustments applied to instruments held and therefore no financial instruments at fair value through profit or loss are classified under Level 3.
Financial instruments classified as Level 1 consist primarily of short-term and tradable bank deposits and Commonwealth and semi-government bonds where an active market has been established. Financial instruments classified as Level 2 include non-actively traded corporate and semi-government bonds (including the QTC 2033 bond and the Capital Indexed bond), certain money market securities (commercial paper and promissory notes) and all derivatives. QTC’s onlendings and client deposits are included under Level 2.
Classification of instruments into fair value hierarchy levels is reviewed semi-annually and where there has been a significant change to the valuation inputs and a transfer is deemed to occur, this is effected at the end of the relevant reporting period. There were no transfers between Level 1 and Level 2 during the year ended 30 June 2014.
The principal inputs to determine the valuation of financial instruments are discussed below:
| § | | Interest rates – these are principally benchmark interest rates such as interbank rates and quoted interest rates in the swap, bond and futures markets. QTC applies mid-market pricing as a practical and consistent expedient for fair value measurements within the bid-ask spread. |
| § | | Counterparty credit spreads – adjustments are made to market prices for changes in the credit worthiness of the counterparty. |
| § | | Interest rate and foreign currency swaps – there are observable markets for both spot and forward contracts. |
��
| § | | Cross currency swaps – these instruments are typically held to maturity and valued using the original trading margin to the swap curve. |
| § | | Investments in unit trusts (Long Term Assets) – Units in trust funds are valued by QIC using fair value methodologies and adjusted for fees outstanding. QIC reports the net asset value based on the hard close unit price at measurement date. |
| | | | | | | | | | | | |
| |
| AS AT 30 JUNE 2014 | | QUOTED PRICES
LEVEL 1 $000 | | | OBSERVABLE INPUTS LEVEL 2 $000 | | | TOTAL
$000 | |
| |
| CAPITAL MARKETS OPERATIONS | | | | | | | | | | | | |
| |
| Financial assets | | | | | | | | | | | | |
| |
| Onlendings | | | - | | | | 85 609 405 | | | | 85 609 405 | |
| |
| Money market deposits | | | 2 674 416 | | | | - | | | | 2 674 416 | |
| |
| Discount securities | | | 4 711 814 | | | | 26 376 | | | | 4 738 190 | |
| |
| Commonwealth and state securities | | | 1 151 874 | | | | - | | | | 1 151 874 | |
| |
| Floating rate notes | | | 4 103 789 | | | | 1 829 | | | | 4 105 618 | |
| |
| Term deposits | | | - | | | | 729 476 | | | | 729 476 | |
| |
| Other investments | | | 327 315 | | | | 972 012 | | | | 1 299 327 | |
| |
| Total financial assets | | | 12 969 208 | | | | 87 339 098 | | | | 100 308 306 | |
| |
| | | | | | | | | | | | |
| |
| Financial liabilities | | | | | | | | | | | | |
| |
| Treasury notes | | | - | | | | 2 152 166 | | | | 2 152 166 | |
| |
| Commercial paper | | | - | | | | 2 223 522 | | | | 2 223 522 | |
| |
| AUD Bonds | | | 81 219 568 | | | | 1 903 790 | | | | 83 123 358 | |
| |
| Floating rate notes | | | - | | | | 4 433 159 | | | | 4 433 159 | |
| |
| Global AUD Bonds | | | 766 982 | | | | - | | | | 766 982 | |
| |
| Medium-term notes | | | - | | | | 1 104 502 | | | | 1 104 502 | |
| |
| Client deposits | | | - | | | | 4 456 718 | | | | 4 456 718 | |
| |
| Collateral held | | | - | | | | 73 196 | | | | 73 196 | |
| |
| Repurchase agreements | | | - | | | | 948 028 | | | | 948 028 | |
| |
| Other interest bearing liabilities | | | - | | | | 223 191 | | | | 223 191 | |
| |
| Total financial liabilities | | | 81 986 550 | | | | 17 518 272 | | | | 99 504 822 | |
| |
| | | | | | | | | | | | |
| |
| Derivative financial assets and liabilities | | | | | | | | | | | | |
| |
| Interest rate swaps | | | - | | | | (135 154) | | | | (135 154) | |
| |
| Cross currency swaps | | | - | | | | 68 817 | | | | 68 817 | |
| |
| Forward rate agreements | | | - | | | | 38 704 | | | | 38 704 | |
| |
| Foreign exchange contracts | | | - | | | | (64 651) | | | | (64 651) | |
| |
| Total derivatives (net) | | | - | | | | (92 284) | | | | (92 284) | |
| |
| | | | | | | | | | | | |
| |
| LONG TERM ASSETS | | | | | | | | | | | | |
| |
| Financial assets | | | | | | | | | | | | |
| |
| Investments in unit trusts – QIC | | | - | | | | 33 431 249 | | | | 33 431 249 | |
| |
48 QUEENSLAND TREASURY CORPORATION ANNUAL REPORT 2013–14
NOTES TO AND FORMING PART OF THE FINANCIAL STATEMENTS
FOR THE YEAR ENDED 30 JUNE 2014
| 20 | FAIR VALUE HIERARCHY CONTINUED |
| | | | | | | | | | | | |
| |
| AS AT 30 JUNE 2013 | | QUOTED PRICES
LEVEL 1 $000 | | | OBSERVABLE INPUTS
LEVEL 2 $000 | | | TOTAL
$000 | |
| |
| CAPITAL MARKETS OPERATIONS | | | | | | | | | | | | |
| |
| Financial assets | | | | | | | | | | | | |
| |
| Onlendings | | | - | | | | 79 118 832 | | | | 79 118 832 | |
| |
| Money market deposits | | | 1 717 477 | | | | - | | | | 1 717 477 | |
| |
| Discount securities | | | 7 616 756 | | | | 126 947 | | | | 7 743 703 | |
| |
| Commonwealth and state securities | | | 3 642 350 | | | | - | | | | 3 642 350 | |
| |
| Floating rate notes | | | 4 312 641 | | | | 1 528 | | | | 4 314 169 | |
| |
| Term deposits | | | - | | | | 552 626 | | | | 552 626 | |
| |
| Other investments | | | 125 102 | | | | 2 098 619 | | | | 2 223 721 | |
| |
| Total financial assets | | | 17 414 326 | | | | 81 898 552 | | | | 99 312 878 | |
| |
| | | | | | | | | | | | |
| |
| Financial liabilities | | | | | | | | | | | | |
| |
| Treasury notes | | | - | | | | 1 237 105 | | | | 1 237 105 | |
| |
| Commercial paper | | | - | | | | 4 013 185 | | | | 4 013 185 | |
| |
| AUD Bonds | | | 83 529 812 | | | | 1 637 925 | | | | 85 167 737 | |
| |
| Global AUD Bonds | | | 1 263 077 | | | | - | | | | 1 263 077 | |
| |
| Medium-term notes | | | - | | | | 1 056 418 | | | | 1 056 418 | |
| |
| Floating rate notes | | | - | | | | 350 884 | | | | 350 884 | |
| |
| Client deposits | | | - | | | | 4 501 397 | | | | 4 501 397 | |
| |
| Collateral held | | | - | | | | 552 721 | | | | 552 721 | |
| |
| Repurchase agreements | | | - | | | | 1 073 577 | | | | 1 073 577 | |
| |
| Other interest bearing liabilities | | | - | | | | 186 182 | | | | 186 182 | |
| |
| Total financial liabilities | | | 84 792 889 | | | | 14 609 394 | | | | 99 402 283 | |
| |
| | | | | | | | | | | | |
| |
| Derivative assets and derivative liabilities | | | | | | | | | | | | |
| |
| Interest rate swaps | | | - | | | | 97 963 | | | | 97 963 | |
| |
| Cross currency swaps | | | - | | | | 19 815 | | | | 19 815 | |
| |
| Forward rate agreements | | | - | | | | 86 378 | | | | 86 378 | |
| |
| Foreign exchange contracts | | | - | | | | 416 579 | | | | 416 579 | |
| |
| Total derivatives (net) | | | - | | | | 620 735 | | | | 620 735 | |
| |
| | | | | | | | | | | | |
| |
| LONG TERM ASSETS | | | | | | | | | | | | |
| |
| Financial assets | | | | | | | | | | | | |
| |
| Investments in unit trusts - QIC | | | - | | | | 29 767 721 | | | | 29 767 721 | |
| |
| 21 | CONCENTRATIONS OF BORROWINGS AND DEPOSITS |
There are no material concentrations of borrowings as these funds are raised from diversified sources through various facilities disclosed under funding facilities in note 25. Managed fund depositors are principally Queensland Government sector entities. These deposits are invested in either QTC’s Cash Fund or Working Capital Facility (11AM Fund) which have a large core of liquid investments. QTC maintains
regular contact with these depositors and therefore has a good knowledge of their forecast liquidity requirements.
Deposits for stock lending and repurchase agreements are invested in the Working Capital Facility (11AM Fund) which can be liquidated daily at no cost.
QUEENSLAND TREASURY CORPORATION ANNUAL REPORT 2013–14 49
NOTES TO AND FORMING PART OF THE FINANCIAL STATEMENTS
FOR THE YEAR ENDED 30 JUNE 2014
The following contingent liabilities existed at balance date:
| § | | With regard to certain cross border lease transactions, QTC has assumed responsibility for a significant portion of the transaction risk. If certain events occur, QTC could be liable to make additional payments under the transactions. However external advice and history to date indicate the likelihood of these events occurring is remote. In addition, QTC has provided certain guarantees and indemnities to various participants in the cross border lease transactions. Expert external advisors consider, that unless exceptional and extreme circumstances arise, QTC will not be required to make a significant payment under these guarantees and indemnities. |
| § | | QTC has provided guarantees relating to the trading activities of Ergon Energy, a Queensland Government owned corporation, to the value of $102 million (2013 $149 million) which are supported by a counter indemnity. |
| § | | QTC has provided guarantees to the value of $345 million (2013 $192 million) to support the commercial activities of various Queensland public sector entities. In each case, a counter indemnity has been obtained by QTC from the appropriate public sector entity. |
| § | | QTC can lend stock to support the liquidity of QTC bonds in the financial markets. At 30 June 2014 and 30 June 2013, no QTC inscribed stock was lent to other financial institutions. |
LEASE COMMITMENTS - QTC AS LESSEE
QTC has entered into the following commercial leases:
| § | | 123 Albert Street, Brisbane, for a period of seven years, with an option to surrender the lease on 1 April 2016 or 1 April 2018. Lease payments include a 4 per cent per annum escalation factor, and |
| § | | 2 Cycas Lane, Eagle Farm, for a period of four years with an option to extend for an additional year. The initial four year term included a six month rent free period to be taken at the start of the lease. |
The future minimum rentals payable under non-cancellable operating leases as at 30 June are as follows:
| | | | | | |
|
| | | 2014
$000 | | | 2013
$000 |
|
| Leases payable | | | | | | |
|
| Not longer than 1 year | | | 3 430 | | | 3 314 |
|
| Longer than 1 year but not longer than 5 years * | | | 2 855 | | | 6 285 |
|
| | | 6 285 | | | 9 599 |
|
* Excludes any payments due on early surrender of the lease.
LEASING ARRANGEMENTS – QTC AS LESSOR
Operating leases
QTC has entered into operating leases as lessor under the whole of government lease facility which consists mainly of buses and ferries. These non-cancellable leases have remaining terms of between 1 and 10 years.
Future minimum rentals receivable under non-cancellable operating leases as at 30 June are as follows:
| | | | | | |
|
| | | 2014
$000 | | | 2013
$000 |
|
| Leases receivable | | | | | | |
|
| Not longer than 1 year | | | 50 679 | | | 51 923 |
|
| Longer than 1 year but not longer than 5 years | | | 135 855 | | | 166 340 |
|
| Longer than 5 years | | | 14 802 | | | 34 829 |
|
| | | 201 336 | | | 253 092 |
|
Finance lease
QTC has entered into two leasing arrangements to lease bus depots to a public sector entity. The minimum lease term under both arrangements is 25 years with the second including an option to extend.
Finance charges include interest and fees associated with the leases. The leases are non-cancellable.
Details of the minimum rental receivable under the finance leases are as follows:
| | | | | | | | |
| |
| | | 2014
$000 | | | 2013
$000 | |
| |
| Lease receivable | | | | | | | | |
| |
| Not longer than 1 year | | | 6 816 | | | | 3 242 | |
| |
| Longer than 1 year but not longer than 5 years | | | 34 158 | | | | 14 141 | |
| |
| Longer than 5 years | | | 203 183 | | | | 80 737 | |
| |
| | | 244 157 | | | | 98 120 | |
| |
| Less amounts representing finance charges | | | (126 591) | | | | (52 405) | |
| |
| | | 117 566 | | | | 45 715 | |
| |
The present values of finance lease receivables are as follows:
| | | | | | | | |
| |
| | | 2014
$000 | | | 2013
$000 | |
| |
| Lease receivable | | | | | | | | |
| |
| Not longer than 1 year (1) | | | 6 515 | | | | 3 099 | |
| |
| Longer than 1 year but not longer than 5 years | | | 27 845 | | | | 11 284 | |
| |
| Longer than 5 years | | | 83 206 | | | | 31 332 | |
| |
| | | 117 566 | | | | 45 715 | |
| |
| (1) | A component of lease receivables is capitalised until 11 September 2014. |
50 QUEENSLAND TREASURY CORPORATION ANNUAL REPORT 2013–14
NOTES TO AND FORMING PART OF THE FINANCIAL STATEMENTS
FOR THE YEAR ENDED 30 JUNE 2014
FORWARD STARTING FIXED RATE LOAN COMMITMENTS
QTC has entered into fixed rate loan agreements with certain clients to lock in interest rates on all or part of future borrowing requirements.
QTC’s future borrowing commitments and the period in which funds are to be onlent are as follows:
| | | | | | | | |
| |
| | | 2014
$000 | | | 2013
$000 | |
| |
| Not longer than 1 year | | | 690 000 | | | | 1 143 782 | |
| |
| Longer than 1 year but not longer than 5 years | | | - | | | | 690 000 | |
| |
| | | 690 000 | | | | 1 833 782 | |
| |
OTHER COMMITMENTS
QTC entered into an arrangement to purchase and construct a bus depot that is leased to a public sector entity over a 25 year term. The lease commenced in 2013-14 and is for a 25 year term (refer note 23).
In the prior financial year, QTC’s commitments under this construction arrangement were as follows:
| | | | | | | | |
| |
| | | 2014
$000 | | | 2013
$000 | |
| |
| Not longer than 1 year | | | - | | | | 9 289 | |
| |
| | | - | | | | 9 289 | |
| |
| | | | | | | | | | | | | | | | |
| |
| FACILITY | | SIZE $M | | MATURITIES# | | CURRENCY | | | FACE VALUE
ON ISSUE
AUD M 2014 | | | FACE VALUE
ON ISSUE
AUD M 2013 | |
| |
| | | | | |
| Short term | | | | | | | | | | | | | | | | |
| |
| Domestic T-Notes | | Unlimited | | 7-365 days | | | AUD | | | | 2 164 | | | | 1 243 | |
| |
| Euro CP | | USD10 000 | | 1-364 days | | | Multicurrency | | | | 1 573 | | | | 2 004 | |
| |
| US CP | | USD10 000 | | 1-270 days | | | USD | | | | 752 | | | | 2 011 | |
| |
| | | | | |
| Long term | | | | | | | | | | | | | | | | |
| |
| AUD Bond | | Unlimited | | 12 benchmark lines 2014-2025 | | | AUD | | | | 64 928 | | | | 60 999 | |
| |
| | | | 4 AGG* lines 2015-2021 | | | AUD | | | | 8 916 | | | | 15 972 | |
| |
| | | | 1 non-benchmark line 2033 | | | AUD | | | | 800 | | | | 725 | |
| |
| | | | Capital indexed bond 2030 | | | AUD | | | | 834 | | | | 811 | |
| |
| | | | Floating rate notes 2014-2017 | | | AUD | | | | 4 422 | | | | 350 | |
| |
| Global AUD Bond | | AUD20 000 | | 2 AGG* lines 2015-2017 | | | AUD | | | | 703 | | | | 1 169 | |
| |
| Euro MTN | | USD10 000 | | Various | | | Multicurrency | | | | 1 101 | | | | 1 027 | |
| |
| US MTN | | USD10 000 | | Various | | | Multicurrency | | | | - | | | | - | |
| |
*AGG – Australian Government Guarantee
# maturities relate to current lines at 30 June 2014
QUEENSLAND TREASURY CORPORATION ANNUAL REPORT 2013–14 51
NOTES TO AND FORMING PART OF THE FINANCIAL STATEMENTS
FOR THE YEAR ENDED 30 JUNE 2014
| 26 | RELATED PARTY TRANSACTIONS |
A related party is one that controls, or is controlled by, or under common control with the entity.
(a) Ultimate controlling entity
The immediate controlling entity and ultimate controlling entity is the
Under Treasurer of Queensland as the Corporation Sole of QTC.
(b) Key management personnel
Disclosures relating to key management personnel are set out in note 27.
(c) Investments in associates and other companies
Details of investments in associates and other companies are set out in notes 29 and 30.
(d) Transactions with related parties
Transactions undertaken with related parties during the year include loans issued to public sector entities (refer note 11), the investment of cash surpluses (refer note 15), advisory, banking and company secretarial services. These transactions were in the normal course of business and on commercial terms and conditions. They exclude certain advisory and other services provided to Queensland Treasury and Trade, its associated
companies and other related parties at no charge.
QTC may from time to time indirectly hold a small amount of investments in QTC Bonds via its investments in unit trusts managed by QIC. QTC does not have direct legal ownership of these assets and therefore no adjustment has been made in the financial statements.
The nature and amount of any individually significant transactions with principal related parties are disclosed below.
All loans to Queensland Treasury Holdings Pty Ltd (QTH) have been fully repaid at balance date. Details of loans held during the financial year are as follows:
| § | | a loan to purchase the rights to licence fees receivable. The loan was fully repaid during the year (2013 market value $153.705 million). Repayments of $167.353 million (2013 $0.011 million) were made during the year. Interest and fees charged totalled $13.648 million (2013 $5.660 million). |
QTC has interests in other government related entities through various shareholdings. These entities hold deposits (refer note 15) and loans (refer note 11) with QTC that are provided on an arm’s length basis and are subject to QTC’s normal terms and conditions.
| 27 | KEY MANAGEMENT PERSONNEL |
Key management personnel are defined as those persons having authority and responsibility for planning, directing and controlling the activities of QTC, being members of the Board and the Executive Management Team.
(a) QTC’s Boards
QTC has designated its powers to its two boards, the Capital Markets Board and the Long Term Asset Advisory Board. Both boards are appointed by the Governor-in-Council, pursuant to section 10(2) of the Queensland Treasury Corporation Act 1988.
(b) Executive management
Executive management are those officers who are members of the Executive Management Team involved in the strategic direction, general management and control of the major activities of the business at an organisational level.
(c) Remuneration principles
Directors – Capital Markets Board
The process for reviewing Board remuneration requires any increase in the Board’s remuneration to be approved by the Treasurer and endorsed by Cabinet. Remuneration was last increased effective 1 July 2012.
Directors – Long Term Asset Advisory Board
No remuneration is payable to the directors of the Long Term Asset Advisory Board.
Executives and employees
QTC employees (including executive management) are employed on individual contracts and are appointed pursuant to the Queensland Treasury Corporation Act 1988.
QTC seeks to attract and retain quality employees with a range of skills and competencies critical to the ongoing success of QTC and the achievement of business strategy and objectives. QTC’s remuneration framework has been developed as part of an attraction and retention strategy and a mechanism to drive superior organisational performance. Further, the framework ensures rigor in pay outcomes appropriate to the (financial institutions) market and environment in which QTC operates and contributes to employee engagement.
The remuneration framework comprises both fixed and variable remuneration (in the form of an annual short-term incentive (STI) opportunity) which are approved by the QTC Board annually.
Fixed remuneration
The fixed remuneration of each QTC employee is reviewed in July each year and is benchmarked against remuneration data from the Financial Institutions Remuneration Group (FIRG). Fixed remuneration levels are set around the FIRG market median position, and experience, skills and performance are considered when determining the remuneration level of each employee.
Variable remuneration - short-term incentives
QTC’s variable remuneration framework provides an annual short-term incentive opportunity for eligible employees, aligned to financial year performance.
This opportunity is designed to differentiate and reward outstanding organisational, group and individual performance, and to align performance at these levels with incentive outcomes. It also aims to ensure market competitiveness, with ‘target’ STI outcomes aligned to the conservative market position and approved at Board level each year. For the 2013-14 year, STI payments will be made to eligible staff in September.
52 QUEENSLAND TREASURY CORPORATION ANNUAL REPORT 2013–14
NOTES TO AND FORMING PART OF THE FINANCIAL STATEMENTS
FOR THE YEAR ENDED 30 JUNE 2014
| 27 | KEY MANAGEMENT PERSONNEL CONTINUED |
(d) Remuneration by category
| | | | | | | | |
| |
| | | 2014 $ | | | 2013 $ | |
| |
| CAPITAL MARKETS OPERATIONS | | | | | | | | |
| |
| Directors | | | | | | | | |
| |
| Short-term employment benefits (1) | | | 373 543 | | | | 364 395 | |
| |
| Post-employment benefits (4) | | | 17 690 | | | | 19 095 | |
| |
| Total | | | 391 233 | | | | 383 490 | |
| |
| Executive management | | | | | | | | |
| |
| Short-term employment benefits (2) | | | 2 707 336 | | | | 2 642 901 | |
| |
| Long-term employment benefits (3) | | | 54 777 | | | | - | |
| |
| Post-employment benefits (4) | | | 99 355 | | | | 90 900 | |
| |
| Total | | | 2 861 468 | | | | 2 733 801 | |
| |
| (1) | Directors’ short-term benefits include board members’ fees, and in relation to the Chairman, also includes the provision of a car park. |
| (2) | Executive management personnel’s short-term benefits include wages, annual leave taken, short-term incentives and non-monetary benefits such as car parks and motor vehicle benefits and for the prior financial year, long-service leave. |
| (3) | Long-term employment benefits relates to long-service leave from 1 July 2013. |
| (4) | Post-employment benefits include superannuation contributions made by the Corporation. |
(i) Directors
Details of the nature and amount of each major element of the remuneration are as follows:
| | | | | | | | | | | | | | | | | | | | | | | | |
| |
| | | SHORT-TERM
EMPLOYMENT BENEFITS | | | POST-EMPLOYMENT
BENEFITS | | | TOTAL | |
| |
| | | 2014 $ | | | 2013 $ | | | 2014 $ | | | 2013 $ | | | 2014 $ | | | 2013 $ | |
| |
| Gerard Bradley - Chairman | | | 117 985 | | | | 117 670 | | | | 10 303 | | | | 10 110 | | | | 128 288 | | | | 127 780 | |
| |
| Alex Beavers - Deputy Chairman | | | 41 425 | | | | 41 431 | | | | - | | | | - | | | | 41 425 | | | | 41 431 | |
| |
| Stephen Bizzell (1) | | | 44 273 | | | | 15 480 | | | | - | | | | - | | | | 44 273 | | | | 15 480 | |
| |
| Gillian Brown | | | 40 209 | | | | 40 209 | | | | 3 719 | | | | 3 619 | | | | 43 928 | | | | 43 828 | |
| |
| Tonianne Dwyer (1) | | | 39 657 | | | | 14 460 | | | | 3 668 | | | | 1 302 | | | | 43 325 | | | | 15 762 | |
| |
| Neville Ide (2) | | | 46 950 | | | | 46 947 | | | | - | | | | - | | | | 46 950 | | | | 46 947 | |
| |
| Marian Micalizzi (3) | | | - | | | | 22 577 | | | | - | | | | 2 032 | | | | - | | | | 24 609 | |
| |
| Bill Shields | | | 43 044 | | | | 43 044 | | | | - | | | | - | | | | 43 044 | | | | 43 044 | |
| |
| Shauna Tomkins (3) | | | - | | | | 22 577 | | | | - | | | | 2 032 | | | | - | | | | 24 609 | |
| |
| Total | | | 373 543 | | | | 364 395 | | | | 17 690 | | | | 19 095 | | | | 391 233 | | | | 383 490 | |
| |
| (1) | Appointed 14 February 2013 |
| (3) | Resigned 31 January 2013 |
QUEENSLAND TREASURY CORPORATION ANNUAL REPORT 2013–14 53
NOTES TO AND FORMING PART OF THE FINANCIAL STATEMENTS
FOR THE YEAR ENDED 30 JUNE 2014
| 27 | KEY MANAGEMENT PERSONNEL CONTINUED |
(ii) Executive management
Details of the nature and amount of each major element of the remuneration of the executive management personnel are as follows:
| | | | | | | | | | | | | | | | | | | | |
| |
| | | SHORT-TERM
EMPLOYMENT BENEFITS (1) | | | POST-
EMPLOYMENT
BENEFITS | | | LONG-TERM
BENEFITS | | | TOTAL | |
| |
| | | BASE $ | | | NON-
MONETARY $ | | | $ | | | $ | | | $ | |
| |
| | | | | |
| 30 JUNE 2014 | | | | | | | | | | | | | | | | | | | | |
| |
| Chief Executive | | | 594 041 | | | | 18 581 | | | | 17 714 | | | | 15 562 | | | | 645 898 | |
| |
| Chief Operating Officer | | | 294 918 | | | | 8 519 | | | | 26 131 | | | | 8 346 | | | | 337 914 | |
| |
| Executive General Manager, Funding & Markets | | | 427 537 | | | | 8 519 | | | | 17 714 | | | | 11 294 | | | | 465 064 | |
| |
| Executive General Manager, Client Services | | | 285 879 | | | | 8 519 | | | | 17 714 | | | | 7 826 | | | | 319 938 | |
| |
| Executive General Manager, Business Services (2) | | | 119 219 | | | | 7 370 | | | | 7 619 | | | | 7 826 | | | | 142 034 | |
| |
| Acting Executive General Manager, Business Services (3) | | | 134 487 | | | | 4 992 | | | | 12 463 | | | | 3 923 | | | | 155 865 | |
| |
| (1) | Exclude at-risk performance payments |
| (3) | Appointed on 4 December 2013 |
| | | | | | | | | | | | | | | | | | | | |
| |
| | | SHORT-TERM
EMPLOYMENT BENEFITS (1) | | | POST-
EMPLOYMENT
BENEFITS | | | LONG-TERM
BENEFITS | | | TOTAL | |
| |
| | | | | |
| 30 JUNE 2013 | | | | | | | | | | | | | | | | | | | | |
| |
| Chief Executive | | | 575 939 | | | | 22 744 | | | | 16 360 | | | | - | | | | 615 043 | |
| |
| Chief Operating Officer | | | 279 291 | | | | 8 305 | | | | 24 133 | | | | - | | | | 311 729 | |
| |
| Executive General Manager, Funding & Markets | | | 414 174 | | | | 8 305 | | | | 17 793 | | | | - | | | | 440 272 | |
| |
| Executive General Manager, Client Services | | | 265 713 | | | | 8 305 | | | | 16 227 | | | | - | | | | 290 245 | |
| |
| Executive General Manager, Business Services | | | 266 054 | | | | 13 901 | | | | 16 387 | | | | - | | | | 296 342 | |
| |
| (1) | Exclude at-risk performance payments |
(iii) At-risk performance payments
The aggregate at-risk performance payments to all key executive management personnel are as follows:
| | | | | | | | |
| |
| | | YEAR OF ASSESSMENT | |
| |
| | | 2014 $ | | | 2013 $ | |
| |
| Executive management | | | 794 755 | | | | 780 170 | |
| |
(e) Other transactions
There were no loans to/from key management personnel during the financial year.
The external auditor (Auditor-General of Queensland) does not provide any consulting services to QTC. Details of amounts paid or payable to the auditor of QTC (GST exclusive) are shown below:
| | | | | | | | |
| |
| | | 2014 $ | | | 2013 $ | |
| |
| | |
| AUDIT SERVICES | | | | | | | | |
| |
| Audit of QTC | | | 375 000 | | | | 375 000 | |
| |
54 QUEENSLAND TREASURY CORPORATION ANNUAL REPORT 2013–14
NOTES TO AND FORMING PART OF THE FINANCIAL STATEMENTS
FOR THE YEAR ENDED 30 JUNE 2014
| 29 | INVESTMENT IN JOINT VENTURE ENTITY |
| | | | | | | | | | | | | | | | | | |
| |
| ENTITY | | PRINCIPAL ACTIVITIES | | ORDINARY SHARE
OWNERSHIP INTEREST | | | INVESTMENT
CARRYING AMOUNT | |
| |
| | | | | 2014 | | | 2013 | | | 2014 | | | 2013 | |
| |
| Local Government Infrastructure Services Pty Ltd | | Provides assistance to Queensland local governments in relation to infrastructure procurement | | | 50%* | | | | 50% | | | | - | | | | 50% | |
| |
*shares sold 1 July 2014
RESULTS OF JOINT VENTURE ENTITY
Summarised financial information of jointly controlled entity:
| | | | | | | | |
| |
| | | 2014
$000 | | | 2013 $000 | |
| |
| | |
| STATEMENT OF COMPREHENSIVE INCOME | | | | | | | | |
| |
| Revenues | | | 5 314 | | | | 9 743 | |
| |
| Expenses | | | (5 594) | | | | (8 701) | |
| |
| (Loss)/profit for the year | | | (280) | | | | 1 042 | |
| |
| | |
| BALANCE SHEET | | | | | | | | |
| |
| Current assets | | | 2 680 | | | | 13 253 | |
| |
| Non-current assets | | | 128 | | | | - | |
| |
| Total assets | | | 2 808 | | | | 13 253 | |
| |
| | |
| Current liabilities | | | 796 | | | | 10 961 | |
| |
| Total liabilities | | | 796 | | | | 10 961 | |
| |
| Net assets | | | 2 012 | | | | 2 292 | |
| |
QTC’s share of the joint venture entity’s results and retained profits, including movements in the carrying amount of the investment consists of:
| | | | | | | | |
| |
| | | 2014
$000 | | | 2013 $000 | |
| |
| | |
| SHARE OF POST-ACQUISITION RETAINED PROFITS | | | | | | | | |
| |
| Share of retained profits at 1 July | | | 1 307 | | | | 1 277 | |
| |
| Share of net (loss)/profit | | | (140) | | | | 521 | |
| |
| Dividend received | | | (261) | | | | (491) | |
| |
| Share of retained profits at 30 June | | | 906 | | | | 1 307 | |
| |
| Write-down of carrying value of investment (1) | | | (1 006) | | | | - | |
| |
| (Loss)/profit on investment | | | (100) | | | | 1 307 | |
| |
| | |
| MOVEMENTS IN CARRYING AMOUNT OF INVESTMENT | | | | | | | | |
| |
| Carrying amount at 1 July | | | 1 407 | | | | 1 377 | |
| |
| Share of net (loss)/profit | | | (140) | | | | 521 | |
| |
| Dividends received | | | (261) | | | | (491) | |
| |
| Writedown of carrying value of investment (1) | | | (1 006) | | | | - | |
| |
| Carrying amount at 30 June | | | - | | | | 1 407 | |
| |
| (1) | QTC’s 50% equity holdings in LGIS was transferred to LGAQ on 1 July 2014 at nominal consideration. The investment value has been written down to its recoverable value at 30 June 2014. |
QUEENSLAND TREASURY CORPORATION ANNUAL REPORT 2013–14 55
NOTES TO AND FORMING PART OF THE FINANCIAL STATEMENTS
FOR THE YEAR ENDED 30 JUNE 2014
| 30 | INVESTMENTS IN COMPANIES |
Investments in the following companies are held at cost:
| | | | | | | | | | | | | | | | | | |
| |
| NAME | | PRINCIPAL ACTIVITIES | | BENEFICIAL
INTEREST
2014 % | | | VOTING
RIGHTS
2014 % | | | BENEFICIAL
INTEREST
2013 % | | | VOTING
RIGHTS
2013 % | |
| |
| Queensland Treasury Holdings Pty Ltd (QTH) | | Holding company for a number of subsidiaries and strategic investments on behalf of the State of Queensland | | | 40 | | | | 24 | | | | 40 | | | | 24 | |
| |
| Queensland Lottery Corporation Pty Ltd (1) | | Holds the lottery licence and trade marks on behalf of the State of Queensland | | | 40 | | | | 24 | | | | 40 | | | | 24 | |
| |
| DBCT Holdings Pty Ltd (1) | | Owns & leases bulk coal port facilities in North Queensland | | | 40 | | | | 24 | | | | 40 | | | | 24 | |
| |
| Queensland Airport Holdings (Mackay) Pty Ltd (1) | | Owns the land for Mackay airport which it has leased under a 99 year lease arrangement | | | 40 | | | | 24 | | | | 40 | | | | 24 | |
| |
| Queensland Airport Holdings (Cairns) Pty Ltd (1) | | Owns the land for Cairns airport which it has leased under a 99 year lease arrangement | | | 40 | | | | 24 | | | | 40 | | | | 24 | |
| |
| Brisbane Port Holdings Pty Ltd (1) | | Holds the land for Brisbane Ports which it has leased under a 99 year lease arrangement | | | 40 | | | | 24 | | | | 40 | | | | 24 | |
| |
| City North Infrastructure Pty Ltd (1, 2) | | Manages the procurement of the Airport Link and Northern Busway projects | | | 40 | | | | 24 | | | | 20 | | | | 12 | |
| |
| Sunshine Locos Pty Ltd (3) | | Dormant | | | 50 | | | | 50 | | | | 50 | | | | 50 | |
| |
| Network Infrastructure Pty Ltd (1) | | Dormant | | | 40 | | | | 24 | | | | 40 | | | | 24 | |
| |
| (1) | Beneficial interest and voting rights in the Company are held indirectly through QTC’s holdings in QTH. |
| (2) | Remaining shares were cancelled on 1 July 2013 increasing the beneficial interest to 40 per cent and voting rights to 24 per cent. |
| (3) | Sunshine Locos Pty Ltd has not been consolidated into these statements due to its immaterial and dormant status. |
QTC pays dividends to the Queensland Government from time to time. A dividend of $120.0 million was provided for during the year (2013 nil).
| 32 | EVENTS SUBSEQUENT TO BALANCE DATE |
There are no other matters or circumstances which have arisen since the end of the financial year that have significantly affected or may significantly affect the operations of QTC, the results of those operations or the state of affairs of QTC in future years.
56 QUEENSLAND TREASURY CORPORATION ANNUAL REPORT 2013–14
CERTIFICATE OF THE QUEENSLAND TREASURY CORPORATION
The foregoing general purpose financial statements have been prepared in accordance with the Financial Accountability Act 2009 and other prescribed requirements.
The Directors draw attention to note 2(a) to the financial statements, which includes a statement of compliance with International Financial Reporting Standards.
We certify that in our opinion:
| | |
(i) | | the prescribed requirements for establishing and keeping the accounts have been complied with in all material respects |
| |
(ii) | | the foregoing annual financial statements have been drawn up so as to present a true and fair view of Queensland Treasury Corporation’s assets and liabilities, financial position and financial performance for the year ended 30 June 2014, and |
| |
(iii) | | the management report includes a fair review of the information required under article 3(2)(c) of the Law of January 11, 2008 on transparency requirements for issuers of securities on the Luxembourg Stock Exchange. |
Signed in accordance with a resolution of the directors.
| | | | |
 | | 
| | |
| G P BRADLEY | | P C NOBLE | | |
Chairman | | Chief Executive | | |
Brisbane
29 August 2014
QUEENSLAND TREASURY CORPORATION ANNUAL REPORT 2013–14 57
INDEPENDENT AUDITOR’S REPORT
To the Capital Markets Board of Queensland Treasury Corporation
REPORT ON THE FINANCIAL REPORT
I have audited the accompanying financial report of Queensland Treasury Corporation, which comprises the balance sheet as at 30 June 2014, the statement of comprehensive income, statement of changes in equity and statement of cash flows for the year then ended, notes comprising a summary of significant accounting policies and other explanatory information, and certificates given by the Chairman and Chief Executive.
The Board’s Responsibility for the Financial Report
The Capital Markets Board (the Board), as delegated by the Corporation Sole, is responsible for the preparation of the financial report that gives a true and fair view in accordance with prescribed accounting requirements identified in the Financial Accountability Act 2009 and the Financial and Performance Management Standard 2009, including compliance with Australian Accounting Standards. The Board’s responsibility also includes such internal control as the Board determines is necessary to enable the preparation of the financial report that gives a true and fair view and is free from material misstatement, whether due to fraud or error. In Note 2(a), the Board also states, in accordance with Accounting Standard AASB 101 Presentation of Financial Statements, that the financial statements comply with International Financial Reporting Standards.
Auditor’s Responsibility
My responsibility is to express an opinion on the financial report based on the audit. The audit was conducted in accordance with the Auditor-General of Queensland Auditing Standards, which incorporate the Australian Auditing Standards. Those standards require compliance with relevant ethical requirements relating to audit engagements and that the audit is planned and performed to obtain reasonable assurance about whether the financial report is free from material misstatement.
An audit involves performing procedures to obtain audit evidence about the amounts and disclosures in the financial report. The procedures selected depend on the auditor’s judgement, including the assessment of the risks of material misstatement of the financial report, whether due to fraud or error. In making those risk assessments, the auditor considers internal control relevant to the entity’s preparation of the financial report that gives a true and fair view in order to design audit procedures that are appropriate in the circumstances, but not for the purpose of expressing an opinion on the effectiveness of the entity’s internal control, other than in expressing an opinion on compliance with prescribed requirements. An audit also includes evaluating the appropriateness of accounting policies used and the reasonableness of accounting estimates made by the Board, as well as evaluating the overall presentation of the financial report including any mandatory financial reporting requirements approved by the Treasurer for application in Queensland.
I believe that the audit evidence obtained is sufficient and appropriate to provide a basis for my audit opinion.
Independence
The Auditor-General Act 2009 promotes the independence of the Auditor-General and all authorised auditors. The Auditor-General is the auditor of all Queensland public sector entities and can be removed only by Parliament.
The Auditor-General may conduct an audit in any way considered appropriate and is not subject to direction by any person about the way in which audit powers are to be exercised. The Auditor-General has for the purposes of conducting an audit, access to all documents and property and can report to Parliament matters which in the Auditor-General’s opinion are significant.
58 QUEENSLAND TREASURY CORPORATION ANNUAL REPORT 2013–14
Opinion
In accordance with s.40 of the Auditor-General Act 2009 –
(a) I have received all the information and explanations which I have required; and
(b) in my opinion –
| | (i) | the prescribed requirements in relation to the establishment and keeping of accounts have been complied with in all material respects; and |
| | (ii) | the financial report presents a true and fair view, in accordance with the prescribed accounting standards, of the transactions of the Queensland Treasury Corporation for the financial year 1 July 2013 to 30 June 2014 and of the financial position as at the end of that year; and |
| | (iii) | the financial report also complies with International Financial Reporting Standards as disclosed in Note 2(a). |
OTHER MATTERS – ELECTRONIC PRESENTATION OF THE AUDITED FINANCIAL REPORT
Those viewing an electronic presentation of these financial statements should note that audit does not provide assurance on the integrity of the information presented electronically and does not provide an opinion on any information which may be hyperlinked to or from the financial statements. If users of the financial statements are concerned with the inherent risks arising from electronic presentation of information, they are advised to refer to the printed copy of the audited financial statements to confirm the accuracy of this electronically presented information.
| | | | | | |
 | | | |  | | |
| A M GREAVES FCA FCPA | | | | | | |
Auditor-General of Queensland | | | | Queensland Audit Office | | |
| | | | Brisbane | | |
QUEENSLAND TREASURY CORPORATION ANNUAL REPORT 2013–14 59
MANAGEMENT REPORT
FOR THE YEAR ENDED 30 JUNE 2014
REVIEW OF OPERATIONS
QTC made an operating profit after tax for the year ended 30 June 2014 of AUD3,247.2 million consisting of the following operating segment results:
§ Capital Markets Operations
During the period from 1 July 2013 to 30 June 2014, QTC continued in its ordinary course of business as the State of Queensland’s central financing authority and corporate treasury services provider. The operating profit after tax for the year ended 30 June 2014 for the Capital Markets Operations segment was AUD119.2 million.
§ Long Term Assets
QTC holds a portfolio of assets which were transferred to QTC by the State Government under an administrative arrangement. These assets are the investments of QTC’s Long Term Assets segment and were accumulated to fund superannuation and other long-term obligations of the State such as insurance and long service leave. In return, QTC issued to the State fixed rate notes which has resulted in the State receiving a fixed rate of return on the notes, while QTC bears the impact of fluctuations in the value and returns on the asset portfolio.
The operating profit after tax for the Long Term Assets segment was AUD3,128.0 million with all major asset classes of the portfolio delivering positive outcomes for the year.
PRINCIPAL RISKS AND UNCERTAINTIES
Financial market conditions were relatively benign in 2013-14. However, there is a risk that markets have become complacent about future risks and that the current environment, characterised by low volatility, will not persist. It is uncertain what may trigger a rise in volatility, when this might occur, and how substantial it might be. There is also uncertainty around policy settings returning to normal including when official interest rates are raised both globally and in Australia. It is possible actions by the Federal Reserve may be a catalyst for a rise in volatility which if it were to be the case, would make QTC’s funding task more difficult, at least relative to the past financial year. However, QTC has established a long track record of attracting investors and raising funds in a cost effective manner across a variety of market conditions and as such, any change in market conditions in this manner is not expected to materially impact on QTC’s performance or its ability to fund the State’s borrowing requirement in 2014-15.
60 QUEENSLAND TREASURY CORPORATION ANNUAL REPORT 2013–14
Appendices
| | |
| CONTENTS | | |
Appendix A: Loans to clients | | 62 |
Appendix B: Statutory and mandatory disclosures | | 66 |
Appendix C: Glossary | | 67 |
Appendix D: Contacts | | 68 |
QUEENSLAND TREASURY CORPORATION ANNUAL REPORT 2013–14 61
APPENDIX A
LOANS TO CLIENTS
| | | | | | | | |
| |
| Loans to clients | | Total Debt Outstanding
(Market Value) 30 June 2013 $000 | | | Total Debt Outstanding
(Market Value) 30 June 2014 $000 | |
| |
| | |
BODIES WITHIN THE PUBLIC ACCOUNTS | | | | | | | | |
| |
CITEC | | | 15 516 | | | | 8 643 | |
| |
Department of Education Training and Employment | | | 65 869 | | | | 62 569 | |
| |
Department of National Parks Recreation Sport and Racing | | | 859 | | | | 204 | |
| |
Department of Science Information Technology Innovation and Arts | | | 6 390 | | | | 6 370 | |
| |
Department of State Development Infrastructure and Planning | | | 100 928 | | | | 90 290 | |
| |
Department of the Premier and Cabinet | | | 13 253 | | | | 11 759 | |
| |
Department of Transport and Main Roads – Main Roads | | | 1 009 027 | | | | 936 367 | |
| |
Department of Transport and Main Roads – Queensland Transport | | | 102 749 | | | | 105 208 | |
| |
Public Works – Department of Housing and Public Works | | | 19 018 | | | | 16 939 | |
| |
QFleet | | | 179 684 | | | | 129 362 | |
| |
Queensland Health | | | 93 738 | | | | 82 830 | |
| |
Queensland Treasury and Trade | | | 36 651 962 | | | | 41 482 531 | |
| |
Total | | | 38 258 994 | | | | 42 933 073 | |
| |
| | |
COOPERATIVE HOUSING SOCIETIES | | | | | | | | |
| |
Cooperative Housing Societies | | | 1 138 | | | | 1 027 | |
| |
Total | | | 1 138 | | | | 1 027 | |
| |
| | |
GOVERNMENT OWNED CORPORATIONS | | | | | | | | |
| |
CS Energy Ltd | | | 892 400 | | | | 925 178 | |
| |
ENERGEX Limited | | | 6 347 474 | | | | 6 706 288 | |
| |
Ergon Energy Corporation Limited | | | 5 317 572 | | | | 5 396 157 | |
| |
Eungella Water Pipeline Pty Ltd | | | 26 305 | | | | 25 028 | |
| |
Gladstone Ports Corporation | | | 500 167 | | | | 507 053 | |
| |
North Queensland Bulk Ports Corporation Limited | | | 69 613 | | | | 69 622 | |
| |
Port of Townsville Limited | | | 62 194 | | | | 89 088 | |
| |
Powerlink | | | 4 364 233 | | | | 4 422 729 | |
| |
Stanwell Corporation Limited | | | 852 847 | | | | 639 161 | |
| |
SunWater | | | 234 780 | | | | 273 221 | |
| |
Total | | | 18 667 584 | | | | 19 053 525 | |
| |
| | |
LOCAL GOVERNMENTS | | | | | | | | |
| |
Balonne Shire Council | | | 4 328 | | | | 4 196 | |
| |
Banana Shire Council | | | 13 713 | | | | 13 127 | |
| |
Barcaldine Regional Council | | | 3 201 | | | | 3 034 | |
| |
Barcoo Shire Council | | | 128 | | | | 103 | |
| |
Blackall Tambo Regional Council | | | 4 819 | | | | 2 420 | |
| |
Brisbane City Council | | | 2 296 355 | | | | 2 917 889 | |
| |
Bulloo Shire Council | | | 4 131 | | | | 5 572 | |
| |
Bundaberg Regional Council | | | 64 136 | | | | 59 268 | |
| |
Burdekin Shire Council | | | 7 687 | | | | 8 110 | |
| |
Cairns Regional Council | | | 100 399 | | | | 98 405 | |
| |
Carpentaria Shire Council | | | 5 219 | | | | 5 211 | |
| |
Cassowary Coast Regional Council | | | 27 666 | | | | 25 850 | |
| |
Central Highlands Regional Council | | | 59 263 | | | | 59 659 | |
| |
Charters Towers Regional Council | | | 173 | | | | 86 | |
| |
62 QUEENSLAND TREASURY CORPORATION ANNUAL REPORT 2013–14
APPENDIX A
LOANS TO CLIENTS CONTINUED
| | | | | | | | |
| |
| Loans to clients | | Total Debt Outstanding
(Market Value) 30 June 2013 $000 | | | Total Debt Outstanding
(Market Value) 30 June 2014 $000 | |
| |
| | |
LOCAL GOVERNMENTS CONTINUED | | | | | | | | |
| |
Cloncurry Shire Council | | | 15 207 | | | | 15 405 | |
| |
Cook Shire Council | | | 4 153 | | | | 5 038 | |
| |
Diamantina Shire Council | | | 1 499 | | | | 1 156 | |
| |
Douglas Shire Council | | | - | | | | 2 617 | |
| |
Etheridge Shire Council | | | 1 924 | | | | 1 402 | |
| |
Flinders Shire Council | | | - | | | | 1 004 | |
| |
Fraser Coast Regional Council | | | 127 679 | | | | 122 701 | |
| |
Gladstone Regional Council | | | 190 416 | | | | 190 813 | |
| |
Gold Coast City Council | | | 841 216 | | | | 882 090 | |
| |
Gympie Regional Council | | | 28 021 | | | | 28 212 | |
| |
Ipswich City Council | | | 428 649 | | | | 456 713 | |
| |
Isaac Regional Council | | | 42 590 | | | | 42 502 | |
| |
Kowanyama Aboriginal Council | | | - | | | | 2 019 | |
| |
Livingstone Shire Council | | | - | | | | 84 695 | |
| |
Local Government Association of Queensland | | | 5 320 | | | | 7 246 | |
| |
Lockyer Valley Regional Council | | | 28 731 | | | | 36 070 | |
| |
Logan City Council | | | 204 952 | | | | 247 183 | |
| |
Longreach Regional Council | | | 8 234 | | | | 9 034 | |
| |
Mackay Regional Council | | | 247 108 | | | | 262 600 | |
| |
Maranoa Regional Council | | | 19 333 | | | | 23 476 | |
| |
Mareeba Shire Council | | | - | | | | 6 523 | |
| |
McKinlay Shire Council | | | 1 159 | | | | 575 | |
| |
Moreton Bay Regional Council | | | 418 364 | | | | 446 535 | |
| |
Mount Isa City Council | | | 28 564 | | | | 33 869 | |
| |
Murweh Shire Council | | | 4 707 | | | | 4 040 | |
| |
Noosa Shire Council | | | - | | | | 48 056 | |
| |
North Burnett Regional Council | | | 4 274 | | | | 3 843 | |
| |
Northern Peninsula Area Regional Council | | | 1 926 | | | | 2 405 | |
| |
Paroo Shire Council | | | 2 584 | | | | 6 075 | |
| |
Redland City Council | | | 69 305 | | | | 66 724 | |
| |
Richmond Shire Council | | | 1 013 | | | | 439 | |
| |
Rockhampton Regional Council | | | 253 549 | | | | 171 244 | |
| |
Scenic Rim Regional Council | | | 11 514 | | | | 15 556 | |
| |
South Burnett Regional Council | | | 13 529 | | | | 38 076 | |
| |
Southern Downs Regional Council | | | 30 583 | | | | 35 149 | |
| |
Sunshine Coast Regional Council | | | 282 365 | | | | 249 224 | |
| |
Tablelands Regional Council | | | 8 978 | | | | 6 375 | |
| |
Toowoomba Regional Council | | | 165 199 | | | | 172 533 | |
| |
Torres Shire Council | | | 1 844 | | | | 1 580 | |
| |
Torres Strait Island Regional Council | | | 510 | | | | 476 | |
| |
Townsville City Council | | | 393 473 | | | | 388 311 | |
| |
Western Downs Regional Council | | | 69 126 | | | | 74 854 | |
| |
Whitsunday Regional Council | | | 80 294 | | | | 77 635 | |
| |
Winton Shire Council | | | 3 407 | | | | 3 373 | |
| |
Total | | | 6 632 514 | | | | 7 478 377 | |
| |
QUEENSLAND TREASURY CORPORATION ANNUAL REPORT 2013–14 63
APPENDIX A
LOANS TO CLIENTS CONTINUED
| | | | | | | | |
| |
| Loans to clients | | Total Debt Outstanding
(Market Value) 30 June 2013 $000 | | | Total Debt Outstanding
(Market Value) 30 June 2014 $000 | |
| |
| | |
STATUTORY BODIES | | | | | | | | |
| |
Grammar schools | | | | | | | | |
| |
Brisbane Girls’ Grammar School | | | 19 541 | | | | 31 724 | |
| |
Brisbane Grammar School | | | 12 676 | | | | 11 196 | |
| |
Ipswich Girls Grammar School | | | 22 971 | | | | 22 661 | |
| |
Ipswich Grammar School | | | 2 454 | | | | 1 216 | |
| |
Rockhampton Girls Grammar School | | | 4 324 | | | | 4 279 | |
| |
Rockhampton Grammar School | | | 12 186 | | | | 20 344 | |
| |
Toowoomba Grammar School | | | 8 186 | | | | 7 652 | |
| |
Townsville Grammar School | | | 16 423 | | | | 15 436 | |
| |
Queensland Water Entities | | | | | | | | |
| |
Queensland Bulk Water Supply Authority | | | 10 020 790 | | | | 10 530 999 | |
| |
Queensland Urban Utilities | | | 537 963 | | | | 599 418 | |
| |
Unitywater | | | 322 516 | | | | 412 397 | |
| |
River Improvement Trusts | | | | | | | | |
| |
Pioneer River Improvement Trust | | | 38 | | | | - | |
| |
Universities | | | | | | | | |
| |
Griffith University | | | 49 946 | | | | 36 451 | |
| |
James Cook University | | | 49 682 | | | | 82 958 | |
| |
Queensland University of Technology | | | 77 633 | | | | 80 689 | |
| |
Sunshine Coast University | | | 15 537 | | | | 14 171 | |
| |
University of Southern Queensland | | | 13 460 | | | | 12 181 | |
| |
Water Boards | | | | | | | | |
| |
Avondale Water Board | | | 88 | | | | - | |
| |
Fernlee Water Authority | | | 940 | | | | 946 | |
| |
Gladstone Area Water Board | | | 222 895 | | | | 240 074 | |
| |
Glamorgan Vale Water Board | | | 40 | | | | - | |
| |
Grevillea Water Pty Ltd | | | 162 | | | | 159 | |
| |
Kelsey Creek Water Board | | | 454 | | | | 225 | |
| |
Mount Isa Water Board | | | 2 579 | | | | 4 880 | |
| |
Pioneer Valley Water Board | | | 1 075 | | | | 611 | |
| |
Riversdale-Murray Valley Management Board | | | 36 | | | | - | |
| |
Water Supply Boards | | | | | | | | |
| |
Bollon South Water Authority | | | 551 | | | | 482 | |
| |
Bollon West Water Authority | | | 1 457 | | | | 1 362 | |
| |
Ingie Water Authority | | | 337 | | | | 305 | |
| |
Other Statutory Bodies | | | | | | | | |
| |
Economic Development Queensland | | | 68 862 | | | | 57 616 | |
| |
Mt Gravatt Showgrounds Trust | | | 33 | | | | - | |
| |
National Trust of Queensland | | | 817 | | | | - | |
| |
Queensland Rail Limited | | | 3 340 998 | | | | 3 351 674 | |
| |
Queensland Rural Adjustments Authority | | | 5 174 | | | | 3 555 | |
| |
South Bank Corporation | | | 25 591 | | | | 13 673 | |
| |
Stadiums Queensland | | | 121 248 | | | | 121 233 | |
| |
Total | | | 14 979 661 | | | | 15 680 569 | |
| |
64 QUEENSLAND TREASURY CORPORATION ANNUAL REPORT 2013–14
APPENDIX A
LOANS TO CLIENTS CONTINUED
| | | | | | | | |
| |
| Loans to clients | | Total Debt Outstanding (Market Value) 30 June 2013 $000 | | | Total Debt Outstanding (Market Value) 30 June 2014 $000 | |
| |
| | |
SUNCORP-METWAY LTD | | | | | | | | |
| |
Suncorp Metway Facility | | | 1 138 | | | | 856 | |
| |
Total | | | 1 138 | | | | 856 | |
| |
| | |
QTC RELATED ENTITIES | | | | | | | | |
| |
DBCT Holdings Pty Ltd | | | 167 474 | | | | 157 520 | |
| |
Queensland Treasury Holdings P/L | | | 153 705 | | | | - | |
| |
Total | | | 321 179 | | | | 157 520 | |
| |
| | |
OTHER BODIES | | | | | | | | |
| |
Aviation Australia Pty Ltd | | | 2 094 | | | | 1 895 | |
| |
Aspire Schools Financing Services | | | 192 376 | | | | 229 229 | |
| |
State Schools | | | 3 246 | | | | 2 548 | |
| |
Royal National Agricultural Industry Association of Queensland | | | 59 150 | | | | 71 028 | |
| |
Total | | | 256 866 | | | | 304 699 | |
| |
GRAND TOTAL | | | 79 119 074 | | | | 85 609 647 | |
| |
QUEENSLAND TREASURY CORPORATION ANNUAL REPORT 2013–14 65
APPENDIX B
STATUTORY AND MANDATORY DISCLOSURES
QTC is required to make various disclosures in its Annual Report. QTC is also required to make various disclosures on the Queensland Government’s Open Data website (qld.gov.au/data) in lieu of inclusion in its Annual Report. This Appendix sets out those mandatory disclosure statements that are not included elsewhere in the report or made available on the Open Data website.
INFORMATION SYSTEMS AND RECORD KEEPING
During the year, QTC continued its compliance with the provisions of the Public Records Act 2002, and its implementation of the Information Standard 40: Recordkeeping and Information Standard 31: Retention and Disposal of Public Records.
QTC has continued its work with State Archives on the development of a QTC-specific Local Retention and Disposal Schedule, and provides training to staff in the appropriate management of public records in all formats, including email.
During the year, QTC’s record keeping systems and capabilities largely continued unchanged. QTC is investigating the procurement and implementation of an electronic document management system for implementation in the 2014-15 year.
PUBLIC SECTOR ETHICS ACT
QTC provides the following information pursuant to obligations under section 23 of the Public Sector Ethics Act 1994 (Qld) to report on action taken to comply with certain sections of the Act.
QTC employees are required to comply with QTC’s Code of Conduct for employees, which aligns with the ethics principles and values in the Public Sector Ethics Act 1994, as well as the Code of Ethics and Code of Conduct established by the Australian Financial Markets Association of which QTC is a member. Both codes are available to employees via QTC’s intranet. Copies of these codes can be inspected by contacting QTC’s Human Resources Group (see Appendix D for contact details). Appropriate education and training about the code of conduct has been provided to QTC staff.
QTC’s corporate governance policies and practices ensure that QTC:
| § | | acts ethically, within appropriate law, policy and convention, and |
| § | | addresses the systems and processes necessary for the proper direction and management of its business and affairs. |
QTC is committed to:
| § | | observing high standards of integrity and fair-dealing in the conduct of its business, and |
| § | | acting with due care, diligence and skill. |
QTC’s Compliance Policy requires that QTC and all employees comply with the letter and the spirit of all relevant laws and regulations, industry standards, and relevant government policies, as well as QTC’s own policies and procedures.
REMUNERATION: BOARD AND COMMITTEE
For the year ending 30 June 2014, the remuneration and committee fees of the QTC Capital Market Board members (excluding superannuation contributions and non-monetary benefits) were as follows:
| | | | | | | | | | | | |
| | | | | | |
BOARD | | | | | | | | COMMITTEE | | | | |
| | | | | | |
Chairperson | | | $100,527 | | | | | Chairperson | | | $6,658 | |
| | | | | | |
Member | | | $33,551 | | | | | Member | | | $5,152 | |
| | | | | | |
The total remuneration payments made to the members of the QTC Capital Market Board was $391,233 and the total on-costs (including travel, accommodation, and hiring of motor vehicles for the members) was $45,961.
No payments in relation to remuneration or on-costs (including travel, accommodation, and hiring of motor vehicles for the members) were made to members of the Long Term Asset Advisory Board in the year ending 30 June 2014.
RELATED ENTITIES
The related entities in Note 30 (except Sunshine Locos Pty Ltd) are consolidated into Queensland Treasury’s financial report.
66 QUEENSLAND TREASURY CORPORATION ANNUAL REPORT 2013–14
APPENDIX C
GLOSSARY
Australian Government Guarantee (AGG): Also known as the Commonwealth Government Guarantee. In response to the global financial crisis, on 25 March 2009, the Australian Government provided a time-limited, voluntary guarantee over existing and new Australian state and territory government borrowing. On 16 June 2009, the Queensland Government took up the guarantee on all existing QTC AUD denominated benchmark bond lines (global and domestic) with a maturity date of between 12 months and 180 months (1-15 years). The RBA approved QTC’s application on 11 December 2009. The AGG was withdrawn for new borrowings after 31 December 2010.
Basis point: One hundredth of one per cent (0.01%).
Bond: A financial instrument where the borrower agrees to pay the investor a rate of interest for a fixed period of time. A typical bond will involve regular interest payments and a return of principal at maturity.
Commonwealth Government Guarantee (CGG): See Australian Government Guarantee above.
CP (commercial paper): A short-term money market instrument issued at a discount with the full face value repaid at maturity. CP can be issued in various currencies with a term to maturity of less than one year.
Credit rating: Measures a borrower’s creditworthiness and provides an international framework for comparing the credit quality of issuers and rated debt securities. Rating agencies allocate three kinds of ratings: issuer credit ratings, long-term debt and short-term debt. Issuer credit ratings are among the most widely watched. They measure the creditworthiness of the borrower including its capacity and willingness to meet financial obligations. QTC has a strong rating from two rating agencies—Standard & Poor’s, and Moody’s.
Distribution group: A group of financial intermediaries who market and make prices in QTC’s debt instruments.
GOC: Government-owned corporation.
Issue price: The price at which a new security is issued in the primary market.
Liquid: Markets or instruments are described as being liquid,
and having depth, if there are enough buyers and sellers to absorb sudden shifts in supply and demand without price distortions.
Market value: The price at which an instrument can be purchased or sold in the current market.
MTN (Medium-Term Note): A financial debt instrument that can be structured to meet an investor’s requirements in regards to interest rate basis, currency and maturity. MTNs usually have maturities between 9 months and 30 years.
QTC: Queensland Treasury Corporation.
RBA: Reserve Bank of Australia.
T-Note (Treasury Note): A short-term money market instrument issued at a discount with the full face value repaid at maturity. T-Notes are issued in Australian dollars with a term to maturity of less than 1 year.
QUEENSLAND TREASURY CORPORATION ANNUAL REPORT 2013–14 67
APPENDIX D
CONTACTS
QUEENSLAND TREASURY CORPORATION
| | |
| Level 6, 123 Albert Street |
| Brisbane Queensland Australia |
|
| GPO Box 1096 |
| Brisbane Queensland |
| Australia 4001 |
| |
| Telephone: | | +61 7 3842 4600 |
| Facsimile: | | +61 7 3221 4122 |
| Email: | | enquiry@qtc.com.au |
| Internet: | | www.qtc.com.au |
Queensland Treasury Corporation’s annual and half-yearly reports (ISSN 1837-1256 print; ISSN 1837-1264 online) are available on QTC’s website at www.qtc.com.au/qtc/public/annual-reports. If you would like a copy of a report posted to you, please call QTC’s Corporate Affairs group on +61 7 3842 4685.
If you would like to comment on a report, please complete the online enquiry form located on our website.
| | |
|
| | | Telephone |
|
Reception | | +61 7 3842 4600 |
|
Executive Office | | +61 7 3842 4611 |
|
Business Services | | +61 7 3842 4872 |
|
Client Services | | +61 7 3842 4901 |
|
Corporate Services | | +61 7 3842 4833 |
|
Funding & Markets | | +61 7 3842 4647 |
|
Strategic Alignment & Implementation | | +61 7 3842 4736 |
|
Stock Registry (Link Market Services Ltd) | | 1800 777 166 |
|

QTC is committed to providing accessible services to Queensland residents from culturally and linguistically diverse backgrounds. If you have difficulty understanding this report, please contact QTC’s Corporate Affairs group on +61 7 3842 4685 and we will arrange for an interpreter to assist you.
68 QUEENSLAND TREASURY CORPORATION ANNUAL REPORT 2013–14
APPENDIX D
CONTACTS CONTINUED
DEALER PANELS AS AT 30 JUNE 2014
Note: actual dealer entities may vary depending on the facility and location of the dealer.
| | |
|
| DOMESTIC AND GLOBAL AUD BOND | | Telephone |
| FACILITY DISTRIBUTION GROUP | | |
|
| Australia and New Zealand | | |
| Banking Group Ltd | | |
|
| Domestic (Australia) | | +61 2 8037 0220 |
|
| Global (London) | | +44 203 229 2070 |
|
| Bank of America Merrill Lynch | | |
|
| Domestic (Australia) | | +61 2 9226 5570 |
|
| Global (London) | | +44 207 995 6750 |
|
| BNP Paribas | | |
|
| Domestic (Australia) | | +61 2 9025 5011 |
|
| Global (London) | | +44 207 595 8231 |
|
| Citigroup Global Markets Australia Ltd | | |
|
| Domestic (Australia) | | +61 2 8225 6450 |
|
| Global (London) | | +44 207 986 9521 |
|
| Commonwealth Bank of Australia | | |
|
| Domestic (Australia) | | +61 2 9117 0020 |
|
| Global (London) | | +44 207 329 6444 |
|
| Deutsche Capital Markets Australia1 | | |
|
| Domestic (Australia) | | +61 2 8258 1444 |
|
| Global (London) | | +44 207 547 1931 |
|
| HSBC | | |
|
| Domestic (Australia) | | +61 2 9255 2059 |
|
| Global (London) | | +44 207 991 7662 |
|
| JP Morgan | | |
|
| Domestic (Australia) | | +61 2 9003 7988 |
|
| Global (London) | | +44 207 742 1829 |
|
| National Australia Bank Ltd | | |
|
| Domestic (Australia) | | +61 2 9295 1166 |
|
| Global (London) | | +44 207 796 4761 |
|
| Nomura International Plc | | |
|
| Domestic (Australia) | | +61 2 8062 8000 |
|
| Global (London) | | +44 207 103 6631 |
|
| RBC Capital Markets | | |
|
| Domestic (Australia) | | +61 2 9033 3222 |
|
| Global (London) | | +44 207 029 0094 |
|
| TD Securities | | |
|
| Domestic (Singapore) | | 1800 646 497 |
|
| Global (London) | | +44 207 628 4334 |
|
| UBS Investment Bank2 | | |
|
| Domestic (Australia) | | +61 2 9324 2222 |
|
| Global (London) | | +44 207 567 3645 |
|
| Westpac Banking Corporation | | |
|
| Domestic (Australia) | | +61 2 8204 2711 |
|
| Global (London) | | +44 207 7621 7620 |
|
| | |
|
| PANEL MEMBERS | | Telephone |
|
| QTC Treasury Note Facility Dealer Panel | | |
|
Australia and New Zealand Banking Group Ltd | | +61 2 8037 0360 |
|
Commonwealth Bank of Australia Ltd (Sydney) | | +61 2 9117 0020 |
|
| Deutsche Bank AG (Sydney) | | +61 2 8258 2288 |
|
| National Australia Bank Ltd (Sydney) | | +61 2 9295 1133 |
|
| Westpac Banking Corporation Ltd (Sydney) | | +61 2 8204 2744 |
|
| US Commercial Paper Facility Dealer Panel | | |
|
| Bank of America Merrill Lynch | | +1 646 855 6333 |
|
| Citigroup Global Markets Inc (New York) | | +1 212 723 6252 |
|
| Deutsche Bank Securities (New York) | | +1 212 250 7179 |
|
| UBS Securities | | +1 203 719 7014 |
|
| Multicurrency Euro Commercial Paper Facility Dealer Panel |
|
| Bank of America Merrill Lynch | | +44 207 996 8904 |
|
| Barclays Bank Plc (London) | | +44 207 773 7863 |
|
| Citigroup International Plc (Hong Kong)3 | | +852 2501 2974 |
|
| Commonwealth Bank of Australia | | +61 2 9117 0047 |
|
| Deutsche Bank AG (Singapore) | | +65 6883 0808 |
|
National Australia Bank Limited (Hong Kong and London) | | +852 2526 5892 |
|
| UBS Ltd (London) | | +44 207 329 0203 |
|
| Multicurrency Euro Medium-Term Note Facility Dealer Panel4 |
|
Includes all Domestic and Global AUD Bond Facility Distribution Group | | |
|
| Multicurrency US Medium-Term Note Facility Dealer Panel |
|
Australia and New Zealand Banking Group Limited | | +1 212 801 9160 |
|
| Bank of America Merrill Lynch | | +1 646 855 8032 |
|
| BNP Paribas | | +1 212 471 8240 |
|
| Citigroup (New York) | | +1 212 723 6171 |
|
| Commonwealth Bank of Australia | | +44 207 329 6444 |
|
| Daiwa Capital Markets Europe Limited | | +61 3 9916 1313 |
|
| Deutsche Bank Securities Inc (New York)3 | | +1 212 250 6801 |
|
| HSBC | | +1 212 525 4688 |
|
| JP Morgan | | +1 212 834 4533 |
|
| National Australia Bank (New York) | | +1 212 916 9677 |
|
| RBC Capital Markets (New York) | | +1 212 858 8343 |
|
| TD Securities | | +1 212 827 7199 |
|
| UBS Investment Bank | | +1 203 719 1830 |
|
1 Lead Manager – United States
2 Lead Manager – Europe
3 Lead Arranger
4 Lead Arranger – UBS Ltd (London)
QUEENSLAND TREASURY CORPORATION ANNUAL REPORT 2013–14 69
APPENDIX D
CONTACTS CONTINUED
ISSUING AND PAYING AGENTS
| | | | | | | | |
|
| | | Contact | | Telephone | | Facsimile | | Email |
|
| AUD Treasury Notes | | Help Desk | | 1300 362 257 | | +61 2 9256 0456 | | cad@asx.com.au |
| Austraclear Services Ltd Sydney | | | | | | | | |
|
| AUD Domestic Bonds | | Markings/Transfers | | +61 2 8571 6488 | | +61 2 9287 0315 | | qtcops@linkmarketservices.com.au |
| Link Market Services Ltd | | | | | | | | |
|
| AUD Global Bonds | | Client Services | | 1 800 735 7777 | | +1 615 866 3887 | | dwac.processing@db.com |
| Deutsche Bank Trust | | | | Option #5 | | | | |
| Company Americas | | | | | | | | |
|
| Euro Commercial Paper | | Client Services | | +44 207 545 8000 | | +44 207 547 6149 | | tss-gds.row@db.com |
| Deutsche Bank AG, London | | | | | | | | |
|
| US Commercial Paper | | Client Services | | +1 866 770 0355 | | +1 732 578 2655 | | mmi.operations@db.com |
| Deutsche Bank Trust | | | | | | | | |
| Company Americas | | | | | | | | |
|
| Euro Medium-Term Notes | | Client Services | | +44 207 545 8000 | | +44 207 547 6149 | | tss-gds.row@db.com |
| Deutsche Bank AG, London | | | | | | | | |
|
| US Medium-Term Notes | | Client Services | | +1 866 797 2808 | | +1 212 461 4450 | | mtn.operations@db.com |
| Deutsche Bank Trust | | | | | | | | |
| Company Americas | | | | | | | | |
|
70 QUEENSLAND TREASURY CORPORATION ANNUAL REPORT 2013–14
QUEENSLAND TREASURY CORPORATION ANNUAL REPORT 2013–14 71


Level 6 123 Albert Street Brisbane
GPO Box 1096 Brisbane
Queensland Australia 4001
Telephone: +61 7 3842 4600
Facsimile: +61 7 3221 4122
www.qtc.com.au
© Queensland Treasury Corporation 2014