EXHIBIT (f)(ii)
The 2015 Review of State Finances.
FORWARD-LOOKING STATEMENTS
This exhibit contains forward-looking statements. Statements that are not historical facts, including statements about the State of Queensland’s (the “State” or “Queensland”) beliefs and expectations, are forward-looking statements. These statements are based on current plans, budgets, estimates and projections and therefore you should not place undue reliance on them. The words “believe”, “may”, “will”, “should”, “estimate”, “continue”, “anticipate”, “intend”, “expect”, “forecast” and similar words are intended to identify forward-looking statements. Forward-looking statements speak only as of the date they are made, and neither the Queensland Treasury Corporation nor the State undertake any obligation to update publicly any of them in light of new information or future events.
Forward-looking statements are based on current plans, estimates and projections and, therefore, undue reliance should not be placed on them. Although the Queensland Treasury Corporation and the State believe that the beliefs and expectations reflected in such forward-looking statements are reasonable, no assurance can be given that such beliefs and expectations will prove to have been correct. Forward-looking statements involve inherent risks and uncertainties. We caution you that actual results may differ materially from those contained in any forward-looking statements.
A number of important factors could cause actual results to differ materially from those expressed in any forward-looking statement. Factors that could cause the actual outcomes to differ materially from those expressed or implied in forward-looking statements include:
| | • | | the international and Australian economies, and in particular the rates of growth (or contraction) of the State’s major trading partners; |
| | • | | the effects, both internationally and in Australia, of any further global financial crisis, any subsequent economic downturn, the ongoing economic, banking and sovereign debt crisis in Europe and any stalling of the protracted United States recovery; |
| | • | | increases or decreases in international and Australian domestic interest rates; |
| | • | | changes in the State’s domestic consumption; |
| | • | | changes in the State’s labor force participation and productivity; |
| | • | | downgrades in the credit ratings of the State and Australia; |
| | • | | changes in the rate of inflation in the State; |
| | • | | changes in environmental and other regulation; and |
| | • | | changes in the distribution of revenue from the Commonwealth of Australia Government to the State. |
Queensland Treasury
2015 Review of State Finances

2015 Review of State Finances
FOREWORD
In accordance with its 2015 election commitment, the new Government directed Queensland Treasury (Treasury) to undertake a Review of the State’s Finances, for publication as part of the first State Budget of the term.
The Review commenced in March 2015 with the purpose of reporting on:
| 1. | The State’s current fiscal position, including any relevant historical context and relative to peers. |
| 2. | The sustainability of the State’s fiscal position, including: |
| | • | | the appropriateness of various operating statement and balance sheet measures of State fiscal performance and sustainability |
| | • | | an assessment of the key drivers and likely direction of those measures based on medium term modelling work to be undertaken by Treasury. |
| 3. | The veracity of the current forward estimates, including: |
| | • | | adequacy of existing provisions on a “no policy change” basis |
| | • | | identification of any material outstanding funding issues requiring resolution |
| | • | | identification of any unallocated funding that may be available for other priorities, including debt repayment. |
| 4. | Based on the above findings, policies and actions required to support implementation of the Government’s five fiscal principles and related commitments. |
This Report is, in effect, a high level fiscal review. It is not intended as a comprehensive policy review covering matters of service delivery and performance. Comments on policy are largely restricted to those areas required to support implementation of the Government’s fiscal principles and strategy.
2015 Review of State Finances
TABLE OF CONTENTS
| | | | | | |
EXECUTIVE SUMMARY | | | 5 | |
| | |
1. | | ECONOMIC CONTEXT | | | 12 | |
| | |
2. | | QUEENSLAND’S FISCAL POSITION – 2000-01 TO 2013-14 | | | 20 | |
| | |
3. | | INTERSTATE COMPARISON OF KEY AGGREGATES | | | 45 | |
| | |
4. | | FORWARD ESTIMATES – ASSUMPTIONS AND RISKS | | | 54 | |
| | |
5. | | MAJOR FUNDING PRESSURES | | | 64 | |
| | |
6. | | CREDIT RATINGS AND DEBT MARKETS | | | 67 | |
| | |
7. | | FISCAL SUSTAINABILITY | | | 78 | |
| | |
8. | | GOC PERFORMANCE AND SUSTAINABILITY | | | 87 | |
| | |
9. | | THE GOVERNMENTS FISCAL PRINCIPLES | | | 97 | |
| | |
10. | | KEY ENABLERS OF THE FISCAL PRINCIPLES | | | 102 | |
| |
GLOSSARY OF TERMS | | | 105 | |
2015 Review of State Finances
EXECUTIVE SUMMARY
ECONOMIC CONTEXT
For the last two decades, the Australian and Queensland economies have shown remarkable resilience despite a series of shocks. The Queensland economy outperformed the national economy throughout most of this period.
More recently, growth in Queensland’s economy has been driven by the significant investment in liquefied natural gas (LNG) projects. This overshadowed an underlying weakness in other sectors of the economy.
The Queensland economy now faces considerable challenges in the form of a weaker outlook for Queensland’s trading partners, a fall in the terms of trade and lower levels of business investment. This in turn is driving slower growth in incomes and spending.
Queensland’s population growth, which for some decades exceeded Australia’s due to strong levels of migration, has slowed to levels more in line with the national average.
The issue for policy makers at both the State and national level is how to facilitate growth in workforce participation and productivity to mitigate the impact of these factors on living standards at a time when governments are fiscally constrained.
QUEENSLAND’S CURRENT FISCAL POSITION
Queensland entered the last decade with a fiscal position that was the strongest of all the states. It had very low levels of debt and low tax rates.
The policy trade-off in Queensland was levels of service, infrastructure and public sector wages that were well below national averages.
Successive Queensland governments implemented policies aimed at raising service levels towards national standards in key areas and addressing infrastructure deficits. The benefit of that investment today (beyond the obvious service delivery benefits) is that Queensland is not facing the major infrastructure pressures now being experienced in many other states.
Queensland’s low tax settings remained in place during this period. There was a fundamental policy imbalance.
In the period leading up to the Global Financial Crisis (GFC), the policy imbalance was masked by the revenue surge from the housing and mining booms and the growth in GST driven by credit expansion. However, with state fiscal capacities equalised through the Grants Commission process, it is the policy settings that are paramount. In effect, like most governments throughout the developed world, Queensland ‘overshot’.
Queensland also faced the added challenges of the South East Queensland water crisis and an unprecedented series of natural disasters.
The net outcome was a dramatic increase in General Government debt between 2006-07 and 2013-14.
5
2015 Review of State Finances
Since 2008, there has been greater expenditure restraint and a series of remedial measures in the form of asset sales, tax increases, the imposition of successive rounds of generic ‘efficiency dividends’ and similar measures.
With a Budget dominated by employee expenses in deficit, a significant reduction in employee expenses was also required.
As a proportion of the population, the public sector is now the same size it was 2000-01. The growth in the public service between 2000-01 and 2013-14 was predominantly in front line service delivery roles.
At the time of the publication of the 2014-15 Mid Year Fiscal and Economic Review (MYFER), the budget and debt position had been broadly stabilised, but with little room for new policy. As is the case with the Australian Government and Western Australian budgets, Queensland faces ongoing revenue challenges associated with the rebalancing of world commodity prices.
INTERSTATE COMPARISON OF KEY AGGREGATES
In terms of peer comparisons, Queensland’s General Government Gross Debt is the highest of all major states. Queensland also performs poorly on the General Government Debt to Revenue measure.
Queensland’s Net Debt position is far more favourable than its Gross Debt position, due to the significant financial investments Queensland holds to meet future employee entitlements, most notably the defined benefit superannuation scheme. These financial investments also see Queensland perform well on the Net Financial Liabilities measure.
Queensland ranks first among the major states on the Net Worth measure, but last on the Net Financial Worth measure. However, the utility of these measures for comparative purposes is questionable, due to differences in the composition and structure of government across jurisdictions and approaches to asset valuation.
FORWARD ESTIMATES – ASSUMPTIONS AND RISKS
The estimates published in the December MYFER were fundamentally sound in terms of the assumptions. There have been developments since the publication of MYFER that will make the Government’s budget and debt reduction task more difficult. These are further reductions in Consensus Forecasts for coal and oil (linked to LNG) prices and the impact of the Australian Energy Regulator’s Determination of allowable revenues for Energex Limited (Energex) and Ergon Energy Corporation Limited (Ergon).
The bulk of the funding identified by the former Government as election commitment offsets was held by Treasury and reflected items where final decisions were yet to be made and a general policy provision for emerging items. This is available for allocation by Government, but is required by Queensland Health and Tourism and Events Queensland to maintain funding levels. While the inclusion of provisions has been standard practice since the introduction of accrual budgeting, a standard protocol should be put in place for communicating those provisions to the relevant departments when an election is called.
6
2015 Review of State Finances
MAJOR FUNDING PRESSURES
As part of the Review, Treasury liaised with Directors-General to identify current funding issues and future pressures that were not captured in agency forward estimates as part of the 2014-15 MYFER.
It is a standard part of the Budget process that agencies will identify a large number of issues for funding consideration that in totality far exceed the funding capacity of Government. The Budget process is designed to deal with those issues in terms of prioritisation and resolution.
The following could be described as the most significant funding pressures faced by the Budget having regard to materiality and likelihood.
| 1. | Health Funding – the challenges associated with the Australian Government’s move from an activity based funding model to a fixed contribution approach. |
| 2. | Cross River Rail – capacity constraints faced by the passenger rail network in crossing the Brisbane River. |
| 3. | Schools – new schools and additional classrooms to meet growth and a re-emergence of school backlog maintenance. |
| 4. | Prison Capacity – some new capacity is being added but could easily be exceeded if recent trends in the prisoner population continue. |
| 5. | Information and Communications Technology – a large number of the Government’s key systems and enabling technologies are past or approaching their end of life. |
| 6. | Tropical Cyclone Marcia – the cost of the damage will need to be incorporated into the 2015-16 Budget. |
CREDIT RATINGS AND DEBT MARKETS
Queensland is currently rated AA+ by Standard & Poor’s with a stable outlook and Aa1 by Moody’s (equivalent to AA+) with a negative outlook.
While, based on the MYFER estimates, Queensland’s new borrowing requirements are relatively low, Queensland Treasury Corporation (QTC) has significant refinancing requirements on the State’s debt. The State has a refinancing requirement averaging approximately $10 billion per annum over the forward estimates.
The number of AAA rated entities has reduced dramatically since the Global Financial Crisis. Australia is now one of only eight sovereigns with a AAA credit rating.
It is difficult to be precise about the cost of Queensland being rated AA+ rather than AAA. Credit ratings are one factor that influence the relative cost of debt. Other factors include the volume of debt, the risk appetite of the market and investors’ views and perceptions.
Under current economic circumstances, it is neither necessary nor wise in terms of the magnitude of the policy adjustments required to pursue a return to AAA in the near term. It is however important for Queensland to have a strong and stable credit rating to ensure orderly access to capital markets at a reasonable price.
7
2015 Review of State Finances
There is ample liquidity in the markets and this has pushed yields to historic lows. However, internationally there is also evidence of significant imbalances in capital markets. Credit quality counts most during periods of market stress.
Queensland’s key credit weakness is its debt burden as measured by debt to revenue. Ratings agencies would be concerned about the re-emergence of material fiscal/cash deficits.
There has been an ongoing debate as to whether the ratings agencies give adequate weight to Queensland’s financial asset holdings. Queensland has over $30 billion in financial assets and is the only Australian state with fully funded public sector employee entitlements.
The fact remains that the State has the ability to give effect to a substantial reduction in debt should the circumstances require it.
FISCAL SUSTAINABILITY
Fiscal sustainability is important because:
| a. | it protects the community from the dislocation and uncertainty associated with significant policy corrections |
| b. | Government needs to have the financial capacity to help the community when needed most |
| c. | it ensures intergenerational equity. |
At the practical level, this is achieved by having principles and targets covering the Budget balance, debt and liability management.
The net operating balance is the Government’s preferred fiscal measure. Most states have the net operating balance as their headline measure. Achieving a net operating surplus is a necessary, but not sufficient condition for fiscal sustainability in light of Queensland’s current debt levels.
Debt in itself is not ‘bad’. While it is widely accepted that states should not borrow for recurrent expenditure, it is entirely appropriate that Government borrow for new infrastructure to support service delivery and economic development – i.e. infrastructure that generates a strong social rate of return.
There is no clear and widely accepted empirical answer as to the appropriate amount of debt for a state government. However, Queensland’s current debt level leaves the State with little capacity to absorb external shocks and potentially vulnerable during times of financial market stress. For these reasons, the conclusion is that Queensland’s debt levels are too high.
Given: (a) the current economic environment and revenue outlook; (b) policy commitments and constraints; and (c) the inevitability that Government will face funding pressures that need to be addressed; a reduction in debt in absolute terms may not be achievable over the medium term.
The most practical medium term objective may be for growth in the economy and revenues to reduce the relative size of Government debt over time – as measured by the General Government debt to revenue ratio.
8
2015 Review of State Finances
Treasury has modelled various scenarios under this approach. If the Government’s fiscal strategy ensures General Government debt grows at or below growth in real gross state product (GSP), then the ‘base case’ would see Queensland’s General Government debt to revenue ratio reduce from around 90% in 2015-16 to below 80% by 2025-26. Any debt reduction measures outside of the ‘base case’ would allow Government to pursue a more ambitious target.
Achieving the desired reduction in the relative size of debt will, at a minimum, require Government to: (a) target operating surpluses in the range of $1 billion to $2 billion; and (b) ensure the capital program is kept to a size where it is primarily funded through recurrent cash flow rather than borrowing.
The analysis is of course based on the current State tax and expenditure mix which in fact, is the heart of the sustainability problem.
For some years now, governments at the state and national level have been implementing a series of sub-optimal solutions in an effort to stabilise their budget situations. The enduring solution to the sustainability problem lies in recognising that Australia’s systems of taxation and fiscal federalism are broken. There is a fundamental mismatch between community expectations and the capacity of governments to deliver.
GOVERNMENT OWNED CORPORATIONS (GOCs) PERFORMANCE AND SUSTAINABILITY
As the lender to the GOCs, QTC reviews the capacity of the GOCs to service their debt – in effect, credit quality. The Queensland Government is the ultimate guarantor.
QTC’s assessment is that in general the businesses are of good credit quality. They are able to meet their debt service and repayment obligations and there is capacity to increase the gearing levels of some GOCs. Based on a ‘desk-top’ analysis, increasing their gearing to more commercial levels could release in the order of $4 billion in equity.
The equity released through the regearing would effectively represent a bring-forward of the Government’s six year debt reduction target for the General Government sector and provide capacity for Government to pursue a more ambitious improvement in the debt to revenue ratio.
CS Energy’s commercial position however, remains challenged. It is incurring operating losses due to long running coal supply and contractual issues.
Queensland Bulk Water Supply Authority (Seqwater) and Queensland Rail are entities which reside in the GOC sector, but are statutory bodies. These entities currently have $12 billion in debt.
Government could consider using some of the equity released from the GOCs to reduce Seqwater’s high debt levels and place it on a firm self-supporting footing.
Like any businesses, Queensland’s GOCs face risks and will have to adapt to sectoral changes – the biggest of which is arguably the impact of new technologies on the electricity network. If these are not managed well, the costs will be borne by the Budget and taxpayers.
9
2015 Review of State Finances
On the basis that the GOC sector debt is commercially sustainable, it is reasonable for the Government’s fiscal policy focus to be on the General Government sector. This however is subject to some important caveats. Namely, to be commercially sustainable they must:
| 1. | have commercially appropriate gearing levels and dividend policies |
| 2. | be allowed to price commercially |
| 3. | evolve and respond to changes in market conditions |
| 4. | make good investment decisions |
| 5. | not have non-commercial policies imposed on them. |
This has not been the case in the past. These elements are also important to the rating agencies’ positions on the status of the GOC debt.
THE GOVERNMENT’S FISCAL PRINCIPLES
The Government’s fiscal principles are sound in terms of coverage. However, based on the analysis contained in this document and developments since MYFER, some modifications are proposed. Treasury’s recommendations for the Government’s five fiscal principles, including those that remain unchanged, are as follows:
| 1. | The Government will target ongoing reductions in Queensland’s relative debt burden, as measured by the General Government debt to revenue ratio. [A medium term quantitative target could be considered as part of the development of the 2015-16 Budget] |
| 2. | The Government will target a net operating surplus that ensures any new capital investment is funded primarily through recurrent revenues rather than borrowing. |
| 3. | The General Government capital program will be managed to ensure a consistent flow of works to support jobs and the economy and reduce the risk of backlogs emerging. |
| 4. | Maintain competitive taxation by ensuring that General Government sector own-source revenue remains at or below 8.5% of gross state product, on average, over the forward estimates. |
| 5. | Target full funding of long term liabilities such as superannuation and WorkCover Queensland (WorkCover) in accordance with actuarial advice. |
KEY ENABLERS OF THE FISCAL PRINCIPLES
The merger of the transmission and distribution entities proposed by the Government should assist in driving efficiencies and returns to the Government as the shareholder.
There are a number of other key policies and actions that will be required to support the achievement of the Government’s fiscal principles.
Employee numbers need to be monitored closely with growth limited to that provided through existing funding formulae and election commitments.
10
2015 Review of State Finances
Wage growth needs be as closely aligned to inflation outcomes as possible. With the ongoing imposition of savings targets on agencies, it is difficult to see how genuine cashable productivity improvements that would be required to fund real wage increases could be achieved.
In Australia the revenue growth over the past two decades was such that it allowed for a familiar pattern: a problem is identified; Government accepts ownership of the problem; and, the solution is a spending package. The Government and the community at large will need to think laterally and develop solutions to problems beyond spending.
Generally, agencies have a good track record of managing within their budgets. However, they are under increasing pressure. To live within their budgets, Ministers and agencies need to continuously review and reprioritise.
Queensland now spends at levels at or around national averages in almost all service delivery areas. Where Queensland’s spending is not achieving the same results as in other states, Government and taxpayers have the right to know why.
The Government has a number of significant system related decisions to make over coming years. It is increasingly accepted that when the claim is that the ICT need is unique, it is easier and cheaper to change the business than build the system. Standardising processes so that Government can access private sector ICT as a service is not outsourcing.
The issue of the public ownership of GOCs has now been resolved. Nonetheless, the State has a vast balance sheet which needs to be managed actively to meet the Government’s debt objectives and future infrastructure needs. Treasury needs to work closely with QTC and QIC on these issues and develop proposals for Government’s consideration.
For the foreseeable future, Queensland will need to closely align its capital spending ambitions to the available cash flow generated by the budget. The focus needs to be on the most efficient way of achieving the outcome sought, rather than the pursuit of ‘the project’. The role of Building Queensland as the Government’s key infrastructure advisor will be pivotal.
The revenue bases of the states are already narrow. Further revenue concessions would be particularly harmful to Queensland’s credit rating position, as they damage both the numerator and denominator in key credit metrics. Moreover, the medium term fiscal challenge for Queensland is closer alignment between its revenue and expenditure settings.
11
2015 Review of State Finances
Economic growth is a key contributor to improving the standard of living of Queenslanders by increasing household incomes and therefore the quantity and quality of goods and services residents can consume and enjoy.
Queensland’s fiscal position needs to be considered in light of the underlying economic context to more fully understand the potential challenges that lie ahead.
| 1.1 | ECONOMIC GROWTH IN QUEENSLAND |
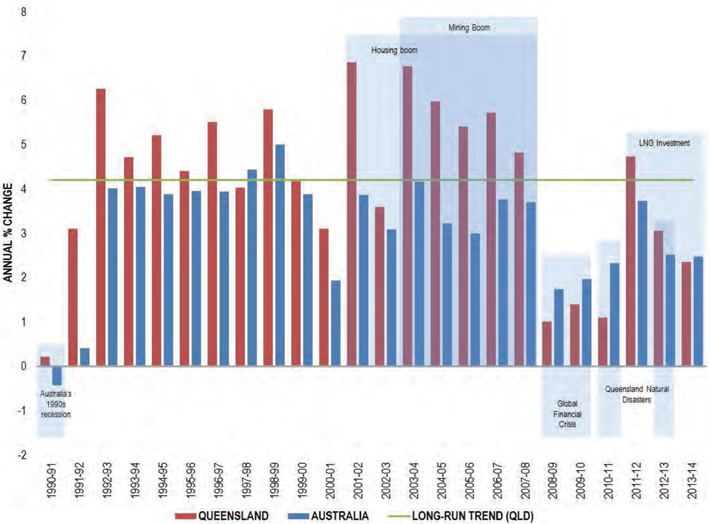
For the last two decades, the Australian and Queensland economies have shown remarkable resilience despite a series of external shocks. As shown in Chart 1.1 below, Queensland outperformed the Australian economy throughout most of this period.
Chart 1.1
Queensland’s Economic Growth Record
Source: Queensland Treasury; ABS 5206.0 and 5220.0
Following a period of only moderate growth in the early 1990s as a result of recessions in industrialised countries around the world, the Queensland economy was able to quickly rebound and embark upon a period of sustained economic expansion.
This turnaround was due, in part, to a swift recovery in dwelling investment as mortgage interest rates declined and growth in exports following a depreciation in the Australian dollar. A prolonged surge in business investment consolidated the recovery.
12
2015 Review of State Finances
While the Asian Financial Crisis hampered business and consumer confidence in 1997-98, a currency depreciation and monetary easing mitigated its impact on the domestic economy.
With a generous First Home Owner Grant and an expanding population, a seven-year housing boom began in 2001-02. During this period, house prices more than doubled and dwelling investment reached an historical high in 2007-08.
Queensland was well placed to benefit from the commodity boom of the early 2000s. Over the decade to 2007-08, raw coal production rose 74%, while production expanded from new zinc, lead and copper mines. Rising optimism also saw business investment record annual growth in excess of 10% per annum between 2002-03 and 2007-08.
Strong economic activity contributed to robust labour market outcomes, with the State’s unemployment rate falling to 3.7% in 2007-08 – a post World War II low. However, wages and price pressures were mounting.
With the onset of the GFC, dwelling investment declined and consumption growth weakened. As the economies of Queensland’s major trading partners slowed, Queensland’s total exports fell. Higher interest rates, an appreciation of the Australian dollar, the severe drought between 2004 and 2007, and the 2008 and 2009 natural disasters also exacerbated the fallout, as demand for labour moderated and unemployment rose.
Over much of the period since the GFC, the Queensland economy has been hindered by subdued global economic conditions and ongoing strength in the Australian dollar. The economy grew by an average of only 0.8% per annum between 2008-09 and 2010-11, before strengthening to an average of 3.3% per annum between 2011-12 and 2013-14.
The more recent expansion was driven by a recovery in coal exports and a significant increase in business investment as a result of the construction of three LNG projects. However, the LNG investment masked weakness in the other sectors of the economy.
The Queensland economy now faces considerable challenges in the form of the weaker outlook for Queensland’s major trading partners, a significant decline in the terms of trade and lower levels of business investment. This, in turn, is driving lower growth in household incomes and spending.
Queensland’s economic performance also continues to be impacted by longer-term underlying factors such as lower population and productivity growth, and a falling employment participation rate.
| 1.2 | DRIVERS OF ECONOMIC GROWTH AND INCOME |
Generally, economic growth is viewed and analysed from the perspective of output – consumption, investment and exports. However, given the primary objective of economic growth is to improve living standards of individuals, it is important to understand the inter-relationships among economic output, incomes and living standards.
The total output of an economy is the generator of, and equates to, the total income received through wages, profits and taxes.
13
2015 Review of State Finances
The income individuals receive is a measure of their standard of living, as it determines the quantity and quality of goods and services they are potentially able to demand and enjoy.
While demand will fluctuate and at times be heavily influenced by external factors (e.g. the international economy), growth in demand will only be sustainable if the population has the capacity to provide the quantity and quality of labour necessary to support the growth in output.
Therefore, in terms of Government policy development, an alternative framework for analysing economic growth is to examine the contributions made by the economy’s population on the supply side.
Under this framework, economic growth can be disaggregated into contributions from three elements – population, participation and productivity.
Table 1.1
Measuring Economic Growth
| | | | |
Element | | Measure | | Description |
| Population | | Population aged 15 years and over | | The more people of working age in the economy, the greater the potential workforce to grow the size of the economy. |
| | |
| Participation | | Extent to which the working age population are employed. | | The more people participate in work, the greater the size of the economy, higher incomes received and quality of life experienced. |
| | |
| Productivity | | Average output produced per hour worked | | As workers are able to produce more with each hour worked, the economy grows, and incomes and quality of life also increase. |
Population Growth
Overall population growth is a function of three factors: the natural population increase (births less deaths); net interstate migration; and net overseas migration.
The age structure is also a significant factor in the relationship between population and economic growth, given the population aged 15 and over primarily constitutes the pool of people from which the labour force is formed. Labour force participation rates are highest for middle-aged cohorts and drop off sharply for older cohorts.
The relative size of different age cohorts can also affect the economy’s industrial structure, e.g. younger age cohorts require more education and older age cohorts generally require greater levels of health and residential care.
Employment Participation
Employment participation reflects a combination of three factors:
| • | | the proportion of the population in the workforce (the labour force participation rate) |
| • | | the proportion of the workforce employed (the employment/unemployment rate) |
| • | | the number of hours worked (reflecting the proportion of employed persons working part time, full time or overtime). |
14
2015 Review of State Finances
Labour Productivity
Labour productivity measures the amount of economic output produced on average per hour worked in the economy. Increases in labour productivity over time can occur through capital deepening (increases in the capital to labour ratio), efficiency improvements (making better use of existing labour and capital) and technological improvements.
Structural changes in the economy, in particular changes in industry structure, are important factors influencing changes in labour productivity, with more capital-intensive industries (e.g. mining and manufacturing) generally leading to increased output per unit of labour employed. Conversely, growth in more labour-intensive sectors (e.g. health and community services, tourism and hospitality) moderate potential increases in labour productivity.
Terms of Trade
Another important factor contributing to both overall economic growth and changes in average incomes is the prevailing terms of trade (i.e. the price of the State’s exports relative to its imports).
Changes in Queensland’s terms of trade over time reflect movement in the relative prices of traded goods and services. The significance to Queensland of its key export-orientated industries means the State’s economic income is likely to be influenced more by changes in the terms of trade than other states.
15
2015 Review of State Finances
| 1.3 | QUEENSLAND’S ECONOMIC PERFORMANCE |
Relative Contribution to Growth
Chart 1.2 shows the relative contributions made by each of these elements to Queensland’s economic growth, and Gross State Income (GSI), over the last 25 years.
Chart 1.2
Drivers of Real Economic and Income Growth, Queensland
(1988-89 to 2013-14)
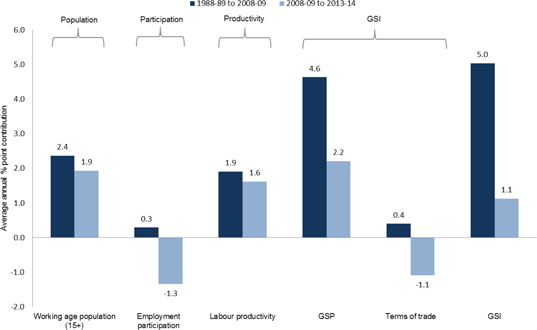
Source: Queensland Treasury; ABS 3101.0 and 6202.0
The key drivers of economic and income growth over recent decades have been population growth and increases in labour productivity, with employment participation and terms of trade also contributing, albeit relatively marginally, to overall growth outcomes. Specifically:
| • | | working age population growth over the last 25 years has averaged 2.2% per year, driven by historically high interstate and overseas migration for much of the period |
| • | | female workforce participation increased from 49.8% of the working age female population in 1988-89 to 60.3% in 2013-14 |
| • | | consistent with the rest of Australia, Queensland has experienced high rates of productivity growth over the past 25 years, averaging 1.9% per year, due to a range of factors, including capital deepening, technological change, policy reform and changes in industry structure |
| • | | high commodity prices initiated a sharp rise in the State’s terms of trade between 2002-03 and 2010-11, although much of these gains have since been reversed. |
In line with the weaker growth experienced in recent years, the contribution from each of these growth drivers has been significantly different since the GFC.
To illustrate this point, Chart 1.2 above compares the contribution to growth of each factor over the 20 years from 1998-89 to 2008-09 with the contribution in the five years from 2008-09 to 2013-14.
Population Growth
Key drivers of population growth have slowed, reducing the number of people being added to the State’s labour force each year.
16
2015 Review of State Finances
In particular, while Queensland’s population growth during the 2000s was underpinned by strong rates of interstate and overseas migration, net interstate migration has fallen significantly over the last decade.
Net interstate migration averaged 29,000 people per year over the 20 years to 2008-09, compared with only 7,600 per year over the five years to 2013-14. Queensland recorded only 5,753 net interstate migrants in 2013-14, the lowest level since records began in 1981-82.
This likely reflects a range of factors, including the maturing of the Queensland economy, with the differential in house prices and cost of living between Queensland and other major states having reduced over time. In addition, the reduced employment opportunities in Queensland relative to other states, in particular, Victoria and New South Wales, has also reduced the relative attractiveness of Queensland as a migration destination.
Employment Participation
The most significant change in recent years has been the detraction from growth from lower employment participation.
Queensland’s labour force participation rate peaked at 67.8% of the working age population in 2008-09 and has since fallen to 65.9% in 2013-14.
In contrast to the strong growth in female participation in the 1990s and 2000s, this rate has more recently fallen.
The ageing of Queensland’s population also appears to be having a negative impact on employment participation rates as a greater proportion of the population exits the labour force.
The proportion of the population aged 15 to 64 peaked in 2007-08 at 67.5% and has since fallen to 66.2%. Over the same period, the proportion of the population aged 65 and over has increased from 12.2% to 14.0%.
Part time employment has grown by 97,400 persons since 2008-09, outstripping full time employment growth of 45,800 persons over the same period.
Some of the fall in the participation rate is likely to be accounted for by a ‘discouraged worker effect’ where rises in the unemployment rate over the period have led to some jobseekers leaving the labour force entirely. Youth have also been affected.
This rise in the unemployment rate can be largely attributed to external economic factors over the past five years, particularly the aftermath of the GFC. These factors are also likely to have contributed to the relative increase in part time employment, compared with full time employment, in recent years.
Labour Productivity
Labour productivity growth in the last five years has been marginally lower than in the previous two decades. More than $60 billion has been invested in the State’s coal seam gas industry during that time.
17
2015 Review of State Finances
In the absence of the coal seam gas development boom, the State’s labour productivity growth in the last five years would have reduced substantially compared with the average over the previous 20 years.
Terms of Trade
Finally, in relation to the terms of trade, it is significant that, over of the past decade, high global commodity prices have fed a boom in the construction of new mines and associated infrastructure in Queensland and elevated the terms of trade, increasing the rate of income growth accruing to Queensland.
However, the high commodity prices which initiated a sharp rise in the State’s terms of trade between 2002-03 and 2010-11 have fallen sharply over the last 18 months, negating some of these impacts and resulting in a substantial detraction from income growth over the last five years.
| 1.4 | QUEENSLAND’S ECONOMIC OUTLOOK |
Economic prospects for Queensland over the next decade will be driven by several key factors, including:
| • | | the performance of international and national economies |
| • | | the transition of the Queensland economy following the resources investment boom. |
The international outlook remains clouded with uncertainty. The pace of economic recovery in the United States is expected to be gradual while high levels of debt in a number of member countries will continue to be a drag on any substantial recovery in the Euro Zone.
In Japan, a declining population is expected to continue to constrain the country’s economic growth. Growth in China should also continue to moderate, as the Chinese Government aims to rebalance the economy, contain growth in local government debt and address environmental concerns. Taken together, these factors suggest that global economic growth is likely to remain below historical averages in coming years.
Meanwhile, migration flows have stabilised over the past few years and, as a result, Australia’s and Queensland’s population growth are expected to be lower than in the previous decade. These developments suggest that national and Queensland trend population growth are likely to stabilise at lower levels than their respective average historical growth rates.
Population growth in Queensland is likely to remain more in line with the national average in the foreseeable future and there is unlikely to be the same influx observed in the first decade of this century.
18
2015 Review of State Finances
The ageing of the population is expected to reduce labour force participation rates. This is also expected to see spending on health and aged care services rise significantly in the coming decade, both nationally and at a State level.
Over the next two years, the Queensland economy will be driven by the transition from the resources investment phase to the production phase. The sharp fall in LNG investment is the major factor restraining growth in 2014-15, but in 2015-16 there will be a rebound in growth as LNG production and exports ramp up.
The transition away from capital-intensive resources investment, combined with greater expenditure in the labour-intensive social services sector, is expected to limit potential growth in labour productivity.
The expected weakness in demand for resources, reflecting the soft international economic outlook, is likely to lead to continued downward pressure on commodity prices, with the terms of trade remaining at lower levels for the foreseeable future. While a number of policy levers that impact on the level of economic activity, such as monetary policy, are managed at the national level, the State Government has some influence in three key policy areas:
| • | | in recognition that the private sector is the principal engine of growth in the economy, a key focus of Government policy should be to create an environment conducive to business confidence and investment |
| • | | the Government also has a role, where appropriate, to support growth through policies aimed at more targeted, immediate employment generation and to address specific instances of labour market failure |
| • | | with the public sector comprising approximately 20% of the economy, ongoing efficiency improvements in the delivery of Government services are also critical to growth in overall labour productivity. |
19
2015 Review of State Finances
| 2. | QUEENSLAND’S FISCAL POSITION – 2000-01 TO 2013-14 |
Queensland’s fiscal position in the 1990s was by any measure the strongest of all the Australian states, largely due to the application of fiscal principles which became known as ‘The Trilogy’. While the wording changed over time, the three core elements remained:
| 1. | Fully funding long term liabilities such as superannuation and workers’ compensation |
| 2. | Borrowing only for assets that generated an income stream sufficient to service the debt |
| 3. | Maintaining Queensland as the ‘low tax State’. |
As a consequence, Queensland had balanced budgets and little to no General Government debt.
Unlike other states, as the ‘low tax State’ Queensland had no fuel tax (later converted into the Fuel Subsidy Scheme), no financial institutions duty and generous principal place of residence stamp duty concessions. Queensland’s tax rates were generally lower across the board.
Clearly, this could only be achieved if there was a trade-off. The trade-off in Queensland was levels of service, infrastructure and public sector wages that were well below the national average.
Since then, successive Queensland governments have sought to address these differences in service levels and standards. The low tax policies however largely remained.
There was also a significant surge in infrastructure spending.
For a time, the revenues generated by the housing and mining booms and the increases in GST revenues arising from the credit expansion made this appear affordable. However the process of fiscal equalisation, whereby all states are placed on a similar footing, means that over the medium term no state can at the same time pursue high expenditure and low tax policies regardless of how strong their economy is performing.
Queensland has also faced a number of severe weather events, first in the form of a protracted water crisis followed by severe floods and cyclones.
The GFC led to a significant collapse in revenues and highlighted the underlying policy imbalance. By that time, the infrastructure spending associated with earlier decisions was effectively ‘committed’.
The outcome was a rapid rise in Queensland’s debt levels. A significant policy correction was required.
Queensland governments have since implemented a range of measures in an effort to address the policy imbalance and stabilise the fiscal position. This task has been made harder due to the ongoing deterioration in the revenue outlook, particularly royalty revenues.
20
2015 Review of State Finances
The rest of this Chapter examines these issues in more detail, with particular reference to the last decade.
Between 2000-01 and 2013-14, General Government recurrent expenditure grew at an average rate of 7%. While clearly in excess of the combination of Consumer Price Index (CPI) and population growth, it aligns with revenue growth during that period.
On one level, this is not surprising. It is consistent with Queensland, on average, recording General Government operating surpluses throughout this period.
Chart 2.1
Total Revenue and Recurrent Expenditures
2000-01 to 2013-14
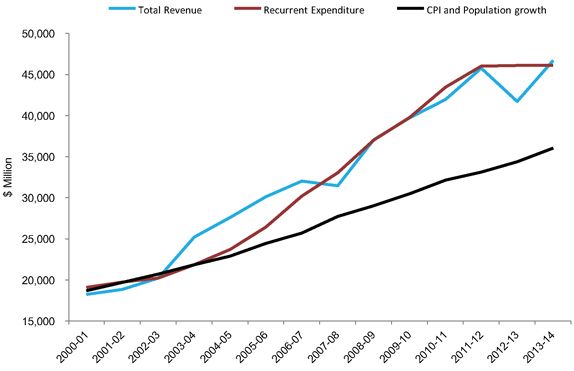
Source: ABS 5512.0; ABS 6401.0; Queensland Report on State Finances 2013-14
The growth rate of 7% per annum is by any measure large and can be explained by two factors:
| 1. | A number of major expenditure policy developments, including ongoing efforts to take Queensland’s expenditure levels towards national averages (See Box 2.1 below) |
| 2. | The recurring theme in the history of public finance of locking in expenditure in the expectation that the revenue boom will continue. |
21
2015 Review of State Finances
Box 2.1
Significant Expenditure Policy Developments
2001-02
| | • | | Breaking the Unemployment Cycle Initiative. |
2002-03
| | • | | Education and Training Reforms for the Future, including introduction of the Preparatory Year of Schooling. |
2004-05
| | • | | Child Protection Funding following the 2004 Crime and Misconduct Commission of Inquiry. |
2005-06
2006-07
| | • | | More Beds for Hospitals. |
| | • | | Queensland Skills Plan. |
2007-08
| | • | | Climate Change Package. |
| | • | | State Schools of Tomorrow. |
2010-11
| | • | | Flying Start – Move Year 7 to High School. |
2011-12
| | • | | 2018 Gold Coast Commonwealth Games. |
2012-13
| | • | | Royalties for the Regions. |
2013-14
| | • | | National Disability Insurance Scheme – Disability Services Shortfall. |
EMPLOYEE EXPENSES
The largest component of General Government expenditure is employee expenses, comprising nearly half of all expenditure. No analysis of trends in the State’s financial position would be complete without a more detailed examination of growth in this expenditure category.
Over the period 2000-01 to 2013-14, employee expenses grew at an average rate of 7.1%.
There are two components that determine growth in employee expenses: employee numbers and wages growth.
22
2015 Review of State Finances
Size and Composition of the Public Service
The Chart below compares growth in the public service compared to population growth over the period 2000-01 to 2013-14.
Chart 2.2
Actual Public Service vs Population Growth Trajectory
Jan 2001 to Jan 2014
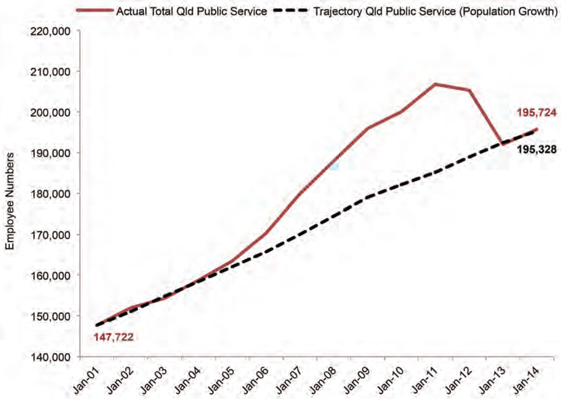
Source: Public Service Commission - MOHRI data
Public sector numbers grew at a rate much higher than population in the period post 2005. The majority of that growth was in Queensland Health.
Following the reduction in employee numbers in 2012-13, as a proportion of the population the public sector is now the same size it was 2000-01.
23
2015 Review of State Finances
Chart 2.3
Composition of Public Service
2001 to 2014
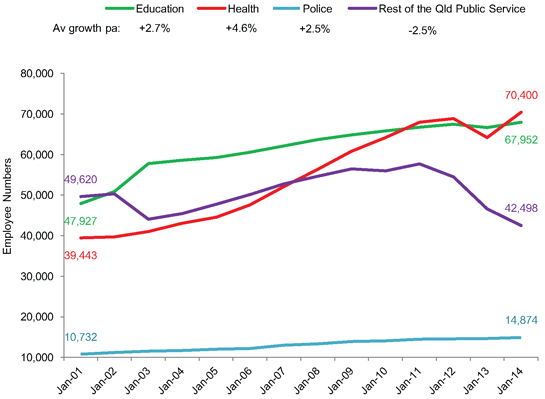
Source: Public Service Commission
Growth in Education and Police department employee numbers has been consistent with population growth. This is not surprising given that their funding formulas are population driven (e.g. school enrolments, police to population ratio).
The overall trajectory would seem to be consistent with the major policy and expenditure pushes of Government during this period, rather than representing a fundamental problem around FTE management.
The exception to this is Queensland Health. Treasury’s view is that in the post 2005 period, Health had problems in relation to both internal systems and management culture in relation to FTE and Budget management. Health’s performance in this area has since greatly improved, particularly with the introduction of the Hospital and Health Services (HHSs).
With the ‘Rest of the Public Service’ declining in absolute terms from 50,000 to 42,000 over this period, this could infer that a higher proportion of the public service is now devoted to direct service delivery than was the case in 2000-01.
24
2015 Review of State Finances
While detailed occupational data for all groups is not available back to 2000-01, the Public Service Commission has been able to provide data on some special occupational groups back to 2002-03. Approximately 80% of the growth in the public service since 2002-03 relates to the occupational groups detailed in the Table below.
Table 2.1
Queensland Public Sector – Special Occupational Groups
| | | | | | | | |
Selected Special Occupational Groups | | Jun-03 | | | Jun-14 | |
Firefighters | | | 2,048 | | | | 2,366 | |
Ambulance Officers | | | 2,162 | | | | 3,551 | |
Teacher/Teacher aides | | | 40,960 | | | | 49,861 | |
Nurses | | | 16,021 | | | | 26,005 | |
Doctors | | | 3,118 | | | | 7,393 | |
Other Health Practitioners | | | 5,490 | | | | 9,326 | |
Police | | | 8,585 | | | | 11,492 | |
| | | | | | | | |
TOTAL | | | 78,382 | | | | 109,994 | |
| | | | | | | | |
Source: Public Service Commission
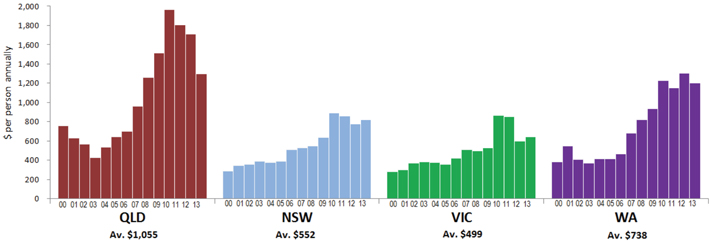
Wages Growth
In 2000-01, Average Weekly Earnings (AWE) for the Queensland public sector was $739, around $44 (or 5.6%) less than the comparable Australian average. Queensland was ranked fourth highest of the states. In 2013-14, AWE in the Queensland public sector was $1,292, which was very close to the Australian average of $1,293 for the public sector. This was the second highest of the states after Western Australia.
In real terms, Queensland public sector AWE increased by 19.4% during this period compared with the Australian average of 15.7%.
Table 2.2
Average Weekly Earnings 2000-01 to 2013-14
| | | | | | | | | | | | | | | | | | | | | | | | | | |
| | | | | Nominal $ | | | Real $(2013-14) | |
| | | Sector | | 2013-14 | | | 2000-01 | | | Change | | | 2013-14 | | | 2000-01 | | | Change | |
Aus | | Private | | | 1,077 | | | | 618 | | | | 459 | | | | 1,077 | | | | 882 | | | | 195 | |
| | Public | | | 1,293 | | | | 783 | | | | 510 | | | | 1,293 | | | | 1,118 | | | | 175 | |
NSW | | Private | | | 1,078 | | | | 670 | | | | 408 | | | | 1,078 | | | | 947 | | | | 131 | |
| | Public | | | 1,281 | | | | 836 | | | | 446 | | | | 1,281 | | | | 1,182 | | | | 99 | |
Vic | | Private | | | 1,026 | | | | 600 | | | | 426 | | | | 1,026 | | | | 848 | | | | 178 | |
| | Public | | | 1,228 | | | | 756 | | | | 472 | | | | 1,228 | | | | 1,068 | | | | 160 | |
Qld | | Private | | | 1,045 | | | | 593 | | | | 452 | | | | 1,045 | | | | 868 | | | | 177 | |
| | Public | | | 1,292 | | | | 739 | | | | 553 | | | | 1,292 | | | | 1,082 | | | | 210 | |
SA | | Private | | | 1,013 | | | | 576 | | | | 437 | | | | 1,013 | | | | 829 | | | | 184 | |
| | Public | | | 1,246 | | | | 764 | | | | 482 | | | | 1,246 | | | | 1,100 | | | | 146 | |
WA | | Private | | | 1,301 | | | | 590 | | | | 711 | | | | 1,301 | | | | 861 | | | | 440 | |
| | Public | | | 1,326 | | | | 723 | | | | 602 | | | | 1,326 | | | | 1,054 | | | | 271 | |
Tas | | Private | | | 1,216 | | | | 731 | | | | 485 | | | | 1,216 | | | | 1,022 | | | | 194 | |
| | Public | | | 840 | | | | 498 | | | | 342 | | | | 840 | | | | 696 | | | | 143 | |
Source: Queensland Treasury; ABS 6302.0
25
2015 Review of State Finances
These results are impacted by the changing relative composition of the public sector workforce (for example, the significant increase in relatively highly paid medical clinicians post 2005 has increased Queensland’s average compared to other jurisdictions).
The Wage Price Index (WPI) removes some of these effects by holding the quality and quantity of labour purchased by employers constant. The WPI for the Queensland public sector increased by 68.8% over the 14 years to December 2014, much the same as the Australian average of 68.5%. At the same time, Queensland private sector WPI increased by 62.2%.
Chart 2.4
Wage Price Index, Australian and Queensland Public Sector
(annual % change, original)
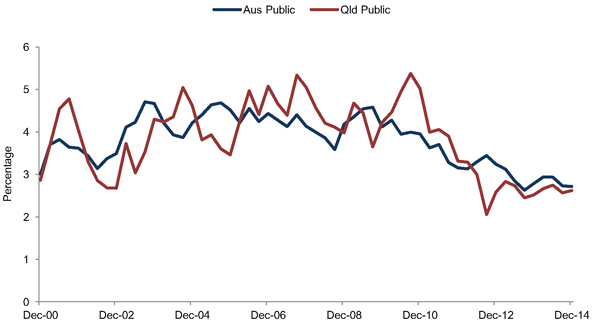
Source: ABS 6345.0
26
2015 Review of State Finances
Chart 2.5
Wage Price Index, Queensland Private and Public Sector
(annual % change, original)
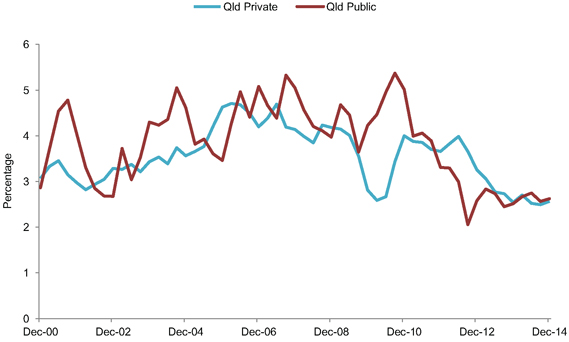
Source: ABS 6345.0
There are two recent significant deviations in the Queensland Public Sector WPI relative to the Queensland Private Sector WPI and the Australian Public Sector WPI. These are in 2008 and 2012.
In November 2008, the Government agreed to a three year wage increase of 4.5%, 4.0% and 4.0%. This increase was high even by wage outcomes at the time, particularly as the seriousness of the GFC was by then apparent. It also contrasts with the Queensland private sector response, which was a swift moderation in wage outcomes.
In 2012, the Government implemented a wages policy of 2.2% per annum. The 2.2% per annum increase has been lower than the actual change in the CPI and represents a reduction in public service real wages over the period. 2.2% is also lower than Treasury’s forward projections for CPI of 2.5% (mid-point of the RBA band), implying an ongoing real wage reduction. There was a protracted period in which the ‘core’ public service received no increase, which partly explains the sharp decline in 2012.
Conclusion
The growth in employee expenses over the period 2000-01 to 2013-14 was far in excess of CPI and population growth, but is explainable in the context of:
| 1. | Significant policy decisions in relation to Health, albeit that during part of this period there were also questions around Queensland Health’s FTE management |
| 2. | An increase in the compositional weighting towards more highly paid professions, and in particular health professionals as part of the 2005 Health Action Plan (HAP) |
| 3. | The general presumption that public sector salaries in key occupation groups should match the national average. |
27
2015 Review of State Finances
While the growth is explainable, it did not make it affordable. With significant fiscal deficits and employee expenses representing half of Government expenditure, Treasury’s conclusion was that a material reduction in employee expenses was required. The magnitude of that reduction was amplified by (a) the cost of the 2008 wage decision; and (b) the 2012 decision to fund election commitments through the imposition of a 3% employee expense growth cap.
HEALTH
No Chapter on expenditure growth over the last decade would be complete without some commentary on Health.
During the period 2001-02 to 2013-14, the health system received average year on year funding growth of 9.4% per annum. Operating expenditure for the health system in 2001-02 was $4.2 billion and grew to $12.1 billion by 2013-14.
Chart 2.6
Queensland Health Total Expenses
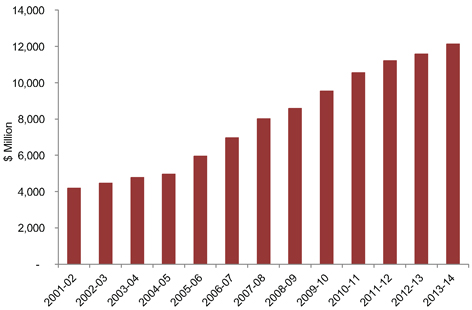
Source: Queensland Treasury
Growth in the period 2001-02 to 2004-05 was modest – in the order of 5% per annum.
The dramatic growth in expenditure from 2005 onwards was driven by two significant policy decisions:
| 1. | the HAP 2005-06 to 2010-11, developed in the wake of the Bundaberg Hospital Crisis |
| 2. | the More Beds for Hospitals Program (More Beds) 2006-07 to 2015-16. |
28
2015 Review of State Finances
The HAP committed funding of $6.4 billion over five and a half years ($4.4 billion additional in funding) to manage growing demand for health services. The program was targeted at sufficiently funding existing services, service expansion and enhancement and the recruitment of additional doctors and nurses.
The More Beds program replaced the HAP as the mechanism for providing additional operating funding to manage demand pressures. The key difference being that this commitment was infrastructure driven and underpinned by the delivery of an additional 2,000 hospital beds and $4.2 billion in funding over the period. The last tranche of growth funding under the More Beds program ceases in 2015-16.
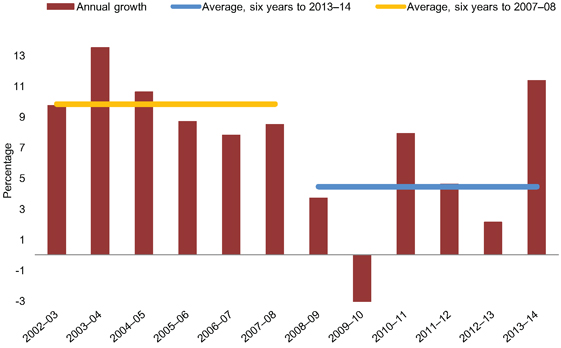
Average annual General Government revenue growth for the six years to 2007–08 was 9.2%. Following the GFC, average annual revenue growth slowed to 7.2% for the six years to 2013-14.
However, a large part of the growth post the GFC reflects Commonwealth Grants, both under the National Economic Stimulus program and the Australian Government contributions to disaster recovery following Cyclone Yasi and 2010 floods.
29
2015 Review of State Finances
Accordingly, the Chart below shows how the key own-purpose revenue sources of GST, tax and royalties have grown since 2002-03. In aggregate, these revenue sources averaged 9.8% annual growth for the six years to 2007-08. This growth eased to 4.4% for the six years to 2013-14. The large increase in 2013-14 was primarily driven by an increase in Queensland’s relativity for the distribution of GST.
Chart 2.7
Queensland GST, Tax and Royalties Growth
Source: Queensland Treasury
GST Revenue
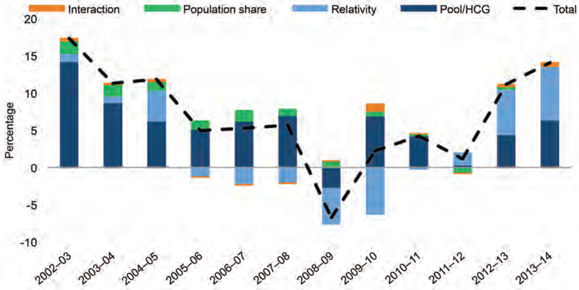
The amount each state receives in GST revenue is determined by: the size of the GST pool; its share of the national population; and its relativity determined by the Commonwealth Grants Commission (CGC).
Queensland’s GST revenue grew by an average rate of 7.5% across 2001-02 to 2007-08. Growth in the GST pool was supported by strength in household consumption and dwelling investment activity, which were sustained by high levels of consumer confidence and partly funded by increases in household borrowings. Queensland’s relativity however declined as the mining boom delivered strong growth in royalty revenue. GST growth then eased to an average annual growth of 4.3% in the six years to 2013-14, as the global economic downturn weighed on domestic activity.
In 2012-13 and 2013-14, the strong growth in Queensland’s GST revenue was driven both by changes to Queensland’s relativity calculations resulting in the State receiving a greater proportion of the total nationwide GST pool and growth in the pool.
30
2015 Review of State Finances
Chart 2.8
Queensland Growth in GST Revenue
(General Government sector, percentage contribution to total growth)
Source: Queensland Treasury
Taxation
Annual growth in transfer duty averaged 19.4% in the six years to 2007-08, driven by a range of factors including Queensland’s relative affordability of housing, high population growth and the impact of the burgeoning mining sector. This was a key contributor to total taxation growth of 12.2% per annum over this period.
The downturn in economic conditions following the GFC caused transfer duty to fall 38% in 2008-09, as business conditions eased and the housing market slowed. Transfer duty has since remained broadly at that level for several years. Strong growth in 2013-14 in part reflected duty on some major business transactions, including the sale of Queensland Motorways Limited (QML).
31
2015 Review of State Finances
Chart 2.9
Transfer Duty Revenue
Source: Queensland Treasury
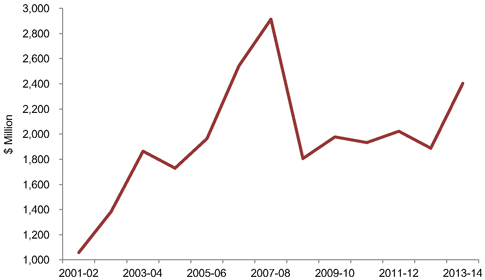
Royalty Revenue
The vast majority of Queensland’s royalty revenue is derived from coal exports.
Royalty revenue grew strongly between 2000-01 and 2007-08, with growth of around 50% in both 2004-05 and 2005-06, due to a surge in the hard coking coal contract price. In contrast to the other own-source revenues, royalty revenues peaked in 2008-09. Floods in Queensland temporarily restricted supply and hard coking and thermal coal contract prices rose to US$ 300/t and US$ 125/t respectively, while the GFC drove a 17% depreciation in the Australian dollar (A$) in that year.
The locked-in contract prices resulted in coal royalties increasing by over 200% in 2008-09, as the higher prices also resulted in higher effective rates of royalties paid (with Queensland operating a progressive royalty rate system from 1 July 2008 – 7% of the coal price per tonne up to the first $100, and 10% for the balance of the price).
32
2015 Review of State Finances
Chart 2.10
Coal Royalty Revenue
Source: Queensland Treasury
Parameters unwound in 2009-10 with the A$ appreciating and coal contract prices falling. This more than offset the growth in coal export volumes and royalty revenue fell significantly. Coal royalties recovered somewhat in 2010-11 and 2011-12 as floods, Cyclone Yasi and industrial action restricted supply and temporarily boosted international coal prices. A higher A$ and lower production volumes however constrained the extent of the recovery in coal royalties.
Since then, coal prices have declined, and with the A$ remaining resiliently high for much of this period, royalty revenues fell in 2012-13. Coal royalties recovered slightly in 2013-14 as volumes increased and the A$ weakened.
Chart 2.11
Coal Contract Prices
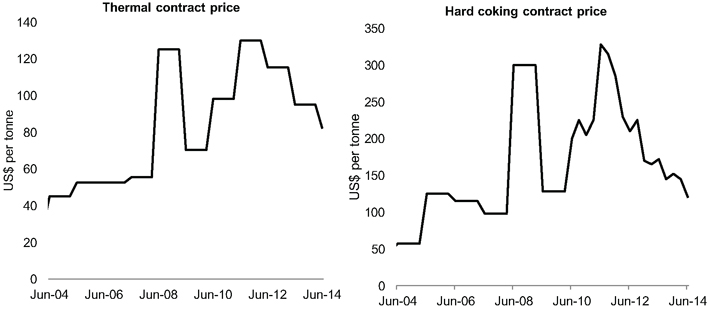
Source: Queensland Treasury; Consensus Forecasts
33
2015 Review of State Finances
| 2.4 | HORIZONTAL FISCAL EQUALISATION |
Any government managing state finances in Australia needs to understand the implications of Horizontal Fiscal Equalisation (HFE). The CGC advises the Australian Government on the distribution of GST revenue among the states based on HFE.
The objective of HFE is to distribute GST in a way that provides all states and territories with the same fiscal capacity to deliver a standard set of services – after taking into account jurisdictions’ expenditure needs and revenue raising capacities.
With revenues and expenditure equalised, it is a state’s policy settings that determines its relative budget outcomes. The Chart below uses CGC data to compare Queensland’s expenditure effort with its tax effort. For many years now, there has been a misalignment between the two.
Chart 2.12
Comparison of Queensland Effort Ratios: Total Tax and Total Expenditure
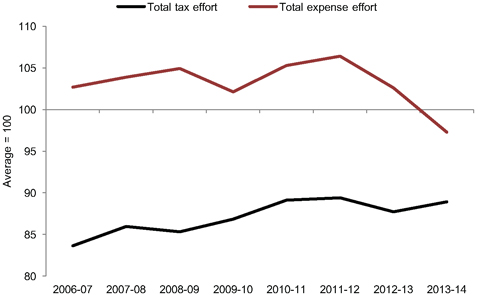
Source: Queensland Treasury
Some of the remedial measures taken over recent years, and most recently the spending reductions in the 2012-13 Budget, have partially addressed the imbalance. The full year impact of those measures, which resulted in no growth in General Government expenditure in 2013-14, is shown in the above Chart. 2013-14 would be rightly regarded as an outlier.
34
2015 Review of State Finances
Generally, and with the notable exception of Disability Services (being addressed as part of the NDIS), Queensland’s expenditure effort is at or above national average levels, but its tax effort (85% to 90%) is below national average levels. The Chart below shows Queensland’s relative effort in the major tax categories assessed by the CGC.
Chart 2.13
Queensland Taxation Effort by Category
2013-14
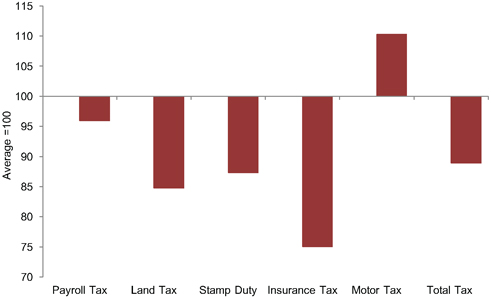
Source: Queensland Treasury
This is important to understanding Queensland’s relative fiscal distress. To put this in context, had Queensland’s tax and expenditure effort been aligned over the decade 2003-04 to 2012-13, Queensland’s General Government debt would currently be in the order of $10 billion to $15 billion lower.
HFE is also important in the context of public debates about how states such as Queensland and Western Australia should ‘use’ their royalty revenues.
An economy that is performing relatively strongly in terms of generating revenue does not compensate for an imbalance in the revenue and expenditure policy mix or inefficiencies in service delivery. Western Australia’s credit rating was downgraded last year despite averaging real economic growth of 6% over the last decade – a performance that would probably put it amongst the strongest performing sub-national economies in the developed world.
The net impact of the HFE process is that royalty revenue is redistributed between all of the states and territories through their GST distribution. Higher royalty revenue in Queensland and Western Australia simply means less GST revenue for Queensland and Western Australia.
35
2015 Review of State Finances
The magnitude of Queensland’s capital expenditure effort during the period 2000-01 to 2012-13 is hard to overstate. Some of the more significant infrastructure project decisions taken during this time are detailed in the Box below. This does not include the South East Queensland (SEQ) water assets and natural disaster related expenditure which is covered separately.
Box 2.2
Significant Infrastructure Project Decisions
2000-01
| • | | Citytrain Rollingstock Programs. |
2002-03
| • | | Introduction of the Preparatory Year of Schooling. |
2004-05
2005-06
| • | | CityTrain MetTRIP Track Infrastructure Upgrades. |
2006-07
| • | | Education - Tomorrow’s Schools. |
2007-08
| • | | Lady Cilento Children’s Hospital (formerly Queensland Children’s Hospital). |
| • | | Sunshine Coast University Hospital. |
| • | | Gold Coast University Hospital. |
| • | | Queensland Rail Citytrain Rollingstock. |
| • | | Gateway Upgrade Project. |
| • | | State Schools of Tomorrow. |
2008-09
| • | | Brisbane Supreme and District Court Complex. |
| • | | Darra to Springfield Transport Corridor. |
| • | | Lotus Glen Correctional Centre. |
2009-10
| • | | Bruce Highway – Cooroy to Curra Upgrade. |
2010-11
| • | | Flying Start – Move Year 7 to High School. |
| • | | Cairns Base, Mackay Base and Townsville Hospital Redevelopments. |
2011-12
| • | | 2018 Gold Coast Commonwealth Games. |
2012-13
| • | | Upgrade of the Bruce Highway Package. |
2013-14
| • | | New Generation Rollingstock. |
36
2015 Review of State Finances
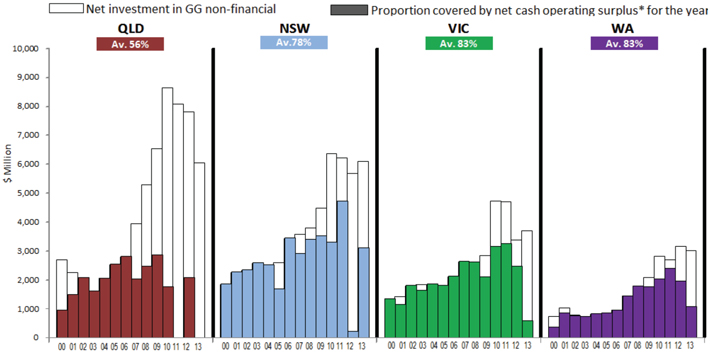
The best way to illustrate Queensland’s capital expenditure effort during this period is by comparing Queensland’s General Government capital expenditure to New South Wales, Victoria and Western Australia. This is shown below in both absolute and per capita terms. Queensland was outspending these states on both measures.
The first Chart also shows the proportion of the spending that was funded from recurrent sources – the cash operating surplus. In terms of reliance on borrowing to fund capital expenditure, Queensland went from no reliance, to partial reliance, to full reliance on borrowings.
Although the rapid increase in expenditure took place between 2006-07 and 2009-10, many of the decisions which gave rise to the expenditure were made in the earlier part of the decade. There is a considerable lag between major project instigation and peak expenditure. By the time the extent of the deterioration in the fiscal climate became clear, most of the projects were past the point where cessation would have represented a sensible public policy outcome. This was the case in pragmatic terms regardless of the merits or otherwise of the post GFC-stimulus arguments made at the time.
Chart 2.14
Net Investment in General Government Non-Financial Assets
1999-00 to 2012-13
Source: ABS; Government Finance Statistics Australia 2008-09 and 2012-13
37
2015 Review of State Finances
Chart 2.15
Net Investment in General Government Non-Financial Assets per Capita
1999-00 to 2012-13
Source: ABS; Government Finance Statistics Australia 2008-09 and 2012-13
While this Review focusses on the cost and the debt implications of the expenditure, there are also undeniable benefits. Queensland has less traffic congestion, better facilities, new hospitals, roads and bridges. SEQ water security is effectively underwritten for decades to come. Unlike in some states, there is minimal public discourse around an ‘infrastructure crisis’.
Just as the infrastructure program was a large part of the reason behind Queensland’s rapid rise in debt, the budget now needs to realise the benefit of that investment through much lower expenditure expectations for the foreseeable future.
If anything, with such a sizeable infrastructure footprint, there needs to be a reweighting of emphasis away from new projects and towards demand management measures and better maintenance of the existing asset base.
THE SOUTH EAST QUEENSLAND WATER CRISIS
From 2001 to 2009, SEQ experienced a prolonged drought. During this time, the combined levels of the region’s three chief water storages – Wivenhoe, Somerset and North Pine Dams – fell below 17%. Serious concerns were held around the security of SEQ’s water supply if the drought continued.
In August 2006, the Government approved a range of measures in response to the critical depletion of regional storages, including the construction of major new supply assets.
The drought-response assets included around 20 infrastructure projects, ranging from additional ground water supplies, the Gold Coast Desalination Plant, the Western Corridor Recycled Water Scheme and new dams and weirs. The Government also purchased SEQ council owned assets. Between 2006-07 and 2008-09 the State raised $7.4 billion in debt to pay for this water infrastructure.
The assets form the basis of the SEQ Water Grid.
38
2015 Review of State Finances
There will always be questions as to whether the pace and scale of the Government’s response was proportionate. However, there was a crisis and based on the information available to Government at the time a significant response was required.
However necessary the response was, it was nonetheless a significant blow to the State’s balance sheet and credit metrics.
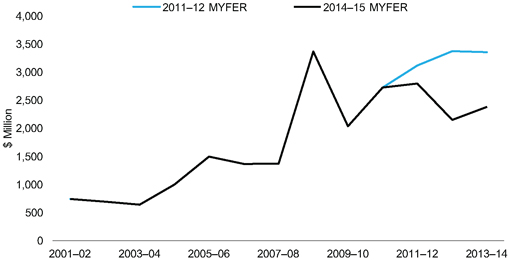
The assets were almost fully debt-funded. In order to mitigate the price impact on consumers, the Government instigated a ten year price path to cost reflective pricing. This means that water infrastructure related debt will peak at $9.4 billion, $2 billion above the cost of the assets, by 2015-16 before reducing as the price path progressively recovers the debt through water charges.
Chart 2.16
Debt connected with SEQ drought response
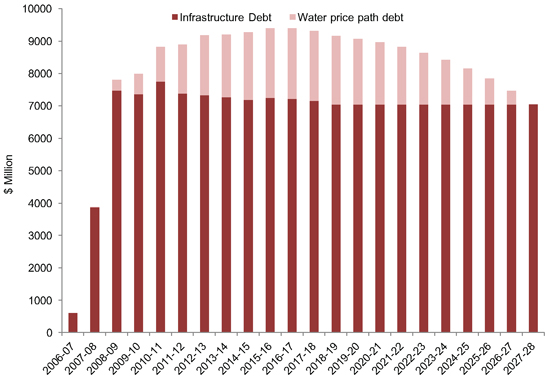
Source: Queensland Treasury, various sources
Unlike the debt held by the State’s Government Owned Corporations, the ratings agencies do not consider this debt to be self-supporting.
As history now shows, one of the most severe droughts in Queensland’s history was ended by one of the most severe floods in Queensland’s history.
39
2015 Review of State Finances
NATURAL DISASTERS
Chart 2.17
A Decade of Natural Disaster Events in Queensland – Costs
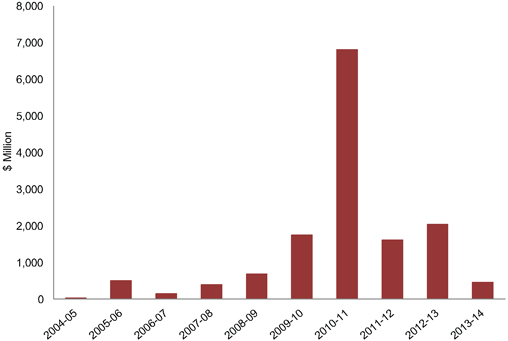
Source: Queensland Treasury
Queensland’s natural disasters have had a significant cost, in financial, economic and most importantly human terms.
In net fiscal terms though, the cost of this unprecedented series of natural disasters to the Budget is much less than the cost of the water grid. This is because the Australian federation, quite appropriately, has supportive risk sharing arrangements. Under these arrangements, and with certain thresholds and exclusions, the Australian Government contributes 75% towards the cost of repair and recovery.
The financial flows associated with the expenditure, and revenues from the Australian Government, have added an additional level of complexity to the presentation of Queensland’s fiscal position that continues to this day.
40
2015 Review of State Finances
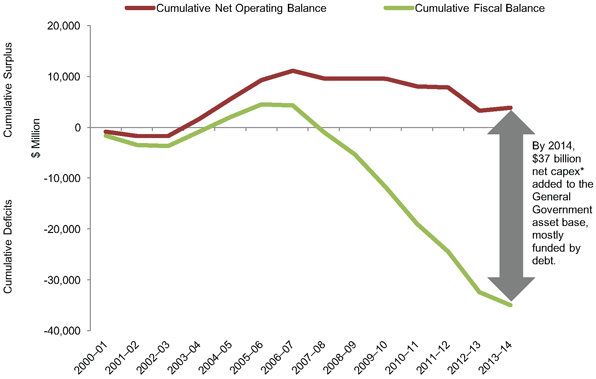
| 2.6 | BRINGING THE PIECES TOGETHER |
The Charts below bring together three key aggregates to illustrate the relationship between the operating surplus (recurrent revenue and expenditure), the fiscal balance (to incorporate capital expenditure) and debt. For completeness, the net debt balance is also shown.
There was a net operating surplus throughout much of the period 2000-01 to 2013-14, but the size of the operating surplus was insufficient to provide funding to support what can only be described as a historically significant surge in capital expenditure. As a consequence, the capital expenditure was funded increasingly by debt.
In other words, if the sole responsibility of the State was the provision of recurrent expenditure, an operating surplus would have been sufficient and Queensland would not have a debt problem. However, the State does have significant infrastructure responsibilities. The size of the operating balance needs to be proportionate to Queensland’s infrastructure obligations and ambitions.
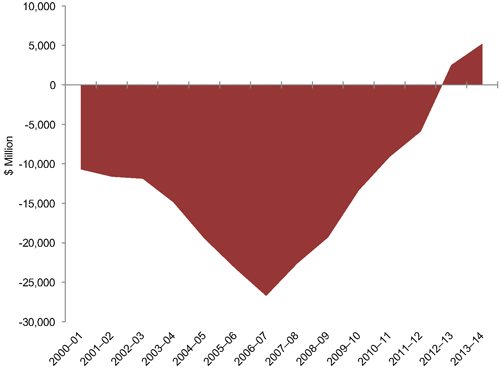
Chart 2.18
Cumulative Net Operating Balance and Fiscal Balance
2000-01 to 2013-14
Source: Queensland Treasury
41
2015 Review of State Finances
Chart 2.19
General Government Gross Debt Balance
2000-01 to 2013-14
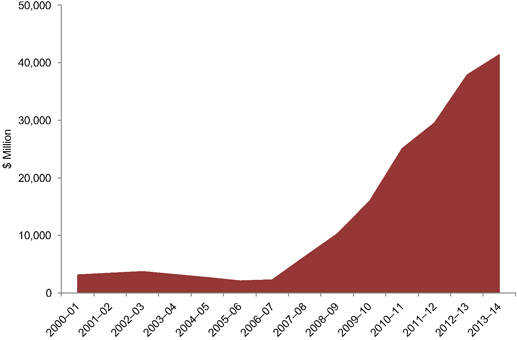
Source: Queensland Treasury
Chart 2.20
General Government Net Debt Balance
2000-01 to 2013-14
Source: Queensland Treasury
42
2015 Review of State Finances
Following the GFC and the subsequent downgrade in Queensland’s credit rating, there has been much greater awareness within Government of the causes of Queensland’s fiscal difficulties as outlined in this Chapter. Since then, successive governments have undertaken remedial measures in an effort to address/stabilise the situation. The significant remedial measures are detailed in the Box below.
There has also been greater restraint shown in relation to new expenditure, with the notable exception of the ultimately successful bid to host the 2018 Commonwealth Games. The decision to participate in NDIS was costly, but understandable in light of Queensland’s historic under-provision in this important area and the better standards of service and care it is intended to provide.
While election commitments have generally been ‘funded’, the funding offsets have been public sector savings – savings which otherwise could have contributed towards the budget repair task.
The culmination of these remedial efforts is a Budget and debt position that at the time of the 2014-15 MYFER had been broadly stabilised, but with little room for expansionary policy. As is the case with the Australian Government and Western Australian budgets, and although less significant in relative terms, Queensland faces ongoing revenue challenges associated with the ongoing rebalancing of world commodity prices and consequent adverse impact on mining royalty revenue.
43
2015 Review of State Finances
Box 2.3
Significant Remedial Measures1
Post 2008-09 Budget
2008-09 Major Economic Statement
| • | | Introduced a Public Sector Efficiency Target. |
| • | | Increased Motor Vehicle Registration Fees. |
| • | | Delayed the Abolition of Transfer Duty on Core Business Assets to 1 July 2012. |
| • | | Introduced a Land Tax Surcharge of 0.5% on aggregate land holdings in excess of $5 million. |
| • | | Closed the QSuper Defined Benefit Scheme to new members. |
2009-10 Budget
| • | | Abolished the Queensland Fuel Subsidy Scheme. |
| • | | Increased the Public Sector Efficiency Target. |
| • | | Further delayed the Abolition of Transfer Duty on Core Business Assets to 1 July 2013. |
| • | | Reduced Local Government Grants and Subsidies. |
| • | | A package of GOC Reforms aimed at increasing rates of return. |
| • | | Asset sales: Forestry Plantations Queensland; Queensland Motorways Limited; Port of Brisbane; QR Limited above and below rail coal business and assets; Abbot Point Coal Terminal. |
2010-11 Budget
| • | | Increased the Public Sector Efficiency Target. |
2010-11 Mid-Year Fiscal and Economic Review
| • | | Introduced a Voluntary Separation Program. |
| • | | Increased the Public Sector Efficiency Target. |
| • | | Removed the Principal Place of Residence Concession for Transfer Duty. |
2011-12 Mid-Year Fiscal and Economic Review
| • | | Increased the Voluntary Separation Program. |
| • | | Further delayed the Abolition of Transfer duty on Core Business Assets – until “the Budget can accommodate the abolition”. |
| • | | Introduced Cash Bidding for Prospective Exploration Land and applied Transfer Duty on the Transfer of Mining Tenures. |
2012-13 Budget
| • | | Major package of fiscal repair measures – comprising expenditure reductions, revenue measures and capital savings. This included a material reduction in the public service of 14,000 FTEs. |
| • | | Increased the Transfer Duty Rate for transactions valued at or above $1 million. |
| • | | Increased the Coal Royalty Rate on values above $100 per tonne. |
| • | | Restricted First Home Owner Grant to those buying or building new homes. |
2013-14 Budget
| • | | Increased the Duty Rate on General Insurance Products. |
| • | | Deferred the next Payroll Tax Threshold increase to $1.2 million to 1 July 2015. |
| • | | Extended the Urban Fire Levy to all property receiving a rates notice – renamed the Emergency Management, Fire and Rescue Levy. |
| • | | Increased the Public Sector Efficiency Target. |
| 1. | ‘Significant’ in this context are measures in excess of $50 million per annum. Does not include measures used to fund election commitments, as these did not contribute towards Budget repair. |
44
2015 Review of State Finances
| 3. | INTERSTATE COMPARISON OF BALANCE SHEET AGGREGATES |
This Chapter compares the balance sheet aggregates of Queensland’s General Government sector with other large states. Tasmania, Australian Capital Territory and the Northern Territory are not included in the analysis. Key characteristics of the comparator states are outlined in the Table below.
Table 3.1
Comparison of Key Statistics – Australian States
| | | | | | | | | | | | | | | | | | | | |
2013-14 | | QLD | | | NSW | | | VIC | | | WA | | | SA | |
Total Area (Km2) | | | 1,730,648 | | | | 800,642 | | | | 227,416 | | | | 2,529,875 | | | | 983,482 | |
Population (Persons) | | | 4,722,447 | | | | 7,518,472 | | | | 5,841,667 | | | | 2,573,389 | | | | 1,685,714 | |
Population Density (Person/Km2) | | | 3 | | | | 9 | | | | 26 | | | | 1 | | | | 2 | |
Gross State Product ($ million) | | | 296,341 | | | | 492,478 | | | | 350,343 | | | | 264,545 | | | | 96,977 | |
GSP per capita ($) | | | 62,752 | | | | 65,502 | | | | 59,973 | | | | 102,800 | | | | 57,529 | |
Source: ABS 3101.04; ABS 5220.01; Geoscience Australia
Queensland is the third most populated state in Australia after New South Wales and Victoria, with a land mass only surpassed by Western Australia. Queensland is the third largest economy in Australia, as measured by GSP.
There are a number of key balance sheet aggregates contained in the Government Finance Statistics (GFS) framework. These are broadly:
| • | | Gross Debt = borrowings balance |
| • | | Net Debt = gross debt offset by financial assets (other than equity investments in other Public Sector Entities) |
| • | | Net Financial Liabilities = net debt plus other financial liabilities |
| • | | Net Financial Worth = financial assets less total liabilities |
| • | | Net Worth = net financial worth plus total non-financial assets |
For comparability purposes, the Chapter uses General Government sector data. In addition to the raw data, comparisons are provided in per capita terms and as a proportion of GSP.
45
2015 Review of State Finances
| 3.2 | GENERAL GOVERNMENT GROSS DEBT |
Gross debt is defined as borrowings that require payment or payments of interest and/or principal by the debtor to the creditor at a date or dates in the future.
As at 30 June 2014, Queensland had the highest General Government Gross Debt.
Chart 3.1
General Government (GG) Gross Debt
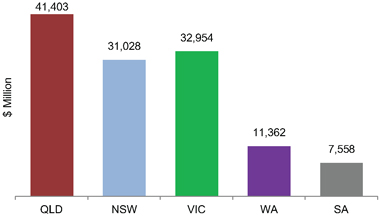
Source: 2013-14 Report on State Finances for Qld, NSW, Vic and WA; 2013-14 Mid-year Budget Review SA
Similarly, Queensland’s gross debt is highest when expressed as a proportion of GSP (14%) and in per capita terms ($8,767).
| | |
Chart 3.2 GG Gross Debt / GSP | | Chart 3.3 GG Gross Debt / Person |
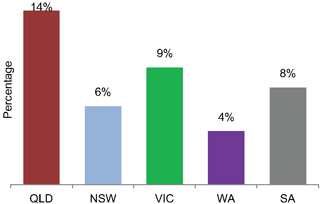 | | 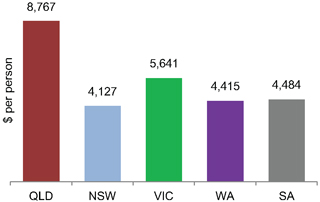 |
Source: 2013-14 Report on State Finances for Qld, NSW, Vic and WA; 2013-14 Mid-year Budget Review SA; ABS 3101.04, ABS 5220.01
46
2015 Review of State Finances
| 3.3 | GENERAL GOVERNMENT NET DEBT |
Net debt is gross debt less certain financial assets (cash and other liquid assets, such as investment, loans and placements).
Net debt is one of the most commonly quoted and well known measures of a government’s financial strength.
Net debt is however only a partial indicator of the government’s financial strength, as not all government assets or liabilities are included. As an example, unfunded superannuation is not included in the calculation of net debt. However, the financial assets allocated to support this liability are included.
As at 30 June 2014, Queensland had the lowest General Government net debt due to the significant financial assets it holds to meet its superannuation liabilities. This compares favourably to other states that have only partially funded their long term superannuation liabilities.
Chart 3.4
GG Net Debt
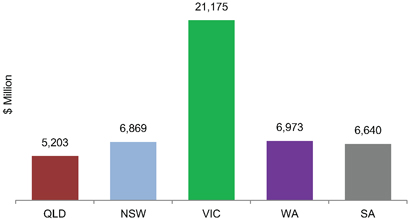
Source: 2013-14 Report on State Finances for Qld, NSW, Vic and WA; 2013-14 Mid-year Budget Review SA
New South Wales has the lowest General Government net debt when expressed as a proportion of GSP and in per capita terms. On these measures, Queensland is ranked second with net debt of 2% of GSP and $1,102 per person.
47
2015 Review of State Finances
| | |
Chart 3.5 GG Net Debt / GSP | | Chart 3.6 GG Net Debt / Person |
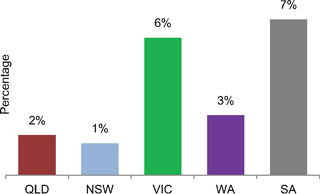 | | 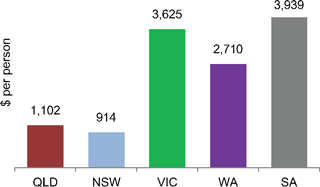 |
Source: 2013-14 Report on State Finances for Qld, NSW, Vic and WA; 2013-14 Mid-year Budget Review SA; ABS 3101.04, ABS 5220.01
| 3.4 | GENERAL GOVERNMENT NET FINANCIAL LIABILITIES |
Net financial liabilities is total liabilities less financial assets (other than equity investments in other Public Sector Entities).
It is a broader measure than net debt as it includes accrued employee liabilities such as superannuation and long service leave entitlements and demonstrates the State’s liquidity position and ability to meet obligations when they become due.
As at 30 June 2014, Queensland’s General Government net financial liabilities were lower than New South Wales and Victoria, but higher than South Australia and Western Australia.
Chart 3.7
GG Net Financial Liabilities
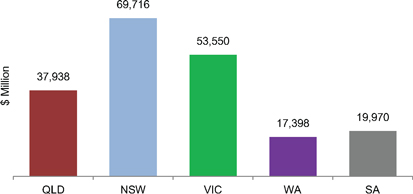
Source: 2013-14 Report on State Finances for Qld, NSW, Vic and WA; 2013-14 Mid-year Budget Review SA
Queensland’s relative position improves when expressed as a proportion of GSP and in per capita terms. On these measures, Queensland ranks second with net financial liabilities of 13% of GSP and $8,034 per person.
48
2015 Review of State Finances
| | |
Chart 3.8 GG Net Financial Liabilities / GSP | | Chart 3.9 GG Net Financial Liabilities / Person |
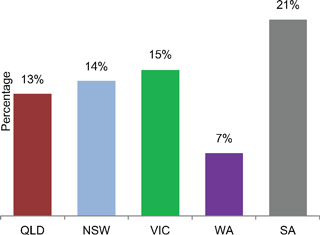
| | 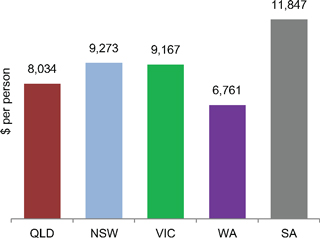
|
Source: 2013-14 Report on State Finances for Qld, NSW, Vic and WA; 2013-14 Mid-year Budget Review SA; ABS 3101.04, ABS 5220.01
| 3.5 | GENERAL GOVERNMENT NET FINANCIAL WORTH |
Net financial worth is the total value of financial assets less total liabilities. This is a measure of a state’s ability to meet its obligations on the basis that all financial assets, including investments in other Public Sector Entities, can in theory be liquidated if necessary. As such, it is a broader measure than net debt and net financial liabilities.
As at 30 June 2014, Queensland recorded the lowest (and negative) net financial worth. All other states by comparison recorded positive net financial worth despite not having fully funded their superannuation liabilities.
Chart 3.10
GG Net Financial Worth
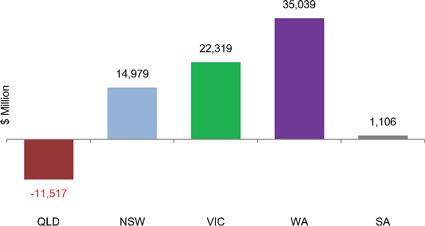
Source: 2013-14 Report on State Finances for Qld, NSW, Vic and WA; 2013-14 Mid-year Budget Review SA
49
2015 Review of State Finances
Because of the negative net financial worth, Queensland ranks last as a proportion of GSP and in per capita terms.
| | |
Chart 3.11 GG Net Financial Worth / GSP | | Chart 3.12 GG Net Financial Worth / Person |
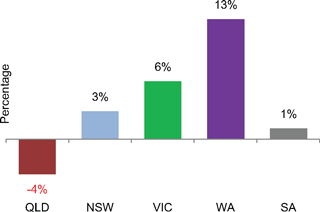 | | 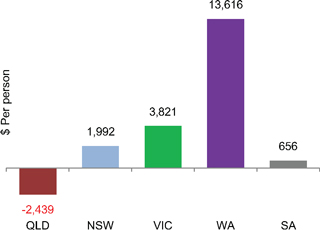 |
Source: 2013-14 Report on State Finances for Qld, NSW, Vic and WA; 2013-14 Mid-year Budget Review SA; ABS3101.04, ABS5220.01
These results are counter-intuitive having regard to Queensland’s strong net financial asset position and warranted further investigation. In addition to institutional differences (e.g. whether assets are state or local government), other states take a much broader view as to the entities and assets that reside outside of the General Government sector. It explains why states such as Victoria and South Australia, both of whom privatised the bulk of their GOCs many years ago, have higher levels of ‘investment in other Public Sector Entities’ than Queensland. The value of this measure for comparative purposes is therefore highly questionable.
| 3.6 | GENERAL GOVERNMENT NET WORTH |
Net worth is total assets less total liabilities. This measure includes both financial and non-financial assets and is therefore the broadest of measures.
Queensland’s General Government net worth of $169.3 billion is higher than all other states.
50
2015 Review of State Finances
Chart 3.13
GG Net Worth
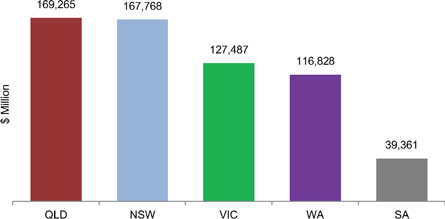
Source: 2013-14 Report on State Finances for Qld, NSW, Vic and WA; 2013-14 Mid-year Budget Review SA
Queensland also recorded the highest General Government net worth as a proportion of GSP, and was only exceeded by Western Australia in per capita terms.
| | |
Chart 3.14 GG Net Worth / GSP | | Chart 3.15 GG Net Worth / Person |
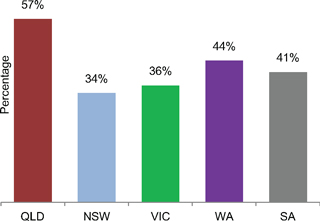
| | 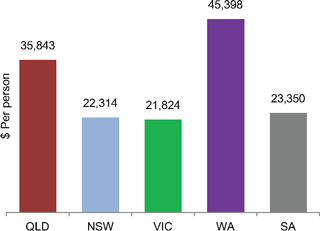 |
Source: 2013-14 Report on State Finances for Qld, NSW, Vic and WA; 2013-14 Mid-year Budget Review SA; ABS3101.04, ABS5220.01
As was the case with the net financial worth measure, net worth also has limitations. In particular, the inclusion or exclusion of certain non-financial assets and different valuation methodologies affect the outcomes.
51
2015 Review of State Finances
In addition, to the extent that a state has a high proportion of non-financial assets on its balance sheet, and these assets are required for service delivery (e.g. roads), then these assets are in effect non-realisable. This calls into question the value of net worth as a true measure of fiscal strength.
| 3.7 | GENERAL GOVERNMENT DEBT TO REVENUE |
For both the public and private sectors, debt serviceability is a key focus of rating agencies and analysts. These measures typically look at the levels of debt compared to revenues or net income and the ability to meet interest costs through interest coverage ratios. For Australian state governments, the common measure of debt serviceability is the level of General Government debt to General Government revenue (on the basis that most government owned businesses in the Non-financial Public sector are self-supporting).
Queensland had the lowest debt to revenue ratio until 2004-05. Queensland’s current debt to revenue ratio of around 90% is the highest of the states by a clear margin.
Chart 3.16
GG Debt to Revenue %
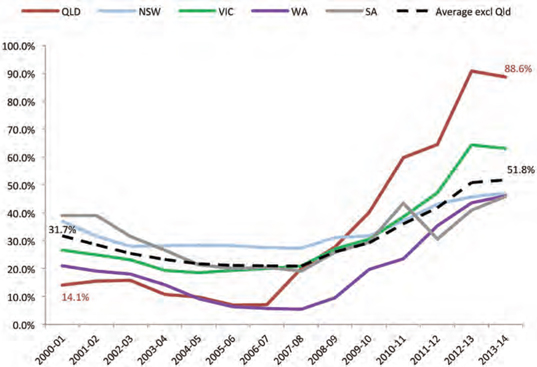
Source: 2013-14 Report on State Finances for Qld, NSW, Vic and WA; 2013-14 Mid-year Budget Review SA; ABS, Government Finance Statistics Australia 2008-09 and 2012-13
52
2015 Review of State Finances
The table below provides the ranking of the states, at 30 June 2014, based on the metrics discussed in this Chapter.
Again, the utility of the net financial worth (where Queensland ranks last) and net worth (where Queensland ranks first) measures are limited by differences in the classification of entities and approaches to asset valuation.
Nonetheless, Queensland has a vast balance sheet as measured by its General Government net worth, while the long standing policy of fully funding accruing employee entitlements see it comparatively well placed in terms of net debt and net financial liabilities. Equally though, the gross debt, net financial worth and debt to revenue measures highlight Queensland’s debt challenge.
Table 3.2
Comparison of Key Metrics – Australian States
| | | | | | | | | | | | | | | | | | | | |
Ranking (1=best to 5=worst) | | QLD | | | NSW | | | VIC | | | WA | | | SA | |
Gross Debt | | | 5 | | | | 3 | | | | 4 | | | | 2 | | | | 1 | |
Net Debt | | | 1 | | | | 3 | | | | 5 | | | | 4 | | | | 2 | |
Net Financial Liabilities | | | 3 | | | | 5 | | | | 4 | | | | 1 | | | | 2 | |
Net Financial Worth | | | 5 | | | | 3 | | | | 2 | | | | 1 | | | | 4 | |
Net Worth | | | 2 | | | | 1 | | | | 3 | | | | 4 | | | | 5 | |
| | | | | |
$ Gross Debt / Person | | | 5 | | | | 1 | | | | 4 | | | | 2 | | | | 3 | |
$ Net Debt / Person | | | 2 | | | | 1 | | | | 4 | | | | 3 | | | | 5 | |
$ Net Financial Liabilities / Person | | | 2 | | | | 4 | | | | 3 | | | | 1 | | | | 5 | |
$ Net Financial Worth / Person | | | 5 | | | | 3 | | | | 2 | | | | 1 | | | | 4 | |
$ Net Worth / Person | | | 1 | | | | 2 | | | | 3 | | | | 4 | | | | 5 | |
| | | | | |
Gross Debt / GSP | | | 5 | | | | 2 | | | | 4 | | | | 1 | | | | 3 | |
Net Debt / GSP | | | 2 | | | | 1 | | | | 4 | | | | 3 | | | | 5 | |
Net Financial Liabilities / GSP | | | 2 | | | | 3 | | | | 4 | | | | 1 | | | | 5 | |
Net Financial Worth / GSP | | | 5 | | | | 3 | | | | 2 | | | | 1 | | | | 4 | |
Net Worth / GSP | | | 1 | | | | 3 | | | | 2 | | | | 5 | | | | 4 | |
| | | | | |
GG Debt / Revenue | | | 5 | | | | 3 | | | | 4 | | | | 2 | | | | 1 | |
53
2015 Review of State Finances
| 4. | FORWARD ESTIMATES – ASSUMPTIONS AND RISKS |
One of the key roles of Treasury is to develop a set of forward estimates on a ‘no policy change’ basis. This means endeavouring to ensure (a) the forward estimates capture the formal decisions of Government up to a particular point in time; and (b) the forward estimates reflect the publicly espoused policy positions of Government.
The other element of forward estimates development is the formulation of expenditure and revenue estimates that align with the ‘base case’ projections for the economy.
Many variables, particularly those involving markets, are subject to constant change. At some point in the Budget/MYFER process, Treasury needs to ‘rule a line’ on further changes other than for exceptional circumstances.
In the 2014-15 MYFER, the General Government sector was expected to deliver a modest operating deficit in 2014-15, before moving into operating surpluses of approximately $3 billion per annum from 2015-16 onwards.
After taking into account net capital purchases, the fiscal balance was expected to remain in deficit in 2014-15, with fiscal surpluses projected from 2015-16 onwards.
Table 4.1
2014-15 MYFER
Key General Government Aggregates
| | | | | | | | | | | | | | | | | | | | |
| | | 2013-14
Actual
$ million | | | 2014-15
Revised
$ million | | | 2015-16
Projection
$ million | | | 2016-17
Projection
$ million | | | 2017-18
Projection
$ million | |
Revenue | | | 46,734 | | | | 49,149 | | | | 52,951 | | | | 54,510 | | | | 56,270 | |
Tax Revenue | | | 11,845 | | | | 12,598 | | | | 12,990 | | | | 13,613 | | | | 14,273 | |
Expenses | | | 46,115 | | | | 49,213 | | | | 49,873 | | | | 51,390 | | | | 53,259 | |
Employee Expenses | | | 17,817 | | | | 18,610 | | | | 19,436 | | | | 20,038 | | | | 20,698 | |
Net Operating Balance | | | 619 | | | | (64 | ) | | | 3,078 | | | | 3,120 | | | | 3,011 | |
Capital Purchases | | | 6,322 | | | | 5,903 | | | | 6,089 | | | | 5,768 | | | | 5,496 | |
Net Capital Purchases | | | 3,200 | | | | 2,778 | | | | 2,747 | | | | 2,903 | | | | 2,376 | |
Fiscal Balance | | | (2,581 | ) | | | (2,842 | ) | | | 331 | | | | 216 | | | | 634 | |
Gross Borrowing | | | 41,403 | | | | 45,801 | | | | 46,097 | | | | 46,630 | | | | 47,072 | |
Net Debt | | | 5,203 | | | | 8,021 | | | | 7,426 | | | | 6,999 | | | | 6,630 | |
Source: 2014-15 Queensland Mid-year Fiscal and Economic Review
54
2015 Review of State Finances
The timing of revenue and expenditure flows in relation to natural disasters has a significant impact on Queensland’s fiscal aggregates. The 2014-15 MYFER identified the impact of disaster recovery revenue and expenditure on the fiscal balance in the following table, which demonstrated an improvement in the underlying fiscal position in each year of the forward estimates.
Table 4.2
2014-15 MYFER
Underlying Fiscal Balance
| | | | | | | | | | | | | | | | |
| | | 2014-15
Revised
$ million | | | 2015-16
Projection
$ million | | | 2016-17
Projection
$ million | | | 2017-18
Projection
$ million | |
Fiscal balance | | | (2,842 | ) | | | 331 | | | | 216 | | | | 634 | |
less Disaster recovery revenue | | | 950 | | | | 1,828 | | | | 82 | | | | — | |
add Disaster recovery expenditure | | | 1,556 | | | | 333 | | | | — | | | | — | |
Underlying fiscal balance | | | (2,236 | ) | | | (1,164 | ) | | | 134 | | | | 634 | |
Source: 2014-15 Queensland Mid-year Fiscal and Economic Review
The 2014-15 MYFER estimated that revenue would increase by an average of 4.8% per annum over the period 2013-14 to 2017-18, which would result in revenue declining as a share of GSP. The average rate of growth in revenue over the period 2007-08 to 2013-14 was 6.8% per annum.
The 2014-15 MYFER incorporated downward revisions to taxation forecasts. This primarily reflected a weaker outlook for payroll tax, consistent with a more subdued labour market outlook. The payroll tax revision was partly offset by a stronger outlook for transfer duty, reflecting a number of large ‘extraordinary’ transactions in 2014-15, supported by strength in the residential property market.
Table 4.3
2014-15 MYFER
Payroll Tax and Transfer Duty Forecasts
| | | | | | | | | | | | | | | | |
| | | 2014-15
$ million | | | 2015-16
$ million | | | 2016-17
$ million | | | 2017-18
$ million | |
Payroll Tax | | | 3,955 | | | | 4,073 | | | | 4,278 | | | | 4,537 | |
Growth (%) | | | 1.0 | % | | | 3.0 | % | | | 5.0 | % | | | 6.1 | % |
Transfer Duty | | | 2,883 | | | | 2,919 | | | | 3,067 | | | | 3,183 | |
Growth (%) | | | 20.0 | % | | | 1.3 | % | | | 5.0 | % | | | 3.8 | % |
Source: 2014-15 Queensland Mid-year Fiscal and Economic Review
55
2015 Review of State Finances
Across the forward estimates, payroll tax growth projections reflect expectations of a further year of subdued employment and wage growth in 2015-16, before improving somewhat from 2016-17 onwards. The transfer duty growth projections for 2015-16 reflected further strength in residential property, partly offset by lower expectations of major transactions. The growth rates in 2016-17 and 2017-18 assumed a moderation of growth in both the volume and average value of transactions.
Since MYFER, payroll tax collections have weakened further, while transfer duty collections have strengthened.
The 2014-15 MYFER assumptions for Queensland’s GST were more conservative than those presented in the Commonwealth Mid Year Economic and Fiscal Outlook.
The royalty forecast provided in the 2014-15 MYFER were based on assumptions in relation to:
| • | | Commodity prices (with coking coal, thermal coal and oil being the most significant) |
| • | | The Australian dollar – US$ exchange rate |
| • | | Export volumes (with coking coal, thermal coal and LNG being the most significant). |
Table 4.4
2014-15 MYFER
Royalty Assumptions
| | | | | | | | | | | | | | | | |
| | | 2014-15 | | | 2015-16 | | | 2016-17 | | | 2017-18 | |
Exchange Rate | | | 0.87 | | | | 0.84 | | | | 0.84 | | | | 0.84 | |
| | | | |
Coal Price ($US) | | | | | | | | | | | | | | | | |
Hard coking | | | 124 | | | | 140 | | | | 150 | | | | 156 | |
Semi-soft/PCI | | | 100 | | | | 109 | | | | 119 | | | | 125 | |
Thermal | | | 81 | | | | 80 | | | | 84 | | | | 89 | |
| | | | |
Oil Price ($US/barrel) | | | 80 | | | | 82.5 | | | | 84 | | | | 85 | |
| | | | |
Coal Volume (Mt) | | | | | | | | | | | | | | | | |
Total Crown | | | 203 | | | | 212 | | | | 222 | | | | 230 | |
Growth | | | 3.9 | % | | | 4.4 | % | | | 4.7 | % | | | 3.6 | % |
Source: 2014-15 Queensland Mid-year Fiscal and Economic Review
Commodity price assumptions were benchmarked to private sector forecasts, with particular reference to the Consensus Forecasts publication, which is released every two months. The latest Consensus Forecasts release available at the time of the 2014-15 MYFER was the October edition.
In the case of the oil price, it was clear that prices had fallen since the October Consensus Forecast. Accordingly, Treasury relied on its own (lower) assumptions for the oil price.
Further discussion of coal and oil price assumptions is provided later in this Chapter.
The exchange rate assumptions in the MYFER were informed by the International Monetary Fund’s estimate of the fair value of the Australian dollar.
56
2015 Review of State Finances
Export volume forecasts were based on Treasury analysis of global demand and supply conditions and changes in Queensland’s export capacity (i.e. opening of new mines and closure/scale-back of existing operations).
GOC Dividends and Tax Equivalents Payments
GOC data was finalised for the 2014-15 MYFER on 4 November 2014, ahead of the MYFER being released on 18 December 2014.
On 27 November 2014, the Australian Energy Regulator (AER) published its Draft Determination for the New South Wales electricity distribution businesses. This issue, and the potential implications for Queensland, are discussed later in this Chapter.
| 4.4 | EXPENDITURE ASSUMPTIONS |
The 2014-15 MYFER estimated that expenses would increase by an average of 3.7% per annum over the period 2013-14 to 2017-18 or 4.6%, excluding disaster recovery expenses. This follows two years of flat expenses growth in 2012-13 and 2013-14.
The MYFER estimates assumed that the previous Government’s 2.2% wages policy would be maintained across the forward estimates.
The number of full time equivalent positions was projected to increase by an average of 0.8% per annum across the forward estimates. As this was below the projected population growth rate of 1.75% per annum, it implied further increases in public sector productivity, and/or increases in outsourcing, would be required to maintain service delivery levels.
As has been the case for a number of years, the MYFER forward estimates did not allow for any cost escalation (other than 2.2% wages policy) for the majority of departments. The exceptions are Education, where there is a growth funding model for the operation of schools, and Health, where Treasury had made some provision for further growth.
As is always the case, Government faces a number of future funding pressures that are not contained in the forward estimates. The material items are identified in the following Chapter.
57
2015 Review of State Finances
The Review considered four matters in detail in relation to the 2014-15 MYFER:
| 1. | Election Commitment Offsets |
During the 2015 election campaign, the former Government released a summary of their election commitments and their net fiscal balance impact. The net fiscal balance impact was shown to be positive across the forward estimates, due to offsets identified in a single line item ‘New Policy Provisions and Reallocations’, which totalled some $1.3 billion across the Budget and forward estimates period.
As part of preparing and finalising the Budget and forward estimates, it is long standing practice to hold provisions for items that would otherwise be in departmental budgets. These provisions have been held since the introduction of accrual accounting in 1998-99 and fall into two broad categories – technical and policy.
Technical provisions are adjustments that Treasury makes to improve the quality and integrity of the estimates. This would include for example, entries to correct for errors made at the departmental level.
Policy provisions are amounts held at the whole-of-Government level for expected future commitments or requirements, often where there are unresolved issues or Government is yet to make a final decision.
$1 billion of the $1.3 billion reflects these centrally held provisions, as follows.
Health Growth Funding
For some years, Health’s forward estimates have been heavily dominated by the additional funding provided under the More Beds program – that is, the additional capacity and activity funded with the construction of the new hospitals. 2015-16 is the last year of that program. Negotiations have been ongoing as to how Health should be funded for activity growth post 2015-16. An amount of $540 million across the forward estimates is held by Treasury for that purpose. This funding will be required by Health. At the time MYFER was released, Treasury was still in the process of negotiating a longer term ‘funding compact’ with Health.
Tourism and Events
Successive governments have made election commitments around Tourism and Events funding that, leaving aside carryovers, have seen total funding approximate $90 million per annum. These commitments have generally been time limited.
While a policy decision, Treasury’s expectation was that Tourism funding would ultimately be maintained at current levels and held a provision across the forward estimates for that purpose. Treasury’s expectation is that the new Government will want to provide this funding to Tourism and Events Queensland to meet its commitments.
General Provision
The MYFER included general provision of $120 million per annum from 2015-16.
These funds do not attach to specific commitments and are available for re-allocation for other purposes. Removal of this provision would reduce expenses by $120 million per annum and be directed to debt reduction or other priorities.
58
2015 Review of State Finances
Treasury has from time to time held these provisions, more commonly for the capital program, where the sum of individual projects does not reflect Treasury’s view of the likely spend in totality. That is, the general provision is inserted to provide a more realistic view of spending at the aggregate level.
Theoretically, this funding was also available to help address emerging issues, such as police and health growth funding.
Royalties for the Regions
The Department of State Development currently holds funding for Royalties for the Regions of $224 million in 2015-16. Although around $30 million of this had not been committed by the previous Government, the scope for reprioritisation is potentially much higher. A detailed review of the Royalties for the Region Program should be undertaken for the 2015-16 Budget to identify the precise quantum.
Other
It is understood that the remaining amount (around $110 million over four years) was nominated by Ministers as funding that could be made available for other purposes predicated on agencies reprioritising their existing budgets. Unlike the other items above, this was not an amount built into the forward estimates at MYFER. The availability or otherwise of these funds should be clarified as part of the 2015-16 Budget meetings with Ministers.
Conclusions/Recommendations
Individually, none of these issues is remarkable in the context of a $50 billion Budget. Their significance and sensitivity is obviously heightened by the fact that MYFER was effectively a Pre-Election Fiscal Outlook.
Two practice improvements are recommended for when an election is called:
| 1. | Treasury should immediately write to the Directors-General informing them of the purpose and quantum of provisions held by Treasury that relate to their portfolios. |
| 2. | Treasury should write to the Opposition informing it of any unallocated provisions unless those provisions had been disclosed in the most recent Budget publication. |
| 2. | Ergon and Energex’s Forecasts |
On 27 November 2014, the AER published its Draft Determination for the New South Wales electricity distribution businesses. This foreshadowed significant reductions to the proposals for operational expenditure, capital expenditure and the weighted average cost of capital (WACC) for the New South Wales businesses. This Draft Determination and the subsequent Queensland Draft Determination have signalled that the revenue earned by Ergon and Energex will be set substantially lower than in the current determination period, implying lower profitability and material downward revisions to returns to Government. The question is whether the MYFER estimates for Energex and Ergon should have been moderated in light of the Draft New South Wales Determination.
59
2015 Review of State Finances
On 31 October 2014, Energex and Ergon submitted their draft regulatory proposals to the AER. The data submitted by those entities and incorporated into MYFER was consistent with those proposals including some anticipated reductions in allowable revenues and WACCs, but not to the level implied by the Draft New South Wales Determination.
Following the release of the Draft New South Wales Determination, Energex and Ergon invested considerable time analysing the likely impact on the AER’s assessment of their submissions. The Draft Determination for Queensland was received in April 2015 and as was expected, there have been reductions in allowable revenues and WACCs.
From the Review’s perspective, the key issue is not the Draft New South Wales Determination. Rather, the issue is whether Treasury should accept the data, or more specifically the baseline assumptions, provided by GOCs or provide its own baseline assumptions for GOCs to use in supplying financial data to Treasury. In the electricity sector, these baseline assumptions would also include generation pool price and electricity demand forecasts.
There are sound arguments for both approaches. The arguments for the former are that the corporations are operating commercially, are better placed from a skills perspective to make these judgements and that they need to take ‘ownership’ of the data. The key argument for Treasury supplied baseline assumptions is consistency, particularly where the State owns more than one entity operating in a market.
Pragmatically, the answer lies somewhere in the middle. That is, Treasury’s role should be to ensure that the core assumptions are broadly reasonable from a commercial perspective and that there are no clear ‘outliers’. The WACCs used by Energex and Ergon would have passed this test at the time the data was finalised, but not now in light of subsequent events – including further moderations in debt yields.
Treasury has informed the Government of a material revision to royalty forecasts.
These revisions primarily reflect a weaker outlook for commodity prices and the oil price (which is linked to LNG) falling further since MYFER. The issue is whether Treasury should have anticipated this and incorporated this into MYFER.
Oil prices are now expected to be around $7 to $16 per barrel lower over the forward estimates than those included in MYFER.
The revisions to commodity price forecasts are consistent with private sector forecasters, as demonstrated by Charts 4.1 and 4.2 which identify the downward revisions in Consensus Forecasts of hard coking and thermal coal.
60
2015 Review of State Finances
Chart 4.1
Consensus Forecasts revisions to hard coking coal prices
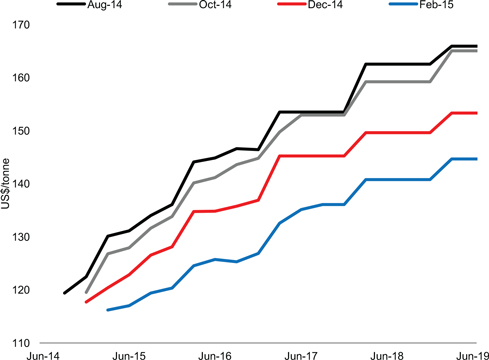
Source: Consensus Forecasts
Chart 4.2
Consensus Forecasts Revisions to Thermal Coal Prices
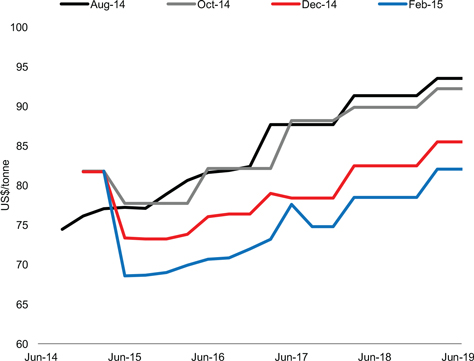
Source: Consensus Forecasts
61
2015 Review of State Finances
Chart 4.3 shows the movements in the prices of Brent crude oil, which is linked to LNG contract prices, in the past decade, along with the forecasts at the time of the MYFER and the latest (February) Consensus Forecasts. Chart 4.4 demonstrates how Consensus Forecasts have been significantly revised down in the past six months.
Chart 4.3
Brent Crude Oil Prices
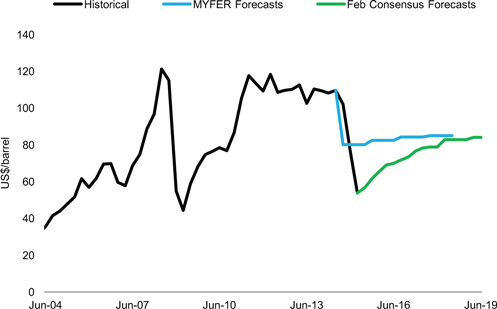
Source: 2014-15 Queensland Mid-year Fiscal and Economic Review; Consensus Forecasts
Chart 4.4
Consensus Forecasts Revisions to Brent Crude Oil Prices
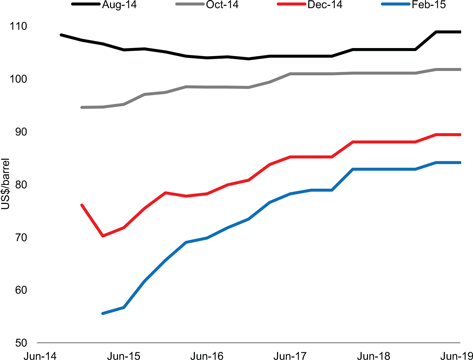
Source: Consensus Forecasts
62
2015 Review of State Finances
Whether Commonwealth or state, Treasuries are subject to external criticism in respect to forecasts, particularly revenue forecasts. Depending on the point in the cycle, Treasury may be criticised as being ‘too conservative’ or ‘overly optimistic’.
While it would be a relatively easy matter for Treasury to protect itself against criticism by ‘going hard’ – i.e. deliberate aggressive revisions, it would not be a good public policy outcome. Treasury’s forecasts send messages to the real economy and need to be reasonable and most likely at the time of publication.
There is no funding in the forward estimates for additional police beyond 2015-16.
Historically, the Queensland Police Service (QPS) budget has grown via:
| • | | government commitments to keep police to population ratio at or above the national average (prior to 2012 this was formula driven, but in 2012 a four year commitment was made for an extra 1,100 police) |
| • | | escalation for non-labour costs (2.5% p.a. on select expenses) |
| • | | enterprise bargaining (2.2% p.a.) – as per Government Wages Policy |
| • | | ad hoc requests for government investment in significant infrastructure and IT projects. |
The number of sworn police has grown 34.4% over the past decade, increasing from 8,496 in 2003-04 to 11,422 in 2013-14 (8.7% growth since 2011-12). In comparison, the Queensland population has grown 23% over the same period.
Queensland now has the third highest rate of police officers to population in Australia, with significantly higher rates than New South Wales, Victoria and Western Australia.
In the second half of 2014, Treasury and the Department of the Premier and Cabinet were discussing options for a new funding model that would provide greater flexibility as to how that funding is deployed.
The exclusive focus on increasing police numbers reduces flexibility to allocate resources based on risk and need. QPS’s ICT currently lags behind other jurisdictions, hampering its ability to provide modern, efficient policing services. For example, the deployment of mobile technology to front-line police officers would improve officer safety, increase officer access to real time information and improve productivity.
The Government’s policy position should have been resolved and incorporated into MYFER.
63
2015 Review of State Finances
| 5. | MAJOR FUNDING PRESSURES |
As part of the Review, Treasury was requested to identify funding pressures that are likely to arise over the forward estimates.
The items identified are not intended to represent a comprehensive catalogue of all funding pressures and issues raised or likely to be raised by agencies. It is a standard part of any budget process that agencies identify multiple issues and bring forward requests that far exceed the Government’s funding capacity.
Rather, the items listed below are those that could be regarded as Tier 1 items having regard to their materiality, likelihood and potential urgency.
Managing Health Demand – State and Commonwealth Growth Funding
Over the last decade, funding for Health has grown considerably, both from State and Australian Government sources. In Queensland, this included large recurrent funding increases under the HAP and More Beds program. Over the period 2003-04 to 2013-14 recurrent funding for Health increased at an average annual rate of 9.9%.
The State funding increases for Health over recent years have been largely based on funding the additional activity generated by the increased bed capacity provided by the More Beds program. This funding comes to an end in 2015-16 and Treasury has been working closely with Queensland Health to develop a contained growth model concept which would cover the period 2015-16 to 2017-18.
A decision on the new growth funding mechanism is needed as a matter of priority to facilitate longer-term planning, but the funding growth rates of the past cannot be sustained.
In its 2014-15 Budget, the Australian Government fundamentally changed the funding methodology under the National Health Reform Agreement from an activity based model to a fixed contribution approach. This approach will significantly reduce the Australian Government contribution to funding growth in public hospital activity from 2017-18.
Given population growth and ageing, medical cost inflation, new medical procedures and technology, it is not hard to arrive at a formula that suggests Health requires funding growth well in excess of the long run growth in GSP. The problem is that the economy will not produce the revenue growth to support this. Given the structure of the State Budget, Health could only be funded at those levels by aggressively crowding out other priorities.
A similar funding conundrum is faced by governments all over the developed world.
Although in the longer-term the outcome of the current review of State-Federal responsibilities will be essential to achieving systemic efficiencies in the health system, in the short to medium term any funding settlement should incentivise Queensland Health and HHSs to continue to realise operational efficiencies. Over the last three years, Queensland Health and several HHSs have returned significant operating surpluses. This is indicative of the efficiencies still to be realised and confirms the need for a realistic but challenging growth funding outcome.
64
2015 Review of State Finances
Cross River Rail Capacity
For many years now, work has been undertaken on identifying the appropriate solution to the capacity constraints faced by the passenger rail network in crossing the Brisbane River.
Proposed solutions have included the 2011 Cross River Rail project, and more recently the Bus and Train project.
As indicated in the 2014-15 MYFER, the forward estimates did not include funding for the Bus and Train project. The preliminary construction cost was approximately $5 billion.
The Government has asked Building Queensland to review both the Cross River Rail project and the Bus and Train project for the purpose of developing its preferred solution.
Schools and Schools Maintenance
The Schools Planning Commission estimates that over 100,000 new student places in over 40 new schools will be needed by 2021 across Queensland. This broadly equates to approximately 79,000 new state school students and up to 1,300 additional state school classrooms.
Of the 1,300 classrooms, the Department of Education and Training (DET) expects that 700 will be required over the forward estimates (2014-15 to 2018-19). While the majority of these would be delivered in existing schools, some new state primary schools will be required.
DET’s capital program has been under pressure for many years. The annual capital program has been prioritised towards accommodating growth, resulting in significant maintenance and asset renewal backlogs. Funding for new schools has been provided on an ad hoc basis, while at the same time DET has been constrained in terms of the rationalisation of the existing asset base.
In the last three years, funding has been provided to help address the maintenance backlog liability. This funding has halted the growth in backlog maintenance, but with its cessation growth in backlog maintenance will resume over the forward estimates period.
Prison Capacity
The Queensland prisoner population has been increasing well above population growth.
Some additional prison capacity is being added to meet current demand levels. However, more capacity may be required in the next five years to meet growth in prisoner numbers if recent trends continue. Procurement processes would need to commence shortly if this capacity is required within this timeframe.
However, prisoner numbers have proven very difficult to forecast in the past. This issue will need to be closely monitored.
65
2015 Review of State Finances
Government Information and Communications Technology
For several years, ICT funding pressures have been building against a backdrop of ageing systems, significant unmet demand for new capacity and a rapidly changing technology environment.
Of the Government’s 547 significant ICT applications, 17% are past their reported end-of-life, 47% will be past their end-of-life in 2 years, and 82% will be past their end-of-life in five years. There are 50 business systems that are high or extreme risk, with 25% of these based on SAP for finance and human resources. In addition, core enabling technologies (e.g. Microsoft) which underpin front-line service delivery and internal administrative systems are past or approaching their end-of-life.
In terms of unmet demand for new or replacement systems, the DGs Council for ICT has reviewed 11 significant proposals for a value of $800 million that are yet to be considered by Government.
The ICT environment is undergoing significant change, with new ICT delivery models entering the market and impacting on the more traditional Government approach to ICT. These changes will impact on traditional systems, storage and hardware approaches (including CITEC) as efficient pricing options such as software as a service, cloud technology and customer friendly apps and customer interaction approaches become the norm.
Over the period of the forward estimates, Queensland will need to establish a position on prioritising and funding system replacement, and provide an efficient and cost-effective policy framework within which agencies can manage their ICT activities.
Tropical Cyclone Marcia
An early estimate of the cost of the damage caused by Tropical Cyclone Marcia is $750 million. Under the Natural Disaster Relief Arrangements, the Australian Government’s contribution towards the cost would be approximately $500 million.
These estimates will continue to evolve as the detailed engineering assessments are undertaken and the remedial works scoped.
66
2015 Review of State Finances
| 6. | CREDIT RATINGS AND DEBT MARKETS |
Credit ratings express a credit agency’s opinion about the ability and willingness of a borrower to meet its financial obligations on time and in full. Credit ratings exist to help lenders assess risk.
Queensland has contracted Standard & Poor’s and Moody’s to provide credit ratings for the State.
Moody’s and Standard & Poor’s base their credit assessment on a formula-driven methodology (which includes some subjective assessment factors) of a state’s standalone position. This is then overlayed with an assessment of the sovereign rating (Australia is one of only eight countries rated AAA stable by all three rating agencies) and the likelihood of Australian Government support to determine a band of rating outcomes.
Queensland is currently rated AA+ by Standard & Poor’s with a stable outlook and Aa1 by Moody’s (equivalent to AA+) with a negative outlook. A negative outlook typically indicates a one in three chance of being downgraded. The table below details the current ratings and outlooks for the Australian states.
Table 6.1
Current Ratings and Outlooks
| | | | | | | | |
| | | Standard & Poor’s | | Moody’s |
| | | Rating | | Outlook | | Rating | | Outlook |
| Queensland | | AA+ | | Stable | | Aa1 | | Negative |
| New South Wales | | AAA | | Stable | | Aaa | | Stable |
| Victoria | | AAA | | Stable | | Aaa | | Stable |
| Western Australia | | AA+ | | Credit Watch Negative | | Aa1 | | Stable |
| South Australia | | AA | | Stable | | Aa1 | | Stable |
| Tasmania | | AA+ | | Stable | | Aa1 | | Negative |
Moody’s Aaa is the equivalent of Standard & Poor’s AAA, Aa1 is AA+ and Aa2 is AA. For ease, the remainder of this brief uses the more familiar Standard & Poor’s terminology when discussing the Moody’s rating.
Source: Standard & Poor’s; Moody’s
A strong credit rating is highly indicative of a good fiscal strategy, but its prime importance is the influence it has on the cost of borrowing and in ensuring access to capital markets. It is the market and investors who, through their actions and perceptions, determine the actual cost.
| 6.2 | QUEENSLAND’S FINANCING REQUIREMENTS |
Queensland’s annual financing requirements are driven by three factors:
| • | | the new borrowing requirements for capital expenditure, as per the State Budget and approved State Borrowing Program |
67
2015 Review of State Finances
| • | | the borrowing requirements of local government and other statutory bodies not included in the State Budget |
| • | | the amount required to refinance QTC’s maturing debt over the period. |
The Budget and forward estimates in the 2014-15 MYFER implied no significant new borrowing requirement. The task for Queensland is the refinancing of its existing debt.
QTC’s principal source of funding is its bond program, which accounts for over $80 billion of QTC’s total borrowings of almost $90 billion. The balance is largely funded through commercial paper. The Chart below shows the maturity profile of Queensland Government bonds as at 31 March 2015.
Chart 6.1
QTC AUD Benchmark and Non-Benchmark Bond Outstanding at 31 March 2015
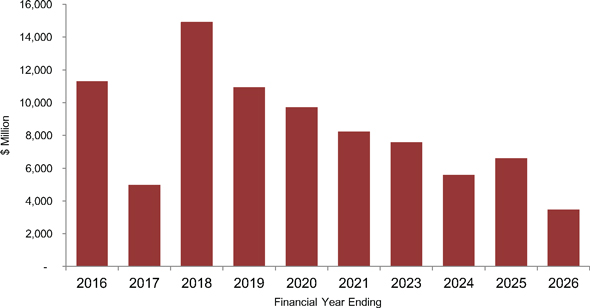
Source: Queensland Treasury Corporation
For decades, the protection of Queensland’s AAA rating had a dominant role in Queensland Government policy deliberations and settings. Queensland was downgraded to AA+ by Standard & Poor’s and Moody’s in 2009.
One of the advantages of AAA over AA+ is that it maximises the size of the potential investor pool. There are some investors whose mandates restrict them to AAA bonds.
In addition, during times of financial market stress, AAA issuers are much better placed as part of the ‘flight to quality’.
68
2015 Review of State Finances
The number of AAA rated entities has reduced dramatically over recent years. The percentage of Moody’s AAA rated sub-nationals declined from 15% to 7% between 2008 and 2013. Australia is now one of only eight sovereigns with a AAA credit rating. Only three companies in the Standard & Poor’s 500 in the United States are rated AAA.
A AAA borrower is described as having an extremely strong capacity to meet its financial commitments. A borrower in the AA band (AA+, AA or AA-) is still regarded as having a very strong capacity to meet its financial commitments.
Cost of AA+ Relative to AAA
It is difficult to be precise about the cost of Queensland’s 2009 downgrade. Credit ratings are one factor that influence the relative cost of debt. Other factors that influence the relative cost of Government debt are:
The Volume of Debt
This is the simple supply and demand dimension. Queensland is by far the largest issuer among the Australian states.
The Risk Appetite of Investors
There will be times when investors switch between bonds of different credit quality based on their preference for yield relative to safety.
Investors’ Views and Perceptions
Investors make money by trying to be ahead of the market. To do so they must form their own views independent of the ratings agencies. If investors expect Queensland is moving towards a rating upgrade, bond spreads will reduce. If investors expect Queensland to be downgraded, spreads will increase.
The cost of AA+ relative to AAA is generally calculated by reference to the difference in yields (the spread) between peers. In Queensland’s case, the obvious peer comparison is New South Wales, which has retained its AAA rating.
It is clear that Queensland’s debt would be cheaper if it were rated AAA. QTC has previously estimated the total cost of the loss of the AAA ratings as being in the order $330 million over the period 2008-09 to 2012-13.
However, the Chart below, which shows variability in spreads between 2008 and January 2015, highlights the multi-dimensional nature of the issue.
69
2015 Review of State Finances
Chart 6.2
QTC 10-year Yield Spread to NSWTC
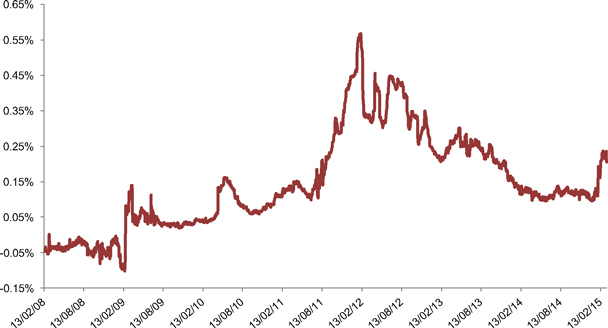
Source: Queensland Treasury Corporation
The lower credit rating has increased the sensitivity of Queensland’s relative cost of debt to adverse market conditions and periods of heightened investor risk aversion. This can result in large changes in QTC’s spread to New South Wales even when both credit ratings are stable.
For example, it is likely that the escalation of the European sovereign debt crisis contributed to the widening of QTC’s spread in 2011-2012. This is consistent with the observation that AAA rated assets benefit from a ‘flight to quality’ when investor risk aversion increases. General Government debt was also increasing rapidly at the time.
The 2009 movement, when QTC’s spread moved by 30 basis points, provides an important lesson for Government in the management of credit rating and market issues. In February 2009, the Government released a revised set of forward estimates incorporating significant downward revisions to revenue and a marked increase in debt arising from the GFC. A General Election was later called. This meant there was an extended period in which neither Government or Treasury could articulate a Government strategy in response. Without a clear strategy, the market is not in a position to establish ‘the floor’ and more often than not will overreact.
The Public Policy Issue
Clearly, viewed from the sole perspective of Queensland’s debt raising activities, AAA is preferable. Queensland’s debt would be cheaper if it had a AAA credit rating.
70
2015 Review of State Finances
However, the cost in relative terms is not significant and needs to be viewed against the opportunity cost of achieving AAA. By way of an extreme example, it is not a good economic outcome if the pursuit of AAA comes at the cost of inadequate infrastructure or an underfunded education or health system.
Under current economic circumstances, it is neither necessary nor wise, in terms of the magnitude of the policy adjustments required, to pursue a return to AAA in the near term.
Nonetheless, as a mature and wealthy economy, Queensland should have an objective of returning to AAA in the long term.
| 6.4 | THE ABSOLUTE COST OF DEBT |
Over recent years, bond yields have been driven to historic lows by below-trend global growth, extended central bank liquidity and elevated geopolitical risks. As a consequence, bond yields in Australia are at multi-decade lows, with Australian Government 10 year bond yields around 2.6%.
Chart 6.3
QTC 10-year Absolute Yield
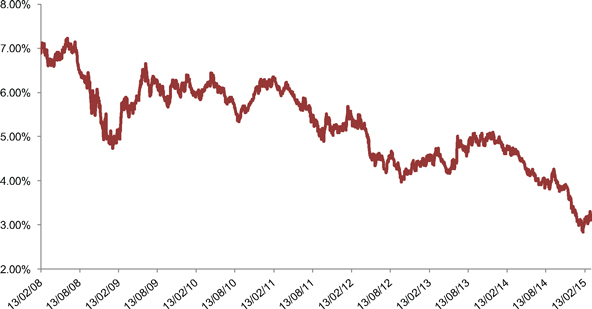
Source: Queensland Treasury Corporation
The General Government sector forward estimates for interest expense are based on the cost of existing debt (the yields prevailing at the time the existing bonds were issued) and market-based forecasts of the yields that will apply when debt is refinanced or new borrowings are undertaken.
The average cost of existing debt is approximately 5%. This cost is expected to fall as borrowings are refinanced at the current low rates.
71
2015 Review of State Finances
Box 6.1
The ‘Austerity’ Debate – Borrow and Invest
There currently is a public policy debate taking place in many developed countries about the wisdom of undertaking budget repair when economic growth is weak. With the vast amounts of liquidity provided by central banks pushing interest rates to multi-decade lows, the argument is that this is the perfect time to borrow and invest – and in particular, upgrade infrastructure. In other words, with interest rates so low, it should not be difficult to find projects where the social rate of return exceeds the cost of capital.
The challenge most developed countries face is that their budgets did not enter the GFC in a strong position, despite the extended period of strong economic growth in the lead up. With the benefit of hindsight, more of the benefits of the pre-GFC boom should have been banked.
The debate is a legitimate one, but is more relevant at the national than sub-national level. This is because: (a) national governments are better placed to influence macroeconomic outcomes (a large part of a sub-national’s efforts leak to other jurisdictions); and (b) national governments that borrow in their own currencies can ultimately rely on the support of their central banks. Countries that have a strong domestic savings pool are better placed than those who rely on foreign capital.
Ultimately, the success of stimulus as a macroeconomic strategy depends on whether it is a correct diagnosis of the problem. Japan is a perfect case in point. It relied on this strategy for the best part of two decades – ultimately taking Japan’s Gross Public Debt to well over 200% of GDP. What was actually needed was serious structural reform of the economy.
Nonetheless, if Queensland: (a) had the balance sheet strength it did at the start of the last decade; and (b) had serious infrastructure backlogs, then now probably would be a good time to address these issues. The reality is though that Queensland’s balance sheet is not well placed to take-on additional debt, nor can it be argued that Queensland faces a material infrastructure deficit. As was shown in Chapter 2, Queensland did borrow on a major scale to invest in infrastructure over the last decade. We have, in effect, already ‘played that card’.
It is nonetheless open to QTC to lengthen the duration of the State’s existing debt.
Queensland’s medium term fiscal stance, as reflected in the 2014-15 MYFER forward estimates, cannot be regarded as contractionary or austere. The change in the fiscal balance is a reasonable proxy for assessing a government’s fiscal stance. From 2015-16 onwards, the year on year change in the fiscal balance is in relative terms negligible.
The solution to Australia’s and Queensland’s below trend economic prospects is more likely to be found in structural reform than Government spending.
72
2015 Review of State Finances
| 6.5 | QUEENSLAND’S CURRENT RATINGS |
Standard & Poor’s Current Status - AA+ and Stable
Table 6.2
Standard & Poor’s Scoring for Queensland
| | | | | | | | | | |
Criteria | | Weight (%) | | | S&P rating | | S&P score* | |
Economy | | | 20 | | | Very Strong | | | 1 | |
Financial Management | | | 20 | | | Strong | | | 2 | |
Budget Flexibility | | | 10 | | | Average | | | 3 | |
Budgetary Performance | | | 10 | | | Weak | | | 4 | |
Liquidity | | | 20 | | | Exceptional | | | 1 | |
Debt Burden | | | 10 | | | High | | | 4 | |
Contingent Liabilities | | | 10 | | | Low | | | 2 | |
Institutional Framework | | | — | | | Extremely Predictable | | | 1 | |
Standard & Poor’s score for Queensland | | | 2.1 | |
| * | Scoring 1 to 5, with lower scores being stronger/more favourable. |
Source: Standard & Poor’s
Standard & Poor’s analysis focusses on the Non-financial Public sector i.e. it includes the debt of GOCs and other businesses.
Queensland’s current Standard & Poor’s score of 2.1 translates to the AA+/A-1+/Stable rating, when the Australian Government’s AAA rating and strong likelihood of support is taken into account.
Key Weaknesses
In the Standard & Poor’s methodology, Queensland’s weakest areas are ‘budgetary performance’ and ‘debt burden’.
The budgetary performance measure is a combination of the operating balance and fiscal balance.
The debt burden measure is a combination of debt to revenue and interest expenses to revenue.
All measures are at the Non-financial Public sector level.
Latest Commentary
Standard & Poor’s October 2014 Research Update noted that:
“The stable outlook reflects the expectation that continued expenditure management will lead to a stabilisation of the State’s high debt burden.”
73
2015 Review of State Finances
“Downward ratings pressure would occur if the State allowed operating expenditures to grow faster than its operating revenues, resulting in larger fiscal deficits further increasing the debt burden.”
Moody’s Current Status – AA+ and Negative
While Moody’s methodology (the Baseline Credit Assessment) is based on the State’s historical performance, the Rating Committee’s adjustments are based on forward-looking opinions of credit strength.
Table 6.3
Moody’s Scoring for Queensland
| | | | | | | | | | | | | | | | | | | | |
Baseline Credit Assessment (BCA) | | Score* | | | Sub-factor
Weighting | | | Sub-factor
Total | | | Factor
Weighting | | | Total | |
Factor 1: Economic Fundamentals | | | | | | | | | | | | | | | | | | | | |
Economic strength | | | 7 | | | | 70 | % | | | 5.2 | | | | 20 | % | | | 1.04 | |
Economic volatility | | | 1 | | | | 30 | % | | | | | | | | | | | | |
Factor 2: Institutional Framework | | | | | | | | | | | | | | | | | | | | |
Legislative background | | | 1 | | | | 50 | % | | | 1 | | | | 20 | % | | | 0.20 | |
Financial flexibility | | | 1 | | | | 50 | % | | | | | | | | | | | | |
Factor 3: Financial Performance and Debt Profile | | | | | | | | | | | | | | | | | | | | |
Gross operating balance/operating revenues | | | 7 | | | | 12.5 | % | | | 4.25 | | | | 30 | % | | | 1.28 | |
Interest payments/operating revenue | | | 5 | | | | 12.5 | % | | | | | | | | | | | | |
Liquidity | | | 1 | | | | 25 | % | | | | | | | | | | | | |
Debt/operating revenues | | | 7 | | | | 25 | % | | | | | | | | | | | | |
Short-term direct debt/ total direct debt | | | 3 | | | | 25 | % | | | | | | | | | | | | |
Factor 4: Governance and Management | | | | | | | | | | | | | | | | | | | | |
Risk controls & financial management | | | 5 | | | | | | | | 5 | | | | 30 | % | | | 1.5 | |
Investment & debt management | | | 1 | | | | | | | | | | | | | | | | | |
Transparency & disclosure | | | 1 | | | | | | | | | | | | | | | | | |
Idiosyncratic risk assessment | | | | | | | | | | | | | | | | | | | 4.02 | |
Systemic risk assessment | | | | | | | | | | | | | | | | | | | Aaa | |
Suggested BCA | | | | | | | | | | | | | | | | | | | Aa3 | |
Source: Moody’s
Moody’s analysis focusses on the General Government sector, plus Queensland Rail and the Queensland Bulk Water Supply Authority (Seqwater). The GOCs are generally considered to be self-supporting.
74
2015 Review of State Finances
The State’s current BCA score is consistent with a lower credit rating of Aa3 (equivalent to AA-). When overlaid with the Australian Government’s AAA rating and very high likelihood of Commonwealth support, this places Queensland in a rating band of AA to AA+.
Queensland’s position at the top of this band reflects a discretionary upgrade by the Moody’s Rating Committee. This adjustment highlights the importance of discretion in the Moody’s ratings process.
Key Weaknesses
Economic Strength (Queensland’s per capita GSP relative to national per capita GDP) is important (weighted at 14% of the total score) – but it is heavily influenced by factors outside of the Government’s control such as terms of trade and economic performance of other states.
Queensland’s weakest areas are the operating balance to operating revenue ratio and the debt to revenue ratio.
Moody’s commentary has focussed on fiscal/cash deficits.
Based on the 2014-15 MYFER projections, no improvement in operating balance to operating or debt to revenue scores is expected over the forward estimates.
Latest Commentary
Moody’s placed Queensland’s rating on a negative outlook in November 2012, which typically indicates a one in three chance of being downgraded.
With Queensland on a negative outlook, the Moody’s commentary is considered to be more relevant than individual components of the Moody’s methodology.
The 2012 downgrade in the outlook reflected “the deterioration in the State’s financial performance which has persisted since fiscal 2007-08 and the resultant high levels of indebtedness”.
In its most recent assessment, Moody’s stated “weakening government resolve to reduce cash deficits and associated debt accumulation could result in downward ratings pressure”.
| 6.6 | COSTS AND CONSEQUENCES OF A DOWNGRADE |
It is clear that a credit rating downgrade would increase the State’s relative borrowing costs. However, it is difficult to quantify the cost of a further downgrade, as the State’s spreads reflect a range of factors, as previously outlined.
It is possible that a downgrade could be made by only one agency, resulting in a split credit rating for the State. If this were to occur, it is likely that the State’s cost of debt will reflect the lower credit rating.
75
2015 Review of State Finances
It is likely that the immediate impact on the relative cost of debt would be larger than the 15 basis point increase that followed the 2009 downgrade.
The more significant issue than the immediate price impact is an increase in the sensitivity of the State’s relative cost of debt during adverse market conditions or heightened periods of risk aversion. The significance of this issue is magnified by the relatively large size of the State’s refinancing requirements.
Three other potential consequences arise:
| 1. | It increases the likelihood of the State having to ask the Australian Government to guarantee the State’s debt during a period of market stress, as Queensland did during the GFC. |
| 2. | The confidence of those who invest in Queensland’s bonds will be affected, as they will incur a mark-to-market loss. There may also be some limited forced selling of QTC bonds due to ratings-based mandate constraints. |
| 3. | Rightly or wrongly, the public view credit ratings movements as a judgement on the Government’s financial management capabilities. |
| 6.7 | DO THE CREDIT RATINGS AGENCIES ATTACH APPROPRIATE WEIGHT TO QUEENSLAND’S LARGE FINANCIAL ASSET HOLDINGS? |
Since Queensland’s ratings downgrade in 2009, there has been an ongoing debate between Treasury/QTC and the ratings agencies about whether they give adequate weight to Queensland’s financial asset holdings.
Queensland has over $30 billion in financial assets and is the only Australian state with fully funded public sector employee entitlements.
Table 6.4
Non-Financial Public Sector Standard & Poor’s Adjusted Figures
| | | | | | | | | | | | | | | | | | | | | | | | |
2013 Actuals ($millions) | | QLD | | | NSW | | | VIC | | | WA | | | SA | | | TAS | |
Unfunded Liabilities | | | 0 | | | | 32,467 | | | | 25,225 | | | | 8,133 | | | | 11,085 | | | | 5,561 | |
Source: Standard & Poor’s
Both ratings agencies’ methodologies make some adjustments for significant unfunded liabilities. Treasury has also been advised that Queensland’s large financial asset holdings have assisted in the subjective deliberations around the rating.
Do Queensland’s financial assets get adequate consideration in the determination of the rating? Probably not. Possible reasons and counter responses include:
| • | | It is Queensland’s policy that the funds are set aside exclusively for employee entitlements. They cannot be set aside exclusively for employee entitlements and also be available for debt servicing/repayment. |
76
2015 Review of State Finances
| • | | The clients they service are generally purchasing debt with duration of five to ten years. That is, the focus of their analytical efforts and metrics is the medium term, whereas the unfunded superannuation liability issue is a longer term intergenerational issue. |
| • | | They operate under stringent internal rules and methodologies that they apply globally – these have only tightened since the GFC. Despite the strength of the argument, there is not a lot of scope for exceptions. |
| • | | When financial markets are under serious stress there are usually flow-on impacts to asset markets and it may not be possible or wise to liquidate assets. |
Nonetheless, the fact remains that the State has a variety of options available to give effect to a substantial reduction in debt should the circumstances require it.
There may also be options for QIC (as the State’s investment manager) and QTC (as the issuer of State debt) to work more closely to ensure the State’s financial assets and liabilities are being managed in the most efficient manner on a whole-of-Government basis.
77
2015 Review of State Finances
| 7.1 | DEFINING ‘SUSTAINABILITY’ IN A STATE GOVERNMENT CONTEXT |
While a discussion of Fiscal Sustainability will eventually involve an assessment of various quantitative measures, it is useful to start in the qualitative – having regard to the role of Government.
Government has a responsibility to provide infrastructure and services and to do so it must raise revenues, and, where appropriate, issue debt. From a qualitative perspective, fiscal sustainability is about achieving the following objectives:
| 1. | Government’s revenue and expenditure policy should be set at a level that promotes stability, to minimise the need for disruptive corrective action and support long term economic growth. |
| 2. | Government should have sufficient financial capacity to absorb shocks so that it can assist the community when needed most – e.g. recovery from natural disasters or external economic shocks, without having to reduce services or increase taxes. |
| 3. | The next generation of taxpayers should not have to pay for services/resources consumed by the taxpayers of today – i.e. there should be intergenerational equity. |
| 4. | Government should operate efficiently – to minimise the costs it imposes on the economy and to maximise the quantity and quality of services it can provide. |
Achieving fiscal sustainability requires fiscal rules or principles which impose an affordability constraint on the activities of government so that spending is prioritised to maximise returns to the community. These fiscal rules or principles should be in a form that allows them to influence the Government decision making process.
Generally, jurisdictions that manage their finances well deliver on these objectives by having a set of fiscal rules or principles covering (1) revenue and expenditure (i.e. the budget balance); (2) debt; and (3) liability management.
Government needs to ensure that its operating revenues exceed its operating expenses – that is, that there is a recurrent Budget surplus. In Government finance statistics, this standard recurrent budget measure is the net operating balance.
The Government’s preferred fiscal measure is the Net Operating Balance. This is the headline measure used by most states. The achievement of a Net Operating Surplus is a necessary but not sufficient condition to attain fiscal sustainability. This is because net operating surpluses will still see debt rise unless the surpluses are large enough to fund capital expenditure.
Treasury recommended in 2012 that the then Government replace net operating surplus with fiscal balance as the prime fiscal target to address Queensland’s rapidly escalating debt levels.
78
2015 Review of State Finances
Treasury also acknowledged that at the point at which Queensland’s debt levels became more manageable, it would be entirely appropriate for the State to run modest fiscal balance deficits in recognition of future infrastructure requirements.
A further complication in setting fiscal strategy is that the revenue outlook is weak and many of the factors that can cause large changes to the State’s revenue position are outside the control of Government.
The Government should target material net operating surpluses that provide an adequate buffer against adverse events and ensure that new infrastructure projects are predominantly funded from recurrent sources rather than borrowing.
Debt in itself is not ‘bad’. It is widely accepted that Australian state governments should not borrow for recurrent expenditure, including maintenance of the existing capital stock. However, it is entirely appropriate for Government to borrow for infrastructure that will service this and future generations of Queenslanders.
Borrowing to invest in infrastructure does not violate the principle of intergenerational equity so long as: (a) the infrastructure is high quality in terms of the social return it generates (just as not all debt is ‘bad’, not all infrastructure is ‘good’); and (b) the debt associated with that infrastructure has been repaid by the time it needs to be replaced.
In practice though, and as is the case with large corporates, governments don’t borrow for and ascribe debt repayment schedules to each piece of infrastructure. The Government as a whole has a ‘financing requirement’ which represents the mathematical outcome of the full suite of Government cash inflows and outflows.
As long as the Government’s investment in the expansion of the capital stock exceeds that financing requirement, then the Government can be said to be borrowing for new infrastructure.
Is Queensland’s Debt Too High?
There is no clear and widely accepted answer as to the ‘right’ level of debt for a Government. Determining whether the current debt level is too high relies on both empirical tests and Government’s tolerance level around certain negative outcomes.
There is a point at which debt becomes so large that the growth in interest costs exceeds the capacity of economic growth to service the debt – the so-called ‘debt spiral’. There can be no serious suggestion that Queensland’s finances are in any such position.
Chapter 2 established that Queensland debt levels are high in relative terms – that is, compared with other states.
A reasonable set of tests that could be used in determining whether Queensland’s debt levels are too high in absolute terms are as follows:
| 1. | Are Queensland’s debt servicing obligations crowding out funding for core expenditure responsibilities? |
79
2015 Review of State Finances
| 2. | Is the State’s balance sheet in a position to absorb a significant shock without a credit rating reaction and/or the need for corrective measures? |
| 3. | Can we be reasonably sure of market access at a reasonable price during times of financial market distress, without the need for Commonwealth support? |
| 4. | Are Queensland’s current debt levels consistent with a strong AA+ rating? |
| 5. | Would Government be willing to accept the consequences of a downgrade? |
Queensland’s debt servicing obligations – as represented by General Government interest expense as a proportion of revenue – have increased from 0.6% in 2006-07 to 4.7% in 2013-14. As a percentage this is not high, but it is clearly aided by the fact that interest rates are at multi-decade lows. In the event that interest rates return to more ‘normal’ levels, this would emerge as a serious issue.
In Treasury’s view, based on the analysis in the previous Chapters the answer to questions 2, 3 and 4 is no. The clear inference being that debt is too high.
The answer to Question 5 is a matter of judgement for the Government having regard to the policy trade-offs.
| 7.4 | SETTING A MEDIUM TERM DEBT REDUCTION OBJECTIVE FOR QUEENSLAND |
The benefit of a medium term (ten year) debt reduction objective is that it would provide a clear policy direction and will help to inform the level of investment that could be available for the State’s infrastructure program which has a longer horizon than the forward estimates.
Measurement
A debt to income ratio allows a jurisdiction to determine how affordable its debt levels are and consequently is a key measure supporting a fiscal sustainability objective. For this reason, some form of debt to revenue ratio is a common feature of government fiscal principles.
There are three main measures of debt to income. The two mostly commonly used ratios are debt to gross domestic/state product and debt to revenue. The third main measure of debt to income is a ratio that compares net financial liabilities to revenue.
Provided that GOCs are able to service their levels of debt through their operations without recourse to the General Government sector, it is appropriate that the focus be General Government debt.
Ultimately the level of debt that is affordable is best measured as a proportion of revenue. The debt of national governments is commonly expressed as a proportion of GDP. However, this is not an appropriate measure for Australian states given the relatively limited ability of state governments to raise revenue.
80
2015 Review of State Finances
Setting the Medium Term Objective
There is no definitive study as to what level of debt to revenue is ‘optimal’. First and foremost, the objective must be achievable. Relevant considerations include:
| a. | the current economic circumstances and outlook which suggest a prolonged period of below trend economic growth and relatively weak revenue growth |
| b. | policy commitments and constraints, including the Government’s willingness and ability to take corrective measures to achieve the target. Treasury is framing this objective on a ‘no policy change’ basis |
| c. | the inevitability that Government will face some funding pressures that will need to be addressed over the medium term. |
Having regard to the above considerations and possible constraints, a reduction in debt in absolute terms is desirable but may not be achievable over the medium term.
Treasury’s view is that the most practical approach to achieving a reduction in the debt to revenue ratio is through the adoption of a medium term objective that should see growth in the economy and revenues reduce the relative size of General Government debt over time.
The debt to revenue ratio is currently estimated to remain at around 90% over the forward estimates. The average General Government sector debt to revenue ratio for Australian states, excluding Queensland, is estimated at around 60% in 2017-18. A material reduction in public policy terms – a noticeable improvement in Queensland’s credit metrics and to provide a buffer against shocks – would take Queensland towards this average.
Other targets, such as returning Queensland’s debt/GSP ratio to its medium to long term average, are even more challenging and would see the debt to revenue ratio at around 40% to 50%. The adjustment that would be required to achieve this would be very large and impose significant costs on the economy and the community.
Once it is accepted that a reduction in the relative size of debt over time is the objective, the issue then becomes the pace of the adjustment. This involves deciding on what is achievable within a range.
| 1. | At one end of the range is holding debt constant in absolute terms (i.e. keeping debt at June 2015 levels). This would achieve the fastest reduction in the debt to revenue ratio. However, based on current projections it is not achievable without tax increases or spending cuts. |
In any case, it is unlikely to reflect the Government’s policy intent or be consistent with its fiscal principles, as it would require Government to maintain a fiscal balance.
| 2. | At the other end of the range is ensuring debt at least grows slower than revenues. This would imply debt growth somewhere in the order of 5%, broadly in alignment with long term growth in nominal GSP. Progress would be so slow that it would defy credibility as a serious debt reduction strategy. |
81
2015 Review of State Finances
Between these extremes is a strategy whereby Government seeks to ensure that debt grows at a rate slower than growth in real GSP. This approach would effectively see inflation do much of the work but at the same time would require a disciplined approach to spending.
Modelling Results
As part of this review, Treasury undertook detailed medium-term modelling to determine the outlook for Queensland’s fiscal position out to 2025-26.
Many of the economic, revenue and expenditure items in the projection period (2018-19 to 2025-26) are forecast using Treasury’s computable general equilibrium model, which derives these forecasts from assumptions on key underlying fundamental factors, including:
| • | | population growth and demographic shifts |
| • | | the outlook for productivity by industry in Queensland |
| • | | changes in Queensland’s labour market participation rates |
| • | | world demand and prices for commodities |
| • | | domestic supply capacity |
This information is then compiled to produce financial forecasts.
The modelling suggests that expenses are expected to grow more quickly than revenue. Projections prepared on a no policy change basis suggest that revenues will grow 4.9% per year on average during the projection period, whilst expenses are forecast to grow on average 5.5% per year. In comparison, nominal GSP was forecast to grow 5.4% per year on average in the projection period.
Revenue growth over the last decade has been on average weaker than GSP growth and is expected to continue to be weaker through the medium-term forecasts. Further, revenue growth is forecast to be weaker than in the past decade, as growth in royalty income eases once the emergence of Queensland’s LNG export industry flows through the forward estimates. Meanwhile, GST revenues are also forecast to grow at a slower pace during the projection period as a greater proportion of disposable income is spent on non-GST attracting items such as health services and education.
Much of the reason that expense growth is forecast to outpace revenue growth over the projection period is due to strong growth in health expenses. This occurs due to the impact of the ageing population increasing per capita demand for health services, combined with the fact that the costs per unit of health services provision is expected to significantly outpace prices growth more generally as the technological usage and quality of health services continues to improve. Overall, strong growth in health expenses is a circumstance that jurisdictions across Australia, and other developed nations, are facing. Current indications are that Commonwealth grants will not keep pace with growth in service demand.
Growth in expenses outpacing revenue growth places pressure on the General Government sector’s ability to achieve and sustain a net operating surplus.
82
2015 Review of State Finances
Indeed, the aggregated projections suggest net operating deficits will re-emerge in the middle of the next decade.
To stabilise or reduce the General Government sector’s level of debt as a proportion of its revenues, Government will need to demonstrate ongoing spending restraint, both in terms of operating and capital expenditure.
Treasury modelling indicates that if the Government can limit operating expenses growth to below 5% per year over the projection period, and target capital expenditure of 1.5% of GSP, then a debt to revenue ratio of less than 80% is achievable by 2025-26.
This equates to recording annual net operating balances around 3% of revenue (approximately $1.5 billion in today’s dollars) over the projection period. Meanwhile, General Government sector capital expenditure equates to around $6 billion at the start of the projection period, increasing to around $9 billion at the end of the period.
Chart 7.1 below illustrates the trajectory for the General Government sector’s debt to revenue ratio under the scenario where expenditure is restrained as discussed. It also illustrates the path the ratio will take in circumstances where revenue grows around 1⁄4 percentage point slower (the low revenue growth line) or faster (the high revenue growth line). As can be seen, the debt to revenue ratio is quite sensitive to the rate of revenue growth. This emphasises the importance of ensuring policy settings are sustainable and supportive of productivity and participation which are the key drivers of economic growth.
Chart 7.1
Debt as a proportion of revenue
(General Government sector, %, nominal terms)
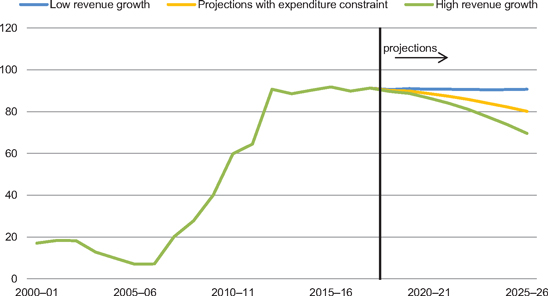
Source: Queensland Treasury
A fiscal objective has the greatest chance of being achieved when it is in a form that is easily understood and can be used in the day to day decision making processes of government.
83
2015 Review of State Finances
In terms of the Government’s immediate fiscal strategy deliberations, achieving this will require:
| 1. | General Government sector net operating surpluses of between $1 billion and $2 billion |
| 2. | Fiscal balance deficits of no more than $1 billion to $1.5 billion. |
There is optionality for Government in terms of the capital and recurrent mix, but within the constraint of limiting growth in debt to 3.5% (long run real GSP).
In summary, reaching a debt to revenue ratio of 70% to 80% in the next 10 years would: (a) represent a material improvement; (b) based on current projections is achievable; and (c) would, in all likelihood, not impose significant adjustment costs on the economy and the community.
Any debt reduction measures implemented outside of this ‘base case’ should be used to pursue a more ambitious target.
There are several caveats to the ‘base case’. The most important of them being that while it is framed on a no policy change basis and the assumptions are reasonable, Government does not operate in a steady state world. Over any reasonable time period, events will happen that are beyond the control of Government and policy adjustments will be required.
| 7.5 | FINANCIAL LIABILITY MANAGEMENT |
One of the enduring features of Queensland public finance has been setting aside funding, on an actuarially determined basis, to meet long term employee entitlements – most notably superannuation. This policy was put in place long before unfunded public sector employee obligations started receiving public attention in Australia in the 1990s in the context of the introduction of accrual accounting.
Over time, the principle of pre-funding has been extended to other employee entitlements such as long service leave and judges’ pension liabilities. In addition, since 2000, the Government has funded its insurable liabilities via the Queensland Government Insurance Fund (QGIF), with premiums paid by government agencies. Workers’ Compensation liabilities have been funded by employer premiums since inception, with these funds governed and administered separately by WorkCover.
84
2015 Review of State Finances
The funding position of the various Government employee entitlement and insurance schemes at the latest reporting date of 30 June 2014 is shown in the following chart:
Chart 7.2
Funding Position of Queensland Government
Employee Entitlement and Insurance Assets and Liabilities
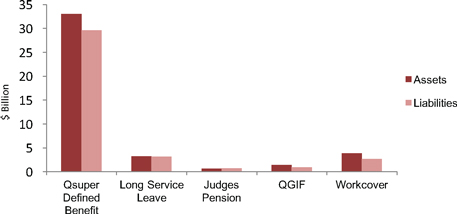
Source: Queensland Treasury
The defined benefit members will retire progressively over the coming two decades and the scheme will be all but finalised by 2035. Unlike schemes in other states, benefits are largely lump sum – there is no long tail pension liability. The objective now is to manage the financial assets in a way that minimises investment risk and ensures cash flow is available to meet scheme obligations as they fall due.
Unlike other jurisdictions, Queensland will not have to borrow over coming decades to fund the retirement benefits of public servants.
The Queensland policy framework was put in place at a time when Queensland had very low levels of debt. It is an open question whether, in light of Queensland’s current debt levels, the same policy decision would be made today.
The pre-funding of long service leave is arguably an extreme application of the basic principle and could be regarded as optional. Treasury is not aware of any other government that pre-funds long service leave.
A FINAL NOTE ON SUSTAINABILITY
The foregoing discussion on fiscal sustainability has been framed within the general constraints of the current tax and expenditure mix.
For some years now the Australian Government and the states have, in a fiscal sense, been ‘treading water’ with relatively weak revenue growth making it more difficult to improve public finances.
An important contribution to providing a more enduring solution to the sustainability problem could be made by changes to Australia’s systems of taxation and fiscal federalism. The current mismatch of revenue and spending responsibilities has created a large gap between community expectations and the capacity of Governments to deliver.
85
2015 Review of State Finances
The Australian Government is currently leading work on these issues through White Paper processes. At this point, Discussion or Issues Papers have been released on Tax Reform and aspects of Fiscal Federalism.
The Tax Reform White Paper process seeks to develop options for modernising Australia’s tax system to reflect changes in the economy and support improvements in living standards.
The Federation Reform White Paper process will seek to clarify roles and responsibilities, and reduce the duplication that currently exists between the Australian Government and the states. Doing so will require states to recognise that there are some functions currently performed by the states that the Australian Government is better placed to perform and the Commonwealth recognising that it is currently overreaching in areas that are fundamentally state responsibilities.
Previous efforts of reform in these areas have proved fruitless, despite considerable bodies of work being undertaken.
In the absence of reform in these key areas, the Australian and state governments will have to continue to implement sub-optimal solutions to the fiscal sustainability problem.
86
2015 Review of State Finances
| 8. | GOC PERFORMANCE AND SUSTAINABILITY |
The State owns and operates a number of commercial businesses with a total asset value of approximately $66 billion.
Of the businesses, ten are established as GOCs under the Government Owned Corporations Act 1993 (GOC Act) and have a commercial focus in the electricity, ports and commercial water sectors.
Seqwater and Queensland Rail are statutory authorities and are not regarded as ‘self-supporting’. The term ‘GOC Sector’ should in this Chapter be taken to mean the ten GOCs covering electricity generation and networks, ports and SunWater Limited (SunWater).
Appendix A provides details of the asset bases and debt levels of the individual GOCs.
The GOC sector has assets of $36.2 billion as at 30 June 2014 which represents approximately 12% of the total assets of the State of $306 billion. Total debt of the GOC sector is $19.9 billion, representing 27% of the State borrowings of $72.7 billion. These businesses provided dividends and tax equivalents to the State of approximately $1.7 billion in the year ending 30 June 2014.
The Government has committed to retaining these commercial businesses in Government ownership and separately paying down debt. Retaining these entities in Government ownership means that the Government as a shareholder needs to decide what it wants to achieve through the ownership of the businesses.
All GOCs face increasing external challenges that could impact value and performance unless they are in a position to respond. To the extent that GOCs are restricted in their capacity to respond, this will have a direct impact on returns to the State, with the cost ultimately borne by taxpayers.
This requires Government to address issues around structure and governance as a priority.
| 8.2 | SUSTAINABILITY OF THE GOC SECTOR |
The following section outlines some of the key challenges facing the State’s GOCs by sector.
Energy Sector
The GOCs dominate the Queensland energy sector, owning 100% of the transmission and distribution networks within the State and controlling 62% of the generation capacity. Ergon Energy Queensland (EEQ) a wholly owned subsidiary of the distributor Ergon, is the major electricity retailer in regional Queensland.
87
2015 Review of State Finances
In general, the transmission network service provider, Queensland Electricity Transmission Corporation Limited (Powerlink), and the SEQ distribution network service provider, Energex, are well-run businesses. Ergon continues to be negatively impacted by the legacies of the previous six regional network businesses merged to form Ergon, which is evident in the lack of operational integration.
Electricity Network Businesses
The electricity network businesses are facing significant sectoral changes. These include decreasing energy consumption, increasing installation of solar photovoltaic panels (PV) and growth in other existing and emerging technologies (smart metering, storage, electric vehicles, and demand-side management).
There is potential for some of these technologies to become increasingly cost-attractive to smaller industrial users. The business models of the electricity network businesses will need to change to respond effectively to these challenges.
As regulated monopolies, a key risk faced by network businesses is the regulatory determination made each five years. These determinations set the revenues that the electricity networks can recover from their customers based on a return on assets, depreciation and operating costs. Recent determinations made by the AER in other states and the April 2015 Queensland Draft Determination have signalled that the revenue earned by distribution and transmission entities will be set substantially lower than in the current determination period, implying lower profitability.
These determinations have also focused on prescribing higher levels of benchmark efficiency (a lower allowance for operating costs). The State’s network GOCs may have more difficulty in meeting these benchmarks than counterparts in other jurisdictions if they face operational constraints.
Where operating costs do not meet the benchmarks set by the AER (i.e. they cannot be fully recovered), returns to shareholders will be lower.
The merger of the transmission and distribution entities proposed by the Government as part of its 2015 election commitments should assist in driving efficiencies and reducing costs which will improve the performance of these businesses and the returns to shareholders.
Electricity Retail
EEQ supplies electricity to approximately 700,000 customers in regional and remote Queensland. A critical part of EEQ’s role is managing the risk associated with having to purchase electricity in the highly volatile spot market but supply at a fixed price set by the regulator. Under the Electricity Act 1994 (Qld), EEQ is only allowed to operate in these regions, can only offer notified tariffs (set by the regulator Queensland Competition Authority (QCA)) and is not allowed to compete for customers.
The Government compensates EEQ by way of a Community Service Obligation (CSO) for charging customers in regional Queensland the same price as that offered to customers in SEQ. This CSO has been steadily increasing and currently exceeds $500 million per annum.
88
2015 Review of State Finances
As the fifth largest retailer, by customers, in the National Electricity Market, EEQ is a substantial business with revenues of $2 billion. EEQ is currently implementing a new customer information system to improve the performance of its business. This will also allow EEQ to achieve functional separation from Ergon, recognising the significant differences between a distribution and retail business. Integration of EEQ with a generation GOC, creating a vertically integrated business, would align with the business model of many of its private sector counterparts.
Another option is to create a new division within the merged business that focusses on responding to developments in the electricity market driven by technology and changing demand profiles. This could accelerate the transition of the business from the traditional distribution model towards a customer-focused energy service provider, offsetting the declining program of work in core distribution.
Generation
While some GOCs operate in a regulated business environment, the generator GOCs – CS Energy and Stanwell – operate in a competitive market environment. The financial performance of the generator GOCs has been poor for several years, with falling electricity demand compounded by oversupply and declining prices. Compulsory trading of wholesale generation in a national market, private sector competition and the development of sophisticated markets in energy-based hedging instruments have substantially changed the environment in which the generators operate.
The Australian Energy Market Operator (AEMO) has made successive cuts to the energy demand outlook over the past several years. Despite this, Queensland remains one of the few regions in the national electricity market with a forecast increase in energy demand. The main driver of this new demand is the energy requirements of the LNG export industry. At the same time, the LNG industry has increased competition for gas which is the fuel source for some generation.
CS Energy is facing significant challenges. It has incurred annual operating losses in each of the past five years and has high debt levels. This is as a result of ongoing difficulties with coal supply at its Callide Power Station, as well as issues associated with the Gladstone Power Station (GPS) Interconnected Power Pooling Agreement (IPPA). Further work needs to be undertaken with CS Energy to drive commercial outcomes on the issues of the coal supply contracts for the Callide Power Station and the IPPA contract.
The proposed merger of the generation GOCs, the form of which is subject to further discussions with the Australian Competition and Consumer Commission (ACCC), should assist in improving the efficiency of the generation businesses.
Transport Sector
Four port GOCs are responsible for managing 17 Government owned ports, which include coal export terminals, multi-cargo ports and small community ports. Generally the port GOCs are operated on a commercial basis. However, due to low volumes and legacy contract arrangements, some of the ports have a limited opportunity to generate returns and cannot be viably operated on a commercial basis.
89
2015 Review of State Finances
The largest of the port GOCs is Gladstone Ports Corporation Limited (GPC) which is responsible for the management of the ports of Gladstone, Bundaberg and Rockhampton. Gladstone Port is Queensland’s largest port and the fifth largest coal exporting port in the world. GPC is efficiently operated but would benefit from a more efficient capital structure.
North Queensland Bulk Ports (NQBP) owns Dalrymple Bay Coal Terminal and Abbott Point, which are leased to the private sector, and operates the ports of Mackay, Hay Point, Weipa and Maryborough. It maintains a focus of port development, mainly because of the proximity of its port lands to mineral extraction, and the development of the Mackay city port. NQBP also has an inefficient capital structure, a legacy of its role in port development.
The Port of Townsville continues to suffer from an inefficient supply chain between rail and port. The Mount Isa Rail Line and the North Coast Rail Line are key supply chain links to the Port of Townsville. The integration of the port with the Mount Isa Rail Line and parts of the North Coast Rail Line have been recognised as possible options for improving these supply chain issues and further investigation of these options could be undertaken.
Bulk Water Sector
The bulk water supply service sector in Queensland is dominated by State-owned water businesses Seqwater and SunWater. Additionally, there are two Category 1 water authorities – Mount Isa Water Board and Gladstone Area Water Board – which perform many of the same dam storage, pipeline distribution and irrigation channel services as SunWater in regional Queensland.
SunWater and these regional water authorities hold profitable pipeline assets that service mostly mining and industrial bulk water users. Separation of these profitable pipeline assets from the bulk water assets has the potential to drive commercial outcomes and increased performance within a GOC structure.
| 8.3 | OTHER COMMERCIAL BUSINESSES |
Queensland Rail
Public transport fares account for less than 20% of the cost of operating the passenger train network in Queensland. The balance is contributed by the State through a Transport Services Contract which covers both the operational cost of the business as well as a contribution for the capital expenditure requirements. In 2013-14, this subsidy amounted to $1.6 billion. As part of the legacy from the sale of the coal business, Queensland Rail has $3 billion of debt which can only be repaid with the financial support of the State.
Given the nature of Queensland Rail’s operations, it is questionable whether the GOC financial and governance model remains relevant. A review of the financial structure and funding mechanisms of Queensland Rail may yield administrative and other efficiencies.
90
2015 Review of State Finances
Seqwater
Seqwater comprises the bulk water assets of the State, those acquired from SEQ local councils and constructed in response to the drought emergency between 2006 and 2009. The assets acquired or constructed were financed with debt and a ten year price path was implemented over which full cost recovery could be achieved. As a result the aggregate debt of Seqwater is still increasing. A review of the capital structure may be warranted to strengthen its stand alone status.
| 8.4 | CAPITAL STRUCTURE AND RETURNS |
The ability to pursue commercial strategies for capital structuring should drive superior returns for the shareholder while at the same time ensuring the businesses operate efficiently.
The current approach to management of the capital structures has been to ensure that the businesses maintain an investment grade rating (BBB/Baa2). The gearing levels are however significantly below their private sector counterparts, as highlighted in the table below.
This is in part due to the funds that were retained to support high levels of capital expenditure. These capital expenditure requirements have moderated significantly over recent years. This inefficient use of capital has resulted in reduced financial performance.
Table 8.1
GOC Sector Benchmark Gearing Levels
| | | | | | |
Sector | | Private Sector
Peer Gearing
Levels | | Indicative GOC
Gearing Levels1 | |
Networks | | 70% - 85% | | | 55 | % |
Generation | | 30% - 40% | | | 50 | %2 |
Ports3 | | ~75% | | | 31 | %4 |
Water5 | | 65% - 70% | | | 40 | %6 |
| 1. | Financial year 2013-14. |
| 2. | Average - significant variance in gearing levels from 30% - 70%. |
| 3. | Debt capacity depends on growth, business model and level of operating risk. |
| 4. | Only includes GPC and PoTL. Significant range in gearing levels of all GOC Ports ~20% - 40%. |
| 5. | No water comparables; gas pipelines used as most relevant comparables. |
| 6. | SunWater only – excludes $208.1 million bridging loan and includes Bulk Water Assets. |
Source: Queensland Treasury Corporation
Gearing the GOCs to a more commercial level in line with their private sector peers, and using those funds to reduce General Government debt, has the benefit of more efficiently utilising the capital available to the State. This would be achieved by raising debt in the GOCs and using that debt to return equity to the State.
This should have no impact on their capacity to deliver services at the expected level of quality.
91
2015 Review of State Finances
The majority of GOCs operate regulated businesses, either directly or indirectly. The capital structure and dividend payment policies applied by Government to the GOCs are different from the approaches used by the private sector which traditionally looks to generate superior cash distributions to shareholders. Private sector regulated businesses typically use higher leverage and fund higher levels of distributions by borrowing against an annual asset revaluation, while maintaining investment grade credit metrics and a constant capital structure. This is consistent with regulated revenue models which treat the ability to borrow against the increasing asset base as a source of returns for equity holders.
In contrast, the approach adopted by the GOCs of paying dividends as a percentage of adjusted net profit after tax, has resulted in gearing levels falling below what is deemed to be an efficient capital structure because cash that would otherwise be distributed to equity is instead retained in the business. Similarly, the lender oversight by QTC has been ineffectual as a means of encouraging cost efficiencies because the required investment grade credit metrics are easily met.
Adopting a dividend policy aligned more closely with the private sector approach should result in an increase in dividends paid to Government.
However, a revised dividend and gearing policy must also consider the risks and impacts of potential changes to the market in which these businesses operate. That is, the structure should be both efficient and prudent.
Again, the emergence of substitution energy technologies and competitors represents a major challenge to the electricity GOCs in particular.
Each GOC has two shareholding Ministers: the Treasurer and the administering department Minister. The GOCs are governed by boards of directors which are responsible for the commercial operation and management of the GOC.
The current GOC model was established in 1993 and promoted four key principles:
| • | | Management autonomy and authority |
| • | | Strict accountability for performance |
| • | | Competitive neutrality. |
The GOC model promotes the commercial operation of the GOCs, free from operational Government interference, but within a framework of strategic oversight and performance monitoring. It requires that Government clearly delineates between its role as a shareholder, policy maker, regulator and service provider in each sector and does not allow conflicts between these to obscure the commercial mandate of the GOC. This does not occur in practice.
92
2015 Review of State Finances
GOCs’ ability to operate on a commercial basis is impeded by requirements to comply with policies or directions not required of their private sector counterparts. This has restricted the capacity of the boards and management of the businesses to act commercially and in the best interests of the companies and of the Government as a shareholder. This is evidenced by the numerous policies and guidelines to which the GOCs are expected to adhere, in addition to the requirements set out in the GOC Act and Corporations Act.
Successive governments have found it challenging to delineate between the roles of shareholder, policy maker, regulator and service provider. Arguably, the inclusion of the administrating departments’ Minister as a shareholding Minister has contributed to the conflict between the commercial charter of a GOC and the implementation of Government policy. It may be timely to review the governance structures under which the GOCs operate.
Maintaining an efficient capital structure for the GOCs provides the advantage of imposing private sector financial disciplines on the businesses. However, it will also increase the risks and volatility of returns. This will necessitate increased monitoring of the operations of the GOCs that traditionally is undertaken by the businesses’ financiers with the shareholder focused on performance.
QTC, in its role as financier, should operate more as a private sector financier and monitor the performance of the GOCs. This means monitoring performance against investment grade credit metrics and project finance loan covenants, regular credit reports and benchmarked performance.
93
2015 Review of State Finances
Appendix A: GOC Sector Asset and Equity Values and Debt Levels
Table 8.2
Summary of Asset and Equity Values and Debt Levels
| | | | | | | | | | | | | | |
GOC FY2014 Balances | | Sector | | Asset Value1
$ Million | | | Equity Value
$ Million | | | Total Debt
$ Million | |
Generators | | | | | | | | | | | | | | |
- CS Energy | | Energy | | | 1,450.9 | | | | 314.9 | | | | 1,801.7 | 2 |
- Stanwell | | Energy | | | 2,170.0 | | | | 1,324.0 | | | | 1,339.4 | 2 |
Networks | | | | | | | | | | | | | | |
- Powerlink | | Energy | | | 7,503.7 | | | | 2,580.8 | | | | 4,154.2 | |
- Energex | | Energy | | | 11,685.0 | | | | 3,825.0 | | | | 6,465.0 | |
- Ergon | | Energy | | | 9,879.0 | | | | 3,459.0 | | | | 5,115.0 | |
Ports | | | | | | | | | | | | | | |
- Gladstone Ports | | Transport | | | 1,610.0 | | | | 1,093.7 | | | | 461.5 | |
- Port of Townsville | | Transport | | | 519.2 | | | | 433.4 | | | | 84.3 | |
- North Queensland Bulk Ports | | Transport | | | 287.7 | | | | 266.8 | | | | 66.6 | |
- Ports North | | Transport | | | 114.5 | | | | 256.3 | | | | — | |
Utilities | | | | | | | | | | | | | | |
- SunWater3 | | Bulk Water | | | 996.9 | | | | 677.6 | | | | 479.9 | |
| | | | | | | | | | | | | | |
Total | | | | | 36,217.0 | | | | 14,231.5 | | | | 19,966.6 | |
| | | | | | | | | | | | | | |
| 1. | Asset value is Plant, Property & Equipment as per Annual Financial Statements. These values do not necessarily represent market value. |
| 2. | 2013/14 accounts show a net debt position after offset arrangements. |
| 3. | Total debt includes a bridging loan of $208.1M |
Source: 2013-14 Annual Financial Statements
94
2015 Review of State Finances
Appendix B: Returns on Equity
Table 8.3
Comparison - Cash Returns on Equity and Traditional Return on Equity
| | | | | | | | | | | | | | | | |
| | | 2010-11 | | | 2011-12 | | | 2012-13 | | | 2013-14 | |
Generators | | | | | | | | | | | | | | | | |
CS Energy | | | | | | | | | | | | | | | | |
Cash return on equity | | | 0.0 | % | | | 0.0 | % | | | 0.0 | % | | | 0.0 | % |
Return on equity | | | -72.5 | % | | | 42.6 | % | | | -14.9 | % | | | -1.6 | % |
Stanwell | | | | | | | | | | | | | | | | |
Cash return on equity | | | 0.0 | % | | | 5.1 | % | | | 1.0 | % | | | 7.3 | % |
Return on equity | | | -10.2 | % | | | 116.7 | % | | | -5.9 | % | | | 21.1 | % |
Networks | | | | | | | | | | | | | | | | |
Powerlink | | | | | | | | | | | | | | | | |
Cash return on equity | | | 5.5 | % | | | 6.3 | % | | | 21.6 | % | | | 6.5 | % |
Return on equity | | | 15.5 | % | | | 11.9 | % | | | 25.0 | % | | | 15.1 | % |
Energex | | | | | | | | | | | | | | | | |
Cash return on equity | | | 6.4 | % | | | 7.2 | % | | | 8.8 | % | | | 10.6 | % |
Return on equity | | | 20.8 | % | | | 14.4 | % | | | 16.4 | % | | | 26.9 | % |
Ergon | | | | | | | | | | | | | | | | |
Cash return on equity | | | 7.6 | % | | | 7.8 | % | | | 8.8 | % | | | 11.4 | % |
Return on equity | | | 34.0 | % | | | 7.2 | % | | | 22.6 | % | | | 3.7 | % |
Ports | | | | | | | | | | | | | | | | |
Gladstone Ports | | | | | | | | | | | | | | | | |
Cash return on equity | | | 5.1 | % | | | 5.6 | % | | | 6.6 | % | | | 5.4 | % |
Return on equity | | | 6.7 | % | | | 8.5 | % | | | 8.6 | % | | | 32.3 | % |
Port of Townsville | | | | | | | | | | | | | | | | |
Cash return on equity | | | 0.0 | % | | | 1.4 | % | | | 4.1 | % | | | 1.8 | % |
Return on equity | | | -0.3 | % | | | 6.8 | % | | | 11.0 | % | | | 13.1 | % |
North Queensland Bulk Ports | | | | | | | | | | | | | | | | |
Cash return on equity | | | 12.5 | % | | | 0.0 | % | | | 5.8 | % | | | 7.0 | % |
Return on equity | | | 271.1 | % | | | -86.7 | % | | | 19.3 | % | | | 8.5 | % |
Ports North | | | | | | | | | | | | | | | | |
Cash return on equity | | | 1.5 | % | | | 0.0 | % | | | 1.9 | % | | | 2.5 | % |
Return on equity | | | 1.8 | % | | | 5.2 | % | | | 2.2 | % | | | -5.1 | % |
Water | | | | | | | | | | | | | | | | |
SunWater | | | | | | | | | | | | | | | | |
Cash return on equity | | | 5.0 | % | | | 0.0 | % | | | 1.9 | % | | | 6.2 | % |
Return on equity | | | 10.4 | % | | | -2.5 | % | | | 3.2 | % | | | 7.9 | % |
Cash return on equity is calculated as dividends declared divided by equity.
Return on equity is calculated as change in equity plus dividends divided by the previous years equity.
Source: 2013-14 Annual Financial Statements
95
2015 Review of State Finances
Appendix C: Dividends and Tax Equivalents
Table 8.4
Summary of Dividends and Tax Equivalents – GOC Sector
| | | | | | | | | | | | |
GOC FY2014 Balances ($million) | | Dividends | | | Tax
Equivalents | | | Total | |
Generators | | | | | | | | | | | | |
- CS Energy | | | 0.0 | | | | (33.9 | )1 | | | (33.9 | ) |
- Stanwell | | | 96.5 | | | | 45.0 | | | | 141.5 | |
Networks | | | | | | | | | | | | |
- Powerlink | | | 167.8 | | | | 91.5 | | | | 259.3 | |
- Energex | | | 406.0 | | | | 215.0 | | | | 621.0 | |
- Ergon2 | | | 392.6 | | | | 172.0 | | | | 564.6 | |
Ports | | | | | | | | | | | | |
- Gladstone Ports | | | 58.6 | | | | 42.4 | | | | 101.0 | |
- Port of Townsville | | | 7.7 | | | | 7.5 | | | | 15.2 | |
- North Queensland Bulk Ports | | | 18.7 | | | | 7.5 | | | | 26.2 | |
- Ports North | | | 6.4 | | | | 4.8 | | | | 11.2 | |
Utilities | | | | | | | | | | | | |
- SunWater | | | 42.1 | | | | 15.0 | | | | 57.1 | |
| | | | | | | | | | | | |
Total | | | 1,196.4 | | | | 566.8 | | | | 1,763.2 | |
| | | | | | | | | | | | |
| 1. | Income tax benefit loss before income tax of ($93.8 million). |
| 2. | Ergon received a CSO payment of $519 million in FY2014. |
Source: 2013-14 Annual Financial Statements
| | | | |
| Note: | | • | | Dividend payments are made to the State in December each year. |
| | • | | Tax equivalents includes deferred tax expenses which will only be received in future years. Actual tax equivalents received were approximately $200 million lower than figure above. |
| | • | | Income tax benefit is an accounting adjustment and is not paid to CS Energy. |
96
2015 Review of State Finances
| 9. | THE GOVERNMENT’S FISCAL PRINCIPLES |
The coverage of the Government’s proposed fiscal principles is sound. However, based on the foregoing discussion and analysis, some modifications and clarifications are proposed.
As outlined in this document, the biggest fiscal issue facing the State is the high level of debt in the General Government sector. With the Government’s fiscal strategy being framed around this issue, dealing with debt should be the first principle.
| 9.1 | GENERAL GOVERNMENT DEBT |
Current Principle
Pay down General Government sector debt of $5.4 billion over six years, with a target of paying down $12 billion of General Government debt over ten years.
Discussion
The debt objective needs to be framed around three practical considerations:
| 1. | The current economic circumstances and outlook which suggest a prolonged period of below trend growth and relatively weak revenue growth. |
| 2. | Policy commitments and constraints, including the Government’s willingness and ability to take corrective measures (expenditure cuts or tax increases) to achieve the objective. |
| 3. | The inevitability that Government will face some funding pressures that will need to be addressed over the medium. |
While of course it would be Treasury’s preference to reduce debt in absolute terms, it is better for the principle to be enduring and achievable than overly ambitious. The Government’s ability to achieve a reduction in absolute terms also has to be reconsidered in light of post MYFER revenue developments.
Treasury’s view is that the most practical approach is a medium term objective that will see growth in the economy and revenues reduce the relative size of General Government debt over time.
The benefit of a medium term objective is that it would provide a clear policy direction and will help to inform the level of investment that should be available for the State’s infrastructure program which has a longer horizon than the forward estimates.
The General Government debt to revenue ratio is currently estimated to remain at around 90% over the forward estimates. The average of the other states (excluding Queensland) is currently around 60%.
Based on Treasury’s modelling, an objective of 70% to 80% is both reasonable and achievable over the next decade. Any debt reduction measures pursued outside of the ‘base case’ modelling assumptions would allow Government to pursue a more ambitious target. The key though is continuous improvement based around a tight fiscal strategy.
97
2015 Review of State Finances
Recommendation
The Government will target ongoing reductions in Queensland’s relative debt burden, as measured by the General Government debt to revenue ratio.
[A medium term quantitative target should be considered as part of the development of the 2015-16 Budget]
| 9.2 | GENERAL GOVERNMENT NET OPERATING SURPLUS |
Current Principle
Maintain a General Government sector net operating surplus over the economic cycle.
Discussion
Most states have the net operating balance as their headline fiscal measure. The issue for Government is the size of the operating surplus it needs to target to achieve its other objectives.
Throughout modern history, economic cycles have been a prominent feature of world economies. These cycles, which range in severity, are characterised by two distinct phases – contraction and expansion.
Measured from the most recent peak in 1990, the current cycle has lasted almost 25 years.
The likely intent of the reference to the economic cycle in the principle was to reflect that occasionally, for reasons well beyond control of Government, an operating deficit may be recorded. Where those circumstances are of a one-off nature, it may be unreasonable or indeed counterproductive to undertake corrective action.
A perfect example of this was in 2000-01, when Queensland’s net operating result went into deficit as a result the collapse of HIH Insurance (a licensed CTP insurer) and the transfer of the Townsville Water Board from the State to local government. It was entirely appropriate that Government did not take corrective action.
While acknowledging that these situations do arise, Treasury is concerned that the reference to the economic cycle will be too open to misinterpretation – including as a weakening in the Government’s resolve. It is better to explain the impact of unforeseen events when they arise.
The size of the net operating surplus target needs to be determined having regard to (a) the proposed size of the capital program; and (b) the debt objective/principle.
Recommendation
The Government will target a net operating surplus that ensures any new capital investment is funded primarily through recurrent revenues rather than borrowing.
98
2015 Review of State Finances
Current Principle
Borrowing in the General Government sector will be strictly managed for new infrastructure so as to be serviced within a General Government net operating surplus target, while also seeking to ensure a consistent flow of works to support jobs and the economy, and mitigate against a backlog of necessary works emerging.
Discussion
This principle arguably has two planks, the first covering the ‘fiscal constraint’ and the second covering the Government’s broad infrastructure policy intent.
Treasury’s concern with the first plank is that it is too open. The reader could interpret “serviced within a General Government net operating surplus target” to mean only meet the interest costs. This has never been a problem for Queensland.
The risk is that it could be seen as Government not learning the lessons of the last decade – that is, an operating surplus on its own is not sufficient to control debt.
If the recommendations in relation to the debt and net operating surplus principles above are accepted, this principle can be reframed to focus exclusively on the Government’s infrastructure intent.
Recommendation
The General Government capital program will be managed to ensure a consistent flow of works to support jobs and the economy, and reduce the risk of backlogs emerging.
Current Principle
Maintain competitive taxation by ensuring that General Government sector own-source revenue remains at or below 8.5% of nominal gross state product, on average, over the forward estimates.
Discussion
The broad policy intent of the principle is clear. It provides an appropriate recognition of the role of competitive levels of taxation in promoting positive economic outcomes.
Chapter 2 outlined that one of the reasons Queensland’s finances deteriorated over the period 2000-01 to 2013-14 is that there is a fundamental imbalance between Queensland’s expenditure aspirations/policies and its revenue policies. That is, Queensland now spends at levels at or above the national average but taxes at levels below the national average. At some point in the future, there needs to be some public discourse around this issue.
99
2015 Review of State Finances
Nonetheless, the principle remains consistent with the policy intent of successive Queensland Governments. The immediate issue is to clarify whether the principle is intended to apply to taxes or own-source revenue.
Based on the 8.5% of GSP, the reasonable inference is that it is intended to apply to all own-source revenues – total revenues less Australian Government grants and subsidies.
Over recent years, Queensland’s ratio has averaged around 8%. Increased financial performance from Queensland’s GOCs or a recovery in commodity prices and royalties could see this principle tested.
Queensland has unique funding arrangements for its defined benefit superannuation scheme and large financial asset holdings. These financial assets earn interest which, while classified as own-source revenue, is reinvested in the fund. That is, they are own-source but not own-purpose.
The inclusion of interest earnings in own-source revenues distorts the comparison with other states. Interest earnings should be excluded from the calculation.
An alternative of course would be to reframe the principle around State taxation using one or all of the familiar measures outlined below.
Table 9.1
Tax Competitiveness – 2014-15 Data
| | | | | | | | | | | | | | | | | | | | | | | | | | | | | | | | | | | | |
| | | QLD | | | NSW | | | VIC | | | WA | | | SA | | | TAS | | | ACT | | | NT | | | Avg | |
Taxation per capita ($) | | | 2,638 | | | | 3,423 | | | | 3,037 | | | | 3,506 | | | | 2,605 | | | | 1,934 | | | | 3,575 | | | | 2,392 | | | | 3,191 | |
Taxation effort (%) | | | 88.6 | | | | 106.9 | | | | 101.4 | | | | 95.4 | | | | 109.7 | | | | 92.4 | | | | 99.3 | | | | 83.5 | | | | 100.0 | |
Taxation % of GSP (%) | | | 3.78 | | | | 4.63 | | | | 4.63 | | | | 3.33 | | | | 4.33 | | | | 3.80 | | | | 3.53 | | | | 2.44 | | | | 4.17 | |
Source: Queensland Treasury, various sources
Recommendation
Retain as proposed, but agree that interest earnings on the State’s financial assets are excluded.
| 9.5 | FULL FUNDING OF LONG TERM LIABILITIES |
Current Principle
Target full funding of long term liabilities such as superannuation and WorkCover in accordance with actuarial advice.
100
2015 Review of State Finances
Discussion
As previously outlined, the various Government employee entitlement and insurance schemes are all in surplus at the latest reporting date of 30 June 2014. The Government is well placed to achieve this principle, with the key risk being investment market performance. Ongoing vigilance is required, particularly in relation to WorkCover, to ensure alignment between scheme design and contribution levels.
Recommendation
Retain as proposed.
101
2015 Review of State Finances
| 10. | KEY ENABLERS OF THE GOVERNMENT’S FISCAL PRINCIPLES |
Retain Strong FTE Controls
Employee expenses account for nearly half of General Government operating expenditure.
The Public Service Commission and agencies have good processes in place to monitor FTE numbers. These reporting arrangements should be retained. It is essential that FTE growth is limited to that which is already accommodated within existing funding formulae (e.g. schools) and the Government’s election commitments.
Align Wage Outcomes to Inflation
Employees need to be compensated fairly, but that compensation needs to have regard to the current economic circumstances. Value should also be placed on the Government’s guarantee of employment security.
With a direct link or strong nexus between many of the Government’s revenue sources and inflation, wage agreements that by design or accident (i.e. through lower inflation outcomes) lead to real wage increase will put the Budget under significant pressure. The current forward estimates are based on the former Government’s policy of 2.2% per annum.
Treasury recommends that the Government’s policy for the foreseeable future be to maintain wages in real terms. This could involve an approach under which rather than striking a three year agreement, employees were provided with more frequent adjustments for cost of living pressures based on actual CPI outcomes. A policy framework would need to be developed around this proposal.
Resist Spending as ‘the Solution’
In Australia the revenue growth over the past two decades was such that it allowed for a familiar three step pattern: 1. a problem is identified; 2. Government accepts ownership of the problem; 3. the solution is a spending package.
Sometimes, by the time the spending package is in place, the nature or extent of the problem has changed. The Government and the community at large will need to think laterally and develop solutions to problems beyond spending.
Allow Agencies to Change and Reprioritise
Generally, agencies have a good track record of managing within their budgets. However, they are under increasing pressure. They have not received non-labour escalation since 2004 and have had to absorb a series of efficiency dividends to contribute towards budget repair and fund election commitments.
102
2015 Review of State Finances
To live within their budgets, Ministers and agencies need the prerogative to continuously review and reprioritise – while of course ensuring that they comply with the Government’s policy commitments.
Benchmark and Understand Reasons for Differences in Performance
This Review is not a performance review, but there are obvious linkages between service delivery performance and fiscal outcomes.
Queensland now spends at levels at or around national averages in almost all service delivery areas. The output delivered or outcomes achieved per dollar spent vary across the states. In some areas Queensland may be outperforming and in other areas underperforming.
Where Queensland’s spending is not achieving the same results as in other states, Government and taxpayers have the right to know why. There may be valid reasons, but those reasons should be tested.
This is important with Australian Government funding to the states increasingly based on the concept of the ‘national efficient price’.
ICT – Wherever Possible, Don’t ‘Build Your Own’
Government is not alone in finding major ICT development difficult. There are stories of major ICT development failures in both the public and private sectors.
It is increasingly accepted that when the claim is that the ICT need is unique, it is easier and cheaper to change the business than build the system.
The Queensland Government has a number of significant system related decisions to make over coming years.
Standardising processes so that Government can access private sector ICT as a service is not outsourcing. It is sensible risk management and in line with current trends in ICT delivery.
| 10.2 | BALANCE SHEET MANAGEMENT |
Manage the Balance Sheet
The issue of the public ownership of GOCs has now been clearly resolved. Nonetheless, the State has a vast balance sheet which needs to be managed actively to meet the Government debt objectives and future infrastructure needs. Treasury needs to work closely with QTC and QIC on solutions to these issues.
Some agencies are struggling under the weight of their infrastructure footprints and do not have sufficient funding to maintain their existing assets properly. If they can’t adapt to changing circumstances and needs, the hidden cost is poorly maintained schools, roads etc.
103
2015 Review of State Finances
Disposing of vacant land or underutilised facilities, or choosing to lease rather than buy, cannot be viewed in the same light as the public ownership of GOCs. Rather, these actions should represent the routine business of Government and should be pursued where sensible.
Develop Mechanisms to Ration Available Capital Wisely
For the foreseeable future, Queensland will need to closely align its capital spending ambitions to the available cash flow generated by the budget. Against this backdrop, some observations follow.
Historically, new projects have invariably displaced the important maintenance task. Schools are a case in point.
The focus needs to be on the most efficient way of achieving the outcome sought, rather than the pursuit of ‘the project’. In some cases, small tactical capital or demand interventions may produce better economic and service delivery outcomes.
It is not difficult to find projects that produce positive benefit to cost ratios. What is really required is a robust evaluation and prioritisation framework that allows for the relative ranking of projects within a funding limit.
The role of Building Queensland as the Government’s core infrastructure advisor will be pivotal.
Defend the Revenue Base
When the economy is weak Government is put under increasing pressure for tax reductions and concessions.
By any reasonable measure, Queensland’s tax take is low when compared to other states. From a design perspective, State taxes are far from ideal but are unlikely to be the cause or the solution to sector specific problems.
Revenue concessions are also particularly harmful to Queensland’s credit rating position, as they damage both the numerator and denominator in key credit metrics.
104
2015 Review of State Finances
GLOSSARY OF TERMS
| | |
| 3Ps | | Population (growth) Participation and Productivity |
| |
| A$ | | Australian Dollar |
| |
| ABS | | Australian Bureau of Statistics |
| |
| ACT | | Australian Capital Territory |
| |
| ACCC | | Australian Competition and Consumer Commission |
| |
| AEMO | | Australian Energy Market Operator |
| |
| AER | | Australian Energy Regulator |
| |
| AWE | | Average Weekly Earnings |
| |
| BCA | | Baseline Credit Assessment |
| |
| CGC | | Commonwealth Grants Commission |
| |
| CITEC | | Queensland Government Information and Communication Technology provider |
| |
| COAG | | Council of Australian Governments |
| |
| CPI | | Consumer Price Index |
| |
| CS Energy | | CS Energy Limited |
| |
| CSG-LNG | | Coal Seam Gas – Liquefied Natural Gas |
| |
| CSO | | Community Service Obligation |
| |
| CTP | | Compulsory Third Party |
| |
| DG | | Director-General |
| |
| DET | | Department of Education and Training |
| |
| EEQ | | Ergon Energy Queensland Pty Ltd |
| |
| Energex | | Energex Limited |
| |
| Ergon | | Ergon Energy Corporation Limited |
| |
| FTE | | Full-time equivalent |
| |
| GDP | | Gross Domestic Product |
| |
| GFC | | Global Financial Crisis |
| |
| GFS | | Government Finance Statistics |
| |
| GG | | General Government (Sector) |
| |
| GOC | | Government Owned Corporation |
| |
| GPS | | Gladstone Power Station |
| |
| GPC | | Gladstone Ports Corporation |
| |
| GSI | | Gross State Income |
| |
| GSP | | Gross State Product |
105
2015 Review of State Finances
| | |
| GST | | Goods and Services Tax |
| |
| HAP | | Health Action Plan |
| |
| HFE | | Horizontal Fiscal Equalisation |
| |
| HHS | | Hospital and Health Service |
| |
| ICT | | Information and Communication Technology |
| |
| IPPA | | Interconnected Power Pooling Agreement |
| |
| LNG | | Liquefied Natural Gas |
| |
| MetTRIP | | Queensland Rail Citytrain Network |
| |
| Mt | | Million tonnes |
| |
| More Beds | | More Beds for Hospitals Program |
| |
| MOHRI | | Minimum Obligatory Human Resource Information |
| |
| MYEFO | | Mid-year Economic and Fiscal Outlook |
| |
| MYFER | | Mid-year Fiscal and Economic Review |
| |
| NDIS | | National Disability Insurance Scheme |
| |
| NPV | | Net Present Value |
| |
| NSW | | New South Wales |
| |
| Powerlink | | Queensland Electricity Transmission Corporation |
| |
| QCA | | Queensland Competition Authority |
| |
| QIC | | Queensland Investment Corporation |
| |
| QLD | | Queensland |
| |
| QML | | Queensland Motorways Limited |
| |
| QPS | | Queensland Police Service |
| |
| QR | | Queensland Rail |
| |
| QSuper | | QSuper Limited |
| |
| QTC | | Queensland Treasury Corporation |
| |
| RBA | | Reserve Bank of Australia |
| |
| SA | | South Australia |
| |
| S&P | | Standard & Poor’s |
| |
| SCI | | Statement of Corporate Intent |
| |
| SEQ | | South East Queensland |
| |
| Stanwell | | Stanwell Corporation Limited |
| |
| SunWater | | SunWater Limited |
| |
| Tas | | Tasmania |
| |
| Treasury | | Queensland Treasury |
| |
| US$ | | United States Dollar |
106
2015 Review of State Finances
| | |
| Vic | | Victoria |
| |
| WA | | Western Australia |
| |
| WACC | | Weighted average cost of capital |
| |
| WorkCover | | WorkCover Queensland |
| |
| WPI | | Wage Price Index |
107