EXHIBIT (c)(ii)
Consolidated Financial Statements of the Co-Registrant for the fiscal year ended June 30, 2016.
FORWARD-LOOKING STATEMENTS
This exhibit contains forward-looking statements. Statements that are not historical facts, including statements about the State of Queensland’s (the “State” or “Queensland”) beliefs and expectations, are forward-looking statements. These statements are based on current plans, budgets, estimates and projections and therefore you should not place undue reliance on them. The words “believe”, “may”, “will”, “should”, “estimate”, “continue”, “anticipate”, “intend”, “expect”, “forecast” and similar words are intended to identify forward-looking statements. Forward-looking statements speak only as of the date they are made, and neither the Queensland Treasury Corporation nor the State undertake any obligation to update publicly any of them in light of new information or future events.
Forward-looking statements are based on current plans, estimates and projections and, therefore, undue reliance should not be placed on them. Although the Queensland Treasury Corporation and the State believe that the beliefs and expectations reflected in such forward-looking statements are reasonable, no assurance can be given that such beliefs and expectations will prove to have been correct. Forward-looking statements involve inherent risks and uncertainties. We caution you that actual results may differ materially from those contained in any forward-looking statements.
A number of important factors could cause actual results to differ materially from those expressed in any forward-looking statement. Factors that could cause the actual outcomes to differ materially from those expressed or implied in forward-looking statements include:
| | • | | the international and Australian economies, and in particular the rates of growth (or contraction) of the State’s major trading partners; |
| | • | | the effects, both internationally and in Australia, of any economic downturn, ongoing economic, banking and sovereign debt risk in Europe and any stalling of the protracted United States recovery; |
| | • | | increases or decreases in international and Australian domestic interest rates; |
| | • | | changes in the State’s domestic consumption; |
| | • | | changes in the State’s labor force participation and productivity; |
| | • | | downgrades in the credit ratings of the State or Australia; |
| | • | | changes in the rate of inflation in the State; |
| | • | | changes in environmental and other regulation; and |
| | • | | changes in the distribution of revenue from the Commonwealth of Australia Government to the State. |
2015–16 Report on State Finances of the Queensland Government – 30 June 2016
Incorporating the Outcomes Report and the AASB 1049 Financial Statements
Contents
| | | | |
| | | Page | |
| |
Message from the Treasurer | | | 3 | |
| |
Outcomes Report - Uniform Presentation Framework | | | | |
| |
Overview and Analysis | | | 4-01 | |
| |
Operating Statement by Sector | | | 4-07 | |
| |
Balance Sheet by Sector | | | 4-08 | |
| |
Cash Flow Statement by Sector | | | 4-09 | |
| |
General Government Sector Taxes | | | 4-10 | |
| |
General Government Sector Dividend and Income Tax Equivalent Income | | | 4-10 | |
| |
General Government Sector Grant Revenue | | | 4-11 | |
| |
General Government Sector Grant Expenses | | | 4-11 | |
| |
General Government Sector Expenses by Function | | | 4-12 | |
| |
General Government Sector Purchases of Non-financial Assets by Function | | | 4-13 | |
| |
Loan Council Allocation | | | 4-13 | |
| |
Certification of Outcomes Report | | | 4-14 | |
| |
AASB 1049 Financial Statements | | | | |
| |
Overview and Analysis | | | 5-01 | |
| |
Audited Financial Statements | | | | |
| |
Operating Statement | | | 6-01 | |
| |
Balance Sheet | | | 6-03 | |
| |
Statement of Changes in Net Assets (Equity) | | | 6-04 | |
| |
Cash Flow Statement | | | 6-06 | |
| |
Notes to the Financial Statements | | | 6-07 | |
| |
Certification of Queensland State Government Financial Statements | | | 6-91 | |
| |
Independent Auditor’s Report to the Treasurer of Queensland | | | 6-92 | |
| | | | |
| Report on State Finances 2015–16 – Government of Queensland | | 1 |
This page is intentionally left blank
| | | | |
| 2 | | Report on State Finances 2015–16 – Government of Queensland |
Message from the Treasurer
This Report on State Finances incorporates Queensland’s Outcomes Report and AASB1049 Financial Statements for the General Government Sector (GGS) and Whole of Government (Total State Sector), providing a comprehensive analysis of Government’s finances for the 2015-16 financial year.
The Outcomes Report
The Outcomes Report contains financial statements that are prepared and presented in accordance with the Uniform Presentation Framework (UPF) agreed to at the 1991 Premiers’ Conference and revised in 2008 to align with AASB 1049 Whole of Government and General Government Sector Financial Reporting. The primary objective of the UPF is to provide uniform and comparable reporting of Commonwealth, State and Territory Governments’ financial information.
Queensland’s annual Budget was prepared in accordance with the UPF. The Outcomes Report compares achieved financial results with revised forecasts contained in the 2016-17 Budget papers.
The UPF presentation is primarily structured on a sectoral basis with a focus on the General Government and Public Non-financial Corporations sectors.
The AASB 1049 Financial Statements
The AASB 1049 Financial Statements outline the operations of the Queensland Government on an accrual basis in accordance with Australian Accounting Standard AASB 1049 and other applicable standards. The statements present the Operating Statement, Balance Sheet and Cash Flows of the Queensland Total State Sector on a consolidated basis and the GGS on a partially consolidated basis.
AASB 1049 was released in October 2007. The standard aims to harmonise the Government Finance Statistics (GFS) and Accounting Standard frameworks. The GFS reporting framework, developed by the Australian Bureau of Statistics (ABS), is based on international statistical standards and allows comprehensive assessments to be made of the economic impact of government. A full set of financial statements is required for both the GGS and Total State Sector. Comparison is with the prior year, though the GGS financial statements also require analysis of variances between original budget and actuals.
Financial statements for the General Government, Public Non-financial Corporations and Public Financial Corporations sectors are disclosed in the disaggregated information note to the financial statements (Note 2).
A full list of consolidated entities is disclosed in Note 49 of the financial statements.
Where applicable, comparatives have been restated to agree with changes in presentation in the financial statements for the current reporting period and to correct timing differences and/or errors from prior periods.
Related Publications
This report complements other key publications relating to the financial performance of the Queensland Public Sector including:
| | - | the annual Budget papers; |
| | - | Budget updates including the Mid Year Fiscal and Economic Review; |
| | - | the Treasurer’s Consolidated Fund Financial Report; and |
| | - | the annual reports of the various departments, statutory bodies, Government-owned corporations and other entities that comprise the Queensland Government. |
I note the assurances of Treasury officials that both the Outcomes Report and the audited financial statements are presented on a true and fair basis and that the independent auditor’s report is unqualified.
In endorsing this report, I place on record my appreciation of the professionalism and co-operation extended to Queensland Treasury by agency personnel and of the Treasury staff involved in its preparation.
HON. CURTIS PITT MP
Treasurer
Minister for Aboriginal and Torres Strait Islander Partnerships
Minister for Sport
| | | | |
| Report on State Finances 2015–16 – Government of Queensland | | 3 |
2015-16 Outcomes Report
Uniform Presentation Framework of the Queensland Government – 30 June 2016
Outcomes Report - Overview and Analysis
Overview
The General Government UPF net operating balance for 2015-16 was a surplus of $970 million. This is $818 million higher than the 2016-17 Budget estimated actual surplus of $152 million.
The 2015-16 result is the largest operating surplus since 2006-07.
Chart 4.1: General Government Sector net operating balance 2005-06 to 2015-16
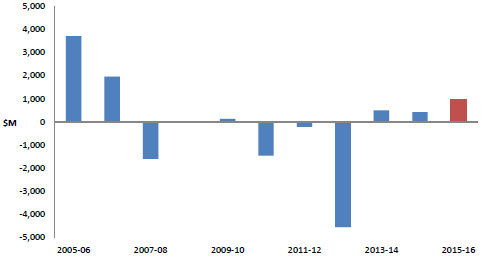
Source: Queensland Report on State Finances AASB 1049 Statements 2005-06 to 2015-16
GGS gross borrowings at 30 June 2016 were $35.486 billion, slightly below the estimated actual of $35.698 billion and significantly below the 2014-15 Budget projection of $48.023 billion and 2015-16 Budget of $38.151 billion, as shown in Chart 4.2.
Chart 4.2: General Government Sector borrowings, 2015-16, estimates and actual
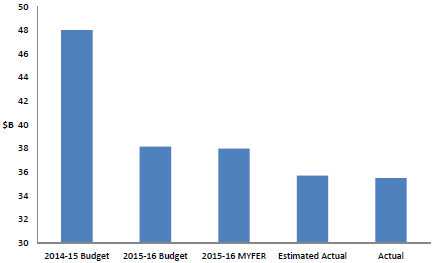
Source: Queensland State Budgets 2014-15 to 2016-17, 2015-16 MYFER and 2015-16 Report on State Finances
| | | | |
| Report on State Finances 2015–16 – Government of Queensland | | 4-01 |
Outcomes Report - Overview and Analysis
Relative to 2014-15, the GGS gross borrowings decreased by $7.619 billion in 2015-16, while revenue increased by $1.025 billion. As a result, the debt to revenue ratio improved (decreased) from 87% in 2014-15 to 70% in 2015-16. The Government’s Debt Action Plan played a significant role in this improvement.
Non-financial Public Sector gross borrowings of $72.922 billion were $7.697 billion lower than the 2014-15 Budget projection. This outcome was $1.191 billion lower than the 2015-16 Budget of $74.113 billion.
The proportion of General Government capital investment funded through operating cash flows in 2015-16 was 115%, in line with the estimated actual at the time of the 2016-17 Budget. The outcome represents a significant improvement on the 2015-16 Budget projection of 83% and the 2015-16 MYFER estimate of 82%.
Chart 4.3: General Government Sector operating cashflows as a proportion of capital purchases, 2015-16, estimates and actual
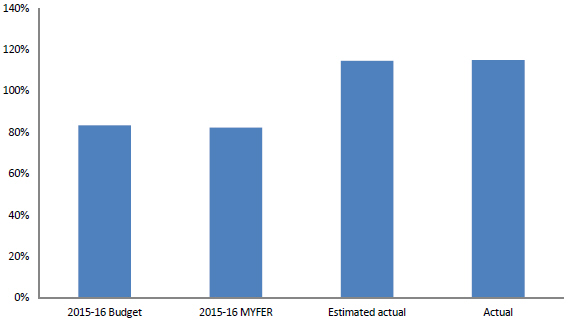
Source: Queensland 2015-16 State Budget, 2015-16 MYFER, 2016-17 State Budget, and 2015-16 Report on State Finances
Fiscal principles
Following consideration of the Review of State Finances, prepared by Queensland Treasury, the Government tabled a revised Charter of Fiscal Responsibility in Parliament. In keeping with the requirement to regularly report progress against the principles set out in the Charter, the table on page 4-03 provides an overview of these fiscal principles and progress against them for the 2015-16 financial year. A new fiscal principle in relation to the size of the public service was introduced in the 2016-17 Budget and will be reported against from the 2016-17 year onwards.
Principle 1 - Target ongoing reductions in Queensland’s relative debt burden, as measured by the General Government debt to revenue ratio
In managing GGS debt, a debt to revenue ratio is a key measure of the sustainability of a jurisdiction’s debt levels. Queensland’s debt to revenue ratio was 70% in 2015-16, slightly lower than the estimated actual.
The debt to revenue ratio peaked at 91% in 2012-13 and is expected to stabilise around 70%, as a result of the Government’s Debt Action Plan.
Principle 2 - Target net operating surpluses that ensure any new capital investment in the General Government Sector is funded primarily through recurrent revenues rather than borrowing
Given the importance of managing GGS debt, the Government recognises that the size of the General Government operating surplus must be large enough that recurrent revenues, rather than borrowings, are the primary funding source for capital investment in the GGS.
The proportion of General Government capital investment funded through operating cash flows in 2015-16 was 115%, as estimated in the 2016-17 Budget.
Principle 3 - The capital program will be managed to ensure a consistent flow of works to support jobs and the economy and reduce the risk of backlogs emerging
While the value of the capital program can fluctuate across individual years, the 2016-17 Budget provides for GGS capital purchases of non-financial assets to average of $6 billion across 2016-17 to 2019-20.
| | | | |
| 4-02 | | Report on State Finances 2015–16 – Government of Queensland |
Outcomes Report - Overview and Analysis
Fiscal principles - continued
Principle 4 - Maintain competitive taxation by ensuring that General Government Sector own-source revenue remains at or below 8.5% of nominal gross state product, on average, across the forward estimates
Government has a clear role in providing an economic environment that supports business and jobs growth and does not place undue strain on households. In 2015-16, own-source revenue represented 8.7% of nominal gross state product, slightly above the estimate in the 2016-17 Budget, mainly due to additional revenue. Own source revenue is expected to average 7.5% of gross state product across the forward estimates.
Principle 5 - Target full funding of long term liabilities such as superannuation and WorkCover in accordance with actuarial advice.
Consistent with the long-standing practice of successive governments, the Queensland Government is committed to ensuring that the State sets aside assets, on an actuarially determined basis, to meet long term liabilities such as superannuation and WorkCover. The latest full actuarial review of the QSuper scheme was as at 30 June 2015 and was presented in a report dated 31 March 2016.
As at 30 June 2016, WorkCover Queensland was fully funded.
| | | | |
| The fiscal principles of the Queensland Government 2015-16 |
| |
Principle | | Indicator |
| | Debt to Revenue Ratio |
| Target ongoing reductions in Queensland’s relative debt burden, as measured by the General Government debt to revenue ratio | | Est. Actual | | Outcome |
| | 71% | | 70% |
| | Capital purchases to Operating cash flows |
| Target net operating surpluses that ensure any new capital investment in the General Government Sector is funded primarily through recurrent revenue rather than borrowings | | Est. Actual | | Outcome |
| | 115% | | 115% |
| | GGS purchases of non-financial assets |
| The capital program will be managed to ensure a consistent flow of works to support jobs and the economy and reduce the risk of backlogs emerging | | Est. Actual | | Outcome |
| | $4.173 billion | | $4.092 billion |
| | Own-source revenue to gross state product ratio |
| Maintain competitive taxation by ensuring that General Government Sector own-source revenue remains at or below 8.5% of nominal gross state product, on average, across the forward estimates | | Est. Actual | | Outcome |
| | 8.3% | | 8.7% |
| Target full funding of long-term liabilities such as superannuation in accordance with actuarial advice | | The latest full actuarial review of the QSuper scheme as at 30 June 2015 found the scheme to be fully funded. |
| | | | |
| Report on State Finances 2015–16 – Government of Queensland | | 4-03 |
Outcomes Report - Overview and Analysis
Summary of Key UPF Financial Aggregates
Outlined in the table below are the key aggregates, by sector.
| | | | | | | | | | | | | | | | | | | | | | | | |
| | | General Government
Sector | | | Public Non-financial
Corporations Sector | | | Non-financial Public
Sector | |
| | | Est. Actual | | | Outcome | | | Est. Actual | | | Outcome | | | Est. Actual | | | Outcome | |
| | | $ million | | | $ million | | | $ million | | | $ million | | | $ million | | | $ million | |
Revenue | | | 49,976 | | | | 50,995 | | | | 11,310 | | | | 11,863 | | | | 56,203 | | | | 57,608 | |
Expenses | | | 49,824 | | | | 50,025 | | | | 9,894 | | | | 10,263 | | | | 56,242 | | | | 56,735 | |
Net operating balance | | | 152 | | | | 970 | | | | 1,416 | | | | 1,600 | | | | (39 | ) | | | 873 | |
Capital purchases | | | 4,173 | | | | 4,092 | | | | 2,745 | | | | 2,773 | | | | 6,918 | | | | 6,900 | |
Fiscal balance | | | (940 | ) | | | (461 | ) | | | 1,085 | | | | 1,178 | | | | (1,462 | ) | | | (1,020 | ) |
Borrowing | | | 35,698 | | | | 35,486 | | | | 37,018 | | | | 37,436 | | | | 72,715 | | | | 72,922 | |
Note:
| 1. | Numbers may not add due to rounding |
General Government Sector
| | | | | | | | |
General Government Revenue | | 2015-16
Est. Actual
$ million | | | 2015-16
Outcome
$ million | |
Taxation revenue | | | 12,660 | | | | 12,547 | |
Grants revenue | | | 23,696 | | | | 23,740 | |
Sales of goods and services | | | 5,409 | | | | 5,926 | |
Interest income | | | 2,427 | | | | 2,543 | |
Dividend and income tax equivalent income | | | 2,438 | | | | 2,661 | |
Other revenue | | | 3,346 | | | | 3,577 | |
Total Revenue | | | 49,976 | | | | 50,995 | |
Note:
| 1. | Numbers may not add due to rounding |
Total GGS revenue was $1.019 billion higher than the 2015-16 estimated actual. Sales of goods and services were higher, mainly due to the grossing up of medical supplies in the Outcome and increased funding for health from the Commonwealth for higher activity through the Pharmaceutical Benefits Scheme. Higher income tax equivalents and dividends mainly from Electricity businesses and higher other revenue (royalties and contributed assets) were partly offset by lower taxes, primarily payroll tax and transfer duty.
| | | | | | | | |
| | | 2015-16 | | | 2015-16 | |
| | | Est. Actual | | | Outcome | |
General Government Expenses | | $ million | | | $ million | |
Employee expenses | | | 19,956 | | | | 20,044 | |
Superannuation expenses | | | | | | | | |
Superannuation interest cost | | | 778 | | | | 767 | |
Other superannuation expenses | | | 2,548 | | | | 2,507 | |
Other operating expenses | | | 14,895 | | | | 15,000 | |
Depreciation and amortisation | | | 3,367 | | | | 2,927 | |
Other interest expenses | | | 2,193 | | | | 2,220 | |
Grant expenses | | | 6,088 | | | | 6,559 | |
Total Expenses | | | 49,824 | | | | 50,025 | |
Note:
| 1. | Numbers may not add due to rounding |
Total GGS expenses for 2015-16 were $201 million higher than expected in the 2016-17 Budget:
| - | | Grant expenses were $471 million higher than budgeted, though this was mainly due to a reallocation from other operating expenses in relation to payments to TAFE providers. The corresponding decrease in other operating expenses was offset by the grossing up of expenses on medical supplies and pharmaceutical sales as well as additional road expenses. |
| - | | The lower depreciation expense follows a review of asset lives for road infrastructure. |
| | | | |
| 4-04 | | Report on State Finances 2015–16 – Government of Queensland |
Outcomes Report - Overview and Analysis
GGS expenditure is focussed on the delivery of core services to the community. As shown in Chart 4.4 below, education and health account for over half of the total expenses.
Chart 4.4: Expenses by Function1 (General Government Sector) 2015-16
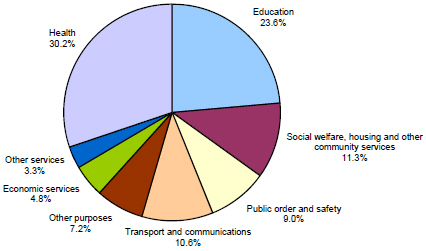
| 1 | Refer to page 4-12 for further detail of expenses in each function. |
Net Operating Balance
The net operating balance is the net of revenue and expenses from transactions and was $970 million, compared to the 2016-17 Budget estimate for 2015-16 of $152 million. This difference is largely due to the higher revenue and lower depreciation expense, as discussed above.
Capital Purchases
GGS purchases of non-financial assets (i.e. capital expenditure) totalled $4.092 billion which was $81 million less than the 2016-17 Budget estimate for 2015-16 capital purchases.
Fiscal Balance
The fiscal balance or net lending/borrowing aggregate broadly shows how much of the acquisition of non-financial assets is financed by the net operating balance (excluding depreciation and non-cash grants) and how much by borrowing.
The improvement in the fiscal balance for 2015-16 from a deficit of $940 million at the time of the 2016-17 Budget to a deficit of $461 million is mainly due to the higher revenue as mentioned above.
Borrowing
Gross borrowings were $35.486 billion compared to the forecast of $35.698 billion. Net repayment of borrowing for the GGS for 2015-16 was $6.738 billion, compared to the estimate at the time of the 2016-17 Budget of $7.465 billion due to timing differences on borrowing reflected in higher cash balances.
Net Worth
The General Government’s net worth was $191.91 billion as at 30 June 2016, $24.826 billion higher than the estimated actual included in the 2016-17 Budget. The increase related mainly to the revaluation of roads and land under roads (including a prior year adjustment). Road infrastructure is now valued on a basis that more closely reflects the cost of largely working on existing (brownfield) road alignments rather than unconstrained greenfield sites. The remaining useful lives of some components of road assets were also extended as part of this review resulting in lower depreciation for the year.
| | | | |
| Report on State Finances 2015–16 – Government of Queensland | | 4-05 |
Outcomes Report - Overview and Analysis
Operating Result
The operating result represents the result for the State under the Accounting Standards framework. The GGS operating result of $1.088 billion differs from the net operating balance as it includes valuation adjustments such as gains and losses on financial and non-financial assets and the effect of revising the capital structure of the Government owned corporations.
Comprehensive Result - Total Change in Net Worth
The comprehensive result includes revaluation of assets taken to reserves. The increase from the estimated actual to the actual comprehensive result was due mainly to the revaluations of non-financial assets discussed above.
Public Non-financial Corporations (PNFC) Sector
The Public Non-financial Corporations Sector comprises bodies such as Government-owned corporations that mainly engage in the production of goods and services (of a non-financial nature) for sale in the market place at prices that aim to recover most of the costs involved:
| - | | The PNFC Sector recorded a net operating surplus of $1.6 billion, $184 million higher than forecast. Both revenue and expenses were higher than forecast, mainly due to higher than expected demand for electricity generation. |
| - | | The fiscal balance was a surplus of $1.178 billion, compared to an estimated surplus of $1.085 billion. |
State Financial (Total State) Sector
The Total State Sector includes all State Government departments and statutory authorities, public non-financial corporations, public financial corporations and their controlled entities. All material inter-entity and intra-entity transactions and balances have been eliminated to the extent practicable:
| - | | The net operating balance for 2015-16 was a deficit of $494 million, while the operating result was a deficit of $4.088 billion as it includes the net increase in market value of QTC’s external borrowings and derivatives and QIC’s investments. |
| - | | The cash deficit was $1.849 billion for 2015-16 after allowing for purchases of non-financial assets of $6.93 billion. |
| - | | The net worth was $182.09 billion, an increase of over $20 billion to that published in 2014-15, which largely reflects the net effect of market value movements in infrastructure, investments and borrowings. |
| | | | |
| 4-06 | | Report on State Finances 2015–16 – Government of Queensland |
2015-16 Operating Statement by Sector ($ million)
| | | | | | | | | | | | | | | | | | | | | | | | | | | | | | | | | | |
| | | | | | | | | | | | | | | | | | | | | | | Public Financial | | | State | |
| | | | | General Government | | | Public Non-financial | | | Non-financial Public | | | Corporations | | | Financial | |
| | | | | Sector | | | Corporations Sector | | | Sector | | | Sector | | | Sector | |
| | | | | Est. Actual | | | Actual | | | Est. Actual | | | Actual | | | Est. Actual | | | Actual | | | Actual (b) | | | Actual (b) | |
| | Revenue from Transactions | | | | | | | | | | | | | | | | | | | | | | | | | | | | | | | | |
| | Taxation revenue | | | 12,660 | | | | 12,547 | | | | — | | | | — | | | | 12,345 | | | | 12,231 | | | | — | | | | 12,226 | |
| | Grants revenue | | | 23,696 | | | | 23,740 | | | | 719 | | | | 699 | | | | 23,845 | | | | 23,823 | | | | — | | | | 23,746 | |
| | Sales of goods and services | | | 5,409 | | | | 5,926 | | | | 10,336 | | | | 10,777 | | | | 13,863 | | | | 14,882 | | | | 1,702 | | | | 16,327 | |
| | Interest income | | | 2,427 | | | | 2,543 | | | | 58 | | | | 62 | | | | 2,485 | | | | 2,605 | | | | 5,060 | | | | 1,565 | |
| | Dividend and income tax equivalent income | | | 2,438 | | | | 2,661 | | | | 14 | | | | 14 | | | | 135 | | | | 182 | | | | — | | | | 20 | |
| | Other revenue | | | 3,346 | | | | 3,577 | | | | 183 | | | | 310 | | | | 3,530 | | | | 3,884 | | | | 98 | | | | 3,974 | |
| | Total Revenue from Transactions | | | 49,976 | | | | 50,995 | | | | 11,310 | | | | 11,863 | | | | 56,203 | | | | 57,608 | | | | 6,860 | | | | 57,859 | |
| | | | | | | | | |
Less | | Expenses from Transactions | | | | | | | | | | | | | | | | | | | | | | | | | | | | | | | | |
| | Employee expenses | | | 19,956 | | | | 20,044 | | | | 1,630 | | | | 1,625 | | | | 21,483 | | | | 21,571 | | | | 270 | | | | 21,632 | |
| | Superannuation expenses | | | | | | | | | | | | | | | | | | | | | | | | | | | | | | | | |
| | Superannuation interest cost | | | 778 | | | | 767 | | | | — | | | | (12 | ) | | | 778 | | | | 755 | | | | — | | | | 755 | |
| | Other superannuation expenses | | | 2,548 | | | | 2,507 | | | | 218 | | | | 201 | | | | 2,766 | | | | 2,709 | | | | 17 | | | | 2,726 | |
| | Other operating expenses | | | 14,895 | | | | 15,000 | | | | 3,054 | | | | 3,400 | | | | 16,063 | | | | 16,564 | | | | 1,555 | | | | 18,109 | |
| | Depreciation and amortisation | | | 3,367 | | | | 2,927 | | | | 2,365 | | | | 2,346 | | | | 5,732 | | | | 5,274 | | | | 51 | | | | 5,325 | |
| | Other interest expenses | | | 2,193 | | | | 2,220 | | | | 1,897 | | | | 1,885 | | | | 3,888 | | | | 3,904 | | | | 6,094 | | | | 3,847 | |
| | Grants expenses | | | 6,088 | | | | 6,559 | | | | 15 | | | | 15 | | | | 5,533 | | | | 5,958 | | | | 77 | | | | 5,958 | |
| | Other property expenses | | | — | | | | — | | | | 715 | | | | 802 | | | | — | | | | — | | | | 53 | | | | — | |
| | Total Expenses from Transactions | | | 49,824 | | | | 50,025 | | | | 9,894 | | | | 10,263 | | | | 56,242 | | | | 56,735 | | | | 8,118 | | | | 58,353 | |
Equals | | Net Operating Balance | | | 152 | | | | 970 | | | | 1,416 | | | | 1,600 | | | | (39 | ) | | | 873 | | | | (1,258 | ) | | | (494 | ) |
| | | | | | | | | |
| | Other economic flows - included in operating result | | | 397 | | | | 119 | | | | (81 | ) | | | (277 | ) | | | (529 | ) | | | (753 | ) | | | 420 | | | | (3,594 | ) |
| | | | | | | | | |
| | Operating Result | | | 549 | | | | 1,088 | | | | 1,335 | | | | 1,323 | | | | (568 | ) | | | 120 | | | | (838 | ) | | | (4,088 | ) |
| | | | | | | | | |
| | Other economic flows - other movements in equity | | | (1,647 | ) | | | 22,639 | | | | (2,383 | ) | | | (3,339 | ) | | | (530 | ) | | | 23,608 | | | | (111 | ) | | | 24,555 | |
| | | | | | | | | |
| | Comprehensive Result - Total Change in Net Worth | | | (1,098 | ) | | | 23,728 | | | | (1,048 | ) | | | (2,016 | ) | | | (1,098 | ) | | | 23,728 | | | | (948 | ) | | | 20,467 | |
| | | | | | | | | | | | | | | | | | | | | | | | | | | | | | | | | | |
| | KEY FISCAL AGGREGATES | | | | | | | | | | | | | | | | | | | | | | | | | | | | | | | | |
| | | | | | | | | |
| | Net Operating Balance | | | 152 | | | | 970 | | | | 1,416 | | | | 1,600 | | | | (39 | ) | | | 873 | | | | (1,258 | ) | | | (494 | ) |
| | | | | | | | | |
Less | | Net Acquisition of Non-financial Assets | | | | | | | | | | | | | | | | | | | | | | | | | | | | | | | | |
| | Purchases of non-financial assets | | | 4,173 | | | | 4,092 | | | | 2,745 | | | | 2,773 | | | | 6,918 | | | | 6,900 | | | | 29 | | | | 6,930 | |
| | Less Sales of non-financial assets | | | 216 | | | | 254 | | | | 45 | | | | 45 | | | | 261 | | | | 292 | | | | 8 | | | | 299 | |
| | Less Depreciation | | | 3,367 | | | | 2,927 | | | | 2,365 | | | | 2,346 | | | | 5,732 | | | | 5,274 | | | | 51 | | | | 5,325 | |
| | Plus Change in inventories | | | (29 | ) | | | (37 | ) | | | (20 | ) | | | (35 | ) | | | (49 | ) | | | (72 | ) | | | — | | | | (72 | ) |
| | Plus Other movements in non-financial assets | | | 529 | | | | 556 | | | | 17 | | | | 75 | | | | 546 | | | | 631 | | | | — | | | | 631 | |
| | Equals Total Net Acquisition of Non-financial Assets | | | 1,091 | | | | 1,431 | | | | 331 | | | | 422 | | | | 1,422 | | | | 1,893 | | | | (29 | ) | | | 1,865 | |
| | Equals Fiscal Balance | | | (940 | ) | | | (461 | ) | | | 1,085 | | | | 1,178 | | | | (1,462 | ) | | | (1,020 | ) | | | (1,229 | ) | | | (2,359 | ) |
Notes:
| (a) | Numbers may not add due to rounding. |
| (b) | In accordance with UPF requirements, estimates for Public Financial Corporations and State Financial sectors are not included in Budget documentation. |
| | | | |
| Report on State Finances 2015–16 – Government of Queensland | | 4-07 |
2015-16 Balance Sheet by Sector ($ million)
| | | | | | | | | | | | | | | | | | | | | | | | | | | | | | | | |
| | | | | | | | | | | | | | | | | | | | | Public Financial | | | State | |
| | | General Government | | | Public Non-financial | | | Non-financial Public | | | Corporations | | | Financial | |
| | | Sector | | | Corporations Sector | | | Sector | | | Sector | | | Sector | |
| | | Est. Actual | | | Actual | | | Est. Actual | | | Actual | | | Est. Actual | | | Actual | | | Actual (b) | | | Actual (b) | |
Assets | | | | | | | | | | | | | | | | | | | | | | | | | | | | | | | | |
Financial assets | | | | | | | | | | | | | | | | | | | | | | | | | | | | | | | | |
Cash and deposits | | | 648 | | | | 1,104 | | | | 1,278 | | | | 1,542 | | | | 1,926 | | | | 2,646 | | | | 1,334 | | | | 1,876 | |
Advances paid | | | 708 | | | | 632 | | | | 33 | | | | 33 | | | | 733 | | | | 657 | | | | — | | | | 657 | |
Investments, loans and placements | | | 33,317 | | | | 33,612 | | | | 361 | | | | 530 | | | | 33,679 | | | | 34,142 | | | | 142,869 | | | | 65,646 | |
Receivables | | | 3,678 | | | | 4,282 | | | | 1,432 | | | | 1,473 | | | | 3,436 | | | | 3,774 | | | | 311 | | | | 3,926 | |
Equity | | | | | | | | | | | | | | | | | | | | | | | | | | | | | | | | |
Investments in other public sector entities | | | 21,323 | | | | 20,477 | | | | — | | | | — | | | | 3,148 | | | | 3,269 | | | | — | | | | — | |
Investments - other | | | 166 | | | | 157 | | | | 226 | | | | 267 | | | | 392 | | | | 424 | | | | — | | | | 425 | |
Total financial assets | | | 59,841 | | | | 60,265 | | | | 3,330 | | | | 3,845 | | | | 43,315 | | | | 44,913 | | | | 144,514 | | | | 72,530 | |
Non-financial Assets | | | | | | | | | | | | | | | | | | | | | | | | | | | | | | | | |
Land and other fixed assets | | | 175,269 | | | | 200,647 | | | | 60,753 | | | | 60,166 | | | | 236,021 | | | | 260,813 | | | | 224 | | | | 261,037 | |
Other non-financial assets | | | 6,582 | | | | 6,377 | | | | 1,371 | | | | 1,491 | | | | 1,137 | | | | 1,063 | | | | 52 | | | | 1,055 | |
Total Non-financial Assets | | | 181,851 | | | | 207,024 | | | | 62,124 | | | | 61,657 | | | | 237,158 | | | | 261,876 | | | | 277 | | | | 262,092 | |
Total assets | | | 241,692 | | | | 267,289 | | | | 65,454 | | | | 65,502 | | | | 280,473 | | | | 306,789 | | | | 144,790 | | | | 334,622 | |
Liabilities | | | | | | | | | | | | | | | | | | | | | | | | | | | | | | | | |
Payables | | | 2,962 | | | | 3,596 | | | | 2,312 | | | | 2,825 | | | | 3,648 | | | | 4,484 | | | | 210 | | | | 4,535 | |
Superannuation liability | | | 27,219 | | | | 27,360 | | | | (252 | ) | | | (171 | ) | | | 26,967 | | | | 27,189 | | | | — | | | | 27,189 | |
Other employee benefits | | | 5,001 | | | | 5,217 | | | | 669 | | | | 696 | | | | 5,670 | | | | 5,913 | | | | 109 | | | | 6,022 | |
Deposits held | | | — | | | | 3 | | | | 21 | | | | 20 | | | | 21 | | | | 23 | | | | 6,834 | | | | 4,753 | |
Advances received | | | 566 | | | | 514 | | | | 8 | | | | 8 | | | | 566 | | | | 514 | | | | — | | | | 514 | |
Borrowing | | | 35,698 | | | | 35,486 | | | | 37,018 | | | | 37,436 | | | | 72,715 | | | | 72,922 | | | | 131,579 | | | | 102,955 | |
Other liabilities | | | 3,161 | | | | 3,204 | | | | 7,503 | | | | 7,479 | | | | 3,801 | | | | 3,835 | | | | 2,790 | | | | 6,564 | |
Total liabilities | | | 74,607 | | | | 75,380 | | | | 47,278 | | | | 48,294 | | | | 113,388 | | | | 114,879 | | | | 141,521 | | | | 152,532 | |
Net Worth | | | 167,084 | | | | 191,910 | | | | 18,176 | | | | 17,208 | | | | 167,084 | | | | 191,910 | | | | 3,269 | | | | 182,090 | |
| | | | | | | | | | | | | | | | | | | | | | | | | | | | | | | | |
Net Financial Worth | | | (14,766 | ) | | | (15,114 | ) | | | (43,948 | ) | | | (44,449 | ) | | | (70,074 | ) | | | (69,966 | ) | | | 2,993 | | | | (80,002 | ) |
Net Financial Liabilities | | | 36,090 | | | | 35,591 | | | | N/A | | | | N/A | | | | 73,222 | | | | 73,235 | | | | N/A | | | | 80,002 | |
Net Debt | | | 1,590 | | | | 654 | | | | 35,374 | | | | 35,359 | | | | 36,964 | | | | 36,013 | | | | (5,790 | ) | | | 40,043 | |
Notes:
| (a) | Numbers may not add due to rounding. |
| (b) | In accordance with UPF requirements, estimates for Public Financial Corporations and State Financial sectors are not included in Budget documentation. |
| | | | |
| 4-08 | | Report on State Finances 2015–16 – Government of Queensland |
2015-16 Cash Flow Statement by Sector ($ million)
| | | | | | | | | | | | | | | | | | | | | | | | | | | | | | | | |
| | | | | | | | | | | | | | | | | | | | | Public Financial | | | State | |
| | | General Government | | | Public Non-financial | | | Non-financial Public | | | Corporations | | | Financial | |
| | | Sector | | | Corporations Sector | | | Sector | | | Sector | | | Sector | |
| | | Est. Actual | | | Actual | | | Est. Actual | | | Actual | | | Est. Actual | | | Actual | | | Actual (b) | | | Actual (b) | |
Cash Receipts from Operating Activities | | | | | | | | | | | | | | | | | | | | | | | | | | | | | | | | |
Taxes received | | | 12,660 | | | | 12,588 | | | | — | | | | — | | | | 12,344 | | | | 12,267 | | | | — | | | | 12,263 | |
Grants and subsidies received | | | 23,725 | | | | 23,891 | | | | 698 | | | | 689 | | | | 23,830 | | | | 23,945 | | | | — | | | | 23,867 | |
Sales of goods and services | | | 5,662 | | | | 6,083 | | | | 11,455 | | | | 11,917 | | | | 14,882 | | | | 16,211 | | | | 1,812 | | | | 17,773 | |
Interest receipts | | | 2,427 | | | | 2,536 | | | | 58 | | | | 62 | | | | 2,485 | | | | 2,598 | | | | 4,940 | | | | 1,564 | |
Dividends and income tax equivalents | | | 3,729 | | | | 3,754 | | | | 14 | | | | 14 | | | | 201 | | | | 199 | | | | — | | | | 20 | |
Other receipts | | | 4,326 | | | | 4,385 | | | | 205 | | | | 214 | | | | 4,530 | | | | 4,596 | | | | 99 | | | | 4,688 | |
Total | | | 52,528 | | | | 53,237 | | | | 12,430 | | | | 12,896 | | | | 58,274 | | | | 59,816 | | | | 6,851 | | | | 60,174 | |
Cash Payments for Operating Activities | | | | | | | | | | | | | | | | | | | | | | | | | | | | | | | | |
Payments for employees | | | (22,870 | ) | | | (22,830 | ) | | | (1,829 | ) | | | (1,776 | ) | | | (24,596 | ) | | | (24,507 | ) | | | (279 | ) | | | (24,577 | ) |
Payments for goods and services | | | (16,107 | ) | | | (16,459 | ) | | | (3,775 | ) | | | (3,778 | ) | | | (17,661 | ) | | | (18,389 | ) | | | (77 | ) | | | (18,466 | ) |
Grants and subsidies | | | (6,268 | ) | | | (6,750 | ) | | | (13 | ) | | | (14 | ) | | | (5,689 | ) | | | (6,128 | ) | | | (77 | ) | | | (6,128 | ) |
Interest paid | | | (2,193 | ) | | | (2,223 | ) | | | (1,747 | ) | | | (1,832 | ) | | | (3,737 | ) | | | (3,849 | ) | | | (6,083 | ) | | | (3,908 | ) |
Other payments | | | (311 | ) | | | (271 | ) | | | (1,512 | ) | | | (1,558 | ) | | | (918 | ) | | | (928 | ) | | | (1,476 | ) | | | (2,314 | ) |
Total | | | (47,749 | ) | | | (48,533 | ) | | | (8,877 | ) | | | (8,957 | ) | | | (52,601 | ) | | | (53,801 | ) | | | (7,993 | ) | | | (55,392 | ) |
Net Cash Inflows from Operating Activities | | | 4,779 | | | | 4,704 | | | | 3,553 | | | | 3,939 | | | | 5,673 | | | | 6,015 | | | | (1,142 | ) | | | 4,782 | |
Cash Flows from Investments in Non-financial Assets | | | | | | | | | | | | | | | | | | | | | | | | | | | | | | | | |
Purchases of non-financial assets | | | (4,173 | ) | | | (4,092 | ) | | | (2,745 | ) | | | (2,773 | ) | | | (6,918 | ) | | | (6,900 | ) | | | (31 | ) | | | (6,930 | ) |
Sales of non-financial assets | | | 216 | | | | 254 | | | | 45 | | | | 45 | | | | 261 | | | | 292 | | | | 7.563 | | | | 299 | |
Total | | | (3,958 | ) | | | (3,838 | ) | | | (2,700 | ) | | | (2,729 | ) | | | (6,658 | ) | | | (6,607 | ) | | | (23 | ) | | | (6,630 | ) |
Net Cash Flows from Investments in Financial Assets for Policy Purposes | | | 3,403 | | | | 3,348 | | | | (3,383 | ) | | | (3,331 | ) | | | — | | | | (2 | ) | | | — | | | | (2 | ) |
Net Cash Flows for Investments in Financial Assets for Liquidity Purposes | | | 2,817 | | | | 2,540 | | | | (61 | ) | | | 20 | | | | 2,756 | | | | 2,559 | | | | 5,479 | | | | 5,367 | |
Receipts from Financing Activities | | | | | | | | | | | | | | | | | | | | | | | | | | | | | | | | |
Advances received (net) | | | (137 | ) | | | (111 | ) | | | (1 | ) | | | (1 | ) | | | (138 | ) | | | (112 | ) | | | — | | | | (112 | ) |
Borrowing (net) | | | (7,465 | ) | | | (6,738 | ) | | | 4,553 | | | | 4,461 | | | | (2,911 | ) | | | (2,277 | ) | | | 2,337 | | | | 53 | |
Dividends paid | | | — | | | | — | | | | (2,659 | ) | | | (2,669 | ) | | | — | | | | — | | | | (97 | ) | | | — | |
Deposits received (net) | | | — | | | | 1 | | | | (6 | ) | | | (7 | ) | | | (6 | ) | | | (6 | ) | | | (889 | ) | | | (332 | ) |
Other financing (net) | | | — | | | | — | | | | (20 | ) | | | (143 | ) | | | — | | | | (123 | ) | | | (6,499 | ) | | | (3,951 | ) |
Total | | | (7,602 | ) | | | (6,848 | ) | | | 1,868 | | | | 1,642 | | | | (3,055 | ) | | | (2,517 | ) | | | (5,149 | ) | | | (4,341 | ) |
Net Increase/(Decrease) in Cash Held | | | (561 | ) | | | (94 | ) | | | (722 | ) | | | (458 | ) | | | (1,283 | ) | | | (553 | ) | | | (835 | ) | | | (825 | ) |
Net cash from operating activities | | | 4,779 | | | | 4,704 | | | | 3,553 | | | | 3,939 | | | | 5,673 | | | | 6,015 | | | | (1,142 | ) | | | 4,782 | |
Net cash from investments in non-financial assets | | | (3,958 | ) | | | (3,838 | ) | | | (2,700 | ) | | | (2,729 | ) | | | (6,658 | ) | | | (6,607 | ) | | | (23 | ) | | | (6,630 | ) |
Dividends paid | | | — | | | | — | | | | (2,659 | ) | | | (2,669 | ) | | | — | | | | — | | | | (97 | ) | | | — | |
Cash Surplus/(Deficit) | | | 821 | | | | 866 | | | | (1,806 | ) | | | (1,459 | ) | | | (985 | ) | | | (593 | ) | | | (1,263 | ) | | | (1,849 | ) |
| | | | | | | | | | | | | | | | | | | | | | | | | | | | | | | | |
Derivation of ABS GFS Cash Surplus/Deficit | | | | | | | | | | | | | | | | | | | | | | | | | | | | | | | | |
Cash surplus/(deficit) | | | 821 | | | | 866 | | | | (1,806 | ) | | | (1,459 | ) | | | (985 | ) | | | (593 | ) | | | (1,263 | ) | | | (1,849 | ) |
Acquisitions under finance leases and similar arrangements | | | (350 | ) | | | (341 | ) | | | — | | | | — | | | | (350 | ) | | | (341 | ) | | | — | | | | (341 | ) |
ABS GFS Cash Surplus/(Deficit) Including Finance Leases and Similar Arrangements | | | 471 | | | | 525 | | | | (1,806 | ) | | | (1,459 | ) | | | (1,335 | ) | | | (934 | ) | | | (1,263 | ) | | | (2,190 | ) |
Notes:
| (a) | Numbers may not add due to rounding. |
| (b) | In accordance with UPF requirements, estimates for Public Financial Corporations and State Financial sectors are not included in Budget documentation. |
| | | | |
| Report on State Finances 2015–16 – Government of Queensland | | 4-09 |
Outcomes Report - Other General Government UPF Data
Data in the following tables is presented in accordance with the Uniform Presentation Framework.
General Government Sector Taxes
| | | | |
| | | 2015-16 | |
| | | Outcome | |
| | | $ million | |
Taxes on employers’ payroll and labour force | | | 3,712 | |
| |
Taxes on property | | | | |
Land taxes | | | 1,010 | |
Stamp duties on financial and capital transactions | | | 3,005 | |
Other | | | 679 | |
| |
Taxes on the provision of goods and services | | | | |
Taxes on gambling | | | 1,138 | |
Taxes on insurance | | | 866 | |
| |
Taxes on use of goods and performance of activities | | | | |
Motor vehicle taxes | | | 2,137 | |
| |
Total Taxation Revenue | | | 12,547 | |
Note:
| 1. | Numbers may not add due to rounding. |
General Government Sector
Dividend and Income Tax Equivalent Income
| | | | |
| | | 2015-16 | |
| | | Outcome | |
| | | $ million | |
Dividend and Income Tax Equivalent income from PNFC sector | | | 2,493 | |
Dividend and Income Tax Equivalent income from PFC sector | | | 163 | |
Other Dividend and Income Tax Equivalent income | | | 6 | |
| |
Total Dividend and Income Tax Equivalent income | | | 2,661 | |
Note:
| 1. | Numbers may not add due to rounding. |
| | | | |
| 4-10 | | Report on State Finances 2015–16 – Government of Queensland |
Outcomes Report - Other General Government UPF Data
General Government Sector Grant Revenue
| | | | |
| | | 2015-16 | |
| | | Outcome | |
| | | $ million | |
Current grant revenue | | | | |
| |
Current grants from the Commonwealth | | | | |
General purpose grants | | | 13,141 | |
Specific purpose grants | | | 6,421 | |
Specific purpose grants for on-passing | | | 2,465 | |
Total current grants from the Commonwealth | | | 22,027 | |
Other contributions and grants | | | 319 | |
Total current grant revenue | | | 22,347 | |
| |
Capital grant revenue | | | | |
| |
Capital grants from the Commonwealth | | | | |
Specific purpose grants | | | 1,365 | |
Specific purpose grants for on-passing | | | — | |
Total capital grants from the Commonwealth | | | 1,365 | |
Other contributions and grants | | | 28 | |
Total capital grant revenue | | | 1,394 | |
| |
Total grant revenue | | | 23,740 | |
Note:
| 1. | Numbers may not add due to rounding. |
General Government Sector Grant Expenses
| | | | |
| | | 2015-16 | |
| | | Outcome | |
| | | $ million | |
Current grant expenses | | | | |
| |
Private and not-for-profit sector | | | 1,922 | |
Private and not-for-profit sector on-passing | | | 2,259 | |
Local Government | | | 190 | |
Local Government on-passing | | | 225 | |
Grants to other sectors of Government | | | 601 | |
Other | | | 219 | |
Total current grant expense | | | 5,416 | |
| |
Capital grant expenses | | | | |
| |
Private and not-for-profit sector | | | 322 | |
Local Government | | | 677 | |
Local Government on-passing | | | — | |
Grants to other sectors of Government | | | 30 | |
Other | | | 114 | |
Total capital grant expenses | | | 1,143 | |
| |
Total grant expenses | | | 6,559 | |
Note:
| 1. | Numbers may not add due to rounding. |
| | | | |
| Report on State Finances 2015–16 – Government of Queensland | | 4-11 |
Outcomes Report - Other General Government UPF Data
General Government Sector Expenses by Function
| | | | |
| | | 2015-16 | |
| | | Outcome | |
| | | $ million | |
General Public Services | | | 1,648 | |
Other general public services | | | 1,648 | |
| |
Public Order and Safety | | | 4,495 | |
Police and fire protection services | | | 2,239 | |
Law courts and legal services | | | 863 | |
Prisons and corrective services | | | 749 | |
Other public order and safety | | | 643 | |
| |
Education | | | 11,810 | |
Primary and secondary education | | | 9,516 | |
Tertiary education | | | 596 | |
Pre-school education and education not definable by level | | | 1,452 | |
Transportation of students | | | 183 | |
Education n.e.c. | | | 62 | |
| |
Health | | | 15,099 | |
Acute care institutions | | | 10,842 | |
Mental health institutions | | | 455 | |
Nursing homes for the aged | | | 226 | |
Community health services | | | 2,853 | |
Public health services | | | 352 | |
Health research | | | 200 | |
Health administration n.e.c. | | | 170 | |
| |
Social Security and Welfare | | | 3,091 | |
Welfare services | | | 2,539 | |
Social security and welfare n.e.c. | | | 551 | |
| |
Housing and Community Amenities | | | 1,455 | |
Housing and community development | | | 1,151 | |
Water Supply | | | 129 | |
Sanitation and protection of the environment | | | 175 | |
| | | | |
| | | 2015-16 | |
| | | Outcome | |
| | | $ million | |
Recreation and Culture | | | 1,109 | |
Recreation facilities and services | | | 773 | |
Cultural facilities and services | | | 333 | |
Recreation and cultural n.e.c. | | | 3 | |
| |
Fuel and Energy | | | 570 | |
Electricity and other energy | | | 570 | |
| |
Agriculture, Forestry, Fishing and Hunting | | | 692 | |
Agriculture | | | 632 | |
Forestry, fishing and hunting | | | 60 | |
| |
Mining, manufacturing and construction | | | 284 | |
Mining and mineral resources other than fuels | | | 114 | |
Construction | | | 170 | |
| |
Transport and Communications | | | 5,303 | |
Road transport | | | 2,417 | |
Water transport | | | 128 | |
Rail transport | | | 1,684 | |
Other transport | | | 1,073 | |
| |
Other Economic Affairs | | | 874 | |
Tourism and area promotion | | | 130 | |
Labour and employment affairs | | | 697 | |
Other economic affairs | | | 47 | |
| |
Other Purposes | | | 3,597 | |
Nominal superannuation interest | | | 767 | |
Public debt transactions | | | 2,203 | |
General purpose inter-government transactions | | | — | |
Natural disaster relief | | | 57 | |
Other purposes n.e.c. | | | 569 | |
| | | | |
Total | | | 50,025 | |
| | | | |
| | | | |
| 4-12 | | Report on State Finances 2015–16 – Government of Queensland |
Outcomes Report - Other General Government UPF Data
General Government Sector Purchases of Non-financial Assets by
Function and Loan Council Allocation
General Government Sector
Purchases of Non-financial Assets by Function
| | | | |
| | | 2015-16 | |
| | | Outcome | |
| | | $ million | |
General public services | | | 84 | |
Public order and safety | | | 224 | |
Education | | | 460 | |
Health | | | 952 | |
Social security and welfare | | | 24 | |
Housing and community amenities | | | 331 | |
Recreation and culture | | | 86 | |
Agriculture, forestry, fishing and hunting | | | 23 | |
Mining, manufacturing and construction | | | 9 | |
Transport and communications | | | 1,877 | |
Other economic affairs | | | 3 | |
Other purposes | | | 19 | |
Total | | | 4,092 | |
Note:
| 1. | Numbers may not add due to rounding |
Loan Council Allocation
The Australian Loan Council requires all jurisdictions to advise the Loan Council Allocation (LCA) outcome for the last financial year as part of the annual Outcomes Report. The LCA represents each government’s call on financial markets for a given financial year.
The main reason for the lower Non-financial Public Sector cash deficit is the improved operating position of the GGS and lower capital expenditure in both the General Government and Public Non-financial Corporations sectors.
| | | | | | | | |
| | | 2015-16 | | | 2015-16 | |
| | | Budget | | | Outcome | |
| | | $ million | | | $ million | |
General Government Sector cash deficit/(surplus)1 | | | 584 | | | | (866 | ) |
PNFC Sector cash deficit/(surplus)1 | | | 1,100 | | | | 1,459 | |
Non-financial Public Sector cash deficit/(surplus)1 | | | 1,684 | | | | 593 | |
Acquisitions under finance leases and similar arrangements | | | 385 | | | | 341 | |
ABS GFS cash deficit/(surplus) | | | 2,068 | | | | 934 | |
Net cash flows from investments in financial assets for policy purposes | | | — | | | | 2 | |
Memorandum items2 | | | 384 | | | | 166 | |
| | |
LOAN COUNCIL ALLOCATION | | | 2,452 | | | | 1,102 | |
Notes:
| 1. | Figures in brackets represent surpluses |
| 2. | Memorandum items include operating leases and local government borrowings |
| 3. | Numbers may not add due to rounding |
| | | | |
| Report on State Finances 2015–16 – Government of Queensland | | 4-13 |
Certification of Outcomes Report
Management Certification
The foregoing Outcomes Report contains financial statements for the Queensland State Government, prepared and presented in accordance with the Uniform Presentation Framework (UPF) agreed to at the 1991 Premiers’ Conference and revised in 2008 to align with AASB 1049 Whole of Government and General Government Sector Financial Reporting.
This report separately discloses outcomes for the General Government, Public Non-financial Corporations, Public Financial Corporations and State Financial sectors within Queensland. Entities excluded from this report include local governments and universities. Queensland public sector entities consolidated for this report are listed in the AASB 1049 Financial Statement, taking into account intra and inter-agency eliminations.
Only those agencies considered material by virtue of their financial transactions and balances are consolidated in this report.
In our opinion, we certify that the Outcomes Report has been properly drawn up, in accordance with UPF requirements, to present a true and fair view of:
| (i) | the Operating Statement and Cash Flows of the Queensland State Government for the financial year; and |
| (ii) | the Balance Sheet of the Government at 30 June 2016. |
At the date of certification of this report, we are not aware of any material circumstances that would render any particulars included in the Outcomes Report misleading or inaccurate.
| | |
| Glenn Miller | | Jim Murphy |
| Acting Assistant Under Treasurer | | Under Treasurer |
| Queensland Treasury | | Queensland Treasury |
23 November 2016
| | | | |
| 4-14 | | Report on State Finances 2015–16 – Government of Queensland |
2015-16
AASB 1049 Financial Statements
Overview and Analysis – 30 June 2016
AASB 1049 - Overview and Analysis
The following analysis compares current year General Government Sector (GGS) and Total State Sector performance with last year’s balances, restated for changes in accounting policies, presentational and timing differences and errors.
AASB 1049 Whole of Government and General Government Sector Financial Reporting aims to harmonise the disclosure presentation to be consistent with the Uniform Presentation Framework disclosed in the Outcomes Report.
Summary of Key Financial Aggregates of the Consolidated Financial Statements
The table below provides aggregate information under AASB1049:
| | | | | | | | | | | | | | | | |
| | | General Government | | | Total State | |
| | | Sector | | | Sector | |
| | | 2016 | | | 2015 | | | 2016 | | | 2015 | |
| | | $ million | | | $ million | | | $ million | | | $ million | |
Taxation revenue | | | 12,547 | | | | 12,598 | | | | 12,226 | | | | 12,245 | |
Grants revenue | | | 23,740 | | | | 23,583 | | | | 23,746 | | | | 23,601 | |
Sales of goods and services | | | 5,926 | | | | 5,443 | | | | 16,327 | | | | 15,386 | |
Interest income | | | 2,543 | | | | 2,470 | | | | 1,565 | | | | 1,358 | |
Dividend and income tax equivalents income | | | 2,661 | | | | 2,554 | | | | 20 | | | | 15 | |
Other revenue | | | 3,577 | | | | 3,322 | | | | 3,974 | | | | 3,706 | |
Continuing Revenue from Transactions | | | 50,995 | | | | 49,970 | | | | 57,859 | | | | 56,311 | |
Employee expenses | | | 20,044 | | | | 18,592 | | | | 21,632 | | | | 20,086 | |
Superannuation expenses | | | 3,275 | | | | 3,197 | | | | 3,482 | | | | 3,405 | |
Other operating expenses | | | 15,000 | | | | 14,539 | | | | 18,109 | | | | 17,086 | |
Depreciation and amortisation | | | 2,927 | | | | 3,137 | | | | 5,325 | | | | 5,542 | |
Other interest expense | | | 2,220 | | | | 2,328 | | | | 3,847 | | | | 3,978 | |
Grants expenses | | | 6,559 | | | | 7,758 | | | | 5,958 | | | | 7,094 | |
Continuing Expenses from Transactions | | | 50,025 | | | | 49,551 | | | | 58,353 | | | | 57,191 | |
| | | | | | | | | | | | | | | | |
Net Operating Balance | | | 970 | | | | 420 | | | | (494 | ) | | | (881 | ) |
| | | | |
Other Economic Flows - Included in Operating Result | | | 119 | | | | 3,530 | | | | (3,594 | ) | | | 1,362 | |
Operating Result | | | 1,088 | | | | 3,949 | | | | (4,088 | ) | | | 481 | |
Other Economic Flows - Other Movements in Equity | | | 18,888 | | | | 1,492 | | | | 20,803 | | | | 4,201 | |
Comprehensive Result1 | | | 19,976 | | | | 5,442 | | | | 16,715 | | | | 4,682 | |
| | | | |
Purchases of non-financial assets | | | 4,092 | | | | 4,635 | | | | 6,930 | | | | 7,823 | |
| | | | | | | | | | | | | | | | |
Fiscal Balance | | | (461 | ) | | | (572 | ) | | | (2,359 | ) | | | (2,622 | ) |
| | | | |
Assets | | | 267,289 | | | | 252,596 | | | | 334,622 | | | | 316,254 | |
Liabilities | | | 75,380 | | | | 80,663 | | | | 152,532 | | | | 150,879 | |
Net Worth | | | 191,910 | | | | 171,933 | | | | 182,090 | | | | 165,375 | |
Note:
| 1. | Comprehensive result is different to the Outcomes Report as it reflects the movement from the 2015 recast position, rather than the 2015 published position. |
| | | | |
| Report on State Finances 2015–16 – Government of Queensland | | 5-01 |
AASB 1049 - Overview and Analysis
Net Operating Balance
The GGS net operating balance was a surplus of $970 million compared to a restated surplus of $420 million in 2014-15.
GGS revenue grew by around 2% ($1.025 billion) while expenses grew by around 1% ($474 million) over the year.
The Total State Sector net operating balance also showed an improvement with a deficit of $494 million compared to a restated deficit of $881 million in 2014-15.
Revenue
Revenue from transactions increased from $49.97 billion in 2014-15 to be $50.995 billion in the GGS and totals $57.859 billion in the Total State Sector, an increase of $1.548 billion over 2014-15.
Revenues by type for the GGS and Total State Sector are shown in the following chart:
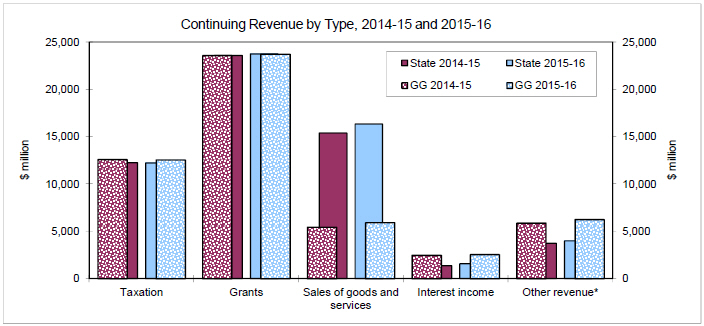
| * | Other revenue includes dividends and tax equivalents income. |
Taxation revenue decreased in 2015-16 by $51 million for GGS and $19 million for the Total State Sector. This reflects an elevated level of transfer duty on large business transactions in 2014-15 and subdued payroll tax collections in 2015-16.
Commonwealth and other grants comprised 47% of GGS revenue and 41% of Total State Sector revenue. Grant revenue overall increased $157 million from 2014-15 for the GGS and $145 million for the Total State Sector. The increase was primarily due to higher GST of $1.306 billion (increased size of pool and higher relativities) and specific purpose payments from the Commonwealth which increased $506 million, mainly for health and education services. These increases were largely offset by lower funding for NDRRA following a decision by the Commonwealth to defer the revenue due to later years, and lower grants for on-passing due to advance payments in the previous year.
Sales of goods and services increased by $483 million in 2015-16 to $5.926 billion in the GGS and increased by $941 million in the Total State Sector.
Dividend and income tax equivalent income was higher by $107 million in 2015-16, mainly due to higher income tax from the electricity entities.
GGS other revenue was $255 million higher in 2015-16 than 2014-15 mainly due to higher royalties, fines and non-cash contributions.
| | | | |
| 5-02 | | Report on State Finances 2015–16 – Government of Queensland |
AASB 1049 - Overview and Analysis
Expenses
Total expenses for 2015-16 were $50.025 billion for the GGS and $58.353 billion for the Total State Sector respectively, $474 million and $1.162 million more than the previous year respectively.
Expenses by type are shown in the following chart:
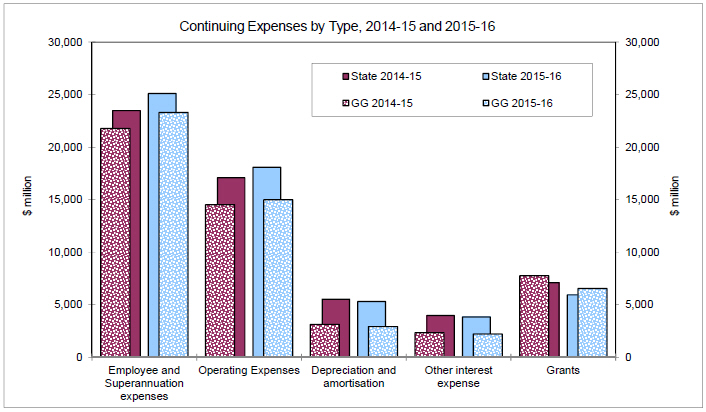
Employee and superannuation expenses were 8% higher in 2015-16, consistent with the estimates in both the 2015-16 and 2016-17 Budgets. The increases are in the areas of Health and Education, reflecting the Government’s commitment to revitalising frontline services.
Other operating expenses were $461 million more than 2014-15 for the GGS (health, education and disability services) and were $1.023 billion higher for the Total State Sector. The increase for the Total State Sector is mainly from electricity generation to match demand and an increase in expected WorkCover claims costs.
Depreciation costs decreased by $210 million to $2.927 billion for the GGS mainly due to the reassessment of the remaining useful lives of road infrastructure.
Grant expenses decreased $1.199 billion in the GGS from 2014-15 mainly reflecting the on-passing of Commonwealth Financial Assistance Grants to local governments which were paid in advance in 2014-15. In addition, capital grants were lower due to the one off transfer in 2014-15 of certain assets to the Gold Coast City Council in relation to the Gold Coast Rapid Transport project and the transfer of the Central Queensland TAFE to the Central Queensland University.
Operating Result
The operating result is the surplus or deficit for the year under the Australian Accounting Standards framework. Valuation and other adjustments such as deferred tax, capital returns and market value interest are shown as other economic flows and are included in the operating result.
The GGS operating result for the 2015-16 year was a surplus of $1.088 billion (2014-15, $3.949 billion). The difference in the result is due to higher regearing dividends declared by PNFCs in 2014-15 as part of the Government’s Debt Action Plan, which are treated as capital returns for GFS purposes.
The Total State Sector operating result was a deficit of $4.088 billion compared to a surplus of $481 million in 2014-15. The lower result in 2015-16 arises from realised and unrealised market value adjustments to derivatives, investments and borrowings, as well as actuarial changes to liabilities.
| | | | |
| Report on State Finances 2015–16 – Government of Queensland | | 5-03 |
AASB 1049 - Overview and Analysis
Fiscal Balance
The GGS fiscal deficit was $461 million for 2015-16 compared to a deficit of $572 million for 2014-15. The Total State Sector fiscal deficit was $2.359 billion for 2015-16 compared to a deficit of $2.622 billion for 2014-15. The improvements were mainly due to lower capital expenditure largely offsetting lower net operating balances once they are adjusted for non-cash items such as the grants to Gold Coast City Council and Central Queensland University mentioned above in the net operating balance analysis.
Assets
Assets controlled by the GGS at 30 June 2016 totalled $267.289 billion, an increase of $14.693 billion on 2014-15, while assets controlled by the State at 30 June 2016 totalled $334.622 billion (2015, $316.254 billion), an increase of $18.368 billion.
Financial assets in the GGS were $9.151 billion lower than 2014-15, partly due to the repatriation of assets set aside for Long Service Leave under the Government’s Debt Action Plan during 2015-16. In addition, receivables from GOCs are significantly lower following dividend payments during 2015-16 under the Debt Action Plan. Investments in the PNFC sector are lower in 2015-16 following revaluations of infrastructure as well as further regearing announced in the 2016-17 Budget. The investment in the PFC sector was lower following below average returns on investments.
Financial assets of the State decreased by $5.465 billion, due to the repatriation of Long Service Leave assets to repay debt, and utilisation of forward funding from previous years.
Non-financial assets increased by $23.843 billion in the GGS mainly due to the revaluation of roads infrastructure. There was an equivalent increase at the TSS level.
The main types of assets owned by the State are detailed in the following chart:
Total Assets by Type, 2015-16
Total State
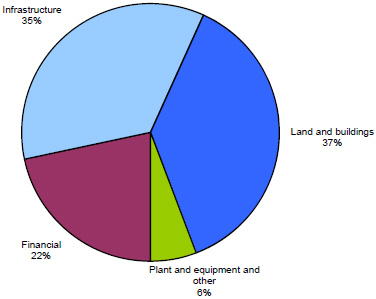
Of the Total State Sector assets, GGS assets comprised 80%, made up of:
| | | | | | | | |
| | | General Government
$M | | | Total State
$M | |
Financial | | | 60,265 | | | | 72,530 | |
Infrastructure | | | 66,887 | | | | 117,390 | |
Land and buildings | | | 120,809 | | | | 125,412 | |
Plant and equipment and other | | | 19,328 | | | | 19,290 | |
| | | | | | | | |
| | | 267,289 | | | | 334,622 | |
| | | | | | | | |
| | | | |
| 5-04 | | Report on State Finances 2015–16 – Government of Queensland |
AASB 1049 - Overview and Analysis
Liabilities
Liabilities at 30 June 2016 totalled $75.38 billion for the GGS and $152.532 billion for the Total State Sector, a decrease of $5.283 billion over 2014-15 for the GGS and an increase of $1.653 billion for the State.
The decrease in liabilities for the GGS was largely due to an decrease in borrowings of $7.6 billion for the GGS, as debt was repaid under the Debt Action Plan. Partly offsetting this is an increase in employee entitlements mainly from actuarial adjustments to the value of superannuation liabilities.
For the Total State Sector, securities and derivatives largely held by QTC have decreased $438 million as repayments of interest-bearing liabilities have been largely offset by market value increases, while deposits, borrowings and advances held have decreased $886 million. Offsetting these decreases is an increase in employee entitlements (mainly superannuation) of $2.162 billion.
The components of State liabilities are shown in the following chart:
Total Liabilities by Type, 2015-16
Total State
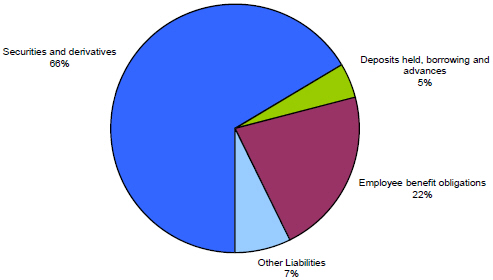
Of the Total State Sector liabilities, GGS liabilities comprised 49%, made up of:
| | | | | | | | |
| | | General Government
$M | | | Total State
$M | |
Securities and derivatives | | | — | | | | 101,346 | |
Deposits held, borrowing and advances | | | 36,003 | | | | 6,877 | |
Employee benefit obligations | | | 32,576 | | | | 33,211 | |
Other liabilities | | | 6,800 | | | | 11,098 | |
| | | | | | | | |
| | | 75,380 | | | | 152,532 | |
| | | | | | | | |
Cash Flow Statement
The GGS recorded positive net cash flows from operating activities of $4.704 billion which were used to fund capital purchases of $4.092 billion.
The Total State Sector recorded net cash flows from operating activities for the 2015-16 financial year of $4.782 billion. This, together with the Government’s Debt Action Plan has financed purchases of non-financial assets of $6.93 billion and the repayment of external debt.
| | | | |
| Report on State Finances 2015–16 – Government of Queensland | | 5-05 |
2015-16 Audited Information Queensland General Government and Whole of Government Consolidated Financial Statements 30 June 2016
Operating Statement for Queensland
for the Year Ended 30 June 2016
| | | | | | | | | | | | | | | | | | | | | | |
| | | | | | | | General Government | | | | | | | |
| | | | | | | | Sector | | | Total State Sector | |
| | | | | | | | 2016 | | | 2015 | | | 2016 | | | 2015 | |
| | | | | Notes | | | $M | | | $M | | | $M | | | $M | |
| | Continuing Operations Revenue from Transactions | | | | | | | | | | | | | | | | | | | | |
| | Taxation revenue | | | 3 | | | | 12,547 | | | | 12,598 | | | | 12,226 | | | | 12,245 | |
| | Grants revenue | | | 4 | | | | 23,740 | | | | 23,583 | | | | 23,746 | | | | 23,601 | |
| | Sales of goods and services | | | 5 | | | | 5,926 | | | | 5,443 | | | | 16,327 | | | | 15,386 | |
| | Interest income | | | 6 | | | | 2,543 | | | | 2,470 | | | | 1,565 | | | | 1,358 | |
| | Dividend and income tax equivalents income | | | 7 | | | | 2,661 | | | | 2,554 | | | | 20 | | | | 15 | |
| | Other revenue | | | 8 | | | | 3,577 | | | | 3,322 | | | | 3,974 | | | | 3,706 | |
| | Continuing Operations Total Revenue from Transactions | | | | | | | 50,995 | | | | 49,970 | | | | 57,859 | | | | 56,311 | |
| | | | | | |
Less | | Continuing Operations Expenses from Transactions | | | | | | | | | | | | | | | | | | | | |
| | Employee expenses | | | 9 | | | | 20,044 | | | | 18,592 | | | | 21,632 | | | | 20,086 | |
| | Superannuation expenses | | | | | | | | | | | | | | | | | | | | |
| | Superannuation interest cost | | | 48 | | | | 767 | | | | 878 | | | | 755 | | | | 873 | |
| | Other superannuation expenses | | | 10 | | | | 2,507 | | | | 2,319 | | | | 2,726 | | | | 2,531 | |
| | Other operating expenses | | | 11 | | | | 15,000 | | | | 14,539 | | | | 18,109 | | | | 17,086 | |
| | Depreciation and amortisation | | | 12 | | | | 2,927 | | | | 3,137 | | | | 5,325 | | | | 5,542 | |
| | Other interest expense | | | 13 | | | | 2,220 | | | | 2,328 | | | | 3,847 | | | | 3,978 | |
| | Grants expenses | | | 14 | | | | 6,559 | | | | 7,758 | | | | 5,958 | | | | 7,094 | |
| | Continuing Operations Total Expenses from Transactions | | | | | | | 50,025 | | | | 49,551 | | | | 58,353 | | | | 57,191 | |
| | | | | | | | | | | | | | | | | | | | | | |
Equals | | Net Operating Balance | | | | | | | 970 | | | | 420 | | | | (494 | ) | | | (881 | ) |
| | | | | | |
Add | | Continuing Operations Other Economic Flows - Included in Operating Result | | | | | | | | | | | | | | | | | | | | |
| | Gains/(losses) on sale of assets/settlement of liabilities | | | 15 | | | | 3 | | | | 37 | | | | (1,275 | ) | | | 86 | |
| | Revaluation increments/(decrements) and impairment (losses)/reversals | | | 16 | | | | 16 | | | | (24 | ) | | | (666 | ) | | | 104 | |
| | Asset write-downs | | | 17 | | | | (257 | ) | | | (479 | ) | | | (300 | ) | | | (518 | ) |
| | Actuarial adjustments to liabilities | | | 18 | | | | (49 | ) | | | 640 | | | | (49 | ) | | | 640 | |
| | Deferred income tax equivalents | | | | | | | (187 | ) | | | 206 | | | | — | | | | — | |
| | Dividends and tax equivalents treated as capital returns | | | 19 | | | | 595 | | | | 3,133 | | | | — | | | | — | |
| | Other | | | 20 | | | | (3 | ) | | | 17 | | | | (1,304 | ) | | | 1,051 | |
| | Continuing Operations Total Other Economic Flows - Included in Operating Result | | | | | | | 119 | | | | 3,530 | | | | (3,594 | ) | | | 1,362 | |
| | | | | | |
Equals | | Operating Result from Continuing Operations | | | | | | | 1,088 | | | | 3,949 | | | | (4,088 | ) | | | 481 | |
| | | | | | |
Add | | Other Economic Flows - Other Movements in Equity | | | | | | | | | | | | | | | | | | | | |
| | Adjustments to opening balances * | | | | | | | — | | | | 3,525 | | | | — | | | | 3,552 | |
| | Revaluations** | | | 21 | | | | 18,889 | | | | (2,033 | ) | | | 20,805 | | | | 649 | |
| | Other** | | | 22 | | | | (1 | ) | | | — | | | | (1 | ) | | | — | |
| | Total Other Economic Flows - Other Movements in Equity | | | | | | | 18,888 | | | | 1,492 | | | | 20,803 | | | | 4,201 | |
| | | | | | | | | | | | | | | | | | | | | | |
Equals | | Comprehensive Result/Total Change in Net Worth | | | | | | | 19,976 | | | | 5,442 | | | | 16,715 | | | | 4,682 | |
| | | | | | |
| | KEY FISCAL AGGREGATES | | | | | | | | | | | | | | | | | | | | |
| | | | | | |
| | Net Operating Balance | | | | | | | 970 | | | | 420 | | | | (494 | ) | | | (881 | ) |
| | | | | | |
Less | | Net Acquisition/(Disposal) of Non-Financial Assets | | | | | | | | | | | | | | | | | | | | |
| | Purchases of non-financial assets | | | | | | | 4,092 | | | | 4,635 | | | | 6,930 | | | | 7,823 | |
| | Less Sales of non-financial assets | | | | | | | 254 | | | | 418 | | | | 299 | | | | 541 | |
| | Less Depreciation | | | | | | | 2,927 | | | | 3,137 | | | | 5,325 | | | | 5,542 | |
| | Plus Change in inventories | | | | | | | (37 | ) | | | (59 | ) | | | (72 | ) | | | (71 | ) |
| | Plus Other movement in non-financial assets | | | | | | | 556 | | | | (29 | ) | | | 631 | | | | 72 | |
| | Equals Total Net Acquisition/(Disposal) of Non-Financial Assets | | | | | | | 1,431 | | | | 992 | | | | 1,865 | | | | 1,741 | |
| | | | | | |
Equals | | Fiscal Balance | | | | | | | (461 | ) | | | (572 | ) | | | (2,359 | ) | | | (2,622 | ) |
| * | Refer to Statement of Changes in Net Assets (Equity) |
| ** | Refer to page 6-02 for split of items in Other Movements in Equity between those that will and those that will not be reclassified subsequently to the Operating Result. |
| | | | |
| Audited Consolidated Financial Statements 2015–16 – Government of Queensland | | 6-01 |
Operating Statement for Queensland
for the Year Ended 30 June 2016
continued
| | | | | | | | | | | | | | | | |
| | | General Government | | | | |
| | | Sector | | | Total State Sector | |
| | | 2016 | | | 2015 | | | 2016 | | | 2015 | |
| | | $M | | | $M | | | $M | | | $M | |
Analysis of Other Economic Flows - Other Movements in Equity | | | | | | | | | | | | | | | | |
| | | | |
Per AASB 7 Financial Instruments: Disclosures, Other Movements in Equity per page 6-01 are required to be classified as follows: | | | | | | | | | | | | | | | | |
| | | | |
Items that will not be reclassified subsequently to Operating Result | | | | | | | | | | | | | | | | |
Increments/(decrements) in asset revaluation surplus | | | 22,774 | | | | 854 | | | | 22,464 | | | | 869 | |
Increments/(decrements) on investments | | | (2,428 | ) | | | (2,561 | ) | | | (1 | ) | | | 6 | |
Actuarial gain/(loss) on defined benefit superannuation plans (net of tax) | | | (1,408 | ) | | | (307 | ) | | | (1,491 | ) | | | (183 | ) |
Other | | | (1 | ) | | | — | | | | (1 | ) | | | — | |
Total items that will not be reclassified subsequently to Operating Result | | | 18,938 | | | | (2,014 | ) | | | 20,970 | | | | 692 | |
| | | | |
Items that will be reclassified subsequently to Operating Result | | | | | | | | | | | | | | | | |
Increments/(decrements) on cash flow hedges (net of tax) | | | (53 | ) | | | (17 | ) | | | (169 | ) | | | (42 | ) |
Increments/(decrements) on available-for-sale financial assets | | | 3 | | | | (1 | ) | | | 3 | | | | (1 | ) |
Total items that will be reclassified subsequently to Operating Result when certain conditions are met | | | (50 | ) | | | (18 | ) | | | (167 | ) | | | (42 | ) |
This Operating Statement should be read in conjunction with the accompanying notes. Note 2 provides disaggregated information in relation to the above components.
| | | | |
| 6-02 | | Audited Consolidated Financial Statements 2015–16 – Government of Queensland |
Balance Sheet for Queensland
as at 30 June 2016
| | | | | | | | | | | | | | | | | | | | |
| | | | | | General Government | | | | | | | |
| | | | | | Sector | | | Total State Sector | |
| | | | | | 2016 | | | 2015 | | | 2016 | | | 2015 | |
| | | Notes | | | $M | | | $M | | | $M | | | $M | |
Assets | | | | | | | | | | | | | | | | | | | | |
Financial Assets | | | | | | | | | | | | | | | | | | | | |
Cash and deposits | | | 23 | | | | 1,104 | | | | 1,198 | | | | 1,876 | | | | 2,701 | |
Receivables and loans | | | | | | | | | | | | | | | | | | | | |
Receivables | | | 24 | (a) | | | 4,282 | | | | 7,588 | | | | 3,926 | | | | 3,582 | |
Advances paid | | | 24 | (b) | | | 632 | | | | 640 | | | | 657 | | | | 672 | |
Loans paid | | | 24 | (c) | | | 90 | | | | 96 | | | | 10,054 | | | | 9,821 | |
Securities other than shares | | | 25 | (a) | | | 33,522 | | | | 36,050 | | | | 55,592 | | | | 60,778 | |
Shares and other equity investments | | | | | | | | | | | | | | | | | | | | |
Investments in public sector entities | | | 25 | (b) | | | 20,477 | | | | 23,685 | | | | — | | | | — | |
Investments in other entities | | | 25 | (c) | | | 8 | | | | 8 | | | | 274 | | | | 291 | |
Investments accounted for using equity method | | | 26 | (a) | | | 150 | | | | 151 | | | | 150 | | | | 151 | |
Total Financial Assets | | | | | | | 60,265 | | | | 69,415 | | | | 72,530 | | | | 77,995 | |
| | | | | |
Non-Financial Assets | | | | | | | | | | | | | | | | | | | | |
Inventories | | | 28 | | | | 507 | | | | 541 | | | | 1,161 | | | | 1,212 | |
Assets held for sale | | | 29 | | | | 123 | | | | 112 | | | | 130 | | | | 119 | |
Investment properties | | | 30 | | | | 341 | | | | 334 | | | | 661 | | | | 653 | |
Property, plant and equipment | | | 32 | | | | 198,996 | | | | 174,911 | | | | 258,161 | | | | 234,309 | |
Intangibles | | | 33 | | | | 714 | | | | 713 | | | | 1,348 | | | | 1,324 | |
Deferred tax asset | | | | | | | 5,972 | | | | 6,233 | | | | — | | | | — | |
Other non-financial assets | | | 34 | | | | 370 | | | | 337 | | | | 632 | | | | 641 | |
Total Non-Financial Assets | | | | | | | 207,024 | | | | 183,181 | | | | 262,092 | | | | 238,258 | |
| | | | | |
Total Assets | | | | | | | 267,289 | | | | 252,596 | | | | 334,622 | | | | 316,254 | |
| | | | | |
Liabilities | | | | | | | | | | | | | | | | | | | | |
Payables | | | 35 | | | | 3,596 | | | | 3,255 | | | | 4,535 | | | | 4,019 | |
Employee benefit obligations | | | | | | | | | | | | | | | | | | | | |
Superannuation liability | | | 36 | (a) | | | 27,360 | | | | 25,869 | | | | 27,189 | | | | 25,566 | |
Other employee benefits | | | 36 | (b) | | | 5,217 | | | | 4,724 | | | | 6,022 | | | | 5,483 | |
Deposits held | | | 37 | (a) | | | 3 | | | | 3 | | | | 4,753 | | | | 5,085 | |
Borrowings and advances | | | | | | | | | | | | | | | | | | | | |
Advances received | | | 37 | (b) | | | 514 | | | | 625 | | | | 514 | | | | 625 | |
Borrowings | | | 37 | (b) | | | 35,486 | | | | 43,105 | | | | 1,610 | | | | 2,053 | |
Securities and derivatives | | | 37 | (c) | | | — | | | | — | | | | 101,346 | | | | 101,784 | |
Deferred tax liability | | | | | | | 814 | | | | 674 | | | | — | | | | — | |
Provisions | | | 38 | | | | 1,601 | | | | 1,628 | | | | 5,115 | | | | 4,937 | |
Other liabilities | | | 39 | | | | 790 | | | | 780 | | | | 1,449 | | | | 1,328 | |
Total Liabilities | | | | | | | 75,380 | | | | 80,663 | | | | 152,532 | | | | 150,879 | |
| | | | | |
Net Assets | | | | | | | 191,910 | | | | 171,933 | | | | 182,090 | | | | 165,375 | |
| | | | | |
Net Worth | | | | | | | | | | | | | | | | | | | | |
Accumulated surplus/(deficit) | | | | | | | 83,672 | | | | 83,982 | | | | 74,902 | | | | 80,273 | |
Reserves | | | | | | | 108,238 | | | | 87,951 | | | | 107,188 | | | | 85,102 | |
Total Net Worth | | | | | | | 191,910 | | | | 171,933 | | | | 182,090 | | | | 165,375 | |
| | | | | | | | | | | | | | | | |
| | | | | |
KEY FISCAL AGGREGATES | | | | | | | | | | | | | | | | | | | | |
Net Financial Worth | | | | | | | (15,114 | ) | | | (11,248 | ) | | | (80,002 | ) | | | (72,884 | ) |
Net Financial Liabilities | | | | | | | 35,591 | | | | 34,933 | | | | 80,002 | | | | 72,884 | |
Net Debt | | | | | | | 654 | | | | 5,749 | | | | 40,043 | | | | 35,575 | |
This Balance Sheet should be read in conjunction with the accompanying notes. Note 2 provides disaggregated information in relation to the components of the net assets.
| | | | |
| Audited Consolidated Financial Statements 2015–16 – Government of Queensland | | 6-03 |
Statement of Changes in Net Assets (Equity) for Queensland General Government Sector
for the year ended 30 June 2016
| | | | | | | | | | | | | | | | | | | | | | | | |
| | | | | | | | | Comprehensive Result for Period | | | | |
| | | Opening Balance | | | Adjustments to
Opening Balances | | | Movements | | | Transfers / Entity
Cessation | | | Actuarial Gain / Loss
on Superannuation | | | Closing
Balance | |
| | | $M | | | $M | | | $M | | | $M | | | $M | | | $M | |
2016 | | | | | | | | | | | | | | | | | | | | | | | | |
Accumulated surplus | | | 83,982 | | | | — | | | | 1,088 | | | | 9 | | | | (1,408 | ) | | | 83,672 | |
Revaluation reserve - financial assets | | | 16,665 | | | | — | | | | (2,478 | ) | | | (10 | ) | | | — | | | | 14,177 | |
Revaluation reserve - non-financial assets | | | 71,187 | | | | — | | | | 22,774 | | | | (10 | ) | | | — | | | | 93,952 | |
Other reserves | | | 99 | | | | — | | | | — | | | | 10 | | | | — | | | | 110 | |
| | | | | | | | | | | | | | | | | | | | | | | | |
Total equity at the end of the financial year | | | 171,933 | | | | — | | | | 21,385 | | | | (1 | ) | | | (1,408 | ) | | | 191,910 | |
| | | | | | | | | | | | | | | | | | | | | | | | |
| | | | |
| | | | | | | | | Comprehensive Result for Period 4 | | | | |
| | | Opening Balance | | | Adjustments to
Opening Balances | | | Movements | | | Transfers / Entity
Cessation | | | Actuarial Gain / Loss
on Superannuation | | | Closing
Balance | |
| | | $M | | | $M | | | $M | | | $M | | | $M | | | $M | |
2015 | | | | | | | | | | | | | | | | | | | | | | | | |
Accumulated surplus 1 | | | 79,417 | | | | 209 | | | | 3,949 | | | | 715 | | | | (307 | ) | | | 83,982 | |
Revaluation reserve - financial assets 2 | | | 19,265 | | | | (21 | ) | | | (2,580 | ) | | | — | | | | — | | | | 16,665 | |
Revaluation reserve - non-financial assets 3 | | | 67,710 | | | | 3,337 | | | | 854 | | | | (714 | ) | | | — | | | | 71,187 | |
Other reserves | | | 100 | | | | — | | | | — | | | | (1 | ) | | | — | | | | 99 | |
| | | | | | | | | | | | | | | | | | | | | | | | |
Total equity at the end of the financial year | | | 166,492 | | | | 3,525 | | | | 2,224 | | | | — | | | | (307 | ) | | | 171,933 | |
| | | | | | | | | | | | | | | | | | | | | | | | |
The following notes relate to prior year adjustments to equity:
| 1 | The opening accumulated surplus has increased by $209 million as a result of non-financial asset revaluations. This increase mainly results from a change in the recognition of buildings on resumed land and a reversal of depreciation for road structures in national parks and state forests following a change in valuation methodology. |
The movement in accumulated surplus for the period is mainly due to the de-recognition of capitalised expenses from capital work in progress to contractor expenses ($144 million) for Transport and Main Roads.
| 2 | The movement in financial assets revaluation reserve for the period includes an increase of $263 million, mainly in relation to the change in value of the Public Non-financial Corporations Sector following a correction of the prior year valuation for Gladstone Ports Corporation’s assets. |
| 3 | The opening non-financial assets revaluation reserve has increased by $3.337 billion due to a review of previous land revaluations by Transport and Main Roads, and a change in methodology for revaluation of roads in national parks and state forests. |
The movement in non-financial assets revaluation reserve for the period includes an increase of $82 million, mainly in relation to the tax effect of the correction to Gladstone Ports’ assets per 2 above.
| 4 | Adjustments to opening balances are included as part of the comprehensive result on the face of the Operating Statement as they represent changes to the comprehensive result in prior periods. |
| | | | |
| 6-04 | | Audited Consolidated Financial Statements 2015–16 – Government of Queensland |
Statement of Changes in Net Assets (Equity) for Queensland Total State Sector
for the year ended 30 June 2016
| | | | | | | | | | | | | | | | | | | | | | | | |
| | | | | | | | | Comprehensive Result for Period | | | | |
| | | | | | Adjustments to | | | | | | Transfers / Entity | | | Actuarial Gain / Loss | | | Closing | |
| | | Opening Balance | | | Opening Balances | | | Movements | | | Cessation | | | on Superannuation 1 | | | Balance | |
| | | $M | | | $M | | | $M | | | $M | | | $M | | | $M | |
2016 | | | | | | | | | | | | | | | | | | | | | | | | |
Accumulated surplus | | | 80,273 | | | | — | | | | (4,088 | ) | | | 208 | | | | (1,491 | ) | | | 74,902 | |
Revaluation reserve - financial assets | | | 1,218 | | | | — | | | | (168 | ) | | | (8 | ) | | | — | | | | 1,042 | |
Revaluation reserve - non-financial assets | | | 82,547 | | | | — | | | | 22,464 | | | | (131 | ) | | | — | | | | 104,880 | |
Other reserves | | | 1,337 | | | | — | | | | — | | | | (71 | ) | | | — | | | | 1,267 | |
| | | | | | | | | | | | | | | | | | | | | | | | |
Total equity at the end of the financial year | | | 165,375 | | | | — | | | | 18,207 | | | | (1 | ) | | | (1,491 | ) | | | 182,090 | |
| | | | | | | | | | | | | | | | | | | | | | | | |
| | | | |
| | | | | | | | | Comprehensive Result for Period 4 | | | | |
| | | | | | Adjustments to | | | | | | Transfers / Entity | | | Actuarial Gain / Loss | | | Closing | |
| | | Opening Balance | | | Opening Balances | | | Movements | | | Cessation | | | on Superannuation 1 | | | Balance | |
| | | $M | | | $M | | | $M | | | $M | | | $M | | | $M | |
2015 | | | | | | | | | | | | | | | | | | | | | | | | |
Accumulated surplus 2 | | | 77,828 | | | | 188 | | | | 481 | | | | 1,960 | | | | (183 | ) | | | 80,273 | |
Revaluation reserve - financial asset 3 | | | 1,255 | | | | — | | | | (37 | ) | | | — | | | | — | | | | 1,218 | |
Revaluation reserve - non-financial assets | | | 80,533 | | | | 3,364 | | | | 869 | | | | (2,219 | ) | | | — | | | | 82,547 | |
Other reserves | | | 1,078 | | | | — | | | | — | | | | 260 | | | | — | | | | 1,337 | |
| | | | | | | | | | | | | | | | | | | | | | | | |
Total equity at the end of the financial year | | | 160,693 | | | | 3,552 | | | | 1,313 | | | | — | | | | (183 | ) | | | 165,375 | |
| | | | | | | | | | | | | | | | | | | | | | | | |
| 1 | Refer to Note 48 - Retirement Benefit Obligations. |
The following notes relate to prior year equity adjustments:
| 2 | The opening accumulated surplus has increased by $188 million as a result of non-financial asset revaluations. This increase mainly results from a change in the recognition of buildings on resumed land and a reversal of depreciation for road structures in national parks and state forests following a change in valuation methodology. |
The movement in accumulated surplus for the period is mainly due to the de-recognition of capitalised expenses from capital work in progress to contractor expenses ($144 million) for Transport and Main Roads.
| 3 | The opening non-financial assets revaluation reserve has increased by $3.364 billion due to a review of previous land revaluations by Transport and Main Roads, and a change in methodology for revaluation of roads in national parks and state forests. |
The movement in non-financial assets revaluation reserve for the period includes an increase of $272 million, mainly due to a correction of the prior year valuation for Gladstone Ports Corporation’s assets.
| 4 | Adjustments to opening balances are included as part of the comprehensive result on the face of the Operating Statement as they represent changes to the comprehensive result in prior periods. |
| | | | |
| Audited Consolidated Financial Statements 2015–16 – Government of Queensland | | 6-05 |
Cash Flow Statement for Queensland
for the Year Ended 30 June 2016
| | | | | | | | | | | | | | | | | | | | |
| | | | | | General Government | | | | | | | |
| | | | | | Sector | | | Total State Sector | |
| | | | | | 2016 | | | 2015 | | | 2016 | | | 2015 | |
| | | Notes | | | $M | | | $M | | | $M | | | $M | |
Cash Flows from Operating Activities | | | | | | | | | | | | | | | | | | | | |
Cash received | | | | | | | | | | | | | | | | | | | | |
Taxes received | | | | | | | 12,588 | | | | 12,540 | | | | 12,263 | | | | 12,189 | |
Grants and subsidies received | | | | | | | 23,891 | | | | 23,495 | | | | 23,867 | | | | 23,503 | |
Sales of goods and services | | | | | | | 6,083 | | | | 5,930 | | | | 17,773 | | | | 17,179 | |
Interest receipts | | | | | | | 2,536 | | | | 2,475 | | | | 1,564 | | | | 1,310 | |
Dividends and income tax equivalents | | | | | | | 3,754 | | | | 2,091 | | | | 20 | | | | 11 | |
Other receipts | | | | | | | 4,385 | | | | 4,407 | | | | 4,688 | | | | 4,776 | |
| | | | | | | 53,237 | | | | 50,939 | | | | 60,174 | | | | 58,968 | |
| | | | | |
Cash paid | | | | | | | | | | | | | | | | | | | | |
Payments for employees | | | | | | | (22,830 | ) | | | (21,531 | ) | | | (24,577 | ) | | | (23,206 | ) |
Payments for goods and services | | | | | | | (16,459 | ) | | | (15,916 | ) | | | (18,466 | ) | | | (18,256 | ) |
Grants and subsidies paid | | | | | | | (6,750 | ) | | | (6,775 | ) | | | (6,128 | ) | | | (6,119 | ) |
Interest paid | | | | | | | (2,223 | ) | | | (2,327 | ) | | | (3,908 | ) | | | (4,012 | ) |
Other payments | | | | | | | (271 | ) | | | (277 | ) | | | (2,314 | ) | | | (2,285 | ) |
| | | | | | | (48,533 | ) | | | (46,826 | ) | | | (55,392 | ) | | | (53,878 | ) |
| | | | | |
Net Cash Flows from Operating Activities | | | 40 | | | | 4,704 | | | | 4,112 | | | | 4,782 | | | | 5,090 | |
| | | | | |
Cash Flows from Investing Activities | | | | | | | | | | | | | | | | | | | | |
Non-Financial Assets | | | | | | | | | | | | | | | | | | | | |
Purchases of non-financial assets | | | | | | | (4,092 | ) | �� | | (4,635 | ) | | | (6,930 | ) | | | (7,823 | ) |
Sales of non-financial assets | | | | | | | 254 | | | | 418 | | | | 299 | | | | 541 | |
| | | | | | | (3,838 | ) | | | (4,217 | ) | | | (6,630 | ) | | | (7,281 | ) |
| | | | | |
Financial Assets (Policy Purposes) | | | | | | | | | | | | | | | | | | | | |
Equity disposals | | | | | | | 3,348 | | | | 22 | | | | (2 | ) | | | — | |
| | | | | | | 3,348 | | | | 22 | | | | (2 | ) | | | — | |
| | | | | |
Financial Assets (Liquidity Purposes) | | | | | | | | | | | | | | | | | | | | |
Sales of investments | | | | | | | 5,547 | | | | 3,173 | | | | 38,431 | | | | 41,597 | |
Purchases of investments | | | | | | | (3,008 | ) | | | (4,456 | ) | | | (33,064 | ) | | | (47,037 | ) |
| | | | | | | 2,540 | | | | (1,283 | ) | | | 5,367 | | | | (5,441 | ) |
Net Cash Flows from Investing Activities | | | | | | | 2,050 | | | | (5,478 | ) | | | (1,266 | ) | | | (12,722 | ) |
| | | | | |
Cash Flows from Financing Activities | | | | | | | | | | | | | | | | | | | | |
Cash received | | | | | | | | | | | | | | | | | | | | |
Advances received | | | | | | | 117 | | | | 251 | | | | 117 | | | | 251 | |
Proceeds of borrowing | | | | | | | 667 | | | | 2,956 | | | | 6,060 | | | | 2,693 | |
Deposits received | | | | | | | 5 | | | | 9 | | | | 121 | | | | 1,397 | |
Other financing (including interest bearing liabilities) | | | | | | | — | | | | — | | | | 38,848 | | | | 30,900 | |
| | | | | | | 789 | | | | 3,217 | | | | 45,146 | | | | 35,241 | |
| | | | | |
Cash paid | | | | | | | | | | | | | | | | | | | | |
Advances paid | | | | | | | (229 | ) | | | (219 | ) | | | (229 | ) | | | (219 | ) |
Borrowing repaid | | | | | | | (7,404 | ) | | | (1,331 | ) | | | (6,007 | ) | | | (2,921 | ) |
Deposits withdrawn | | | | | | | (5 | ) | | | (7 | ) | | | (453 | ) | | | (105 | ) |
Other financing (including interest bearing liabilities) | | | | | | | — | | | | — | | | | (42,799 | ) | | | (25,190 | ) |
| | | | | | | (7,638 | ) | | | (1,556 | ) | | | (49,487 | ) | | | (28,435 | ) |
Net Cash Flows from Financing Activities | | | | | | | (6,848 | ) | | | 1,661 | | | | (4,341 | ) | | | 6,806 | |
| | | | | |
Net increase/(decrease) in Cash and Deposits Held | | | | | | | (94 | ) | | | 295 | | | | (825 | ) | | | (826 | ) |
Cash and deposits at the beginning of the financial year | | | | | | | 1,198 | | | | 903 | | | | 2,701 | | | | 3,526 | |
Cash and Cash Equivalents Held at the End of the Financial Year | | | 23 | | | | 1,104 | | | | 1,198 | | | | 1,876 | | | | 2,701 | |
| | | | | | | | | | | | | | | | |
| | | | | |
KEY FISCAL AGGREGATES | | | | | | | | | | | | | | | | | | | | |
Net Cash from Operating Activities | | | | | | | 4,704 | | | | 4,112 | | | | 4,782 | | | | 5,090 | |
Net Cash Flow from Investments in Non-Financial Assets | | | | | | | (3,838 | ) | | | (4,217 | ) | | | (6,630 | ) | | | (7,281 | ) |
CASH SURPLUS/(DEFICIT) | | | | | | | 866 | | | | (105 | ) | | | (1,849 | ) | | | (2,191 | ) |
| | | | | | | | | | | | | | | | |
| | | | | |
Derivation of ABS GFS Cash Surplus/Deficit | | | | | | | | | | | | | | | | | | | | |
Cash surplus/(deficit) | | | | | | | 866 | | | | (105 | ) | | | (1,849 | ) | | | (2,191 | ) |
Acquisitions under finance leases and similar arrangements | | | | | | | (341 | ) | | | (470 | ) | | | (341 | ) | | | (479 | ) |
ABS GFS Cash Surplus/(Deficit) Including | | | | | | | | | | | | | | | | | | | | |
Finance Leases and Similar Arrangements | | | | | | | 525 | | | | (575 | ) | | | (2,190 | ) | | | (2,670 | ) |
This Cash Flow Statement should be read in conjunction with the accompanying notes. Note 2 provides disaggregated information in relation to the components of the net cash flows.
| | | | |
| 6-06 | | Audited Consolidated Financial Statements 2015–16 – Government of Queensland |
Notes to the Financial Statements
Index of Notes
| | | | | | |
| Note | | Title | | Page | |
1. | | Basis of financial statements preparation | | | 6-08 | |
2. | | Disaggregated information | | | 6-14 | |
3. | | Taxation revenue | | | 6-21 | |
4. | | Grants revenue | | | 6-21 | |
5. | | Sales of goods and services | | | 6-21 | |
6. | | Interest income | | | 6-22 | |
7. | | Dividend and income tax equivalents income | | | 6-22 | |
8. | | Other revenue | | | 6-22 | |
9. | | Employee expenses | | | 6-22 | |
10. | | Other superannuation expenses | | | 6-22 | |
11. | | Other operating expenses | | | 6-23 | |
12. | | Depreciation and amortisation | | | 6-23 | |
13. | | Other interest expense | | | 6-24 | |
14. | | Grants expenses | | | 6-24 | |
15. | | Gains/(losses) on sale of assets/settlement of liabilities | | | 6-24 | |
16. | | Revaluation increments/(decrements) and impairment (losses)/reversals | | | 6-24 | |
17. | | Asset write-downs | | | 6-26 | |
18. | | Actuarial adjustments to liabilities | | | 6-26 | |
19. | | Dividends and tax equivalents treated as capital returns | | | 6-26 | |
20. | | Other economic flows - included in operating result - other | | | 6-26 | |
21. | | Other economic flows - other movements in equity - revaluations | | | 6-27 | |
22. | | Other economic flows - other movements in equity - other | | | 6-27 | |
23. | | Cash and deposits | | | 6-27 | |
24. | | Receivables and loans | | | 6-27 | |
25. | | Securities and shares | | | 6-30 | |
26. | | Other investments | | | 6-32 | |
27. | | Public private partnerships | | | 6-33 | |
28. | | Inventories | | | 6-36 | |
29. | | Assets held for sale | | | 6-37 | |
30. | | Investment properties | | | 6-37 | |
31. | | Restricted assets | | | 6-37 | |
32. | | Property, plant and equipment | | | 6-38 | |
33. | | Intangibles | | | 6-49 | |
34. | | Other non-financial assets | | | 6-51 | |
35. | | Payables | | | 6-51 | |
36. | | Employee benefit obligations | | | 6-51 | |
37. | | Deposits, borrowings and advances, securities and derivatives | | | 6-53 | |
38. | | Provisions | | | 6-55 | |
39. | | Other liabilities | | | 6-57 | |
40. | | Reconciliation of operating result to net cash flows from operating activities | | | 6-58 | |
41. | | Expenditure commitments | | | 6-58 | |
42. | | Cash and other assets held in trust | | | 6-59 | |
43. | | Contingent assets and liabilities | | | 6-59 | |
44. | | Post balance date events | | | 6-64 | |
45. | | Defeased cross border leases | | | 6-64 | |
46. | | Financial risk management disclosure | | | 6-64 | |
47. | | Net fair value of financial instruments | | | 6-70 | |
48. | | Retirement benefit obligations | | | 6-73 | |
49. | | Controlled entities | | | 6-77 | |
50. | | Reconciliation to GFS | | | 6-80 | |
51. | | Expenses from transactions by function | | | 6-85 | |
52. | | Sector assets by function | | | 6-85 | |
53. | | General Government Sector budget to actual comparison | | | 6-86 | |
| | | | |
| Audited Consolidated Financial Statements 2015–16 – Government of Queensland | | 6-07 |
Notes to the Financial Statements
| 1. | Basis of financial statements preparation |
This financial report is prepared for the Queensland General Government Sector (GGS) and the consolidated Total State Sector.
The GGS is a component of the Total State Sector. The GGS is determined in accordance with the principles and rules contained in the Australian Bureau of Statistics’ (ABS) Australian System of Government Finance Statistics: Concepts, Sources and Methods 2005 (ABS GFS Manual). According to the ABS GFS Manual, the GGS consists of all government units and non-profit institutions controlled and mainly financed by government. Government units are legal entities established by political processes that have legislative, judicial or executive authority over other units and which provide goods and services to the community or to individuals on a non-market basis and make transfer payments to redistribute income and wealth. Non-profit institutions are created for the purpose of producing or distributing goods and services but are not a source of income, profit or other financial gain for the government. Refer Note 1(c) for further information on sectors.
Unless otherwise stated, references in this report to “the State” include both the GGS and Total State Sector.
| (b) | The Government reporting entity |
The Queensland Government economic entity (Total State Sector) includes all State Government departments, other General Government entities, Public Non-financial Corporations, Public Financial Corporations and their controlled entities. Refer Note 49 for a full list of controlled entities included in each sector.
Under AASB 1049 Whole of Government and General Government Sector Financial Reporting, the preparation of the GGS financial report does not require full application of AASB 127 Consolidated and Separate Financial Statements and AASB 139 Financial Instruments: Recognition and Measurement. The GGS includes the value of all material assets, liabilities, equity, revenue and expenses of entities controlled by the GGS of Queensland. Assets, liabilities, revenue, expenses and cash flows of government controlled entities that are in the Public Non-financial Corporations Sector (PNFC) and the Public Financial Corporations Sector (PFC) are not separately recognised in the GGS. Instead, the GGS recognises an asset, being the controlling equity investment in those entities and recognises an increment or decrement relating to changes in the carrying amount of that asset, measured in accordance with AASB 1049.
Where control of an entity is obtained during the financial year, its results are included in the Operating Statement from the date control commences. Where control of an entity ceases during a financial year, its results are included for that part of the year during which control existed.
Generally, only those agencies considered material by virtue of the size of their financial transactions and/or resources managed are consolidated for the purposes of this report (refer Note 49 for further details).
In the process of reporting the Government of Queensland as a single economic entity, all material inter-entity and intra-entity transactions and balances have been eliminated to the extent practicable.
The ABS GFS Manual provides the basis upon which GFS information contained in the financial report is prepared. In particular, notes disclosing key fiscal aggregates of net worth, net operating balance, total change in net worth, fiscal balance or net lending/(borrowing) and cash surplus/(deficit), determined using the principles and rules in the ABS GFS Manual are included in the financial report together with a reconciliation of those key fiscal aggregates to the corresponding key fiscal aggregates determined in accordance with AASB 1049 (refer Note 50).
Assets, liabilities, revenue and expenses that are attributed reliably to each sector of the Queensland Government economic entity are disclosed in Note 2. For disclosure purposes, transactions and balances between sectors have not been eliminated but those between entities within each sector have been eliminated. The financial impact of inter-sector transactions and balances is also disclosed in Note 2, under the heading of Consolidation Adjustments.
A brief description of each broad sector of the Government’s activities, determined in accordance with the ABS GFS Manual follows:
General Government Sector (GGS)
The primary function of GGS agencies is to provide public services that:
| | - | | are non-trading in nature and that are for the collective benefit of the community; |
| | - | | are largely financed by way of taxes, fees and other compulsory charges; and |
| | - | | involve the transfer or redistribution of income. |
Public Non-financial Corporations Sector (PNFC Sector)
The primary function of enterprises in the PNFC Sector is to provide goods and services that:
| | - | | are trading, non-regulatory or non-financial in nature; and |
| | - | | are financed by way of sales of goods and services to consumers. |
| | | | |
| 6-08 | | Audited Consolidated Financial Statements 2015–16 – Government of Queensland |
Notes to the Financial Statements
| 1. | Basis of financial statements preparation continued |
Public Financial Corporations Sector (PFC Sector)
The PFC Sector comprises publicly-owned institutions which provide financial services, usually on a commercial basis.
Functions they perform may include:
| | - | | central bank functions; |
| | - | | accepting on-call, term or savings deposits; |
| | - | | investment fund management; |
| | - | | having the authority to incur liabilities and acquire financial assets in the market on their own account; or |
| | - | | providing insurance services. |
| (d) | Compliance with prescribed requirements |
This financial report has been prepared in accordance with the Financial Accountability Act 2009. In addition, the financial statements comply with AASB 1049 which requires compliance with all Australian Accounting Standards and Concepts, Interpretations and other authoritative pronouncements, except those identified below.
With respect to compliance with Australian Accounting Standards and Interpretations, the GGS and the Total State Sector have applied those requirements applicable to not-for-profit entities, as the GGS and the Total State Sector are classified as such. It is, however, recognised that the Total State Sector is an aggregation of both for-profit and not-for-profit entities.
Unless otherwise stated, the accounting policies adopted for the reporting period are consistent with those of the previous reporting period. In accordance with AASB 101 Presentation of Financial Statements and AASB 108 Accounting Policies, Changes in Accounting Estimates and Errors, changes to accounting policies are applied retrospectively unless specific transitional provisions apply.
The financial report of the Total State Sector is a general purpose financial report. The financial report of the GGS is included as two separate columns adjacent to the Total State financial information. GGS information is shaded.
The statements have been prepared on an accrual basis that recognises the financial effects of transactions and events when they occur.
AASB 1049 harmonises GFS with Generally Accepted Accounting Principles (GAAP) to the extent that GFS does not conflict with GAAP. This requires the selection of options within the Australian Accounting Standards that harmonise with the ABS GFS Manual.
The purpose of this financial report is to provide users with information about the stewardship by the Government in relation to the GGS and Total State Sector and accountability for the resources entrusted to it, information about the financial position, performance and cash flows of the GGS and Total State Sector and information that facilitates assessments of the macro-economic impact of the Government.
| (e) | New and changed accounting standards |
No new Australian Accounting Standards effective for the first time in 2015-16 had any material impact on this financial report.
Two Australian Accounting Standards have been early adopted for the 2015-16 year. These are:
AASB 2015-2 Amendments to Australian Accounting Standards—Disclosure Initiative: Amendments to AASB 101 [ AASB 7, AASB 101, AASB 134 & AASB 1049]
The amendments arising from this standard seek to improve financial reporting by providing flexibility as to the ordering of notes, the identification and location of significant accounting policies and the presentation of sub-totals, and provides clarity on aggregating line items. It also emphasises only including material disclosures in the notes. The State has applied this flexibility in preparing the 2015-16 financial statements, including co-locating significant accounting policies with the related breakdowns of financial statement figures in the notes.
AASB 2015-7 Amendments to Australian Accounting Standards—Fair Value Disclosures of Not-for-Profit Public Sector Entities [AASB 13]
This standard amends AASB 13 Fair Value Measurement and provides relief to not-for-profit public sector entities from certain disclosures about property, plant and equipment that is primarily held for its current service potential rather than to generate future net cash inflows. The relief applies to assets under AASB 116 Property, Plant and Equipment which are measured at fair value and categorised within level 3 of the fair value hierarchy (refer to Note 32).
As a result, the following disclosures are no longer required for those assets and, in early adopting the amendments, have been removed from the 2015-16 financial statements:
| | - | | disaggregation of certain gains/losses on assets reflected in the operating result |
| | - | | quantitative information about the significant unobservable inputs used in the fair value measurement; and |
| | - | | a description of the sensitivity of the fair value measurement to changes in the unobservable inputs. |
| | | | |
| Audited Consolidated Financial Statements 2015–16 – Government of Queensland | | 6-09 |
Notes to the Financial Statements
| 1. | Basis of financial statements preparation continued |
| (e) | New and changed accounting standards continued |
The following are the significant new and revised standards that apply as from reporting periods beginning on or after 1 January 2016:
AASB 124 Related Party Disclosures will apply to not-for-profit entities from reporting periods beginning on or after 1 July 2016. The accounting standard already applies to for-profit public sector entities. The accounting standard requires disclosures about the remuneration of key management personnel, transactions with related parties, and relationships between parent and controlled entities. The most significant implications of AASB 124 for the State’s financial statements will be the disclosures to be made about remuneration of key management personnel and significant transactions between Government entities and their related parties. For any such transactions, disclosures will include the nature of the related party relationship, as well as information about those transactions’ terms/conditions and amounts, any guarantees given/received, outstanding receivables/payables, commitments, and any receivables where collection has been assessed as being doubtful.
AASB 15 Revenue from Contracts with Customers will be effective from reporting periods beginning on or after 1 January 2017. This standard contains much more detailed requirements for the accounting for certain types of revenue from customers. Depending on the specific contractual terms, the new requirements may potentially result in a change to the timing of revenue from sales of the State’s goods and services, such that some revenue may need to be deferred to a later reporting period to the extent that the State has received cash but has not met its associated obligations (such amounts would be reported as an unearned revenue in the meantime). The State is yet to complete its analysis of current arrangements for sale of its goods and services but at this stage does not expect a significant impact on its present accounting practices.
AASB 2016-2 Amendments to Australian Accounting Standards—Disclosure Initiative: Amendments to AASB 107 will be effective from reporting periods beginning on or after 1 July 2017. The standard requires entities preparing financial statements in accordance with Tier 1 reporting requirements to provide additional disclosure that enable users of financial statements to evaluate changes in liabilities arising from financing activities. These disclosures will include both cash flows and non-cash changes between the opening and closing balance of the relevant liabilities and be disclosed by way of a reconciliation or roll forward as part of the notes to the statement of cash flows. The measurement of assets, liabilities, income and expenditure in the financial statements will be unaffected.
AASB 9 Financial Instruments and AASB 2014-7 Amendments to Australian Accounting Standards arising from AASB 9 (December 2014) will become effective from reporting periods ending on or after 1 January 2018. The main impacts of these standards on the State are that they will change the requirements for the classification, measurement, impairment and disclosures associated with the State’s financial assets. AASB 9 will introduce different criteria for whether financial assets can be measured at amortised cost or fair value.
The State has commenced reviewing the measurement of its financial assets against the new AASB 9 classification and measurement requirements. However, as the classification of financial assets at the date of initial application of AASB 9 will depend on the facts and circumstances existing at that date, the State’s conclusions will not be confirmed until closer to that time.
The potential impact of the new measurement requirements on the State is that the ‘held to maturity’ investments on the balance sheet will need to be measured at fair value and will no longer be classified as ‘held to maturity’.
AASB 16 Leases will become effective for reporting periods beginning on or after 1 January 2019. AASB 16 requires lessees to recognise a right-of-use asset (representing the right to use the underlying leased asset) and a liability (representing the obligation to make future lease payments) for all leases with a term of more than 12 months, unless the underlying assets are of low value. AASB 16 requirements for lessors remains largely unchanged from AASB 117 Leases. Depending on the specific leases arrangements, the new requirements may potentially result in the majority of what are currently classified as operating leases being reported on the Balance Sheet, hence a significant increase in assets and liabilities for the State. The State is yet to complete its analysis of current arrangements for leases to assess the full range of potential implications.
The reporting period of the GGS and Total State Sector is the year ended 30 June 2016.
Currency and Rounding
All amounts in these statements are in Australian dollars and have been rounded to the nearest $1 million or where the amount is less than $500,000, to zero, unless otherwise indicated. Accordingly, numbers may not add due to rounding.
Comparative information
Where applicable, comparatives have been restated, to be consistent with changes in the financial statements’ presentation for the current reporting period. The impact of any prior year adjustments is noted in the Statement of Changes in Equity.
| | | | |
| 6-10 | | Audited Consolidated Financial Statements 2015–16 – Government of Queensland |
Notes to the Financial Statements
| 1. | Basis of financial statements preparation continued |
| (g) | Presentation continued |
Errors
AASB 108 Accounting Policies, Changes in Accounting Estimates and Errors requires that material prior period errors be corrected retrospectively by either restating comparative amounts if the errors occurred in the prior year; or restating the opening balances of assets, liabilities and equity of the prior year where the error occurred before the prior year.
Foreign currency
Foreign currency transactions are translated into Australian dollars at the rate of exchange prevailing at the date of the transaction. Amounts payable and receivable in foreign currencies at balance date are translated to Australian dollars at rates of exchange current at 30 June 2016.
Translation differences relating to amounts payable and receivable in foreign currencies are brought to account as exchange gains or losses in other economic flows in the operating result, except when deferred in equity as qualifying cash flow hedges and net investment hedges or are attributable to part of the net investment in a foreign operation.
Translation differences on non-monetary assets and liabilities such as equities held at fair value through profit or loss are recognised in other economic flows in the operating result as part of the fair value gain or loss. Translation differences on non-monetary assets such as equities classified as available-for-sale financial assets are included in the fair value reserve in equity.
Translation differences relating to borrowings are accounted for as exchange gains or losses in other economic flows in the operating result.
These financial statements use historical cost accounting principles as the measurement basis unless otherwise stated in the report. Other significant valuation methodologies used include:
Financial assets
| | - | | receivables and loans (except onlendings) are measured at amortised cost; |
| | - | | held-to-maturity investments are measured at amortised cost; |
| | - | | available-for-sale investments are measured at fair value; |
| | - | | other financial assets, including onlendings by QTC, securities and derivatives, are recorded at fair value through profit or loss; |
Financial liabilities
| | - | | payables are measured at amortised cost; |
| | - | | finance lease liabilities, advances from the Commonwealth, interest bearing deposits and GGS loans from QTC are measured at amortised cost; |
| | - | | other financial liabilities, including securities and derivatives, are recorded at fair value through profit or loss; |
Non-financial assets
| | - | | inventories (other than those held for distribution) are valued at the lower of cost and net realisable value under AASB 102 Inventories. |
| | - | | land, buildings, infrastructure, major plant and equipment and heritage and cultural assets are valued at fair value. Other classes of assets are valued at cost which approximates fair value; and |
Non-financial liabilities
| | - | | provisions in relation to superannuation, WorkCover, motor vehicle accident liabilities, Queensland Government Insurance Fund and the Queensland Government Long Service Leave Central Scheme are based on actuarial valuations, measured at the present value of the estimate of the expenditure required to settle the present obligation at the reporting date. |
Business combinations are recognised in accordance with AASB 3 Business Combinations and accounted for using the acquisition method, regardless of whether equity instruments or other assets and liabilities are acquired.
Cost is measured as the fair value of the assets given or liabilities incurred or assumed at the date of exchange plus costs directly attributable to the acquisition.
Identifiable assets acquired and liabilities and contingent liabilities assumed in a business combination are measured initially at their fair value at the acquisition date, irrespective of the extent of any minority interest. The excess of cost of acquisition over the fair value of the State’s share of the identifiable net assets acquired is recorded as goodwill. If the cost of acquisition is less than the State’s share of the fair value of the identifiable net assets of the subsidiary acquired, the difference is recognised directly in other economic flows in the operating result but only after a reassessment of the identification and measurement of the net assets acquired.
| | | | |
| Audited Consolidated Financial Statements 2015–16 – Government of Queensland | | 6-11 |
Notes to the Financial Statements
| 1. | Basis of financial statements preparation continued |
The Government is exempt from Commonwealth taxation except for Fringe Benefits Tax and Goods and Services Tax (GST).
Revenue, expenses and assets are recognised net of GST, except where the amount of GST incurred is not recoverable from the Australian Taxation Office (ATO). In these circumstances, the GST is recognised as part of the acquisition cost of the asset or as part of the item of expense.
Receivables and payables include GST. The amounts of GST receivable from, or payable to, the ATO are included as a current asset or liability in the Balance Sheet.
Cash flows are included in the Cash Flow Statement on a gross basis. The GST components of cash flows arising from investing and financing activities which are recoverable from, or payable to, the ATO are classified as operating cash flows.
| (k) | Related party transactions |
A number of related party transactions which are at arm’s length and under normal commercial terms, have been disclosed in the financial statements of some of the agencies that are included in these consolidated financial statements. These transactions mainly relate to Government-owned corporations. Reference should be made to individual agency reports for further particulars of these transactions.
AASB 1049 requires the Operating Statement to include all items of revenue and expenses recognised in a period. All amounts relating to an item included in the determination of comprehensive result (total change in net worth) are classified as transactions or other economic flows in a manner that is consistent with the ABS GFS Manual. Key technical terms from the ABS GFS Manual that are used in this financial report are outlined in Notes 1(c) and 1(m).
Transactions are interactions between two units by mutual agreement or an action within a unit that is analytically useful to treat as a transaction. Other economic flows are changes in the volume or value of an asset or liability that do not result from transactions (i.e. revaluations and other changes in the volume of assets).
Where application of accounting standards results in a variance to GFS, a reconciliation to GFS is provided in Note 50.
| (m) | Key GFS technical terms |
ABS GFS Manual
The ABS GFS Manual refers to the ABS publication Australian System of Government Finance Statistics: Concepts, Sources and Methods 2005 as updated from time to time.
Cash surplus/(deficit)
The cash surplus/(deficit) is calculated as net cash flows from operating activities plus net cash flows from acquisition and disposal of non-financial assets less distributions paid. GFS cash surplus/(deficit) also deducts the value of assets acquired under finance leases and similar arrangements.
Convergence differences
Convergence differences are differences between the amounts recognised in the financial statements compared with the amounts determined for GFS purposes as a result of differences in definition, recognition, measurement and classification principles and rules.
Comprehensive result—total change in net worth before transactions with owners as owners
This is the net result of all items of revenue and expenses recognised for the period. It is the aggregate of operating result and other movements in equity, other than transactions with owners as owners.
Financial asset
A financial asset is any asset that is:
| | - | | an equity instrument of another entity; |
| | (i) | to receive cash or another financial asset from another entity; or |
| | (ii) | to exchange financial assets or financial liabilities with another entity under conditions that are potentially favourable to the entity; or |
| | | | |
| 6-12 | | Audited Consolidated Financial Statements 2015–16 – Government of Queensland |
Notes to the Financial Statements
| 1. | Basis of financial statements preparation continued |
| (m) | Key GFS technical terms continued |
Financial asset continued
| | - | | a contract that will or may be settled in the entity’s own equity instruments and is: |
| | (i) | a non-derivative for which the entity is or may be obliged to receive a variable number of the entity’s own equity instruments; or |
| | (ii) | a derivative that will or may be settled other than by the exchange of a fixed amount of cash or another financial asset for a fixed number of the entity’s own equity instruments. For this purpose the entity’s own equity instruments do not include instruments that are themselves contracts for the future receipt or delivery of the entity’s own equity instruments. |
Key fiscal aggregates
Key fiscal aggregates are referred to as analytical balances in the ABS GFS Manual. These are data identified in the ABS GFS Manual as useful for macro-economic analysis purposes, including assessing the impact of a government on the economy. They are opening net worth, net operating balance (which equals change in net worth due to transactions), fiscal balance, change in net worth due to other changes in the volume of assets, total change in net worth, closing net worth and cash surplus/(deficit).
Net debt
Net debt equals (deposit liabilities held plus advances and borrowing liabilities) less (cash and deposits, plus investments and loans plus asset advances outstanding). It is based on the definition in the ABS GFS Manual.
Fiscal balance
Also known as Net lending/(borrowing), this measures the financing requirements of government, and is calculated as the net operating balance, less the net acquisition of non-financial assets. A positive result reflects a fiscal surplus (net lending position) and a negative result reflects a fiscal deficit (net borrowing position), based on the definition in the ABS GFS Manual.
Net operating balance
This is calculated as income from transactions minus expenses from transactions, based on the definition in the ABS GFS Manual.
Net worth
For the GGS, net worth is the result of assets less liabilities and shares/contributed capital. For the State, net worth is assets less liabilities since shares and contributed capital is zero. It is an economic measure of wealth and reflects the contribution of governments to the wealth of Australia.
Non-profit institution
A non-profit institution is a legal or social entity that is created for the purpose of producing or distributing goods and services but is not permitted to be a source of income, profit or other financial gain for the units that establish, control or finance it.
Non-financial asset
These are all assets that are not ‘financial assets’.
Operating result
Operating result is a measure of financial performance of the operations of the State for the period. It is the net result of items of revenue, gains and expenses (including losses) recognised for the period, excluding those that are classified as other movements in equity.
Other economic flows
Changes in the volume or value of an asset or liability that do not result from transactions (i.e. revaluations and other changes in the volume of assets) are other economic flows.
| | | | |
| Audited Consolidated Financial Statements 2015–16 – Government of Queensland | | 6-13 |
Notes to the Financial Statements
| 2. | Disaggregated information |
Operating Statement
| | | | | | | | | | | | | | | | | | | | | | | | | | | | | | | | | | | | | | | | | | |
| | | | | General
Government* | | | Public Non-financial
Corporations* | | | Public Financial
Corporations* | | | Consolidation
Adjustments | | | Consolidated | |
| | | | | 2016 | | | 2015 | | | 2016 | | | 2015 | | | 2016 | | | 2015 | | | 2016 | | | 2015 | | | 2016 | | | 2015 | |
| | | | | $M | | | $M | | | $M | | | $M | | | $M | | | $M | | | $M | | | $M | | | $M | | | $M | |
| | Continuing Operations Revenue from Transactions | | | | | | | | | | | | | | | | | | | | | | | | | | | | | | | | | | | | | | | | |
| | | | | | | | | | | |
| | Taxation revenue | | | 12,547 | | | | 12,598 | | | | — | | | | — | | | | — | | | | — | | | | (321 | ) | | | (352 | ) | | | 12,226 | | | | 12,245 | |
| | Grants revenue | | | 23,740 | | | | 23,583 | | | | 699 | | | | 763 | | | | — | | | | — | | | | (693 | ) | | | (745 | ) | | | 23,746 | | | | 23,601 | |
| | Sales of goods and services | | | 5,926 | | | | 5,443 | | | | 10,777 | | | | 10,237 | | | | 1,702 | | | | 1,766 | | | | (2,079 | ) | | | (2,061 | ) | | | 16,327 | | | | 15,386 | |
| | Interest income | | | 2,543 | | | | 2,470 | | | | 62 | | | | 68 | | | | 5,060 | | | | 4,937 | | | | (6,100 | ) | | | (6,116 | ) | | | 1,565 | | | | 1,358 | |
| | Dividend and income tax equivalents income | | | 2,661 | | | | 2,554 | | | | 14 | | | | 10 | | | | — | | | | — | | | | (2,656 | ) | | | (2,549 | ) | | | 20 | | | | 15 | |
| | Other revenue | | | 3,577 | | | | 3,322 | | | | 310 | | | | 342 | | | | 98 | | | | 58 | | | | (10 | ) | | | (16 | ) | | | 3,974 | | | | 3,706 | |
| | | | | | | | | | | |
| | Continuing Operations Total Revenue from Transactions | | | 50,995 | | | | 49,970 | | | | 11,863 | | | | 11,420 | | | | 6,860 | | | | 6,762 | | | | (11,859 | ) | | | (11,841 | ) | | | 57,859 | | | | 56,311 | |
| | | | | | | | | | | |
Less | | Continuing Operations Expenses from Transactions | | | | | | | | | | | | | | | | | | | | | | | | | | | | | | | | | | | | | | | | |
| | | | | | | | | | | |
| | Employee expenses | | | 20,044 | | | | 18,592 | | | | 1,625 | | | | 1,534 | | | | 270 | | | | 250 | | | | (307 | ) | | | (289 | ) | | | 21,632 | | | | 20,086 | |
| | Superannuation expenses | | | | | | | | | | | | | | | | | | | | | | | | | | | | | | | | | | | | | | | | |
| | Superannuation interest cost | | | 767 | | | | 878 | | | | (12 | ) | | | (5 | ) | | | — | | | | — | | | | — | | | | — | | | | 755 | | | | 873 | |
| | Other superannuation expenses | | | 2,507 | | | | 2,319 | | | | 201 | | | | 199 | | | | 17 | | | | 13 | | | | — | | | | — | | | | 2,726 | | | | 2,531 | |
| | Other operating expenses | | | 15,000 | | | | 14,539 | | | | 3,400 | | | | 3,118 | | | | 1,555 | | | | 1,282 | | | | (1,846 | ) | | | (1,852 | ) | | | 18,109 | | | | 17,086 | |
| | Depreciation and amortisation | | | 2,927 | | | | 3,137 | | | | 2,346 | | | | 2,358 | | | | 51 | | | | 47 | | | | — | | | | — | | | | 5,325 | | | | 5,542 | |
| | Other interest expense | | | 2,220 | | | | 2,328 | | | | 1,885 | | | | 1,898 | | | | 6,094 | | | | 6,150 | | | | (6,351 | ) | | | (6,398 | ) | | | 3,847 | | | | 3,978 | |
| | Grants expenses | | | 6,559 | | | | 7,758 | | | | 15 | | | | 11 | | | | 77 | | | | 71 | | | | (693 | ) | | | (745 | ) | | | 5,958 | | | | 7,094 | |
| | Other property expenses | | | — | | | | — | | | | 802 | | | | 678 | | | | 53 | | | | 49 | | | | (856 | ) | | | (727 | ) | | | — | | | | — | |
| | | | | | | | | | | |
| | Continuing Operations Total Expenses from Transactions | | | 50,025 | | | | 49,551 | | | | 10,263 | | | | 9,790 | | | | 8,118 | | | | 7,862 | | | | (10,053 | ) | | | (10,012 | ) | | | 58,353 | | | | 57,191 | |
| | | | | | | | | | | |
Equals | | Net Operating Balance | | | 970 | | | | 420 | | | | 1,600 | | | | 1,629 | | | | (1,258 | ) | | | (1,101 | ) | | | (1,806 | ) | | | (1,828 | ) | | | (494 | ) | | | (881 | ) |
* See Note 1(c) for explanation of sectors.
| | | | |
| 6-14 | | Audited Consolidated Financial Statements 2015–16 – Government of Queensland |
Notes to the Financial Statements
| 2. | Disaggregated information continued |
| | | | | | | | | | | | | | | | | | | | | | | | | | | | | | | | | | | | | | | | |
| | | General
Government* | | | Public Non-financial
Corporations* | | | Public Financial
Corporations* | | | Consolidation
Adjustments | | | Consolidated | |
| | | 2016 | | | 2015 | | | 2016 | | | 2015 | | | 2016 | | | 2015 | | | 2016 | | | 2015 | | | 2016 | | | 2015 | |
| | | $M | | | $M | | | $M | | | $M | | | $M | | | $M | | | $M | | | $M | | | $M | | | $M | |
Continuing Operations Other Economic Flows Included in Operating Result | | | | | | | | | | | | | | | | | | | | | | | | | | | | | | | | | | | | | | | | |
Gain/(loss) on sale of assets /settlement of liabilities | | | 3 | | | | 37 | | | | (4 | ) | | | 8 | | | | (1,274 | ) | | | 41 | | | | — | | | | — | | | | (1,275 | ) | | | 86 | |
Revaluation increments/(decrements) and impairment (losses)/reversals | | | 16 | | | | (24 | ) | | | (349 | ) | | | 71 | | | | (333 | ) | | | 56 | | | | — | | | | — | | | | (666 | ) | | | 104 | |
Asset write-downs | | | (257 | ) | | | (479 | ) | | | (33 | ) | | | (31 | ) | | | (10 | ) | | | (8 | ) | | | — | | | | — | | | | (300 | ) | | | (518 | ) |
Actuarial adjustments to liabilities | | | (49 | ) | | | 640 | | | | — | | | | — | | | | — | | | | — | | | | — | | | | — | | | | (49 | ) | | | 640 | |
Deferred income tax equivalents | | | (187 | ) | | | 206 | | | | 148 | | | | (123 | ) | | | 39 | | | | (83 | ) | | | — | | | | — | | | | — | | | | — | |
Dividends and tax equivalents treated as capital returns | | | 595 | | | | 3,133 | | | | — | | | | — | | | | — | | | | — | | | | (595 | ) | | | (3,133 | ) | | | — | | | | — | |
Other | | | (3 | ) | | | 17 | | | | (38 | ) | | | 194 | | | | 1,998 | | | | 1,599 | | | | (3,261 | ) | | | (759 | ) | | | (1,304 | ) | | | 1,051 | |
| | | | | | | | | | |
Continuing Operations Total Other Economic Flows Included in Operating Result | | | 119 | | | | 3,530 | | | | (277 | ) | | | 120 | | | | 420 | | | | 1,605 | | | | (3,856 | ) | | | (3,892 | ) | | | (3,594 | ) | | | 1,362 | |
| | | | | | | | | | |
Continuing Operations Operating Result | | | 1,088 | | | | 3,949 | | | | 1,323 | | | | 1,749 | | | | (838 | ) | | | 504 | | | | (5,662 | ) | | | (5,721 | ) | | | (4,088 | ) | | | 481 | |
| | | | | | | | | | |
Other Economic Flows Other Movements in Equity | | | | | | | | | | | | | | | | | | | | | | | | | | | | | | | | | | | | | | | | |
Adjustments to opening balances | | | — | | | | 3,525 | | | | — | | | | 6 | | | | — | | | | — | | | | — | | | | 21 | | | | — | | | | 3,552 | |
Revaluations | | | 18,889 | | | | (2,033 | ) | | | (982 | ) | | | 113 | | | | (1 | ) | | | 1 | | | | 2,899 | | | | 2,568 | | | | 20,805 | | | | 649 | |
Other | | | (1 | ) | | | — | | | | — | | | | — | | | | — | | | | — | | | | — | | | | — | | | | (1 | ) | | | — | |
Total Other Economic Flows Other Movements in Equity | | | 18,888 | | | | 1,492 | | | | (982 | ) | | | 120 | | | | (1 | ) | | | 1 | | | | 2,899 | | | | 2,588 | | | | 20,803 | | | | 4,201 | |
| | | | | | | | | | |
Comprehensive Result | | | 19,976 | | | | 5,442 | | | | 340 | | | | 1,868 | | | | (839 | ) | | | 505 | | | | (2,763 | ) | | | (3,132 | ) | | | 16,715 | | | | 4,682 | |
* See Note 1(c) for explanation of sectors.
| | | | |
| Audited Consolidated Financial Statements 2015–16 – Government of Queensland | | 6-15 |
Notes to the Financial Statements
| 2. | Disaggregated information continued |
| | | | | | | | | | | | | | | | | | | | | | | | | | | | | | | | | | | | | | | | | | | | | | |
| | | | | | | | | General
Government* | | | Public Non-financial
Corporations* | | | Public
Financial
Corporations* | | | Consolidation
Adjustments | | | Consolidated | |
| | | | | | | | | 2016 | | | 2015 | | | 2016 | | | 2015 | | | 2016 | | | 2015 | | | 2016 | | | 2015 | | | 2016 | | | 2015 | |
| | | | | | | | | $M | | | $M | | | $M | | | $M | | | $M | | | $M | | | $M | | | $M | | | $M | | | $M | |
| | Transactions With Owners In Their Capacity as Owners | | | | | | | | | | | | | | | | | | | | | | | | | | | | | | | | | | | | | | | | |
| | Ordinary dividends provided or paid | | | — | | | | — | | | | (1,696 | ) | | | (1,731 | ) | | | (109 | ) | | | (97 | ) | | | 1,806 | | | | 1,828 | | | | — | | | | — | |
| | Dividends treated as capital returns paid or provided | | | — | | | | — | | | | (595 | ) | | | (3,133 | ) | | | — | | | | — | | | | 595 | | | | 3,133 | | | | — | | | | — | |
| | Equity injections/(withdrawals) | | | — | | | | — | | | | (309 | ) | | | 5 | | | | — | | | | — | | | | 309 | | | | (5 | ) | | | — | | | | — | |
| | Total Transactions With Owners In Their Capacity as Owners | | | — | | | | — | | | | (2,601 | ) | | | (4,859 | ) | | | (109 | ) | | | (97 | ) | | | 2,710 | | | | 4,957 | | | | — | | | | — | |
| | | | | | | | | | | |
| | Total Change In Net Worth | | | 19,976 | | | | 5,442 | | | | (2,260 | ) | | | (2,991 | ) | | | (948 | ) | | | 407 | | | | (53 | ) | | | 1,824 | | | | 16,715 | | | | 4,682 | |
| | | | | | | | | | | |
| | KEY FISCAL AGGREGATES | | | | | | | | | | | | | | | | | | | | | | | | | | | | | | | | | | | | | | | | |
| | | | | | | | | | | |
| | Net Operating Balance | | | 970 | | | | 420 | | | | 1,600 | | | | 1,629 | | | | (1,258 | ) | | | (1,101 | ) | | | (1,806 | ) | | | (1,828 | ) | | | (494 | ) | | | (881 | ) |
| | | | | | | | | | | |
Less | | Net Acquisition/(Disposal) of Non-Financial Assets | | | | | | | | | | | | | | | | | | | | | | | | | | | | | | | | | | | | | | | | |
| | Purchases of non-financial assets | | | 4,092 | | | | 4,635 | | | | 2,773 | | | | 3,173 | | | | 30 | | | | 12 | | | | 34 | | | | 2 | | | | 6,930 | | | | 7,823 | |
| | | | Less | | Sales of non-financial assets | | | 254 | | | | 418 | | | | 45 | | | | 124 | | | | 7 | | | | (1 | ) | | | (6 | ) | | | — | | | | 299 | | | | 541 | |
| | | | Less | | Depreciation | | | 2,927 | | | | 3,137 | | | | 2,346 | | | | 2,358 | | | | 51 | | | | 47 | | | | — | | | | — | | | | 5,325 | | | | 5,542 | |
| | | | Plus | | Change in inventories | | | (37 | ) | | | (59 | ) | | | (35 | ) | | | (12 | ) | | | — | | | | — | | | | — | | | | — | | | | (72 | ) | | | (71 | ) |
| | | | Plus | | Other movement in non-financial assets | | | 556 | | | | (29 | ) | | | 75 | | | | 102 | | | | — | | | | — | | | | — | | | | — | | | | 631 | | | | 72 | |
| | | | Equals | | Total Net Acquisition/(Disposal) of Non-Financial Assets | | | 1,431 | | | | 992 | | | | 422 | | | | 781 | | | | (28 | ) | | | (34 | ) | | | 40 | | | | 2 | | | | 1,865 | | | | 1,741 | |
| | | | | | | | | | | | | |
| | | | Equals | | Fiscal Balance | | | (461 | ) | | | (572 | ) | | | 1,178 | | | | 848 | | | | (1,230 | ) | | | (1,067 | ) | | | (1,846 | ) | | | (1,831 | ) | | | (2,359 | ) | | | (2,622 | ) |
* See Note 1(c) for explanation of sectors.
| | | | |
| 6-16 | | Audited Consolidated Financial Statements 2015–16 – Government of Queensland |
Notes to the Financial Statements
| 2. | Disaggregated information continued |
Balance Sheet
| | | | | | | | | | | | | | | | | | | | | | | | | | | | | | | | | | | | | | | | |
| | | General
Government* | | | Public Non-financial
Corporations* | | | Public Financial
Corporations* | | | Consolidation
Adjustments | | | Consolidated | |
| | | 2016 | | | 2015 | | | 2016 | | | 2015 | | | 2016 | | | 2015 | | | 2016 | | | 2015 | | | 2016 | | | 2015 | |
| | | $M | | | $M | | | $M | | | $M | | | $M | | | $M | | | $M | | | $M | | | $M | | | $M | |
Assets | | | | | | | | | | | | | | | | | | | | | | | | | | | | | | | | | | | | | | | | |
Financial Assets | | | | | | | | | | | | | | | | | | | | | | | | | | | | | | | | | | | | | | | | |
| | | | | | | | | | |
Cash and deposits | | | 1,104 | | | | 1,198 | | | | 1,542 | | | | 2,001 | | | | 1,334 | | | | 2,169 | | | | (2,104 | ) | | | (2,667 | ) | | | 1,876 | | | | 2,701 | |
Receivables and loans | | | | | | | | | | | | | | | | | | | | | | | | | | | | | | | | | | | | | | | | |
Receivables | | | 4,282 | | | | 7,588 | | | | 1,473 | | | | 1,360 | | | | 311 | | | | 248 | | | | (2,140 | ) | | | (5,615 | ) | | | 3,926 | | | | 3,582 | |
Advances paid | | | 632 | | | | 640 | | | | 33 | | | | 41 | | | | — | | | | — | | | | (8 | ) | | | (9 | ) | | | 657 | | | | 672 | |
Loans paid | | | 90 | | | | 96 | | | | 110 | | | | 111 | | | | 90,833 | | | | 89,429 | | | | (80,979 | ) | | | (79,815 | ) | | | 10,054 | | | | 9,821 | |
Securities other than shares | | | 33,522 | | | | 36,050 | | | | 421 | | | | 201 | | | | 52,035 | | | | 57,583 | | | | (30,386 | ) | | | (33,056 | ) | | | 55,592 | | | | 60,778 | |
Shares and other equity investments | | | | | | | | | | | | | | | | | | | | | | | | | | | | | | | | | | | | | | | | |
Investments in public sector entities | | | 20,477 | | | | 23,685 | | | | — | | | | — | | | | — | | | | — | | | | (20,477 | ) | | | (23,685 | ) | | | — | | | | — | |
Investments in other entities | | | 8 | | | | 8 | | | | 267 | | | | 284 | | | | — | | | | — | | | | — | | | | — | | | | 274 | | | | 291 | |
Investments accounted for using equity method | | | 150 | | | | 151 | | | | — | | | | — | | | | — | | | | — | | | | — | | | | — | | | | 150 | | | | 151 | |
Total Financial Assets | | | 60,265 | | | | 69,415 | | | | 3,845 | | | | 3,996 | | | | 144,514 | | | | 149,430 | | | | (136,094 | ) | | | (144,846 | ) | | | 72,530 | | | | 77,995 | |
| | | | | | | | | | |
Non-Financial Assets | | | | | | | | | | | | | | | | | | | | | | | | | | | | | | | | | | | | | | | | |
| | | | | | | | | | |
Inventories | | | 507 | | | | 541 | | | | 654 | | | | 671 | | | | — | | | | — | | | | — | | | | — | | | | 1,161 | | | | 1,212 | |
Assets held for sale | | | 123 | | | | 112 | | | | 7 | | | | 7 | | | | — | | | | — | | | | — | | | | — | | | | 130 | | | | 119 | |
Investment properties | | | 341 | | | | 334 | | | | 319 | | | | 319 | | | | — | | | | — | | | | — | | | | — | | | | 661 | | | | 653 | |
Property, plant and equipment | | | 198,996 | | | | 174,911 | | | | 58,971 | | | | 59,159 | | | | 194 | | | | 240 | | | | (1 | ) | | | (1 | ) | | | 258,161 | | | | 234,309 | |
Intangibles | | | 714 | | | | 713 | | | | 603 | | | | 598 | | | | 31 | | | | 13 | | | | — | | | | — | | | | 1,348 | | | | 1,324 | |
Deferred tax assets | | | 5,972 | | | | 6,233 | | | | 770 | | | | 641 | | | | 43 | | | | 33 | | | | (6,786 | ) | | | (6,908 | ) | | | — | | | | — | |
Other non-financial assets | | | 370 | | | | 337 | | | | 332 | | | | 357 | | | | 9 | | | | 6 | | | | (80 | ) | | | (58 | ) | | | 632 | | | | 641 | |
Total Non-Financial Assets | | | 207,024 | | | | 183,181 | | | | 61,657 | | | | 61,752 | | | | 277 | | | | 292 | | | | (6,866 | ) | | | (6,967 | ) | | | 262,092 | | | | 238,258 | |
| | | | | | | | | | |
Total Assets | | | 267,289 | | | | 252,596 | | | | 65,502 | | | | 65,749 | | | | 144,790 | | | | 149,721 | | | | (142,960 | ) | | | (151,813 | ) | | | 334,622 | | | | 316,254 | |
* See Note 1(c) for explanation of sectors.
| | | | |
| Audited Consolidated Financial Statements 2015–16 – Government of Queensland | | 6-17 |
Notes to the Financial Statements
| 2. | Disaggregated information continued |
| | | | | | | | | | | | | | | | | | | | | | | | | | | | | | | | | | | | | | | | |
| | | General
Government* | | | Public
Non-financial
Corporations* | | | Public Financial
Corporations* | | | Consolidation
Adjustments | | | Consolidated | |
| | | 2016 | | | 2015 | | | 2016 | | | 2015 | | | 2016 | | | 2015 | | | 2016 | | | 2015 | | | 2016 | | | 2015 | |
| | | $M | | | $M | | | $M | | | $M | | | $M | | | $M | | | $M | | | $M | | | $M | | | $M | |
Liabilities | | | | | | | | | | | | | | | | | | | | | | | | | | | | | | | | | | | | | | | | |
| | | | | | | | | | |
Payables | | | 3,596 | | | | 3,255 | | | | 2,825 | | | | 6,158 | | | | 210 | | | | 172 | | | | (2,096 | ) | | | (5,567 | ) | | | 4,535 | | | | 4,019 | |
Employee benefit obligations | | | | | | | | | | | | | | | | | | | | | | | | | | | | | | | | | | | | | | | | |
Superannuation liability | | | 27,360 | | | | 25,869 | | | | (171 | ) | | | (304 | ) | | | — | | | | — | | | | — | | | | — | | | | 27,189 | | | | 25,566 | |
Other employee benefits | | | 5,217 | | | | 4,724 | | | | 696 | | | | 658 | | | | 109 | | | | 101 | | | | — | | | | — | | | | 6,022 | | | | 5,483 | |
Deposits held | | | 3 | | | | 3 | | | | 20 | | | | 27 | | | | 6,834 | | | | 7,722 | | | | (2,104 | ) | | | (2,667 | ) | | | 4,753 | | | | 5,085 | |
Borrowings and advances | | | | | | | | | | | | | | | | | | | | | | | | | | | | | | | | | | | | | | | | |
Advances received | | | 514 | | | | 625 | | | | 8 | | | | 8 | | | | — | | | | — | | | | (8 | ) | | | (9 | ) | | | 514 | | | | 625 | |
Borrowings | | | 35,486 | | | | 43,105 | | | | 36,990 | | | | 31,953 | | | | 294 | | | | 251 | | | | (71,159 | ) | | | (73,256 | ) | | | 1,610 | | | | 2,053 | |
Securities and derivatives | | | — | | | | — | | | | 446 | | | | 175 | | | | 131,285 | | | | 134,666 | | | | (30,385 | ) | | | (33,056 | ) | | | 101,346 | | | | 101,784 | |
Deferred tax liabilities | | | 814 | | | | 674 | | | | 5,955 | | | | 6,187 | | | | 17 | | | | 46 | | | | (6,786 | ) | | | (6,908 | ) | | | — | | | | — | |
Provisions | | | 1,601 | | | | 1,628 | | | | 839 | | | | 861 | | | | 2,723 | | | | 2,500 | | | | (47 | ) | | | (52 | ) | | | 5,115 | | | | 4,937 | |
Other liabilities | | | 790 | | | | 780 | | | | 685 | | | | 556 | | | | 50 | | | | 46 | | | | (76 | ) | | | (55 | ) | | | 1,449 | | | | 1,328 | |
| | | | | | | | | | |
Total Liabilities | | | 75,380 | | | | 80,663 | | | | 48,294 | | | | 46,280 | | | | 141,521 | | | | 145,504 | | | | (112,662 | ) | | | (121,568 | ) | | | 152,532 | | | | 150,879 | |
| | | | | | | | | | |
Net Assets | | | 191,910 | | | | 171,933 | | | | 17,208 | | | | 19,469 | | | | 3,269 | | | | 4,217 | | | | (30,297 | ) | | | (30,245 | ) | | | 182,090 | | | | 165,375 | |
| | | | | | | | | | |
Net Worth | | | | | | | | | | | | | | | | | | | | | | | | | | | | | | | | | | | | | | | | |
| | | | | | | | | | |
Contributed equity | | | — | | | | — | | | | 8,288 | | | | 8,598 | | | | 37 | | | | 37 | | | | (8,326 | ) | | | (8,635 | ) | | | — | | | | — | |
Accumulated surplus/(deficit) | | | 83,672 | | | | 83,982 | | | | (910 | ) | | | 24 | | | | 2,062 | | | | 2,928 | | | | (9,922 | ) | | | (6,661 | ) | | | 74,902 | | | | 80,273 | |
Reserves | | | 108,238 | | | | 87,951 | | | | 9,830 | | | | 10,847 | | | | 1,170 | | | | 1,252 | | | | (12,050 | ) | | | (14,949 | ) | | | 107,188 | | | | 85,102 | |
| | | | | | | | | | |
Total Net Worth | | | 191,910 | | | | 171,933 | | | | 17,208 | | | | 19,469 | | | | 3,269 | | | | 4,217 | | | | (30,297 | ) | | | (30,245 | ) | | | 182,090 | | | | 165,375 | |
| | | | | | | | | | | | | | | | | | | | | | | | | | | | | | | |
KEY FISCAL AGGREGATES | | | | | | | | | | | | | | | | | | | | | | | | | | | | | | | | | | | | | | | | |
| | | | | | | | | | |
Net Financial Worth | | | (15,114 | ) | | | (11,248 | ) | | | (44,449 | ) | | | (42,284 | ) | | | 2,993 | | | | 3,926 | | | | (23,431 | ) | | | (23,278 | ) | | | (80,002 | ) | | | (72,884 | ) |
Net Financial Liabilities | | | 35,591 | | | | 34,933 | | | | N/A | | | | N/A | | | | N/A | | | | N/A | | | | N/A | | | | N/A | | | | 80,002 | | | | 72,884 | |
Net Debt | | | 654 | | | | 5,749 | | | | 35,359 | | | | 29,810 | | | | (5,790 | ) | | | (6,542 | ) | | | 9,820 | | | | 6,559 | | | | 40,043 | | | | 35,575 | |
* See Note 1(c) for explanation of sectors.
| | | | |
| 6-18 | | Audited Consolidated Financial Statements 2015–16 – Government of Queensland |
Notes to the Financial Statements
| 2. | Disaggregated information continued |
| | | | | | | | | | | | | | | | | | | | | | | | | | | | | | | | | | | | | | | | |
| Cash Flow Statement | | | | | | | | | | | | | | | | | | | | | | | | | | | | | | | | | | | | | | | | |
| | | General
Government* | | | Public Non-financial
Corporations* | | | Public
Financial
Corporations* | | | Consolidation
Adjustments | | | Consolidated | |
| | 2016 | | | 2015 | | | 2016 | | | 2015 | | | 2016 | | | 2015 | | | 2016 | | | 2015 | | | 2016 | | | 2015 | |
| | | $M | | | $M | | | $M | | | $M | | | $M | | | $M | | | $M | | | $M | | | $M | | | $M | |
Cash Flows from Operating Activities | | | | | | | | | | | | | | | | | | | | | | | | | | | | | | | | | | | | | | | | |
Cash received | | | | | | | | | | | | | | | | | | | | | | | | | | | | | | | | | | | | | | | | |
Taxes received | | | 12,588 | | | | 12,540 | | | | — | | | | — | | | | — | | | | — | | | | (325 | ) | | | (351 | ) | | | 12,263 | | | | 12,189 | |
Grants and subsidies received | | | 23,891 | | | | 23,495 | | | | 689 | | | | 743 | | | | — | | | | — | | | | (714 | ) | | | (736 | ) | | | 23,867 | | | | 23,503 | |
Sales of goods and services | | | 6,083 | | | | 5,930 | | | | 11,917 | | | | 11,401 | | | | 1,812 | | | | 1,872 | | | | (2,038 | ) | | | (2,024 | ) | | | 17,773 | | | | 17,179 | |
Interest receipts | | | 2,536 | | | | 2,475 | | | | 62 | | | | 68 | | | | 4,940 | | | | 4,786 | | | | (5,975 | ) | | | (6,019 | ) | | | 1,564 | | | | 1,310 | |
Dividends and income tax equivalents | | | 3,754 | | | | 2,091 | | | | 14 | | | | 10 | | | | — | | | | — | | | | (3,748 | ) | | | (2,090 | ) | | | 20 | | | | 11 | |
Other receipts | | | 4,385 | | | | 4,407 | | | | 214 | | | | 248 | | | | 99 | | | | 137 | | | | (10 | ) | | | (16 | ) | | | 4,688 | | | | 4,776 | |
| | | 53,237 | | | | 50,939 | | | | 12,896 | | | | 12,469 | | | | 6,851 | | | | 6,795 | | | | (12,810 | ) | | | (11,235 | ) | | | 60,174 | | | | 58,968 | |
Cash paid | | | | | | | | | | | | | | | | | | | | | | | | | | | | | | | | | | | | | | | | |
Payments for employees | | | (22,830 | ) | | | (21,531 | ) | | | (1,776 | ) | | | (1,707 | ) | | | (279 | ) | | | (257 | ) | | | 307 | | | | 289 | | | | (24,577 | ) | | | (23,206 | ) |
Payments for goods and services | | | (16,459 | ) | | | (15,916 | ) | | | (3,778 | ) | | | (3,937 | ) | | | (77 | ) | | | (194 | ) | | | 1,848 | | | | 1,792 | | | | (18,466 | ) | | | (18,256 | ) |
Grants and subsidies paid | | | (6,750 | ) | | | (6,775 | ) | | | (14 | ) | | | (9 | ) | | | (77 | ) | | | (71 | ) | | | 714 | | | | 736 | | | | (6,128 | ) | | | (6,119 | ) |
Interest paid | | | (2,223 | ) | | | (2,327 | ) | | | (1,832 | ) | | | (1,790 | ) | | | (6,083 | ) | | | (6,194 | ) | | | 6,230 | | | | 6,299 | | | | (3,908 | ) | | | (4,012 | ) |
Other payments | | | (271 | ) | | | (277 | ) | | | (1,558 | ) | | | (1,051 | ) | | | (1,476 | ) | | | (1,512 | ) | | | 992 | | | | 556 | | | | (2,314 | ) | | | (2,285 | ) |
| | | (48,533 | ) | | | (46,826 | ) | | | (8,957 | ) | | | (8,496 | ) | | | (7,993 | ) | | | (8,228 | ) | | | 10,090 | | | | 9,672 | | | | (55,392 | ) | | | (53,878 | ) |
| | | | | | | | | | |
Net Cash Flows from Operating Activities | | | 4,704 | | | | 4,112 | | | | 3,939 | | | | 3,974 | | | | (1,142 | ) | | | (1,433 | ) | | | (2,720 | ) | | | (1,563 | ) | | | 4,782 | | | | 5,090 | |
| | | | | | | | | | |
Cash Flows from Investing Activities | | | | | | | | | | | | | | | | | | | | | | | | | | | | | | | | | | | | | | | | |
Non-Financial Assets | | | | | | | | | | | | | | | | | | | | | | | | | | | | | | | | | | | | | | | | |
Purchases of non-financial assets | | | (4,092 | ) | | | (4,635 | ) | | | (2,773 | ) | | | (3,173 | ) | | | (30 | ) | | | (12 | ) | | | (34 | ) | | | (2 | ) | | | (6,930 | ) | | | (7,823 | ) |
Sales of non-financial assets | | | 254 | | | | 418 | | | | 45 | | | | 124 | | | | 7 | | | | (1 | ) | | | (6 | ) | | | — | | | | 299 | | | | 541 | |
| | | (3,838 | ) | | | (4,217 | ) | | | (2,729 | ) | | | (3,049 | ) | | | (23 | ) | | | (13 | ) | | | (40 | ) | | | (2 | ) | | | (6,630 | ) | | | (7,281 | ) |
| | | | | | | | | | |
Financial Assets (Policy Purposes) | | | 3,348 | | | | 22 | | | | (3,331 | ) | | | — | | | | — | | | | — | | | | (20 | ) | | | (22 | ) | | | (2 | ) | | | — | |
| | | | | | | | | | |
Financial Assets (Liquidity Purposes) | | | 2,540 | | | | (1,283 | ) | | | 20 | | | | 59 | | | | 5,479 | | | | (5,267 | ) | | | (2,671 | ) | | | 1,051 | | | | 5,367 | | | | (5,441 | ) |
| | | | | | | | | | |
Net Cash Flows from Investing Activities | | | 2,050 | | | | (5,478 | ) | | | (6,040 | ) | | | (2,990 | ) | | | 5,456 | | | | (5,280 | ) | | | (2,732 | ) | | | 1,027 | | | | (1,266 | ) | | | (12,722 | ) |
* See Note 1(c) for explanation of sectors.
| | | | |
| Audited Consolidated Financial Statements 2015–16 – Government of Queensland | | 6-19 |
Notes to the Financial Statements
| 2. | Disaggregated information continued |
| | | | | | | | | | | | | | | | | | | | | | | | | | | | | | | | | | | | | | | | | | |
| | | | | General
Government* | | | Public Non-financial
Corporations* | | | Public
Financial
Corporations* | | | Consolidation
Adjustments | | | Consolidated | |
| | | | | 2016 | | | 2015 | | | 2016 | | | 2015 | | | 2016 | | | 2015 | | | 2016 | | | 2015 | | | 2016 | | | 2015 | |
| | | | | $M | | | $M | | | $M | | | $M | | | $M | | | $M | | | $M | | | $M | | | $M | | | $M | |
| | Cash flows from Financing Activities | | | | | | | | | | | | | | | | | | | | | | | | | | | | | | | | | | | | | | | | |
| | Advances received (net) | | | (111 | ) | | | 33 | | | | (1 | ) | | | (1 | ) | | | — | | | | — | | | | — | | | | — | | | | (112 | ) | | | 32 | |
| | Proceeds of borrowing (net) | | | (6,738 | ) | | | 1,626 | | | | 4,461 | | | | 962 | | | | 2,337 | | | | (2,815 | ) | | | (7 | ) | | | (1 | ) | | | 53 | | | | (228 | ) |
| | Dividends paid (net) | | | — | | | | — | | | | (2,669 | ) | | | (1,375 | ) | | | (97 | ) | | | (190 | ) | | | 2,767 | | | | 1,565 | | | | — | | | | — | |
| | Deposits received (net) | | | 1 | | | | 3 | | | | (7 | ) | | | 1 | | | | (889 | ) | | | 2,248 | | | | 563 | | | | (958 | ) | | | (332 | ) | | | 1,292 | |
| | Other financing (net) | | | — | | | | — | | | | (143 | ) | | | (138 | ) | | | (6,499 | ) | | | 6,896 | | | | 2,691 | | | | (1,047 | ) | | | (3,951 | ) | | | 5,710 | |
| | Net Cash Flows from Financing Activities | | | (6,848 | ) | | | 1,661 | | | | 1,642 | | | | (551 | ) | | | (5,149 | ) | | | 6,138 | | | | 6,014 | | | | (442 | ) | | | (4,341 | ) | | | 6,806 | |
| | | | | | | | | | | |
| | Net increase/(decreased) in Cash Held | | | (94 | ) | | | 295 | | | | (458 | ) | | | 432 | | | | (835 | ) | | | (575 | ) | | | 563 | | | | (978 | ) | | | (825 | ) | | | (826 | ) |
| | Cash at the beginning of the financial year | | | 1,198 | | | | 903 | | | | 2,001 | | | | 1,568 | | | | 2,169 | | | | 2,744 | | | | (2,667 | ) | | | (1,689 | ) | | | 2,701 | | | | 3,526 | |
| | Cash and Cash Equivalents Held at the End of the Financial Year | | | 1,104 | | | | 1,198 | | | | 1,542 | | | | 2,001 | | | | 1,334 | | | | 2,169 | | | | (2,104 | ) | | | (2,667 | ) | | | 1,876 | | | | 2,701 | |
| | | | | | | | | | | | | | | | | | | | | | | | | | | | | | | | | | | | | | | | | | |
| | | | | | | | | | | |
| | KEY FISCAL AGGREGATES | | | | | | | | | | | | | | | | | | | | | | | | | | | | | | | | | | | | | | | | |
| | Net Cash from Operating Activities | | | 4,704 | | | | 4,112 | | | | 3,939 | | | | 3,974 | | | | (1,142 | ) | | | (1,433 | ) | | | (2,720 | ) | | | (1,563 | ) | | | 4,782 | | | | 5,090 | |
| | Net Cash Flow from Investments in Non-Financial Assets | | | (3,838 | ) | | | (4,217 | ) | | | (2,729 | ) | | | (3,049 | ) | | | (23 | ) | | | (13 | ) | | | (40 | ) | | | (2 | ) | | | (6,630 | ) | | | (7,281 | ) |
| | Dividends Paid | | | — | | | | — | | | | (2,669 | ) | | | (1,375 | ) | | | (97 | ) | | | (190 | ) | | | 2,767 | | | | 1,565 | | | | — | | | | — | |
| | CASH SURPLUS/(DEFICIT) | | | 866 | | | | (105 | ) | | | (1,459 | ) | | | (450 | ) | | | (1,263 | ) | | | (1,636 | ) | | | 7 | | | | — | | | | (1,849 | ) | | | (2,191 | ) |
* See Note 1(c) for explanation of sectors.
| | | | |
| 6-20 | | Audited Consolidated Financial Statements 2015–16 – Government of Queensland |
Notes to the Financial Statements
| | | | | | | | | | | | | | | | | | |
| | | |
| General Government
Sector |
| |
| Total State
Sector |
|
| | | | | 2016 | | | 2015 | | | 2016 | | | 2015 | |
| | | | | $M | | | $M | | | $M | | | $M | |
| 3. | | Taxation revenue | | | | | | | | | | | | | | | | |
| | | | | |
| | Stamp Duties | | | | | | | | | | | | | | | | |
| | Transfer | | | 3,005 | | | | 3,082 | | | | 3,005 | | | | 3,082 | |
| | Motor vehicles | | | 504 | | | | 483 | | | | 504 | | | | 483 | |
| | Insurance | | | 816 | | | | 822 | | | | 816 | | | | 822 | |
| | Other duties | | | 20 | | | | 60 | | | | 20 | | | | 60 | |
| | | | | 4,344 | | | | 4,448 | | | | 4,344 | | | | 4,448 | |
| | | | | |
| | Payroll tax | | | 3,712 | | | | 3,804 | | | | 3,610 | | | | 3,703 | |
| | Vehicle registration fees | | | 1,633 | | | | 1,571 | | | | 1,633 | | | | 1,570 | |
| | Gaming taxes and levies | | | 1,138 | | | | 1,077 | | | | 1,138 | | | | 1,077 | |
| | Land tax | | | 1,010 | | | | 977 | | | | 993 | | | | 959 | |
| | Fire levy | | | 457 | | | | 435 | | | | 457 | | | | 435 | |
| | Guarantee fees | | | 201 | | | | 232 | | | | — | | | | — | |
| | Other taxes | | | 51 | | | | 52 | | | | 51 | | | | 52 | |
| | | | | 12,547 | | | | 12,598 | | | | 12,226 | | | | 12,245 | |
| | | | | | | | | | | | | | | |
| | | | | |
| | Taxation revenue is recognised when one or more of the following events are satisfied: | | | | | | | | | | | | | | | | |
| | - the underlying transaction or event which gives rise to the right to collect the revenue occurs and can be measured reliably; | | | | | | | | | | | | | | | | |
| | - the assessment is raised by the self-assessor (a person who lodges transactions online); and/or | | | | | | | | | | | | | | | | |
| | - the assessment is issued as a result of Commissioner-assessed transactions or following compliance activities such as reviews and audits. | | | | | | | | | | | | | | | | |
| | | | | |
| 4. | | Grants revenue | | | | | | | | | | | | | | | | |
| | | | | |
| | Commonwealth | | | | | | | | | | | | | | | | |
| | General purpose payments | | | | | | | | | | | | | | | | |
| | GST revenue grants | | | 13,122 | | | | 11,816 | | | | 13,122 | | | | 11,816 | |
| | Other general purpose payments | | | 19 | | | | 2 | | | | 21 | | | | 19 | |
| | Specific purpose payments | | | 5,948 | | | | 5,442 | | | | 5,951 | | | | 5,445 | |
| | National partnership payments | | | 1,838 | | | | 3,056 | | | | 1,838 | | | | 3,056 | |
| | Grants for on-passing to non-Queensland Government entities | | | 2,465 | | | | 2,824 | | | | 2,465 | | | | 2,824 | |
| | | | | 23,392 | | | | 23,140 | | | | 23,397 | | | | 23,160 | |
| | | | | |
| | Other | | | | | | | | | | | | | | | | |
| | Other grants | | | 197 | | | | 254 | | | | 151 | | | | 212 | |
| | Industry/community contributions | | | 151 | | | | 189 | | | | 198 | | | | 229 | |
| | | | | 348 | | | | 443 | | | | 349 | | | | 441 | |
| | | | | 23,740 | | | | 23,583 | | | | 23,746 | | | | 23,601 | |
| | | | | | | | | | | | | | | |
| | Commonwealth and other grants are recognised as revenue when the State obtains control over the grant, usually upon receipt. Where the grant is of a reciprocal nature, revenue is recognised as and when the obligation is fulfilled. | | | | | | | | | | | | | | | | |
| | | | | |
| 5. | | Sales of goods and services | | | | | | | | | | | | | | | | |
| | | | | |
| | User charges | | | | | | | | | | | | | | | | |
| | Sale of goods and services | | | 3,999 | | | | 3,662 | | | | 14,221 | | | | 13,432 | |
| | Rental income | | | 546 | | | | 514 | | | | 706 | | | | 668 | |
| | | | | 4,545 | | | | 4,176 | | | | 14,927 | | | | 14,101 | |
| | | | | |
| | Fees | | | | | | | | | | | | | | | | |
| | Transport and other licences and permits | | | 709 | | | | 653 | | | | 708 | | | | 653 | |
| | Other regulatory fees | | | 672 | | | | 615 | | | | 693 | | | | 632 | |
| | | | | 1,381 | | | | 1,268 | | | | 1,400 | | | | 1,285 | |
| | | | | 5,926 | | | | 5,443 | | | | 16,327 | | | | 15,386 | |
| | | | | | | | | | | | | | | |
| | To the extent practicable, revenue from the sale of goods and services, fines and regulatory fees is recognised when the transactions or events giving rise to the revenue occur. | | | | | | | | | | | | | | | | |
| | | | | |
| | When revenue has been received in advance for services or works still to be completed at balance date, this revenue is considered to be unearned and is reported in other liabilities (refer Note 39). | | | | | | | | | | | | | | | | |
| | | | |
| Audited Consolidated Financial Statements 2015–16 – Government of Queensland | | 6-21 |
Notes to the Financial Statements
| | | | | | | | | | | | | | | | | | |
| | | | | General Government
Sector | | | Total State
Sector | |
| | | | | 2016 | | | 2015 | | | 2016 | | | 2015 | |
| | | | | $M | | | $M | | | $M | | | $M | |
| 6. | | Interest income | | | | | | | | | | | | | | | | |
| | | | | |
| | Interest | | | 2,543 | | | | 2,470 | | | | 1,565 | | | | 1,358 | |
| | | | | | | | | | | | | | | |
| | Interest revenue from financial assets other than those at fair value through profit and loss totalled: | | | 2,505 | | | | 2,384 | | | | 141 | | | | 132 | |
| | | | | |
| 7. | | Dividend and income tax equivalents income | | | | | | | | | | | | | | | | |
| | | | | |
| | Dividends | | | 1,811 | | | | 1,833 | | | | 20 | | | | 15 | |
| | Income tax equivalents | | | 851 | | | | 722 | | | | — | | | | — | |
| | | | | 2,661 | | | | 2,554 | | | | 20 | | | | 15 | |
| | | | | | | | | | | | | | | |
| | For the GGS, dividends from PNFC and PFC sector entities are recorded as revenue from transactions where the dividends are declared out of current profits. Dividends paid out of prior accumulated profits and reserves or from the sale of businesses represent a return of Government’s initial equity investment under ABS GFS principles and are disclosed as other economic flows (refer Note 19). | | | | | | | | | | | | | | | | |
| | | | | |
| | Dividends from the PNFC and PFC sectors are eliminated in the Total State Sector. | | | | | | | | | | | | | | | | |
| | | | | |
| 8. | | Other revenue | | | | | | | | | | | | | | | | |
| | | | | |
| | Royalties | | | 2,122 | | | | 21,058 | | | | 2,122 | | | | 2,058 | |
| | Land rents | | | 162 | | | | 166 | | | | 163 | | | | 166 | |
| | Donations, gifts and services received at below fair value | | | 138 | | | | 116 | | | | 138 | | | | 117 | |
| | Contributed assets | | | 308 | | | | 314 | | | | 383 | | | | 407 | |
| | Fines | | | 514 | | | | 408 | | | | 514 | | | | 408 | |
| | Other | | | 333 | | | | 261 | | | | 655 | | | | 551 | |
| | | | | 3,577 | | | | 3,322 | | | | 3,974 | | | | 3,706 | |
| | | | | | | | | | | | | | | |
| | Royalties are recognised when one or more of the following events are satisfied: | | | | | | | | | | | | | | | | |
| | - the underlying transaction or event which gives rise to the right to collect the revenue occurs and can be measured reliably; | | | | | | | | | | | | | | | | |
| | - the assessment is raised by the self-assessor (a person who lodges transactions online); and/or | | | | | | | | | | | | | | | | |
| | - the assessment is issued as a result of Commissioner-assessed transactions or following compliance activities such as reviews and audits. | | | | | | | | | | | | | | | | |
| | | | | |
| | Assets received at below fair value, including those received free of charge and that can be measured reliably, are recognised as revenue at their fair value when control over the assets is obtained, normally either on receipt of the assets or on notification that the assets have been secured. | | | | | | | | | | | | | | | | |
| | | | | |
| 9. | | Employee expenses | | | | | | | | | | | | | | | | |
| | | | | |
| | Salaries and wages | | | 17,476 | | | | 16,241 | | | | 19,035 | | | | 17,679 | |
| | Annual leave | | | 1,669 | | | | 1,477 | | | | 1,806 | | | | 1,600 | |
| | Long service leave | | | 463 | | | | 486 | | | | 527 | | | | 526 | |
| | Other employee related expenses | | | 436 | | | | 388 | | | | 265 | | | | 282 | |
| | | | | 20,044 | | | | 18,592 | | | | 21,632 | | | | 20,086 | |
| | | | | | | | | | | | | | | |
| 10. | | Other superannuation expenses | | | | | | | | | | | | | | | | |
| | (refer Note 48 for additional disclosures) | | | | | | | | | | | | | | | | |
| | | | | |
| | Accumulation contribution | | | 1,562 | | | | 1,385 | | | | 1,743 | | | | 1,554 | |
| | Defined benefit service cost | | | 946 | | | | 934 | | | | 983 | | | | 977 | |
| | | | | 2,507 | | | | 2,319 | | | | 2,726 | | | | 2,531 | |
| | | | | | | | | | | | | | | |
| | | | |
| 6-22 | | Audited Consolidated Financial Statements 2015–16 – Government of Queensland |
Notes to the Financial Statements
| | | | | | | | | | | | | | | | | | |
| | | | | General Government Sector | | | Total State
Sector | |
| | | | | 2016 | | | 2015 | | | 2016 | | | 2015 | |
| | | | | $M | | | $M | | | $M | | | $M | |
11. | | Other operating expenses | | | | | | | | | | | | | | | | |
| | | | | |
| | Supplies and services | | | 14,211 | | | | 13,783 | | | | 15,903 | | | | 15,247 | |
| | Workcover Qld and other claims | | | 122 | | | | 94 | | | | 1,539 | | | | 1,225 | |
| | Other expenses | | | 667 | | | | 661 | | | | 667 | | | | 614 | |
| | | | | 15,000 | | | | 14,539 | | | | 18,109 | | | | 17,086 | |
| | | | | | | | | | | | | | | |
| | Audit fees charged by the Queensland Audit Office to entities included
in these financial statements amounted to: | | | 15 | | | | 15 | | | | 21 | | | | 21 | |
| | | | | |
12. | | Depreciation and amortisation | | | | | | | | | | | | | | | | |
| | | | | |
| | Depreciation and amortisation expenses for the financial year were charged
in respect of: | | | | | | | | | | | | | | | | |
| | Buildings | | | 1,328 | | | | 1,267 | | | | 1,436 | | | | 1,381 | |
| | Infrastructure | | | 836 | | | | 1,119 | | | | 2,607 | | | | 2,890 | |
| | Plant and equipment | | | 525 | | | | 524 | | | | 856 | | | | 836 | |
| | Major plant and equipment | | | 25 | | | | 29 | | | | 94 | | | | 149 | |
| | Heritage and cultural assets | | | 29 | | | | 5 | | | | 29 | | | | 5 | |
| | Leased plant and equipment | | | 54 | | | | 44 | | | | 100 | | | | 59 | |
| | Software development | | | 132 | | | | 148 | | | | 232 | | | | 254 | |
| | Capitalised depreciation expense | | | — | | | | — | | | | (29 | ) | | | (33 | ) |
| | | | | 2,927 | | | | 3,137 | | | | 5,325 | | | | 5,542 | |
| | | | | | | | | | | | | | | |
A number of assets held by the State have been determined to have indefinite useful lives and are therefore not depreciated. Such assets include land, certain formation earthworks under roads, the Reference Collection of the Library Board of Queensland, the Art Collection and Library Heritage Collection held by the Queensland Art Gallery Board of Trustees, the State Collection and Library Heritage Collection of the Board of the Queensland Museum and certain other heritage and cultural assets that are subject to preservation requirements to maintain these assets in perpetuity.
Other non-financial assets are depreciated or amortised on a straight-line basis from their date of acquisition (or in respect of internally constructed assets, from the time the asset is completed and held ready for use) and based on their estimated useful lives to the agency.
Where assets have separately identifiable components that are subject to regular replacement, these components are assigned useful lives distinct from the asset to which they relate and are depreciated accordingly. Any expenditure which increases the originally assessed capacity or service potential of an asset is capitalised and the new depreciable value is depreciated over the remaining useful life of the asset.
Leasehold improvements are amortised over the estimated useful lives of the improvements or the unexpired period of the lease, whichever is shorter. The unexpired period of the lease includes any option period where exercise of the option is probable.
Capital work in progress is not depreciated until it reaches service delivery capacity.
Major spares purchased specifically for particular assets are capitalised and depreciated on the same basis as the asset to which they relate.
Estimated useful lives, residual values and depreciation methods are reviewed at the end of each annual reporting period.
Reference should be made to individual agency reports for details of depreciation and amortisation methodologies. The following provides an indication of the estimated useful lives of the different non-financial asset classes held by the State:
| | | | |
Asset class | | Useful life | |
Property, plant and equipment | | | | |
Buildings | | | 1 - 166 years | |
Plant and equipment | | | 1 - 100 years | |
Infrastructure assets | | | up to 200 years | |
| Heritage and cultural assets | | | 7 - 125 years | |
| |
Intangibles | | | | |
Computer software | | | 1 - 25 years | |
Other intangibles (including intellectual property, licences and access rights) | | | 1 - 150 years | |
| | | | |
| Audited Consolidated Financial Statements 2015–16 – Government of Queensland | | 6-23 |
Notes to the Financial Statements
| | | | | | | | | | | | | | | | | | |
| | | | | General Government
Sector | | | Total State
Sector | |
| | | | | 2016 | | | 2015 | | | 2016 | | | 2015 | |
| | | | | $M | | | $M | | | $M | | | $M | |
| 13. | | Other interest expense | | | | | | | | | | | | | | | | |
| | | | | |
| | Interest | | | 2,114 | | | | 2,228 | | | | 3,737 | | | | 3,872 | |
| | Finance charges relating to finance leases | | | 79 | | | | 74 | | | | 81 | | | | 76 | |
| | Other | | | 27 | | | | 26 | | | | 29 | | | | 31 | |
| | | | | 2,220 | | | | 2,328 | | | | 3,847 | | | | 3,978 | |
| | | | | | | | | �� | | | | | | |
| | Interest expense on financial liabilities other than those at fair value through profit and loss amounts to: | | | 2,220 | | | | 2,328 | | | | 173 | | | | 141 | |
| | | | | |
| 14. | | Grants expenses | | | | | | | | | | | | | | | | |
| | | | | |
| | Grants - recurrent | | | 4,696 | | | | 4,836 | | | | 4,674 | | | | 4,818 | |
| | Grants - capital | | | 1,048 | | | | 2,029 | | | | 1,023 | | | | 2,018 | |
| | Grants to first home owners | | | 95 | | | | 92 | | | | 95 | | | | 92 | |
| | Personal benefit payments | | | 166 | | | | 166 | | | | 166 | | | | 166 | |
| | Community service obligations | | | 554 | | | | 634 | | | | — | | | | — | |
| | | | | 6,559 | | | | 7,758 | | | | 5,958 | | | | 7,094 | |
| | | | | | | | | | | | | | | |
| 15. | | Gains/(losses) on sale of assets/settlement of liabilities | | | | | | | | | | | | | | | | |
| | | | | |
| | Gains/(losses) on sale of financial assets/liabilities | | | | | | | | | | | | | | | | |
| | Gains/(losses) on sale of available-for-sale financial assets | | | 1 | | | | 1 | | | | 1 | | | | 2 | |
| | Gains/(losses) on sale of derivatives | | | — | | | | — | | | | (723 | ) | | | (25 | ) |
| | Gains/(losses) on sale of other investments/settlement of liabilities | | | — | | | | — | | | | (551 | ) | | | 65 | |
| | | | | |
| | Gains/(losses) on sale of non-financial assets | | | | | | | | | | | | | | | | |
| | Gains/(losses) on sale of investment property | | | (1 | ) | | | — | | | | (2 | ) | | | — | |
| | Gains/(losses) on sale of non-financial assets | | | 4 | | | | 36 | | | | 1 | | | | 44 | |
| | | | | 3 | | | | 37 | | | | (1,275 | ) | | | 86 | |
| | | | | | | | | | | | | | | |
| 16. | | Revaluation increments/(decrements) and impairment (losses)/reversals | | | | | | | | | | | | | | | | |
| | | | | |
| | Revaluation increments/(decrements) of financial assets | | | | | | | | | | | | | | | | |
| | Revaluation increments/(decrements) - derivatives | | | (2 | ) | | | (6 | ) | | | (120 | ) | | | (49 | ) |
| | Revaluation increments/(decrements) - other investments | | | 2 | | | | 11 | | | | (217 | ) | | | 135 | |
| | | | | — | | | | 6 | | | | (337 | ) | | | 85 | |
| | Revaluation increments/(decrements) of non-financial assets | | | | | | | | | | | | | | | | |
| | Revaluation increments/(decrements) - investment property | | | 6 | | | | 127 | | | | (1 | ) | | | 135 | |
| | Revaluation increments/(decrements) - other non-current assets | | | 18 | | | | (43 | ) | | | (119 | ) | | | (28 | ) |
| | | | | 24 | | | | 84 | | | | (120 | ) | | | 107 | |
| | Revaluation increments/(decrements) - environmental certificates/obligations | �� | | — | | | | — | | | | (8 | ) | | | 19 | |
| | | | | |
| | Revaluation increments/(decrements) - self generating and regenerating assets | | | 5 | | | | 2 | | | | 5 | | | | 2 | |
| | | | | |
| | Impairment (losses)/reversals | | | | | | | | | | | | | | | | |
| | Impairment (losses)/reversals - receivables and loans | | | 5 | | | | (111 | ) | | | (81 | ) | | | (133 | ) |
| | Impairment (losses)/reversals - financial assets at fair value through profit and loss | | | (1 | ) | | | — | | | | (1 | ) | | | — | |
| | Impairment (losses)/reversals - assets held for sale | | | — | | | | (4 | ) | | | — | | | | (4 | ) |
| | Impairment (losses)/reversals - non-financial assets | | | — | | | | — | | | | (107 | ) | | | 29 | |
| | Impairment (losses)/reversals - intangible assets | | | (17 | ) | | | (1 | ) | | | (17 | ) | | | (1 | ) |
| | | | | (13 | ) | | | (116 | ) | | | (206 | ) | | | (109 | ) |
| | | | | 16 | | | | (24 | ) | | | (666 | ) | | | 104 | |
| | | | | | | | | | | | | | | |
At each reporting date, an assessment is undertaken as to whether there are any indications that a physical or intangible asset is impaired. An impairment loss is recognised when an asset’s carrying amount exceeds its recoverable amount. The recoverable amount of the impaired asset is determined as the higher of the asset’s fair value less costs to sell and value in use. Value in use is based on discounted cash flows using a risk adjusted discount rate where assets are held primarily for the generation of cash flows or otherwise, depreciated replacement cost.
| | | | |
| 6-24 | | Audited Consolidated Financial Statements 2015–16 – Government of Queensland |
Notes to the Financial Statements
| 16. | Revaluation increments/(decrements) and impairment (losses)/reversals continued |
The carrying values of assets that have previously been impaired are assessed annually to determine if there has been a reversal in impairment. Where this exists, the impairment is reversed only to the extent that the re-assessed value does not exceed the original carrying value net of the depreciation and amortisation. Impairment on goodwill is not reversed.
Estimates and judgements are continually evaluated and are based on historical experience and other factors, including expectations of future events that may have a financial impact on the State and that are believed to be reasonable under the circumstances. The resulting accounting estimates will, by definition, seldom equal the related actual results. The estimates and assumptions that have a significant risk of causing a material adjustment to the carrying amount of assets and liabilities within the next financial year are discussed below.
Impairment - electricity generators
The value-in-use of electricity generators is determined on the estimated future cash flows based on the continuing use of the asset, discounted to a present value.
The cash flow projections are prepared using forecast economic, market and industry trends, market based assumptions (such as demand, pricing and operational costs), and capital expenditure programs that willing market participants might reasonably adopt. The present value of projected cash flows is determined using a discount rate. Determination of the weighted-average cost of capital (WACC) is based on separate analysis of debt and equity costs, utilising publicly available information including the risk free interest rate, an industry risk premium, and the underlying cost of debt.
CS Energy recognised asset impairment adjustments of $73 million in the 2015-16 financial year. The charge principally relates to the full impairment of property, plant and equipment in respect to the Solar Boost project. The decision not to complete the project was made due to a number of technical and contractual difficulties encountered during construction and the resultant negative impact on the project’s commercial prospects.
Impairment - water assets
On 1 January 2013, the businesses of the former Queensland Bulk Water Transport Authority (LinkWater) and the SEQ Water Grid Manager were transferred into the Queensland Bulk Water Supply Authority (Seqwater) by regulation under the South East Queensland Water (Restructuring) Act 2007 (Restructuring Act).
Seqwater charges South East Queensland distributor-retailers, local governments and other customers for the supply of bulk water, with bulk water prices passed through to customers. From 1 July 2008, a price path was implemented to phase-in price rises associated with the construction of the South East Queensland water grid. Under the price path, prices progressively transition to full cost recovery over a ten year period ending in 2017-18, with the under-recovery of costs during this period funded by debt. Price path debt will be repaid over the following ten year period ending in 2027-28.
In April 2013, the Government announced a revised bulk water price path which reflected a range of measures to lower costs (and moderate price increases), which included:
| | - | | removing the previous requirement to build additional infrastructure in the foreseeable future from the regional water security program for South East Queensland; and |
| | - | | reduced administrative costs resulting from the merger of the bulk water entities. |
The bulk water prices charged by Seqwater are a function of the bulk water price path, which is calculated using generally accepted regulated pricing principles. At the end of the ten year price path in 2017-18, all councils in South East Queensland will be at the ‘common price’, paying the same bulk water prices. Price setting periods have included a two year period from 2007-08, a three year period from 2010-13 and more recently another two year period from 2013-15 including indicative prices for the following three years.
In May 2014, the Queensland Competition Authority (QCA), the State’s independent economic regulator, was tasked with recommending prices for the next three years of the price path, 2015-16 to 2017-18. The QCA’s review included, but was not limited to, assessing Seqwater’s future and proposed capital expenditure to ensure this expenditure is both prudent and efficient. Both Seqwater (in their submission to the QCA as part of the review) and the QCA identified efficiencies and cost savings. As a result, the recommended ‘common price’ for 2017-18 is 12 per cent lower than the indicative ‘common price’ introduced in 2013. The Government accepted the QCA’s recommendations and a decision notification was gazetted on 3 July 2015.
The result is that Seqwater’s customers have certainty in regard to prices, and Seqwater has a higher degree of certainty in regard to its primary revenue stream. Bulk water price revenue is a function of price and usage (the bulk water price is a completely volumetric charge), and as such future revenues will depend on water demand as well as price.
Seqwater has performed an impairment assessment on its bulk water asset base reflecting the three most likely bulk water pricing scenarios up to and post 2028. This represents a change from the prior year single pricing scenario of escalating 2.5 per cent CPI into perpetuity post 2028. The impairment assessment resulted in Seqwater reporting a $204 million decrement against dams and weirs, a $255 million decrement against water treatment plants and a $248 million decrement against pipelines and other. Of this, $474 million was recognised as a decrease in the asset revaluation surplus.
| | | | |
| Audited Consolidated Financial Statements 2015–16 – Government of Queensland | | 6-25 |
Notes to the Financial Statements
| 16. | Revaluation increments/(decrements) and impairment (losses)/reversals continued |
Impairment of financial assets
A financial asset is considered to be impaired if objective evidence indicates that one or more events have had a negative effect on the estimated future cash flow of that asset.
Evidence of impairment may include significant financial difficulties of the debtor, the probability that the debtor will enter bankruptcy or financial reorganisation and payment default or delinquency in interest or principal payments. All financial assets, except for those measured at fair value through profit or loss, are subject to annual review for impairment, in accordance with AASB 139. The amount of the impairment loss is recognised in other economic flows included in the operating result. Receivables are assessed regularly for bad and doubtful debts. Bad debts are written off as they are incurred.
For financial assets carried at amortised cost, the carrying amount of the asset is reduced through the use of a provision account and the amount of the loss is measured as the difference between the asset’s carrying amount and the present value of estimated future cash flows, discounted at the effective interest rate. The adjustment is recognised in other economic flows included in the operating result.
An impairment loss is reversed if the reversal can be related objectively to an event occurring after the impairment loss was recognised. For financial assets measured at amortised cost, the reversal is recognised in other economic flows included in the operating result.
| | | | | | | | | | | | | | | | | | |
| | | | | General Government
Sector | | | Total State Sector | |
| | | | | 2016 | | | 2015 | | | 2016 | | | 2015 | |
| | | | | $M | | | $M | | | $M | | | $M | |
| 17. | | Asset write-downs | | | | | | | | | | | | | | | | |
| | | | | |
| | Bad debts written off not previously impaired | | | (85 | ) | | | (80 | ) | | | (127 | ) | | | (99 | ) |
| | Inventory write-down (net) | | | (10 | ) | | | (9 | ) | | | (11 | ) | | | (28 | ) |
| | Other assets written off/scrapped | | | (162 | ) | | | (391 | ) | | | (162 | ) | | | (391 | ) |
| | | | | (257 | ) | | | (479 | ) | | | (300 | ) | | | (518 | ) |
| | | | | | | | | | | | | | | |
| 18. | | Actuarial adjustments to liabilities | | | | | | | | | | | | | | | | |
| | | | | |
| | Long service leave - gains/(losses) | | | (120 | ) | | | 512 | | | | (120 | ) | | | 512 | |
| | Insurances and other - gains/(losses) | | | 70 | | | | 128 | | | | 70 | | | | 128 | |
| | | | | (49 | ) | | | 640 | | | | (49 | ) | | | 640 | |
| | | | | | | | | | | | | | | |
| 19. | | Dividends and tax equivalents treated as capital returns | | | | | | | | | | | | | | | | |
| | | | | |
| | Dividends | | | 595 | | | | 3,133 | | | | — | | | | — | |
| | | | | 595 | | | | 3,133 | | | | — | | | | — | |
| | | | | | | | | | | | | | | |
| | For GGS, dividends and tax equivalents from PNFC and PFC sector entities paid out of prior accumulated profits and reserves or from the sale of businesses represent a return of Government’s initial equity investment under ABS GFS principles and are disclosed as other economic flows. | | | | | | | | | | | | | | | | |
| | | | | |
| | There were no tax equivalents treated as capital returns in 2015-16 or 2014-15. | | | | | | | | | | | | | | | | |
| | | | | |
| | Dividends and tax equivalents treated as capital returns from the PNFC and PFC sectors are eliminated in the Total State Sector. | | | | | | | | | | | | | | | | |
| | | | | |
| 20. | | Other economic flows - included in operating result - other | | | | | | | | | | | | | | | | |
| | | | | |
| | Net market value interest revenue/(expense) | | | 3 | | | | 9 | | | | (1,260 | ) | | | 846 | |
| | Time value adjustments | | | (2 | ) | | | 8 | | | | (55 | ) | | | (36 | ) |
| | Share of net profit/(loss) of associates and joint ventures accounted for using the equity method | | | (2 | ) | | | (2 | ) | | | (2 | ) | | | (2 | ) |
| | Onerous contracts expense | | | — | | | | — | | | | 22 | | | | 248 | |
| | Other economic flows nec | | | (2 | ) | | | 2 | | | | (9 | ) | | | (5 | ) |
| | | | | (3 | ) | | | 17 | | | | (1,304 | ) | | | 1,051 | |
| | | | | | | | | | | | | | | |
| | | | |
| 6-26 | | Audited Consolidated Financial Statements 2015–16 – Government of Queensland |
Notes to the Financial Statements
| | | | | | | | | | | | | | | | | | |
| | | | | General Government Sector | | | Total State Sector | |
| | | | | 2016 | | | 2015 | | | 2016 | | | 2015 | |
| | | | | $M | | | $M | | | $M | | | $M | |
| 21. | | Other economic flows - other movements in equity - revaluations | | | | | | | | | | | | | | | | |
| | | | | |
| | Revaluations of financial assets - increments/(decrements) | | | | | | | | | | | | | | | | |
| | Available-for-sale financial assets | | | 3 | | | | (1 | ) | | | 3 | | | | (1 | ) |
| | Investments | | | (2,428 | ) | | | (2,561 | ) | | | (2 | ) | | | 7 | |
| | Cash flow hedges | | | (53 | ) | | | (17 | ) | | | (169 | ) | | | (42 | ) |
| | | | | (2,478 | ) | | | (2,580 | ) | | | (168 | ) | | | (37 | ) |
| | Revaluations of non-financial assets - increments/(decrements) | | | | | | | | | | | | | | | | |
| | Property, plant and equipment | | | 22,774 | | | | 852 | | | | 22,464 | | | | 867 | |
| | Intangible assets | | | — | | | | 2 | | | | — | | | | 2 | |
| | | | | 22,774 | | | | 854 | | | | 22,464 | | | | 869 | |
| | | | | |
| | Actuarial gain/(loss) on defined benefit superannuation plans | | | (1,408 | ) | | | (307 | ) | | | (1,491 | ) | | | (183 | ) |
| | | | | 18,889 | | | | (2,033 | ) | | | 20,805 | | | | 649 | |
| | | | | | | | | | | | | | | |
| 22. | | Other economic flows - other movements in equity - other | | | | | | | | | | | | | | | | |
| | | | | |
| | Equity transfers and adjustments including those from ceased entities | | | (1 | ) | | | — | | | | (1 | ) | | | — | |
| | | | | | | | | | | | | | | |
| 23. | | Cash and deposits | | | | | | | | | | | | | | | | |
| | | | | |
| | Cash | | | 49 | | | | 79 | | | | 503 | | | | 382 | |
| | Deposits on call | | | 104 | | | | 159 | | | | 1,373 | | | | 2,318 | |
| | QTC cash funds | | | 951 | | | | 960 | | | | — | | | | — | |
| | | | | 1,104 | | | | 1,198 | | | | 1,876 | | | | 2,701 | |
| | | | | | | | | | | | | | | |
| | Reconciliation to Cash Flow Statement | | | | | | | | | | | | | | | | |
| | | | | |
| | Balances as above | | | 1,104 | | | | 1,198 | | | | 1,876 | | | | 2,701 | |
| | Balances per Cash Flow Statement | | | 1,104 | | | | 1,198 | | | | 1,876 | | | | 2,701 | |
| | | | | | | | | | | | | | | |
All material cash balances held by agencies are managed and invested by QTC daily to maximise returns in accordance with agreed risk profiles on a whole of Government basis.
Cash and deposits includes cash on hand, cash at bank, deposits at call (which are readily convertible to cash on hand and are subject to an insignificant risk of changes in value) and money market deposits net of outstanding bank overdrafts. Where a net overdraft arises on cash at bank, the overdraft is included in borrowings on the Balance Sheet.
Receivables and loans are non-derivative financial assets with fixed or determinable payments that are not quoted in an active market. Loans include finance leases and loans supporting policy objectives of the Government rather than for liquidity management purposes. Settlement on finance leases is within the terms of the lease, ranging from 2 to 99 years. Title is passed to the purchaser on full repayment.
Receivables and loans are initially measured at fair value plus any directly attributable transaction costs. Subsequently, receivables and loans (except onlendings) are recorded at amortised cost using the effective interest method less any impairment losses (receivables and loans are assessed periodically for impairment). The effective interest rate is the rate that exactly discounts estimated future cash flows over the expected life of a financial instrument (or when appropriate, a shorter period) to the net carrying amount of that instrument. Onlendings are recognised at fair value through profit or loss.
Any interest income is recognised in the operating result in the period in which it accrues. For further details on the State revenue recognition, refer to the relevant revenue notes (Notes 3 to 8) and Note 16 for impairment.
| | | | |
| Audited Consolidated Financial Statements 2015–16 – Government of Queensland | | 6-27 |
Notes to the Financial Statements
| | | | | | | | | | | | | | | | | | |
| | | | | General Government
Sector | | | Total State Sector | |
| | | | | 2016 | | | 2015 | | | 2016 | | | 2015 | |
| | | | | $M | | | $M | | | $M | | | $M | |
| 24. | | Receivables and loans continued | | | | | | | | | | | | | | | | |
| | | | | |
| | (a) Receivables | | | | | | | | | | | | | | | | |
| | Current | | | | | | | | | | | | | | | | |
| | Trade debtors | | | 976 | | | | 880 | | | | 2,434 | | | | 2,160 | |
| | Interest receivable | | | 65 | | | | 58 | | | | 20 | | | | 23 | |
| | GST input tax credits receivable | | | 235 | | | | 250 | | | | 262 | | | | 271 | |
| | Dividends and guarantee fees receivable | | | 1,501 | | | | 5,005 | | | | — | | | | — | |
| | Royalties and land rents revenue receivable | | | 175 | | | | 40 | | | | 175 | | | | 40 | |
| | Taxes receivable | | | 252 | | | | 288 | | | | 256 | | | | 292 | |
| | Income tax equivalents receivable | | | 312 | | | | 444 | | | | — | | | | — | |
| | Other receivables | | | 1,275 | | | | 1,126 | | | | 1,258 | | | | 1,194 | |
| | | | | 4,792 | | | | 8,091 | | | | 4,405 | | | | 3,982 | |
| | Less: Allowance for doubtful debts/impairment losses | | | 677 | | | | 676 | | | | 720 | | | | 704 | |
| | | | | 4,115 | | | | 7,415 | | | | 3,685 | | | | 3,278 | |
| | | | | | | | | | | | | | | |
| | Non-current | | | | | | | | | | | | | | | | |
| | Trade debtors | | | 113 | | | | 129 | | | | 163 | | | | 171 | |
| | Other | | | 85 | | | | 82 | | | | 191 | | | | 183 | |
| | | | | 198 | | | | 211 | | | | 353 | | | | 354 | |
| | Less: Allowance for doubtful debts/impairment losses | | | 31 | | | | 38 | | | | 112 | | | | 50 | |
| | | | | 167 | | | | 173 | | | | 241 | | | | 304 | |
| | | | | 4,282 | | | | 7,588 | | | | 3,926 | | | | 3,582 | |
| | | | | | | | | | | | | | | |
| | (b) Advances paid | | | | | | | | | | | | | | | | |
| | Current | | | | | | | | | | | | | | | | |
| | Advances | | | 106 | | | | 104 | | | | 113 | | | | 111 | |
| | Less: Allowance for doubtful debts/impairment losses | | | 17 | | | | 17 | | | | 17 | | | | 17 | |
| | | | | 89 | | | | 86 | | | | 96 | | | | 94 | |
| | | | | | | | | | | | | | | |
| | Non-current | | | | | | | | | | | | | | | | |
| | Advances | | | 546 | | | | 556 | | | | 564 | | | | 581 | |
| | Less: Allowance for doubtful debts/impairment losses | | | 3 | | | | 3 | | | | 3 | | | | 3 | |
| | | | | 543 | | | | 554 | | | | 561 | | | | 579 | |
| | | | | 632 | | | | 640 | | | | 657 | | | | 672 | |
| | | | | | | | | | | | | | | |
| | (c) Loans paid | | | | | | | | | | | | | | | | |
| | Current | | | | | | | | | | | | | | | | |
| | Finance leases | | | 10 | | | | 11 | | | | 11 | | | | 12 | |
| | | | | 10 | | | | 11 | | | | 11 | | | | 12 | |
| | Non-current | | | | | | | | | | | | | | | | |
| | Onlendings | | | — | | | | — | | | | 9,854 | | | | 9,615 | |
| | Finance leases | | | 81 | | | | 84 | | | | 189 | | | | 194 | |
| | | | | 81 | | | | 84 | | | | 10,043 | | | | 9,809 | |
| | | | | 90 | | | | 96 | | | | 10,054 | | | | 9,821 | |
| | | | | | | | | | | | | | | |
| | Finance lease receivables due: | | | | | | | | | | | | | | | | |
| | Not later than 1 year | | | 10 | | | | 12 | | | | 17 | | | | 18 | |
| | Later than 1 year but not later than 5 years | | | 35 | | | | 39 | | | | 61 | | | | 65 | |
| | Later than 5 years | | | 52 | | | | 52 | | | | 247 | | | | 254 | |
| | | | | 97 | | | | 102 | | | | 326 | | | | 336 | |
| | Less: Future finance revenue | | | 7 | | | | 6 | | | | 125 | | | | 130 | |
| | | | | 90 | | | | 96 | | | | 200 | | | | 207 | |
| | | | | | | | | | | | | | | |
| | | | |
| 6-28 | | Audited Consolidated Financial Statements 2015–16 – Government of Queensland |
Notes to the Financial Statements
| | | | | | | | | | | | | | | | | | |
| | | | | General Government
Sector | | | Total State Sector | |
| | | | | 2016 | | | 2015 | | | 2016 | | | 2015 | |
| | | | | $M | | | $M | | | $M | | | $M | |
24. | | Receivables and loans continued | | | | | | | | | | | | | | | | |
| | | | | |
| | (d) Minimum operating lease payments receivable not recognised in the
financial statements: | | | | | | | | | | | | | | | | |
| | | | | |
| | Not later than 1 year | | | 18 | | | | 17 | | | | 70 | | | | 69 | |
| | Later than 1 year but not later than 5 years | | | 73 | | | | 60 | | | | 237 | | | | 227 | |
| | Later than 5 years | | | 173 | | | | 157 | | | | 812 | | | | 759 | |
| | | | | 264 | | | | 234 | | | | 1,119 | | | | 1,055 | |
| | | | | | | | | | | | | | | |
| | | | | | | | | | | | | | | | | | |
| | (e) Impairment of receivables and loans | | | | | | | | | | | | | | | | |
| | | | | | | | | | | | | | | |
| | In accordance with AASB7 Financial Instruments: Disclosures, details of ‘Past due but not impaired’ and ‘Individually impaired’ receivables and loans are included in the tables below. This information has been sourced from GGS and Total State entities with material receivables and loans balances. | |
| | | | | | | | | | | | | | | | | | | | |
| General Government Sector | | | | | | | | | | | | | | | | | | | | |
| | | Past due not impaired | | | Individually
Impaired | |
| | | 1 Month or
Less | | | 1 to 2
Months | | | 2 to 3
Months | | | Over 3
Months | | | | |
| | | $M | | | $M | | | $M | | | $M | | | $M | |
As at 30 June 2016 | | | | | | | | | | | | | | | | | | | | |
| | | | | |
Trade receivables | | | 27 | | | | 9 | | | | 5 | | | | 20 | | | | 122 | |
Other receivables and loans | | | 52 | | | | 49 | | | | 44 | | | | 635 | | | | 485 | |
| | | 79 | | | | 58 | | | | 49 | | | | 655 | | | | 607 | |
| | | | | | | | | | | | | | | | |
As at 30 June 2015 | | | | | | | | | | | | | | | | | | | | |
| | | | | |
Trade receivables | | | 25 | | | | 4 | | | | 13 | | | | 17 | | | | 118 | |
Other receivables and loans | | | 62 | | | | 46 | | | | 21 | | | | 434 | | | | 508 | |
| | | 87 | | | | 49 | | | | 34 | | | | 451 | | | | 626 | |
| | | | | | | | | | | | | | | | |
| | | | | | | | | | | | | | | | | | | | |
| Total State Sector | | | | | | | | | | | | | | | | | | | | |
| | | Past due not impaired | | | Individually
Impaired | |
| | | 1 Month or
Less | | | 1 to 2
Months | | | 2 to 3
Months | | | Over 3
Months | | | | |
| | | $M | | | $M | | | $M | | | $M | | | $M | |
As at 30 June 2016 | | | | | | | | | | | | | | | | | | | | |
| | | | | |
Trade receivables | | | 27 | | | | 9 | | | | 5 | | | | 20 | | | | 122 | |
Other receivables and loans | | | 52 | | | | 49 | | | | 44 | | | | 635 | | | | 485 | |
| | | 79 | | | | 58 | | | | 49 | | | | 655 | | | | 607 | |
| | | | | | | | | | | | | | | | |
As at 30 June 2015 | | | | | | | | | | | | | | | | | | | | |
| | | | | |
Trade receivables | | | 25 | | | | 4 | | | | 12 | | | | 17 | | | | 115 | |
Other receivables and loans | | | 62 | | | | 46 | | | | 21 | | | | 434 | | | | 508 | |
| | | 87 | | | | 49 | | | | 33 | | | | 451 | | | | 623 | |
| | | | | | | | | | | | | | | | |
| | | | |
| Audited Consolidated Financial Statements 2015–16 – Government of Queensland | | 6-29 |
Notes to the Financial Statements
| | | | | | | | | | | | | | | | | | |
| | | | | General Government Sector | | | Total State
Sector | |
| | | | | 2016 | | | 2015 | | | 2016 | | | 2015 | |
| | | | | $M | | | $M | | | $M | | | $M | |
25. | | Securities and shares | | | | | | | | | | | | | | | | |
| | | | | |
| | (a) Securities other than shares | | | | | | | | | | | | | | | | |
| | | | | |
| | Current | | | | | | | | | | | | | | | | |
| | Term deposits | | | 89 | | | | 133 | | | | 89 | | | | 133 | |
| | Rental Purchase Plan | | | 4 | | | | 4 | | | | 4 | | | | 4 | |
| | Securities/bonds | | | 352 | | | | 195 | | | | 4,977 | | | | 7,420 | |
| | Fixed rate notes | | | 2,082 | | | | 5,432 | | | | — | | | | — | |
| | Investments managed by QIC Limited* | | | 1,667 | | | | 1,173 | | | | 4,859 | | | | 7,765 | |
| | Derivatives | | | | | | | | | | | | | | | | |
| | Derivatives - cash flow hedges | | | — | | | | — | | | | 53 | | | | 18 | |
| | Other derivatives | | | — | | | | 2 | | | | 142 | | | | 79 | |
| | Other | | | — | | | | — | | | | 4,122 | | | | 4,884 | |
| | | | | 4,193 | | | | 6,939 | | | | 14,247 | | | | 20,304 | |
| | Non-current | | | | | | | | | | | | | | | | |
| | Term deposits | | | 262 | | | | 288 | | | | 262 | | | | 288 | |
| | Rental Purchase Plan | | | 187 | | | | 188 | | | | 187 | | | | 188 | |
| | Securities/bonds | | | — | | | | — | | | | 7,142 | | | | 5,562 | |
| | Fixed rate notes | | | 28,303 | | | | 27,624 | | | | — | | | | — | |
| | Investments managed by QIC Limited* | | | 491 | | | | 927 | | | | 32,587 | | | | 33,234 | |
| | Derivatives | | | | | | | | | | | | | | | | |
| | Derivatives - cash flow hedges | | | — | | | | — | | | | 2 | | | | 14 | |
| | Other derivatives | | | — | | | | 1 | | | | 270 | | | | 326 | |
| | Other | | | 85 | | | | 82 | | | | 896 | | | | 861 | |
| | | | | 29,328 | | | | 29,111 | | | | 41,346 | | | | 40,474 | |
| | | | | | | | | | | | | | | |
| | | | | 33,522 | | | | 36,050 | | | | 55,592 | | | | 60,778 | |
| | | | | | | | | | | | | | | |
| | * Total State investments managed by QIC Limited were allocated over the
following categories: | | | | | | | | | | | | | | | | |
| | Cash | | | | | | | | | | | 10,515 | | | | 8,150 | |
| | Fixed interest | | | | | | | | | | | 5,269 | | | | 9,842 | |
| | Global equities | | | | | | | | | | | 6,114 | | | | 7,401 | |
| | Property and infrastructure | | | | | | | | | | | 5,948 | | | | 5,570 | |
| | Other | | | | | | | | | | | 9,600 | | | | 10,036 | |
| | | | | | | | | | | | | | | | | | |
| | | | | | | | | | | | | 37,446 | | | | 40,999 | |
| | | | | | | | | | | | | | | | | | |
| | | | | |
| | (b) Investments in public sector entities | | | | | | | | | | | | | | | | |
| | | | | |
| | General Government Sector investment in public sector entities | | | 20,477 | | | | 23,685 | | | | | | | | | |
| | | | | | | | | | | | | | | |
The GGS has equity investments in PNFCs and PFCs that are measured as the Government’s proportional share of the carrying amount of net assets of the PNFC and PFC Sector entities on a GAAP basis. Investments in public sector entities on this basis differ from valuations under GFS. Refer to Note 50 for the reconciliation to GFS.
Note 1(c) outlines the functions of the PNFC and PFC sectors. Refer to Note 49 for a comprehensive list of entities within each sector. Investments in the PNFC and PFC Sectors are eliminated on consolidation of the Total State Sector.
| | | | |
| 6-30 | | Audited Consolidated Financial Statements 2015–16 – Government of Queensland |
Notes to the Financial Statements
| 25. | Securities and shares continued |
(c) Investments in other entities - shares in entities that are not controlled or associated
Investments in entities that are neither controlled/jointly controlled by, nor associates of, the Government are valued at fair value with changes in valuation of these investments treated in a manner consistent with AASB 139 Financial Instruments: Recognition and Measurement.
| | | | | | | | | | | | | | | | | | |
| | | | | General Government
Sector | | | | | | Total State Sector | |
| | | | | 2016 | | 2015 | | | | | | 2016 | | | 2015 | |
| | | | | $M | | $M | | | | | | $M | | | $M | |
Current | | | | | | | | | | | | | | | | | | |
Shares at fair value through profit and loss | | | | — | | — | | | | | | | 265 | | | | 282 | |
| | | | | | | |
Non-current | | | | | | | | | | | | | | | | | | |
Shares at fair value through profit and loss | | | | 7 | | 7 | | | | | | | 7 | | | | 7 | |
Available-for-sale shares | | | | 1 | | 1 | | | | | | | 3 | | | | 3 | |
| | | | | | | | | | | | | | | | | | |
| | | | 8 | | 8 | | | | | | | 9 | | | | 9 | |
| | | | | | | | | | | | | | | | | | |
| | | | 8 | | 8 | | | | | | | 274 | | | | 291 | |
| | | | | | | | | | | | | | | | | | |
The State’s securities and shares in (a), (b) and (c) above are classified as either held-to-maturity investments, available-for-sale financial assets or financial assets at fair value through profit or loss. The carrying amount of financial assets in each of the categories is disclosed in Note 47.
Held-to-maturity investments
Held-to-maturity investments are non-derivative financial assets with fixed or determinable payments and fixed maturity where the State has the intention and ability to hold such investments to maturity. Held-to-maturity investments are initially recognised at fair value plus any directly attributable transaction costs. Subsequently, held-to-maturity investments are measured at amortised cost using the effective interest method, less any impairment losses.
If a class of held-to-maturity investments is tainted or the State fails to keep these investments to maturity other than for specific circumstances explained in AASB 139, it will be required to reclassify the whole class as available-for-sale. The State would also not be able to classify any financial assets as held-to-maturity for the following two annual reporting periods.
Held-to-maturity financial assets primarily comprise term deposits and fixed rate notes with QTC. It is the State’s intention to hold these investments until maturity. Deposits and fixed rate notes held with QTC are eliminated on consolidation of the Total State Sector.
Available-for-sale financial assets
Available-for-sale financial assets are those non-derivative financial assets that are designated as available-for-sale or that are not classified as other categories of financial assets. Such assets are measured at fair value with unrealised gains/losses recognised directly in equity, except for impairment losses and foreign exchange losses on monetary available-for-sale financial assets which are recognised as other economic flows in the operating result. For GGS, investments in other public sector entities are classified as available-for-sale.
Total State Sector available-for-sale financial assets include bank bonds, corporate bonds, Government bonds and share investments.
Financial assets at fair value through profit or loss
Financial assets are classified as fair value through profit or loss at balance date if they are classified as held for trading or designated so upon initial recognition. Financial assets at fair value through profit or loss are valued at fair value at balance date. Unrealised gains and losses are brought to account as other economic flows included in the operating result.
Financial assets at fair value through profit or loss held by the State include money market deposits, discount securities, Commonwealth and State securities, floating rate notes, medium term notes, fixed interest deposits, interests in Rental Purchase Plan agreements and the Pathways Shared Equity program, investments managed by QIC Limited, other investments in managed funds, shares and derivatives. The accounting policy for derivatives is discussed in Note 37.
| | | | |
| Audited Consolidated Financial Statements 2015–16 – Government of Queensland | | 6-31 |
Notes to the Financial Statements
Investments in other entities refer to claims on other entities (or arrangements) entitling the State to a share of the income of the entity and a right to a share of the residual assets of the entity should it be wound up (in the case of associates and joint ventures) or a share of revenue, expenses, assets and liabilities of the arrangement (in the case of joint operations). These investments are held at market value.
There are two main categories:
| | - | | investments accounted for using the equity method (investments in associates and joint ventures); and |
| | - | | investments in joint operations. |
(a) Investments accounted for using the equity method
Associates are those entities over which the State has significant influence but not control. Joint ventures are joint arrangements whereby the State has joint control and rights to the net assets of the arrangements. Such entities are accounted for using the equity method of accounting in accordance with AASB 128 Investments in Associates and Joint Ventures. The State’s share of its associates’ or joint ventures’ post-acquisition profits or losses (less dividends) is recognised in the Operating Statement as an other economic flow and its share of post-acquisition movements in reserves is recognised in the reserves. The cumulative post-acquisition movements are recognised against the carrying amount of the investment. Dividends from associates and joint ventures are recognised as revenue from transactions in the Operating Statement.
The following investments held by the State in unlisted associated and joint venture entities are accounted for using equity method:
| | | | | | | | | | | | | | | | | | | | | | |
| Name of entity | | Principal activity | | | | | Ownership
interest | | | Equity accounted
amount | |
| | | | | | 2016 | | | 2015 | | | 2016 | | | 2015 | |
| | | | | | % | | | % | | | $M | | | $M | |
Dumaresq-Barwon Border Rivers Commission | | Water management | | | (i | ) | | | 50 | | | | 50 | | | | 70 | | | | 70 | |
| | | | | | |
Translational Research Institute Trust | | Medical research and education | | | (ii | ) | | | 25 | | | | 25 | | | | 80 | | | | 81 | |
| | | | | | | | | | | | | | | | | | | | | | |
General Government Sector | | | | | | | | | | | | | | | | | 150 | | | | 151 | |
| | | | | | | | | | | | | | | | | | | | | | |
| | | | | | | | | | | | | | | | | | | | | | |
| | | | | | | | | | | | | | | | | | | | | | |
Total State Sector | | | | | | | | | | | | | | | | | 150 | | | | 151 | |
| | | | | | | | | | | | | | | | | | | | | | |
| | (i) | Dumaresq-Barwon Border Rivers Commission is a joint authority constituted by an agreement between the Queensland and New South Wales governments. Each government holds a 50% interest. |
| | (ii) | Translational Research Institute (TRI) Trust is a Discretionary Unit Trust founded by four members, of which Queensland Health is one. Each founding member holds 25 units in the TRI Trust and equal voting rights. The TRI Trust seeks to design, construct and maintain the TRI Facility and ensure it is operated and managed to promote medical study, research and education. |
(b) Investments in joint operations
Joint operations are joint arrangements whereby the State has control and rights to the assets, and obligations for the liabilities, relating to the arrangements. Such arrangements are accounted for in accordance with AASB 11 Joint Arrangements. The State recognises its share of jointly held or incurred assets, liabilities, revenue and expenses in the joint operations.
| | |
General Government Sector | | |
| |
Joint arrangements that contribute less than $4 million in net assets and/or net revenue to the Balance Sheet or Operating Statement are as follows: | | |
| |
Department of Infrastructure, Local Government and Planning | | |
| |
The Department of Infrastructure, Local Government and Planning holds a 50% interest in a joint venture with the Mackay Regional Council to develop residential land within the Andergrove Urban Development Area. | | |
| | | | |
| 6-32 | | Audited Consolidated Financial Statements 2015–16 – Government of Queensland |
Notes to the Financial Statements
| 26. | Other investments continued |
(b) Investments in joint operations continued
Total State Sector
Joint arrangements for the Total State Sector include the GGS joint ventures above, in addition to the following:
CS Energy Limited
The following are the joint operations in which CS Energy Limited has an interest:
| | | | | | | | | | | | | | |
| | | Name | | Principal Activities | | 2016 | | | 2015 | | | |
| | | | Interest | | | Interest | | | |
| | Callide Power Management Pty Ltd | | Joint Operation Manager | | | 50% | | | | 50% | | | |
| | Callide Power Trading Pty Ltd | | Electricity Marketing Agent | | | 50% | | | | 50% | | | |
| | Callide Oxyfuel Project | | Electricity generation | | | 75% | | | | 75% | | | |
Stanwell Corporation Limited
Stanwell has an 84% interest in the Woodlands Hardwood Plantation Joint Venture and a 19% interest in the Tarong Hoop Pine Joint Venture. The interests are in unincorporated joint operations with Hancock Queensland Plantations Pty Ltd, the principal activity of which is the establishment of a viable commercial plantation of trees.
Stanwell holds a 50% participating interest in the Kogan North Joint Venture, a gas development joint operation with Australian CBM Pty Ltd.
| 27. | Public private partnerships |
There is currently no Australian Accounting Standard specifically addressing accounting for private sector financed infrastructure assets from a grantor’s perspective. The following policies have been adopted pending the development of an accounting standard for the grantor.
Agreements equally proportionately unperformed arising from Public Private Partnerships (PPPs) are not recognised as assets or liabilities. Instead, the payments under these agreements are expensed systematically over the term of the agreements. Any leasing arrangements are disclosed in accordance with AASB 117 Leases. Further, the commitments for future payments under finance leases are also disclosed as commitments in Note 41.
The following PPPs apply to both the GGS and Total State Sector statements.
Education and Training
(a) Southbank Education and Training Precinct
In April 2005, the State Government entered into a contractual arrangement with Axiom Education Queensland Pty Ltd (Axiom) to design, construct, maintain and finance the Southbank Education and Training Precinct for a period of 34 years on State’s land. This is a social infrastructure arrangement whereby the State pays for the third party use of the asset through regular service payments to Axiom over the life of the contract. The arrangement involved the refurbishment or demolition of existing buildings and the development of new buildings.
Construction work was completed on 31 October 2008 and the State has entered into a Head Lease and Sublease with Axiom. The State will pay abatable, undissected service payments to Axiom for the operation, maintenance and provision of the precinct. At the expiry of the lease in 2039, the buildings will revert to the State for nil consideration. The land on which the facility is constructed is owned and recognised as an asset of the State.
The fair value of the buildings was recognised as a finance lease asset with the corresponding recognition for future payments as a finance lease liability.
(b) South East Queensland schools - Aspire
In April 2009, the State Government entered into a contractual arrangement with Aspire Schools (Qld) Pty Limited (Aspire) to design, construct, maintain and partially finance seven schools of the State for a period of 30 years on State’s land. Construction work commenced in May 2009 and was finalised in January 2014. This is a social infrastructure arrangement whereby the State pays for the third party use of the asset through regular service payments to Aspire over the life of the contract.
The State will lease back these schools from Aspire and will pay abatable, undissected service payments to Aspire for the operation, maintenance and provision of the schools. At the expiry of the lease in 2039, the buildings will revert to the State for nil consideration. The land on which the schools are constructed is owned and recognised as an asset of the State.
The fair value of the buildings was recognised as a finance lease asset with the corresponding recognition for future payments as a finance lease liability.
| | | | |
| Audited Consolidated Financial Statements 2015–16 – Government of Queensland | | 6-33 |
Notes to the Financial Statements
| 27. | Public private partnerships continued |
Education and Training continued
(c) Queensland schools - Plenary
In December 2013, the State Government entered into a contractual arrangement with Plenary Schools Pty Ltd (Plenary) for the construction and management of 10 schools in South East Queensland. This is a social infrastructure arrangement whereby the State pays for the third party use of the asset through regular service payments to Plenary over the life of the contract. The project period is for 30 years and is expected to end in December 2043.
At 30 June 2016, construction of Stage 1 at six schools has been completed. Under current arrangements the State is scheduled to pay a series of capital contributions during the construction phase of the project totalling $190 million. These contribution payments result in lower service payments over the period of the concession.
Upon the completion of the construction, the fair value of the buildings will be recognised as a finance lease asset with the corresponding recognition for future payments as a finance lease liability. The land on which the schools are/will be constructed is owned and recognised as an asset of the State.
Queensland Health and Hospital and Health Services (HHSs)
The State Government has entered into a number of contractual arrangements with private sector entities for the construction and operation of public infrastructure facilities for a period of time on State land. After an agreed period of time, ownership of these facilities will pass to Queensland Health or the relevant HHS.
| | | | | | | | |
Entity | | Facility | | Counterparty | | Term of Agreement | | Commencement Date |
| Queensland Health | | Sunshine Coast University Hospital* | | Exemplar Health Partnership | | 25 years | | Scheduled commencement in April 2017 |
| Metro North HHS | | Butterfield Street car park | | International Parking Group Pty Ltd | | 25 years | | January 1998 |
| Metro North HHS | | Bramstone Terrace car park | | International Parking Group Pty Ltd | | 25 years | | November 1998 |
| Metro North HHS | | The Prince Charles Hospital car park | | International Parking Group Pty Ltd | | 22 years | | November 2000 |
| Metro North HHS | | The Prince Charles Hospital Early Education Centre | | Queensland Child Care Services Pty Ltd | | 20 years | | April 2007 |
| Metro South HHS | | The Princess Alexandra Hospital multi storey car park | | International Parking Group Pty Ltd | | 25 years | | February 2008 |
| Sunshine Coast HHS | | Noosa Hospital and Specialist Centre | | Ramsay Health Care | | 20 years | | September 1999 |
| Sunshine Coast HHS | | Sunshine Coast University Private Hospital | | Ramsay Health Care | | 5 years / 25 years | | December 2013 |
| Gold Coast HHS | | The Gold Coast University Hospital western car park | | SurePark Pty Ltd | | 31 years | | July 2010 |
| Townsville HHS | | Medilink | | Trilogy Funds Management Ltd | | 40 years | | January 2012 |
| Townsville HHS | | Goodstart Early Learning | | Trilogy Funds Management Ltd | | 40 years | | February 2012 |
|
* The share of construction costs contributed by Queensland Health is currently recognised as works in progress asset. |
|
| To date, other than the Sunshine Coast University Hospital Project, no rights or obligations relating to these facilities have been recognised by Queensland Health or HHSs, other than those associated with land rental and the provision of various services under the agreements. |
|
| The State has also entered into a number of contractual arrangements (termed collocation agreements) with private sector entities for the construction and operation of private health facilities for a period of time on departmental land. After an agreed period of time, ownership of these facilities will pass to the State. The State does not control the facilities associated with these arrangements and accordingly, does not recognise these facilities and any rights or obligations that may attach to these arrangements other than those recognised under generally accepted accounting principles. |
| | | | | | | | | |
Entity | | Facility | | Counterparty | | Term of
Agreement | | Commencement Date |
| Metro North HHS | | Caboolture Private Hospital | | Affinity Health Ltd | | 25 years | | May 1998 |
| Metro North HHS | | Holy Spirit Northside Private Hospital | | The Holy Spirit Northside Private Hospital Ltd | | 40 years | | September 1999 |
| Metro South HHS | | Redlands Private Hospital | | Sisters of Mercy in Queensland | | 25 years + 30 years | | August 1999 |
| Metro South HHS | | Translational Research Institute Building | | Translational Research Institute Pty Ltd | | 30 years + 20 years | | May 2013 |
| Metro South HHS | | University of Queensland Training Facility – Redlands Hospital | | University of Queensland | | 20 years | | August 2015 |
| Metro South HHS | | University of Queensland Training Facility – Queen Elizabeth II Jubilee Hospital | | University of Queensland | | 20 years | | September 2015 |
| Gold Coast HHS | | Gold Coast Private Hospital | | Healthscope Ltd | | 50 years | | March 2016 |
| | | | |
| 6-34 | | Audited Consolidated Financial Statements 2015–16 – Government of Queensland |
Notes to the Financial Statements
| 27. | Public private partnerships continued |
Transport and Main Roads
(a) Brisbane Airport Rail Link
The Brisbane Airport Rail Link (BARL) is a public passenger rail system built and owned by Airtrain Citylink Limited (Airtrain) to link the Brisbane Domestic and International Airports to the existing Queensland Rail network.
In 1998, the State Government entered into an agreement with Airtrain whereby Airtrain was required to acquire the land for the BARL and design, construct, maintain and operate the BARL for a concession period of 35 years. At the end of this period, the agreement provides for Airtrain to transfer the BARL assets at no cost to the State.
The State Government leases airport land from the Brisbane Airport Corporation and sub-leases the land to Airtrain.
(b) Gold Coast Rapid Transit Project Operator Franchise
In May 2011, the State Government entered into a contractual arrangement with GoldLinQ Consortium (GoldLinQ) to finance, design, build, operate and maintain the Gold Coast light rail system linking key activity centres from Griffith University (Gold Coast Campus) and the Gold Coast University Hospital to Broadbeach via Southport. The operation of the system commenced in July 2014. At the end of the 15-year operations period, ownership of the system will be transferred to the State.
GoldLinQ Consortium partially financed construction of the system, with the State providing a capital contribution. During operations, GoldLinQ Consortium will be paid monthly performance based payments for operations, maintenance and repayment of the debt finance used to construct the system. The State will receive fare-box and advertising revenue generated by the system.
In April 2016, the State entered into a contractual arrangement with GoldLinQ for stage two of the Gold Coast Light Rail system. Stage two will connect the existing light rail system at Gold Coast University Hospital Light Rail station to heavy rail at the Helensvale station. The construction is expected to be completed and operational by April 2018.
(c) AirportLink
In June 2008, the State Government entered into a 45-year service concession arrangement with BrisConnections Operations Pty Ltd and BrisConnections Nominee Company Pty Ltd to design, construct and maintain the AirportLink toll road (AirportLink). In April 2016, Transurban Queensland assumed responsibility for AirportLink and now operates AirportLink under the service concession arrangement.
In return for collecting the tolls, Transurban Queensland must maintain, operate and manage the toll road for the concession period and also assume the demand and patronage risk. The State does not recognise any assets associated with the arrangement. At the end of the service concession period, AirportLink assets will be transferred at no cost to the State.
(d) Toll road arrangements
A Road Franchise Agreement (RFA) was established between the State and Queensland Motorways Limited (QML) on 1 April 2011 for the operation, maintenance and management of the Gateway and Logan Motorways for a period of 40 years. In 2014, Transurban Queensland acquired QML and now operates the Gateway Motorway and Logan Motorway toll roads under the RFA with the State.
In return for collecting the tolls, Transurban Queensland must maintain, operate and manage the toll roads for the period of the franchise and also assumes the demand and patronage risk for the franchise period. The State does not recognise any assets associated with the arrangement. At the end of the RFA concession period, the toll roads infrastructure assets will be transferred to the State.
(e) New Generation Rollingstock
In January 2014, the State Government entered into a 32-year contractual arrangement with NGR Project Company Pty Ltd (Bombardier NGR Consortium) for the design, construction and maintenance of 75 new six car train sets and a new purpose-built maintenance centre. The arrangement will involve the State paying the consortium a series of availability payments over the concession period of 30 years.
In June 2016, the maintenance centre was accepted by the State. All trains are expected to be in service by December 2018.
At the expiry of the concession period, the State will retain ownership of the trains and the maintenance centre.
| | | | |
| Audited Consolidated Financial Statements 2015–16 – Government of Queensland | | 6-35 |
Notes to the Financial Statements
| 27. | Public private partnerships continued |
Transport and Main Roads continued
(f) Toowoomba Second Range Crossing
In August 2015, the State Government entered into a contractual arrangement with Nexus Infrastructure Consortium to finance, design, build, operate and maintain a range crossing connecting the Warrego Highway at Helidon Spa in the east with the Gore Highway at Athol in the west, via Charlton.
The State will provide contributions during the construction stage of the project and ongoing service payments over the 25 year operation and maintenance period. On commissioning of the toll road in late 2018, the State will recognise a lease asset at fair value which will be depreciated over the life of the asset, and a corresponding lease liability, which will be reduced by the state contribution and monthly repayments. Maintenance payments will be expensed during the relevant year. Contributions made prior to the road commissioning are recognised as prepayments.
The Toowoomba Second Range Crossing will be a toll road. Tolls will not be finalised until closer to the opening of the road.
At the expiry of the concession period, the State will retain ownership of the range crossing.
Development at 1 William Street Brisbane
1 William Street is a commercial office tower development. Cbus Property was the successful tenderer with a bid of $653 million and on 21 December 2012, the State entered into a sublease pre-commitment via a series of transaction documents involving:
| | - | | a project deed (overarching document); |
| | - | | a development lease (from the State to the developer during construction phase, which runs for approximately 4 years); |
| | - | | a ground lease (covering land tenure from the State to the developer for 99 years post-construction phase); and |
| | - | | a sublease (from the developer to the State for the building tenure, being 15 years). |
The State’s commitment for the operating lease payments is contingent on the completion of the building and accordingly these amounts are included in Note 43 Contingent assets and liabilities.
Further information may be obtained from the individual financial reports of the relevant agencies.
| | | | | | | | | | | | | | | | | | |
| | | | | General Government
Sector | | | Total State
Sector | |
| | | | | 2016 | | | 2015 | | | 2016 | | | 2015 | |
| | | | | $M | | | $M | | | $M | | | $M | |
| | Estimated cash flows for Public Private Partnerships | | | | | | | | | | | | | | | | |
| | Inflows | | | | | | | | | | | | | | | | |
| | Not later than 1 year | | | 40 | | | | 38 | | | | 40 | | | | 38 | |
| | Later than 1 year but not later than 5 years | | | 178 | | | | 156 | | | | 178 | | | | 156 | |
| | Later than 5 years but not later than 10 years | | | 283 | | | | 235 | | | | 283 | | | | 235 | |
| | Later than 10 years | | | 391 | | | | 387 | | | | 391 | | | | 387 | |
| | | | | 892 | | | | 816 | | | | 892 | | | | 816 | |
| | | | | |
| | Outflows | | | | | | | | | | | | | | | | |
| | Not later than 1 year | | | (1,389 | ) | | | (669 | ) | | | (1,389 | ) | | | (669 | ) |
| | Later than 1 year but not later than 5 years | | | (2,888 | ) | | | (2,258 | ) | | | (2,888 | ) | | | (2,258 | ) |
| | Later than 5 years but not later than 10 years | | | (2,434 | ) | | | (2,017 | ) | | | (2,434 | ) | | | (2,017 | ) |
| | Later than 10 years | | | (7,975 | ) | | | (7,311 | ) | | | (7,975 | ) | | | (7,311 | ) |
| | | | | (14,686 | ) | | | (12,254 | ) | | | (14,686 | ) | | | (12,254 | ) |
| | Estimated Net Cash Flow | | | (13,794 | ) | | | (11,438 | ) | | | (13,794 | ) | | | (11,438 | ) |
| | | | | |
| 28. | | Inventories | | | | | | | | | | | | | | | | |
| | | | | |
| | Current | | | | | | | | | | | | | | | | |
| | Raw materials | | | 11 | | | | 11 | | | | 280 | | | | 279 | |
| | Work in progress | | | 42 | | | | 52 | | | | 70 | | | | 71 | |
| | Finished goods | | | 142 | | | | 123 | | | | 194 | | | | 221 | |
| | Land held for resale | | | 273 | | | | 317 | | | | 273 | | | | 317 | |
| | Inventories held for distribution | | | 27 | | | | 24 | | | | 27 | | | | 24 | |
| | Assets formerly held for lease | | | 5 | | | | 6 | | | | 5 | | | | 6 | |
| | Environmental certificates held for sale/surrender | | | — | | | | — | | | | 143 | | | | 125 | |
| | Other | | | 7 | | | | 8 | | | | 170 | | | | 169 | |
| | | | | 507 | | | | 541 | | | | 1,161 | | | | 1,212 | |
| | | | |
| 6-36 | | Audited Consolidated Financial Statements 2015–16 – Government of Queensland |
Notes to the Financial Statements
Inventories (other than those held for distribution) are carried at the lower of cost and net realisable value under AASB 102 Inventories. Cost is determined on weighted average cost basis and includes expenditure incurred in acquiring the inventories and bringing them to their present location and condition, except for training costs which are expensed as incurred. Where inventories are acquired for no or nominal consideration, the cost is the current replacement cost as at the date of acquisition.
Inventories held for distribution are those inventories which the State distributes for no or nominal consideration. These are measured at cost, adjusted for any loss of service potential. Land held for resale is stated at the lower of cost and net realisable value. Such cost is assigned by specific identification and includes the cost of acquisition and development.
All inventories are classified as current non-financial assets.
| | | | | | | | | | | | | | | | | | | | |
| | | | | General Government
Sector | | | | | Total State
Sector | |
| | | | | 2016 | | | 2015 | | | | | 2016 | | | 2015 | |
| | | | | $M | | | $M | | | | | $M | | | $M | |
| 29. | | Assets held for sale | | | | | | | | | | | | | | | | | | |
| | | | | | |
| | Land | | | 103 | | | | 96 | | | | | | 110 | | | | 98 | |
| | Buildings | | | 15 | | | | 11 | | | | | | 15 | | | | 11 | |
| | Investment properties | | | — | | | | — | | | | | | — | | | | 5 | |
| | Plant and equipment | | | 5 | | | | 5 | | | | | | 5 | | | | 5 | |
| | | | | 123 | | | | 112 | | | | | | 130 | | | | 119 | |
| | | | | | |
| | Non-current assets classified as held for sale consist of those assets that are determined to be available for immediate sale in their present condition, for which their sale is highly probable within the next twelve months. | | | | | | | | | | | | | | | | | | |
| | | | | | |
| | In accordance with AASB 5 Non-current Assets Held for Sale and Discontinued Operations, non-current assets held for sale are measured at the lower of carrying amount and fair value less costs to sell and are not depreciated or amortised. | | | | | | | | | | | | | | | | | | |
| | | | | | |
| | While an asset is classified as held for sale, an impairment loss is recognised for any write downs of the asset to fair value less estimated costs to sell. A gain is recognised for any subsequent increases in fair value less costs to sell of an asset, but not in excess of any cumulative impairment loss previously recognised. | | | | | | | | | | | | | | | | | | |
| | | | | | |
| 30. | | Investment properties | | | | | | | | | | | | | | | | | | |
| | | | | | | | | | | | | | | | | |
| | Land, buildings and work in progress at independent valuation | | | 341 | | | | 334 | | | | | | 661 | | | | 653 | |
| | | | | | |
| | Movements in investment properties were not material. | | | | | | | | | | | | | | | | | | |
| | | | | | |
| | Pursuant to AASB 140 Investment Property, properties held to earn rental income or for capital gains purposes are classified as investment properties. Such properties are valued at fair value. Changes in fair value are recognised in the Operating Statement as other economic flows and no depreciation expense or asset impairment is recognised. | | | | | | | | | | | | | | | | | | |
| | | | | | |
| 31. | | Restricted assets | | | | | | | | | | | | | | | | | | |
| | | | | | |
| | A number of assets included in the consolidated financial statements are classified as restricted assets because their use is wholly or partially restricted by externally imposed requirements. These assets include: | | | | | | | | | | | | | | | | | | |
| | | | | | |
| | Cash to be used to further medical research in specified areas | | | 90 | | | | 89 | | | | | | 90 | | | | 90 | |
| | Cash and property, plant and equipment to be used for other specific purposes | | | 168 | | | | 257 | | | | | | 185 | | | | 269 | |
| | | | | 259 | | | | 346 | | | | | | 275 | | | | 359 | |
| | | | |
| Audited Consolidated Financial Statements 2015–16 – Government of Queensland | | 6-37 |
Notes to the Financial Statements
| 32. | Property, plant and equipment |
| | | | | | | | | | | | | | | | | | | | | | | | | | | | | | | | | | | | | | | | | | |
| | General Government Sector | |
| | | | | | | | |
| | | | | | | | | | | Gross | | | | | | Accumulated | | | | | | Written down
value | |
| | | | | | | | | | | | | | | depreciation/impairment | | | | | |
| | | | | | | | | | | 2016 | | | 2015 | | | | | | 2016 | | | 2015 | | | | | | 2016 | | | 2015 | |
| | | | | | | | | | | $M | | | $M | | | | | | $M | | | $M | | | | | | $M | | | $M | |
| | Land | | | | | | | | | | | 87,402 | | | | 80,712 | | | | | | | | (19 | ) | | | (18 | ) | | | | | | | 87,383 | | | | 80,694 | |
| | Buildings | | | | | | | | | | | 49,481 | | | | 48,785 | | | | | | | | (16,055 | ) | | | (15,504 | ) | | | | | | | 33,426 | | | | 33,281 | |
| | Infrastructure | | | | | | | | | | | 86,203 | | | | 71,067 | | | | | | | | (19,316 | ) | | | (20,545 | ) | | | | | | | 66,887 | | | | 50,522 | |
| | Major plant and equipment | | | | | | | | | | | 668 | | | | 624 | | | | | | | | (346 | ) | | | (319 | ) | | | | | | | 322 | | | | 306 | |
| | Heritage and cultural assets | | | | | | | | | | | 2,019 | | | | 1,199 | | | | | | | | (670 | ) | | | (175 | ) | | | | | | | 1,349 | | | | 1,023 | |
| | Plant and equipment | | | | | | | | | | | 5,716 | | | | 5,474 | | | | | | | | (3,313 | ) | | | (3,049 | ) | | | | | | | 2,403 | | | | 2,426 | |
| | Leased plant and equipment | | | | | | | | | | | 2,949 | | | | 2,443 | | | | | | | | (518 | ) | | | (481 | ) | | | | | | | 2,431 | | | | 1,962 | |
| | Capital work in progress | | | | | | | | | | | 4,794 | | | | 4,697 | | | | | | | | — | | | | — | | | | | | | | 4,794 | | | | 4,697 | |
| | | | | | | | | | | | | | | | | | | | | | | | | | | | | | | | | |
| | | | | | | | | | | | | 239,232 | | | | 215,002 | | | | | | | | (40,236 | ) | | | (40,091 | ) | | | | | | | 198,996 | | | | 174,911 | |
| | | | | | | | | | | | | | | | | | | | | | | | | | | | | | | | | |
| |
| | | Reconciliations of the carrying amount for each class of property, plant and equipment are set out below: | |
| | | | | | |
| | | | | Land | | | Buildings | | | Infrastructure | | | Major plant and
equipment | | | Heritage and
cultural assets | |
| | | | | 2016 | | | 2015 | | | 2016 | | | 2015 | | | 2016 | | | 2015 | | | 2016 | | | 2015 | | | 2016 | | | 2015 | |
| | | | | $M | | | $M | | | $M | | | $M | | | $M | | | $M | | | $M | | | $M | | | $M | | | $M | |
| | Carrying amount at beginning of year | | | 80,694 | | | | 76,812 | | | | 33,281 | | | | 31,454 | | | | 50,522 | | | | 49,899 | | | | 306 | | | | 301 | | | | 1,023 | | | | 951 | |
| | Acquisitions | | | 125 | | | | 188 | | | | 255 | | | | 356 | | | | 3 | | | | 2 | | | | 5 | | | | 2 | | | | 4 | | | | 5 | |
| | Disposals | | | (85 | ) | | | (118 | ) | | | (13 | ) | | | (10 | ) | | | (158 | ) | | | (238 | ) | | | — | | | | — | | | | — | | | | — | |
| | Revaluation increments/(decrements) | | | 6,527 | | | | 3,766 | | | | 1,055 | | | | 660 | | | | 15,210 | | | | (3,722 | ) | | | 23 | | | | 19 | | | | 67 | | | | 57 | |
| | Impairment (losses)/reversals | | | — | | | | — | | | | — | | | | (2 | ) | | | — | | | | (1 | ) | | | — | | | | — | | | | — | | | | — | |
| | Depreciation and amortisation | | | — | | | | — | | | | (1,329 | ) | | | (1,267 | ) | | | (836 | ) | | | (1,119 | ) | | | (25 | ) | | | (29 | ) | | | (29 | ) | | | (5 | ) |
| | Net asset transfers | | | 122 | | | | 46 | | | | 176 | | | | 2,090 | | | | 2,145 | | | | 5,700 | | | | 13 | | | | 12 | | | | 284 | | | | 15 | |
| | | | | | | | | | | | | | | | | | | | | | | | | | | | | | | | | |
| | Carrying amount at end of year | | | 87,383 | | | | 80,694 | | | | 33,426 | | | | 33,281 | | | | 66,887 | | | | 50,522 | | | | 322 | | | | 306 | | | | 1,349 | | | | 1,023 | |
| | | | | | | | | | | | | | | | | | | | | | | | | | | | | | | | | |
| | | | | | | |
| | | | | | | | | | | Plant and
equipment | | | Leased plant
and equipment | | | Capital work in
progress | | | Total | |
| | | | | | | | | | | 2016 | | | 2015 | | | 2016 | | | 2015 | | | 2016 | | | 2015 | | | 2016 | | | 2015 | |
| | | | | | | | | | | $M | | | $M | | | $M | | | $M | | | $M | | | $M | | | $M | | | $M | |
| | Carrying amount at beginning of year | | | | | | | | | | | 2,426 | | | | 2,423 | | | | 1,962 | | | | 1,347 | | | | 4,697 | | | | 10,086 | | | | 174,911 | | | | 173,274 | |
| | Acquisitions | | | | | | | | | | | 351 | | | | 346 | | | | 341 | | | | 470 | | | | 3,041 | | | | 3,280 | | | | 4,126 | | | | 4,649 | |
| | Disposals | | | | | | | | | | | (35 | ) | | | (33 | ) | | | (1 | ) | | | (2 | ) | | | (4 | ) | | | (71 | ) | | | (296 | ) | | | (471 | ) |
| | Revaluation increments/(decrements) | | | | | | | | | | | 1 | | | | (2 | ) | | | 41 | | | | (53 | ) | | | — | | | | — | | | | 22,924 | | | | 726 | |
| | Impairment (losses)/reversals | | | | | | | | | | | — | | | | — | | | | — | | | | — | | | | — | | | | — | | | | — | | | | (2 | ) |
| | Depreciation and amortisation | | | | | | | | | | | (525 | ) | | | (524 | ) | | | (54 | ) | | | (44 | ) | | | — | | | | — | | | | (2,796 | ) | | | (2,989 | ) |
| | Net asset transfers | | | | | | | | | | | 186 | | | | 215 | | | | 142 | | | | 244 | | | | (2,940 | ) | | | (8,598 | ) | | | 128 | | | | (277 | ) |
| | | | | | | | | | | | | | | | | | | | | | | | | | | | | | | | | |
| | Carrying amount at end of year | | | | | | | | | | | 2,403 | | | | 2,426 | | | | 2,431 | | | | 1,962 | | | | 4,794 | | | | 4,697 | | | | 198,996 | | | | 174,911 | |
| | | | | | | | | | | | | | | | | | | | | | | | | | | | | | | | | |
| | | | |
| 6-38 | | Audited Consolidated Financial Statements 2015–16 – Government of Queensland |
Notes to the Financial Statements
| 32. | Property, plant and equipment continued |
Total State Sector
| | | | | | | | | | | | | | | | | | | | | | | | |
| | | Gross | | | Accumulated depreciation/impairment | | | Written down
value | |
| | | 2016 | | | 2015 | | | 2016 | | | 2015 | | | 2016 | | | 2015 | |
| | | $M | | | $M | | | $M | | | $M | | | $M | | | $M | |
Land | | | 90,145 | | | | 83,329 | | | | (49 | ) | | | (39 | ) | | | 90,096 | | | | 83,290 | |
Buildings | | | 52,862 | | | | 51,974 | | | | (17,546 | ) | | | (16,873 | ) | | | 35,316 | | | | 35,101 | |
Infrastructure | | | 162,493 | | | | 146,118 | | | | (45,103 | ) | | | (45,378 | ) | | | 117,390 | | | | 100,740 | |
Major plant and equipment | | | 2,435 | | | | 2,509 | | | | (1,203 | ) | | | (1,138 | ) | | | 1,232 | | | | 1,371 | |
Heritage and cultural assets | | | 2,019 | | | | 1,199 | | | | (670 | ) | | | (175 | ) | | | 1,349 | | | | 1,024 | |
Plant and equipment | | | 9,664 | | | | 9,345 | | | | (5,210 | ) | | | (4,847 | ) | | | 4,453 | | | | 4,498 | |
Leased plant and equipment | | | 3,707 | | | | 3,128 | | | | (918 | ) | | | (830 | ) | | | 2,789 | | | | 2,298 | |
Capital work in progress | | | 5,535 | | | | 5,986 | | | | — | | | | — | | | | 5,535 | | | | 5,986 | |
| | | | | | | | | | | | | | | | | | | | | | | | |
| | | 328,859 | | | | 303,590 | | | | (70,699 | ) | | | (69,281 | ) | | | 258,161 | | | | 234,309 | |
| | | | | | | | | | | | | | | | | | | | | | | | |
Reconciliations of the carrying amount for each class of property, plant and equipment are set out below:
| | | | | | | | | | | | | | | | | | | | | | | | | | | | | | | | | | | | | | | | |
| | | Land | | | Buildings | | | Infrastructure | | | Major plant and equipment | | | Heritage and cultural assets | |
| | | 2016 | | | 2015 | | | 2016 | | | 2015 | | | 2016 | | | 2015 | | | 2016 | | | 2015 | | | 2016 | | | 2015 | |
| | | $M | | | $M | | | $M | | | $M | | | $M | | | $M | | | $M | | | $M | | | $M | | | $M | |
Carrying amount at beginning of year | | | 83,290 | | | | 79,235 | | | | 35,101 | | | | 33,300 | | | | 100,740 | | | | 98,728 | | | | 1,371 | | | | 1,767 | | | | 1,024 | | | | 951 | |
Acquisitions | | | 130 | | | | 192 | | | | 262 | | | | 377 | | | | 175 | | | | 167 | | | | 7 | | | | 2 | | | | 4 | | | | 5 | |
Disposals | | | (96 | ) | | | (147 | ) | | | (21 | ) | | | (15 | ) | | | (169 | ) | | | (262 | ) | | | (5 | ) | | | (1 | ) | | | — | | | | — | |
Revaluation increments/(decrements) | | | 6,575 | | | | 3,885 | | | | 1,130 | | | | 698 | | | | 14,690 | | | | (3,236 | ) | | | (117 | ) | | | (467 | ) | | | 67 | | | | 57 | |
Impairment (losses)/reversals | | | (2 | ) | | | 9 | | | | — | | | | (2 | ) | | | (101 | ) | | | 83 | | | | — | | | | — | | | | — | | | | — | |
Depreciation and amortisation | | | — | | | | — | | | | (1,436 | ) | | | (1,381 | ) | | | (2,607 | ) | | | (2,890 | ) | | | (94 | ) | | | (149 | ) | | | (29 | ) | | | (5 | ) |
Net asset transfers | | | 199 | | | | 117 | | | | 280 | | | | 2,123 | | | | 4,663 | | | | 8,149 | | | | 69 | | | | 219 | | | | 284 | | | | 15 | |
| | | | | | | | | | | | | | | | | | | | | | | | | | | | | | | | | | | | | | | | |
Carrying amount at end of year | | | 90,096 | | | | 83,290 | | | | 35,316 | | | | 35,101 | | | | 117,390 | | | | 100,740 | | | | 1,232 | | | | 1,371 | | | | 1,349 | | | | 1,024 | |
| | | | | | | | | | | | | | | | | | | | | | | | | | | | | | | | | | | | | | | | |
| | | | | | | | | | | | | | | | | | | | | | | | | | | | | | | | |
| | | Plant and equipment | | | Leased plant and equipment | | | Capital work in progress | | | Total | |
| | | 2016 | | | 2015 | | | 2016 | | | 2015 | | | 2016 | | | 2015 | | | 2016 | | | 2015 | |
| | | $M | | | $M | | | $M | | | $M | | | $M | | | $M | | | $M | | | $M | |
Carrying amount at beginning of year | | | 4,498 | | | | 4,475 | | | | 2,298 | | | | 1,689 | | | | 5,986 | | | | 11,542 | | | | 234,309 | | | | 231,688 | |
Acquisitions | | | 394 | | | | 444 | | | | 341 | | | | 479 | | | | 5,608 | | | | 6,108 | | | | 6,921 | | | | 7,775 | |
Disposals | | | (48 | ) | | | (48 | ) | | | (1 | ) | | | (2 | ) | | | (8 | ) | | | (81 | ) | | | (347 | ) | | | (556 | ) |
Revaluation increments/(decrements) | | | 8 | | | | (2 | ) | | | 41 | | | | (53 | ) | | | — | | | | — | | | | 22,394 | | | | 882 | |
Impairment (losses)/reversals | | | (2 | ) | | | (15 | ) | | | — | | | | — | | | | — | | | | — | | | | (106 | ) | | | 75 | |
Depreciation and amortisation | | | (856 | ) | | | (836 | ) | | | (100 | ) | | | (59 | ) | | | — | | | | — | | | | (5,122 | ) | | | (5,320 | ) |
Net asset transfers | | | 458 | | | | 481 | | | | 211 | | | | 244 | | | | (6,052 | ) | | | (11,582 | ) | | | 112 | | | | (235 | ) |
| | | | | | | | | | | | | | | | | | | | | | | | | | | | | | | | |
Carrying amount at end of year | | | 4,453 | | | | 4,498 | | | | 2,789 | | | | 2,298 | | | | 5,535 | | | | 5,986 | | | | 258,161 | | | | 234,309 | |
| | | | | | | | | | | | | | | | | | | | | | | | | | | | | | | | |
| | | | |
| Audited Consolidated Financial Statements 2015–16 – Government of Queensland | | 6-39 |
Notes to the Financial Statements
| 32. | Property, plant and equipment continued |
Recognition and measurement
Acquisition
Items of property, plant and equipment with a cost or other value greater than the asset recognition threshold of the agency are initially capitalised and recorded at cost. Queensland Treasury’s Non-Current Asset Policies for the Queensland Public Sector mandates asset recognition thresholds for departments and not-for-profit statutory bodies as follows:
| | |
Asset class | | Asset recognition threshold |
Land | | $1 (all land) |
| |
Buildings | | $10,000 |
| |
Infrastructure | | $10,000 |
| |
Plant & equipment | | $5,000 |
| |
Major plant & equipment | | An amount greater than or equal to $5,000, the exact amount of which is at the agency’s discretion. |
| |
Leased assets (finance leases) | | The threshold for the class to which the asset would belong if it were not subject to a finance lease. |
| |
Heritage & cultural assets | | $5,000 |
| |
Work in progress | | n/a |
| |
Library reference collections | | $1,000,000 |
Asset recognition thresholds for other entities within the Total State Sector do not exceed the thresholds above.
Items with a cost or other value below each entity’s recognition threshold are expensed in the year of acquisition. Cost is determined as the value given as consideration, plus costs incidental to the acquisition including all other costs incurred in getting the assets ready for use. Training, marketing and advertising costs are expensed as incurred.
In accordance with AASB 116, administration and other general overhead costs are expensed in the year they are incurred. Overhauls and major inspections are only capitalised if it is probable that future economic benefits associated with them will flow to the entity and their cost can be measured reliably. Any remaining carrying amount of the cost of the previous inspection/overhaul (as distinct from physical parts) is derecognised.
Assets acquired at no cost, or for nominal consideration, that can be measured reliably are recognised initially as assets and revenues at their fair value at the date of acquisition.
Recording and valuation
Land, buildings, infrastructure, major plant and equipment, and heritage and cultural assets are valued at fair value in accordance with AASB 13, AASB 116 and Queensland Treasury’s Non-Current Asset Policies for the Queensland Public Sector.
Other classes of assets are valued at cost which approximates fair value.
On initial recognition, all costs incurred in purchasing or constructing the asset and getting it ready for use are capitalised to the value of the asset. Costs also include the initial estimate of the costs of dismantling and restoring the site on which it is located, where that obligation is recognised and measured in accordance with AASB 137 Provisions, Contingent Liabilities and Contingent Assets.
| | | | |
| 6-40 | | Audited Consolidated Financial Statements 2015–16 – Government of Queensland |
Notes to the Financial Statements
| 32. | Property, plant and equipment continued |
| | Recognition and measurement continued |
Recording and valuation continued
Subsequent costs are added to the carrying amount of the asset when it improves the condition of the asset beyond its originally assessed standard of performance or capacity. Otherwise, subsequent costs are expensed.
Non-current physical assets measured at fair value are comprehensively revalued once every five years or as appropriate, with interim valuations using relevant indices being otherwise performed on an annual basis. Separately identified components of assets are measured on the same basis as the assets to which they relate.
Any revaluation increment arising on the revaluation of an asset is credited to the asset revaluation reserve for that class of assets, except to the extent it reverses a revaluation decrement for the class of assets previously recognised as an other economic flow in the Operating Statement. A decrease in the carrying amount on revaluation is charged as an other economic flow in the Operating Statement, to the extent it exceeds the balance of the relevant asset revaluation reserve for the same class of assets.
Items or components that form an integral part of an asset are recognised as a single asset (functional asset). The recognition threshold is applied to the aggregate cost of each functional asset. Energy entities’ easements are disclosed as part of property, plant and equipment because they are considered to be an integral part of the property, plant and equipment of those entities.
Non-reciprocal transfers of assets between wholly-owned Queensland public sector entities, are accounted for as adjustments to contributed equity in accordance with AASB Interpretation 1038 Contributions by Owners Made to Wholly-owned Public Sector Entities.
Impairment
Property, plant and equipment assets are assessed for indicators of impairment on an annual basis. If an indicator of possible impairment exists, the State determines the asset’s recoverable amount, being the higher of the asset’s fair value less costs to sell and current replacement cost. Any amount by which the asset’s carrying amount exceeds the recoverable amount is recorded as an impairment loss.
An impairment loss is recognised as an other economic flow in the Operating Statement, unless the asset is carried at a revalued amount. When assets are measured at a revalued amount, the impairment loss is offset against the asset revaluation surplus of the relevant class. Impairment losses are reversed when there is an indication that the impairment loss may no longer exist and there has been a change in the estimated recoverable amount.
Refer to Note 16 for further information on the State’s policy on impairment, and for any impairment losses recognised in the Operating Statement.
Land under roads
Land under roads is included in the asset class ‘land’ until road declarations for each land portion are confirmed. The value included in the balance of land is approximately $52 billion (2014-15: $47 billion).
All land under roads acquired is recorded at fair value in accordance with AASB 13 and AASB 116 using an englobo basis based on the statutory land valuations (as agreed by all state Valuers-General in 2009).
The englobo method reflects the characteristics that would be taken into account by a potential buyer of land under roads that is made available for sale (after having the legislative restriction removed). Englobo valuation is inclusive of all potential land uses and assumes that if removal of the legislative restriction occurred, land under roads would revert to its original state before subdivision. The methodology is appropriate for all land under roads, regardless of its location or whatever type of road infrastructure (if any) is currently on it.
Fair value is determined by the State Valuation Services using an acceptable, reliable valuation methodology which is undertaken by multiplying the total area of land under roads within each local government area by the average statutory value of all freehold and leasehold land within the corresponding local government area. The statutory valuations for non-rural land are determined on the basis of site value, with the unimproved value used for rural land.
| | | | |
| Audited Consolidated Financial Statements 2015–16 – Government of Queensland | | 6-41 |
Notes to the Financial Statements
| 32. | Property, plant and equipment continued |
| | Recognition and measurement continued |
Property, plant and equipment held for rental
Items of property, plant and equipment that have been held for rental to others are routinely sold in the course of the State’s ordinary business, these assets are transferred to inventories at their carrying amount when they cease to be rented and become held for sale. Cash received from the subsequent sale of assets that were previously held for rental to others and cash paid to purchase these assets are recognised as operating activities rather than investing activities.
Fair value measurement
Fair value is the price that would be received to sell an asset or paid to transfer a liability in an orderly transaction between market participants at the measurement date under current market conditions (i.e. an exit price) regardless of whether that price is directly derived from observable inputs or estimated using another valuation technique.
Observable inputs are publicly available data that are relevant to the characteristics of the assets/liabilities being valued. Observable inputs used by the State include, but are not limited to, published sales data for land and general office buildings.
Unobservable inputs are data, assumptions and judgements that are not available publicly but are relevant to the characteristics of the assets/liabilities being valued. Significant unobservable inputs used by the State include, but are not limited to, subjective adjustments made to observable data to take account of the characteristics of the State assets/liabilities, internal records of recent construction costs (and/or estimates of such costs) for assets’ characteristics/functionality, and assessments of physical condition and remaining useful life. Unobservable inputs are used to the extent that sufficient relevant and reliable observable inputs are not available for similar assets/liabilities.
A fair value measurement of a non-financial asset takes into account a market participant’s ability to generate economic benefits by using the asset in its highest and best use.
All assets and liabilities of the State for which fair value is measured or disclosed in the financial statements are categorised within the following fair value hierarchy, based on the data and assumptions used in the most recent specific appraisals:
| | – Level 1: | represents fair value measurements that reflect unadjusted quoted market prices in active markets for identical assets and liabilities; |
| | – Level 2: | represents fair value measurements that are substantially derived from inputs (other than quoted prices included within level 1) that are observable, either directly or indirectly; and |
| | – Level 3: | represents fair value measurements that are substantially derived from unobservable inputs. |
None of the State’s valuations of non-financial assets are eligible for categorisation into level 1 of the fair value hierarchy.
More specific fair value information about the State’s property, plant and equipment is outlined below.
| | | | |
| 6-42 | | Audited Consolidated Financial Statements 2015–16 – Government of Queensland |
Notes to the Financial Statements
| 32. | Property, plant and equipment continued |
Level 3 fair value reconciliation
| | | | | | | | | | | | | | | | | | | | | | | | | | | | | | | | | | | | | | | | |
| General Government Sector | |
| | | Land | | | Buildings | | | Infrastructure | | | Major plant and equipment | | | Heritage and cultural assets | |
| | | 2016 | | | 2015 | | | 2016 | | | 2015 | | | 2016 | | | 2015 | | | 2016 | | | 2015 | | | 2016 | | | 2015 | |
| | | $M | | | $M | | | $M | | | $M | | | $M | | | $M | | | $M | | | $M | | | $M | | | $M | |
Carrying amount at beginning of year | | | 58,900 | | | | 55,256 | | | | 28,755 | | | | 27,411 | | | | 50,553 | | | | 49,930 | | | | 279 | | | | 271 | | | | 1,070 | | | | 999 | |
Acquisitions | | | 3 | | | | 1 | | | | 185 | | | | 482 | | | | 4 | | | | 2 | | | | 5 | | | | — | | | | 4 | | | | 6 | |
Disposals | | | (71 | ) | | | (43 | ) | | | (18 | ) | | | (13 | ) | | | (5 | ) | | | (5 | ) | | | — | | | | — | | | | — | | | | — | |
Revaluation increments/(decrements) | | | 5,084 | | | | 3,404 | | | | 1,183 | | | | 719 | | | | 15,200 | | | | (3,723 | ) | | | 23 | | | | 20 | | | | 63 | | | | 56 | |
Impairment (losses)/reversals | | | — | | | | 8 | | | | (11 | ) | | | (1 | ) | | | — | | | | (1 | ) | | | — | | | | — | | | | — | | | | — | |
Depreciation and amortisation | | | (4 | ) | | | (4 | ) | | | (1,189 | ) | | | (1,149 | ) | | | (830 | ) | | | (1,116 | ) | | | (24 | ) | | | (24 | ) | | | (28 | ) | | | (5 | ) |
Net asset transfers | | | 366 | | | | 278 | | | | 230 | | | | 1,306 | | | | 1,993 | | | | 5,466 | | | | 34 | | | | 12 | | | | 275 | | | | 15 | |
| | | | | | | | | | | | | | | | | | | | | | | | | | | | | | | | | | | | | | | | |
Carrying amount at end of year | | | 64,278 | | | | 58,900 | | | | 29,136 | | | | 28,755 | | | | 66,915 | | | | 50,553 | | | | 317 | | | | 279 | | | | 1,384 | | | | 1,070 | |
| | | | | | | | | | | | | | | | | | | | | | | | | | | | | | | | | | | | | | | | |
| | | | | | | | |
| | | | | | | | | | | | | | | | | | | | | Leased plant and equipment | | | Total | |
| | | | | | | | | | | | | | | | | | | | | 2016 | | | 2015 | | | 2016 | | | 2015 | |
| | | | | | | | | | | | | | | | | | | | | $M | | | $M | | | $M | | | $M | |
Carrying amount at beginning of year | | | | | | | | | | | | | | | | | | | | | | | | | | | 523 | | | | 470 | | | | 140,080 | | | | 134,338 | |
Acquisitions | | | | | | | | | | | | | | | | | | | | | | | | | | | 97 | | | | 58 | | | | 298 | | | | 549 | |
Disposals | | | | | | | | | | | | | | | | | | | | | | | | | | | — | | | | — | | | | (94 | ) | | | (61 | ) |
Revaluation increments/(decrements) | | | | | | | | | | | | | | | | | | | | | | | | | | | 21 | | | | — | | | | 21,574 | | | | 475 | |
Impairment (losses)/reversals | | | | | | | | | | | | | | | | | | | | | | | | | | | — | | | | — | | | | (11 | ) | | | 6 | |
Depreciation and amortisation | | | | | | | | | | | | | | | | | | | | | | | | | | | (6 | ) | | | (5 | ) | | | (2,082 | ) | | | (2,304 | ) |
Net asset transfers | | | | | | | | | | | | | | | | | | | | | | | | | | | — | | | | — | | | | 2,899 | | | | 7,077 | |
| | | | | | | | | | | | | | | | | | | | | | | | | | | | | | | | | | | | | | | | |
Carrying amount at end of year | | | | | | | | | | | | | | | | | | | | | | | | | | | 634 | | | | 523 | | | | 162,665 | | | | 140,081 | |
| | | | | | | | | | | | | | | | | | | | | | | | | | | | | | | | | | | | | | | | |
| | | | |
| Audited Consolidated Financial Statements 2015–16 – Government of Queensland | | 6-43 |
Notes to the Financial Statements
| 32. | Property, plant and equipment continued |
| | | | | | | | | | | | | | | | | | | | | | | | | | | | | | | | | | | | | | | | |
Level 3 fair value reconciliation | |
|
Total State Sector | |
| | | Land | | | Buildings | | | Infrastructure | | | Major plant and equipment | | | Heritage and cultural assets | |
| | | 2016 | | | 2015 | | | 2016 | | | 2015 | | | 2016 | | | 2015 | | | 2016 | | | 2015 | | | 2016 | | | 2015 | |
| | | $M | | | $M | | | $M | | | $M | | | $M | | | $M | | | $M | | | $M | | | $M | | | $M | |
Carrying amount at beginning of year | | | 60,694 | | | | 56,972 | | | | 30,593 | | | | 29,283 | | | | 100,936 | | | | 98,863 | | | | 1,344 | | | | 1,737 | | | | 1,070 | | | | 999 | |
Acquisitions | | | 46 | | | | 27 | | | | 246 | | | | 506 | | | | 949 | | | | 1,089 | | | | 6 | | | | — | | | | 4 | | | | 6 | |
Disposals | | | (79 | ) | | | (57 | ) | | | (26 | ) | | | (17 | ) | | | (14 | ) | | | (25 | ) | | | (5 | ) | | | (1 | ) | | | — | | | | — | |
Revaluation increments/(decrements) | | | 5,152 | | | | 3,463 | | | | 1,261 | | | | 758 | | | | 14,731 | | | | (3,260 | ) | | | (116 | ) | | | (467 | ) | | | 63 | | | | 56 | |
Impairment (losses)/reversals | | | — | | | | 10 | | | | (11 | ) | | | (1 | ) | | | (107 | ) | | | 119 | | | | — | | | | — | | | | — | | | | — | |
Depreciation and amortisation | | | (10 | ) | | | (7 | ) | | | (1,292 | ) | | | (1,259 | ) | | | (2,572 | ) | | | (2,856 | ) | | | (94 | ) | | | (144 | ) | | | (28 | ) | | | (5 | ) |
Net asset transfers | | | 421 | | | | 286 | | | | 272 | | | | 1,323 | | | | 3,672 | | | | 7,006 | | | | 90 | | | | 219 | | | | 275 | | | | 15 | |
| | | | | | | | | | | | | | | | | | | | | | | | | | | | | | | | | | | | | | | | |
Carrying amount at end of year | | | 66,224 | | | | 60,694 | | | | 31,043 | | | | 30,593 | | | | 117,596 | | | | 100,936 | | | | 1,227 | | | | 1,344 | | | | 1,384 | | | | 1,070 | |
| | | | | | | | | | | | | | | | | | | | | | | | | | | | | | | | | | | | | | | | |
| | | | | |
| | | | | | | | | | | | Leased plant and equipment | | | Total | |
| | | | | | | | | | | | | | | | | | | | | 2016 | | | 2015 | | | 2016 | | | 2015 | |
| | | | | | | | | | | | | | | | | | | | | $M | | | $M | | | $M | | | $M | |
Carrying amount at beginning of year | | | | | | | | | | | | | | | | 523 | | | | 470 | | | | 195,160 | | | | 188,325 | |
Acquisitions | | | | | | | | | | | | | | | | | | | | 97 | | | | 58 | | | | 1,348 | | | | 1,685 | |
Disposals | | | | | | | | | | | | | | | | | | | | — | | | | — | | | | (124 | ) | | | (102 | ) |
Revaluation increments/(decrements) | | | | | | | | | | | | | | | | | | | | 21 | | | | — | | | | 21,111 | | | | 551 | |
Impairment (losses)/reversals | | | | | | | | | | | | | | | | | | | | — | | | | — | | | | (117 | ) | | | 127 | |
Depreciation and amortisation | | | | | | | | | | | | | | | | | | | | (6 | ) | | | (5 | ) | | | (4,002 | ) | | | (4,276 | ) |
Net asset transfers | | | | | | | | | | | | | | | | | | | | — | | | | — | | | | 4,731 | | | | 8,849 | |
| | | | | | | | | | | | | | | | | | | | | | | | | | | | | | | | | | | | | | | | |
Carrying amount at end of year | | | | | | | | | | | | | | | | | | | | 634 | | | | 523 | | | | 218,108 | | | | 195,160 | |
| | | | | | | | | | | | | | | | | | | | | | | | | | | | | | | | | | | | | | | | |
| | | | |
| 6-44 | | Audited Consolidated Financial Statements 2015–16 – Government of Queensland |
Notes to the Financial Statements
| 32. | Property, plant and equipment continued |
Level 3 significant valuation inputs and relationship to fair value
| | | | |
General Government Sector |
Description | | Fair value at
30 June 2016
$M | | Significant unobservable inputs |
| Land | | 64,278 | | Level 3 land assets are mainly comprised of those held by the Department of Natural Resources and Mines and Department of National Parks, Sport and Racing. These assets are classified as land under roads, reserves and unallocated state land, national parks and leasehold land. |
| | | | Land under roads not subject to freehold or leasehold title or reserve tenure vests in the State. This land is valued using the englobo approach as agreed by State Valuers-General. The most significant unobservable input in the valuation of land under roads is the valuers’ judgement in relation to the value that the market would assign to the restrictions placed on the land. |
| | | | The valuation of reserves and unallocated state land is based, where possible, on recent sales in the general location of the land, adjusted for specific attributes of and restrictions on the land being valued. As such, the most significant unobservable input into the valuation of reserves and unallocated state land is the valuers’ professional judgement applied in determining the fair value. |
| | | | National park land is valued with reference to sales of land with a similar topography and location. This market data is adjusted by the valuer to reflect the nature of restrictions upon national park land. Accordingly, the most significant input to the valuation of national park land is the valuers’ judgement in relation to the adjustments potential market participants would make to the price paid for this land in light of the restrictions. |
| | | | Leasehold land is valued using the present value of the future income from leases over the land. In calculating the value of leasehold land, the discount rate applied to the leases is a significant unobservable input. |
| Buildings | | 29,136 | | Buildings classified as Level 3 are those, which due to their specialised nature and/or construction, do not have an active market. These assets are generally valued using a depreciated replacement cost approach. |
| | | | Within level 3 buildings, major sub-groups exist which are valued using similar methods. The most significant of these groups are schools and early childhood buildings, correctional centres, court houses and juvenile justice facilities, health services buildings (including hospitals) and social housing. |
| | | | Schools and early childhood buildings are valued on a depreciated replacement cost basis, utilising published current construction costs for the standard components of the buildings. Adjustments and allowances are made for specialised fit out requirements and more contemporary construction/design approaches. Significant judgement is also required in determining the remaining service life of these buildings. |
| | | | Correctional centres, court houses and juvenile justice facilities are valued using a depreciated replacement cost approach. Significant inputs into this approach are construction costs, locality allowances for regional and remote facilities, remaining useful life and current condition assessments. |
| | | | |
| Audited Consolidated Financial Statements 2015–16 – Government of Queensland | | 6-45 |
Notes to the Financial Statements
| 32. | Property, plant and equipment continued |
Level 3 significant valuation inputs and relationship to fair value continued
| | | | |
General Government Sector continued |
Description | | Fair value at
30 June 2016
$M | | Significant unobservable inputs |
| Buildings continued | | | | Health services buildings (including hospitals) are valued using depreciated replacement cost. In determining the replacement cost of each building, the estimated replacement cost of the asset, or the likely cost of construction, an assessment is performed based on historical records and adjusted for contemporary design/construction practices. The resulting values are adjusted using published locality indices to allow for regional and remote location. The valuers apply professional judgement in assessing the asset’s current condition and remaining service life. |
| | | | Social housing is valued using market based inputs. However, because multi-unit properties do not have separate titles, significant adjustments are made by valuers. Significant unobservable inputs to the valuers’ adjustments are the discount rate applied to represent the cost of obtaining strata title. |
| Infrastructure | | 66,915 | | Level 3 infrastructure within the General Government sector is primarily roads held by the Department of Transport and Main Roads, and roads and tracks within national parks and state forests. Due to their specialised nature and the lack of an active market for infrastructure, these assets are valued using a depreciated replacement cost methodology. |
| | | | Road infrastructure, and roads and tracks within national parks and state forests are valued based on a combination of raw material and other costs of construction compiled by an external expert and internal assumptions based on engineering professional judgement. These inputs take into consideration climatic and environmental conditions for each location and are adjusted for contemporary technology and construction techniques. Accordingly, the most significant unobservable input to the valuation of roads is the calculated replacement cost which is heavily reliant upon engineers’ and valuers’ professional judgement. |
| | | | During 2015-16, the road infrastructure valuation methodology was reviewed by the Department of Transport and Main Roads, and National Parks, Sport and Racing. Both departments now apply a resource-based assessment for valuation using a series of road stereotypes, with Transport and Main Roads specifically applying a reconstruction approach in deriving replacement cost, rather than the ‘greenfield’ approach used in previous years. The useful lives of road components were also reassessed and extended in some cases. The review has resulted in significant revaluation of infrastructure and is reflected in the reconciliation tables above. |
| Heritage and cultural assets | | 1,384 | | Heritage and cultural assets are mainly comprised of unique or iconic items which are considered to be of historical or cultural significance. These assets are primarily held by the Queensland Art Gallery and the Queensland Museum. While some of these items are able to be traded, such transactions are highly individualised and accordingly it is not considered that there is an active market for these types of assets. |
| | | | Collections held by the Queensland Art Gallery and Queensland Museum are largely valued on an individual basis with reference to recent transactions in similar works or the cost of replicating or recollecting items. Due to the unique nature of these items, despite some reliance on recent transactions in similar items, the most significant input to the valuation of collections held by the Queensland Art Gallery and Queensland Museum is the professional judgement of the valuer. |
| | | | |
| 6-46 | | Audited Consolidated Financial Statements 2015–16 – Government of Queensland |
Notes to the Financial Statements
| 32. | Property, plant and equipment continued |
Level 3 significant valuation inputs and relationship to fair value continued
| | | | |
Total State Sector |
Description | | Fair value at 30
June 2016
$M | | Significant unobservable inputs |
| Infrastructure | | 117,596 | | In addition to the infrastructure assets identified above in the General Government Sector, level 3 infrastructure for the Total State Sector includes water, ports, electricity and rail infrastructure assets. |
| | |
| | | | The majority of water infrastructure assets (mainly Seqwater) are valued using an income based approach. Unobservable inputs in this type of valuation include assumptions about future market conditions and selection of an appropriate discount rate. The discount rate is a significant unobservable input to the valuation of water infrastructure. |
| | |
| | | | Port infrastructure has been largely valued using an income based approach. Inherent in this valuation process are assumptions in relation to future operating cash flows, projected capital replacement and selection of an appropriate discount rate (equal to the Weighted Average Cost of Capital) for the organisation holding the assets. The discount rate has a significant impact upon the final valuation and, being based upon professional judgement, is an unobservable input. |
| | |
| | | | The valuation of electricity distribution and transmission infrastructure is undertaken using an income based approach. Being regulated assets, significant professional judgement is required in forecasting future cash flows. The significant unobservable inputs affecting the valuation of electricity infrastructure include assumptions about future revenue caps, future capital expenditure requirements and selection of an appropriate discount rates. |
| | |
| | | | The valuation of NEM connected power stations is based on an income approach using a pre-tax nominal cash flow and discount rate model and various demand, supply and RET scenarios. The significant unobservable inputs affecting the valuation include assumptions about electricity spot prices, contract load and premium and discount rate. |
| | |
| | | | The majority of rail infrastructure is valued using a depreciated replacement cost methodology except for regional freight assets which are valued on a discounted cash flow basis. The significant unobservable inputs to the depreciated replacement cost valuation are costs to replace existing assets and the assessments of current asset condition and remaining useful life. |
| Major Plant and Equipment | | 1,227 | | Major plant and equipment in the Total State Sector is primarily Queensland Rail rollingstock. |
| | |
| | | | Rollingstock is valued using a depreciated replacement cost approach. The significant unobservable inputs to the valuation of rollingstock are estimated costs to replace existing assets and the assumptions made about current asset condition and remaining useful life. |
| | | | |
| Audited Consolidated Financial Statements 2015–16 – Government of Queensland | | 6-47 |
Notes to the Financial Statements
| 32. | Property, plant and equipment continued |
Assets not recognised
The following assets are not recognised in the Balance Sheet:
Railway corridor land
Under the Transport Infrastructure Act 1994, railway corridor land was rendered State land under the control of the Department of Natural Resources and Mines which for reporting purposes recorded the land at nil value. This land is on-leased to Queensland Rail via the Department of Transport and Main Roads at no cost.
Library collections
Purchases for common use collections are expensed as they are incurred, except for the State Library’s Library Collection. Purchases for this collection are capitalised and held at fair value in accordance with Queensland Treasury’s Non-Current Asset Policies for the Queensland Public Sector, except for certain heritage assets whose value cannot be reliably measured.
Native forests and biological assets
Disclosures are outlined in Note 34 Other Non-financial assets.
User funded assets
Certain wharf facilities, bulk sugar terminals, bulk molasses terminals, bulk grain terminals and grain loading facilities have been constructed on land controlled by Queensland port corporations. These assets are not included in the Balance Sheet as users of the assets have either fully or partially funded these facilities and they are either not considered to be controlled by the corporations or no income will flow from the facilities.
Heritage assets
Certain heritage assets, including artefacts, memorabilia and other historical objects held by agencies, have not been valued or included in the Balance Sheet because of the unique nature of the items and the difficulty in determining a reliable value.
| | | | |
| 6-48 | | Audited Consolidated Financial Statements 2015–16 – Government of Queensland |
Notes to the Financial Statements
| | | | | | | | | | | | | | | | | | | | | | | | |
General Government Sector | | | | | | | | | | | | | | | | | | | | | | | | |
| | | Cost | | | Accumulated amortisation | | | Written down value | |
| | | 2016 | | | 2015 | | | 2016 | | | 2015 | | | 2016 | | | 2015 | |
| | | $M | | | $M | | | $M | | | $M | | | $M | | | $M | |
Software development | | | 1,740 | | | | 1,715 | | | | (1,149 | ) | | | (1,133 | ) | | | 591 | | | | 582 | |
Purchased software | | | 386 | | | | 402 | | | | (304 | ) | | | (312 | ) | | | 82 | | | | 90 | |
Other | | | 49 | | | | 48 | | | | (8 | ) | | | (7 | ) | | | 41 | | | | 41 | |
| | | | | | | | | | | | | | | | | | | | | | | | |
| | | 2,176 | | | | 2,165 | | | | (1,461 | ) | | | (1,452 | ) | | | 714 | | | | 713 | |
| | | | | | | | | | | | | | | | | | | | | | | | |
| | | |
| | | Software | | | Other | | | Total | |
| | | 2016 | | | 2015 | | | 2016 | | | 2015 | | | 2016
| | | 2015
| |
| | | $M | | | $M | | | $M | | | $M | | | $M | | | $M | |
Carrying amount at beginning of year | | | 671 | | | | 751 | | | | 41 | | | | 25 | | | | 713 | | | | 776 | |
Acquisitions | | | 8 | | | | 5 | | | | 2 | | | | 13 | | | | 10 | | | | 18 | |
Acquisitions through internal development | | | 142 | | | | 100 | | | | — | | | | — | | | | 142 | | | | 100 | |
Disposals | | | (2 | ) | | | (29 | ) | | | — | | | | — | | | | (2 | ) | | | (29 | ) |
Impairment (losses)/reversals | | | (17 | ) | | | — | | | | — | | | | — | | | | (17 | ) | | | — | |
Amortisation | | | (132 | ) | | | (148 | ) | | | (3 | ) | | | (2 | ) | | | (134 | ) | | | (150 | ) |
Net asset transfers | | | 2 | | | | (7 | ) | | | 2 | | | | 3 | | | | 4 | | | | (4 | ) |
| | | | | | | | | | | | | | | | | | | | | | | | |
Carrying amount at end of year | | | 672 | | | | 671 | | | | 42 | | | | 41 | | | | 714 | | | | 713 | |
| | | | | | | | | | | | | | | | | | | | | | | | |
| | | | |
| Audited Consolidated Financial Statements 2015–16 – Government of Queensland | | 6-49 |
Notes to the Financial Statements
| | | | | | | | | | | | | | | | | | | | | | | | | | | | | | | | |
Total State Sector | | | | | | | | | | | | | | | | | | | | | | | | | | | | | | | | |
| | | Cost | | | Valuation | | | Accumulated
amortisation | | | Written
down value | |
| | | 2016 | | | 2015 | | | 2016 | | | 2015 | | | 2016 | | | 2015 | | | 2016 | | | 2015 | |
| | | $M | | | $M | | | $M | | | $M | | | $M | | | $M | | | $M | | | $M | |
Software development | | | 2,350 | | | | 2,287 | | | | — | | | | — | | | | (1,546 | ) | | | (1,481 | ) | | | 804 | | | | 806 | |
Purchased software | | | 863 | | | | 864 | | | | 13 | | | | 15 | | | | (635 | ) | | | (665 | ) | | | 241 | | | | 213 | |
Licences and rights | | | 16 | | | | 14 | | | | 55 | | | | 55 | | | | (56 | ) | | | (54 | ) | | | 16 | | | | 15 | |
Other | | | 326 | | | | 323 | | | | 8 | | | | 7 | | | | (46 | ) | | | (39 | ) | | | 287 | | | | 290 | |
| | | | | | | | | | | | | | | | | | | | | | | | | | | | | | | | |
| | | 3,555 | | | | 3,487 | | | | 76 | | | | 76 | | | | (2,283 | ) | | | (2,239 | ) | | | 1,348 | | | | 1,324 | |
| | | | | | | | | | | | | | | | | | | | | | | | | | | | | | | | |
| | | | |
| | | Software | | | Licences
and rights | | | Other | | | Total | |
| | | 2016 | | | 2015 | | | 2016 | | | 2015 | | | 2016 | | | 2015 | | | 2016 | | | 2015 | |
| | | $M | | | $M | | | $M | | | $M | | | $M | | | $M | | | $M | | | $M | |
Carrying amount at beginning of year | | | 1,019 | | | | 1,061 | | | | 15 | | | | 64 | | | | 290 | | | | 269 | | | | 1,324 | | | | 1,393 | |
Acquisitions | | | 45 | | | | 13 | | | | — | | | | — | | | | 4 | | | | 21 | | | | 49 | | | | 34 | |
Acquisitions through internal development | | | 147 | | | | 162 | | | | — | | | | — | | | | — | | | | — | | | | 147 | | | | 162 | |
Disposals | | | (3 | ) | | | (29 | ) | | | — | | | | — | | | | — | | | | — | | | | (3 | ) | | | (29 | ) |
Impairment (losses)/reversals | | | (17 | ) | | | — | | | | — | | | | (48 | ) | | | — | | | | — | | | | (17 | ) | | | (48 | ) |
Amortisation | | | (232 | ) | | | (254 | ) | | | (1 | ) | | | (1 | ) | | | (8 | ) | | | (8 | ) | | | (241 | ) | | | (263 | ) |
Net asset transfers | | | 87 | | | | 67 | | | | 2 | | | | — | | | | 1 | | | | 6 | | | | 90 | | | | 73 | |
| | | | | | | | | | | | | | | | | | | | | | | | | | | | | | | | |
Carrying amount at end of year | | | 1,045 | | | | 1,019 | | | | 16 | | | | 15 | | | | 287 | | | | 290 | | | | 1,348 | | | | 1,324 | |
| | | | | | | | | | | | | | | | | | | | | | | | | | | | | | | | |
Intangible assets are recognised in accordance with AASB 138 Intangible Assets. Queensland Treasury’s Non-Current Asset Policies for the Queensland Public Sector which is applicable to departments and statutory bodies, mandates classes of non-current physical and intangible assets. Software is classified as an intangible asset, rather than property, plant and equipment unless it is an integral part of the related hardware.
Internally generated goodwill, brands, and items of similar substance, as well as expenditure on initial research, are specifically excluded from being recognised in the Balance Sheet.
In accordance with the Non-Current Assets Policies for the Queensland Public Sector, the recognition threshold for departments and not-for-profit statutory bodies is $100,000. Items with a lesser value are expensed. The threshold for other entities does not exceed this amount.
Internally generated intangible assets are only revalued where an active market exists for the asset in question, otherwise they are measured at cost.
For information on Impairment policies, refer to Note 16.
| | | | |
| 6-50 | | Audited Consolidated Financial Statements 2015–16 – Government of Queensland |
Notes to the Financial Statements
| | | | | | | | | | | | | | | | | | |
| | | | | General Government
Sector | | | Total State Sector | |
| | | | | 2016 | | | 2015 | | | 2016 | | | 2015 | |
| | | | | $M | | | $M | | | $M | | | $M | |
34. | | Other non-financial assets | | | | | | | | | | | | | | | | |
| | | | | |
| | Current | | | | | | | | | | | | | | | | |
| | Prepayments | | | 306 | | | | 278 | | | | 422 | | | | 412 | |
| | Other | | | 13 | | | | 14 | | | | 118 | | | | 137 | |
| | | | | 319 | | | | 292 | | | | 540 | | | | 550 | |
| | Non-current | | | | | | | | | | | | | | | | |
| | Biological assets | | | 6 | | | | 6 | | | | 7 | | | | 6 | |
| | Prepayments | | | 31 | | | | 32 | | | | 56 | | | | 54 | |
| | Other | | | 13 | | | | 7 | | | | 29 | | | | 31 | |
| | | | | 51 | | | | 45 | | | | 92 | | | | 91 | |
| | | | | | | | | | | | | | | |
| | | | | 370 | | | | 337 | | | | 632 | | | | 641 | |
| | | | | |
| | Other non-financial assets primarily represent prepayments by the State. These prepayments include salaries and wages, grant payments or payments of a general nature made in advance. | | | | | | | | | | | | | | | | |
| | | | | |
| | Biological assets are recognised at fair value which is the amount that could be expected to be received from the disposal of the asset in an active and liquid market, after deducting costs expected to be incurred in realising the proceeds of such a disposal. | | | | | | | | | | | | | | | | |
| | | | | |
| | Biological assets recognised in the Balance Sheet include livestock (comprising cattle, horses, goats, sheep and pigs), and plants (comprising grain and cotton crops, and timber plantations). | | | | | | | | | | | | | | | | |
| | | | | |
| | Biological assets such as tree fruit orchards, vines and nursery seedlings have been assessed in accordance with AASB 141 Agriculture , found not to be material and accordingly, not recognised. | | | | | | | | | | | | | | | | |
| | | | | |
35. | | Payables | | | | | | | | | | | | | | | | |
| | | | | |
| | Current | | | | | | | | | | | | | | | | |
| | Trade creditors | | | 1,707 | | | | 1,743 | | | | 2,547 | | | | 2,373 | |
| | Grants and other contributions | | | 221 | | | | 543 | | | | 130 | | | | 431 | |
| | GST payable | | | 58 | | | | 76 | | | | 139 | | | | 184 | |
| | Other payables | | | 1,539 | | | | 828 | | | | 1,624 | | | | 954 | |
| | | | | 3,525 | | | | 3,189 | | | | 4,440 | | | | 3,943 | |
| | Non-current | | | | | | | | | | | | | | | | |
| | Trade creditors | | | 66 | | | | 56 | | | | 86 | | | | 64 | |
| | Other payables | | | 6 | | | | 10 | | | | 9 | | | | 12 | |
| | | | | 71 | | | | 66 | | | | 94 | | | | 75 | |
| | | | | | | | | | | | | | | |
| | | | | 3,596 | | | | 3,255 | | | | 4,535 | | | | 4,019 | |
| | | | | |
| | Payables mainly represent amounts owing for goods and services provided to the State prior to the end of the financial year. The amounts are unsecured, are usually paid within 30 days of recognition and are non-interest bearing. | | | | | | | | | | | | | | | | |
| | | | | |
| | Payables are recognised at amortised cost using the effective interest rate method. | | | | | | | | | | | | | | | | |
| | | | | |
36. | | Employee benefit obligations | | | | | | | | | | | | | | | | |
| | | | | |
| | (a) Superannuation liability | | | | | | | | | | | | | | | | |
| | | | | |
| | Current | | | | | | | | | | | | | | | | |
| | Superannuation (refer Note 48) | | | 1,903 | | | | 1,924 | | | | 1,903 | | | | 1,924 | |
| | Judges’ pensions (refer Note 48) | | | 19 | | | | 19 | | | | 19 | | | | 19 | |
| | | | | 1,923 | | | | 1,943 | | | | 1,923 | | | | 1,943 | |
| | Non-current | | | | | | | | | | | | | | | | |
| | Superannuation (refer Note 48) | | | 24,702 | | | | 23,281 | | | | 24,532 | | | | 22,977 | |
| | Judges’ pensions (refer Note 48) | | | 735 | | | | 645 | | | | 735 | | | | 645 | |
| | | | | 25,437 | | | | 23,927 | | | | 25,267 | | | | 23,622 | |
| | | | | | | | | | | | | | | |
| | | | | 27,360 | | | | 25,869 | | | | 27,189 | | | | 25,566 | |
| | | | | | | | | | | | | | | | | | |
| | | | |
| Audited Consolidated Financial Statements 2015–16 – Government of Queensland | | 6-51 |
Notes to the Financial Statements
| 36. | Employee benefit obligations continued |
Superannuation/retirement benefit obligations
A superannuation liability for the State public sector is recognised in respect of the various employees’ accrued superannuation benefits and represents the difference between the net market value of plan assets and the estimated accrued superannuation benefits at year end.
The present value of the accrued benefits is calculated using the projected unit credit method and represents the actuarial value of all benefits that are expected to become payable in the future in respect of contributions made or periods of service completed prior to the valuation date, allowing for future salary increases.
The costs of providing future benefits to employees are recognised over the period during which employees provide services. All superannuation plan costs, excluding actuarial gains and losses, are recognised in the Operating Statement. Actuarial gains and losses are recognised directly in equity on an annual basis and represent experience adjustments (the effects of differences between the previous actuarial assumptions and what has actually occurred e.g. investment returns on plan assets) and the effects of changes in actuarial assumptions underlying the valuation.
For the State Public Sector Superannuation Scheme (QSuper), expected future payments are discounted using market yields at the reporting date on Government bonds with terms to maturity that match the estimated future cash outflows. The gross discount rate for 10 year Commonwealth bonds at 30 June 2016 was 2.0% (2015, 3.1%).
Employees in the electricity industry contribute to an industry multiple employer superannuation fund, Energy Super Fund (ESF). The ESF uses discount rates in 2016 that are more closely aligned to the corporate bond rate (refer Note 48).
Future taxes are part of the provision of the existing benefit obligations and are taken into account in measuring the net liability or asset.
| | | | | | | | | | | | | | | | |
| | | General Government
Sector | | | Total State
Sector | |
| | | 2016 | | | 2015 | | | 2016 | | | 2015 | |
| | | $M | | | $M | | | $M | | | $M | |
| (b) Other employee benefits | | | | | | | | | | | | | | | | |
| | | | |
| Current | | | | | | | | | | | | | | | | |
| Salary and wages payable | | | 567 | | | | 416 | | | | 647 | | | | 492 | |
| Annual leave | | | 1,622 | | | | 1,518 | | | | 1,794 | | | | 1,685 | |
| Long service leave | | | 477 | | | | 438 | | | | 833 | | | | 757 | |
| Other employee entitlements | | | 46 | | | | 37 | | | | 136 | | | | 130 | |
| | | 2,711 | | | | 2,408 | | | | 3,409 | | | | 3,064 | |
| Non-current | | | | | | | | | | | | | | | | |
| Long service leave | | | 2,490 | | | | 2,300 | | | | 2,587 | | | | 2,393 | |
| Other employee entitlements | | | 15 | | | | 16 | | | | 25 | | | | 26 | |
| | | 2,505 | | | | 2,316 | | | | 2,612 | | | | 2,418 | |
| | | | | | | | | | | | | |
| | | 5,217 | | | | 4,724 | | | | 6,022 | | | | 5,483 | |
| | | | | | | | | | | | | | | | |
Wages, salaries and sick leave
Liabilities for wages and salaries are accrued at year end. For most agencies, sick leave is non-vesting and is expensed as incurred. Liabilities have been calculated based on wage and salary rates at the date they are expected to be paid and include related on-costs.
Annual leave
The Annual Leave Central Scheme (ALCS) was established on 30 June 2008 to centrally fund annual leave obligations of departments, commercialised business units and shared service providers. Members pay a levy equal to their accrued leave cost into the scheme and are reimbursed by the scheme for annual leave payments made to their employees. Entities that do not participate in the ALCS continue to determine and recognise their own leave liabilities.
The State’s annual leave liability has been calculated based on wage and salary rates at the date they are expected to be paid and include related on-costs. In accordance with AASB 119 Employee Benefits, where annual leave is not expected to be paid within 12 months, the liability is measured at the present value of the future cash flows.
Long service leave
A levy of 2.1% of salary and wages costs is paid by participating agencies (predominantly Government departments) into the Long Service Leave Central Scheme which was introduced in 1999-2000. Amounts paid to employees for long service leave are then claimed from the scheme as a reimbursement. The liability is assessed annually by the State Actuary.
| | | | |
| 6-52 | | Audited Consolidated Financial Statements 2015–16 – Government of Queensland |
Notes to the Financial Statements
| 36. | Employee benefit obligations continued |
Long service leave continued
The valuation method used incorporates consideration of expected future wage and salary levels, experience of employee departures and periods of service. On-costs have been included in the liabilities and expenses for the Long Service Leave Central Scheme. These amounts have not been separately identified, as they are not material in the context of the State’s overall employee entitlement liabilities.
The State’s long service leave provisions are calculated in accordance with AASB 119 using yield rates of Government bonds at reporting date and actuarial assumptions which are mutually compatible. The gross discount rate for 10 year Commonwealth bonds at 30 June 2016 was 2.0% (2015, 3.1%).
Entities that do not participate in the Long Service Leave Central Scheme determine their liability for long service leave based on the present value of estimated future cash outflows to be made.
Termination benefits
Termination benefits are payable when employment is terminated before the normal retirement date or when an employee accepts a voluntary redundancy in exchange for these benefits. The State recognises termination benefits when it is demonstrably committed to either terminating the employment of employees according to a detailed formal plan without possibility of withdrawal or providing termination benefits as a result of an offer made to encourage voluntary redundancy.
If termination benefits meet the AASB 119 timeframe criterion for ‘short-term employee benefits’ they are measured according to the AASB 119 requirements for ‘short-term employee benefits’. Otherwise, termination benefits are measured according to the requirements for ‘other long-term employee benefits’.
Benefits falling due more than 12 months after balance date are discounted to present value.
| | | | | | | | | | | | | | | | | | |
| | | | | General Government
Sector | | | Total State Sector | |
| | | | | 2016 | | | 2015 | | | 2016 | | | 2015 | |
| | | | | $M | | | $M | | | $M | | | $M | |
37. | | Deposits, borrowings and advances, securities and derivatives | | | | | | | | | | | | | | | | |
| | | | | |
| | (a) Deposits held | | | | | | | | | | | | | | | | |
| | | | | |
| | Current | | | | | | | | | | | | | | | | |
| | Deposits at fair value through profit or loss | | | 3 | | | | 3 | | | | 4,733 | | | | 5,059 | |
| | Interest bearing security deposits | | | — | | | | — | | | | 20 | | | | 27 | |
| | | | | 3 | | | | 3 | | | | 4,753 | | | | 5,085 | |
| | (b) Borrowings and advances | | | | | | | | | | | | | | | | |
| | | | | |
| | Advances received | | | | | | | | | | | | | | | | |
| | Current | | | | | | | | | | | | | | | | |
| | State debt to the Commonwealth | | | 24 | | | | 132 | | | | 24 | | | | 132 | |
| | | | | |
| | Non-current | | | | | | | | | | | | | | | | |
| | State debt to the Commonwealth | | | 489 | | | | 492 | | | | 489 | | | | 492 | |
| | | | | 514 | | | | 625 | | | | 514 | | | | 625 | |
| | Borrowings | | | | | | | | | | | | | | | | |
| | Current | | | | | | | | | | | | | | | | |
| | Finance lease liability (refer Note 41) | | | 30 | | | | 22 | | | | 56 | | | | 33 | |
| | QTC borrowings | | | 111 | | | | 5,538 | | | | — | | | | — | |
| | Loans - other | | | 1 | | | | 703 | | | | 44 | | | | 763 | |
| | | | | 141 | | | | 6,263 | | | | 100 | | | | 795 | |
| | Non-Current | | | | | | | | | | | | | | | | |
| | Finance lease liability (refer Note 41) | | | 1,256 | | | | 1,036 | | | | 1,260 | | | | 1,067 | |
| | QTC borrowings | | | 34,089 | | | | 35,806 | | | | — | | | | — | |
| | Loans - other | | | — | | | | — | | | | 250 | | | | 191 | |
| | | | | 35,345 | | | | 36,842 | | | | 1,510 | | | | 1,258 | |
| | | | | | | | | | | | | | | |
| | | | | 35,486 | | | | 43,105 | | | | 1,610 | | | | 2,053 | |
| | | | | | | | | | | | | | | | | | |
Lease liabilities are effectively secured, as the rights to the leased assets revert to the lessor in the event of a default. Interest on finance leases is recognised as an expense as it accrues.
| | | | |
| Audited Consolidated Financial Statements 2015–16 – Government of Queensland | | 6-53 |
Notes to the Financial Statements
| 37. | Deposits, borrowings and advances, securities and derivatives continued |
| | | | | | | | | | | | | | | | |
| | | General Government | | | | | | | |
| | | Sector | | | Total State Sector | |
| | | 2016 | | | 2015 | | | 2016 | | | 2015 | |
| | | $M | | | $M | | | $M | | | $M | |
| | | | |
(c) Securities and derivatives | | | | | | | | | | | | | | | | |
| | | | |
Current | | | | | | | | | | | | | | | | |
Government securities issued | | | — | | | | — | | | | 16,376 | | | | 19,577 | |
Derivatives | | | | | | | | | | | | | | | | |
Derivatives - cash flow hedges | | | — | | | | — | | | | 190 | | | | 18 | |
Other derivatives | | | — | | | | — | | | | 194 | | | | 134 | |
| | | — | | | | — | | | | 16,761 | | | | 19,729 | |
Non-current | | | | | | | | | | | | | | | | |
Government securities issued | | | — | | | | — | | | | 84,009 | | | | 81,604 | |
Derivatives | | | | | | | | | | | | | | | | |
Derivatives - cash flow hedges | | | — | | | | — | | | | 60 | | | | 5 | |
Other derivatives | | | — | | | | — | | | | 515 | | | | 446 | |
| | | — | | | | — | | | | 84,585 | | | | 82,055 | |
| | | | | | | | | | | | | |
| | | — | | | | — | | | | 101,346 | | | | 101,784 | |
| | | | | | | | | | | | | | | | |
The classification of deposits held, borrowings and advances, securities and derivatives disclosed in (a), (b) and (c) above are classified as either financial liabilities held at amortised cost or as financial liabilities at fair value through profit or loss. The carrying amount of financial liabilities in each of the categories is disclosed in Note 47.
Financial liabilities held at amortised cost
Financial liabilities held at amortised cost are initially measured at fair value plus any directly attributable transaction costs. Subsequently, such financial liabilities are measured at amortised cost using the effective interest method.
Financial liabilities measured at amortised cost include interest bearing security deposits, GGS loans with QTC and State debt to the Commonwealth (loans made by the Commonwealth under Loan Council agreements). The GGS loans with QTC are eliminated on consolidation of the Total State Sector.
Financial liabilities at fair value through profit or loss
Financial liabilities are classified as fair value through profit or loss at balance date if they are classified as held for trading or designated so upon initial recognition. Financial liabilities at fair value through profit or loss are valued at fair value at balance date. Unrealised gains and losses are brought to account as other economic flows included in the operating result.
Financial liabilities at fair value through profit or loss include deposits, government securities issued by QTC and derivatives. In relation to deposits, income derived from their investment accrues to depositors daily. The amount shown in the Balance Sheet represents the market value of deposits held at balance date. Collateral held and securities which are sold under agreements to repurchase are disclosed as deposits.
Government securities issued include Treasury notes, Australian and overseas bonds, commercial paper and medium term notes, principally raised by QTC.
Derivative financial instruments
The State, through its controlled entities, enters into derivative financial instruments in the normal course of business in order to hedge exposure to movements in interest rates, commodity prices and foreign currency exchange rates. Strict criteria must be met in order for derivatives to be hedge accounted. GGS entities do not engage in speculative trading.
Derivative financial instruments are initially recognised at fair value on the date on which a derivative contract is entered into and are subsequently remeasured to their fair value at each balance date.
Derivative instruments are used to hedge the State’s exposures to interest rate, foreign currency, commodity prices and credit risks as part of asset and liability management activities. In addition, they may also be used to deliver long term floating rate or long term fixed rate exposure. Derivatives may be designated as either hedges of the fair value of recognised assets or liabilities or firm commitments (fair value hedges) or as hedges of the cash flows of recognised assets and liabilities and highly probable forecast transactions (cash flow hedges). Gains or losses on fair value hedges are recognised as other economic flows included in the operating result. Gains or losses on the effective portion of cash flow hedges are recognised directly in the hedge reserve in equity, while the ineffective portion is recognised immediately as other economic flows included in the operating result.
| | | | |
| 6-54 | | Audited Consolidated Financial Statements 2015–16 – Government of Queensland |
Notes to the Financial Statements
| 37. | Deposits, borrowings and advances, securities and derivatives continued |
| | Derivative financial instruments continued |
Amounts taken to the hedge reserve in equity are transferred to the operating result when the hedged transaction affects the operating result, such as when a forecast sale or purchase occurs or when the hedge becomes ineffective. Where the forecast transaction that is hedged results in recognising a non-financial asset or liability, the gains or losses previously deferred in equity are transferred to the carrying amount of the asset or liability.
When a hedging instrument expires or is sold or terminated, or when a hedge no longer meets the criteria for hedge accounting, any cumulative gain or loss existing in equity at that time remains in equity and is recognised when the forecast transaction is ultimately recognised as other economic flows included in the operating result. When a forecast transaction is no longer expected to occur, the cumulative gain or loss that was reported in equity is immediately transferred to the operating result.
All derivatives are carried as assets when fair value is positive and liabilities when fair value is negative. Derivative assets are disclosed in Note 25(a). Derivative instruments used by the State include: options, futures contracts, electricity derivative contracts, forward starting loans, forward rate agreements, foreign exchange contracts, cross currency swaps and interest rate swaps which may be categorised as:
(i) Cash flow hedges
Electricity derivatives (mostly price swaps and futures) are used to protect against movements in the price of electricity. The contracts are recognised at trade date and settled net, with cash flows expected within three years.
Commodity swaps are used to hedge against price fluctuations of commodities, such as diesel fuel and gas.
Forward exchange contracts and cross currency swaps are entered into to protect against foreign exchange movements. These transactions relate to contracted purchases of components used in capital investments, capital equipment and operating expenditure denominated in foreign currencies.
Settlement of these contracts is to be within 12 - 18 months.
The portion of the gain or loss on the hedging instrument that is determined to be an effective hedge is recognised directly in equity. When the cash flows occur, amounts that had been recognised in the hedge reserve in equity are transferred to the operating result. Where the forecast transaction that is hedged results in recognising a non-financial asset or liability, the gain or loss previously deferred in equity is transferred to the carrying amount of the asset or liability.
Total State Sector net gains/losses deferred to or removed from equity were as follows:
| | – | | net losses deferred to equity totalled $277 million (2015, $88 million); |
| | – | | net losses of $113 million (2015, $34 million) were removed from equity and reclassified to the operating result as a result of cash flow hedge settlements; |
| | – | | a gain of $1 million (2015, $1 million) was removed from equity and transferred to the cost of components. |
No amounts were deferred to or removed from equity by GGS entities in 2016 or 2015.
(ii) Derivatives which do not qualify for hedge accounting
Certain derivatives do not qualify for hedge accounting as they are held for trading or not designated as hedges. These instruments typically include some electricity derivatives such as swaps, caps and options and environmental derivatives contracts, such as forward contracts and options. Interest rate swaps, forward rate agreements, options and credit default swaps are also used to hedge exposure to interest rate movements, foreign currency and credit risks but are not hedge accounted.
| | | | | | | | | | | | | | | | | | |
| | | | | General
Government Sector | | | Total State
Sector | |
| | | | | 2016 | | | 2015 | | | 2016 | | | 2015 | |
| | | | | $M | | | $M | | | $M | | | $M | |
38. | | Provisions | | | | | | | | | | | | | | | | |
| | | | | |
| | Current | | | | | | | | | | | | | | | | |
| | Outstanding claims | | | | | | | | | | | | | | | | |
| | Workers’ compensation | | | — | | | | — | | | | 1,050 | | | | 1,067 | |
| | Other | | | 122 | | | | 118 | | | | 129 | | | | 162 | |
| | Onerous contracts | | | — | | | | — | | | | 22 | | | | 32 | |
| | Queensland Government Insurance Fund | | | 160 | | | | 158 | | | | 160 | | | | 158 | |
| | Other | | | 257 | | | | 214 | | | | 398 | | | | 271 | |
| | | | | 539 | | | | 489 | | | | 1,759 | | | | 1,689 | |
| | | | | | | | | | | | | | | | | | |
| | | | |
| Audited Consolidated Financial Statements 2015–16 – Government of Queensland | | 6-55 |
Notes to the Financial Statements
| | | | | | | | | | | | | | | | |
| | | General Government | | | | | | | |
| | | Sector | | | Total State Sector | |
| | | 2016 | | | 2015 | | | 2016 | | | 2015 | |
| | | $M | | | $M | | | $M | | | $M | |
Non-current | | | | | | | | | | | | | | | | |
Outstanding claims | | | | | | | | | | | | | | | | |
Workers’ compensation | | | — | | | | — | | | | 1,641 | | | | 1,408 | |
Other | | | 300 | | | | 306 | | | | 311 | | | | 321 | |
Onerous contracts | | | — | | | | — | | | | 174 | | | | 178 | |
Queensland Government Insurance Fund | | | 723 | | | | 745 | | | | 723 | | | | 745 | |
Other | | | 39 | | | | 88 | | | | 507 | | | | 595 | |
| | | 1,062 | | | | 1,138 | | | | 3,356 | | | | 3,247 | |
| | | | | | | | | | | | | |
| | | 1,601 | | | | 1,628 | | | | 5,115 | | | | 4,937 | |
| | | | | | | | | | | | | | | | |
Provisions are recognised when there is a present legal or constructive obligation as a result of past events, it is probable that an outflow of resources will be required to settle the obligation and the amount has been reliably estimated. Where there are a number of similar obligations, the likelihood that an outflow will be required is determined by considering the class of obligations as a whole. Provisions are measured at the present value of the estimate of the expenditure required to settle the present obligation at the reporting date. The discount rate used to determine the present value reflects current market assessment of the time value of money and risks specific to the liability.
Outstanding Claims
The liability for outstanding claims is measured as the present value of expected future payments, the majority of which are actuarially assessed. The liability includes outstanding claim recoveries and reinsurance receivables.
| | | | | | | | |
| | | General Government | | | | |
| | | Sector | | Total State Sector |
| | | 2016 | | 2015 | | 2016 | | 2015 |
| | | $M | | $M | | $M | | $M |
Outstanding claim recoveries and reinsurance receivables | | 3 | | 5 | | 164 | | 155 |
In accordance with AASB 1023 General Insurance Contracts, the claims liability includes a risk margin in addition to expected future payments. These liabilities are discounted for the time value of money using risk-free discount rates that are based on current, observable, objective rates. The discount rate applied to Workers’ Compensation gross outstanding claims as at 30 June 2016 was 1.7% (2015, 2.4%).
Queensland Government Insurance Fund (QGIF)
QGIF was established as a centrally managed self-insurance fund for the State’s insurable liabilities covering property, medical and other liabilities and is an administrative arrangement within the Consolidated Fund. QGIF aims to improve the management of insurable risks through identifying, providing for and funding the Government’s insurance liabilities.
Participating government agencies pay premiums into the fund to meet the cost of claims and future insurable liabilities. QGIF outstanding claim liabilities are reported at whole of Government level, with claims paid out of Queensland Treasury’s Administered accounts.
The State’s QGIF provisions are actuarially assessed annually and are calculated in accordance with AASB 137. The liabilities relate to all claims incurred prior to 30 June 2016 and include an estimate of the cost of claims that are incurred but not reported. Expected future payments are discounted using yields on Australian government bonds. This risk free discount rate applied as at 30 June 2016 was 1.85% (2015, 2.8%).
The outstanding claims liability is a central estimate and includes no prudential margin.
Other provisions
(i) Power Purchase/Pooling Agreement provisions
A provision for onerous contracts has been realised in relation to long-term power purchase/pooling agreements (PPAs) when the unavoidable costs of meeting the ongoing obligations under these agreements exceed the expected benefits to be received. The provision for onerous contracts reflects the net present value of the least net cost of exiting these onerous PPAs which is the lower of the cost of fulfilling the agreements or the compensation payable, as defined in these agreements for early termination.
An onerous contract provision exists in relation to the Gladstone Interconnection and Power Pooling Agreement and was remeasured upwards by $24 million during the year due to a change in future period cash flow assumptions.
| | | | |
| 6-56 | | Audited Consolidated Financial Statements 2015–16 – Government of Queensland |
Notes to the Financial Statements
(i) Power Purchase/Pooling Agreement provisions continued
The extent of the future losses from the power purchase/pooling agreements will depend on future wholesale pool prices as well as the need for the State to meet its network support obligations. The future level of Queensland wholesale pool prices remains significantly uncertain. The critical determinants of future pool prices will be the bidding behaviour of participants in the National Electricity Market, load growth, network reliability and the introduction of new generation capacity. The discount rate used reflects current market assessments of the time value of money and the risks specific to these obligations.
(ii) Restoration provisions
Provisions are recognised for dismantling, removal and restoration costs where a constructive obligation exists. The present value of the obligation is recorded in the initial cost of the asset.
| | | | | | | | | | | | | | | | |
General Government Sector movements in provisions | | | | | | | | | | | | | | | | |
| | | Outstanding
Claims | | | QGIF | | | Other
Provisions | | | Total | |
| | | 2016 $M | | | 2016
$M | | | 2016 $M | | | 2016
$M | |
Carrying amount at beginning of year | | | 423 | | | | 903 | | | | 301 | | | | 1,627 | |
Additional provisions recognised | | | 113 | | | | 185 | | | | 56 | | | | 354 | |
Reductions in provisions and payments | | | (83 | ) | | | (141 | ) | | | (54 | ) | | | (278 | ) |
Change from remeasurement and discounting adjustments | | | (31 | ) | | | (65 | ) | | | (7 | ) | | | (103 | ) |
| | | | | | | | | | | | | | | | |
Carrying amount at end of year | | | 422 | | | | 882 | | | | 296 | | | | 1,601 | |
| | | | | | | | | | | | | | | | |
| | | | | | | | | | | | | | | | |
| Total State Sector movements in provisions | | Outstanding
Claims | | | QGIF | | | Other
Provisions | | | Total | |
| | | 2016 $M | | | 2016
$M | | | 2016
$M | | | 2016
$M | |
Carrying amount at beginning of year | | | 2,958 | | | | 903 | | | | 1,076 | | | | 4,937 | |
Additional provisions recognised | | | 1,746 | | | | 185 | | | | 150 | | | | 2,081 | |
Reductions in provisions and payments | | | (1,428 | ) | | | (141 | ) | | | (77 | ) | | | (1,645 | ) |
Change from remeasurement and discounting adjustments | | | (144 | ) | | | (65 | ) | | | (48 | ) | | | (257 | ) |
| | | | | | | | | | | | | | | | |
Carrying amount at end of year | | | 3,132 | | | | 882 | | | | 1,101 | | | | 5,115 | |
| | | | | | | | | | | | | | | | |
| | | | | | | | | | | | | | | | | | |
| | | | | General Government Sector | | | Total State Sector | |
| | | | | 2016
$M | | | 2015 $M | | | 2016
$M | | | 2015
$M | |
39. | | Other liabilities | | | | | | | | | | | | | | | | |
| | | | | |
| | Current | | | | | | | | | | | | | | | | |
| | Unearned revenue | | | 453 | | | | 442 | | | | 561 | | | | 552 | |
| | Environmental surrender obligations (RECs, GECs, NGACs) | | | — | | | | — | | | | 125 | | | | 66 | |
| | Other | | | 204 | | | | 167 | | | | 144 | | | | 134 | |
| | | | | 657 | | | | 609 | | | | 829 | | | | 752 | |
| | Non-current | | | | | | | | | | | | | | | | |
| | Unearned revenue | | | 112 | | | | 169 | | | | 593 | | | | 568 | |
| | Other | | | 21 | | | | 1 | | | | 26 | | | | 8 | |
| | | | | 133 | | | | 171 | | | | 619 | | | | 575 | |
| | | | | | | | | | | | | | | |
| | | | | 790 | | | | 780 | | | | 1,449 | | | | 1,328 | |
| | | | | | | | | | | | | | | | | | |
| | | | |
| Audited Consolidated Financial Statements 2015–16 – Government of Queensland | | 6-57 |
Notes to the Financial Statements
| | | | | | | | | | | | | | | | | | |
| | | | | General Government
Sector | | | Total State
Sector | | | | |
| | | | | 2016 | | | 2015 | | | 2016 | | | 2015 | |
| | | | | $M | | | $M | | | $M | | | $M | |
40. | | Reconciliation of operating result to net cash flows from operating activities | | | | | | | | | | | | | | | | |
| | | | | |
| | Operating result | | | 1,088 | | | | 3,949 | | | | (4,088 | ) | | | 481 | |
| | | | | |
| | Non-cash movements: | | | | | | | | | | | | | | | | |
| | Depreciation and amortisation | | | 2,930 | | | | 3,139 | | | | 5,334 | | | | 5,550 | |
| | Net (gain)/loss on disposal/revaluation of non-current assets and settlement of liabilities | | | (126 | ) | | | 764 | | | | 1,673 | | | | 472 | |
| | Impairment and write-off of bad debts | | | 55 | | | | 117 | | | | 141 | | | | 140 | |
| | Equity accounting (profit)/loss | | | 2 | | | | 2 | | | | 2 | | | | 2 | |
| | Unrealised net (gain)/loss on borrowings/investments | | | (2 | ) | | | (19 | ) | | | 1,309 | | | | (856 | ) |
| | Other | | | 249 | | | | (731 | ) | | | 65 | | | | (525 | ) |
| | | | | |
| | (Increase)/decrease in receivables | | | 271 | | | | (3,585 | ) | | | (428 | ) | | | 11 | |
| | (Increase)/decrease in inventories | | | 23 | | | | 3 | | | | (43 | ) | | | (103 | ) |
| | (Increase)/decrease in prepayment and other assets | | | 39 | | | | (70 | ) | | | 70 | | | | (21 | ) |
| | Increase/(decrease) in payables | | | (99 | ) | | | 387 | | | | 103 | | | | 240 | |
| | Increase/(decrease) in provisions | | | 203 | | | | 104 | | | | 387 | | | | (416 | ) |
| | Increase/(decrease) in other liabilities | | | 71 | | | | 53 | | | | 257 | | | | 115 | |
| | Total non-cash movements | | | 3,616 | | | | 163 | | | | 8,870 | | | | 4,609 | |
| | Cash flows from operating activities | | | 4,704 | | | | 4,112 | | | | 4,782 | | | | 5,090 | |
41. | | Expenditure commitments | | | | | | | | | | | | | | | | |
| | As at 30 June 2016, State Government entities had entered into the following capital and lease commitments. Commitments are exclusive of anticipated recoverable GST. | | | | | | | | | | | | | | | | |
| | These commitments are in addition to those disclosed in Note 27 as Public private partnerships (PPPs), except for finance lease commitments related to Education and Transport and Main Roads’ PPPs which are also included in Note 27. | | | | | | | | | | | | | | | | |
| | Other than obligations under finance leases, where substantially all the risks and benefits incidental to ownership of the leased assets are transferred to the lessee, the following commitments have not been recognised as liabilities in the Balance Sheet. | | | | | | | | | | | | | | | | |
| | Capital expenditure commitments | | | | | | | | | | | | | | | | |
| | | | | | | | | | | | | | | |
| | Capital expenditure commitments contracted for at reporting date but not recognised in the Balance Sheet are: | | | 1,853 | | | | 2,565 | | | | 2,481 | | | | 3,342 | |
| | | | | |
| | Operating lease commitments | | | | | | | | | | | | | | | | |
| | Not later than 1 year | | | 471 | | | | 525 | | | | 583 | | | | 646 | |
| | Later than 1 year but not later than 5 years | | | 1,202 | | | | 1,306 | | | | 1,607 | | | | 1,717 | |
| | Later than 5 years | | | 941 | | | | 897 | | | | 1,550 | | | | 1,673 | |
| | | | | 2,614 | | | | 2,728 | | | | 3,740 | | | | 4,036 | |
| | | | | | | | | | | | | | | | | | |
Operating leases are entered into as a means of acquiring access to office accommodation and storage facilities. Lease payments are generally fixed but with inflation escalation clauses on which contingent rentals are determined.
Some renewal or extension options exist in relation to operating leases. No operating leases contain restrictions on financing or other leasing activities.
| | | | |
| 6-58 | | Audited Consolidated Financial Statements 2015–16 – Government of Queensland |
Notes to the Financial Statements
| | | | | | | | | | | | | | | | | | |
| | | | | General Government | | | | | | | |
| | | | | Sector | | | Total State Sector | |
| | | | | 2016 | | | 2015 | | | 2016 | | | 2015 | |
| | | | | $M | | | $M | | | $M | | | $M | |
41. | | Expenditure commitments continued | | | | | | | | | | | | | | | | |
| | | | | |
| | Finance lease commitments | | | | | | | | | | | | | | | | |
| | | | | |
| | Not later than 1 year | | | 137 | | | | 100 | | | | 164 | | | | 113 | |
| | Later than 1 year but not later than 5 years | | | 591 | | | | 453 | | | | 596 | | | | 484 | |
| | Later than 5 years | | | 2,389 | | | | 1,865 | | | | 2,389 | | | | 1,865 | |
| | Total minimum lease payments * | | | 3,117 | | | | 2,418 | | | | 3,149 | | | | 2,462 | |
| | Future finance charges | | | (1,832 | ) | | | (1,359 | ) | | | (1,833 | ) | | | (1,362 | ) |
| | Total lease liabilities | | | 1,285 | | | | 1,059 | | | | 1,316 | | | | 1,100 | |
| | Reconciliation to Balance Sheet | | | | | | | | | | | | | | | | |
| | Current lease liabilities (refer Note 37) | | | 30 | | | | 22 | | | | 56 | | | | 33 | |
| | Non-current lease liabilities (refer Note 37) | | | 1,256 | | | | 1,036 | | | | 1,260 | | | | 1,067 | |
| | | | | 1,285 | | | | 1,059 | | | | 1,316 | | | | 1,100 | |
| | Finance leases are entered into as a means of funding the acquisition of certain non-current physical assets. Lease payments are generally fixed. No leases have escalation clauses other than in the event of payment default. A small number of leases have renewal or purchase options. Where such options exist, they are all exercisable at market prices. | | | | | | | | | | | | | | | | |
| | | | | |
| | * Includes minimum lease payments in relation to Education and Transport and Main Roads of $1.055 billion which are included in Note 27 PPPs. | | | | | | | | | | | | | | | | |
| | | | | |
42. | | Cash and other assets held in trust | | | | | | | | | | | | | | | | |
| | | | | |
| | Various monies were held in trust by State Government agencies at year end and have not been included as assets/liabilities in the Balance Sheet. | | | | | | | | | | | | | | | | |
| | | | | |
| | A summary follows of entities holding assets in trust: | | | | | | | | | | | | | | | | |
| | | | | |
| | QIC Limited | | | — | | | | — | | | | 38,146 | | | | 32,567 | |
| | The Public Trustee of Queensland | | | 1,668 | | | | 1,672 | | | | 1,668 | | | | 1,672 | |
| | Department of Justice and Attorney-General | | | 43 | | | | 69 | | | | 43 | | | | 69 | |
| | Department of Natural Resources and Mines | | | 43 | | | | 32 | | | | 43 | | | | 32 | |
| | Queensland Performing Arts Trust | | | 23 | | | | 20 | | | | 23 | | | | 20 | |
| | Queensland Police Service | | | 21 | | | | 18 | | | | 21 | | | | 18 | |
| | Queensland Treasury | | | 32 | | | | 16 | | | | 32 | | | | 16 | |
| | Department of Housing and Public Works | | | 12 | | | | — | | | | 12 | | | | — | |
| | QRAA | | | 52 | | | | — | | | | 52 | | | | — | |
| | Other | | | 47 | | | | 38 | | | | 47 | | | | 38 | |
| | | | | 1,941 | | | | 1,865 | | | | 40,087 | | | | 34,432 | |
| | | | | | | | | | | | | | | | | | |
Security, tender and other deposits administered by the State in a fiduciary or trust capacity are not recognised in the financial statements but are disclosed for information purposes. Whilst these transactions and balances are in the care of the State, they are subject to the normal internal control and external audit requirements.
| 43. | Contingent assets and liabilities |
Contingent assets and liabilities represent items that are not recognised in the Balance Sheet because at balance date:
| | - | | there is a possible asset or an obligation arising from past events whose existence will be confirmed by the occurrence or non-occurrence of one or more uncertain future events not wholly within the control of the Government; or |
| | - | | there is a present obligation arising from past events but it is not recognised because it is either not probable that an outflow of resources embodying economic benefits will be required to settle the obligation or the amount of the obligation cannot be measured reliably. |
Below are details of the more significant contingent assets and liabilities from a GGS and Total State Sector perspective.
Pursuant to section 15 of the Queensland Treasury Corporation Act 1988 , any losses of QTC are the responsibility of the Consolidated Fund. On this basis, the contingent assets and liabilities of QTC, which forms part of the Public Financial Corporations Sector, are also incorporated in GGS statements.
| | | | |
| Audited Consolidated Financial Statements 2015–16 – Government of Queensland | | 6-59 |
Notes to the Financial Statements
| 43. | Contingent assets and liabilities continued |
| | | | | | | | | | | | | | | | |
| | | General Government
Sector | | | Total State
Sector | |
| | | 2016 | | | 2015 | | | 2016 | | | 2015 | |
| | | $M | | | $M | | | $M | | | $M | |
Contingent liabilities - quantifiable | | | | | | | | | | | | | | | | |
| | | | |
Nature of contingency | | | | | | | | | | | | | | | | |
| | | | |
Guarantees and indemnities | | | 52,875 | | | | 45,137 | | | | 10,452 | | | | 10,235 | |
Other | | | 1,230 | | | | 1,021 | | | | 1,235 | | | | 1,024 | |
| | | 54,105 | | | | 46,158 | | | | 11,686 | | | | 11,260 | |
| | | | | | | | | | | | |
|
Guarantees and indemnities |
|
General Government Sector |
|
For the GGS, these mainly comprise guarantees of borrowings by local governments and Public Non-financial Corporations from QTC of $9.063 billion and $42.395 billion (2015, $8.898 billion and $34.827 billion) respectively and of insurance policies issued by Suncorp Life and Superannuation Limited of $295 million (2015, $420 million). QTC also provided guarantees of $100 million (2015, $100 million) relating to the trading activities in the National Electricity Market of subsidiaries of Energy Queensland Limited, a Queensland Government-owned corporation. |
Total State Sector |
From a Total State perspective, borrowings by Public Non-financial Corporations from QTC as disclosed above are eliminated on consolidation. |
Other
|
General Government Sector As at 30 June 2016, there are 20 cases (2015, 20 cases) filed with the courts relating to revenue collected by the Office of State Revenue. An estimate of the liability should the outcomes of the above mentioned cases prove unfavourable for the State is $251 million (2015, $40 million). Under the agreement entered into for the development of the 1 William Street site, the State has agreed to enter into a sub-lease of the building when construction has been completed. The State’s commitment for the operating lease payments on the building sub-lease is $979 million (2015, $979 million). The commitment is contingent on the developer, CBus Property 1 William Street Pty Ltd, meeting certain requirements under the contract and has therefore not been included in note 41 as an operating lease commitment. |
Contingent liabilities - not quantifiable
|
General Government Sector Legal proceedings and disputes A number of legal actions have been brought against the State Government and its agencies. Notification has also been received of a number of other cases that are not yet subject to court action but which may result in subsequent litigation. Due to the wide variety and nature of the claims and the uncertainty of any potential liability, no value has been attributed to these actions/claims. Native Title A number of native title claims that affect the Queensland Government have been filed with the National Native Title Tribunal under the Native Title Act 1993 (Commonwealth) . The Native Title Act provides for payment of compensation to native titleholders for a variety of acts that may affect native title. It is possible that the Government may face future litigation and liability in respect of claims for native title. However, given the subjectivity of the issue, it is not appropriate to attempt to determine the likely success of such claims or to quantify any potential liability. Securities, warranties and guarantees The State has provided a number of securities, warranties and guarantees in the normal course of business. The amount of any future claims against these securities, warranties and guarantees cannot be reliably estimated. |
| | | | |
| 6-60 | | Audited Consolidated Financial Statements 2015–16 – Government of Queensland |
Notes to the Financial Statements
| 43. | Contingent assets and liabilities continued |
| | Contingent liabilities - not quantifiable continued |
|
General Government Sector continued Cross Border Lease transactions QTC has assumed responsibility for a significant portion of the transaction risk relating to certain cross border lease transactions and in certain situations could be liable to make additional payments under the transactions. However, external advice and history to date indicate that there is remote likelihood of these events occurring. In addition, QTC has provided certain guarantees and indemnities to various participants in the cross border lease transactions. Unless exceptional and extreme circumstances arise, it is unlikely that QTC will be required to make a significant payment under these guarantees and indemnities. Financial assurance liability gap for mining projects Financial assurances are required for mining projects to cover the rehabilitation liability should a mining leaseholder fail to undertake rehabilitation. The liability to undertake rehabilitation work remains the responsibility of the mining leaseholder. The State’s responsibility in regard to rehabilitation is limited to managing any potential public safety and health risks only. At reporting date, it is not possible to determine the extent or timing of any potential financial effect of this responsibility. Long-term sales permits The Department of Agriculture and Fisheries has issued long-term permits to various sawmilling businesses regarding the supply of log timber from State-owned native forests. These sales permits provide for the payment of compensation by the State to the holder to the extent that the specified quantity of log timber is not harvested from the particular State-owned forests. Collingwood Park guarantee Due to a mine subsidence event that occurred at Collingwood Park in 2008, the State, under the Mineral Resources Act 1989 , provides a guarantee to owners of affected land to stabilise land, repair subsidence related damage (if cost effective to do so), or purchase land beyond economic repair. Major capital projects In the course of constructing the Sunshine Coast University Hospital (SCUH), Queensland Health entered into agreements which may give rise to possible obligations which are contingent on the occurrence or non-occurrence of uncertain future events. Queensland Health has agreed to certain compensation events with the carpark operators of SCUH, which may give rise to possible obligations. Impact of disasters As a result of previous disasters impacting the State, there is a possibility of further claims being made on the Queensland Reconstruction Authority. As per the 2016-17 Budget papers, the expected future expenditure in relation to prior disasters is $406 million (2015, $1.013 billion), the majority of which is expected to be recovered from the Commonwealth. Refer to the contingent assets section for the Natural Disaster Relief and Recovery Arrangements (NDRRA) claims lodged by the State with the Commonwealth which are yet to be approved or paid. The Queensland Floods Commission of Inquiry delivered its Final Report on 16 March 2012. The State is implementing relevant recommendations from the Interim and Final Reports. Certain property owners have commenced a class action making claims against the State in respect of the January 2011 flood. |
Total State Sector
In addition to the above GGS non-quantifiable contingent liabilities, the following relate specifically to the Public Non-financial and Financial Corporation Sectors.
WorkCover Queensland
The Workers’ Compensation and Rehabilitation Act 2003 provides that the State Government guarantees every WorkCover policy or other insurance contract with WorkCover Queensland, a statutory body. Given the nature of this contingency, it is not possible to estimate the liability, if any, due under this heading.
| | | | |
| Audited Consolidated Financial Statements 2015–16 – Government of Queensland | | 6-61 |
Notes to the Financial Statements
| 43. | Contingent assets and liabilities continued |
| | Contingent liabilities - not quantifiable continued |
Total State Sector continued
Contaminated land
The State Government controls certain areas of land that are affected by pollutants. The agencies involved will be obliged to restore these assets to a safe and useable condition in the event that their use changes, for example, when the land is sold. Given its nature, it is not possible to provide an estimate of the potential liability of this exposure.
QIC Limited
QIC Limited, in its capacity as trustee, is potentially liable for the unsettled liabilities of a number of trusts that it administers. However, under the respective trust deeds, the Corporation is entitled to be indemnified out of the assets of the trusts for any losses or outgoings that may be sustained in its role as trustee, provided the trustee has acted within the terms of the trust deeds.
The directors have assessed the recoverable amounts of the assets of the trusts and concluded that currently they have excess assets over liabilities.
Funds managed by QIC Limited in a trustee capacity totalled $38.449 billion at 30 June 2016 (2015, $32.908 billion).
State asset sales
As part of the State’s asset sales process in 2011-12 (the initial public offering of shares in QR National Limited (now Aurizon Limited), the Forestry Plantations business, the Port of Brisbane business, the Abbot Point Coal Terminal (X50) business and Queensland Motorways Limited), the State put in place a number of contractual arrangements which result in contingent liabilities as follows:
| | - | | Superannuation indemnity for QR National and Forestry Plantations Queensland for the cost of employer contributions above a particular threshold for their employees who remained as members of QSuper’s defined benefit category. |
| | - | | State indemnities for directors and officers of relevant Government-owned corporations and State public servants were put into place in relation to liabilities which might arise out of the restructuring and sale of the various sale entities. |
| | - | | Indemnities as to tax and other liabilities (including previous cross border lease liabilities) accrued during the State’s ownership. |
| | - | | Compensation potentially payable in the event that the leases issued over land and infrastructure by State agencies are terminated. |
| | - | | Compensation potentially payable for improvements in the event of the termination of relevant leases. |
| | - | | Various warranties in relation to the businesses sold. |
At present, management are unaware of any breaches of agreements and there are no claims being made. As such, it is not possible to estimate any potential financial effect should such a claim arise in the future.
Julia Creek derailment - Environmental incident
A locomotive derailed on the Mount Isa line on 27 December 2015 releasing 60,873 litres of concentrated sulfuric acid to the ground and into surface water approximately 28 kilometres east of Julia Creek township. Queensland Rail has worked closely with the Department of Environment and Heritage Protection, the third party operator and the product owner throughout the phases of the containment, investigation and remediation. The incident is currently under investigation by the Australian Transport Safety Bureau (ATSB).
| | | | | | | | | | | | | | | | |
| | | General Government | | | | | | | |
| | | Sector | | | Total State Sector | |
| | | 2016 | | | 2015 | | | 2016 | | | 2015 | |
| | | $M | | | $M | | | $M | | | $M | |
Contingent assets - quantifiable | | | | | | | | | | | | | | | | |
| | | | |
Nature of contingency | | | | | | | | | | | | | | | | |
| | | | |
Guarantees and indemnities | | | 7,352 | | | | 7,506 | | | | 8,170 | | | | 8,489 | |
Other | | | 1,055 | | | | 7 | | | | 1,065 | | | | 17 | |
| | | 8,407 | | | | 7,512 | | | | 9,235 | | | | 8,506 | |
| | | | | | | | | | | | | | | | |
| | | | |
| 6-62 | | Audited Consolidated Financial Statements 2015–16 – Government of Queensland |
Notes to the Financial Statements
| 43. | Contingent assets and liabilities continued |
| | Contingent assets - quantifiable continued |
Guarantees
|
General Government Sector The Department of Natural Resources and Mines holds financial assurances of $5.665 billion (2015, $5.849 billion) for mining projects, to cover rehabilitation should a leaseholder fail to undertake rehabilitation. The Departments of Environment and Heritage Protection and Natural Resources and Mines hold bank guarantees totalling $1.265 billion and $29 million (2015, $1.25 billion and $30 million) respectively as financial security to ensure compliance with various acts, environmental management activities, vegetation management development applications and other agreements. The Department of Transport and Main Roads holds securities on behalf of contractors in the form of performance guarantees amounting to $194 million (2015, $164 million). The Department of Health holds $106 million (2015, $106 million) in guarantees and undertakings from third parties in the normal course of business. The Department of State Development holds bank guarantees in relation to the Queensland Investment Incentive Scheme (QIIS) grants and other financial support provided to public sector proponents totalling $35 million (2015, $27 million). The developer of 1 William Street, CBus Property 1 William Street Pty Ltd, has provided a bank guarantee of $35 million (2015, $35 million) for security performance of the developer’s obligations under the project deed. The Department of Infrastructure, Local Government and Planning holds bank guarantees for the performance and satisfaction of construction contracts amounting to $23 million (2015, $44 million). |
Total State Sector
In addition to the above General Government quantifiable guarantees and indemnities, the following relate specifically to the Public Non-financial and Financial Corporations sectors.
WorkCover Queensland holds bank guarantees on behalf of self-insurers totalling $499 million (2015, $542 million).
Queensland Rail holds bank, insurance company and other guarantees of $220 million (2015, $292 million).
Energy Queensland Limited holds bank guarantees totalling $98 million (2015, $149 million) mainly relating to the construction of capital assets for energy customers.
Other
|
General Government Sector NDRRA claim In relation to the 2014-15 NDRRA claim lodged with the Commonwealth in March 2016, the Commonwealth had not approved or paid the $1.05 billion anticipated under the claim at 30 June 2016. Because of uncertainties in the approval process for NDRRA claims, revenue is generally only recognised by the State when the cash is received. Construction Industry Skills Centre Pty Ltd A non-recoverable loan of $11 million (2015, $11 million) paid to Construction Industry Skills Centre Pty Ltd is repayable to the State Government in circumstances contingent on the winding up of the company and related trust. |
Contingent assets - not quantifiable
|
General Government Sector Department of Natural Resources and Mines and SunWater Limited land The Department of Natural Resources and Mines and SunWater Limited (SunWater) share a 8.827 hectare site at Rocklea. Various agreements entered into since 2001 between the Department of Natural Resources and Mines and SunWater carry an obligation on SunWater to provide a freehold portion of land to the department at no cost with sale proceeds from the surplus land payable to SunWater. The sale of surplus land is subject to various approvals from Brisbane City Council, leading to uncertainty about the timing of the sale and therefore the time at which the Department of Natural Resources and Mines will receive freehold title. For these reasons, it is not possible to provide a reliable estimate of the value of the land at balance date. |
| | | | |
| Audited Consolidated Financial Statements 2015–16 – Government of Queensland | | 6-63 |
Notes to the Financial Statements
| 43. | Contingent assets and liabilities continued |
Contingent assets - not quantifiable
Total State Sector
Insurance claims
There are a number of insurance and other claims against external parties yet to be finalised in relation to various matters.
North Queensland Bulk Ports Corporation Limited
North Queensland Bulk Ports Corporation Limited holds a number of guarantees for security over defects in construction and for future liabilities of port operators.
Other claims
At 30 June 2016, CS Energy was in dispute with Anglo American Australia Limited (Anglo) in relation to the supply of coal by Anglo to the Callide B and C power stations. Anglo finalised the sale of the Callide Mine to the private sector on 31 October 2016, and CS Energy will assess the impact in 2016-17.
Stanwell Corporation Limited is seeking to recover amounts in relation to a coal supply agreement between the corporation and Wesfarmers Curragh Pty Ltd (Wesfarmers). Wesfarmers has counter claimed. The dispute is yet to be resolved.
| 44. | Post balance date events |
Restoration and redevelopment of the Herston Quarter
On the 10 July 2015, the Queensland Government announced its plans to progress the redevelopment of the Herston Quarter with the announcement of three proponents for the development work. The Queensland Government has now announced that Australian Unity is the preferred tenderer to develop the five-hectare site adjacent to the Royal Brisbane and Women’s Hospital over a 10 year period. The project will deliver a mix of health, aged care, retirement living and residential accommodation to complement and support the current adjacent health, research and education uses. The project will also include a 132 bed public healthcare facility known as the Specialist Rehabilitation and Ambulatory Care Centre.
National Injury Insurance Scheme
The National Injury Insurance Scheme (Queensland) Act 2016 commenced on 1st July 2016 and establishes the National Injury Insurance Scheme, the National Injury Insurance Agency Queensland and the National Injury Insurance Scheme Fund. The scheme supports eligible participants who sustain serious personal injuries in a motor vehicle accident in Queensland with necessary and reasonable lifetime treatment, care and support.
| 45. | Defeased cross border leases |
The Stanwell power station is subject to cross border leases that were entered into in 1995 and 1996. In accordance with AASB 117 Leases, the leases are treated as finance leases and are being amortised over the estimated life of the assets on a straight line basis consistent with other power stations.
There is no lease liability as future lease payments were prepaid at the commencement of the lease.
| 46. | Financial risk management disclosure |
The State’s activities expose it to a variety of financial risks, such as credit risk, liquidity risk and market risk (including interest rate risk, price risk and foreign exchange risk). The State’s overall risk management objectives, policies and strategies focus on minimising financial risk exposures and seek to mitigate potential adverse effects. The diverse nature of the financing and investing activities undertaken by agencies across the Queensland Government supports a decentralised approach to risk management. Individual agencies are responsible for managing risks to which they are exposed.
Risk management strategies in relation to the State’s financial assets and liabilities are summarised below. Additional risk management information can be found in individual agencies’ general purpose financial reports.
| | | | |
| 6-64 | | Audited Consolidated Financial Statements 2015–16 – Government of Queensland |
Notes to the Financial Statements
| 46. | Financial risk management disclosure continued |
(a) Credit risk
Credit risk exposure represents the potential loss that would be recognised if counterparties failed to meet contractual obligations in relation to receivables, loans and other financial assets. Credit risk is regularly assessed, measured and managed in strict accordance with credit risk policies.
The credit risk in relation to receivables is managed in the following manner:
| | - | | trading terms require payment within a specified period after the goods and services are supplied; |
| | - | | outstanding accounts are assessed for impairment at each reporting date based on objective evidence of impairment; |
| | - | | bad debts are written off as they are incurred; |
| | - | | the credit ratings of all counterparties are monitored and limits adjusted where necessary; |
| | - | | where possible, transactions are undertaken with a large number of counterparties to avoid concentrations of credit risk; |
| | - | | collateral arrangements are utilised to limit derivative credit exposure; and |
| | - | | derivative transactions are undertaken via recognised derivative trading exchanges where practical. |
Receivables and loans past due but not impaired and past due and individually impaired are disclosed in Note 24.
Credit risk in relation to loans and other financial assets is managed through regular analysis of borrowers, potential borrowers and financial market counterparties with respect to their ability to meet interest and capital repayment obligations. Where appropriate, collateral is obtained in the form of rights to securities, deeds of undertaking, letters of credit or guarantees.
Credit risk for the GGS and Total State Sector on recognised financial assets, including derivatives, is the carrying amount of these assets in the Balance Sheet, net of any impairment losses. The State’s major concentrations of credit risk are with the finance sector, the National Electricity Market and rural, housing and health sectors.
The credit exposure for derivative contracts, other than electricity derivatives, is calculated utilising the ‘value-at-risk’ methodology which takes into account the current market value, duration, term to maturity and interest rate and/or exchange rate volatility. The State utilises collateral arrangements to limit its derivative credit exposure.
The State is exposed to significant concentrations of risk in the finance industry. This is difficult to avoid given the size of the State’s investment portfolio and the requirement to invest with counterparties rated A- or better and to invest in highly liquid securities. A ratings-based approach is used to determine maximum credit exposure, as well as the counterparty’s credit metrics, country of domicile, size of its funding programs, asset composition and quality of the underlying security.
The State’s largest holder of investments and non-electricity derivatives is QTC. QTC’s credit risk exposures and its counterparty exposures by rating are as follows:
| | | | | | | | | | | | | | | | | | | | | | | | | | | | | | | | |
| By credit rating 2016 | | AAA | | | AA+ | | | AA | | | AA- | | | A+ | | | A | | | Other | | | Total | |
| | | $M | | | $M | | | $M | | | $M | | | $M | | | $M | | | $M | | | $M | |
Cash & equivalent | | | — | | | | — | | | | — | | | | 1,142 | | | | — | | | | — | | | | — | | | | 1,142 | |
Financial assets | | | 2,324 | | | | 807 | | | | 109 | | | | 12,114 | | | | 709 | | | | 171 | | | | 140 | | | | 16,374 | |
Derivatives | | | — | | | | — | | | | — | | | | 249 | | | | 41 | | | | 42 | | | | 2 | | | | 334 | |
Other | | | — | | | | — | | | | — | | | | 585 | | | | 387 | | | | — | | | | — | | | | 972 | |
| | | | | | | | | | | | | | | | | | | | | | | | | | | | | | | | |
| | | 2,324 | | | | 807 | | | | 109 | | | | 14,090 | | | | 1,137 | | | | 213 | | | | 141 | | | | 18,822 | |
| | | | | | | | | | | | | | | | | | | | | | | | | | | | | | | | |
| | | 12 | % | | | 4 | % | | | 1 | % | | | 75 | % | | | 6 | % | | | 1 | % | | | 1 | % | | | 100 | % |
| | | | | | | | |
| By credit rating 2015 | | AAA | | | AA+ | | | AA | | | AA- | | | A+ | | | A | | | Other | | | Total | |
| | | $M | | | $M | | | $M | | | $M | | | $M | | | $M | | | $M | | | $M | |
Cash & equivalent | | | — | | | | — | | | | — | | | | 2,117 | | | | — | | | | — | | | | — | | | | 2,117 | |
Financial assets | | | 2,729 | | | | 579 | | | | 61 | | | | 13,719 | | | | 571 | | | | 102 | | | | 456 | | | | 18,217 | |
Derivatives | | | — | | | | — | | | | — | | | | 469 | | | | — | | | | 43 | | | | — | | | | 512 | |
Other | | | — | | | | — | | | | — | | | | 9 | | | | 853 | | | | — | | | | — | | | | 862 | |
| | | | | | | | | | | | | | | | | | | | | | | | | | | | | | | | |
| | | 2,729 | | | | 579 | | | | 61 | | | | 16,314 | | | | 1,424 | | | | 145 | | | | 456 | | | | 21,708 | |
| | | | | | | | | | | | | | | | | | | | | | | | | | | | | | | | |
| | | 12 | % | | | 3 | % | | | — | | | | 75 | % | | | 7 | % | | | 1 | % | | | 2 | % | | | 100 | % |
The State also operates in the National Electricity Market, operated by the Australian Energy Market Operator, which has strict prudential guidelines that minimise the potential for credit related losses. This is supported by individual agencies’ Board approved policies. Security deposits, letters of credit or bank guarantees are obtained from customers to mitigate possible losses. Credit risk exposures that relate to electricity derivative financial instruments are managed under International Swaps and Derivatives Association (ISDA) agreements. The ISDA also has a strict credit policy, based on counterparties’ credit ratings and requiring appropriate security.
The State has made loans and advances to primary producers and small businesses at either commercial or concessional interest rates. The credit risk of the rural sector is mitigated through collateral in the form of real property mortgages.
| | | | |
| Audited Consolidated Financial Statements 2015–16 – Government of Queensland | | 6-65 |
Notes to the Financial Statements
| 46. | Financial risk management disclosure continued |
| | (a) Credit risk continued |
Master netting arrangements
The GGS does not have financial instruments that are subject to enforceable master netting arrangements or similar agreements.
The Total State Sector enters into derivative transactions under ISDA Master Agreements and similar agreements. Under the terms of these agreements, the right to set off is enforceable only on the occurrence of default or other credit events. The Total State Sector’s ISDA agreements do not currently meet the criteria for offsetting at balance date, and accordingly the relevant assets and liabilities are shown grossed up.
Collateral is also transferred with derivative counterparties to reduce the Total State Sector’s credit exposure.
(b) Liquidity risk
Liquidity risk arises from the possibility that individual agencies may be unable to settle a transaction on the due date. A range of funding strategies is used to ensure funds are available, such as maintaining a sufficient level of cash holdings to fund unexpected cash flows. QTC holds a minimum 5 working days’ cash requirements in 11AM cash to fund unexpected cash flows. QTC measures the minimum liquidity requirements to comfortably meet the following four scenarios simultaneously:
| | - | | Going Concern - progressively pre-fund term maturities 6 months from maturity |
| | - | | Market Disruption - 90 days survival horizon (severe market circumstances) |
| | - | | Name Crisis - 30 days survival horizon (extreme market circumstances) |
| | - | | Standard & Poor’s Liquidity Ratio - maintain a ratio greater than 80% |
Liquidity risk of electricity market trading is controlled by the Australian Energy Market Operator, whereby all market participants are required to deliver irrevocable bank guarantees as security for timely settlement.
The contractual maturities of financial liabilities are included below:
| | | | | | | | | | | | | | | | | | | | |
General Government Sector | | | | | | | | | | | | | | | | | | | | |
|
The table below sets out the contractual cash flows of the GGS financial liabilities. It is calculated based on undiscounted cash flows relating to the repayment of principal and interest amounts outstanding at balance date. | |
| | | | | |
| As at 30 June 2016 | | | | | | | | | | | | | | | |
| | | 1 Year or
Less | | | 1 to 5
Years | | | Over 5
Years | | | Total | | | Carrying
Value | |
| | | $M | | | $M | | | $M | | | $M | | | $M | |
Payables | | | 5,237 | | | | 196 | | | | 412 | | | | 5,845 | | | | 5,845 | |
Commonwealth borrowings | | | 47 | | | | 298 | | | | 367 | | | | 712 | | | | 514 | |
Other liabilities at amortised cost | | | 35 | | | | 169 | | | | 1,193 | | | | 1,397 | | | | 1,286 | |
QTC borrowings | | | 1,112 | | | | 6,526 | | | | 35,191 | | | | 42,828 | | | | 34,200 | |
Government securities and other loans at fair value | | | 3 | | | | — | | | | — | | | | 3 | | | | 3 | |
| | | | | | | | | | | | | | | | | | | | |
| | | 6,434 | | | | 7,189 | | | | 37,163 | | | | 50,785 | | | | 41,848 | |
| | | | | | | | | | | | | | | | | | | | |
| | | | | |
| As at 30 June 2015 | | | | | | | | | | | | | | | |
| | | 1 Year
or Less | | | 1 to 5
Years | | | Over 5
Years | | | Total | | | Carrying
Value | |
| | | $M | | | $M | | | $M | | | $M | | | $M | |
Payables | | | 5,158 | | | | 83 | | | | — | | | | 5,242 | | | | 5,242 | |
Commonwealth borrowings | | | 156 | | | | 289 | | | | 402 | | | | 847 | | | | 625 | |
Other liabilities at amortised cost | | | 223 | | | | 242 | | | | 1,439 | | | | 1,905 | | | | 1,761 | |
QTC borrowings | | | 2,197 | | | | 8,725 | | | | 40,098 | | | | 51,020 | | | | 41,343 | |
Government securities and other loans at fair value | | | 3 | | | | — | | | | — | | | | 3 | | | | 3 | |
| | | | | | | | | | | | | | | | | | | | |
| | | 7,738 | | | | 9,340 | | | | 41,939 | | | | 59,017 | | | | 48,974 | |
| | | | | | | | | | | | | | | | | | | | |
| | | | |
| 6-66 | | Audited Consolidated Financial Statements 2015–16 – Government of Queensland |
Notes to the Financial Statements
| 46. | Financial risk management disclosure continued |
| | (b) Liquidity risk continued |
Total State Sector
The table below sets out the contractual cash flows of the Total State Sector’s financial liabilities. It is calculated based on undiscounted cash flows relating to the repayment of principal and interest amounts outstanding at balance date.
| | | | | | | | | | | | | | | | | | | | |
| As at 30 June 2016 | | 1 year
or less | | | 1 to 5
years | | | Over 5
years | | | Total | | | Carrying
value | |
| | | $M | | | $M | | | $M | | | $M | | | $M | |
Payables | | | 6,493 | | | | 231 | | | | 412 | | | | 7,136 | | | | 7,136 | |
Commonwealth borrowings | | | 47 | | | | 298 | | | | 367 | | | | 712 | | | | 514 | |
Other liabilities at amortised cost | | | 82 | | | | 174 | | | | 1,193 | | | | 1,449 | | | | 1,336 | |
Government securities and other loans at fair value | | | 18,798 | | | | 53,706 | | | | 43,207 | | | | 115,711 | | | | 105,413 | |
Derivatives | | | 428 | | | | 348 | | | | 420 | | | | 1,196 | | | | 960 | |
| | | | | | | | | | | | | | | | | | | | |
| | | 25,848 | | | | 54,757 | | | | 45,599 | | | | 126,203 | | | | 115,359 | |
| | | | | | | | | | | | | | | | | | | | |
| | | | | |
| As at 30 June 2015 | | 1 year
or less | | | 1 to 5
years | | | Over 5
years | | | Total | | | Carrying
value | |
| | | $M | | | $M | | | $M | | | $M | | | $M | |
Payables | | | 6,244 | | | | 104 | | | | — | | | | 6,349 | | | | 6,349 | |
Commonwealth borrowings | | | 156 | | | | 289 | | | | 402 | | | | 847 | | | | 625 | |
Other liabilities at amortised cost | | | 262 | | | | 274 | | | | 1,439 | | | | 1,976 | | | | 1,829 | |
Government securities and other loans at fair value | | | 24,905 | | | | 53,680 | | | | 41,081 | | | | 119,667 | | | | 106,491 | |
Derivatives | | | 208 | | | | 248 | | | | 389 | | | | 846 | | | | 603 | |
| | | | | | | | | | | | | | | | | | | | |
| | | 31,776 | | | | 54,596 | | | | 43,312 | | | | 129,684 | | | | 115,896 | |
| | | | | | | | | | | | | | | | | | | | |
(c) Market risk
(i) Interest rate and unit price risk
Interest income
The GGS and Total State Sector are exposed to interest rate risk through investments managed by QIC Limited, cash deposits with the Commonwealth Bank of Australia and borrowings from the Commonwealth Government. The GGS is also exposed to interest rate risk through its deposits and fixed rate notes with QTC. The Long Term Asset Advisory Board (LTAAB) determines the investment objectives, risk profiles and strategy for the Long Term Assets within the framework provided by the Government. Since July 2012, LTAAB has been reducing risk in the Asset Portfolio. The result was a reduction in expected return and volatility. In light of this strategy, the expected rate of return on the portfolio on which the interest rate on the fixed rate notes is set was revised from 7.5% to 7.1%, effective 1 July 2013 and reduced to 7% from 1 July 2015. These assets are held to fund superannuation and other long-term obligations of the State.
The GGS does not undertake hedging in relation to interest rate risk on cash deposits or borrowings. This is managed as per the liquidity risk management strategy.
Interest expense
A number of other State-owned entities enter into interest rate swaps, forward rate agreements and futures contracts to assist in the management of interest rate risk. In some instances, interest rate swaps are utilised to swap medium to long term fixed rate borrowings into floating rate. At times, floating to fixed swaps may be undertaken to generate a fixed rate term funding profile.
|
General Government Sector The GGS is exposed to movements in interest rates and managed fund unit prices through its cash deposits, investments and borrowings. The effect of a 1% movement in interest rates on the GGS cash balances would be a $11 million (2015, $12 million) change in the GGS operating result and equity. |
| | | | |
| Audited Consolidated Financial Statements 2015–16 – Government of Queensland | | 6-67 |
Notes to the Financial Statements
| 46. | Financial risk management disclosure continued |
| | (c) Market risk continued |
(i) Interest rate and unit price risk continued
| | |
| | General Government Sector continued The GGS has fixed rate notes with QTC and other investments with QIC Limited that are exposed to interest rate changes and changes in the unit price of the funds managed. Assuming all other variables remained constant, if the return on the notes and investments moved by 1%, the change to the GGS operating result and equity would be approximately $319 million (2015, $348 million). QTC borrowings by the GGS are in the form of fixed rate loans, generic debt pool borrowings (which are akin to fixed rate loans) or floating rate loans. Although the majority of the GGS agency borrowings are either fixed rate loans or generic debt pool loans, the Consolidated Fund bears the risk of movements between the fixed rate and market rate. Consequently, if interest rates on QTC borrowings were to change by 1%, the effect on GGS operating result and equity would be approximately $342 million (2015, $413 million). |
Total State Sector
As the State’s corporate treasury, QTC undertakes portfolio management activities on behalf of the State and raises funding in advance of requirements to ensure Queensland public sector entities have ready access to funding when required and also to reduce the risk associated with refinancing maturing loans. In addition, QTC holds and invests surplus funds on behalf of its clients and for liquidity management purposes. These activities expose the State to interest rate risk including basis risk which is managed within a value-at-risk (VaR) framework and complemented by other measures such as defined stress tests and PVBP (the change in present value for a 1 basis point movement).
| | | | | | | | |
| | | Total State Sector | |
| | | 2016 | | | 2015 | |
| | | $M | | | $M | |
Interest rate risk VaR at 30 June | | | 4.7 | | | | 7.7 | |
Average for the year | | | 6.6 | | | | 7.9 | |
Financial year - minimum | | | 4.1 | | | | 3.6 | |
Financial year - maximum | | | 16.2 | | | | 12.2 | |
The above VaR calculation does not include the potential mark-to-market impact of changes in credit spreads on the value of assets held in the QTC Cash Fund and the Cross Border Lease Portfolio. At 30 June 2016, the State had an exposure of approximately $1.1 million (2015, $0.8 million) per basis point to changes in credit spreads of assets held in the QTC Cash Fund.
The effect of a 1% movement in interest rates on the State’s cash balances would result in a $19 million (2015, $27 million) change to the State’s operating result and equity.
The State has other investments exposed to interest rate changes and changes in the unit price of the funds managed by QIC Limited. Assuming all other variables remained constant, if the return on these investments moved by 1%, the effect on the State’s operating result and equity would be approximately $327 million (2015, $389 million). For the range of changes to the operating result and equity that are considered reasonably possible at year end refer to individual agency statements, particularly QTC.
(ii) Share price and commodity price risk
Share price risk
At 30 June 2016, the State held less than 3% of the shares in Aurizon Holdings Limited (formerly QR National Limited), which is listed on the Australian Stock Exchange. Consequently, it is exposed to changes in the share price. If the share price changed by 10%, the effect on the State’s operating result and equity would be approximately $26 million (2015, $28 million).
Commodity price risk
Other State entities are exposed to commodity price risk resulting from changes in electricity, coal, gas, diesel and other commodity prices. Longer term fixed price supply agreements are utilised to manage risk in relation to coal and gas. A variety of swaps, futures, options and forward exchange contracts are used to hedge against price fluctuations of other commodities, such as diesel fuel. Electricity derivatives (mostly price swaps and futures) are used to protect against movements in the price of electricity in the National Electricity Market. The contracts are recognised at trade date and settled net, with cash flows expected within three years.
As a result of its ownership of electricity generating Government-owned corporations, the State is exposed to Electricity Price Risk.
Each entity is responsible for its own risk management and may make varying assumptions in assessing its sensitivity to such movements. The agencies with a material impact for Total State Sector are CS Energy, Energy Queensland Limited and Stanwell Corporation Limited.
| | | | |
| 6-68 | | Audited Consolidated Financial Statements 2015–16 – Government of Queensland |
Notes to the Financial Statements
| 46. | Financial risk management disclosure continued |
(c) Market risk continued
(ii) Share price and commodity price risk continued
Commodity price risk continued
On the assumption that all other variables remain constant, the impact of electricity forward price movements on the State’s operating result and equity are as follows:
| | | | | | | | | | | | | | | | | | | | | | | | | | | | | | | | |
| | | 2016 | | | 2015 | |
| | | Operating Result | | | Equity | | | Operating Result | | | Equity | |
| | | $M | | | $M | | | $M | | | $M | | | $M | | | $M | | | $M | | | $M | |
| | | +10 | % | | | -10 | % | | | +10 | % | | | -10 | % | | | +10 | % | | | -10 | % | | | +10 | % | | | -10 | % |
| | | | | | | | |
CS Energy | | | (9 | ) | | | 9 | | | | (98 | ) | | | 79 | | | | (20 | ) | | | 19 | | | | (46 | ) | | | 46 | |
Energy Queensland Limited | | | 10 | | | | (11 | ) | | | 92 | | | | (92 | ) | | | 14 | | | | (17 | ) | | | 86 | | | | (85 | ) |
| | | | | | | | |
| | | +15 | % | | | -15 | % | | | +15 | % | | | -15 | % | | | +15 | % | | | -15 | % | | | +15 | % | | | -15 | % |
Stanwell | | | 42 | | | | (95 | ) | | | (162 | ) | | | 213 | | | | 42 | | | | (19 | ) | | | (67 | ) | | | 70 | |
(d) Foreign exchange risk
The State is exposed to movements in foreign currencies as a result of future commercial transactions and recognised assets and liabilities denominated in currencies other than the Australian dollar. The State enters into forward exchange contracts, currency options and swaps to effectively manage the exposure resulting from purchases of various plant, equipment and component parts in foreign currencies. Foreign exchange risk is managed by individual agencies which hedge significant proportions of anticipated transactions in line with their respective risk management strategies.
The State also borrows offshore to provide access to additional sources of funding and diversify risk and undertakes investments in foreign currency assets. To effectively manage the exposure to fluctuations in exchange rates, forward exchange contracts and cross currency swaps are used.
The State’s exposure to foreign exchange risk is not considered material due to the effectiveness of risk management strategies.
| | | | |
| Audited Consolidated Financial Statements 2015–16 – Government of Queensland | | 6-69 |
Notes to the Financial Statements
| | | | | | | | | | | | | | | | | | |
| | | | | General Government
Sector | | | Total State Sector | |
| | | | | 2016 | | | 2015 | | | 2016 | | | 2015 | |
| | | | | $M | | | $M | | | $M | | | $M | |
47. | | Net fair value of financial instruments | | | | | | | | | | | | | | | | |
| | | | | |
| | The carrying amounts of the GGS and Total State Sector financial assets and financial liabilities by category are: | | | | | | | | | | | | | | | | |
| | | | | |
| | Financial assets | | | | | | | | | | | | | | | | |
| | Cash and deposits | | | 1,104 | | | | 1,198 | | | | 1,876 | | | | 2,701 | |
| | Receivables and loans at amortised cost | | | 5,005 | | | | 8,324 | | | | 4,783 | | | | 4,460 | |
| | Held-to-maturity | | | 30,736 | | | | 33,478 | | | | 351 | | | | 422 | |
| | Fair value through profit and loss (at initial recognition) | | | 2,441 | | | | 2,381 | | | | 64,584 | | | | 69,644 | |
| | Fair value through profit and loss (held for trading/not hedge accounted) | | | — | | | | 2 | | | | 412 | | | | 405 | |
| | Available-for-sale investments | | | 20,843 | | | | 23,895 | | | | 374 | | | | 213 | |
| | | | | 60,130 | | | | 69,278 | | | | 72,380 | | | | 77,845 | |
| | Financial liabilities | | | | | | | | | | | | | | | | |
| | Amortised cost | | | 41,845 | | | | 48,971 | | | | 8,986 | | | | 8,802 | |
| | Fair value through profit and loss (at initial recognition) | | | 3 | | | | 3 | | | | 105,663 | | | | 106,513 | |
| | Fair value through profit and loss (held for trading/not hedge accounted) | | | — | | | | — | | | | 709 | | | | 581 | |
| | | | | 41,848 | | | | 48,974 | | | | 115,359 | | | | 115,896 | |
| | Net gains/(losses) on available-for-sale investments recognised in equity | | | (3 | ) | | | 1 | | | | (3 | ) | | | 1 | |
The carrying amounts of GGS and Total State Sector’s financial assets and liabilities, including cash, deposits, receivables and payables, equate approximately to their net fair value, except as outlined below.
| | | | | | | | | | | | | | | | |
General Government Sector | | | | | | | | | | | | | | | | |
| | | Carrying | | | | | | Carrying | | | | |
| | | amount | | | Fair value | | | amount | | | Fair value | |
| | | 2016 | | | 2016 | | | 2015 | | | 2015 | |
| | | $M | | | $M | | | $M | | | $M | |
Financial Liabilities | | | | | | | | | | | | | | | | |
QTC borrowings | | | 34,200 | | | | 38,585 | | | | 41,343 | | | | 44,988 | |
Financial instruments measured at fair value have been classified in accordance with the hierarchy described in AASB 13. The three levels of fair value hierarchy reflect the significance of the inputs used to determine the valuation of these instruments.
| | – | | Level 1: represents fair value measurements that reflect unadjusted quoted market prices in active markets for identical assets and liabilities; |
| | – | | Level 2: represents fair value measurements that are substantially derived from inputs (other than quoted prices included within Level 1) that are observable, either directly or indirectly; and |
| | – | | Level 3: represents fair value measurements that are substantially derived from inputs that are not based on observable market data. |
Level 1
The fair value of financial assets and liabilities with standard terms and conditions and traded in an active market is based on unadjusted quoted market prices. Financial instruments in this category include certain equity and debt investments where quoted prices are available from an active market, such as publicly traded derivatives, short-term and tradeable bank deposits, actively traded Commonwealth and semi-government bonds and investments in certain unit trusts.
Level 2
The fair value of financial assets and liabilities is determined by using quoted market prices in active markets for similar instruments or quoted prices for identical or similar instruments in markets that are considered less than active or other valuation techniques where all significant inputs are directly (prices) or indirectly (derived from prices) observable from market data, other than quoted prices included in Level 1. Financial instruments in this category include fixed interest deposits, fixed term notes, commercial paper, non-actively traded corporate, government and semi-government bonds, certain money market securities, unit trusts and other derivatives such as over-the-counter derivatives, forward exchange contracts, commodity swaps, interest rate and cross currency swaps and some electricity derivatives.
Level 3
Where financial instruments are measured using valuation techniques based on unobservable inputs or observable inputs to which significant adjustments have been applied, such instruments are included in level 3 of the fair value hierarchy. These may include power purchase agreements and other electricity derivative contracts.
| | | | |
| 6-70 | | Audited Consolidated Financial Statements 2015–16 – Government of Queensland |
Notes to the Financial Statements
| 47. | Net fair value of financial instruments continued |
Valuation policies and procedures of the GGS and Total State Sector are developed and reviewed by management of respective agencies. Major valuation techniques adopted by the GGS and Total State Sector include market comparison techniques, option valuation models, forecasting, estimated discounted cash flow techniques, and extrapolation, scalar and translation techniques. There have been no material changes in the above valuation techniques used during the year.
Significant valuation inputs used to value financial instruments categorised within level 2 and level 3 of the fair value hierarchy are:
| | - | | Broker quotes or market prices for similar instruments; |
| | - | | Scalar and translation factors; and |
The following table presents the GGS and Total State Sector financial assets and liabilities recognised and measured at fair value.
| | | | | | | | | | | | | | | | |
| | | Level 1 | | | Level 2 | | | Level 3 | | | Total | |
| | | $M | | | $M | | | $M | | | $M | |
General Government Sector | | | | | | | | | | | | | | | | |
| | | | |
2016 | | | | | | | | | | | | | | | | |
Assets | | | | | | | | | | | | | | | | |
Financial assets at fair value through profit or loss | | | | | | | | | | | | | | | | |
Rental Purchase Plan | | | — | | | | 191 | | | | — | | | | 191 | |
Other investments | | | 116 | | | | 2,118 | | | | — | | | | 2,234 | |
Available-for-sale financial assets | | | | | | | | | | | | | | | | |
Corporate bonds | | | 352 | | | | — | | | | — | | | | 352 | |
Total assets | | | 467 | | | | 2,309 | | | | — | | | | 2,776 | |
| | | | |
2015 | | | | | | | | | | | | | | | | |
Assets | | | | | | | | | | | | | | | | |
Financial assets at fair value through profit or loss | | | | | | | | | | | | | | | | |
Rental Purchase Plan | | | — | | | | 192 | | | | — | | | | 192 | |
Derivatives | | | — | | | | 2 | | | | — | | | | 2 | |
Other investments | | | 104 | | | | 2,078 | | | | — | | | | 2,182 | |
Available-for-sale financial assets | | | | | | | | | | | | | | | | |
Corporate bonds | | | 195 | | | | — | | | | — | | | | 195 | |
Total assets | | | 299 | | | | 2,273 | | | | — | | | | 2,572 | |
| | | | |
| Audited Consolidated Financial Statements 2015–16 – Government of Queensland | | 6-71 |
Notes to the Financial Statements
| 47. | Net fair value of financial instruments continued |
| | | | | | | | | | | | | | | | |
| | | Level 1 | | | Level 2 | | | Level 3 | | | Total | |
| | | $M | | | $M | | | $M | | | $M | |
Total State Sector | | | | | | | | | | | | | | | | |
| | | | |
2016 | | | | | | | | | | | | | | | | |
Assets | | | | | | | | | | | | | | | | |
Financial assets at fair value through profit or loss | | | | | | | | | | | | | | | | |
Rental Purchase Plan | | | — | | | | 191 | | | | — | | | | 191 | |
Derivatives | | | 111 | | | | 351 | | | | 5 | | | | 467 | |
Securities and bonds | | | 4,451 | | | | 7,317 | | | | — | | | | 11,767 | |
Shares | | | 265 | | | | — | | | | — | | | | 265 | |
Loans | | | — | | | | 9,854 | | | | — | | | | 9,854 | |
Other investments | | | 573 | | | | 41,704 | | | | — | | | | 42,276 | |
Available-for-sale financial assets | | | | | | | | | | | | | | | | |
Corporate bonds | | | 352 | | | | — | | | | — | | | | 195 | |
Shares | | | 2 | | | | — | | | | — | | | | 2 | |
Other | | | — | | | | 20 | | | | — | | | | 15 | |
| | | | | | | | | | | | | | | | |
Total assets | | | 5,753 | | | | 59,436 | | | | 5 | | | | 65,033 | |
| | | | | | | | | | | | | | | | |
| | | | |
Liabilities | | | | | | | | | | | | | | | | |
Financial liabilities at fair value through profit or loss | | | | | | | | | | | | | | | | |
Derivatives | | | 225 | | | | 731 | | | | 4 | | | | 960 | |
Deposits | | | — | | | | 4,730 | | | | — | | | | 4,730 | |
Government securities issued | | | 83,719 | | | | 16,667 | | | | — | | | | 100,386 | |
Borrowings | | | — | | | | 294 | | | | — | | | | 294 | |
| | | | | | | | | | | | | | | | |
Total liabilities | | | 83,944 | | | | 22,421 | | | | 4 | | | | 106,369 | |
| | | | | | | | | | | | | | | | |
| | | | |
2015 | | | | | | | | | | | | | | | | |
Assets | | | | | | | | | | | | | | | | |
Financial assets at fair value through profit or loss | | | | | | | | | | | | | | | | |
Rental Purchase Plan | | | — | | | | 192 | | | | — | | | | 192 | |
Derivatives | | | 18 | | | | 415 | | | | 4 | | | | 437 | |
Securities and bonds | | | 12,786 | | | | 1 | | | | — | | | | 12,787 | |
Shares | | | 282 | | | | — | | | | — | | | | 282 | |
Loans | | | — | | | | 9,615 | | | | — | | | | 9,615 | |
Other investments | | | 657 | | | | 46,012 | | | | — | | | | 46,669 | |
Available-for-sale financial assets | | | | | | | | | | | | | | | | |
Corporate bonds | | | 195 | | | | — | | | | — | | | | 195 | |
Shares | | | 2 | | | | — | | | | — | | | | 2 | |
Other | | | — | | | | 15 | | | | — | | | | 15 | |
| | | | | | | | | | | | | | | | |
Total assets | | | 13,939 | | | | 56,250 | | | | 4 | | | | 70,193 | |
| | | | | | | | | | | | | | | | |
| | | | |
Liabilities | | | | | | | | | | | | | | | | |
Financial liabilities at fair value through profit or loss | | | | | | | | | | | | | | | | |
Derivatives | | | 45 | | | | 549 | | | | 8 | | | | 603 | |
Deposits | | | — | | | | 5,056 | | | | — | | | | 5,056 | |
Government securities issued | | | 92,702 | | | | 8,479 | | | | — | | | | 101,181 | |
Borrowings | | | — | | | | 251 | | | | — | | | | 251 | |
| | | | | | | | | | | | | | | | |
Total liabilities | | | 92,747 | | | | 14,335 | | | | 8 | | | | 107,090 | |
| | | | | | | | | | | | | | | | |
Classification of instruments into fair value hierarchy levels is reviewed annually and the GGS and Total State Sector recognise any transfers between levels of the fair value hierarchy during the reporting period in which the transfer has occurred.
There were no significant transfers between level 1 and level 2 during the years ended 30 June 2016 and 2015. Certain derivative instruments of the Total State Sector were transferred out of level 3 to level 2 due to an increase in market liquidity and the instruments becoming readily available.
Net changes in level 3 instruments are not material.
The sensitivity of the State’s level 3 derivatives is not material.
| | | | |
| 6-72 | | Audited Consolidated Financial Statements 2015–16 – Government of Queensland |
Notes to the Financial Statements
| 48. | Retirement benefit obligations |
Retirement benefit liabilities include the following final salary defined benefit schemes:
| | - | | State Public Sector Superannuation Scheme (QSuper); |
| | - | | Pensions provided in accordance with the Judges’ (Pensions and Long Leave) Act 1957 (Judges’ Scheme); and |
| | - | | Energy Super Fund (ESF) |
QSuper and Judges’ Schemes
The State Public Sector Superannuation Fund (QSuper) defined benefit scheme provides accrued benefits based on a member’s salary, contribution rate and length of membership. State Government budget dependent agencies, together with a number of statutory bodies, excluding principally the Queensland electricity supply industry, make employer contributions as required.
QSuper is a regulated defined benefit scheme under the prudential supervision of the Australian Prudential Regulation Authority (APRA) and is subject to the legislation under the Superannuation Industry (Supervision) Act and Regulations. The provisions of the Superannuation (State Public Sector) Act 1990 and the Superannuation (State Public Sector) Deed 1990 govern the operation of QSuper. The QSuper Board of Trustees is responsible for the management of QSuper.
The QSuper scheme is assessed annually by the State Actuary. The latest full actuarial review of the QSuper scheme was as at 30 June 2015 and was presented in a report dated 31 March 2016.
The QSuper defined benefit account is closed to new members.
The Judges’ Scheme provides defined benefit pension entitlements to serving judges and is governed by the provisions of the Judges (Pensions and Long Leave) Act 1957. The Judges’ Scheme is a wholly unfunded scheme.
These schemes expose the State to the following :
| | - | | Inflation risk - the defined benefit obligations are linked to employees’ salaries and therefore the net liability position can be adversely affected by an increase in the defined benefit obligation resulting from unexpected wage inflation. Similarly, the proportion of the defined benefit obligation linked to the consumer price index (pensions) is also subject to the risk of unexpected price inflation. |
| | - | | Interest rate risk - a decrease in the discount rate will increase the defined benefit obligations. |
| | - | | Investment risk resulting from the mismatch between the current investment strategy and the liabilities. |
| | - | | Demographic risk resulting from unexpected employee movements. |
QSuper also incorporates defined contribution categories, for which the State has no further legal or constructive obligation other than to pay contributions. These liabilities and assets have been accounted for in accordance with the standards relevant to defined contribution schemes. In particular, no assets or liabilities relating to the funded Defined Contribution scheme have been included in the Balance Sheet. The expense relating to these schemes is the amount of employer contributions, $2.087 billion (2015, $1.872 billion).
Energy Super Fund
Queensland electricity entities contribute to an industry multiple employer superannuation fund, the Energy Super Fund (ESF). The ESF was formed on the 1 April 2011 with the merger of the Electricity Supply Industry Superannuation Fund (QLD) (ESI Super) and Superannuation Plan for Electrical Contractors (SPEC Super). Members are entitled to benefits from the fund on retirement, resignation, retrenchment, disability or death.
ESF is regulated by APRA under the Superannuation Industry (Supervision) Act 1993.
The defined benefit account of this fund is a funded plan which provides defined lump sum benefits based on years of service and average final salary. Employer contributions to the defined benefit section of the plan are based on recommendations by the plan’s actuary. The actuary has adopted the aggregate funding method to ensure that the benefit entitlements of members and other beneficiaries are fully funded by the time they become payable. This funding method seeks to have benefits funded by a total contribution which is expected to be a constant percentage of members’ salaries and wages over their working lifetimes. Actuarial assessments are made at no more than three yearly intervals, with the most recent actuarial assessment undertaken as at 30 June 2013 by Sunsuper Financial Services Pty Ltd.
The ESF does not impose a legal liability on employer agencies to cover any deficits that may exist in the fund. If the fund were to be wound up there would be no legal obligation on employer agencies to make good any shortfall. The Trust Deed of the Fund states that if the Fund is terminated, after payment of all costs and member benefits in respect for the period up to the date of termination, any remaining assets are to be distributed by the Trustees of the Fund, acting on the advice of the actuary, to participating employers.
Employer agencies may benefit from any surplus in the Fund in the form of a contribution reduction or contribution holiday. Any reduction in contributions would normally be implemented only after advice from the Fund’s actuary.
The defined benefit account of this fund is closed to new members.
| | | | |
| Audited Consolidated Financial Statements 2015–16 – Government of Queensland | | 6-73 |
Notes to the Financial Statements
| 48. | Retirement benefit obligations continued |
| | | | | | | | | | | | | | | | |
| | | General Government | | | | | | | |
| | | Sector | | | Total State Sector | |
| | | 2016 | | | 2015 | | | 2016 | | | 2015 | |
| | | $M | | | $M | | | $M | | | $M | |
Present value of the defined benefit obligation | | | | | | | | | | | | | | | | |
QSuper DB | | | 31,841 | | | | 30,276 | | | | 31,841 | | | | 30,276 | |
Judges | | | 755 | | | | 665 | | | | 755 | | | | 665 | |
ESF | | | — | | | | — | | | | 1,041 | | | | 961 | |
Total present value of the defined benefit obligation | | | 32,596 | | | | 30,941 | | | | 33,637 | | | | 31,902 | |
| | | | |
Fair value of plan assets | | | | | | | | | | | | | | | | |
QSuper DB | | | 5,236 | | | | 5,072 | | | | 5,236 | | | | 5,072 | |
Judges | | | — | | | | — | | | | — | | | | — | |
ESF | | | — | | | | — | | | | 1,212 | | | | 1,264 | |
Total fair value of the plan assets | | | 5,236 | | | | 5,072 | | | | 6,448 | | | | 6,336 | |
| | | | |
Defined benefit obligation Liability/(Asset) recognised in Balance Sheet | | | | | | | | | | | | | | | | |
QSuper DB | | | 26,605 | | | | 25,204 | | | | 26,605 | | | | 25,204 | |
Judges | | | 755 | | | | 665 | | | | 755 | | | | 665 | |
ESF | | | — | | | | — | | | | (171 | ) | | | (303 | ) |
Liability/(Asset) recognised in Balance Sheet | | | 27,360 | | | | 25,869 | | | | 27,189 | | | | 25,566 | |
| | | | |
Reconciliation of the present value of the defined benefit obligation | | | | | | | | | | | | | | | | |
Opening balance | | | 30,941 | | | | 30,261 | | | | 31,902 | | | | 31,363 | |
Current service cost | | | 946 | | | | 934 | | | | 983 | | | | 977 | |
Contributions by plan participants | | | 207 | | | | 240 | | | | 218 | | | | 251 | |
Interest cost | | | 919 | | | | 1,044 | | | | 956 | | | | 1,080 | |
Benefits paid (including contributions tax) | | | (1,850 | ) | | | (2,076 | ) | | | (1,977 | ) | | | (2,200 | ) |
Actuarial (gain)/loss | | | 1,433 | | | | 538 | | | | 1,555 | | | | 431 | |
Closing balance | | | 32,596 | | | | 30,941 | | | | 33,637 | | | | 31,902 | |
| | | | |
Reconciliation of the fair value of plan assets | | | | | | | | | | | | | | | | |
Opening balance | | | 5,072 | | | | 4,749 | | | | 6,336 | | | | 6,004 | |
Return on plan assets at discount rate | | | 151 | | | | 166 | | | | 200 | | | | 207 | |
Return on plan assets above discount rate (actuarial gain) | | | 60 | | | | 179 | | | | 67 | | | | 249 | |
Employer contributions - State share of beneficiary payments | | | 1,579 | | | | 1,796 | | | | 1,579 | | | | 1,796 | |
Employer contributions | | | — | | | | — | | | | 8 | | | | 11 | |
Contributions by plan participants | | | 207 | | | | 240 | | | | 218 | | | | 251 | |
Benefits paid (including contributions tax) | | | (1,833 | ) | | | (2,058 | ) | | | (1,960 | ) | | | (2,182 | ) |
Closing balance | | | 5,236 | | | | 5,072 | | | | 6,448 | | | | 6,336 | |
| | | | |
Present value of the obligation by funding policy | | | | | | | | | | | | | | | | |
Present value of the obligation - wholly unfunded | | | 755 | | | | 665 | | | | 755 | | | | 665 | |
Present value of the obligation - wholly/partly funded | | | 26,605 | | | | 25,204 | | | | 26,434 | | | | 24,901 | |
| | | 27,360 | | | | 25,869 | | | | 27,189 | | | | 25,566 | |
Amounts recognised in Operating Statement | | | | | | | | | | | | | | | | |
Current service cost (including employer contributions) | | | 946 | | | | 934 | | | | 983 | | | | 977 | |
Superannuation interest cost | | | 767 | | | | 878 | | | | 755 | | | | 873 | |
Total amounts recognised in Operating Statement | | | 1,713 | | | | 1,812 | | | | 1,739 | | | | 1,850 | |
| | | | |
| 6-74 | | Audited Consolidated Financial Statements 2015–16 – Government of Queensland |
Notes to the Financial Statements
| 48. | Retirement benefit obligations continued |
| | | | | | | | | | | | | | | | |
| | | General Government | | | | | | | |
| | | Sector | | | Total State Sector | |
| | | 2016 | | | 2015 | | | 2016 | | | 2015 | |
| | | $M | | | $M | | | $M | | | $M | |
Remeasurements of net defined benefit obligation | | | | | | | | | | | | | | | | |
| | | | |
Actuarial gain/(loss) due to changes in demographic assumptions | | | (300 | ) | | | — | | | | (300 | ) | | | — | |
Actuarial gain/(loss) due to changes in financial assumptions | | | (1,569 | ) | | | (1,058 | ) | | | (1,655 | ) | | | (965 | ) |
Actuarial gain/(loss) due to changes in experience adjustments | | | 436 | | | | 520 | | | | 397 | | | | 533 | |
Return on plan assets above discount rate | | | 60 | | | | 179 | | | | 67 | | | | 249 | |
Amounts recognised in Statement of Changes in Net Assets (Equity) | | | (1,373 | ) | | | (359 | ) | | | (1,491 | ) | | | (183 | ) |
| | | | | | | | | | | | | |
Plan Asset Allocations
The State Public Sector Superannuation scheme holds investments with the following asset allocations:
| | | | | | | | | | | | | | | | |
| | | 2016 | | | 2016 | | | 2015 | | | 2015 | |
| | | Quoted | | | Unquoted | | | Quoted | | | Unquoted | |
| | | $M | | | $M | | | $M | | | $M | |
Global equities | | | 3,361 | | | | — | | | | 3,190 | | | | — | |
Global private equity | | | — | | | | 153 | | | | — | | | | 175 | |
Global real estate | | | — | | | | 1,097 | | | | — | | | | 1,059 | |
Cash and fixed interest | | | — | | | | 625 | | | | — | | | | 648 | |
| | | | | | | | | | | | | | | | |
Total | | | 3,361 | | | | 1,875 | | | | 3,190 | | | | 1,882 | |
| | | | | | | | | | | | | | | | |
QSuper plan assets are those held within the QSuper Trust Fund only. QSuper holds investments in unit trusts that hold financial instruments issued by the State. These instruments are difficult to value accurately and are immaterial in proportion to the value of the unit trusts. In addition, these trusts own properties which are used by Government agencies. Again the exact values attributable to these tenancies are difficult to determine accurately, nor do they represent a material proportion of the fair value of plan assets.
No plan assets are held in respect of the Judges’ Scheme.
| | | | | | | | |
| | | 2016 | | | 2015 | |
| | | $M | | | $M | |
The major categories of Energy Super Fund plan assets are as follows: | | | | | | | | |
Global equities | | | 616 | | | | 659 | |
Cash and fixed interest | | | 180 | | | | 238 | |
Real estate | | | 150 | | | | 127 | |
Other | | | 266 | | | | 240 | |
| | | | | | | | |
| | | 1,212 | | | | 1,264 | |
| | | | | | | | |
| | | | | | | | | | | | | | | | |
| | | 2016 | | | 2015 | | | 2016 | | | 2015 | |
| | | $M | | | $M | | | $M | | | $M | |
| | | QSuper DB | | | QSuper DB | | | ESF | | | ESF | |
Actual return on plan assets | | | 211 | | | | 345 | | | | 57 | | | | 111 | |
| | | | | | | | |
| | | QSuper DB | | | ESF | |
Estimate of State share of benefits (employer contributions) to be paid in 2016-17 | | | 1,903 | | | | 8 | |
| | | | |
| Audited Consolidated Financial Statements 2015–16 – Government of Queensland | | 6-75 |
Notes to the Financial Statements
| 48. | Retirement benefit obligations continued |
| | | | | | | | | | | | |
| Principal actuarial assumptions at 30 June 2016 | | QSuper DB | | | Judges | | | ESF | |
Discount rate | | | 2.00 | % | | | 2.00 | % | | | 3.30 | % |
Future inflationary salary increases | | | 2.60 | % | | | 2.60 | % | | | 3.0-4.0 | % |
Expected CPI increases | | | 1.60 | % | | | N/A | | | | N/A | |
| | | |
| Principal actuarial assumptions at 30 June 2015 | | QSuper DB | | | Judges | | | ESF | |
Discount rate | | | 3.10 | % | | | 3.10 | % | | | 4.3-4.5 | % |
Future inflationary salary increases | | | 3.20 | % | | | 3.20 | % | | | 3.0-4.0 | % |
Expected CPI increases | | | 2.20 | % | | | N/A | | | | N/A | |
At 30 June 2016, the weighted average duration of the QSuper defined benefit obligation is 8.6 years (8.6 years, 2015) and between 9 and 10 years for the ESF defined benefit obligation.
Sensitivity Analysis for each significant actuarial assumption
| | | | | | | | |
| | | $M | | | $M | |
| | | QSuper DB | | | Judges | |
Change in defined benefit obligation brought about by a 1% increase in: | | | | | | | | |
Discount rate | | | (2,499 | ) | | | (105 | ) |
Future inflationary salary increases | | | 2,594 | | | | 130 | |
Expected CPI increases | | | 227 | | | | N/A | |
The sensitivity analysis shown above represents the effects of notional changes in each of the key parameters underlying the obligations, while holding all other assumptions constant. The sensitivity analysis may not be representative of the actual change in the defined benefit obligation as it is unlikely that the change in assumptions would occur in isolation of one another as some of the assumptions are correlated. They are not intended to represent any particular probability of occurrence.
In presenting the above sensitivity analysis, the present value of the defined benefit obligation has been calculated using the projected unit credit method at the end of the reporting period, which is the same as that applied in calculating the defined benefit obligation liability recognised in the Balance Sheet.
QSuper funding arrangements and funding policy that affect future contributions
QSuper defined benefit category members are required to contribute a percentage of salary. Standard member contributions range between 5-6% of salary.
Unlike typical regulated defined benefit schemes, only the employee contributions are held within the QSuper Fund. Employer contributions received from employing authorities are held separate from the QSuper Fund in the Long Term Asset portfolio held by Queensland Treasury Corporation. The State makes a last minute contribution to the QSuper Fund when a member exits the defined benefit scheme. Employer contributions to the Fund are decided by the QSuper Board based on the recommendation of the Actuary (95% of benefit payments) as per the relevant actuarial investigation for funding purposes.
Under the Debt Action Plan announced in the 2015-16 Budget the Government has suspended for five years, commencing in 2015-16, the investment of defined benefit employer contributions.
The Long Term Asset portfolio held by the Government, within the Total State Sector, to fund the employee entitlement liabilities includes interest rate and inflation linked portfolios intended to partially hedge the corresponding liability risks.
Employee numbers
|
| The number of full time equivalent employees in the GGS at 30 June 2016 relating to the GGS entities listed in Note 49 totalled 215,751 (2015, 206,557). The full time equivalent employees number for 2016 calculated using the same scope as Budget Paper 2 (Table 5.2) is 210,285. |
The number of Total State full time equivalent employees at 30 June 2016 relating to the consolidated entities listed in Note 49 totalled 234,390 (2015, 225,463).
| | | | |
| 6-76 | | Audited Consolidated Financial Statements 2015–16 – Government of Queensland |
Notes to the Financial Statements
Public sector entities are generally considered material for the purposes of this report if they meet either of the following criteria:
| | - | | net operating result in excess of $5 million (2015, $4 million); or |
| | - | | net assets in excess of $75 million (2015, $50 million). |
However, in addition to material entities, the State consolidates some entities which are not material in terms of the operating position or net asset position criteria if they are either a department or if they are funded for the delivery of services.
When financial results are available in respect of non-material entities, they are reviewed with the aim of including any newly material entities in the following year’s consolidated financial statements.
Newly created entities that are expected to meet the materiality criteria on the basis of their initial budget estimates are included in the consolidated financial statements from the time of their establishment.
The following controlled entities of the Government have been included in the consolidated financial statements for the year ended 30 June 2016. The list has been classified by activity sectors as outlined in Note 1(c).
Entities denoted with an asterisk are consolidated with the accounts of the preceding entity.
The GGS has 100% ownership and voting power in other Queensland public sector entities, classified as either Public Non-financial Corporations or Public Financial Corporations below.
General Government
Departments of Government
Aboriginal and Torres Strait Islander Partnerships
Agriculture and Fisheries
Communities, Child Safety and Disability Services
Education and Training
Energy and Water Supply
Environment and Heritage Protection
Housing and Public Works
| | * | Building and Asset Services - commercialised business unit |
| | * | QFleet - commercialised business unit |
Infrastructure, Local Government and Planning
| | * | Economic Development Queensland - commercialised business unit |
Justice and Attorney-General
National Parks, Sport and Racing
Natural Resources and Mines
Premier and Cabinet
| | * | Corporate Administration Agency - shared service provider |
Public Safety Business Agency
Queensland Fire and Emergency Services
Queensland Health
Queensland Police Service
Queensland Treasury
Science, Information Technology and Innovation
| | * | CITEC - commercialised business unit |
| | * | Queensland Shared Services - shared service provider |
State Development
Tourism, Major Events, Small Business and the Commonwealth Games
Transport and Main Roads
| | * | RoadTek - commercialised business unit |
Other General Government entities
Anti-Discrimination Commission
Board of the Queensland Museum
| | * | Queensland Museum Foundation Trust |
City North Infrastructure Pty Ltd (deconsolidated 1 July 2015)
Crime and Corruption Commission
Electoral Commission of Queensland
Gold Coast 2018 Commonwealth Games Corporation
Gold Coast Waterways Authority
| | | | |
| Audited Consolidated Financial Statements 2015–16 – Government of Queensland | | 6-77 |
Notes to the Financial Statements
| 49. | Controlled entities continued |
General Government continued
Other General Government entities continued
Hospital and Health Services
Cairns and Hinterland
Central Queensland
Central West
Children’s Health Queensland
Darling Downs
Gold Coast
Mackay
Metro North
Metro South
North West
South West
Sunshine Coast
Torres and Cape
Townsville
West Moreton
Wide Bay
Legal Aid Queensland
Legislative Assembly
Library Board of Queensland
* Queensland Library Foundation
Motor Accident Insurance Commission
Nominal Defendant
Office of the Governor
Office of the Health Ombudsman
Office of the Information Commissioner
Office of the Inspector-General of Emergency Management
Office of the Ombudsman
Prostitution Licensing Authority
Public Service Commission
QRAA
Queensland Agricultural Training Colleges
Queensland Art Gallery Board of Trustees
* Queensland Art Gallery Foundation
Queensland Audit Office
Queensland Building and Construction Commission
Queensland Curriculum and Assessment Authority
Queensland Family and Child Commission
Queensland Mental Health Commission
Queensland Performing Arts Trust
Queensland Reconstruction Authority
Residential Tenancies Authority
South Bank Corporation
TAFE Queensland
The Council of the Queensland Institute of Medical Research
The Public Trustee of Queensland
Tourism and Events Queensland
* Gold Coast Events Management Ltd
Trade and Investment Queensland
| | | | |
| 6-78 | | Audited Consolidated Financial Statements 2015–16 – Government of Queensland |
Notes to the Financial Statements
| 49. | Controlled entities continued |
Public Non-financial Corporations
CS Energy Ltd
* Aberdare Collieries Pty Ltd
* Callide Energy Pty Ltd
* CS Energy Group Holdings Pty Ltd
* CS Energy Group Operations Holdings Pty Ltd
* CS Energy Kogan Creek Pty Ltd
* CS Energy Oxyfuel Pty Ltd
* CS Kogan (Australia) Pty Ltd
* Kogan Creek Power Pty Ltd
* Kogan Creek Power Station Pty Ltd
* Manzillo Insurance (PCC) Ltd - Cell EnMach (wound up and closed during 2015-16)
Energy Queensland Limited (formed on 30 June 2016 by a merger of Ergon Energy and Energex)
*Energex Ltd
* Energy Impact Pty Ltd
* Metering Dynamics Business Support Pty Ltd
* Varnsdorf Pty Ltd
* VH Operations Pty Ltd
* Ergon Energy Corporation Limited
* Ergon Energy Queensland Pty Ltd
* Ergon Energy Telecommunications Pty Ltd
* Sparq Solutions Pty Ltd
Far North Queensland Ports Corporation Limited
Gladstone Area Water Board
Gladstone Ports Corporation Limited
* Gladstone Marine Pilot Services Pty Ltd
* Gladstone WICET Operations Pty Ltd (dormant)
Mount Isa Water Board
North Queensland Bulk Ports Corporation Limited
Port of Townsville Limited
Powerlink Queensland
* Harold Street Holdings Pty Ltd
* Powerlink Transmission Services Pty Ltd
Queensland Bulk Water Supply Authority (trading as Seqwater)
Queensland Rail
* Queensland Rail Limited
* On Track Insurance Pty Ltd
Queensland Treasury Holdings Pty Ltd (controlled entity of Queensland Treasury)
* Brisbane Port Holdings Pty Ltd
* DBCT Holdings Pty Ltd
* Network Infrastructure Company Pty Ltd
* Queensland Airport Holdings (Cairns) Pty Ltd
* Queensland Airport Holdings (Mackay) Pty Ltd
* Queensland Lottery Corporation Pty Ltd
Stadiums Queensland
Stanwell Corporation Limited
* Energy Portfolio 1 Pty Ltd (dormant)
* Glen Wilga Coal Pty Ltd (dormant)
* Goondi Energy Pty Ltd
* Mica Creek Pty Ltd
* SCL North West Pty Ltd
* Tarong Energy Corporation Pty Ltd (dormant)
* Tarong Fuel Pty Ltd
* Tarong North Pty Ltd
* TEC Coal Pty Ltd
* TN Power Pty Ltd
SunWater Limited
* Burnett Water Pty Ltd
* Eungella Water Pipeline Pty Ltd
* North West Queensland Water Pipeline Pty Ltd
| | | | |
| Audited Consolidated Financial Statements 2015–16 – Government of Queensland | | 6-79 |
Notes to the Financial Statements
| 49. | Controlled entities continued |
Public Financial Corporations
QIC Limited (non-trading entities that were effectively dormant are not included in this list)
* QIC European Investment Services Limited
* QIC Infrastructure Management No. 2 Pty Ltd
* QIC Investments No.1 Pty Ltd
* QIC Private Capital Pty Ltd
* QIC Properties Pty Ltd
* QIC (UK) Management Limited
* QIC US Management, Inc.
* QIC Global Infrastructure (US), Inc.
* QIC GRE Management (US), Inc.
* QIC (US) Investment Services, Inc.
* QIC Private Equity, LLC
* QIC Properties US, Inc.
* QIC US Shopping Centre Fund No 1 GP LLC
Queensland Treasury Corporation
WorkCover Queensland
The following reconciliations to GFS are determined in accordance with the ABS GFS Manual.
| | (a) | Reconciliation to GFS Net Operating Balance |
| | | | | | | | | | | | | | | | | | | | | | | | |
| | | | | | | | | | | | | | | | | | Total State | |
| | | Notes | | | GGS | | | PNFC | | | PFC | | | Elims | | | Sector | |
| | | | | | $M | | | $M | | | $M | | | $M | | | $M | |
2016 | | | | | | | | | | | | | | | | | | | | | | | | |
Net result from transactions | | | | | | | | | | | | | | | | | | | | | | | | |
Net operating balance (as per Operating Statement) | | | | | | | 970 | | | | 1,600 | | | | (1,258 | ) | | | (1,806 | ) | | | (494 | ) |
| | | | | | |
Convergence differences | | | | | | | | | | | | | | | | | | | | | | | | |
Other operating expenses - onerous contract | | | a | | | | — | | | | (12 | ) | | | — | | | | — | | | | (12 | ) |
Other property expenses - income transferred by Public Enterprises as dividends | | | b | | | | — | | | | (1,696 | ) | | | (109 | ) | | | 1,806 | | | | — | |
Total convergence differences | | | | | | | — | | | | (1,708 | ) | | | (109 | ) | | | 1,806 | | | | (12 | ) |
GFS Net Operating Balance | | | | | | | 970 | | | | (108 | ) | | | (1,367 | ) | | | — | | | | (506 | ) |
| | | | | | |
2015 | | | | | | | | | | | | | | | | | | | | | | | | |
Net result from transactions | | | | | | | | | | | | | | | | | | | | | | | | |
Net operating balance (as per Operating Statement) | | | | | | | 420 | | | | 1,629 | | | | (1,101 | ) | | | (1,828 | ) | | | (881 | ) |
| | | | | | |
Convergence differences | | | | | | | | | | | | | | | | | | | | | | | | |
Other operating expenses - onerous contract | | | a | | | | — | | | | (1 | ) | | | — | | | | — | | | | (1 | ) |
Other property expenses - income transferred by Public Enterprises as dividends | | | b | | | | — | | | | (1,731 | ) | | | (97 | ) | | | 1,828 | | | | — | |
Total convergence differences | | | | | | | — | | | | (1,732 | ) | | | (97 | ) | | | 1,828 | | | | (1 | ) |
GFS Net Operating Balance | | | | | | | 420 | | | | (103 | ) | | | (1,198 | ) | | | — | | | | (882 | ) |
Notes:
The convergence differences comprise:
| | a. | The Operating Statement treats onerous contract expenses as other economic flows included in the operating result. GFS only recognises expenses from transactions when payments are made from the provision. This difference flows through to the Total State Sector. |
| | b. | GFS treats dividends to owners as an expense, whereas in the Operating Statement, they are treated as a distribution to owners and therefore a direct debit to equity. The differences do not flow through to the Total State Sector as they arise from intersector transactions. |
An elimination difference arises in respect of social benefits of $36 million (2015, $39 million) in the GGS and $88 million (2015, $86 million) in the Total State Sector. In accordance with the ABS GFS Manual, certain transactions within and between the GGS and the PNFC sector are not eliminated on consolidation of the GGS or Total State Sector, whereas under AASB 127, intragroup transactions are eliminated in full. These benefits are grossed up for GFS reporting in sales of goods and services and other operating expenses and there is no net effect on the Net operating balance.
| | | | |
| 6-80 | | Audited Consolidated Financial Statements 2015–16 – Government of Queensland |
Notes to the Financial Statements
| 50. | Reconciliation to GFS continued |
| | (b) | Reconciliation to GFS Fiscal Balance |
| | | | | | | | | | | | | | | | | | | | | | | | |
| | | | | | | | | | | | | | | | | | Total State | |
| | | Notes | | | GGS | | | PNFC | | | PFC | | | Elims | | | Sector | |
| | | | | | $M | | | $M | | | $M | | | $M | | | $M | |
2016 | | | | | | | | | | | | | | | | | | | | | | | | |
Fiscal Balance (as per Operating Statement) | | | | | | | (461 | ) | | | 1,178 | | | | (1,230 | ) | | | (1,846 | ) | | | (2,360 | ) |
| | | | | | |
Convergence differences | | | | | | | | | | | | | | | | | | | | | | | | |
Relating to net operating balance | | | | | | | — | | | | (1,708 | ) | | | (109 | ) | | | 1,806 | | | | (12 | ) |
Purchases of non-financial assets | | | a | | | | (131 | ) | | | — | | | | — | | | | — | | | | (131 | ) |
Sales of non-financial assets | | | a | | | | 121 | | | | — | | | | — | | | | — | | | | 121 | |
Change in net inventories | | | a, b | | | | (45 | ) | | | — | | | | — | | | | — | | | | (45 | ) |
GFS Fiscal Balance | | | | | | | (515 | ) | | | (530 | ) | | | (1,339 | ) | | | (41 | ) | | | (2,425 | ) |
| | | | | | |
2015 | | | | | | | | | | | | | | | | | | | | | | | | |
Fiscal Balance (as per Operating Statement) | | | | | | | (572 | ) | | | 848 | | | | (1,067 | ) | | | (1,830 | ) | | | (2,622 | ) |
| | | | | | |
Convergence differences | | | | | | | | | | | | | | | | | | | | | | | | |
Relating to net operating balance | | | | | | | — | | | | (1,732 | ) | | | (97 | ) | | | 1,828 | | | | (1 | ) |
Purchases of non-financial assets | | | a | | | | (152 | ) | | | — | | | | — | | | | — | | | | (152 | ) |
Sales of non-financial assets | | | a | | | | 161 | | | | — | | | | — | | | | — | | | | 161 | |
Change in net inventories | | | a, b | | | | (77 | ) | | | — | | | | — | | | | — | | | | (77 | ) |
| | | | | | |
GFS Fiscal Balance | | | | | | | (640 | ) | | | (884 | ) | | | (1,164 | ) | | | (2 | ) | | | (2,691 | ) |
Notes:
The convergence differences comprise:
| | a. | GFS treats purchases and sales of land inventories and assets held for rental and subsequently held for sale as purchases and sales of non-financial assets. These are reflected in changes in net inventories for AASB 1049. |
| | b. | For AASB 1049, change in net inventories includes total changes in the balance of land inventories and assets held for rental and subsequently held for sale. |
| | (c) | Reconciliation to GFS Total Change in Net Worth |
| | | | | | | | | | | | | | | | | | | | | | | | |
| | | | | | | | | | | | | | | | | | Total State | |
| | | Notes | | | GGS | | | PNFC | | | PFC | | | Elims | | | Sector | |
| | | | | | $M | | | $M | | | $M | | | $M | | | $M | |
2016 | | | | | | | | | | | | | | | | | | | | | | | | |
Comprehensive result - total change in net worth before transactions with owners as owners (as per Operating Statement) | | | | | | | 19,976 | | | | 340 | | | | (839 | ) | | | (2,763 | ) | | | 16,715 | |
| | | | | | |
Convergence differences | | | | | | | | | | | | | | | | | | | | | | | | |
Income transferred from Public Enterprises as dividends | | | a | | | | — | | | | (1,696 | ) | | | (109 | ) | | | 1,806 | | | | — | |
Relating to other economic flows | | | | | | | | | | | | | | | | | | | | | | | | |
Impairment of receivables | | | b | | | | (7 | ) | | | 85 | | | | — | | | | — | | | | 78 | |
Net gain on investments in other entities | | | c | | | | (304 | ) | | | — | | | | — | | | | 304 | | | | — | |
Deferred income tax equivalents | | | d | | | | 401 | | | | (361 | ) | | | (39 | ) | | | — | | | | — | |
Net restoration costs | | | e | | | | (1 | ) | | | 26 | | | | — | | | | — | | | | 25 | |
Onerous contracts | | | f | | | | — | | | | (14 | ) | | | (1 | ) | | | — | | | | (15 | ) |
Remeasurement of shares and other contributed capital | | | g | | | | — | | | | 1,620 | | | | 989 | | | | (2,608 | ) | | | — | |
Total convergence differences | | | | | | | 89 | | | | (340 | ) | | | 839 | | | | (499 | ) | | | 89 | |
GFS Total Change in Net Worth | | | | | | | 20,065 | | | | — | | | | — | | | | (3,262 | ) | | | 16,804 | |
| | | | |
| Audited Consolidated Financial Statements 2015–16 – Government of Queensland | | 6-81 |
Notes to the Financial Statements
| 50. | Reconciliation to GFS continued |
| | (c) | Reconciliation to GFS Total Change in Net Worth continued |
| | | | | | | | | | | | | | | | | | | | | | | | |
| | | | | | | | | | | | | | | | | | Total State | |
| | | Notes | | | GGS | | | PNFC | | | PFC | | | Elims | | | Sector | |
| | | | | | $M | | | $M | | | $M | | | $M | | | $M | |
2015 | | | | | | | | | | | | | | | | | | | | | | | | |
Comprehensive result - total change in net worth before transactions with owners as owners (as per Operating Statement) | | | | | | | 5,442 | | | | 1,868 | | | | 505 | | | | (3,132 | ) | | | 4,682 | |
| | | | | | |
Convergence differences | | | | | | | | | | | | | | | | | | | | | | | | |
Income transferred from Public Enterprises as dividends | | | a | | | | — | | | | (1,731 | ) | | | (97 | ) | | | 1,828 | | | | — | |
Relating to other economic flows | | | | | | | | | | | | | | | | | | | | | | | | |
Impairment of receivables | | | b | | | | 84 | | | | 17 | | | | 1 | | | | — | | | | 101 | |
Net gain on investments in other entities | | | c | | | | 150 | | | | — | | | | — | | | | (150 | ) | | | — | |
Deferred income tax equivalents | | | d | | | | (323 | ) | | | 236 | | | | 86 | | | | — | | | | — | |
Net restoration costs | | | e | | | | 10 | | | | 1 | | | | — | | | | — | | | | 11 | |
Onerous contracts | | | f | | | | — | | | | (190 | ) | | | (1 | ) | | | — | | | | (191 | ) |
Other | | | | | | | | | | | | | | | | | | | | | | | | |
Remeasurement of shares and other contributed capital | | | g | | | | — | | | | (201 | ) | | | (494 | ) | | | 694 | | | | — | |
Total convergence differences | | | | | | | (80 | ) | | | (1,868 | ) | | | (505 | ) | | | 2,373 | | | | (80 | ) |
| | | | | | |
GFS Total Change in Net Worth | | | | | | | 5,362 | | | | — | | | | — | | | | (759 | ) | | | 4,602 | |
Notes:
The convergence differences comprise:
| | a. | GFS treats dividends to owners as an expense, whereas in the Operating Statement, they are treated as a distribution to owners and therefore a direct debit to equity. The differences do not flow through to the Total State Sector as they arise from intersector transactions. |
| | b. | GFS does not recognise impairment of receivables, whereas the Operating Statement recognises impairment of receivables and classifies them as other economic flows. The total difference flows through to the Total State Sector. |
| | c. | The measurement of equity investments in other public sector entities differs for GFS in that, for example, allowance for impairment of receivables, onerous contract provisions and deferred income tax balances are not recognised in net worth under GFS. In addition, the negative net worth of the individual public sector entities is included in the GGS valuation of those entities. |
| | d. | GFS does not recognise deferred income tax equivalents at all, whereas the Operating Statement recognises the deferred income tax equivalents and classifies them as other economic flows. The differences do not flow through to the Total State Sector as they arise from intersector transactions. |
| | e. | GFS does not recognise restoration costs, whereas restoration costs have been recognised in the Operating Statement. This difference flows through to the Total State Sector. |
| | f. | The Operating Statement treats onerous contract expenses as other economic flows included in the operating result. GFS only recognises expenses from transactions when payments are made from the provision. This difference flows through to the Total State Sector. |
| | g. | GFS measures net worth as assets less liabilities less shares/contributed equity (remeasured). Shares/contributed equity are not deducted under Australian Accounting Standards. |
| | | | |
| 6-82 | | Audited Consolidated Financial Statements 2015–16 – Government of Queensland |
Notes to the Financial Statements
| 50. | Reconciliation to GFS continued |
| | (d) | Reconciliation to GFS Net Worth |
| | | | | | | | | | | | | | | | | | | | | | | | |
| | | | | | | | | | | | | | | | | | Total State | |
| | | Notes | | | GGS | | | PNFC | | | PFC | | | Elims | | | Sector | |
| | | | | | $M | | | $M | | | $M | | | $M | | | $M | |
2016 | | | | | | | | | | | | | | | | | | | | | | | | |
Net Worth (as per Balance Sheet) | | | | | | | 191,910 | | | | 17,208 | | | | 3,269 | | | | (30,297 | ) | | | 182,090 | |
| | | | | | |
Convergence differences | | | | | | | | | | | | | | | | | | | | | | | | |
Financial assets | | | | | | | | | | | | | | | | | | | | | | | | |
Accounts receivable | | | a | | | | 728 | | | | 120 | | | | 4 | | | | — | | | | 852 | |
Investment in other entities | | | b | | | | 5,838 | | | | — | | | | — | | | | (5,838 | ) | | | — | |
Non-financial assets | | | | | | | | | | | | | | | | | | | | | | | | |
Restoration assets | | | c | | | | 6 | | | | (68 | ) | | | — | | | | — | | | | (62 | ) |
Deferred tax assets | | | d | | | | (5,972 | ) | | | (770 | ) | | | (43 | ) | | | 6,786 | | | | — | |
Liabilities | | | | | | | | | | | | | | | | | | | | | | | | |
Deferred tax liabilities | | | e | | | | 814 | | | | 5,955 | | | | 17 | | | | (6,786 | ) | | | — | |
Restoration provision | | | f | | | | 1 | | | | 428 | | | | — | | | | — | | | | 430 | |
Provision for onerous contracts | | | g | | | | 1 | | | | 194 | | | | — | | | | — | | | | 196 | |
Shares and other contributed equity | | | h | | | | — | | | | (23,068 | ) | | | (3,247 | ) | | | 26,315 | | | | — | |
Total convergence differences | | | | | | | 1,416 | | | | (17,208 | ) | | | (3,269 | ) | | | 20,477 | | | | 1,416 | |
GFS Net Worth | | | | | | | 193,326 | | | | — | | | | — | | | | (9,820 | ) | | | 183,506 | |
| | | | | | |
2015 | | | | | | | | | | | | | | | | | | | | | | | | |
Net Worth (as per Balance Sheet) | | | | | | | 171,933 | | | | 19,469 | | | | 4,217 | | | | (30,245 | ) | | | 165,375 | |
| | | | | | |
Convergence differences | | | | | | | | | | | | | | | | | | | | | | | | |
Financial assets | | | | | | | | | | | | | | | | | | | | | | | | |
Accounts receivable | | | a | | | | 734 | | | | 35 | | | | 5 | | | | — | | | | 774 | |
Investment in other entities | | | b | | | | 6,142 | | | | — | | | | — | | | | (6,142 | ) | | | — | |
Non-financial assets | | | | | | | | | | | | | | | | | | | | | | | | |
Restoration assets | | | c | | | | 6 | | | | (138 | ) | | | — | | | | — | | | | (132 | ) |
Deferred tax assets | | | d | | | | (6,233 | ) | | | (641 | ) | | | (33 | ) | | | 6,908 | | | | — | |
Liabilities | | | | | | | | | | | | | | | | | | | | | | | | |
Deferred tax liabilities | | | e | | | | 674 | | | | 6,187 | | | | 46 | | | | (6,908 | ) | | | — | |
Restoration provision | | | f | | | | 3 | | | | 471 | | | | — | | | | — | | | | 475 | |
Provision for onerous contracts | | | g | | | | 1 | | | | 209 | | | | 1 | | | | — | | | | 210 | |
Shares and other contributed equity | | | h | | | | — | | | | (25,592 | ) | | | (4,236 | ) | | | 29,828 | | | | — | |
Total convergence differences | | | | | | | 1,327 | | | | (19,469 | ) | | | (4,217 | ) | | | 23,686 | | | | 1,327 | |
GFS Net Worth | | | | | | | 173,260 | | | | — | | | | — | | | | (6,559 | ) | | | 166,702 | |
Notes:
The convergence differences comprise:
| | a. | GFS does not recognise impairment of receivables, whereas an allowance for impairment of receivables is recognised in the Balance Sheet. This total convergence difference flows through to the Total State Sector. |
| | b. | The measurement of equity investments in other public sector entities differs for GFS in that, for example, allowance for impairment of receivables, net restoration provisions, onerous contract provisions and deferred income tax balances are not recognised in net worth under GFS. In addition, the negative net worth of the individual public sector entities is included in the GGS valuation of those entities. |
| | | | | | | | | | | | | | | | |
| | | General Government | | | | | | | |
| | | Sector | | | | | | | |
| | | 2016 | | | 2015 | | | | | | | |
| | | $M | | | $M | | | | | | | |
Reconciliation of GAAP GGS investments in other public sector entities to GFS | | | | | | | | | | | | | | | | |
| | | | |
Investments in other public sector entities under GAAP | | | 20,477 | | | | 23,685 | | | | | | | | | |
Less negative net worth of PNFCs and PFCs | | | — | | | | — | | | | | | | | | |
Add allowance for impairment of receivables | | | 124 | | | | 40 | | | | | | | | | |
Add net deferred tax equivalent liabilities reported by PNFC and PFC | | | 5,159 | | | | 5,559 | | | | | | | | | |
Add provisions for onerous contracts recorded by PNFC and PFC | | | 195 | | | | 210 | | | | | | | | | |
Add net restoration costs | | | 360 | | | | 334 | | | | | | | | | |
Investments in other public sector entities under GFS | | | 26,315 | | | | 29,828 | | | | | | | | | |
| | | | |
| Audited Consolidated Financial Statements 2015–16 – Government of Queensland | | 6-83 |
Notes to the Financial Statements
| 50. | Reconciliation to GFS continued |
| | (d) | Reconciliation to GFS Net Worth continued |
| | c. | GFS does not recognise restoration assets, whereas restoration assets have been recognised in the Balance Sheet. This difference flows through to the Total State Sector. |
| | d. | GFS does not recognise deferred tax assets, whereas deferred tax assets are classified as non-financial assets in the Balance Sheet. The difference does not flow through to the Total State Sector as it arises from intersector transactions. |
| | e. | GFS does not recognise deferred tax liabilities, whereas deferred tax liabilities are classified as non-financial liabilities in the Balance Sheet. The difference does not flow through to the Total State Sector as it arises from intersector transactions. |
| | f. | GFS does not recognise restoration provisions, whereas restoration provisions have been recognised in the Balance Sheet. This difference flows through to the Total State Sector. |
| | g. | GFS does not recognise a provision for onerous contracts, whereas a provision for onerous contracts is recognised in the Balance Sheet. This difference flows through to the Total State Sector. |
| | h. | GFS measures net worth as assets less liabilities less shares/contributed equity. Shares/contributed equity are not deducted under Australian Accounting Standards. |
| | (e) | Reconciliation to GFS Cash Surplus/(Deficit) |
| | | | | | | | | | | | | | | | | | | | | | | | |
| | | | | | | | | | | | | | | | | | Total State | |
| | | Notes | | | GGS | | | PNFC | | | PFC | | | Elims | | | Sector | |
| | | | | | $M | | | $M | | | $M | | | $M | | | $M | |
2016 | | | | | | | | | | | | | | | | | | | | | | | | |
Cash surplus/(deficit) | | | | | | | 866 | | | | (1,459 | ) | | | (1,263 | ) | | | — | | | | (1,849 | ) |
Convergence differences | | | | | | | | | | | | | | | | | | | | | | | | |
Acquisitions under finances leases and similar arrangements | | | a | | | | (341 | ) | | | — | | | | — | | | | — | | | | (341 | ) |
GFS Cash Surplus/(Deficit) | | | | | | | 525 | | | | (1,459 | ) | | | (1,263 | ) | | | — | | | | (2,190 | ) |
| | | | | | |
2015 | | | | | | | | | | | | | | | | | | | | | | | | |
Cash surplus/(deficit) | | | | | | | (105 | ) | | | (450 | ) | | | (1,636 | ) | | | — | | | | (2,191 | ) |
Convergence differences | | | | | | | | | | | | | | | | | | | | | | | | |
Acquisitions under finances leases and similar arrangements | | | a | | | | (470 | ) | | | (9 | ) | | | — | | | | — | | | | (479 | ) |
GFS Cash Surplus/(Deficit) | | | | | | | (575 | ) | | | (459 | ) | | | (1,636 | ) | | | — | | | | (2,670 | ) |
Notes:
| | a. | The convergence differences arise because GFS recognises a notional cash outflow relating to new finance leases and similar arrangements in calculating cash surplus/(deficit), whereas the Cash Flow Statement does not recognise notional cash flows. This total difference flows through to the Total State Sector. |
| | | | |
6-84 | | Audited Consolidated Financial Statements 2015–16 – Government of Queensland |
Notes to the Financial Statements
| | | | | | | | | | | | | | | | | | |
| | | | | General Government | | | | | | | |
| | | | | Sector | | | Total State Sector | |
| | | | | 2016 | | | 2015 | | | 2016 | | | 2015 | |
| | | | | $M | | | $M | | | $M | | | $M | |
51. | | Expenses from transactions by function | | | | | | | | | | | | | | | | |
| | | | | |
| | General public services | | | 1,648 | | | | 1,803 | | | | 1,861 | | | | 1,941 | |
| | Public order and safety | | | 4,495 | | | | 4,337 | | | | 4,446 | | | | 4,290 | |
| | Education | | | 11,810 | | | | 11,263 | | | | 11,687 | | | | 11,145 | |
| | Health | | | 15,099 | | | | 13,668 | | | | 15,013 | | | | 13,588 | |
| | Social security and welfare | | | 3,091 | | | | 2,978 | | | | 3,030 | | | | 2,920 | |
| | Housing and community amenities | | | 1,455 | | | | 1,551 | | | | 1,991 | | | | 2,073 | |
| | Recreation and culture | | | 1,109 | | | | 928 | | | | 1,166 | | | | 995 | |
| | Fuel and energy | | | 570 | | | | 640 | | | | 4,787 | | | | 4,398 | |
| | Agriculture, forestry, fishing and hunting | | | 692 | | | | 630 | | | | 845 | | | | 772 | |
| | Mining, manufacturing and construction | | | 284 | | | | 243 | | | | 284 | | | | 243 | |
| | Transport and communications | | | 5,303 | | | | 6,398 | | | | 5,483 | | | | 6,673 | |
| | Other economic affairs | | | 874 | | | | 769 | | | | 874 | | | | 768 | |
| | Other purposes | | | 3,597 | | | | 4,341 | | | | 6,887 | | | | 7,385 | |
| | | | | 50,025 | | | | 49,551 | | | | 58,353 | | | | 57,191 | |
52. | | Sector assets by function | | | | | | | | | | | | | | | | |
| | | | | |
| | General public services | | | 1,540 | | | | 3,396 | | | | 1,614 | | | | 1,532 | |
| | Public order and safety | | | 7,984 | | | | 7,678 | | | | 7,813 | | | | 7,470 | |
| | Education | | | 20,131 | | | | 18,458 | | | | 19,979 | | | | 18,301 | |
| | Health | | | 13,667 | | | | 13,050 | | | | 13,634 | | | | 13,014 | |
| | Social security and welfare | | | 539 | | | | 578 | | | | 534 | | | | 567 | |
| | Housing and community amenities | | | 18,138 | | | | 18,265 | | | | 30,501 | | | | 31,245 | |
| | Recreation and culture | | | 7,833 | | | | 7,628 | | | | 8,501 | | | | 8,321 | |
| | Fuel and energy | | | 7,937 | | | | 12,069 | | | | 36,917 | | | | 35,907 | |
| | Agriculture, forestry, fishing and hunting | | | 63,720 | | | | 58,264 | | | | 64,278 | | | | 58,982 | |
| | Mining, manufacturing and construction | | | 1,341 | | | | 1,186 | | | | 1,331 | | | | 1,175 | |
| | Transport and communications | | | 79,521 | | | | 62,459 | | | | 88,493 | | | | 71,753 | |
| | Other purposes and economic affairs1 | | | 44,939 | | | | 49,566 | | | | 61,027 | | | | 67,988 | |
| | | | | 267,289 | | | | 252,596 | | | | 334,622 | | | | 316,254 | |
| | 1 | For GGS, includes fixed rate notes and investments in other public sector entities. |
| | | For Total State Sector, includes investments held in trust, securities and bonds. |
| | | | |
| Audited Consolidated Financial Statements 2015–16 – Government of Queensland | | 6-85 |
Notes to the Financial Statements
| | |
53. | | General Government Sector budget to actual comparison |
| |
| | Operating Statement |
| | | | | | | | | | | | | | | | | | | | |
| | | | | | | Published | | | | | | | | | | |
| | | | | | | Budget | | | Actual | | | | | | | |
| | | | | Variance | | 2016 | | | 2016 | | | Change | | | Change | |
| | | | | Notes | | $M | | | $M | | | $M | | | % | |
| | Revenue from Transactions | | | | | | | | | | | | | | | | | | |
| | Taxation revenue | | 1 | | | 12,926 | | | | 12,547 | | | | (378) | | | | -2.9% | |
| | Grants revenue | | 2 | | | 24,555 | | | | 23,740 | | | | (815) | | | | -3.3% | |
| | Sales of goods and services | | 3 | | | 5,430 | | | | 5,926 | | | | 497 | | | | 9.1% | |
| | Interest income | | 4 | | | 2,372 | | | | 2,543 | | | | 171 | | | | 7.2% | |
| | Dividend and income tax equivalents income | | 5 | | | 2,395 | | | | 2,661 | | | | 267 | | | | 11.1% | |
| | Other revenue | | | | | 3,509 | | | | 3,577 | | | | 68 | | | | 1.9% | |
| | Total Revenue from Transactions | | | | | 51,186 | | | | 50,995 | | | | (191) | | | | -0.4% | |
| | | | | | |
Less | | Expenses from Transactions | | | | | | | | | | | | | | | | | | |
| | Employee expenses | | | | | 19,937 | | | | 20,044 | | | | 107 | | | | 0.5% | |
| | Superannuation expenses | | | | | | | | | | | | | | | | | | |
| | Superannuation interest cost | | | | | 803 | | | | 767 | | | | (36) | | | | -4.5% | |
| | Other superannuation expenses | | | | | 2,553 | | | | 2,507 | | | | (46) | | | | -1.8% | |
| | Other operating expenses | | | | | 14,980 | | | | 15,000 | | | | 20 | | | | 0.1% | |
| | Depreciation and amortisation | | 6 | | | 3,264 | | | | 2,927 | | | | (337) | | | | -10.3% | |
| | Other interest expense | | | | | 2,115 | | | | 2,220 | | | | 104 | | | | 4.9% | |
| | Grants expenses | | 7 | | | 6,320 | | | | 6,559 | | | | 239 | | | | 3.8% | |
| | Total Expenses from Transactions | | | | | 49,973 | | | | 50,025 | | | | 52 | | | | 0.1% | |
| | | | | | |
Equals | | Net Operating Balance | | | | | 1,213 | | | | 970 | | | | (243) | | | | | |
| | | | | | |
| | Other Economic Flows - Included in Operating Result | | | | | | | | | | | | | | | | | | |
| | Gain/(loss) on sale of assets and investments/settlement of liabilities | | | | | 18 | | | | 3 | | | | (14) | | | | | |
| | Revaluation increments and impairment loss reversals | | | | | (131) | | | | 16 | | | | 148 | | | | | |
| | Asset write-down, revaluation decrements and impairment loss | | | | | (232) | | | | (257) | | | | (26) | | | | | |
| | Actuarial adjustments to liabilities | | | | | 72 | | | | (49) | | | | (121) | | | | | |
| | Deferred income tax equivalents | | | | | (19) | | | | (187) | | | | (168) | | | | | |
| | Dividends and tax equivalents treated as capital returns | | | | | 156 | | | | 595 | | | | 439 | | | | | |
| | Other | | | | | (2) | | | | (3) | | | | (1) | | | | | |
| | Total Other Economic Flows - Included in Operating Result | | 8 | | | (139) | | | | 119 | | | | 257 | | | | | |
| | | | | | |
| | Operating Result | | | | | 1,074 | | | | 1,088 | | | | 14 | | | | | |
| | | | | | |
| | Other Economic Flows - Other Movements in Equity | | | | | | | | | | | | | | | | | | |
| | Revaluations | | | | | 2,617 | | | | 18,889 | | | | 16,272 | | | | | |
| | Other | | | | | 3 | | | | (1) | | | | (4) | | | | | |
| | Total Other Economic Flows - Other Movements in | | | | | | | | | | | | | | | | | | |
| | Equity | | 9 | | | 2,619 | | | | 18,888 | | | | 16,269 | | | | | |
| | | | | | |
| | Comprehensive Result - Total Changes in Net Worth | | | | | 3,693 | | | | 19,976 | | | | 16,283 | | | | | |
| | | | | | |
| | KEY FISCAL AGGREGATES | | | | | | | | | | | | | | | | | | |
| | | | | | |
| | Net Operating Balance | | | | | 1,213 | | | | 970 | | | | (243) | | | | | |
Less | | Net Acquisition/(Disposal) of Non-Financial Assets | | | | | | | | | | | | | | | | | | |
| | Purchases of non-financial assets | | | | | 5,374 | | | | 4,092 | | | | (1,282) | | | | | |
| | Less Sales of non-financial assets | | | | | 305 | | | | 254 | | | | (51) | | | | | |
| | Less Depreciation | | | | | 3,264 | | | | 2,927 | | | | (337) | | | | | |
| | Plus Change in inventories | | | | | 25 | | | | (37) | | | | (62) | | | | | |
| | Plus Other movement in non-financial assets | | | | | 545 | | | | 556 | | | | 11 | | | | | |
| | Equals Total Net Acquisition/(Disposal) of Non-Financial Assets | | | | | 2,375 | | | | 1,431 | | | | (944) | | | | | |
| | | | | | |
Equals | | Fiscal Balance | | | | | (1,162) | | | | (461) | | | | 701 | | | | | |
| | | | |
| 6-86 | | Audited Consolidated Financial Statements 2015–16 – Government of Queensland |
Notes to the Financial Statements
| | |
| 53. | | General Government Sector budget to actual comparison continued |
| |
| | Balance Sheet |
| | | | | | | | | | | | | | | | | | | | | | |
| | | | | | | | Published | | | | | | | | | | |
| | | | | | | | Budget | | | Actual | | | | | | | |
| | | | | Variance | | | 2016 | | | 2016 | | | Change | | | Change | |
| | | | | Notes | | | $M | | | $M | | | $M | | | % | |
| | Assets | | | | | | | | | | | | | | | | | | | | |
| | Financial Assets | | | | | | | | | | | | | | | | | | | | |
| | Cash and deposits | | | | | | | 875 | | | | 1,104 | | | | 229 | | | | 26.2 | % |
| | Receivables and loans | | | | | | | | | | | | | | | | | | | | |
| | Receivables | | | | | | | 4,177 | | | | 4,282 | | | | 106 | | | | 2.5 | % |
| | Advances paid | | | | | | | 820 | | | | 632 | | | | (188 | ) | | | -22.9 | % |
| | Loans paid | | | | | | | 352 | | | | 90 | | | | (261 | ) | | | -74.3 | % |
| | Securities other than shares | | | | | | | 32,877 | | | | 33,522 | | | | 645 | | | | 2.0 | % |
| | Shares and other equity investment | | | | | | | | | | | | | | | | | | | | |
| | Investments in public sector entities | | | 10 | | | | 22,528 | | | | 20,477 | | | | (2,051 | ) | | | -9.1 | % |
| | Investments in other entities | | | | | | | 18 | | | | 8 | | | | — | | | | 0.0 | % |
| | Investments accounted for using equity method | | | | | | | 152 | | | | 150 | | | | (3 | ) | | | -1.7 | % |
| | Total Financial Assets | | | | | | | 61,798 | | | | 60,265 | | | | (1,523 | ) | | | -2.5 | % |
| | | | | | |
| | Non-Financial Assets | | | | | | | | | | | | | | | | | | | | |
| | Inventories | | | | | | | 584 | | | | 507 | | | | (77 | ) | | | -13.2 | % |
| | Assets held for sale | | | | | | | 156 | | | | 123 | | | | (33 | ) | | | -21.2 | % |
| | Investment properties | | | | | | | 349 | | | | 341 | | | | (8 | ) | | | -2.2 | % |
| | Property, plant and equipment | | | 11 | | | | 178,972 | | | | 198,996 | | | | 20,024 | | | | 11.2 | % |
| | Intangibles | | | | | | | 737 | | | | 714 | | | | (22 | ) | | | -3.0 | % |
| | Deferred tax asset | | | | | | | 5,935 | | | | 5,972 | | | | 37 | | | | 0.6 | % |
| | Other non-financial assets | | | | | | �� | 325 | | | | 370 | | | | 45 | | | | 13.8 | % |
| | Total Non-Financial Assets | | | | | | | 187,058 | | | | 207,024 | | | | 19,966 | | | | 10.7 | % |
| | | | | | |
| | Total Assets | | | | | | | 248,856 | | | | 267,289 | | | | 18,444 | | | | 7.4 | % |
| | | | | | |
| | Liabilities | | | | | | | | | | | | | | | | | | | | |
| | Payables | | | | | | | 3,328 | | | | 3,596 | | | | 268 | | | | 8.1 | % |
| | Employee benefit obligations | | | | | | | | | | | | | | | | | | | | |
| | Superannuation liability | | | 12 | | | | 24,278 | | | | 27,360 | | | | 3,082 | | | | 12.7 | % |
| | Other employee benefits | | | | | | | 5,204 | | | | 5,217 | | | | 12 | | | | 0.2 | % |
| | Deposits held | | | | | | | 1 | | | | 3 | | | | 3 | | | | 574.0 | % |
| | Borrowings and advances | | | | | | | | | | | | | | | | | | | | |
| | Advances received | | | | | | | 682 | | | | 514 | | | | (169 | ) | | | -24.7 | % |
| | Borrowings | | | 13 | | | | 38,160 | | | | 35,486 | | | | (2,674 | ) | | | -7.0 | % |
| | Securities other than shares | | | | | | | (9 | ) | | | — | | | | 9 | | | | -100.0 | % |
| | Deferred tax liability | | | | | | | 860 | | | | 814 | | | | (46 | ) | | | -5.4 | % |
| | Provisions | | | | | | | 1,897 | | | | 1,601 | | | | (296 | ) | | | -15.6 | % |
| | Other liabilities | | | | | | | 756 | | | | 790 | | | | 34 | | | | 4.5 | % |
| | Total Liabilities | | | | | | | 75,155 | | | | 75,380 | | | | 224 | | | | 0.3 | % |
| | | | | | |
| | Net Assets | | | | | | | 173,700 | | | | 191,910 | | | | 18,219 | | | | 10.5 | % |
| | | | | | |
| | Net Worth | | | | | | | | | | | | | | | | | | | | |
| | Accumulated surplus | | | | | | | 88,132 | | | | 83,672 | | | | (4,461 | ) | | | -5.1 | % |
| | Reserves | | | | | | | 85,519 | | | | 108,238 | | | | 22,719 | | | | 26.6 | % |
| | Total Net Worth | | | | | | | 173,652 | | | | 191,910 | | | | 18,258 | | | | 10.5 | % |
| | | | | | | | | | | | | | | | | | | | | | |
| | | | | | |
| | KEY FISCAL AGGREGATES | | | | | | | | | | | | | | | | | | | | |
| | Net Financial Worth | | | | | | | (13,357 | ) | | | (15,114 | ) | | | (1,757 | ) | | | | |
| | Net Financial Liabilities | | | | | | | 35,885 | | | | 35,591 | | | | (294 | ) | | | | |
| | Net Debt | | | | | | | 3,910 | | | | 654 | | | | (3,255 | ) | | | | |
| | | | |
| Audited Consolidated Financial Statements 2015–16 – Government of Queensland | | 6-87 |
Notes to the Financial Statements
| | |
| 53. | | General Government Sector budget to actual comparison continued |
| |
| | Cash flow Statement |
| | | | | | | | | | | | | | | | | | | | | | |
| | | | | | | | Published | | | | | | | | | | |
| | | | | | | | Budget | | | Actual | | | | | | | |
| | | | | Variance | | | 2016 | | | 2016 | | | Change | | | Change | |
| | | | | Notes | | | $M | | | $M | | | $M | | | % | |
| | Cash Flows from Operating Activities | | | | | | | | | | | | | | | | | | | | |
| | Cash received | | | | | | | | | | | | | | | | | | | | |
| | Taxes received | | | 14 | | | | 12,924 | | | | 12,588 | | | | (336 | ) | | | -2.6 | % |
| | Grants and subsidies received | | | 15 | | | | 24,650 | | | | 23,891 | | | | (759 | ) | | | -3.1 | % |
| | Sales of goods and services | | | 16 | | | | 5,565 | | | | 6,083 | | | | 518 | | | | 9.3 | % |
| | Interest receipts | | | 17 | | | | 2,372 | | | | 2,536 | | | | 163 | | | | 6.9 | % |
| | Dividends and income tax equivalents | | | 18 | | | | 2,740 | | | | 3,754 | | | | 1,015 | | | | 37.0 | % |
| | Other receipts | | | 19 | | | | 4,605 | | | | 4,385 | | | | (220 | ) | | | -4.8 | % |
| | | | | | | | | 52,856 | | | | 53,237 | | | | 381 | | | | 0.7 | % |
| | Cash paid | | | | | | | | | | | | | | | | | | | | |
| | Payments for employees | | | 20 | | | | (23,113 | ) | | | (22,830 | ) | | | 284 | | | | -1.2 | % |
| | Payments for goods and services | | | 21 | | | | (16,289 | ) | | | (16,459 | ) | | | (170 | ) | | | 1.0 | % |
| | Grants and subsidies | | | 22 | | | | (6,506 | ) | | | (6,750 | ) | | | (244 | ) | | | 3.8 | % |
| | Interest paid | | | | | | | (2,115 | ) | | | (2,223 | ) | | | (107 | ) | | | 5.1 | % |
| | Other payments | | | | | | | (348 | ) | | | (271 | ) | | | 76 | | | | -21.9 | % |
| | | | | | | | | (48,372 | ) | | | (48,533 | ) | | | (161 | ) | | | 0.3 | % |
| | | | | | |
| | Net Cash Flows from Operating Activities | | | | | | | 4,485 | | | | 4,704 | | | | 220 | | | | 4.9 | % |
| | | | | | |
| | Cash Flows from Investing Activities | | | | | | | | | | | | | | | | | | | | |
| | Non-Financial Assets | | | | | | | | | | | | | | | | | | | | |
| | Purchases of non-financial assets | | | 23 | | | | (5,374 | ) | | | (4,092 | ) | | | 1,282 | | | | -23.9 | % |
| | Sales of non-financial assets | | | | | | | 305 | | | | 254 | | | | (51 | ) | | | -16.8 | % |
| | | | | | | | | (5,069 | ) | | | (3,838 | ) | | | 1,231 | | | | -24.3 | % |
| | Financial Assets (Policy Purposes) | | | | | | | | | | | | | | | | | | | | |
| | Equity disposals | | | | | | | 3,159 | | | | 3,348 | | | | 190 | | | | 6.0 | % |
| | | | | 24 | | | | 3,100 | | | | 3,348 | | | | 248 | | | | 8.0 | % |
| | Financial Assets (Liquidity Purposes) | | | | | | | | | | | | | | | | | | | | |
| | Sales of investments | | | | | | | 5,655 | | | | 5,547 | | | | (108 | ) | | | -1.9 | % |
| | Purchases of investments | | | | | | | (2,595 | ) | | | (3,008 | ) | | | (413 | ) | | | 15.9 | % |
| | | | | 25 | | | | 3,061 | | | | 2,540 | | | | (521 | ) | | | -17.0 | % |
| | | | | | |
| | Net Cash Flows from Investing Activities | | | | | | | 1,092 | | | | 2,050 | | | | 958 | | | | 87.7 | % |
| | | | | | |
| | Cash Flows from Financing Activities | | | | | | | | | | | | | | | | | | | | |
| | Cash received | | | | | | | | | | | | | | | | | | | | |
| | Advances received | | | | | | | 116 | | | | 117 | | | | 1 | | | | 0.9 | % |
| | Proceeds of borrowing | | | 26 | | | | 1,764 | | | | 667 | | | | (1,097 | ) | | | -62 | % |
| | Deposits received | | | | | | | — | | | | 5 | | | | 5 | | | | 100 | % |
| | | | | | | | | 1,880 | | | | 789 | | | | (1,091 | ) | | | -58.0 | % |
| | Cash paid | | | | | | | | | | | | | | | | | | | | |
| | Advances paid | | | | | | | (157 | ) | | | (229 | ) | | | (72 | ) | | | 45.6 | % |
| | Borrowing repaid | | | | | | | (7,278 | ) | | | (7,404 | ) | | | (126 | ) | | | 1.7 | % |
| | Deposits withdrawn | | | | | | | — | | | | (5 | ) | | | (5 | ) | | | 100 | % |
| | | | | | | | | (7,435 | ) | | | (7,638 | ) | | | (202 | ) | | | 2.7 | % |
| | | | | | |
| | Net Cash Flows from Financing Activities | | | | | | | (5,555 | ) | | | (6,848 | ) | | | (1,293 | ) | | | 23.3 | % |
| | | | | | |
| | Net increase/(decreased) in Cash and Deposits Held | | | | | | | 22 | | | | (94 | ) | | | (116 | ) | | | -529.8 | % |
| | Cash and deposits at the beginning of the financial year | | | | | | | 853 | | | | 1,198 | | | | 345 | | | | 40.5 | % |
| | Cash and Deposits Held at the End of the Financial Year | | | | | | | 875 | | | | 1,104 | | | | 229 | | | | 26.2 | % |
| | | | | | | | | | | | | | | | | | | | | | |
| | | | | | |
| | KEY FISCAL AGGREGATES | | | | | | | | | | | | | | | | | | | | |
| | Net Cash from Operating Activities | | | | | | | 4,485 | | | | 4,704 | | | | 220 | | | | | |
| | Net Cash Flow from Investments in Non-Financial Assets | | | | | | | (5,069 | ) | | | (3,838 | ) | | | 1,231 | | | | | |
| | CASH SURPLUS/(DEFICIT) | | | | | | | (584 | ) | | | 866 | | | | 1,450 | | | | | |
| | | | |
| 6-88 | | Audited Consolidated Financial Statements 2015–16 – Government of Queensland |
Notes to the Financial Statements
| | | | | | |
53. | | General Government Sector budget to actual comparison continued |
| | | | | | |
| | Explanations of major variances between AASB 1049 actual amounts and corresponding original budget amounts for GGS |
| | | | | | |
| | Operating Statement |
| | | | | | |
| | 1 | | Taxation revenue has decreased $378 million since the 2015-16 Budget reflecting lower payroll tax revenue ($242 million) as a result of restrained employment and wages growth and lower insurance duty ($63 million) with insurers operating in a highly competitive environment. |
| | | | | | |
| | 2 | | The Australian Government revised its timing of reimbursements to Queensland under the Natural Disaster Relief and Recovery Arrangements (NDRRA) from 2015-16 to subsequent years reducing grant revenue by $1.1 billion. Partially offsetting lower NDRRA revenue were increases in health activity based funding from the Commonwealth ($364 million) and higher than estimated GST revenue ($132 million). |
| | | | | | |
| | 3. | | Sales of goods and services were $497 million higher than the 2015-16 Budget and mainly relate to higher recoveries of the cost of certain drugs and patient recoveries for Queensland Health and HHSs which to a large extent were matched by higher than estimated operating expenses. In addition, casino licence revenue of $78 million received in prior years and previously treated as unearned, has now been recognised. |
| | | | | | |
| | 4 | | Interest income was $171 million higher than that forecast in the 2015-16 Budget due to the revised timing of the withdrawal of all investments held in relation to long service leave liabilities as part of the Government’s Debt Action Plan (DAP) and higher interest earnings on working capital facilities and monies held in relation to DAP, offset in part by lower returns on Nominal Defendant investments held with Queensland Investment Corporation. |
| | | | | | |
| | 5 | | Since the 2015-16 Budget, dividend and income tax equivalents income increased $267 million reflecting the Government’s decision to increase all Government owned corporations (excluding CS Energy) dividend payout ratios from 80% to 100% of profit after tax, Queensland Rail’s improved operating position as a result of lower operating costs and dividends declared by Queensland Treasury Corporation and Queensland Treasury Holdings that were not budgeted. |
| | | | | | |
| | 6 | | Depreciation and amortisation expenses decreased $337 million over the 2015-16 Budget following changes to useful lives for road infrastructure assets which were not budgeted ($228 million) and lower depreciation and amortisation expenses by the Department of Health ($62 million) resulting from a lower asset base. |
| | | | | | |
| | 7 | | Grant expenses increased $239 million from the 2015-16 Budget estimate of $6.320 billion. This variance is due mainly to the Department of Education and Training reclassifying $335 million in training subsidies from other operating expenses to grant expenses and higher electricity community service obligation payments under the uniform tariff policy ($112 million), offset by deferrals in various grant programs. |
| | | | | | |
| | 8 | | Total other economic flows - included in operating result were $257 million higher than budget as a result of : |
| | | | | | |
| | | | - | | $439 million additional return of capital from regearing Government owned corporations as part of the Government’s enhanced Debt Action Plan (DAP) and lower than anticipated impairment losses ($148 million); partially offset by: |
| | | | | | |
| | | | - | | upward actuarial adjustments associated with the long service leave liabilities resulting from lower than expected discount rates and downward actuarial adjustments to the Queensland Government Insurance Fund. |
| | | | | | |
| | | | - | | lower deferred income tax equivalents mainly due to tax losses by Queensland Bulk Water Supply Authority and WorkCover Queensland. |
| | | | | | |
| | 9 | | Other movements in equity mainly relate to upwards valuations of road infrastructure assets and land ($15.615 billion) following the completion of a specific valuation undertaken by the Department of Transport and Main Roads in 2015-16 and revaluation of land under roads by the Department of Natural Resources and Mines ($5.1 billion), neither of which were available at the time of the 2015-16 Budget. These increases were partially offset by actuarial losses on the valuation of defined benefit superannuation liabilities ($2.647 billion) due to lower than expected discount rates and revaluation in value of the GGS investment in public sector entities ($2.491 billion). |
| | | | | | |
| | Balance Sheet |
| | | | | | |
| | 10 | | Investments in public sector entities decreased $2.051 billion from the 2015-16 Budget. This reflects the decline in net worth of the PFC sector of $1.193 billion, mainly due to lower than expected return on Queensland Treasury Corporation’s long term assets portfolio, and the PNFC sector of $858 million, partly due to further enhancements to the Government’s Debt Action Plan since the 2015-16 Budget, including regearing other non-electricity network government owned corporations. |
| | | | | | |
| | 11 | | The increase in property, plant and equipment of $20.024 billion over the 2015-16 Budget is largely due to upwards revaluation of road infrastructure assets and land under roads and to some extent offset by lower capital purchases (refer to variance explanation 23). |
| | | | | | |
| | 12 | | Superannuation liabilities were $3.082 billion higher than Budget due to actuarial losses resulting from lower Commonwealth bond yields at 30 June 2016 compared to those used to discount the defined benefit obligations at the time of the 2015-16 Budget. |
| | | | |
| Audited Consolidated Financial Statements 2015–16 – Government of Queensland | | 6-89 |
Notes to the Financial Statements
| | | | |
53. | | General Government Sector budget to actual comparison continued |
| | | | |
| | Variance notes continued |
| | | | |
| | Balance Sheet continued |
| | | | |
| | 13 | | Borrowings declined $2.674 billion from the 2015-16 Budget forecast reflecting lower financing requirements due to lower than anticipated purchases of non-financial assets (Variance note 27), reclassification by the Public Trust Office of monies held in trust from borrowings to payables and regearing Energy Queensland through the transfer of General Government sector borrowings. |
| | | | |
| | Cash Flow Statement |
| | | | |
| | 14 | | The variance in taxes received is consistent with the Operating Statement. |
| | | | |
| | 15 | | The variance in grants and subsidies received is consistent with the Operating Statement but is also impacted by settlement of receivables for Commonwealth funding in relation to aged care and disability services transition. |
| | | | |
| | 16 | | The variance in receipts from sales of goods and services is consistent with the Operating Statement. |
| | | | |
| | 17 | | The variance in interest receipts is consistent with the Operating Statement. |
| | | | |
| | 18 | | Higher dividend receipts are mainly from the electricity distributors following the early payment of 2015-16 dividends prior to the merger of these entities into Energy Queensland Limited. |
| | | | |
| | 19 | | Other receipts are $220 million lower than budget. This is mainly as a result of lower than expected royalty receipts, coupled with higher than budgeted royalties receivable. |
| | | | |
| | 20 | | Payments for employee expenses are $284 million lower than budget. This was mainly due to lower than expected superannuation beneficiary payments as the number of retirements was less than budgeted. |
| | | | |
| | 21 | | The variance in payments for goods and services is mainly due to lower than budgeted operating payables across the sector. |
| | | | |
| | 22 | | The variance in grants and subsidies is consistent with the Operating Statement. |
| | | | |
| | 23 | | The lower payments for property, plant and equipment of $1.282 billion compared to the 2015-16 original budget largely reflect revised timing of capital spending for a number of projects (including NDRRA) in the Department of Transport and Main Roads and Queensland Health. |
| | | | |
| | 24 | | Net cash inflows from policy purposes are $248 million higher than the 2015-16 Budget, mainly due to higher net equity withdrawals from Government owned Corporations. |
| | | | |
| | 25 | | Net cash inflows from liquidity purposes are $521 million lower than the 2015-16 Budget. This was mainly due to lower than expected sale of investments to meet superannuation beneficiary payments (see explanation 20 above). |
| | | | |
| | 26 | | Proceeds of borrowing were $1.097 billion lower than the 2015-16 Budget mainly due to lower purchases of non-financial assets. |
| | | | |
| 6-90 | | Audited Consolidated Financial Statements 2015–16 – Government of Queensland |
Certificate of Queensland State Government Financial Statements
General Government Sector and Total State Sector Consolidated Financial Statements
2015-16
Management Certificate
The foregoing GGS and Total State Sector consolidated financial statements have been prepared pursuant to section 25(1)(a) and (b) of the Financial Accountability Act 2009 and other prescribed requirements.
In our opinion and in terms of section 25(3) of the Financial Accountability Act 2009, we certify that the GGS and Total State Sector consolidated financial statements have been properly drawn up, under the prescribed requirements, to present a true and fair view of:
| | (i) | the financial operations and cash flows of the Government of Queensland for the financial year; and |
| | (ii) | the financial position of the Government of Queensland at 30 June 2016. |
At date of certification of the statements, we are not aware of any material circumstances that would render any particulars included in the GGS and Total State Sector consolidated financial statements misleading or inaccurate.
| | | | |
| David Newby, CA | | Jim Murphy | | HON CURTIS PITT MP |
| Director, Whole of Government Reporting | | Under Treasurer | | Treasurer, |
| Queensland Treasury | | Queensland Treasury | | Minister for Aboriginal and Torres Strait Islander Partnerships and Minister for Sport |
23 November 2016
| | | | |
| Audited Consolidated Financial Statements 2015–16 – Government of Queensland | | 6-91 |
INDEPENDENT AUDITOR’S REPORT
To the Treasurer of Queensland
Report on the Financial Report
I have audited the accompanying financial report of the Government of Queensland including General Government Sector and Total State Sector, which comprises the balance sheet as at 30 June 2016, and the operating statement, statement of changes in net assets (equity), and cash flow statement for the year ended on that date, notes to the financial statements including, significant accounting policies and other explanatory financial statement information and the certificates given by the Treasurer, Under Treasurer and Director, Whole of Government Reporting. The financial report includes the consolidated financial statements of the Government of Queensland and the entities it controlled at the year’s end or from time to time during the financial year.
Responsibility for the Financial Report
The Treasurer, through Queensland Treasury, is responsible for the preparation and fair presentation of the financial report in accordance with prescribed accounting requirements identified in the Financial Accountability Act 2009 and with Accounting Standard AASB 1049 Whole of Government and General Government Sector Financial Reporting. AASB 1049 requires compliance with other applicable Australian Accounting Standards. This responsibility includes such internal control as the Treasurer determines is necessary to enable the preparation of the financial report that is free from material misstatement, whether due to fraud or error.
Auditor’s Responsibility
My responsibility is to express an opinion on the financial report based on the audit. The audit was conducted in accordance with the Auditor-General of Queensland Auditing Standards, which incorporate the Australian Auditing Standards. Those auditing standards require compliance with relevant ethical requirements relating to audit engagements and that the audit is planned and performed to obtain reasonable assurance about whether the financial report is free of material misstatement.
An audit involves performing procedures to obtain audit evidence about the amounts and disclosures in the financial report. The procedures selected depend on the auditor’s judgement, including the assessment of the risks of material misstatement of the financial report, whether due to fraud or error. In making those risk assessments, the auditor considers the entity’s internal control relevant to the entity’s preparation of the financial report in order to design audit procedures that are appropriate in the circumstances, but not for the purpose of expressing an opinion on the effectiveness of the entity’s internal control, other than in expressing an opinion on compliance with prescribed requirements. An audit also includes evaluating the appropriateness of accounting policies used and the reasonableness of accounting estimates made by the Treasurer, as well as evaluating the overall presentation of the financial report and any mandatory financial reporting requirements as approved by the Treasurer for application in Queensland.
I believe that the audit evidence obtained is sufficient and appropriate to provide a basis for my audit opinion.
My opinion does not provide assurance on the underlying assumptions used in formulating the Budget figures disclosed in the financial statements.
Independence
The Auditor-General Act 2009 promotes the independence of the Auditor-General and all authorised auditors. The Auditor-General is the auditor of all Queensland public sector entities and can be removed only by Parliament.
The Auditor-General may conduct an audit in any way considered appropriate and is not subject to direction by any person about the way in which audit powers are to be exercised. The Auditor-General has for the purposes of conducting an audit, access to all documents and property and can report to Parliament matters which in the Auditor-General’s opinion are significant.
Opinion
In accordance with s.42 of the Auditor-General Act 2009 -
| | (a) | I have received all the information and explanations which I have required; and |
| | (i) | the prescribed requirements in respect of the establishment and keeping of accounts have been complied with in all material respects; and |
| | (ii) | the financial report has been drawn up under prescribed requirements so as to present a true and fair view of the financial operations and cash flows of the Government of Queensland for the financial year 1 July 2015 to 30 June 2016 and of the financial position as at the end of that year. |
| | | | |
| 6-92 | | Audited Consolidated Financial Statements 2015–16 – Government of Queensland |
INDEPENDENT AUDITOR’S REPORT continued
Electronic Presentation of the Audited Financial Report
Those viewing an electronic presentation of these financial statements should note that audit does not provide assurance on the integrity of the information presented electronically and does not provide an opinion on any information which may be hyperlinked to or from the financial statements. If users of the financial statements are concerned with the inherent risks arising from electronic presentation of information, they are advised to refer to the printed copy of the audited financial statements to confirm the accuracy of this electronically presented information.
| | |
A D CLOSE FCPA Auditor-General of Queensland (acting) | |  |
| | | | |
| Audited Consolidated Financial Statements 2015–16 – Government of Queensland | | 6-93 |