EXHIBIT (c)(vii)
Queensland’s Budget Papers for 2017-18.
FORWARD-LOOKING STATEMENTS
This exhibit contains forward-looking statements. Statements that are not historical facts, including statements about the State of Queensland’s (the “State” or “Queensland”) beliefs and expectations, are forward-looking statements. These statements are based on current plans, budgets, estimates and projections and therefore you should not place undue reliance on them. The words “believe”, “may”, “will”, “should”, “estimate”, “continue”, “anticipate”, “intend”, “expect”, “forecast” and similar words are intended to identify forward-looking statements. Forward-looking statements speak only as of the date they are made, and neither the Queensland Treasury Corporation nor the State undertake any obligation to update publicly any of them in light of new information or future events.
Forward-looking statements are based on current plans, estimates and projections and, therefore, undue reliance should not be placed on them. Although the Queensland Treasury Corporation and the State believe that the beliefs and expectations reflected in such forward-looking statements are reasonable, no assurance can be given that such beliefs and expectations will prove to have been correct. Forward-looking statements involve inherent risks and uncertainties. We caution you that actual results may differ materially from those contained in any forward-looking statements.
A number of important factors could cause actual results to differ materially from those expressed in any forward-looking statement. Factors that could cause the actual outcomes to differ materially from those expressed or implied in forward-looking statements include:
| | • | | the international and Australian economies, and in particular the rates of growth (or contraction) of the State’s major trading partners; |
| | • | | the effects, both internationally and in Australia, of any subsequent economic downturn, ongoing economic, banking and sovereign debt crisis in Europe and any stalling of the protracted United States recovery; |
| | • | | increases or decreases in international and Australian domestic interest rates; |
| | • | | changes in the State’s domestic consumption; |
| | • | | changes in the State’s labor force participation and productivity; |
| | • | | downgrades in the credit ratings of the State and Australia; |
| | • | | changes in the rate of inflation in the State; |
| | • | | changes in environmental and other regulation; and |
| | • | | changes in the distribution of revenue from the Commonwealth of Australia Government to the State. |
Queensland Budget | 2017-18
BUDGET SPEECH
Budget Paper No.1

Queensland Budget Papers 2017-18
1. Budget Speech
2. Budget Strategy and Outlook
3. Capital Statement
4. Budget Measures
5. Service Delivery Statements
Appropriation Bills
Budget Highlights
© Crown copyright
All rights reserved
Queensland Government 2017
Excerpts from this publication may be reproduced, with appropriate
acknowledgement, as permitted under the Copyright Act.
Budget Speech
Budget Paper No.1
ISSN 1445-4890 (Print)
ISSN 1445-4904 (Online)
Appropriation Bill 2017
(First reading speech, 13 June 2017)
Treasurer
The Honourable Curtis Pitt MP
Treasurer
Minister for Trade and Investment
Appropriation Bill 2017
(First reading speech, 13 June 2017)
Treasurer
The Honourable Curtis Pitt MP
Treasurer
Minister for Trade and Investment
Mr Speaker
I move that the Bill be now read for a first time.
Mr Speaker,
Around two-and-a-half years ago, Queensland Labor told Queenslanders that there was a better way.
A better way that included consulting and engaging with stakeholders, industry groups, business and everyday Queenslanders.
A better way that included restoring frontline services.
We’ve put Queenslanders first – with more doctors, nurses and health professionals.
More teachers and teacher aides.
More police, paramedics and fire fighters.
We’ve delivered surpluses in my first two Budgets – even before a spike in world coal prices saw forecast surpluses revised upwards.
Confidence is up.
We’ve implemented a clear economic plan to strengthen and grow our regional and state economies, and deliver jobs.
As a result, our $300 plus billion Queensland economy is growing.
Our unemployment rate is lower.
We’ve created nearly 60,000 net new jobs since the 2015 election.
Mr Speaker, this, the third Budget of the Palaszczuk Government is a Budget that delivers more Jobs for Queensland.
1
Economic outlook
Mr Speaker, it has been necessary to frame this Budget in the wake of a natural disaster.
But the cyclone and floods have not dampened our resolve to rebuild and drive economic growth across all parts of Queensland.
Our diverse and resilient economy continues to head in the right direction.
Overall growth in the Queensland economy is forecast to strengthen, from the 2.4 per cent recorded in 2015-16 to 2 3⁄4 per cent in both 2016-17 and 2017-18, before improving to 3 per cent in 2018-19.
Forecasts would have been higher but for the impact of Cyclone Debbie which is expected to shave around $2 billion or 3⁄4 of a percentage point from economic growth across this financial year and next.
Severe Tropical Cyclone Debbie has hit our economy hard slowing growth to now be in line with the rest of the nation.
Coal, sugar, cattle and other exports have been impacted as well as our localised tourism.
However other economic indicators are encouraging.
Queensland businesses are setting export records and our ports are a key part of the logistics chain that sees valuable export income generated for our state.
Overseas exports are expected to grow between 3 per cent and 4 per cent a year over the forecast period.
In the 12 months to April 2017 our exports were worth $61.1 billion, well over $1 billion a week.
This is a strong result when you consider the impacts of Cyclone Debbie and drought.
It shows just how strong and resilient our economy really is.
Growth in services exports such as tourism and education will continue to be supported by a sustained lower Australian dollar and growing demand from Asian markets.
While exports currently underpin a lot of our growth, our domestic economy is seeing an upturn.
We’ve recorded five consecutive quarters of growth in State Final Demand, after eight consecutive quarters of contraction.
We are recording positive growth in business investment, after a sustained period of contraction – 11 consecutive quarters – following the unprecedented $60 billion investment in LNG.
2
Confidence
Over the past two and a half years we’ve seen the rise and rise in business confidence and conditions.
Without confidence, we don’t see new investment, increased profitability and the jobs that go with it.
Nearly every credible survey is saying the same thing.
The NAB Monthly Business Survey has ranked us highest or second-highest on business confidence for 26 of the past 28 months.
Sensis Business Confidence Index for SMEs puts us at the highest level in seven years.
The Suncorp-CCIQ Pulse Survey for March quarter underlined the upturn in the State’s economy with business confidence at its highest since 2014.
In the same survey, business conditions were perceived to be the best since 2009.
We’ve also seen the Westpac-Melbourne Institute Consumer Sentiment Index up 6.2 per cent since January 2015.
In short, confidence has made a comeback.
Economic plan
Queenslanders have every reason to be confident and to remain optimistic about our future and the opportunities ahead of us.
Both in our state, our nation, and in the global economy.
Mr Speaker, today our Government recommits to deliver and implement the next phase of our economic plan.
Our approach to economic and fiscal management has been disciplined.
Today I can report that the Queensland Government is expected to record a net operating surplus of $2.8 billion in 2016-17.
This is the biggest surplus in a decade.
The boost to our revenue from coal royalties has improved the Budget position in 2016-17.
We have acted to allocate it to job generating projects, further retirement of debt and to support downward pressure on electricity prices for Queensland businesses and households.
I can confirm that for the 2017-18 year, the Budget will remain in surplus, albeit dramatically reduced due to the impact of natural disasters.
This $146 million surplus and forecast surpluses across the forward estimates have been achieved through a measured, responsible approach to the State’s finances.
3
The 2017-18 Budget is a measured and responsible Budget with expenses growth averaging 3.2 per cent a year in line with revenue growth in last years’ Budget prior to Tropical Cyclone Debbie.
It would be irresponsible – not just socially but economically – to slash funding for reconstruction and frontline services every time a natural disaster impacts on revenue.
Last year, we introduced a new fiscal principle related to growing the government workforce in line with population growth, on average, over the forward estimates.
It’s a self-imposed measure as part of the toughest suite of fiscal principles in the nation.
Population growth will track at 1.5 per cent and growth in FTEs will be at 1.7 per cent on average over the forward estimates.
To put this into perspective, in the previous government’s last Budget in 2014-15, growth in the public service was 3.7 per cent.
In 2016-17, growth in the public service is expected to be 3 per cent.
Since March 2015, almost 90 per cent of the growth in government workers has been in the key frontline service delivery areas of health, education and police.
Following the completion of our commitment to restore frontline services in 2017-18, growth in the public service will move back in alignment with population growth.
The 2017 Budget maintains a surplus in each and every year of the forward estimates while delivering funding to support jobs, build infrastructure and deliver essential health and education services.
Our surpluses have been achieved while allocating significant expenditure to the essential services that Queenslanders need and deserve.
It’s about delivering more equity, fairness and a better quality of life for Queenslanders no matter where they live.
This Budget allocates substantial additional resources for our schools, hospitals and other community services.
It eases cost of living pressures for households and small businesses.
It strengthens our social fabric.
All of this is occurring in the face of a challenging domestic and global outlook.
Weakening taxation revenue and GST is a challenge beyond 2016-17.
At the same time we must absorb the initial costs of Cyclone Debbie.
Government-owned businesses
Mr Speaker, we promised there was a better way to drive down debt – one that did not involve selling off our income-generating assets.
4
They remain in safe hands, contributing to our economic growth, delivering jobs and services for Queenslanders – keeping the state moving.
Queenslanders can see the returns once again in this Budget in the form of better frontline services and job-creating capital works.
Because we kept them in public ownership, we can use our GOCs to build infrastructure when and where we need it most – especially in regional Queensland.
All of our government-owned businesses are generating revenue for Queenslanders – not sending it beyond our borders or overseas into the pockets of private shareholders.
Driving down debt
Our Debt Action Plan was established to refocus the State’s balance sheet.
A Review of State Finances made recommendations for a revised set of fiscal principles that saw us direct focus towards targeting an improvement to the General Government debt-to-revenue ratio.
Right from the start we rolled up our sleeves.
Our balance sheet reforms are bringing positive results.
Mr Speaker, in 2012-13, Queensland’s debt-to-revenue ratio was 91 per cent.
As a direct result of measures introduced through the Debt Action Plan, we have seen a substantial fall in the ratio to 60 per cent for both 2016-17 and 2017-18.
In 2017-18, General Government debt is expected to be more than $14 billion lower than forecast in the 2014-15 Budget.
And Non-Financial Public Sector debt – which includes government-owned businesses – is expected to be $10 billion lower.
And for those naysayers opposite, the NFPS debt to revenue ratio is also down, from a peak of 141 per cent to 114 per cent.
Both debt measures are down and all this has been achieved without the need to introduce new taxes, fees and charges on Queenslanders.
And it has been achieved without selling our income-generating assets.
Ratings agencies
Mr Speaker, the results of our Debt Action Plan are examined closely by ratings agencies.
Our AA+ credit rating by S&P Global has been affirmed.
5
Our Aa1 credit rating by Moody’s Investor Services has been affirmed and we have moved from a negative outlook to a stable outlook.
These significant decisions – by those who scrutinise every element of our economic plan – confirm it is working.
We rejected the short-sighted option of cutting, sacking, and selling our way back.
In all of our Budgets we choose to put in the hard work.
To make our whole-of-State balance sheet work harder for the benefit of Queenslanders.
We said there was a better way.
And we have seen the positive results – and we will see more.
Jobs for Queensland
Mr Speaker, this is a jobs-focused Government.
We have worked every day to get Queenslanders Back to Work.
I am pleased to advise the House that the Queensland labour market is showing positive signs.
An average of 2,190 jobs have been created each month under this Labor Government.
Both the aggregate and youth unemployment rates have fallen.
Additionally, positive signs are emerging in several areas in regional Queensland.
But there is no question that more needs to be done to lift employment opportunities in some areas of Queensland.
That’s why at the heart of this Budget is a $42.75 billion capital works program over four years.
That’s an increase of over $2 billion from the last Budget and a reflection of our commitment to jobs for Queensland and its future.
In 2017-18 the program will be over $10 billion.
This Budget will support around 40,000 jobs in 2017-18.
Jobs via the infrastructure program.
Jobs from Works for Queensland.
Jobs from our Back to Work program and Skilling Queenslanders for Work.
Many jobs in rural and regional Queensland and most of the jobs in the private sector.
6
Cross River Rail
The Federal Budget ignored Queenslanders and ignored funding requirements for Cross River Rail.
To date the Turnbull Government has committed only to provide $10 million to help fund some pre-construction planning costs.
While the Federal Government dithers and delays its decisions, we cannot wait any longer.
Mr Speaker, I can confirm today that the Palaszczuk Government will fully fund the delivery of the state’s highest priority infrastructure project – Cross River Rail.
This Budget makes the long-term financial commitment to ensure this project, so long promised for Brisbane and the broader South East, can now be delivered with certainty.
Cross River Rail is fundamental to ensuring that the transport system in South East Queensland can continue to grow and accommodate projected increases in population.
This is a traffic congestion-busting project that will support 1,500 construction jobs each year during construction.
But it’s more than just a city-shaping project, Mr Speaker.
It’s an economy-shaping project.
Our decision today will bring on new investment which will in turn create even more jobs and stimulate economic activity.
The project’s total capital cost is forecast to be $5.409 billion.
This Budget commits $1.95 billion over the forward estimates, in addition to the $850 million already funded in previous Budgets, so that early works can start as early as the end of this year.
Queensland deserves to get its fair share of infrastructure funding from the Federal Government – especially for Cross River Rail.
It’s not too late for the Federal Treasurer to make a contribution that properly reflects the strategic importance of this project and its contribution to the nation.
Queenslanders will not forget.
Infrastructure across Queensland
Mr Speaker, while the capital program includes $2.8 billion towards Cross River Rail, this Budget delivers vital infrastructure for communities right across Queensland.
$4.8 billion will be invested in infrastructure this year across regional Queensland including Mackay, Outback, Far North Queensland, Central Queensland, Wide Bay, Darling Downs and Townsville that will directly support 14,500 jobs.
7
For transport and roads, the capital program includes over $3.8 billion, including for construction of the Toowoomba Second Range Crossing and widening the Gateway Motorway North to six lanes.
These road projects are examples of where the Queensland and Federal Governments can work together to fund projects.
There is also $604 million for schools facilities and $916 million for health capital works.
For Townsville, we are setting aside $225 million over four years to address long-term water security.
The State’s contribution of $140 million to the $250 million North Queensland Stadium will support around 750 jobs in design and construction, with many of those positions being filled by people from the Townsville region.
We’ve made a down payment of up to $75 million for channel widening at the Port of Townsville to facilitate more trade and investment, and to ensure Townsville is well positioned for future growth and jobs.
We’ve committed to the $120 million Cairns Shipping Development Project, a much needed project to deliver growth in cruise shipping and jobs in the tourism sector and associated suppliers of goods and services.
Both these projects are subject to finalisation of an environmental impact statement and business case assessment.
The Cairns Convention Centre will receive $176 million to expand into a state-of-the-art international venue.
This catalytic investment will enhance Cairns’ reputation as the gateway to the Great Barrier Reef and underpin the future economy in the Far North.
We are allocating $70 million in 2017-18 for the construction of the Mackay Ring Road – this is a $498 million project in partnership with the Australian Government.
Due for completion in July 2020, the project will improve connectivity between Mackay and the Bowen Basin, and ensure the region is prepared for future growth.
The $200 million expansion of the Capricornia Correctional Centre near Rockhampton will ease overcrowding in the prison system, and will support 100 construction and 70 ongoing jobs.
There’s an allocation of $2 million to support the planned relocation of the Rockhampton Regional Council’s city art gallery.
While the Turnbull Government has not yet agreed to the proposal to fund a Rockhampton flood levee under Category D of the Natural Disaster Relief and Recovery Arrangements, our Government has set aside the necessary funds for our share of this important project.
And this Budget recognises the untapped potential of the North West Minerals Province with $39 million for a Strategic Blueprint to facilitate continued resources sector development, while diversifying the regional economy.
8
Employment programs
Mr Speaker, in addition to our infrastructure program, we need to work even harder to drive better employment outcomes in the South East and across regional Queensland.
That is why this Budget builds on the initiatives of the last two years and commits a further $50 million to continue the highly successful Back to Work program.
As at 31 May 2017, almost $21 million has been paid to employers to directly employ 4,334 regional jobseekers.
This includes 2,200 young jobseekers employed under the $20,000 Back to Work Youth Boost.
Back to Work is now a $150 million program for regional Queensland.
And today I can announce that we are investing $27.5 million to expand Back to Work into South East Queensland for employers who take on long-term unemployed or young unemployed jobseekers.
Since we brought back our $240 million Skilling Queenslanders for Work initiative, more than 18,000 Queenslanders have been assisted.
And more than 9,500 participants who have exited the program have gone on to secure jobs, undertake further training, study, or both.
Mr Speaker, Works for Queensland equals Jobs for Queensland.
This $200 million program delivered in partnership with local governments outside of the south-east corner.
This Budget commits a further $200 million over two years, bringing the total commitment to the Works for Queensland program to $400 million.
Industry and investment
Innovation isn’t just about new industries of the future.
It’s also about transforming our existing industries – building on our traditional strengths – so they can reach their potential and capitalise on changing world markets.
Increased investment in our Advance Queensland initiative takes the Palaszczuk Government’s total commitment to $420 million.
This positions Queensland as the best place in the nation to turn great ideas into reality.
This Budget allocates additional funding of $15 million to develop 10-year Priority Industry Roadmaps and action plans that support emerging and priority sectors to maximise their potential.
Over $10.9 million is being invested from the Business Development Fund, which is encouraging venture capital investment in Queensland.
9
A further $10 million is being redirected into the successful Ignite Ideas Fund, with almost $16.5 million invested to date in 118 innovative small firms with a product prototype ready for market.
At the 2016 Mid Year Review, I announced the $130 million Jobs and Regional Growth Fund and it is delivering for regional Queensland.
Just last week our Government announced $8.64 million in assistance for Bio Processing Australia’s proposed $50 million biorefinery in Mackay, expected to create around 115 jobs.
We were not prepared to stand by and see this invaluable project go offshore to somewhere like Singapore or Malaysia, which was all but certain if it hadn’t been for the fund.
The Industry Attraction Fund is encouraging businesses to relocate or establish new projects in Queensland and has attracted businesses involved in industries from biofuels, to advanced manufacturing and robotics.
And we’re not only focusing on businesses.
We’re also asking people to make the move to Queensland, with a campaign to be launched to attract individuals and businesses to Queensland from interstate, especially NSW and Victoria.
Queensland maintains its competitive tax status against other states and territories.
Per capita state tax is estimated at $2,691 in 2017-18, compared to an average of $3,534 for the other states and territories.
People will continue to benefit from the Government maintaining its commitment to not introduce new taxes, fees or charges on Queenslanders.
They’ll also benefit from greater housing affordability.
First home owners’ grant
The Government recognises how difficult it is for first home buyers to get into the housing market.
The First Home Owners’ Grant was temporarily increased from $15,000 to $20,000 on 1 July last year until the end of this month.
I can announce today that additional funding of $30 million from this year’s Budget will extend the increased grant for a further six months until 31 December 2017.
It is specifically for transactions for buying or building new houses, units or townhouses valued at less than $750,000.
The popularity of the First Home Owners’ Grant is clear.
As at 31 May, 6,353 applications, worth $127 million, had been received.
Of those, 4,900 worth $98 million have been approved so far, with more to be approved as house purchases by applicants proceed.
10
If all the approved grants leverage new dwellings of $750,000 they would represent almost $3.7 billion worth of activity.
And that means Queenslanders in their own homes and jobs for our building industry and related industries.
Foreign landowners
Mr Speaker, following moves in the Federal Budget and also in Victoria, I can inform the House that this year’s Budget introduces a 1.5 per cent land tax surcharge on absentee land tax payers if the value of their taxable land is $350,000 or higher.
The surcharge ensures that absentee owners of land are making a fair contribution and it has no direct impact on Queensland residents.
It is a measure that is expected to increase government revenue by $20 million a year from 2017-18.
However unlike Victoria and New South Wales, we will not be making any further changes to our Foreign Acquirers Transfer Duty Surcharge.
This will see Queensland remain competitive at 3 per cent when compared to our interstate peers at 7 per cent and 8 per cent in Victoria and New South Wales respectively.
World-class health system
Mr Speaker, the Palaszczuk Government is continuing to invest in a world-class health system that provides first-rate services by a highly skilled workforce.
Since March 2015, we have employed an additional 1,191 doctors, 3,172 nurses, 882 allied health professionals and 250 ambulance operatives.
Queensland’s health Budget will grow to a record $16.6 billion in this Budget.
Under our first three Budgets we have increased funding for Health by more than $3 billion.
In this Budget, we have committed $916.1 million including investments in health facilities and supporting infrastructure across the State in 2017-18.
New funding of approximately $208 million will go towards upgrading health and supporting infrastructure in rural and regional Queensland.
$132 million has been earmarked for planning and early works for proposed redevelopments at Logan, Caboolture and Ipswich Hospitals.
A much-needed new adolescent mental health facility will be built at the Prince Charles Hospital costing $68 million, with associated support services in Brisbane, Logan and the Gold Coast.
This is the replacement for the Barrett Centre that was closed under the previous Government.
11
Education and training
We are investing in our future through a record education Budget of $13.7 billion to give our children the best education possible and teachers the support they need to do what they do best – teach.
There will be an additional 230 teachers in 2018 and 2019 to ensure the first smaller cohort of Prep Year students from 2007 are not disadvantaged in subject choices as they complete the senior phase of schooling.
Under the Building Future Schools Fund initiatives, $500 million over five years is being allocated to address enrolment growth pressures in state schools.
We will build the first new high school in inner-Brisbane since 1963 at the former Fortitude Valley State School site and establish a new high school in the capital’s inner-south to take pressure off Brisbane State High School.
Plans already underway for new state high schools in other growth areas across Queensland including Mt Low in Townsville, North Lakes/Mango Hill north of Brisbane, Calliope near Gladstone and Yarrabilba in South Logan.
We have already built a new special school in Cairns and opened three new schools this year: Bellbird Park State Secondary College, Pumicestone State School and Fernbrooke State School.
This year we’re building four new primary schools in Yarrabilba, Coomera, Caloundra South and Burdell near Townsville which will open in 2018.
We’ve also announced the final Queensland Schools Public Private Partnership school will be built in Springfield for 2019.
We are also committing to $250 million for new secondary school classrooms and other infrastructure to cater for additional students in 2020.
This is in addition to the $200 million committed prior to the Budget for 98 new school infrastructure projects, including $100 million for school halls at 30 schools.
This means more work for our tradies.
In total since last years’ Budget we have committed another $950 million towards school infrastructure.
This is in addition to the $1.1 billion committed to State and non-State School infrastructure and maintenance works in prior Budgets.
That’s a commitment of more than $2 billion to school infrastructure by the Palaszczuk Government.
International Education and Training
We’re also implementing the $25.3 million International Education and Training Strategy to Advance Queensland 2016-26.
12
International student enrolments continue to rise, with the latest figures showing 111,500 enrolments last year, the highest figure ever for Queensland.
Regional enrolments are also up, with around a third of international students choosing to further their education outside Brisbane, far and away the highest percentage of any state.
Our modelling shows that by 2026 onshore international student enrolments could reach 193,250, which would deliver an additional $2.8 billion per annum in export earnings.
This would bring the total for the sector to $7.5 billion.
The Arts
Mr Speaker, we are building a permanent film and television industry right here in Queensland.
Queensland continues to attract the biggest names, the biggest acts, the biggest theatre productions and the biggest Hollywood blockbusters the world has to offer.
A strong arts sector contributes to job creation in a diverse economy while helping to build safe, caring, and connected communities.
Expanding our tourism industry
Including flow-on benefits to other sectors, our tourism industry is worth $23 billion to the Queensland economy, employs 220,000 Queenslanders and generates $55.3 million a day in overnight visitor spending.
We are determined to see tourism thrive and will continue to attract and secure major events that grow the Queensland economy and support jobs.
That is why we are committing an additional $47 million in 2020-21 to deliver the $100 million per year funding guarantee for Tourism and Events Queensland.
The Commonwealth Games
Mr Speaker, we are just 10 months away from one of the biggest sporting events in the world – the Gold Coast 2018 Commonwealth Games.
The stats are amazing.
6,600 athletes and officials representing 70 nations and territories throughout 11 days of competition.
More than 1.5 billion people will watch the action on TV and an estimated 1.5 million people will attend our games venues.
13
The total commitment to deliver the Gold Coast Commonwealth Games in 2018 is $1.5 billion.
This will support more than 2,000 jobs during the construction of three new venues and the Games Village.
Of the $657 million in construction contracts for the venues and Games Village, around 90 per cent of the value has been awarded to South East Queensland businesses.
A consortium of four Australian companies has been appointed to provide more than 4,000 personnel to provide security.
The Games also provide a unique opportunity to leave a lasting legacy for business, industry, and sporting and community groups in Queensland.
The Great Barrier Reef
And Mr Speaker, the unprecedented commitment by this Government to protecting the Great Barrier Reef continues.
The reef supports around 69,000 jobs and contributes $5.7 billion to the Queensland and Australian economies.
Yet it remains under pressure from agricultural run-off, climate change, coastal development and illegal fishing.
Cyclones and severe flooding have also impacted the reef.
The Budget allocates $175 million over five years to deliver the Great Barrier Reef Water Quality Program as part of the Government’s ongoing commitment to protect the Great Barrier Reef, one of the State’s great natural tourism assets.
The Government’s comprehensive Great Barrier Reef Water Quality Program is in addition to the $100 million provided in 2015-16 to address the recommendations arising from the Great Barrier Reef Water Science Taskforce.
This Budget commits an additional $15 million over three years to continue the task of reducing carbon emissions.
This is in addition to the previous $15 million climate adaption package and the $8.4 million CarbonPlus initiative to support Indigenous carbon farming.
We are also allocating $2.5 million to implement the container refund scheme and plastic bag ban from 1 July 2018.
Protecting our environment
Mr Speaker, our communities, our economy, and the health and well-being of all Queenslanders go hand in hand with the environment.
14
The Government knows landowners are among some of the best environmental managers to be found anywhere.
That’s why the Government has already made available almost $20 million to secure Nature Refuge Agreements under the NatureAssist Program giving incentives to conserve high-value habitat on privately owned land.
The Government is providing increased funding of $40 million over two years to revitalise national parks and enhance nature based tourism.
This is what the tourism industry has been asking for.
An additional $3.2 million will be provided for the Protected Area Strategy and the management of Nature Refuge Agreements.
The Queensland Indigenous Land and Sea Ranger program provides grant funding, training and mentoring support to increase Indigenous participation in environmental management and supporting jobs in areas including ecotourism.
This year’s Budget commits $8 million over four years to create an additional 25 ranger positions, taking the total number of positions to 100 across 17 regional and remote communities.
Protecting and growing our agricultural assets
Mr Speaker, the importance of Queensland’s agricultural sector to the economy cannot be overstated.
Our determination to protect our precious agricultural assets from feral pests, disease and invasive weeds while growing our export industry is set in stone.
This Budget extends existing drought relief arrangements, with up to $34.6 million in assistance available in 2017-18.
We will provide $5.2 million over three years to support rural economic development through Growing Queensland’s Food Exports, development of a Rural Economies Centre of Excellence and continuation of the One Stop Service.
We are well aware of the impact white spot disease has had on our fisheries industry.
Up to $9 million over two years will continue the Government’s emergency response to white spot disease, building on the $17.6 million already committed.
The Budget commits $2.8 million to continue the fight against Panama disease.
This is in addition to $5.9 million for the Electric Ant Eradication Program, wild dog fencing, and management of Navua Sedge.
We will also continue funding of over $2 million over the next two years for the management of yellow crazy ants in and adjacent to the Wet Tropics World Heritage Area.
15
There is a further $3.4 million over four years for the Queensland Rural and Industry Development Authority to undertake a rural debt survey, operate the Farm Debt Restructure Office, and develop a policy and research function.
The Government will invest $30 million over three years from 2017-18 towards the implementation of Queensland’s Fisheries management reforms.
Powering Queensland Plan
Mr Speaker, the challenge of a secure energy policy – one that realistically transitions to a renewables future – is one that this government is taking head on.
As part of the 2017-18 Budget, I am proud to say the $1.16 billion Powering Queensland Plan is a comprehensive and nation leading package of developments to ensure Queenslanders continue enjoying a lifestyle backed by an affordable, secure and sustainable energy supply.
The plan provides a roadmap to put downward pressure on electricity prices, and drive jobs and investment.
It will lead the State’s transition to a 50 per cent renewable target which will deliver significant economic benefits to Queensland.
This is a broad-reaching plan which incorporates:
| • | | $771 million to provide relief for Queensland electricity consumers by covering the cost of the Solar Bonus Scheme. |
| • | | reopening the gas-fired Swanbank E power station to increase reliable supply |
| • | | directing Stanwell Corporation to undertake strategies to place downward pressure on wholesale prices, and |
| • | | a Queensland Gas Action Plan to ensure long-term gas supply for electricity generation. |
We will also be assessing the feasibility of a separate ‘CleanCo’ to operate Queensland’s existing renewable and low-emissions energy generation assets and develop new renewable energy projects.
The Plan includes $386 million dedicated to Powering North Queensland.
We are funding this plan through the dividends from our government-owned corporations – the same corporations that we committed to keep in public hands to benefit Queenslanders.
We will be giving $150 million for the development of strategic transmission infrastructure to support a clean energy hub in North Queensland.
As part of the Powering North Queensland plan, the Government will work with SunWater to deliver the Burdekin Falls dam safety improvement project, which will ensure that the dam continues to meet design standards at a cost of approximately $200 million.
To date there has been an unprecedented level of renewable energy investment activity in North Queensland.
16
Existing projects are expected to deliver $1.6 billion of infrastructure spending and create more than 1,400 jobs.
Further projects such as a new transmission line will support 3,600 jobs.
Two weeks ago, the Queensland Competition Authority’s proposed increase in retail electricity prices for regional customers of 7.1 per cent in 2017-18 was not accepted by the government.
We moved quickly to more than halve the increase for all Queensland consumers and cut the proposed increase by 50 per cent for businesses through a $771 million electricity affordability package.
This will provide an average saving of $51 for households and $90 for a typical small business in 2017-18 – and ongoing savings to 2020.
Mr Speaker, I’m confident that Queensland is leading the nation with our energy policy and we know how important affordable and clean energy are to business and individuals alike.
Support for small business
With business confidence for small to medium sized enterprises in Queensland at its highest level in seven years, the Palaszczuk Government will continue to work to drive down costs for SMEs.
That’s why we are continuing our partnership with the Chamber of Commerce and Industry Queensland to develop an enhanced ecoBiz program.
EcoBiz supports SMEs to reduce their energy and water consumption, waste production and carbon footprint – and there have been some great results.
WorkCover
We’re also supporting businesses with the lowest workers compensation premiums in Australia.
We will maintain an average premium rate of $1.20 in 2017-18, providing a real benefit to employers, without compromising the viability of the scheme. This is the lowest premium rate in the country.
For those businesses doing the right thing, we will also increase the early-payment discount from 3 to 5 per cent of the premium rate.
In addition, we’re encouraging employers to hire apprentices by covering the WorkCover premiums for apprentices.
Businesses will pay no WorkCover premium on the apprentices they hire.
I can also advise that our doubling of the payroll tax rebate to 50 per cent for businesses that employ apprentices and trainees – announced in last year’s Budget – will continue.
17
Household budgets
Mr Speaker, we all know that everyday expenses can put enormous strain on household budgets.
As a government we want to do more to ease that burden where we can.
Reducing cost-of-living pressures for Queenslanders, and ensuring affordable prices for business, forms a major part of this Budget.
More than $5 billion in concessions will help Queenslanders who need it most, based on factors such as age, income and special needs or disadvantage.
Broader concession arrangements are in place to reduce the price paid by all consumers in areas such as transport, electricity and water.
In addition to the more than three-quarters of a billion dollar investment to limit the QCA’s electricity price rise, we recognise pensioners feel rising living costs and feel it more acutely than most.
In 2017-18, the Government is allocating $54 million to assist pensioners with their rates.
The Pensioner Rate Subsidy Scheme will provide subsidies of up to $200 a year to help pensioners stay in their homes by lessening the impact of local government rates and charges.
In addition, the South East Queensland Pensioner Water Subsidy Scheme provides an annual payment of up to $120 to eligible pensioners to lessen the impact of increased water prices.
And the Electricity Rebate Scheme provides up to $341 per annum to assist with electricity costs for eligible holders of the Pensioner Concession Card, a Queensland Seniors Card or a Department of Veterans Affairs Gold Card.
Queensland Health will spend more than $149 million on providing free dental care to eligible Queenslanders.
On average patients receive approximately $600 for general care, $1,800 for treatment involving dentures, and $265 for emergency dental care.
In a further effort to reduce cost-of-living pressures, fairer fares for public transport users across the South East Queensland network will remain frozen in 2017.
Concession fares for job seekers and asylum seekers will support workforce participation and extend social mobility.
Better roads and transport
Mr Speaker, transport networks bring communities together and services closer.
They’re a critical lifeline for so many rural and regional parts of our state.
They also support commerce and industry.
These are all signs of a healthy, robust economy – and we are delivering.
18
Construction of the $929 million Bruce Highway – Caloundra Road to Sunshine Motorway is underway.
The Queensland Government has secured $743 million from the Federal Government to support the project which will increase safety and ease congestion for around 40,000 motorists daily.
We are partnering with the Federal Government on the $400 million upgrade to the Ipswich Motorway – Rocklea to Darra – with $36 million in 2017-18.
We have also reached agreement with the Australian Government for much needed upgrades to the M1.
This includes $18.6 million in 2017-18 to construct additional lanes between Mudgeeraba and Varsity Lakes at a total cost of $180 million.
In addition $10 million has been budgeted in 2017-18 to upgrade the M1–Gateway Motorway Merge at a total cost of $170 million.
Further, the Queensland Government is investing $5 million to progress the planning and business case development for the six-laning of the Pacific Motorway between Varsity Lakes and Tugun – a key priority on the southern end of the motorway.
Mr Speaker, the $90 million boost to the Transport Infrastructure Development Scheme under Building Our Regions will provide additional support to local government transport infrastructure for three years.
The Budget also provides $8.3 million over two years for the Local Fare Scheme, giving Cape York and Torres Strait communities access to affordable flights.
A further $2 million in 2017-18 will deliver a 12-month trial of the scheme in the Western Cape to improve access to education, employment and health services.
Queensland Housing Strategy
Mr Speaker, housing is an important sector of our economy and is a major jobs generator.
But it is more than that.
Housing is central to everyone’s life and it is central to every community.
That’s the starting point for our new $1.8 billion 10-year Housing Strategy which was launched yesterday.
We recognise the economic benefits the strategy will deliver.
But we also recognise its human impacts.
We know the difference between a house and a home.
We know that having secure and affordable housing gives individuals and families a stable home – stability that can lead to better outcomes in terms of health, education, and training and employment.
19
Affordable housing can shape or reshape people’s lives.
More investment in new housing stocks can help address housing supply issues and can assist in making new home ownership more affordable, and at a time when home and rental affordability can be a challenge.
To help achieve that, this year’s Budget provides biggest commitment to housing in Queensland’s recent history.
The $1.8 billion Strategy will see over 5,500 social and affordable homes built over the life of the strategy, with an average of 800 homes built each year for the first five years.
On average, that means for each of the next five years, we will be building double the number of social and affordable homes built in 2016-17.
We are elevating the building industry in this state, building homes and creating jobs.
Over five years, the Housing strategy will create 600 jobs on average per year, or 450 per year over ten years.
It includes $1.2 billion to renew the existing social housing property portfolio.
There is a $420 million housing construction program to boost the supply of social and affordable housing, including $3.5 million to construct two refuges for women and children escaping domestic and family violence.
We are also allocating $75 million to progress home ownership in discrete Aboriginal and Torres Strait Islander communities, and $100 million for reforms to the housing and homelessness service system.
Prevention of domestic and family violence
Mr Speaker, few governments have paid closer attention to addressing complex issues such as domestic and family violence and child safety than this one.
This Budget continues our response to the Not Now, Not Ever report to address the devastating impacts of domestic and family violence.
Almost $70 million has now been allocated for the specialist domestic and family violence court at Southport and the roll out of courts in Beenleigh and Townsville.
Child safety
Following the Queensland Family and Child Commission’s report into the death of Mason Jet Lee, a $56.8 million package of initiatives was announced earlier this year to further support foster carers and respond to critical issues.
The Budget commits an additional $142 million over four years to further strengthen Queensland’s child protection system.
20
The funding package includes 292 frontline child safety officers, team leaders and front-line support officers.
Disability services
The Budget delivers a record $1.8 billion for disability services.
This includes $549 million for the National Disability Insurance Scheme, which continues to be rolled out in Ipswich and extended to Bundaberg, Rockhampton, Gladstone and west to the border.
Around 91,000 Queenslanders are expected to receive NDIS-funded support services by the end of 2018-19 when it is fully rolled out.
Social benefit bonds
In 2015, we promised we would look at new ways of tackling complex social issues through Social Benefit Bonds.
I’m pleased to say two bonds – one to help address youth reoffending and the other to help reunite children living in out-of-home care with their families – have been officially launched to a positive response.
Law, order and public safety
Mr Speaker, the recent tragic events in Manchester and London serve to remind us of the need to remain vigilant.
It’s important now more than ever for our community to feel safe and be safe.
To make sure our police are highly trained and appropriately resourced.
We will be spending $44 million for an additional 30 counter-terrorism officers, 20 additional Police officers in priority areas and 20 Rapid Action and Patrol Group officers.
This Budget commits funding of $47 million to construct the Westgate Counter Terrorism and Community Safety Training Centre, reducing the need for police to train at multiple locations.
A $265 million overhaul of our probation and parole system announced earlier this year will enable tougher supervision of parolees.
It will expand GPS monitoring and establish a fully independent parole board.
It will also help reduce reoffending and help improve rehabilitation and mental health services.
21
And the community has made it clear that our determination to confront and deal with the Ice epidemic cannot waiver.
The Action on Ice strategy develops solutions directly with communities, battling to cope with this soul-destroying and insidious drug.
Today I announce a further $18 million will be contributed to the plan with measures that increase awareness, support families and better equip our frontline service providers.
Conclusion
Mr Speaker, as a State this year we’ve overcome adversity and met those challenges head-on.
But we have not shifted our focus from job creation.
We have continued to focus on regional economies and transitioning to a post-mining boom economy.
This is a Budget that delivers surpluses over the forward estimates.
It delivers record Health and Education funding and better frontline services.
It delivers lower debt without asset sales.
It delivers cost of living relief.
It delivers the biggest housing spend in Queensland’s history.
It delivers major investments in our renewable energy future.
It delivers a massive state-wide infrastructure program.
And most importantly it delivers jobs for Queensland with the Budget supporting 40,000 jobs – mostly in the private sector.
Mr Speaker, before the end of this year our state’s population will reach five million.
This is a Budget for every one of those five million Queenslanders.
This is a Budget that boosts spending where it’s needed and where it has maximum effect.
This is a Budget to strengthen our economy to face the future with confidence.
This is a Budget about fairness.
This is a Budget about recovery and rebuilding.
This is a Budget about Jobs for Queensland.
Mr Speaker, the Palaszczuk Government is getting on with the job of creating jobs.
I commend the Bill to the House.
22
Queensland Budget 2017-18 Budget Speech Budget Paper No. 1
Queensland Budget 2017-18
Budget Speech Budget Paper No.1
Queensland Budget 2017-18
BUDGET STRATEGY AND OUTLOOK
Budget Paper No.2
2017-18 Queensland Budget Papers
1. Budget Speech
2. Budget Strategy and Outlook
3. Capital Statement
4. Budget Measures
5. Service Delivery Statements
Appropriation Bills
Budget Highlights
© Crown copyright
All rights reserved
Queensland Government 2017
Excerpts from this publication may be reproduced, with appropriate
acknowledgement, as permitted under the Copyright Act.
Budget Strategy and Outlook
Budget Paper No.2
ISSN 1445-4890 (Print)
ISSN 1445-4904 (Online)
Budget Strategy and Outlook 2017-18

State Budget
2017-18
Budget Strategy and Outlook
Budget Paper No. 2
Budget Strategy and Outlook 2017-18
Contents
| | | | | | |
| |
Overview | | | 1 | |
| |
Economic outlook | | | 4 | |
| |
Fiscal outlook | | | 6 | |
| | |
1 | | Economic plan – creating opportunities for all Queenslanders | | | 8 | |
| | |
1.1 | | The Government’s economic plan | | | 9 | |
1.2 | | Improving employment opportunities and outcomes in a transitioning economy | | | 10 | |
1.3 | | Driving private sector growth and jobs | | | 12 | |
1.4 | | Supporting growth and jobs through the economic plan | | | 17 | |
| | |
2 | | Economic performance and outlook | | | 28 | |
| | |
2.1 | | External environment | | | 30 | |
2.2 | | Queensland economy | | | 34 | |
| | |
3 | | Fiscal strategy and outlook | | | 52 | |
| | |
3.1 | | Context | | | 54 | |
3.2 | | Key fiscal aggregates | | | 55 | |
3.3 | | Fiscal principles | | | 67 | |
3.4 | | Achievement of fiscal principles | | | 72 | |
| | |
4 | | Revenue | | | 74 | |
| | |
4.1 | | 2016-17 estimated actual | | | 75 | |
4.2 | | 2017-18 revenue by category | | | 75 | |
4.3 | | 2017-18 Budget initiatives | | | 78 | |
4.4 | | Queensland’s revenue trends | | | 79 | |
Budget Strategy and Outlook 2017-18
��
| | | | | | |
| 4.5 | | Taxation revenue | | | 82 | |
| 4.6 | | Grants revenue | | | 88 | |
| 4.7 | | Royalty revenue | | | 90 | |
| 4.8 | | Sales of goods and services | | | 95 | |
| 4.9 | | Interest income | | | 97 | |
| 4.10 | | Dividend and income tax equivalent income | | | 97 | |
| 4.11 | | Other revenue | | | 98 | |
| | |
| 5 | | Expenses | | | 99 | |
| | |
| 5.1 | | 2016-17 estimated actual | | | 100 | |
| 5.2 | | 2017-18 Budget and out-years | | | 100 | |
| 5.3 | | Expenses by operating statement category | | | 101 | |
| 5.4 | | Operating expenses by purpose | | | 112 | |
| 5.5 | | Departmental expenses | | | 112 | |
| | |
| 6 | | Balance sheet and cash flows | | | 116 | |
| | |
| 6.1 | | Context | | | 117 | |
| 6.2 | | Balance sheet | | | 117 | |
| 6.3 | | Cash flows | | | 125 | |
| 6.4 | | Reconciliation of operating cash flows to the operating statement | | | 126 | |
| | |
| 7 | | Intergovernmental financial relations | | | 127 | |
| | |
| 7.1 | | Federal financial arrangements | | | 128 | |
| 7.2 | | Australian Government funding to the states | | | 131 | |
| 7.3 | | Australian Government funding to Queensland | | | 132 | |
| 7.4 | | GST revenue payment | | | 133 | |
| 7.5 | | Payments to Queensland for specific purposes | | | 134 | |
Budget Strategy and Outlook 2017-18
| | | | | | |
| | |
| 8 | | Public Non-financial Corporations Sector | | | 141 | |
| | |
| 8.1 | | Context | | | 142 | |
| 8.2 | | Finances and performance | | | 151 | |
| | |
| 9 | | Uniform Presentation Framework | | | 160 | |
| | |
| 9.1 | | Context | | | 160 | |
| 9.2 | | Uniform Presentation Framework financial information | | | 160 | |
| 9.3 | | Reconciliation of net operating balance to accounting operating result | | | 170 | |
| 9.4 | | General Government Sector time series | | | 170 | |
| 9.5 | | Other General Government uniform presentation framework data | | | 172 | |
| 9.6 | | Contingent liabilities | | | 178 | |
| 9.7 | | Background and interpretation of uniform presentation framework | | | 178 | |
| 9.8 | | Sector classification | | | 180 | |
| 9.9 | | Reporting entities | | | 181 | |
| |
Appendix A: Concessions statement | | | 184 | |
| |
Context | | | 184 | |
Focus | | | 184 | |
Explanation of scope | | | 184 | |
A.1 Concessions summary | | | 186 | |
A.2 Concessions by agency | | | 187 | |
A.3 Concessions by entity | | | 211 | |
| |
Appendix B: Tax expenditure statement | | | 214 | |
| |
Context | | | 214 | |
Methodology | | | 214 | |
The Tax Expenditure Statement | | | 215 | |
Discussion of individual taxes | | | 217 | |
Budget Strategy and Outlook 2017-18
| | | | |
| |
Appendix C: Revenue and expense assumptions and sensitivity analysis | | | 220 | |
| |
Taxation and royalty revenue | | | 221 | |
Taxation revenue assumptions and revenue risks | | | 222 | |
Royalty assumptions and revenue risks | | | 223 | |
Sensitivity of expenditure estimates and expenditure risks | | | 224 | |
| |
Appendix D: Fiscal aggregates and indicators | | | 225 | |
Budget Strategy and Outlook 2017-18
Overview
Growth in the Queensland economy is forecast to strengthen over the coming years from 2.4% in 2015-16, to 2 3⁄4% in both 2016-17 and 2017-18, and 3% in 2018-19.
The 2017-18 Budget is focused on supporting continued growth and creating jobs for Queensland, while enabling the State’s $300 billion economy to better transition to a more innovative, diverse and productive economy.
A key aspect of the Government’s commitment to create jobs for Queensland is an overarching economic plan which includes a number of key policy initiatives through which the Government will drive sustainable economic growth and jobs across all regions of the State.
In line with the economic plan and building on the range of innovative policies and programs already implemented by the Government over the past two State Budgets, significant additional measures and targeted expenditure in the 2017-18 Budget will:
| • | | drive ongoing growth and jobs, including in regional economies in transition |
| • | | deliver and facilitate significant productive infrastructure |
| • | | help communities impacted by recent natural disasters to recover, reconnect and rebuild |
| • | | boost supply of affordable housing |
| • | | reduce cost of living pressures on Queensland families |
| • | | foster innovation, trade and investment in traditional and emerging industries |
| • | | enhance the safety, security and liveability of Queensland communities. |
By supporting the recovery, transition and growth of businesses, industries and communities across the State, the substantial capital works program and other significant initiatives aimed at fostering investment and growth in the Budget will directly support around 40,000 jobs in 2017-18, predominantly in the private sector, while continuing to create ongoing jobs and improve employment outcomes for all Queenslanders over the short, medium and longer term.
Driving growth and increasing job opportunities for all Queenslanders
Several key Budget initiatives will create a substantial and immediate increase in economic activity and jobs across the State, including the $77.5 million boost to enhance the highly successful Back to Work Regional Employment Package and extend key elements to South East Queensland. The 2017-18 Budget also provides additional funding of $200 million over two years for the Works for Queensland program, supporting local governments outside South East Queensland that are facing unemployment issues to undertake job-creating maintenance and minor infrastructure works. This supplements the $200 million provided in the Mid Year Fiscal and Economic Review (MYFER), bringing the Palaszczuk Government’s total Works for Queensland commitment to $400 million.
Just as importantly, the 2017-18 Budget contains a range of measures to build further productive capacity in the economy by providing economic infrastructure, increasing private sector investment, enhancing innovation and promoting a more diversified economy.
1
Budget Strategy and Outlook 2017-18
This includes significant infrastructure projects in both South East Queensland and regional Queensland as part of a $42.75 billion four year capital works program that will support thousands of jobs across Queensland.
Combined with existing initiatives, including the $200 million Jobs and Regional Growth Package and Market Led Proposals initiative, these measures will support significant employment opportunities across the State during the construction phase of projects and support ongoing direct and indirect jobs over the medium to longer term.
Building productive infrastructure
Key productivity enhancing infrastructure projects in the 2017-18 Budget include a commitment to fully fund the $5.409 billion Cross River Rail project, Queensland’s highest priority transport infrastructure project. This commitment includes an additional $1.952 billion allocation to the project over the forward estimates.
Cross River Rail will provide additional rail capacity to Brisbane’s CBD and provide significant benefits in terms of reduced congestion, improved network reliability and increased accessibility. This project has significant potential to facilitate economic growth and jobs in South East Queensland by making local businesses more accessible, enhancing land use and encouraging business investment in the surrounding area, while also increasing workers’ access to employment opportunities throughout the region.
The Budget also reinforces the Government’s commitment to ensuring all Queenslanders, particularly in regional areas, have access to quality infrastructure, with key industries and communities throughout regional Queensland supported by major infrastructure projects.
These include: $386 million Powering North Queensland Plan (including $136 million Burdekin Falls Dam Safety Improvement Program, $150 million for the development of strategic transmission infrastructure to support a clean energy hub and $100 million for Burdekin Falls Dam hydro-electric power station); $225 million Townsville Water Security initiative; $176 million Cairns Convention Centre Expansion; and funding towards key projects as part of the Townsville City Deal, including the State’s contribution to the $250 million North Queensland Stadium.
Each of these projects will improve the productivity of key industries and facilitate and attract investment in these regions, helping to support longer term economic and employment growth.
Helping communities recover, reconnect and rebuild
Operation Queensland Recovery, led initially by Brigadier Christopher Field, is well underway to recover, reconnect and rebuild more resilient Queensland communities following Severe Tropical Cyclone (STC) Debbie. As at 2 June 2017, in the first two months after the cyclone, more than 118,000 people have been assisted.
Close to $30 million in assistance has already been distributed through the Personal Hardship Assistance Grants and Immediate Hardship Assistance Grants funded under the Natural Disaster Relief and Recovery Arrangements (NDRRA). A $14.7 million Community Recovery Fund has been established and additional funding of $2 million has been provided for the Government’s Go Local campaign to support the agricultural industry in disaster affected areas.
2
Budget Strategy and Outlook 2017-18
The Queensland Government is also expecting to spend over $1 billion to restore essential public assets before reimbursements from the Australian Government through the jointly-funded NDRRA.
By rebuilding vital infrastructure and supporting communities, this investment will support significant short-term construction activity and jobs in these regions. However, more importantly, it will re-establish productivity enhancing infrastructure and restore the productive capacity of affected economies, thereby supporting ongoing growth and employment across the State.
Boosting the supply of affordable housing
A key element of the 2017-18 Budget is the $1.795 billion commitment to support the delivery of the Queensland Housing Strategy, the biggest commitment to housing in the State’s recent history. The Strategy will help boost the supply of social and affordable housing to respond to population growth, housing affordability pressures, and renew existing social housing.
This forms part of the Government’s 10 year $1.835 billion funding package for a range of housing and homelessness measures.
Reducing the cost of living for Queensland families
In response to the cost of living pressures faced by Queensland families, the Government will provide $5.344 billion in specific concessions to help Queenslanders who need it most, while also implementing significant broader concession arrangements to reduce the prices for consumers in areas such as transport, electricity and water, including:
| • | | a continued commitment to the Fairer Fares package in South East Queensland, with a guarantee these lower fares will remain frozen in 2017, with concessions extended to jobseekers and asylum seekers |
| • | | the Government’s $771 million investment to remove the cost of the Solar Bonus Scheme from electricity prices over the next three years, providing an average saving of $51 for households and $90 for small businesses in 2017-18 |
| • | | more than $149 million to provide free dental care to eligible Queenslanders, in addition to the ongoing significant subsidised dental care for the general public in rural and remote areas with no private dental practitioner services. |
The Government’s commitments will not only reduce the cost of living pressures for households, but will provide Queensland families greater opportunity to purchase goods and services that improve their quality of life and support economic activity and jobs in other sectors of the Queensland economy.
Enhancing the safety, security and liveability of Queensland communities
The Government is also committed to protecting vulnerable Queenslanders and enhancing social cohesion and safety in communities through a range of measures. These include ongoing implementation of its response to the Not Now, Not Ever report, with $69.5 million to continue the specialist domestic and family violence court at Southport and roll out courts in Beenleigh and Townsville, including circuit courts to Mount Isa and Palm Island.
3
Budget Strategy and Outlook 2017-18
Funding of $18 million has been committed to tackle the harmful use and effects of crystal methamphetamine (Ice) by increasing awareness, supporting families and better equipping frontline service providers, while $32.6 million has been allocated to re-establish a drug court in Brisbane with support and referral services in four locations.
Since the 2016-17 Budget additional funding of $200 million over four years has been committed to further strengthen Queensland’s child protection system and better support vulnerable children and families. The Budget also delivers a record $1.887 billion for disability services.
The Government is providing $43.7 million over four years from 2017-18 for an additional 30 Counter-Terrorism police officers, an additional 20 police officers for the Townsville Rapid Action and Patrols Groups and a further 20 police officers for priority areas of need to tackle crime and improve community safety.
To help ensure the safety and security of Queenslanders more broadly, an additional $46.7 million has been allocated to build the new Counter-Terrorism and Community Safety Training Centre at Westgate Police Academy, while a consortium of four Australian companies has been appointed to provide a highly trained workforce of more than 4,000 security personnel to provide the highest quality security at the Gold Coast Commonwealth Games in 2018.
Economic outlook
Overall growth in the Queensland economy is forecast to strengthen, from the 2.4% recorded in 2015-16, to 2 3⁄4% in both 2016-17 and 2017-18, and 3% in 2018-19.
Based on forecasts by the Australian Treasury, this is stronger than expected national gross domestic product (GDP) growth of 1 3⁄4% in 2016-17 and in line with it in 2017-18 and 2018-19.
Queensland growth forecasts for 2016-17 and 2017-18 would have been higher, but for the impact of Severe Tropical Cyclone (STC) Debbie, which is estimated to have detracted around $2 billion or 3⁄4 percentage point from economic growth across these years.
Major impacts from STC Debbie include the loss of around 10 million tonnes of coal exports due to damaged rail infrastructure, around $300 million of losses to sugar exports and a considerable hit to tourism in the Whitsundays region.
With the impact of the resources boom largely reflected in exports and population growth broadly in line with the national rate, Queensland’s gross state product growth (GSP) is expected to remain in line with national growth in the projection years, at 3%.
If the improvement in commodity prices is sustained and large projects such as Adani’s Carmichael coal mine proceed, then investment in resources and exports will strengthen, potentially boosting Queensland’s economic growth rates and State revenues.
While a substantial amount of construction work still in the pipeline will see new dwelling construction reach a cyclical peak in 2016-17, activity is expected to fall in 2017-18 and 2018-19 as a large amount of apartment stock comes on line.
Subdued real wages growth, together with modest population growth and the easing in the dwelling sector, is expected to keep growth in household consumption below average.
4
Budget Strategy and Outlook 2017-18
Business investment continues to adjust in 2016-17 from the record levels experienced during the Liquefied Natural Gas (LNG) construction boom. Despite bright spots in tourism and education and ongoing spending in the coal seam gas (CSG) sector, business investment in Queensland is expected to be broadly unchanged in 2017-18, before returning to moderate growth from 2018-19 onward, consistent with the national growth profile.
Overseas exports are expected to grow solidly over the forecast period, generally between 3% and 4% per annum. In addition to the long-expected ramp up in LNG exports, coal exports are expected to recover from the fall in 2016-17 induced by STC Debbie. A competitive exchange rate and growing demand from Asian markets is also expected to boost tourism and education exports.
Following employment growth of 0.7% through the year to June quarter 2016, measured employment has been quite volatile during the current financial year, easing early in the year, but picking up since late 2016. Reflecting this recent momentum, employment in Queensland is forecast to be 1 1⁄4% higher over the year to June quarter 2017.
Consistent with an improvement in overall domestic activity, employment growth is also forecast to strengthen to 1 1⁄2% through the year to June quarter 2019, in line with forecast national jobs growth. These trends are forecast to see the unemployment rate decline to 6% by then.
Forecasts and projections across the forward estimates period for key economic variables are shown in the table below and discussed in detail in Chapter 2.
| Overview Table 1 | Economic forecasts/projections, Queensland1 |
| | | | | | | | | | | | | | | | | | | | | | | | |
| | | Actual | | | Est. Act. | | | Forecasts | | | Projections | |
| | | 2015-16 | | | 2016-17 | | | 2017-18 | | | 2018-19 | | | 2019-20 | | | 2020-21 | |
Gross state product2 | | | 2.4 | | | | 2 3⁄4 | | | | 2 3⁄4 | | | | 3 | | | | 3 | | | | 3 | |
Nominal gross state product | | | 2.4 | | | | 11 3⁄4 | | | | 4 | | | | 3 1⁄4 | | | | 5 1⁄4 | | | | 5 1⁄4 | |
Employment3 | | | 0.7 | | | | 1 1⁄4 | | | | 1 | | | | 1 1⁄2 | | | | 1 3⁄4 | | | | 1 3⁄4 | |
Unemployment rate4 | | | 6.4 | | | | 6 1⁄4 | | | | 6 1⁄4 | | | | 6 | | | | 6 | | | | 6 | |
Inflation5 | | | 1.6 | | | | 1 3⁄4 | | | | 2 | | | | 2 1⁄4 | | | | 2 1⁄2 | | | | 2 1⁄2 | |
Wage Price Index5 | | | 1.9 | | | | 2 | | | | 2 1⁄4 | | | | 2 1⁄2 | | | | 3 | | | | 3 | |
Population5 | | | 1.3 | | | | 1 1⁄2 | | | | 1 1⁄2 | | | | 1 1⁄2 | | | | 1 1⁄2 | | | | 1 1⁄2 | |
Notes:
| 1. | Unless otherwise stated, all figures are annual percentage change. |
| 2. | Chain volume measure (CVM), 2014-15 reference year. |
| 3. | Through-the-year growth rate to the June quarter (seasonally adjusted). This is the same basis as calculated for national employment growth in the Australian Government Budget. The comparable growth rates in year average terms are 1.6%, 0%, 1 1⁄4% and 1 1⁄2% from 2015-16 through to 2018-19, and 1 3⁄4% in the projection years. |
| 4. | Seasonally adjusted rate for the June quarter. |
| 5. | Annual percentage change, year-average. |
Sources: ABS 3101.0, 6202.0, 6345.0, 6401.0 and Queensland Treasury.
5
Budget Strategy and Outlook 2017-18
Fiscal outlook
The 2017-18 Budget demonstrates the Government’s ongoing commitment to responsible fiscal management while responding to the challenges presented by natural disasters and supporting further diversification of the State’s economy following the mining investment boom. The Government is building on its budget strategy from the 2015-16 and 2016-17 Budgets, retaining and delivering on the fiscal principles introduced in those Budgets.
The Budget continues to deliver on the Government’s commitment to revitalising frontline service delivery, while responsibly managing the State’s finances. In 2017-18, the Government is providing a record $16.6 billion to deliver first rate health services by a highly skilled workforce and a record $13.7 billion for education in support of quality education outcomes.
The Government’s responsible fiscal management, as demonstrated through consecutive Budgets and actual outcomes, has been a significant factor in Moody’s Investors Service recently affirming its Aa1 rating, equivalent to AA+, for Queensland.
Importantly, Moody’s removed the negative outlook on Queensland’s credit rating, which had been in place since November 2012, returning the outlook to stable.
The Government recognises that the $2.8 billion surplus in 2016-17 is being supported by a number of temporary factors, such as the timing of disaster recovery reimbursements from the Australian Government and spikes in coal prices. This strong 2016-17 operating surplus has contributed to General Government Sector debt being around $3.8 billion lower in 2016-17 than estimated at the 2016-17 Budget. This has provided the opportunity to support additional infrastructure investment and a range of targeted temporary measures to support business and households.
Debt reduction
The Government’s actions, consistent with its undertakings at the time of the 2015 State election, will continue to manage General Government Sector debt and provide additional funds for infrastructure investment without requiring the sale of government-owned corporations, without increases in taxes on Queenslanders, without cuts to services and without redundancies. The strong performance of government-owned corporations in 2016-17 demonstrates the sustainability of the Government’s Debt Action Plan.
General Government Sector debt is estimated to be $9.347 billion lower in 2017-18 than its 2014-15 high of $43.105 billion, with debt in 2020-21 projected to remain below the 2014-15 peak. The debt to revenue ratio has continued to be revised down and is expected to remain below 70% across the forward estimates, compared to 86% in 2014-15. General Government Sector debt in 2017-18 is expected to be $33.758 billion, a reduction of $14.663 billion compared with the 2014-15 Budget projection.
The reduction in General Government debt in 2016-17, supplemented with further balance sheet measures, has provided the Government with the capacity to fund important new capital infrastructure over the forward estimates without significantly increasing debt.
6
Budget Strategy and Outlook 2017-18
Net operating surpluses
The net operating surplus of $2.8 billion for 2016-17 is expected to be the largest surplus since 2005-06.
Net operating surpluses are expected in each year of the forward estimates, despite the cost of responding to STC Debbie and forecasts for GST and State taxation revenue being revised down by $1.554 billion across the period 2016-17 to 2019-20 since the 2016-17 MYFER. Demonstrating the Government’s ongoing commitment to expenditure control, the new expenditure initiatives outlined in the 2017-18 Budget are partly funded through reprioritisations.
Operating expenses are forecast to grow at a sustainable rate, averaging 3.2% per annum over the five years to 2020-21.
The key fiscal aggregates of the General Government Sector for the 2017-18 Budget are outlined in the table below and are discussed in detail in Chapter 3.
| Overview Table 2 | General Government Sector – key fiscal aggregates1 |
| | | | | | | | | | | | | | | | | | | | | | | | | | | | |
| | | 2015-16
Actual2
$ million | | | 2016-17
MYFER
$ million | | | 2016-17
Est. Act.
$ million | | | 2017-18
Budget
$ million | | | 2018-19
Projection
$ million | | | 2019-20
Projection
$ million | | | 2020-21
Projection
$ million | |
Revenue | | | 50,995 | | | | 54,953 | | | | 56,434 | | | | 55,869 | | | | 56,138 | | | | 57,887 | | | | 58,982 | |
Expenses | | | 50,025 | | | | 52,927 | | | | 53,610 | | | | 55,723 | | | | 56,021 | | | | 57,183 | | | | 58,574 | |
Net operating balance | | | 970 | | | | 2,026 | | | | 2,824 | | | | 146 | | | | 117 | | | | 704 | | | | 408 | |
PNFA3 | | | 4,092 | | | | 5,210 | | | | 4,416 | | | | 5,123 | | | | 6,471 | | | | 7,015 | | | | 6,462 | |
Fiscal balance | | | (461 | ) | | | (1,015 | ) | | | 868 | | | | (2,363 | ) | | | (3,946 | ) | | | (2,725 | ) | | | (2,496 | ) |
Borrowing | | | 35,486 | | | | 36,022 | | | | 33,937 | | | | 33,758 | | | | 36,393 | | | | 38,760 | | | | 41,244 | |
Borrowing (NFPS)4 | | | 72,922 | | | | 73,749 | | | | 73,102 | | | | 71,989 | | | | 74,978 | | | | 77,720 | | | | 81,148 | |
Notes:
| 1. | Numbers may not add due to rounding and bracketed numbers represent negative amounts. |
| 2. | Reflects published actuals. |
| 3. | PNFA: Purchases of non-financial assets. |
| 4. | NFPS: Non-financial Public Sector. |
7
Budget Strategy and Outlook 2017-18
| 1 | Economic plan – creating opportunities for all Queenslanders |
Features
| • | | The Queensland Government’s commitment to creating jobs for Queensland is underpinned by its strong focus on driving ongoing economic growth and creating more opportunities for all Queenslanders. A key element of this commitment is an overarching economic plan focused on facilitating sustainable growth and jobs in the State’s traditional, emerging and new industries, including in regional Queensland. |
| • | | The economic plan outlines six key policy channels through which the Government continues to drive sustainable economic growth: |
| | • | | Fostering entrepreneurship and innovation |
| | • | | Promoting business investment and exports |
| | • | | Delivering and facilitating productive infrastructure |
| | • | | Growing our human capital |
| | • | | Optimising the use of our land and natural resources |
| | • | | Leading an innovative, active and responsive public sector. |
| • | | Most importantly, the economic plan will ensure the translation of this growth into more job opportunities for all Queenslanders over the short, medium and longer term by: |
| | • | | Increasing the employment opportunities available to Queenslanders |
| | • | | Enhancing the skills and capability of Queenslanders to access job opportunities |
| | • | | Improving the matching of workers with jobs |
| | • | | Ensuring all Queenslanders, including those from disadvantaged cohorts and across regional Queensland, benefit from increased opportunities. |
| • | | The 2017-18 Budget will continue to support and facilitate growth of a more innovative, diverse and productive economy, in line with the economic plan and will build on the policies and programs already implemented by the Government. |
| • | | Key elements of the Budget include significant infrastructure investments across the State as part of a $42.75 billion capital works program over four years and initiatives to promote further growth in traditional and emerging industries, including in regions facing challenges. |
| • | | Operation Queensland Recovery is helping rebuild vital infrastructure and supporting communities to restore the productive capacity of economies impacted by recent natural disasters. In addition, the continued strong focus on health, education, justice and public safety, as well as a significant investment in social and Indigenous housing, will ensure all Queenslanders share in the increased opportunities and prosperity as the economy grows. |
| • | | By supporting the recovery, transition and growth of businesses, industries and communities across the State, the capital works program and other initiatives aimed at fostering investment and growth in the 2017-18 Budget will directly support around 40,000 jobs in 2017-18, predominantly in the private sector. Importantly, they will also continue to create jobs and improve employment outcomes for all Queenslanders into the future. |
8
Budget Strategy and Outlook 2017-18
| 1.1 | The Government’s economic plan |
The economic and employment opportunities available to Queenslanders and the quality of life they enjoy depend on the productive capacity, strength and resilience of the State’s economy.
Queensland’s overall economic and labour market performance in recent years has been strong, with more than 59,000 jobs created in Queensland in trend terms since January 2015 and the State expected to record higher economic growth than nationally in 2016-17.
However, the State’s economy continues to face some challenges, particularly in regions recovering from Severe Tropical Cyclone (STC) Debbie, facing persistent drought or continuing to transition to broader based growth following the resources investment boom.
In the longer term, the State’s economic performance will be influenced by a range of international and national economic factors and impacted by ongoing social and demographic trends. In particular, the ageing population, technological change, growth of the Asian middle class and increased environmental concerns will provide both opportunities and challenges.
To ensure the economy remains resilient and capable of responding to challenges and opportunities, the Queensland Government remains committed to supporting business and employment growth in traditional, emerging and new industries, including in regional Queensland.
The Government’s economic plan outlines six key policy channels through which the Government continues to deliver innovative policies and programs to drive economic growth and jobs – creating opportunities for all Queenslanders. The economic plan builds on the Working Queensland initiatives and the Jobs Now, Jobs for the Future employment plan outlined in the 2015-16 Budget and is in line with the 2016-17 Budget’s focus on innovation, investment and infrastructure.
| Figure 1.1 | Queensland Government’s economic plan |
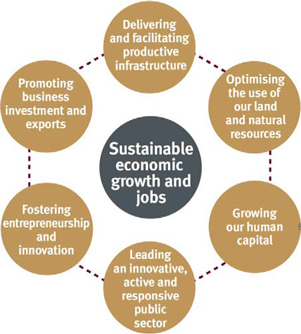
9
Budget Strategy and Outlook 2017-18
| 1.2 | Improving employment opportunities and outcomes in a transitioning economy |
The Queensland economy and labour market has been transitioning gradually over many decades to a more diversified services-based economy, driven by changes in international, national and domestic demand for products and services, productivity enhancing technological advancement and changes in our competitive advantages as the global economy evolves.
Analysis of employment data over the past 30 years shows how the State’s labour market continues to evolve in terms of the industries primarily driving employment growth, labour force participation rates, the demographics of the labour market, the diversity of occupations and job opportunities, and the variety and flexibility of working arrangements.
Over this period there has been a decline in the share of employment supported by some traditional industries (e.g. agriculture and manufacturing), while employment in service industries (e.g. health care and education) has grown in line with trends throughout the developed world.
Other factors, such as the increased use of labour saving technology, have contributed to a fall in the share of employment in some industries (e.g. agriculture, forestry and fishing, and wholesale and retail trade) while at the same time resulting in the emergence of new occupations and stronger growth in employment opportunities in a range of other sectors (e.g. business services).
| Chart 1.1 | Queensland employment share by industry, 1989-90 and 2015-161 |
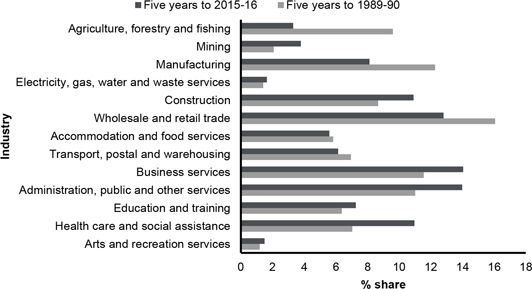
Note:
| 1. | Employment shares are based on ABS data on total hours worked by industry. |
Source: ABS 6291.0.55.003.
10
Budget Strategy and Outlook 2017-18
Recent changes in global economic conditions, including the demand for various commodities and the resulting value of the A$, have impacted in various ways on some key industries (e.g. mining and tourism-related industries), complicating the transition in areas of regional Queensland.
Meanwhile, other factors including population ageing, increasing female participation rates and enhanced diversity and flexibility in employment arrangements, have seen significant changes in the composition of Queensland’s labour force over recent decades.
The female share of employment has increased from 38% in 1985-86 to 47% in 2015-16, while the share of all workers aged 55 years and over has almost doubled from 9.3% to 17.8% over the period. Meanwhile, part time employment has increased from 19% to 30% of total employment.
Given the dynamic nature of the global and national economies, and the likelihood that the Queensland economy and labour market will continue to evolve, the Government’s economic plan is aimed at driving ongoing growth in productivity, economic activity and employment.
In line with the economic plan, the Government’s existing policies and programs, as well as new initiatives in the 2017-18 Budget, will drive four key outcomes in facilitating improved employment opportunities for Queenslanders over the short, medium and longer term:
| 1. | Increasing the employment opportunities available to Queenslanders: |
| | • | | The employment opportunities available in the economy reflect the quantity and quality of labour required to produce goods and services. |
| | • | | Policies and programs that enhance productivity, drive business investment, facilitate infrastructure investment and remove constraints on business growth will help drive increased demand for labour and more job opportunities. |
| 2. | Enhancing the skills and capability of Queenslanders to access job opportunities: |
| | • | | The quality and quantity of labour available in the economy depends on the capacity and capability of people to effectively participate in the labour market. |
| | • | | Policies and initiatives that improve education, skills, health and welfare will result in increased and more effective workforce participation. |
| 3. | Improving the matching of workers with jobs: |
| | • | | It is important labour market stakeholders can interact efficiently and effectively so that businesses can access and identify appropriately skilled workers, and jobseekers can identify and access appropriate employment opportunities, conditions and incomes. |
| | • | | Policies and regulatory settings that facilitate the efficient operation of the labour market, including improving information flows and labour mobility, play a critical role in ensuring optimum economic outcomes by facilitating the matching of labour demand and supply. |
| 4. | Ensuring all Queenslanders, including those in disadvantaged cohorts and across regional Queensland, benefit from increased employment opportunities: |
| | • | | There are several labour market cohorts that have historically faced challenges including: youth; long-term unemployed; mature aged; people with a disability; Aboriginal and Torres Strait Islanders; and people from culturally and linguistically diverse backgrounds. |
| | • | | Policies and initiatives aimed at addressing the issues faced by these cohorts, as well as communities and jobseekers in areas of regional Queensland facing challenges, are needed to help ensure fair and equitable employment outcomes for all Queenslanders. |
11
Budget Strategy and Outlook 2017-18
| Figure 1.2 | Improving employment outcomes through the economic plan |
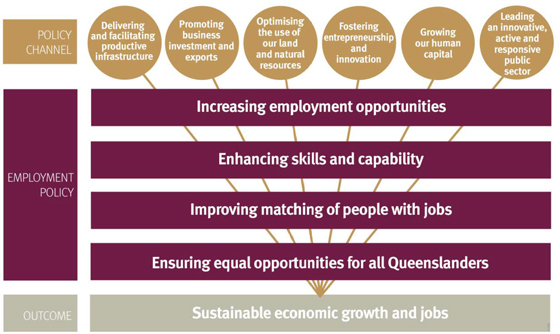
| 1.3 | Driving private sector growth and jobs |
In line with its commitment to drive enhanced economic and employment outcomes, the Queensland Government maintains a strong focus on facilitating productivity enhancing infrastructure and private sector investment, improving the competitiveness of the State’s industries, and building the capacity and employability of the State’s workforce.
This focus on private sector growth and employment is critical given the private sector comprises more than 80% of the State’s economy and supports around 84% of Queensland jobs. Of the 2.36 million Queenslanders employed in 2015-16, almost 2 million were in the private sector.
In addition, several key industries that are generally dominated by private sector businesses and investment (e.g. resources, manufacturing, tourism and construction) are key drivers of economic activity and jobs in many areas of regional Queensland.
Governments at all levels play a key role in shaping and supporting economic and employment outcomes in an economy by facilitating private sector investment, growth and jobs.
In particular, the Queensland Government has a crucial role in ensuring the State’s regulatory and policy frameworks create and sustain an environment conducive to business investment and confidence in several fundamental policy areas: reducing red tape; maintaining an efficient and competitive taxation regime; and maintaining a supportive and sustainable fiscal environment.
12
Budget Strategy and Outlook 2017-18
| Chart 1.2 | Queensland employment shares by private and public sectors, 2015-16 |
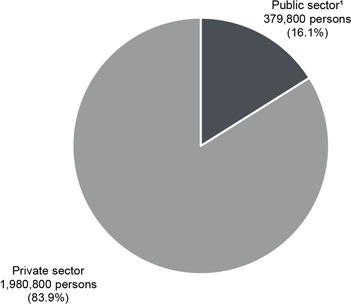
Note:
| 1. | Includes Commonwealth, State and local government employment. |
Sources: ABS 6202.0 and 6248.0.
Reducing red tape
| • | | The Government’s Better Regulation Taskforce continues to identify opportunities to reduce unnecessary and burdensome regulation, thereby cutting the burden and costs for business, including more than 400,000 small businesses, across the State. |
| • | | The ongoing work of the Taskforce will continue to foster more competitive and sustainable businesses and industries, incentivise private sector investment and, ultimately, lead to more employment and higher incomes. |
Maintaining an efficient and competitive taxation regime
| • | | The Government is committed to maintaining an efficient and competitive taxation regime, which provides a competitive advantage to the State’s businesses, moderates the tax burden for its citizens and is fundamental to job creation and sustainable development. |
| • | | Queenslanders continue to benefit from the Government maintaining its commitment not to introduce new taxes, fees or charges. |
Maintaining a supportive and sustainable fiscal environment
| • | | Responsible fiscal management is the backbone of the Government’s economic agenda, providing business with the confidence and certainty to invest and employ. |
| • | | The Government’s adherence to a set of key fiscal principles, including its commitment to focus on reducing the General Government debt burden, helps provide the fiscal capacity to help the community when needed most, for example, when responding to natural disasters. |
13
Budget Strategy and Outlook 2017-18
In addition to ensuring the State’s broader economic and fiscal environment is conducive to growth and investment, the Government continues to implement a range of more specific and targeted initiatives to facilitate economic growth and jobs in the short, medium and longer term.
Several key Budget initiatives will create a substantial and immediate increase in economic activity and jobs across the State, including the $77.5 million boost to enhance the highly successful Back to Work Regional Employment Package and extend key elements to South East Queensland. The 2017-18 Budget also provides additional funding of $200 million over two years for the Works for Queensland program, supporting local governments outside South East Queensland that are facing unemployment issues to undertake job-creating maintenance and minor infrastructure works. This supplements the $200 million provided in the MYFER, bringing the Palaszczuk Government’s total Works for Queensland commitment to $400 million.
Other initiatives, including the $200 million Jobs and Regional Growth Package and Market Led Proposals initiative, will support significant employment opportunities across the State during the construction phase of projects and enhance the productive capacity of the economy.
These measures, along with key elements of the Advance Queensland program and other existing initiatives, will support ongoing jobs over the medium to longer term by providing economic infrastructure, increasing private sector investment, enhancing innovation and promoting a more diversified economy.
The 2017-18 Budget includes a range of measures which will boost productivity and support ongoing longer-term employment including significant infrastructure projects in both South East Queensland and regional Queensland as part of a $42.75 billion four year capital works program.
Funding in the Budget for key infrastructure projects in 2017-18 includes:
| • | | $3.885 billion for transport and roads throughout Queensland |
| • | | $129 million as part of the Queensland Government’s $5.409 billion commitment to deliver Cross River Rail |
| • | | $604.6 million for the construction and refurbishment of school educational facilities, early childhood education and care services and training assets |
| • | | $916.1 million for health, including health facilities and infrastructure across all regions |
| • | | $2.063 billion to deliver cost effective, safe, secure and reliable energy and water supply across the State. |
The Budget also features a range of initiatives to promote ongoing growth in traditional and emerging industries, including in regional Queensland. These includes significant funding to: implement the Trade and Investment Strategy, 2017-2022; support the ongoing work of Tourism and Events Queensland (TEQ); enhance Great Barrier Reef water quality; further develop priority industry roadmaps; promote further exploration and mining activities in the resources sector; and leverage greater value from the State’s national parks.
The continued strong focus on health, education, justice and public safety, as well as a significant level of investment to improve social and Indigenous housing, will help build the capacity and productivity of the State’s workforce, ensuring businesses can draw on a skilled, capable labour supply and workers can capitalise on job opportunities as the private sector invests and grows.
14
Budget Strategy and Outlook 2017-18
In addition, Operation Queensland Recovery is helping rebuild vital economic and social infrastructure in communities impacted by recent natural disasters, maintaining the productive capacity of these vital regional economies.
By continuing to support the recovery, transition and longer term growth of businesses and industries across the State, the 2017-18 Budget complements the substantial reforms and innovative initiatives already implemented by the Government to support ongoing economic growth and improved employment outcomes throughout the State.
| Box 1.1 | Helping Queenslanders back to work |
A critical focus of the Government’s employment policy is to ensure all Queenslanders have the opportunity to access and benefit from employment opportunities.
To help support disadvantaged jobseekers and build the confidence of businesses to take on more staff, particularly in regional Queensland, the Government has implemented two successful flagship employment initiatives: the $240 million Skilling Queenslanders for Work (SQW) and the $177.5 million Back to Work programs. Between them, the two programs have already helped a significant number of Queenslanders, particularly in regional areas, into employment.
Skilling Queenslanders for Work
The $240 million SQW initiative is one of the Government’s key programs aimed at assisting under-utilised or under-employed people, with the suite of programs expected to help support up to 32,000 Queenslanders into work.
SQW provides training and skills development opportunities to people marginally attached to the labour market as well as young people, Aboriginal and Torres Strait Islanders, people with a disability, mature-aged jobseekers, and jobseekers from culturally and linguistically diverse backgrounds. The initiative is supported by a state wide regional network forming partnerships with community-based organisations and local employers to determine local skills and entry-level industry and labour needs.
SQW has assisted more than 18,000 disadvantaged Queenslanders, with more than 9,500 participants employed, undertaking further training/study or both following participation in the programs.
| Chart 1.3 | Skilling Queenslanders for Work – Outcomes by Region |
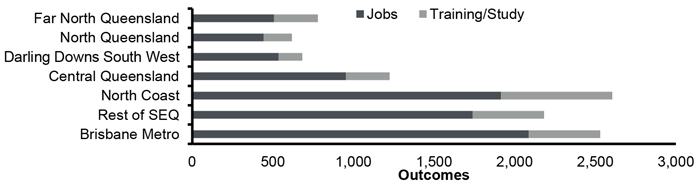
In 2017-18, a further $60 million will be available under SQW to provide skills, training and jobs to around 8,000 disadvantaged Queenslanders.
15
Budget Strategy and Outlook 2017-18
Back to Work
The Queensland Government held a series of employment forums throughout the State over the last two years to hear first-hand from jobseekers, employers and industry stakeholders how the Government can help get unemployed Queenslanders back to work.
The forums highlighted that the Government could play a key role in building business confidence to take on staff and to facilitate engagement between local employers and jobseekers, particularly in regions facing challenges and with transitioning economies.
The Back to Work Regional Employment Package, announced as part of the 2016-17 Budget, committed $100 million to support regional businesses to gain the confidence to employ jobseekers. More specifically, the program focuses on those areas of the State facing high unemployment and/or specific cohorts facing employment challenges. The temporary stimulus provided by the payments may help in sustaining labour demand.
The initiative included $80 million for support payments of up to $15,000 for employers who take on an unemployed regional jobseeker, including long-term unemployed. In addition, the Government established 16 Back to Work Teams throughout regional Queensland to help regional communities generate innovative solutions to local employment challenges.
A $20,000 Youth Boost payment was subsequently introduced and is available to employers until 31 October 2017 if they hire an unemployed young jobseeker (15-24 years) in regional Queensland.
As at 31 May 2017, around 1,000 regional employers have successfully applied for a Back to Work employer support payment and more than 1,372 employers have successfully applied for a Youth Boost payment to provide jobs to regional jobseekers.
As outlined in Chart 1.4 below, Back to Work has resulted in 4,334 jobseekers being employed throughout regional Queensland.
| Chart 1.4 | Back to Work – Jobs supported by region |
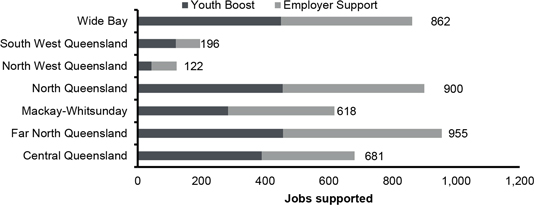
Building on the success of the program, the 2017-18 Budget has committed a further $77.5 million to extend and enhance the Back to Work Program, including an additional $50 million for regional Queensland and $27.5 million to broaden the program to provide support for long-term unemployed and young unemployed persons in South East Queensland.
16
Budget Strategy and Outlook 2017-18
| 1.4 | Supporting growth and jobs through the economic plan |
Since January 2015, the Queensland Government has announced a range of significant new initiatives to grow the economy and support jobs. A significant amount of the funding related to these existing initiatives will continue to flow through to the economy in 2017-18 and subsequent years, thereby supporting ongoing economic activity and employment throughout the State.
Building on this substantial pipeline of existing programs and infrastructure projects, the 2017-18 Budget includes a range of significant new initiatives and increased funding for existing programs that will generate economic activity and jobs throughout the State. The Budget also includes substantial additional investment in productivity enhancing infrastructure and capital works, including several major new projects in regional Queensland.
As a result, the economic activity facilitated through the Government’s existing commitments and 2017-18 Budget measures is estimated to directly support around 40,000 jobs in 2017-18. These jobs are likely to be predominantly in the private sector, but some Government initiatives and capital works will also likely support some local government employment related to specific projects in regional Queensland.
These new and existing initiatives will continue to drive economic growth and, most importantly, create employment opportunities for Queenslanders.
The following sections of this chapter outline how the Government’s existing and new 2017-18 Budget initiatives will contribute to ongoing growth and increased employment opportunities in line with each of the key policy channels identified in the Government’s economic plan.
| 1.4.1 | Delivering and facilitating productive infrastructure |
Delivering and facilitating key infrastructure directly supports construction jobs in the short term. However, the key role of infrastructure is to lift the productive capacity of the economy over the medium to longer term by facilitating the more efficient production and distribution of goods and services, as well as enhancing labour mobility.
By improving the productivity and competitiveness of the State’s businesses and exporters, infrastructure enables resources to be utilised more efficiently and invested more effectively to help stimulate sustainable business activity and growth, thereby supporting ongoing jobs.
Infrastructure provision, particularly transport infrastructure, can also enhance the supply of labour by increasing labour mobility, with the cost and length of the daily commute impacting on people’s capacity to access employment, work in different places and at different times.
The Government has made the provision and facilitation of key infrastructure a priority through development of the State Infrastructure Plan (SIP), which sets out a new strategic direction for the planning, investment and delivery of the State’s infrastructure.
17
Budget Strategy and Outlook 2017-18
This includes a strong focus on infrastructure in regional areas through initiatives such as:
| • | | $130 million Jobs and Regional Growth Fund to facilitate private sector investment and multi-user infrastructure |
| • | | $375 million Building our Regions program to fund local government projects |
| • | | $400 million Works for Queensland Program (including an additional $200 million in this Budget) to support employment through the maintenance and enhancement of infrastructure and facilities in regional Queensland. |
The Government has committed to fully fund and deliver the $5.409 billion Cross River Rail project. Cross River Rail, Queensland’s highest priority transport infrastructure project, will provide additional rail capacity to Brisbane’s CBD and provide significant benefits in terms of reduced congestion, improved network reliability and increased accessibility.
To further promote growth and jobs, key industries and communities in regional Queensland will also be supported by major infrastructure projects announced in the Budget, including $604.6 million for the construction and refurbishment of educational facilities and the $386 million Powering North Queensland Plan (including $136 million Burdekin Falls Dam Safety Improvement Program, $150 million for the development of strategic transmission infrastructure to support a clean energy hub and $100 million for Burdekin Falls Dam hydro-electric power station).
The 2017-18 Budget also includes the $225 million Townsville Water Security initiative, $176 million Cairns Convention Centre Expansion, and funding towards key projects identified as part of the Townsville City Deal, including the State’s contribution to the $250 million North Queensland Stadium.
In addition, Operation Queensland Recovery will help re-build and maintain the productive capacity of regions impacted by recent natural disasters.
A key initiative in the 2017-18 Budget is the $1.8 billion Queensland Housing Strategy over 10 years, to help boost the supply of social and affordable housing in response to population growth and housing affordability pressures.
The program will boost the supply of social and affordable housing to respond to population growth and housing affordability pressures, leverage partnerships with private industry and local governments, and enable reforms to the housing services and support system.
| 1.4.2 | Promoting business investment and exports |
In addition to facilitating the provision of productivity enhancing infrastructure, the Queensland Government continues to ensure the State’s taxation and regulatory frameworks support business investment, as well as implementing specific policies and initiatives that attract and encourage the growth and development of businesses, industries and trade opportunities.
Over the past decade, private business investment, such as investment in non-dwelling construction and machinery and equipment averaged nearly $45 billion per annum, up from $17 billion in the previous decade in real terms.
This investment supported growth of more than 40% in Queensland export volumes over the decade to 2015-16, with one in every five dollars spent on Queensland produced goods and services coming from international or interstate buyers of our exports. Importantly, many of the State’s export-orientated industries also contribute significantly to regional economies.
18
Budget Strategy and Outlook 2017-18
Given the State’s proximity to the rapidly growing Asia-Pacific region, further growth in these key trading partners and the increasing prosperity in developing countries such as China and India will continue to provide trade opportunities through ongoing demand for a range of products and services.
China is now the biggest export destination for Queensland merchandise exports and the largest source of international tourists to Queensland. In the decade to 2016, merchandise exports to China have grown nearly fourfold and spending by Chinese visitors has increased by a factor of seven. Over the same period, merchandise exports to India have more than doubled, while visitor spending from Asian countries other than Japan and China has increased by 90%.
| Chart 1.5 | Merchandise exports by destination |
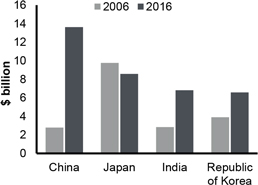
| Chart 1.6 | Visitor expenditure by Country |
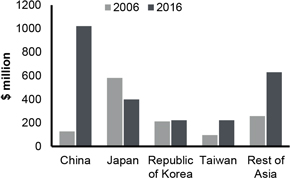
Meanwhile, the increasing mobility of innovative high value firms and workers reinforces the need to maintain an environment that attracts and retains business investment, unlocking new markets, facilitating investment, and attracting and creating high value jobs.
The Queensland Government has continued to update and review existing regulatory settings where circumstances change, including significant reforms in the personalised transport market and changes to trading hours which came into effect on 1 December 2016.
The Government has also implemented several initiatives directly aimed at attracting, fostering and facilitating business investment and growth, particularly in regions, including: $130 million Jobs and Regional Growth Fund to facilitate private sector and multi-user infrastructure; $40 million Advance Queensland Industry Attraction Fund to attract businesses to relocate or establish new projects in the State; and $20 million Made in Queensland program to increase the competitiveness of businesses and employment opportunities in the manufacturing industry.
The Government is also supporting a range of large projects that require significant coordination between stakeholders and leverage substantial investment from the private sector, including through Market Led Proposals such as the $512 million enhancement to the Logan Motorway.
Other Market Led Proposals announced include an international Cruise Terminal at Luggage Point and an Aquarium and Maritime Museum at South Bank. Both these projects should support growth in tourism, one of Queensland’s major export industries. International and domestic tourists spent more than $27 billion in Queensland in 2016-17 and tourism directly employs more than 135,000 Queenslanders.
19
Budget Strategy and Outlook 2017-18
Other initiatives already implemented to support growth in tourism include the Connecting with Asia Strategy and the Attracting Aviation Investment Fund, which have already attracted new services and extra flights from several destinations to the Gold Coast, Cairns and Brisbane. Meanwhile, the Government’s significant commitment, including an additional $47.1 million in this Budget to revitalise Tourism and Events Queensland to promote Queensland as a tourism destination will play a vital role in continuing to drive tourism growth across the State.
The 2017-18 Budget reinforces the Government’s commitment to supporting business investment and trade in a range of other areas. The Budget allocates $175 million over five years to deliver the Great Barrier Reef Water Quality Program as part of the Government’s ongoing commitment to protect the Great Barrier Reef, one of the State’s great natural tourism assets.
To continue to facilitate economic transition and unlock new opportunities for business and employment growth, the Budget also allocates a further $15 million to develop priority industry roadmaps and action plans.
| Box 1.2 | Supporting our regions in transition |
Regional Queensland, with its abundant natural, agricultural and mineral resources, is a key contributor to the performance of both the State and national economies. Indeed, almost 40% of the State’s economic activity and 30% of jobs are in areas outside South East Queensland.
With Queensland having the most decentralised population in mainland Australia, the State comprises a range of unique regional economies with different industry structures, climate, demography and competitive advantages. As such, regions vary in the extent to which they are sensitive to global factors and cyclical or structural changes impacting on key industries.
Therefore, while some regional areas are doing well, others are facing some challenges, particularly those transitioning from traditional mining and agriculture-based economies to broader based drivers of growth.
The importance of supporting regional economies in transition was highlighted recently in the Commonwealth Productivity Commission’s (PC) Initial Report on Transitioning Regional Economies, released in April 2017.
The report notes that many factors influence the way regional communities respond to changing economic circumstances, with the most appropriate policy responses depending on the adaptive capacity of individual regions and the nature of changes they face. The study also highlighted that policies should be aligned with a region’s strengths and supported by targeted investment to develop the capability of the community to deal with transition and adaptation.
Consistent with the PC’s findings, the Queensland Government’s existing and 2017-18 Budget initiatives include a range of policies and programs providing support to, and facilitating economic activity in regions impacted significantly by the recent slowdown in mining related activities (such as the North West, Outback and Townsville) as well as regions facing challenges due to ongoing drought or in the wake of recent natural disasters.
20
Budget Strategy and Outlook 2017-18
These include initiatives aimed at:
| • | | Facilitating investment and leveraging regional economic strengths and opportunities – e.g. $200 million Jobs and Regional Growth Package; $375 million Building Our Regions program; the recently launched Advancing Tourism 2016-2020 Strategy to boost tourism exports and attract job-creating investment; $33.5 million Connecting with Asia Strategy to help tap into new opportunities provided by the growing middle class in Asia; and $42.3 million for the Natural Resources Investment Program included in this Budget. |
| • | | Increasing regional employment opportunities and improving the skills and capability of regional jobseekers – e.g. $177.5 million Back to Work Program; and $240 million Skilling Queenslanders for Work Program. |
| • | | Building the resilience and adaptive capacity of regional communities and economies more broadly – e.g. $1.1 billion allocated in this Budget to rebuild critical infrastructure in regions impacted by STC Debbie and related flooding; tackling the impacts of ongoing drought through the Drought Assistance Package; and $39 million over four years to deliver initiatives to support the North West Minerals Province, including $27.1 million for the Strategic Resources Exploration Program. |
In total, around $4.811 billion of the Government’s $10.171 billion capital works program in 2017-18 is dedicated to delivering productive and essential infrastructure in regional Queensland. The capital works program and the implementation of other key existing and 2017-18 Budget initiatives will directly support around 22,000 jobs, predominantly in the private sector, in regional Queensland in 2017-18.
| Chart 1.7 | Jobs supported by Government initiatives in 2017-18, by region |
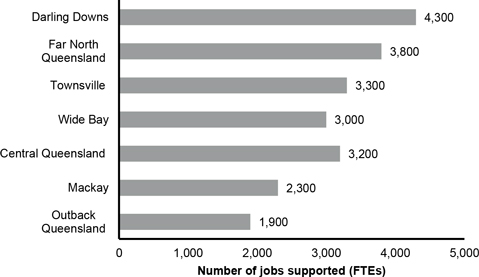
21
Budget Strategy and Outlook 2017-18
| 1.4.3 | Optimising the use of our land and natural resources |
Queensland has significant endowments of natural resources, including minerals, land, water, reefs and its unique natural landscape and heritage.
Importantly, key industries relying directly on the use of Queensland’s land and natural resources are comparatively more important to regional Queensland, with mining, agriculture, forestry and fishing collectively accounting for only 2% of direct total employment in South East Queensland but nearly 12% in the rest of the State.
In addition, the Queensland tourism industry is linked closely to the State’s natural assets (e.g. Great Barrier Reef, national parks, beaches and waterways and outback), many of which are located in regional areas.
Major policy areas in which Queensland Government initiatives enhance the economic benefits and employment derived from the use of land and natural resources include land use planning frameworks, environmental regulation and red tape reduction, as well as initiatives relevant to the specific industries reliant on land and natural resources as key inputs to production.
Land use planning initiatives undertaken by the Queensland Government include the introduction of the new Planning Act 2016, which will provide the foundation for Australia’s best planning system and deliver a transparent and efficient system that contributes to investment and jobs. The Government has also undertaken a review of the South East Queensland (SEQ) Regional Plan 2009-2031 and developed a new statutory regional plan for SEQ, ShapingSEQ, to provide a framework for managing growth over the next 25 years and a vision for the next 50 years in the south-east corner.
Other key initiatives already implemented are designed to enhance environmental regulation and help address the impacts of climate change, including the Reef 2050 Long-term Sustainability Plan, a three year investment in the development of a Queensland Climate Adaptation Strategy (Q-CAS), and development of an effective transition strategy towards a low carbon future.
A number of other significant reforms will help ensure the resources sector continues to be a key contributor to the economy, including a new Tenure Framework, modernising Queensland’s mining and resources regulatory framework and development of a Gas Action Plan, as well as the key resources exploration and investment initiative, the Future Resources Program.
The Government has recently announced a Royalties Payment Scheme – a new policy approach for major resource projects for the future development of the Galilee and Surat Coal Basins, Gas Basins and the North West Minerals Province.
For major projects that have completed comprehensive environmental impact assessments at the State and Commonwealth level, the scheme provides for negotiation of agreements with proponents of projects with significant regional employment, royalties and economic opportunity benefits for medium-term deferral of royalty payments.
These agreements are to be subject to security arrangements, royalties being repaid in full including interest costs at the State bond rate. Other key conditions include the provision of third party access to infrastructure or other acceptable economic infrastructure to the State.
22
Budget Strategy and Outlook 2017-18
The Government has also provided considerable support to agricultural producers through: the Drought Assistance Package to assist farmers affected by financial stress and drought; implementing recommendations from the Biosecurity Capability Review to restore Queensland’s biosecurity capability to world’s best practice; and provision of extra funding to combat Panama disease and the spread of yellow crazy ants.
The 2017-18 Budget features a range of further initiatives aimed at optimising the use of the State’s land and natural resources, including promoting exploration and mining activities through the $27.1 million Strategic Resources Exploration Program. Key elements of this initiative also form part of the Government’s overall package of $39 million over four years to deliver initiatives to support the North West Minerals Province, including implementation of the Queensland Government’s Strategic Blueprint aimed at facilitating a strong and prosperous future for the region.
In order to protect the State’s natural assets to ensure they continue to create wealth for current and future generations of Queenslanders, this Budget also allocates $175 million to improve water quality in the Great Barrier Reef, safeguard and respond to biosecurity related risks, and develop a Climate Change Strategy to assist Queensland to meet its national and international obligations related to CO2 emissions targets.
The Government’s comprehensive Great Barrier Reef Water Quality Program, totalling $175 million over five years, is in addition to the $100 million provided in 2015-16 to address the recommendations arising from the Great Barrier Reef Water Science Taskforce.
The Budget also includes $40 million to revitalise and leverage value from our national parks through increased tourism and other activities.
| 1.4.4 | Fostering entrepreneurship and innovation |
Entrepreneurship and innovation are key drivers of economic growth, increased productivity and improvements in Queenslanders’ living standards and wellbeing.
Innovation relates to the development, adoption and application of new ideas to improve the quality and quantity of production of goods and services while entrepreneurs play a special role in the diffusion of innovation and bringing new ideas and processes to market. Therefore, innovation and entrepreneurial endeavours create additional employment opportunities and enhance the skills and knowledge of the workforce.
A key driver of innovation is increased competition. Therefore, the Government’s ongoing focus on ensuring the State’s regulatory and policy frameworks create and sustain an environment conducive to business investment and confidence will also help support the ongoing development, adoption and diffusion of innovative approaches and technology throughout the State’s traditional and new industries.
The Queensland Government has also made a significant commitment to driving innovation and entrepreneurship through the Advance Queensland suite of programs, based on international evidence of ‘what works’ to create the knowledge-based jobs of the future.
23
Budget Strategy and Outlook 2017-18
This includes commercialisation and co-investment programs, such as the Business Development Fund (BDF) that assist businesses in turning new ideas into viable businesses, connecting them with international and interstate expertise, and helping raise the State’s profile as an investment destination.
To date the BDF has invested over $10.9 million in 10 innovative Queensland based businesses. These businesses are at the forefront of commercialising cutting edge research or innovative ideas, products or services.
The Government has also developed, or is developing in conjunction with industry stakeholders, strategic 10-year industry roadmaps for a number of future focused and innovation-intensive priority industries, including Biofutures and Advanced Manufacturing, to ensure these industries have a bright future in Queensland.
The 2017-18 Budget includes additional funding of $15 million over four years to further develop the priority industry roadmaps and action plans in order to support emerging and priority sectors to maximise their innovation potential. This measure builds on the existing Advance Queensland investment in innovation, skills, education, business development and a start-up culture, delivering knowledge-based jobs now and into the future.
This takes the Palaszczuk Government’s total Advance Queensland commitment to $420 million, positioning Queensland as the place to turn great ideas into reality. Meanwhile, $10 million is being redirected into the successful Ignite Ideas Fund, with almost $16.5 million invested to date in 118 innovative small firms.
Through key elements of the Advance Queensland program and other new initiatives specifically targeting teaching and learning, the Government is also ensuring the State’s future workforce is ‘innovation ready’, such as building the skills, creativity and technical ability of Queenslanders to drive innovation in the future, as well as helping develop, attract and retain world-class scientific talent.
| 1.4.5 | Growing our human capital |
Human capital represents the skills, knowledge and capacity embedded in Queenslanders. A more educated, skilled, flexible and healthier workforce, such as a greater quality and quantity of human capital will ensure the State is well positioned to realise improvements in productivity and competitiveness, driving economic growth and higher real incomes, resulting in improved living standards for Queensland families and communities.
A more skilled and flexible workforce is also likely to see people remain engaged in the labour market for longer and transition better into new forms of employment when cyclical or structural changes alter the mix of skills and knowledge required across the economy.
The Queensland Government has played a significant role in helping Queenslanders back into work through initiatives such as the Skilling Queenslanders for Work and Back to Work programs. In particular, these programs support persons from cohorts that often face barriers to entering the labour force, including youth, long-term unemployed and other disadvantaged groups, building their skills and incentivising employers to employ these jobseekers.
24
Budget Strategy and Outlook 2017-18
In addition, initiatives such as the Apprentice and Trainee Payroll Tax Rebate and Queensland Government Building and Construction Training Policy provide incentives for businesses to take on workers and help build the stock of qualified and skilled Queenslanders for the future.
In the longer term, ongoing development of a more skilled workforce in Queensland will be supported through Jobs Queensland, an independent statutory authority to provide advice to Government on skills demand and long-term workforce planning in Queensland. Other measures implemented to strengthen the Vocational Education and Training (VET) sector, as outlined in the 2016-17 VET Investment Plan and Rescuing TAFE initiative, will also drive enhanced vocational skills and training in the longer term.
To ensure Queenslanders have the health, education, skills and capabilities necessary to enter, participate effectively and remain in the labour market, the Government continues to commit significant funding and introduce a range of new initiatives to ensure continuous improvement in Queensland’s world class health and education systems.
Key measures in the 2017-18 Budget to help promote education and training, thereby enhancing the productivity and skills of Queensland’s current and future workforce, include:
| • | | $500 million Building Future Schools Fund – to address enrolment growth pressures in state schools |
| • | | $250 million Six Full Cohorts 2020 Ready – building the essential education infrastructure needed to cater for the 17,000 additional students expected in 2020 |
| • | | $200 million in additional funding to build fit for purpose learning environments that support educational outcomes |
| • | | $150 million Advancing Teaching and Learning – for investment in teacher attraction, quality and leadership |
| • | | $10 million Regional Skills Adjustment Strategy – additional funding over two years to support unemployed individuals to develop employability skills for jobs in demand, jobs pathway planning and to provide access to training at TAFE Queensland |
| • | | $1.2 million Enhanced Youth Employment Program – additional funding over three years to secure sustainable employment for Aboriginal and Torres Strait Islander youth. |
The 2017-18 Budget also includes a range of other significant investments to help improve health outcomes and build workforce flexibility and resilience including:
| • | | $208.4 million in additional funding over four years for essential upgrades to health facilities and supporting infrastructure in rural and regional areas across the State |
| • | | $131.8 million over four years as an initial investment to enhance public hospital capacity and services in South East Queensland, including the expansion of the emergency department at Caboolture Hospital and detailed planning and preparatory works for proposed redevelopments at Logan, Caboolture and Ipswich hospitals |
| • | | $68.9 million in additional funding over four years to establish a new Adolescent Extended Treatment Facility at The Prince Charles Hospital, two new adolescent Step Up Step Down units in Brisbane, and refurbishment of two adolescent Day Program spaces at Logan and the Gold Coast. |
25
Budget Strategy and Outlook 2017-18
| 1.4.6 | Leading an innovative, active and responsive public sector |
Historically, the State Government has accounted for around 13% of total economic activity in Queensland and a similar proportion of the State’s employment. In addition to being a large employer itself, the Queensland Government indirectly supports ongoing private sector business activity and jobs through both the procurement and delivery of significant goods and services.
Therefore, the Queensland Government is committed to leading the way in terms of driving productivity and economic growth through responsible and sustainable fiscal management, as well as innovative approaches to improving the efficiency and effectiveness of procurement and delivery of essential services.
The Queensland Government has already introduced a number of major innovative reforms to streamline, modernise and improve the way the government delivers and facilitates investment in infrastructure and delivers its services.
These include the Market Led Proposals initiative to facilitate a range of large, complex projects and leverage substantial investment from the private sector, and the Social Benefit Bonds initiative, which has resulted in new and innovative approaches to tackling complex social and economic challenges, including initial pilot programs being negotiated and implemented in the areas of reoffending, reducing Indigenous disadvantage and homelessness.
The Government’s proactive response to address issues raised by business and the community has included the substantial progress made in implementing the One-Stop Shop program, making it simpler and easier for people to access the information and government services they need, with around 250 new and/or improved services now available online.
In the 2017-18 Budget, the Government has provided increased funding of $31 million over two years to continue the One-Stop Shop program which is focused on delivering improvements to frontline services, encouraging innovation and better services for citizens and businesses.
Increased funding of up to $20 million in 2017-18 is also provided for the continuation of the Drought Relief Assistance Scheme (as part of a total Drought Assistance Package of up to $34.6 million in 2017-18). This funding provides freight subsidies and emergency water infrastructure rebates to support producers and communities affected by drought across the State.
The Government is also providing increased funding of $23.3 million over four years to enhance the delivery of environmental regulatory services, to target areas of environmental risk and improve engagement with industry and the community.
Another key focus of the 2017-18 Budget is to protect vulnerable Queenslanders and enhance social cohesion and safety in communities through a range of measures, including:
| • | | $69.5 million to continue the specialist domestic and family violence court at Southport and roll out courts in Beenleigh and Townsville, including circuit courts to Mount Isa and Palm Island, as part of the Government’s ongoing implementation of its response to Not Now, Not Ever report |
| • | | $18 million over four years to tackle the harmful use and effects of crystal methamphetamine (Ice) in Queensland, with measures that increase awareness, support families and better equip frontline service providers |
26
Budget Strategy and Outlook 2017-18
| • | | $141.8 million over four years to further strengthen Queensland’s child protection system, taking total new funding for child safety to $200 million since the 2016-17 Budget |
| • | | an additional $46.7 million towards the Westgate Counter-Terrorism and Safety Training Centre. |
The 2017-18 Budget also sees a continued commitment by the Queensland Government to institutional and other reforms to further enhance the integrity and efficiency of the State’s electoral processes. As such, this Budget provides additional funding to the Electoral Commission to invest in a new Electoral Management system.
The Government’s innovative, proactive and responsive approach to enhance safety, security and social cohesion will directly improve the quality of life enjoyed by all Queenslanders.
In addition, combined with the initiatives in each of the other key policy channels outlined in this chapter, these measures will contribute to the more efficient and productive utilisation of the State’s natural, fiscal and human resources, leading to increased productivity, growth and jobs.
Therefore, in line with the economic plan, the 2017-18 State Budget will deliver opportunities and improved employment outcomes for Queenslanders by supporting the recovery, transition and growth of businesses and communities across the State.
27
Budget Strategy and Outlook 2017-18
| 2 | Economic performance and outlook |
Features
| • | | Following an unprecedented resources investment boom, the Queensland economy continues its transition to more broad-based growth, with STC Debbie also expected to have a considerable impact. |
| • | | Reflecting these trends, overall growth in the Queensland economy is forecast to strengthen across the forward estimates, from 2.4% in 2015-16, to 2 3⁄4% in both 2016-17 and 2017-18. |
| • | | GSP growth is forecast to strengthen further to 3% in 2018-19, with an anticipated recovery in business investment and a solid contribution from public sector capital spending supporting stronger domestic activity, as LNG exports plateau. |
| • | | Based on forecasts by Australian Treasury, this is stronger than expected Gross Domestic Product (GDP) growth nationally of 1 3⁄4% in 2016-17 and in line with it in 2017-18 and 2018-19. |
| • | | As growth becomes more broad based across the major components of domestic demand, growth in Queensland is expected to remain in line with national growth in the projection years, at 3%. |
| • | | If the improvement in commodity prices is sustained and projects such as Adani’s Carmichael coal mine proceed, then investment in resources and exports will strengthen, potentially boosting Queensland economic growth rates and State revenues. |
| • | | Queensland growth forecasts for 2016-17 and 2017-18 would have been higher, but for the impact of STC Debbie, which is estimated to have detracted around $2 billion or 3⁄4 percentage point from growth across these two years. |
| • | | Major impacts from STC Debbie include the loss of around 10 million tonnes of coal exports due to damaged rail infrastructure, around $300 million of losses to sugar exports and a considerable hit to tourism in the Whitsundays region. |
| • | | In recent years, strong growth in the housing sector has supported construction employment during the downturn in mining and LNG investment. This growth has been primarily driven by a surge in the construction of units and apartments in Inner City Brisbane, Brisbane South and Gold Coast. |
| • | | While the substantial amount of construction work still in the pipeline will see new dwelling construction activity reach a cyclical peak in 2016-17, the recent large fall in building approvals suggests new dwelling construction will fall in 2017-18 and 2018-19. |
| • | | Subdued real wages growth, together with population growth in line with national estimates and the easing in the dwelling sector, is expected to result in modest household consumption growth. |
28
Budget Strategy and Outlook 2017-18
| • | | Business investment continues to adjust in 2016-17 from the record levels experienced during the LNG construction boom. With construction of the third and final LNG project completed in late 2016, engineering construction has stabilised. |
| • | | Despite bright spots in the tourism, education and CSG sectors, subdued growth in overall domestic activity suggests the immediate incentive to invest remains muted. Reflecting these trends – and consistent with the national growth profile – business investment in Queensland is expected to be broadly unchanged in 2017-18, before returning to moderate growth from 2018-19 onward. |
| • | | Overseas exports are expected to grow solidly over the forecast period, between 3% and 4% per annum. In addition to the long expected ramp up in LNG exports, coal exports are expected to recover from the fall in 2016-17 induced by STC Debbie. |
| • | | Overall export growth is also expected to be supported by growing services exports such as tourism and education, driven by a competitive exchange rate and growing demand from Asian markets. |
| • | | Following employment growth of 0.7% through the year to June quarter 2016, measured employment has been quite volatile during the current financial year, easing early in the year, but picking up since late 2016. Reflecting this recent momentum, employment in Queensland is forecast to be 1 1⁄4% higher over the year to June quarter 2017. |
| • | | Better prospects for mining, construction, agriculture and tourism operators have seen a welcome improvement in regional labour market conditions. However, the impacts of recent metal mine closures and cutbacks by processors are still being felt, particularly in Townsville and the north west of Queensland-Outback. |
| • | | Consistent with the improvement in overall domestic activity, employment growth is also expected to strengthen to 1 1⁄2% in the year to June quarter 2019. After a period of stabilisation, these trends are also expected to see the unemployment rate decline to 6% by this time. |
29
Budget Strategy and Outlook 2017-18
| 2.1.1 | International conditions |
Queensland’s major trading partners as a whole are expected to grow 3 3⁄4% in 2017, similar to the rate of growth in the previous year. Growth is forecast to remain broadly at that rate over the forecast period (see Table 2.1). A continuing moderation of China’s economic growth outlook is expected to be balanced by more positive economic prospects for India, Korea and, to a lesser degree, the Euro Zone.
| Table 2.1 | Queensland’s major trading partners’ economic outlook1 |
| | | | | | | | | | | | | | | | | | | | | | | | |
| | | Actual | | | Forecasts | |
| | | 2016 | | | 2017 | | | 2018 | | | 2019 | | | 2020 | | | 2021 | |
Major trading partners | | | 3.8 | | | | 3 3⁄4 | | | | 3 3⁄4 | | | | 3 3⁄4 | | | | 3 1⁄2 | | | | 3 3⁄4 | |
China | | | 6.7 | | | | 6 1⁄2 | | | | 6 1⁄4 | | | | 6 | | | | 6 | | | | 5 3⁄4 | |
Japan | | | 1.0 | | | | 1 1⁄4 | | | | 1⁄2 | | | | 3⁄4 | | | | 1⁄4 | | | | 3⁄4 | |
Korea | | | 2.8 | | | | 2 3⁄4 | | | | 2 3⁄4 | | | | 3 | | | | 3 | | | | 3 | |
India2 | | | 6.8 | | | | 7 1⁄4 | | | | 7 3⁄4 | | | | 7 3⁄4 | | | | 8 | | | | 8 | |
Other Asia3 | | | 3.4 | | | | 3 1⁄2 | | | | 3 1⁄2 | | | | 3 3⁄4 | | | | 3 3⁄4 | | | | 3 3⁄4 | |
Europe | | | 1.8 | | | | 1 3⁄4 | | | | 1 1⁄2 | | | | 1 1⁄2 | | | | 1 1⁄2 | | | | 1 1⁄2 | |
UK | | | 1.8 | | | | 2 | | | | 1 1⁄2 | | | | 1 1⁄2 | | | | 2 | | | | 2 | |
US | | | 1.6 | | | | 2 1⁄4 | | | | 2 1⁄2 | | | | 2 | | | | 1 3⁄4 | | | | 1 3⁄4 | |
Notes:
| 1. | Annual percentage change. Decimal point figures indicate an actual outcome. |
| 2. | India’s growth profile is based on an April to March fiscal year. ‘2016’ refers to 2016-17 fiscal year. |
Sources: International Monetary Fund World Economic Outlook, April 2017 and Queensland Treasury.
The US economy grew 1.6% in 2016, lower than the 2.6% recorded in 2015 and 2.2% growth predicted by the International Monetary Fund (IMF) in July 2016. While consumers in the US were more inclined to spend as their job prospects improved, business investment recorded its first decline since 2009, while growth in residential investment slowed in 2016. A stronger US$ also saw exports largely flat in both 2015 and 2016.
US economic growth is expected by most analysts to strengthen to around 2.2% - 2.4% in 2017 and 2.3% - 2.5% in 2018. This outlook is based on anticipation of ongoing improvement in labour market conditions, which should boost household income and confidence, while a rebound in corporate profits should see business investment return to growth. Nevertheless, some of this optimism is based on the implementation of President Trump’s election commitments of an increase in government spending and corporate tax cuts.
Euro Zone monetary policy remains extremely accommodative, supporting economic recovery. Euro Zone economic growth was 1.8% in 2016, following a 2.0% rise in 2015. The unemployment rates across almost all member countries of the Euro Zone fell over the year to March 2017.
30
Budget Strategy and Outlook 2017-18
The European Central Bank (ECB) has forecast the region’s GDP will grow at 1.8% in 2017, before moderating slightly to 1.6% in 2019. Continuing quantitative easing by the ECB should support domestic demand while the lower Euro exchange rate should assist growth in exports. Similar optimism is shared by the IMF and the OECD, with both organisations forecasting the Euro Zone to grow at between 1.6% and 1.7% per annum in 2017 and 2018. However, financial vulnerability continues to be a concern, with the region’s banking sector still struggling with high levels of non-performing loans and low profitability. This is compounded by the Brexit process and potential political uncertainty following European elections.
China’s economic growth has come off from unsustainably high rates in recent years, as the Chinese government places greater emphasis on reducing income inequality, reforming various industries and managing financial risks to the country’s banking sector.
While reform of the country’s coal and steel industries continues in 2017, the Chinese government appears to be inclined to adopt a more market-oriented approach in pursuing further reductions in excess capacity in these industries. The market consensus is that the government’s effort to rebalance and reform the Chinese economy will lead to further moderation in headline economic growth in coming years.
Supported by accommodative fiscal and monetary policies, the Japanese economy is expected to maintain its momentum in 2017. However, Japan’s economic growth is expected to moderate in the medium term. This reflects the continued decline in the country’s population, which is limiting potential growth, together with a scheduled consumption tax hike and an anticipated peak in Olympic Games related construction activity by late 2019. Closely related to a declining population is the ongoing moderation in productivity growth in Japan.
| Chart 2.1 | Monetary Base in the US, Euro Zone, UK and Japan |
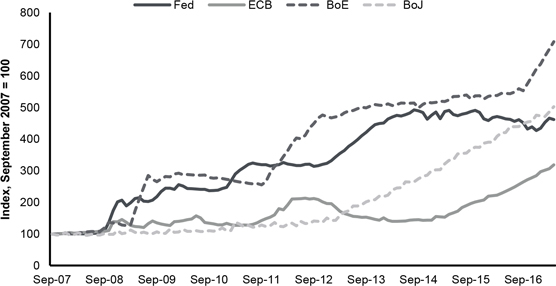
Sources: The Federal Reserve, European Central Bank, Bank of England and Bank of Japan.
31
Budget Strategy and Outlook 2017-18
The Australian economy continues its transition away from resources investment towards broader-based growth. Activity is being supported by the Reserve Bank of Australia’s (RBA) continued accommodative monetary policy stance, with historically low interest rates keeping borrowing costs low for businesses and households.
Australian Treasury forecasts GDP growth to slow to 1 3⁄4% in 2016-17, partly reflecting the impact of a number of weather-related events, including STC Debbie. Economic growth is forecast to rebound to 2 3⁄4% in 2017-18 and 3% in 2018-19 (see Table 2.2).
Historically low wage growth continues to constrain income growth and any rebound in household consumption is likely to be modest. To the extent that Australian Treasury’s forecast decline in the household savings rate does not eventuate, economic growth outcomes will be more modest.
Business investment is forecast to continue its decline in the near-term. The unwinding of resources investment from unprecedented levels is now mostly complete, with its drag on the broader economy expected to wane from 2017-18. Meanwhile, strengthening demand and low financing costs should provide support for non-resources investment. However, as with Queensland, the pace and the timing of the anticipated pick up in non-resources business investment continues to be a key source of uncertainty for the outlook.
Dwelling investment rose substantially in 2015-16, and is expected to continue to grow in the near-term, supported by a strong pipeline of residential construction work yet to be done. However, given the recent fall in dwelling approvals, dwelling investment is expected to grow only marginally in 2017-18 and decline in 2018-19.
Exports are expected to remain a key driver of GDP growth in the coming years, with the last of the iron ore and LNG projects forecast to complete their ramp-up to full capacity by 2018-19. Strong demand from Asia and the lower exchange rate (since its peak in 2011) are expected to drive rapid growth in service exports such as education and tourism.
National labour market conditions have softened recently, with most of the improvements in employment growth driven by part-time workers. Despite a modest rise in the unemployment rate, Australian Treasury believe improvements in leading indicators, such as job advertisements, vacancies and business survey measures, suggest labour market conditions may improve in the near-term.
Australian Treasury forecasts moderate employment growth over the forecast period. As a result, the unemployment rate is forecast to gradually decline, consistent with a recovery in GDP growth.
32
Budget Strategy and Outlook 2017-18
| Table 2.2 | Australian Treasury national economic forecasts |
| | | | | | | | | | | | | | | | | | | | | | | | |
| | | Actual1 | | | Estimate | | | Forecasts | | | Projections | |
| | | 2015-16 | | | 2016-17 | | | 2017-18 | | | 2018-19 | | | 2019-20 | | | 2020-21 | |
GDP2 | | | 2.6 | | | | 1 3⁄4 | | | | 2 3⁄4 | | | | 3 | | | | 3 | | | | 3 | |
Employment3 | | | 1.9 | | | | 1 | | | | 1 1⁄2 | | | | 1 1⁄2 | | | | 1 1⁄2 | | | | 1 1⁄2 | |
Unemployment rate4 | | | 5.7 | | | | 5 3⁄4 | | | | 5 3⁄4 | | | | 5 1⁄2 | | | | 5 1⁄2 | | | | 5 1⁄4 | |
Inflation5 | | | 1.0 | | | | 2 | | | | 2 | | | | 2 1⁄4 | | | | 2 1⁄2 | | | | 2 1⁄2 | |
Population6 | | | 1.4 | | | | 1 1⁄2 | | | | 1 1⁄2 | | | | 1 1⁄2 | | | | 1 1⁄2 | | | | 1 3⁄4 | |
Terms of trade | | | -10.2 | | | | 16 1⁄2 | | | | -2 3⁄4 | | | | -4 1⁄4 | | | | n.a. | | | | n.a. | |
Notes:
| 1. | Calculated using original data unless otherwise indicated. |
| 2. | Per cent change on previous year. CVM, 2014-15 reference year. |
| 3. | Seasonally adjusted, through-the-year growth rate to the June quarter. |
| 4. | Seasonally adjusted rate for the June quarter. Actual outcome for 2015-16. |
| 5. | Through-the-year growth rate to the June quarter. |
| 6. | Through-the-year growth rate to 31 December. |
Sources: ABS 3101.0, 5206.0, 6202.0, 6401.0 and the 2017-18 Australian Government Budget.
Forecasts for the Queensland economy are based on a number of assumptions, including the RBA’s monetary policy stance, the A$ exchange rate, the crude oil price and seasonal conditions over the forecast period. In particular:
| • | | The RBA is assumed to maintain the cash rate at its current historically low level in the near-term, before beginning to gradually normalise monetary policy in the medium term. |
| • | | The value of the A$ is assumed to be broadly unchanged against the US$ across the forecast period. |
| • | | While the promise of production cuts from OPEC and a production freeze from Russia have boosted the oil price, additional supply from the US will temper upward pressure on prices. Therefore, crude oil prices are assumed to only gradually increase over the forecast period. |
| • | | The Bureau of Meteorology is estimating around 50% chance of an El Niño weather event developing later in 2017, which is typically associated with below average rainfall throughout Queensland. Reflecting these risks, some deterioration in seasonal conditions has been factored into the forecasts. |
This chapter ends with a discussion of the risks related to the global economy, financial markets and other assumptions driving the Queensland outlook.
33
Budget Strategy and Outlook 2017-18
| 2.2.1 | Summary of conditions and outlook |
Queensland’s economic growth is estimated to strengthen to 2 3⁄4% in both 2016-17 and 2017-18, with the ramp-up in LNG shipments continuing to boost overseas exports. This improvement is despite the impact of STC Debbie, which is estimated to have detracted around 3⁄4 percentage point from economic growth across these two years. GSP growth is forecast to strengthen further to 3% in 2018-19, with an anticipated recovery in business investment and a solid contribution from public sector capital spending supporting stronger domestic activity, as LNG exports plateau.
With the exception of the period of the GFC and natural disasters, Queensland has traditionally recorded economic growth rates above that nationally, underpinned by sustained resources sector investment and exports, as well as stronger population growth (see Chart 2.2). With these trends becoming less dominant and as growth becomes more broad-based across the major components of domestic demand, growth in Queensland is expected to remain in line with national growth in the projection years, at 3%.
| Chart 2.2 | Economic growth1, Queensland and Australia |
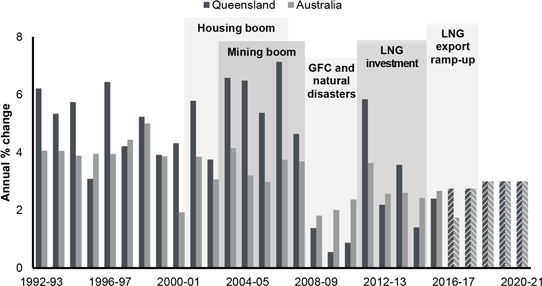
Note:
| 1. | CVM, 2014-15 reference year, 2016-17 onwards are forecasts, 2019-20 and 2020-21 are projections. |
Sources: ABS 5206.0, Australian Government Budget 2017-18 and Queensland Treasury.
34
Budget Strategy and Outlook 2017-18
STC Debbie is estimated to have resulted in a loss to economic output of around $2 billion, or 3⁄4 percentage point of GSP (see Box 2.1). Key sectors impacted include coal exports and agriculture, as well as tourism in the Whitsundays. Losses will be spread across several financial years, but predominantly in 2016-17 and, to a lesser extent, 2017-18.
Modest labour market outcomes, the transition to lower-wage non-resource sectors, and a fall in Queensland’s terms of trade in recent years have constrained growth in wages and incomes. As a result, consumption growth remains subdued in 2016-17, despite low interest rates and an increase in household wealth.
The surge in apartment construction in the South East is underpinning growth in new and used dwelling construction for the fifth consecutive year in 2016-17. However, subdued income growth has constrained alterations and additions activity, resulting in a marginal decline in total dwelling investment in 2016-17. Further, with substantial new supply of apartment stock coming on line in Inner City Brisbane, prices and rents have softened in some markets, and affordability improved. This has resulted in approvals for this segment of the market falling and so total dwelling investment is forecast to ease further in 2017-18 and 2018-19, before slowly recovering.
This decline in dwelling investment is forecast to temper growth in consumption of household goods. With wages and income growth expected to remain constrained, household consumption is expected to grow moderately in these two years. As labour market conditions improve, household consumption growth is expected to pick up later in the forecast period, but population growth of 1 1⁄2% will keep consumption growth well below historical averages.
Business investment continues to adjust following the completion of LNG construction in late 2016, and is expected to decline in 2016-17. While there have been positive signs in relation to investment projects in the tourism and education sectors due to the lower A$ and growing demand from Asia, these are not expected to fully offset the decline in resources investment. As a result, and in line with the national outlook, business investment is expected to be broadly unchanged in 2017-18 before returning to moderate growth across the remainder of the forecast period.
If the improvement in commodity prices is sustained and projects such as Adani’s Carmichael coal mine proceed, then investment in resources will strengthen and business investment would be higher than currently forecast.
The trade sector continues to be a key contributor to Queensland’s GSP growth in 2016-17 (Chart 2.3), particularly LNG exports. While higher prices are boosting nominal returns, real growth in coal and metals exports is expected to be modest over the forecast period. Similarly, with LNG plants approaching production capacity, LNG exports are expected to plateau from 2018-19 onwards. Overall export growth is also expected to be supported by growing services exports such as tourism and education, boosted by a sustained lower A$ and growing demand from Asian markets. From around 3⁄4 percentage point in both 2016-17 and 2017-18, the contribution from net exports is forecast to moderate across the remainder of the forecast period, as the recovery in household and business spending leads to a strengthening in imports.
35
Budget Strategy and Outlook 2017-18
Following employment growth of 0.7% through the year to June quarter 2016, measured employment has been quite volatile during the current financial year, easing early in the year, but picking up since late 2016. While in year average terms employment growth will most likely be flat in 2016-17, this recent momentum in employment is better observed in (seasonally adjusted) through the year terms, which is expected to be around 1 1⁄4% higher over the year to June quarter 2017.
The unemployment rate is estimated to have fallen slightly to 6 1⁄4% in June quarter 2017, with a participation rate that is expected to stabilise at around pre-mining boom levels. With a moderation in key labour intensive sectors in coming years, employment growth is likely to remain modest, as is the case nationally. After a period of stabilisation, Queensland’s unemployment rate is expected to fall to 6% by June quarter 2019, consistent with stronger state final demand and employment growth by this time.
| Chart 2.3 | Contributions to growth in Queensland’s gross state product1 |
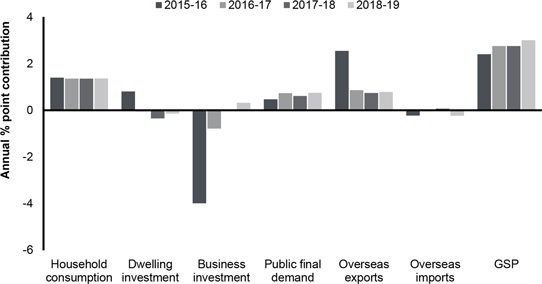
Note:
| 1. | CVM, 2014-15 reference year, 2016-17 onwards are forecasts. |
Source: Queensland Treasury.
36
Budget Strategy and Outlook 2017-18
Table 2.3 outlines the detailed components of GSP for the Actual 2015-16 outcome, the Estimated Actual 2016-17 outcome and the 2017-18 and 2018-19 forecast period.
| Table 2.3 | Queensland economic forecasts1, by component |
| | | | | | | | | | | | | | | | |
| | | Actual | | | Est. Act. | | | Forecasts | |
| | | 2015-16 | | | 2016-17 | | | 2017-18 | | | 2018-19 | |
Economic output2 | | | | | | | | | | | | | | | | |
Household consumption | | | 2.4 | | | | 2 1⁄4 | | | | 2 1⁄4 | | | | 2 1⁄4 | |
Private investment | | | -13.3 | | | | -3 1⁄2 | | | | -1 3⁄4 | | | | 1 1⁄4 | |
Dwelling investment | | | 14.5 | | | | -1 | | | | -5 3⁄4 | | | | -2 3⁄4 | |
New and used | | | 18.5 | | | | 1 3⁄4 | | | | -10 | | | | -6 | |
Alterations and additions | | | 8.9 | | | | -5 | | | | 1 | | | | 2 1⁄4 | |
Business investment | | | -26.0 | | | | -7 | | | | 0 | | | | 3 1⁄4 | |
Non-dwelling construction | | | -32.1 | | | | -11 1⁄4 | | | | -1 1⁄2 | | | | 3 1⁄2 | |
Machinery and equipment | | | -14.6 | | | | -1 | | | | 1 3⁄4 | | | | 2 3⁄4 | |
Private final demand | | | -2.2 | | | | 3⁄4 | | | | 1 1⁄4 | | | | 2 | |
Public final demand | | | 2.1 | | | | 3 1⁄4 | | | | 3 | | | | 3 1⁄4 | |
Gross state expenditure | | | -1.4 | | | | 1 1⁄2 | | | | 1 1⁄2 | | | | 2 1⁄4 | |
Net overseas exports3 | | | 2.3 | | | | 3⁄4 | | | | 3⁄4 | | | | 1⁄2 | |
Overseas exports | | | 12.2 | | | | 3 3⁄4 | | | | 3 1⁄4 | | | | 3 1⁄4 | |
less Overseas imports | | | 1.4 | | | | 1⁄4 | | | | - 1⁄2 | | | | 1 1⁄2 | |
Gross state product | | | 2.4 | | | | 2 3⁄4 | | | | 2 3⁄4 | | | | 3 | |
Nominal gross state product | | | 2.4 | | | | 11 3⁄4 | | | | 4 | | | | 3 1⁄4 | |
Other economic measures | | | | | | | | | | | | | | | | |
Employment4 | | | 0.7 | | | | 1 1⁄4 | | | | 1 | | | | 1 1⁄2 | |
Unemployment rate5 | | | 6.4 | | | | 6 1⁄4 | | | | 6 1⁄4 | | | | 6 | |
Inflation6 | | | 1.6 | | | | 1 3⁄4 | | | | 2 | | | | 2 1⁄4 | |
Wage Price Index6 | | | 1.9 | | | | 2 | | | | 2 1⁄4 | | | | 2 1⁄2 | |
Population6 | | | 1.3 | | | | 1 1⁄2 | | | | 1 1⁄2 | | | | 1 1⁄2 | |
Notes:
| 1. | Unless otherwise stated, all figures are annual percentage changes. |
| 2. | CVM, 2014-15 reference year, except nominal GSP. Components not separately reported are other investment (cultivated biological resources, intellectual property products and ownership transfer costs), the balancing item (including interstate trade and inventories) and the statistical discrepancy. |
| 3. | Goods and services, percentage point contribution to growth in gross state product. |
| 4. | Through-the-year growth rate to the June quarter (seasonally adjusted). This is the same basis as calculated for national employment growth in the Australian Government Budget. The comparable growth rates in year average terms are 1.6%, 0%, 1 1⁄4% and 1 1⁄2% from 2015-16 through to 2018-19. |
| 5. | Seasonally adjusted rate for the June quarter. |
| 6. | Annual percentage change, year-average. |
Sources: ABS 3101.0, 6202.0, 6345.0, 6401.0 and Queensland Treasury.
37
Budget Strategy and Outlook 2017-18
| Box 2.1 | Impacts of Severe Tropical Cyclone (STC) Debbie |
On Tuesday 28 March 2017, Category 4 STC Debbie crossed the Queensland coast around Airlie Beach, then tracked southwest over the next few hours before being downgraded to a tropical low the following day.
STC Debbie inflicted significant structural damage to properties in the Whitsunday Islands, Airlie Beach and Proserpine and dumped a substantial amount of rainfall across the central coast, highlands and coalfields all the way down to the southeast coast regions of Queensland and into New South Wales.
STC Debbie caused damage and distress to households, businesses and public facilities, and the recovery and repair will take an extended time.
This assessment is focused on estimating the impact of the cyclone on overall economic output (as measured by GSP).This primarily involves examining any impact on Queensland’s resources and agricultural production, as well as on the State’s tourism sector.
Impacts on the State Budget, including the costs to rebuild damaged roads and local government infrastructure, providing assistance to individuals, families and businesses impacted by the disasters, are addressed in Chapter 3.
Overall, the loss to economic output due to STC Debbie is estimated to be around $2 billion or 3⁄4 percentage point of GSP. Losses will be spread across several financial years, but predominantly in 2016-17 and 2017-18.
Key sectors impacted include coal exports and agricultural production, as well as tourism in the Whitsundays.
Coal Exports
Unlike the 2010-11 natural disasters, when losses were estimated to have reached $6 billion largely due to mine flooding, there have been no reports of substantial damage to mines or ports infrastructure.
The largest impact on coal exports was damage to rail networks, which included:
| • | | The Goonyella network, closed from 28 March to 26 April. |
| • | | The Blackwater network, closed from 29 March to 10 April. |
| • | | The Moura network, closed from 29 March to 12 April. |
| • | | The Newlands network, closed from 28 March to 13 April. |
Overall, the effect of these closures is estimated to result in a net loss in exports of around 10 million tonnes in June quarter 2017, with approximately two-thirds hard coking coal and the remainder thermal coal.
38
Budget Strategy and Outlook 2017-18
Agriculture
The Mackay-Isaac-Whitsunday region is a significant agricultural region, with $1.1 billion of agricultural production in 2014-15, 9.4% of the Queensland total. The region’s most valuable agricultural products in that year were beef ($485 million), sugar ($354 million), vegetables ($176 million) and grain sorghum ($64 million).
Looking at losses from previous similar events, such as STC Ului in 2010, Queensland Treasury expects losses in the nominal value of sugar exports due to STC Debbie to be around $300 million in the 2018 calendar year. Sorghum exports are expected to be reduced by $37 million in 2017-18. However, better water availability is expected to boost wheat and chickpea exports in 2018 and dried shelled beans exports in 2017-18. In addition, despite some impact on fences and other farm infrastructure, graziers in the affected regions largely welcomed the rain accompanying STC Debbie, which in the longer term will assist herd rebuilding following a sustained period of drought.
Tourism
STC Debbie directly impacted the Whitsundays tourism region, including Airlie Beach and Whitsunday Island resorts.
Overnight visitors spent an estimated $709 million in the Whitsundays region in 2016 (3.6% of the Queensland total), including spending by 243,000 international and 396,000 domestic tourists.
While no firm estimates of losses have been produced by the industry, Queensland Treasury assumes losses to overseas and interstate tourism of approximately $150 million. The loss of key resort capacity includes:
| • | | Hamilton Island: No significant structural damage. Partially re-opened on 8 April, then gradually to return to full capacity from August 2017. |
| • | | Daydream Island: Decided to bring forward $50 million redevelopment. Reopening in mid-2018. |
| • | | Hayman Island: Closed and unable to accept new reservations until mid-2018. |
Household consumption
Household consumption growth has remained below its historical average since the GFC, constrained by moderate growth in household incomes.
Subdued labour market conditions and falls in the terms of trade in recent years have limited income growth, with compensation of employees growing at 1.3% in 2015-16 (Chart 2.4). With the resources sector now entering the more capital intensive export phase, associated employment has fallen following the investment boom. Aggregate income growth has also been impacted by jobs growth shifting towards the services sector, which generally has lower average earnings.
39
Budget Strategy and Outlook 2017-18
Higher commodity prices this year, particularly for coal, have seen an increase in the terms of trade which may provide some support for growth in household incomes and spending in 2016-17. This effect is likely to be relatively mild and transitory, as markets adjust following temporary spikes in coal prices. Looking ahead, the outlook for wages and employment growth, as well as modest population growth, is likely to keep household consumption growth below its historical average over the forecast period.
In recent years, a sustained period of very low interest rates has stimulated strong growth in dwelling investment, which in turn has provided some support to household spending. However, with new dwelling construction expected to reach its cyclical peak this year, the next few years will likely see some moderation in dwelling-related consumption spending, such as household goods and furnishings.
| Chart 2.4 | Nominal household consumption and compensation of employees, Queensland |
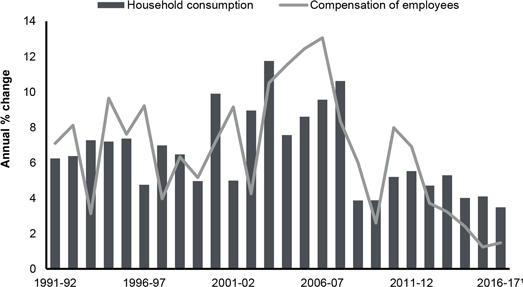
Note:
| 1. | 2016-17 is the first three quarters of the financial year compared with the same period the previous year. |
Source: ABS 5206.0.
40
Budget Strategy and Outlook 2017-18
Dwelling investment
Following aggregate growth of 36.5% over the previous two financial years, new dwelling construction in Queensland is expected to peak in 2016-17. Growth has been driven by construction of units and apartments in Inner City Brisbane, Brisbane South and Gold Coast. This activity has been supported by a sustained period of low interest rates and strong investor interest, particularly given Brisbane’s higher rental yields compared with Sydney and Melbourne.
The large number of completions in recent years has increased risks of an oversupply in apartments in Brisbane. This strong supply response has led to an easing in prices and weak rental price growth for medium-to-high density dwellings. Consequently, dwelling approvals in Queensland, and across most states, have fallen considerably from recent peak levels.
While the substantial amount of construction work still in the pipeline will see new dwelling construction activity reach a cyclical peak in 2016-17, the recent large fall in approvals suggests this component will ease in 2017-18 and 2018-19 (Chart 2.5). Alterations and additions activity is expected to fall in 2016-17, driven by modest population, employment and wages growth. However, this component is expected to return to modest growth from 2017-18 onwards. This will partly offset the expected fall in new dwelling construction activity.
| Chart 2.5 | Value of work yet to be done by type1 and dwelling approvals2, Queensland |
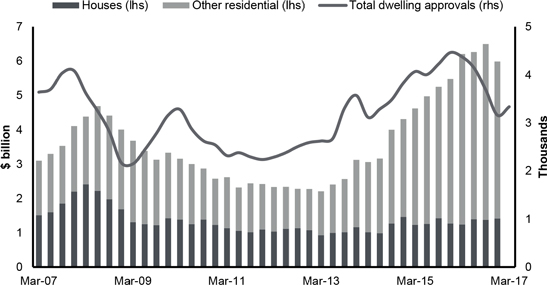
Notes:
| 1. | Nominal, quarterly. March quarter 2017 data not available. |
| 2. | Number, trend, end month of each quarter. |
Sources: ABS 8752.0 and 8731.0.
41
Budget Strategy and Outlook 2017-18
Business investment
Business investment continues to adjust from the record levels experienced during the LNG construction boom. Construction of the third and final LNG project was completed in late 2016 and engineering construction has now stabilised (Chart 2.6). With subdued commodity demand limiting substantial new resource investment and investment outside the resource sector also modest, business investment is expected to fall in 2016-17.
Despite a marginal recovery in late 2016, global industrial production growth remains soft. As such, the level of investment in a small number of committed new resources projects in Queensland is modest compared with the completed LNG projects. However, support to engineering construction should be provided in the medium term from the strong domestic demand for gas, which is driving an ongoing program of CSG exploration and extraction.
| Chart 2.6 | Business investment1, Queensland |
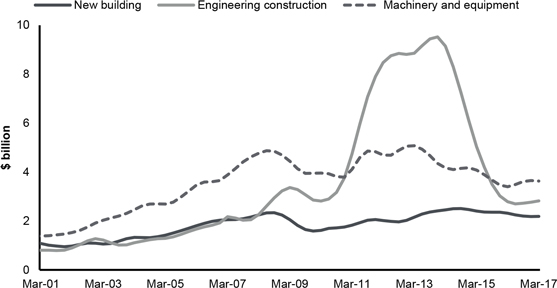
Note:
Source: ABS 5206.0.
Non-residential building construction work done (shops, offices, factories etc.) recorded strong growth in 2013-14, however with several large projects reaching completion, activity has since moderated. While conditions in some of the larger sectors such as commercial offices, retail/wholesale trade and health have eased, some of the smaller sectors such as entertainment, accommodation and industrial warehouses have seen strong growth in the past year. There has also been positive signs in relation to investment projects in the tourism and education sectors due to the lower A$ and growing demand for these services from Asia.
42
Budget Strategy and Outlook 2017-18
However despite these bright spots, with growth in domestic activity subdued, the immediate incentive to invest remains muted. Reflecting these trends – and consistent with the national growth profile – business investment in Queensland is expected to be broadly unchanged in 2017-18, before returning to moderate growth from 2018-19 onward.
Public final demand
Public final demand covers spending across Commonwealth, state and local governments on consumption and investment. Public final demand is expected to grow at a moderate pace as governments remain committed to responsible financial management.
A range of investments in key services and infrastructure at Commonwealth and State level will result in public final demand growing by 3 1⁄4% in 2016-17, 3% in 2017-18 and 3 1⁄4% in 2018-19.
Overseas exports and imports
The trade sector is expected to be a key contributor to Queensland’s economic growth in 2016-17. The real value of overseas goods exports is expected to grow by 3 3⁄4%, driven by the ramp-up of the final LNG trains on Curtis Island. Coal exports are expected to fall in 2016-17, largely as a consequence of transport infrastructure disruptions in the wake of STC Debbie. Reflecting the closure of a number of depleted mines, base metals exports are forecast to continue to fall in 2016-17 before flattening out in 2017-18. Beef exports are also expected to decline further in 2016-17, as farmers continue the herd rebuilding process, while the outlook for crop exports is mixed following STC Debbie. Growth in services exports such as tourism and education will be supported by a sustained lower A$ and growing demand from Asian markets.
LNG exports will be the principal driver of overall exports growth in the current and the next financial years. The first LNG production train on Curtis Island commenced exports in 2014-15, followed by an additional four trains in 2015-16 and the final train in the first half of 2016-17. With demand growth and prices for LNG currently softer than at the time the projects were approved, the three projects have restricted output levels to below nameplate capacity. In particular, the Gladstone LNG project has indicated it will only ramp up to around 77% of nameplate capacity over the next few years. Despite the lower expected volumes, the ramp-up profile of the projects still sees LNG exports grow substantially in year-average terms in 2016-17 and, to a lesser degree, in 2017-18.
In response to China’s reduction in domestic coal production, international coal prices staged a significant recovery in the first half of 2016-17. Specifically, the premium hard coking coal spot price increased from around US$90/tonne at the end of June 2016 to above US$310/tonne in early November. However, the recovery proved to be short lived, with hard coking coal prices falling back to around US$150/tonne before STC Debbie hit central Queensland. The cyclone disruption to Queensland coal exports led to another spike in the hard coking coal price above US$300/tonne in mid-April 2017, before those gains were unwound by early June as the coal rail network returned to full operation (Chart 2.7).
43
Budget Strategy and Outlook 2017-18
| Chart 2.7 | Coal spot prices |
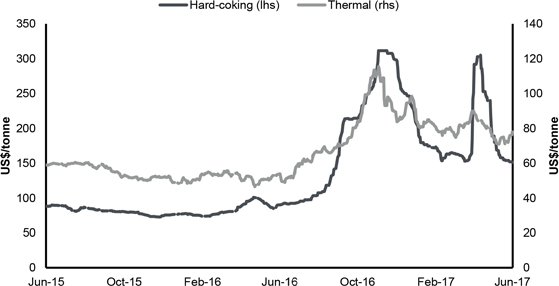
Source: Platts.
Stronger prices drove an unexpected boost in coal export earnings in 2016-17, which is estimated to have increased from $21.3 billion in 2015-16 to more than $40 billion in 2016-17. This is despite an estimated 4% decline in coal export tonnages over the year.
Although rationalisation of China’s coal industry has led to an increase in Queensland coal exports to China, total coal export volumes remained subdued in most of 2016-17. In addition, flood damage to the coal rail transportation network by STC Debbie in late March 2017 led to an estimated loss of coal supply of around 10 million tonnes in June quarter 2017.
Notwithstanding the dip in export tonnages in 2016-17, coal export volumes are predicted to recover toward 240 million tonnes per annum by 2020-21. However, the extent of growth in Queensland coal exports in coming years is likely to be constrained by the anticipated moderation in steel production in China and the increasing role of renewable energy in some markets.
After falling 3.4% in 2015-16, Queensland metals exports are expected to continue to decline in 2016-17. This reflects the closure of a number of depleted zinc/lead mines and production cuts associated with previously low global prices (Chart 2.8), as well as the cessation of nickel production at the Yabulu refinery in early 2016. While mine closures have resulted in a permanent reduction in Queensland’s zinc and lead exports, a sharp rebound in metal prices since late 2015 has subsequently encouraged a modest increase in production. In contrast, aluminium exports have continued to rise, driven by the ongoing ramp up in bauxite production at Weipa.
44
Budget Strategy and Outlook 2017-18
| Chart 2.8 | Zinc and lead production, Queensland |
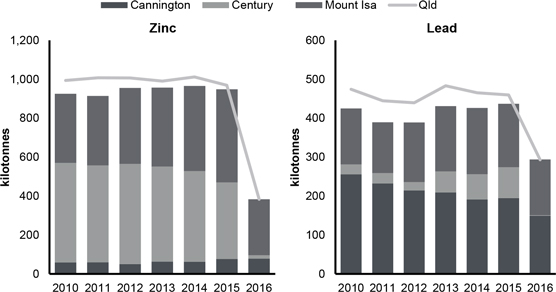
Sources: MMG, Glencore and South 32 company reports and Office of the Chief Economist, Department of Industry, Innovation and Science.
Queensland metals exports are forecast to be broadly unchanged in 2017-18. The commissioning of MMG’s Dugald River mine and Rio Tinto’s Amrun mine are expected to result in a return to growth in metals exports later in the forecast period.
Cattle slaughter rates in Queensland have declined sharply so far in 2016-17, with increased winter and spring rainfall during 2016 seeing farmers starting to rebuild their depleted herds. This increased demand for restocking has supported much higher saleyard prices, which rose to record levels in the first half of 2016-17.
However, while graziers in some coastal regions benefited from STC Debbie related rainfall, conditions more broadly remain unfavourable. A large part of Queensland still remains drought declared, while the summer was generally hot and dry and the seasonal outlook is tilted towards a drier and warmer than average winter.
These conditions, along with a small breeding cow inventory in early 2016-17, mean herd expansion in Queensland will likely be slow, constraining beef production and exports growth until at least 2017-18. Looking further out, a return towards normal seasonal conditions is expected to see beef exports pick up gradually.
Despite an increase in sugarcane crushing in the 2016 season, sugar exports are expected to decline in 2016-17. Lower sugarcane yields have been driven by a combination of the further spread of Yellow Canopy Syndrome and above average winter rainfall, which also led to degraded performance of some sugar mills. Sugar exports are expected to also decline in 2017-18, as the industry recovers from substantial damage in the Mackay-Isaac-Whitsunday region caused by STC Debbie.
45
Budget Strategy and Outlook 2017-18
Cotton exports are forecast to grow substantially in 2016-17, as above average winter rainfall in 2016 encouraged farmers to increase cotton plantings. Looking forward to the 2017 season, the Bureau of Meteorology is forecasting a 50% chance of an El Niño developing later in 2017, which is typically associated with below average rainfall. If realised, this could result in farmers substituting other crops instead of cotton, reducing exports in 2017-18.
Other crop exports are expected to significantly increase in 2016-17, driven by large increases in the production of winter crops, including chickpeas and wheat. Farmers are continuing to increase their area planted to chickpeas in response to expected higher returns. This more than offset a decline in the production of sorghum, as increased winter rainfall encouraged farmers to plant cotton instead. However, this is likely to be reversed in 2017-18, with other crop exports forecast to fall, driven by a decline in the production of chickpeas and wheat.
Tourism arrivals from Asia continue to grow strongly, particularly from China and will increasingly be the key driver of growth over the forecast period, as discretionary income and preferences for long-haul travel increase. Depreciation in the UK Pound and Euro following the Brexit vote in June 2016 has contributed to falls in tourist visitor nights from the UK, Queensland’s largest tourist market, as well as from Germany and France. Overall, overseas tourism exports are forecast to grow in 2017-18 through to the end of the forecast period.
International student commencements have increased 11.6% in the first eight months of 2016-17 and are expected to continue to grow strongly over the forecast period. As with tourism, long-term growth in overseas education exports is expected to be driven by increased demand for education and rising incomes in Asia, particularly China and India.
Labour market
Following growth of 0.7% through the year to June quarter 2016, measured employment has been quite volatile during the current financial year. After easing early in the year, trend employment has picked up since November. While in year-average terms employment growth will most likely be flat in 2016-17, the recent momentum in the labour market is better observed in (seasonally adjusted) through the year terms. On this basis, which is consistent with Australian Treasury presentation of labour market forecasts, employment in Queensland is likely to be around 1 1⁄4% higher over the year to June quarter 2017. The unemployment rate has remained relatively stable, reflecting the participation rate which appears to be stabilising at around pre-mining boom levels.
Hiring across a range of labour intensive service industries partly reflects subdued household consumption growth and an ongoing reluctance by businesses to invest prior to a sustained pick-up in demand. However, the size and composition of employment changes appears somewhat inconsistent with other labour market indicators and improving private final demand (see Chart 2.9). Most notably, a fall in ABS estimates of non-market sector employment (health, education, public administration and safety) – the key driver of Queensland employment growth in recent years – has weighed heavily on aggregate employment outcomes. While vacancy data corroborate some slowing in labour demand across these industries, other data sources suggest these sectors actually rose rather than fell.
46
Budget Strategy and Outlook 2017-18
The surge in Queensland residential dwelling activity has led to strong growth in construction employment at the same time as the wind down in regional construction workforces, including on LNG projects, has largely played out. Meanwhile, stronger tourist activity is translating into employment opportunities in accommodation and food services. A welcome improvement in regional labour market conditions is the result of better prospects for mining, construction, agriculture and tourism operators.
In contrast to the early-to-mid 2000s, when domestic activity was driving economic growth, in recent years it has been driven by capital-intensive resource exports, most notably coal exports between 2012-13 and 2014-15, followed by LNG exports since 2014-15. Therefore, while Queensland’s headline economic growth during that period was relatively robust, employment growth was below historical averages. A forecast rebalancing of economic growth drivers towards household and business sectors is expected to translate into stronger labour market conditions over the forecast horizon, broadly in line with those nationally.
Consistent with the improvement in overall domestic activity, employment growth is also expected to strengthen to 1 1⁄2% in the year to June quarter 2019. After a period of stabilisation, these trends are also expected to see the unemployment rate decline to 6% by then.
| Chart 2.9 | Employment1 and private demand |
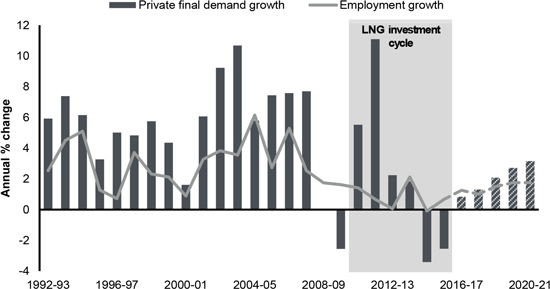
Note:
| 1. | Through-the-year growth rate to the June quarter (seasonally adjusted). |
Sources: ABS 6202.0, 5206.0 and Queensland Treasury.
47
Budget Strategy and Outlook 2017-18
Regional labour markets
Better prospects for mining, construction, agriculture and tourism operators have resulted in a welcome improvement in regional labour market conditions.
By improving mine viability, higher commodity prices have assisted broader labour market conditions, particularly in coal mining centres of Mackay and Fitzroy. In addition, Fitzroy appears to be adjusting well to the wind down in Gladstone’s LNG construction workforce and construction employment in regional Queensland returned to growth in 2016. In contrast, much of the impact of recent metal mine closures and cutbacks by processors is being felt in the north west region of Queensland - Outback, where the majority of ore is mined, and Townsville, where the processing and exporting takes place (Chart 2.10).
STC Debbie is expected to have a substantial impact on the agriculture and tourism sectors and associated employment. Operations close to the coast were significantly disrupted, although increased rainfall should assist Queensland beef cattle farmers as they restore herd numbers. More broadly, stronger tourist activity is translating into employment opportunities in related industries and regions. Labour market conditions in Cairns have improved in recent months, including for youth. The key tourist destination has been assisted by the lower A$ and continued growth in international visitors.
Employment conditions in previously strong South East Queensland have softened somewhat, and the unemployment rate has edged higher. With the substantial volume of residential construction work in South East Queensland beginning to slow in early 2017, growth in construction employment is also likely to moderate.
To address these concerns, the Government is implementing a strong infrastructure building program – including Cross River Rail and North Queensland Stadium – that will support construction activity and jobs, as well as boosting the long-term capacity of the economy.
The Government is also expanding its successful Back to Work Regional Employment Package, with a new program of support payments available to employers in South East Queensland from 1 July 2017 who create employment for long-term unemployed and young jobseekers. The initiative is designed to stimulate economic and labour market conditions in South East Queensland by giving businesses the confidence to employ disadvantaged jobseekers.
48
Budget Strategy and Outlook 2017-18
| Chart 2.10 | Regional unemployment rates1 |
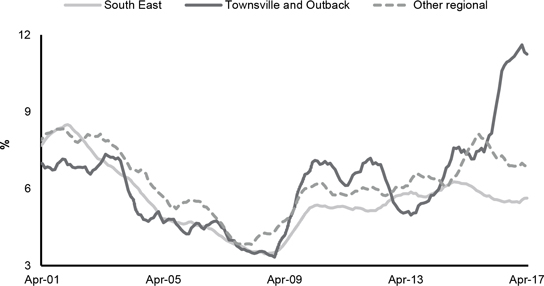
Note:
| 1. | Based on 12 month moving averages. South East Queensland is defined as Greater Brisbane, Gold Coast, Sunshine Coast and Toowoomba. Other regional is defined as Cairns, Darling Downs-Maranoa, Fitzroy, Mackay and Wide Bay. |
Source: ABS 6291.0.55.001.
Prices and wages
Brisbane consumer price inflation is expected to remain relatively weak in 2016-17, consistent with soft conditions in the domestic economy and low national inflation. The increase in 2016-17 largely reflects increased prices for tobacco due to the scheduled 12.5% annual increase in Australian Government’s tobacco excise, higher fruit and vegetable prices due to adverse weather conditions as well as higher purchasing costs for new dwellings.
The increase in insurance premiums driven by the introduction of the National Injury Insurance Scheme, and its associated levy, has also placed upward pressure on inflation in 2016-17. This increase was partly offset by lower urban transport fares due to the Queensland Government’s Fairer Fare package, as well as continuing falling prices for motor vehicle purchases.
A modest acceleration in inflation is forecast for 2017-18, driven by a rebound in the price of automotive fuel on the back of rising global oil prices. A further scheduled increase in the tobacco excise will also contribute to inflation in 2017-18. A 12.5% increase in tobacco excise is scheduled for 1 September each year until 2020.
Despite low nominal wage growth, slower consumer price inflation has resulted in real wage growth. Wage growth is expected to remain subdued in 2017-18, reflecting ongoing spare capacity in the labour market, but is then expected to pick-up as conditions in the domestic economy and labour market improve.
49
Budget Strategy and Outlook 2017-18
Population
After slowing to 1.3% in 2015-16 as the resources investment boom subsided, Queensland’s population growth is forecast to average around 1 1⁄2% per annum over the forward estimates, broadly in line with that forecast nationally. Over the longer term, some moderate acceleration in population growth is expected.
In the year to September 2016, Queensland’s population increased by almost 68,000 compared with just over 57,000 over the year to September 2015. Stronger net interstate migration contributed most to this pick-up, with net overseas migration also recovering over the same period from its September 2015 trough.
Net interstate migration from New South Wales picked up by around 3,000 in the year to September 2016 compared with the previous year. Greater housing affordability in Brisbane is likely to lead to further strengthening in net interstate migration from New South Wales over the forward estimates period. Further, the end of the Western Australia resources investment boom has also seen a significant increase in net inflows into Queensland from that state over the last year, after a period of net outflows between March 2008 and June 2015.
The Commonwealth Department of Immigration and Border Protection has forecast a solid increase in net overseas migration over the next four years, from around 190,000 in the year to September 2016 to almost 250,000 in the year to June 2020. This is primarily due to an expected increased net intake of overseas students. However, in recent years most of this increase has been concentrated in New South Wales and Victoria. As a result, growth in Queensland net overseas migration is expected to remain subdued over the forward estimates.
| Chart 2.11 | Population growth, by region |
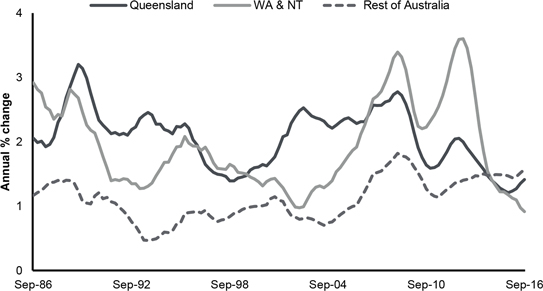
Source: ABS 3101.0.
50
Budget Strategy and Outlook 2017-18
| 2.2.2 | Risks to the economic outlook |
Key risks for the international outlook arise from increased protectionist sentiment in many countries and heightened geopolitical tensions. These are occurring against the backdrop of a changing policy mix under the new US administration and the economic realignment associated with the UK exit from the European Union.
If protectionism intensifies, growth in world trade and output could be slower than expected, flowing through to lower than expected growth in Queensland’s commodity export volumes and prices. Conversely, any heightened geopolitical tensions, while adversely affecting global activity and commodity export volumes, could be offset by higher prices for those exports.
As the US economy has strengthened, the US Federal Reserve Board has increased interest rates by 25 basis points in both December 2016 and March 2017, with two more rate rises expected in 2017. While US fiscal policy is expected to become more expansionary, the risk remains that growth could be slower than expected.
In China, our most important export market, continued reliance on policy stimulus through rapid expansion of credit, together with slow progress in addressing debt in state owned enterprises and local governments, as well as financial fragility of the banking sector, raises the risk of disruptive adjustment.
Domestically, a key source of uncertainty is the pace and timing of the recovery in non-resources business investment, now that the large resources investment projects are completed.
Further, while there is a substantial amount of dwelling construction work still in the pipeline, the large fall in building approvals together with a possible emergence of oversupply of units and apartments in parts of South East Queensland, could see an earlier and faster decline in dwelling investment than currently forecast.
Almost 70% of Queensland is currently drought declared and if these conditions remain more protracted than assumed, this could impact on the production and export of key agricultural commodities.
51
Budget Strategy and Outlook 2017-18
| 3 | Fiscal strategy and outlook |
Features
| • | | A net operating surplus of $2.824 billion is expected for 2016-17, the largest operating surplus since 2005-06. This is $798 million higher than estimated at the 2016-17 Mid Year Fiscal and Economic Review (MYFER), and almost $2 billion greater than the surplus forecast at the time of the 2016-17 Budget. The improvement is primarily due to a number of temporary factors, such as the timing of disaster recovery reimbursements for events prior to Severe Tropical Cyclone (STC) Debbie and strong royalty revenue as a result of highly volatile coal prices in the past year. |
| • | | The Government recognises the significant 2016-17 surplus results from short-term factors. The strong 2016-17 operating surplus will see General Government Sector debt in 2016-17 around $3.8 billion lower than estimates in the 2016-17 Budget. This has provided the opportunity to deliver additional infrastructure investment and a range of targeted temporary measures to support businesses and households. |
| • | | Beyond 2016-17, the fiscal environment facing the State remains challenging, with ongoing weakness in key tax revenues, the return of coal prices to the medium term outlook and recovery work required as a result of STC Debbie. Overall, the loss to economic output due to STC Debbie is estimated to be more than $2 billion, or around 3⁄4 percentage point of GSP. |
| • | | The preliminary estimated cost to the Government of recovery activities is $1.1 billion, comprising around $700 million in operating expenses, predominantly grants to local councils, and $400 million in capital expenditure, predominantly for road infrastructure, across the four years to 2019-20. |
| • | | A General Government Sector net operating surplus of $146 million is forecast for 2017-18. Modest net operating surpluses are forecast across the forward estimates, primarily reflecting the impact of the return to the medium term outlook for coal prices and expenditure initiatives since MYFER averaging around $640 million per annum from 2017-18 to 2019-20. |
| • | | The 2017-18 Budget maintains the Government’s focus on job creation, with a targeted spending program to deliver quality services for all Queenslanders. Key highlights include: |
| | • | | $1.835 billion over 10 years for a range of housing and homelessness measures |
| | • | | $200 million over two years for job creation and minor infrastructure works in local governments outside of South East Queensland under the Works for Queensland program, bringing the total commitment to $400 million |
| | • | | a further $50 million to continue the Back to Work program in regional Queensland and $27.5 million to extend it to South East Queensland |
| | • | | a commitment to fully fund the $5.409 billion Cross River Rail project, Queensland’s highest priority transport infrastructure project. This commitment includes an additional $1.952 billion allocation to the project over the forward estimates. |
52
Budget Strategy and Outlook 2017-18
| • | | Other budget initiatives will continue the Government’s objectives in fostering innovation, delivering productive infrastructure, optimising the use of our land and natural resources, growing our human capital, encouraging innovation and responsiveness in the public sector and promoting business investment and exports. Demonstrating the Government’s commitment to expenditure control, many of these new initiatives are funded through reprioritisations within and across agencies. |
| • | | The 2017-18 Budget also consolidates the work undertaken since 2015-16 under the Government’s Debt Action Plan. Measures relating to revisions to the capital structure of the Government’s energy network businesses and cash management arrangements for government-owned corporations, as well as responsible funding and investment arrangements for the State’s long service leave and superannuation programs have contributed to significant improvements in the State’s debt position. |
| • | | The benefits of the Debt Action Plan are particularly evident in terms of the General Government Sector debt to revenue ratio which, at 60% for 2016-17 and 2017-18, has reduced significantly since the peak of 91% in 2012-13. Increases across the forward estimates reflect the ramp up of the Government’s capital program. |
| • | | In the General Government Sector, the Government is continuing to focus on optimising infrastructure investment while managing debt levels. General Government Sector debt is estimated to be $33.758 billion in 2017-18, which is $9.347 billion lower than the peak in 2014-15 of $43.105 billion and $14.663 billion less than the forecast for 2017-18 of $48.421 billion at the time of the 2014-15 Budget. |
| • | | General Government Sector capital expenditure is expected to total $6.696 billion for 2017-18, which comprises $5.123 billion of Purchases of Non-Financial Assets (PNFA) and $1.573 billion of capital grants expenses. In addition, $618 million in acquisitions of non-financial assets under finance leases brings the total General Government Sector capital program in 2017-18 to $7.314 billion. |
| • | | Across the period from 2017-18 to 2020-21, the General Government Sector capital program of $30.881 billion comprises capital expenditure of $29.218 billion ($25.071 billion PNFA and $4.147 billion capital grants) and acquisitions of assets under financial leases of $1.663 billion. |
| • | | Non-financial Public Sector capital expenditure totals $9.553 billion for 2017-18, which comprises $7.989 billion of PNFA and $1.563 billion of capital grants expenses. With acquisitions of non-financial assets under finance leases, the total capital program in 2017-18 is budgeted at $10.171 billion. Across the period from 2017-18 to 2020-21, the total Non-financial Public Sector capital program is $42.75 billion, comprising $36.979 billion PNFA, $4.107 billion capital grants and $1.663 billion in acquisitions of assets under financial leases. |
53
Budget Strategy and Outlook 2017-18
The focus of the Palaszczuk Government over the last two State Budgets has been on delivering election commitments and policy measures which create jobs and support future economic growth. The 2016-17 Budget highlighted the strengths of Queensland’s diversified economy, including in key areas of regional Queensland, and this Budget continues to support and facilitate growth in an innovative and productive Queensland economy.
The Government recognises that the significant surplus estimated in 2016-17 ($2.824 billion) is supported by a number of temporary factors, such as the timing of disaster recovery reimbursements from the Australian Government for events prior to STC Debbie and the spike in coal prices in 2016. Accordingly, the Government is directing this additional revenue to increased infrastructure investment and to a range of targeted, temporary measures to support businesses and households, including a $771 million electricity affordability package, funded in part by dividends from government-owned electricity generators (see Box 3.1).
The fiscal environment facing the State remains challenging beyond 2016-17. Along with ongoing weakness in key tax revenues, the return of coal prices to the medium term outlook following the sharp increase towards the end of 2016 has impacted revenue estimates over the forward estimates since the 2016-17 Budget. As well, reparation work required as a result of STC Debbie is expected to cost the government approximately $1.1 billion in capital expenditure and grants to local governments over the next few years, before reimbursements from the Australian Government (see Box 3.2).
Since the 2015-16 Budget, the Government has focused on the importance of delivering net operating surpluses to ensure that the General Government Sector capital program can be funded primarily through recurrent revenues, rather than borrowings, as highlighted in the Review of State Finances released concurrently with the 2015-16 Budget. Five fiscal principles, aimed at improving the sustainability of the State’s finances, were adopted, with a sixth added in the 2016-17 Budget. The Government remains committed to these principles:
| • | | Target ongoing reductions in Queensland’s relative debt burden, as measured by the General Government Sector debt to revenue ratio |
| • | | Target net operating surpluses that ensure any new capital investment in the General Government Sector is funded primarily through recurrent revenues rather than borrowing |
| • | | The capital program will be managed to ensure a consistent flow of works to support jobs and the economy and reduce the risk of backlogs emerging |
| • | | Maintain competitive taxation by ensuring that General Government Sector own-source revenue remains at or below 8.5% of nominal gross state product, on average, across the forward estimates |
| • | | Target full funding of long-term liabilities such as superannuation and WorkCover in accordance with actuarial advice |
| • | | Maintain a sustainable public sector by ensuring that overall growth in full-time equivalent employees, on average over the forward estimates, does not exceed population growth. |
Further discussion on these fiscal principles, and the Government’s progress in meeting its targets, is provided in Sections 3.3 and 3.4.
54
Budget Strategy and Outlook 2017-18
| Box 3.1 | Price relief for electricity consumers |
The Government remains committed to reducing cost-of-living pressures for Queenslanders, and ensuring affordable prices for business.
On 31 May 2017, the Queensland Competition Authority recommended that retail electricity prices for the typical residential household in regional Queensland increase by 7.1%. The proposed electricity price rise has been driven by substantial increases in the wholesale electricity prices resulting from supply and demand imbalances in New South Wales, Victoria and South Australia.
In response, the Government will meet more than half the increase for Queensland consumers through a $771 million electricity affordability package in 2016-17, funded in part by the dividends it receives from government-owned electricity generators. This will put direct downwards pressure on electricity prices over the next three years, while also reducing the retail electricity price increase in 2017-18 from 7.1% to 3.3% for the typical household.
The price reduction will be achieved by the Government taking on responsibility for the cost of the Solar Bonus Scheme premium Feed-in-Tariff, for consumers with photovoltaic solar panels on their roofs, for the next three years to 2019-20. This illustrates the benefit to Queenslanders of keeping income-generating assets in public hands.
The key fiscal aggregates of the General Government Sector for the 2017-18 Budget are outlined in Table 3.1 and are discussed in detail in this chapter.
| Table 3.1 | General Government Sector – key fiscal aggregates1 |
| | | | | | | | | | | | | | | | | | | | | | | | | | | | |
| | | 2015-16
Actual2
$ million | | | 2016-17
MYFER
$ million | | | 2016-17
Est. Act.
$ million | | | 2017-18
Budget
$ million | | | 2018-19
Projection
$ million | | | 2019-20
Projection
$ million | | | 2020-21
Projection
$ million | |
Revenue | | | 50,995 | | | | 54,953 | | | | 56,434 | | | | 55,869 | | | | 56,138 | | | | 57,887 | | | | 58,982 | |
Expenses | | | 50,025 | | | | 52,927 | | | | 53,610 | | | | 55,723 | | | | 56,021 | | | | 57,183 | | | | 58,574 | |
Net operating balance | | | 970 | | | | 2,026 | | | | 2,824 | | | | 146 | | | | 117 | | | | 704 | | | | 408 | |
PNFA3 | | | 4,092 | | | | 5,210 | | | | 4,416 | | | | 5,123 | | | | 6,471 | | | | 7,015 | | | | 6,462 | |
Fiscal balance | | | (461 | ) | | | (1,015 | ) | | | 868 | | | | (2,363 | ) | | | (3,946 | ) | | | (2,725 | ) | | | (2,496 | ) |
Borrowing | | | 35,486 | | | | 36,022 | | | | 33,937 | | | | 33,758 | | | | 36,393 | | | | 38,760 | | | | 41,244 | |
Borrowing (NFPS)4 | | | 72,922 | | | | 73,749 | | | | 73,102 | | | | 71,989 | | | | 74,978 | | | | 77,720 | | | | 81,148 | |
Notes:
| 1. | Numbers may not add due to rounding. Bracketed numbers represent negative amounts. |
| 2. | Reflects published actuals. |
| 3. | PNFA: Purchases of non-financial assets. |
| 4. | NFPS: Non-financial Public Sector. |
55
Budget Strategy and Outlook 2017-18
| 3.2.1 | Net operating balance |
Table 3.2 compares the General Government Sector net operating balance forecasts for the 2016-17 Budget and MYFER with 2017-18 Budget forecasts.
| Table 3.2 | General Government Sector – net operating balance forecasts |
| | | | | | | | | | | | | | | | | | | | | | | | |
| | | 2015-16
$ million | | | 2016-17
$ million | | | 2017-18
$ million | | | 2018-19
$ million | | | 2019-20
$ million | | | 2020-21
$ million | |
2016-17 Budget | | | 152 | | | | 867 | | | | 1,225 | | | | 321 | | | | 741 | | | | n.a. | |
2016-17 MYFER | | | 970 | | | | 2,026 | | | | 1,095 | | | | 479 | | | | 981 | | | | n.a. | |
2017-18 Budget | | | 970 | | | | 2,824 | | | | 146 | | | | 117 | | | | 704 | | | | 408 | |
The anticipated 2016-17 net operating balance of $2.824 billion compares with a forecast surplus of $2.026 billion expected in the 2016-17 MYFER. The $798 million improvement in the net operating balance since then primarily reflects increases in revenue from royalties, mainly as a result of the sharp increase in coal prices during 2016.
Since MYFER, revenue has increased by $1.481 billion in 2016-17, primarily related to:
| • | | upward revisions to forecasts for royalty revenue, attributable largely to higher coal prices during 2016-17 ($457 million) |
| • | | the impact of changes to the timing of Natural Disaster Relief and Recovery Arrangements (NDRRA) revenue from the Australian Government ($357 million). |
Further, increased net flows from the Public Non-financial Corporation (PNFC) Sector and Public Financial Corporations (PNF) Sector of $323 million also contributed to the net operating balance.
The key drivers for increased expenses since MYFER are policy measures, including the Government’s program in 2016-17 of price relief for electricity consumers ($771 million).
56
Budget Strategy and Outlook 2017-18
As shown in Chart 3.1 below, the estimated 2016-17 net operating balance is the largest operating surplus since 2005-06.
| Chart 3.1 | Net operating balance |
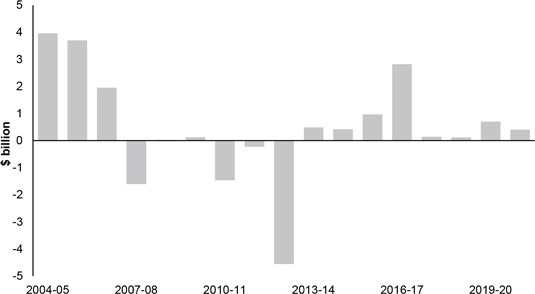
Consistent with the Government’s fiscal principles, net operating surpluses are forecast across the forward estimates. For 2017-18, the estimated General Government Sector operating surplus of $146 million is significantly lower than the $1.095 billion expected at the time of the 2016-17 MYFER, with lower results also seen across the forward estimates.
Royalty revenue projections for 2017-18 have increased since the 2016-17 MYFER by $808 million. This is due in part to the timing of royalty revenue collections, with payments in the first quarter of 2017-18 being impacted by royalties owed from the previous quarter, and to a slower than expected reduction in hard coking coal prices from the 2016-17 peak.
However, taxation has been revised downwards by $258 million in 2017-18 (excluding revenue measures) relative to MYFER, primarily as a result of reductions in the rate of growth of payroll tax and also reflecting in part the volatility of the property market in reduced transfer duty estimates. Reductions in GST revenue across the period to 2019-20 have also impacted revenue forecasts. In addition, the shift in the timing of NDRRA reimbursements relating to prior disaster events has reduced revenue in 2017-18.
Since the 2016-17 MYFER, additional expense measures of $763 million have been provided for in 2017-18, with $1.927 billion over the three years to 2019-20. These measures include funding for the Works for Queensland program and the Jobs and Regional Growth Fund, supporting jobs creation that will continue to enable Queensland’s $300 billion economy to grow and diversify.
57
Budget Strategy and Outlook 2017-18
The 2017-18 Budget also includes initiatives to protect vulnerable Queenslanders and enhance social cohesion and safety in communities:
| • | | $265 million to overhaul Queensland’s probation and parole system to enable tougher supervision of parolees, expand GPS monitoring, establish a fully independent parole board, reduce reoffending, and improve rehabilitation and mental health services |
| • | | $199.6 million to support the transfer of 17 year olds from the adult justice system to the youth justice system and provide pathways to reduce offending behaviour |
| • | | $141.8 million over four years to further strengthen Queensland’s child protection system. This takes total new funding for child safety to $200 million since the 2016-17 Budget |
| • | | $18 million to tackle the harmful use and effects of crystal methamphetamine (Ice) in Queensland, with measures that increase awareness, support families and better equip frontline service providers. |
Additional measures, detailed in Budget Measures (Budget Paper 4), support the Government’s ongoing commitment to improve service delivery across the State.
Expenses and revenue are both projected to increase by around 3% per annum over the five years to 2020-21.
58
Budget Strategy and Outlook 2017-18
Table 3.3 provides a breakdown of the movements in the net operating balance since the 2016-17 MYFER.
| Table 3.3 | Reconciliation of net operating balance, 2016-17 MYFER to 2017-18 Budget1 |
| | | | | | | | | | | | | | | | |
| | | 2016-17
$ million | | | 2017-18
$ million | | | 2018-19
$ million | | | 2019-20
$ million | |
2016-17 MYFER net operating balance | | | 2,026 | | | | 1,095 | | | | 479 | | | | 981 | |
Taxation revisions2 | | | (11 | ) | | | (258 | ) | | | (303 | ) | | | (298 | ) |
Royalty revisions | | | 457 | | | | 808 | | | | 183 | | | | 108 | |
GST revisions | | | (242 | ) | | | (156 | ) | | | (335 | ) | | | (147 | ) |
Natural disaster revisions3,4 | | | | | | | | | | | | | | | | |
Change in revenue | | | 357 | | | | (373 | ) | | | 301 | | | | 420 | |
Change in expenses | | | (91 | ) | | | (240 | ) | | | (328 | ) | | | (143 | ) |
| | | | | | | | | | | | | | | | |
Net change | | | 266 | | | | (613 | ) | | | (26 | ) | | | 277 | |
Measures5 | | | | | | | | | | | | | | | | |
Expense | | | (850 | ) | | | (763 | ) | | | (640 | ) | | | (524 | ) |
Revenue | | | — | | | | 12 | | | | 41 | | | | 37 | |
| | | | | | | | | | | | | | | | |
Net | | | (850 | ) | | | (751 | ) | | | (599 | ) | | | (487 | ) |
Net flows from PNFC and PFC Sector entities6 | | | 323 | | | | 198 | | | | (14 | ) | | | 236 | |
Australian Government funding revisions7 | | | (119 | ) | | | (535 | ) | | | 291 | | | | 525 | |
Other parameter adjustments8 | | | 974 | | | | 357 | | | | 441 | | | | (491 | ) |
2017-18 Budget net operating balance | | | 2,824 | | | | 146 | | | | 117 | | | | 704 | |
Notes:
| 1. | Numbers may not add due to rounding. Numbers indicate the impact on the operating balance. A number in brackets indicates a negative impact on the operating balance. |
| 2. | Represents parameter adjustments to taxation revenue excluding taxation revenue measures. |
| 3. | Represents movements in revenue and expenses for natural disaster restoration. Largely represents revisions to the timing of expected reimbursements from the Australian Government and additional expenses and reimbursements in response to STC Debbie. |
| 4. | This table shows changes in NDRRA revenues and expenses since the 2016-17 MYFER and differs from numbers in Table 3.4, which provides budgeted total NDRRA revenue and expenditure. |
| 5. | Reflects the operating balance impact of Government decisions since the 2016-17 MYFER. |
| 6. | Represents revisions to dividends and tax equivalent payments from, and community service obligations (CSOs) and Transport Service Contract (TSC) payments to, Public Non-financial Corporations and Public Financial Corporations, net of CSO and TSC expense measures. |
| 7. | Represents the net impact of funding provided by the Australian Government primarily for Specific Purpose Payments and National Partnership payments and excludes funding for disaster recovery expenses. |
| 8. | Refers to adjustments largely of a non-policy nature, primarily changes in interest paid on borrowings, depreciation, growth funding, swaps, deferrals and administered revenue. |
59
Budget Strategy and Outlook 2017-18
| 3.2.2 | Natural Disaster Relief and Recovery Arrangements |
Longstanding NDRRA arrangements provide a cost sharing formula between the Queensland and Australian Governments, as well as a range of pre-agreed relief measures which may be activated by the Queensland Government immediately following a disaster event, once a need has been established.
The timing of expenditure in relation to natural disasters, and the anticipated NDRRA reimbursements from the Australian Government, continues to significantly impact Queensland’s budget position.
Since the 2016-17 MYFER, a change in the expected timing of reimbursements for events prior to STC Debbie was announced as part of the Australian Government’s Mid Year Economic and Fiscal Outlook update in December 2016. NDRRA revenue for 2016-17 is now expected to be $357 million higher than the $746 million expected at the 2016-17 MYFER, with a reduction in 2017-18 of $373 million.
Table 3.4 outlines the estimated impact of natural disaster arrangements on Queensland’s net operating balance. This shows the operating balance in underlying surplus, after adjusting for the impact of disasters.
| Table 3.4 | Impact of Natural Disaster Relief and Recovery Arrangements funding on the net operating balance1 |
| | | | | | | | | | | | | | | | | | | | |
| | | 2016-17 | | | 2017-18 | | | 2018-19 | | | 2019-20 | | | 2020-21 | |
| | | $ million | | | $ million | | | $ million | | | $ million1 | | | $ million | |
Published net operating balance | | | 2,824 | | | | 146 | | | | 117 | | | | 704 | | | | 408 | |
less Disaster revenue | | | 1,103 | | | | 223 | | | | 301 | | | | 420 | | | | — | |
add Disaster expenses2 | | | 367 | | | | 389 | | | | 336 | | | | 143 | | | | — | |
Underlying net operating balance | | | 2,088 | | | | 312 | | | | 152 | | | | 427 | | | | 408 | |
Disaster related capital2,3 | | | 18 | | | | 121 | | | | 245 | | | | 50 | | | | — | |
Notes:
| 1. | Numbers may not add due to rounding. |
| 2. | Of the $1.2 billion in expenses from 2016-17 to 2019-20 relating to disasters, approximately $700 million relates to STC Debbie, primarily for grants to local councils. Capital related expenditure of $434 million across the same period primarily relates to road infrastructure repairs as a result of STC Debbie. |
| 3. | Excludes loans provided through the State. |
60
Budget Strategy and Outlook 2017-18
| Box 3.2 | Severe Tropical Cyclone (STC) Debbie |
Immediately after Category 4 STC Debbie hit Queensland’s central coast, the Government initiated programs to provide protection and immediate and ongoing assistance to the public to alleviate personal hardship during and post the disaster. Information and support were available through the Community Recovery Hotline, and for the first time, applications for financial assistance were available online, with payments transferred directly to bank accounts of eligible recipients where appropriate.
For those families without access to the internet or phone, 30,000 debit cards were pre-deployed to the region, with thousands of additional cards held in reserve ready for deployment. Immediate hardship assistance of $180 per person, up to $900 for a family of five or more, was made available, subject to various criteria, so that people in impacted communities could purchase food and other essentials, and get back on their feet as quickly as possible.
Queensland is no stranger to natural disasters, with previous cyclone-related events costing the State in excess of $10 billion since 2005-06, prior to any Commonwealth reimbursement. STC Debbie is expected to cost the Government approximately $1.1 billion in recovery work. This comprises around $700 million in operating expenses, predominantly grants to local councils, and $400 million in capital expenditure, predominantly for road infrastructure, across the four years to 2019-20, before partial reimbursements in arrears from the Australian Government through the jointly-funded Commonwealth-State NDRRA.
Within the first two months after the cyclone, close to $30 million in assistance has already been distributed through the Personal Hardship Assistance Grants and Immediate Hardship Assistance Payments funded under the NDRRA. A $14.7 million Community Recovery Fund has also been established and additional funding of $2 million has been provided for the Government’s Go Local campaign to support the agricultural industry in disaster affected areas. In addition:
| • | | 10,763 Rapid Damage Assessments were conducted |
| • | | 235,000 properties had power restored |
| • | | 1,167 schools reopened in time for the second term of the school year |
| • | | 56,000 insurance claims were submitted in Queensland and New South Wales, worth $897 million. |
Sound pricing of risk and strong investment performance has put the Queensland Government Insurance Fund (QGIF) in a good financial position, with investments held exceeding the provisioning for claims. As a result, $500 million will be drawn from the QGIF surplus to assist in funding the Government’s response to STC Debbie. On current estimates, this will still leave a substantial surplus in QGIF to respond to future claims.
The Queensland Government will contribute $110 million towards a proposed joint $220 million funding package under the Commonwealth and State-funded NDRRA Category D following STC Debbie.
This funding package is contingent on the approval of the Commonwealth and includes a request for a matching contribution for the South Rockhampton Flood Levee.
61
Budget Strategy and Outlook 2017-18
| 3.2.3 | Cash flows and balance sheet |
General Government Sector
Cash surplus/(deficit)
The General Government Sector is expected to record a cash surplus in 2016-17 of $1.038 billion, compared to a $569 million deficit forecast in the 2016-17 MYFER. The significant cash surplus compared to the expected cash deficit primarily reflects higher net operating receipts and reduced cash requirements for investments in non-financial assets.
A cash deficit of $1.922 billion is expected in the General Government Sector in 2017-18 with cash deficits forecast across the forward estimates.
Capital purchases
For the General Government Sector, PNFA in 2016-17 are estimated to be $4.416 billion, $794 million less than forecast in the 2016-17 MYFER. For 2017-18, budgeted General Government Sector PNFA totals $5.123 billion.
Over the period 2017-18 to 2020-21, PNFA in the General Government Sector of $25.071 billion are planned. Capital grants expenses for the same period are expected to total $4.147 billion, a total of $29.218 billion for General Government Sector capital expenditure. In addition, acquisitions of non-financial assets under finance leases total $1.663 billion for the General Government Sector over this period. These leases relate primarily to Public Private Partnerships.
In total over the four years to 2020-21, the General Government Sector capital program is forecast to be $30.881 billion. This compares to the total General Government Sector capital program at the time of the 2016-17 Budget of $29.515 billion over the four years to 2019-20.
Borrowings
Gross General Government Sector borrowings of $33.937 billion at 30 June 2017, representing the stock of borrowing outstanding as presented in the Balance Sheet, are $3.838 billion lower than the $37.775 billion forecast in the 2016-17 Budget and $14.279 billion less than the forecast of $48.216 billion at the time of the 2014-15 Budget. The significant reduction is primarily due to the Queensland Government’s continuing focus on its Debt Action Plan, which has reduced General Government Sector debt as well as associated interest costs.
In the 2016-17 Budget, a net General Government Sector borrowing of $665 million was budgeted in 2016-17. As a result of increased royalties revenue and changes to capital expenditure across the forward estimates, debt has reduced for 2016-17 and net borrowing will only be required from 2018-19 onwards.
Since implementation in the context of the 2015-16 and 2016-17 State Budgets, a number of measures under the Debt Action Plan have delivered a significant improvement in the State’s debt position, and these have been achieved while retaining 100% state ownership of the Government’s income-generating assets and maintaining full funding of superannuation liabilities.
62
Budget Strategy and Outlook 2017-18
Debt reduction measures implemented include:
| • | | revising the capital structure of the Government’s energy network businesses |
| • | | funding long service leave on an emergent basis, aligning Queensland with standard practice across Australia |
| • | | temporary suspension of investment of defined benefit employer contributions and surplus repatriation from the defined benefit superannuation scheme |
| • | | revised cash management arrangements for government-owned corporations. |
For the 2017-18 Budget, the Government has continued its assessment of efficient capital allocation and cash management for the government-owned corporations. With estimated dividends and tax equivalent payments of over $2 billion in 2016-17, the strong financial position of government-owned corporations creates opportunities for the sector to contribute to essential growth-enhancing infrastructure in Queensland, which will collectively contribute to over $520 million infrastructure investment in regional Queensland. Projects include:
| • | | $150 million of Powerlink’s dividend to assist in investigations and preliminary work on a new connection for large-scale solar and wind generation infrastructure in North Queensland |
| • | | $100 million of Stanwell’s dividend to contribute to funding the proposed hydro-electric power station at the Burdekin Falls Dam. |
In addition, SunWater will retain all of its 2016-17 dividend, and the Government will provide a further $100 million towards improvement works to ensure that the Burdekin Falls Dam continues to meet design standards, supports the proposed hydro-electric power station, and allows for the potential raising of the dam wall. Further details of these and other projects are provided in Chapter 8.
The benefits of the Debt Action Plan are particularly evident in terms of the General Government Sector debt to revenue ratio, which has significantly decreased since its peak in 2012-13 of 91% to 60% for 2016-17 and 2017-18. While the debt to revenue ratio increases across the forward estimates, these results are still below those expected at the time of the 2016-17 Budget and 2016-17 MYFER. On average over the budget and forward estimates, the debt to revenue ratio is 66%, well below the four years to 2019-20 forecast in the 2016-17 Budget.
Table 3.5 provides details of the debt to revenue ratio and Chart 3.2 compares General Government Sector borrowing projections with those of the 2014-15, 2015-16 and 2016-17 Budgets.
| Table 3.5 | General Government Sector gross borrowings as a proportion of revenue |
| | | | | | | | | | | | | | | | | | | | |
| | | 2016-17 | | | 2017-18 | | | 2018-19 | | | 2019-20 | | | 2020-21 | |
| | | Est. Act. | | | Budget | | | Projection | | | Projection | | | Projection | |
| | | $ million | | | $ million | | | $ million | | | $ million | | | $ million | |
Gross borrowings | | | 33,937 | | | | 33,758 | | | | 36,393 | | | | 38,760 | | | | 41,244 | |
Revenue | | | 56,434 | | | | 55,869 | | | | 56,138 | | | | 57,887 | | | | 58,982 | |
Borrowings/revenue ratio | | | 60 | % | | | 60 | % | | | 65 | % | | | 67 | % | | | 70 | % |
63
Budget Strategy and Outlook 2017-18
| Chart 3.2 | General Government Sector borrowings |
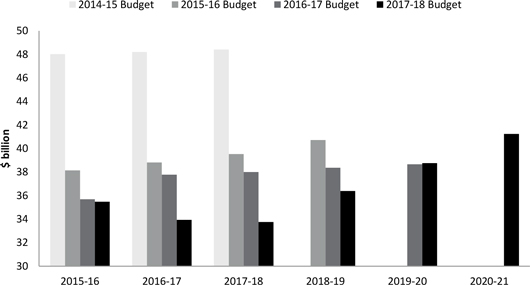
The active balance sheet management strategies under the Debt Action Plan have assisted in ensuring that borrowings in 2017-18 are projected to be $14.663 billion lower than at the time of the 2014-15 Budget, as detailed in Table 3.6 below.
| Table 3.6 | Revisions to General Government Sector borrowings1 |
| | | | | | | | | | | | | | | | |
| | | 2014-15 | | | 2015-16 | | | 2016-17 | | | 2017-18 | |
| | | $ million | | | $ million | | | $ million | | | $ million | |
2014-15 Budget | | | 48,141 | | | | 48,023 | | | | 48,216 | | | | 48,421 | |
2015-16 Budget | | | 43,268 | | | | 38,151 | | | | 38,818 | | | | 39,532 | |
2016-17 Budget2 | | | 43,105 | | | | 35,698 | | | | 37,775 | | | | 38,000 | |
2017-18 Budget3 | | | 43,105 | | | | 35,486 | | | | 33,937 | | | | 33,758 | |
Change between 2014-15 Budget and 2017-18 Budget | | | (5,036 | ) | | | (12,537 | ) | | | (14,279 | ) | | | (14,663 | ) |
Notes:
| 1. | Numbers may not add due to rounding. A number in brackets represents a negative amount. |
| 2. | Number for 2014-15 represents actual result for that year. |
| 3. | Numbers for 2014-15 and 2015-16 represent actual results for those years. |
64
Budget Strategy and Outlook 2017-18
Public Non-financial Corporations Sector
The Public Non-financial Corporations (PNFC) Sector consolidates the State’s commercial entities, including those that operate in the energy, transport and water industries. Further details on the PNFC Sector are provided in Chapter 8.
The PNFC Sector is expecting net borrowing of $294 million in 2016-17, slightly less than estimated at the 2016-17 MYFER. Gross borrowings in the PNFC Sector for 2016-17 are estimated at $39.165 billion.
Borrowings in the Sector are expected to rise modestly each year from 2017-18 to $39.904 billion in 2020-21, primarily driven by increased investment in the rail, port and water businesses.
Purchases of non-financial assets for the PNFC Sector are estimated to be $2.512 billion in 2016-17 and total a projected $11.908 billion across the budget and forward estimates.
Non-financial Public Sector
The Non-financial Public Sector (NFPS) comprises the General Government and PNFC Sectors. Transactions between these sectors are eliminated in aggregated totals.
Gross borrowings of $73.102 billion are estimated at 30 June 2017 in the NFPS, $8.132 billion less than the 2014-15 Budget estimate. The consistent improvement in each successive budget since that time is primarily due to the Government’s focus on debt reduction in the General Government Sector. As at 30 June 2018, borrowings in the NFPS are expected to decline to $71.989 billion, over $10 billion less than projected in the 2014-15 Budget.
Chart 3.3 and Table 3.7 provide details of NFPS borrowings since the 2014-15 Budget.
| Chart 3.3 | Non-financial Public Sector borrowings |
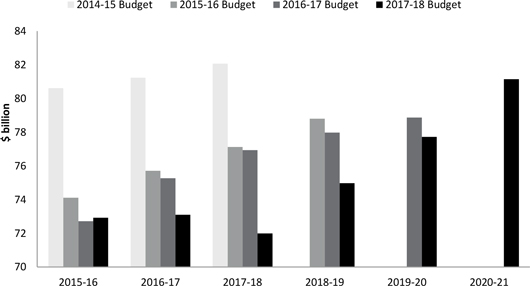
65
Budget Strategy and Outlook 2017-18
| Table 3.7 | Revisions to Non-financial Public Sector borrowings1 |
| | | | | | | | | | | | | | | | |
| | | 2014-15 | | | 2015-16 | | | 2016-17 | | | 2017-18 | |
| | | $ million | | | $ million | | | $ million | | | $ million | |
2014-15 Budget | | | 79,956 | | | | 80,619 | | | | 81,234 | | | | 82,070 | |
2015-16 Budget | | | 75,535 | | | | 74,113 | | | | 75,714 | | | | 77,119 | |
2016-17 Budget2 | | | 75,233 | | | | 72,715 | | | | 75,270 | | | | 76,939 | |
2017-18 Budget3 | | | 75,233 | | | | 72,922 | | | | 73,102 | | | | 71,989 | |
Change between 2014-15 Budget and 2017-18 Budget | | | (4,723 | ) | | | (7,697 | ) | | | (8,132 | ) | | | (10,081 | ) |
Notes:
| 1. | Numbers may not add due to rounding. A number in brackets represents a negative amount. |
| 2. | Number for 2014-15 represents actual result for that year. |
| 3. | Numbers for 2014-15 and 2015-16 represent actual results for those years. |
The NFPS debt to revenue ratio is estimated at 114% for 2016-17, lower than expected at the 2016-17 Budget (125%) and 2016-17 MYFER (119%) and significantly lower than forecast at the time of the 2014-15 Budget, when the 2016-17 NFPS debt to revenue ratio was projected to be 130%. The reductions since 2014-15 are due primarily to increased royalty revenue in 2016-17 and the impact of the Government’s Debt Action Plan in reducing General Government debt, as demonstrated in Chart 3.4.
The NFP debt to revenue ratio for 2017-18 is also estimated to be 114%. Over the forward estimates, the increase in the NFPS debt to revenue ratio reflects the timing of significant capital projects and associated borrowings, as well as the expected moderation in revenue growth over the period 2017-18 to 2020-21.
| Chart 3.4 | Non-financial Public Sector debt to revenue ratio |
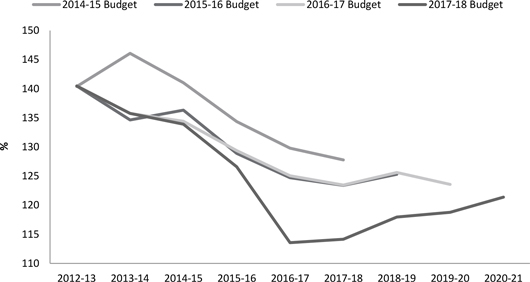
66
Budget Strategy and Outlook 2017-18
The Government remains committed to its fiscal principles, which underpin the development of the State’s fiscal strategy and financial decision-making, and have provided the framework for the State Budgets since 2015-16. During the 2015-16 Budget five principles were implemented, and subsequently refined, with an additional fiscal principle adopted in the 2016-17 Budget to ensure the ongoing sustainability of the public service.
Fiscal principles
Principle 1 – Target ongoing reductions in Queensland’s relative debt burden, as measured by the General Government debt to revenue ratio
A primary fiscal principle of the Queensland Government has been to reduce General Government Sector debt, to provide the Government with the capacity to respond to market and environmental shocks. The Government’s objective is to service General Government Sector debt through General Government Sector revenues, including taxes (either state or federal), charges and royalties. By contrast, government-owned corporation debt is serviced from the operating cash flows of these entities.
The debt to revenue measure ratio is the key measure of the sustainability of General Government Sector debt levels. The Government aims to reduce this ratio over time to continue to improve the State’s fiscal sustainability.
As a result of initiatives implemented through the Debt Action Plan, the General Government Sector’s debt to revenue ratio has fallen substantially over the period to 2017-18 in each successive budget since 2014-15, as seen in Chart 3.5. Debt to revenue ratios for both 2016-17 and 2017-18 reduce to 60% from the peak of 91% in 2012-13.
Across the forward estimates, the expected moderation in revenue growth, as well as the timing of significant capital projects and associated borrowings, sees a gradual increase in the forecast debt to revenue ratio to 2020-21. On average over the budget and forward estimates, the debt to revenue ratio is 66%, well below the four years to 2019-20 forecast in the 2016-17 Budget.
67
Budget Strategy and Outlook 2017-18
| Chart 3.5 | General Government Sector debt to revenue ratio |

Principle 2 – Target net operating surpluses that ensure any new capital investment in the General Government Sector is funded primarily through recurrent revenues rather than borrowing
The net operating balance is recognised across Australian states and territories as the appropriate measure of a jurisdiction’s annual operating position. The Queensland Government targets operating surpluses to ensure that recurrent revenues, rather than borrowings, are the primary funding source for capital investment in the General Government Sector.
The General Government Sector Cash Flow Statement (refer Table 9.7) provides details of the sources of funding for capital investment. It shows that net cash inflows from operating activities equate to 126% of the funding required for the 2016-17 net General Government Sector investments in non-financial assets. Similar to the outcome for 2015-16 (123%), this result is primarily due to the upwards revisions to revenue.
For 2017-18, net cash inflows from operating activities are budgeted to be 59% of the funding required for net General Government Sector investments in non-financial assets. Across 2017-18 to 2020-21, this ratio averages 52%, primarily reflecting the higher level of capital spending during the period. However, this measurement does not recognise the additional funds made available by the Debt Action Plan that can be utilised to invest in capital projects. Indeed, in the four years to 2020-21, gross borrowings increase by only $7.307 billion in support of the General Government Sector capital program of $30.881 billion.
68
Budget Strategy and Outlook 2017-18
| Chart 3.6 | General Government Sector net operating cash flow as a proportion of investments in non-financial assets |
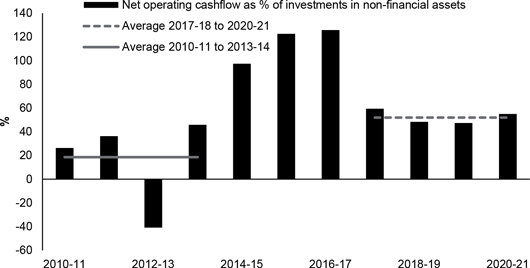
Principle 3 – The capital program will be managed to ensure a consistent flow of works to support jobs and the economy and reduce the risk of backlogs emerging
While the value of the total capital program can fluctuate across financial years, due to the nature and timing of projects, the 2017-18 Budget provides for an overall increase in General Government Sector PNFA from $4.416 billion estimated in 2016-17 to an average of $6.268 billion across the budget and forward estimates. Total General Government Sector PNFA over the budget and forward estimates are projected at $25.071 billion, an increase of $1.2 billion over the four years to 2019-20 forecast in the 2016-17 Budget.
The General Government Sector PNFA increases steadily to 2019-20, reflecting the Government’s objective to ensure a consistent flow of works to support jobs and the economy and to reduce the risk of backlogs emerging. Nevertheless, the capital program remains well below the unusually high levels of the period 2009-10 to 2011-12, when a significant State infrastructure program was further elevated by the Australian Government’s stimulus program in response to the Global Financial Crisis.
69
Budget Strategy and Outlook 2017-18
Principle 4 – Maintain competitive taxation by ensuring that General Government Sector own-source revenue remains at or below 8.5% of nominal gross state product, on average, across the forward estimates
The Queensland Government has a clear role in providing an economic environment that supports business and jobs growth, without placing undue strain on households.
Taxation per capita in Queensland is significantly lower compared to the average of other Australian states and territories, as discussed in Chapter 4. In 2017-18 Queensland’s taxation per capita of $2,691 will be $843 per capita less than the average of the other jurisdictions.
In addition to comparing Queensland’s competitive taxation status across jurisdictions, the Government also aims to support businesses and households by ensuring that own-source revenue in the General Government Sector, including user charges and royalties, remains at or below 8.5% of nominal gross state product, on average, across the forward estimates. Own-source revenue is derived from total State revenue less any grants received from external sources, mainly the Australian Government.
This principle is expected to be met over the forward estimates period, with revenue falling as a percentage of GSP. For 2017-18, General Government own-source revenue is forecast to be 7.7% of nominal gross state product. This falls to 7.1% by 2020-21, with an average of 7.4% across the four years.
Principle 5 – Target full funding of long-term liabilities such as superannuation and WorkCover in accordance with actuarial advice
Consistent with the long-standing practice in Queensland, the Government continues to be committed to ensuring that the State sets aside assets to meet long-term liabilities such as superannuation and WorkCover, in accordance with actuarial advice.
The State Actuary’s most recent valuation indicates that, as at 30 June 2016, the defined benefit superannuation scheme is in a surplus position of over $9 billion. The review was undertaken in accordance with the funding and solvency framework developed by the Australian Prudential Regulation Authority (APRA) and was publicly released in May 2017, under prudential requirements.
The review examined expected repatriations over the three years commencing 2017-18, consistent with previous Budget forecasts, and demonstrated that combined funding measures announced over the last two Budgets are expected to reduce the overfunding of the scheme whilst still maintaining a buffer to protect against adverse experiences. The review concluded that the repatriation and contribution suspension initiatives could proceed as planned, with reviews to be undertaken on an annual cycle.
As at 30 June 2016, the most recently available assessment, the WorkCover scheme was also fully funded.
70
Budget Strategy and Outlook 2017-18
Principle 6 – Maintain a sustainable public service by ensuring that overall growth in full-time equivalents (FTE) employees, on average over the forward estimates, does not exceed population growth
The Government has committed to providing high quality and appropriate frontline services that keep pace with growth in the population, while maintaining fiscally responsible and affordable levels of expenditure. A key focus is to ensure a balance between delivery of high-quality services, and the discipline that underpins the Government’s commitment to fiscal sustainability.
FTEs are estimated to increase by around 6,000 (or 2.8%) in 2017-18, with around 82% of the increase being attributable to growth in health and education.
Average growth over the forward estimates period from 2016-17 to 2020-21 is 1.7%. This compares to an estimated Queensland population growth of 1 1⁄2% annually.
Further details on FTE estimates are provided in Chapter 5, with Table 5.2 providing in-scope agencies and their full-time equivalent estimates for 2016-17 and 2017-18.
71
Budget Strategy and Outlook 2017-18
| 3.4 | Achievement of fiscal principles |
Table 3.8 provides a summary of the Government’s progress in meeting its fiscal principles’ targets.
| Table 3.8 | The fiscal principles of the Queensland Government |
| | | | | | | | | | | | |
Principle | | Indicator | |
| | | General Government debt to revenue ratio | |
| | | | | | 2016-17 MYFER
% | | | 2017-18 Budget
% | |
Target ongoing reductions in Queensland’s relative debt burden, as measured by the General Government debt to revenue ratio. | | | 2016-17 | | | | 66 | | | | 60 | |
| | | 2017-18 | | | | 67 | | | | 60 | |
| | | 2018-19 | | | | 69 | | | | 65 | |
| | | 2019-20 | | | | 68 | | | | 67 | |
| | | 2020-21 | | | | n.a. | | | | 70 | |
| |
| | | General Government net operating cash flows as a
proportion of net investments in non-financial assets | |
| | | | | | 2016-17 MYFER1
% | | | 2017-18 Budget
% | |
| | | | | | | | | | |
Target net operating surpluses that ensure any new capital investment in the General Government Sector is funded primarily through recurrent revenues rather than borrowing. | | | 2016-17 | | | | 88 | | | | 126 | |
| | | 2017-18 | | | | 65 | | | | 59 | |
| | | 2018-19 | | | | 61 | | | | 48 | |
| | | 2019-20 | | | | 62 | | | | 47 | |
| | | 2020-21 | | | | n.a | | | | 55 | |
| |
| | | General Government purchases of non-financial assets | |
| | | | | | 2016-17 MYFER
$ million | | | 2017-18 Budget
$ million | |
| | | | | | | | | | |
The capital program will be managed to ensure a consistent flow of works to support jobs and the economy and reduce the risk of backlogs emerging. | | | 2016-17 | | | | 5,210 | | | | 4,416 | |
| | | 2017-18 | | | | 6,439 | | | | 5,123 | |
| | | 2018-19 | | | | 5,644 | | | | 6,471 | |
| | | 2019-20 | | | | 5,985 | | | | 7,015 | |
| | | 2020-21 | | | | n.a. | | | | 6,462 | |
72
Budget Strategy and Outlook 2017-18
| | | | | | |
Principle | | Indicator | |
Maintain competitive taxation by ensuring that General Government Sector own-source revenue remains at or below 8.5% of nominal gross state product, on average, across the forward estimates. | | General Government own-source revenue to GSP | | | | |
| | 2017-18 | | | 7.7 | % |
| | Average across the forward estimates | | | 7.4 | % |
Target full funding of long-term liabilities such as superannuation and WorkCover in accordance with actuarial advice. | | As at the last actuarial review (as at June 2016), accruing superannuation liabilities were fully funded. The WorkCover scheme was also fully funded as at 30 June 2016. | | | | |
Maintain a sustainable public service by ensuring that overall growth in full-time equivalents (FTE) employees, on average over the forward estimates, does not exceed population growth. | | FTE growth | | | | |
| | Average across the forward estimates | | | 1.7 | % |
| | Population growth | | | | |
| | Average across the forward estimates | | | 1 1⁄2 | % |
|
Note: |
1. 2016-17 MYFER ratio has been revised to reflect the ratio of net operating cash flows to net capital purchases in line with 2017-18 Budget methodology. |
73
Budget Strategy and Outlook 2017-18
Features
| • | | Total General Government Sector revenue is estimated to be $56.434 billion in 2016-17, $5.439 billion (or 10.7%) higher than in 2015-16. Higher than budgeted revenue growth in 2016-17 is due to increased revenue from royalties resulting from increased coal prices, as well as changes to the timing of payments for Natural Disaster Relief and Recovery Arrangements (NDRRA). |
| • | | Total General Government Sector revenue in 2016-17 is estimated to be $2.985 billion (or 5.6%) higher than was estimated in the 2016-17 Budget. The major driver of this increase is higher royalty revenue from the increase in coal prices towards the end of 2016. |
| • | | While strong revenue growth is estimated for 2016-17 as a result of short-term increases to mining royalties, the revenue outlook is challenging. Total revenue is expected to grow at an average annual rate of 3.0% over the five years to 2020-21. Revenue growth over this period is supported by moderate average annual growth in taxation (4.6%) and current grants (4.3%), but is also affected by reductions in interest income and revenue from government-owned corporations. |
| • | | Since the 2016-17 Mid Year Fiscal and Economic Review (MYFER), forecasts for royalty revenue have been revised upward by $1.556 billion over the four years to 2019-20. Most of this revision is in 2016-17 and 2017-18, and mainly reflects a somewhat slower return of coal prices to the medium term outlook following the sharp increase in 2016, and disruptions related to Severe Tropical Cyclone (STC) Debbie. Royalty revisions in this Budget follow an increase of $2.151 billion between the 2016-17 Budget and MYFER over the four years to 2019-20. |
| • | | Total General Government Sector revenue is estimated to be $55.869 billion in 2017-18. The decrease of $565 million (or 1.0%) from 2016-17 revenue is largely due to royalty revenue falling in 2017-18 as coal prices normalise. |
| • | | Queensland will maintain its competitive tax status, with per capita state tax estimated at $2,691 in 2017-18, compared to an average of $3,534 for the other states and territories. |
| • | | Queenslanders continue to benefit from the Government maintaining its commitment to not introduce new taxes, fees or charges. Scheduled annual indexation of certain fees and charges will continue up to 2018-19. From 2019-20, the indexation rate will be based on the Consumer Price Index (CPI), which is expected to reduce fees and charges by $78 million over two years. |
| • | | The payroll tax rebate for apprentices and trainees will continue at the increased rate of 50% for an additional 12 months, until 30 June 2018. |
| • | | From 1 July 2017, a 1.5% surcharge will be introduced for absentee payers of land tax, applying to land holdings of $350,000 or higher in addition to other land tax payable. This will have no direct effect on Queensland residents. |
74
Budget Strategy and Outlook 2017-18
This chapter provides an overview of General Government Sector revenue for the 2016-17 estimated actual outcome, forecasts for the 2017-18 Budget year and projections for 2018-19 to 2020-21.
| 4.1 | 2016-17 estimated actual |
General Government Sector revenue in 2016-17 is estimated to be $56.434 billion, which is $2.985 billion (or 5.6%) more than the 2016-17 Budget estimate.
Significant variations from the 2016-17 Budget estimates include:
| • | | A $1.894 billion (or 90%) increase in revenue from royalties and land rents, mainly as a result of the sharp increase in coal prices towards the end of 2016. |
| • | | A $534 million (or 2.0%) increase in grants from the Australian Government. Increases in payments for specific purposes, including changes to the timing of NDRRA reimbursements, have been partially offset by reduced estimates of GST revenue. |
| • | | Sales of goods and services revenue being $407 million (or 7.5%) higher than was estimated in the 2016-17 Budget. |
These increases were partially offset by decreased taxation revenue (down $205 million), mainly related to lower than anticipated revenue from payroll tax and gambling tax.
| 4.2 | 2017-18 revenue by category |
General Government Sector revenue in 2017-18 is estimated to be $55.869 billion, $565 million (or 1.0%) lower than the 2016-17 estimated actual revenue of $56.434 billion. The revenue reduction in 2017-18 is mainly due to short-term or once-off influences inflating revenue in 2016-17, with these expected to return to more normal levels in 2017-18. Between 2015-16 and 2017-18, estimated average annual growth is 4.7%.
Revenue from capital grants is expected to be $623 million lower in 2017-18 compared to 2016-17, primarily due to a shift in the timing of NDRRA funding received from the Australian Government relating to prior disaster events, reducing revenue in 2017-18.
Total revenue from royalties and land rents is expected to be $533 million lower in 2017-18 than in 2016-17. The significant royalty increase in 2016-17 is driven by a short-term increase in coal prices, which is not expected to be sustained. Coking coal prices are expected to steadily decline through 2017-18 and reach a medium term assumption of US$115/tonne during 2018-19.
Also, revenue from dividends and income tax equivalent income is expected to be $481 million lower in 2017-18, mainly due to declining payments from energy network businesses.
Partially offsetting these decreases are modest growth in less volatile revenue sources, with 2.7% growth in taxation revenue, and 2.2% growth in current grants.
Major sources of General Government Sector revenue in 2017-18 are grants revenue (49.5%) and taxation revenue (23.8%). Table 4.1 details revenue estimates by category, and Chart 4.1 illustrates the composition of General Government Sector revenue.
75
Budget Strategy and Outlook 2017-18
| Table 4.1 | General Government Sector revenue1 |
| | | | | | | | | | | | | | | | | | | | | | | | | | | | |
| | | 2015-16
Actual
$ million | | | 2016-17
Budget
$ million | | | 2016-17
Est. Act.
$ million | | | 2017-18
Budget
$ million | | | 2018-19
Projection
$ million | | | 2019-20
Projection
$ million | | | 2020-21
Projection
$ million | |
Taxation revenue | | | 12,547 | | | | 13,150 | | | | 12,945 | | | | 13,298 | | | | 14,031 | | | | 14,843 | | | | 15,707 | |
Sales of goods and services | | | 5,926 | | | | 5,423 | | | | 5,830 | | | | 6,067 | | | | 6,101 | | | | 6,268 | | | | 6,366 | |
Interest income | | | 2,543 | | | | 2,296 | | | | 2,300 | | | | 2,330 | | | | 2,225 | | | | 1,949 | | | | 1,881 | |
Grants revenue | | | | | | | | | | | | | | | | | | | | | | | | | | | | |
Current grants | | | 22,347 | | | | 24,286 | | | | 24,753 | | | | 25,299 | | | | 25,663 | | | | 26,448 | | | | 27,571 | |
Capital grants | | | 1,394 | | | | 2,830 | | | | 2,955 | | | | 2,332 | | | | 2,161 | | | | 2,234 | | | | 1,436 | |
Dividend and income tax equivalent income | | | | | | | | | | | | | | | | | |
Dividends | | | 1,811 | | | | 1,590 | | | | 1,697 | | | | 1,453 | | | | 1,333 | | | | 1,364 | | | | 1,202 | |
Income tax equivalent income | | | 851 | | | | 717 | | | | 841 | | | | 604 | | | | 549 | | | | 639 | | | | 567 | |
Other revenue | | | | | | | | | | | | | | | | | | | | | | | | | | | | |
Royalties and land rents | | | 2,284 | | | | 2,111 | | | | 4,005 | | | | 3,472 | | | | 3,039 | | | | 3,096 | | | | 3,180 | |
Other | | | 1,293 | | | | 1,046 | | | | 1,108 | | | | 1,015 | | | | 1,036 | | | | 1,046 | | | | 1,073 | |
Total revenue | | | 50,995 | | | | 53,449 | | | | 56,434 | | | | 55,869 | | | | 56,138 | | | | 57,887 | | | | 58,982 | |
Note:
| 1. | Numbers may not add due to rounding. |
76
Budget Strategy and Outlook 2017-18
| Chart 4.1 | Revenue by operating statement category, 2017-181 |
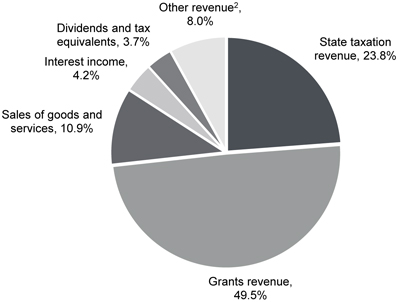
Notes:
| 1. | Numbers may not add due to rounding. |
| 2. | The major component of other revenue is royalties and land rents (6.2% of total revenue). |
77
Budget Strategy and Outlook 2017-18
Chart 4.2 compares 2017-18 forecasts with 2016-17 estimated actuals.
| Chart 4.2 | Revenue by operating statement category, 2016-17 and 2017-181 |
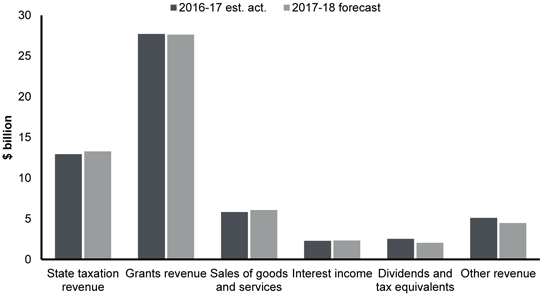
Note:
| 1. | Grants revenue is largely made up of Australian Government funding. |
| 4.3 | 2017-18 Budget initiatives |
| 4.3.1 | Surcharge for absentee payers of land tax |
The Government will introduce a 1.5% surcharge for absentee payers of land tax, as defined under the Land Tax Act 2010. The surcharge will apply to land holdings of $350,000 or higher, in addition to other land lax payable from 1 July 2017.
Absentee owners benefit from a high standard of services and infrastructure delivered and maintained by a broad range of taxes, many of which are borne by other taxpayers such as residents and companies. The surcharge will ensure absentee owners of land make a fair contribution, and will have no direct impact on Queensland residents.
This measure is expected to raise additional revenue of $20 million in 2017-18.
78
Budget Strategy and Outlook 2017-18
| 4.3.2 | Extension of increased payroll tax rebate for apprentices and trainees |
The Government is continuing the payroll tax rebate on the wages of apprentices and trainees at the increased rate of 50% until 30 June 2018. This rebate is in addition to their wages being exempt and will be used as an offset against payroll tax payable on the wages of other employees.
This measure is expected to result in a reduction to payroll tax revenue of $12 million in 2017-18.
| 4.3.3 | Changes to fees and charges escalation |
The Queensland Government has a policy in place which requires departments to regularly review their fees and charges to ensure they remain appropriate and that the cost structure underlying the amount of the fee or charge remains accurate and efficient. However, it is not economical for a detailed review to be conducted each year. Therefore, to maintain the value of the fee or charge when a comprehensive review is not conducted, departments generally apply the Government indexation policy.
In June 2012, the previous Government changed the indexation policy to an annual indexation rate of 3.5% per annum, which did not reflect any specific cost index. The penalty unit indexation rate was also set at 3.5% to align with the other fees and charges indexation rate. As part of the 2017-18 Budget, the Government has decided to instead base the escalation of fees and charges and the penalty unit on the Consumer Price Index from 2019-20. At the current CPI level, this would result in a lower fees and charges escalation rate from 2019-20.
The Government indexation policy does not apply to intra and inter-departmental charges, fees and charges of an ad hoc nature, or nationally agreed fees (e.g. heavy vehicle registration); or where a specific indexation policy has been approved by the Cabinet Budget Review Committee.
This measure is estimated to reduce fees and charges revenue by $78 million across 2019-20 and 2020-21.
| 4.4 | Queensland’s revenue trends |
Chart 4.3 examines the contribution of the key revenue sources of GST, taxation and royalties to revenue growth. Royalties are the largest driver of growth in 2016-17, with royalties expected to peak in that year before declining through 2017-18 as coal prices return to a medium term outlook. In 2017-18, GST and taxation revenue contribute the largest proportion of growth.
Total revenue growth, which is mainly driven by these three sources, is estimated to be 3.0% on average over the five years to 2020-21. This is far lower than the 7.1% average growth in total revenue in the fifteen years to 2014-15.
79
Budget Strategy and Outlook 2017-18
Revenue grew strongly between 2000-01 and 2007-08, supported by growth in these three key sources. Queensland’s GST revenue grew by an average rate of 7.5% in the six years to 2007-08, primarily due to strong growth in national GST collections. Growth in GST was supported by strong growth in household consumption and dwelling investment activity, which were sustained by high levels of consumer confidence and partly funded by increases in household borrowings. GST growth continued to support overall revenue growth in more recent years, particularly from 2012-13 onwards as moderate growth in the GST pool combined with increases in Queensland’s share of GST.
Annual growth in transfer duty averaged 22.6% over the seven years to 2007-08, driven by a range of factors including Queensland’s relative affordability of housing, high population growth and the impact of the burgeoning mining sector. While taxation growth from 2009-10 was somewhat more subdued following the 2008-09 decline, it continued to make a moderate contribution to overall revenue growth, mainly from payroll tax, transfer duty and motor vehicle registration.
Royalty revenue also grew strongly over the 2000-01 to 2007-08 period, with growth of around 50% in both 2004-05 and 2005-06. In contrast to other key revenues, royalties reached a peak in 2008-09, as coal contracts had been priced at record levels prior to the onset of the GFC. Royalty revenue then fell significantly in 2009-10, and its contribution to growth remained relatively low or negative until 2016-17. The recent surge in coal prices means that royalty revenue in 2016-17 is expected to exceed the 2008-09 collections for the first time, but this uplift is also expected to be short term, with royalties falling in 2017-18 and 2018-19.
Looking forward, the overall revenue growth is modest relative to that experienced between 2000-01 and 2007-08. Taxation is expected to grow by 4.6% on average in the five years to 2020-21, with average payroll tax growth of 4.4% and transfer duty growth of 4.9% per year on average. Royalties are expected to reduce over the period 2017-18 to 2020-21 as coal prices decline to medium term expectations. While the GST pool is expected to grow moderately over the five years to 2020-21, declines in Queensland’s share of the pool are expected to reduce GST growth to 3.7%.
Growth is also affected by reductions in other revenue lines, with capital grants from the Australian Government expected to be $1.440 billion lower in 2020-21 than in 2016-17 due to the profile of NDRRA and national roads payments from the Australian Government. Revenue from dividend and income tax equivalent income is also expected to decline between 2016-17 and 2020-21, primarily driven by reduced dividends from energy network businesses due to the new 2017-2022 Powerlink revenue determination and reduced earnings as a result of low regulated revenue growth. More detail on dividends and income tax equivalent income is in Chapter 8.
Growth in individual revenue lines across the forward estimates is discussed in more detail in the next section.
80
Budget Strategy and Outlook 2017-18
| Chart 4.3 | Contribution to growth of key revenues1 |
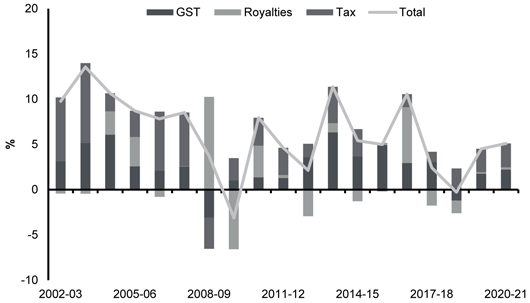
Note:
| 1. | Annual percentage point contribution to growth of the aggregate of three categories (GST, royalties and taxes). Total is the annual % growth in revenues of the aggregate of the three categories. |
81
Budget Strategy and Outlook 2017-18
Total revenue from taxation is expected to grow by 2.7% in 2017-18, following an estimated increase of 3.2% in 2016-17. The main components of taxation revenue are shown in Table 4.2.
| Table 4.2 | State taxation revenue1 |
| | | | | | | | | | | | | | | | | | | | | | | | |
| | | 2015-16
Actual
$ million | | | 2016-17
Est. Act.
$ million | | | 2017-18
Budget
$ million | | | 2018-19
Projection
$ million | | | 2019-20
Projection
$ million | | | 2020-21
Projection
$ million | |
Payroll tax | | | 3,712 | | | | 3,667 | | | | 3,819 | | | | 4,057 | | | | 4,328 | | | | 4,615 | |
Duties | | | | | | | | | | | | | | | | | | | | | | | | |
Transfer | | | 3,005 | | | | 3,327 | | | | 3,190 | | | | 3,367 | | | | 3,580 | | | | 3,813 | |
Vehicle registration | | | 504 | | | | 516 | | | | 537 | | | | 563 | | | | 592 | | | | 621 | |
Insurance2 | | | 816 | | | | 852 | | | | 892 | | | | 936 | | | | 983 | | | | 1,032 | |
Other duties3 | | | 20 | | | | 41 | | | | 59 | | | | 62 | | | | 64 | | | | 67 | |
Total duties | | | 4,344 | | | | 4,736 | | | | 4,678 | | | | 4,928 | | | | 5,219 | | | | 5,534 | |
Gambling taxes and levies | | | | | | | | | | | | | | | | | | | | | | | | |
Gaming machine tax | | | 677 | | | | 687 | | | | 718 | | | | 750 | | | | 784 | | | | 819 | |
Health Services Levy | | | 68 | | | | 72 | | | | 80 | | | | 87 | | | | 96 | | | | 106 | |
Lotteries taxes | | | 259 | | | | 242 | | | | 249 | | | | 257 | | | | 264 | | | | 272 | |
Wagering taxes | | | 10 | | | | 10 | | | | 10 | | | | 11 | | | | 11 | | | | 11 | |
Casino taxes and levies | | | 101 | | | | 100 | | | | 103 | | | | 106 | | | | 109 | | | | 113 | |
Keno tax | | | 21 | | | | 20 | | | | 21 | | | | 21 | | | | 22 | | | | 23 | |
Total gambling taxes and levies | | | 1,138 | | | | 1,131 | | | | 1,181 | | | | 1,233 | | | | 1,287 | | | | 1,344 | |
Other taxes | | | | | | | | | | | | | | | | | | | | | | | | |
Land tax | | | 1,010 | | | | 1,086 | | | | 1,192 | | | | 1,274 | | | | 1,358 | | | | 1,441 | |
Motor vehicle registration | | | 1,633 | | | | 1,676 | | | | 1,741 | | | | 1,809 | | | | 1,877 | | | | 1,948 | |
Emergency Management Levy | | | 457 | | | | 482 | | | | 508 | | | | 535 | | | | 560 | | | | 586 | |
Guarantee fees4 | | | 201 | | | | 112 | | | | 128 | | | | 142 | | | | 160 | | | | 183 | |
Other taxes5 | | | 51 | | | | 54 | | | | 51 | | | | 52 | | | | 54 | | | | 55 | |
Total taxation revenue | | | 12,547 | | | | 12,945 | | | | 13,298 | | | | 14,031 | | | | 14,843 | | | | 15,707 | |
Notes:
| 1. | Numbers may not add due to rounding. |
| 2. | Includes duty on accident insurance premiums. |
| 3. | Includes duty on life insurance premiums. |
| 4. | Includes competitive neutrality fees charged to government-owned corporations. |
| 5. | Includes the Statutory Insurance Scheme Levy and Nominal Defendant Levy. |
82
Budget Strategy and Outlook 2017-18
Chart 4.4 indicates the composition of estimated State taxation revenue for 2016-17.
| Chart 4.4 | State taxation by tax category, 2017-181 |
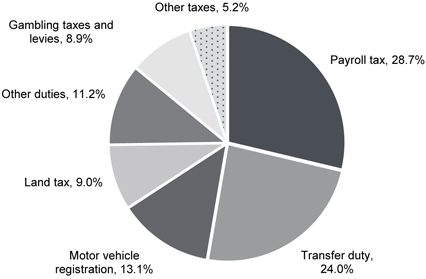
Note:
| 1. | Percentages may not add to 100% due to rounding. “Other duties” includes vehicle registration duty, insurance duty and other minor duties. “Other taxes” includes the Emergency Management Levy, guarantee fees and other minor taxes. |
The largest sources of state taxation revenue are payroll tax and transfer duty, which together represent around 53% of the State’s total taxation revenue in 2017-18.
Payroll tax (28.7% of total tax revenue in 2017-18) has a relatively stable base with growth usually driven by the underlying strength of the State economy. Since the GFC, payroll tax has overtaken transfer duty as the key contributor to Queensland’s tax revenue collections.
In the last few years, payroll tax has been affected by changes in the composition of the payroll tax base, with reductions in collections from the mining and construction industries only partially offset by growth in other industries, such as retail trade.
In contrast, revenue growth from transfer duty (representing 24.0% of tax revenue) can vary significantly from year to year due to the volatility of both the residential and non-residential segments of the property market.
Land tax represents 9.0% of total tax revenue in 2017-18. While also subject to the volatility of value movements in the property market, this impact is moderated by a relatively stable base and the effect of three year averaging of land values for assessments.
Gambling taxes and levies represent 8.9% of tax revenues in 2016-17. Motor vehicle registration represents 13.1% of total tax revenue.
83
Budget Strategy and Outlook 2017-18
| 4.5.1 | Queensland’s competitive tax status |
Taxation can impact on business decisions regarding investment and employment, and also household investment and home ownership. Maintaining the competitiveness of Queensland’s tax system provides a competitive advantage to business and moderates the tax burden for its citizens, and is therefore fundamental to the Government’s commitment to job creation and sustainable development.
One of the Government’s Fiscal Principles is to maintain competitive taxation by ensuring General Government Sector own-source revenue remains at or below 8.5% of nominal gross state product (GSP), on average, across the forward estimates. Own-source revenue is derived from total State revenue less any grants received from external sources, mainly the Australian Government. This principle is expected to be met over the forward estimates period, with own-source revenue well below 8.5% of GSP. Section 3.3 provides more detail on the Government’s Fiscal Principles.
As Chart 4.5 shows, taxation per capita in Queensland is significantly lower than the average taxation per capita in the other states and territories. In 2017-18, it is estimated that Queensland’s taxation per capita of $2,691 will be $843 per capita less than the average of other jurisdictions.
| Chart 4.5 | Taxation per capita, 2017-18 |
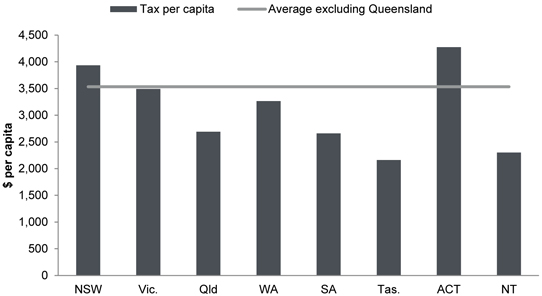
Sources: 2017-18 Budget for all states except NSW, SA where mid-year updates are used, and WA where the Pre-election Financial Projections Statement is used. Population estimates from the 2017-18 Commonwealth Budget.
Table 4.3 demonstrates that the Queensland tax system remains amongst the most competitive in Australia, using various measures of tax competitiveness.
Queensland’s tax effort, as measured by the Commonwealth Grants Commission, was 12% below the national average in 2015-16. A third measure of competitiveness, taxation as a share of GDP, also confirms that Queensland’s taxes are competitive with other states.
84
Budget Strategy and Outlook 2017-18
| Table 4.3 | Queensland’s tax competitiveness |
| | | | | | | | | | | | | | | | | | | | | | | | | | | | | | | | | | | | |
| | | NSW | | | Vic. | | | Qld | | | WA | | | SA | | | Tas.4 | | | ACT5 | | | NT4 | | | Avg6 | |
Taxation per capita1($) | | | 3,936 | | | | 3,492 | | | | 2,691 | | | | 3,267 | | | | 2,660 | | | | 2,161 | | | | 4,332 | | | | 2,304 | | | | 3,534 | |
Taxation effort2 (%) | | | 105 | | | | 101 | | | | 88 | | | | 102 | | | | 103 | | | | 90 | | | | 102 | | | | 85 | | | | 100 | |
Taxation % of GSP3 (%) | | | 5.5 | | | | 5.3 | | | | 4.0 | | | | 3.8 | | | | 4.4 | | | | 4.1 | | | | 4.3 | | | | 2.6 | | | | 5.0 | |
Notes:
| 1. | 2017-18 data. Sources: 2017-18 Budget for all jurisdictions except NSW, SA where mid-year updates are used, and WA which uses the Pre-election Financial Projections Statement. Population data from Commonwealth 2017-18 Budget. |
| 2. | 2015-16 data. Source: Commonwealth Grants Commission 2017 Update – total tax revenue effort for assessed taxes (payroll, transfer duty, land tax, insurance duty and motor vehicle taxes). Revenue raising effort ratios, assessed by the Commonwealth Grants Commission, isolate policy impacts from revenue capacity impacts and are an indicator of the extent to which governments burden their revenue bases. Queensland’s tax revenue raising effort is well below the Australian policy standard (equal to 100%). |
| 3. | 2015-16 data. Sources: Australian Bureau of Statistics 5506.0 and ABS 5220.0. |
| 4. | Low taxation per capita primarily reflects the lower revenue raising capacity of those jurisdictions. |
| 5. | Figures include municipal rates. |
| 6. | Weighted average of states and territories, excluding Queensland (aside from taxation effort, which is the average of all states). |
Payroll tax is chargeable at a rate of 4.75% when the total yearly Australian taxable wages of an employer, or those of a group of related employers, exceed the exemption threshold of $1.1 million.
The overall payroll tax rate of 4.75% is the lowest in Australia and the exemption threshold of $1.1 million is the highest threshold of any mainland state. Queensland employers with total yearly Australian taxable wages between $1.1 million and $5.5 million also obtain a partial deduction, with the deduction withdrawn at a rate of $1 in every $4 of taxable wages. From 1 July 2015, in addition to their wages already being exempt from payroll tax, a 25% payroll tax rebate applied to the wages of eligible apprentices and trainees. To offer an added incentive for businesses to employ apprentices and trainees, the rebate was increased to 50% for 12 months from 1 July 2016. In this Budget, the Government has extended the availability of this increased rate of rebate until 30 June 2018.
Payroll tax collections are estimated to be $3.819 billion in 2017-18, representing growth of 4.1% on the 2016-17 estimated actual. This estimate has been reduced by $221 million since the 2016-17 Budget and reflects the continued impact of reduced collections in 2016-17 from the mining and construction industries.
The mining and construction industries, which have a higher concentration of larger organisations, have experienced subdued collections in recent years consistent with slowing in business investment due to the completion of LNG construction in late 2016. This is also having an impact on employment in industries servicing the resources and construction sectors, such as professional services and equipment hiring.
Collections in recent months have shown signs of improvement, and coupled with continued modest growth from other industries such as retail trade and finance and insurance, moderate growth is expected in 2017-18 and across the estimates period, albeit well below historic levels.
85
Budget Strategy and Outlook 2017-18
The average annual payroll tax growth is forecast to be 4.4% over the five years to 2020-21, almost half the average of 8.5% in the 15 years to 2014-15.
Duties are levied on a range of financial and property transactions. The major duties include transfer, vehicle registration and insurance duties.
Transfer duty
Transfer duty is charged at various rates on the transfer of real and business property. The Queensland Government offers extensive concessions for the transfer of land where the property is purchased as a home. For example, eligible home buyers pay a 1% concessional rate on dutiable values up to $350,000, rather than the normal schedule of rates between 1.5% and 3.5% for those values. If a first home buyer purchases a property up to $500,000 they will pay no duty, with reduced rates available up to $550,000.
Revenue from transfer duty is expected to be 4.1% lower in 2017-18 than in 2016-17, following growth of 10.7% in 2016-17. The growth in 2016-17 has been inflated by several large non-residential transactions although collections have been supported by moderate underlying growth in the residential market.
The reduction of 4.1% in 2017-18 reflects the expectation there will be fewer large transactions along with a restrained residential market, with low price growth expected in a well-supplied apartment market as outlined in Chapter 2. Over the five years to 2020-21, transfer duty is estimated to grow by 4.9% on average per annum.
Vehicle registration duty
Vehicle registration duty is charged at rates of between 2% and 4% of the dutiable value of a motor vehicle on the transfer or initial registration of the motor vehicle, with the rate generally depending on the number of cylinders or rotors of the vehicle.
Revenue from vehicle registration duty is expected to grow by 4.0% in 2017-18, following growth of 2.4% in 2016-17.
Insurance duty
Insurance duty is charged on contracts of general insurance (for example, insurance for house and contents, vehicle, professional indemnity), life insurance, compulsory third party insurance and accident insurance. Revenue from insurance duty is expected to grow by 4.7% in 2017-18.
| 4.5.4 | Gambling taxes and levies |
A range of gambling activities are subject to State taxes and levies. Total gambling tax and levy collections are estimated to grow by 4.4% in 2017-18, and 3.4% on average over the five years to 2020-21.
86
Budget Strategy and Outlook 2017-18
Land tax is levied on the taxable value of the landowner’s aggregated holdings of freehold land owned in Queensland as at midnight on 30 June each year. The principal place of residence is deducted from this value.
Resident individuals are generally liable for land tax if the total taxable value of the freehold land owned by that person as at 30 June is equal to or greater than $600,000. Companies, trustees and absentees are liable for land tax if the total taxable value of the freehold land owned as at 30 June is equal to or greater than $350,000.
Land tax is estimated to grow by 9.7% to $1.192 billion in 2017-18, reflecting growth in land values in recent years. Some moderation in property value growth is expected in the next few years, with the average annual growth of 7.4% over the five years to 2020-21 boosted by additional collections from the absentee surcharge.
| 4.5.6 | Motor vehicle registration |
Motor vehicle registration fees are expected to grow by 3.9% in 2017-18. Average annual growth across the five years to 2020-21 will reflect an increase in the number of motor vehicles as well as the annual indexation of fees.
| 4.5.7 | Emergency Management levy |
The Emergency Management Levy revenue, which is used to partly offset the costs of emergency management in Queensland, is expected to grow by 5.4% in 2017-18.
Guarantee fees are revenues collected by the Queensland Treasury Corporation (QTC) on behalf of the State and comprise competitive neutrality fees and credit margin fees. These fees promote competitive neutrality between public sector agencies and those in the private sector, and ensure that the benefits accruing from the financial backing of the State (through QTC) are shared between the borrower and the State.
Other taxes represent revenue from taxes such as the Statutory Insurance Scheme levy and the Nominal Defendant levy.
Tax expenditures are reductions in tax revenue that result from the use of the tax system as a policy tool to deliver Government policy objectives. Tax expenditures are provided through a range of concessions, including tax exemptions, reduced tax rates, tax rebates, tax deductions and provisions which defer payment of a tax liability to a future period. Appendix B provides details of tax expenditure arrangements currently provided by the Queensland Government.
87
Budget Strategy and Outlook 2017-18
Grants revenue is comprised of Australian Government grants, grants from the community and industry, and other miscellaneous grants. The decline of $77 million (or 0.3%) in 2017-18 reflects a $546 million increase in current grants that is offset by a $623 million decrease in capital grants. The decline in capital grants from 2016-17 to 2017-18 primarily reflects a shift in the timing of NDRRA funding, relating to prior disaster events, reducing revenue in 2017-18.
| | | | | | | | | | | | | | | | | | | | | | | | |
| | | 2015-16
Actual
$ million | | | 2016-17
Est. Act.
$ million | | | 2017-18
Budget
$ million | | | 2018-19
Projection
$ million | | | 2019-20
Projection
$ million | | | 2020-21
Projection
$ million | |
Current grants | | | | | | | | | | | | | | | | | | | | | | | | |
Australian Government grants | | | 22,062 | | | | 24,394 | | | | 25,004 | | | | 25,396 | | | | 26,182 | | | | 27,306 | |
Other grants and contributions | | | 284 | | | | 359 | | | | 295 | | | | 268 | | | | 266 | | | | 265 | |
Total current grants | | | 22,347 | | | | 24,753 | | | | 25,299 | | | | 25,663 | | | | 26,448 | | | | 27,571 | |
Capital grants | | | | | | | | | | | | | | | | | | | | | | | | |
Australian Government grants | | | 1,368 | | | | 2,876 | | | | 2,258 | | | | 2,104 | | | | 2,187 | | | | 1,436 | |
Other grants and contributions | | | 26 | | | | 79 | | | | 73 | | | | 57 | | | | 47 | | | | | |
Total capital grants | | | 1,394 | | | | 2,955 | | | | 2,332 | | | | 2,161 | | | | 2,234 | | | | 1,436 | |
Total grants revenue | | | 23,740 | | | | 27,708 | | | | 27,631 | | | | 27,824 | | | | 28,682 | | | | 29,007 | |
Note:
| 1. | Numbers may not add due to rounding. |
| 4.6.1 | Australian Government payments |
Australian Government payments to Queensland comprise:
| • | | general purpose payments, consisting of GST revenue grants and associated payments, which are ‘untied’ and are used for both recurrent and capital purposes |
| • | | payments for specific purposes, including grants for health, schools, skills and workforce development, disabilities and housing, which are used to meet Australian Government and shared policy objectives. |
Australian Government payments to Queensland in 2017-18 are expected to total $27.263 billion, representing a slight decline of $7 million compared to payments in 2016-17. This small decrease is made up of a $932 million (or 6.7%) increase in GST revenue being offset by a $939 million decrease in total payments for specific purposes.
88
Budget Strategy and Outlook 2017-18
| Table 4.5 | Australian Government payments1 |
| | | | | | | | | | | | | | | | | | | | | | | | |
| | | 2015-16
Actual
$ million | | | 2016-17
Est. Act.
$ million | | | 2017-18
Budget
$ million | | | 2018-19
Projection
$ million | | | 2019-20
Projection
$ million | | | 2020-21
Projection
$ million | |
GST revenue grants2 | | | 13,122 | | | | 13,939 | | | | 14,871 | | | | 14,490 | | | | 15,042 | | | | 15,772 | |
Total payments for specific purposes3 | | | 10,308 | | | | 13,331 | | | | 12,392 | | | | 13,009 | | | | 13,326 | | | | 12,970 | |
Total Australian Government payments | | | 23,430 | | | | 27,270 | | | | 27,263 | | | | 27,499 | | | | 28,368 | | | | 28,742 | |
Notes:
| 1. | Numbers may not add due to rounding. |
| 2. | Queensland Treasury estimates. |
| 3. | Differs from Chapter 7 due to the inclusion of direct Australian Government payments to Queensland agencies for Commonwealth own purpose expenditure. |
Chapter 7 provides detailed background on federal-state financial arrangements, including an analysis of Queensland’s share of GST revenue and details of Australian Government payments to Queensland.
GST revenue grants and associated payments
GST revenue grants and associated payments to Queensland in 2017-18 are expected to be $14.871 billion, which represents growth of $932 million compared to the 2016-17 estimated actual.
GST revenue projections are based on expected growth in economic parameters, such as household consumption and dwelling investment, which have a strong link to the GST base. In the 2017-18 Budget, the Australian Government has decreased their estimate for the GST pool by $2.500 billion over the period 2016-17 to 2019-20 since the 2016-17 MYEFO.
The distribution of GST revenues is based on the recommendations of the Commonwealth Grants Commission in accordance with the application of horizontal fiscal equalisation principles. Queensland’s share of GST funding (relativity) in 2017-18 increased in the 2017 Update from the Commonwealth Grants Commission. Chapter 7 provides further detail on Queensland’s expected GST revenue.
Payments for specific purposes
Australian Government payments for specific purposes to Queensland in 2017-18 are estimated at $12.392 billion. Chapter 7 provides further detail on Australian Government payments for specific purposes.
89
Budget Strategy and Outlook 2017-18
| 4.6.2 | Other grants and contributions |
Other grants and contributions are funds received from other state and local government agencies, other bodies and individuals. Contributions exclude Australian Government grants and user charges. The main sources of contributions are:
| • | | Those received from private enterprise and community groups to fund research projects and community services, including the contributions of parents and citizens associations to state schools. |
| • | | Contributed assets and goods and services received for a nominal amount. |
Revenues from other grants and contributions will vary from year to year based on the number and size of research projects, assets transferred between the Government and the private sector, and contributed assets and services.
The State earns royalties from the extraction of coal, base and precious metals, bauxite, petroleum and gas, mineral sands and other minerals. Royalties ensure some of the proceeds of the extraction of non-renewable resources are returned to the community. Land rents are also earned from pastoral holdings, mining and petroleum leases. Royalties and land rents are detailed in Table 4.6.
| Table 4.6 | Royalties and land rents1 |
| | | | | | | | | | | | | | | | | | | | | | | | |
| | | 2015-16
Actual
$ million | | | 2016-17
Est. Act.
$ million | | | 2017-18
Budget
$ million | | | 2018-19
Projection
$ million | | | 2019-20
Projection
$ million | | | 2020-21
Projection
$ million | |
Coal | | | 1,705 | | | | 3,376 | | | | 2,750 | | | | 2,241 | | | | 2,222 | | | | 2,260 | |
Petroleum2 | | | 36 | | | | 97 | | | | 147 | | | | 194 | | | | 248 | | | | 296 | |
Other royalties3 | | | 381 | | | | 365 | | | | 402 | | | | 426 | | | | 441 | | | | 435 | |
Land rents | | | 162 | | | | 167 | | | | 172 | | | | 178 | | | | 184 | | | | 189 | |
Total royalties and land rents | | | 2,284 | | | | 4,005 | | | | 3,472 | | | | 3,039 | | | | 3,096 | | | | 3,180 | |
Notes:
| 1. | Numbers may not add due to rounding. |
| 3. | Includes base and precious metals and other minerals royalties. |
Since the 2016-17 Budget, royalty revenue has been revised up by $3.707 billion across the period 2016-17 to 2019-20. Royalty revenue in 2016-17 is now expected to be 80.9% higher in 2016-17 than in 2015-16. This is mainly caused by changes to coal prices, which have been highly volatile in the past year. Coal spot prices increased sharply in the last few months of 2016-17, before falling in the first quarter of 2017 and increasing again following STC Debbie. While coal volumes were also negatively impacted by STC Debbie in 2016-17, this has been offset by increased price estimates.
90
Budget Strategy and Outlook 2017-18
After the significant increase in 2016-17, royalties are expected to decline by 14.0% in 2017-18 as coal prices progressively decline from their short-term peak towards a medium term price estimate of US$115/tonne.
There is a high degree of uncertainty associated with estimates of commodity prices, which can have significant impacts on royalty revenue. Price volatility and other issues such as the level of exposure of mining operations to the risk of natural disasters can cause a high level of volatility in royalty estimates. At the same time, the contribution of royalties to overall revenue growth and volatility is limited by its quantum. Royalties make up only 5.9% of total revenue in 2017-18, compared to 23.8% for state taxes and 26.6% for GST.
While coal prices have contributed a large degree of volatility to royalty estimates in 2016-17 and 2017-18, estimated average annual growth across the period 2015-16 to 2020-21 is 7.1%. This is supported by growth in coal volumes over the period, a medium term coal price estimate that is stronger than the 2015-16 year average, and growth in LNG export volumes. Estimates of the A$-US$ exchange rate remain unchanged since MYFER, with the exchange rate assumed to remain flat across the forward estimates.
Assumptions underlying the royalty estimates, and the sensitivity of royalty estimates to changes in the assumptions are contained in Appendix C.
Chart 4.6 shows coking coal price forecasts compared to previous estimates and Consensus Economics forecasts. Budget coal price forecasts are similar to the most recent forecasts available in Consensus Economics reports, with a degree of conservatism from 2017-18.
| Chart 4.6 | Coking coal price forecasts by iteration1 |
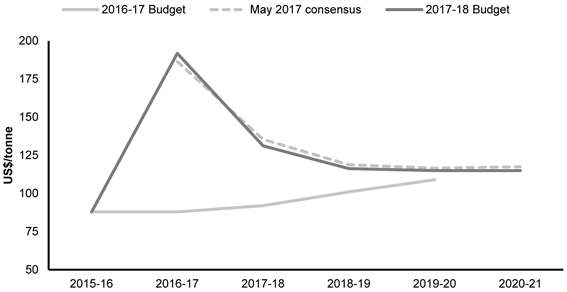
Sources: Queensland State Budget 2016-17 and 2017-18 and Consensus Economics Energy and Metals May 2017.
91
Budget Strategy and Outlook 2017-18
Hard coking coal prices increased sharply in the second half of 2016. This was driven by a range of factors, including a program of rationalisation for China’s coal production, as well as logistical bottlenecks and seaborne supply constraints. In the MYFER, coking coal price estimates assumed a steady decline from a peak in the December 2016 quarter as supply constraints eased.
Since the MYFER, further upwards revisions have been made to coal prices in 2016-17, with the March quarter benchmark contract price being stronger than expected. While coal spot prices declined rapidly in the early months of 2017, prices increased again following STC Debbie. Disruptions in coal rail networks following the cyclone also reduced expected coal volumes towards the end of 2016-17.
On a year average basis, the premium hard coking coal price is expected to increase 118% in 2016-17 to US$192/tonne, compared to US$88/tonne in 2015-16.
Similar periods of short-term royalty growth have been experienced in the past. Royalty revenues reached a peak in 2008-09, as coal contracts had been priced at record levels prior to the onset of the GFC, then fell significantly in 2009-10 as a result of falling coal contract prices. While prices increased again during 2011, this was accompanied by reduced volumes from the impact of the 2010-11 natural disasters.
| Chart 4.7 | Coking coal price |
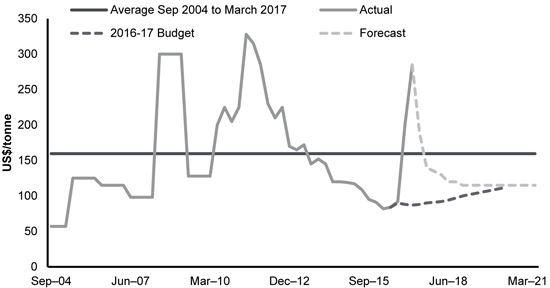
Sources: Consensus Economics and Queensland Treasury.
Royalty revenue is expected to exceed 2008-09 levels for the first time in 2016-17, then decrease in 2017-18 and 2018-19, with the coal price expected to decline steadily to US$131/tonne in 2017-18 and a medium term price of US$115/tonne during 2018-19. Royalty estimates are $1.897 billion (97.7%) higher in 2016-17 and $1.190 billion (56.4%) higher in 2017-18 than estimated in the 2016-17 Budget.
92
Budget Strategy and Outlook 2017-18
Recent upward revisions to royalties follow significant reductions in expectations, with royalty revenue having been revised down in each subsequent budget update between the 2014-15 Budget and the 2016-17 Budget. Coal royalty estimates in 2016-17 are now expected to exceed estimates made in the 2014-15 Budget, despite having been revised down significantly in the interim, but remain lower in 2017-18.
However, as the sharp increase in coal prices is not expected to be sustained, less substantial upwards revisions to coal royalty revenue are expected in 2018-19 ($446 million) and 2019-20 ($175 million) compared to the 2016-17 Budget. The royalty impact of changes to coal price expectations compared to previous budgets is shown in Chart 4.8.
| Chart 4.8 | Coal royalty revenue since the 2014-15 Budget |
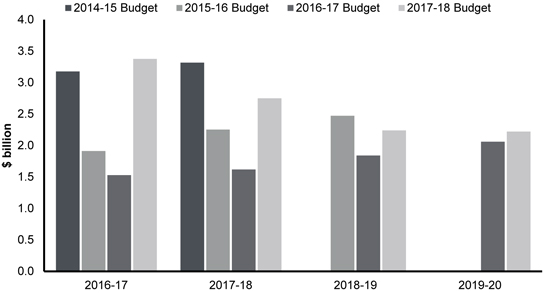
Oil prices are related to LNG prices and therefore factor strongly into royalty forecasts. Since the 2016-17 Budget, estimates of oil prices have changed only marginally. Across the forward estimates, oil prices are expected to improve gradually, with assumptions incorporating some conservatism compared to Consensus Economics forecasts (see Chart 4.9). Petroleum royalties have been revised upward by $29 million in 2016-17 since the 2016-17 Budget, reflecting higher than forecast collections.
Slight reductions to LNG export volume assumptions have contributed to small downwards revisions in petroleum royalties from 2018-19 since the 2016-17 Budget.
93
Budget Strategy and Outlook 2017-18
| Chart 4.9 | Brent Oil price forecasts, by iteration |
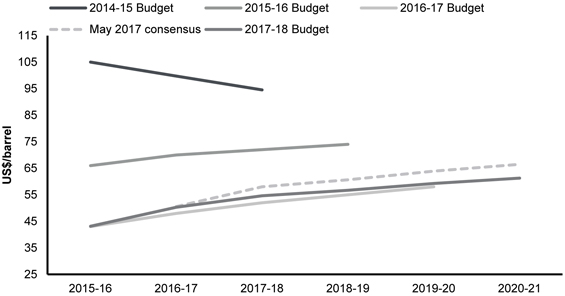
Source: Queensland State Budgets 2014-15 to 2017-18 and Consensus Economics Energy and Metals May 2017.
Other royalties includes revenue from metals mined in Queensland such as copper, lead and zinc and other minerals including bauxite. Revenue from other royalties is expected to grow 10.1% in 2017-18, supported by price increases. This follows a decline of 4.1% in 2016-17 associated with reduced exports for a number of metals, including lead and zinc.
Revenue from land rents derived from mining and petroleum leases and pastoral holdings are expected to grow 3.3% in 2017-18, following growth of 2.8% in 2016-17.
94
Budget Strategy and Outlook 2017-18
| Box 4.1 | Policy approach for future mineral development |
The Government has introduced a new policy approach for the future mineral development projects in the Galilee and Surat Basins, the North West Minerals Province and undeveloped gas basins to provide investor certainty and encourage new mining development opportunities in these regions. This revised model will apply to future resource development proposals in the three regions and replace the ad hoc approach of the past. The principles-based framework requires:
| • | | all royalties due to the State are paid over the term of any agreement (inclusive of interest foregone costs), with security of payment and no adverse budget impact to the State |
| • | | any agreement with a proponent will not involve the direct expenditure of public funds in the project or in directly-related economic infrastructure for that project (noting that government-owned corporations (GOCs) may still supply economic infrastructure on commercial terms to resource project proponents) |
| • | | the provision by the proponent of third party access infrastructure or other acceptable economic infrastructure to the State |
| • | | projects must have significant regional employment, generation of royalties and economic opportunity benefits, such as the potential to assist in opening up undeveloped resource basins. |
| 4.8 | Sales of goods and services |
Sales of goods and services revenue comprises cost recoveries from providing goods or services. Table 4.7 provides a breakdown of the category.
The Government provides concessions in the form of discounts, rebates and subsidies to improve access to and the affordability of a range of services for individuals or families, based on eligibility criteria relating to factors such as age, income and special needs or disadvantage. Appendix A provides details of the concession arrangements provided by the Queensland Government.
95
Budget Strategy and Outlook 2017-18
| Table 4.7 | Sales of goods and services1 |
| | | | | | | | | | | | | | | | | | | | | | | | |
| | | 2015-16
Actual
$ million | | | 2016-17
Est. Act.
$ million | | | 2017-18
Budget
$ million | | | 2018-19
Projection
$ million | | | 2019-20
Projection
$ million | | | 2020-21
Projection
$ million | |
Fee for service activities | | | 2,644 | | | | 2,522 | | | | 2,661 | | | | 2,503 | | | | 2,592 | | | | 2,609 | |
Public Transport: South East Queensland | | | 377 | | | | 352 | | | | 338 | | | | 344 | | | | 354 | | | | 363 | |
Rent revenue | | | 546 | | | | 582 | | | | 597 | | | | 631 | | | | 665 | | | | 702 | |
Sale of land inventory | | | 91 | | | | 76 | | | | 85 | | | | 143 | | | | 113 | | | | 91 | |
Hospital fees | | | 772 | | | | 834 | | | | 857 | | | | 874 | | | | 889 | | | | 898 | |
Transport and traffic fees | | | 381 | | | | 397 | | | | 414 | | | | 432 | | | | 449 | | | | 466 | |
Other sales of goods and services | | | 1,116 | | | | 1,068 | | | | 1,114 | | | | 1,174 | | | | 1,206 | | | | 1,238 | |
Total sales of goods and services | | | 5,926 | | | | 5,830 | | | | 6,067 | | | | 6,101 | | | | 6,268 | | | | 6,366 | |
Note:
| 1. | Numbers may not add due to rounding. |
| 4.8.1 | Fee for service activities |
Major items of fee for service activities across the General Government Sector include:
| • | | recoverable works carried out by the Department of Transport and Main Roads and the commercialised arm of the department |
| • | | fees charged by Technical and Further Education (TAFE) colleges |
| • | | fees charged by CITEC to commercial clients for information brokerage services. |
| 4.8.2 | Other sales of goods and services |
As shown in Table 4.7, there are a variety of other types of sales of goods and services and these are discussed in more detail below:
| • | | Revenues arising from the arrangements associated with South East Queensland integrated ticketing and public transport arrangements, which commenced in July 2004. A new fare structure commenced in December 2016, which included extending the fare freeze by six months. |
| • | | Rent revenue is earned on the rent or lease of Government buildings, housing, plant and equipment and car parks. Major items under this category include public housing rentals and rents charged for Government buildings. |
| • | | Sale of land inventory includes property transactions where it is a core business of the agency, such as Economic Development Queensland’s role to facilitate land to unlock economic growth opportunities. |
| • | | Hospital fees are collected by public hospitals for a range of hospital services. Fees include those received from private patients and other third party payers, as well as payments received from the Australian Government Department of Veterans’ Affairs for the treatment of veterans. |
96
Budget Strategy and Outlook 2017-18
| • | | Transport and traffic fees comprise state transport fees, the Traffic Improvement Fee, drivers’ licence fees and various marine licence and registration fees. |
| • | | Other sales of goods and services include items such as Title Registration Fees, recreational ship registrations and other licences and permits. |
Interest income is estimated to account for 4.2% of total General Government Sector revenue in 2017-18. Interest income is expected to decline between 2017-18 and 2020-21, reflecting a reduction in the portfolio of financial assets held for defined benefit superannuation as a result of the implementation of the Debt Action Plan. Interest income is also affected by the $500 million reallocation from the Queensland Government Insurance Fund to partly offset the Government’s response to STC Debbie, which is discussed in Chapter 3.
Interest income primarily comprises interest earned on investments, including those held for superannuation and insurance purposes.
| 4.10 | Dividend and income tax equivalent income |
Dividend and income tax equivalent income accounts for 3.7% of total General Government Sector revenue in 2017-18.
Dividends are received from the State’s equity investments in Public Non-financial Corporations and Public Financial Corporations, for example, the Queensland electricity supply industry, QIC Limited, Queensland Treasury Corporation, port authorities and Queensland Rail. Income tax equivalent income comprises payments by government-owned corporations in lieu of state and Australian Government taxes and levies from which they are exempt. These payments arise from an agreement reached between the Australian Government and state governments in 1994 to establish a process for achieving tax uniformity and competitive neutrality between public sector and private sector trading activities.
Revenue from dividend and income tax equivalent income is expected to decline over the period 2016-17 to 2020-21, mainly due to declining payments from energy network businesses.
Dividend and income tax equivalent income payments from energy network business are estimated to decline in 2017-18 due to the new 2017-2022 Powerlink revenue determination, which provides for lower annual revenues than the previous determination. Low regulated revenue growth among the network businesses over the forward estimates are also expected to lead to decreasing dividends. Trends in dividends and income tax equivalent income are discussed in more detail in Chapter 8.
Dividend and income tax equivalent income does not represent the full extent of financial arrangements between the Public Non-financial Corporations Sector and the General Government Sector. As detailed in Chapter 8, General Government Sector expenditure on community service obligations and Transport Service Contracts are expected to be over $2.2 billion in each year from 2016-17.
97
Budget Strategy and Outlook 2017-18
Other revenue, including royalty revenue, accounts for 8.0% of total General Government Sector revenue in 2017-18. Royalties themselves account for 5.9% of revenue in 2017-18, and are discussed in section 4.7.
| | | | | | | | | | | | | | | | | | | | | | | | |
| | | 2015-16
Actual
$ million | | | 2016-17
Est. Act.
$ million | | | 2017-18
Budget
$ million | | | 2018-19
Projection
$ million | | | 2019-20
Projection
$ million | | | 2020-21
Projection
$ million | |
Royalties and land rents | | | 2,284 | | | | 4,005 | | | | 3,472 | | | | 3,039 | | | | 3,096 | | | | 3,180 | |
Fines and forfeitures | | | 514 | | | | 398 | | | | 427 | | | | 451 | | | | 474 | | | | 494 | |
Revenue not elsewhere classified | | | 779 | | | | 710 | | | | 589 | | | | 585 | | | | 572 | | | | 579 | |
Total other revenue | | | 3,577 | | | | 5,113 | | | | 4,487 | | | | 4,075 | | | | 4,142 | | | | 4,253 | |
Note:
| 1. | Numbers may not add due to rounding. |
| 4.11.1 | Fines and forfeitures |
The major fines and infringements included in this category are issued by the Department of Transport and Main Roads (DTMR) and Queensland Police Service (QPS), incorporating fixed and mobile camera offences, speeding and tolling offences. Revenue from fines and forfeitures are expected to grow by 7.2% in 2017-18.
The expected 22.6% decrease in 2016-17 relates mainly to reduced referrals of tolling offences to the State Penalties Enforcement Registry (SPER). This results from an agreement with the toll road operator that provides increased opportunities for customers to pay their outstanding tolls prior to referral to the State for issuing an infringement and amends the decisions made in 2014 that resulted in increased fines for tolling offences being referred to SPER.
| Table 4.9 | Fines and forfeitures1 |
| | | | | | | | | | | | | | | | | | | | | | | | |
| | | 2015-16
Actual
$ million | | | 2016-17
Est. Act.
$ million | | | 2017-18
Budget
$ million | | | 2018-19
Projection
$ million | | | 2019-20
Projection
$ million | | | 2020-21
Projection
$ million | |
Red light camera fines | | | 12 | | | | 11 | | | | 12 | | | | 13 | | | | 14 | | | | 15 | |
Speed camera fines | | | 164 | | | | 133 | | | | 153 | | | | 169 | | | | 184 | | | | 194 | |
Other camera detected offences | | | 7 | | | | 5 | | | | 5 | | | | 5 | | | | 5 | | | | 6 | |
Other fines and forfeitures | | | 332 | | | | 249 | | | | 256 | | | | 264 | | | | 271 | | | | 280 | |
Total fines and forfeitures | | | 514 | | | | 398 | | | | 427 | | | | 451 | | | | 474 | | | | 494 | |
Note:
| 1. | Numbers may not add due to rounding. |
| 4.11.2 | Revenue not elsewhere classified |
The $121 million decrease in 2017-18 includes reductions in sundry revenue and donations across a number of departments.
98
Budget Strategy and Outlook 2017-18
Features
| • | | The Government remains committed to job creation and reducing cost-of-living pressures for Queenslanders with expense measures announced since the 2016-17 Budget focusing on these key issues. |
| • | | Expenses for 2016-17 are estimated to be $53.610 billion, an increase of $3.585 billion (or 7.2%) from 2015-16. The increase is due to growth funding to support ongoing demand for health services and student enrolments, job creation programs, the electricity affordability package and the Australian Government’s advance payment of financial assistance grants to local governments for 2017-18 in 2016-17. |
| • | | Total expenses are projected to grow at an average annual rate of 3.2% over the five years to 2020-21 compared to average annual revenue growth of 3.0% over the same period. |
| • | | In 2017-18, General Government Sector expenses are estimated to be $55.723 billion, an expected increase of $2.113 billion (or 3.9%) over the estimated actual for 2016-17. The increase is a result of continued demand growth in education and health services, expenditure in relation to the preparation and delivery of the Gold Coast 2018 Commonwealth Games and expense measures announced since the 2016-17 Budget with a key focus on jobs and economic growth including: |
| | • | | Works for Queensland program providing funding across 65 regional councils to support jobs and deliver vital infrastructure in regional Queensland. |
| | • | | Jobs and Regional Growth package targeted at growing regional economies and improving employment outcomes for young Queenslanders. |
| | • | | Additional funding for the Back to Work Regional Employment Package and a new allocation for Back to Work in South East Queensland. |
| • | | Severe Tropical Cyclone (STC) Debbie recovery activities are expected to increase expenses by $700 million over the period 2016-17 to 2019-20. |
| • | | The average growth in employee expenses over the five years to 2020-21 is 4.1% per annum, reflecting growth in full time equivalents (FTEs) and the Government’s wages policy. |
| • | | In 2017-18, the major areas of expenditure are health and education, which together constitute approximately 53.7% of General Government Sector expenses. |
This chapter provides an overview of General Government Sector expenses for the estimated actual for 2016-17, forecasts for the 2017-18 Budget year and projections for 2018-19 to 2020-21. The forward estimates are based on the economic projections outlined in Chapter 2.
99
Budget Strategy and Outlook 2017-18
| 5.1 | 2016-17 estimated actual |
General Government Sector expenses in 2016-17 are estimated to be $53.610 billion, $683 million higher than the 2016-17 Mid Year Fiscal and Economic Review (MYFER) estimate. The increase since MYFER is largely driven by an increase in grant expenses, in particular the Government’s $771 million electricity affordability package aimed at reducing the impact of electricity price increases to Queenslanders.
| 5.2 | 2017-18 Budget and out-years |
| Table 5.1 | General Government Sector expenses1 |
| | | | | | | | | | | | | | | | | | | | | | | | |
| | | 2015-16
Actual
$ million | | | 2016-17
Est. Act.
$ million | | | 2017-18
Budget
$ million | | | 2018-19
Projection
$ million | | | 2019-20
Projection
$ million | | | 2020-21
Projection
$ million | |
Employee expenses | | | 20,044 | | | | 21,203 | | | | 22,420 | | | | 22,724 | | | | 23,696 | | | | 24,561 | |
Superannuation interest costs | | | 767 | | | | 514 | | | | 600 | | | | 637 | | | | 664 | | | | 668 | |
Other superannuation expenses | | | 2,507 | | | | 2,707 | | | | 2,753 | | | | 2,749 | | | | 2,752 | | | | 2,781 | |
Other operating expenses | | | 15,000 | | | | 15,932 | | | | 17,037 | | | | 15,959 | | | | 16,076 | | | | 16,346 | |
Depreciation and amortisation | | | 2,927 | | | | 3,009 | | | | 3,093 | | | | 3,194 | | | | 3,327 | | | | 3,457 | |
Other interest expenses | | | 2,220 | | | | 1,702 | | | | 1,706 | | | | 1,690 | | | | 1,671 | | | | 1,755 | |
Grants expenses | | | 6,559 | | | | 8,543 | | | | 8,114 | | | | 9,068 | | | | 8,996 | | | | 9,006 | |
Total Expenses | | | 50,025 | | | | 53,610 | | | | 55,723 | | | | 56,021 | | | | 57,183 | | | | 58,574 | |
Note:
| 1. | Numbers may not add due to rounding. |
General Government Sector expenses of $55.723 billion in 2017-18 represent an increase of $2.113 billion (or 3.9%) over the 2016-17 estimated actual. Factors influencing the higher expenditure in 2017-18 include:
| • | | an estimated $750 million in the preparation and delivery of the Gold Coast 2018 Commonwealth Games |
| • | | growth in education expenditure reflecting student enrolment growth in state schools, enterprise bargaining outcomes and other school based cost increases including school maintenance, election commitment funding for extra teachers and school guidance officers, maintaining secondary curriculum offerings for the half cohort of students going into senior secondary and additional funding from the Australian Government’s proposed Quality Schools program, including funding for non-state schools |
| • | | growth in funding to Queensland Health to support growing demand and critical service needs and Commonwealth funded expenditure deferred from 2016-17 |
100
Budget Strategy and Outlook 2017-18
| • | | job creation funding for Works for Queensland, Back to Work Regional Employment Package and Back to Work South East Queensland and Jobs and Regional Growth package |
| • | | community services initiatives including Strengthening Queensland Child Protection System with a significant boost to frontline and frontline support child safety workers and continuing support of the transition of disability services to the National Disability Insurance Scheme |
| • | | justice system reforms including reforms to the Queensland parole and probation system, transitioning 17 year olds from the adult justice system to the youth justice system and re-establishment of the Drug Court. |
Growth in 2017-18 expenses is partly offset by the one-off electricity affordability grant in 2016-17, the Australian Government’s advance payment of financial assistance grants to local governments in 2016-17 for 2017-18 and whole-of-Government reprioritisation expense measures (refer to Budget Measures – Budget Paper 4).
| 5.3 | Expenses by operating statement category |
As outlined in Chart 5.1, the largest expense categories in the General Government Sector in 2017-18 are employee and superannuation expenses (46.2%), followed by other operating expenses (30.6%) that reflect non-labour costs of service.
| Chart 5.1 | Expenses by operating statement category, 2017-181 |
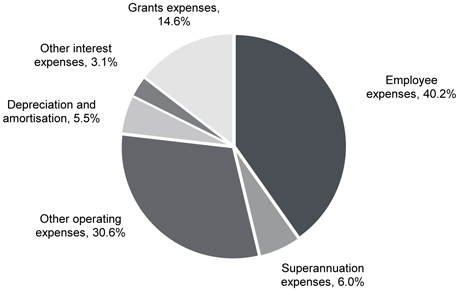
Note:
| 1. | Percentages may not add to 100% due to rounding. |
101
Budget Strategy and Outlook 2017-18
Chart 5.2 compares the 2016-17 estimated actual expenses for each operating statement category with the 2017-18 Budget. Growth in the two largest categories, employee expenses and other operating expenses, is contributing most to growth in 2017-18.
| Chart 5.2 | Expenses by operating statement category |
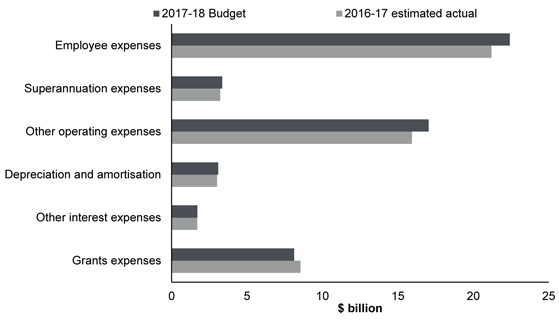
Employee expenses include salaries and wages, annual leave and long service leave.
In 2017-18, employee expenses are expected to be $22.420 billion, $1.217 billion or 5.7% higher than the 2016-17 estimated actual. This reflects both growth in full-time equivalents (FTEs) and the Government’s 2.5% wages policy. Much of the increase in employee expenses in 2017-18 is in the key frontline service areas of health and education.
102
Budget Strategy and Outlook 2017-18
Full-time equivalents
Chart 5.3 shows actual FTEs from 2005-06 to 2015-16 and estimated FTEs from 2016-17 to 2020-21.
| Chart 5.3 | Departmental FTEs |
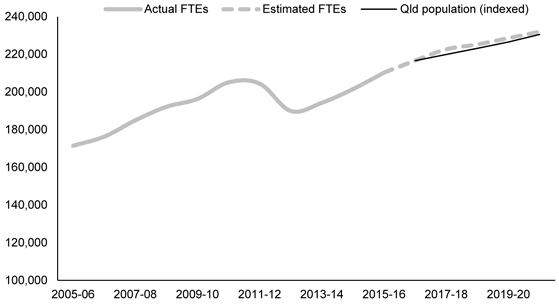
During the 2015 election, the Government made commitments to revitalise frontline service delivery. This resulted in FTEs increasing 8,764 (or 4.3%) between 2014-15 and 2015-16, and an estimated further 6,350 (or 3.0%) in 2016-17. Of the increase across the two years, almost 90% was in the key frontline service delivery areas of health, education and police. As at March 2017, 91.2% of public servants were engaged in frontline and frontline support roles.
FTE growth is moderating. FTEs are estimated to increase by around 6,000 (or 2.8%) in 2017-18, with around 82% of the increase being attributable to growth in health and education. These additional FTEs will continue to reduce the number of patients waiting longer than the recommended time, relieve pressure on class sizes and continue to improve student outcomes.
Given the tight fiscal environment and the fact that employee expenses represent the State’s largest expense category, the Government introduced a new fiscal principle in the 2016-17 Budget to maintain a sustainable public service where overall growth in FTEs, on average over the forward estimates, does not exceed population growth.
The overall average annual growth rate over 2016-17 to 2020-21, based on current estimates, is 1.7%. This compares to an estimated Queensland population growth of 1.5% annually. To monitor progress towards achieving this, the Queensland Public Service Commission collects agency workforce data on a quarterly basis for analysis and reporting purposes.
103
Budget Strategy and Outlook 2017-18
| Box 5.1 | Improving the quality of reporting |
The State Government is continuing to take strong steps to achieve the fiscal principle to maintain a sustainable public service by ensuring that overall growth in full-time equivalents (FTE) employees, on average over the forward estimates, does not exceed population growth.
The primary data collection tool to monitor performance against the principle is the Minimum Obligatory Human Resource Information (MOHRI) data collection process, which not only captures the number of FTEs, but also qualitative information about the FTEs, including regional data.
As noted in last year’s Budget Strategy and Outlook (Budget Paper 2), the MOHRI data and Budget FTE data are not directly comparable due to differences in methodology.
While the quality of the MOHRI data is improving, Queensland Treasury will work with the PSC to improve data collection and quality, including seasonable variability and indirect employment (including the use of labour hire, contractors and consultants).
Queensland Treasury will also enhance its reporting to the Government on the implications of the data for the fiscal principle, fiscal sustainability and frontline service delivery, including employment levels in regional Queensland.
While FTE growth is moderating compared to past results, it remains above population growth, and the Government will continue to provide a significant focus on FTEs over the coming year.
In particular, the whole-of-sector approach to prioritising efforts and moving staff to meet these changing priorities will continue. This approach not only allows the Government to manage the growth in FTEs, but it also provides valuable opportunities and experience for public servants.
A number of strategies have already been introduced to enhance and promote mobility opportunities across the public sector. These include:
| • | | the implementation of a talent mobility pilot program to focus primarily on employees impacted by the National Disability Insurance Scheme (NDIS) in the Department of Communities, Child Safety and Disability Services, and entry-level administrative roles |
| • | | providing opportunities for existing staff across the public service to be involved in the planning for the Commonwealth Games 2018 |
| • | | implementing initiatives to provide potential leaders with opportunities to support their leadership development. |
The Government is also committed to ensuring that public service staff are located where they are needed in the community. Around 30% of FTEs are located outside of South East Queensland, consistent with population share. Regional Action Plans show increases in key service delivery occupations across the regions.
The devolved frontline service delivery models used in some agencies continue to present challenges to FTE estimation and monitoring, in particular where funding is provided in such a way that agencies determine how to most efficiently deliver services. Consistent with last year, the 2017-18 Budget FTE estimates build in an allowance for this.
104
Budget Strategy and Outlook 2017-18
Table 5.2 shows the funded FTE positions by department and is consistent with agency Service Delivery Statements.
| Table 5.2 | Funded controlled FTE positions by Department1 |
| | | | | | | | | | | | |
| | | 2016-17
Budget | | | 2016-17
Est. Act | | | 2017-18
Budget | |
Aboriginal and Torres Strait Islander Partnerships2 | | | 351 | | | | 315 | | | | 315 | |
Agriculture and Fisheries | | | 2,057 | | | | 2,057 | | | | 2,089 | |
Communities, Child Safety and Disability Services3 | | | 5,948 | | | | 6,031 | | | | 5,944 | |
Education and Training (total-disaggregation below)4 | | | 72,872 | | | | 72,710 | | | | 73,964 | |
Electoral Commission of Queensland | | | 55 | | | | 55 | | | | 56 | |
Energy and Water Supply | | | 224 | | | | 227 | | | | 228 | |
Environment and Heritage Protection5 | | | 1,109 | | | | 1,211 | | | | 1,299 | |
Housing and Public Works | | | 2,962 | | | | 2,999 | | | | 3,017 | |
Infrastructure, Local Government and Planning | | | 516 | | | | 547 | | | | 560 | |
Justice and Attorney-General6,7 | | | 8,650 | | | | 8,892 | | | | 9,603 | |
National Parks, Sport and Racing8 | | | 1,369 | | | | 1,424 | | | | 1,444 | |
Natural Resources and Mines | | | 2,440 | | | | 2,441 | | | | 2,441 | |
Office of the Inspector-General Emergency Management | | | 21 | | | | 21 | | | | 22 | |
Premier and Cabinet | | | 679 | | | | 661 | | | | 682 | |
Public Safety Business Agency6 | | | 1,117 | | | | 1,144 | | | | 1,144 | |
Public Service Commission | | | 73 | | | | 73 | | | | 73 | |
Queensland Audit Office | | | 184 | | | | 184 | | | | 197 | |
Queensland Fire and Emergency Services6 | | | 3,256 | | | | 3,253 | | | | 3,280 | |
Queensland Health (total-disaggregation below)9,14 | | | 82,614 | | | | 83,740 | | | | 87,396 | |
Queensland Police Service6 | | | 15,301 | | | | 15,299 | | | | 15,463 | |
Queensland Treasury | | | 1,813 | | | | 1,803 | | | | 1,819 | |
Science, Information Technology and Innovation10 | | | 2,697 | | | | 2,768 | | | | 2,766 | |
State Development11 | | | 599 | | | | 619 | | | | 624 | |
The Public Trustee of Queensland | | | 597 | | | | 602 | | | | 609 | |
Tourism, Major Events, Small Business and the Commonwealth Games12 | | | 167 | | | | 142 | | | | 124 | |
Transport and Main Roads13 | | | 7,416 | | | | 7,418 | | | | 7,480 | |
Total | | | 215,087 | | | | 216,636 | | | | 222,639 | |
Education and Training Disaggregation | | | | | | | | | | | | |
Education and Training | | | 68,856 | | | | 68,695 | | | | 69,975 | |
TAFE Queensland | | | 4,016 | | | | 4,015 | | | | 3,989 | |
Total Education and Training | | | 72,872 | | | | 72,710 | | | | 73,964 | |
105
Budget Strategy and Outlook 2017-18
| | | | | | | | | | | | |
| | | 2016-17
Budget | | | 2016-17
Est. Act | | | 2017-18
Budget | |
Queensland Health Disaggregation | | | | | | | | | | | | |
Health | | | 7,308 | | | | 7,238 | | | | 7,415 | |
Queensland Ambulance Services | | | 4,261 | | | | 4,261 | | | | 4,346 | |
Cairns and Hinterland Hospital and Health Service | | | 4,554 | | | | 4,780 | | | | 4,923 | |
Central Queensland Hospital and Health Service | | | 2,688 | | | | 2,890 | | | | 2,890 | |
Central West Hospital and Health Service | | | 349 | | | | 362 | | | | 373 | |
Children’s Health Queensland Hospital and Health Service | | | 3,486 | | | | 3,592 | | | | 3,608 | |
Darling Downs Hospital and Health Service | | | 4,011 | | | | 4,190 | | | | 4,315 | |
Gold Coast Hospital and Health Service | | | 7,069 | | | | 7,261 | | | | 7,482 | |
Mackay Hospital and Health Service | | | 2,000 | | | | 2,142 | | | | 2,160 | |
Metro North Hospital and Health Service | | | 14,300 | | | | 15,250 | | | | 15,750 | |
Metro South Hospital and Health Service | | | 12,021 | | | | 12,655 | | | | 12,604 | |
North West Hospital and Health Service | | | 669 | | | | 693 | | | | 702 | |
South West Hospital and Health Service | | | 722 | | | | 777 | | | | 777 | |
Sunshine Coast Hospital and Health Service | | | 5,700 | | | | 5,550 | | | | 6,540 | |
Torres and Cape Hospital and Health Service | | | 899 | | | | 903 | | | | 926 | |
Townsville Hospital and Health Service | | | 5,073 | | | | 5,133 | | | | 5,180 | |
West Moreton Hospital and Health Service | | | 3,037 | | | | 3,090 | | | | 3,243 | |
Wide Bay Hospital and Health Service | | | 2,783 | | | | 2,973 | | | | 3,049 | |
Funded unallocated FTEs14 | | | 1,684 | | | | — | | | | 1,113 | |
Total Queensland Health | | | 82,614 | | | | 83,740 | | | | 87,396 | |
Notes:
| 1. | The budgeted and estimated FTEs in this table are the funded FTEs in each agency as at 30 June of each relevant year. This data is often compared to the Public Service Commission’s (PSC) Queensland public sector quarterly workforce profile reporting. The PSC’s reports include Minimum Obligatory Human Resource Information (MOHRI) for people (on both an FTE and headcount basis) at a point in time. Explanation of variations in departmental FTEs can be found in the Service Delivery Statements. Departmental totals may include multiple tables from Service Delivery Statements, due to separate FTE tables being provided for Commercialised Business Units. |
| 2. | The decrease in the 2016-17 estimated actual compared to the 2016-17 Budget is due to the transfer of the department’s Retail Stores operations to Community Enterprise Queensland effective 1 May 2017, offset by additional regional resources provided for an enhanced Youth Employment Program as part of the Job and Regional Growth Package. |
| 3. | The decrease relates to Disability Services and reflects the transition of Queensland clients to the National Disability Insurance Scheme. |
| 4. | The increase in the 2017-18 Budget compared to the 2016-17 estimated actual relates to additional school based staff associated with forecast enrolment growth and election commitments. |
| 5. | The increase in the 2016-17 estimated actual compared to the 2016-17 Budget reflects changes to planned activity under existing CBRC approved programs, including temporary externally funded programs. The further increase in the 2017-18 Budget reflects additional programmed FTEs to deliver projects including Yellow Crazy Ant Management, Future of Queensland’s Environmental Regulator and compliance and rehabilitation action associated with Linc Energy Limited and regional offsite soil and gas contamination management. |
106
Budget Strategy and Outlook 2017-18
| 6. | 2016-17 Budget figures have been adjusted to reflect machinery-of-government changes. |
| 7. | The increase in the 2016-17 estimated actual compared to the 2016-17 Budget is mainly due to the Community Youth Response – Townsville initiative and accommodating growing offender numbers. The further increase in the 2017-18 Budget primarily relates to 2017-18 Budget initiatives for Specialist Domestic and Family Violence Courts, Re-establishment of the Drug Court, the Transition of 17 year olds to the youth justice system and to implement the recommendations of the Independent Review of Youth Detention in Queensland, the Government’s response to Queensland Parole System Review recommendations and to accommodate growth in offender numbers. |
| 8. | The increase in the 2016-17 estimated actual compared to the 2016-17 Budget is due to a number of factors including externally funded programs and infrastructure programs requiring additional FTEs to meet outcomes. The further increase in the 2017-18 Budget is mainly due to the new funding received for the Revitalising National Parks program. |
| 9. | The increase in the 2016-17 estimated actual compared to the 2016-17 Budget is predominantly driven by additional Commonwealth growth funding which has been earned by the HHSs delivering activity over and above their published budget levels. The further increase in the 2017-18 Budget reflects the commissioning of new services and additional activity purchased from the HHSs, the on-boarding of new staff as part of the progressive ramp up of services at the new Sunshine Coast University Hospital, the recruitment of 75 frontline Ambulance Officers to meet increasing demand and growth in services provided to HHSs to meet increased service demand. |
| 10. | The increase in the 2016-17 estimated actual compared to the 2016-17 Budget mainly relates to the One- Stop Shop program and the cross-agency Human Resources Information System program. |
| 11. | The increase in 2016-17 estimated actual and further increase in the 2017-18 Budget is due to the employment of temporary staff engaged to deliver priority projects. Priority projects include the creation of Priority Industry Sectors teams – Roadmaps and Action Plans to diversify the Queensland economy; accelerating the Building our Regions grant program; and delivering the Back to Work Regional Employment Package. Other key priority projects include implementing the government’s contractual obligations to deliver the $3 billion Queens Wharf Project; progressing Priority Ports Master Planning; managing the construction of the North Queensland Stadium; and implementing a strategic blueprint for Queensland’s North West Minerals Province, which is a whole-of-government initiative. |
| 12. | The decrease in the 2016-17 estimated actual compared to the 2016-17 Budget follows implementation of the whole of government resource sharing model. Under this model FTEs remain on their home department’s payroll. FTEs within Tourism have remained constant. |
| 13. | The increase in the 2017-18 Budget compared to the 2016-17 estimated actual relates to additional temporary FTEs required for the Gold Coast 2018 Commonwealth Games and additional permanent FTEs required for Personalised Transport enforcement activities. |
| 14. | The 2016-17 Budget has been restated to include the funded unallocated FTEs published in the 2016-17 Budget Strategy and Outlook (Budget Paper 2). In 2017-18, there are additional funded FTE positions which have not yet been allocated to particular HHSs. |
107
Budget Strategy and Outlook 2017-18
| 5.3.2 | Superannuation expenses |
The superannuation interest cost represents the imputed interest on the Government’s accruing defined benefit superannuation liabilities.
In determining the State’s defined benefit superannuation liabilities, AASB 119 Employee Benefits requires the discounting of future benefit obligations using yield rates on Government bonds net of investment tax. Interest costs are calculated on a net liability approach by applying the discount rate to both the gross liability and superannuation plan assets.
Superannuation interest costs are dependent on the applicable discount rates and increase marginally over the forward estimates as these rates increase. The defined benefit scheme, which is closed to new members and subject to interest rate fluctuations, will decline over time as members leave.
Other superannuation expenses represent employer superannuation contributions to accumulation superannuation and the current service cost of the State’s defined benefit obligation (or the increase in the present value of the defined benefit obligation resulting from employee service in the current period).
| 5.3.3 | Other operating expenses |
Other operating expenses comprise the non-labour costs of providing goods and services, including services to government and non-government organisations, repairs and maintenance, consultancies, contractors, electricity, communications and marketing.
In 2017-18, other operating expenses are expected to be $17.037 billion, an increase of $1.105 billion or 6.9% over the 2016-17 estimated actual. Significant movements from the 2016-17 estimated actual outcome are due to:
| • | | final preparations and delivery of the Gold Coast 2018 Commonwealth Games including costs such as Games and venue operations, transportation, security, marketing and communications |
| • | | anticipated student enrolment growth, and the impact of increases in Australian Government funding for the proposed Quality Schools program |
| • | | increase in transport funding including higher Transport Service Contract payments to Queensland Rail |
| • | | justice reforms including reforms to the Queensland parole and probation system, transitioning 17 year olds from the adult justice system to the youth justice system and re-establishment of the Drug Court. |
Other operating expenses decline in 2018-19 following hosting of the 2018 Commonwealth Games and the progressive re-classification of disability services funding to grant expenses with the transition to the National Disability Insurance Scheme.
108
Budget Strategy and Outlook 2017-18
| 5.3.4 | Depreciation and amortisation |
Depreciation and amortisation expense is an estimate of the progressive consumption of the State’s assets through normal usage, wear and tear and obsolescence. Growth in this expense category primarily reflects asset revaluations and the size of the State’s capital program.
| 5.3.5 | Other interest expenses |
Other interest expenses include interest paid on borrowings to acquire capital assets and infrastructure such as roads and government buildings.
Since implementing the Government’s Debt Action Plan other interest expenses are estimated to decline $518 million in 2016-17 to $1.702 billion compared to $2.22 billion in 2015-16.
In 2017-18, the General Government Sector has total debt servicing costs forecast at $1.706 billion. Interest costs are expected to remain relatively stable over the forward estimates.
Current grants include grants and subsidies to the community (such as schools, hospitals, benevolent institutions and local governments) and personal benefit payments. Community service obligations (CSOs) are provided where Public Non-financial Corporations (PNFCs) are required to provide non-commercial services or services at non-commercial prices for the benefit of the community (for further details refer to Chapter 8).
Capital transfers represent grants to the PNFC Sector, local governments, not-for-profit institutions and other non-government entities, such as businesses and households (including the Queensland First Home Owners’ Grant) for capital purposes.
109
Budget Strategy and Outlook 2017-18
Table 5.3 provides a breakdown of grants by category and recipient type.
| | | | | | | | | | | | |
| | | 2015-16
Actual
$ million | | | 2016-17
Est. Act.
$ million | | | 2017-18
Budget
$ million | |
Current | | | | | | | | | | | | |
Grants to local government | | | 415 | | | | 899 | | | | 462 | |
Grants to private and not-for-profit organisations | | | | | | | | | | | | |
State funding for non-state schools | | | 634 | | | | 660 | | | | 688 | |
Australian Government funding for non-state schools | | | 2,240 | | | | 2,394 | | | | 2,507 | |
Other | | | 1,307 | | | | 1,285 | | | | 1,461 | |
Grants to other sectors of government | | | | | | | | | | | | |
Community service obligations to PNFCs | | | 554 | | | | 622 | | | | 499 | |
Other payments to PNFCs | | | 23 | | | | 799 | | | | 27 | |
Other | | | 24 | | | | 154 | | | | 618 | |
Other | | | 219 | | | | 389 | | | | 279 | |
Total current transfers | | | 5,416 | | | | 7,202 | | | | 6,541 | |
Capital | | | | | | | | | | | | |
Grants to local government | | | 676 | | | | 906 | | | | 1,126 | |
State funding for non-state schools | | | 123 | | | | 93 | | | | 93 | |
Grants to private and not-for-profit organisations | | | 200 | | | | 163 | | | | 197 | |
Payments to PNFCs | | | 30 | | | | 29 | | | | 10 | |
Queensland First Home Owners’ Grants | | | 95 | | | | 149 | | | | 147 | |
Other | | | 19 | | | | 1 | | | | — | |
Total capital transfers | | | 1,143 | | | | 1,341 | | | | 1,573 | |
Total current and capital transfers | | | 6,559 | | | | 8,543 | | | | 8,114 | |
Note:
| 1. | Numbers may not add due to rounding. |
In 2016-17, current grant expenses are estimated to be $7.202 billion, $1.786 billion higher than 2015-16. This increase is mainly due to:
| • | | A $771 million electricity affordability package to reduce the cost-of-living pressures for Queenslanders. The Queensland Competition Authority has recommended that retail electricity prices for the average residential customer in regional Queensland increase by 7.1% in 2017-18. The Government will provide price relief to electricity consumers by meeting the costs of the Solar Bonus Scheme for three years, which will more than halve the price increase. |
| • | | The Australian Government’s advance payment in 2016-17 of $233 million in financial assistance grants to local governments for 2017-18. (In 2014-15, the Australian Government similarly made an advance payment of $225 million to the State thereby reducing grants in 2015-16, further amplifying the increase in 2016-17.) |
| • | | Assistance provided under the Back to Work program for employment in regional areas. |
110
Budget Strategy and Outlook 2017-18
| • | | A higher level of Australian Government grant assistance to non-state schools to reflect student enrolment growth. |
| • | | An increase in CSO payments to Energy Queensland under the Uniform Tariff Policy. |
| • | | Grants to other sectors of government mainly represent the transition to the National Disability Insurance Scheme reflecting payments by the State to the Australian Government’s National Disability Insurance Agency. |
Capital grants are estimated to increase $198 million in 2016-17. The increase is mainly due to capital grants to local governments through the Government’s Works for Queensland initiative announced in the 2016-17 MYFER.
In 2017-18, grant expenses are estimated to be $8.114 billion. Adjusting for the impact of the electricity affordability package and advance payments of financial assistance grants on 2016-17, the underlying increase in grant expenses is forecast to be $808 million in 2017-18.
The underlying growth in grant expenses in 2017-18 is in large part due to the Government’s agenda of creating more jobs and promoting economic growth in the regions with funding provided for the following initiatives:
| • | | Works for Queensland providing funding across 65 regional councils to support jobs and deliver vital infrastructure in regional Queensland with a further $200 million allocated across 2017-18 and 2018-19 bringing the total funding package to $400 million. |
| • | | Back to Work Regional Employment Package providing assistance to raise employment in regional areas. In 2017-18, a further $50 million has been allocated to this program along with $27.5 million funding for Back to Work South East Queensland. |
| • | | Jobs and Regional Growth package targeting growing regional economies and improving employment outcomes for young Queenslanders. |
Grants to other sectors of government mainly represent the transition to the National Disability Insurance Scheme (NDIS) reflecting payments by the State to the National Disability Insurance Agency (NDIA). Disability services expenditure is progressively re-classified from other operating expenses to grant expenses to the NDIA as Queensland transitions to the NDIS.
Extension to the temporary increase in the Queensland First Home Owners’ Grant
The Queensland First Home Owners’ Grant is available for first home buyers who are buying or building a new house, unit or townhouse valued at less than $750,000.
To assist first home buyers entering the housing market, the Queensland First Home Owners’ Grant temporary increase, from $15,000 to $20,000 for contracts on newly constructed homes will be extended to eligible transactions entered into between 1 July 2017 and 31 December 2017.
111
Budget Strategy and Outlook 2017-18
| 5.4 | Operating expenses by purpose |
Chart 5.4 indicates the proportion of expenditure by major purpose classification for the 2017-18 Budget. Health accounts for the largest share of expenses (29.5%) followed by Education (24.2%).
| Chart 5.4 | General Government Sector expenses by purpose, 2017-181 |
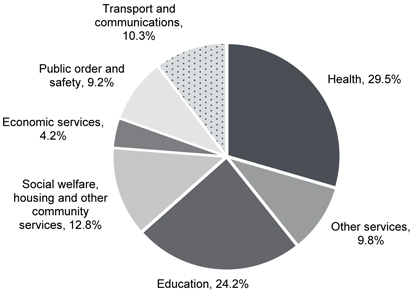
Note:
| 1. | Percentages may not add to 100% due to rounding. |
Data presented in Tables 5.4 and 5.5 provide a summary drawn from financial statements contained in the Service Delivery Statements (SDS). Further information on the composition of expenses, outputs delivered and factors influencing the movement in expenses can also be obtained from a department’s SDS.
112
Budget Strategy and Outlook 2017-18
| Table 5.4 | Departmental controlled expense1, 2 |
| | | | | | | | |
| | | 2016-17
Est. Act.
$ 000 | | | 2017-18
Budget
$ 000 | |
Aboriginal and Torres Strait Islander Partnerships | | | 122,599 | | | | 92,212 | |
Agriculture and Fisheries | | | 455,917 | | | | 424,742 | |
Communities, Child Safety and Disability Services | | | 2,818,312 | | | | 2,750,882 | |
Education and Training | | | 9,307,686 | | | | 9,993,714 | |
Electoral Commission of Queensland | | | 28,722 | | | | 55,277 | |
Energy and Water Supply | | | 69,468 | | | | 89,293 | |
Environment and Heritage Protection | | | 236,658 | | | | 283,039 | |
Health Consolidated3 | | | 16,086,236 | | | | 16,553,729 | |
Housing and Public Works | | | 1,953,958 | | | | 2,006,623 | |
Inspector General Emergency Management | | | 4,582 | | | | 4,968 | |
Infrastructure, Local Government and Planning | | | 444,400 | | | | 548,287 | |
Justice and Attorney-General | | | 1,513,941 | | | | 1,686,778 | |
Legislative Assembly | | | 90,773 | | | | 91,303 | |
National Parks, Sport and Racing | | | 340,496 | | | | 417,742 | |
Natural Resources and Mines | | | 445,537 | | | | 445,905 | |
Office of the Governor | | | 6,805 | | | | 6,968 | |
Office of the Ombudsman | | | 8,527 | | | | 8,925 | |
Premier and Cabinet | | | 231,439 | | | | 271,201 | |
Public Safety Business Agency | | | 463,344 | | | | 458,996 | |
Public Service Commission | | | 14,460 | | | | 16,200 | |
Queensland Audit Office | | | 42,732 | | | | 44,005 | |
Queensland Fire and Emergency Services | | | 634,866 | | | | 663,802 | |
Queensland Police Service | | | 2,238,209 | | | | 2,370,191 | |
Queensland Treasury | | | 373,764 | | | | 391,475 | |
Science, Information Technology and Innovation | | | 379,511 | | | | 419,618 | |
State Development | | | 359,534 | | | | 428,946 | |
The Public Trustee of Queensland | | | 84,785 | | | | 88,061 | |
Tourism, Major Events, Small Business and the Commonwealth Games | | | 174,297 | | | | 348,486 | |
Transport and Main Roads | | | 5,660,180 | | | | 5,809,765 | |
Total expenses | | | 44,591,738 | | | | 46,771,133 | |
Notes:
| 1. | Total expenses by department do not equate to total General Government expenses in Uniform Presentation Framework (UPF) terms reported elsewhere in the Budget Papers as General Government expenses include a wider range of entities including State Government statutory authorities. In addition transactions eliminated between entities within the General Government Sector are excluded in the preparation of whole-of-Government UPF financial statements. |
| 2. | Explanation of variations in departmental controlled expenses can be found in the Service Delivery Statements. |
| 3. | This represents Health Consolidated in the Service Delivery Statement, which consolidates Queensland Health controlled, the Hospital and Health Services, and Queensland Ambulance Service. |
113
Budget Strategy and Outlook 2017-18
| Table 5.5 | Departmental administered expense1, 2 |
| | | | | | | | |
| | | 2016-17
Est. Act.
$ 000 | | | 2017-18
Budget
$ 000 | |
Aboriginal and Torres Strait Islander Partnerships | | | 14,116 | | | | 12,266 | |
Agriculture and Fisheries | | | 13,978 | | | | 14,047 | |
Communities, Child Safety and Disability Services | | | 453,542 | | | | 900,851 | |
Education and Training | | | 3,242,767 | | | | 3,383,861 | |
Energy and Water Supply | | | 1,412,622 | | | | 516,880 | |
Health Consolidated | | | 42,512 | | | | 34,153 | |
Housing and Public Works | | | 3,508 | | | | 3,510 | |
Infrastructure, Local Government and Planning | | | 1,145,249 | | | | 852,389 | |
Justice and Attorney-General | | | 368,670 | | | | 380,910 | |
National Parks, Sport and Racing | | | 64,290 | | | | 31,819 | |
Natural Resources and Mines | | | 51,705 | | | | 51,705 | |
Premier and Cabinet | | | 153,286 | | | | 160,740 | |
Queensland Treasury | | | 6,140,259 | | | | 6,249,785 | |
Science, Information Technology and Innovation | | | 72,538 | | | | 82,605 | |
State Development | | | 2,500 | | | | 2,500 | |
The Public Trustee of Queensland | | | 1,134 | | | | 1,134 | |
Tourism, Major Events, Small Business and the Commonwealth Games | | | 267,014 | | | | 623,869 | |
Total expenses | | | 13,449,690 | | | | 13,303,024 | |
Notes:
| 1. | Total expenses by department does not equate to total General Government expenses in Uniform Presentation Framework (UPF) terms reported elsewhere in the Budget Papers as General Government expenses include a wider range of entities including State Government statutory authorities. In addition transactions eliminated between entities within the General Government Sector are excluded in the preparation of whole-of-Government UPF financial statements. |
| 2. | Explanation of variations in departmental administered expenses can be found in the Service Delivery Statements. |
114
Budget Strategy and Outlook 2017-18
Table 5.6 reconciles the departmental expenses set out above with General Government Sector total expenses.
| Table 5.6 | Reconciliation of departmental to UPF expenses1 |
| | | | | | | | |
| | | 2016-17
Est. Act.
$ million | | | 2017-18
Budget
$ million | |
Departmental expenses per Service Delivery Statements | | | | | | | | |
- Controlled | | | 44,592 | | | | 46,771 | |
- Administered | | | 13,450 | | | | 13,303 | |
| | |
Non-UPF departmental expenses and whole-of-Government schemes2 | | | (4,164 | ) | | | (4,142 | ) |
| | |
Other General Government entities (e.g. CBUs, SSPs, Statutory Bodies) | | | 4,591 | | | | 5,294 | |
| | |
| | | 58,469 | | | | 61,226 | |
| | |
Superannuation Interest cost | | | 514 | | | | 600 | |
| | |
Eliminations and Other whole-of-Government adjustments | | | | | | | | |
Elimination of payments to CBUs and SSPs | | | (2,803 | ) | | | (2,707 | ) |
Other eliminations and adjustments | | | (2,570 | ) | | | (3,396 | ) |
| | |
Total General Government UPF expenses | | | 53,610 | | | | 55,723 | |
Notes:
| 1. | Numbers may not add due to rounding and bracketed numbers represent negative amounts. |
| 2. | Certain expenses such as asset valuation changes are included in agency reporting, but are excluded from the UPF. In addition, this item removes the effect of cash payments for whole-of-government schemes such as the State’s share of superannuation beneficiary payments reported in Queensland Treasury Administered’s expenses. Costs associated with these schemes are accrued annually. |
115
Budget Strategy and Outlook 2017-18
| 6 | Balance sheet and cash flows |
Features
| • | | Between 2016-17 and 2019-20, the Government’s continued focus on balance sheet management through the Debt Action Plan and other budget strategies will see over $30 billion invested in the capital program for the General Government Sector, while maintaining debt levels consistent with those expected in the 2016-17 Mid Year Fiscal and Economic Review (MYFER). |
| • | | General Government Sector debt is expected to fall by over $1.7 billion from $35.486 billion in 2015-16 to $33.758 billion in 2017-18. This is $3.6 billion lower than the projection for 2017-18 at the time of the 2016-17 MYFER and $4.2 billion lower than in the 2016-17 Budget. |
| • | | The reduction in General Government debt in 2016-17 has provided the Government with the capacity to fund important new capital infrastructure over the forward estimates. Indeed, up until 2019-20 General Government debt is lower each year than predicted in the 2016-17 Budget. |
| • | | With this budget consolidating the work undertaken to date by the current Government to refocus the balance sheet to reduce debt while optimising infrastructure investment, Non-financial Public Sector (NFPS) debt is projected to be $10.1 billion lower in 2017-18 than the original 2014-15 Budget projections under the previous Government. General Government debt is projected to be $14.7 billion lower in 2017-18 using the same basis of comparison. |
| • | | The State’s net worth, the amount by which its assets exceed its liabilities, is forecast to be over $207 billion by 2019-20, over $3 billion higher than at the time of the 2016-17 MYFER and over $29 billion higher than the 2016-17 Budget. The increase since the 2016-17 Budget predominantly reflects a net upward revaluation for road infrastructure assets. |
| • | | At the time of the 2016-17 MYFER, net cash inflows from operating activities for 2016-17 were expected to cover 88% of net investments in Non-financial Assets (NFAs) for the General Government Sector. The estimated actual coverage is now expected to be 126%. |
| • | | Non-financial Public Sector capital expenditure totals $41.086 billion for the period 2017-18 to 2020-21, which comprises $36.979 billion of PNFA, and $4.107 billion of capital grant expenses. In addition to these, acquisitions of non-financial assets under finance leases of $1.663 billion, brings the total capital program for the 2017-18 Budget to $42.75 billion. |
116
Budget Strategy and Outlook 2017-18
The balance sheet shows the projected assets, liabilities and net worth of the General Government Sector as at 30 June each financial year. It is important for the Government to maintain a strong balance sheet to provide it with the stability, flexibility and capacity to deal with emerging financial and economic pressures, and to provide a strong foundation for future economic growth.
Following consideration of the 2015 Review of State Finances, the Government introduced revised fiscal principles in the 2015-16 Budget and the Government has retained these principles in framing subsequent budgets. The principles include the targeting of an ongoing reduction in Queensland’s debt burden, as measured by the General Government Sector debt to revenue ratio, and targeting net operating surpluses that ensure new capital investment is primarily funded through recurrent revenues, rather than borrowing. With this budget consolidating the work already undertaken through the implementation of the Debt Action Plan and other budget strategies, debt levels in most years are well below 2016-17 Budget and 2016-17 MYFER projections while the State continues to invest in valuable infrastructure projects and rebuilds after Severe Tropical Cyclone Debbie.
Table 6.1 provides a summary of the key balance sheet aggregates for the General Government Sector.
| Table 6.1 | General Government Sector: summary of budgeted balance sheet1 |
| | | | | | | | | | | | | | | | | | | | | | | | |
| | | 2016-17
Budget
$ million | | | 2016-17
Est. Act.
$ million | | | 2017-18
Budget
$ million | | | 2018-19
Projection
$ million | | | 2019-20
Projection
$ million | | | 2020-21
Projection
$ million | |
Financial assets | | | 60,462 | | | | 61,260 | | | | 60,814 | | | | 59,483 | | | | 58,620 | | | | 58,570 | |
Non-financial assets | | | 185,686 | | | | 209,645 | | | | 212,407 | | | | 217,499 | | | | 221,975 | | | | 225,783 | |
Total assets | | | 246,148 | | | | 270,906 | | | | 273,222 | | | | 276,981 | | | | 280,596 | | | | 284,352 | |
Borrowings | | | 37,775 | | | | 33,937 | | | | 33,758 | | | | 36,393 | | | | 38,760 | | | | 41,244 | |
Advances and deposits | | | 809 | | | | 1,331 | | | | 1,544 | | | | 1,260 | | | | 916 | | | | 873 | |
Superannuation liability | | | 25,891 | | | | 24,998 | | | | 23,355 | | | | 21,736 | | | | 20,334 | | | | 18,909 | |
Other provisions and liabilities | | | 11,946 | | | | 12,574 | | | | 12,642 | | | | 13,000 | | | | 13,291 | | | | 13,652 | |
Total liabilities | | | 76,421 | | | | 72,840 | | | | 71,299 | | | | 72,389 | | | | 73,301 | | | | 74,678 | |
Net worth | | | 169,726 | | | | 198,066 | | | | 201,922 | | | | 204,592 | | | | 207,294 | | | | 209,675 | |
Net financial worth | | | (15,960 | ) | | | (11,579 | ) | | | (10,485 | ) | | | (12,907 | ) | | | (14,681 | ) | | | (16,108 | ) |
Net financial liabilities | | | 37,279 | | | | 32,895 | | | | 33,273 | | | | 36,043 | | | | 37,849 | | | | 39,199 | |
Net debt | | | 3,525 | | | | 297 | | | | 1,622 | | | | 5,748 | | | | 8,960 | | | | 11,318 | |
Note:
| 1. | Numbers may not add due to rounding and bracketed numbers represent negative numbers. |
117
Budget Strategy and Outlook 2017-18
The General Government Sector holds the equity of the State’s public enterprises, principally its shareholding in government-owned corporations (GOCs) but also Public Financial Corporations like Queensland Treasury Corporation (QTC), in much the same manner as the parent or holding company in a group of companies. The estimated investment in public enterprises is included in the General Government Sector’s financial assets.
Financial assets of $61.260 billion are estimated for 2016-17, $798 million higher than originally budgeted for 2016-17. Receivables are $911 million higher than budgeted, which includes dividends from other sectors.
Between 2016-17 and 2019-20, financial assets are projected to decrease by $2.64 billion as investments are repatriated from the actuarially assessed defined benefit superannuation fund and Queensland Government Insurance Fund (QGIF) surpluses. These repatriations will be used to fund the State Infrastructure Fund and additional priority capital projects as well as reducing debt.
Chart 6.1 shows forecast General Government Sector financial assets by category at 30 June 2018. Investments held to meet future liabilities, including superannuation and insurance, comprise the major part of the State’s financial assets.
| Chart 6.1 | Forecast General Government Sector financial assets by category, at 30 June 20181 |
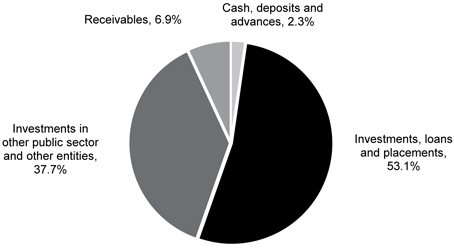
Note:
| 1. | Percentages may not add to 100% due to rounding. |
118
Budget Strategy and Outlook 2017-18
| 6.2.2 | Non-financial assets |
General Government Sector non-financial assets are estimated to total $209.645 billion at 30 June 2017, $23.959 billion higher than forecast at the 2016-17 Budget and $1.337 billion lower than in the 2016-17 MYFER.
The increase since the 2016-17 Budget reflects the flow through of a net upward revaluation at 30 June 2016 primarily for road infrastructure assets. These revaluations were incorporated into the 2016-17 MYFER.
Non-financial assets in 2017-18 are expected to grow by $2.762 billion over the 2016-17 estimated actuals, to be $212.407 billion at 30 June 2018. These assets consist primarily of land and other fixed assets of $205.439 billion, the majority of which are roads, schools, hospitals and other infrastructure used to provide services to Queenslanders. Other non-financial assets of $6.969 billion held by the State include prepayments and deferred income tax assets relating to GOCs.
Queensland has historically had a higher level of General Government Sector capital spending than other jurisdictions. Reflecting the pipeline of decisions made during a period of fiscal consolidation, and increased spending in other jurisdictions, per capita PNFA in Queensland are expected to be lower than the average of other states between 2015-16 and 2017-18. From 2018-19, the Government’s enhanced infrastructure investment decisions are expected to drive Queensland back up over the average of other jurisdictions.
| Chart 6.2 | General Government Sector per capita purchases of non-financial assets |
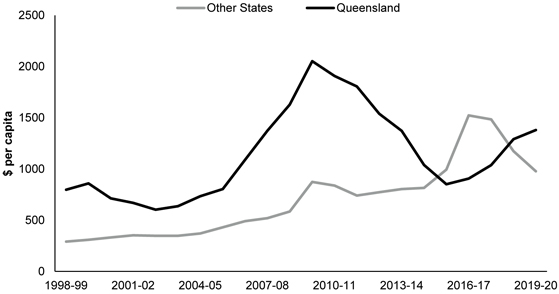
Source: ABS 5512.0 and Queensland Treasury calculations based on 2017-18 Budget for all states except NSW, SA where mid-year updates are used, and WA where the Pre-election Financial Projections Statement is used.
119
Budget Strategy and Outlook 2017-18
General Government Sector capital expenditure for 2017-18 is forecast to be $6.696 billion, which comprises $5.123 billion of PNFA, and $1.573 billion of capital grant expenses. In addition to these, acquisitions of non-financial assets under finance leases are forecast to be $618 million, bringing the total General Government Sector capital program in 2017-18 to $7.314 billion.
Over the four years to 2020-21, General Government Sector capital expenditure is forecast to be $29.218 billion, which comprises $25.071 billion of PNFA, and $4.147 billion of capital grant expenses. Acquisitions of non-financial assets under finance leases are forecast to be $1.663 billion, bringing the total General Government Sector capital program over the period to $30.881 billion.
Following consideration of the Review of State Finances, the Government established five fiscal principles, one of which aims to better manage the capital program to ensure a consistent flow of works to support jobs and the economy, and another that targets net operating surpluses that ensure General Government Sector PNFA are funded primarily through recurrent revenues rather than borrowing.
General Government Sector PNFA are forecast to increase from $4.416 billion in the 2016-17 estimated actual to $7.015 billion in 2019-20. This increase reflects the Government’s commitment to fiscally responsible infrastructure investment to deliver productivity enhancing infrastructure, without significantly increasing debt.
The strong surplus in 2016-17, which has resulted in lower levels of debt, in combination with other balance sheet measures, provides capacity to fund further priority capital projects over the forward estimates without significantly increasing projected debt levels. Balance sheet measures in this budget include repatriation of $500 million in surpluses from the QGIF and the return from QTC of $500 million of its past surpluses.
In terms of ensuring new capital purchases in the General Government Sector are primarily funded through operating revenues, forecast net operating cash flows from 2016-17 to 2020-21 of $17.389 billion are funding net investments in NFAs of $27.714 billion. Net cash inflows from operating activities equate to 59.4% of the funding required for the 2017-18 General Government Sector net investments in NFAs and averages 67.2% across the period 2016-17 to 2020-21.
The State has also entered into a number of finance leases, mainly in relation to Public Private Partnerships, totalling $2.378 billion over the period 2016-17 to 2018-19, including:
| • | | $1.030 billion for New Generation Rollingstock |
| • | | $430 million for the Toowoomba Second Range Crossing |
| • | | $195 million for the Gold Coast Light Rail - Stage 2 |
| • | | $460 million for the Sunshine Coast University Hospital. |
Generally, at the commencement of finance leases, the non-financial assets and the borrowings of the State increase by an equal amount to reflect the acquisition of the asset from the proponent. There are no cash impacts on the commencement of the lease - the finance lease liabilities are subsequently repaid under the terms of the Public Private Partnership agreement.
120
Budget Strategy and Outlook 2017-18
Purchases of non-financial assets by the NFPS over the period 2017-18 to 2020-21 are forecast to be $36.979 billion, which is an average of $9.245 billion per annum. With capital grant expenses of $4.107 billion, this brings total capital expenditure to $41.086 billion. In addition to this, acquisitions of non-financial assets under finance leases of $1.663 billion bring the total capital program over the period to $42.75 billion. While its primary aim is to facilitate service delivery to Queenslanders, infrastructure investment makes an important contribution to the economy and is a cornerstone of the Queensland job market, particularly in the construction industry.
General Government Sector
Estimated General Government Sector liabilities of $72.840 billion in 2016-17 are $3.581 billion lower than the 2016-17 Budget, mainly due to lower than expected borrowings. Improved operating cash flows, predominantly due to better than expected royalty revenue, and lower than expected capital outlays estimated for 2016-17 have resulted in lower debt than expected at the time of the 2016-17 Budget.
Due to the Government’s commitment to sustainable fiscal management, General Government Sector borrowing is expected to fall $1.549 billion from $35.486 billion in 2015-16 to $33.937 billion in 2016-17.
Total liabilities in the General Government Sector in 2017-18 will reduce by a further $1.541 billion from the 2016-17 estimated actual.
General Government Sector borrowings of $33.758 billion are budgeted for 2017-18, $4.242 billion lower than the projection in the 2016-17 Budget and $3.606 billion lower than projected at the time of the 2016-17 MYFER. Borrowings are expected to increase by $7.307 billion between 2016-17 and 2020-21 in support of PNFA’s of $25.071 billion.
Liabilities relating to employee entitlements (principally superannuation and long service leave) are projected to total $28.865 billion at 30 June 2018, a 4.9% decrease on the 2016-17 estimated actual. The State’s defined benefit fund has been closed to new entrants since 2008. Given the age profile of those employees still in that fund, retirements are also increasing. Accordingly, the State’s superannuation liability is now declining over the forward estimates. In addition, an anticipated increase in bond rates across the forward estimates contributes to the expected decline.
The remainder of the liabilities consist of payables, advances and other liabilities such as unearned revenue and provisions.
The composition of the General Government Sector’s forecast liabilities at 30 June 2018 is illustrated in Chart 6.3.
The Government considers the General Government Sector debt to revenue ratio to be an important indicator, consistent with its fiscal principle of targeting ongoing reductions in Queensland’s relative debt burden (refer Chart 3.5 in Chapter 3).
121
Budget Strategy and Outlook 2017-18
| Chart 6.3 | Forecast General Government Sector liabilities by category, at 30 June 20181 |
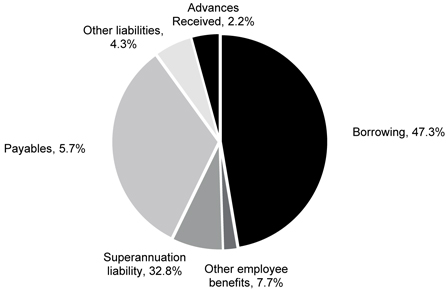
Note:
| 1. | Percentages may not add to 100% due to rounding. |
Non-financial Public Sector borrowings
Non-financial Public Sector borrowings of $73.102 billion are expected for 2016-17, $2.168 billion lower than expected at the 2016-17 Budget, $647 million lower than 2016-17 MYFER and $8.132 billion lower than forecast in the 2014-15 Budget.
Due to the Debt Action Plan measures being implemented by the Government which refocuses the balance sheet to lower debt, NFPS debt at 30 June 2018 is projected to be over $10 billion lower than the original 2014-15 Budget projections.
Non-financial Public Sector borrowings of $77.72 billion are now expected for 2019-20, $202 million higher than expected at the 2016-17 MYFER but $1.149 billion less than the comparable 2016-17 Budget estimate. This largely reflects the Government’s commitment to fiscally responsible infrastructure investment, without increasing debt.
122
Budget Strategy and Outlook 2017-18
The net financial worth measure is an indicator of financial strength. Net financial worth is defined as financial assets less all existing and accruing liabilities. Financial assets include cash and deposits, advances, financial investments, loans, receivables and equity in public enterprises.
The net financial worth measure is broader than the alternative measure – net debt – which measures only cash, advances and investments on the assets side and borrowings and advances on the liabilities side.
The net financial worth of the General Government Sector for 2016-17 is estimated at negative $11.579 billion, an improvement of $4.381 billion on the 2016-17 Budget mainly due to the impact of the decrease in Borrowing.
| 6.2.5 | Net financial liabilities |
Net financial liabilities are total liabilities less financial assets, other than equity investments in other public sector entities. This measure is broader than net debt as it includes other significant liabilities, rather than just borrowings (for example, accrued employee liabilities such as superannuation and long service leave entitlements).
The net financial liabilities of the General Government Sector for 2016-17 are estimated to be $32.895 billion, an improvement of $4.384 billion on 2016-17 Budget.
Net financial liabilities remain relatively stable in 2017-18, then increase from 2018-19 mainly as investments are repatriated from the actuarially assessed defined benefit superannuation fund and Queensland Government Insurance Fund surplus to fund priority infrastructure projects and disaster recovery.
123
Budget Strategy and Outlook 2017-18
The net worth, or equity, of the State is the amount by which the State’s assets exceed its liabilities. This is the value of the investment held on behalf of the people of Queensland by public sector instrumentalities.
Changes in the State’s net worth occur for a number of reasons including:
| • | | operating surpluses (deficits) that increase (decrease) the Government’s equity |
| • | | revaluation of assets and liabilities as required by accounting standards. For example, the Government’s accruing liabilities for employee superannuation and long service leave are determined by actuarial assessments |
| • | | movements in the net worth of the State’s investments in the Public Non-financial Corporations and Public Financial Corporations sectors |
| • | | gains or losses on disposal of assets. Where the selling price of an asset is greater (less) than its value in an agency’s accounts, the resultant profit (loss) affects net worth. |
The net worth of the General Government Sector in 2016-17 is estimated to be $198.066 billion. This is $28.340 billion higher than forecast in the 2016-17 Budget primarily due to upward revaluations of road infrastructure assets at 30 June 2016.
From 2016-17, net worth is projected to steadily increase mainly as a result of the growth in purchases of non-financial assets.
Net debt is the sum of advances received and borrowings less cash and deposits, advances paid and investments, loans and placements.
Net debt for the General Government Sector in 2016-17 is estimated to be $297 million, $3.228 billion less than the 2016-17 Budget mainly as a result of improved royalty receipts and the change in timing of PNFA flowing through to lower borrowings. Net debt is forecast to increase across the forward estimates to fund priority infrastructure projects.
In the NFPS, net debt is estimated at $36.269 billion in 2016-17, $3.634 billion less than the 2016-17 Budget. Net debt is expected to increase to $37.890 billion in 2017-18 and then grow through to 2020-21 with infrastructure provision partly funded by borrowings and investment drawdowns.
124
Budget Strategy and Outlook 2017-18
The cash flow statement provides information on the Government’s estimated cash flows from its operating, financing and investing activities.
The cash flow statement records estimated cash payments and cash receipts and hence differs from accrued revenue and expenditure recorded in the operating statement. In particular, the operating statement records certain revenues and expenses that do not have an associated cash flow (for example, depreciation expense). The timing of recognition of accrued revenues or expenses in the operating statement may differ from the actual cash disbursement or receipt (for example, tax equivalents). A reconciliation between the cash flows from operations and the operating statement is provided in Table 6.2.
The cash flow statement also records cash flows associated with investing and financing activities that are otherwise reflected in the balance sheet. For example, purchases of capital equipment are recorded in the cash flow statement and impact on the balance sheet through an increase in the stock of physical assets.
The cash flow statement provides the cash surplus (deficit) measure which is comprised of the net cash flows from operating activities plus the net cash flows from investments in non-financial assets (or physical capital).
The Australian Bureau of Statistics Government Finance Statistics (GFS) surplus (deficit) is derived by including the initial increase in liability at the commencement of finance leases in the cash surplus (deficit). This measure is also used to derive the Loan Council Allocation nomination, provided in Chapter 9.
The estimated General Government Sector cash surplus of $1.038 billion in 2016-17 is $2.588 billion higher than that forecast at the time of the 2016-17 Budget. This is largely due to the higher than expected operating cash flows and lower than expected PNFA.
After taking into account PNFA of $5.123 billion, a cash deficit of $1.922 billion is forecast for 2017-18, in line with the 2016-17 MYFER.
Net cash flows from investments in financial assets for policy purposes include net cash flows from disposal or return of equity, and net equity injections into government-owned corporations. Cash flows from the return of equity in the energy network businesses and other businesses as a result of the enhanced Debt Action Plan are the primary driver of net inflows of $2.084 billion over the period 2016-17 to 2020-21.
Net cash flows from investments in financial assets for liquidity purposes represent net investment in financial assets to cover liabilities such as superannuation, other employee entitlements and insurance. The drawdown of long service leave assets and the repatriation of surpluses in the actuarially assessed defined benefit superannuation fund and the QGIF flow through this line in the Statement of Cash Flows.
Total General Government Sector PNFA of $5.123 billion are budgeted for 2017-18 and, over the period 2017-18 to 2020-21, PNFA are expected to total $25.071 billion in the General Government Sector.
125
Budget Strategy and Outlook 2017-18
| 6.4 | Reconciliation of operating cash flows to the operating statement |
Table 6.2 provides a reconciliation of the cash flows from operating activities to the operating result for the General Government Sector.
| Table 6.2 | General Government Sector: reconciliation of cash flows from operating activities to accrual operating activities1 |
| | | | | | | | |
| | | 2016-17
Est. Act.
$ million | | | 2017-18
Budget
$ million | |
Revenue from transactions | | | 56,434 | | | | 55,869 | |
Plus/(less) movement in tax equivalent and dividend receivables | | | (781 | ) | | | 251 | |
Plus GST receipts | | | 1,703 | | | | 1,814 | |
Plus/(less) movement in other receivables | | | (316 | ) | | | (614 | ) |
Equals cash receipts from operating activities | | | 57,040 | | | | 57,320 | |
Expenses from transactions | | | 53,610 | | | | 55,723 | |
(Less) non-cash items | | | | | | | | |
Depreciation and amortisation expense | | | (3,009 | ) | | | (3,093 | ) |
Accrued superannuation expense | | | (1,465 | ) | | | (1,445 | ) |
Accrued employee entitlements | | | (469 | ) | | | (499 | ) |
Other accrued costs | | | (125 | ) | | | (113 | ) |
Plus superannuation benefits paid – defined benefit | | | 1,758 | | | | 1,983 | |
Plus/(less) movement in employee entitlement provisions | | | 243 | | | | 289 | |
Plus/(less) GST paid | | | 1,684 | | | | 1,795 | |
Plus/(less) movement in other provisions and payables | | | (259 | ) | | | (129 | ) |
Equals cash payments for operating activities | | | 51,968 | | | | 54,511 | |
Note:
| 1. | Numbers may not add due to rounding and bracketed numbers represent negative amounts. |
The main difference between the accrual operating statement and the cash flow relates to the timing of cash payments and receipts and their recognition in accrual terms and the inclusion of non-cash expenses and revenues. The largest differences between accrual accounting and cash flows are in relation to depreciation and superannuation. Differences due to the timing of receipt or payment of amounts are recorded as either a receivable or payable in the balance sheet.
126
Budget Strategy and Outlook 2017-18
| 7 | Intergovernmental financial relations |
Features
| • | | Queensland’s ability to raise revenue is less than required to meet its service delivery responsibilities while the Australian Government can raise more revenue than is required to meet its responsibilities. As such, Australian Government funding contributes to Queensland’s ability to meet its current and future service delivery and infrastructure responsibilities. Without the appropriate level of Australian Government funding, Queensland cannot provide the essential services and infrastructure sought by the community. |
| • | | However, Queensland’s capacity to manage these responsibilities continues to be impacted by uncertainty of funding from the Australian Government for critical services including early childhood education and remote Indigenous housing, and conditions imposed on access to funding such as for the Skilling Australians Fund and the new National Housing and Homelessness Agreement. Such conditions are inconsistent with the principles of the Intergovernmental Agreement on Federal Financial Relations. |
| • | | While the 2017-18 Commonwealth Budget provided additional funding for school education, it did not provide a clear commitment to Queensland’s number one infrastructure priority, Cross River Rail and other essential infrastructure projects such as a new pipeline to connect Queensland’s gas supply with industry and users. |
| • | | Estimated Australian Government funding in 2017-18 for Queensland is $26.850 billion. Queensland is estimated to receive $14.871 billion in GST revenue and $11.979 billion in payments for specific purposes. |
| • | | The Commonwealth Grants Commission (CGC) 2017 Update Report recommended Queensland’s share of goods and services tax (GST) increase in 2017-18. The increase recognises the impact of factors beyond the State’s control, such as high Natural Disaster Relief and Recovery Arrangements (NDRRA) expenditure relating to 2011 and 2012 disaster events, higher service delivery costs and lower capacity to generate tax revenue in Queensland. |
| • | | Queensland’s estimated $14.871 billion of GST revenue in 2017-18 is $2.379 billion more than its population share. This reflects unavoidable higher costs in service delivery to regional and remote communities, and the need for appropriate funding being made available. Total GST revenue to all states is expected to be $62.340 billion in 2017-18, an increase of $3.100 billion or 5.2% on 2016-17. |
| • | | Of payments for specific purposes to Queensland in 2017-18, $882 million are National Specific Purpose Payments, $4.201 billion are National Health Reform funding, $4.129 billion are Quality Schools funding and $2.545 billion are National Partnership payments which include funding agreements for Universal Access to Early Childhood Education and Skills Reform. NDRRA funding of $223 million is expected in 2017-18. |
127
Budget Strategy and Outlook 2017-18
| 7.1 | Federal financial arrangements |
Federal financial relations in Australia are characterised by vertical fiscal imbalance (VFI). VFI occurs because state and territory governments’ ability to raise own-source revenue is less than required to meet service delivery responsibilities while the Australian Government raises more revenue than is required to meet its service delivery responsibilities. Revenue raised by the Australian Government is generated from taxpayers in all states and territories (states) 1. Without appropriate payments by the Australian Government to states, it will not be possible to provide the essential services and infrastructure sought by communities.
In 2015-16, the Australian Government collected the majority of taxation revenues (79.5%), while states collected 17.0% and local governments the remaining 3.6%2. National tax reform and other changes since 2000 have led to an increase in VFI. Chart 7.1 shows that while all states received 35.0% of their revenue from the Australian Government in 1999-2000, this is forecast to increase to 45.4% in 2017-18 based on the Australian Government’s budget estimates3.
| Chart 7.1 | General Government revenue sources, all states, 1999-2000 and 2017-181 |
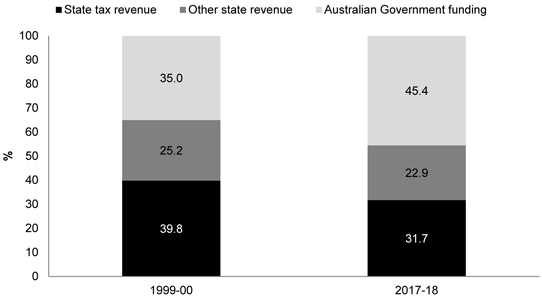
Note:
Sources: ABS Government Finance Statistics Cat No. 5512.0 and state and Australian Government Budget Papers.
| 1 | States refer to states and territories unless otherwise specified. |
| 2 | ABS Government Finance Statistics Cat No. 5506.0. |
| 3 | National aggregates and interstate comparisons in this chapter will use Australian Government estimates for consistency. Queensland specific figures are consistent with Queensland Budget estimates. |
128
Budget Strategy and Outlook 2017-18
In Australia, VFI is addressed through a system of intergovernmental payments from the Australian Government to the states which allow the states to meet their service delivery and infrastructure responsibilities. The framework for providing these payments is set out in the Intergovernmental Agreement on Federal Financial Relations (IGA FFR). The IGA FFR outlines the Australian Government’s commitment to provide ongoing financial support to the states through two types of payments – general revenue assistance and payments for specific purposes. These payments represent the Australian Government’s contribution to states’ current and future service delivery responsibilities. Without the appropriate contribution by the Australian Government, states would not be able to provide essential services and infrastructure.
General revenue assistance payments are able to be used by the states for any purpose (untied funding). Just over half of all Australian Government payments are untied and largely reflect the proceeds from the GST. Payments for specific purposes are considered tied funding which are provided to support a particular project or service area. These payments are comprised of ongoing financial payments to the states for service delivery in a particular sector, known as National Specific Purpose Payments (SPPs), and time-limited payments that support project delivery and facilitate reforms, known as National Partnership payments (NPs).
One of the outcomes of VFI has been overlap and duplication in roles and responsibilities relating to service delivery and infrastructure provision, particularly in the areas of health and education. This can result in excessive administration, unnecessary additional costs, blurred accountability and a misallocation of resources to areas of lower priority. Receiving a significant proportion of their revenue through Australian Government payments leaves states subject to unilateral decisions by the Australian Government affecting the stability and predictability of their finances.
Another important element of Australian federal financial arrangements is the process of horizontal fiscal equalisation (HFE). Like many federations, each Australian state has a different capacity to raise revenue or deliver services owing to factors largely beyond their control, such as demography, socio-economic status, geography and natural resources. The HFE process seeks to give all states the fiscal capacity to deliver services to their populations, taking into account states’ capacities to raise revenue from their own sources, as well as their different expenditure needs.
Under the terms of the IGA FFR, GST revenue is required to be distributed to the states on the basis of HFE. The Commonwealth Grants Commission (CGC) is tasked with recommending state shares of GST funding to the Australian Government. The amount of GST revenue received by an individual state is determined by the national pool of revenue collected through the GST and its recommended share.
The Australian Government recently tasked the Productivity Commission with reviewing the current HFE system to determine its economic impacts and whether preferable alternatives exist. Further details are provided in Box 7.1.
129
Budget Strategy and Outlook 2017-18
| Box 7.1 | Productivity Commission inquiry into Horizontal Fiscal Equalisation (HFE) |
On 30 April 2017, the Commonwealth Treasurer announced a Productivity Commission (the Commission) inquiry into Australia’s system of HFE, which underpins the current distribution of GST revenue to states.
The Commission has been asked to consider
“ …the influence the current system has on productivity, efficiency and economic growth, including the movement of capital and labour across state borders; the incentives for states to undertake fiscal (expense and revenue) reforms that improve the operation of their own jurisdictions, and on states’ abilities to prepare and deliver annual budgets.”
The Terms of Reference also instruct the Commission to consider the current system’s implications for equity, efficiency and simplicity. In addition, the Commission has been tasked with examining whether there may be preferable alternatives to the current system, taking account of previous reviews of the HFE process, including the 2012 GST Distribution Review report as well as international approaches to fiscal equalisation within federations.
As part of the inquiry, the Commission is seeking public feedback on these issues. The Queensland Government intends to provide a submission to the inquiry in support of the principle that all states should have the fiscal capacity to provide similar levels of services and infrastructure. It is also essential that the different circumstances and challenges each state faces are recognised to ensure similar levels of service can be delivered regardless of where someone lives.
For instance, as a vast and decentralised state, with more than seven times the land mass of Victoria and communities in every corner of the state, Queensland faces significant challenges in delivering services to regional and remote communities. The unavoidably higher costs in providing services to these communities must be recognised in any assessment of fiscal capacity and appropriate funding made available. The Queensland Government believes such funding is vital to ensure essential services and infrastructure are provided to all Queenslanders wherever they live.
A draft report is expected to be released in October 2017, with a final report due to be provided to the Australian Government by 31 January 2018.
130
Budget Strategy and Outlook 2017-18
| 7.2 | Australian Government funding to the states |
As discussed in section 7.1, total Australian Government payments to the states are made up of general revenue assistance payments and payments for specific purposes. General revenue assistance payments include proceeds from the GST, which are untied, whereas payments for specific purposes are considered tied payments as they are for a specific project or service area.
Total Australian Government payments for the states in 2017-18 are expected to be $118.968 billion, an increase of $3.161 billion, or 2.7%, from 2016-17. Payments in 2017-18 are expected to account for 26.8% of the Australian Government’s total revenue.
GST revenue from the Australian Government to all states is expected to be $62.340 billion in 2017-18, an increase of 5.2% in nominal terms, or 1.6% in real per capita terms.
Total payments for specific purposes in 2017-18 are expected to be $55.898 billion, a 0.1% increase in nominal terms and a 3.3% decrease in real per capita terms compared with 2016-17. Total payments for specific purposes consist of $19.563 billion in National Health Reform, $18.218 billion in Quality Schools funding, $13.742 billion in National Partnership payments and $4.375 billion in National Specific Purpose Payments (shown in Chart 7.2).
| Chart 7.2 | Breakdown of Australian Government payments to states, 2017-181 |
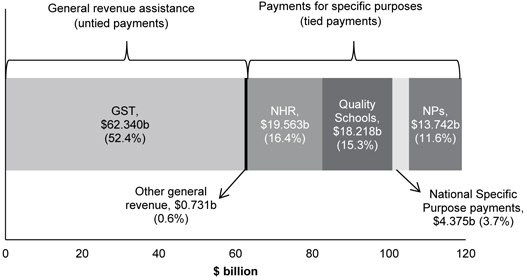
Note:
| 1. | NHR is funding under the National Health Reform. Quality Schools funding was previously Students First funding. NPs are funding for National Partnership payments. |
Source: 2017-18 Commonwealth Budget Paper No.3.
131
Budget Strategy and Outlook 2017-18
| 7.3 | Australian Government funding to Queensland |
With Queensland’s own-source revenue less than is required to meet its responsibilities, the appropriate level of Australian Government funding is essential to deliver vital services.
Estimated Australian Government funding in 2017-18 for Queensland, included in the 2017-18 Queensland Budget, is $26.850 billion4, an increase of $0.542 billion, or 2.1%, compared with 2016-17. This amount includes NDRRA payments of around $223 million in 2017-18. The estimated total Australian funding will comprise of $14.871 billion in payments for general purposes and $11.979 billion in payments for specific purposes.
Australian Government funding is estimated to account for 48.1% of Queensland’s total General Government Sector revenue sources in 2017-18 (shown in Chart 7.3). Australian Government funding has grown significantly as a proportion of Queensland’s total revenue since the introduction of the GST in 2000, consistent with a broader national trend.
| Chart 7.3 | General Government Sector revenue sources, Queensland, 2017-181 |
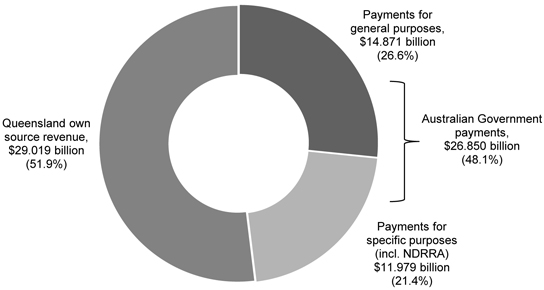
Note:
| 1. | Percentage may not add to 100% due to rounding. |
Source: 2017-18 Commonwealth Budget Paper No. 3 and Queensland Treasury estimates.
| 4 | This figure differs to Chapter 4 Australian Government payments estimates, owing to the exclusion of direct Australian Government payments to Queensland departments for Commonwealth own purpose expenditure. |
132
Budget Strategy and Outlook 2017-18
GST revenue accounts for all general purpose payments Queensland receives. In 2017-18, Queensland expects to receive $14.871 billion of GST revenue, $931.5 million or 6.7% higher than the amount received in 2016-17 (see Chart 7.4). This is also $2.379 billion greater than its population share.
| Chart 7.4 | Estimated GST payments to Queensland, 2012-13 to 2017-181 |
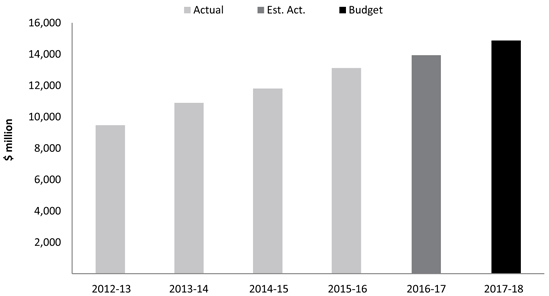
Note:
| 1. | Figures include the balancing adjustments which account for differences between the GST paid to states and the final GST pool size and population outcomes in the prior year. |
Sources: 2017-18 Commonwealth Budget Paper No. 3 and Queensland Treasury estimates.
The increase in GST revenue in 2017-18 largely reflects growth in the GST pool and an underlying increase in Queensland’s share of GST revenue as recommended in the CGC’s Report on GST Revenue Sharing Relativities – 2017 Update. The CGC’s recommended relativity (accepted by the Australian Government) for Queensland increased to 1.18769 for 2017-18, up from 1.17109 in 2016-17.
Queensland’s share of GST for 2017-18 has increased because of:
| • | | Lower proportion of high value holdings in Queensland’s total land value which are taxed at higher rates. This reduced Queensland’s capacity to raise land tax revenue. |
| • | | Higher relative wage costs in Queensland since 2012-13 which increased the cost of service delivery in the State in comparison to other states. |
| • | | Below average increase in Queensland’s property sales reduced its capacity to raise revenue from conveyance duty compared to New South Wales and Victoria who have experienced stronger property markets. |
| • | | Declines in Queensland’s taxable private sector payrolls between 2012-13 and 2015-16 while New South Wales and Victoria have experienced increases in private sector payrolls over the same period. This has reduced Queensland’s payroll tax revenue raising capacity compared to these states. |
133
Budget Strategy and Outlook 2017-18
These gains were partially offset by a greater share of Commonwealth infrastructure payments in 2015-16 compared to 2012-13 and lower population growth. Queensland’s share of GST revenue has traditionally increased due to previous above-average population growth rates which imply a greater need for infrastructure investment. While Queensland’s population growth rate has slowed in recent years dampening this effect, over the longer term, some moderate acceleration in population growth is expected (as discussed in Chapter 2).
Queensland’s share of GST is also impacted by changing circumstances in other states. For instance between 2012-13 and 2015-16 (assessment years for the 2017-18 relativity), New South Wales experienced strong activity in the property sector resulting in a significant positive impact on the state’s capacity to raise revenue, lowering its GST requirement. Additionally, Northern Territory’s share of national population growth declined, reducing its investment requirement and therefore GST. The net effect of these factors has led to a redistribution of GST revenue to other states including Queensland. Table 7.1 shows the relativities and resulting GST distributions for each state and territory for 2017-18.
| Table 7.1 | Recommended relativities and estimated GST shares, 2017-18 |
| | | | | | | | | | | | | | | | | | | | | | | | | | | | | | | | |
| | | NSW | | | Vic. | | | Qld | | | WA | | | SA | | | Tas. | | | ACT | | | NT | |
CGC recommended relativity | | | 0.87672 | | | | 0.93239 | | | | 1.18769 | | | | 0.34434 | | | | 1.43997 | | | | 1.80477 | | | | 1.19496 | | | | 4.66024 | |
GST Share ($ million) | | | 17,554 | | | | 14,765 | | | | 14,871 | | | | 2,327 | | | | 6,303 | | | | 2,387 | | | | 1,225 | | | | 2,908 | |
GST per capita ($) | | | 2,221 | | | | 2,362 | | | | 3,009 | | | | 872 | | | | 3,648 | | | | 4,573 | | | | 3,028 | | | | 11,807 | |
Sources: 2017-18 Commonwealth Budget Paper No. 3, Commonwealth Grants Commission Report on GST Revenue Sharing Relativities – 2017 Update.
| 7.5 | Payments to Queensland for specific purposes |
Payments for specific purposes comprise of National Health Reform funding, Quality Schools funding, National Specific Purpose Payments (SPPs), and National Partnership (NP) payments.
Queensland is expected to receive $11.979 billion in payments for specific purposes in 2017-18, $390 million lower than 2016-17. This is mainly due to lower NDRRA funding which is expected to decrease by $880 million to $223 million over the year.
134
Budget Strategy and Outlook 2017-18
In 2017-18, National Health Reform Funding which accounts for 35.1% of the total payment for specific purposes is expected to increase by 1.2% over the year to $4.201 billion. The proposed Quality Schools funding5 (refer to Box 7.3 for details) which accounts for 34.5% of the total payments for specific purposes, is expected to increase to $4.129 billion over the same period (see Table 7.2).
| Table 7.2 | Estimated payments for specific purpose1 |
| | | | | | | | | | | | |
| | | 2015-16
Actual
$ million | | | 2016-17
Est. Act.
$ million | | | 2017-18
Budget
$ million | |
National Specific Purpose Payments | | | 847 | | | | 865 | | | | 882 | |
Disability services | | | 289 | | | | 299 | | | | 310 | |
Affordable housing | | | 266 | | | | 269 | | | | 273 | |
Skills and workforce development | | | 292 | | | | 296 | | | | 300 | |
National Health Reform funding | | | 3,531 | | | | 4,153 | | | | 4,201 | |
Quality Schools funding2 | | | 3,743 | | | | 3,876 | | | | 4,129 | |
National Partnership Payments (incl. NDRRA) | | | 1,848 | | | | 3,475 | | | | 2,767 | |
Total payments for specific purposes | | | 9,969 | | | | 12,368 | | | | 11,979 | |
Notes:
| 1. | Numbers may not add due to rounding. |
| 2. | Quality Schools agreement is currently under negotiation and it replaces the formerly Student First – Education Reform funding. |
Sources: 2017-18 Commonwealth Budget Paper No. 3 and Queensland Treasury estimates.
National Specific Purpose Payments (SPPs) encompasses 7.4% of the total specific purpose payments. SPPs are expected to increase by 2.0% to $882 million in 2017-18 compared to the previous year. This can be attributed to higher funding for the disability services, affordable housing and skills and workforce development specific purpose payments arrangements.
National Partnership payments (including NDRRA) (NPs) account for 23.1% of the total payment for specific purposes. NPs are expected to decrease by 20.4% to $2.767 billion in 2017-18 compared to the previous year as a result of lower NDRRA funding. A significant proportion of these payments are allocated for infrastructure, housing and community services (refer to Chart 7.5).
| 5 | Quality Schools agreement is currently under negotiation and it replaces the former Student First- Education Reform Funding. |
135
Budget Strategy and Outlook 2017-18
| Chart 7.5 | National Partnership Payments by sector, 2017-181, 2 |
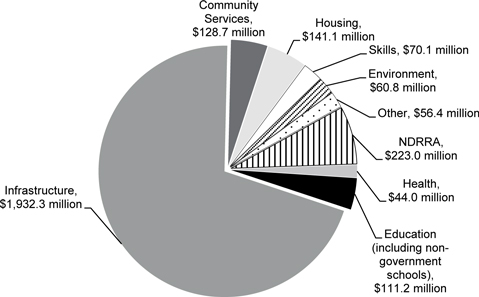
Notes:
| 1. | Excludes Australian Government direct funding to local government. |
| 2. | Total amount may not add to 2017-18 Budget forecast due to rounding. |
Sources: 2017-18 Commonwealth Budget Paper No. 3 and Queensland Treasury estimates.
136
Budget Strategy and Outlook 2017-18
| Box 7.3 | Key funding initiatives in the 2017-18 Commonwealth Budget |
Quality Schools funding
In the 2017-18 Commonwealth Budget, the Australian Government announced Quality Schools funding of $18.218 billion nationally in 2017-18 and $79.648 billion over the forward estimates to 2020-21. This included a new needs-based school funding model intended to improve education outcomes of Australian students and their schools for both government and non-government schools.
Australian Government funding is expected to grow in line with enrolments and indexation of 3.56% each year for the 2018, 2019 and 2020 school years. From the 2021 school year, funding is expected to be indexed by a program-specific parameter calculated as a composite of the Wage Price Index and Consumer Price Index.
The new funding is contingent on the Australian Government passing legislative changes this year and will be subject to agreement between the State and Australian Governments, particularly pertaining to the education reforms being sought by the Australian Government. The actual amount of funding to be received by individual states and sectors will be determined by a revision of the 2011 report into school funding undertaken by David Gonski.
The Australian Government funding under Quality Schools for Queensland Government schools is expected to be $1.622 billion in 2017-18 (and $7.274 billion over four years to 2020-21). Queensland non-government schools are expected to receive funding of $2.279 billion in 2017-18 (and $9.867 billion over four years to 2020-21).
The Quality Schools funding in the 2017-18 Commonwealth Budget also transitions the additional funding provided over two years from 2016-17 for school students with disability.
National Housing and Homelessness
In the 2017-18 Commonwealth Budget, the Australian Government announced the reform of the National Affordable Housing Agreement and the Homelessness agreements. This has resulted in a merge of these agreements to form a new National Housing and Homelessness Agreement (NHHA) which will commence from 2018-19. The NHHA will provide additional Australian Government funding of approximately $100 million to Queensland over three years from 2018-19 to fund ongoing homelessness support services, with this funding to be matched by the State Government. Total Australian Government funding under NHHA for Queensland will be $306.5 million in 2018-19 ($933.8 million over three years to 2020-21).
137
Budget Strategy and Outlook 2017-18
Skilling Australians Fund
The 2017-18 Commonwealth Budget announced the establishment of the Skilling Australians Fund (SAF) to support the skilling of Australian workers. This Fund will supersede funding provided under the National Partnership Agreement on Skills Reform and proposes to make available an estimated $1.5 billion nationally over the next four years to 2021. The total funding available under the SAF will be contingent on revenue raised by the Commonwealth from the introduction of a new Skilling Australians Fund levy (to be introduced from March 2018) to be imposed on businesses that employ foreign workers on certain skilled visas.
SAF funding will be prioritised towards trade and non-trade apprenticeships and traineeships in target areas. Eligible projects may include providing incentives for employers, pre-apprenticeship training, improving apprenticeship and traineeship retention and completion rates, and additional support for higher level apprenticeships.
While the 2017-18 Commonwealth Budget allocated $293.9 million over four years to 2021 to Queensland, the actual allocation will be contingent on revenue raised from the new levy and Queensland contributing matching funding and meeting eligibility criteria as outlined by the Australian Government. Significant uncertainty remains around this matching requirement and the details around the eligibility criteria for states to access SAF funding.
Infrastructure funding
Despite the 2017-18 Commonwealth Budget including a $10 billion National Rail Program (NRP), no specific funding has been provided for Queensland’s top infrastructure priority, Cross River Rail (CRR). While the CRR would appear to be a suitable candidate for funding under the NRP, it will need to compete with an extensive list of other potential multi-billion dollar rail projects around Australia. Additionally, funding of only $600 million of the $10 billion program has been committed to over two years in 2019-20 and 2020-21.
Likewise, no funding was provided in the 2017-18 Commonwealth Budget for the construction of a new gas pipeline to open up the Galilee and Bowen Basins. Such a pipeline would connect new potential gas producing areas with major east coast energy users in centres such as Townsville and help ease problems in the national energy market.
Uncertainties created by the Australian Government’s decision to deny direct funding to crucial infrastructure projects not only limits the State Government’s capacity to promote economic growth and employment across Queensland, it also creates additional unnecessary challenges for Queensland to plan its Budget.
138
Budget Strategy and Outlook 2017-18
| 7.5.1 | Projections of specific purpose funding to Queensland |
Across the forward estimates, total payments for specific purposes are expected to remain relatively stable, with annual average growth of around 0.5% between 2018-19 and 2020-21 (see Chart 7.6).
| Chart 7.6 | Payments for specific purposes to Queensland1, 2 |
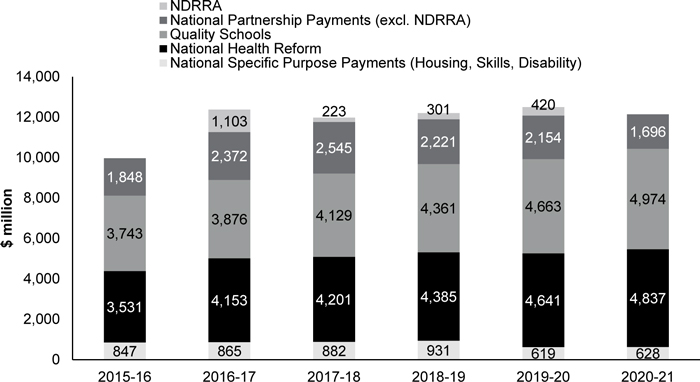
Notes:
| 1. | Excludes Australian Government direct funding to local government. |
| 2. | 2015-16 are actuals and 2016-17 are estimated actuals. |
Sources: 2017-18 Commonwealth Budget Paper No. 3 and Queensland Treasury estimates.
National Health Reform funding for Queensland is expected to increase by an average of 3.9% per annum over the forward estimates. Under the recently agreed Addendum to the National Health Reform Agreement, the Australian Government will fund 45% of the efficient cost of additional hospital activity, up to a national growth cap of 6.5% per annum.
Quality Schools funding for Queensland is expected to increase by $845 million between 2017-18 and 2020-21. For the 2018 school year and beyond, the Australian Government recently proposed a new needs-based funding model for schools. Under the new funding model Queensland is expecting to receive $7.274 billion for state schools and $9.867 billion for non-government schools over the forward estimates. However, funding is contingent on the Australian Government passing legislative changes this year and will be subject to agreement between the State and Australian Governments. Further details are provided in Box 7.3.
Funding for National SPPs is expected to decrease in 2019-20 as the NDIS is fully implemented from the same year, which will redirect the National Disability SPP to the NDIS. Funding for the skills and workforce development SPP and affordable housing SPP is expected to be relatively stable across the forward estimates.
139
Budget Strategy and Outlook 2017-18
The original intent of the IGA FFR was to limit the number of NPs, allowing for funding to flow to states for efficient service delivery and reduce the reporting burden. Over time, the number of time-limited and low-value NPs has increased, reducing budget certainty and raising community expectations for ongoing services.
When agreements expire, states are left with limited opportunities to deal with the expiring NP as the final decision on continued funding is made through the Australian Government’s budget process. The expiry of a number of large NPs over the last few years in a tight fiscal environment has brought the risks posed by the number of fixed-term funding arrangements into sharp focus. States have had limited capacity to influence the continuation of expiring agreements and often there is little warning on whether funding will be continued. An early indication as to the continuation, lapse or other treatment of funding under expiring agreements is necessary to enable states to undertake effective service delivery and budgetary planning.
There are 24 agreements due to expire in 2016-17 or 2017-18. The total value of these expiring agreements, over the lives of the agreements (which vary between one and ten years) is $1.966 billion. Of the 24 agreements currently due to expire, the 2017-18 Commonwealth Budget provided no advice on 13 agreements regarding renewal and/or funding. The most significant of which is the Remote Housing Strategy NP which provides funding for improved housing in Indigenous communities.
Short-term funding was announced for the Universal Access to Early Childhood Education NP until December 2018 and the Adult Public Dental Services NP until June 2019. When the Australian Government decides to cease funding for expiring agreements, this presents a significant ongoing fiscal risk, with impacts on the quality and continuity of much needed services delivered to vulnerable members of the community.
140
Budget Strategy and Outlook 2017-18
| 8 | Public Non-financial Corporations Sector |
Features
| • | | The Government is supporting over $520 million of additional infrastructure investment through a combination of government-owned corporations retaining a portion of their 2016-17 earnings, and additional capital investment from Government (discussed further in Box 8.1). |
| • | | The outlook for the electricity generators has improved substantially following significant improvements in wholesale prices. The recent higher prices have also flowed into an improved outlook over coming years. |
| • | | These higher wholesale prices have also contributed to a 7.1% increase in electricity prices for the typical household in the Queensland Competition Authority’s determination which was released on 31 May 2017. In response, the Queensland Government has intervened to reduce this electricity price increase to only 3.3% through committing $771 million in 2016-17 to remove the costs of the Solar Bonus Scheme from electricity prices from 2017-18 to 2019-20. |
| • | | The Government has also taken a number or reforms to place downward pressure on wholesale prices in the future, including directing Stanwell to alter its bidding behaviour in peak demand events. |
| • | | The electricity network businesses have also provided above budget returns as a result of higher energy sales associated with a hotter than usual summer. |
| • | | Following the merger of the electricity distribution businesses on 30 June 2016, Energy Queensland has reviewed its operational and capital expenditure programs to ensure the $562 million of merger savings are fully realised. As a result higher than expected savings of $233 million were achieved in 2016-17, with the overall savings target remaining unchanged. |
| • | | In response to the Commission of Inquiry into Queensland Rail’s train crewing practices, the Queensland Government is providing an additional $25 million to Queensland Rail in 2017-18 to implement the Inquiry’s 36 recommendations. |
141
Budget Strategy and Outlook 2017-18
A number of industries are covered by the Public Non-financial Corporations (PNFC) Sector, including energy, rail, port and water. Queensland’s government-owned corporations (GOCs), declared by regulation to be GOCs under the Government Owned Corporations Act 1993 (GOC Act), make up a large part of the PNFC sector. Also included in the sector are non-GOC entities, the Queensland Bulk Water Supply Authority (trading as Seqwater), Queensland Rail, local water boards and other public corporations.
GOCs are accountable for their financial performance and are required to be commercial and efficient organisations. These requirements are legislated under the GOC Act.
PNFC Sector entities provide services or commodities like other businesses. The entities incur costs and bear commercial risks in the delivery of their services or products and generate revenue from the sale of these services or products. The aim of these entities is to deliver vital services while also achieving a commercial rate of return which is returned to the Government as dividends.
These returns to Government are used to pay for important community services such as hospitals, education and concession payments and to repay Government debt. In some cases, part of a PNFC entity’s revenue may arise from community service obligation (CSO) payments from the Government. These payments are used to subsidise a service or commodity provided by the entity, and allow it to be provided to the community at a lower price than it would be on a purely commercial basis. A key example of this is the CSO paid to Energy Queensland to provide electricity in regional Queensland at prices based on the costs of supply in southeast Queensland, in accordance with the Government’s Uniform Tariff Policy.
| Box 8.1 | Capital allocation to priority projects of government-owned corporations |
As part of the Debt Action Plan announced in the 2015-16 Budget, Government reviewed the level of equity committed to its energy GOCs to ensure the most effective and efficient deployment of capital, consistent with the recommendations of the Review of State Finances. As a result of this review, the dividend payout ratio of most GOCs was increased and capital was reallocated to reduce General Government debt. The review of capital allocation was extended to other GOCs in the 2015-16 MYFER.
Since then, the capital structures of GOCs have been monitored to ensure they remain efficient and sustainable. Added to the regearing initiatives implemented in 2015-16, measures are being put in place to ensure the effective management of GOCs’ surplus cash, which is made available to Government when it is not immediately needed by GOCs.
In this Budget, the Government has continued its assessment of efficient capital allocation and cash management in the context of the strategic capital priorities of the sector, and opportunities to contribute to essential infrastructure and the growth and development of Queensland.
142
Budget Strategy and Outlook 2017-18
The estimated net profit after tax of GOCs is $1.9 billion in 2016-17. The Government will utilise some of these earnings to kick-start growth-enhancing infrastructure projects:
| • | | The Queensland Government will commit $150 million of Powerlink’s 2016-17 earnings to develop strategic transmission infrastructure in north and north-west Queensland to support a clean energy hub, subject to a feasibility study. This will unlock up to 2,000 megawatts of renewable energy projects and potentially support up to 4,600 jobs over the long term. |
| • | | Stanwell will reinvest $100 million of its 2016-17 earnings to contribute to funding the proposed hydro-electric power station at the Burdekin Falls Dam. This power station will further contribute to the State’s renewable energy generation capacity and support between 150 and 200 new jobs when construction commences. |
| • | | SunWater will retain $36 million of its 2016-17 earnings and Government will provide a further $100 million towards improvement works to ensure that the Burdekin Falls Dam continues to meet design standards, supports the proposed hydro-electric power station and allows for the potential raising of the dam wall. This is expected to support up to 250 construction jobs in regional Queensland. |
| • | | Port of Townsville will reinvest $13 million of its 2016-17 earnings to contribute to the channel widening project, which will allow larger vessels to access the port. In addition, the State Government will commit a further $62 million to this project. The Government will work with Port of Townsville on additional funding opportunities to progress this important economic development project. Together with work on streamlining the supply chain, this channel widening will position Port of Townsville as a hub for trade between North Queensland and the rest of the world, and an alternative to Port of Brisbane. |
| • | | The Government will contribute $60 million over two years from 2018-19 to widen and deepen the Trinity Inlet Channel and swing basin at the Port of Cairns. The project will allow cruise ships up to 300 metres in length access to the Port, and also facilitate future Navy expansion plans. The project has an estimated cost of $120 million and will be subject to an Environmental Impact Statement and business case approval. |
| • | | The Government will contribute $2.5 million to the investigation and possible establishment of a Clean Energy Company that will own the State’s renewable and clean energy assets. Consideration will be given during this investigation to whether existing State-owned hydro electric and gas generation assets, as well as the new renewable energy projects announced in this Budget, become the foundation assets of this entity. There will also be an investigation into the ability of such an entity to enhance competition in the wholesale market. |
These measures will collectively contribute over $520 million to infrastructure investment in regional Queensland and complement the $225 million of State funding which Government is providing to assist with Townsville water security measures.
The Government will continue with the cash management strategy announced in the 2016-17 Budget.
143
Budget Strategy and Outlook 2017-18
Electricity Networks
The Queensland Government owns two electricity network businesses that are responsible for transporting safe, reliable electricity to consumers across the State – Powerlink and Energy Queensland.
Revenues for the network businesses are largely derived from network services that are regulated by the Australian Energy Regulator (AER). The AER determines these revenues on a five-yearly basis, based on the businesses’ proposals and its view of the reasonable benchmark efficient costs for a network business.
Powerlink is a high-voltage transmission network that transports electricity long distances from generation plants to the distribution networks and connects Queensland to other states. The electricity is transmitted at high voltages so that large volumes can travel efficiently over long distances. To ensure mandated reliability levels are maintained as demand grows, Powerlink is obligated to plan and develop the network. Powerlink’s external environment has changed significantly in recent years with changes in consumer demand, market and regulatory changes, increasing complexity within the electricity market and the emergence of renewable energies and other technologies.
On 28 April 2017, the AER delivered its final revenue determination for Powerlink for the 2017-18 to 2021-22 regulatory period. The AER’s final determination will allow Powerlink to recover $3.940 billion over the five year period (2017-18 to 2021-22) in comparison to $4.680 billion (nominal) during the previous regulatory period (2012-13 to 2016-17). The final decision allows for annual revenues to be $240.7 million (24.7%) lower than the previous regulatory period in real dollar terms. The reduction in regulated revenue reflects declining demand growth forecasts. The decision reduces the total capital expenditure from $2.520 billion in the previous regulatory period down to $835.5 million in the 2017-2022 period with the AER concluding that Powerlink can improve the whole-of-life performance of their network assets. Total operating expenditure has remained relatively flat with a slight increase from $933.5 million in 2012-2017 to $976.7 million in 2017-2022.
The new determination will moderate pressure on customers’ bills, with the AER estimating an annual average reduction in network charges flowing through to customers of $32 for residential customers.
In addition to the regulated revenue, Powerlink has increased its focus on its growing non-regulated revenue stream through expanding its business development capability. Powerlink has identified a number of potential projects in Queensland over the next 12 months, the value of which range from $60 million to $250 million, and has responded to increased competition in this area by aiming to establish a more proactive commercial approach to such projects.
On 30 June 2016, Energex and Ergon Energy were merged under the new parent company, Energy Queensland. Energy Queensland owns and operates the low-voltage distribution network that transports electricity from Powerlink’s transmission network and distributes it to households and businesses across Queensland. Ergon Energy, which provides the distribution network in regional Queensland, is also Queensland’s second largest electricity retailer, providing retail services to the majority of customers in regional Queensland.
As well as providing these services, Energy Queensland is also involved in a range of other activities including the provision of contestable metering services and telecommunications. It also owns and operates the Barcaldine power station, as well as 33 stand-alone power stations that provide power supply to customers in isolated communities not connected to the grid.
144
Budget Strategy and Outlook 2017-18
Energy Queensland has also established a new energy services business to pursue strategic investments in unregulated markets to provide greater choice to customers and enable the group to respond to industry disruption.
When the Government announced the merger of Energex and Ergon Energy under Energy Queensland in MYFER 2015-16, it was announced that through merger and other efficiencies, savings of $562 million are expected over five years. These savings will deliver benefits to both Government and electricity consumers, through improved returns from the business, and by putting downward pressure on electricity prices. They will also put Energy Queensland on a sustainable path to achieving the efficiency improvements required under the AER determinations for 2015-2020, ensuring the business is well placed for its next AER determination in 2020.
After the merger on 30 June 2016, and the appointment of a new Chair and CEO, Energy Queensland has assessed the efficiency and merger savings originally forecast. Management developed and negotiated approved savings targets for their respective areas of responsibility and these were aggregated and compared to the savings identified by the Government’s advisers to the merger. As a consequence there has been a change to the profile of savings expected to be achieved, with higher than expected savings to be achieved in 2016-17 and a revision to the level of future savings. Energy Queensland is working hard to pursue additional savings to maintain downward pressure on electricity prices.
| Table 8.1 | Network Merger and Efficiency Savings1 |
| | | | | | | | | | | | | | | | | | | | | | | | |
| | | 2015-16
$ million | | | 2016-17
$ million | | | 2017-18
$ million | | | 2018-19
$ million | | | 2019-20
$ million | | | Total
$ million | |
Distribution Merger and Efficiency Savings forecast at MYFER 2015-16 | | | (8 | ) | | | 10 | | | | 178 | | | | 180 | | | | 202 | | | | 562 | |
Distribution Merger and Efficiency Savings currently forecast | | | 0 | | | | 233 | | | | 81 | | | | 96 | | | | 153 | | | | 562 | |
Note:
| 1. | Numbers may not add due to rounding and bracketed numbers represent negative amounts. |
To date over 40% of the forecast savings have been achieved with significant reductions in capital expenditure and smaller reductions in operating expenditure, which have assisted in containing electricity prices. The savings currently expected in 2016-17 exceed the original forecasts at the time of the 2015-16 MYFER and updated forecasts of $76 million from 2016-17 MYFER. The savings achieved have contributed to the higher than expected dividend expected to be paid by Energy Queensland of $911 million for this financial year.
145
Budget Strategy and Outlook 2017-18
Electricity Generation
The National Electricity Market (NEM) has been undergoing an unprecedented period of change and the Queensland generators are not immune to this. Various developments in the industry are expected to provide opportunities for the Queensland generators in the near future. Notably, this includes the closure of the Hazelwood Power Station in Victoria in March 2017 which has increased demand for baseload generation to be provided from other parts of the NEM. The development of the Liquefied Natural Gas (LNG) industry in Queensland is almost complete, with all six trains online. As anticipated, the ramp up in LNG production has led to a significant increase in baseload demand to meet their production requirements and has diverted gas away from electricity generation. These factors contributed to increased domestic energy prices.
However there are also changes in the industry, which will present challenges for the generators and potentially result in reduced demand for baseload generation. The amount of renewables in Queensland is increasing and is expected to increase markedly in coming years, providing a significant amount of new capacity in the market and changing the generation mix. This includes continued growth in solar photovoltaic (PV) panels which, as at 30 April 2017, provided installed PV capacity of 1,706 megawatts (MW) in Queensland. The increased take up of batteries and other technological developments will also start to impact on the landscape of the electricity generation industry.
CS Energy is a merchant electricity generator that sells electricity in the NEM under the Electricity Act 1994. CS Energy has more than 400 employees, operates three power stations and has a trading portfolio of 4,035 MW. CS Energy dispatches 35% of Queensland’s electricity output and 10% of electricity supplied to the NEM.
CS Energy’s diverse asset portfolio comprises coal-fired and hydroelectric power stations, electricity trading rights and coal assets. CS Energy owns and operates the Callide B, Kogan Creek and Wivenhoe power stations and has a 50% interest in the Callide C Power Station. CS Energy provides operations and maintenance services to the joint venture owners of the Callide C Power Station.
In November 2016, CS Energy resolved a long-standing contractual dispute with Anglo American, which resulted in Batchfire Resources Pty Ltd taking ownership of the Callide Mine from Anglo American. On 1 November 2016, since Batchfire took control of the Callide Mine from Anglo, it has met delivery and quality requirements under the new coal supply agreement.
Meanwhile, CS Energy has successfully implemented strategies that will exceed the efficiency targets identified during the 2015-16 MYFER.
As a result of these efforts, in 2015-16 CS Energy was able to return a dividend to shareholders for the first time in seven years.
Stanwell has a total of more than 4,000 MW of installed capacity, and is one of Australia’s largest electricity providers. Stanwell has a diversified portfolio of coal, gas and water assets, which it uses to generate electricity. In the past year, Stanwell has invested nearly $200 million in capital projects to ensure the efficiency and security of its generation fleet.
Stanwell is well placed to play a supportive role in the move to a more renewable generation mix. Through its portfolio of hydro power stations, Stanwell has the capacity to generate more than 160 MW of environmentally responsible energy.
146
Budget Strategy and Outlook 2017-18
As part of the review of the State’s electricity businesses in 2015 and 2016, the Government identified efficiency savings that could be achieved by Stanwell which amounted to $110 million by 2019-20. To date Stanwell has already achieved significant efficiency savings through reducing its operational costs and redesigning its workforce structures.
As part of the Powering Queensland Plan, the Government has taken steps to ensure affordable, secure and sustainable energy supply for Queensland homes, businesses and industry. This involves issuing directions to publicly owned electricity industry participants to bring more supply into the market to reduce volatility and put downward pressure on wholesale prices.
| Table 8.2 | Generation Business Efficiency Savings1 |
| | | | | | | | | | | | | | | | | | | | | | | | |
| | | 2015-16
$ million | | | 2016-17
$ million | | | 2017-18
$ million | | | 2018-19
$ million | | | 2019-20
$ million | | | Total
$ million | |
Generation efficiency forecast at MYFER 2015-16 | | | 17 | | | | 31 | | | | (1 | ) | | | 57 | | | | 6 | | | | 110 | |
Generation efficiency currently forecast | | | 31.1 | | | | 24.7 | | | | 11 | | | | 66.5 | | | | 48.7 | | | | 182.1 | |
Note:
| 1. | Numbers may not add due to rounding and bracketed numbers represent negative amounts. |
Queensland Rail
Queensland Rail is an integrated, publicly-owned rail operator, responsible for the delivery of passenger transport in South East Queensland, long distance passenger services in rural and regional Queensland and provision of third party access to networks for freight transport across the State.
The majority of Queensland Rail’s services are delivered under a Rail Transport Services Contract (TSC) between the Government, represented by the Department of Transport and Main Roads (TMR), and Queensland Rail. The Rail TSC provides funding for rail infrastructure, Citytrain (South East Queensland passenger services) and Traveltrain (regional passenger services).
147
Budget Strategy and Outlook 2017-18
| Box 8.2 | Reforms of Queensland Rail governance |
Queensland Rail is focused on the delivery of safe, reliable and value for money rail services. However, due to a range of factors, its timetable services were severely disrupted in 2016, impacting on rail passengers. To fully investigate the failures and to ensure Queensland Rail improves its services, the Government initiated an independent inquiry into Queensland Rail’s train crewing practices.
The Commission of Inquiry submitted its final report to the Premier on 31 January 2017. The Government endorsed all 36 recommendations and all 36 will be fully implemented.
The Commission identified four key underlying factors which caused the disruptions to the passenger services on the Citytrain network:
| • | | demand for train crew increased significantly in recent years |
| • | | the supply of qualified drivers declined over the same period |
| • | | people and process limitations resulted in the growing gap between supply and demand not being widely appreciated |
| • | | Queensland Rail’s vast remit and its complex and unclear governance arrangements made it difficult for the CEO to maintain effective oversight of operations. |
The implementation of the recommendations will ensure Queensland Rail has the internal capacity for forward planning and implementation of processes and procedures to address issues that resulted in the disruptions to Citytrain passenger services. It will also ensure that Queensland Rail is well placed to better forecast and plan the recruitment and training of train crew to ensure services are delivered at an appropriate level to meet the needs of South East Queensland.
To ensure there are no financial constraints to the implementation of the Commission’s recommendations, the Government is providing $25 million to Queensland Rail for implementation costs in 2017-18. This funding will be provided through the existing Transport Services Contract.
Ports
Queensland has a large network of ports along its coastline, ranging from small installations serving local communities to world class export terminals. Other than the Port of Brisbane, all Queensland ports are owned by the State Government and run by GOCs. Queensland’s ports are a major component of its supply chain and economy, and their efficient operation is essential to continued economic growth, job creation, and sustainable development in the State.
The port sector’s financial performance is influenced by the condition of the Queensland economy, particularly in terms of demand abroad for Queensland’s natural resources and agricultural products. Queensland ports continue to look to further enhance supply chain efficiency and identify new markets to improve financial outcomes and stimulate the Queensland economy.
148
Budget Strategy and Outlook 2017-18
Key projects in 2017-18 include:
| • | | progressing the Environmental Impact Statement and approvals for the Cairns Shipping Development Project |
| • | | the completion of accelerated works programs at Abbot Point, Hay Point and Mackay and the upgrades of infrastructure for wharves 4 and 5 at the Port of Mackay to support trade growth |
| • | | progressing the detailed business case and seeking approvals to commence works on the Clinton Vessel Interaction Project. |
Water
The two largest entities in the Queensland bulk water market are the Queensland Bulk Water Supply Authority (trading as Seqwater) and SunWater Limited (SunWater).
Seqwater is responsible for supplying safe, secure and reliable bulk drinking water for people across South East Queensland (SEQ). Its assets and area of operations are spread across a large geographic area from the New South Wales border, to the base of the Toowoomba ranges and as far north as Gympie. Seqwater also provides essential flood mitigation services, and manages seven water supply schemes which provide irrigation services to approximately 1,200 rural customers.
Seqwater is also the owner-operator of 37 water treatment plants, the Gold Coast Desalination Plant and the Western Corridor Recycled Water Scheme, and a 600 kilometre reverse flow pipeline network that connects the Sunshine Coast to the Gold Coast (the Water Grid).
Seqwater’s revenue primarily comes from bulk water sales, with prices for this determined by the SEQ bulk water price path. The price path was established to phase in affordable price increases to fund the construction of the SEQ Water Grid. During this period it was anticipated that bulk water prices would not recover the costs of bulk water supply, which resulted in Seqwater selling bulk water at a loss, with the shortfall funded by borrowings (the resulting debt is known as ‘price path debt’). This price path debt is expected to peak in 2016-17 and decline over the period to 2028 as this debt is repaid. Total borrowings are forecast to be stable from 2016-17 onwards.
The bulk water price path is smoothing the implementation of cost-reflective pricing, which are scheduled to be achieved for most Local Government Areas in SEQ by 2017-18, and by 2019-20 for the Local Government Areas of Noosa, the Sunshine Coast, and Redland. The price path will see Seqwater’s revenue increase over the forward estimates with Seqwater maintaining its positive operating position over the forward estimates period, excluding depreciation expenses. Seqwater has maintained a positive operating position since the merger with the SEQ Water Grid Manager, LinkWater and the former Seqwater on 1 January 2013. Seqwater also continues to set improved operational and capital efficiency targets in order to deliver value for money for residents of SEQ.
Seqwater’s financial performance for 2016-17 is expected to exceed both the original budget and the MYFER update as a result of the hotter and dryer conditions experienced over the summer period. The forecast financial performance is also expected to increase as a result of extending the water sale contract with Stanwell Limited from 2018-19 onwards, as well as updated demand forecasts.
149
Budget Strategy and Outlook 2017-18
Key projects in 2017-18 include:
| • | | Somerset Hydro Refurbishment |
| • | | Petrie Water Supply Zone Upgrade |
| • | | Beaudesert Water Supply Zone Upgrade |
| • | | Mt Crosby East Bank Water Pump Station Flood Resilience Works |
| • | | Mt Crosby East Bank Water Treatment Plant Filtration Upgrade |
| • | | Lake MacDonald Dam Upgrade Stage 2. |
SunWater is the Government’s major bulk water supply business for all regions outside of SEQ. It supplies untreated bulk water to approximately 5,000 customers across the industrial, mining, urban and irrigation customer segments. SunWater provides this through an extensive regional asset base, owning and managing water infrastructure assets with a replacement value of around $13 billion. This includes 19 major dams, 66 weirs and barrages, 82 major pumping stations, 3,155 km of pipelines and channels, 730 km of drains and 12 small licensed water and sewerage treatments plants to cater for staff and recreational visitors at dam sites.
SunWater’s ongoing interaction with customers and industry representative groups suggests a period of low growth in key customer segments will continue. Despite the market situation, SunWater continues to actively work with customers to investigate all business opportunities consistent with the Government’s expectations and priorities.
Dam safety is a major focus for SunWater as it is for all bulk water suppliers. SunWater commenced a prioritised Dam Safety Improvement Program (DSIP) in 2005 to ensure that dam safety is maintained.
The DSIP is an essential program to ensure the safety and stability of dams and the ongoing safety of downstream communities, and SunWater must undertake dam safety work to meet its obligations under Queensland dam safety regulations. However, it is also likely to significantly influence SunWater’s financial performance and net flows to the Government over the forward estimates period and beyond.
Key projects that will be progressed in 2017-18 include:
| • | | Fairbairn Dam spillway improvements and rectification works |
| • | | Burdekin Falls Dam foundation drainage improvement works |
| • | | Boondooma Dam spillway reinstatement and sidewall repair |
| • | | strengthening the monoliths ‘D’ and ‘K’ within the primary spillway of Paradise Dam and undertaking secondary spillway improvements. |
150
Budget Strategy and Outlook 2017-18
| 8.2 | Finances and performance |
| 8.2.1 | Earnings before interest and tax |
Total forecast PNFC Sector earnings before interest and tax (EBIT) for 2016-17 are estimated to be $4.731 billion, up from $4.059 billion forecast at the time of the 2016-17 Budget. This increase is primarily due to increases in networks and generation. The increased performance in both the network and generation businesses is driven by higher energy sales as a result of the hotter than usual summer.
Over the forward estimates, total PNFC sector EBIT is expected to decrease to $3.517 billion in 2020-21. This projected decrease is driven by forecast reductions in wholesale generation revenues resulting in lower generation sector earnings, and lower electricity network business earnings over the current regulatory period (see Table 8.3).
The generators have benefited from increased sales revenue due to the higher wholesale electricity prices in 2016-17. The better electricity price outlook has also supported revenues in coming years. CS Energy is also benefiting from the new coal supply agreement, which has improved coal delivery for Callide mine. Reflecting these factors, the aggregated EBIT for the generators is forecast to improve, peaking in 2017-18, before lower wholesale prices reduce EBIT over the forward estimates.
In Powerlink’s new regulatory period (which begins on 1 July 2017) the recoverable revenue allowance will be materially reduced, driven by both a lower cost of capital allowance and regulated asset base roll forward. This has been reflected in forecast EBIT reducing from $753 million in 2016-17 to a forecast $405 million in 2017-18, making significant contributions to the overall reduction in the electricity network’s reduced EBIT.
Seqwater has benefited from increased water sales revenue in 2016-17 due to the hotter and dryer conditions over summer. Seqwater is also benefiting from new contracting arrangements with Stanwell Limited, updated demand assumptions and revenue increases flowing from the bulk water price path, which all contribute to EBIT improving over the forward estimates.
151
Budget Strategy and Outlook 2017-18
| Table 8.3 | Earnings before interest and tax1 |
| | | | | | | | | | | | | | | | | | | | | | | | | | | | |
| | | 2015-16
Actual
$ million | | | 2016-17
Budget
$ million | | | 2016-17
Est. Act.
$ million | | | 2017-18
Budget
$ million | | | 2018-19
Projection
$ million | | | 2019-20
Projection
$ million | | | 2020-21
Projection
$ million | |
Electricity Networks | | | 2,573 | | | | 2,533 | | | | 2,823 | | | | 2,064 | | | | 1,933 | | | | 1,941 | | | | 1,869 | |
Electricity Generation | | | 382 | | | | 482 | | | | 892 | | | | 1,070 | | | | 858 | | | | 750 | | | | 564 | |
Rail | | | 447 | | | | 409 | | | | 354 | | | | 291 | | | | 335 | | | | 371 | | | | 379 | |
Ports | | | 218 | | | | 212 | | | | 191 | | | | 188 | | | | 212 | | | | 227 | | | | 232 | |
Water | | | 352 | | | | 409 | | | | 452 | | | | 438 | | | | 482 | | | | 460 | | | | 483 | |
Other | | | (59 | ) | | | 13 | | | | 19 | | | | 1 | | | | (8 | ) | | | (10 | ) | | | (10 | ) |
Total PNFC sector earnings before interest and tax | | | 3,913 | | | | 4,059 | | | | 4,731 | | | | 4,053 | | | | 3,811 | | | | 3,739 | | | | 3,517 | |
Note:
| 1. | Numbers may not add due to rounding and bracketed numbers represent negative amounts. |
Entities in the PNFC Sector utilise debt financing as a source of funds for asset renewal and capital investments, and to maintain an optimum capital structure.
PNFC Sector entities are required to take a prudent and sound approach to the management of debt, including the establishment of borrowing arrangements which are appropriate to the business risk of the organisation. These arrangements take into account the appropriateness of the proposed capital expenditure program, together with the implications of the borrowings for key financial and performance related indicators.
Total forecast PNFC Sector borrowings for 2016-17 are estimated to be $39.165 billion. Forecast borrowings are expected to increase to $39.904 billion by 2020-21, primarily driven by increases in the rail and electricity network businesses, while partially offset by reductions in the electricity generation businesses’ borrowings (see Table 8.4).
The electricity network borrowings are forecast to increase over the forward estimates in line with growth in the regulated asset base.
Debt sourced from QTC is forecast to remain constant for Stanwell, and to reduce for CS Energy over the forward estimates, as it applies its higher earnings to reduce debt levels to more closely align with its peers.
Borrowings attributable to the generators are higher in 2016-17 and 2017-18, reflecting the unrealised market value effect of forward contracts entered into prior to the upward change in market conditions. This adjustment presents as borrowings under the Uniform Presentation Framework. These forward contracts are entered into at rates prevailing in the market at the time and provide revenue certainty to the generators. The liability will reverse as these contracts unwind in subsequent years with no impact on the earnings of the generators.
152
Budget Strategy and Outlook 2017-18
Borrowings attributable to port GOCs increased significantly in 2016-17, primarily reflecting the Government’s decisions under the Debt Action Plan to increase the gearing of Gladstone Ports Corporation Limited and North Queensland Bulk Ports Limited to more commercial levels through special dividends and capital returns to Government. Total port GOC borrowings over the forward estimates are forecast to increase to fund new capital works and infrastructure projects for the ports of Gladstone and Townsville.
Borrowings in the water sector are largely attributable to Seqwater, which holds around $9.4 billion of debt. The debt balance was the result of the large investment in water infrastructure in response to the Millennium Drought and the associated price path. Seqwater has updated its forecast borrowing to be stable across the forward estimates.
The gearing levels of all GOCs continue to be monitored to ensure that all GOCs maintain metrics that are at a minimum consistent with an investment grade credit rating.
| | | | | | | | | | | | | | | | | | | | | | | | | | | | |
| | | 2015-16 | | | 2016-17 | | | 2016-17 | | | 2017-18 | | | 2018-19 | | | 2019-20 | | | 2020-21 | |
| | | Actual | | | Budget | | | Est. Act. | | | Budget | | | Projection | | | Projection | | | Projection | |
| | | $ million | | | $ million | | | $ million | | | $ million | | | $ million | | | $ million | | | $ million | |
Electricity Networks | | | 21,573 | | | | 21,622 | | | | 21,403 | | | | 21,689 | | | | 22,157 | | | | 22,543 | | | | 23,171 | |
Electricity Generation | | | 2,262 | | | | 1,700 | | | | 3,681 | | | | 1,580 | | | | 1,167 | | | | 878 | | | | 963 | |
Rail | | | 3,014 | | | | 3,308 | | | | 3,169 | | | | 4,061 | | | | 4,366 | | | | 4,611 | | | | 4,854 | |
Ports | | | 607 | | | | 1,033 | | | | 990 | | | | 997 | | | | 997 | | | | 1,012 | | | | 1,052 | |
Water | | | 9,900 | | | | 10,004 | | | | 9,850 | | | | 9,846 | | | | 9,856 | | | | 9,891 | | | | 9,848 | |
Other | | | 80 | | | | (172 | ) | | | 72 | | | | 57 | | | | 41 | | | | 25 | | | | 16 | |
Total PNFC sector borrowings | | | 37,436 | | | | 37,496 | | | | 39,165 | | | | 38,231 | | | | 38,584 | | | | 38,960 | | | | 39,904 | |
Note:
| 1. | Numbers may not add due to rounding and bracketed numbers represent negative amounts. |
| 8.2.3 | Returns to Government |
PNFC Sector entities provide returns to Government by way of dividends and current tax equivalent payments (TEPs).
153
Budget Strategy and Outlook 2017-18
Dividends
A GOC’s dividend policy is agreed with shareholding Ministers as part of the Statement of Corporate Intent for the relevant period. A Statement of Corporate Intent represents a performance contract between the shareholding Ministers and a GOC board, with the board being accountable to shareholding Ministers for meeting financial and non-financial performance targets and delivering on the outcomes detailed in the Statement of Corporate Intent. When establishing the dividend policy for the period, GOC boards are expected to ensure that it takes into account the return shareholders expect on their investments and the levels of equity required to maintain a preferred capital structure. The final dividend payment is determined in accordance with the GOC Act.
In 2016-17, the Government decided that some GOCs should retain some or all of their annual earnings, to fund upcoming capital projects.
Total forecast PNFC sector dividends for 2016-17 are estimated to be $1.641 billion, up from the $1.535 billion forecast at the time of the 2016-17 Budget (see Table 8.5). This increase in dividends has been driven by increased earnings from the electricity generation and network businesses, which have benefited from higher electricity demand during the year. The reductions in the AER’s Final Determination on Powerlink’s regulated revenue proposal are mainly driven by low levels of demand growth in coming years. These higher dividends will in part be used to fund the $771 million removal of Solar Bonus Scheme costs from electricity bills to provide electricity price relief to Queenslanders.
Dividends are projected to decrease to $1.095 billion by 2020-21, primarily driven by significant reductions in dividend returns from the electricity network businesses as a result of Powerlink’s new revenue determination which commences in 2017-18 and provides for significantly lower annual revenues than the previous determination period, and low regulated revenue growth for the network businesses over the forward estimates.
In addition to the dividends provided by the network businesses, Powerlink will retain $150 million of its 2016-17 earnings for the development of strategic transmission infrastructure to support a clean energy hub (discussed further in Box 8.1).
The generators are expected to provide strong dividends over the forward estimates. These returns will be supported by a tight wholesale market following the closure of large baseload generators in southern states.
In addition, Stanwell will retain $100 million of its 2016-17 earnings to help fund the proposed hydro-electric power station at Burdekin Falls Dam. Completion of the Burdekin Falls Dam project will be subject to feasibility investigations (discussed further in Box 8.1).
The port GOCs’ dividends in 2016-17 will be lower than budgeted reflecting a combination of non-recurring gains realised in 2015-16 instead of 2016-17, and lower earnings due to slightly lower tonnages than forecast, bad debts and higher interest costs. In addition, the Port of Townsville will retain around $13 million of earnings for 2016-17 as contribution towards the Townsville channel capacity upgrade (discussed further in Box 8.1). Over the forward estimates, dividends are estimated to stabilise and grow modestly in line with improving returns of the port businesses.
154
Budget Strategy and Outlook 2017-18
Dividends for the water GOCs in 2016-17 will be lower primarily due to SunWater retaining its 2016-17 earnings of $36 million to contribute to the dam safety works for the Burdekin Falls Dam (discussed further in Box 8.1).
| | | | | | | | | | | | | | | | | | | | | | | | | | | | |
| | | 2015-16 | | | 2016-17 | | | 2016-17 | | | 2017-18 | | | 2018-19 | | | 2019-20 | | | 2020-21 | |
| | | Actual | | | Budget | | | Est. Act. | | | Budget | | | Projection | | | Projection | | | Projection | |
| | | $ million | | | $ million | | | $ million | | | $ million | | | $ million | | | $ million | | | $ million | |
Electricity Networks | | | 1,146 | | | | 1,000 | | | | 1,068 | | | | 716 | | | | 626 | | | | 621 | | | | 537 | |
Electricity Generation | | | 175 | | | | 216 | | | | 378 | | | | 463 | | | | 388 | | | | 390 | | | | 291 | |
Rail | | | 182 | | | | 164 | | | | 120 | | | | 92 | | | | 128 | | | | 155 | | | | 151 | |
Ports | | | 134 | | | | 114 | | | | 69 | | | | 86 | | | | 101 | | | | 111 | | | | 113 | |
Water | | | 39 | | | | 41 | | | | 8 | | | | 28 | | | | 22 | | | | 2 | | | | 4 | |
Other | | | 20 | | | | — | | | | — | | | | 10 | | | | — | | | | — | | | | — | |
Total PNFC sector dividends | | | 1,696 | | | | 1,535 | | | | 1,641 | | | | 1,395 | | | | 1,265 | | | | 1,279 | | | | 1,095 | |
Note:
| 1. | Numbers may not add due to rounding and bracketed numbers represent negative amounts. |
Tax equivalent payments
Tax equivalent payments (TEPs) are paid by the PNFC Sector entities to recognise the benefits derived because they are not liable to pay Australian Government tax. The primary objective of the payment is to promote competitive neutrality, through a uniform application of income tax laws between the government-owned entities and their privately held counterparts.
Total forecast PNFC Sector TEPs for 2016-17 are estimated to be $812 million, up from the projected $687 million at the time of the 2016-17 Budget (see Table 8.6).
Following a prolonged period of losses and deferred payments, CS Energy is forecast to record a small tax equivalent payment in 2018-19, followed by more substantial payments in the following two years. For Stanwell, after strong prices support tax equivalent payments in 2016-17 and 2017-18, less supportive market conditions will result in tax equivalent payments trending downwards over the latter half of the forward estimates.
For the Port GOCs, 2016-17 TEPs are estimated to be slightly lower than forecast reflecting a combination of non-recurring gains in 2015-16, lower than expected earnings from resources customers due to challenging market conditions, and higher interest costs. Over the forward estimates, TEPs are estimated to stabilise and grow modestly in line with improving returns of the port businesses.
155
Budget Strategy and Outlook 2017-18
| Table 8.6 | Tax equivalent payments1 |
| | | | | | | | | | | | | | | | | | | | | | | | | | | | |
| | | 2015-16 | | | 2016-17 | | | 2016-17 | | | 2017-18 | | | 2018-19 | | | 2019-20 | | | 2020-21 | |
| | | Actual | | | Budget | | | Est. Act. | | | Budget | | | Projection | | | Projection | | | Projection | |
| | | $ million | | | $ million | | | $ million | | | $ million | | | $ million | | | $ million | | | $ million | |
Electricity Networks | | | 545 | | | | 463 | | | | 541 | | | | 324 | | | | 289 | | | | 288 | | | | 258 | |
Electricity Generation | | | 86 | | | | 91 | | | | 152 | | | | 154 | | | | 132 | | | | 219 | | | | 174 | |
Rail | | | 83 | | | | 66 | | | | 56 | | | | 39 | | | | 34 | | | | 33 | | | | 24 | |
Ports | | | 49 | | | | 49 | | | | 38 | | | | 37 | | | | 44 | | | | 48 | | | | 50 | |
Water | | | 31 | | | | 9 | | | | 16 | | | | 11 | | | | 7 | | | | 1 | | | | 2 | |
Other | | | 3 | | | | 9 | | | | 10 | | | | 7 | | | | 7 | | | | 7 | | | | 7 | |
Total PNFC sector current tax equivalent payments | | | 797 | | | | 687 | | | | 812 | | | | 572 | | | | 513 | | | | 595 | | | | 515 | |
Note:
| 1. | Numbers may not add due to rounding and bracketed numbers represent negative amounts. |
Competitive neutrality fees
In accordance with the National Competition Policy principles, GOCs are expected to operate on the basis that they do not experience significant advantages or disadvantages by virtue of their Government ownership. One of the most significant advantages available to GOCs is the ability to borrow funds at a lower rate than private sector competitors on the basis of the State Government’s credit strength. In order to account for this advantage, the Competition Principles Agreement requires a notional charge to be applied to a GOC’s cost of debt. A competitive neutrality fee (CNF) is thus applied to all borrowings and financial arrangements in the nature of debt obligations. In general, changes in CNF payments reflect movements in borrowing amounts, interest rate spreads and the entity’s stand-alone credit rating.
Total forecast PNFC sector CNF payments for 2016-17 are estimated to be $112 million, $44 million lower than the $156 million forecast in the 2016-17 Budget (see Table 8.7). This reduction has been driven by the electricity network businesses as part of their debt restructuring arrangements.
156
Budget Strategy and Outlook 2017-18
| Table 8.7 | Competitive neutrality fee payments1 |
| | | | | | | | | | | | | | | | | | | | | | | | | | | | |
| | | 2015-16 | | | 2016-17 | | | 2016-17 | | | 2017-18 | | | 2018-19 | | | 2019-20 | | | 2020-21 | |
| | | Actual | | | Budget | | | Est. Act. | | | Budget | | | Projection | | | Projection | | | Projection | |
| | | $ million | | | $ million | | | $ million | | | $ million | | | $ million | | | $ million | | | $ million | |
Electricity Networks | | | 134 | | | | 94 | | | | 48 | | | | 59 | | | | 74 | | | | 93 | | | | 112 | |
Electricity Generation | | | 23 | | | | 21 | | | | 21 | | | | 22 | | | | 20 | | | | 19 | | | | 20 | |
Rail | | | 33 | | | | 30 | | | | 31 | | | | 32 | | | | 33 | | | | 33 | | | | 35 | |
Ports | | | 7 | | | | 7 | | | | 9 | | | | 11 | | | | 11 | | | | 11 | | | | 11 | |
Water | | | 4 | | | | 5 | | | | 2 | | | | 5 | | | | 5 | | | | 4 | | | | 5 | |
Total PNFC sector competitive neutrality fees | | | 201 | | | | 156 | | | | 112 | | | | 128 | | | | 142 | | | | 160 | | | | 183 | |
Note:
| 1. | Numbers may not add due to rounding and bracketed numbers represent negative amounts. |
| 8.2.4 | Community service obligation and Rail Transport Services Contract payments |
The Government sometimes directs or requires its businesses to perform activities that are not in the entity’s commercial interest (for example, offering services at a reduced price). In these situations, Government will often provide a Community Service Obligation (CSO) payment to the entity for the cost of delivering the service.
Transport Services Contract (TSC) payments are made to Queensland Rail to provide rail passenger services at non-commercial (subsidised) prices for the commuter and tourism markets. Before the 2015-16 Budget, these payments were reported as CSOs.
Total forecast PNFC sector CSO and TSC payments for 2016-17 are estimated to be $2.212 billion, slightly down from $2.250 billion forecast at the time of the 2016-17 Budget (see Table 8.8).
In 2017-18, it is estimated that the Government will provide CSO and TSC payments to PNFC Sector entities of $2.209 billion. This is forecast to increase to $2.475 billion in 2020-21. The increase is attributable to the TSC and is due to a mix of factors such as growth in patronage, escalation of service delivery costs and forecast growth in services. The current TSC expires on 30 June 2018. The TSC projections from 2018-19 have been left unchanged from the 2016-17 Budget, with escalation applied in 2020-21. Further consideration will be given to the TSC structure and valuation following receipt of the CityTrain Response Unit’s findings and recommendations which are expected in 2018.
In line with the Queensland Government’s uniform electricity tariff policy, a CSO payment is provided to Ergon Energy to compensate the retail subsidiary for the increased costs of operating in regional Queensland. This subsidy is provided to ensure that Queenslanders, regardless of their geographic location, pay a similar price for their electricity. The estimated actual electricity CSO for 2016-17 is $610 million, higher than the $558 million forecast at the time of the 2016-17 Budget. This increase is largely due to increased retail sales as a result of the hotter and dryer conditions over the summer period.
157
Budget Strategy and Outlook 2017-18
| Table 8.8 | Community service obligation payments and Transport Services Contracts1 |
| | | | | | | | | | | | | | | | | | | | | | | | | | | | |
| | | 2015-16 | | | 2016-17 | | | 2016-17 | | | 2017-18 | | | 2018-19 | | | 2019-20 | | | 2020-21 | |
| | | Actual | | | Budget | | | Est. Act. | | | Budget | | | Projection | | | Projection | | | Projection | |
| | | $ million | | | $ million | | | $ million | | | $ million | | | $ million | | | $ million | | | $ million | |
Electricity Networks | | | 541 | | | | 558 | | | | 610 | | | | 488 | | | | 462 | | | | 498 | | | | 493 | |
Rail | | | 1,570 | | | | 1,680 | | | | 1,590 | | | | 1,710 | | | | 1,719 | | | | 1,933 | | | | 1,981 | |
Water | | | 13 | | | | 12 | | | | 12 | | | | 11 | | | | 11 | | | | — | | | | — | |
Total PNFC sector CSO and TSC | | | 2,124 | | | | 2,250 | | | | 2,212 | | | | 2,209 | | | | 2,191 | | | | 2,432 | | | | 2,475 | |
Note:
| 1. | Numbers may not add due to rounding. |
Net flows, as shown in Table 8.9, represent the net value of flows to and from the PNFC Sector (the positive effect of dividends and TEPs less the negative effect of CSO and TSC payments).
| Table 8.9 | Net flows to the General Government Sector from PNFC Sector entities |
| | | | | | | | | | | | | | | | | | | | | | | | | | | | |
| | | 2015-16 | | | 2016-17 | | | 2016-17 | | | 2017-18 | | | 2018-19 | | | 2019-20 | | | 2020-21 | |
| | | Actual | | | Budget | | | Est. Act. | | | Budget | | | Projection | | | Projection | | | Projection | |
| | | $ million | | | $ million | | | $ million | | | $ million | | | $ million | | | $ million | | | $ million | |
Net Flows | | | 369 | | | | (28 | ) | | | 241 | | | | (242 | ) | | | (479 | ) | | | (451 | ) | | | (756 | ) |
Note:
| 1. | Numbers may not add due to rounding. Bracketed numbers represent a net flow from the General Government Sector to the PNFC Sector. |
The levels and weightings of GOC debt and equity are managed by the Government to maintain an optimal and efficient capital structure. Corporations may have different target capital structures for different business entities or to support expected capital programs and projects.
Total forecast PNFC equity movements for 2016-17 are estimated to be a reduction of equity of $87 million. In 2016-17, Powerlink have returned a special dividend of $160 million, with further material equity returns from the network businesses forecast from 2018-19 in order to maintain the Government’s target gearing ratio. The equity return is forecast to increase over the forward estimates in line with the current forecast for inflation.
In November 2016, North Queensland Bulk Ports Limited returned $110 million of equity to Government as a special dividend under the Debt Action Plan, while the Port of Townsville Limited is receiving an equity injection of around $62 million for the Townsville channel capacity upgrade. The Government will contribute $60 million over two years from 2018-19 to widen and deepen the Trinity Inlet Channel and swing basin at the Port of Cairns. The project will allow cruise ships up to 300 metres in length access to the Port, and also facilitate future Navy expansion plans. The project has an estimated cost of $120 million and will be subject to an Environmental Impact Statement and business case approval.
158
Budget Strategy and Outlook 2017-18
In 2016-17, Sunwater will receive a $100 million equity injection to undertake essential dam safety upgrades at Burdekin Falls Dam, and to develop a detailed business case for improvement works to the saddle dam and monoliths, to ensure the dam continues to meet current best practice safety standards.
Equity increases for Queensland Rail over 2017-18 to 2019-20 relate to funding provided for the North Coast Line capacity improvement project.
| Table 8.10 | Equity movements1 |
| | | | | | | | | | | | | | | | | | | | | | | | | | | | |
| | | 2015-16 | | | 2016-17 | | | 2016-17 | | | 2017-18 | | | 2018-19 | | | 2019-20 | | | 2020-21 | |
| | | Actual | | | Budget | | | Est. Act. | | | Budget | | | Projection | | | Projection | | | Projection | |
| | | $ million | | | $ million | | | $ million | | | $ million | | | $ million | | | $ million | | | $ million | |
Electricity Networks | | | (197 | ) | | | (160 | ) | | | (160 | ) | | | (20 | ) | | | (291 | ) | | | (429 | ) | | | (520 | ) |
Electricity Generation | | | (150 | ) | | | — | | | | — | | | | — | | | | — | | | | — | | | | — | |
Rail | | | — | | | | 84 | | | | — | | | | 18 | | | | 45 | | | | 37 | | | | — | |
Ports | | | (335 | ) | | | (110 | ) | | | (48 | ) | | | — | | | | 30 | | | | 30 | | | | — | |
Water | | | (260 | ) | | | (130 | ) | | | 100 | | | | — | | | | — | | | | — | | | | — | |
Other | | | 38 | | | | 12 | | | | 21 | | | | — | | | | — | | | | — | | | | — | |
Total PNFC sector equity movements | | | (904 | ) | | | (305 | ) | | | (87 | ) | | | (1 | ) | | | (216 | ) | | | (362 | ) | | | (520 | ) |
Note:
| 1. | Bracketed numbers represent equity returns from the PNFC Sector to the General Government Sector. |
159
Budget Strategy and Outlook 2017-18
| 9 | Uniform Presentation Framework |
This chapter contains detailed financial statements for the Queensland Public Sector prepared under the Uniform Presentation Framework (UPF) of reporting as required under the Australian Loan Council arrangements.
The UPF was reviewed following the release in October 2007 of the Australian Accounting Standards Board’s (AASB) accounting standard, AASB 1049 Whole of Government and General Government Sector Financial Reporting. The standard aims to harmonise Government Finance Statistics (GFS) and Generally Accepted Accounting Principles (GAAP) with the objective of improving the clarity and transparency of government financial statements.
In addition, the chapter provides:
| • | | a reconciliation of the General Government Sector net operating balance to the accounting operating result |
| • | | a time series for the General Government Sector using the revised UPF |
| • | | details of General Government Sector grant revenue and expenses |
| • | | details of General Government Sector dividend and income tax equivalent income |
| • | | data on General Government Sector expenses and purchases of non-financial assets by function |
| • | | details of taxation revenue collected by the General Government Sector |
| • | | the State’s revised Loan Council Budget allocation |
| • | | details of contingent liabilities |
| • | | background information on the revised UPF and disclosure differences arising from it, including the conceptual basis, sector definitions and a list of reporting entities. |
| 9.2 | Uniform Presentation Framework financial information |
The tables on the following pages present operating statements, balance sheets and cash flow statements prepared on a harmonised basis for the General Government, Public Non-financial Corporations (PNFC) and Non-financial Public Sectors.
Under the UPF requirements, budgeted financial information for the Public Financial Corporations Sector is not included.
160
Budget Strategy and Outlook 2017-18
| Table 9.1 | General Government Sector Operating Statement1 |
| | | | | | | | | | | | | | | | | | | | | | | | | | | | | | | | |
| | | | | | | 2015-16
Outcome
$ million | | | 2016-17
Budget
$ million | | | 2016-17
Est. Actual
$ million | | | 2017-18
Budget
$ million | | | 2018-19
Projection
$ million | | | 2019-20
Projection
$ million | | | 2020-21
Projection
$ million | |
| | | | | | | | |
| | Revenue from Transactions | | | | | | | | | | | | | | | | | | | | | | | | | | | | |
| | Taxation revenue | | | 12,547 | | | | 13,150 | | | | 12,945 | | | | 13,298 | | | | 14,031 | | | | 14,843 | | | | 15,707 | |
| | Grants revenue | | | 23,740 | | | | 27,116 | | | | 27,708 | | | | 27,631 | | | | 27,824 | | | | 28,682 | | | | 29,007 | |
| | Sales of goods and services | | | 5,926 | | | | 5,423 | | | | 5,830 | | | | 6,067 | | | | 6,101 | | | | 6,268 | | | | 6,366 | |
| | Interest income | | | 2,543 | | | | 2,296 | | | | 2,300 | | | | 2,330 | | | | 2,225 | | | | 1,949 | | | | 1,881 | |
| | Dividend and income tax equivalent income | | | 2,661 | | | | 2,307 | | | | 2,538 | | | | 2,057 | | | | 1,881 | | | | 2,003 | | | | 1,769 | |
| | Other revenue | | | 3,577 | | | | 3,156 | | | | 5,113 | | | | 4,487 | | | | 4,075 | | | | 4,142 | | | | 4,253 | |
| | Total Revenue from Transactions | | | 50,995 | | | | 53,449 | | | | 56,434 | | | | 55,869 | | | | 56,138 | | | | 57,887 | | | | 58,982 | |
| | | | | | | | |
Less | | Expenses from Transactions | | | | | | | | | | | | | | | | | | | | | | | | | | | | |
| | Employee expenses | | | 20,044 | | | | 20,930 | | | | 21,203 | | | | 22,420 | | | | 22,724 | | | | 23,696 | | | | 24,561 | |
| | Superannuation expenses | | | | | | | | | | | | | | | | | | | | | | | | | | | | |
| | Superannuation interest cost | | | 767 | | | | 810 | | | | 514 | | | | 600 | | | | 637 | | | | 664 | | | | 668 | |
| | Other superannuation expenses | | | 2,507 | | | | 2,628 | | | | 2,707 | | | | 2,753 | | | | 2,749 | | | | 2,752 | | | | 2,781 | |
| | Other operating expenses | | | 15,000 | | | | 16,220 | | | | 15,932 | | | | 17,037 | | | | 15,959 | | | | 16,076 | | | | 16,346 | |
| | Depreciation and amortisation | | | 2,927 | | | | 3,501 | | | | 3,009 | | | | 3,093 | | | | 3,194 | | | | 3,327 | | | | 3,457 | |
| | Other interest expenses | | | 2,220 | | | | 1,693 | | | | 1,702 | | | | 1,706 | | | | 1,690 | | | | 1,671 | | | | 1,755 | |
| | Grants expenses | | | 6,559 | | | | 6,799 | | | | 8,543 | | | | 8,114 | | | | 9,068 | | | | 8,996 | | | | 9,006 | |
| | Total Expenses from Transactions | | | 50,025 | | | | 52,582 | | | | 53,610 | | | | 55,723 | | | | 56,021 | | | | 57,183 | | | | 58,574 | |
| | | | | | | | |
Equals | | Net Operating Balance | | | 970 | | | | 867 | | | | 2,824 | | | | 146 | | | | 117 | | | | 704 | | | | 408 | |
| | | | | | | | |
Plus | | Other economic flows - included in operating result | | | 119 | | | | (629 | ) | | | 220 | | | | (75 | ) | | | 164 | | | | 219 | | | | 329 | |
| | | | | | | | |
Equals | | Operating Result | | | 1,088 | | | | 239 | | | | 3,044 | | | | 71 | | | | 281 | | | | 923 | | | | 737 | |
| | | | | | | | |
Plus | | Other economic flows - other movements in equity | | | 22,639 | | | | 2,404 | | | | 3,112 | | | | 3,785 | | | | 2,389 | | | | 1,779 | | | | 1,644 | |
| | | | | | | | |
Equals | | Comprehensive Result - Total Change In Net Worth | | | 23,728 | | | | 2,642 | | | | 6,156 | | | | 3,856 | | | | 2,670 | | | | 2,702 | | | | 2,380 | |
| | | | | | | | |
| | KEY FISCAL AGGREGATES | | | | | | | | | | | | | | | | | | | | | | | | | | | | |
| | | | | | | | |
| | Net Operating Balance | | | 970 | | | | 867 | | | | 2,824 | | | | 146 | | | | 117 | | | | 704 | | | | 408 | |
| | | | | | | | |
Less | | Net Acquisition of Non-financial Assets | | | | | | | | | | | | | | | | | | | | | | | | | | | | |
| | Purchases of non-financial assets | | | 4,092 | | | | 5,452 | | | | 4,416 | | | | 5,123 | | | | 6,471 | | | | 7,015 | | | | 6,462 | |
| | Less | | Sales of non-financial assets | | | 254 | | | | 341 | | | | 382 | | | | 392 | | | | 349 | | | | 383 | | | | 267 | |
| | Less | | Depreciation | | | 2,927 | | | | 3,501 | | | | 3,009 | | | | 3,093 | | | | 3,194 | | | | 3,327 | | | | 3,457 | |
| | Plus | | Change in inventories | | | (37 | ) | | | 33 | | | | 20 | | | | 73 | | | | (54 | ) | | | (81 | ) | | | (38 | ) |
| | Plus | | Other movements in non-financial assets | | | 556 | | | | 1,231 | | | | 911 | | | | 797 | | | | 1,189 | | | | 205 | | | | 205 | |
| | Equals | | Total Net Acquisition of Non-financial Assets | | | 1,431 | | | | 2,873 | | | | 1,956 | | | | 2,508 | | | | 4,063 | | | | 3,429 | | | | 2,904 | |
| | | | | | | | |
Equals | | Fiscal Balance | | | (461 | ) | | | (2,006 | ) | | | 868 | | | | (2,363 | ) | | | (3,946 | ) | | | (2,725 | ) | | | (2,496 | ) |
Note:
| 1. | Numbers may not add due to rounding and bracketed numbers represent negative amounts. |
161
Budget Strategy and Outlook 2017-18
| Table 9.2 | Public Non-financial Corporations Sector Operating Statement1 |
| | | | | | | | | | | | | | | | | | | | | | | | | | | | | | | | |
| | | | | | | 2015-16
Outcome
$ million | | | 2016-17
Budget
$ million | | | 2016-17
Est. Actual
$ million | | | 2017-18
Budget
$ million | | | 2018-19
Projection
$ million | | | 2019-20
Projection
$ million | | | 2020-21
Projection
$ million | |
| | | | | | | | |
| | Revenue from Transactions | | | | | | | | | | | | | | | | | | | | | | | | | | | | |
| | Grants revenue | | | 699 | | | | 716 | | | | 1,555 | | | | 647 | | | | 613 | | | | 639 | | | | 636 | |
| | Sales of goods and services | | | 10,777 | | | | 10,869 | | | | 11,957 | | | | 10,950 | | | | 11,172 | | | | 11,468 | | | | 11,615 | |
| | Interest income | | | 62 | | | | 40 | | | | 33 | | | | 37 | | | | 37 | | | | 43 | | | | 43 | |
| | Dividend and income tax equivalent income | | | 14 | | | | 14 | | | | 14 | | | | 14 | | | | 14 | | | | 14 | | | | 14 | |
| | Other revenue | | | 310 | | | | 137 | | | | 354 | | | | 300 | | | | 219 | | | | 219 | | | | 221 | |
| | Total Revenue from Transactions | | | 11,863 | | | | 11,776 | | | | 13,913 | | | | 11,948 | | | | 12,054 | | | | 12,383 | | | | 12,529 | |
| | | | | | | | |
Less | | Expenses from Transactions | | | | | | | | | | | | | | | | | | | | | | | | | | | | |
| | Employee expenses | | | 1,625 | | | | 1,720 | | | | 1,835 | | | | 1,925 | | | | 1,945 | | | | 1,988 | | | | 2,020 | |
| | Superannuation expenses | | | | | | | | | | | | | | | | | | | | | | | | | | | | |
| | Superannuation interest cost | | | (12 | ) | | | — | | | | — | | | | — | | | | — | | | | — | | | | — | |
| | Other superannuation expenses | | | 201 | | | | 218 | | | | 142 | | | | 155 | | | | 158 | | | | 160 | | | | 163 | |
| | Other operating expenses | | | 3,400 | | | | 3,271 | | | | 3,922 | | | | 3,388 | | | | 3,527 | | | | 3,621 | | | | 3,889 | |
| | Depreciation and amortisation | | | 2,346 | | | | 2,458 | | | | 2,406 | | | | 2,575 | | | | 2,666 | | | | 2,744 | | | | 2,789 | |
| | Other interest expenses | | | 1,885 | | | | 2,038 | | | | 2,022 | | | | 1,952 | | | | 1,949 | | | | 1,940 | | | | 1,983 | |
| | Grants expenses | | | 15 | | | | 15 | | | | 791 | | | | 21 | | | | 21 | | | | 21 | | | | 22 | |
| | Other property expenses | | | 802 | | | | 693 | | | | 818 | | | | 578 | | | | 520 | | | | 602 | | | | 521 | |
| | Total Expenses from Transactions | | | 10,263 | | | | 10,414 | | | | 11,936 | | | | 10,594 | | | | 10,785 | | | | 11,076 | | | | 11,387 | |
| | | | | | | | |
Equals | | Net Operating Balance | | | 1,600 | | | | 1,362 | | | | 1,977 | | | | 1,354 | | | | 1,269 | | | | 1,307 | | | | 1,141 | |
| | | | | | | | |
Plus | | Other economic flows - included in operating result | | | (277 | ) | | | (12 | ) | | | (114 | ) | | | 57 | | | | (15 | ) | | | (119 | ) | | | (130 | ) |
| | | | | | | | |
Equals | | Operating Result | | | 1,323 | | | | 1,350 | | | | 1,863 | | | | 1,412 | | | | 1,254 | | | | 1,188 | | | | 1,012 | |
| | | | | | | | |
Plus | | Other economic flows - other movements in equity | | | (3,339 | ) | | | (1,354 | ) | | | (1,971 | ) | | | 60 | | | | (905 | ) | | | (1,156 | ) | | | (1,089 | ) |
| | | | | | | | |
Equals | | Comprehensive Result - Total Change In Net Worth | | | (2,016 | ) | | | (4 | ) | | | (108 | ) | | | 1,472 | | | | 349 | | | | 32 | | | | (78 | ) |
| | | | | | | | |
| | KEY FISCAL AGGREGATES | | | | | | | | | | | | | | | | | | | | | | | | | | | | |
| | | | | | | | |
| | Net Operating Balance | | | 1,600 | | | | 1,362 | | | | 1,977 | | | | 1,354 | | | | 1,269 | | | | 1,307 | | | | 1,141 | |
| | | | | | | | |
Less | | Net Acquisition of Non-financial Assets | | | | | | | | | | | | | | | | | | | | | | | | | | | | |
| | Purchases of non-financial assets | | | 2,773 | | | | 2,812 | | | | 2,512 | | | | 2,866 | | | | 3,057 | | | | 2,994 | | | | 2,991 | |
| | Less | | Sales of non-financial assets | | | 45 | | | | 17 | | | | 30 | | | | 46 | | | | 48 | | | | 47 | | | | 37 | |
| | Less | | Depreciation | | | 2,346 | | | | 2,458 | | | | 2,406 | | | | 2,575 | | | | 2,666 | | | | 2,744 | | | | 2,789 | |
| | Plus | | Change in inventories | | | (35 | ) | | | (18 | ) | | | 30 | | | | 3 | | | | 7 | | | | 8 | | | | 5 | |
| | Plus | | Other movements in non-financial assets | | | 75 | | | | 16 | | | | 65 | | | | 68 | | | | 68 | | | | 69 | | | | 70 | |
| | Equals | | Total Net Acquisition of Non-financial Assets | | | 422 | | | | 335 | | | | 170 | | | | 316 | | | | 420 | | | | 280 | | | | 241 | |
| | | | | | | | |
Equals | | Fiscal Balance | | | 1,178 | | | | 1,027 | | | | 1,807 | | | | 1,038 | | | | 849 | | | | 1,027 | | | | 900 | |
Note:
| 1. | Numbers may not add due to rounding and bracketed numbers represent negative amounts. |
162
Budget Strategy and Outlook 2017-18
| Table 9.3 | Non-financial Public Sector Operating Statement1 |
| | | | | | | | | | | | | | | | | | | | | | | | | | | | | | | | | | |
| | | | | | | | | 2015-16
Outcome
$ million | | | 2016-17
Budget
$ million | | | 2016-17
Est. Actual
$ million | | | 2017-18
Budget
$ million | | | 2018-19
Projection
$ million | | | 2019-20
Projection
$ million | | | 2020-21
Projection
$ million | |
| | | | | | | | |
| | Revenue from Transactions | | | | | | | | | | | | | | | | | | | | | | | | | | | | |
| | Taxation revenue | | | 12,231 | | | | 12,879 | | | | 12,732 | | | | 13,062 | | | | 13,778 | | | | 14,570 | | | | 15,408 | |
| | Grants revenue | | | 23,823 | | | | 27,197 | | | | 27,794 | | | | 27,722 | | | | 27,908 | | | | 28,765 | | | | 29,091 | |
| | Sales of goods and services | | | 14,882 | | | | 14,383 | | | | 15,947 | | | | 15,025 | | | | 15,196 | | | | 15,605 | | | | 15,788 | |
| | Interest income | | | 2,605 | | | | 2,336 | | | | 2,334 | | | | 2,367 | | | | 2,262 | | | | 1,992 | | | | 1,925 | |
| | Dividend and income tax equivalent income | | | 182 | | | | 99 | | | | 98 | | | | 103 | | | | 117 | | | | 142 | | | | 173 | |
| | Other revenue | | | 3,884 | | | | 3,294 | | | | 5,467 | | | | 4,786 | | | | 4,294 | | | | 4,361 | | | | 4,473 | |
| | Total Revenue from Transactions | | | 57,608 | | | | 60,188 | | | | 64,373 | | | | 63,066 | | | | 63,554 | | | | 65,435 | | | | 66,858 | |
| | | | | | | | |
Less | | Expenses from Transactions | | | | | | | | | | | | | | | | | | | | | | | | | | | | |
| | Employee expenses | | | 21,571 | | | | 22,546 | | | | 22,948 | | | | 24,249 | | | | 24,571 | | | | 25,585 | | | | 26,479 | |
| | Superannuation expenses | | | | | | | | | | | | | | | | | | | | | | | | | | | | |
| | Superannuation interest cost | | | 755 | | | | 810 | | | | 514 | | | | 600 | | | | 637 | | | | 664 | | | | 668 | |
| | Other superannuation expenses | | | 2,709 | | | | 2,847 | | | | 2,849 | | | | 2,908 | | | | 2,906 | | | | 2,912 | | | | 2,944 | |
| | Other operating expenses | | | 16,564 | | | | 17,577 | | | | 18,010 | | | | 18,428 | | | | 17,402 | | | | 17,559 | | | | 18,034 | |
| | Depreciation and amortisation | | | 5,274 | | | | 5,959 | | | | 5,414 | | | | 5,668 | | | | 5,860 | | | | 6,071 | | | | 6,246 | |
| | Other interest expenses | | | 3,904 | | | | 3,575 | | | | 3,612 | | | | 3,530 | | | | 3,496 | | | | 3,451 | | | | 3,556 | |
| | Grants expenses | | | 5,958 | | | | 6,179 | | | | 7,866 | | | | 7,579 | | | | 8,560 | | | | 8,461 | | | | 8,476 | |
| | Total Expenses from Transactions | | | 56,735 | | | | 59,494 | | | | 61,213 | | | | 62,961 | | | | 63,433 | | | | 64,704 | | | | 66,404 | |
| | | | | | | | |
Equals | | Net Operating Balance | | | 873 | | | | 694 | | | | 3,160 | | | | 105 | | | | 121 | | | | 732 | | | | 454 | |
| | | | | | | | |
Plus | | Other economic flows - included in operating result | | | (753 | ) | | | (801 | ) | | | (54 | ) | | | (37 | ) | | | (142 | ) | | | (329 | ) | | | (321 | ) |
| | | | | | | | |
Equals | | Operating Result | | | 120 | | | | (106 | ) | | | 3,106 | | | | 67 | | | | (21 | ) | | | 403 | | | | 133 | |
| | | | | | | | |
Plus | | Other economic flows - other movements in equity | | | 23,608 | | | | 2,749 | | | | 3,050 | | | | 3,789 | | | | 2,691 | | | | 2,299 | | | | 2,248 | |
| | | | | | | | |
Equals | | Comprehensive Result - Total Change In Net Worth | | | 23,728 | | | | 2,642 | | | | 6,156 | | | | 3,856 | | | | 2,670 | | | | 2,702 | | | | 2,380 | |
| | | | | | | | |
| | KEY FISCAL AGGREGATES | | | | | | | | | | | | | | | | | | | | | | | | | | | | |
| | | | | | | | |
| | Net Operating Balance | | | 873 | | | | 694 | | | | 3,160 | | | | 105 | | | | 121 | | | | 732 | | | | 454 | |
| | | | | | | | |
Less | | Net Acquisition of Non-financial Assets | | | | | | | | | | | | | | | | | | | | | | | | | | | | |
| | Purchases of non-financial assets | | | 6,900 | | | | 8,264 | | | | 6,899 | | | | 7,989 | | | | 9,529 | | | | 10,009 | | | | 9,453 | |
| | Less | | | | Sales of non-financial assets | | | 292 | | | | 358 | | | | 383 | | | | 438 | | | | 397 | | | | 430 | | | | 304 | |
| | Less | | | | Depreciation | | | 5,274 | | | | 5,959 | | | | 5,414 | | | | 5,668 | | | | 5,860 | | | | 6,071 | | | | 6,246 | |
| | Plus | | | | Change in inventories | | | (72 | ) | | | 15 | | | | 49 | | | | 77 | | | | (47 | ) | | | (73 | ) | | | (33 | ) |
| | Plus | | | | Other movements in non-financial assets | | | 631 | | | | 1,247 | | | | 975 | | | | 865 | | | | 1,258 | | | | 274 | | | | 275 | |
| | Equals | | | | Total Net Acquisition of Non-financial Assets | | | 1,893 | | | | 3,208 | | | | 2,126 | | | | 2,825 | | | | 4,482 | | | | 3,709 | | | | 3,145 | |
| | | | | | | | |
Equals | | Fiscal Balance | | | (1,020 | ) | | | (2,514 | ) | | | 1,034 | | | | (2,720 | ) | | | (4,362 | ) | | | (2,978 | ) | | | (2,691 | ) |
Note:
| 1. | Numbers may not add due to rounding and bracketed numbers represent negative amounts. |
163
Budget Strategy and Outlook 2017-18
| Table 9.4 | General Government Sector Balance Sheet1 |
| | | | | | | | | | | | | | | | | | | | | | | | | | | | |
| | | 2015-16
Outcome
$ million | | | 2016-17
Budget
$ million | | | 2016-17
Est. Actual
$ million | | | 2017-18
Budget
$ million | | | 2018-19
Projection
$ million | | | 2019-20
Projection
$ million | | | 2020-21
Projection
$ million | |
| | | | | | | |
Assets | | | | | | | | | | | | | | | | | | | | | | | | | | | | |
Financial Assets | | | | | | | | | | | | | | | | | | | | | | | | | | | | |
Cash and deposits | | | 1,104 | | | | 658 | | | | 710 | | | | 548 | | | | 617 | | | | 671 | | | | 694 | |
Advances paid | | | 632 | | | | 812 | | | | 711 | | | | 831 | | | | 872 | | | | 832 | | | | 846 | |
Investments, loans and placements | | | 33,612 | | | | 33,589 | | | | 33,550 | | | | 32,301 | | | | 30,418 | | | | 29,214 | | | | 29,260 | |
Receivables | | | 4,282 | | | | 3,907 | | | | 4,818 | | | | 4,190 | | | | 4,284 | | | | 4,579 | | | | 4,523 | |
Equity | | | | | | | | | | | | | | | | | | | | | | | | | | | | |
Investments in other public sector entities | | | 20,477 | | | | 21,320 | | | | 21,315 | | | | 22,787 | | | | 23,136 | | | | 23,169 | | | | 23,091 | |
Investments - other | | | 157 | | | | 176 | | | | 156 | | | | 156 | | | | 156 | | | | 156 | | | | 156 | |
Total Financial Assets | | | 60,265 | | | | 60,462 | | | | 61,260 | | | | 60,814 | | | | 59,483 | | | | 58,620 | | | | 58,570 | |
| | | | | | | |
Non-financial Assets | | | | | | | | | | | | | | | | | | | | | | | | | | | | |
Land and other fixed assets | | | 200,647 | | | | 178,628 | | | | 203,084 | | | | 205,439 | | | | 210,924 | | | | 215,158 | | | | 218,819 | |
Other non-financial assets | | | 6,377 | | | | 7,058 | | | | 6,561 | | | | 6,969 | | | | 6,575 | | | | 6,817 | | | | 6,964 | |
Total Non-financial Assets | | | 207,024 | | | | 185,686 | | | | 209,645 | | | | 212,407 | | | | 217,499 | | | | 221,975 | | | | 225,783 | |
| | | | | | | |
Total Assets | | | 267,289 | | | | 246,148 | | | | 270,906 | | | | 273,222 | | | | 276,981 | | | | 280,596 | | | | 284,352 | |
| | | | | | | |
Liabilities | | | | | | | | | | | | | | | | | | | | | | | | | | | | |
Payables | | | 3,596 | | | | 3,209 | | | | 4,008 | | | | 4,089 | | | | 4,227 | | | | 4,324 | | | | 4,369 | |
Superannuation liability | | | 27,360 | | | | 25,891 | | | | 24,998 | | | | 23,355 | | | | 21,736 | | | | 20,334 | | | | 18,909 | |
Other employee benefits | | | 5,217 | | | | 5,179 | | | | 5,359 | | | | 5,510 | | | | 5,665 | | | | 5,746 | | | | 5,943 | |
Deposits held | | | 3 | | | | — | | | | 3 | | | | 3 | | | | 3 | | | | 3 | | | | 3 | |
Advances received | | | 514 | | | | 809 | | | | 1,328 | | | | 1,541 | | | | 1,257 | | | | 913 | | | | 870 | |
Borrowing | | | 35,486 | | | | 37,775 | | | | 33,937 | | | | 33,758 | | | | 36,393 | | | | 38,760 | | | | 41,244 | |
Other liabilities | | | 3,204 | | | | 3,559 | | | | 3,207 | | | | 3,044 | | | | 3,107 | | | | 3,222 | | | | 3,340 | |
Total Liabilities | | | 75,380 | | | | 76,421 | | | | 72,840 | | | | 71,299 | | | | 72,389 | | | | 73,301 | | | | 74,678 | |
| | | | | | | |
Net Worth | | | 191,910 | | | | 169,726 | | | | 198,066 | | | | 201,922 | | | | 204,592 | | | | 207,294 | | | | 209,675 | |
| | | | | | | | | | | | | | | | | | | | | | | | | | | | |
Net Financial Worth | | | (15,114 | ) | | | (15,960 | ) | | | (11,579 | ) | | | (10,485 | ) | | | (12,907 | ) | | | (14,681 | ) | | | (16,108 | ) |
Net Financial Liabilities | | | 35,591 | | | | 37,279 | | | | 32,895 | | | | 33,273 | | | | 36,043 | | | | 37,849 | | | | 39,199 | |
Net Debt | | | 654 | | | | 3,525 | | | | 297 | | | | 1,622 | | | | 5,748 | | | | 8,960 | | | | 11,318 | |
Notes:
| 1. | Numbers may not add due to rounding and bracketed numbers represent negative amounts. |
164
Budget Strategy and Outlook 2017-18
| Table 9.5 | Public Non-financial Corporations Sector Balance Sheet1 |
| | | | | | | | | | | | | | | | | | | | | | | | | | | | |
| | | 2015-16
Outcome
$ million | | | 2016-17
Budget
$ million | | | 2016-17
Est. Actual
$ million | | | 2017-18
Budget
$ million | | | 2018-19
Projection
$ million | | | 2019-20
Projection
$ million | | | 2020-21
Projection
$ million | |
| | | | | | | |
Assets | | | | | | | | | | | | | | | | | | | | | | | | | | | | |
Financial Assets | | | | | | | | | | | | | | | | | | | | | | | | | | | | |
Cash and deposits | | | 1,542 | | | | 539 | | | | 1,489 | | | | 524 | | | | 446 | | | | 467 | | | | 502 | |
Advances paid | | | 33 | | | | 275 | | | | 849 | | | | 1,073 | | | | 809 | | | | 556 | | | | 556 | |
Investments, loans and placements | | | 530 | | | | 333 | | | | 885 | | | | 395 | | | | 383 | | | | 382 | | | | 380 | |
Receivables | | | 1,473 | | | | 1,634 | | | | 1,699 | | | | 1,610 | | | | 1,592 | | | | 1,576 | | | | 1,606 | |
Equity | | | | | | | | | | | | | | | | | | | | | | | | | | | | |
Investments - other | | | 267 | | | | 226 | | | | 280 | | | | 280 | | | | 280 | | | | 280 | | | | 280 | |
Total Financial Assets | | | 3,845 | | | | 3,008 | | | | 5,202 | | | | 3,882 | | | | 3,510 | | | | 3,260 | | | | 3,323 | |
| | | | | | | |
Non-financial Assets | | | | | | | | | | | | | | | | | | | | | | | | | | | | |
Land and other fixed assets | | | 60,166 | | | | 61,675 | | | | 61,133 | | | | 62,730 | | | | 63,751 | | | | 64,637 | | | | 65,453 | |
Other non-financial assets | | | 1,491 | | | | 1,342 | | | | 1,270 | | | | 1,112 | | | | 1,089 | | | | 1,092 | | | | 1,112 | |
Total Non-financial Assets | | | 61,657 | | | | 63,017 | | | | 62,403 | | | | 63,842 | | | | 64,840 | | | | 65,729 | | | | 66,565 | |
| | | | | | | |
Total Assets | | | 65,502 | | | | 66,026 | | | | 67,605 | | | | 67,724 | | | | 68,350 | | | | 68,989 | | | | 69,888 | |
| | | | | | | |
Liabilities | | | | | | | | | | | | | | | | | | | | | | | | | | | | |
Payables | | | 2,825 | | | | 2,407 | | | | 3,431 | | | | 2,809 | | | | 2,516 | | | | 2,566 | | | | 2,442 | |
Superannuation liability | | | (171 | ) | | | (242 | ) | | | (163 | ) | | | (155 | ) | | | (147 | ) | | | (139 | ) | | | (131 | ) |
Other employee benefits | | | 696 | | | | 681 | | | | 767 | | | | 767 | | | | 769 | | | | 775 | | | | 781 | |
Deposits held | | | 20 | | | | 24 | | | | 23 | | | | 23 | | | | 23 | | | | 23 | | | | 23 | |
Advances received | | | 8 | | | | 7 | | | | 7 | | | | 7 | | | | 6 | | | | 5 | | | | 4 | |
Borrowing | | | 37,436 | | | | 37,496 | | | | 39,165 | | | | 38,231 | | | | 38,584 | | | | 38,960 | | | | 39,904 | |
Other liabilities | | | 7,479 | | | | 7,482 | | | | 7,274 | | | | 7,470 | | | | 7,677 | | | | 7,846 | | | | 7,989 | |
Total Liabilities | | | 48,294 | | | | 47,854 | | | | 50,504 | | | | 49,151 | | | | 49,429 | | | | 50,035 | | | | 51,012 | |
| | | | | | | |
Net Worth | | | 17,208 | | | | 18,172 | | | | 17,101 | | | | 18,573 | | | | 18,921 | | | | 18,954 | | | | 18,876 | |
| | | | | | | | | | | | | | | | | | | | | | | | | | | | |
Net Financial Worth | | | (44,449 | ) | | | (44,845 | ) | | | (45,302 | ) | | | (45,269 | ) | | | (45,919 | ) | | | (46,775 | ) | | | (47,689 | ) |
Net Debt | | | 35,359 | | | | 36,378 | | | | 35,972 | | | | 36,268 | | | | 36,975 | | | | 37,583 | | | | 38,494 | |
Notes:
| 1. | Numbers may not add due to rounding and bracketed numbers represent negative amounts. |
165
Budget Strategy and Outlook 2017-18
| Table 9.6 | Non-financial Public Sector Balance Sheet1 |
| | | | | | | | | | | | | | | | | | | | | | | | | | | | |
| | | 2015-16
Outcome
$ million | | | 2016-17
Budget
$ million | | | 2016-17
Est. Actual
$ million | | | 2017-18
Budget
$ million | | | 2018-19
Projection
$ million | | | 2019-20
Projection
$ million | | | 2020-21
Projection
$ million | |
| | | | | | | |
Assets | | | | | | | | | | | | | | | | | | | | | | | | | | | | |
Financial Assets | | | | | | | | | | | | | | | | | | | | | | | | | | | | |
Cash and deposits | | | 2,646 | | | | 1,197 | | | | 2,199 | | | | 1,073 | | | | 1,063 | | | | 1,138 | | | | 1,196 | |
Advances paid | | | 657 | | | | 830 | | | | 728 | | | | 842 | | | | 876 | | | | 830 | | | | 845 | |
Investments, loans and placements | | | 34,142 | | | | 33,922 | | | | 34,436 | | | | 32,696 | | | | 30,801 | | | | 29,595 | | | | 29,640 | |
Receivables | | | 3,774 | | | | 3,780 | | | | 4,477 | | | | 4,005 | | | | 4,050 | | | | 4,119 | | | | 4,241 | |
Equity | | | | | | | | | | | | | | | | | | | | | | | | | | | | |
Investments in other public sector entities | | | 3,269 | | | | 3,148 | | | | 4,216 | | | | 4,216 | | | | 4,216 | | | | 4,216 | | | | 4,216 | |
Investments - other | | | 424 | | | | 402 | | | | 436 | | | | 436 | | | | 436 | | | | 436 | | | | 436 | |
Total Financial Assets | | | 44,913 | | | | 43,280 | | | | 46,491 | | | | 43,267 | | | | 41,441 | | | | 40,334 | | | | 40,573 | |
| | | | | | | |
Non-financial Assets | | | | | | | | | | | | | | | | | | | | | | | | | | | | |
Land and other fixed assets | | | 260,813 | | | | 240,303 | | | | 264,217 | | | | 268,168 | | | | 274,675 | | | | 279,794 | | | | 284,271 | |
Other non-financial assets | | | 1,063 | | | | 1,541 | | | | 1,239 | | | | 1,451 | | | | 863 | | | | 916 | | | | 888 | |
Total Non-financial Assets | | | 261,876 | | | | 241,844 | | | | 265,456 | | | | 269,619 | | | | 275,537 | | | | 280,711 | | | | 285,159 | |
| | | | | | | |
Total Assets | | | 306,789 | | | | 285,124 | | | | 311,947 | | | | 312,885 | | | | 316,978 | | | | 321,044 | | | | 325,732 | |
| | | | | | | |
Liabilities | | | | | | | | | | | | | | | | | | | | | | | | | | | | |
Payables | | | 4,484 | | | | 3,909 | | | | 5,450 | | | | 5,155 | | | | 4,971 | | | | 4,909 | | | | 4,979 | |
Superannuation liability | | | 27,189 | | | | 25,649 | | | | 24,835 | | | | 23,200 | | | | 21,589 | | | | 20,195 | | | | 18,778 | |
Other employee benefits | | | 5,913 | | | | 5,860 | | | | 6,126 | | | | 6,277 | | | | 6,435 | | | | 6,521 | | | | 6,724 | |
Deposits held | | | 23 | | | | 24 | | | | 26 | | | | 26 | | | | 26 | | | | 26 | | | | 26 | |
Advances received | | | 514 | | | | 559 | | | | 504 | | | | 485 | | | | 459 | | | | 360 | | | | 317 | |
Borrowing | | | 72,922 | | | | 75,270 | | | | 73,102 | | | | 71,989 | | | | 74,978 | | | | 77,720 | | | | 81,148 | |
Other liabilities | | | 3,835 | | | | 4,127 | | | | 3,838 | | | | 3,831 | | | | 3,929 | | | | 4,020 | | | | 4,085 | |
Total Liabilities | | | 114,879 | | | | 115,397 | | | | 113,881 | | | | 110,963 | | | | 112,386 | | | | 113,750 | | | | 116,057 | |
| | | | | | | |
Net Worth | | | 191,910 | | | | 169,726 | | | | 198,066 | | | | 201,922 | | | | 204,592 | | | | 207,294 | | | | 209,675 | |
| | | | | | | | | | | | | | | | | | | | | | | | | | | | |
Net Financial Worth | | | (69,966 | ) | | | (72,118 | ) | | | (67,390 | ) | | | (67,697 | ) | | | (70,945 | ) | | | (73,416 | ) | | | (75,484 | ) |
Net Financial Liabilities | | | 73,235 | | | | 75,266 | | | | 71,605 | | | | 71,912 | | | | 75,160 | | | | 77,632 | | | | 79,699 | |
Net Debt | | | 36,013 | | | | 39,903 | | | | 36,269 | | | | 37,890 | | | | 42,722 | | | | 46,543 | | | | 49,811 | |
Notes:
| 1. | Numbers may not add due to rounding and bracketed numbers represent negative amounts. |
166
Budget Strategy and Outlook 2017-18
| Table 9.7 | General Government Sector Cash Flow Statement1 |
| | | | | | | | | | | | | | | | | | | | | | | | | | | | |
| | | 2015-16
Outcome
$ million | | | 2016-17
Budget
$ million | | | 2016-17
Est. Actual
$ million | | | 2017-18
Budget
$ million | | | 2018-19
Projection
$ million | | | 2019-20
Projection
$ million | | | 2020-21
Projection
$ million | |
| | | | | | | |
Cash Receipts from Operating Activities | | | | | | | | | | | | | | | | | | | | | | | | | | | | |
Taxes received | | | 12,588 | | | | 13,140 | | | | 12,935 | | | | 13,296 | | | | 14,029 | | | | 14,842 | | | | 15,705 | |
Grants and subsidies received | | | 23,891 | | | | 27,054 | | | | 27,798 | | | | 27,695 | | | | 27,894 | | | | 28,751 | | | | 29,078 | |
Sales of goods and services | | | 6,083 | | | | 5,721 | | | | 6,037 | | | | 6,087 | | | | 6,250 | | | | 6,412 | | | | 6,505 | |
Interest receipts | | | 2,536 | | | | 2,296 | | | | 2,299 | | | | 2,328 | | | | 2,223 | | | | 1,947 | | | | 1,879 | |
Dividends and income tax equivalents | | | 3,754 | | | | 1,652 | | | | 1,766 | | | | 2,309 | | | | 2,023 | | | | 1,901 | | | | 2,029 | |
Other receipts | | | 4,385 | | | | 4,279 | | | | 6,204 | | | | 5,606 | | | | 5,166 | | | | 5,266 | | | | 5,357 | |
Total Operating Receipts | | | 53,237 | | | | 54,142 | | | | 57,040 | | | | 57,320 | | | | 57,586 | | | | 59,119 | | | | 60,553 | |
| | | | | | | |
Cash Payments for Operating Activities | | | | | | | | | | | | | | | | | | | | | | | | | | | | |
Payments for employees | | | (22,830 | ) | | | (24,366 | ) | | | (24,489 | ) | | | (26,099 | ) | | | (26,527 | ) | | | (27,766 | ) | | | (28,553 | ) |
Payments for goods and services | | | (16,459 | ) | | | (17,443 | ) | | | (17,050 | ) | | | (18,359 | ) | | | (17,122 | ) | | | (17,243 | ) | | | (17,520 | ) |
Grants and subsidies | | | (6,750 | ) | | | (6,731 | ) | | | (8,451 | ) | | | (8,036 | ) | | | (8,957 | ) | | | (8,946 | ) | | | (8,947 | ) |
Interest paid | | | (2,223 | ) | | | (1,693 | ) | | | (1,702 | ) | | | (1,706 | ) | | | (1,690 | ) | | | (1,671 | ) | | | (1,755 | ) |
Other payments | | | (271 | ) | | | (349 | ) | | | (276 | ) | | | (311 | ) | | | (333 | ) | | | (354 | ) | | | (369 | ) |
Total Operating Payments | | | (48,533 | ) | | | (50,581 | ) | | | (51,968 | ) | | | (54,511 | ) | | | (54,629 | ) | | | (55,979 | ) | | | (57,143 | ) |
| | | | | | | |
Net Cash Inflows from Operating Activities | | | 4,704 | | | | 3,561 | | | | 5,072 | | | | 2,809 | | | | 2,957 | | | | 3,141 | | | | 3,410 | |
| | | | | | | |
Cash Flows from Investments in Non-Financial Assets | | | | | | | | | | | | | | | | | | | | | | | | | | | | |
Purchases of non-financial assets | | | (4,092 | ) | | | (5,452 | ) | | | (4,416 | ) | | | (5,123 | ) | | | (6,471 | ) | | | (7,015 | ) | | | (6,462 | ) |
Sales of non-financial assets | | | 254 | | | | 341 | | | | 382 | | | | 392 | | | | 349 | | | | 383 | | | | 267 | |
Net Cash Flows from Investments in Non-financial Assets | | | (3,838 | ) | | | (5,111 | ) | | | (4,034 | ) | | | (4,731 | ) | | | (6,122 | ) | | | (6,632 | ) | | | (6,195 | ) |
| | | | | | | |
Net Cash Flows from Investments in Financial Assets for Policy Purposes | | | 3,348 | | | | 911 | | | | 763 | | | | 502 | | | | 105 | | | | 300 | | | | 414 | |
| | | | | | | |
Net Cash Flows from Investments in Financial Assets for Liquidity Purposes | | | 2,540 | | | | (214 | ) | | | (1,833 | ) | | | 1,268 | | | | 1,905 | | | | 1,227 | | | | (24 | ) |
| | | | | | | |
Receipts from Financing Activities | | | | | | | | | | | | | | | | | | | | | | | | | | | | |
Advances received (net) | | | (111 | ) | | | 197 | | | | 752 | | | | 168 | | | | (361 | ) | | | (333 | ) | | | (84 | ) |
Borrowing (net) | | | (6,738 | ) | | | 665 | | | | (1,114 | ) | | | (176 | ) | | | 1,584 | | | | 2,352 | | | | 2,502 | |
Deposits received (net) | | | 1 | | | | — | | | | — | | | | — | | | | — | | | | — | | | | — | |
Net Cash Flows from Financing Activities | | | (6,848 | ) | | | 862 | | | | (362 | ) | | | (9 | ) | | | 1,223 | | | | 2,019 | | | | 2,419 | |
| | | | | | | |
Net Increase/(Decrease) in Cash held | | | (94 | ) | | | 10 | | | | (394 | ) | | | (161 | ) | | | 68 | | | | 54 | | | | 23 | |
| | | | | | | |
Net cash from operating activities | | | 4,704 | | | | 3,561 | | | | 5,072 | | | | 2,809 | | | | 2,957 | | | | 3,141 | | | | 3,410 | |
Net cash flows from investments in non-financial assets | | | (3,838 | ) | | | (5,111 | ) | | | (4,034 | ) | | | (4,731 | ) | | | (6,122 | ) | | | (6,632 | ) | | | (6,195 | ) |
Surplus/(Deficit) | | | 866 | | | | (1,550 | ) | | | 1,038 | | | | (1,922 | ) | | | (3,165 | ) | | | (3,491 | ) | | | (2,785 | ) |
| | | | | | | |
Derivation of ABS GFS Cash Surplus/Deficit | | | | | | | | | | | | | | | | | | | | | | | | | | | | |
Cash surplus/(deficit) | | | 866 | | | | (1,550 | ) | | | 1,038 | | | | (1,922 | ) | | | (3,165 | ) | | | (3,491 | ) | | | (2,785 | ) |
Acquisitions under finance leases and similar arrangements | | | (341 | ) | | | (1,032 | ) | | | (715 | ) | | | (618 | ) | | | (1,045 | ) | | | — | | | | — | |
ABS GFS Cash Surplus/(Deficit) Including Finance Leases and Similar Arrangements | | | 525 | | | | (2,582 | ) | | | 322 | | | | (2,540 | ) | | | (4,210 | ) | | | (3,491 | ) | | | (2,785 | ) |
Note:
| 1. | Numbers may not add due to rounding and bracketed numbers represent negative amounts. |
167
Budget Strategy and Outlook 2017-18
| Table 9.8 | Public Non-financial Corporations Sector Cash Flow Statement1 |
| | | | | | | | | | | | | | | | | | | | | | | | | | | | |
| | | 2015-16
Outcome
$ million | | | 2016-17
Budget
$ million | | | 2016-17
Est. Actual
$ million | | | 2017-18
Budget
$ million | | | 2018-19
Projection
$ million | | | 2019-20
Projection
$ million | | | 2020-21
Projection
$ million | |
| | | | | | | |
Cash Receipts from Operating Activities | | | | | | | | | | | | | | | | | | | | | | | | | | | | |
Grants and subsidies received | | | 689 | | | | 693 | | | | 1,523 | | | | 623 | | | | 565 | | | | 604 | | | | 601 | |
Sales of goods and services | | | 11,917 | | | | 11,861 | | | | 12,973 | | | | 12,268 | | | | 12,387 | | | | 12,663 | | | | 12,772 | |
Interest receipts | | | 62 | | | | 40 | | | | 33 | | | | 37 | | | | 37 | | | | 43 | | | | 43 | |
Dividends and income tax equivalents | | | 14 | | | | 14 | | | | 14 | | | | 14 | | | | 14 | | | | 14 | | | | 14 | |
Other receipts | | | 214 | | | | 96 | | | | 308 | | | | 257 | | | | 177 | | | | 143 | | | | 183 | |
Total Operating Receipts | | | 12,896 | | | | 12,704 | | | | 14,852 | | | | 13,198 | | | | 13,180 | | | | 13,467 | | | | 13,613 | |
| | | | | | | |
Cash Payments for Operating Activities | | | | | | | | | | | | | | | | | | | | | | | | | | | | |
Payments for employees | | | (1,776 | ) | | | (1,919 | ) | | | (1,979 | ) | | | (2,072 | ) | | | (2,093 | ) | | | (2,135 | ) | | | (2,169 | ) |
Payments for goods and services | | | (3,778 | ) | | | (3,904 | ) | | | (4,771 | ) | | | (4,146 | ) | | | (4,238 | ) | | | (4,212 | ) | | | (4,599 | ) |
Grants and subsidies | | | (14 | ) | | | (14 | ) | | | (18 | ) | | | (287 | ) | | | (277 | ) | | | (266 | ) | | | (20 | ) |
Interest paid | | | (1,832 | ) | | | (2,059 | ) | | | (2,028 | ) | | | (1,960 | ) | | | (1,951 | ) | | | (1,945 | ) | | | (1,981 | ) |
Other payments | | | (1,558 | ) | | | (1,461 | ) | | | (1,525 | ) | | | (1,118 | ) | | | (1,061 | ) | | | (1,013 | ) | | | (1,107 | ) |
Total Operating Payments | | | (8,957 | ) | | | (9,356 | ) | | | (10,322 | ) | | | (9,584 | ) | | | (9,620 | ) | | | (9,571 | ) | | | (9,877 | ) |
| | | | | | | |
Net Cash Inflows from Operating Activities | | | 3,939 | | | | 3,347 | | | | 4,530 | | | | 3,614 | | | | 3,561 | | | | 3,896 | | | | 3,736 | |
| | | | | | | |
Cash Flows from Investments in Non-Financial Assets | | | | | | | | | | | | | | | | | | | | | | | | | | | | |
Purchases of non-financial assets | | | (2,773 | ) | | | (2,812 | ) | | | (2,512 | ) | | | (2,866 | ) | | | (3,057 | ) | | | (2,994 | ) | | | (2,991 | ) |
Sales of non-financial assets | | | 45 | | | | 17 | | | | 30 | | | | 46 | | | | 48 | | | | 47 | | | | 37 | |
Net Cash Flows from Investments in Non-financial Assets | | | (2,729 | ) | | | (2,795 | ) | | | (2,482 | ) | | | (2,820 | ) | | | (3,010 | ) | | | (2,947 | ) | | | (2,954 | ) |
| | | | | | | |
Net Cash Flows from Investments in Financial Assets for Policy Purposes | | | (3,331 | ) | | | (755 | ) | | | (755 | ) | | | (20 | ) | | | (150 | ) | | | (336 | ) | | | (414 | ) |
| | | | | | | |
Net Cash Flows from Investments in Financial Assets for Liquidity Purposes | | | 20 | | | | (2 | ) | | | 7 | | | | — | | | | — | | | | — | | | | — | |
| | | | | | | |
Receipts from Financing Activities | | | | | | | | | | | | | | | | | | | | | | | | | | | | |
Advances received (net) | | | (1 | ) | | | (251 | ) | | | (824 | ) | | | (233 | ) | | | 256 | | | | 245 | | | | (1 | ) |
Borrowing (net) | | | 4,461 | | | | 540 | | | | 294 | | | | 122 | | | | 603 | | | | 388 | | | | 946 | |
Dividends paid | | | (2,669 | ) | | | (670 | ) | | | (747 | ) | | | (1,646 | ) | | | (1,383 | ) | | | (1,263 | ) | | | (1,278 | ) |
Deposits received (net) | | | (7 | ) | | | 3 | | | | 3 | | | | — | | | | — | | | | — | | | | — | |
Other financing (net) | | | (143 | ) | | | (156 | ) | | | (78 | ) | | | 18 | | | | 45 | | | | 37 | | | | — | |
Net Cash Flows from Financing Activities | | | 1,642 | | | | (535 | ) | | | (1,353 | ) | | | (1,738 | ) | | | (479 | ) | | | (593 | ) | | | (333 | ) |
| | | | | | | |
Net Increase/(Decrease) in Cash held | | | (458 | ) | | | (739 | ) | | | (53 | ) | | | (965 | ) | | | (78 | ) | | | 21 | | | | 35 | |
| | | | | | | |
Net cash from operating activities | | | 3,939 | | | | 3,347 | | | | 4,530 | | | | 3,614 | | | | 3,561 | | | | 3,896 | | | | 3,736 | |
Net cash flows from investments in non-financial assets | | | (2,729 | ) | | | (2,795 | ) | | | (2,482 | ) | | | (2,820 | ) | | | (3,010 | ) | | | (2,947 | ) | | | (2,954 | ) |
Dividends paid | | | (2,669 | ) | | | (670 | ) | | | (747 | ) | | | (1,646 | ) | | | (1,383 | ) | | | (1,263 | ) | | | (1,278 | ) |
Surplus/(Deficit) | | | (1,459 | ) | | | (118 | ) | | | 1,301 | | | | (853 | ) | | | (832 | ) | | | (313 | ) | | | (497 | ) |
| | | | | | | |
Derivation of ABS GFS Cash Surplus/Deficit | | | | | | | | | | | | | | | | | | | | | | | | | | | | |
Cash surplus/(deficit) | | | (1,459 | ) | | | (118 | ) | | | 1,301 | | | | (853 | ) | | | (832 | ) | | | (313 | ) | | | (497 | ) |
ABS GFS Cash Surplus/(Deficit) Including Finance Leases and Similar Arrangements | | | (1,459 | ) | | | (118 | ) | | | 1,301 | | | | (853 | ) | | | (832 | ) | | | (313 | ) | | | (497 | ) |
Note:
| 1. | Numbers may not add due to rounding and bracketed numbers represent negative amounts. |
168
Budget Strategy and Outlook 2017-18
| Table 9.9 | Non-financial Public Sector Cash Flow Statement1 |
| | | | | | | | | | | | | | | | | | | | | | | | | | | | |
| | | 2015-16
Outcome
$ million | | | 2016-17
Budget
$ million | | | 2016-17
Est. Actual
$ million | | | 2017-18
Budget
$ million | | | 2018-19
Projection
$ million | | | 2019-20
Projection
$ million | | | 2020-21
Projection
$ million | |
| | | | | | | |
Cash Receipts from Operating Activities | | | | | | | | | | | | | | | | | | | | | | | | | | | | |
Taxes received | | | 12,267 | | | | 12,878 | | | | 12,731 | | | | 13,061 | | | | 13,777 | | | | 14,569 | | | | 15,407 | |
Grants and subsidies received | | | 23,945 | | | | 27,123 | | | | 27,865 | | | | 27,775 | | | | 27,966 | | | | 28,823 | | | | 29,151 | |
Sales of goods and services | | | 16,211 | | | | 15,316 | | | | 16,806 | | | | 16,007 | | | | 16,204 | | | | 16,589 | | | | 16,727 | |
Interest receipts | | | 2,598 | | | | 2,336 | | | | 2,333 | | | | 2,365 | | | | 2,260 | | | | 1,990 | | | | 1,922 | |
Dividends and income tax equivalents | | | 199 | | | | 100 | | | | 129 | | | | 94 | | | | 109 | | | | 131 | | | | 153 | |
Other receipts | | | 4,596 | | | | 4,375 | | | | 6,512 | | | | 5,862 | | | | 5,343 | | | | 5,408 | | | | 5,540 | |
Total Operating Receipts | | | 59,816 | | | | 62,129 | | | | 66,376 | | | | 65,164 | | | | 65,659 | | | | 67,511 | | | | 68,900 | |
| | | | | | | |
Cash Payments for Operating Activities | | | | | | | | | | | | | | | | | | | | | | | | | | | | |
Payments for employees | | | (24,507 | ) | | | (26,181 | ) | | | (26,379 | ) | | | (28,075 | ) | | | (28,522 | ) | | | (29,801 | ) | | | (30,621 | ) |
Payments for goods and services | | | (18,389 | ) | | | (19,095 | ) | | | (19,630 | ) | | | (20,173 | ) | | | (18,940 | ) | | | (18,982 | ) | | | (19,584 | ) |
Grants and subsidies | | | (6,128 | ) | | | (6,120 | ) | | | (7,012 | ) | | | (7,781 | ) | | | (8,740 | ) | | | (8,679 | ) | | | (8,439 | ) |
Interest paid | | | (3,849 | ) | | | (3,604 | ) | | | (3,627 | ) | | | (3,539 | ) | | | (3,499 | ) | | | (3,455 | ) | | | (3,554 | ) |
Other payments | | | (928 | ) | | | (890 | ) | | | (873 | ) | | | (820 | ) | | | (823 | ) | | | (818 | ) | | | (836 | ) |
Total Operating Payments | | | (53,801 | ) | | | (55,891 | ) | | | (57,521 | ) | | | (60,387 | ) | | | (60,525 | ) | | | (61,736 | ) | | | (63,033 | ) |
| | | | | | | |
Net Cash Inflows from Operating Activities | | | 6,015 | | | | 6,238 | | | | 8,855 | | | | 4,776 | | | | 5,135 | | | | 5,774 | | | | 5,867 | |
| | | | | | | |
Cash Flows from Investments in Non-Financial Assets | | | | | | | | | | | | | | | | | | | | | | | | | | | | |
Purchases of non-financial assets | | | (6,900 | ) | | | (8,264 | ) | | | (6,899 | ) | | | (7,989 | ) | | | (9,529 | ) | | | (10,009 | ) | | | (9,453 | ) |
Sales of non-financial assets | | | 292 | | | | 358 | | | | 383 | | | | 438 | | | | 397 | | | | 430 | | | | 304 | |
Net Cash Flows from Investments in Non-financial Assets | | | (6,607 | ) | | | (7,906 | ) | | | (6,516 | ) | | | (7,551 | ) | | | (9,132 | ) | | | (9,579 | ) | | | (9,149 | ) |
| | | | | | | |
Net Cash Flows from Investments in Financial Assets for Policy Purposes | | | (2 | ) | | | — | | | | (11 | ) | | | 500 | | | | — | | | | — | | | | — | |
| | | | | | | |
Net Cash Flows from Investments in Financial Assets for Liquidity Purposes | | | 2,559 | | | | (215 | ) | | | (1,826 | ) | | | 1,268 | | | | 1,905 | | | | 1,227 | | | | (24 | ) |
| | | | | | | |
Receipts from Financing Activities | | | | | | | | | | | | | | | | | | | | | | | | | | | | |
Advances received (net) | | | (112 | ) | | | (54 | ) | | | (72 | ) | | | (65 | ) | | | (104 | ) | | | (88 | ) | | | (84 | ) |
Borrowing (net) | | | (2,277 | ) | | | 1,205 | | | | (821 | ) | | | (54 | ) | | | 2,187 | | | | 2,740 | | | | 3,448 | |
Deposits received (net) | | | (6 | ) | | | 3 | | | | 3 | | | | — | | | | — | | | | — | | | | — | |
Other financing (net) | | | (123 | ) | | | — | | | | (59 | ) | | | — | | | | — | | | | — | | | | — | |
Net Cash Flows from Financing Activities | | | (2,517 | ) | | | 1,154 | | | | (949 | ) | | | (119 | ) | | | 2,082 | | | | 2,653 | | | | 3,364 | |
| | | | | | | |
Net Increase/(Decrease) in Cash held | | | (553 | ) | | | (729 | ) | | | (448 | ) | | | (1,126 | ) | | | (10 | ) | | | 75 | | | | 58 | |
| | | | | | | |
Net cash from operating activities | | | 6,015 | | | | 6,238 | | | | 8,855 | | | | 4,776 | | | | 5,135 | | | | 5,774 | | | | 5,867 | |
Net cash flows from investments in non-financial assets | | | (6,607 | ) | | | (7,906 | ) | | | (6,516 | ) | | | (7,551 | ) | | | (9,132 | ) | | | (9,579 | ) | | | (9,149 | ) |
Surplus/(Deficit) | | | (593 | ) | | | (1,667 | ) | | | 2,339 | | | | (2,775 | ) | | | (3,997 | ) | | | (3,804 | ) | | | (3,282 | ) |
| | | | | | | |
Derivation of ABS GFS Cash Surplus/Deficit | | | | | | | | | | | | | | | | | | | | | | | | | | | | |
Cash surplus/(deficit) | | | (593 | ) | | | (1,667 | ) | | | 2,339 | | | | (2,775 | ) | | | (3,997 | ) | | | (3,804 | ) | | | (3,282 | ) |
Acquisitions under finance leases and similar arrangements | | | (341 | ) | | | (1,032 | ) | | | (715 | ) | | | (618 | ) | | | (1,045 | ) | | | — | | | | — | |
ABS GFS Cash Surplus/(Deficit) Including Finance Leases and Similar Arrangements | | | (934 | ) | | | (2,700 | ) | | | 1,624 | | | | (3,393 | ) | | | (5,042 | ) | | | (3,804 | ) | | | (3,282 | ) |
Note:
| 1. | Numbers may not add due to rounding and bracketed numbers represent negative amounts. |
169
Budget Strategy and Outlook 2017-18
| 9.3 | Reconciliation of net operating balance to accounting operating result |
The primary difference between the net operating balance and the accounting operating result calculated under Australian Accounting Standards is that valuation adjustments are excluded from the net operating balance.
Data presented in Table 9.10 provides a reconciliation of the General Government Sector net operating balance to the accounting operating result.
| Table 9.10 | Reconciliation of UPF net operating balance to accounting operating result1 |
| | | | | | | | | | | | |
| | | 2016-17
Budget
$ million | | | 2016-17
Est. Act.
$ million | | | 2017-18
Budget
$ million | |
| | | |
Net operating balance General Government sector (Table 9.1) | | | 867 | | | | 2,824 | | | | 146 | |
| | | |
Remeasurement/valuation adjustments | | | | | | | | | | | | |
Bad debts and amortisation | | | (88 | ) | | | (90 | ) | | | (89 | ) |
Deferred tax equivalents | | | (54 | ) | | | 1 | | | | 64 | |
Dividends from network GOCs under Debt Action Plan (treated as return of equity for UPF) | | | 160 | | | | 660 | | | | 20 | |
Market value adjustments on financial assets and liabilities | | | (487 | ) | | | (308 | ) | | | 17 | |
Revaluation of provisions | | | 75 | | | | 120 | | | | 66 | |
Decommissioned infrastructure assets and land under roads | | | (143 | ) | | | (143 | ) | | | (143 | ) |
Gain/(loss) on assets sold/written off/impaired | | | (92 | ) | | | (20 | ) | | | (9 | ) |
| | | |
Accounting operating result General Government sector | | �� | 239 | | | | 3,044 | | | | 71 | |
Note:
| 1. | Numbers may not add due to rounding and bracketed numbers represent negative amounts. |
| 9.4 | General Government Sector time series |
Data presented in Table 9.11 provides a time series from 2004-05 to 2015-16 for the General Government Sector on the key fiscal aggregates used by the Government to measure financial performance. These aggregates have been backcast (as far as possible) to comply with AASB 1049 Whole of Government and General Government Sector Financial Reporting.
170
Budget Strategy and Outlook 2017-18
Table 9.11: General Government Sector time series1
| | | | | | | | | | | | | | | | | | | | | | | | | | | | | | | | | | | | | | | | | | | | | | | | |
| | | 2004-05
Actual
$ million | | | 2005-06
Actual
$ million | | | 2006-07
Actual
$ million | | | 2007-08
Actual
$ million | | | 2008-09
Actual
$ million | | | 2009-10
Actual
$ million | | | 2010-11
Actual
$ million | | | 2011-12
Actual
$ million | | | 2012-13
Actual
$ million | | | 2013-14
Actual
$ million | | | 2014-15
Actual
$ million | | | 2015-16
Actual
$ million | |
| | | | | | | | | | | | |
Revenue from Transactions | | | | | | | | | | | | | | | | | | | | | | | | | | | | | | | | | | | | | | | | | | | | | | | | |
Taxation revenue | | | 6,952 | | | | 7,396 | | | | 8,484 | | | | 9,546 | | | | 8,866 | | | | 9,375 | | | | 9,981 | | | | 10,608 | | | | 10,937 | | | | 11,840 | | | | 12,598 | | | | 12,547 | |
Grant revenue | | | 12,755 | | | | 13,590 | | | | 14,378 | | | | 15,510 | | | | 17,481 | | | | 20,205 | | | | 20,338 | | | | 22,652 | | | | 18,322 | | | | 21,740 | | | | 23,583 | | | | 23,740 | |
Sales of goods and services | | | 2,380 | | | | 2,641 | | | | 2,909 | | | | 3,357 | | | | 3,648 | | | | 3,961 | | | | 4,172 | | | | 5,002 | | | | 5,087 | | | | 5,039 | | | | 5,443 | | | | 5,926 | |
Interest income | | | 2,972 | | | | 3,414 | | | | 3,338 | | | | (275 | ) | | | 1,482 | | | | 2,204 | | | | 2,368 | | | | 2,485 | | | | 2,644 | | | | 2,460 | | | | 2,470 | | | | 2,543 | |
Dividend and income tax equivalent income | | | 1,022 | | | | 1,059 | | | | 858 | | | | 1,244 | | | | 1,180 | | | | 949 | | | | 1,232 | | | | 1,112 | | | | 1,351 | | | | 1,975 | | | | 2,554 | | | | 2,661 | |
Other revenue | | | 1,517 | | | | 1,983 | | | | 2,032 | | | | 2,041 | | | | 4,421 | | | | 3,033 | | | | 3,921 | | | | 3,942 | | | | 3,415 | | | | 3,650 | | | | 3,322 | | | | 3,577 | |
Total Revenue | | | 27,599 | | | | 30,084 | | | | 31,999 | | | | 31,424 | | | | 37,078 | | | | 39,727 | | | | 42,013 | | | | 45,801 | | | | 41,755 | | | | 46,705 | | | | 49,970 | | | | 50,995 | |
| | | | | | | | | | | | |
Expenses from Transactions | | | | | | | | | | | | | | | | | | | | | | | | | | | | | | | | | | | | | | | | | | | | | | | | |
Employee expenses | | | 9,621 | | | | 10,615 | | | | 11,731 | | | | 13,175 | | | | 14,310 | | | | 15,566 | | | | 16,826 | | | | 18,250 | | | | 18,130 | | | | 17,816 | | | | 18,592 | | | | 20,044 | |
Superannuation expenses | | | | | | | | | | | | | | | | | | | | | | | | | | | | | | | | | | | | | | | | | | | | | | | | |
Superannuation interest costs | | | 867 | | | | 840 | | | | 1,154 | | | | 816 | | | | 858 | | | | 1,320 | | | | 1,240 | | | | 1,216 | | | | 923 | | | | 963 | | | | 878 | | | | 767 | |
Other superannuation expenses | | | 1,238 | | | | 1,367 | | | | 1,513 | | | | 1,865 | | | | 2,012 | | | | 2,051 | | | | 2,171 | | | | 2,301 | | | | 2,420 | | | | 2,277 | | | | 2,319 | | | | 2,507 | |
Other operating expenses | | | 4,522 | | | | 5,236 | | | | 6,138 | | | | 6,646 | | | | 7,300 | | | | 7,568 | | | | 8,646 | | | | 9,497 | | | | 12,817 | | | | 13,108 | | | | 14,539 | | | | 15,000 | |
Depreciation and amortisation | | | 1,526 | | | | 1,678 | | | | 1,764 | | | | 1,851 | | | | 2,496 | | | | 2,501 | | | | 2,507 | | | | 2,777 | | | | 2,902 | | | | 3,060 | | | | 3,137 | | | | 2,927 | |
Other interest expenses | | | 213 | | | | 174 | | | | 180 | | | | 347 | | | | 599 | | | | 803 | | | | 1,125 | | | | 1,659 | | | | 1,940 | | | | 2,200 | | | | 2,328 | | | | 2,220 | |
Grant expenses | | | 5,647 | | | | 6,467 | | | | 7,565 | | | | 8,329 | | | | 9,525 | | | | 9,790 | | | | 10,963 | | | | 10,327 | | | | 7,182 | | | | 6,792 | | | | 7,758 | | | | 6,559 | |
Total Expenses | | | 23,634 | | | | 26,378 | | | | 30,046 | | | | 33,030 | | | | 37,099 | | | | 39,599 | | | | 43,479 | | | | 46,028 | | | | 46,312 | | | | 46,217 | | | | 49,551 | | | | 50,025 | |
| | | | | | | | | | | | |
Net Operating Balance | | | 3,964 | | | | 3,707 | | | | 1,953 | | | | (1,606 | ) | | | (21 | ) | | | 128 | | | | (1,466 | ) | | | (226 | ) | | | (4,558 | ) | | | 488 | | | | 420 | | | | 970 | |
| | | | | | | | | | | | |
OTHER KEY AGGREGATES | | | | | | | | | | | | | | | | | | | | | | | | | | | | | | | | | | | | | | | | | | | | | | | | |
| | | | | | | | | | | | |
Purchases of non-financial assets | | | 2,717 | | | | 3,196 | | | | 4,412 | | | | 5,725 | | | | 6,772 | | | | 8,959 | | | | 8,237 | | | | 7,971 | | | | 7,001 | | | | 6,323 | | | | 4,635 | | | | 4,092 | |
| | | | | | | | | | | | |
Net acquisition of non-financial assets | | | 1,016 | | | | 1,234 | | | | 2,157 | | | | 3,680 | | | | 4,349 | | | | 6,665 | | | | 5,583 | | | | 5,241 | | | | 3,389 | | | | 3,087 | | | | 992 | | | | 1,431 | |
| | | | | | | | | | | | |
Fiscal Balance | | | 2,946 | | | | 2,472 | | | | (204 | ) | | | (5,286 | ) | | | (4,371 | ) | | | (6,537 | ) | | | (7,049 | ) | | | (5,467 | ) | | | (7,947 | ) | | | (2,599 | ) | | | (572 | ) | | | (461 | ) |
| | | | | | | | | | | | |
Cash Surplus/(Deficit) | | | 4,635 | | | | 4,649 | | | | 2,360 | | | | (4,924 | ) | | | (2,866 | ) | | | (5,341 | ) | | | (5,880 | ) | | | (4,951 | ) | | | (8,585 | ) | | | (3,345 | ) | | | (131 | ) | | | 866 | |
| | | | | | | | | | | | |
Net Worth | | | 92,148 | | | | 104,446 | | | | 118,532 | | | | 193,838 | | | | 184,277 | | | | 175,588 | | | | 177,875 | | | | 170,745 | | | | 172,963 | | | | 166,492 | | | | 171,933 | | | | 191,910 | |
| | | | | | | | | | | | |
Net Debt | | | (19,354 | ) | | | (23,203 | ) | | | (26,622 | ) | | | (22,586 | ) | | | (19,251 | ) | | | (13,354 | ) | | | (9,542 | ) | | | (5,720 | ) | | | 2,399 | | | | 5,208 | | | | 5,749 | | | | 654 | |
| | | | | | | | | | | | |
Borrowing | | | 2,794 | | | | 2,084 | | | | 2,267 | | | | 6,328 | | | | 10,308 | | | | 15,916 | | | | 24,593 | | | | 29,517 | | | | 37,878 | | | | 41,368 | | | | 43,105 | | | | 35,486 | |
| | | | | | | | | | | | |
Borrowing (NFPS) | | | 15,819 | | | | 17,314 | | | | 23,971 | | | | 30,856 | | | | 42,645 | | | | 51,713 | | | | 53,708 | | | | 61,542 | | | | 69,086 | | | | 72,637 | | | | 75,233 | | | | 72,922 | |
Note:
| 1. | Numbers may not add due to rounding and bracketed numbers represent negative amounts. |
Source: Report on State Finances for Queensland 2004-05 to 2015-16. (Numbers have been recast for changes to UPF
171
Budget Strategy and Outlook 2017-18
| 9.5 | Other General Government uniform presentation framework data |
Data in the following tables are presented in accordance with the UPF.
Data presented in Tables 9.12 and 9.13 provide details of General Government Sector current and capital grant revenue and expenses.
| Table 9.12 | General Government Sector grant revenue1 |
| | | | | | | | |
| | | 2016-17
Est. Act.
$ million | | | 2017-18
Budget
$ million | |
| | |
Current grant revenue | | | | | | | | |
Current grants from the Commonwealth | | | | | | | | |
General purpose grants | | | 13,947 | | | | 14,779 | |
Specific purpose grants | | | 7,355 | | | | 7,470 | |
Specific purpose grants for on-passing | | | 3,087 | | | | 2,747 | |
Total current grants from the Commonwealth | | | 24,388 | | | | 24,996 | |
Other contributions and grants | | | 365 | | | | 303 | |
Total current grant revenue | | | 24,753 | | | | 25,299 | |
| | |
Capital grant revenue | | | | | | | | |
Capital grants from the Commonwealth | | | | | | | | |
Specific purpose grants | | | 2,869 | | | | 2,251 | |
Specific purpose grants for on-passing | | | 7 | | | | 5 | |
Total capital grants from the Commonwealth | | | 2,876 | | | | 2,256 | |
Other contributions and grants | | | 79 | | | | 76 | |
Total capital grant revenue | | | 2,955 | | | | 2,332 | |
Total grant revenue | | | 27,708 | | | | 27,631 | |
Note:
| 1. | Numbers may not add due to rounding. |
172
Budget Strategy and Outlook 2017–18
| Table 9.13 | General Government Sector grant expense1 |
| | | | | | | | |
| | | 2016-17
Est. Act.
$ million | | | 2017-18
Budget
$ million | |
| | |
Current grant expense | | | | | | | | |
Private and Not-for-profit sector | | | 1,926 | | | | 2,134 | |
Private and Not-for-profit sector on-passing | | | 2,413 | | | | 2,521 | |
Local Government | | | 216 | | | | 229 | |
Local Government on-passing | | | 683 | | | | 233 | |
Grants to other sectors of Government | | | 1,576 | | | | 1,145 | |
Other | | | 389 | | | | 279 | |
Total current grant expense | | | 7,202 | | | | 6,541 | |
| | |
Capital grant expense | | | | | | | | |
Private and Not-for-profit sector | | | 255 | | | | 290 | |
Local Government | | | 899 | | | | 1,121 | |
Local Government on-passing | | | 7 | | | | 5 | |
Grants to other sectors of Government | | | 29 | | | | 10 | |
Other | | | 151 | | | | 148 | |
Total capital grant expense | | | 1,341 | | | | 1,573 | |
Total grant expense | | | 8,543 | | | | 8,114 | |
Note:
| 1. | Numbers may not add due to rounding. |
| 9.5.2 | Dividend and income tax equivalent income |
Table 9.14 provides details of the source of dividend and income tax equivalent income in the General Government sector.
| Table 9.14 | General Government Sector dividend and income tax equivalent income1 |
| | | | | | | | |
| | | 2016-17
Est. Act.
$ million | | | 2017-18
Budget
$ million | |
Dividend and Income Tax Equivalent income from PNFC sector | | | 2,454 | | | | 1,969 | |
Dividend and Income Tax Equivalent income from PFC sector | | | 84 | | | | 88 | |
Total Dividend and Income Tax Equivalent income | | | 2,538 | | | | 2,057 | |
Note:
| 1. | Numbers may not add due to rounding. |
173
Budget Strategy and Outlook 2017-18
| 9.5.3 | Expenses by function |
Data presented in Table 9.15 provides details of General Government Sector expenses by function.
| Table 9.15 | General Government Sector expenses by function1 |
| | | | | | | | | | | | | | | | | | | | | | | | |
| | | 2016-17
Budget
$ million | | | 2016-17
Est. Act.
$ million | | | 2017-18
Budget
$ million | | | 2018-19
Projection
$ million | | | 2019-20
Projection
$ million | | | 2020-21
Projection
$ million | |
| | | | | | |
General public services | | | 1,818 | | | | 1,588 | | | | 1,595 | | | | 1,546 | | | | 1,516 | | | | 1,441 | |
Public order and safety | | | 4,796 | | | | 4,820 | | | | 5,138 | | | | 5,195 | | | | 5,332 | | | | 5,459 | |
Education | | | 12,650 | | | | 12,643 | | | | 13,458 | | | | 13,854 | | | | 14,493 | | | | 15,206 | |
Health | | | 15,080 | | | | 16,081 | | | | 16,444 | | | | 16,823 | | | | 17,523 | | | | 18,104 | |
Social security and welfare | | | 3,226 | | | | 3,227 | | | | 3,589 | | | | 4,200 | | | | 4,030 | | | | 4,192 | |
Housing and community amenities | | | 1,592 | | | | 1,554 | | | | 1,756 | | | | 1,727 | | | | 1,766 | | | | 1,727 | |
Recreation and culture | | | 1,263 | | | | 1,267 | | | | 1,782 | | | | 994 | | | | 911 | | | | 908 | |
Fuel and energy | | | 607 | | | | 1,422 | | | | 527 | | | | 489 | | | | 534 | | | | 526 | |
Agriculture, forestry, fishing and hunting | | | 614 | | | | 730 | | | | 672 | | | | 626 | | | | 619 | | | | 610 | |
Mining, manufacturing and construction | | | 331 | | | | 327 | | | | 317 | | | | 308 | | | | 318 | | | | 320 | |
Transport and communications | | | 6,007 | | | | 5,537 | | | | 5,752 | | | | 5,620 | | | | 5,776 | | | | 5,808 | |
Other economic affairs | | | 732 | | | | 728 | | | | 846 | | | | 765 | | | | 743 | | | | 733 | |
Other purposes | | | 3,865 | | | | 3,686 | | | | 3,847 | | | | 3,874 | | | | 3,621 | | | | 3,540 | |
| | | | | | |
Total Expenses | | | 52,582 | | | | 53,610 | | | | 55,723 | | | | 56,021 | | | | 57,183 | | | | 58,574 | |
Note:
| 1. | Numbers may not add due to rounding. |
174
Budget Strategy and Outlook 2017-18
| 9.5.4 | Purchases of non-financial assets by function |
Data presented in Table 9.16 provides details of General Government Sector purchases of non-financial assets by function.
| Table 9.16 | General Government Sector purchases of non-financial assets by function1 |
| | | | | | | | | | | | | | | | | | | | | | | | |
| | | 2016-17
Budget
$ million | | | 2016-17
Est. Act.
$ million | | | 2017-18
Budget
$ million | | | 2018-19
Projection
$ million | | | 2019-20
Projection
$ million | | | 2020-21
Projection
$ million | |
| | | | | | |
General public services | | | 39 | | | | 87 | | | | 46 | | | | 162 | | | | 154 | | | | 26 | |
Public order and safety | | | 373 | | | | 248 | | | | 552 | | | | 362 | | | | 304 | | | | 309 | |
Education | | | 493 | | | | 525 | | | | 643 | | | | 687 | | | | 626 | | | | 496 | |
Health | | | 833 | | | | 700 | | | | 984 | | | | 991 | | | | 712 | | | | 530 | |
Social security and welfare | | | 30 | | | | 35 | | | | 55 | | | | 54 | | | | 48 | | | | 42 | |
Housing and community amenities | | | 400 | | | | 273 | | | | 434 | | | | 297 | | | | 265 | | | | 255 | |
Recreation and culture | | | 163 | | | | 61 | | | | 99 | | | | 226 | | | | 180 | | | | 38 | |
Agriculture, forestry, fishing and hunting | | | 23 | | | | 18 | | | | 23 | | | | 23 | | | | 20 | | | | 20 | |
Mining, manufacturing and construction | | | 5 | | | | 6 | | | | 7 | | | | 7 | | | | 2 | | | | 2 | |
Transport and communications | | | 2,973 | | | | 2,397 | | | | 2,100 | | | | 3,412 | | | | 4,627 | | | | 4,712 | |
Other economic affairs | | | 7 | | | | 6 | | | | 8 | | | | 8 | | | | 7 | | | | 7 | |
Other purposes | | | 112 | | | | 59 | | | | 173 | | | | 244 | | | | 69 | | | | 24 | |
| | | | | | |
Total Purchases | | | 5,452 | | | | 4,416 | | | | 5,123 | | | | 6,471 | | | | 7,015 | | | | 6,462 | |
Note:
| 1. | Numbers may not add due to rounding. |
175
Budget Strategy and Outlook 2017-18
Data presented in Table 9.17 provides details of taxation revenue collected by the General Government Sector.
| Table 9.17 | General Government Sector taxes1 |
| | | | | | | | |
| | | 2016-17
Est. Actual
$ million | | | 2017-18
Budget
$ million | |
| | |
Taxes on employers’ payroll and labour force | | | 3,667 | | | | 3,819 | |
| | |
Taxes on property | | | | | | | | |
Land taxes | | | 1,086 | | | | 1,192 | |
Stamp duties on financial and capital transactions | | | 3,327 | | | | 3,190 | |
Other | | | 635 | | | | 696 | |
| | |
Taxes on the provision of goods and services | | | | | | | | |
Taxes on gambling | | | 1,131 | | | | 1,181 | |
Taxes on insurance | | | 905 | | | | 943 | |
| | |
Taxes on use of goods and performance of activities | | | | | | | | |
Motor vehicle taxes | | | 2,192 | | | | 2,278 | |
| | |
Total Taxation Revenue | | | 12,945 | | | | 13,298 | |
Note:
| 1. | Numbers may not add due to rounding. |
176
Budget Strategy and Outlook 2017-18
| 9.5.6 | Loan Council Allocation |
The Australian Loan Council requires all jurisdictions to prepare Loan Council Allocations (LCA) to provide an indication of each government’s probable call on financial markets over the forthcoming financial year.
Table 9.18 presents the State’s revised Budget LCA and the Loan Council endorsed LCA for 2017-18.
| Table 9.18 | Loan Council Allocation1 |
| | | | | | | | | | |
| | | | | 2017-18
Nomination
$ million | | | 2017-18
Budget
$ million | |
| | | |
| | General Government sector cash deficit/(surplus) | | | 2,088 | | | | 1,922 | |
| | PNFC sector cash deficit/(surplus) | | | 538 | | | | 853 | |
| | | |
| | Non-financial Public sector cash deficit/(surplus) | | | 2,626 | | | | 2,775 | |
| | Acquisitions under finance leases and similar arrangements | | | 682 | | | | 618 | |
| | | |
Equals | | ABS GFS cash deficit/(surplus) | | | 3,308 | | | | 3,393 | |
| | | |
Less | | Net cash flows from investments in financial assets for policy purposes | | | — | | | | 500 | |
Plus | | Memorandum items 2 | | | 944 | | | | 1,037 | |
| | | |
| | Loan Council Allocation | | | 4,252 | | | | 3,930 | |
Notes:
| 1. | Numbers may not add due to rounding. |
| 2. | Memorandum items include local government and universities borrowings and operating leases. |
The State’s Budget LCA is a deficit of $3.930 billion, compared to the LCA nomination of $4.252 billion. This improvement is largely the result of net cash flows from net capital returns from other public sector entities.
177
Budget Strategy and Outlook 2017-18
| 9.6 | Contingent liabilities |
Contingent liabilities represent items that are not included in the Budget as significant uncertainty exists as to whether the Government would sacrifice future economic benefits in respect of these items. Nevertheless, such contingencies need to be recognised and managed wherever possible in terms of their potential impact on the Government’s financial position in the future.
The State’s quantifiable and non-quantifiable contingent liabilities are detailed in the 2015-16 Report on State Finances – whole-of-government financial statements (note 43).
A summary of the State’s quantifiable contingent liabilities as at 30 June 2016 is provided in Table 9.19.
| Table 9.19 | Contingent liabilities |
| | | | |
| | | 2015-16
$ million | |
Nature of contingent liability | | | | |
| |
Guarantees and indemnities | | | 10,452 | |
Other | | | 1,235 | |
| |
Total | | | 11,686 | |
| 9.7 | Background and interpretation of uniform presentation framework |
As mentioned in the introduction to this chapter, the UPF was reviewed in 2007 following the release of the AASB accounting standard, AASB 1049 Whole of Government and General Government Sector Financial Reporting.
This standard aims to harmonise GFS and GAAP with the objective of improving the clarity and transparency of government financial statements.
| 9.7.1 | Accrual Government Finance Statistics framework |
The GFS reporting framework, developed by the Australian Bureau of Statistics (ABS), is based on international statistical standards (the International Monetary Fund Manual on Government Finance Statistics and the United Nations System of National Accounts). This allows comprehensive assessments to be made of the economic impact of government.
The accrual GFS framework is based on an integrated recording of stocks and flows. Stocks refer to a unit’s holdings of assets and liabilities at a point in time, whilst flows represent the movement in the stock of assets and liabilities between two points in time. Flows comprise two separate types, transactions and other economic flows. Transactions come about as a result of mutually agreed interactions between units or within a single unit. Other economic flows would include revaluations and destruction or discovery of assets that do not result from a transaction. In GFS operating statements, other economic flows, being outside of the control of government, are excluded and do not affect the net operating balance or fiscal balance.
178
Budget Strategy and Outlook 2017-18
| 9.7.2 | Accrual Government Finance Statistics framework |
In addition to the GFS framework, public sector entities were previously required to report at year end against AAS 31 Financial Reporting by Government, which meant complying with the Accounting Standards issued by the AASB.
| 9.7.3 | Harmonisation under AASB 1049 |
This dual reporting regime caused confusion for financial report users and the Financial Reporting Council asked the AASB to develop a framework harmonising GAAP and GFS and to issue an Australian accounting standard for a single set of government reports.
In the development of AASB 1049, the AASB adopted the following approaches:
| • | | adoption of GAAP definition, recognition and measurement principles in almost all cases |
| • | | amending presentation requirements to encompass a comprehensive result that retains GAAP classification system but overlays it with a transaction and other economic flows classification system based on GFS |
| • | | expanding the disclosure requirements to incorporate key fiscal aggregates required by GFS. |
| 9.7.4 | Revisions to the Uniform Presentation Framework |
Following the introduction of AASB 1049, the Australian, state and territory governments consider that the UPF will continue to be an important framework for ensuring comparability of financial information across jurisdictions. The UPF shall continue to apply to financial statements produced by government in budgets, mid-year budget updates and final budget outcome reports, whereas the accounting standard applies only to outcome reports.
Therefore, rather than replacing the UPF with the accounting standard, the framework was updated to align with AASB 1049. Australian, state and territory governments agreed that the updated framework would continue to provide a common core of comparable financial information in their budget papers and comparable data amongst jurisdictions while maintaining at least the current level of transparency.
Aligning the framework with the AASB 1049 was not intended to create a UPF that complies with all the reporting requirements of AASB 1049. For example, the UPF does not include the same level of detail in relation to disclosure requirements as AASB 1049. Instead, the revised UPF allows jurisdictions to utilise the framework as the base set of statements and add additional relevant information in order to comply with AASB 1049.
179
Budget Strategy and Outlook 2017-18
GFS data is presented by institutional sector, distinguishing between the General Government Sector and the PNFC Sector.
Budget reporting focuses on the General Government Sector, which provides regulatory services and goods and services of a non-market nature that are provided at less than cost or at no cost. These services are largely financed by general revenue (Australian Government grants and state taxation). This service comprises government departments, their commercialised business units/shared service providers and certain statutory bodies.
The PNFC Sector comprises bodies that provide mainly market goods and services that are of a non-regulatory and non-financial nature. PNFCs are financed through sales to consumers of their goods and services and may be supplemented by explicit government subsidy to satisfy community service obligations. In general, PNFCs are legally distinguishable from the governments that own them. Examples of PNFCs include the energy entities and Queensland Rail.
Together, the General Government Sector and the PNFC Sector comprise the Non-financial Public Sector.
Further discussion of the GFS framework of reporting, including definitions of GFS terms, can be obtained from the webpage of the ABS at www.abs.gov.au.
180
Budget Strategy and Outlook 2017-18
The reporting entities included in the General Government and PNFC Sectors in these Budget papers are provided below.
Departments
Aboriginal and Torres Strait Islander Partnerships
Agriculture and Fisheries
Communities, Child Safety and Disability Services
Education and Training
Electoral Commission of Queensland
Natural Resources and Mines
Office of the Governor
Office of the Inspector-General Emergency Management
Office of the Ombudsman
Premier and Cabinet
Public Safety Business Agency
Public Service Commission
Queensland Audit Office
Queensland Fire and Emergency Services
Queensland Health
Queensland Police Service
Queensland Treasury
Science, Information Technology and Innovation
State Development
The Public Trustee of Queensland
Energy and Water Supply
Environment and Heritage Protection
Housing and Public Works
Infrastructure, Local Government and Planning
Justice and Attorney-General
Legislative Assembly
National Parks, Sport and Racing
Tourism, Major Events, Small Business and the Commonwealth Games
Transport and Main Roads
Commercialised Business Units
Building and Asset Services
CITEC
Economic Development Queensland
QFleet
RoadTek
Shared Service Providers
Corporate Administration Agency
Queensland Shared Services
181
Budget Strategy and Outlook 2017-18
Statutory Authorities
Anti-Discrimination Commission
Board of the Queensland Museum
Crime and Corruption Commission
Cross River Rail Delivery Authority
Gold Coast 2018 Commonwealth Games Corporation
Gold Coast Waterways Authority
Hospital and Health Services
Cairns and Hinterland
Central Queensland
Central West
Children’s Health Queensland
Darling Downs
Gold Coast
Mackay
Metro North
Metro South
North West
South West
Sunshine Coast
Torres and Cape
Townsville
West Moreton
Wide Bay
Legal Aid Queensland
Library Board of Queensland
Motor Accident Insurance Commission
Nominal Defendant
Office of the Information Commissioner
Office of the Health Ombudsman
Prostitution Licensing Authority
Queensland Agricultural Training Colleges
Queensland Art Gallery Board of Trustees
Queensland Building and Construction Commission
Queensland Curriculum and Assessment Authority
Queensland Family and Child Commission
Queensland Mental Health Commission
Queensland Performing Arts Trust
Queensland Racing Integrity Commission
Queensland Reconstruction Authority
QRAA
Residential Tenancies Authority
South Bank Corporation
TAFE Queensland
The Council of the Queensland Institute of Medical Research
Tourism and Events Queensland
Trade and Investment Queensland
182
Budget Strategy and Outlook 2017-18
| 9.9.2 | Public Non-financial Corporations |
Brisbane Port Holdings Pty Ltd
CS Energy Limited
DBCT Holdings Pty Ltd
Energy Queensland
Far North Queensland Ports Corporation Limited
Gladstone Area Water Board
Gladstone Ports Corporation Limited
Mount Isa Water Board
North Queensland Bulk Ports Corporation Limited
Port of Townsville Limited
Powerlink Queensland
Queensland Bulk Water Supply Authority (Seqwater)
Queensland Lottery Corporation Pty Ltd
Queensland Rail
Queensland Treasury Holdings Pty Ltd
Stadiums Queensland
Stanwell Corporation Limited
SunWater Limited
183
Budget Strategy and Outlook 2017-18
| Appendix A: | Concessions statement |
Context
The Queensland Government provides a wide range of concessions across a variety of services and products. In addition to targeted discounts, rebates and subsidies for Queenslanders based on eligibility criteria relating to factors such as age, income and special needs or disadvantage, broader concession arrangements are in place to reduce the price paid by all consumers in areas such as transport, electricity and water.
The majority of Queenslanders benefit from at least one concession and in many cases may benefit from multiple concessions each year. For example, aged pensioners are eligible for a number of Queensland Government concessions, such as discounts on their council rates, water, gas and electricity bills, vehicle registration fees as well as subsidised optometry and dental services.
Further information on the eligibility requirements and benefits of a range of Government concessions can be found at: http://www.qld.gov.au/community/cost-of-living-support/concessions/.
Focus
This statement highlights the cost and nature of concessions provided by the Queensland Government. It covers both concessions that are direct Budget outlays (for example, fee subsidy payments), and concessions that are revenue foregone through fees and charges that are set at a lower rate than applies to the wider community or, in some cases, the full cost of service provision.
Sections A.2 and A.3 set out the individual concessions by agency and government-owned corporation respectively, sorted in alphabetical order. The total value of these concessions is estimated to be $5.344 billion in 2017-18. This represents a significant Government and taxpayer commitment to improving the accessibility and affordability of a diverse range of services and reducing the price paid by consumers of those services to ease cost of living pressures.
Explanation of scope
For the purposes of this document, concessions include:
| • | | discounts, rebates and subsidies to improve access to, and the affordability of, a range of services for individuals or families based on eligibility criteria relating to factors such as age, income and special needs or disadvantage |
| • | | concessional prices for Government services, where the price charged to all consumers is less than the full cost of service provision. |
Both General Government and Public Non-financial Corporations (PNFC) Sector concessions are included. Where a payment is made from a General Government Sector agency to a PNFC entity for a concession arrangement, the expenditure is reported against the General Government Sector agency only to avoid double counting. To be included in this statement, concessions must meet the minimum materiality threshold of estimated expenditure or revenue foregone of $50,000 in 2017-18.
184
Budget Strategy and Outlook 2017-18
Varying methods have been used to estimate the cost of concessions depending on the nature of the concession, including:
| • | | direct Budget outlay cost (for example, direct subsidy or rebate payments or Government’s contribution in the case of items such as rental subsidies) |
| • | | revenue foregone (for example, concessional fees and charges) |
| • | | cost of goods and services provided. |
For the purposes of illustration, the document often uses averages to demonstrate the potential value of the concession to consumers. However, averages are not reflective of individual circumstances, meaning the actual dollar value of the concession to consumers may vary from person to person.
The Concessions Statement does not include Tax Expenditures (for example, tax exemptions, reduced tax rates, tax rebates and deductions). Information on Tax Expenditures can be found in Appendix B – Tax expenditure statement.
185
Budget Strategy and Outlook 2017-18
| Table A.1.1 | Concession by entity1 |
| | | | | | | | |
Concession by entity | | 2016-17
Est. Act.
$ million | | | 2017-18
Estimate
$ million | |
Agency | | | | | | | | |
Department of Agriculture and Fisheries | | | 31.6 | | | | 41.8 | |
Department of Communities, Child Safety and Disability Services | | | 262.1 | | | | 290.0 | |
Department of Education and Training | | | 531.5 | | | | 591.0 | |
Department of Energy and Water Supply | | | 666.6 | | | | 776.2 | |
Department of Housing and Public Works | | | 419.0 | | | | 431.0 | |
Department of Justice and Attorney-General | | | 83.6 | | | | 87.8 | |
Department of National Parks, Sport and Racing | | | 1.6 | | | | 1.8 | |
Department of Natural Resources and Mines | | | 4.2 | | | | 4.2 | |
Department of Science, Information Technology and Innovation | | | 0.4 | | | | 0.4 | |
Department of Transport and Main Roads | | | 2,462.9 | | | | 2,667.3 | |
Department of the Premier and Cabinet | | | 4.7 | | | | 5.0 | |
Queensland Fire and Emergency Services | | | 9.4 | | | | 9.9 | |
Queensland Health | | | 309.9 | | | | 284.7 | |
Total Agency | | | 4,787.5 | | | | 5,191.1 | |
| | |
Government-owned corporations | | | | | | | | |
Energy Queensland | | | 23.2 | | | | 26.2 | |
Far North Queensland Ports Corporation Limited | | | 0.8 | | | | 0.8 | |
Gladstone Ports Corporation Limited | | | 54.8 | | | | 55.5 | |
North Queensland Bulk Ports Corporation Limited | | | 2.6 | | | | 2.6 | |
Port of Townsville Limited | | | 5.6 | | | | 5.7 | |
Queensland Rail Limited | | | 1.7 | | | | 1.8 | |
SunWater Limited | | | 58.6 | | | | 60.1 | |
Total Government-owned corporations | | | 147.3 | | | | 152.7 | |
| | |
Total all entities | | | 4,934.8 | | | | 5,343.8 | |
Note:
| 1. | Numbers may not add due to rounding |
186
Budget Strategy and Outlook 2017-18
| Table A.2.1 | Department of Agriculture and Fisheries |
| | | | | | | | |
Concession by entity | | 2016-17
Est. Act.
$ million | | | 2017-18
Estimate
$ million | |
Primary Industry Productivity Enhancement Scheme (PIPES)1 | | | 24.3 | | | | 20.3 | |
Drought Relief Assistance Scheme2 | | | 7.2 | | | | 20.0 | |
Farm Management Grant3 | | | 0.1 | | | | 1.5 | |
Total | | | 31.6 | | | | 41.8 | |
Notes:
| 1. | The concession represents the fair values of the interest rate concessions pertaining to loans issued in each of the financial years shown. |
| 2. | The 2016-17 estimated actual is lower than previously anticipated due to improved climatic conditions across the State. In 2017-18 the Government is providing increased funding of up to $20 million for the continuation of the Drought Relief Assistance Scheme. |
| 3. | The increase between the 2016-17 estimated actual and the 2017-18 estimate is due to anticipated increased take up of the grant in 2017-18. The scheme commenced as at the end of March 2017. |
Primary Industry Productivity Enhancement Scheme (PIPES)
PIPES is administered by the Queensland Rural and Industry Development Authority (QRIDA) and provides concessional rates of interest on loans to eligible primary producers in need of financial assistance. First Start Loans and Sustainability Loans of up to $2 million and $1.3 million respectively support applicants to enter primary production and to improve productivity and sustainability. The average concessional interest rate for new lending is 3.24%. The amounts shown in the above table represent the fair values of the interest rate concessions pertaining to loans issued in each of the financial years shown.
Drought Relief Assistance Scheme
The Drought Relief Assistance Scheme provides freight subsidies and emergency water infrastructure rebates to support producers and communities that have been affected by drought conditions across the State. Freight subsidies of up to 50% and emergency water infrastructure rebates of up to 50% are available to eligible applicants, up to a maximum of between $20,000 and $40,000 per property, per financial year.
Farm Management Grant
The Farm Management Grant aims to assist eligible Queensland primary producers or their relatives offset the costs of professional advice associated with succession planning. The grant provides rebates of up to 50% of the amount paid for professional advice, up to a maximum of $2,500 per financial year.
187
Budget Strategy and Outlook 2017-18
| Table A.2.2 | Department of Communities, Child Safety and Disability Services |
| | | | | | | | |
Concession | | 2016-17
Est. Act.
$ million | | | 2017-18
Estimate
$ million | |
Electricity Rebate Scheme1, 2 | | | 173.4 | | | | 200.0 | |
Pensioner Rate Subsidy Scheme | | | 53.6 | | | | 54.2 | |
South East Queensland Pensioner Water Subsidy Scheme | | | 19.2 | | | | 19.6 | |
Home Energy Emergency Assistance Scheme | | | 10.0 | | | | 10.0 | |
Electricity Life Support Concession Scheme1 | | | 2.4 | | | | 2.5 | |
Reticulated Natural Gas Rebate Scheme | | | 2.2 | | | | 2.3 | |
Medical Cooling and Heating Electricity Concession Scheme1 | | | 1.3 | | | | 1.4 | |
Total | | | 262.1 | | | | 290.0 | |
Notes:
| 1. | Electricity price linked rebates are adjusted annually according to the Queensland Competition Authority’s (QCA) price determination for the general household electricity tariff (Tariff 11). For 2017-18, the QCA determined Tariff 11 will increase by 7.1%, however the Queensland Government is taking action to reduce this to 3.3%. |
| 2. | The increase between the 2016-17 estimated actual and the 2017-18 estimate also reflects the growth in claimants arising from the increased uptake of concession cards, as well as the extension of the Electricity Rebate to Commonwealth Health Care Card Holders and asylum seekers from 1 January 2017. |
Electricity Rebate Scheme
The Electricity Rebate Scheme provides a rebate of up to $341 per annum to assist with the cost of domestic electricity supply to the home of eligible holders of a Pensioner Concession Card, a Queensland Seniors Card or a Department of Veterans’ Affairs Gold Card (and receive a War Widow/er Pension or special rate Totally or Permanently Incapacitated Pension).
As announced in the 2016-17 Mid Year Fiscal and Economic Review, the Queensland Government has extended the rebate to Commonwealth Health Care Card Holders and asylum seekers from 1 January 2017, allowing an estimated 157,000 additional Queensland families to access the rebate at an estimated cost of $170 million over four years from 2016-17.
Pensioner Rate Subsidy Scheme
The Pensioner Rate Subsidy Scheme offers a 20% subsidy (up to a maximum of $200 per annum) to lessen the impact of local government rates and charges on pensioners, thereby assisting them to continue to live in their own homes.
South East Queensland Pensioner Water Subsidy Scheme
The South East Queensland (SEQ) Pensioner Water Subsidy Scheme provides a subsidy of up to $120 per annum to eligible pensioner property owners in the SEQ Water Grid to lessen the impact of increased water prices. This subsidy is in addition to the Pensioner Rate Subsidy Scheme.
188
Budget Strategy and Outlook 2017-18
Home Energy Emergency Assistance Scheme
The Home Energy Emergency Assistance Scheme provides emergency assistance of up to $720 once in a two year period to assist low income households experiencing a short term financial crisis and who are unable to pay their current electricity and/or reticulated natural gas account. It is not a requirement for the claimant to hold a concession card.
Electricity Life Support Concession Scheme
The Electricity Life Support Concession Scheme is aimed at assisting seriously ill people who use home based life support systems by providing a rebate of up to $694 per annum for users of oxygen concentrators and a rebate of up to $465 per annum for users of kidney dialysis machines to meet their electricity costs. The concession is paid quarterly and is subject to the patient being medically assessed in accordance with Queensland Health eligibility criteria.
Reticulated Natural Gas Rebate Scheme
The Reticulated Natural Gas Rebate Scheme provides a rebate of up to $71 per annum to assist with the cost of reticulated natural gas supplied to the home of eligible holders of a Pensioner Concession Card, Queensland Seniors Card or a Department of Veterans’ Affairs Gold Card (and receive the War Widow/er Pension or special rate Totally or Permanently Incapacitated Pension).
Medical Cooling and Heating Electricity Concession Scheme
The Medical Cooling and Heating Electricity Concession Scheme provides a rebate of up to $341 per annum for eligible concession card holders with a medical condition who have dependence on air conditioning to regulate body temperature.
189
Budget Strategy and Outlook 2017-18
| Table A.2.3 | Department of Education and Training |
| | | | | | | | |
Concession | | 2016-17
Est. Act.
$ million | | | 2017-18
Estimate
$ million | |
User Choice - Apprentice and Trainee Training Subsidy | | | 212.0 | | | | 212.0 | |
Vocational Education and Training (VET) - Certificate 3 Guarantee Tuition Fee Subsidy1 | | | 126.7 | | | | 179.2 | |
VET - Higher Level Skills Tuition Fee Subsidy1 | | | 64.6 | | | | 70.0 | |
Textbook and Resource Allowance | | | 58.1 | | | | 58.1 | |
School Transport Assistance for Students with Disabilities2 | | | 41.7 | | | | 42.7 | |
Living Away from Home Allowance Scheme | | | 8.2 | | | | 8.3 | |
Tuition fee exemptions/waivers - Dependants of international students | | | 6.6 | | | | 6.8 | |
Non-Government Schools Transport Assistance Scheme2 | | | 5.9 | | | | 6.1 | |
Travel and Accommodation Subsidy3 | | | 2.5 | | | | 3.0 | |
Dalby State High School - Bunya Campus Residential Facility4 | | | 2.6 | | | | 2.7 | |
Spinifex State College - Mount Isa Student Residential Facility | | | 1.1 | | | | 1.1 | |
Distance Education - Information and Communication Technology Subsidy Scheme | | | 0.9 | | | | 0.8 | |
Distance Education - Non-Government Student Fee Subsidy5 | | | 0.4 | | | | 0.2 | |
Western Cape Student Residential College, Weipa6 | | | 0.2 | | | | — | |
Total | | | 531.5 | | | | 591.0 | |
Notes:
| 1. | The increase between the 2016-17 estimated actual and 2017-18 estimate is due to the anticipated increase in activity due to the demand driven nature of the program. |
| 2. | The increase between the 2016-17 estimated actual and 2017-18 estimate is due to a combination of CPI indexation and student enrolment growth. |
| 3. | The increase between the 2016-17 estimated actual and 2017-18 estimate is due to a low take up of this subsidy in 2016-17. |
| 4. | The increase between the 2016-17 estimated actual and 2017-18 estimate is due to anticipated increased student enrolments in 2018. |
| 5. | The decrease between the 2016-17 estimated actual and 2017-18 estimate is due to an anticipated lower uptake of this subsidy in 2018. |
| 6. | The decrease between the 2016-17 estimated actual and 2017-18 estimate is due to the Residential College being anticipated to be self-funded in 2017-18. |
190
Budget Strategy and Outlook 2017-18
User Choice – Apprentice and Trainee Training Subsidy
The User Choice – Apprentice and Trainee Training Subsidy program provides government funding towards the costs of training and assessment for eligible Queensland apprentices and trainees. The subsidy is available to public and private registered training organisations (pre-approved as pre-qualified suppliers) to subsidise tuition fees to reduce the cost of required accredited, entry level training for apprentices and trainees. The program provides greater flexibility for apprentices, trainees and their employers to select a preferred registered training organisation and to negotiate the type of training to meet their specific needs.
Whilst the full cost of each training subsidy varies by course, the average annual dollar value of this subsidy per student is $2,303.
Vocational Education and Training (VET) – Certificate 3 Guarantee Tuition Fee Subsidy
The Vocational Education and Training (VET) Certificate 3 Guarantee Tuition Fee Subsidy provides a government subsidy to allow eligible Queenslanders to obtain their first post-school Certificate III qualification to gain a job or to improve their employment status. The subsidy is available to private and public registered training organisations (pre-approved as pre-qualified suppliers) to subsidise tuition fees paid by students undertaking eligible vocation education and training qualifications (primarily Certificate III qualifications).
The annual average dollar value of this subsidy for each qualification ranges from $432 to $6,408 depending on the eligibility and qualification subsidised. The average subsidy value is $2,766.
VET – Higher Level Skills Tuition Fee Subsidy
The VET Higher Level Skills Tuition Fee Subsidy provides a government subsidy to eligible students and employers to undertake a priority Certificate IV, diploma or advanced diploma or industry endorsed skill set. This program will help individuals gain employment in a critical occupation, career advancement in a priority industry or transition to university to continue their studies. The subsidy is available to private and public registered training organisations (pre-approved as pre-qualified suppliers) to subsidise tuition fees paid by students undertaking eligible vocational education and training qualifications at Certificate IV or above.
The annual average dollar value of this subsidy for each qualification ranges from $1,085 to $8,010 depending on the eligibility and qualification subsidised. The average subsidy value is $3,772.
Textbook and Resource Allowance
The Textbook and Resource Allowance is for parents/caregivers of secondary school age students attending State and approved non-government schools to assist with the cost of textbooks and learning resources. Parents generally sign over this allowance to the school to reduce the fees associated with participating in the school’s textbook and resource scheme. In 2017, the allowance per annum is $123 for students in Years 7 to 10 and $266 for students in Years 11 and 12.
191
Budget Strategy and Outlook 2017-18
School Transport Assistance for Students with Disabilities
School Transport Assistance for Students with Disabilities is provided for students to attend State school programs that meet their individual education needs. This transport assistance includes the provision of taxis or specialised contracted minibuses, payment of fares on regular buses or trains or an allowance for parents who drive their children to school. The benefit level is to a maximum of $400 per week, per student, however in exceptional circumstances higher amounts may be approved. A separate scheme is in place for students with disabilities attending non-government schools (refer ‘Non-Government Schools Transport Assistance Scheme’).
The Department of Education and Training is working with the Department of Transport and Main Roads (DTMR) to establish a long-term solution for the delivery of school transport assistance for students with disabilities under the National Disability Insurance Scheme (NDIS).
Living Away from Home Allowance Scheme
The Living Away from Home Allowance Scheme provides financial assistance to support
Queensland families and targets geographically-isolated families. The scheme meets the costs of children who are required to live away from home to attend schools. This concession is available to Queensland students attending both state and non-government schools.
The benefits available for eligible students in 2017 are:
| • | | Remote Area Allowance – assistance of $2,277 per annum is available to students attending campuses of the Australian Agricultural College Corporation in lieu of Year 11 and 12. |
| • | | Remote Area Tuition Allowance – primary students up to $3,678 per annum and secondary students up to $5,296 per annum. Benefit levels are linked to the tuition fees charged by approved boarding schools. |
| • | | Remote Area Travel Allowance – available where the distance from the family home to the boarding location is at least 50km. Benefit levels depend on the distance travelled, and range from $139 to a maximum of $1,696 per annum. |
| • | | Remote Area Disability Supplement – available to students with disabilities who incur additional costs associated with living away from home to attend school. Benefits are up to $7,412 per student per annum. |
Tuition fee exemptions/waivers – Dependants of international students
This concession, available for dependants of international students, allows students who meet the approved exemption criteria and wish to enrol their child in Preparatory (Prep) Year to Year 12 of schooling are exempt from paying dependant tuition fees. The exemption only applies for the duration of the main temporary visa holder’s (parent) course of study in Queensland. A dependant student (Prep to Year 12) of a temporary visa holder may also be eligible for a tuition fee waiver in certain circumstances, including financial hardship.
The estimated average amount exempted or waived per student is $7,553 for the 2017-18 financial year.
192
Budget Strategy and Outlook 2017-18
Non-Government Schools Transport Assistance Scheme
The Non-Government School Transport Assistance Scheme assists families by providing funding towards the transport costs of students attending non-government schools outside of the Brisbane City Council area. Under the scheme, reimbursement is provided for transport expenses above a set weekly threshold amount. In 2017, the threshold is $33 per week for families, or $25 for families with a Health Care Card, Pensioner or Department of Veterans’ Affairs Pensioner Card.
The program also assists families of students with disabilities who attend a non-government school. The level of assistance provided is dependent on the type of transport needed and travel assistance already provided by DTMR. For families using taxis, assistance is capped at $300 per week.
The Department of Education and Training is working with DTMR to establish a long-term solution for the delivery of school transport assistance for students with disabilities under the NDIS.
Travel and Accommodation Subsidy
The Travel and Accommodation Subsidy provides financial assistance to Queensland apprentices and trainees for travel expenses incurred in attending off the job training at a registered training organisation. To be eligible, apprentices must attend the closest registered training organisation that offers the required qualification and travel a minimum of 100 kilometres (km) return from their usual place of residence to the registered training organisation. The subsidy provides for:
| • | | return land travel to the registered training organisation of 15 cents per km for distances between 100 – 649km, increasing to 19 cents per km for distances between 650 – 1,400 km |
| • | | cost of ferry travel if necessary |
| • | | a return economy air ticket to the location of the registered training organisation if necessary |
| • | | accommodation assistance of $28 per day for overnight stay within Queensland and $68 for interstate travellers, if it is necessary to live away from their usual place of residence to attend training. |
Dalby State High School – Bunya Campus Residential Facility
The Dalby State High School – Bunya Campus Residential Facility provides affordable residential accommodation for secondary school students in a boarding facility. The concession particularly targets secondary school students from rural and remote communities, however, any secondary age student is eligible. Students accommodated at the residential facility are enrolled at Dalby State High School and participate in agricultural education programs.
193
Budget Strategy and Outlook 2017-18
Spinifex State College – Mount Isa Student Residential Facility
The Spinifex State College – Mount Isa Student Residential Facility provides an affordable residential facility in Mount Isa for students from the North Western area of the State whose home community does not provide secondary schooling. The funding meets the cost of wages for the residential college, increasing the affordability of the accommodation rates charged to students.
Distance Education – Information and Communication Technology Subsidy Scheme
The Distance Education – Information and Communication Technology Subsidy Scheme provides assistance to students enrolled in a school of distance education that are geographically isolated or in the medical category.
The scheme provides $250 per annum to assist with purchasing, replacing or upgrading computer hardware for students in the distance/geographically isolated and medical categories, and $500 per annum to assist students in the distance/geographically isolated category to meet the costs of broadband internet access and download charges for the home classroom. Eligible students also receive access to free software licences.
Distance Education – Non-Government Student Fee Subsidy
The Distance Education – Non-Government Student Fee Subsidy is available to students who are enrolled in non-government schools and also choose to access distance education subjects. It provides an average annual subsidy of approximately $1,297.60 per distance education subject enrolment.
This subsidises approximately 50% of the total average cost per annum of providing a subject through distance education for non-government school students. The concession contributes towards the state continuing to make distance education available to non-government schools, ensuring the widest possible subject choice for students, while recovering a proportion of the teaching and overhead costs.
Western Cape Student Residential College, Weipa
The Western Cape Student Residential College, Weipa (formerly Far North Queensland Region - Student Residential College) provides a residential schooling option for students from the Torres Strait and Cape York. This college provides an option that is more familiar for students from remote locations, with the intent to increase participation and retention of secondary students in schooling. The concession targets students from the Torres Strait and Cape York seeking secondary education when their home community does not provide secondary schooling. The concession provides wages for the residential college allowing the rates charged to students to be more affordable. The Residential College is expected to be self-funded in 2017-18.
194
Budget Strategy and Outlook 2017-18
| Table A.2.4 | Department of Energy and Water Supply |
| | | | | | | | |
Concession | | 2016-17
Est. Act.
$ million | | | 2017-18
Estimate
$ million | |
Energy Queensland - Uniform Tariff Policy (excluding Isolated Systems) | | | 564.2 | | | | 441.1 | |
Powering Queensland Plan - Electricity Affordability Package | | | — | | | | 268.0 | |
Energy Queensland - Uniform Tariff Policy for Isolated Systems | | | 45.7 | | | | 47.1 | |
Drought Relief Arrangements | | | 6.2 | | | | 6.3 | |
Origin Energy - Uniform Tariff Policy | | | 2.8 | | | | 2.5 | |
Cloncurry Pipeline Water Supply Subsidy | | | 5.9 | | | | 6.0 | |
SunWater Rural Irrigation Water Price Subsidy | | | 3.7 | | | | 3.1 | |
Urban Water Price Path | | | 35.7 | | | | — | |
Seqwater Rural Irrigation Water Price Subsidy | | | 2.4 | | | | 2.1 | |
Total | | | 666.6 | | | | 776.2 | |
Energy Queensland – Uniform Tariff Policy (excluding Isolated Systems)
The Energy Queensland – Uniform Tariff Policy (excluding Isolated Systems) ensures that, where possible, all Queensland non-market electricity customers of a similar type pay a similar price for electricity regardless of where they live. As the notified prices do not reflect the full cost of electricity supply for most remote and regional Queenslanders, a subsidy is provided. The community service obligation (CSO) payment to the regional retailer Energy Queensland covers the difference between the revenue earned by charging customers notified prices and the actual costs in the regional areas (due to differences in network costs and energy losses).
As Energex’s distribution charges are used in the setting of notified prices, the difference between Energex’s and Ergon Energy’s distribution charges has a significant impact on the CSO amount (ie. a smaller difference results in a lower CSO). For 2017-18, the reduction in the CSO largely relates to an expected decrease in Ergon Energy’s distribution charges relative to Energex’s charges. This reflects the Australian Energy Regulator’s decisions for the two distribution businesses regarding the revenue that they are allowed to recover from their customers. A small over-recovery in distribution revenue by Ergon Energy that occurred in 2015-16 is also expected to flow through in a further reduction in charges in 2017-18.
In addition, the 2016-17 CSO cost was higher than trend mainly because of the record temperatures in February and early March 2017, which resulted in an increase in load, and higher costs from network charges and line losses. This result exaggerates the difference between 2016-17 and 2017-18 beyond what would be expected to occur under continued normal weather conditions.
195
Budget Strategy and Outlook 2017-18
Powering Queensland Plan – Electricity Affordability Package
The Powering Queensland Plan is providing one-off funding in 2016-17, including $771 million to support the stabilisation of electricity prices for Queensland consumers, by funding the removal of costs of the Solar Bonus Scheme from electricity prices for three years from 1 July 2017 and directing Energy Queensland to remove costs from network charges. This will reduce bill increases in 2017-18 from 7.1% to 3.3% for the typical household, and provide an average saving of $51 for households and $90 for small businesses in 2017-18, compared with the increase which would have occurred without Government intervention. It is estimated that the benefit to Queenslanders in 2017-18 as a result of this measure will be $268 million.
Energy Queensland – Uniform Tariff Policy for Isolated Systems
The Energy Queensland – Uniform Tariff Policy for Isolated Systems ensures that, where possible, all Queensland non-market electricity customers of a similar type pay a similar price for electricity regardless of where they live. Energy Queensland owns and operates 33 isolated power stations which supply electricity to remote and isolated Queensland communities. Energy Queensland retails electricity to these customers at the notified prices, and the Government provides funding to the retailer to cover the difference between the revenue earned and the cost of supplying electricity to these customers.
The CSO estimate for 2017-18 is higher than 2016-17 estimated actuals due to expected higher generation and maintenance costs.
Drought Relief Arrangements
Drought Relief Arrangements provide relief to farming customers from fixed charges for electricity accounts that are used to pump water for farm or irrigation purposes during periods of drought.
The drought relief figure for 2017-18 is an estimate and could be subject to change based on drought declarations.
Origin Energy – Uniform Tariff Policy
The Origin Energy – Uniform Tariff Policy ensures that, where possible, all Queensland non-market electricity customers of a similar type pay a similar price for electricity regardless of where they live. Origin Energy retails electricity to approximately 5,450 Queensland non-market customers in the Goondiwindi, Texas and Inglewood areas who are supplied electricity through the New South Wales (NSW) Essential Energy distribution network.
The Government provides a rebate to these customers, via a CSO payment to Origin Energy, to ensure they pay no more for electricity than similar customers in Queensland. Therefore, the CSO amount depends on the relative difference between Queensland and NSW retail electricity tariffs for non-market customers.
196
Budget Strategy and Outlook 2017-18
Cloncurry Pipeline Water Supply Subsidy
North West Queensland Water Pipeline Limited (NWQWP), a SunWater Limited (SunWater) subsidiary, owns and operates the Cloncurry Pipeline between the Ernest Henry Mine and Cloncurry. The pipeline guarantees Cloncurry Shire Council’s long-term water supply and supports industrial development in the region. As the construction and operation of the Cloncurry Water Pipeline is a non-commercial investment, the Government provides funding to NWQWP to ensure that SunWater receives a return on its investment in the pipeline.
SunWater Rural Irrigation Water Price Subsidy
SunWater owns and operates water supply schemes across regional Queensland. As the owner of SunWater, the Government decides how much to recover of SunWater’s costs through irrigation prices. Currently, SunWater’s irrigation water prices for some schemes are set below the level necessary to recover the cost of supplying water to the irrigators. Government funding is provided to SunWater to offset the reduced revenue and to ensure that increases in water prices paid by rural irrigation customers to recover costs are gradual.
The decrease in the CSO for 2017-18 is largely due to the price path arrangements leading to a reduction in the concession required.
Urban Water Price Path
Bulk water prices in South East Queensland (SEQ) have been set at levels below the cost of supply since the introduction of the bulk water price path in 2008. The concession amount is the difference between revenue received and the costs recovered over the period. Importantly, the bulk water price path has slowly increased bulk water prices over time to the point where they are cost reflective for the majority of bulk water consumers in SEQ. As a result, 2017-18 represents the first year in which the price path does not result in an under recovery of revenue.
Seqwater Rural Irrigation Water Price Subsidy
Seqwater owns and operates water supply schemes across SEQ which also supply bulk water services to rural irrigation customers. Currently Seqwater’s rural irrigation prices for some schemes are set below the level necessary to recover the cost of supplying water to the irrigators. Government funding is provided to Seqwater to offset the reduced revenue and to ensure that increases in water prices paid by rural irrigation customers to recover costs are gradual.
The decrease in the CSO for 2017-18 is largely due to the price path arrangements leading to a reduction in the concession required.
197
Budget Strategy and Outlook 2017-18
| Table A.2.5 | Department of Housing and Public Works |
| | | | | | | | |
Concession | | 2016-17
Est. Act.
$ million | | | 2017-18
Estimate
$ million | |
Government managed housing rental rebate1 | | | 365.2 | | | | 376.8 | |
National Rental Affordability Scheme2 | | | 27.4 | | | | 28.4 | |
Home Assist Secure3 | | | 20.0 | | | | 19.0 | |
Non-residential buildings - subsidised rents | | | 5.2 | | | | 5.6 | |
Rental Bond Loans | | | 1.2 | | | | 1.2 | |
Non-government managed housing4 | | | — | | | | — | |
Total | | | 419.0 | | | | 431.0 | |
Notes:
| 1. | The increase between the 2016-17 estimated actual and the 2017-18 estimate is primarily due to lower forecast growth in tenant rental income. |
| 2. | The increase between the 2016-17 estimated actual and the 2017-18 estimate is due to the expected increase in the indexation rate for the 2017-18 NRAS incentive and an increase in the number of dwellings delivered. |
| 3. | The decrease between the 2016-17 estimated actual and the 2017-18 estimate is due to the anticipated decrease in the number of households seeking assistance in 2017-18. |
| 4. | The value of this concession arrangement cannot be easily quantified. |
Government managed housing rental rebate
The Government managed housing rental rebate targets low income families and individuals and represents the difference between the rents that would be payable in the private market and rent that is charged by Government based on household income.
Assistance is provided to approximately 53,000 households. The estimated average yearly subsidy per household for 2017-18 is $7,073.
National Rental Affordability Scheme
The National Rental Affordability Scheme (NRAS) is an Australian Government initiative, delivered in partnership with the Queensland Government, to increase the supply of new affordable rental housing. The scheme provides financial incentives to investors to build well located dwellings and rent them to eligible low to moderate income households, at a discounted rate at least 20% below market rent.
Under the scheme, the concession to the tenant is provided by the property owner. Due to the nature of the arrangement, the overall value of the concession to the tenant cannot be quantified. In 2017-18, the Government has allocated $28.4 million for the payment of financial incentives to NRAS investors who are then required to discount rents to tenants.
198
Budget Strategy and Outlook 2017-18
Home Assist Secure
Home Assist Secure provides free safety related information and referrals, and subsidised assistance to eligible clients unable to undertake or pay for critical maintenance services without assistance. To be considered for assistance, home owners or tenants with a disability or over the age of 60 must hold a Pensioner Concession Card and be unable to complete the work themselves. In addition, they must be unable to access assistance from family or friends or other services. Labour costs (up to $400 per household per year) for the assistance provided are subsidised by Home Assist Secure while the balance of the costs (including all materials) are met by the client.
Home Assist Secure targets home owners and those in rental housing who are over 60 years of age or have disability, and who require assistance to remain living in their home. In 2017-18, $19 million in grants to Home Assist Secure providers will be issued to ensure the ongoing delivery of assistance to those in greatest need. It is estimated that over 47,500 households will be assisted.
Non-residential buildings – subsidised rents
Accommodation is provided to 38 community, education, arts and not-for-profit organisations in Government owned non-residential buildings. Tenures for the occupancies are by way of leases, licences or month to month arrangements. Rents paid by the organisations are often below independently assessed market rent levels. Subsidised rental arrangements are provided to 25 properties comprising a total floor area of approximately 24,665 square metres. The total subsidy is calculated by deducting the actual amount paid by the occupants from the total estimated annual market rent for the office space.
Rental Bond Loans
The Government provides interest-free rental bond loans equivalent to a maximum amount of four weeks rent to people who cannot afford to pay a full bond to move into private rental accommodation reducing the need for more costly, subsidised housing assistance.
The concession represents the interest saving for the client on the bond loan. In 2017-18, $27 million in bond loans will be advanced to an estimated 24,000 clients.
Non-government managed housing
The Government provides contributions to social housing providers, including capital grants, granted land or properties, or recurrent funding, to assist in increasing housing affordability and access to social housing. Due to the nature of the arrangement, the overall value of the concession provided by the Government cannot be easily quantified.
Rents charged for social housing managed by the providers are based on 25% of a household’s assessable income, which substantially reduces accommodation costs for eligible individuals and families.
199
Budget Strategy and Outlook 2017-18
| Table A.2.6 | Department of Justice and Attorney-General |
| | | | | | | | |
Concession | | 2016-17
Est. Act.
$ million | | | 2017-18
Estimate
$ million | |
Public Trustee of Queensland - Concessions | | | 34.3 | | | | 36.0 | |
Queensland Civil and Administrative Tribunal | | | 19.1 | | | | 19.7 | |
Court Services - Civil Court | | | 18.1 | | | | 19.3 | |
Blue Card - Volunteer Applicants | | | 10.0 | | | | 10.6 | |
Body Corporate and Community Management - Dispute Resolution | | | 2.1 | | | | 2.2 | |
Total | | | 83.6 | | | | 87.8 | |
Public Trustee of Queensland – Concessions
The Public Trustee of Queensland (the Public Trustee) is a self-funding organisation and uses a scale of fees which is designed to reflect a fair cost for the services provided.
The Public Trustee has established a safety net limit on the annual fees payable by certain clients. The arrangement provides for a rebate of fees for some clients with limited assets, for example financial administration for clients with impaired capacity, or administration of deceased estates or trusts. The Public Trustee also provides free Will making services for Queenslanders.
In addition, the Public Trustee provides funding to the Public Guardian and financial assistance under the Civil Law Legal Aid Scheme administered by Legal Aid Queensland, to enable these organisations to provide services to the people of Queensland.
Queensland Civil and Administrative Tribunal
The Queensland Civil and Administrative Tribunal (QCAT) is an independent tribunal which makes decisions and resolves disputes across a wide range of jurisdictions for the community. Fees for these services are below cost recovery to ensure services are accessible, fair and inexpensive. QCAT provides human rights services with no application fees for matters in guardianship and administration of adults, children and young people and anti-discrimination.
Court Services – Civil Court
The Supreme, District and Magistrates Courts hear civil disputes between two or more parties (people or organisations) where one party sues the other, usually to obtain compensation or seek some other remedy. These disputes may involve anything from defamation to outstanding debts. Civil Court Fees are prescribed under the Uniform Civil Procedure (Fees) Regulation 2009 for proceedings commenced in civil matters and are set below full cost recovery to ensure that civil remedies are accessible to all Queenslanders.
200
Budget Strategy and Outlook 2017-18
Blue Card – Volunteer Applicants
Individuals providing child-related services or conducting child-related activities in regulated service environments are required to undergo an assessment of their police and relevant disciplinary information, and if approved, are issued with a blue card. A blue card is valid for three years unless cancelled or suspended earlier. The application fee for a blue card is $87.20 (as at 1 July 2017). Since the inception of the blue card system in 2001, Government has met the cost of blue card assessment for volunteer applicants.
Body Corporate and Community Management – Dispute Resolution
The Office of the Commissioner for Body Corporate and Community Management provides a dispute resolution service to parties unable to resolve disputes themselves. The service consists of conciliation, with the aim of achieving a voluntary agreement, and adjudication, which results in a formal order. The service is delivered below full cost recovery so as to not restrict access to justice due to affordability reasons.
| Table A.2.7 | Department of National Parks, Sport and Racing |
| | | | | | | | |
Concession | | 2016-17
Est. Act.
$ million | | | 2017-18
Estimate
$ million | |
Tour fee and access permit concessions | | | 1.3 | | | | 1.5 | |
Queensland Recreation Centres - Concessional usage rates | | | 0.3 | | | | 0.3 | |
Total | | | 1.6 | | | | 1.8 | |
Tour fee and access permit concessions
Tour fee, access permit and camping fee concessions are available in specified protected areas including David Fleay Wildlife Park, Mon Repos Conservation Park, St Helena Island National Park, Walk-About Creek Wildlife Centre, Fort Lytton National Park, Cooloola Recreation Area, Moreton Island and Fraser Island.
Queensland Recreation Centres – Concessional usage rates
Concessional usage rates are offered to students and children 17 years and under, for the use of Queensland Recreation Centres, primarily at Currimundi and Tallebudgera. These concessional rates provide discounts of between 4.4% and 34.2%.
201
Budget Strategy and Outlook 2017-18
| Table A.2.8 | Department of Natural Resources and Mines |
| | | | | | | | |
Concession | | 2016-17
Est. Act.
$ million | | | 2017-18
Estimate
$ million | |
Drought Assistance Package - Water Licence Fee Waiver and Land Rental Rebates | | | 4.2 | | | | 4.2 | |
Total | | | 4.2 | | | | 4.2 | |
Drought Assistance Package – Water Licence Fee Waiver and Land Rental Rebates
As part of the Government’s drought assistance package, the annual water licence fee of $76.55 will be waived for 2017-18 for landholders in Local Government Areas (LGA) that are drought declared and other properties that are individually drought declared. The estimate is dependent on drought declarations and the demand for drought assistance.
Category 11 Grazing and Primary Production landholders under the Land Act 1994 will also be eligible to a rent rebate in 2017-18. The rebate is available to lessees, other than those on minimum rent that are in a drought declared LGA and to individually drought declared properties. In addition to this rebate, drought declared landholders will be granted a hardship deferral for required rent payments.
| Table A.2.9 | Department of Science, Information Technology and Innovation |
| | | | | | | | |
Concession | | 2016-17
Est. Act.
$ million | | | 2017-18
Estimate
$ million | |
State Library of Queensland - Venue hire rebates | | | 0.4 | | | | 0.4 | |
Total | | | 0.4 | | | | 0.4 | |
State Library of Queensland – Venue hire rebates
State Library of Queensland provides venue hire concessions to targeted community and non-profit groups including cultural and charitable organisations and educational institutions in order to support events and programs directly linked to State Library of Queensland’s services, programs and activities.
202
Budget Strategy and Outlook 2017-18
| Table A.2.10 | Department of Transport and Main Roads |
| | | | | | | | |
Concession | | 2016-17
Est. Act.
$ million | | | 2017-18
Estimate
$ million | |
General Public Transport Concessions (South East Queensland) | | | 1,207.1 | | | | 1,355.7 | |
Rail Network and Infrastructure Funding | | | 538.5 | | | | 564.8 | |
General Public Transport Concessions (Regional Queensland) | | | 243.4 | | | | 256.6 | |
Vehicle and boat registration concessions | | | 159.3 | | | | 167.3 | |
School Transport Assistance Scheme | | | 130.5 | | | | 134.9 | |
TransLink Transport Concessions (South East Queensland) | | | 78.1 | | | | 80.0 | |
Rail Concession Scheme | | | 36.5 | | | | 36.5 | |
Livestock and Regional Freight Contracts | | | 33.3 | | | | 33.8 | |
Other transport concessions (Regional Queensland) and taxi subsidies | | | 26.8 | | | | 26.3 | |
Commercial ship registration and licensing | | | 2.4 | | | | 4.4 | |
Designated Public Transport Concessions for Seniors Card Holders | | | 3.8 | | | | 3.8 | |
Practical Driving Test | | | 3.2 | | | | 3.2 | |
Total | | | 2,462.9 | | | | 2,667.3 | |
General Public Transport Concessions (South East Queensland)
The General Public Transport Concessions (South East Queensland) represents the direct funding contribution that Government makes towards the cost of operating public transport services within South East Queensland. This contribution effectively reduces the ticket price paid by all public transport users on bus, rail and ferry services, increasing the affordability of these services.
The General Public Transport Concessions (South East Queensland) is increasing in 2017-18 due to annual cost indexation, increased finance lease costs and availability, operator payments associated with the acquisition of new generation rollingstock and the opening of the Gold Coast Light Rail Stage 2 and the full year impact of the Fairer Fares package (2016-17 only had a half year impact).
Rail Network and Infrastructure Funding
Rail network and infrastructure funding ensures that the State supported rail network is safe, reliable and fit for purpose. The contract also provides funding to Queensland Rail to support major capital projects and related asset strategies. The funding provided via this contract directly benefits customers of the State supported rail network, including both freight and passengers. Without this funding, rail access charges (including public transport fares) would be significantly higher for all users of the rail network.
203
Budget Strategy and Outlook 2017-18
General Public Transport Concessions (Regional Queensland)
The General Public Transport Concessions (Regional Queensland) describes the financial contribution that Government provides across a range of transport services in regional Queensland. The impact of this contribution benefits all public transport users through reduced transport fares. This concession covers:
| • | | TravelTrain (excluding the ‘Rail Concession Scheme’ for eligible pensioners, veterans and seniors) |
| • | | subsidies for Kuranda Scenic Railway |
| • | | subsidies for Heritage Rail Services |
| • | | subsidies for regional bus and ferry operators (excluding concessional top up amounts and School Transport Assistance Scheme related amounts) |
| • | | subsidies for the Rail XPT Service (Sydney-Brisbane) and Savannahlander (Atherton Tableland) |
| • | | subsidies for air services to remote and rural communities within the State |
| • | | subsidies for long distance coach services to rural and remote communities within the State. |
Vehicle and boat registration concessions
Registration concessions for light and heavy motor vehicles and boats are provided to holders of the Pensioner Concession Card, Queensland Seniors Card and to those assessed by the Department of Veterans’ Affairs as meeting the necessary degree of incapacity or impairment. The concession is aimed at improving access to travel for pensioners, seniors and persons with a disability by providing a reduced rate of registration fees. For most eligible card holders, a concession for a family 4-cylinder vehicle would reduce the 12 month registration charge from $310.50 to $155.25. For a recreational boat up to and including 4.5 metres in length, the concession reduces the registration charge from $83.80 to $41.90 (based on registration charges at 1 July 2017).
A special interest vehicle (SIV) registration concession is offered for motor vehicles that have low use associated with vintage and historic and street rod car club events. A 12 month registration for a 6-cylinder SIV concession reduces registration from $491.65 to $87.50. A concession is also available for specific purposes such as water, mineral or oil exploration and bee keeping. Other motor vehicle and boat registration concessions are provided to primary producers, local governments, charitable and community service organisations, and people living in remote areas without access to the wider road network.
School Transport Assistance Scheme
The School Transport Assistance Scheme assists students that do not have a school in their local area or who are from defined low income groups with travel costs. The scheme provides funding to reduce the cost of travelling to school on bus, rail and/or ferry services, with allowances for private vehicle transport in certain circumstances. A typical concession would be to fully fund the cost of travel from home to the nearest State primary or high school where no local primary or high school is available (for example from Bargara to Bundaberg High School).
204
Budget Strategy and Outlook 2017-18
TransLink Transport Concessions (South East Queensland)
The TransLink Transport Concessions (South East Queensland) are provided by the Government to ensure access and mobility for Queenslanders who require assistance because of age, disability or fixed low income. Passengers entitled to receive public transport concessions include holders of a Pensioner Concession Card, Veterans’ Affairs Gold Card, Seniors Card (all states and territories), Companion Card, Vision Impairment Travel Pass, TPI Veteran Travel Pass, children, as well as secondary and tertiary students. In addition to these existing groups, concession groups now include Newstart and Youth Allowance (Job Seeker) recipients and asylum seekers. Under the new 2017 fares, for a peak one zone journey using a gocard, the concession reduces an adult fare from $3.20 to $1.60.
Rail Concession Scheme
The Queensland Rail Concession Scheme improves the affordability of long distance and urban rail services for eligible pensioners, veterans, seniors and current/past rail employees with 25 years of service. Assistance for long distance rail services is provided through discounted fares and free travel vouchers. For TravelTrain (long distance rail) services, depending on the service, the concession may be for free travel for up to four trips per year for Queensland pensioners (subject to availability of seats and payment of an administration fee).
Livestock and Regional Freight Contracts
The Livestock and Regional Freight Contracts provide funding to support the movement of cattle (via rail only) and freight (via road and rail) to and from regional areas of Queensland. The funding provided directly benefits the cattle industry and enables regional Queensland communities to maintain employment and directly benefits those communities who are reliant on rail freight services by reducing the cost of these freight services for users.
Other transport concessions (Regional Queensland) and taxi subsidies
Other transport concessions (Regional Queensland) and taxi subsidies are provided by the Government to ensure access and mobility for Queenslanders who require assistance because of age, disability or fixed low income. Passengers entitled to receive public transport concessions include holders of a Pensioner Concession Card, Veterans’ Affairs Gold Card, Seniors Card (all states and territories), Companion Card, Vision Impairment Travel Pass, TPI Veteran Travel Pass, children, as well as secondary and tertiary students. In addition to these existing groups, new concession groups are to include Newstart and Youth Allowance (Job Seeker) recipients and asylum seekers.
The Taxi Subsidy Scheme aims to improve the mobility of persons with severe disabilities by providing a 50% concession fare up to a maximum subsidy of $25 per trip.
205
Budget Strategy and Outlook 2017-18
Commercial ship registration and licensing
The commercial vessel safety concession is increasing as revenue received from commercial ship registration declines. This is due to issuing five year certificates of operation in 2015-16 to assist in transfer of responsibility to the national regulator; and some commercial ship owners choosing to register their vessels in other states but operating in Queensland waters. The department will continue to provide the same level of safety regulation in 2017-18 after which the Australian Maritime Safety Authority (AMSA) will provide service delivery as the national regulator.
The commercial vessel safety program including inspection standards and ship operator competency standards is funded from commercial ship registration and licensing revenue. The commercial ship registration and licensing concession represents the difference between the cost of supporting the safety of commercial vessels in Queensland waters and revenue collected via commercial registration and compliance fees. The concession represents a benefit to commercial ship owners and operators. Vessels operated by primary or secondary schools used in marine education courses, vessels owned by the emergency services department, volunteer marine rescue associations and surf lifesaving associations are generally exempt from fees. The responsibility for regulation of domestic commercial vessels is now the responsibility of AMSA. The completion of the transfer of service delivery to the national regulator has been deferred until July 2018 when AMSA will be responsible for policy setting, fee collection and service delivery.
Designated Public Transport Concessions for Seniors Card Holders
Designated Public Transport Concessions for Seniors Card Holders allows visitors from interstate, who hold a state or territory Seniors Card, to access public transport concessions within Queensland and is fully funded by the Queensland Government.
Practical Driving Test
As part of the State’s driver licensing arrangements, applicants for new licences are required to undertake a practical driving test. The total cost to pre-book driver examinations and to perform the practical driver assessment is not fully recovered by the fee charged ($50.90 (ex GST) as at 1 July 2017), providing a direct concession to applicants.
206
Budget Strategy and Outlook 2017-18
| Table A.2.11 | Department of the Premier and Cabinet |
| | | | | | | | |
Concession | | 2016-17
Est. Act.
$ million | | | 2017-18
Estimate
$ million | |
Queensland Museum - Arts concessional entry fees | | | 1.6 | | | | 1.5 | |
Queensland Performing Arts Trust - Arts concessional entry fees | | | 1.3 | | | | 1.3 | |
Queensland Art Gallery - Arts concessional entry fees | | | 0.4 | | | | 0.8 | |
Queensland Performing Arts Trust - Venue hire rebates | | | 0.6 | | | | 0.6 | |
Arts Queensland - Discount on property lease rentals | | | 0.5 | | | | 0.5 | |
Arts Queensland - Venue hire rebates | | | 0.3 | | | | 0.3 | |
Total | | | 4.7 | | | | 5.0 | |
Queensland Museum – Arts concessional entry fees
Concessional entry fees are provided to seniors, students, children, families and a variety of concession card holders for ticketed exhibitions at Queensland Museum and Sciencentre and for general entry to Cobb & Co Museum Toowoomba, The Workshops Rail Museum Ipswich, and Museum of Tropical Queensland Townsville. Concessions are also provided to targeted groups, such as schools, to encourage visits to museums. The level of concession provided varies depending on the venue and the event.
Queensland Performing Arts Trust – Arts concessional entry fees
Concessional entry fees are offered for specific Queensland Performing Arts Trust productions and to provide support for other not for profit theatre companies to enable tickets to be sold at concessional prices. The level of concession provided varies depending on the number and size of events being held each year.
Queensland Art Gallery – Arts concessional entry fees
Queensland Art Gallery’s ticket prices are set to ensure that they are affordable and to maximise attendance, with additional concessions provided to seniors, students, children, families and a variety of concession card holders. The purpose of the Queensland Art Gallery – Arts concessional entry fees concession is to contribute to the cultural, social and intellectual development of Queenslanders, and encourage diverse audiences.
Queensland Performing Arts Trust – Venue hire rebates
Venue hire rebates are offered to Government funded cultural organisations, charitable organisations, government departments and educational institutions. Organisations currently receiving discounts are Queensland Symphony Orchestra, Opera Queensland, Queensland Theatre Company and Queensland Ballet.
207
Budget Strategy and Outlook 2017-18
Arts Queensland – Discount on property lease rentals
Property lease rentals are provided to arts and cultural organisations at a discount from market rental rates at the Judith Wright Centre of Contemporary Arts, 381 Brunswick Street, Fortitude Valley and the Cairns Centre of Contemporary Arts. Discounts range from 20% to 100% of the market rate (dependent on location) of the commercial office space. Further discounts on specialist rehearsal and gallery space are given as negotiated at the time of entering the lease and dependent on the individual arts or cultural organisation and its funding.
Arts Queensland – Venue hire rebates
Venue hire rebates are provided to support Queensland funded arts organisations and professional artists to create, rehearse and present new productions at the Judith Wright Centre of Contemporary Arts and the Cairns Centre of Contemporary Arts.
| Table A.2.12 | Queensland Fire and Emergency Services |
| | | | | | | | |
Concession | | 2016-17
Est. Act.
$ million | | | 2017-18
Estimate
$ million | |
Emergency Management Levy Concession | | | 9.4 | | | | 9.9 | |
Total | | | 9.4 | | | | 9.9 | |
Emergency Management Levy Concession
The Emergency Management Levy applies to all prescribed properties within Queensland. The levy provides a funding base for emergency services including emergency management, fire and rescue services. Owners of prescribed properties who are in receipt of an Australian Government pension are eligible to receive a discount of 20% on the levy payable for a property that is their principal place of residence. In addition, community organisation owners of specified properties are exempt from payment of the levy.
208
Budget Strategy and Outlook 2017-18
| Table A.2.13 | Queensland Health |
| | | | | | | | |
Concession | | 2016-17
Est. Act.
$ million | | | 2017-18
Estimate
$ million | |
Oral Health Scheme1 | | | 167.0 | | | | 149.2 | |
Patient Travel Subsidy Scheme2 | | | 78.9 | | | | 82.7 | |
Medical Aids Subsidy Scheme3 | | | 40.9 | | | | 35.7 | |
Spectacle Supply Scheme | | | 9.1 | | | | 9.1 | |
Community Aids Equipment and Assistive Technologies Initiative and Vehicle Options Subsidy Scheme4 | | | 14.0 | | | | 8.0 | |
Total | | | 309.9 | | | | 284.7 | |
Notes:
| 1. | The decrease of $17.8 million between the 2016-17 estimated actual and the 2017-18 estimate is due to a reduction in Commonwealth funding available under the new National Partnership Agreement on Adult Public Dental Services. The 2016-17 estimated actual also includes Medicare revenue claimed directly by Hospital and Health Services under the Child Dental Benefits Schedule. |
| 2. | The Patient Travel Subsidy Scheme allocation is calculated on historical utilisation rates. The increase of $3.8 million between the 2016-17 estimated actual and 2017-18 estimate is due to expected population growth and higher utilisation of the Scheme. |
| 3. | The decrease of $5.2 million between the 2016-17 estimated actual and the 2017-18 estimate is due to funding for this activity being progressively transferred to the National Disability Insurance Scheme (NDIS). |
| 4. | The decrease of $6 million between the 2016-17 estimated actual and the 2017-18 estimate is due to funding for this activity being progressively transferred to the NDIS. |
Oral Health Scheme
The Oral Health Scheme provides free dental care to eligible clients and their dependants who possess a current Health Care Card, Pensioner Concession Card, Queensland Seniors Card or Commonwealth Seniors Card. The average value of a course of treatment for eligible clients is approximately $600 for general care, $1,800 for treatment involving dentures, and $265 for emergency dental care. In rural and remote areas where no private dental practitioner exists, access to dental care for the general public is provided at a concessional rate, generally 15% to 20% less than average private dental fees.
Patient Travel Subsidy Scheme
The Patient Travel Subsidy Scheme (PTSS) provides financial assistance to patients who need to access specialist medical services which are not available within their local area. The PTSS provides a subsidy towards the cost of travel and accommodation for patients and, in some cases, an approved escort. Patients will receive fully subsidised commercial transport if arranged by Queensland Health, or will be subsidised at the economy/government discount rate (less GST). Alternatively a subsidy of 30 cents per kilometre is paid where a private vehicle is used. The accommodation subsidy is $60 per person per night for the period the patient is required to be away from home for medical reasons and when they are not in hospital, and for their escort, if approved. A subsidy of $10 per person per night is payable to patients and approved escorts who stay in private accommodation.
209
Budget Strategy and Outlook 2017-18
Medical Aids Subsidy Scheme
The Medical Aids Subsidy Scheme provides funding assistance for the provision of a range of aids and equipment to eligible Queensland residents with permanent and stabilised conditions or disabilities. Aids and equipment are provided primarily to assist people to live at home thus avoiding premature or inappropriate residential care or hospitalisation.
Subsidies vary based on service category and clinical criteria and are provided to assist with the costs of communication aids, continence aids, daily living aids, medical grade footwear, mobility aids, orthoses and oxygen. The scheme will provide over 66,000 occasions of service to approximately 42,000 clients during 2017-18.
Spectacle Supply Scheme
The Spectacle Supply Scheme provides eligible Queensland residents with free access to a comprehensive range of basic spectacles every two years including bifocals and trifocals. Applicants must be holders of eligible concession cards and be deemed by a prescriber to have a clinical need for spectacles.
The scheme provides around 82,000 items each year to approximately 68,000 clients (some clients require more than one pair of spectacles due to clinical need). The average cost of services provided to applicants is approximately $112 per item, including the costs of administering the scheme through the Medical Aids Subsidy Scheme.
Community Aids Equipment and Assistive Technologies Initiative and Vehicle Options Subsidy Scheme
The Community Aids Equipment and Assistive Technologies Initiative (CAEATI) and Vehicle Options Subsidy Scheme (VOSS) provide financial assistance to eligible Queensland residents to support them to be more independent, participate further in social and economic opportunities in the community and contribute to a better quality of life.
CAEATI funding is capped at $10,000 per client over a three year period. CAEATI includes aids, equipment and assistive technologies for postural support, communication support, community mobility and active participation.
VOSS funding is capped at $10,000 per client over a five year period. VOSS provides subsidies for a range of vehicle access options, including the subsidy of driving lessons on a suitably modified vehicle, modifications to a vehicle, purchase of a suitably modified vehicle or vehicle suitable for modification.
To receive funding through either of these schemes, an individual must be assessed as eligible for specialist disability support under the Disability Support Act 2006. Queensland resident eligibility is determined during the intake process, and confirmed as part of the assessment process.
210
Budget Strategy and Outlook 2017-18
A.3 Concessions by entity
| Table A.3.1 | Energy Queensland |
| | | | | | | | |
Concession | | 2016-17
Est. Act.
$ million | | | 2017-18
Estimate
$ million | |
Regulated Service Charges - Energex | | | 15.6 | | | | 14.8 | |
Regulated Service Charges - Ergon | | | 7.6 | | | | 11.4 | |
Total | | | 23.2 | | | | 26.2 | |
Regulated Service Charges – Energex
Under Schedule 8 of the Electricity Regulation 2006, charges for a range of services provided by Energex Limited (Energex) to energy retailers, for example disconnection and reconnection of supply, are capped. The maximum amount Energex is able to charge for these services is, on average, less than the value which the Australian Energy Regulator ascribes to the provision of these services by Energex, resulting in a concession provided to energy retailers and in turn households.
Regulated Service Charges – Ergon
Under Schedule 8 of the Electricity Regulation 2006, service charges for a range of services provided by Ergon Energy Corporation Limited (Ergon Energy) to energy retailers, for example disconnection and reconnection of supply, are capped. The maximum amount Ergon Energy is able to charge for these services is, on average, less than the value which the Australian Energy Regulator ascribes to the provision of these services by Ergon Energy, resulting in a concession provided to energy retailers and in turn households.
| Table A.3.2 | Far North Queensland Ports Corporation Limited |
| | | | | | | | |
Concession | | 2016-17
Est. Act.
$ million | | | 2017-18
Estimate
$ million | |
Concessional Leases - Industry/Commercial | | | 0.6 | | | | 0.6 | |
Concessional Leases - Community | | | 0.2 | | | | 0.2 | |
Total | | | 0.8 | | | | 0.8 | |
Concessional Leases – Industry/Commercial
Far North Queensland Ports Corporation Limited (FNQPC) provides several leases to agricultural industry proponents at below commercial rates. FNQPC also provides leases to various community organisations at below commercial rates. The amounts shown are estimates of the revenue foregone by not charging commercial rates.
211
Budget Strategy and Outlook 2017-18
| Table A.3.3 | Gladstone Ports Corporation Limited |
| | | | | | | | |
Concession | | 2016-17
Est. Act.
$ million | | | 2017-18
Estimate
$ million | |
Concessional Port Charges | | | 51.2 | | | | 52.0 | |
Concessional Leases - Industry/Commercial | | | 2.8 | | | | 3.1 | |
Concessional Leases - Community | | | 0.8 | | | | 0.4 | |
Total | | | 54.8 | | | | 55.5 | |
Concessional Port Charges
The Gladstone Ports Corporation Limited (GPC) is subject to a number of long-term major industry contracts where port charges are significantly lower than market rates. These historical contracts were entered into to support various industries and government initiatives from time to time. The amounts shown are estimates of the revenue foregone by GPC as a result of being unable to charge commercial rates.
Concessional Leases
GPC has various land and building lease arrangements at non-commercial rates. These contracts relate to incentives to improve utilisation of port land and assets and to establish businesses within port precincts. GPC also provides support to community and not-for-profit organisations through concessional leasing arrangements. The amounts shown are estimates of the revenue foregone by not charging commercial rates.
| Table A.3.4 | North Queensland Bulk Ports Corporation Limited |
| | | | | | | | |
Concession | | 2016-17
Est. Act.
$ million | | | 2017-18
Estimate
$ million | |
Concessional Leases - Industry/Commercial | | | 1.1 | | | | 1.1 | |
Concessional Leases - Community | | | 1.5 | | | | 1.5 | |
Total | | | 2.6 | | | | 2.6 | |
Concessional Leases
North Queensland Bulk Ports (NQBP) Corporation Limited provides several long-term leases to agricultural industry proponents at below commercial rates. NQBP also provides leases to various community organisations, local councils and Government departments at below commercial rates. The amounts shown are estimates of the revenue foregone by not charging commercial rates.
212
Budget Strategy and Outlook 2017-18
| Table A.3.5 | Port of Townsville Limited |
| | | | | | | | |
Concession | | 2016-17
Est. Act.
$ million | | | 2017-18
Estimate
$ million | |
Concessional Leases - Industry/Commercial | | | 5.5 | | | | 5.6 | |
Concessional Leases - Community | | | 0.1 | | | | 0.1 | |
Total | | | 5.6 | | | | 5.7 | |
Concessional Leases
Port of Townsville Limited provides several long-term leases to agricultural industry proponents at below commercial rates. Port of Townsville Limited also provides leases to various community organisations, local councils and Government departments at below commercial rates. The amounts shown are estimates of the revenue foregone by not charging commercial rates.
| Table A.3.6 | Queensland Rail Limited |
| | | | | | | | |
Concession | | 2016-17
Est. Act.
$ million | | | 2017-18
Estimate
$ million | |
Concessional Leases - Community | | | 1.7 | | | | 1.8 | |
Total | | | 1.7 | | | | 1.8 | |
Concessional Leases – Community
Queensland Rail leases properties, typically to community organisations, at below commercial rates under the continuation of pre-existing arrangements. The properties are generally of historical significance to the local community and the lessee often undertakes beautification works on the property. The amount shown is an estimate of the revenue foregone by not charging commercial rates.
| Table A.3.7 | SunWater Limited |
| | | | | | | | |
Concession | | 2016-17
Est. Act.
$ million | | | 2017-18
Estimate
$ million | |
Water Supply Contracts | | | 58.6 | | | | 60.1 | |
Total | | | 58.6 | | | | 60.1 | |
Water Supply Contracts
SunWater Limited has a number of historic non-commercial water supply contracts that benefit specific entities, predominantly local government authorities. The future treatment of these water supply contracts is currently being considered by Government. The amount shown represents the difference between revenue and expenses under a fully costed allocation model. Currently annual price increases are limited to CPI.
213
Budget Strategy and Outlook 2017-18
| Appendix B: | Tax expenditure statement |
Context
Governments employ a range of policy tools to achieve social and economic objectives. These include the use of direct budgetary outlays, regulatory mechanisms and taxation. This Tax Expenditure Statement (TES) details revenue foregone as a result of Government decisions relating to the provision of tax exemptions or concessions. The TES is designed to improve transparency in the use of tax expenditures and increase public understanding of the fiscal process.
Tax expenditures are reductions in tax revenue that result from the use of the taxation system as a policy tool to deliver Government policy objectives. Tax expenditures are provided through a range of measures, including:
| • | | the application of reduced tax rates to certain groups or sectors of the community |
| • | | provisions which defer payment of a tax liability to a future period. |
Labelling an exemption or concession as a tax expenditure does not necessarily imply any judgement as to its appropriateness. It merely makes the amount of the exemption or concession explicit and thereby facilitates its scrutiny as part of the annual Budget process.
Methodology
Revenue foregone approach
The method used almost exclusively by governments to quantify the value of their tax expenditures is the revenue foregone approach. This method estimates the revenue foregone through use of the concession by applying the benchmark rate of taxation to the volume of activities or assets affected by the concession. One of the deficiencies of the revenue foregone approach is that the effect on taxpayer behaviour resulting from the removal of the particular tax expenditure is not factored into the estimate. Consequently, the aggregation of costings for individual tax expenditure items presented in the TES will not necessarily provide an accurate estimate of the total level of assistance provided through tax expenditures.
Measuring tax expenditures requires the identification of:
| • | | concessionally taxed components of the benchmark tax base such as a specific activity or class of taxpayer |
| • | | a benchmark tax rate to apply to the concessionally taxed components of the tax base. |
214
Budget Strategy and Outlook 2017-18
Defining the tax benchmark
The most important step in the preparation of a TES is the establishment of a benchmark for each tax included in the statement. The benchmark provides a basis against which each tax concession can be evaluated. The aim of the benchmark is to determine which concessions are tax expenditures as opposed to structural elements of the tax. The key features of a tax benchmark are:
| • | | any specific accounting conventions applicable to the tax |
| • | | the deductibility of compulsory payments |
| • | | any provisions to facilitate administration |
| • | | provisions relating to any fiscal obligations. |
By definition, tax expenditures are those tax concessions not included as part of the tax benchmark.
Identification of benchmark revenue bases and rates requires a degree of judgement and is not definitive. Furthermore, data limitations mean that the tax expenditures are approximations and are not exhaustive. This statement does not include estimates of revenue foregone from exemptions or concessions provided to Government agencies. Very small exemptions or concessions are also excluded.
The Tax Expenditure Statement
This year’s statement includes estimates of tax expenditures in 2015-16 and 2016-17 for payroll tax, land tax, duties and gambling taxes. A summary of the major tax expenditures valued on the basis of revenue foregone is presented in Table B.1. Not all expenditures can be quantified at this time. Accordingly, the total value of tax expenditures should be considered as indicative only.
215
Budget Strategy and Outlook 2017-18
| Table B.11 | Tax expenditure summary1 |
| | | | | | | | |
| | | 2015-162
$ million | | | 2016-17
$ million | |
Payroll Tax | | | | | | | | |
Exemption threshold | | | 1,369 | | | | 1,395 | |
Deduction scheme | | | 335 | | | | 332 | |
Section 14 exemptions | | | | | | | | |
Local Government | | | 139 | | | | 142 | |
Education | | | 178 | | | | 181 | |
Hospitals | | | 368 | | | | 397 | |
Total Payroll Tax | | | 2,388 | | | | 2,447 | |
Land Tax | | | | | | | | |
Liability thresholds3 | | | 596 | | | | 704 | |
Graduated land tax scale | | | 589 | | | | 653 | |
Primary production deduction | | | 83 | | | | 83 | |
Part 6 Divisions 2 and 3 exemptions not included elsewhere4 | | | 100 | | | | 102 | |
Land developers’ concession | | | 20 | | | | 20 | |
Total Land Tax | | | 1,388 | | | | 1,562 | |
Duties | | | | | | | | |
Transfer duty on residential property | | | | | | | | |
Home concession | | | 386 | | | | 401 | |
First home concession | | | 215 | | | | 216 | |
First home vacant land | | | 24 | | | | 26 | |
Insurance duty | | | | | | | | |
WorkCover | | | 54 | | | | 62 | |
Health insurance | | | 399 | | | | 421 | |
Total Duties | | | 1,079 | | | | 1,125 | |
Taxes on Gambling | | | | | | | | |
Gaming machine taxes | | | 114 | | | | 122 | |
Casino taxes | | | 9 | | | | 8 | |
Total Gambling Tax | | | 123 | | | | 130 | |
Total | | | 4,978 | | | | 5,264 | |
Notes:
| 1. | Numbers may not add due to rounding. |
| 2. | 2015-16 estimates may have been revised since the 2016-17 Budget. |
| 3. | Land tax is payable only on the value of taxable land above a threshold which depends on the ownership structure. |
| 4. | Applicable, but not limited, to religious bodies, public benevolent institutions and other exempt charitable institutions. |
216
Budget Strategy and Outlook 2017-18
Discussion of individual taxes
Payroll tax
The benchmark tax base for payroll tax is assumed to be all taxable wages, salaries and supplements (including employer superannuation contributions) paid in Queensland, as defined in the Payroll Tax Act 1971. The benchmark tax rate for payroll tax is assumed to be the statutory rate applying in each financial year.
Payroll tax exemption threshold
Employers who employ in Queensland with an annual Australian payroll of $1.1 million or less are exempt from payroll tax. On the basis of 2015-16 average weekly earnings, this threshold corresponded to approximately 14 full-time equivalent employees. This exemption is designed to assist small and medium sized businesses.
Deduction scheme
Employers who employed in Queensland with Australian payrolls between $1.1 million and $5.5 million benefited from a deduction of $1.1 million, which reduced by $1 for every $4 by which the annual payroll exceeded $1.1 million. The deduction is pro-rated for interstate wages. There was no deduction for employers or groups that had an annual payroll in excess of $5.5 million.
Section 14 exemptions
A number of organisations are provided with exemptions from payroll tax under Section 14 of the Payroll Tax Act 1971. The activities for which estimates have been calculated are wages paid by public hospitals, non-tertiary private educational institutions and local governments (excluding commercial activities).
Land tax
The benchmark tax base is assumed to be all freehold land within Queensland, excluding residential land used as a principal place of residence and land owned by individuals with a value for that year below the threshold. The benchmark tax rate for land tax is assumed to be the top rate of land tax applicable in Queensland in each financial year.
Liability thresholds
Land tax is payable on the value of taxable land equal to or above a threshold which depends on the land’s ownership. The threshold for companies, trusts and absentees is $350,000 and for resident individuals the threshold is $600,000.
Land owned by resident individuals as their principal place of residence is excluded from the estimate. The exemption from paying below a minimum amount is not included as a tax expenditure as it is regarded as the application of an administration threshold.
217
Budget Strategy and Outlook 2017-18
Graduated land tax scale
A graduated (concessional) scale of land tax rates is applicable to land with a taxable value of less than $5 million for resident individuals and companies, trustees and absentees. The benchmark rates used for estimating the tax expenditures were 1.75% for individuals and 2.0% for companies, trustees and absentees.
Primary production deduction
The taxable value of land owned by a resident individual, trustee or some absentees and companies does not include all or part of their land that is used for the business of agriculture, pasturage or dairy farming.
Part 6 Divisions 2 and 3 exemptions (not elsewhere included)
A number of land tax exemptions are granted in Part 6 Divisions 2 and 3 of the Land Tax Act 2010 to eligible organisations. These include, but are not limited to, public benevolent institutions, religious institutions and other exempt charitable institutions, retirement villages, trade unions and showgrounds.
Land developers’ concession
Land tax payable by land developers is calculated on the basis that the unimproved value of (undeveloped) land subdivided in the previous financial year and which remains unsold at 30 June of that year is 60% of the Valuer-General’s value. This concession is outlined in Section 30 of the Land Tax Act 2010.
Duties
Home concession
A concessional rate of duty applies to purchases of a principal place of residence. A 1% concessional rate applies on dutiable values up to $350,000, rather than the normal schedule of rates between 1.5% and 3.5%. For properties valued over $350,000, the scheduled rates of transfer duty apply on the excess.
First home concession
Where a purchaser has not previously owned a residence in Queensland or elsewhere, the purchaser of a home receives a more generous concession on duty. This concession comprises a rebate in addition to the home concession on properties (this concession may not be applicable if the purchase price is less than the full market value of the property). The size of the rebate depends on the value of the property. A full concession is provided to purchases of a first principal place of residence valued up to $500,000.
218
Budget Strategy and Outlook 2017-18
First home vacant land concession
A first home concession is available for the purchase of certain vacant land up to the value of $400,000, with a full concession available on certain vacant land up to the value of $250,000.
Insurance duty
The benchmark tax base is assumed to be all premiums for general insurance policies (not for life insurance). The benchmark tax scale is assumed to be the scale that actually applied in each financial year.
Gambling taxes
Gaming machine tax concessions for licensed clubs
The benchmark tax base is assumed to be all gaming machines operated by licensed clubs and hotels in Queensland. The benchmark tax rate is assumed to be the highest marginal tax rate (as is applied to hotels) that actually applied in each financial year.
A progressive tax rate scale applies to gaming machines operated by licensed clubs. The tax rate is calculated monthly on the gaming machine taxable metered win and the top tax rate is only applied to the portion of gaming machine revenue where the monthly metered win exceeds $1.4 million for any licensed club.
Casino tax concessions
The benchmark tax base is assumed to be all casinos operating in Queensland. The benchmark tax rate is assumed to be the highest tax rate that is actually applied in each financial year.
A tax rate of 20% of gross revenue applies for standard transactions in the Brisbane and Gold Coast casinos. A concessional tax rate of 10% applies for gross revenue from standard transactions in the Cairns and Townsville casinos. The tax rate applicable to gaming machines in casinos is 30% of gross revenue in the Brisbane and Gold Coast casinos and 20% in the Cairns and Townsville casinos.
In addition concessional rates of 10% also apply for revenue from high rollers in all casinos. A goods and services tax (GST) credit is provided to casinos that approximates a reduction in the above tax rates of 9.09%
219
Budget Strategy and Outlook 2017-18
| Appendix C: | Revenue and expense assumptions and sensitivity analysis |
The Queensland Budget, like those of other jurisdictions, is based in part on assumptions made about parameters that are uncertain, both internal and external to the State, which can impact directly on economic and fiscal forecasts.
This appendix outlines the assumptions underlying the revenue and expense estimates and analyses the sensitivity of the estimates to changes in the economic and other assumptions. This analysis is provided to enhance the level of transparency and accountability of the Government.
The forward estimates in the Budget are framed on a no policy change basis. That is, the expenditure and revenue policies in place at the time of the Budget (including those announced in the Budget) are applied consistently throughout the forward estimates period.
The following discussion provides details of some of the key assumptions, estimates and risks associated with revenue and expenditure and, where a direct link can be established, the indicative impact on forecasts resulting from a movement in those variables.
220
Budget Strategy and Outlook 2017-18
Taxation and royalty revenue
| Table C.1 | Taxation and royalty revenue1 |
| | | | | | | | | | | | | | | | | | | | | | | | |
| | | 2015-16
Actual
$ million | | | 2016-17
Est. Act.
$ million | | | 2017-18
Budget
$ million | | | 2018-19
Projection
$ million | | | 2019-20
Projection
$ million | | | 2020-21
Projection
$ million | |
Payroll tax | | | 3,712 | | | | 3,667 | | | | 3,819 | | | | 4,057 | | | | 4,328 | | | | 4,615 | |
Transfer duty | | | 3,005 | | | | 3,327 | | | | 3,190 | | | | 3,367 | | | | 3,580 | | | | 3,813 | |
Other duties | | | 1,340 | | | | 1,409 | | | | 1,488 | | | | 1,562 | | | | 1,639 | | | | 1,721 | |
Gambling taxes and levies | | | 1,138 | | | | 1,131 | | | | 1,181 | | | | 1,233 | | | | 1,287 | | | | 1,344 | |
Land tax | | | 1,010 | | | | 1,086 | | | | 1,192 | | | | 1,274 | | | | 1,358 | | | | 1,441 | |
Motor vehicle registration | | | 1,633 | | | | 1,676 | | | | 1,741 | | | | 1,809 | | | | 1,877 | | | | 1,948 | |
Other taxes | | | 709 | | | | 648 | | | | 687 | | | | 730 | | | | 774 | | | | 825 | |
Total taxation revenue | | | 12,547 | | | | 12,945 | | | | 13,298 | | | | 14,031 | | | | 14,843 | | | | 15,707 | |
Royalties | | | | | | | | | | | | | | | | | | | | | | | | |
Coal | | | 1,705 | | | | 3,376 | | | | 2,750 | | | | 2,241 | | | | 2,222 | | | | 2,260 | |
Petroleum2 | | | 36 | | | | 97 | | | | 147 | | | | 194 | | | | 248 | | | | 296 | |
Other royalties3 | | | 381 | | | | 365 | | | | 402 | | | | 426 | | | | 441 | | | | 435 | |
Land rents | | | 162 | | | | 167 | | | | 172 | | | | 178 | | | | 184 | | | | 189 | |
Total royalties and land rents | | | 2,284 | | | | 4,005 | | | | 3,472 | | | | 3,039 | | | | 3,096 | | | | 3,180 | |
Notes:
| 1. | Numbers may not add due to rounding. |
| 2. | Includes impact of liquefied natural gas (LNG). |
| 3. | Includes base and precious metals and other mineral royalties. |
221
Budget Strategy and Outlook 2017-18
Taxation revenue assumptions and revenue risks
The rate of growth in tax revenues is dependent on a range of factors that are linked to the rate of growth in economic activity in the State. Some taxes are closely related to activity in specific sectors of the economy, whilst others are broadly related to the general rate of economic growth, employment, inflation and wages. A change in the level of economic activity, resulting from economic growth differing from forecast levels, would impact upon a broad range of taxation receipts.
Wages and employment growth – payroll tax collections
Wages and employment growth have a direct impact on payroll tax collections. The Budget assumptions are for an increase in wages of 2 1⁄4% and an increase in employment of 1% in 2017-18. The composition of the payroll tax base is also important. For example, the rate of growth in payroll tax is expected to be lower as businesses in fast growing sectors such as tourism, retail and hospitality are often outside the tax base because they are below the threshold. A one percentage point variation in either Queensland wages growth or employment would change payroll tax collections by approximately $38 million in 2017-18.
Transfer duty estimates
Transfer duty collections in 2017-18 are expected to decrease by 4.1% on the 2016-17 estimated actual due to strong growth of 10.7% in 2016-17, support by a number of one-off large commercial transactions.
Across the forward estimates period, moderate growth in residential and non-residential transfer duty, supported by a pipeline of construction works should support growth in transfer duty collections.
A one percentage point variation in either the average value of property transactions or the volume of transactions would change transfer duty collections by approximately $32 million in 2017-18.
222
Budget Strategy and Outlook 2017-18
Royalty assumptions and revenue risks
| Table C.2 | Coal royalty assumptions |
| | | | | | | | | | | | | | | | | | | | |
| | | 2016-17 | | | 2017-18 | | | 2018-19 | | | 2019-20 | | | 2020-21 | |
| | | Est. Act.
$ million | | | Budget
$ million | | | Projection
$ million | | | Projection
$ million | | | Projection
$ million | |
Tonnages - crown export1 | | | 201 | | | | 207 | | | | 216 | | | | 225 | | | | 229 | |
Exchange rate US$ per A$2 | | | 0.75 | | | | 0.75 | | | | 0.75 | | | | 0.75 | | | | 0.75 | |
Year average coal prices (US$ per tonne)3 | | | | | | | | | | | | | | | | | | | | |
Hard coking | | | 192 | | | | 131 | | | | 116 | | | | 115 | | | | 115 | |
Semi-soft | | | 139 | | | | 112 | | | | 97 | | | | 91 | | | | 90 | |
Thermal | | | 66 | | | | 78 | | | | 70 | | | | 68 | | | | 67 | |
Year average oil price | | | | | | | | | | | | | | | | | | | | |
Brent (US$ per barrel) | | | 50 | | | | 55 | | | | 57 | | | | 59 | | | | 61 | |
Notes:
| 1. | Excludes coal produced for domestic consumption and coal where royalties are not paid to the Government, i.e. private royalties. 2017-18 estimate for domestic coal volume is approximately 24.9 Mt and private coal is 9.5 Mt. |
| 3. | Price for highest quality coking and thermal coal. Lower quality coal can be sold below this price with indicative average prices for 2017-18 as follows: Hard coking US$126 and thermal US$72. |
Royalty Assumptions
Table C.2 provides the 2017-18 Budget assumptions regarding coal royalties, which represent the bulk of Queensland’s royalty revenue.
Exchange rate and commodity prices and volumes – royalties estimates
Estimates of mining royalties are sensitive to movements in the A$-US$ exchange rate and commodity prices and volumes. Contracts for the supply of commodities are generally written in US dollars. Accordingly, a change in the exchange rate impacts on the Australian dollar price of commodities and therefore expected royalties collections.
Coal
For each one cent movement in the A$-US$ exchange rate, the impact on royalty revenue would be approximately $49 million in 2017-18.
A 1% variation in export coking and thermal coal volumes would lead to a change in royalty revenue of approximately $23 million.
A 1% variation in the average price of export coal would lead to a change in royalty revenue of approximately $37 million.
223
Budget Strategy and Outlook 2017-18
Parameters influencing Australian Government GST payments to Queensland
The Queensland Budget incorporates estimates of GST revenue grants to Queensland based on Australian Government estimates of national GST collections and Queensland Treasury assumptions of Queensland’s share. The estimates of collections are primarily determined by the value of consumption subject to GST.
Since the Australian Government payments are based on the amount actually collected, it is Queensland’s Budget that bears the risks of fluctuations in GST collections. As with all other tax estimates, there is a risk of lower collections than estimated if economic growth and consumption are weaker than expected.
Due to the complexities associated with the GST base, the information provided in the Australian Government Budget Papers is not sufficient to prepare indicative forecasts of the sensitivity of GST estimates to key variables.
Sensitivity of expenditure estimates and expenditure risks
Public sector wage costs
Salaries and wages form a large proportion of General Government Sector operating expenses. Increases in salaries and wages are negotiated through enterprise bargaining agreements.
The 2017-18 Budget and forward estimates includes funding for wage increases as per existing agreements and reflect the Government’s wages policy where outcomes are yet to be finalised.
A general 1% increase in wage outcomes in a particular year would increase expenses by around $220 million in that year. The impact would compound and be much larger in the later years.
Interest rates
The General Government Sector has a total debt servicing cost estimated at $1.706 billion in 2017-18. The current average duration of General Government Sector debt is just over 5.5 years. The majority of General Government Sector debt is held under fixed interest rates and therefore the impact of interest rate variations on debt servicing costs in 2017-18 would be relatively modest, with the impact occurring progressively across the forward estimates.
Actuarial estimates of superannuation and long service leave
Liabilities for superannuation and long service leave are estimated by the State Actuary with reference to, among other things, assumed rates of investment returns, salary growth, inflation and discount rate. These liabilities are therefore subject to changes in these parameters. Similarly, the long service leave liabilities are subject to the risk that the actual rates of employee retention will vary from those assumed in the liability calculation.
224
Budget Strategy and Outlook 2017-18
| Appendix D: | Fiscal aggregates and indicators |
Table D.1 Key Fiscal Aggregates1
| | | | | | | | | | | | | | | | | | | | | | | | | | | | | | | | | | | | | | | | | | | | | | | | |
| | | 2009-10 | | | 2010-11 | | | 2011-12 | | | 2012-13 | | | 2013-14 | | | 2014-15 | | | 2015-16 | | | 2016-17 | | | 2017-18 | | | 2018-19 | | | 2019-20 | | | 2020-21 | |
| | | Actual | | | Actual | | | Actual | | | Actual | | | Actual | | | Actual | | | Actual | | | Revised | | | Projection | | | Projection | | | Projection | | | Projection | |
| | | $ million | | | $ million | | | $ million | | | $ million | | | $ million | | | $ million | | | $ million | | | $ million | | | $ million | | | $ million | | | $ million | | | $ million | |
General Government | | | | | | | | | | | | | | | | | | | | | | | | | | | | | | | | | | | | | | | | | | | | | | | | |
Total revenue | | | 39,727 | | | | 42,013 | | | | 45,801 | | | | 41,755 | | | | 46,705 | | | | 49,970 | | | | 50,995 | | | | 56,434 | | | | 55,869 | | | | 56,138 | | | | 57,887 | | | | 58,982 | |
Tax revenue | | | 9,375 | | | | 9,981 | | | | 10,608 | | | | 10,937 | | | | 11,840 | | | | 12,598 | | | | 12,547 | | | | 12,945 | | | | 13,298 | | | | 14,031 | | | | 14,843 | | | | 15,707 | |
Total expenses | | | 39,599 | | | | 43,479 | | | | 46,028 | | | | 46,313 | | | | 46,217 | | | | 49,551 | | | | 50,025 | | | | 53,610 | | | | 55,723 | | | | 56,021 | | | | 57,183 | | | | 58,574 | |
Employee expenses | | | 15,566 | | | | 16,826 | | | | 18,250 | | | | 18,130 | | | | 17,816 | | | | 18,592 | | | | 20,044 | | | | 21,203 | | | | 22,420 | | | | 22,724 | | | | 23,696 | | | | 24,561 | |
Net operating balance | | | 128 | | | | (1,466 | ) | | | (226 | ) | | | (4,558 | ) | | | 488 | | | | 420 | | | | 970 | | | | 2,824 | | | | 146 | | | | 117 | | | | 704 | | | | 408 | |
Capital purchases | | | 8,959 | | | | 8,237 | | | | 7,971 | | | | 7,001 | | | | 6,323 | | | | 4,635 | | | | 4,092 | | | | 4,416 | | | | 5,123 | | | | 6,471 | | | | 7,015 | | | | 6,462 | |
Net capital purchases | | | 6,665 | | | | 5,583 | | | | 5,241 | | | | 3,389 | | | | 3,087 | | | | 992 | | | | 1,431 | | | | 1,956 | | | | 2,508 | | | | 4,063 | | | | 3,429 | | | | 2,904 | |
Fiscal balance | | | (6,537 | ) | | | (7,049 | ) | | | (5,467 | ) | | | (7,947 | ) | | | (2,599 | ) | | | (572 | ) | | | (461 | ) | | | 868 | | | | (2,363 | ) | | | (3,946 | ) | | | (2,725 | ) | | | (2,496 | ) |
Borrowings | | | 15,916 | | | | 24,593 | | | | 29,517 | | | | 37,878 | | | | 41,369 | | | | 43,105 | | | | 35,486 | | | | 33,937 | | | | 33,758 | | | | 36,393 | | | | 38,760 | | | | 41,244 | |
Net debt | | | (13,354 | ) | | | (9,542 | ) | | | (5,720 | ) | | | 2,399 | | | | 5,208 | | | | 5,749 | | | | 654 | | | | 297 | | | | 1,622 | | | | 5,748 | | | | 8,960 | | | | 11,318 | |
| | | | | | | | | | | | |
Non-Financial Public Sector | | | | | | | | | | | | | | | | | | | | | | | | | | | | | | | | | | | | | | | | | | | | | | | | |
Total revenue | | | 47,883 | | | | 49,040 | | | | 52,307 | | | | 49,181 | | | | 53,502 | | | | 56,178 | | | | 57,608 | | | | 64,373 | | | | 63,066 | | | | 63,554 | | | | 65,435 | | | | 66,858 | |
Capital purchases | | | 15,007 | | | | 13,306 | | | | 11,980 | | | | 10,774 | | | | 9,313 | | | | 7,813 | | | | 6,900 | | | | 6,899 | | | | 7,989 | | | | 9,529 | | | | 10,009 | | | | 9,453 | |
Borrowings | | | 51,713 | | | | 53,708 | | | | 61,542 | | | | 69,086 | | | | 72,637 | | | | 75,233 | | | | 72,922 | | | | 73,102 | | | | 71,989 | | | | 74,978 | | | | 77,720 | | | | 81,148 | |
Notes:
| 1. | Bracketed numbers represent negative amounts. |
225
Budget Strategy and Outlook 2017-18
Table D.2 Key Fiscal Indicators1
| | | | | | | | | | | | | | | | | | | | | | | | | | | | | | | | | | | | | | | | | | | | | | | | |
| | | 2009-10 | | | 2010-11 | | | 2011-12 | | | 2012-13 | | | 2013-14 | | | 2014-15 | | | 2015-16 | | | 2016-17 | | | 2017-18 | | | 2018-19 | | | 2019-20 | | | 2020-21 | |
| | | Actual | | | Actual | | | Actual | | | Actual | | | Actual | | | Actual | | | Actual | | | Revised | | | Projection | | | Projection | | | Projection | | | Projection | |
| | | % | | | % | | | % | | | % | | | % | | | % | | | % | | | % | | | % | | | % | | | % | | | % | |
General Government | | | | | | | | | | | | | | | | | | | | | | | | | | | | | | | | | | | | | | | | | | | | | | | | |
Revenue/GSP | | | 15.7 | | | | 15.6 | | | | 15.8 | | | | 14.4 | | | | 15.5 | | | | 16.2 | | | | 16.1 | | | | 16.0 | | | | 15.2 | | | | 14.8 | | | | 14.5 | | | | 14.0 | |
Tax/GSP | | | 3.7 | | | | 3.7 | | | | 3.7 | | | | 3.8 | | | | 3.9 | | | | 4.1 | | | | 4.0 | | | | 3.7 | | | | 3.6 | | | | 3.7 | | | | 3.7 | | | | 3.7 | |
Own source revenue/GSP | | | 7.7 | | | | 8.1 | | | | 8.0 | | | | 8.1 | | | | 8.3 | | | | 8.6 | | | | 8.6 | | | | 8.1 | | | | 7.7 | | | | 7.5 | | | | 7.3 | | | | 7.1 | |
Expenses/GSP | | | 15.7 | | | | 16.1 | | | | 15.9 | | | | 15.9 | | | | 15.4 | | | | 16.1 | | | | 15.8 | | | | 15.2 | | | | 15.2 | | | | 14.8 | | | | 14.3 | | | | 13.9 | |
Employee expenses/GSP | | | 6.2 | | | | 6.2 | | | | 6.3 | | | | 6.2 | | | | 5.9 | | | | 6.0 | | | | 6.3 | | | | 6.0 | | | | 6.1 | | | | 6.0 | | | | 5.9 | | | | 5.8 | |
Net operating balance/GSP | | | 0.1 | | | | (0.5 | ) | | | (0.1 | ) | | | (1.6 | ) | | | 0.2 | | | | 0.1 | | | | 0.3 | | | | 0.8 | | | | 0.0 | | | | 0.0 | | | | 0.2 | | | | 0.1 | |
Capital purchases/GSP | | | 3.5 | | | | 3.1 | | | | 2.8 | | | | 2.4 | | | | 2.1 | | | | 1.5 | | | | 1.3 | | | | 1.2 | | | | 1.4 | | | | 1.7 | | | | 1.8 | | | | 1.5 | |
Net cash inflows from operating activities/Net cash flows from investments in non-financial assets | | | 38.7 | | | | 26.3 | | | | 36.3 | | | | (40.8 | ) | | | 45.8 | | | | 97.5 | | | | 122.6 | | | | 125.7 | | | | 59.4 | | | | 48.3 | | | | 47.4 | | | | 55.0 | |
Fiscal balance/GSP | | | (2.6 | ) | | | (2.6 | ) | | | (1.9 | ) | | | (2.7 | ) | | | (0.9 | ) | | | (0.2 | ) | | | (0.1 | ) | | | 0.2 | | | | (0.6 | ) | | | (1.0 | ) | | | (0.7 | ) | | | (0.6 | ) |
Borrowings/GSP | | | 6.3 | | | | 9.1 | | | | 10.2 | | | | 13.0 | | | | 13.7 | | | | 14.0 | | | | 11.2 | | | | 9.6 | | | | 9.2 | | | | 9.6 | | | | 9.7 | | | | 9.8 | |
Borrowings/revenue | | | 40.1 | | | | 58.5 | | | | 64.4 | | | | 90.7 | | | | 88.6 | | | | 86.3 | | | | 69.6 | | | | 60.1 | | | | 60.4 | | | | 64.8 | | | | 67.0 | | | | 69.9 | |
| | | | | | | | | | | | |
Revenue growth | | | 7.1 | | | | 5.8 | | | | 9.0 | | | | (8.8 | ) | | | 11.9 | | | | 7.0 | | | | 2.1 | | | | 10.7 | | | | (1.0 | ) | | | 0.5 | | | | 3.1 | | | | 1.9 | |
Tax growth | | | 5.7 | | | | 6.5 | | | | 6.3 | | | | 3.1 | | | | 8.3 | | | | 6.4 | | | | (0.4 | ) | | | 3.2 | | | | 2.7 | | | | 5.5 | | | | 5.8 | | | | 5.8 | |
Expenses growth | | | 6.7 | | | | 9.8 | | | | 5.9 | | | | 0.6 | | | | (0.2 | ) | | | 7.2 | | | | 1.0 | | | | 7.2 | | | | 3.9 | | | | 0.5 | | | | 2.1 | | | | 2.4 | |
Employee expenses growth | | | 8.8 | | | | 8.1 | | | | 8.5 | | | | (0.7 | ) | | | (1.7 | ) | | | 4.4 | | | | 7.8 | | | | 5.8 | | | | 5.7 | | | | 1.4 | | | | 4.3 | | | | 3.6 | |
| | | | | | | | | | | | |
Non-Financial Public Sector | | | | | | | | | | | | | | | | | | | | | | | | | | | | | | | | | | | | | | | | | | | | | | | | |
Capital purchases/GSP | | | 5.9 | | | | 4.9 | | | | 4.1 | | | | 3.7 | | | | 3.1 | | | | 2.5 | | | | 2.2 | | | | 2.0 | | | | 2.2 | | | | 2.5 | | | | 2.5 | | | | 2.2 | |
Borrowings/GSP | | | 20.4 | | | | 19.9 | | | | 21.3 | | | | 23.8 | | | | 24.1 | | | | 24.4 | | | | 23.1 | | | | 20.7 | | | | 19.6 | | | | 19.7 | | | | 19.4 | | | | 19.3 | |
Borrowings/revenue | | | 108.0 | | | | 109.5 | | | | 117.7 | | | | 140.5 | | | | 135.8 | | | | 133.9 | | | | 126.6 | | | | 113.6 | | | | 114.1 | | | | 118.0 | | | | 118.8 | | | | 121.4 | |
Net financial liabilities2/revenue | | | 112.5 | | | | 96.2 | | | | 115.6 | | | | 133.4 | | | | 129.8 | | | | 125.2 | | | | 127.1 | | | | 111.2 | | | | 114.0 | | | | 118.3 | | | | 118.6 | | | | 119.2 | |
Notes:
| 1. | Bracketed numbers represent negative amounts. |
| 2. | UPF definition, which is equal to total financial assets less investments in other public sector entities less total liabilities. |
226
Queensland Budget 2017-18 Budget Strategy and Outlook Budget Paper No. 2
Queensland Budget 2017-18
Budget Strategy and Outlook Budget Paper No. 2
Queensland Budget 2017-18
CAPITAL STATEMENT
Budget Paper No. 3
2017-18 Queensland Budget Papers
1. Budget Speech
2. Budget Strategy and Outlook
3. Capital Statement
4. Budget Measures
5. Service Delivery Statements
Appropriation Bills
Budget Highlights
© Crown copyright
All rights reserved
Queensland Government 2017
Excerpts from this publication may be reproduced, with appropriate
acknowledgement, as permitted under the Copyright Act.
Capital Statement
Budget Paper No. 3
ISSN 1445-4890 (Print)
ISSN 1445-4904 (Online)

State Budget
2017-18
Capital Statement
Budget Paper No. 3
Contents
| | | | | | |
| 1 | | Approach and highlights | | | 1 | |
| | |
| 1.1 | | Introduction | | | 1 | |
| 1.2 | | Capital planning and prioritisation | | | 2 | |
| 1.3 | | Innovative funding and financing | | | 3 | |
| 1.4 | | Key projects | | | 9 | |
| 1.5 | | Highlights by Asset Class | | | 13 | |
| | |
| 2 | | 2017-18 Capital Program overview | | | 19 | |
| | |
| 2.1 | | Capital purchases | | | 20 | |
| 2.2 | | Capital grants | | | 24 | |
| 2.3 | | Changes to forecast delivery of 2016-17 Capital Program | | | 28 | |
| | |
| 3 | | Capital outlays by entity | | | 29 | |
| | |
| 3.1 | | Aboriginal and Torres Strait Islander Partnerships | | | 29 | |
| 3.2 | | Agriculture and Fisheries | | | 30 | |
| 3.3 | | Communities, Child Safety and Disability Services | | | 32 | |
| 3.4 | | Education and Training | | | 35 | |
| 3.5 | | Electoral Commission of Queensland | | | 44 | |
| 3.6 | | Energy and Water Supply | | | 45 | |
| 3.7 | | Environment and Heritage Protection | | | 63 | |
| 3.8 | | Housing and Public Works | | | 65 | |
| 3.9 | | Infrastructure, Local Government and Planning | | | 70 | |
| 3.10 | | Justice and Attorney-General | | | 75 | |
| 3.11 | | Legislative Assembly of Queensland | | | 80 | |
| 3.12 | | National Parks, Sport and Racing | | | 81 | |
| 3.13 | | Natural Resources and Mines | | | 85 | |
| 3.14 | | Premier and Cabinet | | | 87 | |
| 3.15 | | Public Safety Business Agency | | | 91 | |
| | | | | | |
| 3.16 | | Queensland Fire and Emergency Services | | | 97 | |
| 3.17 | | Queensland Health | | | 99 | |
| 3.18 | | Queensland Police Service | | | 110 | |
| 3.19 | | Queensland Treasury | | | 111 | |
| 3.20 | | Science, Information Technology and Innovation | | | 113 | |
| 3.21 | | State Development | | | 116 | |
| 3.22 | | Tourism, Major Events, Small Business and the Commonwealth Games | | | 117 | |
3.23 | | Transport and Main Roads | | | 119 | |
| | | | | | |
| Appendix A: | | Entities included in capital outlays 2017-18 | | | 138 | |
| | |
| Appendix B: | | Key concepts and coverage | | | 141 | |
| | |
| Appendix C: | | Capital Purchases by Entity by Region 2017-18 | | | 142 | |
Capital Statement 2017-18
The capital statement provides an overview of the Queensland Government’s approach to capital planning and delivery and the capital program for 2017-18. The capital program is focused on growing the Queensland economy through job-creating investment, infrastructure and innovation across the state. Queensland Treasury estimates that capital expenditure in 2017-18 will directly support around 29,000 full-time jobs. In total, the 2017-18 Budget will directly support around 40,000 jobs in 2017-18, predominantly in the private sector, while continuing to create jobs and improve employment outcomes for all Queenslanders into the future.
The Queensland Government has an important role in providing essential infrastructure and capital works to meet the state’s increasing service needs and to promote increased productivity and efficiency for the state’s industries. The Queensland Government also recognises that building infrastructure benefits local communities, strengthens local economies and supports local jobs.
Non-financial Public Sector capital expenditure totals $10.171 billion for 2017-18, which comprises $8.608 billion of purchases of non-financial assets (PNFA) and acquisitions of non-financial assets under finance leases, and $1.563 billion of capital grants expenses.
The government will invest $3.885 billion on roads and transport infrastructure in 2017-18. In addition, there will be significant investments in health, education and housing to address population growth and improve productivity and prosperity.
Each year, part of the Queensland Government’s capital program is undertaken through the Public Non-financial Corporations (PNFC) sector (that is, commercial entities of government, including government-owned corporations). For 2017-18, capital purchases by the PNFC sector will comprise 35.9 per cent of the state capital program, reflecting major investments in port and rail infrastructure and the energy sector.
The Infrastructure Portfolio Office (IPO) within the Department of Infrastructure, Local Government, and Planning in conjunction with Queensland Treasury have been working with agencies to improve the profiling of their capital program over the forward estimates. While the total capital program has not reduced, the 2017-18 year is lower than forecast previously as project expenditure has been re-profiled over the forward estimates. The 2016-17 budget estimate was $40.836 billion over the forward estimates. The 2017-18 budget estimate over the forward estimates is $42.750 billion.
The government has committed to fully fund and deliver Cross River Rail. In addition to funding previously set aside, the Queensland Government has allocated a further $1.952 billion over the forward estimates. In future Budgets, the Queensland Government will allocate a further $2.597 billion over the period 2021-22 to 2023-24. This ensures the $5.409 billion required for delivery is fully committed. While this delivers certainty of funding, it is expected that the cost to the state will be reduced through future Australian Government contributions and the proceeds of commercial funding sources, such as the development of government land around stations.
1
Capital Statement 2017-18
| 1.2 | Capital planning and prioritisation |
| 1.2.1 | State Infrastructure Plan |
Released in March 2016, the State Infrastructure Plan (SIP) provides a clear vision for planning, investment and delivery of infrastructure in Queensland. The SIP underpins the government’s commitment to support jobs and the economy, by ensuring the state is investing in the right infrastructure, in the right place and at the right time. The implementation of the SIP is led by the IPO within the Department of Infrastructure, Local Government and Planning.
The Infrastructure Cabinet Committee (ICC) continues its focus on infrastructure coordination and development, monitoring the implementation of the SIP and the whole-of-government capital expenditure program and makes recommendations to Cabinet on infrastructure matters.
The 2017 SIP Part B update will align with the 2017-18 State Budget and reflect the government’s current capital investment program. The 2017 SIP Part B update will also highlight how infrastructure proposals mature from early concept to a funded government project by moving through various planning and investment decision phases.
Building Queensland is a statutory body established under the Building Queensland Act 2015 that provides independent expert advice to Queensland Government departments, government-owned corporations and selected statutory authorities to enable better infrastructure decisions.
Building Queensland develops an infrastructure pipeline of priority projects every six months to assist Government’s decisions for major infrastructure. The pipeline identifies unfunded priority proposals that Building Queensland recommends for further development or investment consideration.
Building Queensland also assists agencies with pre-business case activities, and assists or leads the development of business cases for infrastructure proposals across government. Building Queensland has completed detailed business cases for the following projects:
| • | | European Train Control System |
| • | | Beerburrum to Nambour Rail Upgrade |
| • | | The Smithfield Transport Corridor Upgrade. |
In addition, Building Queensland has completed the preliminary business cases for the Nullinga Dam Project and the Clinton Vessel Interaction Project.
Detailed business cases currently underway include the following:
| • | | Arthur Gorrie Correctional Centre |
| • | | Lower Fitzroy River Water Infrastructure Project |
| • | | Townsville Eastern Access Rail Corridor |
| • | | Public Safety Regional Radio Communications. |
2
Capital Statement 2017-18
| 1.3 | Innovative funding and financing |
| 1.3.1 | State Infrastructure Fund |
The $2.2 billion State Infrastructure Fund was established to boost infrastructure investment, increase business confidence and to fund priorities in both the State Infrastructure Plan and Building Queensland’s Infrastructure Pipeline. Table 1 shows the programs within the State Infrastructure Fund.
The components of the funding package are:
| • | | $300 million for the Priority Economic Works and Productivity Program (PEWPP). Funding has been allocated to the Department of Transport and Main Roads and Queensland Rail to deliver seven high priority transport projects. Located around Queensland, these projects will be progressively delivered through to December 2020. |
| • | | $180 million for the Significant Regional Infrastructure Projects Program (SRIPP) is now delivering 25 significant social and economic infrastructure projects or programs in key regional centres across Queensland, and all projects are forecast for completion by end of June 2019. |
| • | | $20 million Maturing the Infrastructure Pipeline Program (MIPP) to review the 141 ‘proposals raised through consultation’ and 92 ‘future opportunities’ identified in the 2016 SIP Part B – progress will be reported in the 2017 SIP Part B update. In 2017-18, strategic assessments and preliminary evaluations will be undertaken of new infrastructure proposals submitted by local governments in late 2016. |
| • | | $800 million allocated towards the delivery of Cross River Rail and a further $50 million to establish the Cross River Rail Delivery Authority. These allocations for Queensland’s number one infrastructure project align with the government’s priorities to attract investment, build infrastructure and grow innovation. More information on the government’s commitment to the delivery of Cross River Rail is outlined in section 1.4 Key projects of this document. |
| • | | $200 million for the first stage of the Works for Queensland (W4Q) program that was funded in the Mid-Year Fiscal and Economic Review (MYFER) 2016-17. This stage of the program prioritises regional areas outside South East Queensland which are experiencing higher unemployment rates. The program is delivering jobs through priority maintenance and minor infrastructure works for 65 local governments across Queensland. |
| Table 1 | State Infrastructure Fund |
| | | | |
Program | | Total
$ million | |
Maturing the Infrastructure Pipeline | | | 20 | |
Priority Economic Works and Productivity Program | | | 300 | |
Significant Regional Infrastructure Projects Program | | | 180 | |
Works for Queensland | | | 200 | |
Cross River Rail | | | 850 | |
Future Projects1 | | | 650 | |
| | | | |
State Infrastructure Fund Total | | | 2,200 | |
| | | | |
| 1 | Future Projects includes committed funding for the Pacific Motorway Upgrade between Mudgeeraba and Varsity Lakes. |
3
Capital Statement 2017-18
| 1.3.2 | Market-Led Proposals |
Market-Led Proposals (MLPs) were introduced in the 2015-16 Budget as part of the government’s plan to create jobs and stimulate the economy. An MLP is a submission from the private sector seeking a commercial arrangement with government to provide a service or infrastructure that will meet a community need.
MLPs always include a role for government and are expected to provide benefits to government and/or the Queensland community. They are usually “low risk – low cost” to government and must present a clear case for direct negotiation so that a competitive process would not be expected to result in a better outcome for the state.
The government also needs to be satisfied that no other proposal addressing the same need – or proposing a similar outcome – is under active consideration by government and that the proposal is a genuine commercial proposition.
If the government can be satisfied that the proposal has the potential to generate benefits for the community and deliver value for Queensland taxpayers, it can mean a good idea gets off the ground faster.
Projects which are wholly, or largely, privately funded and of economic or social significance to Queensland or a region, such as those that support a large number of jobs or will generate significant economic activity beyond the project, are highly regarded.
The MLP Guidelines have been improved to build on their success to date, making it easier to engage with the process and to understand what is required. In response to feedback from stakeholders this includes streamlining the approval process, consolidating the assessment criteria, and replacing the “uniqueness” criteria with “justification for direct negotiation”. New supplementary guidance, with practical examples, will also help proponents to submit submissions which are more likely to be successful.
Further information on the updated MLP guidelines will be released in the near future.
Criteria for success
The new consolidated assessment criteria for initial consideration of a proposal are that it must:
| • | | satisfy a community need and align with government’s priorities |
| • | | demonstrate that the public interest is best served by government negotiating directly with the proponent, rather than by engaging in a competitive process |
| • | | deliver a value-for-money outcome to the state, which can be determined in the absence of a competitive market |
| • | | have a proponent with the financial and technical capacity, capability, and experience to deliver the outcome successfully. |
If progressed to Detailed Proposal, the proposal will be assessed to determine that:
| • | | there is an allocation of costs and risks between the proponent and the government that is acceptable to the government |
| • | | the proposal is technically, commercially, and practically feasible. |
A successful MLP will result in government contracting directly with a proponent rather than offering the opportunity to the market through a competitive process.
4
Capital Statement 2017-18
Since the MLP framework has been established, the Treasury MLP team has discussed more than 140 preliminary proposals with proponents from every sector. Out of these concept discussions, 41 Stage One: Initial Proposals have been submitted for formal consideration, with five proposals progressing to Stage Two: Detailed Proposal or beyond. One of these, the Logan Motorway Enhancement Project, has reached contractual close.
Where a good idea isn’t successful as an MLP, it can be progressed in another way. Of the 19 formal proposals closed to date, six are being considered or are progressing through a competitive process and three have been referred to existing government funding programs or other government support.
Projects in the Detailed Proposal stage include
Brisbane International Cruise Terminal
The Port of Brisbane Pty Ltd (PBPL) is seeking to fully fund and finance a $100 million cruise ship facility catering for mega cruise ships at Luggage Point, which could add as much as $1 billion into the Queensland economy in the next two decades and support up to 300 jobs during the second year of construction.
The cruise ship terminal will cater to the new generation of mega cruise ships, which currently have to berth at temporary facilities in the Port of Brisbane. It is expected that over 60 per cent of cruise ships operating in Australia from 2020 will be mega cruise ships.
In April 2017, PBPL received in-principle support for the proposed commercial and technical solutions with key stakeholders. PBPL has indicated that it will submit its detailed proposal to the Queensland Government in late September 2017.
The Prince Charles Hospital Carpark and Office Accommodation
Carpark developer, International Parking Group (IPG), which is contracted to manage paid car parking at The Prince Charles Hospital campus, has submitted a proposal offering to resolve the hospital’s carpark shortage by financing and constructing two multi-level car parks offering 1,500 bays and constructing office accommodation for 500 staff.
The project has an estimated cost of $54 million and will be undertaken in return for an extension of its existing exclusive contract to manage all paid parking on the campus.
The proponent has indicated that it will submit a detailed proposal in 2017.
Approved proposals
Logan Motorway Enhancement Project
Transurban Queensland (TQ), which operates and maintains the Logan, Gateway and Gateway Extension motorways under a long-term agreement with the state, was the first proponent in Queensland to progress to contract award under the Queensland Government’s MLP framework.
TQ’s $512 million enhancement to the Logan and Gateway Extension motorways will provide a range of improvements to the motorways and surrounding roads to improve driver safety, reduce travel times, relieve local traffic congestion and enhance connectivity with other major road networks.
Queensland Treasury, in partnership with the Department of Transport and Main Roads, undertook a thorough assessment of TQ’s detailed proposal and concluded that the project was commercially sound, represented value for money and would deliver positive outcomes for Queenslanders.
5
Capital Statement 2017-18
Following contract close in December 2016, initial site establishment works have commenced with major construction to progress from mid-2017.
The project is expected to support around 1,300 jobs during the 2.5 year construction period and generate around $1 billion (present value) in economic benefits for Queenslanders over 30 years. TQ will fully finance the costs of the works and will predominantly fund the project through moderate toll increases for trucks using the Logan and Gateway motorways. There will also be a new toll facility for motorists if they choose to use new south-facing ramps at Compton Road to access and exit the Gateway Extension Motorway.
The project is expected to be completed in mid-2019.
| 1.3.3 | Public-private partnerships |
The Queensland Government is engaged in a range of public-private partnerships (PPPs) that often involve the private sector constructing an asset, which is then leased to the public sector.
Whilst a PPP transfers construction and maintenance risk to the private sector, given the arrangement has the public sector effectively retaining the risks and rewards of ownership of an asset to the public sector, the government’s financial statements recognise an acquisition under a finance lease and a corresponding finance lease liability. The liability is treated as a borrowing in the state’s balance sheet.
Acquisitions under finance leases and finance lease liabilities are typically recognised once construction has been completed and the lease commences, rather than recognising expenditure and associated borrowings across the construction period as occurs under traditional delivery.
In 2017-18, the value of acquisitions under finance leases is expected to be $618.3 million.
Given the significant value of acquisition under finance leases in 2017-18, it is important that this method of infrastructure delivery is recognised as part of the Capital Statement.
| 1.3.4 | Other infrastructure investment facilitated by the state |
Resource development framework
The Queensland Government has launched a new policy approach for the future development of the Galilee, Surat, other basins and the North West Minerals Province. The approach will apply to new developments and will provide investor certainty leading to development and business opportunities in the Basins and the North West Minerals Province. These regions have the potential to support thousands of new jobs in regional centres. After the completion of comprehensive environmental impact assessments by state and federal agencies, projects will abide by the following principles:
| • | | all royalties due to the state are paid over the term of any agreement (inclusive of interest foregone costs), with security of payment and no adverse budget impact to the state |
| • | | any agreement with a proponent will not involve the direct expenditure of public funds in the project or in directly related economic infrastructure for that project (noting that government- owned corporations (GOCs) may still supply economic infrastructure on commercial terms to resource project proponents) |
6
Capital Statement 2017-18
| • | | the proponent is to provide third party access infrastructure or other acceptable economic infrastructure to the state |
| • | | projects must have significant regional employment, generation of royalties and economic opportunity benefits, such as the potential to assist in opening up undeveloped resource basins. |
Building our Regions
The $375 million Building our Regions program provides funding to local governments for critical infrastructure in regional areas – supporting jobs, fostering economic development and improving liveability in regional communities.
To date, the program has allocated almost $156.2 million to 108 projects, which has attracted a further $277.8 million in investment from councils and other organisations. In the 2016-17 Budget the Palaszczuk Government injected a further $70 million for a third round of the program. Successful projects for Round 3 will be announced in the first half of 2017-18. It is expected that, during 2017-18, $111 million of capital grants are to be paid to successful applicants.
Works for Queensland
The government is providing an additional $200 million for the Works for Queensland program, for two years from 2017-18. This takes total government funding to $400 million, building on the existing $200 million commitment for the program announced on 13 December last year. The Works for Queensland program will support local governments outside South East Queensland that are facing elevated levels of unemployment. The program will fund job-creating maintenance and minor infrastructure works to ultimately improve the condition, quality or lifespan of local government assets. Funding will be allocated to eligible councils taking into account the size of the community and the relative need based on unemployment statistics.
Transport Infrastructure Development Scheme
The Transport Infrastructure Development Scheme (TIDS) provides targeted investment in local government transport infrastructure. The objectives of this scheme are to:
| • | | provide for an overall increase in works on the local government transport network |
| • | | promote development of regional transport stewardship and delivery capability |
| • | | link TIDS funding to desired outcomes to be delivered by local government |
| • | | achieve best value from all available resources. |
TIDS funding underpins the Roads and Transport Alliance – a 15 year partnership between Transport and Main Roads and the Local Government Association of Queensland on behalf of Queensland local governments, for the stewardship of the regional road and transport network. The Queensland Government’s $90 million increase to TIDS, announced in the 2016-17 Budget as part of Building our Regions, will commence in 2017-18.
North Queensland Initiatives
The Queensland Government allocates significant funding to support the development of new infrastructure in regional areas across the State, including North Queensland. The Queensland Government also notes the importance of complementary Australian Government infrastructure funding and is actively involved with the Australian Government to progress projects under various initiatives.
7
Capital Statement 2017-18
The National Water Infrastructure Development Fund (NWIDF), announced as part of the White Paper on Developing Northern Australia and Agricultural Competitiveness, is another opportunity for Northern Queensland. The NWIDF is comprised of two parts: the feasibility component ($59.5 million) and the capital component ($440 million). Funding of $24.8 million is being made available for 15 feasibility studies in Queensland, including a feasibility study of the proposed Nullinga Dam. As the feasibility funding from the Australian Government is paid in arrears, the Queensland Government has stepped in to provide interim funding arrangements to ensure the feasibility studies can proceed.
Queensland has secured $223.8 million federal funding under the Northern Australia Roads Programme, towards a total of $279.7 million (includes 20 per cent state contribution). A further $76 million is being invested under the Northern Australia Beef Roads Programme, which is made up of $56.9 million federal funding and contributions of $19.2 million from state and relevant local governments. Key projects under these initiatives are outlined in section 3 Transport and Main Roads of this document.
Further, the Queensland Government’s $130 million Jobs and Regional Growth Fund will support regional growth and job creation by incentivising regional private sector businesses and projects and leveraging additional investment. The fund is focussed on regional areas, including North Queensland, and will provide financial assistance that may also help develop common user infrastructure opportunities that underpin multiple projects.
Powering North Queensland Plan
The Queensland Government is committed to securing energy supply and driving down energy costs for Queensland consumers. The 2017-18 Budget is using the dividends from Government owned corporations to kick-start growth-enhancing infrastructure projects through a $386 million down payment for the Powering North Queensland plan.
The plan includes:
| • | | $150 million for the development of strategic transmission infrastructure to support a clean energy hub |
| • | | $100 million to help fund the proposed hydro-electric power station at Burdekin Falls Dam |
| • | | $100 million towards improvement works to ensure that the Burdekin Falls Dam continues to meet design standards, as well as the reinvestment of SunWater’s 2016-17 dividends (estimated at $36 million) |
| • | | commissioning a hydro-electric study to assess options for deploying new hydro in the state, including North Queensland. |
Projects such as a new transmission line will unlock around 2,000 MW of wind, pumped hydro and solar projects, and potentially support 4,600 jobs over the long-term.
Townsville Water Security
Following the launch of Australia’s first City Deal in Townsville, an inter-governmental Water Taskforce has been established to review options to deliver a sustainable and secure long-term water supply for Townsville. The Government is setting aside funding of $225 million over four years from 2017-18 to ensure the State is prepared to act on the findings of the Taskforce and support Townsville water security.
8
Capital Statement 2017-18
This section provides an overview of key projects by phase.
Burdekin Falls Dam Improvement, Raising and Hydro Electric Power Station
The government will invest to develop a business case for a hydro-electric power station on the state’s largest dam – Burdekin Falls Dam – to secure energy and support jobs for North Queensland. The power station will further contribute to the state’s renewable energy generation capacity and could generate 150 gigawatt hours of electricity – the equivalent of the annual energy use of 30,000 homes. The project could support between 150 and 200 new jobs when construction commences. The government-owned corporation Stanwell Corporation Limited will retain $100 million of its dividend to contribute to funding the proposed hydro-electric power station.
Government-owned corporation SunWater will retain all of its 2016-17 dividend in order to undertake essential dam safety upgrades and will also develop a detailed business case for improvement works to the saddle dam and monoliths so that the dam continues to meet current best practice safety standards. Government will provide a further $100 million towards the cost of the dam safety upgrades, which are expected to support around 250 construction jobs in regional Queensland.
Funding from the Australian Government’s National Water Infrastructure Development Fund is being used to undertake a high-level assessment of the feasibility of increasing the Burdekin Falls Dam capacity by 150,000 megalitres by raising the dam wall by two metres. Increasing the capacity of the dam would deliver additional water to support urban growth, increased resources activity in the Bowen and Galilee Basins, and irrigation development.
Port of Townsville Channel Capacity Upgrade
The Port of Townsville Limited (POTL) is proposing to widen the existing Platypus Channel and Sea Channel connection to the Port to allow larger vessels safe access; at an estimated cost of $193 million. The State Government will invest $75 million into the project, by reinvesting around $13 million of POTL’s 2016-17 dividend and committing a further $62 million directly to support the Channel Capacity Upgrade. As well as widening the channels, associated works include construction of rock walls and revetments to form receiving ponds for the beneficial re-use of dredge material, establishing a quarry to supply marine-grade armour rock required for rock walls and revetments, and installing navigation aids aligned with the new channel configuration. POTL intend to beneficially re-use capital dredge material consistent with the Sustainable Ports Development Act 2015 and construction will not commence until all necessary environmental approvals are in place.
European Train Control System (ETCS) – Inner City
A business case was completed for ETCS in mid-2016. Queensland Rail has allocated $634 million in its capital works program for delivery of the ETCS project between Milton and Northgate stations. A market sounding process was undertaken in late 2016 and detailed planning for the procurement phase is underway, with the formal procurement process to commence in mid-2017. Contract award for the delivery of ETCS is expected in 2018.
9
Capital Statement 2017-18
Implementation of ETCS through the centre of Brisbane’s train network will improve safety and provide capacity to run additional rail services. It is a critical project to facilitate the Cross River Rail project and manage passenger demand while Cross River Rail is being delivered.
Cross River Rail
During the 2016-17 financial year, the Cross River Rail project has progressed through the planning and assessment phases with the introduction and commencement of the Cross River Rail Delivery Authority Act 2016, the establishment of the Cross River Rail Delivery Authority (CRRDA) and the announcement of the Cross River Rail Delivery Board (the CRRD Board). As a result of these actions, delivery of the project became responsibility of the Delivery Authority from 14 April 2017.
The current project design for Cross River Rail encompasses a 10.2 kilometre link from Dutton Park to Bowen Hills, with 5.9 kilometres of tunnel under the Brisbane River and CBD, connecting northern and southern rail networks and providing significant benefits to commuters from both directions. Five new and upgraded high-capacity stations will be developed at: Boggo Road, Woolloongabba, Albert Street, Roma Street and the Exhibition showgrounds.
This second rail river crossing will ease congestion, improve network reliability and increase accessibility to the Brisbane CBD, allowing more people to travel longer distances with shorter journey times.
The Queensland Government is committed to the delivery of Cross River Rail. In this Budget the government is providing the additional funding necessary to meet the cost of delivery for Cross River Rail, ensuring that the project can now be delivered with certainty.
The project’s total cost of delivery is forecast to be $5.409 billion over the period 2016-17 to 2023-24. To date the Australian Government has committed only $10 million, to help fund some pre-construction planning costs. The Queensland Government will continue to work with the Australian Government to secure a contribution that properly reflects the strategic importance of this project and its contribution to the nation.
In this Budget the government has allocated an additional $1.952 billion to Cross River Rail over the forward estimates period. Together with the $850 million that the government previously allocated in the State Infrastructure Fund and the Australian Government’s contribution of $10 million, this provides total funding of $2.812 billion over the forward estimates (2016-17 to 2020-21). In future Budgets, the State Government will allocate a further $2.597 billion over the period 2021-22 to 2023-24. The government expects that this will be reduced through future Australian Government contributions and the proceeds of commercial funding sources.
The government recognises the significant potential of this infrastructure to boost jobs and economic growth, and add value to commercial and residential development sites across the region. The government is committed to maximising the benefits that can be achieved through integrated transport and land use development. The Cross River Rail Delivery Authority has a clear commercial mandate to explore the potential to leverage appropriate development to help fund the project.
10
Capital Statement 2017-18
Herston Quarter
Herston Quarter is an approximately five hectare site adjacent to the Royal Brisbane and Women’s Hospital that became available for redevelopment following the relocation of children’s health services to the Lady Cilento Children’s Hospital in South Brisbane.
The development site presents an exciting opportunity for the private sector to deliver a master planned health-related development, which capitalises on the location within the Herston Health Precinct, and leverages the convenience and quality of the adjacent institutions and developments.
After a competitive procurement process led by Queensland Treasury, Australian Unity has been engaged by the state as the master developer for the redevelopment of the Herston Quarter. Australian Unity’s proposal seeks to achieve the government’s vision to elevate Brisbane’s health credentials and cement the broader Herston Health Precinct as home to globally recognised health care, research, education, clinical trials and treatments.
Australian Unity will transform the site into a vibrant health-related mixed use community. This includes the delivery of a new 132-bed public Specialist Rehabilitation and Ambulatory Care Centre.
Following contract close on 23 February 2017, responsibility for the Herston Quarter has been transferred to Metro North Hospital and Health Service, which has entered into a Development Agreement with Australian Unity. Site establishment works have commenced with development to occur in stages over the next ten years.
The $1.1 billion project is to be delivered at no net cost or risk to the state and will support over 700 full-time equivalent jobs annually over the construction period, and hundreds of full-time jobs annually in operation.
Queen’s Wharf Brisbane
The Queen’s Wharf Brisbane (QWB) development is a $3 billion dollar capital investment in the urban renewal of the government precinct to create an iconic world class tourism offering.
The successful proponent, Destination Brisbane Consortium (DBC), will deliver five new premium hotels, three residential towers, in excess of 100 food and beverage and retail outlets, around 12 football fields (11 hectares) of enhanced public open space, the adaptive re-use of heritage buildings in the precinct and the construction of a pedestrian bridge to South Bank.
Consistent with the government’s focus on job creation, the project will provide significant economic development opportunities for Queensland by supporting more than 2,000 jobs during construction and 8,000 ongoing jobs.
The site handover and early works commenced in January 2017, with the integrated resort expected to open in 2022.
Toowoomba Second Range Crossing
The Toowoomba Second Range Crossing (TSRC) project is a $1.6 billion, 41 kilometre bypass route to the north of Toowoomba, running from the Warrego Highway at Helidon in the east to the Gore Highway at Athol in the west, via Charlton. The project is being jointly funded by the Queensland and Australian Governments. The project will support up to 1,800 full-time jobs during construction and is expected to improve road and driver safety, reduce travel time across the Range by up to 40 minutes for heavy commercial vehicles and relieve pressure on local roads by redirecting trucks away from Toowoomba’s CBD.
11
Capital Statement 2017-18
In 2015, the Nexus consortium was awarded the contract to deliver the TSRC and will be responsible for the design, construction, financing, operation and maintenance of the TSRC for a period of 25 years following construction completion which is expected in late 2018.
The TSRC will be a toll road, and use of the TSRC will be mandated for heavy vehicles without a Toowoomba destination. The Department of Transport and Main Roads will undertake further consultation with industry and the community before toll tariffs are finalised.
A competitive tender process for the procurement of tolling back office services has commenced. Responses to the state’s Request for Proposals are expected mid-2017.
Gold Coast Light Rail
The Gold Coast Light Rail Stage 2 (GCLR2) project extends the existing light rail system a further 7.3km to connect with the heavy rail network at Helensvale; providing an 11 minute trip from Helensvale station to the Gold Coast University Hospital station.
The $420 million project will support up to 1,000 jobs during construction. The project will be delivered with a $270 million contribution from the Queensland Government, $95 million from the Australian Government and $55 million from the Gold Coast City Council.
The current Gold Coast Light Rail proponent (GoldLinQ) has engaged CPB Contractors to construct Stage Two. Major works are well underway, with the project to be completed prior to the 2018 Commonwealth Games.
New Generation Rollingstock
The government’s $4.4 billion New Generation Rollingstock (NGR) project will see a significant increase to the South East Queensland train fleet to meet the growing demand for rail services.
The project is the largest single investment by Queensland in trains and demonstrates the government’s commitment to public transport in South East Queensland.
The NGR project is being delivered under an availability payment Public Private Partnership (PPP) by the Qtectic consortium.
Under the PPP, the consortium is responsible for financing, constructing and maintaining 75 new 6-car trains over a 32 year period, along with a new purpose-built maintenance centre at Wulkuraka, and three train simulators for training train crew.
Queensland Rail will operate the NGR trains, and is undertaking planning and preparation to transition the new trains into daily operations. The new trains will be progressively rolled-out onto the South East Queensland rail network from 2017.
North Queensland Stadium (NQ Stadium)
The $250 million North Queensland Stadium project will deliver an iconic, 25,000 seat regional stadium in Townsville in time for the 2020 NRL season.
The project is being jointly funded by the Queensland and Australian governments as part of the City Deal for Townsville, with a contribution from the NRL and the North Queensland Cowboys.
12
Capital Statement 2017-18
The NQ Stadium is expected to support up to 750 jobs throughout the design and construction phase as well as on-going jobs in hospitality, new tourism opportunities and major events. The stadium will also be a catalyst for urban renewal and regeneration for Townsville’s inner city and waterfront.
In December 2016, the successful principal contractor (a Cox Architecture-led team) was announced and the design concept for the stadium was released. On 1 May 2017, the successful Managing Contractor (Watpac) was announced. Engaging local industry in the delivery of the stadium is a key objective of the project, with Watpac committing to ensuring that more than 80 per cent of hours spent building the stadium will be by locals and at least 80 per cent of the value of the project will be spent on local subcontractors and suppliers.
It is expected that construction will commence late 2017.
| 1.5 | Highlights by Asset Class |
This section provides highlights by asset class for the 2017-18 capital program.
In 2017-18, the total capital program for the transport portfolio is forecast to be $3.885 billion including total capital grants of $237.4 million. This includes the Department of Transport and Main Roads, Queensland Rail, Far North Queensland Ports Corporation Limited, Gladstone Ports Corporation Limited, North Queensland Bulk Ports Corporation Limited, Port of Townsville Limited, RoadTek and the Gold Coast Waterways Authority.
In addition, the recently formed Cross River Rail authority will begin delivery of Cross River Rail.
Roads and public transport infrastructure
Highlights of the 2017-18 transport infrastructure program include:
| • | | $129 million in capital funding allocated to the Cross River Rail Delivery Authority as part of the Queensland Government’s $5.409 billion commitment to deliver Cross River Rail. |
| • | | $407 million to continue delivery of 75 new six-car sets, and services over a 32-year period for the New Generation Rollingstock to meet the growing demand for rail services in South East Queensland. |
| • | | $252.5 million towards the Toowoomba Second Range Crossing project, a bypass route to the north of Toowoomba, approximately 41km in length, running from the Warrego Highway at Helidon to the Gore Highway at Athol, via Charlton, at a total cost of $1.606 billion, in partnership with the Australian Government. |
| • | | $236.3 million towards widening the Gateway Motorway North to six lanes, south of Nudgee, at a total cost of $1.143 billion, in partnership with the Australian Government. |
| • | | $233.5 million to deliver the light rail system from Parkland Drive to Helensvale Rail Station, Gold Coast Light Rail (Stage 2), at a total cost of $420 million, in partnership with the Australian Government and the Gold Coast City Council. |
13
Capital Statement 2017-18
| • | | $120 million to duplicate the Bruce Highway from four to six lanes, from Caloundra Road to the Sunshine Motorway, at a total estimated cost of $929.3 million, in partnership with the Australian Government. |
Rail and Ports
The Rail and Ports 2017-18 capital program totals capital purchases $843.4 million. Highlights of the program include:
Queensland Rail:
| • | | $36 million to revitalise and modernise Brisbane’s Central Station to greatly improve the customer experience and cater for future growth. |
| • | | $29.7 million for implementation of European Train Control System Level 2 in the Brisbane Inner City Network. |
| • | | $24.5 million to continue track and tunnel upgrades between Brisbane and Toowoomba to cater for growing demand. |
| • | | $23.5 million to continue the duplication of the Gold Coast Line between Coomera and Helensvale. |
| • | | $18.3 million towards upgrades at Alderley, Morayfield, Newmarket, Graceville, Dinmore, Strathpine and Boondall Stations. |
Ports:
| • | | Far North Queensland Ports Corporation Limited has allocated $7.1 million towards new and continuing development within its ports in Far North Queensland including $3.8 million to continue the development of the Tingira Street Precinct in Cairns, at a total cost of $21.3 million. |
| • | | Gladstone Ports Corporation Limited has allocated $98.3 million towards ongoing development of the Port of Gladstone and additional works at the Port of Bundaberg and the Port of Rockhampton. This includes $49.7 million towards continuing upgrades at the RG Tanna Coal Terminal at the Port of Gladstone, at a total cost of $226 million. |
| • | | North Queensland Bulk Ports Corporation Limited has allocated $24.7 million to continue port planning and development initiatives to meet industry requirements for export coal facilities including $7 million to renew Wharf 4 and 5 Fender at the Port of Mackay to support trade growth, at a total cost of $9.5 million. |
| • | | Port of Townsville Limited has allocated $23.4 million towards ongoing development at the Port of Townsville and additional works at the Port of Lucinda. This includes $14.4 million for the redevelopment of the Berth 4 facility at the Port of Townsville, at a total cost of $37.3 million. |
14
Capital Statement 2017-18
The Energy and Water Supply portfolio capital program for 2017-18 is $2.063 billion. The capital works program supports the government’s commitment to deliver cost effective, safe, secure and reliable energy and water supply.
Highlights of the portfolio’s capital program include:
| • | | Energy Queensland has a capital program of $1.412 billion to improve and reinforce electricity supplies across Queensland to meet customer needs especially to cover peak electricity demand periods and to support the increased use of residential solar power, storage batteries, electric vehicles and air-conditioners. |
| • | | The capital spend for CS Energy Limited and Stanwell Corporation Limited is $242.7 million, primarily focused on maintaining existing plant and operations. This includes $55.1 million for improvements to the Callide Power Stations and $53.8 million for Stanwell Power Station projects. |
| • | | Powerlink Queensland’s capital program is $196.5 million and is predominantly focused on refit or replacement of aged equipment and assets. This includes $8.6 million to replace aged primary plant and secondary systems equipment at the Mackay Substation. |
| • | | SunWater’s planned capital purchases are $48.7 million. This spend will include improvement works of $12.9 million and $4.6 million at Boondooma Dam and Burdekin Falls Dam respectively. |
| • | | Gladstone Area Water Board and Mount Isa Water Board have a combined capital program of $44.3 million, primarily focused on continuing cost-effective and safe operations of the Water Boards’ property, plant and equipment. |
| • | | Seqwater’s capital purchases in 2017-18 are $118.5 million. The capital program is focused on the continuation of a safe, secure and reliable water supply for South East Queensland. |
The total capital purchases in 2017-18 for the health portfolio is $916.1 million. The focus for 2017-18 includes investment in health infrastructure, capital works and purchases across a broad range of areas including hospitals, ambulance stations and vehicles, health technology, research and scientific services, mental health services, staff accommodation and information and communication technology.
Highlights of the 2017-18 capital program for health services include:
| • | | $47.6 million as part of $208.4 million over four years for essential upgrades to health facilities and supporting infrastructure in rural and regional areas across the state including major redevelopments at Kingaroy Hospital, Blackall Hospital and Sarina Hospital, Townsville Hospital, refurbishment at Maryborough Hospital, a new mental health unit at Cairns Hospital, and the replacement of the primary health care centre on Mer (Murray) Island. The program will also support upgrades to staff accommodation at various locations across Queensland to provide safe, secure housing in rural areas. |
| • | | $24 million as part of $131.8 million over four years as an initial investment to enhance public hospital capacity and services in south-east Queensland including the expansion of the emergency department at Caboolture Hospital and detailed planning and preparatory works for proposed redevelopments at Logan, Caboolture and Ipswich hospitals. |
15
Capital Statement 2017-18
| • | | $8.7 million as part of $68.2 million over four years to establish a new Adolescent Extended Treatment Facility at The Prince Charles Hospital, two new adolescent Step Up Step Down units in Brisbane and refurbishment of two adolescent Day Program spaces at Logan and the Gold Coast. |
| 1.5.4 | Education and Training |
Education and Training portfolio will make capital purchases of $604.6 million in 2017-18. This includes capital works program of $536.6 million for the construction and refurbishment of school educational facilities, early childhood education and care services and training assets.
Highlights of the capital program include:
| • | | $28 million as part of $500 million in total capital funding over five years to address enrolment growth pressures in state schools. |
| • | | $154.5 million as part of $200 million in total funding for the construction of new halls, upgrading of existing halls and land acquisitions for new schools. |
| • | | $112.5 million to undertake new stages for recently opened schools and provide additional classrooms at existing schools in growth areas throughout the state. |
| • | | $37.7 million (excluding an expense component of $3.7 million) as part of $100.7 million in total capital funding over five years to continue construction of three new primary schools in the high growth areas of Yarrabilba (Logan), Caloundra-South and Coomera (all opening in 2018). |
| • | | $21.3 million (excluding an expense component of $1.6 million) as part of $43.2 million in total capital funding to continue construction of the new primary school in Burdell, Townsville (opening in 2018). |
| • | | $85.1 million to undertake renewal and minor projects to replace and enhance facilities at existing schools. |
The 2017-18 capital program features a range of projects designed to facilitate improvements in the state’s digital infrastructure.
Highlights across government include:
| • | | $135.4 million for Queensland Health to invest in Information Technology Equipment and Information Communication and Technology to ensure continued efficiency of the Queensland Health system. This will include investment in core infrastructure to support digital hospitals, and replacement and enhancement of core clinical and business systems to support frontline health service provision, corporate functions and decision making at the point of care. |
| • | | $12 million by the Queensland Institute of Medical Research for the acquisition of new and/or replacement state-of-the-art scientific equipment. |
| • | | $11.7 million by Queensland Treasury to implement the Office of State Revenue Transformation Program. This will enable the delivery of an upgraded Information Communication and Technology platform and support improved revenue management services into the future. |
16
Capital Statement 2017-18
| 1.5.6 | Justice and Public Safety |
$274.8 million will be invested in capital purchases to support the delivery of essential frontline public safety services to Queensland communities.
Highlights of the Capital Program include:
| • | | $47.1 million for replacement and new urban and rural fire vehicles. |
| • | | $44.5 million to replace or upgrade urban and rural fire and emergency and state emergency services facilities across Queensland. |
| • | | $32.4 million for new and replacement police service vehicles. |
| • | | $33.6 million to refurbish, upgrade or replace police facilities across the State. |
| • | | $3.5 million to commence the Westgate Counter-Terrorism and Community Safety Training Centre. |
In addition, $203.9 million capital purchases will be provided primarily for prison infrastructure, perimeter security upgrades, correctional centre enhancements, security management system upgrades and the programmed renewal and minor works of courthouses and youth justice facilities. These capital purchases include:
| • | | $7.5 million of $200 million at Capricornia Correctional Centre to provide an extra 164 beds to provide additional prisoner capacity. |
| • | | $16.9 million to support the transition of 17 year olds into the youth justice system. |
| 1.5.7 | Arts, Culture and Recreation |
Significant investment is provided in 2017-18 for culture and recreation. Highlights of investment include:
| • | | $6 million to renew and replace large critical infrastructure items across the Cultural Precinct, including the central energy plant renewal program, precinct-wide electrical safety upgrade program, precinct accessibility and mobility projects including amenities upgrades, precinct- wide lift and escalator upgrades, theatre dressing room upgrades at Queensland Performing Arts Centre and storage upgrades at the Queensland Art Gallery. |
| • | | $25 million capital grant for the Racing Infrastructure Fund to assist the racing industry to improve racing infrastructure facilities across the state. |
| • | | $6 million will be provided for the Arts Infrastructure Investment Fund for priority infrastructure projects across state owned arts and cultural facilities. This is part of a $17.5 million commitment over four years towards the Arts Infrastructure Investment Fund that includes works on the Bille Brown Theatre. |
| • | | $15 million will be invested to enhance critical infrastructure including nature-based tourism opportunities and the management of the state’s national parks. |
| • | | $4.3 million to maintain and upkeep Queensland Recreation Centres, Sports Grounds and Sports Houses throughout the state. |
17
Capital Statement 2017-18
Social housing is provided by the Queensland Government and non-government organisations to assist people who are unable to secure and sustain accommodation in the private market. The government’s capital investment in social housing in 2017-18 includes:
| • | | $390 million towards construction of new dwellings and upgrades to existing properties. |
| • | | $109.1 million of capital grants to assist non-government organisations to construct and upgrade social housing dwellings. |
Further, the government has committed $1.620 billion to deliver a housing construction program over 10 years. The housing construction program will boost supply of social and affordable housing and renew existing social housing. The government is committed to innovative approaches to boost housing supply, including by leveraging partnerships with private industry and local governments, and this funding package allows flexibility in how supply is increased.
The housing construction program is part of the $1.795 billion commitment to support delivery of the Queensland Housing Strategy 2017-2027. This in turn is part of $1.835 billion over 10 years the government is providing for a range of housing and homelessness measures. Additional details of the Queensland Housing Strategy and the Queensland Government’s response to housing and homelessness can be found in Budget Measures: Budget Paper 4.
18
Capital Statement 2017-18
| 2 | 2017-18 Capital Program overview |
Features
| • | | Non-financial Public Sector capital expenditure totals $10.171 billion for 2017-18, which comprises $8.608 billion of purchases of non-financial assets (PNFA) and acquisitions of non-financial assets under finance leases, and $1.563 billion of capital grants expenses. This capital program supports around 29,000 jobs in 2017-18. |
| • | | The level of capital expenditure over the forward estimates is forecast to total $42.750 billion including capital purchases and capital grants. With the government engaging in a range of Public Private Partnerships to deliver infrastructure, the value of acquisitions under finance leases is larger across the forward estimates than it has been historically. |
| • | | The Cross River Rail Delivery Authority has been allocated $129 million in capital funding in 2017-18 as part of the Queensland Government’s $5.409 billion commitment to deliver Cross River Rail. |
| • | | There will be capital expenditure of $3.885 billion for transport and roads in 2017-18, including $252.5 million to construct the Toowoomba Second Range Crossing, providing a bypass route to the north of Toowoomba at a total cost of $1.606 billion, in partnership with the Australian Government. $236.3 million will also be spent on widening the Gateway Motorway North to six lanes, south of Nudgee, at a total cost of $1.143 billion, in partnership with the Australian Government. |
| • | | Capital purchases for the health portfolio are $916.1 million in 2017-18, including capital purchases of $47.6 million for essential upgrades to health facilities and supporting infrastructure in rural and regional areas across the state, $24 million as an initial investment to enhance public hospital capacity and services in south-east Queensland, and $8.7 million for adolescent mental health facilities. |
| • | | The Queensland Government will make capital purchases of $536.6 million to construct and refurbish school educational facilities, early childhood education and care services, and training assets, including $28 million as part of the $500 million in total capital funding over five years to address enrolment growth pressures in state schools. |
| • | | The energy and water sector will make capital purchases of $2.063 billion to deliver cost effective, safe, secure and reliable energy and water supply. |
| • | | Capital purchases in the Public Non-financial Corporations sector, predominantly government- owned corporations, constitute 35.9 per cent of the total capital program. |
| • | | The 2017-18 capital program is focused on ensuring a consistent flow of works to support jobs and the economy and reduce the risk of backlogs emerging. To ensure government assets continue to efficiently deliver key social services and support the development of the state, capital expenditure will focus on the needs of local communities and support local employment opportunities. |
19
Capital Statement 2017-18
The Queensland Government invests in capital assets to support the services it provides to the community and to improve the productivity of the Queensland economy.
Capital purchases by purpose in 2017-18 are shown in Chart 1 below. Transport continues to account for the largest share of purchases, followed by energy, health and community services, and education and training. Table 2 identifies the level of capital purchases by entity for the 2016-17 year (estimated actual) and the budget for 2017-18.
Non-financial Public Sector capital expenditure totals $10.171 billion for 2017-18, which comprises $8.608 billion of purchases of non-financial assets (PNFA) and acquisitions of non-financial assets under finance leases, and $1.563 billion of capital grants expenses.
The capital program will support around 29,000 jobs in 2017-18.
| Chart 1 | Capital Purchases by Purpose 2017-18 |
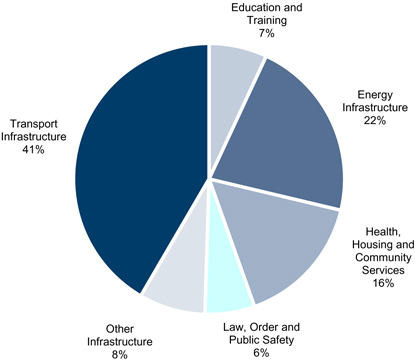
Table 2 shows capital purchases in 2017-18 by State Government entity. Transport and Main Roads has the largest proportion of the total purchases.
20
Capital Statement 2017-18
| Table 2 | Capital Purchases for 2017-18 by State Government Entity1,2 |
| | | | | | | | |
Entity | | 2016-17
Est. Actual
$‘000 | | | 2017-18
Budget
$‘000 | |
Aboriginal and Torres Strait Islander Partnerships | | | 731 | | | | 6,509 | |
Agriculture and Fisheries | | | 18,791 | | | | 21,127 | |
Communities, Child Safety and Disability Services | | | 14,747 | | | | 25,093 | |
Education and Training | | | 617,883 | | | | 604,605 | |
Electoral Commission of Queensland | | | 2,779 | | | | 6,385 | |
Energy and Water Supply | | | | | | | | |
Energy Generation Sector | | | 256,633 | | | | 242,716 | |
Energy Transmission and Distribution | | | 1,326,653 | | | | 1,608,747 | |
Water Distribution and Supply | | | 219,883 | | | | 211,529 | |
Environment and Heritage Protection | | | 5,128 | | | | 8,332 | |
Fire and Emergency Services | | | 5,042 | | | | 6,200 | |
Housing and Public Works | | | 489,692 | | | | 446,382 | |
Infrastructure, Local Government and Planning | | | | | | | | |
Infrastructure, Local Government and Planning | | | 102,759 | | | | 118,964 | |
Cross River Rail Delivery Authority | | | — | | | | 129,000 | |
Justice and Attorney-General | | | 85,696 | | | | 227,206 | |
Legislative Assembly of Queensland | | | 6,538 | | | | 7,664 | |
National Parks, Sport and Racing | | | 58,339 | | | | 91,733 | |
Natural Resources and Mines | | | 12,453 | | | | 17,685 | |
Premier and Cabinet | | | 26,189 | | | | 31,148 | |
Public Safety Business Agency3 | | | 173,678 | | | | 244,027 | |
Queensland Health | | | 1,217,385 | | | | 916,125 | |
Queensland Police Service | | | 18,411 | | | | 23,705 | |
Queensland Treasury | | | 7,856 | | | | 16,038 | |
Science, Information Technology and Innovation | | | 18,713 | | | | 22,337 | |
State Development | | | 4,751 | | | | 47,610 | |
Tourism, Major Events, Small Business and the Commonwealth Games | | | 11,567 | | | | 935 | |
Transport and Main Roads | | | | | | | | |
Transport and Main Roads | | | 2,711,622 | | | | 2,822,485 | |
Queensland Rail | | | 596,590 | | | | 671,645 | |
Port Authorities | | | 123,645 | | | | 153,508 | |
State Infrastructure Fund4 | | | — | | | | 184,000 | |
Other Agencies5 | | | 11,395 | | | | 5,648 | |
Other Adjustments6 | | | (280,854 | ) | | | 38,522 | |
Anticipated Capital Contingency Reserve7 | | | (250,000 | ) | | | (350,000 | ) |
Total Capital Purchases | | | 7,614,695 | | | | 8,607,610 | |
21
Capital Statement 2017-18
| | | | | | | | |
Total Capital Purchases Breakdown | | 2016-17
Est. Actual
$‘000 | | | 2017-18
Budget
$‘000 | |
Consisting of: | | | | | | | | |
Purchases of non-financial assets per Non-financial Public Sector Cash Flow Statement (BP2 Table 9.9) | | | 6,899,423 | | | | 7,989,304 | |
New finance leases | | | 715,272 | | | | 618,306 | |
Total Capital Purchases | | | 7,614,695 | | | | 8,607,610 | |
Notes
| 1. | Includes all associated statutory bodies. |
| 2. | Numbers may not add due to rounding. |
| 3. | The Public Safety Business Agency is a capital purchaser for Queensland Fire and Emergency Services, Queensland Police Service and the Office of the Inspector-General Emergency Management. |
| 4. | Represents funding for projects yet to be incorporated into individual departments’ forwards estimates. |
| 5. | Includes other Government entities with non-material capital programs. |
| 6. | Representing Inter-agency eliminations, movements in capital payable and receivable and other accounting adjustments to align with Uniform Presentation Framework Statements. |
| 7. | Contingency recognises that on a whole-of-Government basis, there is likely to be under spending, resulting in a carryover of capital allocations. |
22
Capital Statement 2017-18
Table 3 shows capital purchases by statistical area and region. Around 63 per cent of total capital purchases will be spent outside of Greater Brisbane (Brisbane, Logan and Ipswich) in 2017-18.
| Table 3 | Capital Purchases by Statistical Area for 2017-181,2 |
| | | | | | | | | | | | | | |
Regional Action Plan Region | | Capital
Purchases
$‘000 | | | Statistical Area | | Capital
Purchases
$‘000 | |
Brisbane | | | 2,145,713 | | | | 301 | | | Brisbane East | | | 152,827 | |
| | | | | | | 302 | | | Brisbane North | | | 513,092 | |
| | | | | | | 303 | | | Brisbane South | | | 447,607 | |
| | | | | | | 304 | | | Brisbane West | | | 159,387 | |
| | | | | | | 305 | | | Inner Brisbane | | | 872,800 | |
Ipswich | | | 800,296 | | | | 310 | | | Ipswich | | | 800,296 | |
Wide Bay | | | 536,944 | | | | 319 | | | Wide Bay | | | 536,944 | |
Darling Downs | | | 841,721 | | | | 307 | | | Darling Downs Maranoa | | | 601,116 | |
| | | | | | | 317 | | | Toowoomba | | | 240,605 | |
Gold Coast | | | 773,079 | | | | 309 | | | Gold Coast | | | 773,079 | |
Logan | | | 229,235 | | | | 311 | | | Logan Beaudesert | | | 229,235 | |
Mackay | | | 387,561 | | | | 312 | | | Mackay | | | 387,561 | |
Outback Qld3 | | | 232,888 | | | | 315 | | | Outback | | | 332,313 | |
Far North Qld3 | | | 550,831 | | | | 306 | | | Cairns | | | 451,406 | |
Central Qld | | | 623,913 | | | | 308 | | | Fitzroy | | | 623,913 | |
Sunshine Coast and Moreton Bay | | | 899,213 | | | | 316 | | | Sunshine Coast | | | 561,299 | |
| | | | | | | 313 | | | Moreton Bay North | | | 185,776 | |
| | | | | | | 314 | | | Moreton Bay South | | | 152,138 | |
Townsville | | | 586,216 | | | | 318 | | | Townsville | | | 586,216 | |
Total Capital Purchases | | | | | | | | | | | | | 8,607,610 | |
Notes
| 1. | Numbers may not add due to rounding. |
| 2. | The anticipated Capital Contingency Reserve and other adjustments have been spread across statistical areas proportionate to capital spends. |
| 3 | $ 99,425,000 capital purchase in Outback statistical area belongs to the Far North Qld region. |
23
Capital Statement 2017-18
The Queensland Government provides grants for capital purposes to a range of organisations and private individuals.
Capital grants to local governments (LG), non-government organisations (NGOs) and individuals are illustrated in Chart 2 below. Capital grants are expected to be $1.563 billion in 2017-18, the largest of which are capital grants to local governments for general purposes.
| Chart 2 | Capital Grants by Purpose and Recipient |
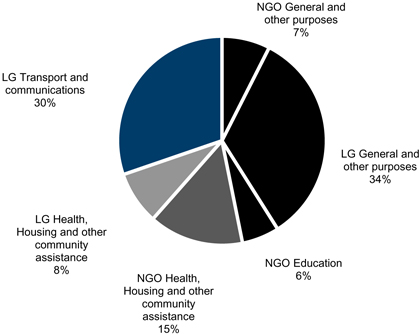
24
Capital Statement 2017-18
Table 4 shows the planned expenditure on capital grants by State Government entity for 2017-18. The Queensland Reconstruction Authority has the highest level of capital grants.
| Table 4 | Expenditure on Capital Grants by State Government Entity for 2017-181,2 |
| | | | | | | | |
Entity | | 2016-17
Est. Actual
$‘000 | | | 2017-18
Budget
$‘000 | |
Aboriginal and Torres Strait Islander Partnerships | | | 16,304 | | | | 9,317 | |
Agriculture and Fisheries | | | 244 | | | | 1,342 | |
Communities, Child Safety and Disability Services | | | 7,604 | | | | 4,183 | |
Education and Training | | | 92,675 | | | | 92,675 | |
Environment and Heritage Protection | | | 400 | | | | — | |
Fire and Emergency Services | | | 897 | | | | 897 | |
Housing and Public Works | | | 57,228 | | | | 109,075 | |
Infrastructure, Local Government and Planning | | | | | | | | |
Infrastructure, Local Government and Planning | | | 267,946 | | | | 296,560 | |
Queensland Reconstruction Authority | | | 247,460 | | | | 317,933 | |
National Parks, Sport and Racing | | | 27,860 | | | | 68,093 | |
Premier and Cabinet | | | 1,829 | | | | 26,560 | |
Queensland Treasury | | | 150,952 | | | | 147,601 | |
Science, Information Technology and Innovation | | | 4,260 | | | | 2,451 | |
State Development | | | 59,559 | | | | 139,851 | |
Tourism, Major Events, Small Business and the Commonwealth Games | | | 5,500 | | | | 18,779 | |
Transport and Main Roads | | | | | | | | |
Transport and Main Roads | | | 237,427 | | | | 237,427 | |
Other Adjustments3 | | | 56,520 | | | | 50,732 | |
Anticipated Capital Contingency Reserve | | | — | | | | 40,000 | |
Total Capital Grants | | | 1,312,180 | | | | 1,563,476 | |
Notes
| 1. | Includes associated statutory bodies. |
| 2. | Numbers may not add due to rounding. |
| 3. | Includes assets transferred and other technical accounting adjustments. |
25
Capital Statement 2017-18
Table 5 shows expenditure on capital grants by statistical area. Far North Queensland has the highest level of capital grants.
| Table 5 | Capital Grants by Statistical Area for 2017-181,2 |
| | | | | | | | | | | | | | |
Regional Action Plan Region | | Grants
$‘000 | | | Statistical Area | | Grants
$‘000 | |
Brisbane | | | 183,542 | | | | 301 | | | Brisbane East | | | 37,346 | |
| | | | | | | 302 | | | Brisbane North | | | 29,852 | |
| | | | | | | 303 | | | Brisbane South | | | 45,430 | |
| | | | | | | 304 | | | Brisbane West | | | 24,782 | |
| | | | | | | 305 | | | Inner Brisbane | | | 46,132 | |
Ipswich | | | 68,139 | | | | 310 | | | Ipswich | | | 68,139 | |
Wide Bay | | | 112,029 | | | | 319 | | | Wide Bay | | | 112,029 | |
Darling Downs | | | 76,164 | | | | 307 | | | Darling Downs Maranoa | | | 45,751 | |
| | | | | | | 317 | | | Toowoomba | | | 30,413 | |
Gold Coast | | | 101,788 | | | | 309 | | | Gold Coast | | | 101,788 | |
Logan | | | 55,970 | | | | 311 | | | Logan Beaudesert | | | 55,970 | |
Mackay | | | 131,846 | | | | 312 | | | Mackay | | | 131,846 | |
Outback Qld3 | | | 195,284 | | | | 315 | | | Outback | | | 290,766 | |
Far North Qld3 | | | 268,393 | | | | 306 | | | Cairns | | | 172,911 | |
Central Qld | | | 164,189 | | | | 308 | | | Fitzroy | | | 164,189 | |
Sunshine Coast and Moreton Bay | | | 103,188 | | | | 316 | | | Sunshine Coast | | | 46,001 | |
| | | | | | | 313 | | | Moreton Bay North | | | 31,154 | |
| | | | | | | 314 | | | Moreton Bay South | | | 26,033 | |
Townsville | | | 102,944 | | | | 318 | | | Townsville | | | 102,944 | |
Total Capital Grants | | | | | | | | | | | | | 1,563,476 | |
Notes
| 1. | Numbers may not add due to rounding. |
| 2. | The adjustments referred to in Table 4 have been spread across statistical areas proportionate to allocation of Grants. |
| 3. | $ 95,482,000 capital grants in Outback statistical area belongs to the Far North Qld region. |
Chart 3 shows the distribution of the total 2017-18 capital program (capital purchases and capital grants) across the geographical regions of Queensland, as classified for Budget Paper 3 purposes.
26
Capital Statement 2017-18
| Chart 3 | Map of Queensland Regions |
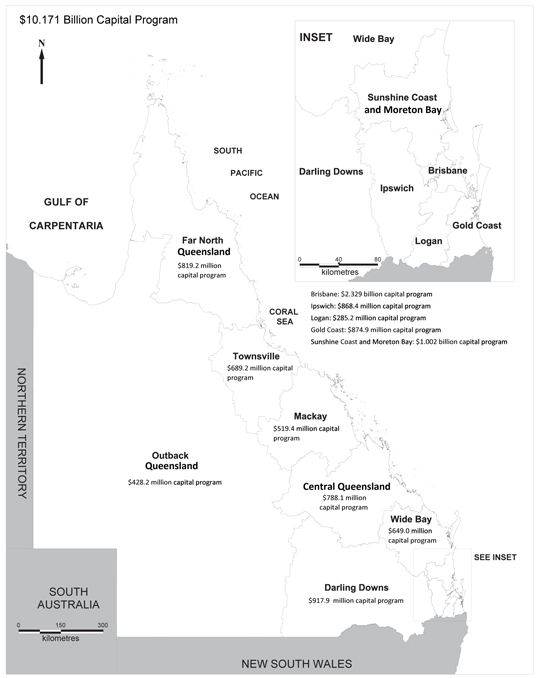
Note: Boundaries are based on ASGS 2011
27
Capital Statement 2017-18
| 2.3 | Changes to forecast delivery of 2016-17 Capital Program |
The 2016-17 Budget capital program was $10.666 billion, made up of capital purchases of $8.264 billion, capital grants of $1.370 billion and finance leases of $1.032 billion. Following a number of revisions to the timing and form of capital spending, the estimated actual for the 2016-17 capital program is $8.927 billion, made up of capital purchases of $6.899 billion, capital grants of $1.312 billion and finance leases of $715 million.
Approximately $150 million of the 2016-17 Budget capital program was accounted for in the 2016-17 year as operating expenditure rather than capital expenditure. There was also lower than expected capital expenditure in Public Non-financial Corporations, leading to a lower level of capital purchases reported in this sector for 2016-17. Other capital expenditure has been re-profiled to future years, predominately driven by changes to project delivery in transport and health.
28
Capital Statement 2017-18
| 3 | Capital outlays by entity |
| 3.1 | ABORIGINAL AND TORRES STRAIT ISLANDER PARTNERSHIPS |
Department of Aboriginal and Torres Strait Islander Partnerships
Total capital purchases for the Department of Aboriginal and Torres Strait Islander Partnerships are estimated to be $6.5 million in 2017-18. Total capital grants for the department are estimated to be $9.3 million in 2017-18.
Program Highlights (Property, Plant and Equipment)
| • | | $6 million towards land acquisitions related to the Cape York Peninsula Tenure Resolution Program. |
| • | | $509,000 for other property, plant and equipment. |
Program Highlights (Capital Grants)
| • | | $9.3 million for programs to develop land infrastructure and subdivisions for social housing in remote and discrete Indigenous communities. |
| | | | | | | | | | | | | | | | | | | | |
| Aboriginal and Torres Strait Islander Partnerships | |
Project | | Statistical
Area | | | Total
Estimated
Cost
$‘000 | | | Expenditure
to
30-06-17
$‘000 | | | Budget
2017-18
$‘000 | | | Post
2017-18
$‘000 | |
DEPARTMENT OF ABORIGINAL AND TORRES STRAIT ISLANDER PARTNERSHIPS | | | | | | | | | | | | | | | | | | | | |
| | | | | |
Property, Plant and Equipment | | | | | | | | | | | | | | | | | | | | |
Cape York Peninsula Tenure Resolution Program land acquisitions | | | 315 | | | | 6,000 | | | | | | | | 6,000 | | | | | |
Other property, plant and equipment | | | Various | | | | | | | | | | | | 509 | | | | Ongoing | |
| | | | | | | | | | | | | | | | | | | | |
Total Property, Plant and Equipment | | | | | | | | | | | | | | | 6,509 | | | | | |
| | | | | | | | | | | | | | | | | | | | |
| | | | | |
Capital Grants | | | | | | | | | | | | | | | | | | | | |
Indigenous land and infrastructure programs | | | Various | | | | 100,933 | | | | 91,616 | | | | 9,317 | | | | | |
| | | | | | | | | | | | | | | | | | | | |
Total Capital Grants | | | | | | | | | | | | | | | 9,317 | | | | | |
| | | | | | | | | | | | | | | | | | | | |
| | | | | | | | | | | | | | | | | | | | |
| | | | | | | | | | | | | | | | | | | | |
TOTAL ABORIGINAL AND TORRES STRAIT ISLANDER PARTNERSHIPS (PPE) | | | | | | | | | | | | | | | 6,509 | | | | | |
| | | | | | | | | | | | | | | | | | | | |
| | | | | | | | | | | | | | | | | | | | |
| | | | | | | | | | | | | | | | | | | | |
TOTAL ABORIGINAL AND TORRES STRAIT ISLANDER PARTNERSHIPS (CG) | | | | | | | | | | | | | | | 9,317 | | | | | |
| | | | | | | | | | | | | | | | | | | | |
29
Capital Statement 2017-18
| 3.2 | AGRICULTURE AND FISHERIES |
Total capital purchases and grants for the Agriculture and Fisheries portfolio including statutory bodies reporting to the Minister for Agriculture and Fisheries are $22.5 million for 2017-18.
Department of Agriculture and Fisheries
Capital purchases and grants for the Department of Agriculture and Fisheries (DAF) in 2017-18 are $19.5 million. The department’s capital program is focused on developing and upgrading research facilities to deliver outcomes for agriculture, biosecurity, fisheries and forestry.
DAF has facilities located throughout rural and regional Queensland. These require continual minor works, mechanical items and plant and equipment upgrades to keep them operating effectively.
Program Highlights (Property, Plant and Equipment)
| • | | $4.5 million is allocated to continue upgrades of the department’s research and operational facilities through the Research Facilities Development, Scientific Equipment, and Minor Works Programs. |
| • | | $3.8 million is provided for the upgrade and refurbishment of existing facilities at Toowoomba, which will enhance service delivery and improve operational efficiencies. |
| • | | $1.5 million is allocated to provide new and replacement heavy plant and equipment including trucks, tractors, irrigators, all-terrain vehicles and other machinery. |
| • | | $881,000 is provided for leasehold fitout replacements to the Ecoscience and Health and Food Sciences Precincts. |
| • | | $800,000 is provided to continue replacement of vessels and marine equipment for fisheries research and regulatory functions. |
Program Highlights (Capital Grants)
| • | | $1.3 million is provided as a Capital Grant to the Royal Society for the Prevention of Cruelty to Animals (RSPCA) Queensland for facility upgrades in Cairns and Townsville. |
Queensland Agricultural Training Colleges
Capital purchases for the Queensland Agricultural Training Colleges in 2017-18 are $3 million. The capital program is primarily focused on upgrading infrastructure of the colleges at Longreach and Emerald to support business growth initiatives.
30
Capital Statement 2017-18
| | | | | | | | | | | | | | | | | | | | |
| Agriculture and Fisheries | |
Project | | Statistical
Area | | | Total
Estimated
Cost
$‘000 | | | Expenditure
to
30-06-17
$‘000 | | | Budget
2017-18
$‘000 | | | Post
2017-18
$‘000 | |
DEPARTMENT OF AGRICULTURE AND FISHERIES | | | | | | | | | | | | | |
| | | | | |
Property, Plant and Equipment | | | | | | | | | | | | | | | | | | | | |
Upgrade and Refurbishment of Existing Facilities at Toowoomba | | | 317 | | | | 7,350 | | | | 1,050 | | | | 3,800 | | | | 2,500 | |
Scientific Equipment | | | Various | | | | | | | | | | | | 2,000 | | | | Ongoing | |
Computer Equipment | | | 305 | | | | | | | | | | | | 4,965 | | | | Ongoing | |
Heavy Plant and Equipment | | | Various | | | | | | | | | | | | 1,500 | | | | Ongoing | |
Minor Works | | | Various | | | | | | | | | | | | 1,500 | | | | Ongoing | |
Research Facilities Development | | | Various | | | | | | | | | | | | 1,000 | | | | Ongoing | |
Ecosciences and Health and Food Sciences Precincts Fitout Replacement Program | | | Various | | | | | | | | | | | | 881 | | | | Ongoing | |
Vessels and Marine Equipment | | | Various | | | | | | | | | | | | 800 | | | | Ongoing | |
Software Purchases and Development | | | 305 | | | | | | | | | | | | 800 | | | | Ongoing | |
Other Property Plant and Equipment | | | Various | | | | | | | | | | | | 881 | | | | Ongoing | |
| | | | | | | | | | | | | | | | | | | | |
Total Property, Plant and Equipment | | | | | | | | | | | | | | | 18,127 | | | | | |
| | | | | | | | | | | | | | | | | | | | |
| | | | | |
Capital Grants | | | | | | | | | | | | | | | | | | | | |
RSPCA Capital Grant | | | Various | | | | 3,000 | | | | 244 | | | | 1,342 | | | | 1,414 | |
| | | | | | | | | | | | | | | | | | | | |
Total Capital Grants | | | | | | | | | | | | | | | 1,342 | | | | | |
| | | | | | | | | | | | | | | | | | | | |
| | | |
QUEENSLAND AGRICULTURAL TRAINING COLLEGES | | | | | | | | | | | | | |
| | | | | |
Property, Plant and Equipment | | | | | | | | | | | | | | | | | | | | |
Emerald Agricultural College Buildings and Upgrades | | | 308 | | | | 1,519 | | | | | | | | 1,519 | | | | | |
Longreach Pastoral College Building and Infrastructure upgrades | | | 315 | | | | 693 | | | | | | | | 693 | | | | | |
Plant and Equipment (including IT Upgrades) | | | Various | | | | | | | | | | | | 658 | | | | Ongoing | |
Walkamin Building Upgrade | | | 306 | | | | 130 | | | | | | | | 130 | | | | | |
| | | | | | | | | | | | | | | | | | | | |
Total Property, Plant and Equipment | | | | | | | | | | | | | | | 3,000 | | | | | |
| | | | | | | | | | | | | | | | | | | | |
| | | | | | | | | | | | | | | | | | | | |
| | | | | | | | | | | | | | | | | | | | |
TOTAL AGRICULTURE AND FISHERIES (PPE) | | | | | | | | | | | | | | | 21,127 | | | | | |
| | | | | | | | | | | | | | | | | | | | |
| | | | | | | | | | | | | | | | | | | | |
| | | | | | | | | | | | | | | | | | | | |
TOTAL AGRICULTURE AND FISHERIES (CG) | | | | | | | | | | | | | | | 1,342 | | | | | |
| | | | | | | | | | | | | | | | | | | | |
31
Capital Statement 2017-18
| 3.3 | COMMUNITIES, CHILD SAFETY AND DISABILITY SERVICES |
The capital works program for the Department of Communities, Child Safety and Disability Services is $25.1 million in 2017-18. Total capital grants for the portfolio is $4.2 million. These funds provide for integrated community services and strengthen and protect the well-being of Queenslanders, particularly those who are vulnerable and most in need.
Program Highlights (Property, Plant and Equipment)
| • | | $2.2 million for the construction of the Moranbah Youth and Community Centre, at a total cost of $3.2 million, as part of a capital and operating funding agreement with BHP Billiton Mitsubishi Alliance Coal Operations Pty Ltd. |
| • | | $7.3 million to continue the upgrade and construction program for multipurpose and neighbourhood centres, including $2.7 million for Inala and East Murgon, $1.3 million to acquire land for new centres at Ripley and in the Kallangur area and design development of the Thursday Island Community Hub, and $3.3 million for building upgrades, rectifications and compliance works. |
| • | | $2.1 million to continue infrastructure upgrades, rectification works, and construct purpose built accommodation as part of a targeted response for people with an intellectual and/or cognitive disability who exhibit extremely challenging behaviours. |
| • | | $1.4 million to establish a new Child Safety Service Centre in Morayfield and continue upgrades of child safety residential care facilities. |
| • | | $786,000 of a total $2.6 million over two years for the development of a whole-of-government ICT system to improve information sharing across agencies in regards to children missing from out-of-home care. |
| • | | $6.8 million for enhancements to key existing information systems and programs to implement new systems. This will improve contract management systems functionality, documents and records management and information sharing across agencies and the sector, and offer business efficiencies and better service delivery. |
Program Highlights (Capital Grants)
| • | | $2.2 million for the Elderly Parent Carer Innovation Initiative which is aimed at assisting elderly parent carers to secure accommodation for their adult son or daughter with a disability when they can no longer care for them. This program has invested in projects to create new living arrangements that include use of accessible housing designs and assistive technologies to enable adults with disability to live a rich and valued life in their communities. |
32
Capital Statement 2017-18
| • | | $1.8 million for the purchase and modification of properties for people with high and complex needs providing safe and sustainable long term accommodation in Townsville, Cairns and Brisbane. |
| • | | $250,000 to complete the design and documentation phase of the Atherton Community Centre. |
| | | | | | | | | | | | | | | | | | | | |
| Communities, Child Safety and Disability Services | |
Project | | Statistical
Area | | | Total
Estimated
Cost
$‘000 | | | Expenditure
to
30-06-17
$‘000 | | | Budget
2017-18
$‘000 | | | Post
2017-18
$‘000 | |
DEPARTMENT OF COMMUNITIES, CHILD SAFETY AND DISABILITY SERVICES | | | | | | | | | | | | | | | | | | | | |
| | | | | |
Property, Plant and Equipment | | | | | | | | | | | | | | | | | | | | |
Community Services | | | | | | | | | | | | | | | | | | | | |
Moranbah Youth and Community Centre | | | 312 | | | | 3,200 | | | | 50 | | | | 2,200 | | | | 950 | |
Inala Community Centre Replacement | | | 310 | | | | 3,500 | | | | 60 | | | | 1,290 | | | | 2,150 | |
East Murgon Neighbourhood Centre Replacement | | | 319 | | | | 2,600 | | | | 20 | | | | 1,360 | | | | 1,220 | |
Ripley Neighbourhood Centre | | | 310 | | | | 4,100 | | | | | | | | 600 | | | | 3,500 | |
Kallangur Area Neighbourhood Centre | | | 314 | | | | 4,100 | | | | | | | | 600 | | | | 3,500 | |
Thursday Island Community Hub | | | 315 | | | | 4,600 | | | | 900 | | | | 100 | | | | 3,600 | |
Mackay Neighbourhood Centre Renewal | | | 312 | | | | 1,200 | | | | 82 | | | | 1,118 | | | | | |
General Upgrades | | | Various | | | | | | | | | | | | 250 | | | | Ongoing | |
Neighbourhood Centre Renewal Program | | | Various | | | | | | | | | | | | 1,940 | | | | Ongoing | |
| | | | | | | | | | | | | | | | | | | | |
Sub-total Community Services | | | | | | | | | | | | | | | 9,458 | | | | | |
| | | | | | | | | | | | | | | | | | | | |
| | | | | |
Disability Services | | | | | | | | | | | | | | | | | | | | |
Bracken Ridge Redevelopment | | | 302 | | | | 2,500 | | | | 60 | | | | 1,540 | | | | 900 | |
Infrastructure Program | | | Various | | | | | | | | | | | | 21 | | | | Ongoing | |
General Upgrades | | | Various | | | | | | | | | | | | 550 | | | | Ongoing | |
| | | | | | | | | | | | | | | | | | | | |
Sub-total Disability Services | | | | | | | | | | | | | | | 2,111 | | | | | |
| | | | | | | | | | | | | | | | | | | | |
| | | | | |
Child and Family Services | | | | | | | | | | | | | | | | | | | | |
Morayfield Child Safety Service Centre | | | 313 | | | | 1,200 | | | | | | | | 1,200 | | | | | |
33
Capital Statement 2017-18
| | | | | | | | | | | | | | | | | | | | |
| Communities, Child Safety and Disability Services | |
Project | | Statistical
Area | | | Total
Estimated
Cost
$‘000 | | | Expenditure
to
30-06-17
$‘000 | | | Budget
2017-18
$‘000 | | | Post
2017-18
$‘000 | |
Residential Care Facilities | | | Various | | | | | | | | | | | | 200 | | | | Ongoing | |
| | | | | | | | | | | | | | | | | | | | |
Sub-total Child and Family Services | | | | | | | | | | | | | | | 1,400 | | | | | |
| | | | | | | | | | | | | | | | | | | | |
| | | | | |
Other Property, Plant and Equipment | | | | | | | | | | | | | | | | | | | | |
Missing Child Interagency System | | | Various | | | | 2,620 | | | | | | | | 786 | | | | 1,834 | |
Information Technology Infrastructure Replacement | | | Various | | | | | | | | | | | | 1,270 | | | | Ongoing | |
Office Accommodation | | | Various | | | | | | | | | | | | 3,275 | | | | Ongoing | |
Information System Enhancements | | | Various | | | | | | | | | | | | 6,793 | | | | Ongoing | |
| | | | | | | | | | | | | | | | | | | | |
Sub-total Other Property, Plant and Equipment | | | | | | | | | | | | 12,124 | | | | | |
| | | | | | | | | | | | | | | | | | | | |
| | | | | | | | | | | | | | | | | | | | |
| | | | | | | | | | | | | | | | | | | | |
Total Property, Plant and Equipment | | | | | | | | | | | | | | | 25,093 | | | | | |
| | | | | | | | | | | | | | | | | | | | |
Capital Grants | | | | | | | | | | | | | | | | | | | | |
| | | | | |
Atherton Community Centre | | | | | | | | | | | | | | | | | | | | |
Atherton Community Centre | | | 306 | | | | 250 | | | | | | | | 250 | | | | | |
| | | | | | | | | | | | | | | | | | | | |
Sub-total Atherton Community Centre | | | | | | | | | | | | | | | 250 | | | | | |
| | | | | | | | | | | | | | | | | | | | |
| | | | | |
Elderly Parent Carer Innovation Initiative | | | | | | | | | | | | | | | | | | | | |
Moreton Bay South | | | 314 | | | | 1,000 | | | | 800 | | | | 200 | | | | | |
Brisbane West | | | 304 | | | | 751 | | | | 150 | | | | 601 | | | | | |
Sunshine Coast | | | 316 | | | | 1,000 | | | | 400 | | | | 600 | | | | | |
Darling Downs-Maranoa | | | 307 | | | | 438 | | | | 88 | | | | 350 | | | | | |
Brisbane East | | | 301 | | | | 843 | | | | 421 | | | | 422 | | | | | |
| | | | | | | | | | | | | | | | | | | | |
Sub-total Elderly Parent Carer Innovation Initiative | | | | | | | | | | | | | | | 2,173 | | | | | |
| | | | | | | | | | | | | | | | | | | | |
| | | | | |
Supported Accommodation | | | | | | | | | | | | | | | | | | | | |
Brisbane North | | | 302 | | | | 800 | | | | 80 | | | | 720 | | | | | |
Cairns | | | 306 | | | | 800 | | | | 80 | | | | 720 | | | | | |
Townsville | | | 318 | | | | 800 | | | | 480 | | | | 320 | | | | | |
| | | | | | | | | | | | | | | | | | | | |
Sub-total Supported Accommodation | | | | | | | | | | | | | | | 1,760 | | | | | |
| | | | | | | | | | | | | | | | | | | | |
| | | | | | | | | | | | | | | | | | | | |
| | | | | | | | | | | | | | | | | | | | |
Total Capital Grants | | | | | | | | | | | | | | | 4,183 | | | | | |
| | | | | | | | | | | | | | | | | | | | |
| | | | | | | | | | | | | | | | | | | | |
| | | | | | | | | | | | | | | | | | | | |
TOTAL COMMUNITIES, CHILD SAFETY AND DISABILITY SERVICES (PPE) | | | | | | | | | | | | | | | 25,093 | | | | | |
| | | | | | | | | | | | | | | | | | | | |
| | | | | | | | | | | | | | | | | | | | |
| | | | | | | | | | | | | | | | | | | | |
TOTAL COMMUNITIES, CHILD SAFETY AND DISABILITY SERVICES (CG) | | | | | | | | | | | | | | | 4,183 | | | | | |
| | | | | | | | | | | | | | | | | | | | |
34
Capital Statement 2017-18
| 3.4 | EDUCATION AND TRAINING |
Total capital purchases for the Education and Training portfolio (including the Department of Education and Training and related entities) are $604.6 million in 2017-18. Total capital grants for the portfolio are $92.7 million in 2017-18.
Department of Education and Training
The 2017-18 capital purchases of $580.6 million includes the capital works program of $536.6 million for the construction and refurbishment of school educational facilities, early childhood education and care services and training assets. This includes $44 million (including a finance lease component of $21.2 million) in 2017-18 allocated to the $1.380 billion Queensland Schools Public Private Partnerships project for 10 new schools in South East Queensland. Capital works planning targets government priorities and needs through consideration of population growth and shifts, changes in educational needs and addressing high priority needs for student and staff health and safety.
Program Highlights (Property, Plant and Equipment)
| • | | $154.5 million as part of $200 million in total funding for the construction of new halls, upgrading of existing halls and land acquisitions for new schools. |
| • | | $112.5 million to undertake new stages for recently opened schools and provide additional classrooms at existing schools in growth areas throughout the State. |
| • | | $37.7 million (excluding an expense component of $3.7 million) as part of the $100.7 million in total capital funding over five years to continue construction of three new primary schools in the high growth areas of Yarrabilba (Logan), Caloundra-South and Coomera (all opening in 2018). |
| • | | $42.4 million to undertake renewal and minor projects at existing schools. |
| • | | $42.7 million to replace and enhance facilities at existing schools. |
| • | | $21.3 million (excluding an expense component of $1.6 million) as part of $43.2 million in total capital funding to continue construction of the new primary school in Burdell, Townsville (opening in 2018). |
| • | | $28 million as part of $500 million in total capital funding over five years to address enrolment growth pressures in state schools. |
| • | | $17.3 million for the renewal and growth of Queensland’s training assets required for delivery of priority skills training that supports workforce and economic development. |
| • | | $4.3 million to continue refurbishment and enhancement of existing early childhood education and care facilities. |
35
Capital Statement 2017-18
Program Highlights (Capital Grants)
| • | | $92.7 million is provided in 2017-18 to the Non-State Schooling sector. |
| | | | | | | | | | | | | | | | | | | | |
| Education and Training | |
Project | | Statistical
Area | | | Total
Estimated
Cost
$‘000 | | | Expenditure
to
30-06-17
$‘000 | | | Budget
2017-18
$‘000 | | | Post
2017-18
$‘000 | |
DEPARTMENT OF EDUCATION AND TRAINING | | | | | | | | | | | | | | | | | | | | |
| | | | | |
Property, Plant and Equipment | | | | | | | | | | | | | | | | | | | | |
Capital Works Program | | | | | | | | | | | | | | | | | | | | |
Education Capital Works Program | | | | | | | | | | | | | | | | | | | | |
New Primary School in Caloundra South | | | 316 | | | | 31,953 | | | | 8,818 | | | | 11,906 | | | | 11,229 | |
New Primary School in Coomera | | | 309 | | | | 32,742 | | | | 8,862 | | | | 11,780 | | | | 12,100 | |
New Primary School in Yarrabilba | | | 311 | | | | 36,023 | | | | 6,459 | | | | 14,044 | | | | 15,520 | |
New Primary School in Burdell (Townsville) | | | 318 | | | | 43,226 | | | | 6,287 | | | | 21,312 | | | | 15,627 | |
Allenstown State School - Classrooms and amenities refurbishment | | | 308 | | | | 1,032 | | | | 172 | | | | 860 | | | | | |
Ayr State High School - Air-conditioning replacement | | | 318 | | | | 729 | | | | 162 | | | | 567 | | | | | |
Balmoral State High School - New multi-purpose sports facility | | | 305 | | | | 2,580 | | | | 182 | | | | 2,398 | | | | | |
Bentley Park College - Upgrade/refurbishment of hall | | | 306 | | | | 1,290 | | | | 96 | | | | 1,194 | | | | | |
Bohlevale State School - Upgrade - Hall | | | 318 | | | | 1,290 | | | | 91 | | | | 1,199 | | | | | |
Bounty Boulevard State School - New multi-purpose hall | | | 314 | | | | 4,300 | | | | 821 | | | | 3,479 | | | | | |
Boyne Island State School - Upgrade - Hall | | | 308 | | | | 1,032 | | | | 79 | | | | 953 | | | | | |
Branyan Road State School - Additional classrooms | | | 319 | | | | 2,325 | | | | | | | | 465 | | | | 1,860 | |
Bray Park State High School - Multi-Purpose Hall extension | | | 314 | | | | 2,580 | | | | 182 | | | | 2,398 | | | | | |
Bundaberg State High School - Performing arts upgrade | | | 319 | | | | 1,720 | | | | 172 | | | | 1,548 | | | | | |
36
Capital Statement 2017-18
| | | | | | | | | | | | | | | | | | |
| Education and Training | |
Project | | Statistical
Area | | Total
Estimated
Cost
$‘000 | | | Expenditure
to
30-06-17
$‘000 | | | Budget
2017-18
$‘000 | | | Post
2017-18
$‘000 | |
Caboolture Special School - Additional classrooms | | 313 | | | 6,994 | | | | 2,697 | | | | 4,297 | | | | | |
Cairns West State School - Additional classrooms | | 306 | | | 4,771 | | | | 191 | | | | 4,580 | | | | | |
Caningeraba State School - Additional classrooms | | 309 | | | 5,673 | | | | 1,315 | | | | 4,358 | | | | | |
Cannon Hill State School - Air-conditioning replacement | | 303 | | | 912 | | | | 527 | | | | 385 | | | | | |
Caravonica State School - New multi-purpose hall | | 306 | | | 3,870 | | | | 274 | | | | 3,596 | | | | | |
Cavendish Road State High School - New multi-purpose hall | | 303 | | | 5,160 | | | | 363 | | | | 4,797 | | | | | |
Centenary Heights State High School - Additional classrooms | | 317 | | | 9,765 | | | | 465 | | | | 930 | | | | 8,370 | |
Chancellor State College - Additional classrooms | | 316 | | | 3,255 | | | | | | | | 465 | | | | 2,790 | |
Chinchilla State High School - New multi-purpose hall | | 307 | | | 3,870 | | | | 272 | | | | 3,598 | | | | | |
Claremont Special School - Additional classrooms | | 310 | | | 8,174 | | | | 2,755 | | | | 5,419 | | | | | |
Cleveland District State High School - New multi-purpose hall | | 301 | | | 5,160 | | | | 363 | | | | 4,797 | | | | | |
Clinton State School - Air-conditioning replacement | | 308 | | | 1,499 | | | | 770 | | | | 729 | | | | | |
Cooktown State School - Air-conditioning replacement | | 315 | | | 1,239 | | | | 920 | | | | 319 | | | | | |
Coolum State High School - Additional classrooms | | 316 | | | 4,073 | | | | 874 | | | | 3,199 | | | | | |
Crestmead State School - Additional classrooms | | 311 | | | 4,743 | | | | 1,603 | | | | 3,140 | | | | | |
Currimundi Special School - Additional classrooms | | 316 | | | 9,486 | | | | 316 | | | | 6,584 | | | | 2,586 | |
Dundula State School - Administration refurbishment | | 312 | | | 860 | | | | 344 | | | | 516 | | | | | |
Edge Hill State School - Air-conditioning replacement | | 306 | | | 729 | | | | 324 | | | | 405 | | | | | |
37
Capital Statement 2017-18
| | | | | | | | | | | | | | | | | | |
| Education and Training | |
Project | | Statistical
Area | | Total
Estimated
Cost
$‘000 | | | Expenditure
to
30-06-17
$‘000 | | | Budget
2017-18
$‘000 | | | Post
2017-18
$‘000 | |
Eimeo Road State School - Additional classrooms | | 312 | | | 6,649 | | | | 496 | | | | 5,867 | | | | 286 | |
Emerald State High School - Upgrade - Hall | | 308 | | | 1,290 | | | | 98 | | | | 1,192 | | | | | |
Enoggera State School - New Performing Arts facility | | 304 | | | 2,780 | | | | 2,468 | | | | 312 | | | | | |
Flagstone State Community College - Additional classrooms | | 311 | | | 860 | | | | 172 | | | | 688 | | | | | |
Gladstone State High School - Additional classrooms | | 308 | | | 5,580 | | | | 1,697 | | | | 3,883 | | | | | |
Goodna State School - Additional classrooms | | 310 | | | 4,464 | | | | 19 | | | | 465 | | | | 3,980 | |
Gordonvale State High School - Indoor sports facility | | 306 | | | 3,870 | | | | 272 | | | | 3,598 | | | | | |
Gympie Special School - Additional classrooms | | 319 | | | 7,440 | | | | 1,314 | | | | 6,126 | | | | | |
Gympie State High School - Agricultural education facility refurbishment | | 319 | | | 430 | | | | 172 | | | | 258 | | | | | |
Highfields State Secondary College - Stage 3 | | 317 | | | 11,160 | | | | | | | | 1,860 | | | | 9,300 | |
Homebush State School - Additional classrooms | | 312 | | | 456 | | | | 204 | | | | 252 | | | | | |
Indooroopilly State School - Additional classrooms | | 304 | | | 2,790 | | | | | | | | 465 | | | | 2,325 | |
Ipswich West Special School - Additional classrooms | | 310 | | | 7,440 | | | | 1,156 | | | | 6,272 | | | | 12 | |
Kedron State School - Additional classrooms | | 302 | | | 3,720 | | | | | | | | 465 | | | | 3,255 | |
Kelvin Grove State College - Additional classrooms | | 305 | | | 7,235 | | | | 5,827 | | | | 1,408 | | | | | |
Kelvin Grove State College - Indoor sports facility | | 305 | | | 5,160 | | | | 362 | | | | 4,798 | | | | | |
Kepnock State High School - Administration refurbishment and extension | | 319 | | | 860 | | | | 172 | | | | 688 | | | | | |
Kepnock State High School - New multi-purpose hall | | 319 | | | 3,870 | | | | 272 | | | | 3,598 | | | | | |
Kingaroy State High School - New multi-purpose hall | | 319 | | | 3,870 | | | | 272 | | | | 3,598 | | | | | |
38
Capital Statement 2017-18
| | | | | | | | | | | | | | | | | | |
| Education and Training | |
Project | | Statistical
Area | | Total
Estimated
Cost
$‘000 | | | Expenditure
to
30-06-17
$‘000 | | | Budget
2017-18
$‘000 | | | Post
2017-18
$‘000 | |
Kirwan State High School - Air-conditioning replacement | | 318 | | | 729 | | | | 81 | | | | 648 | | | | | |
Kirwan State High School - Replace Multi-purpose Hall | | 318 | | | 5,160 | | | | 363 | | | | 4,797 | | | | | |
Lockyer District State High School - Upgrade - Hall | | 317 | | | 1,290 | | | | 98 | | | | 1,192 | | | | | |
MacGregor State High School - Manual arts facility replacement | | 303 | | | 3,010 | | | | 172 | | | | 2,838 | | | | | |
Mackay North State High School - Air-conditioning replacement | | 312 | | | 3,119 | | | | 486 | | | | 2,633 | | | | | |
Mackay Northern Beaches State High School - Stage 3 | | 312 | | | 6,696 | | | | | | | | 1,116 | | | | 5,580 | |
Mackay West State School - Classroom refurbishment | | 312 | | | 860 | | | | 172 | | | | 688 | | | | | |
Mango Hill State School - Additional classrooms | | 314 | | | 5,848 | | | | 1,229 | | | | 4,619 | | | | | |
Mansfield State High School - New multi-purpose hall | | 303 | | | 5,160 | | | | 363 | | | | 4,797 | | | | | |
Mareeba State School - Site redevelopment | | 306 | | | 3,440 | | | | 172 | | | | 3,268 | | | | | |
Maroochydore State High School - Additional classrooms | | 316 | | | 1,612 | | | | 494 | | | | 1,118 | | | | | |
Marsden State High School - Replace multi-purpose hall | | 311 | | | 5,160 | | | | 363 | | | | 4,797 | | | | | |
Maryborough State High School - New multi-purpose hall | | 319 | | | 3,870 | | | | 272 | | | | 3,598 | | | | | |
Meridan State College - Additional classrooms | | 316 | | | 4,650 | | | | 3,832 | | | | 818 | | | | | |
Mitchelton Special School - Additional classrooms | | 304 | | | 5,673 | | | | | | | | 465 | | | | 5,208 | |
Morayfield State High School - Additional classrooms | | 313 | | | 1,720 | | | | 344 | | | | 1,376 | | | | | |
Mossman State High School - Upgrade - Hall | | 306 | | | 860 | | | | 66 | | | | 794 | | | | | |
Mount Ommaney Special School - Additional classrooms | | 304 | | | 2,790 | | | | | | | | 465 | | | | 2,325 | |
Nambour Special School - Additional classrooms | | 316 | | | 4,650 | | | | 77 | | | | 4,444 | | | | 129 | |
39
Capital Statement 2017-18
| | | | | | | | | | | | | | | | | | |
| Education and Training | |
Project | | Statistical
Area | | Total
Estimated
Cost
$‘000 | | | Expenditure
to
30-06-17
$‘000 | | | Budget
2017-18
$‘000 | | | Post
2017-18
$‘000 | |
Narangba Valley State School - Additional classrooms | | 313 | | | 2,790 | | | | 93 | | | | 2,697 | | | | | |
New Farm State School - Additional classrooms | | 305 | | | 4,134 | | | | 1,558 | | | | 2,576 | | | | | |
North Lakes State College - Additional classrooms | | 314 | | | 13,949 | | | | 513 | | | | 8,969 | | | | 4,467 | |
Northern Peninsula Area College - Bamaga Junior Campus - New covered multi-purpose court and storage area | | 315 | | | 2,580 | | | | 181 | | | | 2,399 | | | | | |
Pimpama State School - Additional classrooms | | 309 | | | 5,115 | | | | | | | | 465 | | | | 4,650 | |
Pimpama State School - New multi-purpose hall | | 309 | | | 4,300 | | | | 304 | | | | 3,996 | | | | | |
Pimpama State Secondary College - Stage 4 | | 309 | | | 5,580 | | | | | | | | 5,580 | | | | | |
Redcliffe Special School - Additional classrooms | | 313 | | | 6,012 | | | | 1,465 | | | | 4,547 | | | | | |
Redcliffe State High School - New Hall and Administration | | 313 | | | 6,009 | | | | 1,403 | | | | 4,606 | | | | | |
Redland Bay State School - Classroom upgrade and administration extension | | 301 | | | 860 | | | | 172 | | | | 688 | | | | | |
Richlands East State School - Additional classrooms | | 310 | | | 3,255 | | | | | | | | 465 | | | | 2,790 | |
Rockhampton Special School - Additional classrooms | | 308 | | | 3,488 | | | | 977 | | | | 2,511 | | | | | |
Southport Special School - Additional classrooms | | 309 | | | 1,720 | | | | 86 | | | | 1,634 | | | | | |
Southport Special School - New Building | | 309 | | | 7,206 | | | | 4,376 | | | | 2,830 | | | | | |
Spinifex State College - Mount Isa - Senior Campus - Upgrade - Hall | | 315 | | | 860 | | | | 66 | | | | 794 | | | | | |
Springfield Central State High School - New multi-purpose hall | | 310 | | | 5,160 | | | | 363 | | | | 4,797 | | | | | |
Sunnybank Special School - Site redevelopment | | 303 | | | 4,300 | | | | 172 | | | | 4,128 | | | | | |
40
Capital Statement 2017-18
| | | | | | | | | | | | | | | | | | |
| Education and Training | |
Project | | Statistical
Area | | Total
Estimated
Cost
$‘000 | | | Expenditure
to
30-06-17
$‘000 | | | Budget
2017-18
$‘000 | | | Post
2017-18
$‘000 | |
Tamborine Mountain State High School - Additional classrooms | | 309 | | | 1,488 | | | | 302 | | | | 1,186 | | | | | |
The Gap State School - Upgrade - Hall | | 304 | | | 1,290 | | | | 98 | | | | 1,192 | | | | | |
Tinana State School - Additional classrooms | | 319 | | | 860 | | | | 172 | | | | 688 | | | | | |
Trinity Bay State High School - New multi-purpose hall | | 306 | | | 5,160 | | | | 363 | | | | 4,797 | | | | | |
Wavell State High School - New performing arts/music facility | | 302 | | | 5,160 | | | | 363 | | | | 4,797 | | | | | |
West End State School - Additional classrooms and resource centre | | 305 | | | 9,525 | | | | 5,616 | | | | 3,909 | | | | | |
Western Cape College - Weipa - Air-conditioning replacement | | 315 | | | 3,888 | | | | 405 | | | | 3,483 | | | | | |
Wilsonton State High School | | 317 | | | 3,870 | | | | 274 | | | | 3,596 | | | | | |
Yarrilee State School - Administration extension | | 319 | | | 1,084 | | | | 82 | | | | 1,002 | | | | | |
Yeppoon State High School - Upgrade - Hall | | 308 | | | 1,290 | | | | 98 | | | | 1,192 | | | | | |
Metropolitan Region - Mount Gravatt Office Refurbishment | | 303 | | | 2,080 | | | | 1,177 | | | | 903 | | | | | |
Land Acquisition1 | | Various | | | | | | | | | | | 69,019 | | | | Ongoing | |
Public Private Partnerships | | Various | | | | | | | | | | | 44,011 | | | | Ongoing | |
School Subsidy Scheme | | Various | | | | | | | | | | | 4,650 | | | | Ongoing | |
Significant Regional Infrastructure Projects Program | | Various | | | | | | | | | | | 19,023 | | | | Ongoing | |
General and Minor Works | | Various | | | | | | | | | | | 42,446 | | | | Ongoing | |
School Infrastructure Enhancement capital contribution | | Various | | | | | | | | | | | 11,000 | | | | Ongoing | |
Building Future Schools Fund | | Various | | | 500,000 | | | | | | | | 28,000 | | | | 472,000 | |
| | | | | | | | | | | | | | | | | | |
Sub-total Education Capital Works Program | | | | | | | | | | | | | 515,057 | | | | | |
| | | | | | | | | | | | | | | | | | |
| | | | | |
Training Capital Works Program | | | | | | | | | | | | | | | | | | |
Training Assets - Asset Replacement Program | | Various | | | | | | | | | | | 5,500 | | | | Ongoing | |
Training Assets - Emergent Replacement | | Various | | | | | | | | | | | 1,000 | | | | Ongoing | |
Training Assets - Property Management Program | | Various | | | | | | | | | | | 1,500 | | | | Ongoing | |
41
Capital Statement 2017-18
| | | | | | | | | | | | | | | | | | | | |
| Education and Training | |
Project | | Statistical
Area | | | Total
Estimated
Cost
$‘000 | | | Expenditure
to
30-06-17
$‘000 | | | Budget
2017-18
$‘000 | | | Post
2017-18
$‘000 | |
Training Assets - Renewal and Reinvigoration | | | Various | | | | | | | | | | | | 9,250 | | | | Ongoing | |
| | | | | | | | | | | | | | | | | | | | |
Sub-total Training Capital Works Program | | | | | | | | | | | | | | | 17,250 | | | | | |
| | | | | | | | | | | | | | | | | | | | |
| | | | | |
Early Childhood Education and Care Capital Works Program | | | | | | | | | | | | | | | | | | | | |
Capalaba State College - Redland Bay Early Years Service | | | 301 | | | | 1,554 | | | | 127 | | | | 1,427 | | | | | |
Tara Shire State College - Early Years Service | | | 307 | | | | 1,907 | | | | | | | | 1,342 | | | | 565 | |
General and Minor Works | | | Various | | | | | | | | | | | | 1,486 | | | | Ongoing | |
| | | | | | | | | | | | | | | | | | | | |
Sub-total Early Childhood Education and Care Capital Works Program | | | | | | | | | | | | | | | 4,255 | | | | | |
| | | | | | | | | | | | | | | | | | | | |
| | | | | | | | | | | | | | | | | | | | |
| | | | | | | | | | | | | | | | | | | | |
Sub-total Capital Works Program | | | | | | | | | | | | | | | 536,562 | | | | | |
| | | | | | | | | | | | | | | | | | | | |
| | | | | |
Plant and Equipment | | | Various | | | | | | | | | | | | 44,028 | | | | Ongoing | |
| | | | | | | | | | | | | | | | | | | | |
Total Property, Plant and Equipment | | | | | | | | | | | | | | | 580,590 | | | | | |
| | | | | | | | | | | | | | | | | | | | |
| | | | | |
Capital Grants | | | | | | | | | | | | | | | | | | | | |
Capital Grants | | | Various | | | | | | | | | | | | 92,675 | | | | Ongoing | |
| | | | | | | | | | | | | | | | | | | | |
Total Capital Grants | | | | | | | | | | | | | | | 92,675 | | | | | |
| | | | | | | | | | | | | | | | | | | | |
| | | | | |
QUEENSLAND CURRICULUM AND ASSESSMENT AUTHORITY | | | | | | | | | | | | | | | | | | | | |
| | | | | |
Property, Plant and Equipment | | | | | | | | | | | | | | | | | | | | |
Enrolments and Achievements for Senior Learners System | | | 305 | | | | 2,701 | | | | 1,803 | | | | 898 | | | | | |
Contact Management System | | | 305 | | | | 998 | | | | 548 | | | | 450 | | | | | |
Endorsed Assessment System | | | 305 | | | | 1,137 | | | | 455 | | | | 682 | | | | | |
Assessor, Invigilator & Marker Management System | | | 305 | | | | 380 | | | | 130 | | | | 250 | | | | | |
Identity and Access Management System | | | 305 | | | | 1,351 | | | | 783 | | | | 568 | | | | | |
VET Management | | | 305 | | | | 1,289 | | | | 510 | | | | 779 | | | | | |
Syllabus Online | | | 305 | | | | 401 | | | | 251 | | | | 150 | | | | | |
Professional Development Online | | | 305 | | | | 400 | | | | 200 | | | | 200 | | | | | |
Confirmation Online | | | 305 | | | | 438 | | | | 215 | | | | 223 | | | | | |
Other Plant & Equipment | | | 305 | | | | | | | | | | | | 140 | | | | Ongoing | |
| | | | | | | | | | | | | | | | | | | | |
Total Property, Plant and Equipment | | | | | | | | | | | | | | | 4,340 | | | | | |
| | | | | | | | | | | | | | | | | | | | |
42
Capital Statement 2017-18
| | | | | | | | | | | | | | | | | | |
| Education and Training | |
Project | | Statistical
Area | | Total
Estimated
Cost
$‘000 | | | Expenditure
to
30-06-17
$‘000 | | | Budget
2017-18
$‘000 | | | Post
2017-18
$‘000 | |
| | | | | |
TAFE QUEENSLAND | | | | | | | | | | | | | | | | | | |
| | | | | |
Property, Plant and Equipment | | | | | | | | | | | | | | | | | | |
Plant and equipment replacement | | Various | | | | | | | | | | | 6,272 | | | | Ongoing | |
Minor capital projects and acquisitions | | Various | | | | | | | | | | | 484 | | | | Ongoing | |
Product Development | | Various | | | | | | | | | | | 7,458 | | | | Ongoing | |
Student Management System | | Various | | | 18,758 | | | | 13,297 | | | | 5,461 | | | | | |
| | | | | | | | | | | | | | | | | | |
Total Property, Plant and Equipment | | | | | | | | | | | | | 19,675 | | | | | |
| | | | | | | | | | | | | | | | | | |
| | | | | | | | | | | | | | | | | | |
| | | | | | | | | | | | | | | | | | |
TOTAL EDUCATION AND TRAINING (PPE) | | | | | | | | | | | | | 604,605 | | | | | |
| | | | | | | | | | | | | | | | | | |
| | | | | | | | | | | | | | | | | | |
| | | | | | | | | | | | | | | | | | |
TOTAL EDUCATION AND TRAINING (CG) | | | | | | | | | | | | | 92,675 | | | | | |
| | | | | | | | | | | | | | | | | | |
Note:
| 1. | $61.8 million out of $69 million in 2017-18 relates to the land acquisitions for new schools as part of the $200 million in total funding to fast track state school infrastructure. |
43
Capital Statement 2017-18
| 3.5 | ELECTORAL COMMISSION OF QUEENSLAND |
An amount of $6.3 million has been deferred from 2016-17 to 2017-18 to replace the Commission’s Strategic Elections Management System (SEMS). A further $79,000 has been allocated for the ongoing replacement of plant and equipment.
| | | | | | | | | | | | | | | | | | |
| Electoral Commission of Queensland | |
Project | | Statistical
Area | | Total
Estimated
Cost
$‘000 | | | Expenditure
to
30-06-17
$‘000 | | | Budget
2017-18
$‘000 | | | Post
2017-18
$‘000 | |
ELECTORAL COMMISSION OF QUEENSLAND | | | | | | | | | | | | | | | | | | |
| | | | | |
Property, Plant and Equipment | | | | | | | | | | | | | | | | | | |
Plant & Equipment | | 305 | | | | | | | | | | | 79 | | | | Ongoing | |
SEMS Replacement Project | | 305 | | | 6,306 | | | | | | | | 6,306 | | | | | |
| | | | | | | | | | | | | | | | | | |
Total Property, Plant and Equipment | | | | | | | | | | | | | 6,385 | | | | | |
| | | | | | | | | | | | | | | | | | |
| | | | | | | | | | | | | | | | | | |
| | | | | | | | | | | | | | | | | | |
TOTAL ELECTORAL COMMISSION OF QUEENSLAND (PPE) | | | | | | | | | | | | | 6,385 | | | | | |
| | | | | | | | | | | | | | | | | | |
44
Capital Statement 2017-18
| 3.6 | ENERGY AND WATER SUPPLY |
The Energy and Water Supply portfolio includes the Department of Energy and Water Supply, statutory bodies reporting to the Minister for Energy, Biofuels and Water Supply, and energy and water supply government-owned corporations. The portfolio capital program for 2017-18 is $2.063 billion. The capital works program supports the Government commitment to deliver cost effective, safe, secure and reliable energy and water supply.
CS Energy Limited
Total capital expenditure planned for 2017-18 is $93.6 million. This reflects the continued commitment to ongoing reliability and efficiency of generation plant at its power station sites.
Program Highlights (Property, Plant and Equipment)
| • | | $55.1 million for improvements to the Callide Power Stations, including $27.4 million for overhaul work. |
| • | | $11.8 million for improvements to the Kogan Creek Power Station, including $3.5 million for overhaul work. |
| • | | $8.2 million for Kogan Creek Mine projects. |
| • | | $12.3 million for improvements to the Wivenhoe Power Station, including $10.5 million for overhaul work. |
| • | | $6.2 million for Corporate Capital costs primarily for Information Communication and Technology projects. |
Stanwell Corporation Limited
Total capital expenditure planned for 2017-18 is $149.1 million. This primarily relates to replacement, refurbishment and upgrades to plant and equipment at its various power sites.
Program Highlights (Property, Plant and Equipment)
| • | | $14.9 million for Tarong Power Station projects including $8 million for the overhaul of Tarong North Power Station. |
| • | | $50.5 million for Meandu Mine projects including $16.7 million for Coal Handling Preparation Plant replacements and upgrades, $14.3 million for the mine development area and $6.8 million for the mine Truck and Shovel replacement program. |
| • | | $53.8 million for Stanwell Power Station projects including $24.3 million for major overhauls, $14.4 million for the upgrade of the Control System and $7.4 million for the Unit Cooling Water Mid Life Condenser Re-tube. |
45
Capital Statement 2017-18
| • | | $3 million for Mica Creek Power Station projects including $2.1 million for the C2 unit overhaul. |
| • | | $2.5 million for Stanwell’s Hydro Power Stations. |
| • | | $473,000 for Swanbank Power Station sustaining projects. |
| • | | $19.1 million for Information Technology expenditure including $11.2 million for hardware and software upgrades and $7.9 million for upgrades and replacements of major Information Communication and Technology systems. |
Energy Queensland
Total capital expenditure planned for 2017-18 is $1.412 billion. This forms part of Energy Queensland’s commitment to providing a safe, secure and highly reliable electricity supply to all Queensland customers that is both cost effective and dependable by continuing a focus on efficiencies, asset management and network capability.
The capital program aims to improve and reinforce electricity supplies across Queensland to meet customer needs especially to cover peak electricity demand periods, and to support the increased use of residential solar power, storage batteries, electric vehicles and air-conditioners.
Program Highlights (Property, Plant and Equipment)
| • | | $6.9 million to continue work on the multi-stage SunCoast Power Project to increase network capacity and improve reliability on the Sunshine Coast. |
| • | | $4.9 million to continue the redevelopment of the Bundall Substation to increase network capacity and improve reliability. |
| • | | $16.3 million to upgrade radio communications between Mackay and Maryborough. |
| • | | $20.6 million to redevelop the Garbutt Depot and Logistics Centre Stage 2. |
| • | | $2.9 million to upgrade the Palm Beach Substation to improve network performance. |
| • | | $7.3 million to upgrade the Labrador Substation to improve network performance. |
| • | | $1.9 million to upgrade the Nudgee Substation to improve network performance. |
| • | | $2.3 million to upgrade the Caboolture West Substation to improve network performance. |
46
Capital Statement 2017-18
| • | | $3.6 million to develop the new Gracemere Substation to improve network performance. |
| • | | $1.3 million to upgrade the Amamoor Substation to improve network performance. |
Powerlink Queensland
Total capital expenditure planned for 2017-18 is $196.5 million. This is predominantly focused on refit or replacement of aged equipment and assets to ensure continued reliable supply of electricity.
Program Highlights (Property, Plant and Equipment)
| • | | $8.3 million to refit aged assets on the Collinsville to Proserpine transmission line in the Mackay region. |
| • | | $9 million to replace aged assets at the Nebo Substation in the Mackay region, including primary plant equipment, secondary systems equipment and a 275/132kV transformer. |
| • | | $8.6 million to replace aged primary plant and secondary systems equipment at the Mackay Substation. |
| • | | $6 million to replace aged secondary systems equipment at the Rocklea Substation in the Brisbane region. |
| • | | $4 million to replace aged secondary systems equipment at the Calvale and Callide B Substations in the Central Queensland region. |
| • | | $3.6 million to replace aged secondary systems equipment at the Ross Substation in the Townsville region. |
SunWater Limited
Total capital expenditure planned for 2017-18 is $48.7 million. This spend will include a focus on the continuation of a reliable bulk water supply for regional Queensland and ensuring SunWater’s dams are enhanced to meet the extreme weather events that the State can experience.
Program Highlights (Property, Plant and Equipment)
| • | | $12.9 million for improvement works at Boondooma Dam with planned construction to further strengthen the dam spillway including side wall repair. |
| • | | $9.7 million for SunWater’s refurbishment and enhancement annual program of works to repair, maintain, renew and enhance existing water infrastructure assets and water supply schemes across regional Queensland. |
47
Capital Statement 2017-18
| • | | $4.6 million for improvement works at Burdekin Falls Dam with planned construction to improve the efficiency of existing drains in the spillway, installation of additional drains and to enhance the anchoring of the rock foundation. |
| • | | $2.4 million to continue improvement works at Paradise Dam with planned construction to further strengthen the dam spillway (monoliths D and K) to withstand extreme weather events. |
| • | | $4 million for the Emergency Management Response Plan associated with the continued improvement of SunWater’s dedicated flood control room, including specific computer and communications systems fit out and associated software. |
| • | | $416,000 for Feasibility Studies investigating: |
Lower Fitzroy River Infrastructure Project - the proposed construction of weirs on the Fitzroy River to help meet future water demand from urban populations, industry and agriculture in Rockhampton, Gladstone and the Capricorn Coast, including an Environmental Impact Assessment and Water Infrastructure Strategy Report.
Nathan Dam and Pipelines Project - the proposed construction of water storage and pipeline infrastructure to provide reliable water for agriculture, industry and urban populations in the Surat Coal Basin and the Dawson-Callide region, and potentially addressing critical water supply needs in the Lower Fitzroy, including an Environmental Impact Assessment.
| • | | $7.1 million for Software Development and Hardware involving the renewal and replacement of computer equipment and security enhancements to SunWater’s business and data (flood/water level monitoring) networks and replacement of the Enterprise Resource Platform. |
| • | | $7.5 million for plant and equipment, including capital expenditure associated with vehicles, trailers, pumps and valves required for SunWater’s operations and minor works (projects under $250,000). |
Gladstone Area Water Board
Total capital expenditure planned for 2017-18 is $27.1 million. The capital program is focused on continuing effective and safe operations of Gladstone Area Water Board’s (GAWB) Property, Plant and Equipment, while maintaining a state of preparedness as per GAWB’s Contingent Supply Strategy.
Program Highlights (Property, Plant and Equipment)
| • | | $20.2 million for the Offline Standby Storage and Repump Station project, due for completion in 2018, will provide 14 days of raw water supply independent of critical infrastructure at Awoonga Dam, to mitigate risk and facilitate planned maintenance of critical infrastructure. |
48
Capital Statement 2017-18
| • | | $2.7 million for the Low Lift and High Lift Pump Station project, designed to replace aged electrical and pumping equipment at the Gladstone Water Treatment Plant, allowing for greater operational control, better pumping efficiency and efficiencies in energy consumption. |
| • | | $600,000 for the East End reservoir various works project, designed to replace the roof, both internal and external ladders, carry out repairs to the construction joints plus undertake patch repairs to the concrete walls and anchor blocks of the reservoir. |
| • | | $530,000 for the Yarwun Water Treatment Plant switchboard replacement as it has reached the end of its useful life. The project is to replace the existing switchboard and update the equipment related to the Motor Control Centre switchboard. |
Mount Isa Water Board
Total capital expenditure planned for 2017-18 is $17.2 million. The capital program is focused on the continuing cost-effective, reliable, and safe operation of Mount Isa Water Board’s (MIWB) Property, Plant and Equipment. While the majority of projects are programed to extend beyond 2017-18, two major projects with a total cost of approximately $3.2 million (Mount Isa Terminal Reservoir South Tank and Power Reliability Moondarra System) are expected to be completed within the financial year.
Program Highlights (Property, Plant and Equipment)
| • | | $8 million for supply reliability of the Clear Water Lagoon - Mount Isa Terminal Reservoir Storage Tanks Project, which will start construction of 35-megalitre operational storage tanks on the Mount Isa Mines site, including associated pipelines and ancillary infrastructure. This will address both the future service reliability of water supply to Mount Isa Mines and more broadly the supply reliability from Clear Water Lagoon to Mount Isa Terminal Reservoir. |
| • | | $1.8 million for the Mount Isa Terminal Reservoir Storage Tanks project, which will see construction of new potable storage tanks to replace the leaking tank at the Mount Isa Terminal Reservoir. This will eliminate water losses, improve water supply reliability and address water quality assurance requirements. |
| • | | $1.4 million for power reliability to the Moondarra system, to refurbish the Moondarra switchyard and install alternative power supply to the Col Popple Pump Station, which will improve power supply reliability to the Deep Well and Col Popple Pump Stations, and the R48 Reserve. |
49
Capital Statement 2017-18
| • | | $1 million to initiate project implementation of the solar power supply for the Lake Julius system to address increases in electrical costs and secure cost effective water supply from Lake Julius - especially during drought periods. |
| • | | $1.6 million allocated for various projects related to asset enhancements and renewals, including improvements to water quality and site security and safety. |
Seqwater
Total capital expenditure planned for 2017-18 is $118.5 million. The capital program is focused on the continuation of a safe, secure and reliable water supply for South East Queensland, as well as providing essential flood mitigation services and managing catchment health. Seqwater has facilities located throughout South East Queensland. These require minor works and renewals, as well as upgrades and compliance driven works to ensure effective operation.
Program Highlights (Property, Plant and Equipment)
| • | | $6 million for the continuation of the sludge handling upgrade at North Pine Water Treatment Plant to reduce capacity constraints. |
| • | | $3.9 million to connect the Petrie Water Supply Zone to an alternative bulk water supply point, which is a joint project with Unitywater. |
| • | | $2 million to continue planning works in relation to the Lake MacDonald Dam safety upgrade to comply with dam safety regulations. |
| • | | $2 million for the Sideling Creek Dam safety upgrade to comply with dam safety regulations. |
| • | | $2 million for the Lowood Water Treatment Plant upgrade to ensure improved water quality, supply reliability and regulatory compliance. |
| • | | $1.8 million for improving flood resilience at the Mount Crosby East Bank Water Pump Station. |
| • | | $1.8 million to continue the refurbishment and upgrade 20 filters at the Mount Crosby East Bank Water Treatment Plant to maintain and improve capability and reliability. |
| • | | $269,000 to continue the planning for the proposed pipeline connection for Beaudesert to the water grid to secure long-term water supply. |
50
Capital Statement 2017-18
| | | | | | | | | | | | | | | | | | | | |
| Energy and Water Supply | |
Project | | Statistical
Area | | | Total
Estimated
Cost
$‘000 | | | Expenditure
to
30-06-17
$‘000 | | | Budget
2017-18
$‘000 | | | Post
2017-18
$‘000 | |
DEPARTMENT OF ENERGY AND WATER SUPPLY | | | | | | | | | | | | | | | | | | | | |
| | | | | |
CS ENERGY LIMITED | | | | | | | | | | | | | | | | | | | | |
| | | | | |
Property, Plant and Equipment | | | | | | | | | | | | | | | | | | | | |
Callide Power Station enhancements, overhauls and refurbishment | | | 308 | | | | 55,105 | | | | | | | | 55,105 | | | | | |
Kogan Creek Power Station enhancements, overhauls and refurbishment | | | 307 | | | | 11,799 | | | | | | | | 11,799 | | | | | |
Kogan Creek Mine developments and refurbishment | | | 307 | | | | 8,231 | | | | | | | | 8,231 | | | | | |
Wivenhoe Power Station enhancements, overhauls and refurbishment | | | 310 | | | | 12,312 | | | | | | | | 12,312 | | | | | |
Upgrade of corporate information systems to support the business | | | 305 | | | | 6,195 | | | | | | | | 6,195 | | | | | |
| | | | | | | | | | | | | | | | | | | | |
Total Property, Plant and Equipment | | | | | | | | | | | | | | | 93,642 | | | | | |
| | | | | | | | | | | | | | | | | | | | |
| | | | |
STANWELL CORPORATION LIMITED | | | | | | | | | | | | | | | | | |
| | | | | |
Property, Plant and Equipment | | | | | | | | | | | | | | | | | | | | |
Barron Gorge Power Station - Minor Works | | | 306 | | | | 355 | | | | | | | | 355 | | | | | |
Kareeya Power Station - Minor Works | | | 306 | | | | 1,647 | | | | | | | | 1,647 | | | | | |
Koombooloomba Power Station - Minor Works | | | 306 | | | | 404 | | | | | | | | 404 | | | | | |
Wivenhoe Power Station - Minor Works | | | 310 | | | | 56 | | | | | | | | 56 | | | | | |
Swanbank Power Station - Minor Works | | | 310 | | | | 473 | | | | | | | | 473 | | | | | |
Mica Creek Power Station | | | | | | | | | | | | | | | | | | | | |
Mica Creek Power Station - Minor Works | | | 315 | | | | 868 | | | | | | | | 868 | | | | | |
Mica Creek Power Station - Overhauls | | | 315 | | | | 2,110 | | | | | | | | 2,110 | | | | | |
51
Capital Statement 2017-18
| | | | | | | | | | | | | | | | | | | | |
| Energy and Water Supply | |
Project | | Statistical
Area | | | Total
Estimated
Cost
$‘000 | | | Expenditure
to
30-06-17
$‘000 | | | Budget
2017-18
$‘000 | | | Post
2017-18
$‘000 | |
Meandu Mine | | | | | | | | | | | | | | | | | | | | |
Meandu Mine - Exploration and Evaluation | | | 319 | | | | 250 | | | | | | | | 250 | | | | | |
Meandu Mine - Coal Handling Preparation Plant Replacements and Upgrades | | | 319 | | | | 16,655 | | | | | | | | 16,655 | | | | | |
Meandu Mine - Development Program | | | 319 | | | | 4,897 | | | | | | | | 4,897 | | | | | |
Meandu Mine - Dozer Replacement Programs | | | 319 | | | | 2,400 | | | | | | | | 2,400 | | | | | |
Meandu Mine - Ancillary Fleet Equipment Replacement Programs | | | 319 | | | | 3,997 | | | | | | | | 3,997 | | | | | |
Meandu Mine - Truck and Shovel Replacement Programs | | | 319 | | | | 6,800 | | | | | | | | 6,800 | | | | | |
Meandu Mine - Minor Works | | | 319 | | | | 1,235 | | | | | | | | 1,235 | | | | | |
Meandu Mine - Mine Development | | | 319 | | | | 14,295 | | | | | | | | 14,295 | | | | | |
Stanwell Power Station | | | | | | | | | | | | | | | | | | | | |
Stanwell Power Station - Other Sustaining Projects | | | 308 | | | | 7,707 | | | | | | | | 7,707 | | | | | |
Stanwell Power Station - Control System Upgrade | | | 308 | | | | 68,000 | | | | 27,577 | | | | 14,369 | | | | 26,054 | |
Stanwell Power Station - Unit Cooling Water Mid Life Condenser Retube | | | 308 | | | | 30,743 | | | | 17,637 | | | | 7,422 | | | | 5,684 | |
Stanwell Power Station - Overhauls | | | 308 | | | | 24,341 | | | | | | | | 24,341 | | | | | |
Tarong Power Station | | | | | | | | | | | | | | | | | | | | |
Tarong Power Station - Other Sustaining Projects | | | 319 | | | | 6,893 | | | | | | | | 6,893 | | | | | |
Tarong North Power Station - Overhauls | | | 319 | | | | 8,000 | | | | | | | | 8,000 | | | | | |
Other Capital Projects | | | | | | | | | | | | | | | | | | | | |
ICT - Hardware and Software Upgrades | | | Various | | | | 11,162 | | | | | | | | 11,162 | | | | | |
ICT - Enterprise Program of Works | | | Various | | | | 7,865 | | | | | | | | 7,865 | | | | | |
Other Capital Projects | | | Various | | | | 178 | | | | | | | | 178 | | | | | |
Gas Supply Strategy | | | 307 | | | | 4,695 | | | | | | | | 4,695 | | | | | |
| | | | | | | | | | | | | | | | | | | | |
Total Property, Plant and Equipment | | | | | | | | | | | | | | | 149,074 | | | | | |
| | | | | | | | | | | | | | | | | | | | |
52
Capital Statement 2017-18
| | | | | | | | | | | | | | | | | | | | |
| Energy and Water Supply | |
Project | | Statistical
Area | | | Total
Estimated
Cost
$‘000 | | | Expenditure
to
30-06-17
$‘000 | | | Budget
2017-18
$‘000 | | | Post
2017-18
$‘000 | |
| | | | | |
ENERGY QUEENSLAND | | | | | | | | | | | | | | | | | | | | |
| | | | | |
Property, Plant and Equipment | | | | | | | | | | | | | | | | | | | | |
Standard Control Services | | | | | | | | | | | | | | | | | | | | |
Augmentation | | | | | | | | | | | | | | | | | | | | |
SunCoast Power Project | | | 316 | | | | 89,339 | | | | 19,143 | | | | 6,897 | | | | 63,299 | |
Cairns Kamerunga - 22kV Augmentation | | | 306 | | | | 2,283 | | | | 553 | | | | 1,730 | | | | | |
Gladstone - Briffney 11kV Feeder | | | 308 | | | | 1,818 | | | | 76 | | | | 1,742 | | | | | |
Operational Technology Device Management Phase 1 | | | Various | | | | 3,444 | | | | 1,851 | | | | 1,593 | | | | | |
Real Time Capacity Architecture | | | Various | | | | 1,696 | | | | 637 | | | | 1,059 | | | | | |
Safety Net Implementation | | | Various | | | | | | | | | | | | 5,691 | | | | Ongoing | |
Network initiated capacity augmentation - Brisbane | | | Various | | | | 52,169 | | | | | | | | 52,169 | | | | | |
Network initiated capacity augmentation - Gold Coast | | | 309 | | | | 20,097 | | | | | | | | 20,097 | | | | | |
Network initiated capacity augmentation - Ipswich | | | 310 | | | | 11,525 | | | | | | | | 11,525 | | | | | |
Network initiated capacity augmentation - Sunshine Coast | | | 316 | | | | 30,145 | | | | | | | | 30,145 | | | | | |
Network initiated capacity augmentation - Wide Bay Burnett | | | 319 | | | | 2,966 | | | | | | | | 2,966 | | | | | |
Other Regulated Network Initiated Capital Work - Ergon Energy | | | Various | | | | 58,693 | | | | | | | | 58,693 | | | | | |
| | | | | | | | | | | | | | | | | | | | |
Sub-total Augmentation | | | | | | | | | | | | | | | 194,307 | | | | | |
| | | | | | | | | | | | | | | | | | | | |
| | | | | |
Replacements | | | | | | | | | | | | | | | | | | | | |
Amamoor Substation Upgrade | | | 319 | | | | 2,229 | | | | 843 | | | | 1,274 | | | | 112 | |
Bromelton Substation Upgrade | | | 311 | | | | 2,670 | | | | 1,793 | | | | 592 | | | | 285 | |
Bundall Substation Upgrade | | | 309 | | | | 11,743 | | | | 2,955 | | | | 4,943 | | | | 3,845 | |
Caboolture West Substation Upgrade | | | 313 | | | | 10,630 | | | | 7,873 | | | | 2,297 | | | | 460 | |
53
Capital Statement 2017-18
| | | | | | | | | | | | | | | | | | |
| Energy and Water Supply | |
Project | | Statistical
Area | | Total
Estimated
Cost
$‘000 | | | Expenditure
to
30-06-17
$‘000 | | | Budget
2017-18
$‘000 | | | Post
2017-18
$‘000 | |
Cast Iron High Voltage Cable Terminal (Pothead) Replacement Program | | Various | | | 2,082 | | | | 135 | | | | 1,947 | | | | | |
Circuit Breaker Replacement Program | | Various | | | | | | | | | | | 3,403 | | | | Ongoing | |
Conductor Clearance Program | | Various | | | 20,344 | | | | | | | | 20,344 | | | | | |
Conductor Clearance to Structure | | Various | | | 6,744 | | | | 285 | | | | 6,459 | | | | | |
Deception Bay Substation Upgrade | | 313 | | | 7,574 | | | | 5,581 | | | | 1,444 | | | | 549 | |
Gracemere Substation Development | | 308 | | | 3,649 | | | | 39 | | | | 3,610 | | | | | |
Grantham Substation Upgrade | | 317 | | | 3,245 | | | | 434 | | | | 2,210 | | | | 601 | |
Hemmant Substation Upgrade | | 301 | | | 7,685 | | | | 2,815 | | | | 2,900 | | | | 1,970 | |
New Farm Substation Upgrade | | 305 | | | 5,176 | | | | 1,564 | | | | 3,026 | | | | 586 | |
Labrador Substation Upgrade | | 309 | | | 18,262 | | | | 3,967 | | | | 7,275 | | | | 7,020 | |
Lawnton Substation Upgrade | | 314 | | | 4,261 | | | | 1,974 | | | | 1,339 | | | | 948 | |
Leichhardt Substation Upgrade | | 318 | | | 1,868 | | | | 100 | | | | 1,768 | | | | | |
Low Voltage Small Copper Replacement (Stage 2 and 3) | | Various | | | | | | | | | | | 39,946 | | | | Ongoing | |
Lytton Substation Upgrade | | 301 | | | 2,273 | | | | 1,350 | | | | 923 | | | | | |
Mackay Tennyson Street Substation Upgrade | | 312 | | | 1,439 | | | | 56 | | | | 1,383 | | | | | |
Miami Substation Upgrade | | 309 | | | 3,950 | | | | 2,150 | | | | 1,378 | | | | 422 | |
Nudgee Substation Upgrade | | 302 | | | 9,854 | | | | 7,802 | | | | 1,880 | | | | 172 | |
Radio Communication Safety Upgrades | | Various | | | 30,407 | | | | 6,732 | | | | 16,348 | | | | 7,327 | |
Palm Beach Substation Upgrade | | 309 | | | 13,539 | | | | 9,097 | | | | 2,906 | | | | 1,536 | |
Protection Replacement | | 315 | | | | | | | | | | | 2,614 | | | | Ongoing | |
Salisbury Substation Upgrade | | 303 | | | 8,397 | | | | 3,757 | | | | 2,523 | | | | 2,117 | |
Power supply upgrade between South Pine and Hays Inlet Substation | | Various | | | 4,523 | | | | 1,917 | | | | 99 | | | | 2,507 | |
Strathpine - Replace Circuit Breakers | | 314 | | | 3,845 | | | | 808 | | | | 743 | | | | 2,294 | |
Network initiated replacement works - Brisbane | | Various | | | | | | | | | | | 148,173 | | | | Ongoing | |
Network initiated replacement works - Gold Coast | | 309 | | | | | | | | | | | 31,855 | | | | Ongoing | |
54
Capital Statement 2017-18
| | | | | | | | | | | | | | | | | | |
| Energy and Water Supply | |
Project | | Statistical
Area | | Total
Estimated
Cost
$‘000 | | | Expenditure
to
30-06-17
$‘000 | | | Budget
2017-18
$‘000 | | | Post
2017-18
$‘000 | |
Network initiated replacement works - Ipswich | | 310 | | | | | | | | | | | 21,761 | | | | Ongoing | |
Network initiated replacement works - Sunshine Coast | | 316 | | | | | | | | | | | 42,281 | | | | Ongoing | |
Network initiated replacement works - Wide Bay Burnett | | 319 | | | | | | | | | | | 3,783 | | | | Ongoing | |
Other Regulated Network Initiated Capital Work - Ergon Energy | | Various | | | 148,587 | | | | | | | | 148,587 | | | | | |
| | | | | | | | | | | | | | | | | | |
Sub-total Replacements | | | | | | | | | | | | | 532,014 | | | | | |
| | | | | | | | | | | | | | | | | | |
| | | | | |
Connections | | | | | | | | | | | | | | | | | | |
Customer Connections - Brisbane | | Various | | | 72,247 | | | | | | | | 72,247 | | | | | |
Customer Connections - Gold Coast | | 309 | | | 7,663 | | | | | | | | 7,663 | | | | | |
Customer Connections - Ipswich | | 310 | | | 3,408 | | | | | | | | 3,408 | | | | | |
Customer Connections - Sunshine Coast | | 316 | | | 7,199 | | | | | | | | 7,199 | | | | | |
Customer Connections - Wide Bay Burnett | | 319 | | | 800 | | | | | | | | 800 | | | | | |
Other Regulated Customer Initiated Capital Work (Standard Control Services) - Ergon Energy | | Various | | | 73,507 | | | | | | | | 73,507 | | | | | |
| | | | | | | | | | | | | | | | | | |
Sub-total Connections | | | | | | | | | | | | | 164,824 | | | | | |
| | | | | | | | | | | | | | | | | | |
| | | | | | | | | | | | | | | | | | |
| | | | | | | | | | | | | | | | | | |
Sub-total Standard Control Services | | | | | | | | | | | | | 891,145 | | | | | |
| | | | | | | | | | | | | | | | | | |
| | | | | |
Non-System Capital Expenditure | | | | | | | | | | | | | | | | | | |
Garbutt Depot & Logistics Centre Redevelopment Stage 2 | | 318 | | | 42,500 | | | | 21,939 | | | | 20,561 | | | | | |
McLeod Street Cairns Refurbishment | | 306 | | | 14,625 | | | | 226 | | | | 5,233 | | | | 9,166 | |
Searle Street Maryborough Redevelopment | | 319 | | | 41,193 | | | | | | | | 6,478 | | | | 34,715 | |
South Street Toowomba Redevelopment | | 317 | | | 32,178 | | | | 15,865 | | | | 16,313 | | | | | |
Property and Buildings - Energex | | Various | | | 33,877 | | | | | | | | 33,877 | | | | | |
55
Capital Statement 2017-18
| | | | | | | | | | | | | | | | | | |
| Energy and Water Supply | |
Project | | Statistical
Area | | Total
Estimated
Cost
$‘000 | | | Expenditure
to
30-06-17
$‘000 | | | Budget
2017-18
$‘000 | | | Post
2017-18
$‘000 | |
Property - Minor Program for 2017-18 | | Various | | | 4,897 | | | | | | | | 4,897 | | | | | |
Property Minor Programs - Fitzroy | | 308 | | | 7,205 | | | | | | | | 7,205 | | | | | |
Property Minor Programs - Fraser Burnett | | 319 | | | 2,888 | | | | | | | | 2,888 | | | | | |
Property Minor Programs - Greater Downs | | 307 | | | 348 | | | | | | | | 348 | | | | | |
Property Minor Programs - Herbert | | Various | | | 1,868 | | | | | | | | 1,868 | | | | | |
Property Minor Programs - Pioneer | | 312 | | | 1,815 | | | | | | | | 1,815 | | | | | |
Property Minor Programs - Tropical North | | Various | | | 4,881 | | | | | | | | 4,881 | | | | | |
Information and Communication Technologies | | 305 | | | 5,800 | | | | | | | | 5,800 | | | | | |
Tools and Equipment - Energex | | 305 | | | | | | | | | | | 5,400 | | | | Ongoing | |
Tools and Equipment - Ergon Energy | | Various | | | | | | | | | | | 6,000 | | | | Ongoing | |
Vehicles - Energex | | 305 | | | | | | | | | | | 26,500 | | | | Ongoing | |
Vehicles - Ergon Energy | | Various | | | | | | | | | | | 20,141 | | | | Ongoing | |
| | | | | | | | | | | | | | | | | | |
Sub-total Non-System Capital Expenditure | | | | | | | | | | | | | 170,205 | | | | | |
| | | | | | | | | | | | | | | | | | |
| | | | | |
Alternative Control Services | | | | | | | | | | | | | | | | | | |
Customer initiated works - Gold Coast | | 309 | | | 7,727 | | | | | | | | 7,727 | | | | | |
Customer initiated works - Wide Bay/Burnett | | 319 | | | 633 | | | | | | | | 633 | | | | | |
Customer initiated works - Brisbane | | Various | | | 65,404 | | | | | | | | 65,404 | | | | | |
Customer initiated works - Ipswich | | 310 | | | 3,385 | | | | | | | | 3,385 | | | | | |
Customer initiated works - Sunshine Coast | | 316 | | | 5,693 | | | | | | | | 5,693 | | | | | |
Other Regulated Customer Initiated Capital Work (Alternative Control Services) - Ergon Energy | | Various | | | 50,339 | | | | | | | | 50,339 | | | | | |
| | | | | | | | | | | | | | | | | | |
Sub-total Alternative Control Services | | | | | | | | | | | | | 133,181 | | | | | |
| | | | | | | | | | | | | | | | | | |
| | | | | |
Non-Regulated Capital Expenditure | | | | | | | | | | | | | | | | | | |
Communications and Supervisory Control and Data Acquisition | | 315 | | | 3,198 | | | | 633 | | | | 2,565 | | | | | |
Community Based Projects | | 315 | | | 5,999 | | | | 1,963 | | | | 4,036 | | | | | |
56
Capital Statement 2017-18
| | | | | | | | | | | | | | | | | | |
| Energy and Water Supply | |
Project | | Statistical
Area | | Total
Estimated
Cost
$‘000 | | | Expenditure
to
30-06-17
$‘000 | | | Budget
2017-18
$‘000 | | | Post
2017-18
$‘000 | |
Embedded Generators - Energex | | 305 | | | 256 | | | | | | | | 256 | | | | | |
Metering Dynamics | | 305 | | | 27,192 | | | | | | | | 27,192 | | | | | |
Ergon Energy Retail Capital Expenditure | | 305 | | | | | | | | | | | 32,594 | | | | Ongoing | |
Isolated Systems Capital Works Geothermal Plant Birdsville | | 315 | | | 15,100 | | | | 4,486 | | | | 7,357 | | | | 3,257 | |
Renewable Energy Coconut Island Solar | | 315 | | | 313 | | | | | | | | 313 | | | | | |
Environment Related Projects - Torres Strait | | 315 | | | 2,570 | | | | | | | | 1,928 | | | | 642 | |
Isolated Systems Capital Works Palm Island Power Station Upgrade | | 318 | | | 15,607 | | | | 14,625 | | | | 982 | | | | | |
Generation Set Upgrade - Murray Island | | 315 | | | 1,849 | | | | 210 | | | | 1,639 | | | | | |
Generation Set Upgrade - Aurukun | | 315 | | | 1,169 | | | | | | | | 1,167 | | | | 2 | |
Other Isolated Capital Work | | Various | | | 10,153 | | | | | | | | 10,153 | | | | | |
| | | | | | | | | | | | | | | | | | |
Sub-total Non-Regulated Capital Expenditure | | | | | | | | | | | | | 90,182 | | | | | |
| | | | | | | | | | | | | | | | | | |
| | | | | |
ICT Capital Expenditure | | | | | | | | | | | | | | | | | | |
SPARQ Capital Expenditure - Energex | | 305 | | | | | | | | | | | 63,700 | | | | Ongoing | |
SPARQ Capital Expenditure - Ergon Energy | | Various | | | | | | | | | | | 63,824 | | | | Ongoing | |
| | | | | | | | | | | | | | | | | | |
Sub-total ICT Capital Expenditure | | | | | | | | | | | | | 127,524 | | | | | |
| | | | | | | | | | | | | | | | | | |
| | | | | | | | | | | | | | | | | | |
| | | | | | | | | | | | | | | | | | |
Total Property, Plant and Equipment | | | | | | | | | | | | | 1,412,237 | | | | | |
| | | | | | | | | | | | | | | | | | |
| | | | | |
POWERLINK QUEENSLAND | | | | | | | | | | | | | | | | | | |
| | | | | |
Property, Plant and Equipment | | | | | | | | | | | | | | | | | | |
Total Non Prescribed Transmission Network Connections | | Various | | | | | | | | | | | 30,038 | | | | Ongoing | |
Total Other Projects less than $20Mil | | Various | | | | | | | | | | | 96,426 | | | | Ongoing | |
Braemar Substation Secondary Systems Replacement | | 307 | | | 29,200 | | | | 26,839 | | | | 1,700 | | | | 661 | |
Blackwall Substation Secondary Systems Replacement | | 310 | | | 33,100 | | | | 28,023 | | | | 1,800 | | | | 3,277 | |
Moura Switchyard Replacement | | 308 | | | 24,500 | | | | 20,334 | | | | 1,600 | | | | 2,566 | |
57
Capital Statement 2017-18
| | | | | | | | | | | | | | | | | | |
| Energy and Water Supply | |
Project | | Statistical
Area | | Total
Estimated
Cost
$‘000 | | | Expenditure
to
30-06-17
$‘000 | | | Budget
2017-18
$‘000 | | | Post
2017-18
$‘000 | |
Nebo 275/132kV Transformer Replacement | | 312 | | | 24,800 | | | | 19,513 | | | | 3,700 | | | | 1,587 | |
Ross Substation Secondary Systems Replacement | | 318 | | | 27,000 | | | | 19,204 | | | | 3,600 | | | | 4,196 | |
Substation Security Upgrade | | Various | | | 40,000 | | | | 23,198 | | | | 16,000 | | | | 802 | |
Callide A / Calvale 132kV Network Reinvestment | | 308 | | | | | | | | | | | 7,965 | | | | Ongoing | |
Collinsville to Proserpine Transmission Line Refit | | 318 | | | | | | | | | | | 8,281 | | | | Ongoing | |
Mackay Substation Replacement | | 312 | | | | | | | | | | | 8,600 | | | | Ongoing | |
Rocklea Substation Secondary Systems Replacement | | 303 | | | | | | | | | | | 6,000 | | | | Ongoing | |
Stanwell Substation Secondary Systems Replacement | | 308 | | | | | | | | | | | 1,500 | | | | Ongoing | |
Nebo Substation Primary Plant Replacement | | 312 | | | | | | | | | | | 2,300 | | | | Ongoing | |
Calvale and Callide B Substation Secondary Systems Replacement | | 308 | | | | | | | | | | | 4,000 | | | | Ongoing | |
Nebo Secondary Systems Replacement | | 312 | | | | | | | | | | | 3,000 | | | | Ongoing | |
| | | | | | | | | | | | | | | | | | |
Total Property, Plant and Equipment | | | | | | | | | | | | | 196,510 | | | | | |
| | | | | | | | | | | | | | | | | | |
| | | | | |
SUNWATER LIMITED | | | | | | | | | | | | | | | | | | |
| | | | | |
Property, Plant and Equipment | | | | | | | | | | | | | | | | | | |
Boondooma Dam spillway and side wall repair | | 319 | | | 46,159 | | | | 25,197 | | | | 12,937 | | | | 8,025 | |
Dam Safety Improvement Program - Paradise Dam (strengthening of monoliths D&K) | | 319 | | | 36,666 | | | | 26,500 | | | | 2,431 | | | | 7,735 | |
Dam Safety Improvement Program - Burdekin Falls Dam (foundation drainage improvement) | | 318 | | | 10,059 | | | | 2,699 | | | | 4,569 | | | | 2,791 | |
Lower Fitzroy Infrastructure Feasibility Project | | 308 | | | 255 | | | | | | | | 255 | | | | | |
Nathan Dam and Pipelines Feasibility Project | | 308 | | | 161 | | | | | | | | 161 | | | | | |
Refurbishment & Enhancement - Bundaberg Water Supply | | 319 | | | | | | | | | | | 571 | | | | Ongoing | |
58
Capital Statement 2017-18
| | | | | | | | | | | | | | |
| Energy and Water Supply | |
Project | | Statistical
Area | | Total
Estimated
Cost
$‘000 | | Expenditure
to
30-06-17
$‘000 | | Budget
2017-18
$‘000 | | | Post
2017-18
$‘000 | |
Refurbishment & Enhancement - Pioneer Water Supply | | 312 | | | | | | | 462 | | | | Ongoing | |
Refurbishment & Enhancement - Upper Burnett Water Supply | | 319 | | | | | | | 451 | | | | Ongoing | |
Refurbishment & Enhancement - Bowen Broken Water Supply | | 312 | | | | | | | 402 | | | | Ongoing | |
Refurbishment & Enhancement - Callide Water Supply | | 308 | | | | | | | 375 | | | | Ongoing | |
Refurbishment & Enhancement - Barker Baranbah Water Supply | | 319 | | | | | | | 359 | | | | Ongoing | |
Refurbishment & Enhancement - Dawson Water Supply | | 308 | | | | | | | 271 | | | | Ongoing | |
Refurbishment & Enhancement - St George Water Supply | | 307 | | | | | | | 459 | | | | Ongoing | |
Refurbishment & Enhancement - Eton Water Supply | | 312 | | | | | | | 560 | | | | Ongoing | |
Refurbishment & Enhancement - Eton Irrigation | | 312 | | | | | | | 431 | | | | Ongoing | |
Refurbishment & enhancement - Burdekin Irrigation | | 318 | | | | | | | 929 | | | | Ongoing | |
Refurbishment & Enhancement - Bundaberg Irrigation | | 319 | | | | | | | 984 | | | | Ongoing | |
Refurbishment & enhancement - St George Irrigation | | 307 | | | | | | | 656 | | | | Ongoing | |
Refurbishment & Enhancement - Mareeba Irrigation | | 306 | | | | | | | 300 | | | | Ongoing | |
Refurbishment & enhancement - Tarong Pipeline | | 319 | | | | | | | 1,094 | | | | Ongoing | |
Refurbishment & Enhancement - Awoonga-Callide Pipeline | | 308 | | | | | | | 392 | | | | Ongoing | |
Refurbishment & Enhancement - Collinsville Pipeline | | 312 | | | | | | | 472 | | | | Ongoing | |
Refurbishment & Enhancement - Blackwater Pipeline | | 308 | | | | | | | 514 | | | | Ongoing | |
Software Development & Hardware | | 305 | | | | | | | 7,075 | | | | Ongoing | |
Minor Works | | 305 | | | | | | | 2,585 | | | | Ongoing | |
Plant & Equipment | | 305 | | | | | | | 4,962 | | | | Ongoing | |
Emergency Management Response Plan | | 305 | | | | | | | 4,046 | | | | Ongoing | |
| | | | | | | | | | | | | | |
Total Property, Plant and Equipment | | | | | | | | | 48,703 | | | | | |
| | | | | | | | | | | | | | |
59
Capital Statement 2017-18
| | | | | | | | | | | | | | | | | | |
| Energy and Water Supply | |
Project | | Statistical
Area | | Total
Estimated
Cost
$‘000 | | | Expenditure
to
30-06-17
$‘000 | | | Budget
2017-18
$‘000 | | | Post
2017-18
$‘000 | |
| | | | | |
GLADSTONE AREA WATER BOARD | | | | | | | | | | | | | | | | | | |
| | | | | |
Property, Plant and Equipment | | | | | | | | | | | | | | | | | | |
Offline Standby and Repump Station | | 308 | | | 29,952 | | | | 7,608 | | | | 20,183 | | | | 2,161 | |
Low lift and high lift pump station switchboard and variable frequency drive replacement | | 308 | | | 4,626 | | | | 1,899 | | | | 2,727 | | | | | |
East End Reservoir various works | | 308 | | | 1,403 | | | | 803 | | | | 600 | | | | | |
Yarwun Water Treatment Plant switchboard replacement | | 308 | | | 910 | | | | 380 | | | | 530 | | | | | |
Moura rail line crossing | | 308 | | | 1,069 | | | | 669 | | | | 400 | | | | | |
Land rationalisation | | 308 | | | 1,938 | | | | 1,606 | | | | 332 | | | | | |
Offline Storage to Fitzsimmons 700mm Internal | | 308 | | | 1,304 | | | | 1,004 | | | | 300 | | | | | |
Boat Creek Reservoir - Secure Land | | 308 | | | 307 | | | | 7 | | | | 300 | | | | | |
Scour Valve Replacement Program | | 308 | | | 310 | | | | 80 | | | | 230 | | | | | |
Site Security Project | | 308 | | | 376 | | | | 176 | | | | 200 | | | | | |
Awoonga Dam Spillway acceptable flood capacity Upgrades | | 308 | | | 8,592 | | | | 8,392 | | | | 200 | | | | | |
Treatment projects | | 308 | | | 205 | | | | 25 | | | | 180 | | | | | |
Enterprise resource planning enhancement | | 308 | | | 267 | | | | 117 | | | | 150 | | | | | |
Easement Review | | 308 | | | 413 | | | | 263 | | | | 150 | | | | | |
Replace Queensland Alumina Limited 600mm Isolation Valve | | 308 | | | 373 | | | | 223 | | | | 150 | | | | | |
Delivery Projects | | 308 | | | 222 | | | | 122 | | | | 100 | | | | | |
Gladstone Water Treatment Plant staged upgrades | | 308 | | | 1,550 | | | | 1,450 | | | | 100 | | | | | |
Supervisory control and data acquisition upgrade | | 308 | | | 403 | | | | 303 | | | | 100 | | | | | |
Queensland Alumina Limited Pipeline replacement | | 308 | | | 629 | | | | 529 | | | | 100 | | | | | |
Corporate projects | | 308 | | | 156 | | | | 106 | | | | 50 | | | | | |
Gladstone Fitzroy pipeline | | 308 | | | 5,685 | | | | 5,635 | | | | 50 | | | | | |
| | | | | | | | | | | | | | | | | | |
Total Property, Plant and Equipment | | | | | | | | | | | | | 27,132 | | | | | |
| | | | | | | | | | | | | | | | | | |
60
Capital Statement 2017-18
| | | | | | | | | | | | | | | | | | | | |
| Energy and Water Supply | |
Project | | Statistical
Area | | | Total
Estimated
Cost
$‘000 | | | Expenditure
to
30-06-17
$‘000 | | | Budget
2017-18
$‘000 | | | Post
2017-18
$‘000 | |
| | | | | |
MOUNT ISA WATER BOARD | | | | | | | | | | | | | | | | | | | | |
| | | | | |
Property, Plant and Equipment | | | | | | | | | | | | | | | | | | | | |
Power Reliability Hilton - Lake Julius | | | 315 | | | | | | | | | | | | 60 | | | | Ongoing | |
Power Reliability Moondarra System | | | 315 | | | | 1,733 | | | | 334 | | | | 1,399 | | | | | |
Lake Julius Power Pole Replacement | | | 315 | | | | | | | | | | | | 580 | | | | Ongoing | |
Operations and Maintenance Asset Requirements | | | 315 | | | | | | | | | | | | 678 | | | | Ongoing | |
Mount Isa Terminal Reservoir Storage Tanks | | | 315 | | | | 1,919 | | | | 150 | | | | 1,769 | | | | | |
Supply Reliability Clear Water Lagoon to Mount Isa Terminal Reservoir | | | 315 | | | | 17,450 | | | | | | | | 7,948 | | | | 9,502 | |
Upgrade Maintenance Access to Pump Stations | | | 315 | | | | 1,466 | | | | | | | | 733 | | | | 733 | |
Large Scale Renewable Energy Project | | | 315 | | | | | | | | | | | | 1,000 | | | | Ongoing | |
R48 Reserve Road Access Improvement | | | 315 | | | | 2,150 | | | | | | | | 150 | | | | 2,000 | |
Lake Moondarra Booster Pump Station Oil Circuit Breaker Replacement | | | 315 | | | | 360 | | | | | | | | 360 | | | | | |
Critical Spares Procurement | | | 315 | | | | | | | | | | | | 400 | | | | Ongoing | |
Asset Renewals - Projects less than $250,000 | | | 315 | | | | | | | | | | | | 774 | | | | Ongoing | |
Asset Enhancements - Projects less than $250,000 | | | 315 | | | | | | | | | | | | 870 | | | | Ongoing | |
Plant and Equipment - Projects less than $250,000 | | | 315 | | | | | | | | | | | | 471 | | | | Ongoing | |
| | | | | | | | | | | | | | | | | | | | |
Total Property, Plant and Equipment | | | | | | | | | | | | | | | 17,192 | | | | | |
| | | | | | | | | | | | | | | | | | | | |
| | | | | |
SEQWATER | | | | | | | | | | | | | | | | | | | | |
| | | | | |
Property, Plant and Equipment | | | | | | | | | | | | | | | | | | | | |
Beaudesert Water Supply Zone Upgrade | | | 311 | | | | 80,082 | | | | 34 | | | | 269 | | | | 79,779 | |
Other Infrastructure Capital Works | | | Various | | | | | | | | | | | | 81,484 | | | | Ongoing | |
Non-Infrastructure Capital Works | | | Various | | | | | | | | | | | | 14,079 | | | | Ongoing | |
Fleet Renewal | | | Various | | | | | | | | | | | | 2,150 | | | | Ongoing | |
61
Capital Statement 2017-18
| | | | | | | | | | | | | | | | | | |
| Energy and Water Supply | |
Project | | Statistical
Area | | Total
Estimated
Cost
$‘000 | | | Expenditure
to
30-06-17
$‘000 | | | Budget
2017-18
$‘000 | | | Post
2017-18
$‘000 | |
Mount Crosby East Bank Water pump Station Flood Resilience Works | | 310 | | | 31,610 | | | | | | | | 1,800 | | | | 29,810 | |
Mount Crosby East Bank Water Treatment Plant Filtration Upgrade | | 310 | | | 34,000 | | | | 837 | | | | 1,775 | | | | 31,388 | |
Somerset Hydro Refurbishment | | 310 | | | 12,083 | | | | 11,083 | | | | 1,000 | | | | | |
Lake MacDonald Dam Upgrade Stage 2 | | 316 | | | 88,521 | | | | 2,321 | | | | 2,000 | | | | 84,200 | |
Sideling Creek Dam Safety Upgrade Stage 1 | | 314 | | | 18,000 | | | | 1,456 | | | | 2,000 | | | | 14,544 | |
Lowood Water Treatment Plant Stage 1 Upgrade | | 310 | | | 17,094 | | | | 2,094 | | | | 2,000 | | | | 13,000 | |
North Pine Water Treatment Plant - Sludge Handling Upgrade | | 314 | | | 10,165 | | | | 3,665 | | | | 6,000 | | | | 500 | |
Petrie New Water Supply Connection | | 314 | | | 9,960 | | | | 6,015 | | | | 3,945 | | | | | |
| | | | | | | | | | | | | | | | | | |
Total Property, Plant and Equipment | | | | | | | | | | | | | 118,502 | | | | | |
| | | | | | | | | | | | | | | | | | |
| | | | | | | | | | | | | | | | | | |
| | | | | | | | | | | | | | | | | | |
TOTAL ENERGY AND WATER SUPPLY (PPE) | | | | | | | | | | | | | 2,062,992 | | | | | |
| | | | | | | | | | | | | | | | | | |
62
Capital Statement 2017-18
| 3.7 | ENVIRONMENT AND HERITAGE PROTECTION |
Total capital purchases for the Department of Environment and Heritage Protection for 2017-18 are $8.3 million, including $3.2 million for land acquisitions, $2 million for enhancements to environmental regulatory capabilities and $1.6 million to progress remediation of land impacted by underground coal gasification (UCG) by-products.
The 2017-18 capital program will continue the State’s acquisition of land of high environmental value for inclusion in Queensland’s protected area estate. In addition, the department will continue to invest in the development of technology and systems to enable a targeted, scientific and risk-based approach to environmental management, and enhanced opportunities for the public to report environmental issues and engage with the department. Plant and equipment will be purchased to progress remediation of ground and surface water impacted by UCG by-products near Chinchilla.
These purchases reflect the department’s mission to lead environment and heritage protection and sustainability in Queensland through strong environmental regulation, conservation of the State’s natural environment and cultural values and enabling sustainable development.
Program Highlights (Property, Plant and Equipment)
| • | | $3.2 million in 2017-18 for protected area land acquisitions. |
| • | | $2 million in 2017-18 for development of systems to enhance environmental regulatory capabilty and improve engagement with the community. |
| • | | $1.6 million in 2017-18 for acquisition of plant and equipment to manage, remediate and dispose of ground and surface water impacted by UCG by-products. |
| • | | $800,000 in 2017-18 towards general systems development. |
| • | | $624,000 in 2017-18 towards general plant and equipment acquisition. |
63
Capital Statement 2017-18
| | | | | | | | | | | | | | | | | | |
| Environment and Heritage Protection | |
Project | | Statistical
Area | | Total
Estimated
Cost
$‘000 | | | Expenditure
to
30-06-17
$‘000 | | | Budget
2017-18
$‘000 | | | Post
2017-18
$‘000 | |
DEPARTMENT OF ENVIRONMENT AND HERITAGE PROTECTION | | | | | | | | | |
| | | | | |
Property, Plant and Equipment | | | | | | | | | | | | | | | | | | |
Protected Area Land Acquisitions Systems | | Various | | | 5,000 | | | | 1,780 | | | | 3,220 | | | | | |
Systems for Environmental Regulation | | Various | | | 2,046 | | | | | | | | 2,046 | | | | | |
General Systems Development | | Various | | | | | | | | | | | 800 | | | | Ongoing | |
Plant and Equipment | | | | | | | | | | | | | | | | | | |
Plant and Equipment - UCG | | 307 | | | 1,642 | | | | | | | | 1,642 | | | | | |
General Plant and Equipment | | Various | | | | | | | | | | | 624 | | | | Ongoing | |
| | | | | | | | | | | | | | | | | | |
Total Property, Plant and Equipment | | | | | | | | | | | | | 8,332 | | | | | |
| | | | | | | | | | | | | | | | | | |
| | | | | | | | | | | | | | | | | | |
| | | | | | | | | | | | | | | | | | |
TOTAL ENVIRONMENT AND HERITAGE PROTECTION (PPE) | | | | | | | | | | | | | 8,332 | | | | | |
| | | | | | | | | | | | | | | | | | |
64
Capital Statement 2017-18
| 3.8 | HOUSING AND PUBLIC WORKS |
Total capital purchases for the Housing and Public Works portfolio, including its statutory bodies, are $446.4 million in 2017-18, with capital grants of $109.1 million. Capital purchases include the Queensland Building and Construction Commission of $879,000 and the Residential Tenancies Authority of $160,000.
The Queensland Housing Strategy includes $1.620 billion to deliver a housing construction jobs program over 10 years. Further details of this overall package can be found in the Overview section of Budget Paper 4.
Department of Housing and Public Works
Total capital purchases and capital grants expenditure in 2017-18 are $554.4 million.
Program Highlights (Property, Plant and Equipment)
| • | | $216.8 million to deliver 417 social housing dwellings and upgrade existing social housing. |
| • | | $156.9 million for social housing in Aboriginal and Torres Strait Islander communities (including $129.8 million funding through the National Partnership on Remote Housing) to deliver 238 dwellings, upgrade existing social housing and purchase 10 dwellings to be used as temporary accommodation as part of the program to progress the transfer of social housing for home ownership. |
| • | | $50.5 million for the provision and upgrade of Government employee housing to support the attraction and retention of government employees in locations of high need where there is no alternative accommodation in rural and remote Queensland. This includes $11.8 million towards the construction of 24 units of accommodation in Aurukun for the provision of secure housing for government employees to support enhanced service delivery in this area. |
| • | | $13.8 million for supported accommodation including the construction of a new Youth Foyer in Townsville. |
| • | | $2.7 million for the redevelopment of the Boggo Road Gaol Precinct. The redevelopment includes the revitalisation of the heritage listed Boggo Road Gaol and provides urban renewal in this vibrant inner city location with substantial residential development and affordable housing, retail and commercial development and upgraded recreational parkland on adjoining lots. |
Program Highlights (Capital Grants)
| • | | $65.8 million for social housing in Aboriginal and Torres Strait Islander communities to deliver 26 dwellings, upgrade existing social housing and undertake infrastructure development including upgrades to progress the transfer of social housing for home ownership on Aboriginal and Torres Strait Islander land. |
| • | | $43.2 million to deliver 18 social housing dwellings and upgrade existing social housing. |
65
Capital Statement 2017-18
Queensland Building and Construction Commission
In 2017-18, the Queensland Building and Construction Commission has capital purchases of $879,000 to replace ageing property, plant and equipment to reduce expenditure on maintenance costs.
Residential Tenancies Authority
In 2016-17, the Residential Tenancies Authority (RTA) will complete the myRTA system which comprises a fully integrated bond management, CRM and finance system. In 2017-18, the RTA will return to normalised capital expenditure levels which comprises the maintenance of its existing systems and equipment.
| | | | | | | | | | | | | | | | | | | | |
| Housing and Public Works | |
Project | | Statistical
Area | | | Total
Estimated
Cost
$‘000 | | | Expenditure
to
30-06-17
$‘000 | | | Budget
2017-18
$‘000 | | | Post
2017-18
$‘000 | |
DEPARTMENT OF HOUSING AND PUBLIC WORKS | | | | | | | | | | | | | | | | | | | | |
| | | | | |
Property, Plant and Equipment | | | | | | | | | | | | | | | | | | | | |
Housing and Homelessness Services | | | | | | | | | | | | | | | | | | | | |
Cairns Construction | | | 306 | | | | | | | | | | | | 95,762 | | | | Ongoing | |
Brisbane - Inner City Construction | | | 305 | | | | | | | | | | | | 155 | | | | Ongoing | |
Brisbane - South Construction | | | 303 | | | | | | | | | | | | 11,740 | | | | Ongoing | |
Brisbane - North Construction | | | 302 | | | | | | | | | | | | 8,273 | | | | Ongoing | |
Brisbane - West Construction | | | 304 | | | | | | | | | | | | 10,261 | | | | Ongoing | |
Brisbane - East Construction | | | 301 | | | | | | | | | | | | 7,138 | | | | Ongoing | |
Fitzroy Construction | | | 308 | | | | | | | | | | | | 5,689 | | | | Ongoing | |
Gold Coast Construction | | | 309 | | | | | | | | | | | | 7,992 | | | | Ongoing | |
Ipswich Construction | | | 310 | | | | | | | | | | | | 2,584 | | | | Ongoing | |
Logan - Beaudesert Construction | | | 311 | | | | | | | | | | | | 3,959 | | | | Ongoing | |
Mackay Construction | | | 312 | | | | | | | | | | | | 2,489 | | | | Ongoing | |
Moreton Bay - North Construction | | | 313 | | | | | | | | | | | | 9,571 | | | | Ongoing | |
Moreton Bay - South Construction | | | 314 | | | | | | | | | | | | 721 | | | | Ongoing | |
Queensland - Outback Construction | | | 315 | | | | | | | | | | | | 9,215 | | | | Ongoing | |
Sunshine Coast Construction | | | 316 | | | | | | | | | | | | 5,207 | | | | Ongoing | |
Toowoomba Construction | | | 317 | | | | | | | | | | | | 2,490 | | | | Ongoing | |
Townsville Construction | | | 318 | | | | | | | | | | | | 41,041 | | | | Ongoing | |
66
Capital Statement 2017-18
| | | | | | | | | | | | | | | | | | |
| Housing and Public Works | |
Project | | Statistical
Area | | Total
Estimated
Cost
$‘000 | | | Expenditure
to
30-06-17
$‘000 | | | Budget
2017-18
$‘000 | | | Post
2017-18
$‘000 | |
Statewide Construction | | Various | | | | | | | | | | | 22,571 | | | | Ongoing | |
Wide Bay Upgrades | | 319 | | | | | | | | | | | 5,701 | | | | Ongoing | |
Townsville Upgrades | | 318 | | | | | | | | | | | 10,874 | | | | Ongoing | |
Toowoomba Upgrades | | 317 | | | | | | | | | | | 3,051 | | | | Ongoing | |
Sunshine Coast Upgrades | | 316 | | | | | | | | | | | 3,889 | | | | Ongoing | |
Queensland - Outback Upgrades | | 315 | | | | | | | | | | | 10,507 | | | | Ongoing | |
Moreton Bay - South Upgrades | | 314 | | | | | | | | | | | 851 | | | | Ongoing | |
Moreton Bay - North Upgrades | | 313 | | | | | | | | | | | 2,784 | | | | Ongoing | |
Mackay Upgrades | | 312 | | | | | | | | | | | 4,274 | | | | Ongoing | |
Logan - Beaudesert Upgrades | | 311 | | | | | | | | | | | 3,488 | | | | Ongoing | |
Ipswich Upgrades | | 310 | | | | | | | | | | | 3,975 | | | | Ongoing | |
Gold Coast Upgrades | | 309 | | | | | | | | | | | 4,355 | | | | Ongoing | |
Fitzroy Upgrades | | 308 | | | | | | | | | | | 5,768 | | | | Ongoing | |
Darling Downs - Maranoa Upgrades | | 307 | | | | | | | | | | | 1,496 | | | | Ongoing | |
Cairns Upgrades | | 306 | | | | | | | | | | | 26,006 | | | | Ongoing | |
Brisbane - Inner City Upgrades | | 305 | | | | | | | | | | | 4,016 | | | | Ongoing | |
Brisbane - West Upgrades | | 304 | | | | | | | | | | | 1,385 | | | | Ongoing | |
Brisbane - South Upgrades | | 303 | | | | | | | | | | | 7,960 | | | | Ongoing | |
Brisbane - North Upgrades | | 302 | | | | | | | | | | | 4,244 | | | | Ongoing | |
Brisbane - East Upgrades | | 301 | | | | | | | | | | | 3,649 | | | | Ongoing | |
Statewide Upgrades | | Various | | | | | | | | | | | 838 | | | | Ongoing | |
Darling Downs - Maranoa Purchase of existing properties | | 307 | | | | | | | | | | | 470 | | | | Ongoing | |
Queensland - Outback Purchase of existing properties | | 315 | | | | | | | | | | | 3,000 | | | | Ongoing | |
Statewide Purchase of existing properties | | Various | | | | | | | | | | | 5,000 | | | | Ongoing | |
Moreton Bay - South Land | | 314 | | | | | | | | | | | 618 | | | | Ongoing | |
Cairns Land | | 306 | | | | | | | | | | | 1,123 | | | | Ongoing | |
Townsville Land | | 318 | | | | | | | | | | | 1,123 | | | | Ongoing | |
Sunshine Coast Land | | 316 | | | | | | | | | | | 1,797 | | | | Ongoing | |
Brisbane - South Land | | 303 | | | | | | | | | | | 1,236 | | | | Ongoing | |
Moreton Bay - North Land | | 313 | | | | | | | | | | | 1,854 | | | | Ongoing | |
Logan - Beaudesert Land | | 311 | | | | | | | | | | | 3,369 | | | | Ongoing | |
Ipswich Land | | 310 | | | | | | | | | | | 3,819 | | | | Ongoing | |
Gold Coast Land | | 309 | | | | | | | | | | | 3,819 | | | | Ongoing | |
Brisbane - North Land | | 302 | | | | | | | | | | | 741 | | | | Ongoing | |
Brisbane - East Land | | 301 | | | | | | | | | | | 1,236 | | | | Ongoing | |
Brisbane - West Land | | 304 | | | | | | | | | | | 741 | | | | Ongoing | |
Brisbane - Inner City Land | | 305 | | | | | | | | | | | 989 | | | | Ongoing | |
67
Capital Statement 2017-18
| | | | | | | | | | | | | | | | | | | | |
| Housing and Public Works | |
Project | | Statistical
Area | | | Total
Estimated
Cost
$‘000 | | | Expenditure
to
30-06-17
$‘000 | | | Budget
2017-18
$‘000 | | | Post
2017-18
$‘000 | |
Statewide Land | | | Various | | | | | | | | | | | | 500 | | | | Ongoing | |
Other Plant and Equipment | | | Various | | | | | | | | | | | | 2,601 | | | | Ongoing | |
| | | | | | | | | | | | | | | | | | | | |
Sub-total Housing and Homelessness Services | | | | | | | | | | | | | | | 390,005 | | | | | |
| | | | | | | | | | | | | | | | | | | | |
| | | | | |
Public Works | | | | | | | | | | | | | | | | | | | | |
Brisbane - Boggo Road Precinct Redevelopment | | | 303 | | | | 42,067 | | | | 39,327 | | | | 2,740 | | | | | |
Building Works and Capital Replacements | | | Various | | | | | | | | | | | | 500 | | | | Ongoing | |
Government Employee Housing | | | Various | | | | | | | | | | | | 38,705 | | | | Ongoing | |
Government Employee Housing Construction - Aurukun | | | 306 | | | | 22,600 | | | | 1,280 | | | | 11,811 | | | | 9,509 | |
Other Property, Plant and Equipment | | | Various | | | | | | | | | | | | 1,582 | | | | Ongoing | |
| | | | | | | | | | | | | | | | | | | | |
Sub-total Public Works | | | | | | | | | | | | | | | 55,338 | | | | | |
| | | | | | | | | | | | | | | | | | | | |
| | | | | | | | | | | | | | | | | | | | |
| | | | | | | | | | | | | | | | | | | | |
Total Property, Plant and Equipment | | | | | | | | | | | | | | | 445,343 | | | | | |
| | | | | | | | | | | | | | | | | | | | |
| | | | | |
Capital Grants | | | | | | | | | | | | | | | | | | | | |
Housing and Homelessness Services | | | | | | | | | | | | | | | | | | | | |
Brisbane - North Capital Grants | | | 302 | | | | | | | | | | | | 1,500 | | | | Ongoing | |
Cairns Capital Grants | | | 306 | | | | | | | | | | | | 57,460 | | | | Ongoing | |
Fitzroy Capital Grants | | | 308 | | | | | | | | | | | | 553 | | | | Ongoing | |
Queensland - Outback Capital Grants | | | 315 | | | | | | | | | | �� | | 8,146 | | | | Ongoing | |
Townsville Capital Grants | | | 318 | | | | | | | | | | | | 4,877 | | | | Ongoing | |
Wide Bay Capital Grants | | | 319 | | | | | | | | | | | | 6,392 | | | | Ongoing | |
Statewide Capital Grants | | | Various | | | | | | | | | | | | 30,147 | | | | Ongoing | |
| | | | | | | | | | | | | | | | | | | | |
Sub-total Housing and Homelessness Services | | | | | | | | | | | | | | | 109,075 | | | | | |
| | | | | | | | | | | | | | | | | | | | |
| | | | | | | | | | | | | | | | | | | | |
| | | | | | | | | | | | | | | | | | | | |
Total Capital Grants | | | | | | | | | | | | | | | 109,075 | | | | | |
| | | | | | | | | | | | | | | | | | | | |
| | | | | |
QUEENSLAND BUILDING AND CONSTRUCTION COMMISSION | | | | | | | | | | | | | | | | | | | | |
| | | | | |
Property, Plant and Equipment | | | | | | | | | | | | | | | | | | | | |
Other Property, Plant and Equipment | | | 303 | | | | 1,123 | | | | 244 | | | | 879 | | | | | |
| | | | | | | | | | | | | | | | | | | | |
Total Property, Plant and Equipment | | | | | | | | | | | | | | | 879 | | | | | |
| | | | | | | | | | | | | | | | | | | | |
68
Capital Statement 2017-18
| | | | | | | | | | | | | | | | | | | | |
| Housing and Public Works | |
Project | | Statistical
Area | | | Total
Estimated
Cost
$‘000 | | | Expenditure
to
30-06-17
$‘000 | | | Budget
2017-18
$‘000 | | | Post
2017-18
$‘000 | |
| | | | | |
RESIDENTIAL TENANCIES AUTHORITY | | | | | | | | | | | | | | | | | | | | |
| | | | | |
Property, Plant and Equipment | | | | | | | | | | | | | | | | | | | | |
Asset Replacement Program | | | 305 | | | | | | | | | | | | 85 | | | | Ongoing | |
Portfolio Delivery Projects | | | 305 | | | | | | | | | | | | 75 | | | | Ongoing | |
| | | | | | | | | | | | | | | | | | | | |
Total Property, Plant and Equipment | | | | | | | | | | | | | | | 160 | | | | | |
| | | | | | | | | | | | | | | | | | | | |
| | | | | | | | | | | | | | | | | | | | |
| | | | | | | | | | | | | | | | | | | | |
TOTAL HOUSING AND PUBLIC WORKS (PPE) | | | | | | | | 446,382 | | | | | |
| | | | | | | | | | | | | | | | | | | | |
| | | | | | | | | | | | | | | | | | | | |
| | | | | | | | | | | | | | | | | | | | |
TOTAL HOUSING AND PUBLIC WORKS (CG) | | | | | | | | | | | | | | | 109,075 | | | | | |
| | | | | | | | | | | | | | | | | | | | |
69
Capital Statement 2017-18
| 3.9 | INFRASTRUCTURE, LOCAL GOVERNMENT AND PLANNING |
In 2017-18, the Infrastructure, Local Government and Planning portfolio, including Economic Development Queensland, South Bank Corporation, Queensland Reconstruction Authority and Cross River Rail Delivery Authority has capital purchases of $248 million and capital grants of $614 million.
Department of Infrastructure, Local Government and Planning
The Department of Infrastructure, Local Government and Planning has capital purchases of $18.1 million and capital grants of $296.6 million in 2017-18.
Program Highlights (Property, Plant and Equipment)
| • | | $11.4 million for the replacement of the Cherbourg Wastewater Infrastructure. |
| • | | $2.5 million for the development of the Palm Island Wastewater Infrastructure. |
| • | | $2.2 million for the Drinking Water Security Project at Pormpuraaw. |
| • | | $1.9 million for the continued work of the Indigenous State Infrastructure Program which aims to improve environmental health conditions for people living in major communities in Indigenous council areas. |
Program Highlights (Capital Grants)
| • | | $180 million for the Works for Queensland Program to support local governments outside of South East Queensland to undertake job-creating maintenance and minor infrastructure works. |
| • | | $30 million for water, wastewater and solid waste infrastructure in Indigenous communities and to develop options for a long term infrastructure program in Indigenous communities including the role of Indigenous councils. |
| • | | $29 million for the Local Government Grants and Subsidies Program which provides funding for priority infrastructure projects to meet identified community needs and to support projects that will enhance sustainable and liveable communities. |
| • | | $14.3 million for the revitalisation of the riverfront in Rockhampton and the Yeppoon foreshore in finalisation of the $40 million assistance package. |
| • | | $10 million to assist with Townsville water security measures. |
| • | | $5.6 million for the Community Resilience Fund to support local governments to deliver critical infrastructure that will develop and improve resilience in the built environment. |
| • | | $2.5 million to assist smaller local governments with infrastructure costs associated with the introduction of fluoridation. |
70
Capital Statement 2017-18
Economic Development Queensland
In 2017-18, Economic Development Queensland has capital purchases of $79.7 million.
Program Highlights (Property, Plant and Equipment)
| • | | $31.8 million for the Yeerongpilly Green Transit Oriented Development. |
| • | | $24.8 million for the urban renewal development at Northshore Hamilton. |
| • | | $12.1 million for continuing works on the Commonwealth Games Village. |
| • | | $4.2 million for The Village Townsville residential development in the Oonoonba Priority Development Area. |
| • | | $2.3 million for the Ageing in Place pilot project. |
South Bank Corporation
In 2017-18, South Bank Corporation has budgeted capital works totalling $21.2 million to maintain and enhance the South Bank Parklands, the Corporation’s commercial assets and the Brisbane Convention and Exhibition Centre.
Queensland Reconstruction Authority
The capital expenditure for the Queensland Reconstruction Authority in 2017-18 consists of capital grants of $317.9 million. This is funded up to 75 percent by the Australian Government under the Natural Disaster Relief and Recovery Arrangements (NDRRA) with the remainder funded by the State Government.
Program Highlights (Capital Grants)
| • | | In 2017-18 $317.9 million is being provided to local governments to undertake recovery, reconstruction, betterment and other NDRRA projects relating to natural disaster events of 2015 to 2017. |
| • | | Following finalisation of NDRRA programs for 2014 and prior event periods, capital grants relating to these events are no longer reported. |
Cross River Rail Delivery Authority
In 2017-18, the Cross River Rail Delivery Authority has budgeted capital expenditure totalling $129 million to continue to progress the planning, procurement, early works and development associated with the Cross River Rail project.
71
Capital Statement 2017-18
| | | | | | | | | | | | | | | | | | | | |
| Infrastructure, Local Government and Planning | |
Project | | Statistical
Area | | | Total
Estimated
Cost
$‘000 | | | Expenditure
to
30-06-17
$‘000 | | | Budget
2017-18
$‘000 | | | Post
2017-18
$‘000 | |
DEPARTMENT OF INFRASTRUCTURE, LOCAL GOVERNMENT AND PLANNING | | | | | | | | | | | | | | | | | | | | |
| | | | | |
Property, Plant and Equipment | | | | | | | | | | | | | | | | | | | | |
Cherbourg Wastewater Infrastructure | | | 319 | | | | 14,900 | | | | 3,511 | | | | 11,389 | | | | | |
Palm Island Wastewater Infrastructure | | | 318 | | | | 5,476 | | | | 2,940 | | | | 2,536 | | | | | |
Pormpuraaw Drinking Water Security Project | | | 315 | | | | 2,400 | | | | 200 | | | | 2,200 | | | | | |
Indigenous State Infrastructure Program | | | Various | | | | 61,022 | | | | 59,137 | | | | 1,885 | | | | | |
Other Property, Plant and Equipment | | | 305 | | | | | | | | | | | | 102 | | | | Ongoing | |
| | | | | | | | | | | | | | | | | | | | |
Total Property, Plant and Equipment | | | | | | | | | | | | | | | 18,112 | | | | | |
| | | | | | | | | | | | | | | | | | | | |
| | | | | |
Capital Grants | | | | | | | | | | | | | | | | | | | | |
Works for Queensland | | | Various | | | | 400,000 | | | | 120,000 | | | | 180,000 | | | | 100,000 | |
Townsville Water Security Measures | | | 318 | | | | 225,000 | | | | | | | | 10,000 | | | | 215,000 | |
Indigenous Water Infrastructure Program | | | Various | | | | 120,000 | | | | 30,000 | | | | 30,000 | | | | 60,000 | |
Fluoridation Infrastructure Grants Program | | | Various | | | | 5,000 | | | | | | | | 2,500 | | | | 2,500 | |
Yeppoon and Rockhampton Revitalisation Project | | | 308 | | | | 40,000 | | | | 25,666 | | | | 14,334 | | | | | |
Major Infrastructure Program - Stage 6 | | | 315 | | | | 15,000 | | | | 3,750 | | | | 3,750 | | | | 7,500 | |
Local Government Grants and Subsidies Program | | | Various | | | | | | | | | | | | 28,953 | | | | Ongoing | |
Community Resilience Fund | | | Various | | | | 41,500 | | | | 35,878 | | | | 5,622 | | | | | |
Natural Disaster Resilience Program 2013-15 | | | Various | | | | 14,907 | | | | 12,951 | | | | 1,384 | | | | 572 | |
Natural Disaster Resilience Program 2013-15 (Australian Government) | | | Various | | | | 16,838 | | | | 13,843 | | | | 2,224 | | | | 771 | |
Natural Disaster Resilience Program 2015-17 | | | Various | | | | 10,538 | | | | 5,762 | | | | 4,776 | | | | | |
Natural Disaster Resilience Program 2015-17 (Australian Government) | | | Various | | | | 16,547 | | | | 5,762 | | | | 10,785 | | | | | |
Roma Street Parklands | | | 305 | | | | | | | | | | | | 1,488 | | | | Ongoing | |
Kuranda Skyrail and Infrastructure Levy | | | 306 | | | | | | | | | | | | 744 | | | | Ongoing | |
| | | | | | | | | | | | | | | | | | | | |
Total Capital Grants | | | | | | | | | | | | | | | 296,560 | | | | | |
| | | | | | | | | | | | | | | | | | | | |
72
Capital Statement 2017-18
| | | | | | | | | | | | | | | | | | | | |
| Infrastructure, Local Government and Planning | |
Project | | Statistical
Area | | | Total
Estimated
Cost
$‘000 | | | Expenditure
to
30-06-17
$‘000 | | | Budget
2017-18
$‘000 | | | Post
2017-18
$‘000 | |
| | | | | |
ECONOMIC DEVELOPMENT QUEENSLAND | | | | | | | | | | | | | | | | | | | | |
| | | | | |
Property, Plant and Equipment | | | | | | | | | | | | | | | | | | | | |
Willowbank Industrial Development | | | 310 | | | | 73,971 | | | | 15,981 | | | | 1,000 | | | | 56,990 | |
Ageing in Place | | | Various | | | | 2,400 | | | | 71 | | | | 2,329 | | | | | |
The Village Townsville | | | 318 | | | | 136,898 | | | | 86,972 | | | | 4,246 | | | | 45,680 | |
Northshore Hamilton | | | 305 | | | | 350,954 | | | | 61,618 | | | | 24,829 | | | | 264,507 | |
Yeerongpilly Green Transit Oriented Development | | | 303 | | | | 72,523 | | | | 16,449 | | | | 31,777 | | | | 24,297 | |
Carseldine Urban Village | | | 302 | | | | 30,536 | | | | | | | | 878 | | | | 29,658 | |
Gladstone State Development Area | | | 308 | | | | 13,617 | | | | 5,417 | | | | 500 | | | | 7,700 | |
Townsville Regional Industrial Estate | | | 318 | | | | 9,750 | | | | 4,200 | | | | 500 | | | | 5,050 | |
Clinton Industrial Development | | | 308 | | | | 11,695 | | | | 445 | | | | 500 | | | | 10,750 | |
Salisbury Plains Industrial Precinct | | | 312 | | | | 6,766 | | | | 1,328 | | | | 500 | | | | 4,938 | |
Mica Creek Services | | | 315 | | | | 5,750 | | | | 250 | | | | 500 | | | | 5,000 | |
Commonwealth Games Village | | | 309 | | | | 72,860 | | | | 60,747 | | | | 12,113 | | | | | |
| | | | | | | | | | | | | | | | | | | | |
Total Property, Plant and Equipment | | | | | | | | | | | | | | | 79,672 | | | | | |
| | | | | | | | | | | | | | | | | | | | |
| | | | | |
SOUTH BANK CORPORATION | | | | | | | | | | | | | | | | | | | | |
| | | | | |
Property, Plant and Equipment | | | | | | | | | | | | | | | | | | | | |
Parklands Enhancements and replacements | | | 303 | | | | | | | | | | | | 6,310 | | | | Ongoing | |
Car park lift upgrade | | | 303 | | | | 400 | | | | | | | | 400 | | | | | |
Car park LED Light Installation | | | 303 | | | | 250 | | | | | | | | 250 | | | | | |
Investment Properties - awnings and outdoor enhancement | | | 303 | | | | 1,590 | | | | | | | | 1,590 | | | | | |
Investment Properties - Other enhancements and replacements | | | 303 | | | | | | | | | | | | 3,550 | | | | Ongoing | |
Brisbane Convention and Exhibition Centre - solar panels | | | 303 | | | | 3,080 | | | | | | | | 3,080 | | | | | |
Brisbane Convention and Exhibition Centre - other enhancements and replacements | | | 303 | | | | | | | | | | | | 6,000 | | | | Ongoing | |
| | | | | | | | | | | | | | | | | | | | |
Total Property, Plant and Equipment | | | | | | | | | | | | | | | 21,180 | | | | | |
| | | | | | | | | | | | | | | | | | | | |
73
Capital Statement 2017-18
| | | | | | | | | | | | | | | | | | | | |
| Infrastructure, Local Government and Planning | |
Project | | Statistical
Area | | | Total
Estimated
Cost
$‘000 | | | Expenditure
to
30-06-17
$‘000 | | | Budget
2017-18
$‘000 | | | Post
2017-18
$‘000 | |
| | | | | |
QUEENSLAND RECONSTRUCTION AUTHORITY | | | | | | | | | | | | | | | | | | | | |
| | | | | |
Capital Grants | | | | | | | | | | | | | | | | | | | | |
Local Government Authorities | | | Various | | | | 1,084,429 | | | | 372,611 | | | | 317,933 | | | | 393,885 | |
| | | | | | | | | | | | | | | | | | | | |
Total Capital Grants | | | | | | | | | | | | | | | 317,933 | | | | | |
| | | | | | | | | | | | | | | | | | | | |
| | | | | | | | | | | | | | | | | | | | |
| | | | | |
CROSS RIVER RAIL DELIVERY AUTHORITY | | | | | | | | | | | | | | | | | | | | |
| | | | | |
Property, Plant and Equipment | | | | | | | | | | | | | | | | | | | | |
Cross River Rail | | | 305 | | | | 5,409,000 | | | | | | | | 129,000 | | | | 5,280,000 | |
| | | | | | | | | | | | | | | | | | | | |
Total Property, Plant and Equipment | | | | | | | | | | | | | | | 129,000 | | | | | |
| | | | | | | | | | | | | | | | | | | | |
| | | | | | | | | | | | | | | | | | | | |
| | | | | | | | | | | | | | | | | | | | |
TOTAL INFRASTRUCTURE, LOCAL GOVERNMENT AND PLANNING (PPE) | | | | | | | | | | | | | | | 247,964 | | | | | |
| | | | | | | | | | | | | | | | | | | | |
| | | | | | | | | | | | | | | | | | | | |
| | | | | | | | | | | | | | | | | | | | |
TOTAL INFRASTRUCTURE, LOCAL GOVERNMENT AND PLANNING (CG) | | | | | | | | | | | | | | | 614,493 | | | | | |
| | | | | | | | | | | | | | | | | | | | |
74
Capital Statement 2017-18
| 3.10 | JUSTICE AND ATTORNEY-GENERAL |
The 2017-18 capital purchases for Justice and Attorney-General (including Public Trust Office, Legal Aid Queensland and Crime and Corruption Commission) are $227.2 million.
Department of Justice and Attorney-General
The Department of Justice and Attorney-General capital purchases for 2017-18 are $203.9 million. The department’s capital purchases will primarily focus on prison infrastructure, perimeter security upgrades, correctional centre enhancements, security management system upgrade and the programmed renewal and minor works of courthouses and youth justice facilities.
Program Highlights (Property, Plant and Equipment)
| • | | $7.5 million of $200 million at Capricornia Correctional Centre to provide an extra 164 beds to provide additional prisoner capacity. |
| • | | $42.1 million of $126.9 million to complete the recommissioning of Borallon Training and Correctional Centre, incorporating the remediation of hanging points from all secure cells without air-conditioning. |
| • | | $26.8 million of $76.6 million Perimeter Security Upgrade Program - Stage 2. This program will upgrade the perimeter security at various correctional centres. |
| • | | $24.3 million in correctional centre enhancements including Woodford Correctional Centre and Brisbane Women’s Correctional Centre. |
| • | | $15.8 million of $23.4 million to upgrade the security management system at the Brisbane Youth Detention Centre. |
| • | | $16.9 million to support the transition of 17 year olds into the youth justice system. |
| • | | $20.1 million of $37.3 million project to upgrade the Rockhampton, Beenleigh, Townsville and Kingaroy courthouses. |
| • | | $26.2 million for the on-going programmed renewal, maintenance and minor works of courthouses and youth justice facilities. |
Public Trustee of Queensland
During 2017-18 the capital budget is $13.5 million. This capital expenditure will enable the Public Trust Office to continue to provide a wide range of efficient services to the Queensland community, as well as continuing to maintain appropriate workplace health and safety standards for clients and staff.
75
Capital Statement 2017-18
Program Highlights (Property, Plant and Equipment)
| • | | $8.8 million will be spent on building improvements and refurbishment of existing offices throughout the state. |
| • | | $3.9 million will be spent on plant and equipment. This includes investment for the fitout of offices and investment in computer hardware to manage the upgrading of equipment on a rolling replacement strategy. |
| • | | The Public Trustee will also invest $800,000 in software during the year. |
Legal Aid Queensland
Legal Aid Queensland’s 2017-18 capital expenditure program is $1.3 million. Legal Aid Queensland will invest $1.1 million on major property, plant and equipment projects including the refurbishment of the Cairns and Brisbane offices.
A further $205,000 will be invested to maintain Legal Aid Queensland’s business systems, replace motor vehicles and minor property, plant and equipment.
Crime and Corruption Commission
The Crime and Corruption Commission will spend $8.5 million on its capital purchases in 2017-18. The Commission will invest $3.6 million in developing a new Investigations Case Management System, $3.4 million on computer and other equipment replacement and $700,000 on vehicle replacement.
76
Capital Statement 2017-18
| | | | | | | | | | | | | | | | | | | | |
| Justice and Attorney-General | |
Project | | Statistical
Area | | | Total
Estimated
Cost
$‘000 | | | Expenditure
to
30-06-17
$‘000 | | | Budget
2017-18
$‘000 | | | Post
2017-18
$‘000 | |
DEPARTMENT OF JUSTICE AND ATTORNEY-GENERAL | | | | | | | | | | | | | | | | | | | | |
| | | | | |
Property, Plant and Equipment | | | | | | | | | | | | | | | | | | | | |
Queensland Corrective Services | | | | | | | | | | | | | | | | | | | | |
Major Works - Correctional Centres | | | | | | | | | | | | | | | | | | | | |
Capricornia Correctional Centre Expansion | | | 308 | | | | 200,000 | | | | | | | | 7,500 | | | | 192,500 | |
Borallon Training and Correctional Centre | | | 310 | | | | 126,900 | | | | 84,828 | | | | 42,072 | | | | | |
Perimeter Security Upgrade Program - Stage 2 | | | Various | | | | 76,579 | | | | 17,049 | | | | 26,801 | | | | 32,729 | |
| | | | | | | | | | | | | | | | | | | | |
Sub-total Major Works - Correctional Centres | | | | | | | | | | | | | | | 76,373 | | | | | |
| | | | | | | | | | | | | | | | | | | | |
| | | | | |
Correctional Centre Enhancements | | | | | | | | | | | | | | | | | | | | |
Brisbane Women’s Correctional Centre | | | 310 | | | | 22,000 | | | | 500 | | | | 13,500 | | | | 8,000 | |
Woodford Correctional Centre | | | 313 | | | | 8,011 | | | | 2,377 | | | | 5,634 | | | | | |
Prison Infrastructure | | | Various | | | | 14,923 | | | | 9,796 | | | | 5,127 | | | | | |
| | | | | | | | | | | | | | | | | | | | |
Sub-total Correctional Centre Enhancements | | | | | | | | | | | | | | | 24,261 | | | | | |
| | | | | | | | | | | | | | | | | | | | |
| | | | | |
Probation and Parole office accommodation | | | Various | | | | | | | | | | | | 2,394 | | | | Ongoing | |
Other acquisitions of property, plant and equipment | | | Various | | | | | | | | | | | | 10,182 | | | | Ongoing | |
| | | | | | | | | | | | | | | | | | | | |
Sub-total Queensland Corrective Services | | | | | | | | | | | | | | | 113,210 | | | | | |
| | | | | | | | | | | | | | | | | | | | |
| | | | | |
Youth Justice Services | | | | | | | | | | | | | | | | | | | | |
Brisbane Youth Detention Centre - Security Management System Upgrade | | | 310 | | | | 23,411 | | | | 2,925 | | | | 15,819 | | | | 4,667 | |
Transition of 17 year olds to the youth justice system | | | Various | | | | 16,886 | | | | | | | | 16,886 | | | | | |
Youth Justice Facilities | | | Various | | | | | | | | | | | | 11,305 | | | | Ongoing | |
| | | | | | | | | | | | | | | | | | | | |
Sub-total Youth Justice Services | | | | | | | | | | | | | | | 44,010 | | | | | |
| | | | | | | | | | | | | | | | | | | | |
| | | | | |
Justice Services | | | | | | | | | | | | | | | | | | | | |
Rockhampton Courthouse Upgrade | | | 308 | | | | 12,000 | | | | 165 | | | | 5,835 | | | | 6,000 | |
Beenleigh Courthouse Upgrade | | | 311 | | | | 11,000 | | | | | | | | 5,500 | | | | 5,500 | |
Townsville Courthouse Upgrade | | | 318 | | | | 9,000 | | | | | | | | 4,500 | | | | 4,500 | |
77
Capital Statement 2017-18
| | | | | | | | | | | | | | | | | | | | |
| Justice and Attorney-General | |
Project | | Statistical
Area | | | Total
Estimated
Cost
$‘000 | | | Expenditure
to
30-06-17
$‘000 | | | Budget
2017-18
$‘000 | | | Post
2017-18
$‘000 | |
Kingaroy Courthouse Upgrade | | | 319 | | | | 5,260 | | | | 952 | | | | 4,308 | | | | | |
Courthouses, Programmed Renewal | | | Various | | | | | | | | | | | | 13,210 | | | | Ongoing | |
Courthouses, Minor Capital Works | | | Various | | | | | | | | | | | | 1,670 | | | | Ongoing | |
Other acquisitions of property, plant and equipment | | | Various | | | | | | | | | | | | 6,335 | | | | Ongoing | |
Queensland Courts Information Systems | | | 305 | | | | | | | | | | | | 925 | | | | Ongoing | |
| | | | | | | | | | | | | | | | | | | | |
Sub-total Justice Services | | | | | | | | | | | | | | | 42,283 | | | | | |
| | | | | | | | | | | | | | | | | | | | |
| | | | | |
Other Departmental | | | | | | | | | | | | | | | | | | | | |
Minor Capital Works - Software | | | 305 | | | | | | | | | | | | 3,178 | | | | Ongoing | |
Leasehold Improvements | | | Various | | | | | | | | | | | | 491 | | | | Ongoing | |
Other acquisitions of property, plant and equipment | | | Various | | | | | | | | | | | | 761 | | | | Ongoing | |
| | | | | | | | | | | | | | | | | | | | |
Sub-total Other Departmental | | | | | | | | | | | | | | | 4,430 | | | | | |
| | | | | | | | | | | | | | | | | | | | |
| | | | | | | | | | | | | | | | | | | | |
| | | | | | | | | | | | | | | | | | | | |
Total Property, Plant and Equipment | | | | | | | | | | | | | | | 203,933 | | | | | |
| | | | | | | | | | | | | | | | | | | | |
| | | | | |
PUBLIC TRUSTEE OF QUEENSLAND | | | | | | | | | | | | | | | | | | | | |
| | | | | |
Property, Plant and Equipment | | | | | | | | | | | | | | | | | | | | |
Other capital | | | 305 | | | | | | | | | | | | 800 | | | | Ongoing | |
Buildings | | | Various | | | | | | | | | | | | 8,750 | | | | Ongoing | |
Plant and equipment | | | Various | | | | | | | | | | | | 3,931 | | | | Ongoing | |
| | | | | | | | | | | | | | | | | | | | |
Total Property, Plant and Equipment | | | | | | | | | | | | | | | 13,481 | | | | | |
| | | | | | | | | | | | | | | | | | | | |
| | | | | |
LEGAL AID QUEENSLAND | | | | | | | | | | | | | | | | | | | | |
| | | | | |
Property, Plant and Equipment | | | | | | | | | | | | | | | | | | | | |
Brisbane building refurbishment | | | 305 | | | | 246 | | | | | | | | 246 | | | | | |
Cairns office relocation and refurbishment | | | 306 | | | | 707 | | | | | | | | 707 | | | | | |
Other office refurbishment | | | 305 | | | | | | | | | | | | 169 | | | | Ongoing | |
Motor vehicle replacement | | | 305 | | | | | | | | | | | | 205 | | | | Ongoing | |
| | | | | | | | | | | | | | | | | | | | |
Total Property, Plant and Equipment | | | | | | | | | | | | | | | 1,327 | | | | | |
| | | | | | | | | | | | | | | | | | | | |
78
Capital Statement 2017-18
| | | | | | | | | | | | | | | | | | | | |
| Justice and Attorney-General | |
Project | | Statistical
Area | | | Total
Estimated
Cost
$‘000 | | | Expenditure
to
30-06-17
$‘000 | | | Budget
2017-18
$‘000 | | | Post
2017-18
$‘000 | |
| | | | |
CRIME AND CORRUPTION COMMISSION | | | | | | | | | | | | | | | | | |
| | | | | |
Property, Plant and Equipment | | | | | | | | | | | | | | | | | | | | |
Computer software | | | 305 | | | | 300 | | | | | | | | 300 | | | | | |
Investigations case management system | | | 305 | | | | 3,637 | | | | | | | | 3,637 | | | | | |
Computer and other equipment | | | 305 | | | | 3,423 | | | | | | | | 3,423 | | | | | |
Vehicle replacement | | | 305 | | | | 700 | | | | | | | | 700 | | | | | |
Leasehold improvements | | | 305 | | | | 405 | | | | | | | | 405 | | | | | |
| | | | | | | | | | | | | | | | | | | | |
Total Property, Plant and Equipment | | | | | | | | | | | | | | | 8,465 | | | | | |
| | | | | | | | | | | | | | | | | | | | |
| | | | | | | | | | | | | | | | | | | | |
| | | | | | | | | | | | | | | | | | | | |
TOTAL JUSTICE AND ATTORNEY-GENERAL (PPE) | | | | | | | | 227,206 | | | | | |
| | | | | | | | | | | | | | | | | | | | |
79
Capital Statement 2017-18
| 3.11 | LEGISLATIVE ASSEMBLY OF QUEENSLAND |
Total capital purchases for the Legislative Assembly of Queensland are $7.7 million in 2017-18. Significant capital expenditure in the parliamentary precinct includes continuation of the Parliament House fire protection system, completion of the Parliament House stonework restoration program, continuation of CCTV Security upgrade throughout the precinct, and the replacement of various property, plant and equipment including information technology infrastructure. In 2017-18, a range of major office equipment devices will also be replaced in Members’ electorate offices.
| | | | | | | | | | | | | | | | | | | | |
| Legislative Assembly of Queensland | |
Project | | Statistical
Area | | | Total
Estimated
Cost
$‘000 | | | Expenditure
to
30-06-17
$‘000 | | | Budget
2017-18
$‘000 | | | Post
2017-18
$‘000 | |
LEGISLATIVE ASSEMBLY OF QUEENSLAND | | | | | | | | | | | | | | | | | | | | |
| | | | | |
Property, Plant and Equipment | | | | | | | | | | | | | | | | | | | | |
Parliament House stonework restoration | | | 305 | | | | 6,064 | | | | 5,664 | | | | 400 | | | | | |
Parliament House fire protection system | | | 305 | | | | 5,621 | | | | 2,227 | | | | 3,394 | | | | | |
CCTV Security upgrade | | | 305 | | | | 1,500 | | | | 900 | | | | 300 | | | | 300 | |
Precinct audio visual equipment | | | 305 | | | | 900 | | | | 700 | | | | 200 | | | | | |
Other property, plant and equipment | | | 305 | | | | | | | | | | | | 3,370 | | | | Ongoing | |
| | | | | | | | | | | | | | | | | | | | |
Total Property, Plant and Equipment | | | | | | | | | | | | | | | 7,664 | | | | | |
| | | | | | | | | | | | | | | | | | | | |
| | | | | | | | | | | | | | | | | | | | |
| | | | | | | | | | | | | | | | | | | | |
TOTAL LEGISLATIVE ASSEMBLY OF QUEENSLAND (PPE) | | | | | | | | | | | | | | | 7,664 | | | | | |
| | | | | | | | | | | | | | | | | | | | |
80
Capital Statement 2017-18
| 3.12 | NATIONAL PARKS, SPORT AND RACING |
Total capital outlays for the Department of National Parks, Sport and Racing and Stadiums Queensland are $159.8 million for 2017-18.
Department of National Parks, Sport and Racing
Capital purchases for the Department of National Parks, Sport and Racing for 2017-18 are $49.5 million, with $68.1 million in capital grants.
The Department of National Parks, Sport and Racing’s vision is that Queenslanders are enriched and connected through healthy parks and active lifestyles.
Consistent with this vision, the department supports the Government’s commitments through protecting and managing our parks, forests and the Great Barrier Reef for current and future generations, supporting and encouraging participation in physical activity through sport and active recreation, and supporting the Queensland racing industry.
The 2017-18 capital program directly supports these objectives through capital grant programs, capital works in National Parks and Sport and Recreation facilities, ongoing replacement of plant and equipment and the development of systems to support delivery of frontline services.
Program Highlights (Property, Plant and Equipment)
| • | | $15 million in 2017-18 to enhance critical infrastructure including nature-based tourism opportunities and the management of the State’s national parks to protect natural and cultural values and maintain the breadth and quality of visitor experiences. |
| • | | $5.7 million for redevelopment of the Mon Repos Turtle Centre. |
| • | | $2.8 million to improve facilities at the Daisy Hill Koala Bushland precinct in preparation for the Gold Coast 2018 Commonwealth Games. |
| • | | $1.4 million for ‘start-up’ activities, including construction of internal roads, fences, signage and firebreaks, the establishment of management bases and ranger accommodation, and for the purchase of plant and equipment for recently established protected areas. |
| • | | $1.3 million for the development of management bases, ranger accommodation and supporting infrastructure on Cape York Peninsula. |
| • | | $1.3 million for visitor access and park management facilities and equipment on North Stradbroke Island, jointly managed with the Quandamooka Yoolooburrabee Aboriginal Corporation. |
81
Capital Statement 2017-18
| • | | $965,000 for moorings to improve tourism and recreation use of the Great Barrier Reef. |
| • | | $1.9 million towards the development of software systems. |
| • | | $14.7 million in various capital works and plant and equipment purchases for parks and forests. |
| • | | $4.3 million to maintain and upkeep Queensland Recreation Centres, Sports Grounds and Sports Houses throughout the State. |
Program Highlights (Capital Grants)
| • | | $41.1 million under the Get Playing and Get Playing Plus programs and other various grants to provide funding for new or upgraded sport and recreation facility projects to help Queenslanders become involved in sport and active recreation. |
| • | | $25 million under the Racing Infrastructure Fund to assist the racing industry to improve racing infrastructure facilities across the State. |
| • | | $2 million in 2017-18 towards a Queensland first grants program for female friendly change facilities. |
Stadiums Queensland
Stadiums Queensland’s 2017-18 capital outlay of $42.2 million represents the investment required to maintain Queensland’s major sports facilities to a standard appropriate for the conduct of national and international events, and community sports activity.
Program Highlights (Property, Plant and Equipment)
| • | | $29 million in 2017-18 towards the development of the Queensland State Netball Centre at the Queensland Sport and Athletics Centre. |
82
Capital Statement 2017-18
| | | | | | | | | | | | | | | | | | | | |
| National Parks, Sport and Racing | |
Project | | Statistical
Area | | | Total
Estimated
Cost
$‘000 | | | Expenditure
to
30-06-17
$‘000 | | | Budget
2017-18
$‘000 | | | Post
2017-18
$‘000 | |
DEPARTMENT OF NATIONAL PARKS, SPORT AND RACING | | | | | | | | | | | | | | | | | | | | |
| | | | | |
Property, Plant and Equipment | | | | | | | | | | | | | | | | | | | | |
Queensland Recreation Centres, Sports Grounds and Sport Houses Capital Works | | | Various | | | | | | | | | | | | 4,252 | | | | Ongoing | |
Various plant and equipment - Sport and Recreation | | | Various | | | | | | | | | | | | 239 | | | | Ongoing | |
Revitalising National Parks | | | Various | | | | 35,000 | | | | | | | | 15,000 | | | | 20,000 | |
Recreation and visitor facilities - Parks and forests | | | Various | | | | | | | | | | | | 5,718 | | | | Ongoing | |
Management and access facilities - Parks and forests | | | Various | | | | | | | | | | | | 5,680 | | | | Ongoing | |
Mon Repos Turtle Centre redevelopment | | | 319 | | | | 10,000 | | | | 499 | | | | 5,737 | | | | 3,764 | |
Daisy Hill Koala Bushland precinct | | | 311 | | | | 3,300 | | | | 500 | | | | 2,800 | | | | | |
Recreation, visitor, management and access facilities for recently established protected areas | | | Various | | | | | | | | | | | | 1,411 | | | | Ongoing | |
Cape York - Recreation, visitor, management and access facilities | | | 315 | | | | | | | | | | | | 1,290 | | | | Ongoing | |
North Stradbroke Island - Recreation, visitor, management and access facilities | | | 301 | | | | | | | | | | | | 1,299 | | | | Ongoing | |
Improving tourism and recreation use of the Great Barrier Reef - Moorings | | | 306 | | | | 2,375 | | | | 855 | | | | 965 | | | | 555 | |
Various plant and equipment - Parks and forests | | | Various | | | | | | | | | | | | 3,276 | | | | Ongoing | |
System Development - Parks and forests | | | Various | | | | | | | | | | | | 1,863 | | | | Ongoing | |
| | | | | | | | | | | | | | | | | | | | |
Total Property, Plant and Equipment | | | | | | | | | | | | | | | 49,530 | | | | | |
| | | | | | | | | | | | | | | | | | | | |
| | | | | |
Capital Grants | | | | | | | | | | | | | | | | | | | | |
Get Playing rounds 4-6 | | | Various | | | | 41,000 | | | | 15,950 | | | | 16,986 | | | | 8,064 | |
Get Playing Plus | | | Various | | | | 60,250 | | | | 23,797 | | | | 22,507 | | | | 13,946 | |
Female Friendly Facilities Program | | | Various | | | | 15,000 | | | | | | | | 2,000 | | | | 13,000 | |
Various capital grants - Sport and Recreation | | | Various | | | | 1,600 | | | | | | | | 1,600 | | | | | |
83
Capital Statement 2017-18
| | | | | | | | | | | | | | | | | | | | |
| National Parks, Sport and Racing | |
Project | | Statistical
Area | | | Total
Estimated
Cost
$‘000 | | | Expenditure
to
30-06-17
$‘000 | | | Budget
2017-18
$‘000 | | | Post
2017-18
$‘000 | |
Racing Infrastructure Fund | | | Various | | | | 125,088 | | | | 12,647 | | | | 25,000 | | | | 87,441 | |
| | | | | | | | | | | | | | | | | | | | |
Total Capital Grants | | | | | | | | | | | | | | | 68,093 | | | | | |
| | | | | | | | | | | | | | | | | | | | |
| | | | | |
STADIUMS QUEENSLAND | | | | | | | | | | | | | | | | | | | | |
| | | | | |
Property, Plant and Equipment | | | | | | | | | | | | | | | | | | | | |
Annual capital and maintenance program | | | Various | | | | | | | | | | | | 13,203 | | | | Ongoing | |
Queensland State Netball Centre | | | 303 | | | | 44,000 | | | | 2,255 | | | | 29,000 | | | | 12,745 | |
| | | | | | | | | | | | | | | | | | | | |
Total Property, Plant and Equipment | | | | | | | | | | | | | | | 42,203 | | | | | |
| | | | | | | | | | | | | | | | | | | | |
| | | | | | | | | | | | | | | | | | | | |
| | | | | | | | | | | | | | | | | | | | |
TOTAL NATIONAL PARKS, SPORT AND RACING (PPE) | | | | | | | | | | | | | | | 91,733 | | | | | |
| | | | | | | | | | | | | | | | | | | | |
| | | | | | | | | | | | | | | | | | | | |
| | | | | | | | | | | | | | | | | | | | |
TOTAL NATIONAL PARKS, SPORT AND RACING (CG) | | | | | | | | | | | | | | | 68,093 | | | | | |
| | | | | | | | | | | | | | | | | | | | |
84
Capital Statement 2017-18
| 3.13 | NATURAL RESOURCES AND MINES |
Total capital purchases for the Natural Resources and Mines portfolio for 2017-18 is $17.7 million.
Department of Natural Resources and Mines
The Department of Natural Resources and Mines’ purpose is to promote the responsible use of our natural resources - water, land, minerals and energy - to sustainably generate prosperity for current and future generations of Queenslanders.
To support this, the department’s 2017-18 capital investment program will continue to: invest in a robust and reliable water monitoring network, manage disclaimed mine sites, maintain the stock route network, upgrade departmental buildings and accommodation facilities and address the department’s aged ICT asset portfolio to provide simple and efficient access to information for industry and the community.
Program Highlights
| • | | $4.5 million in 2017-18 towards ICT systems development. |
| • | | $2.6 million in 2017-18 towards systems development for the management of Geoscience data curation and support systems. |
| • | | $1.8 million in 2017-18 for the management of the disclaimed mine sites. |
| • | | $800,000 in 2017-18 towards improvements to the stock route network. |
| | | | | | | | | | | | | | | | | | | | |
| Natural Resources and Mines | |
Project | | Statistical
Area | | | Total
Estimated
Cost
$‘000 | | | Expenditure
to
30-06-17
$‘000 | | | Budget
2017-18
$‘000 | | | Post
2017-18
$‘000 | |
DEPARTMENT OF NATURAL RESOURCES AND MINES | | | | | | | | | | | | | | | | | | | | |
| | | | | |
Property, Plant and Equipment | | | | | | | | | | | | | | | | | | | | |
Strategic Resources Exploration Program | | | 305 | | | | 7,125 | | | | | | | | 2,595 | | | | 4,530 | |
Texas Silver Mine Site Rehabilitation and Management | | | 307 | | | | 2,000 | | | | 400 | | | | 1,600 | | | | | |
Water Monitoring network | | | Various | | | | | | | | | | | | 1,312 | | | | Ongoing | |
Stock Route network | | | Various | | | | | | | | | | | | 800 | | | | Ongoing | |
Linc Energy Mine Site Rehabilitation and Management | | | 307 | | | | | | | | | | | | 223 | | | | Ongoing | |
Systems development | | | 305 | | | | | | | | | | | | 4,501 | | | | Ongoing | |
85
Capital Statement 2017-18
| | | | | | | | | | | | | | | | | | | | |
| Natural Resources and Mines | |
Project | | Statistical
Area | | | Total
Estimated
Cost
$‘000 | | | Expenditure
to
30-06-17
$‘000 | | | Budget
2017-18
$‘000 | | | Post
2017-18
$‘000 | |
Other property, plant and equipment | | | Various | | | | | | | | | | | | 6,654 | | | | Ongoing | |
| | | | | | | | | | | | | | | | | | | | |
Total Property, Plant and Equipment | | | | | | | | | | | | | | | 17,685 | | | | | |
| | | | | | | | | | | | | | | | | | | | |
| | | | | | | | | | | | | | | | | | | | |
| | | | | | | | | | | | | | | | | | | | |
TOTAL NATURAL RESOURCES AND MINES (PPE) | | | | | | | | | | | | | | | 17,685 | | | | | |
| | | | | | | | | | | | | | | | | | | | |
86
Capital Statement 2017-18
Department of the Premier and Cabinet
The Department of the Premier and Cabinet (including Ministerial Offices and Office of the Leader of the Opposition) has planned capital purchases of $20.2 million and capital grants of $26.6 million in 2017-18.
Program Highlights (Property, Plant and Equipment)
| • | | $6 million to renew and replace large critical infrastructure items across the Cultural Precinct, including the central energy plant renewal program, precinct-wide electrical safety upgrade program, precinct accessibility and mobility projects including amenities upgrades, precinct-wide lift and escalator upgrades, theatre dressing room upgrades at Queensland Performing Arts Centre and storage upgrades at the Queensland Art Gallery. |
| • | | $6 million for priority infrastructure projects across State owned arts and cultural facilities including works on the Bille Brown Theatre, delivered through the Arts Infrastructure Investment Fund. |
| • | | $5.9 million for the creation of a new permanent Anzac Legacy Gallery at the Queensland Museum, South Bank, as part of Queensland’s Anzac Centenary commemoration program 2014-18. |
| • | | $1.4 million to refurbish the Cremorne Theatre, including new seats, changes to balconies to improve sightlines to the stage, better accessibility for patrons with disabilities and allow greater flexibility for the theatre to be transformed and adapted for different productions. |
Program Highlights (Capital Grants)
| • | | $14 million towards the construction of the Cairns Performing Arts Centre. |
| • | | $5 million for the restoration and enhancement of the state’s war memorial in Anzac Square, Brisbane. |
| • | | $4.4 million to Queensland Museum for the transformation of the Sciencentre. |
| • | | $2 million provided towards the planned relocation of the Rockhampton Art Gallery. |
Queensland Museum
The Queensland Museum will invest $5.8 million in the Queensland Museum Sciencentre, State Collection storage and acquisitions as well as the life cycle replacement and renewal of equipment.
87
Capital Statement 2017-18
Program Highlights (Property, Plant and Equipment)
| • | | $4.4 million to transform the Sciencentre at the Queensland Museum into a cutting edge interactive hub for science, technology, engineering and mathematics (STEM). |
| • | | $503,000 invested in information technology primarily for the life cycle replacement of assets and upgrades across the museum network. |
Queensland Art Gallery
The Queensland Art Gallery will invest $4.2 million in acquiring art for the Gallery’s collection as well as life cycle replacement of other property, plant and equipment assets.
Program Highlights (Property, Plant and Equipment)
| • | | $3.6 million investment in the acquisition of art for the Gallery’s collection. |
| • | | $550,000 to replace other property, plant and equipment. |
Queensland Performing Arts Trust
The Queensland Performing Arts Trust will invest $1 million in the lifecycle replacement of operational property plant and equipment assets such as theatre equipment and food and beverage equipment.
| | | | | | | | | | | | | | | | | | | | |
| Premier and Cabinet | |
Project | | Statistical
Area | | | Total
Estimated
Cost
$‘000 | | | Expenditure
to
30-06-17
$‘000 | | | Budget
2017-18
$‘000 | | | Post
2017-18
$‘000 | |
DEPARTMENT OF THE PREMIER AND CABINET | | | | | | | | | | | | | | | | | | | | |
| | | | | |
Property, Plant and Equipment | | | | | | | | | | | | | | | | | | | | |
Cultural Precinct Critical Infrastructure | | | 305 | | | | 22,856 | | | | 14,201 | | | | 5,995 | | | | 2,660 | |
Cremorne Theatre | | | 305 | | | | 2,250 | | | | 845 | | | | 1,405 | | | | | |
DPC ICT Systems Upgrade | | | 305 | | | | 957 | | | | 38 | | | | 919 | | | | | |
Arts Infrastructure Investment Fund | | | Various | | | | 17,500 | | | | | | | | 6,000 | | | | 11,500 | |
Anzac Legacy - Anzac Gallery at Queensland Museum South Bank | | | 305 | | | | 6,473 | | | | 601 | | | | 5,872 | | | | | |
| | | | | | | | | | | | | | | | | | | | |
Total Property, Plant and Equipment | | | | | | | | | | | | 20,191 | | | | | |
| | | | | | | | | | | | | | | | | | | | |
| | | | | |
Capital Grants | | | | | | | | | | | | | | | | | | | | |
Upgrade of Queensland Museum’s South Bank Storage Area | | | 305 | | | | 2,300 | | | | 1,000 | | | | 700 | | | | 600 | |
88
Capital Statement 2017-18
| | | | | | | | | | | | | | | | | | |
| Premier and Cabinet | |
Project | | Statistical
Area | | Total
Estimated
Cost
$‘000 | | | Expenditure
to
30-06-17
$‘000 | | | Budget
2017-18
$‘000 | | | Post
2017-18
$‘000 | |
Cultural Infrastructure | | 305 | | | 750 | | | | 500 | | | | 250 | | | | | |
Anzac Legacy - Anzac Square Stage 4 | | 305 | | | 16,400 | | | | 11,400 | | | | 5,000 | | | | | |
QAG Critical Asset Replacement | | 305 | | | 1,450 | | | | 1,200 | | | | 250 | | | | | |
QM Sciencentre - STEM Development | | 305 | | | 9,360 | | | | 5,000 | | | | 4,360 | | | | | |
Cairns Performing Arts Centre | | 306 | | | 15,000 | | | | | | | | 14,000 | | | | 1,000 | |
Rockhampton Art Gallery | | 308 | | | 2,000 | | | | | | | | 2,000 | | | | | |
| | | | | | | | | | | | | | | | | | |
Total Capital Grants | | | | | | | | | | | | | 26,560 | | | | | |
| | | | | | | | | | | | | | | | | | |
| | | | | |
QUEENSLAND MUSEUM | | | | | | | | | | | | | | | | | | |
| | | | | |
Property, Plant and Equipment | | | | | | | | | | | | | | | | | | |
Sciencentre Transformation | | 305 | | | 9,360 | | | | 5,000 | | | | 4,360 | | | | | |
Life cycle capital replacement | | 305 | | | 357 | | | | | | | | 357 | | | | | |
Collection acquisition | | 305 | | | 50 | | | | | | | | 50 | | | | | |
Collection storage facilities | | 305 | | | 490 | | | | | | | | 490 | | | | | |
Information Technology | | 305 | | | 503 | | | | | | | | 503 | | | | | |
| | | | | | | | | | | | | | | | | | |
Total Property, Plant and Equipment | | | | | | | | | | | | | 5,760 | | | | | |
| | | | | | | | | | | | | | | | | | |
| | | | | |
QUEENSLAND ART GALLERY | | | | | | | | | | | | | | | | | | |
| | | | | |
Property, Plant and Equipment | | | | | | | | | | | | | | | | | | |
Acquisition of Art Works for the Gallery | | 305 | | | | | | | | | | | 3,647 | | | | Ongoing | |
Critical replacement of Plant and Equipment | | 305 | | | 1,450 | | | | 1,200 | | | | 250 | | | | | |
Ongoing replacement of Plant and Equipment | | 305 | | | | | | | | | | | 300 | | | | Ongoing | |
| | | | | | | | | | | | | | | | | | |
Total Property, Plant and Equipment | | | | | | | | | | | | | 4,197 | | | | | |
| | | | | | | | | | | | | | | | | | |
89
Capital Statement 2017-18
| | | | | | | | | | | | | | | | | | | | |
Premier and Cabinet | |
Project | | Statistical
Area | | | Total
Estimated
Cost
$‘000 | | | Expenditure
to
30-06-17
$‘000 | | | Budget
2017-18
$‘000 | | | Post
2017-18
$‘000 | |
| | | | | |
QUEENSLAND PERFORMING ARTS TRUST | | | | | | | | | | | | | | | | | | | | |
| | | | | |
Property, Plant and Equipment | | | | | | | | | | | | | | | | | | | | |
Lifecycle replacement of operational PPE | | | 305 | | | | | | | | | | | | 1,000 | | | | Ongoing | |
| | | | | | | | | | | | | | | | | | | | |
Total Property, Plant and Equipment | | | | | | | | | | | | | | | 1,000 | | | | | |
| | | | | | | | | | | | | | | | | | | | |
| | | | | | | | | | | | | | | | | | | | |
| | | | | | | | | | | | | | | | | | | | |
TOTAL PREMIER AND CABINET (PPE) | | | | | | | | | | | | | | | 31,148 | | | | | |
| | | | | | | | | | | | | | | | | | | | |
| | | | | | | | | | | | | | | | | | | | |
| | | | | | | | | | | | | | | | | | | | |
TOTAL PREMIER AND CABINET (CG) | | | | | | | | | | | | | | | 26,560 | | | | | |
| | | | | | | | | | | | | | | | | | | | |
90
Capital Statement 2017-18
| 3.15 | PUBLIC SAFETY BUSINESS AGENCY |
The 2017-18 Public Safety Business Agency capital program provides an investment of $244 million in capital purchases to support the delivery of essential frontline public safety services to Queensland communities.
This investment will fund capital works, information technology and other essential equipment for the Queensland Police Service, Queensland Fire and Emergency Services and the Office of the Inspector-General Emergency Management.
Queensland Fire and Emergency Services
$107.9 million is provided for fire and emergency services facilities, urban and rural fire appliances and communications equipment including:
| • | | $1.9 million to commence replacement of the auxiliary fire and rescue stations at Kilkivan and Rathdowney and to continue replacement of the auxiliary fire and rescue station at Tara. |
| • | | $16.7 million to complete the replacement of the auxiliary fire and rescue stations at Charleville, Childers, Goombungee, Gordonvale, Herberton, Oakey, Proserpine and Richmond. |
| • | | $2.5 million to complete an upgrade of the permanent fire and rescue station at Bundamba and commence an upgrade of the permanent fire and rescue station at Mount Ommaney. |
| • | | $6.4 million to complete replacement of the permanent fire and rescue station and BA Hazmat facility at Mackay. |
| • | | $4.5 million to complete replacement of the permanent fire and rescue station at Smithfield and to upgrade the permanent fire and rescue station and Communications Centre at Rockhampton. |
| • | | $0.5 million to fit-out a State Air Operations Facility hangar at Toowoomba. |
| • | | $4 million to complete a Rural Fire Service and State Emergency Service (SES) facility at Howard collocated with a new police station. |
| • | | $1.3 million to complete replacement of the permanent fire and rescue station, Rural Fire Service and SES facility at Bundaberg. |
| • | | $1.3 million to complete replacement of the auxiliary fire and rescue station, Rural Fire Service and SES facility at Roma, and infrastructure works for the south western region headquarters at Charlton. |
| • | | $2.8 million to upgrade the Horn Island collocated Rural Fire Service and SES facility. |
91
Capital Statement 2017-18
| • | | $1.9 million to complete an upgrade of the mixed permanent-auxiliary fire and rescue station at Mount Isa and to commence replacement of the combined area office and the Rural Fire Service and SES facility at Mount Isa. |
| • | | $1 million to fit-out a specialist response and training facility at North Rockhampton. |
| • | | $5.7 million for strategic land acquisitions and Rural Fire Service land purchases. |
| • | | $47.1 million for replacement and new urban and rural fire appliances. |
| • | | $4.3 million for minor capital works across the State including upgrades of fire and rescue station amenities. |
| • | | $6.1 million for operational, information and communications systems and equipment. |
Queensland Police Service
$121.7 million is provided for Queensland Police Service facilities, information and communication technology and other essential equipment including:
| • | | $4.1 million to commence the residential accommodation at Aurukun, the police station and watchhouse upgrade at Aurukun, the refurbishment of the heritage building at Wacol, the replacement police stations at Coolum and Mount Morgan and the replacement police station and watchhouse at Pormpuraaw. |
| • | | $3.5 million to commence the Westgate Counter-Terrorism and Community Safety Training Centre. |
| • | | $5.8 million to continue the replacement police station and district headquarters and to upgrade an existing police station and watchhouse at Caboolture. |
| • | | $0.8 million to continue the new police station at Highfields, the replacement police stations at Beaudesert, Kilcoy and Nambour and to upgrade the police station at Atherton. |
| • | | $3.5 million to continue the Police Headquarters renewal project. |
| • | | $5.6 million to complete the construction of the new collocated Road Policing Unit and Special Emergency Response Team facility at Cairns. |
| • | | $13.9 million to complete replacement of the police station at Gordonvale, a replacement police station at Howard, collocated with a Rural Fire Service and SES facility and replacement of the police station at Bowen. |
| • | | $32.4 million for new and replacement police service vehicles. |
| • | | $20.6 million for plant and equipment including the Public Safety Network. |
92
Capital Statement 2017-18
| • | | $12.3 million for a range of information and communication technology initiatives. |
| • | | $3 million for strategic land acquisitions. |
| • | | $16.3 million for minor capital works across the State. |
Public Safety Business Agency - Other Departmental Capital
| • | | $6.1 million is provided for aircraft maintenance. |
| • | | $8.3 million is provided to support the Queensland Ambulance Service information and communication technology. |
| | | | | | | | | | | | | | | | | | | | |
| Public Safety Business Agency | |
Project | | Statistical
Area | | | Total
Estimated
Cost
$‘000 | | | Expenditure
to
30-06-17
$‘000 | | | Budget
2017-18
$‘000 | | | Post
2017-18
$‘000 | |
PUBLIC SAFETY BUSINESS AGENCY | | | | | | | | | | | | | | | | | | | | |
| | | | | |
Property, Plant and Equipment | | | | | | | | | | | | | | | | | | | | |
Queensland Fire and Emergency Services | | | | | | | | | | | | | | | | | | | | |
Buildings | | | | | | | | | | | | | | | | | | | | |
Bundaberg replacement permanent station, rural fire and SES facility | | | 319 | | | | 7,046 | | | | 5,772 | | | | 1,274 | | | | | |
Bundamba permanent station upgrade | | | 310 | | | | 3,640 | | | | 1,190 | | | | 2,450 | | | | | |
Charleville replacement auxiliary station | | | 315 | | | | 3,012 | | | | 477 | | | | 2,535 | | | | | |
Charlton regional headquarters upgrade | | | 317 | | | | 750 | | | | 120 | | | | 630 | | | | | |
Childers replacement auxiliary station | | | 319 | | | | 3,960 | | | | 466 | | | | 3,494 | | | | | |
Goombungee replacement auxiliary station | | | 307 | | | | 1,600 | | | | 50 | | | | 1,550 | | | | | |
Gordonvale replacement auxiliary station | | | 306 | | | | 3,064 | | | | 1,514 | | | | 1,550 | | | | | |
Herberton replacement auxiliary station | | | 306 | | | | 2,706 | | | | 482 | | | | 2,224 | | | | | |
Horn Island collocated rural fire and SES facility upgrade | | | 315 | | | | 2,800 | | | | | | | | 2,800 | | | | | |
Howard rural fire station and SES facility, collocated with police station | | | 319 | | | | 4,892 | | | | 912 | | | | 3,980 | | | | | |
93
Capital Statement 2017-18
| | | | | | | | | | | | | | | | | | | | |
| Public Safety Business Agency | |
Project | | Statistical
Area | | | Total
Estimated
Cost
$‘000 | | | Expenditure
to
30-06-17
$‘000 | | | Budget
2017-18
$‘000 | | | Post
2017-18
$‘000 | |
Kilkivan replacement auxiliary station | | | 319 | | | | 1,800 | | | | | | | | 900 | | | | 900 | |
Mackay replacement permanent station and BA Hazmat facility | | | 312 | | | | 7,527 | | | | 1,093 | | | | 6,434 | | | | | |
Mount Isa permanent station upgrade | | | 315 | | | | 1,000 | | | | 211 | | | | 789 | | | | | |
Mount Isa replacement combined area office | | | 315 | | | | 3,500 | | | | | | | | 1,000 | | | | 2,500 | |
Mount Isa rural fire and SES facility upgrade | | | 315 | | | | 4,000 | | | | | | | | 100 | | | | 3,900 | |
Mount Ommaney permanent station upgrade | | | 304 | | | | 800 | | | | | | | | 50 | | | | 750 | |
North Rockhampton specialist response and training facility upgrade | | | 308 | | | | 1,000 | | | | | | | | 1,000 | | | | | |
Oakey replacement auxiliary station | | | 307 | | | | 1,330 | | | | 451 | | | | 879 | | | | | |
Proserpine replacement auxiliary station | | | 312 | | | | 3,205 | | | | 894 | | | | 2,311 | | | | | |
Rathdowney replacement auxiliary station | | | 311 | | | | 1,800 | | | | | | | | 800 | | | | 1,000 | |
Richmond replacement auxiliary station | | | 315 | | | | 2,201 | | | | 51 | | | | 2,150 | | | | | |
Rockhampton permanent station upgrade and Communications Centre | | | 308 | | | | 3,786 | | | | 862 | | | | 2,924 | | | | | |
Roma replacement auxiliary station, rural fire and SES facility | | | 307 | | | | 5,240 | | | | 4,540 | | | | 700 | | | | | |
Smithfield replacement permanent station | | | 306 | | | | 2,826 | | | | 1,265 | | | | 1,561 | | | | | |
Tara replacement auxiliary station | | | 307 | | | | 1,801 | | | | 51 | | | | 150 | | | | 1,600 | |
Toowoomba State Air Operations Facility hangar fit-out | | | 317 | | | | 500 | | | | | | | | 500 | | | | | |
Minor works | | | Various | | | | | | | | | | | | 4,280 | | | | Ongoing | |
Land | | | | | | | | | | | | | | | | | | | | |
Strategic land acquisitions | | | Various | | | | | | | | | | | | 5,609 | | | | Ongoing | |
94
Capital Statement 2017-18
| | | | | | | | | | | | | | | | | | |
| Public Safety Business Agency | |
Project | | Statistical
Area | | Total
Estimated
Cost
$‘000 | | | Expenditure
to
30-06-17
$‘000 | | | Budget
2017-18
$‘000 | | | Post
2017-18
$‘000 | |
Rural Operations land purchases | | Various | | | | | | | | | | | 100 | | | | Ongoing | |
Plant and Equipment | | | | | | | | | | | | | | | | | | |
Rural fire appliances | | Various | | | | | | | | | | | 10,691 | | | | Ongoing | |
Urban fire appliances | | Various | | | | | | | | | | | 36,449 | | | | Ongoing | |
Communications equipment | | Various | | | | | | | | | | | 4,743 | | | | Ongoing | |
Information systems development | | Various | | | | | | | | | | | 1,068 | | | | Ongoing | |
Other plant and equipment | | Various | | | | | | | | | | | 250 | | | | Ongoing | |
| | | | | | | | | | | | | | | | | | |
Sub-total Queensland Fire and Emergency Services | | | | | | | | | | | | | 107,925 | | | | | |
| | | | | | | | | | | | | | | | | | |
| | | | | |
Queensland Police Service | | | | | | | | | | | | | | | | | | |
Buildings | | | | | | | | | | | | | | | | | | |
Atherton station upgrade | | 306 | | | 6,190 | | | | 40 | | | | 150 | | | | 6,000 | |
Aurukun residential accommodation | | 315 | | | 2,750 | | | | | | | | 2,750 | | | | | |
Aurukun station and watchhouse upgrade | | 315 | | | 6,700 | | | | | | | | 200 | | | | 6,500 | |
Beaudesert replacement station | | 311 | | | 5,890 | | | | 290 | | | | 100 | | | | 5,500 | |
Bowen replacement station | | 312 | | | 8,000 | | | | 1,050 | | | | 6,950 | | | | | |
Caboolture replacement station and district headquarters | | 313 | | | 16,279 | | | | 700 | | | | 5,500 | | | | 10,079 | |
Caboolture old station and watchhouse refurbishment | | 313 | | | 6,533 | | | | 33 | | | | 300 | | | | 6,200 | |
Cairns new operational facilities | | 306 | | | 6,000 | | | | 404 | | | | 5,596 | | | | | |
Coolum replacement station | | 316 | | | 2,700 | | | | | | | | 100 | | | | 2,600 | |
Gordonvale replacement station | | 306 | | | 4,127 | | | | 338 | | | | 3,789 | | | | | |
Highfields new station | | 317 | | | 2,770 | | | | 70 | | | | 100 | | | | 2,600 | |
Howard replacement station, collocated with rural fire station and SES facility | | 319 | | | 3,896 | | | | 722 | | | | 3,174 | | | | | |
Kilcoy replacement station | | 313 | | | 1,965 | | | | 115 | | | | 100 | | | | 1,750 | |
Mount Morgan replacement station | | 308 | | | 2,100 | | | | | | | | 100 | | | | 2,000 | |
Nambour replacement station | | 316 | | | 9,040 | | | | 40 | | | | 300 | | | | 8,700 | |
Police Headquarters renewal project | | 305 | | | | | | | | | | | 3,500 | | | | Ongoing | |
Pormpuraaw replacement station and watchhouse | | 315 | | | 8,200 | | | | | | | | 300 | | | | 7,900 | |
Wacol heritage building refurbishment | | 310 | | | 11,200 | | | | | | | | 600 | | | | 10,600 | |
95
Capital Statement 2017-18
| | | | | | | | | | | | | | | | | | | | |
| Public Safety Business Agency | |
Project | | Statistical
Area | | | Total
Estimated
Cost
$‘000 | | | Expenditure
to
30-06-17
$‘000 | | | Budget
2017-18
$‘000 | | | Post
2017-18
$‘000 | |
Westgate - Counter-Terrorism and Community Training Centre | | | 310 | | | | 46,700 | | | | | | | | 3,500 | | | | 43,200 | |
Air conditioning plant replacement program | | | Various | | | | | | | | | | | | 4,500 | | | | Ongoing | |
Closed circuit camera upgrades in various watchhouses | | | Various | | | | | | | | | | | | 2,000 | | | | Ongoing | |
Housing upgrade program | | | Various | | | | | | | | | | | | 1,000 | | | | Ongoing | |
Minor works | | | Various | | | | | | | | | | | | 16,270 | | | | Ongoing | |
Strategic land acquisitions | | | Various | | | | | | | | | | | | 3,000 | | | | Ongoing | |
Plant and Equipment | | | | | | | | | | | | | | | | | | | | |
Information and communication technology | | | Various | | | | | | | | | | | | 12,324 | | | | Ongoing | |
Public Safety Network Management Centre | | | 305 | | | | | | | | | | | | 8,076 | | | | Ongoing | |
Vehicle replacement and growth | | | Various | | | | | | | | | | | | 32,431 | | | | Ongoing | |
Vessel management program | | | Various | | | | | | | | | | | | 4,397 | | | | Ongoing | |
Other plant and equipment | | | Various | | | | | | | | | | | | 600 | | | | Ongoing | |
| | | | | | | | | | | | | | | | | | | | |
Sub-total Queensland Police Service | | | | | | | | | | | | | | | 121,707 | | | | | |
| | | | | | | | | | | | | | | | | | | | |
| | | | | |
Other Departmental | | | | | | | | | | | | | | | | | | | | |
Aircraft maintenance | | | Various | | | | | | | | | | | | 6,087 | | | | Ongoing | |
Queensland Ambulance Service information systems development | | | Various | | | | | | | | | | | | 8,308 | | | | Ongoing | |
| | | | | | | | | | | | | | | | | | | | |
Sub-total Other Departmental | | | | | | | | | | | | | | | 14,395 | | | | | |
| | | | | | | | | | | | | | | | | | | | |
| | | | | | | | | | | | | | | | | | | | |
| | | | | | | | | | | | | | | | | | | | |
Total Property, Plant and Equipment | | | | | | | | | | | | | | | 244,027 | | | | | |
| | | | | | | | | | | | | | | | | | | | |
| | | | | | | | | | | | | | | | | | | | |
| | | | | | | | | | | | | | | | | | | | |
TOTAL PUBLIC SAFETY BUSINESS AGENCY (PPE) | | | | | | | | 244,027 | | | | | |
| | | | | | | | | | | | | | | | | | | | |
96
Capital Statement 2017-18
| 3.16 | QUEENSLAND FIRE AND EMERGENCY SERVICES |
Most new and ongoing capital initiatives to support Queensland Fire and Emergency Services (QFES) operational capability are delivered by the Public Safety Business Agency. This includes fire and emergency services facilities, urban and rural fire appliances and communications equipment and the implementation of the Accelerated Rural Fire Service Fleet Program.
QFES continues to be responsible for delivering operational equipment and information systems development.
In 2017-18, QFES will invest $6.2 million in capital purchases and $897,000 in capital grants.
Program Highlights (Property, Plant and Equipment)
| • | | $3.7 million for operational equipment, which may include protective clothing such as fully encapsulated gas suits, specialist and field portable scientific analysis and detection equipment, and compressors for self-contained breathing apparatus. |
| • | | $310,000 for specialised operational equipment to support public safety at the Gold Coast 2018 Commonwealth Games. |
| • | | $2.2 million for additions and upgrades to information systems. |
Program Highlights (Capital Grants)
| • | | $712,000 for State Emergency Service capital grants. |
| • | | $185,000 for Rural Fire Brigade capital grants. |
97
Capital Statement 2017-18
| | | | | | | | | | | | | | | | | | | | |
| Fire and Emergency Services | |
Project | | Statistical
Area | | | Total
Estimated
Cost
$‘000 | | | Expenditure
to
30-06-17
$‘000 | | | Budget
2017-18
$‘000 | | | Post
2017-18
$‘000 | |
QUEENSLAND FIRE AND EMERGENCY SERVICES | | | | | | | | | | | | | | | | | | | | |
| | | | | |
Property, Plant and Equipment | | | | | | | | | | | | | | | | | | | | |
Operational equipment | | | Various | | | | | | | | | | | | 4,000 | | | | Ongoing | |
Information systems development | | | Various | | | | | | | | | | | | 2,200 | | | | Ongoing | |
| | | | | | | | | | | | | | | | | | | | |
Total Property, Plant and Equipment | | | | | | | | | | | | | | | 6,200 | | | | | |
| | | | | | | | | | | | | | | | | | | | |
| | | | | |
Capital Grants | | | | | | | | | | | | | | | | | | | | |
Rural fire brigades | | | Various | | | | | | | | | | | | 185 | | | | Ongoing | |
State Emergency Service | | | Various | | | | | | | | | | | | 712 | | | | Ongoing | |
| | | | | | | | | | | | | | | | | | | | |
Total Capital Grants | | | | | | | | | | | | | | | 897 | | | | | |
| | | | | | | | | | | | | | | | | | | | |
| | | | | | | | | | | | | | | | | | | | |
| | | | | | | | | | | | | | | | | | | | |
TOTAL FIRE AND EMERGENCY SERVICES (PPE) | | | | | | | | | | | | | | | 6,200 | | | | | |
| | | | | | | | | | | | | | | | | | | | |
| | | | | | | | | | | | | | | | | | | | |
| | | | | | | | | | | | | | | | | | | | |
TOTAL FIRE AND EMERGENCY SERVICES (CG) | | | | | | | | | | | | | | | 897 | | | | | |
| | | | | | | | | | | | | | | | | | | | |
98
Capital Statement 2017-18
The Queensland public healthcare system comprises the Department of Health, Queensland Ambulance Service and 16 independent Hospital and Health Services. The total capital investment program in 2017-18 for Queensland Health and the Council of the Queensland Institute of Medical Research is $916.1 million.
Queensland Health and Hospital and Health Services
The Queensland Health capital investment program works to ensure staff, patients, and communities have access to contemporary health infrastructure that supports the delivery of health services. Health infrastructure that is fit for purpose and value for money underpins the delivery of quality frontline services that contribute to the health and wellbeing of all Queenslanders. The department takes a strategic view to ensure health infrastructure and healthcare technology and information communication technology strengthens our public health system to meet the growing demand for world class facilities and services.
Program Highlights (Property, Plant and Equipment)
In 2017-18, Queensland Health will continue to invest in health infrastructure, capital works and purchases across a broad range of areas including hospitals, ambulance stations and vehicles, health technology, research and scientific services, mental health services, staff accommodation and ICT.
Hospital and health facility projects highlights in 2017-18 include:
| • | | $47.6 million ($208.4 million over four years) for essential upgrades to health facilities and supporting infrastructure in rural and regional areas across the State. The funding will facilitate major redevelopments at Kingaroy Hospital, Blackall Hospital and Sarina Hospital, the redevelopment of the clinical services building and the relocation of the breast screen clinic at Townsville Hospital, the refurbishment of the emergency department and specialist outpatient facilities at Maryborough Hospital, a new mental health unit at Cairns Hospital, and the replacement of the primary health care centre on Mer (Murray) Island. The program will also support upgrades to staff accommodation at various locations across Queensland to provide safe, secure housing in rural areas. |
| • | | $24 million in 2017-18 ($131.8 million over four years) as an initial investment to enhance public hospital capacity and services in south-east Queensland, including the expansion of the emergency department at Caboolture Hospital and detailed planning and preparatory works for proposed redevelopments at Logan, Caboolture and Ipswich hospitals. Final costings for these projects will be informed by detailed business cases. |
99
Capital Statement 2017-18
| • | | $8.7 million in 2017-18 ($68.2 million over four years) to establish a new Adolescent Extended Treatment Facility at The Prince Charles Hospital, two new adolescent Step Up Step Down units in Brisbane and refurbishment of two adolescent Day Program spaces at Logan and the Gold Coast. |
| • | | $80 million under the Priority Capital Program to be distributed across Hospital and Health Services and Health Support Queensland for a range of capital works projects to enhance, refurbish or replace existing infrastructure and to sustain and improve business and service level continuity. The program seeks to address legislative compliance (including fire safety and food safety), essential services (including electricity, water supply and sewerage), major plant and systems (including air-conditioners, chillers, lifts and infrastructure call systems) and major building elements (including foundations, floors, walls and roofs). |
| • | | $61.1 million as part of the $180 million Enhancing Regional Hospitals Program announced in the 2015-16 Budget, for upgrades at the Hervey Bay and Gladstone Emergency Departments, Caloundra Health Service and Roma Hospital. |
| • | | $64.7 million for ongoing staged works as part of the new Sunshine Coast University Hospital that opened in March 2017. |
| • | | $27.3 million to progress Significant Regional Infrastructure Projects, including: Boulia Community Clinic refurbishment, McKinlay Multi-purpose Health Service refurbishment and expansion, Paediatrics Unit at Townsville Hospital, new Palm Island Primary Health Care, and Step Up/Step Down mental health facilities in Bundaberg, Gladstone and Mackay. |
| • | | $24.8 million as part of the $230 million Advancing Queensland’s Health Infrastructure Program announced in the 2016-17 Budget. The program will facilitate essential upgrades to health facilities and supporting infrastructure across Queensland, including repurposing of the Nambour General Hospital, redevelopment of Atherton Hospital emergency department and operating theatres and redevelopment of the Thursday Island Hospital. The program will also support the development of a new health precinct for the southern corridor of Cairns and short term carpark solutions at Caboolture and Logan Hospitals. |
| • | | $6.9 million to enhance the resilience of electrical systems at Lady Cilento Children’s Hospital to improve building and medical systems availability in an emergency situation. |
| • | | $6.6 million to commence construction of the new multi-storey car park at Rockhampton Hospital. |
100
Capital Statement 2017-18
| • | | $5.2 million for the refurbishment and extension of the Aurukun Primary Health Care Clinic, providing new staff administration and breakout areas, upgraded amenities, consultation rooms, communications upgrade, disabled access ramps and ambulance bay, as well as new separate staff accommodation units and secure car parking. |
| • | | $2.9 million to complete the replacement of the Dimbulah Primary Healthcare Clinic. |
| • | | $1.5 million towards completion of the replacement Aramac Primary Healthcare Centre. Once complete, the new facility will replace the existing emergency care, consultation rooms, treatment rooms and associated clinical facilities. |
| • | | $31 million to finalise several major programs of work where construction is largely complete, including: Cairns Hospital, Lady Cilento Children’s Hospital, Rockhampton Hospital and Townsville Hospital Expansion. |
In 2017-18, $135.4 million will be invested in Information Technology Equipment and Information Communication and Technology to ensure continued efficiency of the Queensland Health system. This will include investment in core infrastructure to support digital hospitals, and replacement and enhancement of core clinical and business systems to support frontline health service provision, corporate functions and decision making at the point of care.
In addition, $190.1 million will be allocated by Hospital and Health Services to capital projects across Queensland in 2017-18. Projects include:
| • | | $2 million for the relocation of the 16 bed Monash Lodge Aged Care facility to the Clermont Hospital site. |
| • | | $7 million for the delivery of additional acute bed capacity at Redcliffe Hospital. |
| • | | $3.3 million for the establishment of a Step Up Step Down mental health facility in Nundah to support the recovery of patients in the community. |
| • | | $5.3 million for expansion of the nuclear medicine hot-laboratory at Royal Brisbane and Women’s Hospital. |
| • | | $1.3 million towards Stage 2 of the Southern Queensland Centre of Excellence in Aboriginal and Torres Strait Islander Primary Health Care (SQCoE). Stage 2 will expand current health services, research and training, and offer an opportunity for improved work practices. |
| • | | $3.3 million for the development and construction of the Wynnum Manly Community Health Centre (Gundu Pa). The new Centre will offer a centralised modern public health facility providing essential health services to the Wynnum community. |
101
Capital Statement 2017-18
| • | | $5.3 million to extend existing IT services, and develop new IT services at the Sunshine Coast University Hospital. |
Queensland Ambulance Service
In 2017-18, the Queensland Ambulance Service (QAS) will invest $54.6 million in capital purchases to support essential frontline services in order to provide the highest possible pre-hospital quality emergency and non-emergency care and services to the community. In implementing its capital program the QAS will review opportunities for co-location with health services, thus improving the close linkages and working relationships between public hospitals, as well as other emergency management infrastructure. Highlights of the capital program include:
| • | | $21 million to purchase 150 new and replacement ambulance vehicles. |
| • | | $4 million for strategic land acquisitions to accommodate future expansion of services |
| • | | $4.9 million for information systems development to enhance patient care and service delivery |
| • | | $23.3 million for ambulance facilities, including: completing replacement ambulance stations at Coral Gardens, Thursday Island, and Wynnum; completing new stations at Birtinya, Bundaberg, and Kenilworth; commencing planning for new stations at Hervey Bay and Drayton; commencing planning for a replacement station at Kirwan; redevelopment works at Rockhampton and Cairns stations (including Operations Centres); and minor works at various stations to improve functionality and prolong useful life. |
Council of the Queensland Institute of Medical Research
The QIMR capital program in 2017-18 will invest $12 million for the acquisition of new and/or replacement state-of-the-art scientific equipment.
102
Capital Statement 2017-18
| | | | | | | | | | | | | | | | | | |
| Queensland Health |
Project | | Statistical
Area | | | Total
Estimated
Cost
$‘000 | | | Expenditure
to
30-06-17
$‘000 | | | Budget
2017-18
$‘000 | | | Post
2017-18
$‘000 |
QUEENSLAND HEALTH AND HOSPITAL AND HEALTH SERVICES |
| | | | | |
Property, Plant and Equipment1 | | | | | | | | | | | | | | | | | | |
Hospital and Health Services | | | | | | | | | | | | | | | | | | |
Advancing Queensland Health Infrastructure Program | | | Various | | | | 230,000 | | | | 8,381 | | | | 24,814 | | | 196,805 |
Aramac Primary Health Care Centre Redevelopment | | | 315 | | | | 3,045 | | | | 1,532 | | | | 1,513 | | | |
Aurukun Primary Health Care Centre Redevelopment | | | 315 | | | | 6,653 | | | | 1,413 | | | | 5,240 | | | |
Cairns Hospital Redevelopment | | | 306 | | | | 446,300 | | | | 436,800 | | | | 9,500 | | | |
Cape York Staff Accommodation - Kowanyama | | | 315 | | | | 3,404 | | | | 118 | | | | 3,286 | | | |
Community Mental Health Program | | | Various | | | | 5,151 | | | | 1,957 | | | | 3,194 | | | |
Dimbulah Primary Healthcare Clinic | | | 315 | | | | 4,453 | | | | 1,569 | | | | 2,884 | | | |
Enhancing Regional Hospitals Program | | | Various | | | | 180,000 | | | | 5,648 | | | | 61,091 | | | 113,261 |
Lady Cilento Children’s Hospital2 | | | 305 | | | | 1,433,145 | | | | 1,381,179 | | | | 10,000 | | | 41,966 |
Lady Cilento Children’s Hospital Resilience Project | | | 305 | | | | 8,647 | | | | 1,729 | | | | 6,918 | | | |
Master Planning Studies | | | Various | | | | | | | | | | | | 2,379 | | | Ongoing |
Priority Capital Program | | | Various | | | | | | | | | | | | 80,000 | | | Ongoing |
Rockhampton Hospital Carpark3 | | | 308 | | | | 25,500 | | | | 500 | | | | 6,580 | | | 18,420 |
Rockhampton Hospital Expansion | | | 308 | | | | 178,364 | | | | 175,400 | | | | 2,964 | | | |
Rural and Regional Infrastructure Package | | | | | | | | | | | | | | | | | | |
Blackall Hospital Redevelopment | | | 315 | | | | 17,900 | | | | | | | | 5,000 | | | 12,900 |
Cairns Hospital Mental Health Unit | | | 306 | | | | 70,000 | | | | | | | | 3,000 | | | 67,000 |
Kingaroy Hospital Redevelopment | | | 307 | | | | 62,000 | | | | | | | | 8,000 | | | 54,000 |
Mer (Murray) Island Building Replacement | | | 315 | | | | 7,000 | | | | | | | | 1,000 | | | 6,000 |
Maryborough Hospital Emergency Department | | | 319 | | | | 5,000 | | | | | | | | 5,000 | | | |
Maryborough Hospital Specialist Outpatients Refurbishment | | | 319 | | | | 5,000 | | | | | | | | 5,000 | | | |
103
Capital Statement 2017-18
| | | | | | | | | | | | | | | | |
| Queensland Health |
Project | | Statistical
Area | | Total
Estimated
Cost
$‘000 | | | Expenditure
to
30-06-17
$‘000 | | | Budget
2017-18
$‘000 | | | Post
2017-18
$‘000 |
Sarina Hospital Redevelopment | | 312 | | | 16,500 | | | | | | | | 1,000 | | | 15,500 |
Townsville Hospital Clinical Services Redevelopment | | 318 | | | 10,400 | | | | | | | | 5,000 | | | 5,400 |
Townsville Hospital - relocation of breast screen clinic | | 318 | | | 1,600 | | | | | | | | 1,600 | | | |
Staff accommodation program | | Various | | | 13,000 | | | | | | | | 13,000 | | | |
Significant Regional Infrastructure Projects Program | | | | | | | | | | | | | | | | |
Boulia Community Hospital Refurbishment | | 315 | | | 2,000 | | | | 375 | | | | 1,625 | | | |
McKinlay Multi Purpose Health Service | | 315 | | | 5,000 | | | | 230 | | | | 4,770 | | | |
Paediatrics Unit at Townsville Hospital | | 318 | | | 6,600 | | | | 3,982 | | | | 2,618 | | | |
Palm Island Primary Health Care | | 318 | | | 16,500 | | | | 800 | | | | 7,700 | | | 8,000 |
Adult Step Up Step Down Facility - Bundaberg | | 319 | | | 4,000 | | | | 465 | | | | 3,535 | | | |
Adult Step Up Step Down Facility - Gladstone | | 308 | | | 4,000 | | | | 465 | | | | 3,535 | | | |
Adult Step Up Step Down Facility - Mackay | | 312 | | | 4,000 | | | | 465 | | | | 3,535 | | | |
South East Queensland - adolescent mental health facilities | | Various | | | 68,237 | | | | 958 | | | | 8,713 | | | 58,566 |
South East Queensland - Planning for Growth | | | | | | | | | | | | | | | | |
Caboolture Hospital - Emergency Department Expansion | | 313 | | | 19,600 | | | | | | | | 15,000 | | | 4,600 |
Logan, Caboolture and Ipswich4 Hospital Business Cases and Preparatory Work | | Various | | | 112,163 | | | | | | | | 9,000 | | | 103,163 |
Sunshine Coast University5 Hospital | | 316 | | | 1,872,151 | | | | 1,725,948 | | | | 64,737 | | | 81,466 |
Townsville Hospital Expansion | | 318 | | | 334,000 | | | | 325,416 | | | | 8,584 | | | |
UQ Oral Health Centre at Herston | | 305 | | | 3,415 | | | | 6 | | | | 3,409 | | | |
Project Finalisation | | Various | | | 1,460 | | | | | | | | 1,460 | | | |
Other Acquisitions of Property, Plant and Equipment | | | | | | | | | | | | | | | | |
Building Works Capital Project Management | | Various | | | | | | | | | | | 850 | | | Ongoing |
Finance System Replacement | | Various | | | 105,000 | | | | 15,000 | | | | 65,000 | | | 25,000 |
Health Technology Equipment | | Various | | | | | | | | | | | 8,102 | | | Ongoing |
104
Capital Statement 2017-18
| | | | | | | | | | | | | | | | | | |
| Queensland Health | |
Project | | Statistical
Area | | Total
Estimated
Cost
$‘000 | | | Expenditure
to
30-06-17
$‘000 | | | Budget
2017-18
$‘000 | | | Post
2017-18
$‘000 | |
Laboratory Information Systems | | Various | | | 60,905 | | | | 5,500 | | | | 20,500 | | | | 34,905 | |
Minor Capital Projects and6 Acquisitions | | Various | | | | | | | | | | | 10,282 | | | | Ongoing | |
Regional eHealth Project | | Various | | | 34,950 | | | | 5,250 | | | | 12,765 | | | | 16,935 | |
Telehealth (Revitalisation of Regional, Rural and Remote Health Services) | | Various | | | 2,000 | | | | 1,280 | | | | 360 | | | | 360 | |
| | | | | | | | | | | | | | | | | | |
Sub-total Other Acquisitions of Property, Plant and Equipment | | | | | | | | | | | | | 117,859 | | | | | |
| | | | | | | | | | | | | | | | | | |
| | | | | |
Information Communication and Technology | | | | | | | | | | | | | | | | | | |
Information Technology Equipment | | Various | | | | | | | | | | | 77,300 | | | | Ongoing | |
Information Communication and Technology | | Various | | | | | | | | | | | 58,102 | | | | Ongoing | |
| | | | | | | | | | | | | | | | | | |
Sub-total Information Communication and Technology | | | | | | | | | | | | | 135,402 | | | | | |
| | | | | | | | | | | | | | | | | | |
| | | | | |
Cairns and Hinterland | | | | | | | | | | | | | | | | | | |
Health Technology Equipment | | 306 | | | | | | | | | | | 6,770 | | | | Ongoing | |
Minor Capital Projects and Acquisitions | | 306 | | | | | | | | | | | 3,096 | | | | Ongoing | |
| | | | | | | | | | | | | | | | | | |
Sub-total Cairns and Hinterland | | | | | | | | | | | | | 9,866 | | | | | |
| | | | | | | | | | | | | | | | | | |
| | | | | |
Central Queensland | | | | | | | | | | | | | | | | | | |
Health Technology Equipment | | 308 | | | | | | | | | | | 4,298 | | | | Ongoing | |
Minor Capital Projects and Acquisitions | | 308 | | | | | | | | | | | 2,274 | | | | Ongoing | |
| | | | | | | | | | | | | | | | | | |
Sub-total Central Queensland | | | | | | | | | | | | | 6,572 | | | | | |
| | | | | | | | | | | | | | | | | | |
| | | | | |
Central West | | | | | | | | | | | | | | | | | | |
Health Technology Equipment | | 315 | | | | | | | | | | | 686 | | | | Ongoing | |
Minor Capital Projects and Acquisitions | | 315 | | | | | | | | | | | 510 | | | | Ongoing | |
| | | | | | | | | | | | | | | | | | |
Sub-total Central West | | | | | | | | | | | | | 1,196 | | | | | |
| | | | | | | | | | | | | | | | | | |
| | | | | |
Children’s Health Queensland | | | | | | | | | | | | | | | | | | |
Health Technology Equipment | | 305 | | | | | | | | | | | 3,159 | | | | Ongoing | |
Minor Capital Projects and Acquisitions | | 305 | | | | | | | | | | | 1,668 | | | | Ongoing | |
| | | | | | | | | | | | | | | | | | |
Sub-total Children’s Health Queensland | | | | | | | | | | | | | 4,827 | | | | | |
| | | | | | | | | | | | | | | | | | |
| | | | | |
Darling Downs | | | | | | | | | | | | | | | | | | |
Health Technology Equipment | | 307 | | | | | | | | | | | 4,484 | | | | Ongoing | |
105
Capital Statement 2017-18
| | | | | | | | | | | | | | | | | | | | |
| Queensland Health | |
Project | | Statistical
Area | | | Total
Estimated
Cost
$‘000 | | | Expenditure
to
30-06-17
$‘000 | | | Budget
2017-18
$‘000 | | | Post
2017-18
$‘000 | |
Minor Capital Projects and Acquisitions | | | 307 | | | | | | | | | | | | 3,518 | | | | Ongoing | |
| | | | | | | | | | | | | | | | | | | | |
Sub-total Darling Downs | | | | | | | | | | | | | | | 8,002 | | | | | |
| | | | | | | | | | | | | | | | | | | | |
| | | | | |
Gold Coast | | | | | | | | | | | | | | | | | | | | |
Health Technology Equipment | | | 309 | | | | | | | | | | | | 953 | | | | Ongoing | |
Minor Capital Projects and Acquisitions | | | 309 | | | | | | | | | | | | 3,543 | | | | Ongoing | |
| | | | | | | | | | | | | | | | | | | | |
Sub-total Gold Coast | | | | | | | | | | | | | | | 4,496 | | | | | |
| | | | | | | | | | | | | | | | | | | | |
| | | | | |
Mackay | | | | | | | | | | | | | | | | | | | | |
Health Technology Equipment | | | 312 | | | | | | | | | | | | 2,412 | | | | Ongoing | |
Minor Capital Projects and Acquisitions | | | 312 | | | | | | | | | | | | 1,489 | | | | Ongoing | |
Bowen Emergency Department | | | 312 | | | | 1,651 | | | | 1,486 | | | | 165 | | | | | |
Clermont Montcler Monash Lodge | | | 312 | | | | 2,000 | | | | | | | | 2,000 | | | | | |
Proserpine Emergency Department Expansion | | | 312 | | | | 1,849 | | | | 1,387 | | | | 462 | | | | | |
Proserpine Simulation Laboratory | | | 312 | | | | 100 | | | | 75 | | | | 25 | | | | | |
Water Treatment | | | 312 | | | | 2,000 | | | | 1,200 | | | | 800 | | | | | |
| | | | | | | | | | | | | | | | | | | | |
Sub-total Mackay | | | | | | | | | | | | | | | 7,353 | | | | | |
| | | | | | | | | | | | | | | | | | | | |
| | | | | |
Metro North | | | | | | | | | | | | | | | | | | | | |
Health Technology Equipment | | | 302 | | | | | | | | | | | | 20,777 | | | | Ongoing | |
Minor Capital Projects and Acquisitions | | | 302 | | | | | | | | | | | | 14,364 | | | | Ongoing | |
Additional Acute bed capacity at Redcliffe Hospital | | | 313 | | | | 8,136 | | | | 1,048 | | | | 7,036 | | | | 52 | |
Information Communication Technology | | | 302 | | | | 45,091 | | | | 26,415 | | | | 18,676 | | | | | |
Nundah Step Up/Step Down | | | 302 | | | | 5,023 | | | | 1,696 | | | | 3,327 | | | | | |
Royal Brisbane and Women’s Hospital (RBWH) Nuclear Medicine Hot-Laboratory Expansion | | | 305 | | | | 6,110 | | | | 649 | | | | 5,279 | | | | 182 | |
Ashworth House Nursing Home Refurbishment | | | 302 | | | | 2,165 | | | | 1,631 | | | | 534 | | | | | |
| | | | | | | | | | | | | | | | | | | | |
Sub-total Metro North | | | | | | | | | | | | | | | 69,993 | | | | | |
| | | | | | | | | | | | | | | | | | | | |
| | | | | |
Metro South | | | | | | | | | | | | | | | | | | | | |
Health Technology Equipment | | | 303 | | | | | | | | | | | | 16,809 | | | | Ongoing | |
106
Capital Statement 2017-18
| | | | | | | | | | | | | | | | | | | | |
| Queensland Health | |
Project | | Statistical
Area | | | Total
Estimated
Cost
$‘000 | | | Expenditure
to
30-06-17
$‘000 | | | Budget
2017-18
$‘000 | | | Post
2017-18
$‘000 | |
Minor Capital Projects and Acquisitions | | | 303 | | | | | | | | | | | | 11,086 | | | | Ongoing | |
Capital Projects | | | 305 | | | | | | | | | | | | 3,120 | | | | Ongoing | |
Inala Indigenous Southern Queensland Centre of Excellence Stage 2 | | | 310 | | | | 10,233 | | | | 8,982 | | | | 1,251 | | | | | |
Wynnum Manly Community Health Centre, Gundu Pa | | | 301 | | �� | | 13,602 | | | | 10,332 | | | | 3,270 | | | | | |
| | | | | | | | | | | | | | | | | | | | |
Sub-total Metro South | | | | | | | | | | | | | | | 35,536 | | | | | |
| | | | | | | | | | | | | | | | | | | | |
| | | | | |
North West | | | | | | | | | | | | | | | | | | | | |
Health Technology Equipment | | | 315 | | | | | | | | | | | | 685 | | | | Ongoing | |
Minor Capital Projects and Acquisitions | | | 315 | | | | | | | | | | | | 869 | | | | Ongoing | |
| | | | | | | | | | | | | | | | | | | | |
Sub-total North West | | | | | | | | | | | | | | | 1,554 | | | | | |
| | | | | | | | | | | | | | | | | | | | |
| | | | | |
South West | | | | | | | | | | | | | | | | | | | | |
Health Technology Equipment | | | 315 | | | | | | | | | | | | 496 | | | | Ongoing | |
Minor Capital Projects and Acquisitions | | | 315 | | | | | | | | | | | | 882 | | | | Ongoing | |
Charleville Hospital Staff Accommodation Replacement | | | 315 | | | | 400 | | | | 160 | | | | 240 | | | | | |
Cunnumulla Hospital Building Linkway | | | 315 | | | | 550 | | | | 450 | | | | 100 | | | | | |
| | | | | | | | | | | | | | | | | | | | |
Sub-total South West | | | | | | | | | | | | | | | 1,718 | | | | | |
| | | | | | | | | | | | | | | | | | | | |
| | | | | |
Sunshine Coast | | | | | | | | | | | | | | | | | | | | |
Health Technology Equipment | | | 316 | | | | | | | | | | | | 6,670 | | | | Ongoing | |
Minor Capital Projects and Acquisitions | | | 316 | | | | | | | | | | | | 2,969 | | | | Ongoing | |
Sunshine Coast University Hospital Group 4 ICT Projects | | | 316 | | | | 29,850 | | | | 18,236 | | | | 5,311 | | | | 6,303 | |
| | | | | | | | | | | | | | | | | | | | |
Sub-total Sunshine Coast | | | | | | | | | | | | | | | 14,950 | | | | | |
| | | | | | | | | | | | | | | | | | | | |
| | | | | |
Torres and Cape | | | | | | | | | | | | | | | | | | | | |
Health Technology Equipment | | | 315 | | | | | | | | | | | | 1,167 | | | | Ongoing | |
107
Capital Statement 2017-18
| | | | | | | | | | | | | | | | | | | | |
| Queensland Health | |
Project | | Statistical
Area | | | Total
Estimated
Cost
$‘000 | | | Expenditure
to
30-06-17
$‘000 | | | Budget
2017-18
$‘000 | | | Post
2017-18
$‘000 | |
Minor Capital Projects and Acquisitions | | | 315 | | | | | | | | | | | | 1,434 | | | | Ongoing | |
| | | | | | | | | | | | | | | | | | | | |
Sub-total Torres and Cape | | | | | | | | | | | | | | | 2,601 | | | | | |
| | | | | | | | | | | | | | | | | | | | |
| | | | | |
Townsville | | | | | | | | | | | | | | | | | | | | |
Health Technology Equipment | | | 318 | | | | | | | | | | | | 6,777 | | | | Ongoing | |
Minor Capital Projects and Acquisitions | | | 318 | | | | | | | | | | | | 4,763 | | | | Ongoing | |
| | | | | | | | | | | | | | | | | | | | |
Sub-total Townsville | | | | | | | | | | | | | | | 11,540 | | | | | |
| | | | | | | | | | | | | | | | | | | | |
| | | | | |
West Moreton | | | | | | | | | | | | | | | | | | | | |
Health Technology Equipment | | | 310 | | | | | | | | | | | | 2,860 | | | | Ongoing | |
Minor Capital Projects and Acquisitions | | | 310 | | | | | | | | | | | | 2,537 | | | | Ongoing | |
| | | | | | | | | | | | | | | | | | | | |
Sub-total West Moreton | | | | | | | | | | | | | | | 5,397 | | | | | |
| | | | | | | | | | | | | | | | | | | | |
| | | | | |
Wide Bay | | | | | | | | | | | | | | | | | | | | |
Health Technology Equipment | | | 319 | | | | | | | | | | | | 2,421 | | | | Ongoing | |
Minor Capital Projects and Acquisitions | | | 319 | | | | | | | | | | | | 2,124 | | | | Ongoing | |
| | | | | | | | | | | | | | | | | | | | |
Sub-total Wide Bay | | | | | | | | | | | | | | | 4,545 | | | | | |
| | | | | | | | | | | | | | | | | | | | |
| | | | | |
Queensland Ambulance Service | | | | | | | | | | | | | | | | | | | | |
Birtinya New Station | | | 316 | | | | 4,396 | | | | 2,734 | | | | 1,662 | | | | | |
Bundaberg New Station | | | 319 | | | | 5,150 | | | | 4,115 | | | | 1,035 | | | | | |
Cairns Station and Operations Centre Redevelopment | | | 306 | | | | 5,600 | | | | | | | | 200 | | | | 5,400 | |
Coral Gardens Replacement Station | | | 309 | | | | 4,700 | | | | 209 | | | | 4,491 | | | | | |
Drayton New Station | | | 317 | | | | 4,000 | | | | | | | | 100 | | | | 3,900 | |
Hervey Bay New Station | | | 319 | | | | 3,500 | | | | | | | | 100 | | | | 3,400 | |
Kenilworth Station | | | 316 | | | | 1,866 | | | | 367 | | | | 1,499 | | | | | |
Kirwan Replacement Station | | | 318 | | | | 5,000 | | | | | | | | 200 | | | | 4,800 | |
Minor Works | | | Various | | | | | | | | | | | | 6,433 | | | | Ongoing | |
Rockhampton Station and Operations Centre Redevelopment | | | 308 | | | | 5,000 | | | | | | | | 500 | | | | 4,500 | |
Thursday Island Replacement Station and Relief Accommodation | | | 315 | | | | 2,814 | | | | 260 | | | | 2,554 | | | | | |
Wynnum Replacement Station | | | 301 | | | | 4,600 | | | | 50 | | | | 4,550 | | | | | |
108
Capital Statement 2017-18
| | | | | | | | | | | | | | | | | | | | |
| Queensland Health | |
Project | | Statistical
Area | | | Total
Estimated
Cost
$‘000 | | | Expenditure
to
30-06-17
$‘000 | | | Budget
2017-18
$‘000 | | | Post
2017-18
$‘000 | |
Strategic Land Acquisitions | | | Various | | | | | | | | | | | | 4,000 | | | | Ongoing | |
Ambulance Vehicles | | | Various | | | | | | | | | | | | 21,000 | | | | Ongoing | |
Information Systems Development | | | Various | | | | | | | | | | | | 4,922 | | | | Ongoing | |
Operational Equipment | | | Various | | | | | | | | | | | | 1,325 | | | | Ongoing | |
| | | | | | | | | | | | | | | | | | | | |
Sub-total Queensland Ambulance Service | | | | | | | | | | | | | | | 54,571 | | | | | |
| | | | | | | | | | | | | | | | | | | | |
| | | | | | | | | | | | | | | | | | | | |
| | | | | | | | | | | | | | | | | | | | |
Total Property, Plant and Equipment | | | | | | | | | | | | | | | 904,162 | | | | | |
| | | | | | | | | | | | | | | | | | | | |
| | | | | |
COUNCIL OF THE QUEENSLAND INSTITUTE OF MEDICAL RESEARCH | | | | | | | | | | | | | | | | | | | | |
| | | | | |
Property, Plant and Equipment | | | | | | | | | | | | | | | | | | | | |
Other scientific equipment | | | 305 | | | | | | | | | | | | 11,963 | | | | Ongoing | |
| | | | | | | | | | | | | | | | | | | | |
Total Property, Plant and Equipment | | | | | | | | | | | | | | | 11,963 | | | | | |
| | | | | | | | | | | | | | | | | | | | |
| | | | | | | | | | | | | | | | | | | | |
| | | | | | | | | | | | | | | | | | | | |
TOTAL QUEENSLAND HEALTH (PPE) | | | | | | | | | | | | | | | 916,125 | | | | | |
| | | | | | | | | | | | | | | | | | | | |
Notes:
| 1. | Total Estimated Cost may include both non-capital and capital components of project expenditure. |
| 2. | The Lady Cilento Children’s Hospital opened in November 2014. The funding allocation for the 2017-18 financial year is for the defects liability period, finalisation of contracts, finalisation of Information and Communication Technology deferred works, and staff to support the phases of the project. |
| 3. | Total Estimated Cost is subject to finalisation of the current tender process. |
| 4. | Includes funding of $9 million internally reallocated by Queensland Health for the preparation of detailed business cases. |
| 5. | The $1.872 billion includes the total Sunshine Coast Health Institute (SCHI) fit out capital cost. Those elements of the total SCHI fit-out capital cost that relate to the proposed (non-QH) SCHI tenants (University of Sunshine Coast, Sunshine Coast TAFE and future medical school provider) will be funded directly via capital contributions from those tenants. |
| 6. | Amount is net of non capital component of project expenditure. |
109
Capital Statement 2017-18
| 3.18 | QUEENSLAND POLICE SERVICE |
Most new and ongoing capital initiatives to support the operational capability of the Queensland Police Service are provided by the Public Safety Business Agency. This includes police accommodation facilities, motor vehicles, vessels and information technology.
The Queensland Police Service continues to be responsible for delivering operational equipment to maintain quality frontline services. In 2017-18, the Queensland Police Service will invest $24.1 million in capital purchases.
Program Highlights (Property, Plant and Equipment)
| • | | $602,000 for operational equipment and vehicles to improve counter-terrorism capability and capacity. |
| • | | $4 million for Camera Detected Offence Program equipment. |
| • | | $19.4 million for other property, plant and equipment including the replacement of operational assets. |
| | | | | | | | | | | | | | | | | | | | |
| Queensland Police Service | |
Project | | Statistical
Area | | | Total
Estimated
Cost
$‘000 | | | Expenditure
to
30-06-17
$‘000 | | | Budget
2017-18
$‘000 | | | Post
2017-18
$‘000 | |
QUEENSLAND POLICE SERVICE | | | | | | | | | | | | | | | | | | | | |
| | | | | |
Property, Plant and Equipment | | | | | | | | | | | | | | | | | | | | |
Improving Counter-Terrorism Capability and Capacity | | | Various | | | | 788 | | | | 186 | | | | 602 | | | | | |
Camera Detected Offence Program | | | Various | | | | | | | | | | | | 3,680 | | | | Ongoing | |
Other plant and equipment | | | Various | | | | | | | | | | | | 19,423 | | | | Ongoing | |
| | | | | | | | | | | | | | | | | | | | |
Total Property, Plant and Equipment | | | | | | | | | | | | | | | 23,705 | | | | | |
| | | | | | | | | | | | | | | | | | | | |
| | | | | | | | | | | | | | | | | | | | |
| | | | | | | | | | | | | | | | | | | | |
TOTAL QUEENSLAND POLICE SERVICE (PPE) | | | | | | | | | | | | | | | 23,705 | | | | | |
| | | | | | | | | | | | | | | | | | | | |
110
Capital Statement 2017-18
Queensland Treasury
Queensland Treasury’s capital purchases for 2017-18 will be $13.8 million. Total capital grants for the department is $147.6 million.
Program Highlights (Property, Plant and Equipment)
| • | | $504,000 in capital expenditure to improve compliance, client interaction and service delivery. This will prepare the Office of State Revenue to deliver the planned Transformation Program to implement improved revenue management services into the future. |
| • | | $11.7 million in capital expenditure to implement the Office of State Revenue Transformation Program. This will enable the delivery of an upgraded ICT platform and support improved revenue management services into the future. |
| • | | $1.6 million for ongoing asset replacement primarily in the Office of Industrial Relations. |
Program Highlights (Capital Grants)
| • | | $147.6 million for the Queensland First Home Owners’ Grant to assist first home buyers to enter the housing market. |
Queensland Racing Integrity Commission
Queensland Racing Integrity Commission’s capital purchases for 2017-18 will be $2.3 million.
Program Highlights (Property, Plant and Equipment)
| • | | $2.3 million in capital works for the Racing Science Centre as part of the Queensland Racing Integrity Commission’s Compliance Enforcement Framework. This will enable the upgrade of core drug testing technology and support investment in new technology to provide high quality testing services. |
111
Capital Statement 2017-18
| | | | | | | | | | | | | | | | | | | | |
| Queensland Treasury | |
Project | | Statistical
Area | | | Total
Estimated
Cost
$‘000 | | | Expenditure
to
30-06-17
$‘000 | | | Budget
2017-18
$‘000 | | | Post
2017-18
$‘000 | |
QUEENSLAND TREASURY | | | | | | | | | | | | | | | | | | | | |
| | | | | |
Property, Plant and Equipment | | | | | | | | | | | | | | | | | | | | |
Secure the integrity of the state revenue base and improve services into the future | | | 305 | | | | 6,053 | | | | 5,422 | | | | 504 | | | | 127 | |
Office of State Revenue Transformation Program | | | 305 | | | | 17,739 | | | | | | | | 11,699 | | | | 6,040 | |
Asset replacement | | | 305 | | | | | | | | | | | | 1,552 | | | | Ongoing | |
| | | | | | | | | | | | | | | | | | | | |
Total Property, Plant and Equipment | | | | | | | | | | | | | | | 13,755 | | | | | |
| | | | | | | | | | | | | | | | | | | | |
| | | | | |
Capital Grants | | | | | | | | | | | | | | | | | | | | |
Queensland First Home Owners’ Grant | | | Various | | | | | | | | | | | | 147,601 | | | | Ongoing | |
| | | | | | | | | | | | | | | | | | | | |
Total Capital Grants | | | | | | | | | | | | | | | 147,601 | | | | | |
| | | | | | | | | | | | | | | | | | | | |
| | | | |
QUEENSLAND RACING INTEGRITY COMMISSION | | | | | | | | | | | | | | | | | |
| | | | | |
Property, Plant and Equipment | | | | | | | | | | | | | | | | | | | | |
Compliance Enforcement Framework for Queensland Racing Integrity Commission | | | 305 | | | | 5,909 | | | | | | | | 2,283 | | | | 3,626 | |
| | | | | | | | | | | | | | | | | | | | |
Total Property, Plant and Equipment | | | | | | | | | | | | | | | 2,283 | | | | | |
| | | | | | | | | | | | | | | | | | | | |
| | | | | | | | | | | | | | | | | | | | |
| | | | | | | | | | | | | | | | | | | | |
TOTAL QUEENSLAND TREASURY (PPE) | | | | | | | | | | | | 16,038 | | | | | |
| | | | | | | | | | | | | | | | | | | | |
| | | | | | | | | | | | | | | | | | | | |
| | | | | | | | | | | | | | | | | | | | |
TOTAL QUEENSLAND TREASURY (CG) | | | | | | | | | | | | 147,601 | | | | | |
| | | | | | | | | | | | | | | | | | | | |
112
Capital Statement 2017-18
| 3.20 | SCIENCE, INFORMATION TECHNOLOGY AND INNOVATION |
In 2017-18 total capital outlays amount to $24.8 million including capital purchases of $22.3 million and capital grants of $2.5 million for the Science, Information Technology and Innovation portfolio including its statutory body, commercialised business unit and shared service provider.
Department of Science, Information Technology and Innovation
The Department of Science, Information Technology and Innovation invests in and maintains the State’s scientific research facilities and equipment. The department provides reliable information systems, technologies and infrastructure to support service delivery across government and to the community.
Program Highlights (Property, Plant and Equipment)
| • | | $4 million for mainframe replacement for CITEC ICT. |
| • | | $3.3 million for hardware replacement in CITEC. |
| • | | $3.1 million for ongoing replacement of departmental assets including essential scientific equipment. |
| • | | $2.9 million for activities relating to the first phase of the Science ICT Remediation and Renewal Program. |
| • | | $2.2 million for consolidation and upgrade of finance and human resource systems managed by Queensland Shared Services. |
| • | | $2.1 million for critical software enhancements relating to CITEC Information Brokerage. |
| • | | $2.1 million for optimisation projects and initiatives by Queensland Shared Services. |
| • | | $1.9 million to the Library Board of Queensland for the purchase of heritage and infrastructure collections, intangible assets in the form of digital collections, as well as replacement of information technology and micrographic equipment. |
Program Highlights (Capital Grants)
| • | | $2 million to the Australian Institute of Tropical Health and Medicine to support the establishment of the institute and strengthen Queensland’s readiness to combat biosecurity risks. |
113
Capital Statement 2017-18
| | | | | | | | | | | | | | | | | | | | |
| Science, Information Technology and Innovation | |
Project | | Statistical
Area | | | Total
Estimated
Cost
$‘000 | | | Expenditure
to
30-06-17
$‘000 | | | Budget
2017-18
$‘000 | | | Post
2017-18
$‘000 | |
DEPARTMENT OF SCIENCE, INFORMATION TECHNOLOGY AND INNOVATION | | | | | | | | | | | | | | | | | | | | |
| | | | | |
Property, Plant and Equipment | | | | | | | | | | | | | | | | | | | | |
Asset Replacement | | | 305 | | | | | | | | | | | | 3,126 | | | | Ongoing | |
Science ICT Remediation and Renewal Program | | | 305 | | | | 2,880 | | | | | | | | 2,880 | | | | | |
Content Delivery System | | | 305 | | | | 1,225 | | | | 658 | | | | 567 | | | | | |
| | | | | | | | | | | | | | | | | | | | |
Total Property, Plant and Equipment | | | | | | | | | | | | | | | 6,573 | | | | | |
| | | | | | | | | | | | | | | | | | | | |
| | | | | |
Capital Grants | | | | | | | | | | | | | | | | | | | | |
Australian Institute of Tropical Health and Medicine | | | Various | | | | 34,320 | | | | 32,320 | | | | 2,000 | | | | | |
Engineering laboratories in Cairns | | | 306 | | | | 1,000 | | | | 520 | | | | 451 | | | | 29 | |
| | | | | | | | | | | | | | | | | | | | |
Total Capital Grants | | | | | | | | | | | | | | | 2,451 | | | | | |
| | | | | | | | | | | | | | | | | | | | |
| | | | | |
LIBRARY BOARD OF QUEENSLAND | | | | | | | | | | | | | | | | | | | | |
| | | | | |
Property, Plant and Equipment | | | | | | | | | | | | | | | | | | | | |
Asset Replacement Program | | | 305 | | | | | | | | | | | | 783 | | | | Ongoing | |
Heritage Collection Additions | | | 305 | | | | | | | | | | | | 336 | | | | Ongoing | |
Information Collection Additions | | | 305 | | | | | | | | | | | | 349 | | | | Ongoing | |
Digital Collection Additions | | | 305 | | | | | | | | | | | | 466 | | | | Ongoing | |
| | | | | | | | | | | | | | | | | | | | |
Total Property, Plant and Equipment | | | | | | | | | | | | | | | 1,934 | | | | | |
| | | | | | | | | | | | | | | | | | | | |
| | | | | |
CITEC | | | | | | | | | | | | | | | | | | | | |
| | | | | |
Property, Plant and Equipment | | | | | | | | | | | | | | | | | | | | |
Mainframe Replacement - ICT | | | 305 | | | | 4,000 | | | | | | | | 4,000 | | | | | |
Hardware Replacement - ICT | | | 305 | | | | | | | | | | | | 2,500 | | | | Ongoing | |
Software Enhancements - Information Brokerage | | | 305 | | | | | | | | | | | | 2,055 | | | | Ongoing | |
Hardware Replacement - Information Brokerage | | | 305 | | | | | | | | | | | | 800 | | | | Ongoing | |
| | | | | | | | | | | | | | | | | | | | |
Total Property, Plant and Equipment | | | | | | | | | | | | | | | 9,355 | | | | | |
| | | | | | | | | | | | | | | | | | | | |
114
Capital Statement 2017-18
| | | | | | | | | | | | | | | | | | | | |
| Science, Information Technology and Innovation | |
Project | | Statistical
Area | | | Total
Estimated
Cost
$‘000 | | | Expenditure
to
30-06-17
$‘000 | | | Budget
2017-18
$‘000 | | | Post
2017-18
$‘000 | |
| | | | | |
QUEENSLAND SHARED SERVICES | | | | | | | | | | | | | | | | | | | | |
| | | | | |
Property, Plant and Equipment | | | | | | | | | | | | | | | | | | | | |
Optimisation projects and initiatives | | | 305 | | | | | | | | | | | | 2,102 | | | | Ongoing | |
Asset Replacement | | | 305 | | | | | | | | | | | | 200 | | | | Ongoing | |
System consolidation and upgrades | | | 305 | | | | 13,358 | | | | 11,185 | | | | 2,173 | | | | | |
| | | | | | | | | | | | | | | | | | | | |
Total Property, Plant and Equipment | | | | | | | | | | | | | | | 4,475 | | | | | |
| | | | | | | | | | | | | | | | | | | | |
| | | | | | | | | | | | | | | | | | | | |
| | | | | | | | | | | | | | | | | | | | |
TOTAL SCIENCE, INFORMATION TECHNOLOGY AND INNOVATION (PPE) | | | | | | | | | | | | | | | 22,337 | | | | | |
| | | | | | | | | | | | | | | | | | | | |
| | | | | | | | | | | | | | | | | | | | |
| | | | | | | | | | | | | | | | | | | | |
TOTAL SCIENCE, INFORMATION TECHNOLOGY AND INNOVATION (CG) | | | | | | | | | | | | | | | 2,451 | | | | | |
| | | | | | | | | | | | | | | | | | | | |
115
Capital Statement 2017-18
Department of State Development
In 2017-18, the Department of State Development has capital purchases of $47.6 million and capital grants of $139.9 million to support economic development in Queensland.
Program Highlights (Property, Plant and Equipment)
| • | | $46 million for the development of the North Queensland Stadium. |
Program Highlights (Capital Grants)
| • | | $111.3 million for the Building our Regions program to fund critical infrastructure in regional areas. |
| • | | $28.6 million for the Royalties for the Regions program to support regional communities. |
| | | | | | | | | | | | | | | | | | | | |
| State Development | |
Project | | Statistical
Area | | | Total
Estimated
Cost
$‘000 | | | Expenditure
to
30-06-17
$‘000 | | | Budget
2017-18
$‘000 | | | Post
2017-18
$‘000 | |
DEPARTMENT OF STATE DEVELOPMENT | | | | | | | | | | | | | | | | | | | | |
| | | | | |
Property, Plant and Equipment | | | | | | | | | | | | | | | | | | | | |
Grants Management System | | | Various | | | | 550 | | | | 165 | | | | 385 | | | | | |
Gladstone State Development Area (formerly Targinnie Precinct, Gladstone) | | | 308 | | | | 67,868 | | | | 62,398 | | | | 675 | | | | 4,795 | |
Stanwell Gladstone Infrastructure Corridor State Development Area | | | 308 | | | | 6,749 | | | | 5,742 | | | | 450 | | | | 557 | |
North Queensland Stadium | | | 318 | | | | 249,427 | | | | 3,000 | | | | 46,000 | | | | 200,427 | |
Other Plant and Equipment | | | Various | | | | | | | | | | | | 100 | | | | Ongoing | |
| | | | | | | | | | | | | | | | | | | | |
Total Property, Plant and Equipment | | | | | | | | | | | | | | | 47,610 | | | | | |
| | | | | | | | | | | | | | | | | | | | |
| | | | | |
Capital Grants | | | | | | | | | | | | | | | | | | | | |
Building our Regions | | | Various | | | | 215,406 | | | | 40,951 | | | | 111,263 | | | | 63,192 | |
Royalties for the Regions | | | Various | | | | 89,545 | | | | 38,597 | | | | 28,588 | | | | 22,360 | |
| | | | | | | | | | | | | | | | | | | | |
Total Capital Grants | | | | | | | | | | | | | | | 139,851 | | | | | |
| | | | | | | | | | | | | | | | | | | | |
| | | | | | | | | | | | | | | | | | | | |
| | | | | | | | | | | | | | | | | | | | |
TOTAL STATE DEVELOPMENT (PPE) | | | | | | | | | | | | | | | 47,610 | | | | | |
| | | | | | | | | | | | | | | | | | | | |
| | | | | | | | | | | | | | | | | | | | |
| | | | | | | | | | | | | | | | | | | | |
TOTAL STATE DEVELOPMENT (CG) | | | | | | | | | | | | | | | 139,851 | | | | | |
| | | | | | | | | | | | | | | | | | | | |
116
Capital Statement 2017-18
| 3.22 | TOURISM, MAJOR EVENTS, SMALL BUSINESS AND THE COMMONWEALTH GAMES |
Total capital purchases for the Department of Tourism, Major Events, Small Business and the Commonwealth Games in 2017-18 is $935,000 with $18.8 million in capital grants.
Program Highlights (Property, Plant and Equipment)
The property, plant and equipment in the Department of Tourism, Major Events, Small Business and the Commonwealth Games in 2017-18 is $935,000 for the construction of Gold Coast 2018 Commonwealth Games venues and office equipment replacement.
| • | | $519,000 is allocated to the Queensland State Velodrome for track cycling. |
| • | | $404,000 is allocated to the Carrara Stadium upgrades for athletics. |
Program Highlights (Capital Grants)
The capital grants in the Department of Tourism, Major Events, Small Business and the Commonwealth Games in 2017-18 are $18.8 million for the construction of Gold Coast 2018 Commonwealth Games venues and Tourism developments in Mackay and Townsville.
| • | | $6.9 million is allocated as grants to the Carrara Precinct including Carrara Indoor Stadium, Carrara Southern Precinct and Gold Coast Sports and Leisure Centre for wrestling and badminton facilities. |
| • | | $1.7 million is allocated as grants to the Belmont Shooting Centre for clay target, full bore, pistol and small bore shooting. |
| • | | $1.5 million is allocated as grants to the Coomera Indoor Sports Centre for gymnastics and netball facilities. |
| • | | $1.3 million is allocated as grants for the Mackay Tourism Visitor Information Centre. |
| • | | $1.3 million is allocated as grants to the Village Roadshow Sound Stage 9 for squash, table tennis and boxing facilities. |
| • | | $1.2 million is allocated as grants for the Gold Coast Hockey Centre. |
| • | | $590,000 is allocated as grants for the Nerang Mountain Bike Trails. |
| • | | $541,000 is allocated as grants for the Mt Inkerman Nature Tourism Development. |
117
Capital Statement 2017-18
| | | | | | | | | | | | | | | | | | | | |
| Tourism, Major Events, Small Business and the Commonwealth Games1 | |
Project | | Statistical
Area | | | Total
Estimated
Cost
$‘000 | | | Expenditure
to
30-06-17
$‘000 | | | Budget
2017-18
$‘000 | | | Post
2017-18
$‘000 | |
DEPARTMENT OF TOURISM, MAJOR EVENTS, SMALL BUSINESS AND THE COMMONWEALTH GAMES | | | | | | | | | | | | | | | | | | | | |
| | | | | |
Property, Plant and Equipment | | | | | | | | | | | | | | | | | | | | |
Queensland State Velodrome | | | 301 | | | | 59,984 | | | | 59,465 | | | | 519 | | | | | |
Carrara Stadium | | | 309 | | | | 5,579 | | | | 5,175 | | | | 404 | | | | | |
Other PPE - Office Equipment | | | 305 | | | | 90 | | | | 30 | | | | 12 | | | | 48 | |
| | | | | | | | | | | | | | | | | | | | |
Total Property, Plant and Equipment | | | | | | | | | | | | | | | 935 | | | | | |
| | | | | | | | | | | | | | | | | | | | |
| | | | | |
Capital Grants | | | | | | | | | | | | | | | | | | | | |
Carrara Precinct | | | 309 | | | | 119,165 | | | | 112,242 | | | | 6,923 | | | | | |
Belmont Shooting Centre | | | 301 | | | | 16,965 | | | | 15,238 | | | | 1,727 | | | | | |
Coomera Indoor Sports Centre | | | 309 | | | | 40,164 | | | | 38,644 | | | | 1,520 | | | | | |
Mackay Tourism Visitor Centre | | | 312 | | | | 1,300 | | | | | | | | 1,300 | | | | | |
Village Roadshow Sound Stage 9 | | | 309 | | | | 11,000 | | | | 9,750 | | | | 1,250 | | | | | |
Gold Coast Hockey Centre | | | 309 | | | | 16,473 | | | | 15,309 | | | | 1,164 | | | | | |
Nerang Mountain Bike Trails | | | 309 | | | | 3,041 | | | | 2,451 | | | | 590 | | | | | |
Mt Inkerman Nature Tourism Development | | | 318 | | | | 541 | | | | | | | | 541 | | | | | |
Gold Coast Aquatic Centre | | | 309 | | | | 41,391 | | | | 41,200 | | | | 191 | | | | | |
Other Games Projects | | | 309 | | | | 10,516 | | | | 6,943 | | | | 3,573 | | | | | |
| | | | | | | | | | | | | | | | | | | | |
Total Capital Grants | | | | | | | | | | | | | | | 18,779 | | | | | |
| | | | | | | | | | | | | | | | | | | | |
| | | | | | | | | | | | | | | | | | | | |
| | | | | | | | | | | | | | | | | | | | |
TOTAL TOURISM, MAJOR EVENTS, SMALL BUSINESS AND THE COMMONWEALTH GAMES (PPE) | | | | | | | | | | | | | | | 935 | | | | | |
| | | | | | | | | | | | | | | | | | | | |
| | | | | | | | | | | | | | | | | | | | |
| | | | | | | | | | | | | | | | | | | | |
TOTAL TOURISM, MAJOR EVENTS, SMALL BUSINESS AND THE COMMONWEALTH GAMES (CG) | | | | | | | | | | | | | | | 18,779 | | | | | |
| | | | | | | | | | | | | | | | | | | | |
Note:
| 1. | In accordance with the Venue Infrastructure Governance Framework, the Department of State Development has project and budget accountability and responsibility for Gold Coast 2018 Commonwealth Games venue delivery. |
118
Capital Statement 2017-18
| 3.23 | TRANSPORT AND MAIN ROADS |
In 2017-18, total capital purchases for the Transport and Main Roads portfolio are $3.885 billion, including capital grants of $237.4 million. The portfolio includes the Department of Transport and Main Roads, Queensland Rail, Far North Queensland Ports Corporation Limited, Gladstone Ports Corporation Limited, North Queensland Bulk Ports Corporation Limited, Port of Townsville Limited, RoadTek and the Gold Coast Waterways Authority.
Department of Transport and Main Roads
In 2017-18, capital purchases total $3.042 billion towards critical infrastructure investment across the state. The Queensland Government is committed to delivering an integrated, safe and efficient transport system that connects regional Queenslanders and other communities throughout the state.
Program Highlights (Property, Plant and Equipment)
| • | | $252.5 million towards the Toowoomba Second Range Crossing project, a bypass route to the north of Toowoomba, approximately 41km in length, running from the Warrego Highway at Helidon to the Gore Highway at Athol, via Charlton, at a total cost of $1.606 billion, in partnership with the Australian Government. |
| • | | $236.3 million towards widening the Gateway Motorway North to six lanes, south of Nudgee, at a total cost of $1.143 billion, in partnership with the Australian Government. |
| • | | $233.5 million to deliver the light rail system from Parkland Drive to Helensvale Rail Station, Gold Coast Light Rail (Stage 2), at a total cost of $420 million, in partnership with the Australian Government and Gold Coast City Council. |
| • | | $120 million to duplicate the Bruce Highway from four to six lanes, Caloundra Road to the Sunshine Motorway, at a total estimated cost of $929.3 million, in partnership with the Australian Government. |
| • | | $105 million to undertake restoration works in response to the impacts of cyclone Debbie on the Queensland transport infrastructure, at a total cost of $450 million, in partnership with the Australian Government. |
| • | | $70 million to construct Mackay Ring Road (Stage 1), at a total estimated cost of $497.8 million, in partnership with the Australian Government. |
| • | | $407 million to continue delivery of 75 new six car sets, and services over a 32-year period for the New Generation Rollingstock to meet the growing demand for rail services in South East Queensland. |
119
Capital Statement 2017-18
| • | | $44.4 million to duplicate from two to four lanes, a section of the Warrego Highway, Charlton to Kingsthorpe, at a total cost of $160 million, in partnership with the Australian Government. |
| • | | $40 million to widen the Bruce Highway (Cooroy to Curra) to four lanes between Traveston Road and Keefton Road, Gympie (Section C), at a total cost of $384.2 million, in partnership with the Australian Government. |
| • | | $39.7 million to complete upgrading of various Gold Coast roads in preparation for the Commonwealth Games, at a total cost of $160.7 million. |
| • | | $36.4 million to realign the Peak Downs Highway at Eton Range, at a total cost of $189.2 million, in partnership with the Australian Government. |
| • | | $36 million to construct additional lanes at Oxley Road-Suscatand Street, Ipswich Motorway, Rocklea to Darra (Stage 1), at a total cost of $400 million, in partnership with the Australian Government. |
| • | | $18.6 million to construct additional lanes on the Pacific Motorway between Mudgeeraba and Varsity Lakes, in partnership with the Australian Government. |
| • | | $18.3 million to widen Warrego Highway to four lanes at Dalby eastern access, at a total cost of $56 million, in partnership with the Australian Government. |
| • | | $16.8 million to replace timber bridges at various locations on the Dawson Highway, at a total cost of $40 million. |
| • | | $16.3 million to replace the bridge and approaches for flood immunity at Cape River on the Gregory Developmental Road, at a total cost of $34.6 million. |
| • | | $16 million to seal sections of the Kennedy Developmental Road between Hughenden and The Lynd (Hann Highway), at a total cost of $50 million, in partnership with the Australian Government. |
| • | | $10 million to upgrade the Pacific Motorway/ Gateway Motorway Merge, in partnership with the Australian Government. |
Program Highlights (Capital Grants)
| • | | $70 million of infrastructure development grants to local governments, including Aboriginal and Torres Strait Islander community assistance. |
| • | | $21.4 million towards development of cycle network throughout Queensland. |
| • | | $16.6 million for the Queensland School Bus Upgrade Scheme providing funding to eligible school bus operators to assist with the purchase of new buses or buses that are less than five years old. |
120
Capital Statement 2017-18
Gold Coast Waterways Authority
In 2017-18 Gold Coast Waterways Authority has allocated $8.3 million to improve management of, and provide better access to, the Gold Coast waterways, canals and rivers.
Program Highlights (Property, Plant and Equipment)
| • | | $5.5 million to improve access and safety by dredging navigation channels, and to improve accessibility and quality of waterways information. |
| • | | $630,000 to provide boating infrastructure such as boat ramps, pontoons and to implement the Surfers Riverside Masterplan. |
Queensland Rail Limited
In 2017-18, $671.6 million is allocated towards capital purchases for Queensland Rail.
Program Highlights (Property, Plant and Equipment)
$212 million is provided towards projects that will grow or enhance the Queensland Rail Network including:
| • | | $36 million to revitalise and modernise Brisbane’s Central Station to greatly improve the customer experience and cater for future growth. |
| • | | $29.7 million for implementation of European Train Control System Level 2 in the Brisbane Inner City Network. |
| • | | $24.5 million to continue track and tunnel upgrades between Brisbane and Toowoomba to cater for growing demand. |
| • | | $23.5 million to continue the duplication of the Gold Coast Line between Coomera and Helensvale. |
| • | | $18.3 million towards upgrades at Alderley, Morayfield, Newmarket, Graceville, Dinmore, Strathpine and Boondall Stations. |
| • | | $16.9 million to upgrade the capacity of the North Coast Rail Line to increase productivity and efficiency of freight transport. |
| • | | $40.1 million to continue investment required to support the delivery of the New Generation Rollingstock into service. |
$459.7 million replacement, renewal and upgrade of rail infrastructure, rollingstock, buildings and other supporting assets including:
| • | | $295.2 million for network investment including track infrastructure, civil structures, signalling and other network assets. |
121
Capital Statement 2017-18
| • | | $88.3 million for rail operations investment including Rollingstock overhauls, operational facilities and other rail operations assets. |
| • | | $76.2 million for business enabling investment on corporate, property and ICT works across Queensland. |
Far North Queensland Ports Corporation Limited
In 2017-18, Far North Queensland Ports Corporation Limited has allocated $7.1 million towards new and continuing development within its ports in Far North Queensland.
Program Highlights (Property, Plant and Equipment)
| • | | $3.8 million to continue the development of the Tingira Street Precinct in Cairns, at a total cost of $21.3 million. |
Gladstone Ports Corporation Limited
In 2017-18, Gladstone Ports Corporation Limited has allocated $98.3 million towards ongoing development of the Port of Gladstone, and additional works at the Port of Bundaberg and the Port of Rockhampton.
Program Highlights (Property, Plant and Equipment)
| • | | $49.7 million towards continuing upgrades at the RG Tanna Coal Terminal at the Port of Gladstone, at a total cost of $226 million. |
| • | | $7 million for projects relating to Barney Point including Mooring Upgrade and Conveyor Overpass and other projects, at a total cost of $14.3 million. |
| • | | $5.6 million for the Fisherman’s Landing projects relating to preventative works and drainage, at a total cost of $33.4 million. |
North Queensland Bulk Ports Corporation Limited
In 2017-18, North Queensland Bulk Ports Corporation has allocated $24.7 million to continue port planning and development initiatives to meet industry requirements for export coal facilities.
Program Highlights (Property, Plant and Equipment)
| • | | $7 million to renew Wharf 4 and 5 Fender at the Port of Mackay to support trade growth, at a total cost of $9.5 million. |
| • | | $2.9 million to establish a long life Module Offloading Facility along with supporting infrastructure at Abbott Point Port to facilitate ongoing operational users, at a total cost of $14.5 million. |
| • | | $1.1 million to purchase residential properties at Hay Point that will become buffer land in the future between Coal Terminal and the community, at a total cost of $8.6 million. |
122
Capital Statement 2017-18
Port of Townsville Limited
In 2017-18, Port of Townsville Limited has allocated $23.4 million towards ongoing development at the Port of Townsville and additional works at the Port of Lucinda.
Program Highlights (Property, Plant and Equipment)
| • | | $14.4 million for the redevelopment of the Berth 4 facility at the Port of Townsville including alignment with adjacent berth and deck surface works, at a total cost of $37.3 million. |
| | | | | | | | | | | | | | | | | | | | |
| Transport and Main Roads | |
Project | | Statistical
Area | | | Total
Estimated
Cost
$‘000 | | | Expenditure
to
30-06-17
$‘000 | | | Budget
2017-18
$‘000 | | | Post
2017-18
$‘000 | |
DEPARTMENT OF TRANSPORT AND MAIN ROADS | | | | | | | | | | | | | |
| | | | | |
Property, Plant and Equipment | | | | | | | | | | | | | | | | | | | | |
Central West District | | | | | | | | | | | | | | | | | | | | |
Clermont - Alpha Road, pave and1 seal | | | 315 | | | | 8,710 | | | | 140 | | | | 1,970 | | | | 6,600 | |
Diamantina Developmental Road1 (Boulia - Dajarra), pavement rehabilitation and widening | | | 315 | | | | 5,030 | | | | 100 | | | | 2,130 | | | | 2,800 | |
Diamantina Developmental Road (Windorah - Bedourie), pave and seal | | | 315 | | | | 2,750 | | | | | | | | 1,822 | | | | 928 | |
Landsborough Highway (Blackall -2,3 Barcaldine), Barcaldine, widening | | | 315 | | | | 12,500 | | | | 5,875 | | | | 5,625 | | | | 1,000 | |
Muttaburra-Aramac Road, pavement rehabilitation | | | 315 | | | | 3,581 | | | | 896 | | | | 2,685 | | | | | |
Other construction | | | 315 | | | | 25,044 | | | | | | | | 25,044 | | | | | |
| | | | | | | | | | | | | | | | | | | | |
Sub-total Central West District | | | | | | | | | | | | | | | 39,276 | | | | | |
| | | | | | | | | | | | | | | | | | | | |
| | | | | |
Darling Downs District Chinchilla Rail Crossing Upgrade4 | | | 307 | | | | 16,000 | | | | 1,171 | | | | 8,775 | | | | 6,054 | |
123
Capital Statement 2017-18
| | | | | | | | | | | | | | | | | | |
| Transport and Main Roads | |
Project | | Statistical
Area | | Total
Estimated
Cost
$‘000 | | | Expenditure
to
30-06-17
$‘000 | | | Budget
2017-18
$‘000 | | | Post
2017-18
$‘000 | |
Cunningham Highway (Warwick - Inglewood), wide centre line treatment | | 307 | | | 2,303 | | | | | | | | 2,303 | | | | | |
Drillham - Jackson Widening4 Upgrade | | 307 | | | 11,000 | | | | 808 | | | | 3,915 | | | | 6,277 | |
Miles Western Access Upgrade4 | | 307 | | | 24,000 | | | | 1,224 | | | | 1,164 | | | | 21,612 | |
New England Highway (Yarraman - Toowoomba), overtaking lanes | | 307 | | | 7,000 | | | | 2,278 | | | | 4,722 | | | | | |
New England Highway Upgrade2 Program, safety works within Southern Downs | | 307 | | | 11,625 | | | | 1,016 | | | | 7,109 | | | | 3,500 | |
Toowoomba Second Range5 Crossing | | 307 | | | 1,606,250 | | | | 411,503 | | | | 252,463 | | | | 942,284 | |
Warrego Highway (Dalby - Miles),4 Overtaking Lanes | | 307 | | | 35,000 | | | | 2,037 | | | | 25,893 | | | | 7,070 | |
Warrego Highway, Charlton -4 Kingsthorpe, duplication | | 307 | | | 160,000 | | | | 23,216 | | | | 44,378 | | | | 92,406 | |
Warrego Highway, Dalby Eastern4 Access Upgrade | | 307 | | | 56,000 | | | | 7,920 | | | | 18,252 | | | | 29,828 | |
Warrego Highway, Dalby Western4 Access Upgrade (Stage 1) | | 307 | | | 59,000 | | | | 8,832 | | | | 17,539 | | | | 32,629 | |
Warrego Highway, Oakey - Dalby,4 overtaking lanes | | 307 | | | 44,000 | | | | 23,922 | | | | 8,902 | | | | 11,176 | |
Warrego Highway, Oakey - Miles,4 safety upgrade | | 307 | | | 40,000 | | | | 6,630 | | | | 11,966 | | | | 21,404 | |
Other construction | | 307 | | | 22,797 | | | | | | | | 22,797 | | | | | |
| | | | | | | | | | | | | | | | | | |
Sub-total Darling Downs District | | | | | | | | | | | | | 430,178 | | | | | |
| | | | | | | | | | | | | | | | | | |
| | | | | |
Far North District | | | | | | | | | | | | | | | | | | |
Bruce Highway (Innisfail - Cairns), formation widening | | 306 | | | 31,782 | | | | 19,273 | | | | 7,535 | | | | 4,974 | |
Burke Developmental Road1 (Normanton - Dimbulah), pavement widening | | 306 | | | 7,460 | | | | 390 | | | | 4,000 | | | | 3,070 | |
Cairns Southern Access Corridor (Stage 2), widen to six lanes | | 306 | | | 58,000 | | | | 18,973 | | | | 9,172 | | | | 29,855 | |
Cape York Region Package,6 miscellaneous works | | Various | | | 140,014 | | | | 97,216 | | | | 3,845 | | | | 38,953 | |
Kennedy Highway (Cairns - Mareeba), Kuranda Range Run-Off Road, widen pavement | | 306 | | | 3,004 | | | | 100 | | | | 2,500 | | | | 404 | |
124
Capital Statement 2017-18
| | | | | | | | | | | | | | | | | | |
| Transport and Main Roads | |
Project | | Statistical
Area | | Total
Estimated
Cost
$‘000 | | | Expenditure
to
30-06-17
$‘000 | | | Budget
2017-18
$‘000 | | | Post
2017-18
$‘000 | |
Peninsula Developmental Road6 (Coen - Weipa), Archer River, pave and seal | | 315 | | | 20,000 | | | | 12,133 | | | | 7,391 | | | | 476 | |
Peninsula Developmental Road6 (Coen - Weipa), Rio Tinto Boundary, pave and seal | | 315 | | | 12,100 | | | | 1,438 | | | | 9,851 | | | | 811 | |
Peninsula Developmental Road6 (Laura - Coen), Coen South, pave and seal | | 315 | | | 22,925 | | | | 17,552 | | | | 4,944 | | | | 429 | |
Peninsula Developmental Road6 (Laura - Coen), Racecourse to Little Laura Upgrade Stage 2, pave and seal | | 315 | | | 10,698 | | | | 1,307 | | | | 8,655 | | | | 736 | |
Peninsula Developmental Road6 (Laura - Coen), Stage 2, South of Duck Holes Creek, pave and seal | | 315 | | | 6,300 | | | | 543 | | | | 4,557 | | | | 1,200 | |
Other construction | | 306 | | | 39,687 | | | | | | | | 39,687 | | | | | |
| | | | | | | | | | | | | | | | | | |
Sub-total Far North District | | | | | | | | | | | | | 102,137 | | | | | |
| | | | | | | | | | | | | | | | | | |
| | | | | |
Fitzroy District | | | | | | | | | | | | | | | | | | |
Banksia Road, Stanage Bay, boat ramp upgrade | | 308 | | | 1,850 | | | | 122 | | | | 1,728 | | | | | |
Bruce Highway (Benaraby - Rockhampton), Bajool, widening | | 308 | | | 16,950 | | | | 9,338 | | | | 7,612 | | | | | |
Bruce Highway (Rockhampton - St Lawrence), Rockhampton Northern Access Upgrade, Stage 1 | | 308 | | | 121,000 | | | | 6,400 | | | | 10,900 | | | | 103,700 | |
Capricorn Highway duplication7 (Rockhampton - Gracemere) | | 308 | | | 74,990 | | | | | | | | 5,000 | | | | 69,990 | |
Dawson Highway, Timber Bridge8 Replacement Package | | 308 | | | 40,000 | | | | 7,194 | | | | 16,806 | | | | 16,000 | |
Gregory Highway (Emerald - Clermont), Productivity Enhancement Works | | 308 | | | 5,920 | | | | 2,979 | | | | 2,941 | | | | | |
Gregory Highway, (Emerald - Clermont) Retreat Creek, Theresa Creek and Chirnside North of Emerald, replace existing culverts | | 308 | | | 4,142 | | | | 803 | | | | 3,339 | | | | | |
125
Capital Statement 2017-18
| | | | | | | | | | | | | | | | | | |
| Transport and Main Roads | |
Project | | Statistical
Area | | Total
Estimated
Cost
$‘000 | | | Expenditure
to
30-06-17
$‘000 | | | Budget
2017-18
$‘000 | | | Post
2017-18
$‘000 | |
Rockhampton Road Train Access1,8 (Stage 1) | | 308 | | | 30,000 | | | | 4,000 | | | | 9,000 | | | | 17,000 | |
Other construction | | 308 | | | 42,566 | | | | | | | | 42,566 | | | | | |
| | | | | | | | | | | | | | | | | | |
Sub-total Fitzroy District | | | | | | | | | | | | | 99,892 | | | | | |
| | | | | | | | | | | | | | | | | | |
| | | | | |
Mackay Whitsunday District | | | | | | | | | | | | | | | | | | |
Bruce Highway, Sandy Gully Bridge Upgrade | | 312 | | | 57,500 | | | | 15,310 | | | | 13,119 | | | | 29,071 | |
Carpet Snake Point boat ramp construction | | 312 | | | 2,300 | | | | 363 | | | | 1,937 | | | | | |
Mackay Ring Road, construct new two lane road | | 312 | | | 497,810 | | | | 50,426 | | | | 70,000 | | | | 377,384 | |
Mackay River Street, Boat Ramp, construction | | 312 | | | 1,500 | | | | 300 | | | | 1,200 | | | | | |
Mackay-Slade Point Road, Vines3 Creek Bridges Replacement | | 312 | | | 28,000 | | | | 5,333 | | | | 6,807 | | | | 15,860 | |
Peak Downs Highway (Nebo - Mackay), Timber Bridge Replacements | | 312 | | | 70,000 | | | | 21,021 | | | | 10,189 | | | | 38,790 | |
Peak Downs Highway, Eton Range Realignment | | 312 | | | 189,200 | | | | 53,031 | | | | 36,388 | | | | 99,781 | |
Other construction | | 312 | | | 20,360 | | | | | | | | 20,360 | | | | | |
| | | | | | | | | | | | | | | | | | |
Sub-total Mackay Whitsunday District | | | | | | | | | | | | | 160,000 | | | | | |
| | | | | | | | | | | | | | | | | | |
| | | | | |
Metropolitan District | | | | | | | | | | | | | | | | | | |
Cannon Hill Park and Ride Upgrade | | 303 | | | 2,000 | | | | | | | | 250 | | | | 1,750 | |
Cleveland-Redland Bay Road (Redland Bay) and Giles Road Intersection, improve and signalise | | 301 | | | 2,988 | | | | 197 | | | | 2,491 | | | | 300 | |
Ernie’s Roundabout Bus Driver Facilities | | 305 | | | 3,322 | | | | 230 | | | | 3,092 | | | | | |
Ferny Grove Station Precinct Transit Oriented Development | | 302 | | | 9,000 | | | | | | | | 1,200 | | | | 7,800 | |
Gateway Motorway North, south of Nudgee, permanent speed enforcement and heavy vehicle stopping lane | | 302 | | | 4,474 | | | | 167 | | | | 3,368 | | | | 939 | |
Gateway Motorway North, upgrade to six lanes | | 302 | | | 1,142,727 | | | | 532,287 | | | | 236,345 | | | | 374,095 | |
126
Capital Statement 2017-18
| | | | | | | | | | | | | | | | | | |
| Transport and Main Roads | |
Project | | Statistical
Area | | Total
Estimated
Cost
$‘000 | | | Expenditure
to
30-06-17
$‘000 | | | Budget
2017-18
$‘000 | | | Post
2017-18
$‘000 | |
Ipswich Motorway, Rocklea to8 Darra (Stage 1), upgrade | | 310 | | | 400,000 | | | | 25,401 | | | | 36,000 | | | | 338,599 | |
Mains Road Park and Ride Upgrade | | 303 | | | 7,210 | | | | | | | | 3,605 | | | | 3,605 | |
Mount Cotton Road (Sheldon), wide centre line treatment | | 301 | | | 4,633 | | | | 460 | | | | 2,965 | | | | 1,208 | |
Mount Cotton Road, (Mount Cotton), Woodlands Drive - Mount View Road, centreline drainage and widening works | | 301 | | | 2,968 | | | | 503 | | | | 2,165 | | | | 300 | |
New Generation Rollingstock5 | | 310 | | | 4,155,705 | | | | 352,679 | | | | 406,965 | | | | 3,396,061 | |
North Brisbane Bikeway, Stage 2 and 3, Somerset Street to Price Street, design and construct cycle facilities | | 303 | | | 13,180 | | | | 3,176 | | | | 1,675 | | | | 8,329 | |
Queensport Road - Murrarie Road (Murrarie), Park and Ride facility expansion | | 301 | | | 3,000 | | | | 225 | | | | 1,775 | | | | 1,000 | |
Redland Bay Road (Sheldon), pavement widening | | 301 | | | 4,152 | | | | 378 | | | | 2,993 | | | | 781 | |
Veloway 1, Pacific Motorway Cycleway (Stage D) | | 303 | | | 23,721 | | | | 13,055 | | | | 3,739 | | | | 6,927 | |
Other construction | | 305 | | | 18,960 | | | | | | | | 18,960 | | | | | |
| | | | | | | | | | | | | | | | | | |
Sub-total Metropolitan District | | | | | | | | | | | | | 727,588 | | | | | |
| | | | | | | | | | | | | | | | | | |
| | | | | |
North Coast District | | | | | | | | | | | | | | | | | | |
Beerburrum Road and Pumicestone Road, signals | | 313 | | | 2,330 | | | | 200 | | | | 1,700 | | | | 430 | |
Brisbane - Woodford Road, intersection upgrade | | 314 | | | 3,000 | | | | 175 | | | | 1,775 | | | | 1,050 | |
Bruce Highway (Brisbane - Gympie), Boundary Road Interchange | | 314 | | | 100,375 | | | | 54,555 | | | | 10,000 | | | | 35,820 | |
Bruce Highway safety barrier installation | | Various | | | 79,790 | | | | 10,860 | | | | 34,540 | | | | 34,390 | |
Bruce Highway, Caloundra Road to Sunshine Motorway | | 316 | | | 929,250 | | | | 79,968 | | | | 120,000 | | | | 729,282 | |
D’Aguilar Highway (Caboolture - Kilcoy), Chambers Road to Peterson Road, overtaking lane and intersection upgrades | | 313 | | | 4,700 | | | | 309 | | | | 3,700 | | | | 691 | |
127
Capital Statement 2017-18
| | | | | | | | | | | | | | | | | | |
| Transport and Main Roads | |
Project | | Statistical
Area | | Total
Estimated
Cost
$‘000 | | | Expenditure
to
30-06-17
$‘000 | | | Budget
2017-18
$‘000 | | | Post
2017-18
$‘000 | |
Eumundi - Kenilworth Road, pavement rehabilitation | | 316 | | | 2,100 | | | | 40 | | | | 2,060 | | | | | |
Forest Hill - Fernvale Road, pavement rehabilitation | | 310 | | | 2,100 | | | | 30 | | | | 2,070 | | | | | |
Kawana Way (Sunshine Motorway8 - Nicklin Way), Sunshine Coast University Hospital, roundabout upgrades | | 316 | | | 22,000 | | | | 16,316 | | | | 5,242 | | | | 442 | |
Redcliffe Road (Anzac Avenue) resurfacing between Gynther and Klinger Roads | | 313 | | | 3,000 | | | | | | | | 3,000 | | | | | |
Warrego Highway (Ipswich - Toowoomba), Tallegalla Road and Lowood - Minden Road, intersection improvements | | 310 | | | 10,000 | | | | 1,853 | | | | 5,147 | | | | 3,000 | |
Other construction | | 316 | | | 46,900 | | | | | | | | 46,900 | | | | | |
| | | | | | | | | | | | | | | | | | |
Sub-total North Coast District | | | | | | | | | | | | | 236,134 | | | | | |
| | | | | | | | | | | | | | | | | | |
| | | | | |
Northern District | | | | | | | | | | | | | | | | | | |
Bruce Highway (Bowen - Ayr), Burdekin River Bridge, rehabilitation | | 318 | | | 43,750 | | | | 38,733 | | | | 2,900 | | | | 2,117 | |
Bruce Highway (Townsville - Ingham), Cattle Creek and Frances Creek, upgrade | | 318 | | | 118,900 | | | | 21,821 | | | | 42,800 | | | | 54,279 | |
Bruce Highway (Townsville - Ingham), Deep Creek - Bluewater Creek, pavement widening | | 318 | | | 7,500 | | | | 400 | | | | 7,100 | | | | | |
Flinders Highway, Townsville to7 Charters Towers, pavement strengthening and rehabilitation | | 318 | | | 17,000 | | | | 1,045 | | | | 4,969 | | | | 10,986 | |
Garbutt - Upper Ross Road,8 Riverway Drive, duplication | | 318 | | | 35,000 | | | | 5,743 | | | | 14,291 | | | | 14,966 | |
Gregory Developmental Road, Cape River Bridge Replacement | | 318 | | | 34,600 | | | | 2,325 | | | | 16,275 | | | | 16,000 | |
Gregory Developmental Road, Charters Towers to The Lynd, widening | | 318 | | | 42,280 | | | | 4,406 | | | | 10,000 | | | | 27,874 | |
128
Capital Statement 2017-18
| | | | | | | | | | | | | | | | | | |
| Transport and Main Roads | |
Project | | Statistical
Area | | Total
Estimated
Cost
$‘000 | | | Expenditure
to
30-06-17
$‘000 | | | Budget
2017-18
$‘000 | | | Post
2017-18
$‘000 | |
South Townsville Road Abbot Street and Oonoonba Road Intersection, installation of traffic signals | | 318 | | | 2,353 | | | | 268 | | | | 2,085 | | | | | |
Other construction | | 318 | | | 41,958 | | | | | | | | 41,958 | | | | | |
| | | | | | | | | | | | | | | | | | |
Sub-total Northern District | | | | | | | | | | | | | 142,378 | | | | | |
| | | | | | | | | | | | | | | | | | |
| | | | | |
North West District | | | | | | | | | | | | | | | | | | |
Barkly Highway (Cloncurry - Mount Isa), Mount Isa City Centre, Pedestrian Intersection, improvements | | 315 | | | 1,843 | | | | 125 | | | | 1,718 | | | | | |
Cloncurry - Dajarra Road, sealing1 | | 315 | | | 3,220 | | | | | | | | 1,610 | | | | 1,610 | |
Flinders Highway (Charters7 Towers - Hughenden), culvert upgrades | | 315 | | | 15,250 | | | | 1,250 | | | | 7,750 | | | | 6,250 | |
Flinders Highway (Hughenden -7 Richmond), culvert upgrades | | 315 | | | 9,750 | | | | 750 | | | | 5,500 | | | | 3,500 | |
Flinders Highway, various locations (Richmond Shire Council), asphalt resurfacing | | 315 | | | 4,402 | | | | 2,402 | | | | 2,000 | | | | | |
Kennedy Developmental Road7 (Hann Highway), The Lynd - Hughenden, sealing | | 315 | | | 50,000 | | | | 4,000 | | | | 16,000 | | | | 30,000 | |
Other construction | | 315 | | | 22,390 | | | | | | | | 22,390 | | | | | |
| | | | | | | | | | | | | | | | | | |
Sub-total North West District | | | | | | | | | | | | | 56,968 | | | | | |
| | | | | | | | | | | | | | | | | | |
| | | | | |
South West District | | | | | | | | | | | | | | | | | | |
Carnarvon Highway, St George - Surat Road, pavement widening | | 307 | | | 16,500 | | | | 1,527 | | | | 6,321 | | | | 8,652 | |
Carnarvon Highway, Injune-Rolleston Road, pavement widening | | 307 | | | 12,040 | | | | 1,500 | | | | 4,620 | | | | 5,920 | |
Hungerford Road, Box Culvert, replacement of five structures | | 315 | | | 1,100 | | | | 100 | | | | 1,000 | | | | | |
Other construction | | 307 | | | 22,119 | | | | | | | | 22,119 | | | | | |
| | | | | | | | | | | | | | | | | | |
Sub-total South West District | | | | | | | | | | | | | 34,060 | | | | | |
| | | | | | | | | | | | | | | | | | |
| | | | | |
South Coast District | | | | | | | | | | | | | | | | | | |
Beaudesert - Beenleigh Road, installation of safety treatments | | 311 | | | 5,880 | | | | 170 | | | | 2,000 | | | | 3,710 | |
Beaudesert Town Centre Bypass | | 311 | | | 26,000 | | | | 19,000 | | | | 7,000 | | | | | |
129
Capital Statement 2017-18
| | | | | | | | | | | | | | | | | | |
| Transport and Main Roads | |
Project | | Statistical
Area | | Total
Estimated
Cost
$‘000 | | | Expenditure
to
30-06-17
$‘000 | | | Budget
2017-18
$‘000 | | | Post
2017-18
$‘000 | |
Cunningham Highway (Ipswich -2 Warwick), Warrill View, pavement rehabilitation | | 310 | | | 12,500 | | | | 8,500 | | | | 4,000 | | | | | |
Gold Coast Light Rail (Stage 2)5 | | 309 | | | 420,000 | | | | 104,246 | | | | 233,542 | | | | 82,212 | |
Labrador-Carrara Road,9 Crestwood Drive to Nerang Southport Road, widen to 6 lanes | | 309 | | | 22,500 | | | | 12,348 | | | | 10,152 | | | | | |
Nerang - Broadbeach Road9 (Carrara) Gooding Drive Intersection Upgrade | | 309 | | | 11,701 | | | | 5,075 | | | | 6,626 | | | | | |
Oxenford - Coomera Gorge Road and Guanaba Creek Road, realignment | | 309 | | | 4,416 | | | | 647 | | | | 3,069 | | | | 700 | |
Pacific Motorway (Rochedale8,10 South), Miles Platting Road to Rochedale Road (Gateway Merge) | | 303 | | | 170,000 | | | | 3,300 | | | | 10,000 | | | | 156,700 | |
Pacific Motorway (Mudgeeraba -11 Varsity Lakes) extra lanes | | 309 | | | 180,000 | | | | 6,467 | | | | 18,638 | | | | 154,895 | |
Southport-Burleigh Road, Vespa9 Crescent to Nerang River Bridge, widen to six lanes | | 309 | | | 49,000 | | | | 34,099 | | | | 14,901 | | | | | |
V1 Cycleway (Springwood), Logan Road - Paradise Road | | 311 | | | 4,100 | | | | 500 | | | | 3,600 | | | | | |
Waterford - Tamborine Road (Logan Village) Upgrade between Anzac Avenue to Hotz Road | | 311 | | | 39,500 | | | | 4,500 | | | | 18,000 | | | | 17,000 | |
Widening of the Mount Lindesay Highway between Browns Plains and Beaudesert | | 311 | | | 20,000 | | | | | | | | 4,000 | | | | 16,000 | |
Other construction | | 309 | | | 23,693 | | | | | | | | 23,693 | | | | | |
| | | | | | | | | | | | | | | | | | |
Sub-total South Coast District | | | | | | | | | | | | | 359,221 | | | | | |
| | | | | | | | | | | | | | | | | | |
| | | | | |
Wide Bay Burnett District | | | | | | | | | | | | | | | | | | |
Bruce Highway (Gympie - Maryborough), North of Pineapple Farm - South of Old Gympie Road, widening for wide centre line treatments | | 319 | | | 8,560 | | | | 2,864 | | | | 3,324 | | | | 2,372 | |
130
Capital Statement 2017-18
| | | | | | | | | | | | | | | | | | |
| Transport and Main Roads | |
Project | | Statistical
Area | | Total
Estimated
Cost
$‘000 | | | Expenditure
to
30-06-17
$‘000 | | | Budget
2017-18
$‘000 | | | Post
2017-18
$‘000 | |
Bruce Highway (Gympie - Maryborough), Pineapple Hill, construct southbound overtaking lanes | | 319 | | | 9,800 | | | | 2,790 | | | | 4,674 | | | | 2,336 | |
Bruce Highway (Maryborough - Gin Gin), Hebbards Road - North South Road, Apple Tree Creek, widening and rehabilitation | | 319 | | | 14,909 | | | | 626 | | | | 12,200 | | | | 2,083 | |
Bruce Highway, (Gin Gin - Benaraby) North of Monduran Dam Road (Carman Road - Langbeckers Nurseries), widen and overlay | | 319 | | | 4,800 | | | | 484 | | | | 3,916 | | | | 400 | |
Bruce Highway, Cooroy to Curra (Section C), upgrade | | 319 | | | 384,241 | | | | 163,395 | | | | 40,000 | | | | 180,846 | |
Bruce Highway, Tinana Interchange Upgrade | | 319 | | | 38,000 | | | | 20,099 | | | | 8,000 | | | | 9,901 | |
Burnett Highway (Goomeri - Gayndah), pavement rehabilitation | | 319 | | | 2,164 | | | | 80 | | | | 1,780 | | | | 304 | |
Dickabram Rail, Road Bridge, rehabilitation | | 319 | | | 8,000 | | | | 500 | | | | 2,500 | | | | 5,000 | |
Maryborough - Hervey Bay Road and Urraween Road Intersection, signalisation | | 319 | | | 12,500 | | | | 5,042 | | | | 6,045 | | | | 1,413 | |
Pialba-Burrum Heads Road and Scrub Hill Road and Wide Bay Drive, intersection signalisation | | 319 | | | 26,000 | | | | 4,944 | | | | 6,500 | | | | 14,556 | |
Other construction | | 319 | | | 46,628 | | | | | | | | 46,628 | | | | | |
| | | | | | | | | | | | | | | | | | |
Sub-total Wide Bay Burnett District | | | | | | | | | | | | | 135,567 | | | | | |
| | | | | | | | | | | | | | | | | | |
| | | | | |
State Wide | | | | | | | | | | | | | | | | | | |
Boating Infrastructure Minor12 Works | | Various | | | | | | | | | | | 8,938 | | | | Ongoing | |
Maritime Safety Minor Works | | Various | | | | | | | | | | | 13,042 | | | | Ongoing | |
Natural Disaster Recovery and13 Reconstruction Works | | Various | | | 400,000 | | | | | | | | 105,000 | | | | 295,000 | |
Passenger Transport Facilities Program | | Various | | | | | | | | | | | 15,796 | | | | Ongoing | |
131
Capital Statement 2017-18
| | | | | | | | | | | | | | | | | | |
| Transport and Main Roads | |
Project | | Statistical
Area | | Total
Estimated
Cost
$‘000 | | | Expenditure
to
30-06-17
$‘000 | | | Budget
2017-18
$‘000 | | | Post
2017-18
$‘000 | |
Transport Corridor Acquisition Fund | | Various | | | | | | | | | | | 40,000 | | | | Ongoing | |
Other construction | | Various | | | 59,763 | | | | | | | | 59,763 | | | | | |
| | | | | | | | | | | | | | | | | | |
Sub-total State Wide | | | | | | | | | | | | | 242,539 | | | | | |
| | | | | | | | | | | | | | | | | | |
| | | | | |
Other Property, Plant and Equipment | | | | | | | | | | | | | | | | | | |
Corporate Buildings | | Various | | | | | | | | | | | 4,000 | | | | Ongoing | |
Information Technology | | Various | | | | | | | | | | | 22,402 | | | | Ongoing | |
Plant and Equipment | | Various | | | | | | | | | | | 11,887 | | | | Ongoing | |
| | | | | | | | | | | | | | | | | | |
Sub-total Other Property, Plant and Equipment | | | | | | | | | | | | | 38,289 | | | | | |
| | | | | | | | | | | | | | | | | | |
| | | | | | | | | | | | | | | | | | |
| | | | | | | | | | | | | | | | | | |
Total Property, Plant and Equipment | | | | | | | | | | | | | 2,804,227 | | | | | |
| | | | | | | | | | | | | | | | | | |
| | | | | |
Capital Grants | | | | | | | | | | | | | | | | | | |
Black Spot | | Various | | | | | | | | | | | 12,178 | | | | Ongoing | |
Bridges Renewal Program | | Various | | | 40,161 | | | | 29,274 | | | | 9,787 | | | | 1,100 | |
Cape York Region Package | | Various | | | 48,463 | | | | 14,240 | | | | 23,781 | | | | 10,442 | |
Cycle Program | | Various | | | | | | | | | | | 21,387 | | | | Ongoing | |
Passenger Transport Facilities Program | | Various | | | | | | | | | | | 8,692 | | | | Ongoing | |
Queensland School Bus Upgrade | | Various | | | | | | | | | | | 16,572 | | | | Ongoing | |
Regional Roads Infrastructure Package | | Various | | | 13,314 | | | | 3,466 | | | | 3,750 | | | | 6,098 | |
Royalties for the Regions | | Various | | | 19,541 | | | | 12,594 | | | | 4,105 | | | | 2,842 | |
Transport Infrastructure Development Scheme | | Various | | | | | | | | | | | 70,000 | | | | Ongoing | |
Transport and Tourism Connections | | 315 | | | 10,000 | | | | | | | | 5,900 | | | | 4,100 | |
Other Capital Grants | | Various | | | 61,275 | | | | | | | | 61,275 | | | | | |
| | | | | | | | | | | | | | | | | | |
Total Capital Grants | | | | | | | | | | | | | 237,427 | | | | | |
| | | | | | | | | | | | | | | | | | |
| | | | | |
GOLD COAST WATERWAYS AUTHORITY | | | | | | | | | | | | | | | | | | |
| | | | | |
Property, Plant and Equipment | | | | | | | | | | | | | | | | | | |
Navigation Access and Safety | | 309 | | | 12,263 | | | | 3,410 | | | | 5,503 | | | | 3,350 | |
Boating Infrastructure Program | | 309 | | | 4,620 | | | | 1,210 | | | | 630 | | | | 2,780 | |
Plant, Equipment & Minor Works | | 309 | | | 6,455 | | | | 1,910 | | | | 2,125 | | | | 2,420 | |
| | | | | | | | | | | | | | | | | | |
Total Property, Plant and Equipment | | | | | | | | | | | | | 8,258 | | | | | |
| | | | | | | | | | | | | | | | | | |
132
Capital Statement 2017-18
| | | | | | | | | | | | | | | | | | | | |
| Transport and Main Roads | |
Project | | Statistical
Area | | | Total
Estimated
Cost
$‘000 | | | Expenditure
to
30-06-17
$‘000 | | | Budget
2017-18
$‘000 | | | Post
2017-18
$‘000 | |
ROADTEK | | | | | | | | | | | | | | | | | | | | |
| | | | | |
Property, Plant and Equipment | | | | | | | | | | | | | | | | | | | | |
Hire Plant | | | Various | | | | | | | | | | | | 10,000 | | | | Ongoing | |
| | | | | | | | | | | | | | | | | | | | |
Total Property, Plant and Equipment | | | | | | | | | | | | | | | 10,000 | | | | | |
| | | | | | | | | | | | | | | | | | | | |
| | | | | |
QUEENSLAND RAIL LIMITED | | | | | | | | | | | | | | | | | | | | |
| | | | | |
Property, Plant and Equipment | | | | | | | | | | | | | | | | | | | | |
Growth | | | | | | | | | | | | | | | | | | | | |
European Train Control System Level 2 - Inner City | | | 305 | | | | 634,381 | | | | 15,248 | | | | 29,654 | | | | 589,479 | |
New Generation Rollingstock - Power Distribution | | | Various | | | | 42,137 | | | | 3,046 | | | | 23,729 | | | | 15,362 | |
New Generation Rollingstock - Business Systems | | | 305 | | | | 36,144 | | | | 31,980 | | | | 4,164 | | | | | |
New Generation Rollingstock Stabling Facilities | | | Various | | | | 115,931 | | | | 115,731 | | | | 200 | | | | | |
Other New Generation Rollingstock - Operational Readiness Projects | | | Various | | | | 12,013 | | | | | | | | 12,013 | | | | | |
Central Station Renewal | | | 305 | | | | 44,300 | | | | 7,017 | | | | 20,637 | | | | 16,646 | |
Other Central Station Upgrades | | | 305 | | | | 23,962 | | | | | | | | 15,353 | | | | 8,609 | |
Alderley and Newmarket Station Upgrades | | | 305 | | | | 29,589 | | | | 24,933 | | | | 4,656 | | | | | |
Graceville and Dinmore Station Upgrades | | | Various | | | | 35,220 | | | | 31,189 | | | | 4,031 | | | | | |
Morayfield Station Upgrade | | | 313 | | | | 15,000 | | | | 705 | | | | 3,350 | | | | 10,945 | |
Strathpine and Boondall Station Upgrades | | | Various | | | | 28,444 | | | | 2,012 | | | | 6,229 | | | | 20,203 | |
Other Station Upgrades | | | Various | | | | | | | | | | | | 17,804 | | | | Ongoing | |
Toowoomba Range Capacity and Clearance | | | 317 | | | | 34,481 | | | | 5,142 | | | | 24,466 | | | | 4,873 | |
Coomera to Helensvale Duplication | | | 309 | | | | 131,544 | | | | 81,174 | | | | 23,506 | | | | 26,864 | |
North Coast Line Capacity Improvement Project (Passing Loops) | | | Various | | | | 100,000 | | | | 1,350 | | | | 16,900 | | | | 81,750 | |
Other Projects14 | | | Various | | | | | | | | | | | | 5,273 | | | | Ongoing | |
| | | | | | | | | | | | | | | | | | | | |
Sub-total Growth | | | | | | | | | | | | | | | 211,965 | | | | | |
| | | | | | | | | | | | | | | | | | | | |
133
Capital Statement 2017-18
| | | | | | | | | | | | | | | | | | | | |
| Transport and Main Roads | |
Project | | Statistical
Area | | | Total
Estimated
Cost
$‘000 | | | Expenditure
to
30-06-17
$‘000 | | | Budget
2017-18
$‘000 | | | Post
2017-18
$‘000 | |
Network15 | | | | | | | | | | | | | | | | | | | | |
Below Rail Cost Optimisation | | | Various | | | | | | | | | | | | 28,871 | | | | Ongoing | |
Below Rail Operational15 Performance | | | Various | | | | | | | | | | | | 266,338 | | | | Ongoing | |
| | | | | | | | | | | | | | | | | | | | |
Sub-total Network | | | | | | | | | | | | | | | 295,209 | | | | | |
| | | | | | | | | | | | | | | | | | | | |
| | | | | |
Rail Operations | | | | | | | | | | | | | | | | | | | | |
Above Rail Cost Optimisation16 | | | Various | | | | | | | | | | | | 12,142 | | | | Ongoing | |
Above Rail Operational16 Performance | | | Various | | | | | | | | | | | | 76,165 | | | | Ongoing | |
| | | | | | | | | | | | | | | | | | | | |
Sub-total Rail Operations | | | | | | | | | | | | | | | 88,307 | | | | | |
| | | | | | | | | | | | | | | | | | | | |
| | | | | |
Business Enabling | | | | | | | | | | | | | | | | | | | | |
ICT Program | | | Various | | | | | | | | | | | | 8,087 | | | | Ongoing | |
Safety Program | | | Various | | | | | | | | | | | | 9,857 | | | | Ongoing | |
Workforce Productivity Program | | | Various | | | | | | | | | | | | 4,348 | | | | Ongoing | |
Other Enabling Program | | | Various | | | | | | | | | | | | 53,872 | | | | Ongoing | |
| | | | | | | | | | | | | | | | | | | | |
Sub-total Business Enabling | | | | | | | | | | | | | | | 76,164 | | | | | |
| | | | | | | | | | | | | | | | | | | | |
| | | | | | | | | | | | | | | | | | | | |
| | | | | | | | | | | | | | | | | | | | |
Total Property, Plant and Equipment | | | | | | | | | | | | | | | 671,645 | | | | | |
| | | | | | | | | | | | | | | | | | | | |
| | | | | |
FAR NORTH QUEENSLAND PORTS CORPORATION LIMITED | | | | | | | | | | | | | | | | | | | | |
| | | | | |
Property, Plant and Equipment | | | | | | | | | | | | | | | | | | | | |
Foreshore Development | | | 306 | | | | 21,180 | | | | 19,180 | | | | 1,000 | | | | 1,000 | |
Site Decontamination | | | 306 | | | | 200 | | | | | | | | 200 | | | | | |
Cityport Commercial Allowance | | | 306 | | | | 4,808 | | | | 3,988 | | | | 300 | | | | 520 | |
Mourilyan Lease Acquisitions | | | 306 | | | | 250 | | | | | | | | 250 | | | | | |
Marina Reconfiguration & Expansion | | | 306 | | | | 3,870 | | | | 1,170 | | | | 100 | | | | 2,600 | |
Tingira Street Subdivision Development | | | 306 | | | | 21,290 | | | | 3,140 | | | | 3,750 | | | | 14,400 | |
Horn Island Cargo Wharf Access Road | | | 315 | | | | 1,700 | | | | | | | | 300 | | | | 1,400 | |
Plant, Equipment and Minor Works | | | 306 | | | | | | | | | | | | 1,209 | | | | Ongoing | |
| | | | | | | | | | | | | | | | | | | | |
Total Property, Plant and Equipment | | | | | | | | | | | | | | | 7,109 | | | | | |
| | | | | | | | | | | | | | | | | | | | |
| | | | | |
GLADSTONE PORTS CORPORATION LIMITED | | | | | | | | | | | | | | | | | | | | |
| | | | | |
Property, Plant and Equipment | | | | | | | | | | | | | | | | | | | | |
RG Tanna Coal Terminal Projects | | | | | | | | | | | | | | | | | | | | |
Process Control Systems, Stockpile Management and Upgrades | | | 308 | | | | 158,382 | | | | 36,490 | | | | 36,322 | | | | 85,570 | |
134
Capital Statement 2017-18
| | | | | | | | | | | | | | | | | | |
| Transport and Main Roads | |
Project | | Statistical
Area | | Total
Estimated
Cost
$‘000 | | | Expenditure
to
30-06-17
$‘000 | | | Budget
2017-18
$‘000 | | | Post
2017-18
$‘000 | |
Conveyor Life Extension | | 308 | | | 50,825 | | | | 8,920 | | | | 10,155 | | | | 31,750 | |
Capacity Maximisation | | 308 | | | 16,800 | | | | 5,648 | | | | 3,252 | | | | 7,900 | |
Auckland Point Projects | | 308 | | | 33,800 | | | | | | | | 3,000 | | | | 30,800 | |
Barney Point Projects | | 308 | | | 14,320 | | | | 26 | | | | 6,984 | | | | 7,310 | |
Port of Bundaberg Projects | | 319 | | | 3,400 | | | | | | | | 3,400 | | | | | |
Fisherman’s Landing Projects | | 308 | | | 33,400 | | | | 3,191 | | | | 5,609 | | | | 24,600 | |
Pontoon Piles Replacement | | 308 | | | 500 | | | | | | | | 500 | | | | | |
Marina Pilot Services Projects | | 308 | | | 7,270 | | | | 3,077 | | | | 3,173 | | | | 1,020 | |
Information Systems Projects | | 308 | | | 22,805 | | | | 3,304 | | | | 4,880 | | | | 14,621 | |
Port Services Projects | | 308 | | | 63,673 | | | | 17,973 | | | | 8,801 | | | | 36,899 | |
Port Alma Projects | | 308 | | | 3,722 | | | | 519 | | | | 2,703 | | | | 500 | |
Quarry Projects | | 308 | | | 4,375 | | | | | | | | 1,225 | | | | 3,150 | |
South Trees Projects | | 308 | | | 7,200 | | | | | | | | 1,800 | | | | 5,400 | |
Plant, Equipment and Minor Works | | 308 | | | 17,371 | | | | 995 | | | | 6,518 | | | | 9,858 | |
| | | | | | | | | | | | | | | | | | |
Total Property, Plant and Equipment | | | | | | | | | | | | | 98,322 | | | | | |
| | | | | | | | | | | | | | | | | | |
| | | | | |
NORTH QUEENSLAND BULK PORTS CORPORATION LIMITED | | | | | | | | | | | | | | | | | | |
| | | | | |
Property, Plant and Equipment | | | | | | | | | | | | | | | | | | |
Abbot Point Module Offloading Facility | | 312 | | | 14,534 | | | | 8,358 | | | | 2,851 | | | | 3,325 | |
Hay Point Multi Offload Facility | | 312 | | | 2,500 | | | | 1,141 | | | | 1,359 | | | | | |
Louisa Creek Acquisition Program | | 312 | | | 8,616 | | | | 1,252 | | | | 1,052 | | | | 6,312 | |
Indigenous Land User Agreement | | 312 | | | 3,483 | | | | 474 | | | | 580 | | | | 2,429 | |
Mackay Port Development General | | 312 | | | 15,948 | | | | 4,558 | | | | 3,420 | | | | 7,970 | |
Abbot Point Port Development General | | 312 | | | 6,484 | | | | 314 | | | | 2,270 | | | | 3,900 | |
Hay Point Port Development General | | 312 | | | 3,931 | | | | 401 | | | | 1,710 | | | | 1,820 | |
Weipa Port Development General | | 315 | | | 350 | | | | 50 | | | | 120 | | | | 180 | |
Mackay Wharf 4 and 5 Fender Upgrade | | 312 | | | 9,516 | | | | 2,500 | | | | 7,016 | | | | | |
Middle Breakwater Fuel Line Supports Replacement | | 312 | | | 2,786 | | | | 300 | | | | 686 | | | | 1,800 | |
Mackay Northern Access Road | | 312 | | | 1,500 | | | | | | | | 1,500 | | | | | |
Mackay Wharf 1 Deck Concrete Sealing | | 312 | | | 1,200 | | | | 100 | | | | 1,100 | | | | | |
Mackay Water Network Enhancements | | 312 | | | 750 | | | | 50 | | | | 350 | | | | 350 | |
Business Improvement | | 312 | | | 2,295 | | | | 708 | | | | 657 | | | | 930 | |
| | | | | | | | | | | | | | | | | | |
Total Property, Plant and Equipment | | | | | | | | | | | | | 24,671 | | | | | |
| | | | | | | | | | | | | | | | | | |
135
Capital Statement 2017-18
| | | | | | | | | | | | | | | | | | |
| Transport and Main Roads | |
Project | | Statistical
Area | | Total
Estimated
Cost
$‘000 | | | Expenditure
to
30-06-17
$‘000 | | | Budget
2017-18
$‘000 | | | Post
2017-18
$‘000 | |
PORT OF TOWNSVILLE LIMITED | | | | | | | | | | | | | | | | | | |
| | | | | |
Property, Plant and Equipment | | | | | | | | | | | | | | | | | | |
Berth 4 Upgrade | | 318 | | | 37,305 | | | | 22,873 | | | | 14,432 | | | | | |
Berth 3 Paved Area Upgrade | | 318 | | | 682 | | | | 282 | | | | 250 | | | | 150 | |
Replacement of Pilot Vessel Petrel II | | 318 | | | 2,550 | | | | 2,012 | | | | 538 | | | | | |
Port Management Information System | | 318 | | | 1,300 | | | | 50 | | | | 625 | | | | 625 | |
Berth 7 Earth Pier rock armour scour protection | | 318 | | | 500 | | | | | | | | 500 | | | | | |
Expanded Air Monitoring Network | | 318 | | | 1,006 | | | | 300 | | | | 235 | | | | 471 | |
Berth 3 bollards upgrade | | 318 | | | 300 | | | | | | | | 300 | | | | | |
Port Expansion Environmental Assessment | | 318 | | | 2,500 | | | | 500 | | | | 1,000 | | | | 1,000 | |
Dynamic Under Keel Clearance | | 318 | | | 2,200 | | | | | | | | 200 | | | | 2,000 | |
Road Works Logistics Management Works | | 318 | | | 1,000 | | | | | | | | 1,000 | | | | | |
Security Upgrades | | 318 | | | 2,502 | | | | | | | | 237 | | | | 2,265 | |
Harbour City Gateway | | 318 | | | 1,805 | | | | 575 | | | | 625 | | | | 605 | |
Plant, Equipment and Minor Works | | 318 | | | | | | | | | | | 3,464 | | | | Ongoing | |
| | | | | | | | | | | | | | | | | | |
Total Property, Plant and Equipment | | | | | | | | | | | | | 23,406 | | | | | |
| | | | | | | | | | | | | | | | | | |
| | | | | | | | | | | | | | | | | | |
| | | | | | | | | | | | | | | | | | |
TOTAL TRANSPORT AND MAIN ROADS (PPE) | | | | | | | | | | | | | 3,647,638 | | | | | |
| | | | | | | | | | | | | | | | | | |
| | | | | | | | | | | | | | | | | | |
| | | | | | | | | | | | | | | | | | |
TOTAL TRANSPORT AND MAIN ROADS (CG) | | | | | | | | | | | | | 237,427 | | | | | |
| | | | | | | | | | | | | | | | | | |
Notes:
| 1. | Part of the $76.1 million Northern Australia Beef Roads Programme. |
| 2. | Part of the $61.6 million National Highway Upgrade Program. |
| 3. | Part of the $144.6 million Accelerated Works Program. |
| 4. | Part of the $635 million Warrego Highway Upgrade Package to upgrade the Warrego Highway between Toowoomba and Miles. |
| 5. | This project is being delivered under a Public Private Partnership arrangement (PPP). |
| 6. | Part of the $260.5 million Cape York Region Package. |
| 7. | Part of the $279.7 million Northern Australian Roads Programme. |
| 8. | Part of the State Infrastructure Fund Priority Economic Works and Productivity Program. |
| 9. | Part of the $160.7 million Commonwealth Games Upgrade Package. |
136
Capital Statement 2017-18
| 10. | Indicative total project cost to be confirmed through the procurement process. Australian Government contribution capped at $115 million, with the Queensland Government to fund the balance. Queensland Government contribution includes $42 million from the State Infrastructure Fund - Priority Economic Works and Productivity Program. |
| 11. | Indicative total project cost to be confirmed through the procurement process. Australian Government contribution capped at $110 million, with the Queensland Government to fund the balance. Queensland Government contribution includes $44 million from the State Infrastructure Fund. |
| 12. | Represents the statewide allocation only, as part of the $23.4 million Recreational Boating Program. |
| 13. | Represents capital works only. The additional $50 million was allocated to emergent works in response to the impacts of cyclone Debbie on the Queensland transport infrastructure. |
| 14. | Projects other than European Train Control System, New Generation Rollingstock - Operational Readiness, Central and other station upgrades that will grow and enhance the Queensland Rail Network. They are mainly related to infrastructure, civil and signalling works. |
| 15. | Below Rail includes track infrastructure. |
| 16. | Above rail includes stations, platforms and rollingstock. |
All Projects - Total estimated cost is inclusive of both non-capital and capital components of project expenditure.
137
Capital Statement 2017-18
Appendices
| Appendix A: | Entities included in capital outlays 2017-18 |
Aboriginal and Torres Strait Islander Partnerships
Department of Aboriginal and Torres Strait Islander Partnerships
Agriculture and Fisheries
Department of Agriculture and Fisheries
Queensland Agricultural Training Colleges
Communities, Child Safety and Disability Services
Department of Communities, Child Safety and Disability Services
Education and Training
Department of Education and Training
Queensland Curriculum and Assessment Authority
TAFE Queensland
Electoral Commission of Queensland
Energy and Water Supply
Department of Energy and Water Supply
CS Energy Limited
Stanwell Corporation Limited
Energy Queensland
Powerlink Queensland
SunWater Limited
Gladstone Area Water Board
Mount Isa Water Board
Seqwater
Environment and Heritage Protection
Department of Environment and Heritage Protection
138
Capital Statement 2017-18
Housing and Public Works
Department of Housing and Public Works
Queensland Building and Construction Commission
Residential Tenancies Authority
Infrastructure, Local Government and Planning
Department of Infrastructure, Local Government and Planning
Economic Development Queensland
South Bank Corporation
Queensland Reconstruction Authority
Cross River Rail Delivery Authority
Justice and Attorney-General
Department of Justice and Attorney-General
Public Trustee of Queensland
Legal Aid Queensland
Crime and Corruption Commission
Legislative Assembly of Queensland
National Parks, Sport and Racing
Department of National Parks, Sport and Racing
Stadiums Queensland
Natural Resources and Mines
Department of Natural Resources and Mines
Premier and Cabinet
Department of Premier and Cabinet
Queensland Museum
Queensland Art Gallery
Queensland Performing Arts Trust
Public Safety Business Agency
Queensland Fire and Emergency Services
Queensland Health
Queensland Health and Hospital and Health Services
Council of the Queensland Institute of Medical Research
Queensland Police Service
Queensland Police Service
139
Capital Statement 2017-18
Queensland Treasury
Queensland Treasury
Queensland Racing Integrity Commission
Science, Information Technology and Innovation
Department of Science, Information Technology and Innovation
Library Board of Queensland
CITEC
Queensland Shared Services
State Development
Department of State Development
Tourism, Major Events, Small Business and the Commonwealth Games
Department of Tourism, Major Events, Small Business and the Commonwealth Games
Transport and Main Roads
Department of Transport and Main Roads
Gold Coast Waterways Authority
RoadTek
Queensland Rail Limited
Far North Queensland Ports Corporation Limited
Gladstone Ports Corporation Limited
North Queensland Bulk Ports Corporation Limited
Port of Townsville Limited.
140
Capital Statement 2017-18
| Appendix B: | Key concepts and coverage |
Coverage of the capital statement
Under accrual output budgeting, capital is the stock of assets including property, plant and equipment and intangible assets that any agency owns and/or controls and uses in the delivery of services, as well as capital grants made to other entities. The following definitions are applicable throughout this document:
| • | | capital purchases – property, plant and equipment outlays as per the financial statements excluding asset sales, depreciation and revaluations |
| • | | capital grants – capital grants to other entities and individuals (excluding grants to other government departments and statutory bodies). |
Capital contingency
Consistent with the approach adopted in previous years, a capital contingency reserve has been included. This reserve recognises that while agencies budget to fully use their capital works allocation, circumstances such as project lead-in times, project management constraints, unexpected weather conditions and capacity constraints such as the supply of labour and materials may prevent full usage. On a whole-of-government basis, there is likely to be underspending, resulting in a carry-over of capital allocations.
Estimated jobs supported by capital works
The estimated jobs supported by the Government’s capital works program in 2017-18 is based on Queensland Treasury’s Guidelines for estimating the full-time equivalent (FTE) jobs directly supported by capital works. However, in some cases, jobs estimates quoted for specific projects throughout the Capital Statement and in other Budget papers may reflect other approaches, including proponent’s estimates or project specific information, rather than the methodology in the Queensland Treasury’s Guidelines for estimating FTE jobs.
Estimated overall jobs supported by 2017-18 Budget
The estimated 40,000 jobs (FTEs) directly supported by the Budget, includes the 29,000 direct jobs estimated to be supported by the 2017-18 capital works program and around 11,000 additional jobs supported by key existing and 2017-18 Budget initiatives which have a strong focus on driving private sector growth and employment. Therefore, the estimated 40,000 jobs directly supported are expected to be predominantly in the private sector, but some key Government initiatives and capital works will also likely directly support some local government employment related to specific projects in regional Queensland.
141
Capital Statement 2017-18
| Appendix C: | Capital Purchases by Entity by Region 2017-18 |
| | | | | | | | | | | | | | | | | | | | | | | | |
| | | | | | Brisbane | | | | | | | | | | |
| | | Bris Est | | | Bris Nth | | | Bris Sth | | | Bris Wst | | | Inner Bris | | | Sub Total1 | |
Entity2 | | $‘000 | | | $‘000 | | | $‘000 | | | $‘000 | | | $‘000 | | | $‘000 | |
| | | | | | |
Aboriginal and Torres Strait Islander Partnerships | | | — | | | | — | | | | — | | | | — | | | | 305 | | | | 305 | |
| | | | | | |
Agriculture and Fisheries | | | — | | | | 400 | | | | 1,681 | | | | 450 | | | | 5,780 | | | | 8,311 | |
| | | | | | |
Communities, Child Safety and Disability Services | | | 666 | | | | 2,154 | | | | 1,010 | | | | 539 | | | | 942 | | | | 5,311 | |
| | | | | | |
Education and Training | | | 21,341 | | | | 18,578 | | | | 39,821 | | | | 14,561 | | | | 35,630 | | | | 129,931 | |
| | | | | | |
Electoral Commission of Queensland | | | — | | | | — | | | | — | | | | — | | | | 6,385 | | | | 6,385 | |
| | | | | | |
Energy and Water Supply | | | 12,619 | | | | 106,150 | | | | 123,680 | | | | 63,936 | | | | 321,343 | | | | 627,728 | |
| | | | | | |
Environment and Heritage Protection | | | 321 | | | | 296 | | | | 489 | | | | 260 | | | | 361 | | | | 1,727 | |
| | | | | | |
Fire and Emergency Services | | | 297 | | | | 275 | | | | 453 | | | | 241 | | | | 333 | | | | 1,599 | |
| | | | | | |
Housing and Public Works | | | 15,503 | | | | 16,459 | | | | 29,844 | | | | 15,206 | | | | 9,199 | | | | 86,211 | |
| | | | | | |
Infrastructure, Local Government and Planning | | | — | | | | 878 | | | | 52,957 | | | | — | | | | 153,931 | | | | 207,766 | |
| | | | | | |
Justice and Attorney-General | | | 4,568 | | | | 4,866 | | | | 7,956 | | | | 3,692 | | | | 24,367 | | | | 45,449 | |
| | | | | | |
Legislative Assembly of Queensland | | | — | | | | — | | | | — | | | | — | | | | 7,664 | | | | 7,664 | |
| | | | | | |
National Parks, Sport and Racing | | | 4,188 | | | | 2,954 | | | | 34,881 | | | | 2,300 | | | | 8,306 | | | | 52,629 | |
| | | | | | |
Natural Resources and Mines | | | — | | | | — | | | | 293 | | | | — | | | | 9,973 | | | | 10,266 | |
| | | | | | |
Premier and Cabinet | | | 286 | | | | 266 | | | | 439 | | | | 233 | | | | 25,471 | | | | 26,695 | |
| | | | | | |
Public Safety Business Agency3 | | | 7,397 | | | | 6,827 | | | | 11,265 | | | | 6,030 | | | | 19,882 | | | | 51,401 | |
| | | | | | |
Queensland Health | | | 31,560 | | | | 79,588 | | | | 64,050 | | | | 19,190 | | | | 72,175 | | | | 266,563 | |
| | | | | | |
Queensland Police Service | | | 1,139 | | | | 1,050 | | | | 1,733 | | | | 920 | | | | 1,278 | | | | 6,120 | |
| | | | | | |
Queensland Treasury | | | — | | | | — | | | | — | | | | — | | | | 16,038 | | | | 16,038 | |
| | | | | | |
Science, Information Technology and Innovation | | | — | | | | — | | | | — | | | | — | | | | 22,337 | | | | 22,337 | |
| | | | | | |
State Development | | | 24 | | | | 21 | | | | 35 | | | | 19 | | | | 26 | | | | 125 | |
| | | | | | |
Tourism, Major Events, Small Business and the Commonwealth Games | | | 519 | | | | — | | | | — | | | | — | | | | 12 | | | | 531 | |
| | | | | | |
Transport and Main Roads | | | 54,392 | | | | 279,679 | | | | 83,236 | | | | 33,952 | | | | 143,683 | | | | 594,942 | |
| | | | | | |
Other Agencies4 | | | 271 | | | | 250 | | | | 413 | | | | 219 | | | | 304 | | | | 1,457 | |
| | | | | | |
Anticipated Capital Contingency Reserve and Other Adjustments5 | | | | | | | | | | | | | | | | | | | | | | | | |
| | | | | | |
Funds Allocated | | | 152,827 | | | | 513,092 | | | | 447,607 | | | | 159,387 | | | | 872,799 | | | | 2,145,712 | |
Notes
| 1. | Numbers may not add due to rounding and allocations of adjustments. |
| 2. | Includes all associated statutory bodies. |
| 3. | The Public Safety Business Agency is a capital purchaser for Queensland Fire and Emergency Services, Queensland Police Service and the Office of the Inspector-General Emergency Management. |
| 4. | Includes other Government entities with non-material capital programs. |
| 5. | The Anticipated Capital Contingency Reserve and other adjustments have been spread across statistical areas proportionate to capital spends. |
142
Capital Statement 2017-18
| | | | | | | | | | | | | | | | | | | | | | | | | | | | |
| | | Ipswich | | | Wide Bay | | | Darling Downs | | | | | | Gold Coast | | | Logan | |
| | | | | | | | | D Downs
Maranoa | | | Toowoomba | | | Sub Total1 | | | G Coast | | | Logan
B’desert | |
Entity2 | | $‘000 | | | $‘000 | | | $‘000 | | | $‘000 | | | $‘000 | | | $‘000 | | | $‘000 | |
| | | | | | | |
Aboriginal and Torres Strait Islander Partnerships | | | — | | | | — | | | | — | | | | — | | | | — | | | | — | | | | — | |
| | | | | | | |
Agriculture and Fisheries | | | — | | | | 500 | | | | 1,856 | | | | 4,350 | | | | 6,206 | | | | — | | | | — | |
| | | | | | | |
Communities, Child Safety and Disability Services | | | 2,959 | | | | 2,198 | | | | 590 | | | | 442 | | | | 1,032 | | | | 1,864 | | | | 936 | |
| | | | | | | |
Education and Training | | | 38,039 | | | | 39,605 | | | | 12,965 | | | | 17,107 | | | | 30,072 | | | | 67,960 | | | | 42,989 | |
| | | | | | | |
Electoral Commission of Queensland | | | — | | | | — | | | | — | | | | — | | | | — | | | | — | | | | — | |
| | | | | | | |
Energy and Water Supply | | | 98,505 | | | | 196,459 | | | | 58,720 | | | | 133,906 | | | | 192,626 | | | | 118,636 | | | | 13,755 | |
| | | | | | | |
Environment and Heritage Protection | | | 459 | | | | 401 | | | | 1,821 | | | | 212 | | | | 2,033 | | | | 804 | | | | 452 | |
| | | | | | | |
Fire and Emergency Services | | | 423 | | | | 373 | | | | 166 | | | | 197 | | | | 363 | | | | 743 | | | | 419 | |
| | | | | | | |
Housing and Public Works | | | 15,290 | | | | 10,074 | | | | 3,913 | | | | 7,840 | | | | 11,753 | | | | 24,818 | | | | 15,696 | |
| | | | | | | |
Infrastructure, Local Government and Planning | | | 1,000 | | | | 11,389 | | | | — | | | | — | | | | — | | | | 12,113 | | | | — | |
| | | | | | | |
Justice and Attorney-General | | | 78,179 | | | | 11,019 | | | | 2,541 | | | | 3,132 | | | | 5,673 | | | | 13,238 | | | | 11,933 | |
| | | | | | | |
Legislative Assembly of Queensland | | | — | | | | — | | | | — | | | | — | | | | — | | | | — | | | | — | |
| | | | | | | |
National Parks, Sport and Racing | | | 2,535 | | | | 8,003 | | | | 1,009 | | | | 1,194 | | | | 2,203 | | | | 4,821 | | | | 5,326 | |
| | | | | | | |
Natural Resources and Mines | | | 392 | | | | 293 | | | | 2,276 | | | | 552 | | | | 2,828 | | | | 293 | | | | 195 | |
| | | | | | | |
Premier and Cabinet | | | 412 | | | | 360 | | | | 160 | | | | 190 | | | | 350 | | | | 721 | | | | 406 | |
| | | | | | | |
Public Safety Business Agency3 | | | 17,120 | | | | 22,069 | | | | 7,394 | | | | 6,116 | | | | 13,510 | | | | 18,522 | | | | 11,317 | |
| | | | | | | |
Queensland Health | | | 40,577 | | | | 48,891 | | | | 29,208 | | | | 15,779 | | | | 44,987 | | | | 68,437 | | | | 33,434 | |
| | | | | | | |
Queensland Police Service | | | 1,626 | | | | 1,422 | | | | 633 | | | | 751 | | | | 1,384 | | | | 2,849 | | | | 1,602 | |
| | | | | | | |
Queensland Treasury | | | — | | | | — | | | | — | | | | — | | | | — | | | | — | | | | — | |
| | | | | | | |
Science, Information Technology and Innovation | | | — | | | | — | | | | — | | | | — | | | | — | | | | — | | | | — | |
| | | | | | | |
State Development | | | 33 | | | | 29 | | | | 13 | | | | 15 | | | | 28 | | | | 58 | | | | 33 | |
| | | | | | | |
Tourism, Major Events, Small Business and the Commonwealth Games | | | — | | | | — | | | | — | | | | — | | | | — | | | | 404 | | | | — | |
| | | | | | | |
Transport and Main Roads | | | 514,212 | | | | 191,472 | | | | 486,602 | | | | 52,206 | | | | 538,808 | | | | 447,568 | | | | 93,755 | |
| | | | | | | |
Other Agencies4 | | | 387 | | | | 339 | | | | 151 | | | | 179 | | | | 330 | | | | 679 | | | | 382 | |
| | | | | | | |
Anticipated Capital Contingency Reserve and Other Adjustments5 | | | | | | | | | | | | | | | | | | | | | | | | | | | | |
| | | | | | | |
Funds Allocated | | | 800,296 | | | | 536,944 | | | | 601,116 | | | | 240,605 | | | | 841,721 | | | | 773,079 | | | | 229,235 | |
Notes
| 1. | Numbers may not add due to rounding and allocations of adjustments. |
| 2. | Includes all associated statutory bodies. |
| 3. | The Public Safety Business Agency is a capital purchaser for Queensland Fire and Emergency Services, Queensland Police Service and the Office of the Inspector-General Emergency Management. |
| 4. | Includes other Government entities with non-material capital programs. |
| 5. | The Anticipated Capital Contingency Reserve and other adjustments have been spread across statistical areas proportionate to capital spends. |
143
Capital Statement 2017-18
| | | | | | | | | | | | | | | | | | | | | | | | | | | | | | | | |
| | | Mackay | | | Outback Qld & Far North Qld | | | Fitzroy | | | Sunshine Coast | | | | |
| | | | | | Outback | | | Cairns | | | | | | Sunshine
Coast | | | Moreton B
Nth | | | Moreton B
Sth | | | Sub Total1 | |
Entity2 | | $‘000 | | | $‘000 | | | $‘000 | | | $‘000 | | | $‘000 | | | $‘000 | | | $‘000 | | | $‘000 | |
| | | | | | | | |
Aboriginal and Torres Strait Islander Partnerships | | | — | | | | 6,102 | | | | 51 | | | | — | | | | — | | | | — | | | | — | | | | — | |
| | | | | | | | |
Agriculture and Fisheries | | | 465 | | | | 993 | | | | 880 | | | | 2,842 | | | | 515 | | | | — | | | | — | | | | 515 | |
| | | | | | | | |
Communities, Child Safety and Disability Services | | | 3,846 | | | | 556 | | | | 898 | | | | 683 | | | | 990 | | | | 1,887 | | | | 1,242 | | | | 4,119 | |
| | | | | | | | |
Education and Training | | | 22,344 | | | | 12,436 | | | | 37,501 | | | | 25,928 | | | | 50,086 | | | | 32,432 | | | | 31,880 | | | | 114,398 | |
| | | | | | | | |
Electoral Commission of Queensland | | | — | | | | — | | | | — | | | | — | | | | — | | | | — | | | | — | | | | — | |
| | | | | | | | |
Energy and Water Supply | | | 80,002 | | | | 73,962 | | | | 83,636 | | | | 269,020 | | | | 122,063 | | | | 6,321 | | | | 33,773 | | | | 162,157 | |
| | | | | | | | |
Environment and Heritage Protection | | | 251 | | | | 121 | | | | 340 | | | | 325 | | | | 480 | | | | 332 | | | | 276 | | | | 1,088 | |
| | | | | | | | |
Fire and Emergency Services | | | 234 | | | | 113 | | | | 316 | | | | 303 | | | | 444 | | | | 308 | | | | 254 | | | | 1,006 | |
| | | | | | | | |
Housing and Public Works | | | 9,491 | | | | 24,049 | | | | 138,392 | | | | 14,976 | | | | 16,066 | | | | 17,797 | | | | 5,140 | | | | 39,003 | |
| | | | | | | | |
Infrastructure, Local Government and Planning | | | 500 | | | | 5,749 | | | | 583 | | | | 1,000 | | | | — | | | | — | | | | — | | | | — | |
| | | | | | | | |
Justice and Attorney-General | | | 3,569 | | | | 1,762 | | | | 5,661 | | | | 19,565 | | | | 6,823 | | | | 10,354 | | | | 3,930 | | | | 21,107 | |
| | | | | | | | |
Legislative Assembly of Queensland | | | — | | | | — | | | | — | | | | — | | | | — | | | | — | | | | — | | | | — | |
| | | | | | | | |
National Parks, Sport and Racing | | | 1,427 | | | | 1,982 | | | | 2,879 | | | | 1,848 | | | | 2,676 | | | | 1,857 | | | | 1,516 | | | | 6,049 | |
| | | | | | | | |
Natural Resources and Mines | | | 552 | | | | 553 | | | | 586 | | | | 750 | | | | 195 | | | | 195 | | | | 195 | | | | 585 | |
| | | | | | | | |
Premier and Cabinet | | | 225 | | | | 109 | | | | 305 | | | | 292 | | | | 430 | | | | 298 | | | | 248 | | | | 976 | |
| | | | | | | | |
Public Safety Business Agency3 | | | 21,475 | | | | 15,414 | | | | 22,699 | | | | 11,515 | | | | 11,449 | | | | 13,544 | | | | 6,363 | | | | 31,356 | |
| | | | | | | | |
Queensland Health | | | 30,435 | | | | 43,893 | | | | 47,691 | | | | 44,188 | | | | 118,310 | | | | 46,568 | | | | 20,427 | | | | 185,305 | |
| | | | | | | | |
Queensland Police Service | | | 889 | | | | 429 | | | | 1,204 | | | | 1,152 | | | | 1,700 | | | | 1,176 | | | | 979 | | | | 3,855 | |
| | | | | | | | |
Queensland Treasury | | | — | | | | — | | | | — | | | | — | | | | — | | | | — | | | | — | | | | — | |
| | | | | | | | |
Science, Information Technology and Innovation | | | — | | | | — | | | | — | | | | — | | | | — | | | | — | | | | — | | | | — | |
| | | | | | | | |
State Development | | | 18 | | | | 9 | | | | 25 | | | | 1,149 | | | | 35 | | | | 24 | | | | 20 | | | | 79 | |
| | | | | | | | |
Tourism, Major Events, Small Business and the Commonwealth Games | | | — | | | | — | | | | — | | | | — | | | | — | | | | — | | | | — | | | | — | |
| | | | | | | | |
Transport and Main Roads | | | 217,366 | | | | 148,901 | | | | 114,157 | | | | 237,343 | | | | 236,945 | | | | 55,154 | | | | 47,915 | | | | 340,014 | |
| | | | | | | | |
Other Agencies4 | | | 212 | | | | 102 | | | | 287 | | | | 274 | | | | 405 | | | | 280 | | | | 233 | | | | 918 | |
| | | | | | | | |
Anticipated Capital Contingency Reserve and Other Adjustments5 | | | | | | | | | | | | | | | | | | | | | | | | | | | | | | | | |
| | | | | | | | |
Funds Allocated | | | 387,561 | | | | 332,313 | | | | 451,406 | | | | 623,913 | | | | 561,299 | | | | 185,776 | | | | 152,138 | | | | 899,213 | |
Notes
| 1. | Numbers may not add due to rounding and allocations of adjustments. |
| 2. | Includes all associated statutory bodies. |
| 3. | The Public Safety Business Agency is a capital purchaser for Queensland Fire and Emergency Services, Queensland Police Service and the Office of the Inspector-General Emergency Management. |
| 4. | Includes other Government entities with non-material capital programs. |
| 5. | The Anticipated Capital Contingency Reserve and other adjustments have been spread across statistical areas proportionate to capital spends. |
144
Capital Statement 2017-18
| | | | | | | | |
| | | Townsville | | | Totals1 | |
Entity2 | | $‘000 | | | $‘000 | |
| | |
Aboriginal and Torres Strait Islander Partnerships | | | 51 | | | | 6,509 | |
| | |
Agriculture and Fisheries | | | 415 | | | | 21,127 | |
| | |
Communities, Child Safety and Disability Services | | | 691 | | | | 25,093 | |
| | |
Education and Training | | | 43,402 | | | | 604,605 | |
| | |
Electoral Commission of Queensland | | | — | | | | 6,385 | |
| | |
Energy and Water Supply | | | 146,506 | | | | 2,062,992 | |
| | |
Environment and Heritage Protection | | | 331 | | | | 8,332 | |
| | |
Fire and Emergency Services | | | 308 | | | | 6,200 | |
| | |
Housing and Public Works | | | 56,629 | | | | 446,382 | |
| | |
Infrastructure, Local Government and Planning | | | 7,864 | | | | 247,964 | |
| | |
Justice and Attorney-General | | | 10,051 | | | | 227,206 | |
| | |
Legislative Assembly of Queensland | | | — | | | | 7,664 | |
| | |
National Parks, Sport and Racing | | | 2,031 | | | | 91,733 | |
| | |
Natural Resources and Mines | | | 392 | | | | 17,685 | |
| | |
Premier and Cabinet | | | 297 | | | | 31,148 | |
| | |
Public Safety Business Agency3 | | | 7,629 | | | | 244,027 | |
| | |
Queensland Health | | | 61,724 | | | | 916,125 | |
| | |
Queensland Police Service | | | 1,173 | | | | 23,705 | |
| | |
Queensland Treasury | | | — | | | | 16,038 | |
| | |
Science, Information Technology and Innovation | | | — | | | | 22,337 | |
| | |
State Development | | | 46,024 | | | | 47,610 | |
| | |
Tourism, Major Events, Small Business and the Commonwealth Games | | | — | | | | 935 | |
| | |
Transport and Main Roads | | | 209,100 | | | | 3,647,638 | |
| | |
Other Agencies4 | | | 280 | | | | 5,648 | |
| | |
Anticipated Capital Contingency Reserve and Other Adjustments5 | | | | | | | (127,478 | ) |
| | |
Funds Allocated | | | 586,216 | | | | 8,607,610 | |
Notes
| 1. | Numbers may not add due to rounding and allocations of adjustments. |
| 2. | Includes all associated statutory bodies. |
| 3. | The Public Safety Business Agency is a capital purchaser for Queensland Fire and Emergency Services, Queensland Police Service and the Office of the Inspector-General Emergency Management. |
| 4. | Includes other Government entities with non-material capital programs. |
| 5. | The Anticipated Capital Contingency Reserve and other adjustments have been spread across statistical areas proportionate to capital spends. |
145
Queensland Budget 2017-18 Capital Statement Budget Paper No. 3
Queensland Budget 2017-18
Capital Statement Budget Paper No. 3
Queensland Budget | 2017-18
BUDGET MEASURES
Budget Paper No.4
2017-18 Queensland Budget Papers
1. Budget Speech
2. Budget Strategy and Outlook
3. Capital Statement
4. Budget Measures
5. Service Delivery Statements
Appropriation Bills
Budget Highlights
© Crown copyright
All rights reserved
Queensland Government 2017
Excerpts from this publication may be reproduced, with appropriate
acknowledgement, as permitted under the Copyright Act.
Budget Measures
Budget Paper No.4
ISSN 1445-4890 (Print)
ISSN 1445-4904 (Online)

State Budget
2017-18
Budget Measures
Budget Paper No. 4
Contents
| | | | | | |
| 1 | | Overview | | | 1 | |
| | |
| 1.1 | | Introduction | | | 3 | |
| 1.2 | | Explanation of scope and terms | | | 4 | |
| 1.3 | | Whole-of-Government measures | | | 6 | |
| | |
| 2 | | Expense Measures | | | 25 | |
| | |
| | Department of Aboriginal and Torres Strait Islander Partnerships | | | 26 | |
| | Department of Agriculture and Fisheries | | | 28 | |
| | Department of Communities, Child Safety and Disability Services | | | 33 | |
| | Department of Education and Training | | | 39 | |
| | Department of Energy and Water Supply | | | 42 | |
| | Department of Environment and Heritage Protection | | | 46 | |
| | Department of Housing and Public Works | | | 51 | |
| | Department of Infrastructure, Local Government and Planning | | | 55 | |
| | Department of Justice and Attorney-General | | | 58 | |
| | Department of National Parks, Sport and Racing | | | 63 | |
| | Department of Natural Resources and Mines | | | 65 | |
| | Department of Science, Information Technology and Innovation | | | 67 | |
| | Department of State Development | | | 69 | |
| | Department of the Premier and Cabinet | | | 72 | |
| | Department of Tourism, Major Events, Small Business and the Commonwealth Games | | | 76 | |
| | Department of Transport and Main Roads | | | 78 | |
| | Electoral Commission of Queensland | | | 81 | |
| | Legislative Assembly of Queensland | | | 82 | |
| | Public Safety Business Agency | | | 83 | |
| | Queensland Fire and Emergency Services | | | 84 | |
| | Queensland Health | | | 85 | |
| | Queensland Police Service | | | 88 | |
| | Queensland Treasury | | | 93 | |
| | | | | | |
| | |
| 3 | | Capital Measures | | | 97 | |
| | |
| | Department of Aboriginal and Torres Strait Islander Partnerships | | | 98 | |
| | Department of Education and Training | | | 99 | |
| | Department of Environment and Heritage Protection | | | 101 | |
| | Department of Housing and Public Works | | | 102 | |
| | Department of lnfrastructure, Local Government and Planning | | | 104 | |
| | Department of Justice and Attorney-General | | | 105 | |
| | Department of National Parks, Sport and Racing | | | 108 | |
| | Department of Natural Resources and Mines | | | 109 | |
| | Department of Science, Information Technology and Innovation | | | 111 | |
| | Department of the Premier and Cabinet | | | 112 | |
| | Department of Transport and Main Roads | | | 113 | |
| | Electoral Commission of Queensland | | | 114 | |
| | Legislative Assembly of Queensland | | | 115 | |
| | Public Safety Business Agency | | | 116 | |
| | Queensland Fire and Emergency Services | | | 117 | |
| | Queensland Health | | | 118 | |
| | Queensland Police Service | | | 120 | |
| | Queensland Treasury | | | 121 | |
| | |
| 4 | | Revenue Measures | | | 122 | |
| | |
| | Whole-of-Government | | | 123 | |
| | Department of Justice and Attorney-General | | | 124 | |
| | Department of Natural Resources and Mines | | | 125 | |
| | Queensland Treasury | | | 126 | |
Budget Measures 2017-18
Features
| • | | This Budget Paper presents a consolidation of expense, capital and revenue measures reflecting decisions since the 2016-17 Budget. |
| • | | The suite of measures in the 2017-18 Budget will drive more inclusive economic growth and job creation across the State, including initiatives and investment targeted at regional economies in transition post the resources boom. |
| • | | The Budget will also deliver measures targeted at reducing cost of living pressures on Queensland families, enhancing the safety, security and live ability of Queensland communities and helping to rebuild critical infrastructure and support communities impacted by recent natural disasters. |
| • | | The Government will provide increased funding of $1.952 billion over three years from 2018-19 to the Cross River Rail Delivery Authority to progress the Cross River Rail project. This, in addition to funding previously allocated, brings total funding for the project to$2.812 billion over four years. The $5.409 billion project is the Government’s highest infrastructure priority with significant potential to boost jobs and economic growth, and add value to commercial and residential development sites across the region. |
| • | | The Government is committed to assisting those Queenslanders most in need meet their housing needs and is providing total funding of $1.835 billion over 10 years for a range of housing and homelessness measures. This includes $30 million in 2017-18 to extend the temporary increase (from $15,000 to $20,000) in the Queensland First Home Owners’ Grant. |
| • | | The Powering Queensland Plan is providing one off funding in 2016-17 of $771 million to support the stabilisation of electricity prices for Queensland consumers. This forms part of the Government’s overall commitment of $1.16 billion to ensure affordable, secure and sustainable energy supply for Queensland homes, businesses and industry. |
| • | | The Government will provide increased funding of $728 million in 2020-21 to support the ongoing growth in demand for health and ambulance services. The funding is based on growth in activity of four per cent for public hospital services and cost growth in line with the projected Consumer Price Index (CPI). |
| • | | The Government has provided an additional $950 million from 2016-17 to build fit for purpose learning environments that support educational outcomes and address enrolment growth pressures in Queensland schools. |
| • | | The Government has provided additional funding of $400 million over three years from 2016-17 for the Works for Queensland program, supporting local governments outside South East Queensland that are facing unemployment issues to undertake job-creating maintenance and minor infrastructure works. This funding includes an additional $200 million in this Budget, building on the $200 million announced in the 2016-17 MYFER. |
1
Budget Measures 2017-18
| • | | The Government is providing total funding of $199.6 million over four years to transition 17 year olds from Queensland’s adult justice system to the youth justice system. |
| • | | The Government is providing additional funding of $200 million over four years to further strengthen Queensland’s child protection system. This includes additional funding of $141.8 million approved in the 2017-18 Budget, and a $56.8 million package of initiatives responding to critical issues. |
| • | | The Government has provided additional funding of $120 million over four years from 2016-17 for water, wastewater and solid waste infrastructure in Indigenous communities and to develop options for a long-term infrastructure program in Indigenous communities. |
| • | | The Action on Ice package is a total of $18 million over four years to tackle the harmful use and effects of crystal methamphetamine (Ice) in Queensland, with measures that increase awareness, support families and better equip our frontline service providers. |
| • | | The Government is providing $69.5 million over four years to rollout Specialist Domestic and Family Violence Courts, which includes $40.4 million over four years provided as a whole-of-Government contingency for this measure in the 2016-17 Budget. |
| • | | The Government is providing increased funding of $88.5 million over five years from 2017-18, held centrally, for the Great Barrier Reef Water Quality Program, as part of the Queensland Government’s commitment to the protection of the Great Barrier Reef. This is part of a comprehensive Great Barrier Reef Water Quality Program across several agencies totalling $175 million over five years from 2017-18. |
| • | | In response to heightened unrest and the temporary closure of the school in May 2016, the Government and community combined to work towards achieving sustained calm in Aurukun. Funding of $13.3 million has been allocated to a range of activities to address community safety, provide access to education, strengthen the community and its governance and harness jobs and economic opportunities. |
| • | | The Government is providing additional funding of $39 million for a package of new measures to support a strong and prosperous future for the North West Minerals Province. The package is facilitating continued resources sector development, diversifying the regional economy, creating employment opportunities, and working through partnerships to deliver integrated and appropriate services. This package will be supported by funding provided for the Strategic Resources Exploration Program. |
| • | | The Government has implemented a whole-of-Government reprioritisation program of $175 million over 2017-18 to 2020-21 to contribute to whole-of-Government priorities. |
2
Budget Measures 2017-18
The purpose of this document is to provide a consolidated view of policy decisions with budgetary impacts made by the Government since the 2016-17 Budget.
This document complements other Budget Papers, in particular Budget Paper No. 2 Budget Strategy and Outlook, Budget Paper No. 3 Capital Statement and the Service Delivery Statements.
This paper includes only new policy decisions and does not detail the full amount of additional funding being provided to agencies to deliver services and infrastructure. Other adjustments, including those that are parameter based and where the funding formula remains unchanged, are similarly excluded.
The total funding impact of new measures is summarised in Tables 1.5 to 1.7 at the conclusion of this chapter.
For details on the total funding available to agencies, refer to agencies’ Service Delivery Statements.
3
Budget Measures 2017-18
| 1.2 | Explanation of scope and terms |
The following is a description of the scope and terms applied in this document.
This document includes measures with the following features:
| • | | Sector. Only Queensland General Government sector agencies are included. Measures involving Government-owned corporations or other Public Non-financial Corporations sector agencies are within scope only if the measures are being funded directly by the General Government sector or if there is a flow through effect (for example, Community Service Obligations). |
| • | | Timeframe. Measures based on decisions made by the Government since the 2016-17 Budget. |
| • | | Type. Measures with budgetary impacts, in particular: |
(i) expense and capital measures with service delivery, capital enhancement, grant or subsidy impacts on the community; and
(ii) revenue measures involving a significant change in revenue policy, including changes in the tax rate.
| • | | Initiatives of a technical nature or non-policy based adjustments, such as parameter based funding adjustments, are not included if the formula to calculate these adjustments has not changed, as they do not reflect changes in Government policy. The main focus is on measures reflecting policy decisions that impact directly on the community through service delivery or other means. |
| • | | Materiality. Minor measures or measures with non-significant community impact are not included in this document. |
Tables in this document are presented on a net funding basis.
| • | | Net funding refers to the impact that the funding of the measure has on appropriations from the Consolidated Fund or centrally held funds to the relevant General Government agency. The tables do not include funding directed to the measure from existing agency resources or other sources. |
| • | | Amounts refer to additional funding being provided to agencies for a particular program or project, as a result of Government decisions since the 2016-17 Budget. This may differ to other Budget papers, such as Budget Paper No. 3 Capital Statement, that may refer to total funding. |
| • | | Where a measure involves material expenditure or revenue collections by more than one department, the measure is reported under each department involved. The addition of each individual department’s portion of a particular measure may not equate to the reported total whole-of-Government figure due to the omission of some department’s portions that did not meet Budget Paper 4’s materiality threshold (i.e. $250,000 over five years). |
4
Budget Measures 2017-18
| • | | Amounts included in the tables relating to revenue measures represent the impact of the measure on Government revenue (with a positive amount representing additional revenue). |
| • | | Queensland Health (the Department of Health, the Hospital and Health Services and the Queensland Ambulance Service) are provided with a total annual funding envelope and given the autonomy to allocate these resources to the combination of services which they consider will support the best possible health outcomes for Queenslanders. The 2015-16 Budget provided $2.3 billion to Queensland Health over four years from 2015-16 under these arrangements. An additional $728 million, as identified in Chapter 2 Expense Measures of this paper, will be provided in 2020-21 to continue to support this arrangement. Consequently, funding for new measures is embedded within this annual funding allocation and similarly, Queensland Health are excluded from the whole-of-Government reprioritization measures. |
Tables 1.5 to 1.7 identify expense, capital and revenue measures separately, categorised as follows:
| • | | up to and including 2016-17 Mid-Year Fiscal and Economic Review (MYFER) |
| • | | since the 2016-17 MYFER. |
5
Budget Measures 2017-18
| 1.3 | Whole-of-Government Measures |
The following section presents selected whole-of-Government measures relating to decisions taken since the 2016-17 Budget. This does not represent the full range of whole-of-Government measures since the 2016-17 Budget.
| 1.3.1 | Housing and Homelessness |
Housing is an important foundation for a person to achieve other vital outcomes in life such as good health, quality education and strong employment opportunities. The Government is committed to assist Queenslanders meet their housing needs and is providing total funding of $1.835 billion over 10 years for a range of housing and homelessness measures. This includes $1.806 billion in additional funding and $29.2 million in internal reallocations.
The components of the funding package are:
| • | | $1.795 billion to support delivery of the Queensland Housing Strategy 2017-2027 ($1.766 billion additional funding and $29.2 million internally reallocated) |
| • | | $30 million in 2017-18 to extend the temporary increase (from $15,000 to $20,000) in the Queensland First Home Owners’ Grant |
| • | | $10 million over two years for the Regional Planning Program to support land monitoring and a South East Queensland strategic assessment. |
The Queensland Housing Strategy (QHS) 2017-2027, will be vital to building caring and connected communities and will reshape the way Government delivers housing and homelessness services.
Components of the funding for the QHS over 10 years are:
| • | | $1.2 billion to renew the existing social housing property portfolio |
| • | | $420 million for a housing construction program to boost the supply of social and affordable housing (including $3.5 million to construct two refuges for women and children escaping domestic and family violence) |
| • | | $75 million to progress home ownership in discrete Aboriginal and Torres Strait Islander communities |
| • | | $100 million for reforms to the housing and homelessness service system. |
Funding for the housing construction program will be provided to boost supply of social and affordable housing. The Government is committed to innovative approaches to boost housing supply, including by leveraging partnerships with private industry and local governments, and this funding package allows flexibility in how supply is increased.
6
Budget Measures 2017-18
In addition to the QHS, the Government is funding measures to assist first home buyers and reduce impediments to housing supply. Namely:
| • | | $30 million in 2017-18 to extend the temporary increase in the Queensland First Home Owners’ Grant from $15,000 to $20,000 for a further six months. This will assist first home buyers to enter the housing market. The grant is available for contracts signed between 1 July 2017 and 31 December 2017 for new houses, units or townhouses valued at less than $750,000 |
| • | | $10 million for Regional Planning and Program Implementation to support a land supply monitoring program and to undertake a strategic assessment of the State’s planning and environmental offsets framework for growth areas in South East Queensland. This will assist in minimising environmental impacts and reducing avoidable costs and time delays for development. |
Additional details of funding can be found in the Department of Housing and Public Works, Department of Infrastructure, Local Government and Planning, and Queensland Treasury sections of Chapter 2 Expense Measures, and in the Department of Housing and Public Works section of Chapter 3 Capital Measures.
| Table 1.1 | Housing and Homelessness1 |
| | | | | | | | | | | | | | | | | | | | | | | | |
| | | 2016-17 | | | 2017-18 | | | 2018-19 | | | 2019-20 | | | 2020-21 | | | Total | |
| | | $ million | | | $ million | | | $ million | | | $ million | | | $ million | | | $ million | |
Expense Measures | | | | | | | | | | | | | | | | | | | | | | | | |
| | | | | | |
Queensland First Home Owners’ Grant | | | — | | | | 30.0 | | | | — | | | | — | | | | — | | | | 30.0 | |
Regional Program Planning | | | — | | | | 5.0 | | | | 5.0 | | | | — | | | | — | | | | 10.0 | |
Queensland Housing Strategy 2017-20272 | | | — | | | | 5.5 | | | | 41.5 | | | | 49.1 | | | | 39.3 | | | | 135.4 | |
| | | | | | | | | | | | | | | | | | | | | | | | |
Total Expense Measures | | | — | | | | 40.5 | | | | 46.5 | | | | 49.1 | | | | 39.3 | | | | 175.4 | |
| | | | | | | | | | | | | | | | | | | | | | | | |
| | | | | | |
Capital Measures | | | | | | | | | | | | | | | | | | | | | | | | |
| | | | | | |
Queensland Housing Strategy 2017-20272 | | | — | | | | 174.2 | | | | 199.9 | | | | 175.8 | | | | 176.4 | | | | 726.3 | |
| | | | | | | | | | | | | | | | | | | | | | | | |
Total Capital Measures | | | — | | | | 174.2 | | | | 199.9 | | | | 175.8 | | | | 176.4 | | | | 726.3 | |
| | | | | | | | | | | | | | | | | | | | | | | | |
Notes:
| 1. | Numbers shown are net of reprioritised funding amounts and may not add due to rounding. |
| 2. | The table reflects the total funding package for the Queensland Housing Strategy across the forward estimates. A component of the package has not been allocated to departmental forward estimates and will be held in a central contingency pending market processes. |
| 1.3.2 | Strategic Blueprint for Queensland’s North West Minerals Province |
The Government is providing additional funding of $39 million for a package of new measures to support a strong and prosperous future for the region by facilitating continued resources sector development, diversifying the regional economy and creating employment opportunities, and working through partnerships to deliver integrated and appropriate services.
7
Budget Measures 2017-18
This package will be supported by funding provided for the Strategic Resources Exploration Program.
Further details can be found in the Department of Communities, Child Safety and Disability Services, Department of the Premier and Cabinet, Department of State Development and the Department of Natural Resources and Mines sections of Chapter 2 Expense Measures, and the Department of Natural Resources and Mines section of Chapter 3 Capital Measures.
| 1.3.3 | Queensland Reef Water Quality Program 2017-2022 |
The Government is providing increased funding of $88.5 million over five years from 2017-18, held centrally, for the Great Barrier Reef Water Quality Program, as part of the Queensland Government’s commitment to the protection of the Great Barrier Reef.
This is part of a comprehensive Great Barrier Reef Water Quality Program across several agencies totalling $175 million over five years from 2017-18. It will support the continuation of critical programs to assist working towards the achievement of water quality targets, including Best Practice Management programs, provision of economic support and decision-making tools for agricultural producers, the Paddock to Reef program and the Natural Resource Management Program for Reef Water Quality. This is in addition to the $100 million provided over five years from 2015-16 to address the recommendations arising from the Great Barrier Reef Water Science Taskforce.
The Department of Environment and Heritage Protection, Department of Natural Resources and Mines, Department of Agriculture and Fisheries, Department of Science, Information Technology and Innovation and private sector partners will work in collaboration to deliver the program. Further details can be found in Chapter 2 Expense Measures.
| 1.3.4 | Aurukun Heightened Response |
In response to heightened unrest and the temporary closure of the school in May 2016, the Government and community combined to work towards achieving sustained calm in Aurukun.
Funding of $13.3 million has been allocated to a range of activities to address community safety, provide access to education, strengthen the community and its governance and harness jobs and economic opportunities.
The components of the funding package are detailed in Table 1.2 below.
Further details can be found in the Department of Aboriginal and Torres Strait Islander Partnerships, Department of Communities, Child Safety and Disability Services, Department of Environment and Heritage Protection, Department of Justice and Attorney-General, and the Queensland Police Service sections of Chapter 2 Expense Measures.
8
Budget Measures 2017-18
| Table 1.2 | Aurukun Heightened Response1 |
| | | | | | | | | | | | | | | | | | | | | | | | |
| | | 2016-17 | | | 2017-18 | | | 2018-19 | | | 2019-20 | | | 2020-21 | | | Total | |
| | | $ million | | | $ million | | | $ million | | | $ million | | | $ million | | | $ million | |
Expense Measures | | | | | | | | | | | | | | | | | | | | | | | | |
Aurukun Heightened Response2 | | | 2.6 | | | | 4.0 | | | | 0.4 | | | | 0.4 | | | | 0.4 | | | | 7.8 | |
Youth and adult prisoner reintegration | | | 0.4 | | | | 0.6 | | | | — | | | | — | | | | — | | | | 1.0 | |
Aurukun Youth Strategy | | | 0.1 | | | | 0.1 | | | | — | | | | — | | | | — | | | | 0.2 | |
Junior Ranger Cultural Camp and Pathway to a Ranger Career | | | 0.3 | | | | 0.7 | | | | 0.7 | | | | 0.7 | | | | 0.7 | | | | 2.9 | |
Aurukun Policing Model | | | 0.8 | | | | 0.6 | | | | — | | | | — | | | | — | | | | 1.4 | |
| | | | | | | | | | | | | | | | | | | | | | | | |
Total | | | 4.2 | | | | 5.9 | | | | 1.0 | | | | 1.1 | | | | 1.1 | | | | 13.3 | |
| | | | | | | | | | | | | | | | | | | | | | | | |
Notes:
| 1. | Numbers may not add due to rounding. |
| 2. | Funding provided across a range of initiatives: Three Rivers Community Centre Redevelopment, Adult literacy and numeracy program, youth engagement and on-going community co-ordination. |
| 1.3.5 | Community Service Workers Award Wage Increases |
The Government is providing additional funding of $137.7 million over four years, in recognition of increases to award rates for social and community service employees arising from Fair Work Australia’s 2012 Equal Remuneration Order. The funding will be allocated on a prioritised basis to non-government service providers which support dependent and vulnerable Queenslanders.
Further details can be found in the Department of Communities, Child Safety and Disability Services, Queensland Health, Department of Justice and Attorney-General, and Department of Housing and Public Works sections of Chapter 2 Expense Measures.
| Table 1.3 | Community Service Workers Award Wage Increases1 |
| | | | | | | | | | | | | | | | | | | | |
| | | 2017-18 | | | 2018-19 | | | 2019-20 | | | 2020-21 | | | Total | |
| | | $ million | | | $ million | | | $ million | | | $ million | | | $ million | |
Department of Communities, Child Safety and Disability Services | | | — | | | | 17.5 | | | | 30.4 | | | | 34.5 | | | | 82.4 | |
Department of Justice and Attorney-General | | | 1.0 | | | | 2.6 | | | | 4.2 | | | | 4.9 | | | | 12.7 | |
Department of Housing and Public Works | | | 0.3 | | | | 0.7 | | | | 1.2 | | | | 1.4 | | | | 3.6 | |
Queensland Health | | | 2.2 | | | | 5.9 | | | | 9.7 | | | | 11.2 | | | | 29.0 | |
Total | | | 3.5 | | | | 26.7 | | | | 45.5 | | | | 52.0 | | | | 127.7 | |
Notes:
| 1. | Numbers shown are net of reprioritised funding amounts and may not add due to rounding. |
9
Budget Measures 2017-18
| 1.3.6 | Government Employee Housing |
The Government is providing increased funding of $23 million over two years ($11.5 million in 2017-18 and 2018-19) through contributions from client agencies for critical backlog maintenance of Government Employee Housing stock to address health and safety issues.
The Government is also providing increased funding of $67.4 million over four years to support a $122.9 million capital program to upgrade existing and to build new Government Employee Housing stock.
The Government has also provided additional funding of $22.6 million over three years from 2016-17 for the construction of 24 units of Government Employee Housing accommodation in Aurukun.
Further details can be found in the Department of Housing and Public Works sections of Chapter 2 Expense Measures and Chapter 3 Capital Measures.
| 1.3.7 | Government indexation policy |
The Queensland Government has decided to move to a CPI-based escalation of fees and charges and the penalty unit from 2019-20 that will replace the previous Government’s policy of an indexation rate of 3.5% per annum. From 2019-20 onwards, the CPI is projected to increase by 2.5% per annum, consistent with the mid-point of the Reserve Bank of Australia’s target band. This measure results in a reduction in revenue of $25 million in 2019-20 and $53 million in 2020-21.
This change is expected to reduce the increase in fees and charges subject to the Government indexation policy, including motor vehicle registration fees, transport and traffic fees and the Emergency Management Levy.
10
Budget Measures 2017-18
The Government has implemented a whole-of-Government reprioritisation program of $175 million over 2017-18 to 2020-21 to contribute to whole-of-Government priorities. The allocations for individual departments and agencies are outlined in Table 1.4 below.
Achieving these reprioritisation allocations will be the responsibility of each Minister, and with consideration to the Government’s commitment to public sector employment security. There will be no forced or voluntary redundancy programs in response to reprioritisation measures. Apart from this commitment, Ministers have discretion in how the savings are achieved.
| Table 1.4 | Reprioritisation allocations1 |
| | | | | | | | | | | | | | | | | | | | |
| | | 2017-18 | | | 2018-19 | | | 2019-20 | | | 2020-21 | | | Total | |
| | | $ million | | | $ million | | | $ million | | | $ million | | | $ million | |
Department of Aboriginal and Torres Strait Islander Partnerships | | | (0.1 | ) | | | (0.1 | ) | | | (0.1 | ) | | | (0.1 | ) | | | (0.5 | ) |
Department of Agriculture and Fisheries | | | (0.3 | ) | | | (0.6 | ) | | | (0.5 | ) | | | (0.5 | ) | | | (2.0 | ) |
Department of Communities, Child Safety and Disability Services | | | (0.4 | ) | | | (0.6 | ) | | | (1.5 | ) | | | (1.5 | ) | | | (4.1 | ) |
Department of Education and Training | | | (10.9 | ) | | | (22.0 | ) | | | (22.1 | ) | | | (22.6 | ) | | | (77.7 | ) |
Department of Energy and Water Supply | | | (0.0 | ) | | | (0.1 | ) | | | (0.1 | ) | | | (0.1 | ) | | | (0.3 | ) |
Department of Environment and Heritage Protection | | | (0.2 | ) | | | (0.4 | ) | | | (0.4 | ) | | | (0.3 | ) | | | (1.3 | ) |
Department of Infrastructure, Local Government and Planning | | | (0.1 | ) | | | (0.2 | ) | | | (0.1 | ) | | | (0.1 | ) | | | (0.6 | ) |
Department of Justice and Attorney-General | | | (1.9 | ) | | | (3.9 | ) | | | (3.8 | ) | | | (3.7 | ) | | | (13.3 | ) |
Department of National Parks, Sport and Racing | | | (0.4 | ) | | | (0.7 | ) | | | (0.7 | ) | | | (0.6 | ) | | | (2.4 | ) |
Department of Natural Resources and Mines | | | (0.4 | ) | | | (0.7 | ) | | | (0.6 | ) | | | (0.6 | ) | | | (2.3 | ) |
Department of Science, Information Technology and Innovation | | | (0.4 | ) | | | (0.7 | ) | | | (0.7 | ) | | | (0.7 | ) | | | (2.5 | ) |
Department of State Development | | | (0.2 | ) | | | (0.3 | ) | | | (0.3 | ) | | | (0.3 | ) | | | (1.1 | ) |
Departments of Tourism, Major Events, Small Business and the Commonwealth Games | | | (0.0 | ) | | | (0.0 | ) | | | (0.0 | ) | | | (0.0 | ) | | | (0.2 | ) |
Department of Transport and Main Roads | | | (6.1 | ) | | | (12.5 | ) | | | (12.0 | ) | | | (11.7 | ) | | | (42.4 | ) |
Department of the Premier and Cabinet | | | (0.3 | ) | | | (0.6 | ) | | | (0.5 | ) | | | (0.5 | ) | | | (1.9 | ) |
Legislative Assembly of Queensland | | | (0.0 | ) | | | (0.1 | ) | | | (0.1 | ) | | | (0.1 | ) | | | (0.3 | ) |
Office of the Ombudsman | | | (0.0 | ) | | | (0.0 | ) | | | (0.0 | ) | | | (0.0 | ) | | | (0.1 | ) |
Public Safety Business Agency | | | (0.4 | ) | | | (0.8 | ) | | | (0.8 | ) | | | (0.8 | ) | | | (2.8 | ) |
Public Service Commission | | | (0.0 | ) | | | (0.0 | ) | | | (0.0 | ) | | | (0.0 | ) | | | (0.1 | ) |
Queensland Fire and Emergency Services | | | (0.0 | ) | | | (0.0 | ) | | | (0.0 | ) | | | (0.0 | ) | | | (0.1 | ) |
Queensland Police Service | | | (2.4 | ) | | | (5.0 | ) | | | (4.8 | ) | | | (4.9 | ) | | | (17.0 | ) |
Queensland Treasury | | | (0.4 | ) | | | (0.7 | ) | | | (0.6 | ) | | | (0.6 | ) | | | (2.3 | ) |
Total | | | (25.0 | ) | | | (50.0 | ) | | | (50.0 | ) | | | (50.0 | ) | | | (175.0 | ) |
Notes:
| 1. | Numbers may not add and some appear as zero due to rounding. Numbers may include portfolio totals, including multiple individual agencies. |
11
Budget Measures 2017-18
| Table 1.5: | Expense measures since the 2016-17 Budget |
| | | | | | | | | | | | | | | | | | | | |
| | | 2016-17 | | | 2017-18 | | | 2018-19 | | | 2019-20 | | | 2020-21 | |
Expense measures up to and including MYFER | | $‘000 | | | $‘000 | | | $‘000 | | | $‘000 | | | $‘000 | |
| | | | | |
Department of Aboriginal and Torres Strait Islander Partnerships | | | | | | | | | | | | | | | | | | | | |
Aurukun Heightened Response1 | | | 5,835 | | | | 787 | | | | 412 | | | | 377 | | | | 355 | |
| | | | | | | | | | | | | | | | | | | | |
Portfolio Total | | | 5,835 | | | | 787 | | | | 412 | | | | 377 | | | | 355 | |
| | | | | | | | | | | | | | | | | | | | |
| | | | | |
Department of Agriculture and Fisheries | | | | | | | | | | | | | | | | | | | | |
Drought and Climate Adaptation Program | | | — | | | | 3,105 | | | | 3,310 | | | | 3,205 | | | | 3,205 | |
10 Year Plan for the National Red Imported Fire Ant Eradication Program in South East Queensland | | | 1,875 | | | | — | | | | — | | | | — | | | | — | |
Improving Beef Supply Chains | | | 700 | | | | — | | | | — | | | | — | | | | — | |
Varroa Mite Response | | | 275 | | | | — | | | | — | | | | — | | | | — | |
| | | | | | | | | | | | | | | | | | | | |
Portfolio Total | | | 2,850 | | | | 3,105 | | | | 3,310 | | | | 3,205 | | | | 3,205 | |
| | | | | | | | | | | | | | | | | | | | |
| | | | | |
Department of Communities, Child Safety and Disability Services | | | | | | | | | | | | | | | | | | | | |
Additional Child Safety Workers | | | — | | | | — | | | | — | | | | — | | | | — | |
Foster and Kinship Carer Support through the Non Government Sector | | | 2,000 | | | | 2,000 | | | | — | | | | — | | | | — | |
Aurukun Heightened Response - Aurukun Youth Strategy | | | 111 | | | | 96 | | | | — | | | | — | | | | — | |
Community Aids, Equipment and Assistive Technologies Initiative and the Vehicle Options Subsidy Scheme | | | — | | | | — | | | | — | | | | — | | | | — | |
Escalation of National Disability Insurance Scheme (NDIS) Funding | | | — | | | | — | | | | — | | | | — | | | | 64,300 | |
Extending Existing Drought Relief Arrangements | | | — | | | | — | | | | — | | | | — | | | | — | |
Multi-Agency Service Response to Child Sexual Abuse | | | — | | | | — | | | | — | | | | — | | | | — | |
Replacement of Integrated Client Management System | | | — | | | | — | | | | — | | | | — | | | | — | |
Support Services for Young People with a Disability Leaving School | | | — | | | | — | | | | — | | | | — | | | | — | |
| | | | | | | | | | | | | | | | | | | | |
Portfolio Total | | | 2,111 | | | | 2,096 | | | | — | | | | — | | | | 64,300 | |
| | | | | | | | | | | | | | | | | | | | |
| | | | | |
Department of Education and Training | | | | | | | | | | | | | | | | | | | | |
Southbank Education and Training Precinct (SETP) | | | 22,700 | | | | 25,500 | | | | 19,400 | | | | 22,900 | | | | 16,400 | |
Enhanced First Start Initiative | | | — | | | | 500 | | | | — | | | | — | | | | — | |
| | | | | | | | | | | | | | | | | | | | |
Portfolio Total | | | 22,700 | | | | 26,000 | | | | 19,400 | | | | 22,900 | | | | 16,400 | |
| | | | | | | | | | | | | | | | | | | | |
| | | | | |
Department of Environment and Heritage Protection | | | | | | | | | | | | | | | | | | | | |
Establishment of Queensland CarbonPlus Fund | | | 1,024 | | | | 4,876 | | | | 2,500 | | | | — | | | | — | |
Aurukun Heightened Response - Junior Rangers Cultural Camp and Pathway to a Ranger Career | | | 315 | | | | 655 | | | | 655 | | | | 655 | | | | 655 | |
Underground Coal Gasification - Linc Energy Mine Site1 | | | 3,997 | | | | — | | | | — | | | | — | | | | — | |
| | | | | | | | | | | | | | | | | | | | |
Portfolio Total | | | 5,336 | | | | 5,531 | | | | 3,155 | | | | 655 | | | | 655 | |
| | | | | | | | | | | | | | | | | | | | |
| | | | | |
Department of Housing and Public Works | | | | | | | | | | | | | | | | | | | | |
Community Assistance Fund for Complying with Queensland’s Smoke Alarm Laws | | | 300 | | | | 4,700 | | | | — | | | | — | | | | — | |
Improving Security of Payment for Subcontractors in the Building and Construction Industry | | | 1,700 | | | | — | | | | — | | | | — | | | | — | |
| | | | | | | | | | | | | | | | | | | | |
Portfolio Total | | | 2,000 | | | | 4,700 | | | | — | | | | — | | | | — | |
| | | | | | | | | | | | | | | | | | | | |
12
Budget Measures 2017-18
| | | | | | | | | | | | | | | | | | | | |
| | | 2016-17 | | | 2017-18 | | | 2018-19 | | | 2019-20 | | | 2020-21 | |
Expense measures up to and including MYFER | | $‘000 | | | $‘000 | | | $‘000 | | | $‘000 | | | $‘000 | |
| | | | | |
Department of Infrastructure, Local Government and Planning | | | | | | | | | | | | | | | | | | | | |
Works for Queensland1 | | | 120,000 | | | | 80,000 | | | | — | | | | — | | | | — | |
Cities Transformation Taskforce1 | | | 2,000 | | | | — | | | | — | | | | — | | | | — | |
| | | | | | | | | | | | | | | | | | | | |
Portfolio Total | | | 122,000 | | | | 80,000 | | | | — | | | | — | | | | — | |
| | | | | | | | | | | | | | | | | | | | |
| | | | | |
Department of Justice and Attorney-General | | | | | | | | | | | | | | | | | | | | |
Capricornia Correctional Centre Expansion | | | — | | | | 400 | | | | 400 | | | | 400 | | | | 1,000 | |
Queenland Parole System Review - Immediate Reforms | | | 500 | | | | 39,437 | | | | 47,162 | | | | 49,373 | | | | 52,828 | |
Aurukun Heightened Response - Youth and Adult Prisoner Reintegration | | | 403 | | | | 598 | | | | — | | | | — | | | | — | |
| | | | | | | | | | | | | | | | | | | | |
Portfolio Total | | | 903 | | | | 40,435 | | | | 47,562 | | | | 49,773 | | | | 53,828 | |
| | | | | | | | | | | | | | | | | | | | |
| | | | | |
Department of Natural Resources and Mines | | | | | | | | | | | | | | | | | | | | |
Texas Silver Mine Site1 | | | 3,590 | | | | 2,512 | | | | — | | | | — | | | | — | |
Coal Mine Workers’ Health Scheme | | | 2,457 | | | | 1,280 | | | | — | | | | — | | | | — | |
Linc Energy Mine Site1 | | | 2,072 | | | | — | | | | — | | | | — | | | | — | |
| | | | | | | | | | | | | | | | | | | | |
Portfolio Total | | | 8,119 | | | | 3,792 | | | | — | | | | — | | | | — | |
| | | | | | | | | | | | | | | | | | | | |
| | | | | |
Department of Science, Information Technology and Innovation | | | | | | | | | | | | | | | | | | | | |
One-Stop Shop1 | | | 10,992 | | | | — | | | | — | | | | — | | | | — | |
| | | | | | | | | | | | | | | | | | | | |
Portfolio Total | | | 10,992 | | | | — | | | | — | | | | — | | | | — | |
| | | | | | | | | | | | | | | | | | | | |
| | | | | |
Department of State Development | | | | | | | | | | | | | | | | | | | | |
Made in Queensland | | | 170 | | | | 13,670 | | | | 6,160 | | | | — | | | | — | |
Supporting the Office of the Coordinator-General | | | — | | | | 4,231 | | | | 4,357 | | | | 4,431 | | | | 4,443 | |
Regional Facilitation Teams | | | 375 | | | | 750 | | | | 375 | | | | — | | | | — | |
Jobs and Regional Growth Fund | | | — | | | | — | | | | — | | | | — | | | | — | |
| | | | | | | | | | | | | | | | | | | | |
Portfolio Total | | | 545 | | | | 18,651 | | | | 10,892 | | | | 4,431 | | | | 4,443 | |
| | | | | | | | | | | | | | | | | | | | |
| | | | | |
Department of the Premier and Cabinet | | | | | | | | | | | | | | | | | | | | |
Queensland Museum - State Collection Care and Preservation | | | 850 | | | | 3,150 | | | | 3,150 | | | | 3,150 | | | | 3,150 | |
| | | | | | | | | | | | | | | | | | | | |
Portfolio Total | | | 850 | | | | 3,150 | | | | 3,150 | | | | 3,150 | | | | 3,150 | |
| | | | | | | | | | | | | | | | | | | | |
| | | | | |
Department of Tourism, Major Events, Small Business and the Commonwealth Games | | | | | | | | | | | | | | | | | | | | |
Major Events funding for Tourism and Events Queensland (TEQ)1 | | | 2,300 | | | | 3,575 | | | | — | | | | — | | | | — | |
| | | | | | | | | | | | | | | | | | | | |
Portfolio Total | | | 2,300 | | | | 3,575 | | | | — | | | | — | | | | — | |
| | | | | | | | | | | | | | | | | | | | |
| | | | | |
Department of Transport and Main Roads | | | | | | | | | | | | | | | | | | | | |
Personalised Transport Reforms Industry Adjustment Assistance Package1 | | | 40,000 | | | | 60,270 | | | | — | | | | — | | | | — | |
Maritime Safety Activities | | | 2,315 | | | | 3,388 | | | | 2,456 | | | | 2,527 | | | | 2,604 | |
| | | | | | | | | | | | | | | | | | | | |
Portfolio Total | | | 42,315 | | | | 63,658 | | | | 2,456 | | | | 2,527 | | | | 2,604 | |
| | | | | | | | | | | | | | | | | | | | |
| | | | | |
Electoral Commission of Queensland | | | | | | | | | | | | | | | | | | | | |
Electronic Disclosure System | | | — | | | | — | | | | — | | | | — | | | | — | |
| | | | | | | | | | | | | | | | | | | | |
Portfolio Total | | | — | | | | — | | | | — | | | | — | | | | — | |
| | | | | | | | | | | | | | | | | | | | |
13
Budget Measures 2017-18
| | | | | | | | | | | | | | | | | | | | |
| | | 2016-17 | | | 2017-18 | | | 2018-19 | | | 2019-20 | | | 2020-21 | |
Expense measures up to and including MYFER | | $‘000 | | | $‘000 | | | $‘000 | | | $‘000 | | | $‘000 | |
| | | | | |
Legislative Assembly of Queensland | | | | | | | | | | | | | | | | | | | | |
Broadcast of Proceedings and Members’ Video on Demand Upgrade | | | 73 | | | | — | | | | — | | | | — | | | | — | |
| | | | | | | | | | | | | | | | | | | | |
Portfolio Total | | | 73 | | | | — | | | | — | | | | — | | | | — | |
| | | | | | | | | | | | | | | | | | | | |
| | | | | |
Public Safety Business Agency | | | | | | | | | | | | | | | | | | | | |
Mount Isa Rotary Wing Base Maintenance1 | | | 800 | | | | — | | | | — | | | | — | | | | — | |
| | | | | | | | | | | | | | | | | | | | |
Portfolio Total | | | 800 | | | | — | | | | — | | | | — | | | | — | |
| | | | | | | | | | | | | | | | | | | | |
| | | | | |
Queensland Health | | | | | | | | | | | | | | | | | | | | |
Herston Quarter Program | | | 2,250 | | | | 4,700 | | | | 4,700 | | | | 4,900 | | | | 3,900 | |
| | | | | | | | | | | | | | | | | | | | |
Portfolio Total | | | 2,250 | | | | 4,700 | | | | 4,700 | | | | 4,900 | | | | 3,900 | |
| | | | | | | | | | | | | | | | | | | | |
| | | | | |
Queensland Police Service | | | | | | | | | | | | | | | | | | | | |
Queensland Police Service Certified Agreement 2016 | | | 15,165 | | | | 22,097 | | | | 29,275 | | | | — | | | | — | |
Project Booyah | | | 532 | | | | 1,617 | | | | 1,619 | | | | 1,724 | | | | 1,873 | |
Aurukun Heightened Response - Aurukun Policing Model | | | 854 | | | | 569 | | | | — | | | | — | | | | — | |
Operation Oscar Merchant | | | — | | | | — | | | | — | | | | — | | | | — | |
| | | | | | | | | | | | | | | | | | | | |
Portfolio Total | | | 16,551 | | | | 24,283 | | | | 30,894 | | | | 1,724 | | | | 1,873 | |
| | | | | | | | | | | | | | | | | | | | |
| | | | | |
Queensland Treasury | | | | | | | | | | | | | | | | | | | | |
Jobs and Regional Growth Fund | | | 1,083 | | | | 88,833 | | | | 40,083 | | | | — | | | | — | |
Government partnership with the Mates in Construction program | | | 500 | | | | 500 | | | | — | | | | — | | | | — | |
Regional Facilitation Teams | | | 125 | | | | 250 | | | | 125 | | | | — | | | | — | |
| | | | | | | | | | | | | | | | | | | | |
Portfolio Total | | | 1,708 | | | | 89,583 | | | | 40,208 | | | | — | | | | — | |
| | | | | | | | | | | | | | | | | | | | |
| | | | | |
Total impact on Expense up to and including MYFER | | | 250,238 | | | | 374,046 | | | | 166,139 | | | | 93,642 | | | | 154,713 | |
14
Budget Measures 2017-18
| | | | | | | | | | | | | | | | | | | | |
| | | 2016-17 | | | 2017-18 | | | 2018-19 | | | 2019-20 | | | 2020-21 | |
Expense measures since 2016-17 MYFER | | $‘000 | | | $‘000 | | | $‘000 | | | $‘000 | | | $‘000 | |
| | | | | |
Whole-of-Government | | | | | | | | | | | | | | | | | | | | |
Reprioritisations | | | — | | | | (25,000 | ) | | | (50,000 | ) | | | (50,000 | ) | | | (50,000 | ) |
| | | | | | | | | | | | | | | | | | | | |
Portfolio Total | | | — | | | | (25,000 | ) | | | (50,000 | ) | | | (50,000 | ) | | | (50,000 | ) |
| | | | | | | | | | | | | | | | | | | | |
| | | | | |
Department of Aboriginal and Torres Strait Islander Partnerships | | | | | | | | | | | | | | | | | | | | |
Aurukun Heightened Response2 | | | (3,229 | ) | | | 3,229 | | | | — | | | | — | | | | — | |
Community and Personal Histories Resourcing | | | — | | | | 2,792 | | | | 418 | | | | 418 | | | | 418 | |
Closing the Gap - response to the 2017 Closing the Gap Report | | | — | | | | 1,090 | | | | 2,940 | | | | 1,990 | | | | 1,540 | |
Independent legal advice expenses for Reparations Scheme claimants | | | — | | | | 650 | | | | — | | | | — | | | | — | |
Enhanced Youth Employment Program | | | 150 | | | | 600 | | | | 450 | | | | — | | | | — | |
Efforts to address Youth Sexual Violence and Abuse | | | — | | | | 400 | | | | 400 | | | | 400 | | | | — | |
Cultural Acknowledgement and Promotion | | | — | | | | — | | | | — | | | | — | | | | — | |
| | | | | | | | | | | | | | | | | | | | |
Portfolio Total | | | (3,079 | ) | | | 8,761 | | | | 4,208 | | | | 2,808 | | | | 1,958 | |
| | | | | | | | | | | | | | | | | | | | |
| | | | | |
Department of Agriculture and Fisheries | | | | | | | | | | | | | | | | | | | | |
Fisheries Reform - Implementing Government Commitments | | | — | | | | 6,996 | | | | 6,996 | | | | 6,891 | | | | — | |
Biosecurity Regional Responses | | | 1,304 | | | | 3,930 | | | | — | | | | — | | | | — | |
Biosecurity - Ongoing Panama TR4 Response | | | — | | | | 1,257 | | | | — | | | | — | | | | — | |
Rural Economic Development Package | | | — | | | | 1,200 | | | | 1,450 | | | | 800 | | | | — | |
Queensland Rural and Industry Development Authority (QRIDA) | | | — | | | | 900 | | | | 820 | | | | 820 | | | | 820 | |
Containment of White Spot Disease | | | 17,631 | | | | — | | | | — | | | | — | | | | — | |
Extending Existing Drought Relief Arrangements | | | — | | | | — | | | | — | | | | — | | | | — | |
Queensland Reef Water Quality Program 2017-2022 | | | — | | | | — | | | | — | | | | — | | | | — | |
| | | | | | | | | | | | | | | | | | | | |
Portfolio Total | | | 18,935 | | | | 14,283 | | | | 9,266 | | | | 8,511 | | | | 820 | |
| | | | | | | | | | | | | | | | | | | | |
| | | | | |
Department of Communities, Child Safety and Disability Services | | | | | | | | | | | | | | | | | | | | |
Strengthening Queensland’s Child Protection System | | | — | | | | 32,530 | | | | 52,799 | | | | 55,959 | | | | 57,313 | |
Domestic and Family Violence Response - Specialist Domestic and Family Violence Courts | | | — | | | | 1,462 | | | | 1,462 | | | | 1,462 | | | | 1,462 | |
Domestic and Family Violence Shelters | | | — | | | | — | | | | 1,120 | | | | 1,120 | | | | 1,120 | |
Action on Ice | | | — | | | | 2,460 | | | | 2,460 | | | | 2,460 | | | | — | |
Strategic Blueprint for Queensland’s North West Minerals Province | | | — | | | | 150 | | | | 150 | | | | 150 | | | | 150 | |
Community Services Workers Award Wage Increases | | | — | | | | — | | | | 17,457 | | | | 30,449 | | | | 34,496 | |
| | | | | | | | | | | | | | | | | | | | |
Portfolio Total | | | — | | | | 36,602 | | | | 75,448 | | | | 91,600 | | | | 94,541 | |
| | | | | | | | | | | | | | | | | | | | |
| | | | | |
Department of Education and Training | | | | | | | | | | | | | | | | | | | | |
Maintaining Senior Secondary Curriculum Offerings for Students in the Prep Half Cohort | | | — | | | | 12,435 | | | | 28,399 | | | | 16,048 | | | | — | |
Senior Assessment and Tertiary Entrance System | | | — | | | | 164 | | | | 122 | | | | 200 | | | | — | |
Advancing Teaching and Learning | | | — | | | | — | | | | 68,830 | | | | 40,070 | | | | 41,070 | |
State Contribution Grant (previously the Public Provider Grant) | | | — | | | | — | | | | — | | | | — | | | | — | |
Regional Skills Adjustment Strategy | | | — | | | | 5,000 | | | | 5,000 | | | | — | | | | — | |
Regional Skills Investment Strategy | | | — | | | | — | | | | — | | | | — | | | | — | |
| | | | | | | | | | | | | | | | | | | | |
Portfolio Total | | | — | | | | 17,599 | | | | 102,351 | | | | 56,318 | | | | 41,070 | |
| | | | | | | | | | | | | | | | | | | | |
15
Budget Measures 2017-18
| | | | | | | | | | | | | | | | | | | | |
| | | 2016-17 | | | 2017-18 | | | 2018-19 | | | 2019-20 | | | 2020-21 | |
Expense measures since 2016-17 MYFER | | $‘000 | | | $‘000 | | | $‘000 | | | $‘000 | | | $‘000 | |
| | | | | |
Department of Energy and Water Supply | | | | | | | | | | | | | | | | | | | | |
Community Service Obligation for the Cloncurry Pipeline | | | — | | | | 6,017 | | | | 6,167 | | | | — | | | | — | |
Community Service Obligation Lower Burdekin Water | | | — | | | | 318 | | | | 318 | | | | 318 | | | | 318 | |
National Water Infrastructure Development Fund | | | 2,705 | | | | 12,130 | | | | 4,966 | | | | — | | | | — | |
Powering Queensland Plan | | | — | | | | 10,000 | | | | — | | | | — | | | | — | |
Regional Business Support | | | 2,130 | | | | 7,870 | | | | — | | | | — | | | | — | |
Funding for Community Service Obligation payments for SunWater and Seqwater irrigation water supply services | | | — | | | | 4,900 | | | | 4,200 | | | | — | | | | — | |
Clean Energy Company | | | — | | | | 2,500 | | | | — | | | | — | | | | — | |
Compliance and Regulation of Biofuels Mandate | | | — | | | | 1,280 | | | | 1,312 | | | | 1,345 | | | | — | |
New Bulk Water Infrastructure in Queensland | | | — | | | | 852 | | | | 1,182 | | | | 797 | | | | — | |
Solar for Public Housing | | | 400 | | | | 800 | | | | — | | | | — | | | | — | |
Extending Existing Drought Relief Arrangements | | | 2,100 | | | | — | | | | — | | | | — | | | | — | |
Powering Queensland Plan - Electricity Affordability Package | | | 771,000 | | | | — | | | | — | | | | — | | | | — | |
| | | | | | | | | | | | | | | | | | | | |
Portfolio Total | | | 778,335 | | | | 46,667 | | | | 18,145 | | | | 2,460 | | | | 318 | |
| | | | | | | | | | | | | | | | | | | | |
| | | | | |
Department of Environment and Heritage Protection | | | | | | | | | | | | | | | | | | | | |
Underground Coal Gasification - Linc Energy Mine Site2 | | | — | | | | 13,798 | | | | 3,725 | | | | 3,725 | | | | 3,725 | |
Future of Queensland’s Environmental Regulator | | | — | | | | 6,689 | | | | 3,896 | | | | 1,084 | | | | 409 | |
Queensland Climate Change Strategies | | | — | | | | 5,000 | | | | 5,000 | | | | 5,000 | | | | — | |
Protected Area Outcomes | | | — | | | | 3,194 | | | | — | | | | — | | | | — | |
Implementing Queensland’s Container Refund Scheme & Plastic Bag Ban | | | — | | | | 2,500 | | | | — | | | | — | | | | — | |
Indigenous Land and Sea Rangers - Building Jobs From Country For Country | | | — | | | | 945 | | | | 1,890 | | | | 2,630 | | | | 2,630 | |
Sustainable Businesses Partnership | | | — | | | | 916 | | | | — | | | | — | | | | — | |
Advancing Queensland’s Waste Reform Agenda | | | — | | | | — | | | | — | | | | — | | | | — | |
Coordinated Per- and Poly-fluroalkyl Substances (PFAS) Contamination Management | | | — | | | | — | | | | — | | | | — | | | | — | |
Mine Rehabilitation Reform | | | — | | | | — | | | | — | | | | — | | | | — | |
Queensland Reef Water Quality Program 2017-2022 | | | — | | | | — | | | | — | | | | — | | | | — | |
| | | | | | | | | | | | | | | | | | | | |
Portfolio Total | | | — | | | | 33,042 | | | | 14,511 | | | | 12,439 | | | | 6,764 | |
| | | | | | | | | | | | | | | | | | | | |
| | | | | |
Department of Housing and Public Works | | | | | | | | | | | | | | | | | | | | |
Queensland Housing Strategy | | | — | | | | 5,492 | | | | 41,538 | | | | 42,142 | | | | 32,337 | |
National Partnership Agreement on Homelessness | | | — | | | | 29,424 | | | | — | | | | — | | | | — | |
Government Employee Housing | | | — | | | | 11,500 | | | | 11,500 | | | | — | | | | — | |
Community Service Workers Award Wage Increases | | | — | | | | 959 | | | | 2,592 | | | | 4,249 | | | | 4,896 | |
Cairns Convention Centre Expansion | | | — | | | | — | | | | — | | | | — | | | | — | |
Gold Coast Convention and Exhibition Centre development proposal | | | — | | | | — | | | | — | | | | — | | | | — | |
Household Disaster Resilience | | | — | | | | — | | | | — | | | | — | | | | — | |
Re-establishment of the Drug Court | | | — | | | | — | | | | — | | | | — | | | | — | |
Restoration and Upgrade of Old Museum Building | | | — | | | | — | | | | — | | | | — | | | | — | |
| | | | | | | | | | | | | | | | | | | | |
Portfolio Total | | | — | | | | 47,375 | | | | 55,630 | | | | 46,391 | | | | 37,233 | |
| | | | | | | | | | | | | | | | | | | | |
16
Budget Measures 2017-18
| | | | | | | | | | | | | | | | | | | | |
| | | 2016-17 | | | 2017-18 | | | 2018-19 | | | 2019-20 | | | 2020-21 | |
Expense measures since 2016-17 MYFER | | $‘000 | | | $‘000 | | | $‘000 | | | $‘000 | | | $‘000 | |
| | | | | |
Department of Infrastructure, Local Government and Planning | | | | | | | | | | | | | | | | | | | | |
Works for Queensland2 | | | — | | | | 100,000 | | | | 100,000 | | | | — | | | | — | |
Indigenous Water Infrastructure Program | | | 30,000 | �� | | | 30,000 | | | | 30,000 | | | | 30,000 | | | | — | |
Cross River Rail Delivery Authority Operating Budget | | | — | | | | 20,000 | | | | — | | | | — | | | | — | |
Maturing the Infrastructure Pipeline Stage 2 | | | — | | | | 10,000 | | | | — | | | | — | | | | — | |
Townsville Water Security Measures | | | — | | | | 10,000 | | | | 15,000 | | | | 100,000 | | | | 100,000 | |
Regional Planning Program | | | — | | | | 5,000 | | | | 5,000 | | | | — | | | | — | |
State Government Financial Aid | | | — | | | | 3,370 | | | | 3,454 | | | | 3,540 | | | | 3,628 | |
Cities Transformation Taskforce2 | | | — | | | | 2,988 | | | | 1,914 | | | | 1,963 | | | | 1,971 | |
Fluoridation Infrastructure Grants Program | | | — | | | | 2,500 | | | | 2,500 | | | | — | | | | — | |
Disaster Resilience | | | — | | | | — | | | | — | | | | — | | | | — | |
State Assessment Referral Agency | | | — | | | | — | | | | — | | | | 8,000 | | | | 8,000 | |
| | | | | | | | | | | | | | | | | | | | |
Portfolio Total | | | 30,000 | | | | 183,858 | | | | 157,868 | | | | 143,503 | | | | 113,599 | |
| | | | | | | | | | | | | | | | | | | | |
| | | | | |
Department of Justice and Attorney-General | | | | | | | | | | | | | | | | | | | | |
Expansion of Prison Infrastructure for Women Prisoners | | | — | | | | 457 | | | | 2,104 | | | | 4,333 | | | | 4,484 | |
Transition of 17 year olds to the Youth Justice System | | | — | | | | 38,051 | | | | 42,597 | | | | 43,764 | | | | 44,823 | |
Domestic and Family Violence Response - Specialist Domestic and Family Violence Courts | | | — | | | | 10,183 | | | | 7,718 | | | | 8,689 | | | | 8,530 | |
Youth Detention in Queensland | | | — | | | | 6,214 | | | | 6,509 | | | | 6,670 | | | | 6,834 | |
Blue Card Efficiency Savings | | | — | | | | 5,000 | | | | — | | | | — | | | | — | |
Re-establishment of the Drug Court | | | — | | | | 3,988 | | | | 5,225 | | | | 6,448 | | | | 6,527 | |
Community Youth Response - Townsville | | | — | | | | 3,151 | | | | 3,617 | | | | — | | | | — | |
Coroners Court of Queensland Demand Pressures | | | — | | | | 331 | | | | — | | | | — | | | | — | |
Community Services Workers Award Wage Increases | | | — | | | | 268 | | | | 724 | | | | 1,186 | | | | 1,366 | |
Office of the Director of Public Prosecutions - Confiscations Unit | | | — | | | | 255 | | | | 489 | | | | 501 | | | | 514 | |
| | | | | | | | | | | | | | | | | | | | |
Portfolio Total | | | — | | | | 67,898 | | | | 68,983 | | | | 71,591 | | | | 73,078 | |
| | | | | | | | | | | | | | | | | | | | |
| | | | | |
Department of National Parks, Sport and Racing | | | | | | | | | | | | | | | | | | | | |
Funding to prepare and scuttle ex-HMAS Tobruk | | | 1,500 | | | | 6,000 | | | | 500 | | | | — | | | | — | |
Stadiums Queensland | | | — | | | | 4,973 | | | | 5,085 | | | | 5,200 | | | | 5,316 | |
Revitalising National Parks | | | — | | | | 2,500 | | | | 2,500 | | | | — | | | | — | |
Female Friendly Facilities Program | | | — | | | | 2,000 | | | | — | | | | — | | | | — | |
Great Barrier Reef Joint Field Management Program | | | — | | | | — | | | | 429 | | | | 437 | | | | 446 | |
Queensland State Netball Centre | | | 4,000 | | | | — | | | | — | | | | — | | | | — | |
| | | | | | | | | | | | | | | | | | | | |
Portfolio Total | | | 5,500 | | | | 15,473 | | | | 8,514 | | | | 5,637 | | | | 5,762 | |
| | | | | | | | | | | | | | | | | | | | |
| | | | | |
Department of Natural Resources and Mines | | | | | | | | | | | | | | | | | | | | |
Texas Silver Mine Site2 | | | (2,000 | ) | | | 4,990 | | | | — | | | | — | | | | — | |
Strategic Resources Exploration Program | | | — | | | | 3,500 | | | | 7,000 | | | | 7,000 | | | | 2,500 | |
Linc Energy Mine Site2 | | | — | | | | 743 | | | | 795 | | | | 827 | | | | 864 | |
Natural Resources Investment Program | | | — | | | | — | | | | 10,000 | | | | 10,506 | | | | 10,769 | |
Queensland Reef Water Quality Program 2017-2022 | | | — | | | | — | | | | — | | | | — | | | | — | |
| | | | | | | | | | | | | | | | | | | | |
Portfolio Total | | | (2,000 | ) | | | 9,233 | | | | 17,795 | | | | 18,333 | | | | 14,133 | |
| | | | | | | | | | | | | | | | | | | | |
17
Budget Measures 2017-18
| | | | | | | | | | | | | | | | | | | | |
| | | 2016-17 | | | 2017-18 | | | 2018-19 | | | 2019-20 | | | 2020-21 | |
Expense measures since 2016-17 MYFER | | $‘000 | | | $‘000 | | | $‘000 | | | $‘000 | | | $‘000 | |
| | | | | |
Department of Science, Information Technology and Innovation | | | | | | | | | | | | | | | | | | | | |
One-Stop Shop2 | | | — | | | | 20,000 | | | | — | | | | — | | | | — | |
Digital Archive Program - Phase 1 | | | — | | | | 5,016 | | | | 7,685 | | | | — | | | | — | |
Science ICT Remediation and Renewal Program - Phase 1 | | | — | | | | 3,300 | | | | — | | | | — | | | | — | |
Open Data Policy and Action Plan | | | — | | | | 543 | | | | 509 | | | | — | | | | — | |
Advance Queensland - Ignite Ideas Fund | | | — | | | | — | | | | — | | | | — | | | | — | |
Queensland Reef Water Quality Program 2017-2022 | | | — | | | | — | | | | — | | | | — | | | | — | |
| | | | | | | | | | | | | | | | | | | | |
Portfolio Total | | | — | | | | 28,859 | | | | 8,194 | | | | — | | | | — | |
| | | | | | | | | | | | | | | | | | | | |
| | | | | |
Department of State Development | | | | | | | | | | | | | | | | | | | | |
Supporting Major State Development Projects | | | — | | | | 11,477 | | | | 13,142 | | | | (1,250 | ) | | | (1,250 | ) |
Advance Queensland - 10-year Priority Industry Roadmaps and Action Plans | | | — | | | | 3,000 | | | | 4,000 | | | | 4,000 | | | | 4,000 | |
Strategic Blueprint for Queensland’s North West Minerals Province | | | — | | | | 320 | | | | 320 | | | | 320 | | | | 320 | |
| | | | | | | | | | | | | | | | | | | | |
Portfolio Total | | | — | | | | 14,797 | | | | 17,462 | | | | 3,070 | | | | 3,070 | |
| | | | | | | | | | | | | | | | | | | | |
| | | | | |
Department of the Premier and Cabinet | | | | | | | | | | | | | | | | | | | | |
Queensland Museum - Sciencentre Transformation | | | 5,000 | | | | 4,360 | | | | — | | | | — | | | | — | |
Action On Ice | | | — | | | | 3,150 | | | | — | | | | — | | | | — | |
Indigenous Performance | | | — | | | | 2,050 | | | | — | | | | — | | | | — | |
Investing in Regional Arts | | | — | | | | 2,000 | | | | 1,500 | | | | 1,500 | | | | 1,500 | |
Rockhampton Art Gallery | | | — | | | | 2,000 | | | | — | | | | — | | | | — | |
Building Social Cohesion | | | — | | | | 1,964 | | | | 1,814 | | | | 1,814 | | | | 1,814 | |
Queensland Family and Child Commission - Responsive Child Protection System | | | — | | | | 700 | | | | 114 | | | | 114 | | | | 114 | |
Domestic and Family Violence Response - Evaluation Framework | | | — | | | | 611 | | | | 781 | | | | 381 | | | | 366 | |
Strategic Blueprint for Queensland’s North West Minerals Province | | | — | | | | — | | | | — | | | | — | | | | — | |
| | | | | | | | | | | | | | | | | | | | |
Portfolio Total | | | 5,000 | | | | 16,835 | | | | 4,209 | | | | 3,809 | | | | 3,794 | |
| | | | | | | | | | | | | | | | | | | | |
| | | | | |
Department of Tourism, Major Events, Small Business and the Commonwealth Games | | | | | | | | | | | | | | | | | | | | |
Major Events funding for Tourism and Events Queensland (TEQ)2 | | | 3,100 | | | | 1,200 | | | | — | | | | — | | | | — | |
Continuation of the funding guarantee for Tourism and Events Queensland (TEQ) | | | — | | | | — | | | | — | | | | — | | | | 47,052 | |
Tourism and Small Business Recovery Package | | | — | | | | 12,200 | | | | — | | | | — | | | | — | |
Young Tourism Leaders Network | | | 75 | | | | 150 | | | | 75 | | | | — | | | | — | |
Cyclone Recovery Marketing Program | | | 1,500 | | | | — | | | | — | | | | — | | | | — | |
| | | | | | | | | | | | | | | | | | | | |
Portfolio Total | | | 4,675 | | | | 13,550 | | | | 75 | | | | — | | | | 47,052 | |
| | | | | | | | | | | | | | | | | | | | |
| | | | | |
Department of Transport and Main Roads | | | | | | | | | | | | | | | | | | | | |
Rail Transport Services | | | — | | | | 51,024 | | | | 51,266 | | | | 53,333 | | | | 55,465 | |
Transport Service Contract | | | — | | | | 25,000 | | | | — | | | | — | | | | — | |
Continuation of the Local Fare Scheme and a Trial Period for the Western Cape and Gulf | | | — | | | | 6,034 | | | | 4,233 | | | | — | | | | — | |
CityTrain Response Unit | | | 3,517 | | | | 3,704 | | | | 1,540 | | | | — | | | | — | |
18
Budget Measures 2017-18
| | | | | | | | | | | | | | | | | | | | |
| | | 2016-17 | | | 2017-18 | | | 2018-19 | | | 2019-20 | | | 2020-21 | |
Expense measures since 2016-17 MYFER | | $‘000 | | | $‘000 | | | $‘000 | | | $‘000 | | | $‘000 | |
| | | | | |
Gold Coast Waterways Authority | | | — | | | | 1,980 | | | | 1,980 | | | | 1,980 | | | | 1,980 | |
Personalised Transport Reforms Industry Adjustment Assistance Package2 | | | — | | | | 1,500 | | | | — | | | | — | | | | — | |
Mornington Island Runway | | | 4,500 | | | | — | | | | — | | | | — | | | | — | |
| | | | | | | | | | | | | | | | | | | | |
Portfolio Total | | | 8,017 | | | | 89,242 | | | | 59,019 | | | | 55,313 | | | | 57,445 | |
| | | | | | | | | | | | | | | | | | | | |
| | | | | |
Electoral Commission of Queensland | | | | | | | | | | | | | | | | | | | | |
Redistribution Information Letter | | | — | | | | 1,250 | | | | — | | | | — | | | | — | |
SEMS Replacement Project | | | — | | | | — | | | | — | | | | — | | | | — | |
| | | | | | | | | | | | | | | | | | | | |
Portfolio Total | | | — | | | | 1,250 | | | | — | | | | — | | | | — | |
| | | | | | | | | | | | | | | | | | | | |
| | | | | |
Legislative Assembly of Queensland | | | | | | | | | | | | | | | | | | | | |
Coal Workers’ Pneumoconiosis Select Committee | | | 520 | | | | — | | | | — | | | | — | | | | — | |
| | | | | | | | | | | | | | | | | | | | |
Portfolio Total | | | 520 | | | | — | | | | — | | | | — | | | | — | |
| | | | | | | | | | | | | | | | | | | | |
| | | | | |
Public Safety Business Agency | | | | | | | | | | | | | | | | | | | | |
Queensland Government Air Aircraft Maintenance and Compliance | | | — | | | | 3,267 | | | | — | | | | — | | | | — | |
Mount Isa Rotary Wing Base Maintenance2 | | | — | | | | 2,400 | | | | — | | | | — | | | | — | |
| | | | | | | | | | | | | | | | | | | | |
Portfolio Total | | | — | | | | 5,667 | | | | — | | | | — | | | | — | |
| | | | | | | | | | | | | | | | | | | | |
| | | | | |
Queensland Fire and Emergency Services | | | | | | | | | | | | | | | | | | | | |
Queensland Fire and Emergency Service Certified Agreement 2016 | | | 2,366 | | | | 4,362 | | | | 4,989 | | | | — | | | | — | |
| | | | | | | | | | | | | | | | | | | | |
Portfolio Total | | | 2,366 | | | | 4,362 | | | | 4,989 | | | | — | | | | — | |
| | | | | | | | | | | | | | | | | | | | |
| | | | | |
Queensland Health | | | | | | | | | | | | | | | | | | | | |
Queensland Parole System Review - Immediate Reforms | | | — | | | | 3,000 | | | | 3,000 | | | | 3,000 | | | | 3,000 | |
Community Services Workers Award Wage Increases | | | — | | | | 2,185 | | | | 5,925 | | | | 9,749 | | | | 11,246 | |
Transition of 17 Year Olds to the Youth Justice System | | | — | | | | 1,500 | | | | 1,500 | | | | 1,500 | | | | 1,500 | |
Action on Ice | | | — | | | | — | | | | — | | | | — | | | | — | |
Operational Growth Funding | | | — | | | | — | | | | — | | | | — | | | | 728,000 | |
Re-establishment of the Drug Court | | | — | | | | — | | | | — | | | | — | | | | — | |
| | | | | | | | | | | | | | | | | | | | |
Portfolio Total | | | — | | | | 6,685 | | | | 10,425 | | | | 14,249 | | | | 743,746 | |
| | | | | | | | | | | | | | | | | | | | |
| | | | | |
Queensland Police Service | | | | | | | | | | | | | | | | | | | | |
Police for Counter Terrorism, Rapid Action and Patrols Group and other priority areas | | | — | | | | 6,253 | | | | 8,481 | | | | 8,688 | | | | 8,899 | |
Camera Detected Offence Program | | | — | | | | 2,455 | | | | 3,338 | | | | 4,219 | | | | 4,802 | |
Domestic and Family Violence Response - Specialist Domestic and Family Violence Courts | | | — | | | | 1,734 | | | | 1,811 | | | | 2,455 | | | | 2,524 | |
Transition of 17 year olds to the Youth Justice System | | | — | | | | 1,500 | | | | 2,000 | | | | 2,000 | | | | 2,000 | |
Action on Ice - Roadside Drug Testing Program | | | — | | | | 972 | | | | 969 | | | | 1,096 | | | | 1,045 | |
Community Youth Response - Townsville | | | — | | | | 249 | | | | 283 | | | | — | | | | — | |
Additional Civilian Prosecutors | | | — | | | | — | | | | — | | | | — | | | | — | |
Re-Establishment of the Drug Court | | | — | | | | — | | | | — | | | | — | | | | — | |
| | | | | | | | | | | | | | | | | | | | |
Portfolio Total | | | — | | | | 13,163 | | | | 16,882 | | | | 18,458 | | | | 19,270 | |
| | | | | | | | | | | | | | | | | | | | |
19
Budget Measures 2017-18
| | | | | | | | | | | | | | | | | | | | |
| | | 2016-17 | | | 2017-18 | | | 2018-19 | | | 2019-20 | | | 2020-21 | |
Expense measures since 2016-17 MYFER | | $‘000 | | | $‘000 | | | $‘000 | | | $‘000 | | | $‘000 | |
| | | | | |
Queensland Treasury | | | | | | | | | | | | | | | | | | | | |
Back to Work - Regional Employment Package | | | — | | | | 50,000 | | | | — | | | | — | | | | — | |
Back to Work - South East Queensland | | | 51 | | | | 13,977 | | | | 13,490 | | | | — | | | | — | |
Queensland First Home Owners’ Grant | | | — | | | | 30,000 | | | | — | | | | — | | | | — | |
Office of State Revenue - Transformation Program | | | — | | | | 8,731 | | | | 14,269 | | | | 11,850 | | | | 7,941 | |
Queensland Trade and Investment Strategy 2017-2022 | | | 1,302 | | | | 9,711 | | | | 8,273 | | | | 7,949 | | | | 7,762 | |
Financial Assurance Framework Reform | | | — | | | | — | | | | — | | | | — | | | | — | |
Social Benefit Bonds | | | — | | | | — | | | | — | | | | — | | | | — | |
| | | | | | | | | | | | | | | | | | | | |
Portfolio Total | | | 1,353 | | | | 112,419 | | | | 36,032 | | | | 19,799 | | | | 15,703 | |
| | | | | | | | | | | | | | | | | | | | |
| | | | | |
Total impact on Expense since 2016-17 MYFER | | | 849,622 | | | | 762,620 | | | | 640,006 | | | | 524,289 | | | | 1,229,356 | |
| | | | | |
Total impact on Expense since the 2016-17 Budget | | | 1,099,860 | | | | 1,136,666 | | | | 806,145 | | | | 617,931 | | | | 1,384,069 | |
| | | | | |
Less Australian Government funding | | | 3,705 | | | | 45,554 | | | | 4,966 | | | | — | | | | — | |
| | | | | |
Net of Measures funded by Australian Government | | | 1,096,155 | | | | 1,091,112 | | | | 801,179 | | | | 617,931 | | | | 1,384,069 | |
| 1. | Further funding for this measure can be found in the Post Mid-Year Fiscal and Economic Review section of this table. |
| 2. | Further funding for this measure can be found in the Mid-Year Fiscal and Economic Review section of this table. |
20
Budget Measures 2017-18
| Table 1.6: | Capital measures since the 2016-17 Budget |
| | | | | | | | | | | | | | | | | | | | |
Capital measures up to and including MYFER | | 2016-17
$‘000 | | | 2017-18
$‘000 | | | 2018-19
$‘000 | | | 2019-20
$‘000 | | | 2020-21
$‘000 | |
| | | | | |
Department of Housing and Public Works | | | | | | | | | | | | | | | | | | | | |
Construction of Government Employee Housing in Aurukun | | | 1,280 | | | | 11,811 | | | | 9,509 | | | | — | | | | — | |
| | | | | | | | | | | | | | | | | | | | |
Portfolio Total | | | 1,280 | | | | 11,811 | | | | 9,509 | | | | — | | | | — | |
| | | | | | | | | | | | | | | | | | | | |
| | | | | |
Department of Justice and Attorney-General | | | | | | | | | | | | | | | | | | | | |
Capricornia Correctional Centre Expansion | | | — | | | | 7,500 | | | | 21,000 | | | | 47,000 | | | | 110,000 | |
Queensland Parole System Review - Immediate Reforms | | | 1,000 | | | | — | | | | — | | | | — | | | | — | |
| | | | | | | | | | | | | | | | | | | | |
Portfolio Total | | | 1,000 | | | | 7,500 | | | | 21,000 | | | | 47,000 | | | | 110,000 | |
| | | | | | | | | | | | | | | | | | | | |
| | | | | |
Department of Natural Resources and Mines | | | | | | | | | | | | | | | | | | | | |
Texas Silver Mine Site | | | 400 | | | | 1,600 | | | | — | | | | — | | | | — | |
| | | | | | | | | | | | | | | | | | | | |
Portfolio Total | | | 400 | | | | 1,600 | | | | — | | | | — | | | | — | |
| | | | | | | | | | | | | | | | | | | | |
| | | | | |
Department of Transport and Main Roads | | | | | | | | | | | | | | | | | | | | |
Ferny Grove Station Precinct TOD Project | | | — | | | | 1,200 | | | | 3,600 | | | | 4,200 | | | | — | |
| | | | | | | | | | | | | | | | | | | | |
Portfolio Total | | | — | | | | 1,200 | | | | 3,600 | | | | 4,200 | | | | — | |
| | | | | | | | | | | | | | | | | | | | |
| | | | | |
Electoral Commission of Queensland | | | | | | | | | | | | | | | | | | | | |
Electronic Disclosure System | | | 2,700 | | | | — | | | | — | | | | — | | | | — | |
| | | | | | | | | | | | | | | | | | | | |
Portfolio Total | | | 2,700 | | | | — | | | | — | | | | — | | | | — | |
| | | | | | | | | | | | | | | | | | | | |
| | | | | |
Legislative Assembly of Queensland | | | | | | | | | | | | | | | | | | | | |
Broadcast of Proceedings and Members’ Video on Demand Upgrade | | | 439 | | | | — | | | | — | | | | — | | | | — | |
Parliamentary Annexe Lift Upgrade Program | | | 885 | | | | — | | | | — | | | | — | | | | — | |
| | | | | | | | | | | | | | | | | | | | |
Portfolio Total | | | 1,324 | | | | — | | | | — | | | | — | | | | — | |
| | | | | | | | | | | | | | | | | | | | |
| | | | | |
Public Safety Business Agency | | | | | | | | | | | | | | | | | | | | |
Queensland Government Air Aircraft Maintenance and Compliance1 | | | 6,010 | | | | — | | | | — | | | | — | | | | — | |
| | | | | | | | | | | | | | | | | | | | |
Portfolio Total | | | 6,010 | | | | — | | | | — | | | | — | | | | �� | |
| | | | | | | | | | | | | | | | | | | | |
| | | | | |
Total impact on Capital up to and including MYFER | | | 12,714 | | | | 22,111 | | | | 34,109 | | | | 51,200 | | | | 110,000 | |
21
Budget Measures 2017-18
| | | | | | | | | | | | | | | | | | | | |
Capital measures since 2016-17 MYFER | | 2016-17
$‘000 | | | 2017-18
$‘000 | | | 2018-19
$‘000 | | | 2019-20
$‘000 | | | 2020-21
$‘000 | |
| | | | | |
Department of Aboriginal and Torres Strait Islander Partnerships | | | | | | | | | | | | | | | | | | | | |
Cape York Peninsula Tenure Resolution Program | | | — | | | | 3,000 | | | | — | | | | — | | | | — | |
| | | | | | | | | | | | | | | | | | | | |
Portfolio Total | | | — | | | | 3,000 | | | | — | | | | — | | | | — | |
| | | | | | | | | | | | | | | | | | | | |
| | | | | |
Department of Education and Training | | | | | | | | | | | | | | | | | | | | |
Advancing Queensland Schools Program | | | 85,650 | | | | 129,560 | | | | (15,210 | ) | | | — | | | | — | |
Building Future Schools Fund | | | — | | | | 28,000 | | | | 75,000 | | | | 115,000 | | | | 100,000 | |
Adolescent Mental Health Facilities | | | — | | | | — | | | | — | | | | — | | | | — | |
Six Full Cohorts - 2020 Ready | | | — | | | | — | | | | 150,000 | | | | 100,000 | | | | — | |
| | | | | | | | | | | | | | | | | | | | |
Portfolio Total | | | 85,650 | | | | 157,560 | | | | 209,790 | | | | 215,000 | | | | 100,000 | |
| | | | | | | | | | | | | | | | | | | | |
| | | | | |
Department of Environment and Heritage Protection | | | | | | | | | | | | | | | | | | | | |
Future of Queensland’s Environmental Regulator | | | — | | | | 2,046 | | | | — | | | | — | | | | — | |
Underground Coal Gasification - Linc Energy Mine Site | | | — | | | | 1,642 | | | | — | | | | — | | | | — | |
| | | | | | | | | | | | | | | | | | | | |
Portfolio Total | | | — | | | | 3,688 | | | | — | | | | — | | | | — | |
| | | | | | | | | | | | | | | | | | | | |
| | | | | |
Department of Housing and Public Works | | | | | | | | | | | | | | | | | | | | |
Queensland Housing Strategy | | | — | | | | 149,250 | | | | 174,859 | | | | 175,825 | | | | 176,420 | |
Government Employee Housing | | | — | | | | 18,505 | | | | 22,908 | | | | 10,449 | | | | 15,558 | |
Cairns Convention Centre Expansion | | | — | | | | — | | | | 88,000 | | | | 88,000 | | | | — | |
| | | | | | | | | | | | | | | | | | | | |
Portfolio Total | | | — | | | | 167,755 | | | | 285,767 | | | | 274,274 | | | | 191,978 | |
| | | | | | | | | | | | | | | | | | | | |
| | | | | |
Department of Infrastructure, Local Government and Planning | | | | | | | | | | | | | | | | | | | | |
Cross River Rail | | | — | | | | — | | | | 62,000 | | | | 1,061,000 | | | | 829,000 | |
| | | | | | | | | | | | | | | | | | | | |
Portfolio Total | | | — | | | | — | | | | 62,000 | | | | 1,061,000 | | | | 829,000 | |
| | | | | | | | | | | | | | | | | | | | |
| | | | | |
Department of Justice and Attorney-General | | | | | | | | | | | | | | | | | | | | |
Expansion of Prison Infrastructure for Women Prisoners | | | — | | | | 4,500 | | | | 8,000 | | | | — | | | | — | |
Transition of 17 year olds to the Youth Justice System | | | — | | | | 16,886 | | | | — | | | | — | | | | — | |
Courthouse Infrastructure | | | — | | | | 10,000 | | | | 6,000 | | | | — | | | | — | |
Domestic and Family Violence Response - Specialist Domestic and Family Violence Courts | | | — | | | | 10,000 | | | | 10,000 | | | | — | | | | — | |
Audio Visual Capability in the Criminal Justice System | | | — | | | | 4,965 | | | | 7,208 | | | | 6,936 | | | | 6,256 | |
Re-establishment of the Drug Court | | | — | | | | 500 | | | | — | | | | — | | | | — | |
| | | | | | | | | | | | | | | | | | | | |
Portfolio Total | | | — | | | | 46,851 | | | | 31,208 | | | | 6,936 | | | | 6,256 | |
| | | | | | | | | | | | | | | | | | | | |
| | | | | |
Department of National Parks, Sport and Racing | | | | | | | | | | | | | | | | | | | | |
Revitalising National Parks | | | — | | | | 15,000 | | | | 20,000 | | | | — | | | | — | |
Daisy Hill Koala Bushland Precinct | | | 500 | | | | 1,800 | | | | — | | | | — | | | | — | |
| | | | | | | | | | | | | | | | | | | | |
Portfolio Total | | | 500 | | | | 16,800 | | | | 20,000 | | | | — | | | | — | |
| | | | | | | | | | | | | | | | | | | | |
| | | | | |
Department of Natural Resources and Mines | | | | | | | | | | | | | | | | | | | | |
Strategic Resources Exploration Program | | | — | | | | 2,595 | | | | 3,545 | | | | 435 | | | | 550 | |
Linc Energy Mine Site | | | — | | | | 223 | | | | 80 | | | | 50 | | | | 50 | |
| | | | | | | | | | | | | | | | | | | | |
Portfolio Total | | | — | | | | 2,818 | | | | 3,625 | | | | 485 | | | | 600 | |
| | | | | | | | | | | | | | | | | | | | |
22
Budget Measures 2017-18
| | | | | | | | | | | | | | | | | | | | |
Capital measures since 2016-17 MYFER | | 2016-17
$‘000 | | | 2017-18
$‘000 | | | 2018-19
$‘000 | | | 2019-20
$‘000 | | | 2020-21
$‘000 | |
| | | | | |
Department of Science, Information Technology and Innovation | | | | | | | | | | | | | | | | | | | | |
Science ICT Remediation and Renewal Program - Phase 1 | | | — | | | | 2,880 | | | | — | | | | — | | | | — | |
| | | | | | | | | | | | | | | | | | | | |
Portfolio Total | | | — | | | | 2,880 | | | | — | | | | — | | | | — | |
| | | | | | | | | | | | | | | | | | | | |
| | | | | |
Department of the Premier and Cabinet | | | | | | | | | | | | | | | | | | | | |
Arts Infrastructure and Refurbishment | | | — | | | | 6,000 | | | | 4,000 | | | | 4,000 | | | | 3,500 | |
Queensland Family and Child Commission - Responsive Child Protection System | | | — | | | | 800 | | | | — | | | | — | | | | — | |
| | | | | | | | | | | | | | | | | | | | |
Portfolio Total | | | — | | | | 6,800 | | | | 4,000 | | | | 4,000 | | | | 3,500 | |
| | | | | | | | | | | | | | | | | | | | |
| | | | | |
Department of Transport and Main Roads | | | | | | | | | | | | | | | | | | | | |
Additional road projects funded in partnership with Federal Government | | | — | | | | 5,796 | | | | 40,204 | | | | 33,800 | | | | 37,200 | |
Camera Detected Offence Program | | | — | | | | (23,650 | ) | | | (27,650 | ) | | | 36,398 | | | | 43,898 | |
| | | | | | | | | | | | | | | | | | | | |
Portfolio Total | | | — | | | | (17,854 | ) | | | 12,554 | | | | 70,198 | | | | 81,098 | |
| | | | | | | | | | | | | | | | | | | | |
| | | | | |
Public Safety Business Agency | | | | | | | | | | | | | | | | | | | | |
Queensland Government Air Aircraft Maintenance and Compliance2 | | | — | | | | 6,087 | | | | — | | | | — | | | | — | |
| | | | | | | | | | | | | | | | | | | | |
Portfolio Total | | | — | | | | 6,087 | | | | — | | | | — | | | | — | |
| | | | | | | | | | | | | | | | | | | | |
| | | | | |
Queensland Fire and Emergency Services | | | | | | | | | | | | | | | | | | | | |
Accelerated Rural Fire Service Fleet Program | | | — | | | | 10,691 | | | | 19,405 | | | | (10,691 | ) | | | (19,405 | ) |
| | | | | | | | | | | | | | | | | | | | |
Portfolio Total | | | — | | | | 10,691 | | | | 19,405 | | | | (10,691 | ) | | | (19,405 | ) |
| | | | | | | | | | | | | | | | | | | | |
| | | | | |
Queensland Health | | | | | | | | | | | | | | | | | | | | |
Integrated Electronic Medical Records Program | | | 6,170 | | | | 50,500 | | | | — | | | | — | | | | — | |
Health Infrastructure - priority rural and regional projects | | | — | | | | 47,600 | | | | 51,900 | | | | 96,400 | | | | 12,500 | |
Health Infrastructure - South East Queensland - planning for growth | | | — | | | | 15,000 | | | | 14,600 | | | | 30,000 | | | | 63,163 | |
Health Infrastructure - South East Queensland - adolescent mental health facilities | | | 958 | | | | 8,713 | | | | 45,320 | | | | 13,246 | | | | — | |
| | | | | | | | | | | | | | | | | | | | |
Portfolio Total | | | 7,128 | | | | 121,813 | | | | 111,820 | | | | 139,646 | | | | 75,663 | |
| | | | | | | | | | | | | | | | | | | | |
| | | | | |
Queensland Police Service | | | | | | | | | | | | | | | | | | | | |
Counter-Terrorism and Community Safety Centre - Westgate | | | — | | | | 3,500 | | | | 24,200 | | | | 19,000 | | | | — | |
Camera Detected Offence Program | | | — | | | | (350 | ) | | | (350 | ) | | | 950 | | | | 950 | |
| | | | | | | | | | | | | | | | | | | | |
Portfolio Total | | | — | | | | 3,150 | | | | 23,850 | | | | 19,950 | | | | 950 | |
| | | | | | | | | | | | | | | | | | | | |
| | | | | |
Queensland Treasury | | | | | | | | | | | | | | | | | | | | |
Office of State Revenue - Transformation Program | | | — | | | | 11,699 | | | | 5,479 | | | | 561 | | | | — | |
Queensland Racing Integrity Commission - Compliance Enforcement Framework | | | — | | | | 2,283 | | | | 2,123 | | | | 979 | | | | 524 | |
| | | | | | | | | | | | | | | | | | | | |
Portfolio Total | | | — | | | | 13,982 | | | | 7,602 | | | | 1,540 | | | | 524 | |
| | | | | | | | | | | | | | | | | | | | |
| | | | | |
Total impact on Capital since 2016-17 MYFER | | | 93,278 | | | | 546,021 | | | | 791,621 | | | | 1,782,338 | | | | 1,270,164 | |
| | | | | |
Total impact on Capital since the 2016-17 Budget | | | 105,992 | | | | 568,132 | | | | 825,730 | | | | 1,833,538 | | | | 1,380,164 | |
| 1. | Further funding for this measure can be found in the Post Mid-Year Fiscal and Economic Review section of this table. |
| 2. | Further funding for this measure can be found in the Mid-Year Fiscal and Economic Review section of this table. |
23
Budget Measures 2017-18
| Table 1.7: | Revenue measures since the 2016-17 Budget |
| | | | | | | | | | | | | | | | | | | | |
Revenue measures since 2016-17 MYFER | | 2016-17
$‘000 | | | 2017-18
$‘000 | | | 2018-19
$‘000 | | | 2019-20
$‘000 | | | 2020-21
$‘000 | |
| | | | | |
Whole-of-Government | | | | | | | | | | | | | | | | | | | | |
Government Indexation Policy | | | — | | | | — | | | | — | | | | (25,000 | ) | | | (53,000 | ) |
| | | | | | | | | | | | | | | | | | | | |
Portfolio Total | | | — | | | | — | | | | — | | | | (25,000 | ) | | | (53,000 | ) |
| | | | | | | | | | | | | | | | | | | | |
| | | | | |
Department of Justice and Attorney-General | | | | | | | | | | | | | | | | | | | | |
Justice of the Peace Qualified and Commissioners for Declaration Handbook Revised Fees | | | — | | | | 342 | | | | 300 | | | | 150 | | | | 150 | |
| | | | | | | | | | | | | | | | | | | | |
Portfolio Total | | | — | | | | 342 | | | | 300 | | | | 150 | | | | 150 | |
| | | | | | | | | | | | | | | | | | | | |
| | | | | |
Department of Natural Resources and Mines | | | | | | | | | | | | | | | | | | | | |
Extending existing drought relief arrangements | | | — | | | | — | | | | — | | | | — | | | | — | |
| | | | | | | | | | | | | | | | | | | | |
Portfolio Total | | | — | | | | — | | | | — | | | | — | | | | — | |
| | | | | | | | | | | | | | | | | | | | |
| | | | | |
Queensland Treasury | | | | | | | | | | | | | | | | | | | | |
Absentee Land Tax | | | — | | | | 20,000 | | | | 21,400 | | | | 22,800 | | | | 24,200 | |
Office of State Revenue - Transformation Program | | | — | | | | 4,095 | | | | 19,318 | | | | 38,635 | | | | 57,953 | |
Rebate of Payroll Tax for Apprentices and Trainees | | | — | | | | (12,000 | ) | | | — | | | | — | | | | — | |
| | | | | | | | | | | | | | | | | | | | |
Portfolio Total | | | — | | | | 12,095 | | | | 40,718 | | | | 61,435 | | | | 82,153 | |
| | | | | | | | | | | | | | | | | | | | |
| | | | | |
Total impact on Revenue since 2016-17 MYFER | | | — | | | | 12,437 | | | | 41,018 | | | | 36,585 | | | | 29,303 | |
| | | | | |
Total impact on Revenue since the 2016-17 Budget | | | — | | | | 12,437 | | | | 41,018 | | | | 36,585 | | | | 29,303 | |
24
Budget Measures 2017-18
Introduction
The following tables present the relevant portfolio expense measures relating to decisions taken since the 2016-17 Budget. This does not represent the full amount of additional funding provided to agencies since the 2016-17 Budget. For further explanation, refer to Explanation of Scope and Terms in Chapter 1.
25
Budget Measures 2017-18
Department of Aboriginal and Torres Strait Islander Partnerships
| | | | | | | | | | | | | | | | | | | | |
| | | 2016-17
$‘000 | | | 2017-18
$‘000 | | | 2018-19
$‘000 | | | 2019-20
$‘000 | | | 2020-21
$‘000 | |
Aurukun Heightened Response | | | 2,606 | | | | 4,016 | | | | 412 | | | | 377 | | | | 355 | |
The Government has provided additional funding of $7.8 million over five years and $355,000 ongoing to support the Aurukun community. Further details of this funding can be found in the Department of Communities, Child Safety and Disability Services, Department of Environment and Heritage Protection, Department of Justice and Attorney-General, and the Queensland Police Service sections of this chapter.
This forms part of the Government’s overall package of $13.3 million over five years provided to address safety, support the community and improve employment outcomes. Further details of this package can be found in Chapter 1 Overview.
| | | | | | | | | | | | | | | | | | | | |
| | | 2016-17
$‘000 | | | 2017-18
$‘000 | | | 2018-19
$‘000 | | | 2019-20
$‘000 | | | 2020-21
$‘000 | |
Community and Personal Histories Resourcing | | | — | | | | 2,792 | | | | 418 | | | | 418 | | | | 418 | |
The Government is providing additional funding of $2.8 million in 2017-18 and $418,000 per annum ongoing to support and resource the Community and Personal Histories Unit.
| | | | | | | | | | | | | | | | | | | | |
| | | 2016-17
$‘000 | | | 2017-18
$‘000 | | | 2018-19
$‘000 | | | 2019-20
$‘000 | | | 2020-21
$‘000 | |
Closing the Gap - response to the 2017 Closing the Gap Report | | | — | | | | 1,090 | | | | 2,940 | | | | 1,990 | | | | 1,540 | |
The Government is providing increased funding of $7.6 million over four years as a contribution towards the Queensland Aboriginal and Torres Strait Islander Foundation (QATSIF), to compensate Elders Groups for their work informing policy responses and the development of a performance assessment framework to monitor outcomes and assist with working with the Australian Government on Closing the Gap targets.
26
Budget Measures 2017-18
| | | | | | | | | | | | | | | | | | | | |
| | | 2016-17
$‘000 | | | 2017-18
$‘000 | | | 2018-19
$‘000 | | | 2019-20
$‘000 | | | 2020-21
$‘000 | |
Independent legal advice expenses for Reparations Scheme claimants | | | — | | | | 650 | | | | — | | | | — | | | | — | |
The Government is providing additional funding of $650,000 in 2017-18 for the provision of independent legal advice for scheme claimants.
| | | | | | | | | | | | | | | | | | | | |
| | | 2016-17
$‘000 | | | 2017-18
$‘000 | | | 2018-19
$‘000 | | | 2019-20
$‘000 | | | 2020-21
$‘000 | |
Enhanced Youth Employment Program | | | 150 | | | | 600 | | | | 450 | | | | — | | | | — | |
The Government has provided increased funding of $1.2 million over three years for the enhanced Youth Employment Program to secure sustainable employment for Aboriginal and Torres Strait Islander young people.
| | | | | | | | | | | | | | | | | | | | |
| | | 2016-17
$‘000 | | | 2017-18
$‘000 | | | 2018-19
$‘000 | | | 2019-20
$‘000 | | | 2020-21
$‘000 | |
Efforts to address Youth Sexual Violence and Abuse | | | — | | | | 400 | | | | 400 | | | | 400 | | | | — | |
The Government is providing increased funding of $1.2 million over three years for the continuation of initiatives in Aurukun and West Cairns designed to address youth sexual violence and abuse.
| | | | | | | | | | | | | | | | | | | | |
| | | 2016-17
$‘000 | | | 2017-18
$‘000 | | | 2018-19
$‘000 | | | 2019-20
$‘000 | | | 2020-21
$‘000 | |
Cultural Acknowledgement and Promotion | | | — | | | | — | | | | — | | | | — | | | | — | |
Funding of $1 million is being internally reallocated by the department for Aboriginal and Torres Strait Islander cultural acknowledgement, maintenance and promotion activities.
27
Budget Measures 2017-18
Department of Agriculture and Fisheries
| | | | | | | | | | | | | | | | | | | | |
| | | 2016-17
$‘000 | | | 2017-18
$‘000 | | | 2018-19
$‘000 | | | 2019-20
$‘000 | | | 2020-21
$‘000 | |
Fisheries Reform - Implementing Government Commitments | | | — | | | | 6,996 | | | | 6,996 | | | | 6,891 | | | | — | |
The Government is providing additional funding of $20.9 million over three years from 2017-18 to implement reforms to the management of Queensland’s fisheries. Funding of $9.2 million has also been reprioritised by the department internally to fund this measure.
| | | | | | | | | | | | | | | | | | | | |
| | | 2016-17
$‘000 | | | 2017-18
$‘000 | | | 2018-19
$‘000 | | | 2019-20
$‘000 | | | 2020-21
$‘000 | |
Biosecurity Regional Responses | | | 1,304 | | | | 3,930 | | | | — | | | | — | | | | — | |
The Government has provided increased funding of $5.2 million over two years from 2016-17 for pest and weed management. This includes increased funding for wild dog exclusion fencing ($1 million), additional funding for the management of navua sedge ($250,000) and funding to continue the National Electric Ant Eradication Program ($3.9 million) in Far North Queensland.
| | | | | | | | | | | | | | | | | | | | |
| | | 2016-17
$‘000 | | | 2017-18
$‘000 | | | 2018-19
$‘000 | | | 2019-20
$‘000 | | | 2020-21
$‘000 | |
Drought and Climate Adaptation Program | | | — | | | | 3,105 | | | | 3,310 | | | | 3,205 | | | | 3,205 | |
The Government is providing increased funding of $16 million over five years to 2021-22 for the continuation of the Drought and Climate Adaptation Program. The program aims to provide the resources, tools and training to help primary producers be more resilient and better able to manage their drought and climate risks. This will benefit resource management, performance, and long term productivity of the agricultural sector and the Queensland economy.
28
Budget Measures 2017-18
| | | | | | | | | | | | | | | | | | | | |
| | | 2016-17
$‘000 | | | 2017-18
$‘000 | | | 2018-19
$‘000 | | | 2019-20
$‘000 | | | 2020-21
$‘000 | |
Biosecurity - Ongoing Panama TR4 Response | | | — | | | | 1,257 | | | | — | | | | — | | | | — | |
The Government is providing increased funding of $1.3 million in 2017-18 to support continuation of the Panama TR4 Program, following the detection of Panama disease Tropical Race 4 in Queensland in March 2015.
| | | | | | | | | | | | | | | | | | | | |
| | | 2016-17
$‘000 | | | 2017-18
$‘000 | | | 2018-19
$‘000 | | | 2019-20
$‘000 | | | 2020-21
$‘000 | |
Rural Economic Development Package | | | — | | | | 1,200 | | | | 1,450 | | | | 800 | | | | — | |
The Government is providing additional funding of $3.5 million over three years from 2017-18 to support regional economic development. Funding of $1.8 million has also been reprioritised by the department internally to fund this measure, bringing the total to $5.2 million. Funding will provide for Growing Queensland’s Food Exports, a Rural Economies Centre of Excellence and continuation of the department’s One Stop Service.
| | | | | | | | | | | | | | | | | | | | |
| | | 2016-17
$‘000 | | | 2017-18
$‘000 | | | 2018-19
$‘000 | | | 2019-20
$‘000 | | | 2020-21
$‘000 | |
Queensland Rural and Industry Development Authority (QRIDA) | | | — | | | | 900 | | | | 820 | | | | 820 | | | | 820 | |
The Government is providing additional funding of $900,000 in 2017-18 and $820,000 per annum from 2018-19 for the Queensland Rural and Industry Development Authority (QRIDA) to undertake a Rural Debt Survey, establish and operate the Office for Farm Debt Restructure, and develop a policy and research function.
29
Budget Measures 2017-18
| | | | | | | | | | | | | | | | | | | | |
| | | 2016-17
$‘000 | | | 2017-18
$‘000 | | | 2018-19
$‘000 | | | 2019-20
$‘000 | | | 2020-21
$‘000 | |
10 Year Plan for the National Red Imported Fire Ant Eradication Program in South East Queensland | | | 1,875 | | | | — | | | | — | | | | — | | | | — | |
The Government has provided increased funding of $1.9 million in 2016-17 for the National Red Imported Fire Ant Eradication Program (NRIFAEP). The department has internally reallocated a further $700,000, which when combined with contributions from the Australian Government and other States and Territories brings the total funding for 2016-17 to $19.1 million. In addition, the Government has committed increased funding of $28.2 million over 10 years from 2017-18, held centrally, to implement an expanded NRIFAEP, subject to National Cost Sharing Agreement (NCSA) being finalised.
| | | | | | | | | | | | | | | | | | | | |
| | | 2016-17
$‘000 | | | 2017-18
$‘000 | | | 2018-19
$‘000 | | | 2019-20
$‘000 | | | 2020-21
$‘000 | |
Containment of White Spot Disease | | | 17,631 | | | | — | | | | — | | | | — | | | | — | |
The Government has provided additional funding of $17.6 million in 2016-17 for the biosecurity response to White Spot Disease in prawns, following the detection of White Spot Syndrome Virus in prawn farms and in the Logan River and Moreton Bay. In addition, the Government has provisioned for funding of up to $9 million over two years from 2017-18, held centrally, to continue the white spot response, pending refinement of program costs.
| | | | | | | | | | | | | | | | | | | | |
| | | 2016-17
$‘000 | | | 2017-18
$‘000 | | | 2018-19
$‘000 | | | 2019-20
$‘000 | | | 2020-21
$‘000 | |
Extending Existing Drought Relief Arrangements | | | — | | | | — | | | | — | | | | — | | | | — | |
The Government is providing increased funding of up to $20 million in 2017-18, held centrally, for the continuation of the Drought Relief Assistance Scheme. This funding provides freight subsidies and emergency water infrastructure rebates to support producers and communities that have been affected by drought across the State.
The Drought Assistance Package is a total of up to $34.6 million in 2017-18 across several departments to support drought affected communities across the State. Further funding can be found in the Department of Communities, Child Safety and Disability Services and Department of Energy and Water Supply sections of this chapter and the Department of Natural Resources and Mines section of Chapter 4 Revenue Measures.
30
Budget Measures 2017-18
| | | | | | | | | | | | | | | | | | | | |
| | | 2016-17
$‘000 | | | 2017-18
$‘000 | | | 2018-19
$‘000 | | | 2019-20
$‘000 | | | 2020-21
$‘000 | |
Improving Beef Supply Chains | | | 700 | | | | — | | | | — | | | | — | | | | — | |
The Government has provided additional funding of $700,000 in 2016-17 for the commissioning of an independent beef supply chain study to inform the viability of investment in beef industry related infrastructure accross regional Queensland.
| | | | | | | | | | | | | | | | | | | | |
| | | 2016-17
$‘000 | | | 2017-18
$‘000 | | | 2018-19
$‘000 | | | 2019-20
$‘000 | | | 2020-21
$‘000 | |
Queensland Reef Water Quality Program 2017-2022 | | | — | | | | — | | | | — | | | | — | | | | — | |
The Government is providing increased funding of $88.5 million over five years, held centrally, for the Great Barrier Reef Water Quality Program, as part of the Queensland Government’s commitment to the protection of the Great Barrier Reef.
This is part of a comprehensive Great Barrier Reef Water Quality Program across several agencies totalling $175 million over five years from 2017-18. It will support the continuation of critical programs to assist working towards the achievement of water quality targets, including Best Practice Management programs, provision of economic support and decision-making tools for agricultural producers, the Paddock to Reef program and the Natural Resource Management Program for Reef Water Quality. This is in addition to the $100 million provided over five years from 2015-16 to address the recommendations arising from the Great Barrier Reef Water Science Taskforce.
The Department of Environment and Heritage Protection, the Department of Natural Resources and Mines, the Department of Agriculture and Fisheries, the Department of Science, Information Technology and Innovation and private sector partners will work in collaboration to deliver the program.
31
Budget Measures 2017-18
| | | | | | | | | | | | | | | | | | | | |
| | | 2016-17
$‘000 | | | 2017-18
$‘000 | | | 2018-19
$‘000 | | | 2019-20
$‘000 | | | 2020-21
$‘000 | |
Varroa Mite Response | | | 275 | | | | — | | | | — | | | | — | | | | — | |
The Government has provided additional funding of $275,000 in 2016-17 for the incident definition phase of the Varroa Mite response which occurred prior to National Cost Sharing Agreement (NCSA). Varroa mites are a serious pest and a threat to the local honey bee industry and crops that rely on bees for pollination.
The national cost shared component of the response is $2.6 million over four years. Under the NCSA, $2.5 million will be provided by the Australian Government, other States and Territories, and industry related parties with Queensland Government contributing $109,000.
32
Budget Measures 2017-18
Department of Communities, Child Safety and Disability Services
| | | | | | | | | | | | | | | | | | | | |
| | | 2016-17
$‘000 | | | 2017-18
$‘000 | | | 2018-19
$‘000 | | | 2019-20
$‘000 | | | 2020-21
$‘000 | |
Strengthening Queensland’s Child Protection System | | | — | | | | 32,530 | | | | 52,799 | | | | 55,959 | | | | 57,313 | |
The Government is providing additional funding of $200 million over four years to further strengthen Queensland’s child protection system. This includes additional funding of $141.8 million approved in the 2017-18 Budget, and a $56.8 million package of initiatives responding to critical issues following release of the Queensland Family and Child Commission’s report into the death of Mason Jet Lee. The $200 million package includes 292 new child safety workers, including front line child safety officers, support officers, team leaders and administrative officers, as well as increased investment in intensive family support services. These positions are on top of the extra 82 child safety front line and support staff announced in October 2016. The Government has also set aside $1.4 million for future requirements in the child safety system.
| | | | | | | | | | | | | | | | | | | | |
| | | 2016-17
$‘000 | | | 2017-18
$‘000 | | | 2018-19
$‘000 | | | 2019-20
$‘000 | | | 2020-21
$‘000 | |
Additional Child Safety Workers | | | — | | | | — | | | | — | | | | — | | | | — | |
Funding of $13.2 million over two years (2016-17 and 2017-18) has been reprioritised by the department to hire an additional 82 child safety workers.
| | | | | | | | | | | | | | | | | | | | |
| | | 2016-17
$‘000 | | | 2017-18
$‘000 | | | 2018-19
$‘000 | | | 2019-20
$‘000 | | | 2020-21
$‘000 | |
Domestic and Family Violence Response - Specialist Domestic and Family Violence Courts | | | — | | | | 1,462 | | | | 1,462 | | | | 1,462 | | | | 1,462 | |
The Government is providing increased funding of $5.8 million over four years (which includes allocation of funding held in a whole-of-Government contingency in the 2016-17 Budget), and ongoing funding of $1.5 million per annum to continue court support services and perpetrator programs for the specialist Domestic and Family Violence court in Southport as well as further rollout to Beenleigh and Townsville, including circuit courts to Mount Isa and Palm Island.
33
Budget Measures 2017-18
This forms part of the Government’s total package of $69.5 million over four years to rollout Specialist Domestic and Family Violence Courts, which includes $40.4 million over four years provided as a whole-of-Government contingency for this measure in the 2016-17 Budget. Further details of this package can be found in the Department of Justice and Attorney-General and Queensland Police Service sections of this chapter and the Department of Justice and Attorney-General section of Chapter 3 Capital Measures.
This forms part of the Government’s overall package to implement the Government response to the Not Now, Not Ever report since the 2015-16 Budget.
| | | | | | | | | | | | | | | | | | | | |
| | | 2016-17
$‘000 | | | 2017-18
$‘000 | | | 2018-19
$‘000 | | | 2019-20
$‘000 | | | 2020-21
$‘000 | |
Domestic and Family Violence Shelters | | | — | | | | — | | | | 1,120 | | | | 1,120 | | | | 1,120 | |
The Government will provide additional funding of $1.1 million per annum to operate two new domestic and family violence shelters. The capital component of this measure can be found in the Department of Housing and Public Works section of Chapter 3 Capital Measures as part of the Queensland Housing Strategy 2017-2027. This forms part of the Government’s overall package to implement the Government response to the Not Now, Not Ever report since the 2015-16 Budget.
| | | | | | | | | | | | | | | | | | | | |
| | | 2016-17
$‘000 | | | 2017-18
$‘000 | | | 2018-19
$‘000 | | | 2019-20
$‘000 | | | 2020-21
$‘000 | |
Action on Ice | | | — | | | | 2,460 | | | | 2,460 | | | | 2,460 | | | | — | |
The Government is providing additional funding of $7.4 million over three years for support services for the families of crystal methamphetamine (Ice) users as part of the Action on Ice package. This funding will also support families involved in the child protection system to overcome Ice issues.
The Action on Ice package is a total of $18 million over four years to tackle the harmful use and effects of Ice in Queensland. Further details can be found in the Department of the Premier and Cabinet, Queensland Health and Queensland Police Service sections of this chapter.
34
Budget Measures 2017-18
| | | | | | | | | | | | | | | | | | | | |
| | | 2016-17
$‘000 | | | 2017-18
$‘000 | | | 2018-19
$‘000 | | | 2019-20
$‘000 | | | 2020-21
$‘000 | |
Foster and Kinship Carer Support through the Non Government Sector | | | 2,000 | | | | 2,000 | | | | — | | | | — | | | | — | |
The Government has provided increased funding of $4 million over two years to accelerate the transfer of foster and kinship carer support to the non-government sector.
| | | | | | | | | | | | | | | | | | | | |
| | | 2016-17
$‘000 | | | 2017-18
$‘000 | | | 2018-19
$‘000 | | | 2019-20
$‘000 | | | 2020-21
$‘000 | |
Strategic Blueprint for Queensland’s North West Minerals Province | | | — | | | | 150 | | | | 150 | | | | 150 | | | | 150 | |
The Government is providing additional funding of $600,000 over four years to support implementation of the Queensland Government’s Strategic Blueprint for Queensland’s North West Minerals Province that is aimed at facilitating a strong and prosperous future for the region.
This forms part of the Government’s overall package of $39 million over four years across several departments to deliver initiatives to support the North West Minerals Province. Further details can be found in the Department of the Premier and Cabinet, Department of State Development and the Department of Natural Resources and Mines section of this chapter, and the Department of Natural Resources and Mines section of Chapter 3 Capital Measures.
| | | | | | | | | | | | | | | | | | | | |
| | | 2016-17
$‘000 | | | 2017-18
$‘000 | | | 2018-19
$‘000 | | | 2019-20
$‘000 | | | 2020-21
$‘000 | |
Aurukun Heightened Response - Aurukun Youth Strategy | | | 111 | | | | 96 | | | | — | | | | — | | | | — | |
The Government has provided additional funding of $207,000 over two years for in-community support and coordination of a community-driven Aurukun Youth Strategy. Further details of this funding can be found in the Department of Aboriginal and Torres Strait Islander Partnerships, Department of Environment and Heritage Protection, Department of Justice and Attorney-General, and the Queensland Police Service sections of this chapter.
This forms part of the Government’s overall package of $13.3 million over five years provided to address safety, support the community and improve employment outcomes. Further details of this package can be found in Chapter 1 Overview.
35
Budget Measures 2017-18
| | | | | | | | | | | | | | | | | | | | |
| | | 2016-17
$‘000 | | | 2017-18
$‘000 | | | 2018-19
$‘000 | | | 2019-20
$‘000 | | | 2020-21
$‘000 | |
Community Aids, Equipment and Assistive Technologies Initiative and the Vehicle Options Subsidy Scheme | | | — | | | | — | | | | — | | | | — | | | | — | |
Funding of $8.5 million over three years is being reprioritised by the department to support the continuation of the Community Aids, Equipment and Assistive Technologies Initiative and the Vehicle Options Subsidy Scheme.
| | | | | | | | | | | | | | | | | | | | |
| | | 2016-17
$‘000 | | | 2017-18
$‘000 | | | 2018-19
$‘000 | | | 2019-20
$‘000 | | | 2020-21
$‘000 | |
Community Services Workers Award Wage Increases | | | — | | | | — | | | | 17,457 | | | | 30,449 | | | | 34,496 | |
The Government will provide additional funding of $82.4 million over three years from 2018-19, with a further $10 million reprioritised by the department over two years from 2017-18, in recognition of increases to award rates for social and community service employees arising from Fair Work Australia’s 2012 Equal Remuneration Order. The funding will be allocated on a prioritised basis to non-government service providers which support dependent and vulnerable Queenslanders. Further details of this funding can be found in the Queensland Health, Department of Justice and Attorney-General, and Department of Housing and Public Works sections of this chapter.
This forms part of the Government’s overall package of $137.7 million over four years from2017-18, with $52 million ongoing from 2020-21, which will significantly contribute to the sustainability of the non-government sector. Further details on this package can be found in Chapter 1 Overview.
| | | | | | | | | | | | | | | | | | | | |
| | | 2016-17
$‘000 | | | 2017-18
$‘000 | | | 2018-19
$‘000 | | | 2019-20
$‘000 | | | 2020-21
$‘000 | |
Escalation of National Disability Insurance Scheme (NDIS) Funding | | | — | | | | — | | | | — | | | | — | | | | 64,300 | |
Escalation of 3.5% has been applied to Queensland’s NDIS funding commitment in 2020-21, in accordance with the Heads of Agreement between the Commonwealth and Queensland Governments on the National Disability Insurance Scheme.
36
Budget Measures 2017-18
| | | | | | | | | | | | | | | | | | | | |
| | | 2016-17
$‘000 | | | 2017-18
$‘000 | | | 2018-19
$‘000 | | | 2019-20
$‘000 | | | 2020-21
$‘000 | |
Extending Existing Drought Relief Arrangements | | | — | | | | — | | | | — | | | | — | | | | — | |
The Government is providing increased funding of up to $4 million in 2017-18, held centrally, to extend community support measures in drought declared areas to strengthen the resilience of drought affected Queenslanders. The measures include a mix of financial assistance, counselling services, community events and farm skill development activities.
The Drought Assistance Package is a total of up to $34.6 million in 2017-18 across several departments to support drought affected communities across the State. Further funding can be found in the Department of Agriculture and Fisheries and the Department of Energy and Water Supply sections of this chapter and the Department of Natural Resources and Mines section of Chapter 4 Revenue Measures.
| | | | | | | | | | | | | | | | | | | | |
| | | 2016-17
$‘000 | | | 2017-18
$‘000 | | | 2018-19
$‘000 | | | 2019-20
$‘000 | | | 2020-21
$‘000 | |
Multi-Agency Service Response to Child Sexual Abuse | | | — | | | | — | | | | — | | | | — | | | | — | |
Funding of $1 million in 2017-18 is being reallocated internally by the department to facilitate development of multi-agency responses to child sexual abuse, including awareness raising and development of new protocols and guidelines.
| | | | | | | | | | | | | | | | | | | | |
| | | 2016-17
$‘000 | | | 2017-18
$‘000 | | | 2018-19
$‘000 | | | 2019-20
$‘000 | | | 2020-21
$‘000 | |
Replacement of lntegrated Client Management System | | | — | | | | — | | | | — | | | | — | | | | — | |
Funding of $1.5 million in 2016-17 has been reprioritised by the department to progress replacement of the child protection and youth justice ICT system.
37
Budget Measures 2017-18
| | | | | | | | | | | | | | | | | | | | |
| | | 2016-17
$‘000 | | | 2017-18
$‘000 | | | 2018-19
$‘000 | | | 2019-20
$‘000 | | | 2020-21
$‘000 | |
Support Services for Young People with a Disability Leaving School | | | — | | | | — | | | | — | | | | — | | | | — | |
Funding of $8 million over two years is being internally reallocated by the department to support young people with disability in their transition from school.
38
Budget Measures 2017-18
Department of Education and Training
| | | | | | | | | | | | | | | | | | | | |
| | | 2016-17
$‘000 | | | 2017-18
$‘000 | | | 2018-19
$‘000 | | | 2019-20
$‘000 | | | 2020-21
$‘000 | |
Southbank Education and Training Precinct (SETP) | | | 22,700 | | | | 25,500 | | | | 19,400 | | | | 22,900 | | | | 16,400 | |
The Government has provided additional funding of $106.9 million over five years and ongoing funding over the life of the agreement to 2039 to assist the department to meet its obligations under the SETP Public Private Partnership (PPP) arrangements.
| | | | | | | | | | | | | | | | | | | | |
| | | 2016-17
$‘000 | | | 2017-18
$‘000 | | | 2018-19
$‘000 | | | 2019-20
$‘000 | | | 2020-21
$‘000 | |
Maintaining Senior Secondary Curriculum Offerings for Students in the Prep Half Cohort | | | — | | | | 12,435 | | | | 28,399 | | | | 16,048 | | | | — | |
The Government is providing additional funding of $56.9 million over three years (including an allocation for non-state schools through the basket nexus funding arrangements) to ensure students from the smaller cohort of Prep in 2007 can access the existing range of senior secondary subjects.
| | | | | | | | | | | | | | | | | | | | |
| | | 2016-17
$‘000 | | | 2017-18
$‘000 | | | 2018-19
$‘000 | | | 2019-20
$‘000 | | | 2020-21
$‘000 | |
Enhanced First Start lnitiative | | | — | | | | 500 | | | | — | | | | — | | | | — | |
The Government is providing increased funding of $500,000 in 2017-18 to enhance the First Start Initiative under Skilling Queenslanders for Work which subsidises local councils to employ additional trainees.
39
Budget Measures 2017-18
| | | | | | | | | | | | | | | | | | | | |
| | | 2016-17
$‘000 | | | 2017-18
$‘000 | | | 2018-19
$‘000 | | | 2019-20
$‘000 | | | 2020-21
$‘000 | |
Senior Assessment and Tertiary Entrance System | | | — | | | | 164 | | | | 122 | | | | 200 | | | | — | |
The Government is providing increased funding of $486,000 over three years for the development of a Queensland Australian Tertiary Admission Rank.
| | | | | | | | | | | | | | | | | | | | |
| | | 2016-17
$‘000 | | | 2017-18
$‘000 | | | 2018-19
$‘000 | | | 2019-20
$‘000 | | | 2020-21
$‘000 | |
Advancing Teaching and Learning | | | — | | | | — | | | | 68,830 | | | | 40,070 | | | | 41,070 | |
The Government will provide additional funding of $150 million over three years from 2018-19 and ongoing funding (including an allocation for non-state schools through the basket nexus funding arrangements) for investment in teacher attraction, quality and leadership, as well as building staff capability in response to the Disability Review.
| | | | | | | | | | | | | | | | | | | | |
| | | 2016-17
$‘000 | | | 2017-18
$‘000 | | | 2018-19
$‘000 | | | 2019-20
$‘000 | | | 2020-21
$‘000 | |
State Contribution Grant (previously the Public Provider Grant) | | | — | | | | — | | | | — | | | | — | | | | — | |
Funding of $13 million in 2017-18 is being reallocated internally by the department to increase the State Contribution Grant (previously known as the Public Provider Grant) to invest in teacher quality and quality vocational education and training delivery.
| | | | | | | | | | | | | | | | | | | | |
| | | 2016-17
$‘000 | | | 2017-18
$‘000 | | | 2018-19
$‘000 | | | 2019-20
$‘000 | | | 2020-21
$‘000 | |
Regional Skills Adjustment Strategy | | | — | | | | 5,000 | | | | 5,000 | | | | — | | | | — | |
The Government is providing additional funding of $10 million over two years to support unemployed individuals to develop employability skills for jobs in demand, job pathway planning and to provide access to training at TAFE Queensland.
40
Budget Measures 2017-18
| | | | | | | | | | | | | | | | | | | | |
| | | 2016-17
$‘000 | | | 2017-18
$‘000 | | | 2018-19
$‘000 | | | 2019-20
$‘000 | | | 2020-21
$‘000 | |
Regional Skills Investment Strategy | | | — | | | | — | | | | — | | | | — | | | | — | |
Funding of $9 million over four years from 2017-18 is being reallocated internally by the department for the Regional Skills Investment Strategy to provide a local focus on training opportunities for selected communities to develop skills for individuals that are discouraged or displaced from employment.
41
Budget Measures 2017-18
Department of Energy and Water Supply
| | | | | | | | | | | | | | | | | | | | |
| | | 2016-17
$‘000 | | | 2017-18
$‘000 | | | 2018-19
$‘000 | | | 2019-20
$‘000 | | | 2020-21
$‘000 | |
Community Service Obligation for the Cloncurry Pipeline | | | — | | | | 6,017 | | | | 6,167 | | | | — | | | | — | |
The Government is providing increased funding of up to $12.2 million over two years for the Community Service Obligation payment to SunWater which supports operations of the Cloncurry water pipeline.
| | | | | | | | | | | | | | | | | | | | |
| | | 2016-17
$‘000 | | | 2017-18
$‘000 | | | 2018-19
$‘000 | | | 2019-20
$‘000 | | | 2020-21
$‘000 | |
Community Service Obligation Lower Burdekin Water | | | — | | | | 318 | | | | 318 | | | | 318 | | | | 318 | |
The Government is providing increased funding of $318,000 per annum from 1 July 2017 for the Community Service Obligation payment to SunWater to support the costs associated with the supply of bulk water in the Lower Burdekin.
| | | | | | | | | | | | | | | | | | | | |
| | | 2016-17
$‘000 | | | 2017-18
$‘000 | | | 2018-19
$‘000 | | | 2019-20
$‘000 | | | 2020-21
$‘000 | |
National Water Infrastructure Development Fund | | | 2,705 | | | | 12,130 | | | | 4,966 | | | | — | | | | — | |
The Australian Government has committed to provide increased funding of up to $19.8 million over three years for the delivery of feasibility studies under Part 1 of the National Water Infrastructure Development Fund (NWIDF), contingent on recipients meeting project milestones. This brings total funding for ths measure to $24.8 million. The Queensland Government will provide upfront funding of up to $15 million in advance to accelerate assessment of water infrastructure options which could stimulate regional economic activity, which will be reimbursed by the Australian Government once project milestones are met.
42
Budget Measures 2017-18
| | | | | | | | | | | | | | | | | | | | |
| | | 2016-17
$‘000 | | | 2017-18
$‘000 | | | 2018-19
$‘000 | | | 2019-20
$‘000 | | | 2020-21
$‘000 | |
Powering Queensland Plan | | | — | | | | 10,000 | | | | — | | | | — | | | | — | |
The Government is providing additional funding of $10 million in 2017-18. This includes $8.4 million for the establishment of a Queensland Energy Security Taskforce to develop short and long-term system energy security plans for Queensland, and $1.6 million to implement the recommendations of the Renewable Energy Expert Panel.
This forms part of the Government’s overall commitment of $1.16 billion to ensure affordable, secure and sustainable energy supply for Queensland homes, businesses and industry.
| | | | | | | | | | | | | | | | | | | | |
| | | 2016-17
$‘000 | | | 2017-18
$‘000 | | | 2018-19
$‘000 | | | 2019-20
$‘000 | | | 2020-21
$‘000 | |
Regional Business Support | | | 2,130 | | | | 7,870 | | | | — | | | | — | | | | — | |
The Government has provided additional funding of $10 million over two years to support regional economies, transition business customers to cost-reflective electricity prices and manage budget impacts for Government. This package will deliver better access to digital metering, more information about tariff options, and co-contributions to help customers in real need invest in operational and equipment changes to manage bill impacts.
| | | | | | | | | | | | | | | | | | | | |
| | | 2016-17
$‘000 | | | 2017-18
$‘000 | | | 2018-19
$‘000 | | | 2019-20
$‘000 | | | 2020-21
$‘000 | |
Funding for Community Service Obligation payments for SunWater and Seqwater irrigation water supply services | | | — | | | | 4,900 | | | | 4,200 | | | | — | | | | — | |
The Government is providing increased funding of up to $9.1 million over two years for the Seqwater and SunWater irrigation scheme Community Service Obligation payments. For 2019-20 and beyond, funding will be considered after the Government’s next review of irrigation prices.
43
Budget Measures 2017-18
| | | | | | | | | | | | | | | | | | | | |
| | | 2016-17
$‘000 | | | 2017-18
$‘000 | | | 2018-19
$‘000 | | | 2019-20
$‘000 | | | 2020-21
$‘000 | |
Clean Energy Company | | | — | | | | 2,500 | | | | — | | | | — | | | | — | |
The Government is providing additional funding of $2.5 million in 2017-18to investigate the establishment of a Clean Energy Company that will own the State’s renewable and clean energy assets.
This forms part of the Government’s overall commitment of $1.16 billion to ensure affordable, secure and sustainable energy supply for Queensland homes, businesses and industry.
| | | | | | | | | | | | | | | | | | | | |
| | | 2016-17
$‘000 | | | 2017-18
$‘000 | | | 2018-19
$‘000 | | | 2019-20
$‘000 | | | 2020-21
$‘000 | |
Compliance and Regulation of Biofuels Mandate | | | — | | | | 1,280 | | | | 1,312 | | | | 1,345 | | | | — | |
The Government is providing increased funding of $3.9 million over three years to continue delivery of the biofuels mandate.
| | | | | | | | | | | | | | | | | | | | |
| | | 2016-17
$‘000 | | | 2017-18
$‘000 | | | 2018-19
$‘000 | | | 2019-20
$‘000 | | | 2020-21
$‘000 | |
New Bulk Water Infrastructure in Queensland | | | — | | | | 852 | | | | 1,182 | | | | 797 | | | | — | |
The Government is providing additional funding of $2.8 million over three years to coordinate the prioritisation of new bulk water infrastructure projects.
| | | | | | | | | | | | | | | | | | | | |
| | | 2016-17
$‘000 | | | 2017-18
$‘000 | | | 2018-19
$‘000 | | | 2019-20
$‘000 | | | 2020-21
$‘000 | |
Solar for Public Housing | | | 400 | | | | 800 | | | | — | | | | — | | | | — | |
The Government has provided additional funding of $1.2 million over two years for a trial of solar photovoltaic (PV) systems on public housing to test whether new solar business models can help open up access to solar PV and lower electricity costs for vulnerable customers.
44
Budget Measures 2017-18
| | | | | | | | | | | | | | | | | | | | |
| | | 2016-17
$‘000 | | | 2017-18
$‘000 | | | 2018-19
$‘000 | | | 2019-20
$‘000 | | | 2020-21
$‘000 | |
Extending Existing Drought Relief Arrangements | | | 2,100 | | | | — | | | | — | | | | — | | | | — | |
The Government has provided increased funding of $2.1 million in 2016-17 and is providing increased funding of up to $6.4 million in 2017-18, held centrally, to continue to provide relief to farming customers from fixed charges for electricity accounts that are used to pump water for farm or irrigation purposes during periods of drought.
The Drought Assistance Package is a total of up to $34.6 million in 2017-18 across several departments to support drought affected communities across the State. Further funding can be found in the Department of Agriculture and Fisheries and Department of Communities, Child Safety and Disability Services sections of this chapter and the Department of Natural Resources and Mines section of Chapter 4 Revenue Measures.
| | | | | | | | | | | | | | | | | | | | |
| | | 2016-17
$‘000 | | | 2017-18
$‘000 | | | 2018-19
$‘000 | | | 2019-20
$‘000 | | | 2020-21
$‘000 | |
Powering Queensland Plan - Electricity Affordability Package | | | 771,000 | | | | — | | | | — | | | | — | | | | — | |
The Government has provided additional funding of $771 million in 2016-17 to support the stabilisation of electricity prices for Queensland consumers, by funding the removal of costs of the Solar Bonus Scheme from electricity prices for three years from 2017-18 and directing Energy Queensland to remove costs from network charges. It is estimated that the benefit to Queenslanders in 2017-18 as a result of this measure will be $268 million.
This forms part of the Government’s overall commitment of $1.16 billion to ensure affordable, secure and sustainable energy supply for Queensland homes, businesses and industry.
45
Budget Measures 2017-18
Department of Environment and Heritage Protection
| | | | | | | | | | | | | | | | | | | | |
| | | 2016-17
$‘000 | | | 2017-18
$‘000 | | | 2018-19
$‘000 | | | 2019-20
$‘000 | | | 2020-21
$‘000 | |
Underground Coal Gasification - Linc Energy Mine Site | | | 3,997 | | | | 13,798 | | | | 3,725 | | | | 3,725 | | | | 3,725 | |
The Government has provided increased funding of $29 million over five years. This includes $4 million in 2016-17 to support environmental monitoring and progress preliminary rehabilitation of land impacted by underground coal gasification by-products. A further $25 million over four years from 2017-18 is provided to support ongoing prosecution of Linc Energy and its former directors for alleged serious environmental harm and to undertake further remediation of surface and groundwater impacted by by-products of underground coal gasification.
This forms part of the Government’s overall package of $36.3 million over five years. Further details can be found in Chapter 3 Capital Measures and the Department of Natural Resources and Mines sections of this chapter and Chapter 3 Capital Measures.
| | | | | | | | | | | | | | | | | | | | |
| | | 2016-17
$‘000 | | | 2017-18
$‘000 | | | 2018-19
$‘000 | | | 2019-20
$‘000 | | | 2020-21
$‘000 | |
Future of Queensland’s Environmental Regulator | | | — | | | | 6,689 | | | | 3,896 | | | | 1,084 | | | | 409 | |
The Government is providing increased funding of $12.1 million over four years to enhance the delivery of environmental regulatory services, to target areas of environmental risk and improve engagement with industry and the community. Further funding of $11.2 million is being reallocated internally by the department, bringing total funding for this measure to $23.3 million over four years. The capital component of this measure can be found in Chapter 3 Capital Measures.
46
Budget Measures 2017-18
| | | | | | | | | | | | | | | | | | | | |
| | | 2016-17
$‘000 | | | 2017-18
$‘000 | | | 2018-19
$‘000 | | | 2019-20
$‘000 | | | 2020-21
$‘000 | |
Queensland Climate Change Strategies | | | — | | | | 5,000 | | | | 5,000 | | | | 5,000 | | | | — | |
The Government is providing increased funding of $15 million over three years to develop and assist in the implementation of strategies to reduce and manage the risks of climate change across Queensland. This will be complemented by initiatives within the Department of Transport and Main Roads, the Department of Infrastructure, Local Government and Planning, the Department of Energy and Water Supply, the Department of Natural Resources and Mines, the Department of State Development and the Department of Agriculture and Fisheries.
| | | | | | | | | | | | | | | | | | | | |
| | | 2016-17
$‘000 | | | 2017-18
$‘000 | | | 2018-19
$‘000 | | | 2019-20
$‘000 | | | 2020-21
$‘000 | |
Establishment of Queensland CarbonPlus Fund | | | 1,024 | | | | 4,876 | | | | 2,500 | | | | — | | | | — | |
The Government has provided additional funding of $8.4 million over three years to establish a carbon offset fund to develop the capacity of Indigenous communities to participate in commercial carbon offset markets. The CarbonPlus Fund will offset two years of emissions generated by the Queensland Government vehicle fleet.
| | | | | | | | | | | | | | | | | | | | |
| | | 2016-17
$‘000 | | | 2017-18
$‘000 | | | 2018-19
$‘000 | | | 2019-20
$‘000 | | | 2020-21
$‘000 | |
Protected Area Outcomes | | | — | | | | 3,194 | | | | — | | | | — | | | | — | |
The Government is providing increased funding of $3.2 million in 2017-18to finalise the Protected Area Strategy and continue the Nature Refuges Program, including the NatureAssist Program, which provides incentives to landowners to conserve high value habitat on privately owned land.
47
Budget Measures 2017-18
| | | | | | | | | | | | | | | | | | | | |
| | | 2016-17
$‘000 | | | 2017-18
$‘000 | | | 2018-19
$‘000 | | | 2019-20
$‘000 | | | 2020-21
$‘000 | |
Implementing Queensland’s Container Refund Scheme & Plastic Bag Ban | | | — | | | | 2,500 | | | | — | | | | — | | | | — | |
The Government is providing additional funding of $2.5 million in 2017-18for the implementation of a Container Refund Scheme and a ban on plastic bags as part of the Advancing Queensland’s Waste Reform Agenda.
| | | | | | | | | | | | | | | | | | | | |
| | | 2016-17
$‘000 | | | 2017-18
$‘000 | | | 2018-19
$‘000 | | | 2019-20
$‘000 | | | 2020-21
$‘000 | |
Indigenous Land and Sea Rangers - Building Jobs From Country For Country | | | — | | | | 945 | | | | 1,890 | | | | 2,630 | | | | 2,630 | |
The Government is providing increased funding of $8.1 million over four years to expand the Indigenous Land and Sea Rangers Program from 75 to 100 positions. The program delivers skilled Indigenous jobs and protects environmental and cultural heritage values in some of Queensland’s most environmentally significant and iconic landscapes.
| | | | | | | | | | | | | | | | | | | | |
| | | 2016-17
$‘000 | | | 2017-18
$‘000 | | | 2018-19
$‘000 | | | 2019-20
$‘000 | | | 2020-21
$‘000 | |
Sustainable Businesses Partnership | | | — | | | | 916 | | | | — | | | | — | | | | — | |
The Government is providing additional funding of $916,000 in 2017-18for a sustainable business partnership to develop a program that supports small and medium sized businesses achieve resource efficiencies and environmental innovation.
48
Budget Measures 2017-18
| | | | | | | | | | | | | | | | | | | | |
| | | 2016-17
$‘000 | | | 2017-18
$‘000 | | | 2018-19
$‘000 | | | 2019-20
$‘000 | | | 2020-21
$‘000 | |
Aurukun Heightened Response - Junior Rangers Cultural Camp and Pathway to a Ranger Career | | | 315 | | | | 655 | | | | 655 | | | | 655 | | | | 655 | |
The Government has provided additional funding of $2.9 million over five years and $655,000 per annum ongoing to engage Aurukun youth and young adults in schools, training and career pathways in conservation and land management.
Further funding can be found in the Department of Aboriginal and Torres Strait Islander Partnerships, Department of Communities, Child Safety and Disability Services, Department of Justice and Attorney-General and the Queensland Police Service sections of this chapter.
This forms part of the Government’s overall package of $13.3 million over five years provided to address safety, support the community and improve employment outcomes. Further details of this package can be found in Chapter 1 Overview.
| | | | | | | | | | | | | | | | | | | | |
| | | 2016-17
$‘000 | | | 2017-18
$‘000 | | | 2018-19
$‘000 | | | 2019-20
$‘000 | | | 2020-21
$‘000 | |
Advancing Queensland’s Waste Reform Agenda | | | — | | | | — | | | | — | | | | — | | | | — | |
Funding of $3 million over two years from 2017-18 is being reprioritised by the department to promote recycling and waste diversion industries, leading to a reduction in waste going to landfill and greater reuse of materials.
| | | | | | | | | | | | | | | | | | | | |
| | | 2016-17
$‘000 | | | 2017-18
$‘000 | | | 2018-19
$‘000 | | | 2019-20
$‘000 | | | 2020-21
$‘000 | |
Coordinated Per- and Poly-fluroalkyl Substances (PFAS) Contamination Management | | | — | | | | — | | | | — | | | | — | | | | — | |
Funding of $1.4 million over three years from 2017-18 is being reprioritised by the department to provide legal and technical advice in the identification and management of historical fire-fighting foam pollution across Queensland.
49
Budget Measures 2017-18
| | | | | | | | | | | | | | | | | | | | |
| | | 2016-17
$‘000 | | | 2017-18
$‘000 | | | 2018-19
$‘000 | | | 2019-20
$‘000 | | | 2020-21
$‘000 | |
Mine Rehabilitation Reform | | | — | | | | — | | | | — | | | | — | | | | — | |
Funding of $2.7 million over three years from 2017-18 is being reprioritised by the department to develop and implement an enhanced regulatory framework under the Environmental Protection Act 1994 to improve rehabilitation standards of mined land across Queensland.
| | | | | | | | | | | | | | | | | | | | |
| | | 2016-17
$‘000 | | | 2017-18
$‘000 | | | 2018-19
$‘000 | | | 2019-20
$‘000 | | | 2020-21
$‘000 | |
Queensland Reef Water Quality Program 2017-2022 | | | — | | | | — | | | | — | | | | — | | | | — | |
The Government is providing increased funding of $88.5 million over five years from 2017-18, held centrally, for the Great Barrier Reef Water Quality Program, as part of the Queensland Government’s commitments the protection of the Great Barrier Reef.
This is part of a comprehensive Great Barrier Reef Water Quality Program across several agencies totalling $175 million over five years from 2017-18. It will support the continuation of critical programs to assist working towards the achievement of water quality targets, including Best Practice Management programs, provision of economic support and decision-making tools for agricultural producers, the Paddock to Reef program and the Natural Resource Management Program for Reef Water Quality. This is in addition to the $100 million provided over five years from 2015-16 to address the recommendations arising from the Great Barrier Reef Water Science Taskforce.
The Department of Environment and Heritage Protection, the Department of Natural Resources and Mines, the Department of Agriculture and Fisheries, the Department of Science, Information Technology and Innovation and private sector partners will work in collaboration to deliver the program.
50
Budget Measures 2017-18
Department of Housing and Public Works
| | | | | | | | | | | | | | | | | | | | |
| | | 2016-17
$‘000 | | | 2017-18
$‘000 | | | 2018-19
$‘000 | | | 2019-20
$‘000 | | | 2020-21
$‘000 | |
Queensland Housing Strategy | | | — | | | | 5,492 | | | | 41,538 | | | | 42,142 | | | | 32,337 | |
The Government is providing additional funding of $121.5 million over four years from 2017-18 to support delivery of the Queensland Housing Strategy 2017-2027. Further funding of $29.2 million, from the discontinuation of the last round of the National Rental Affordability Scheme program, has been reallocated internally by the department to support this measure.
Total funding of $1.795 billion over 10 years for the Queensland Housing Strategy 2017-2027 will boost the supply of social and affordable housing to respond to population growth and housing affordability pressures, leverage private industry and local government support, and enable reforms to the housing services and support system. This forms part of the Government’s ten year $1.835 billion funding package for housing and homelessness.
The capital component of this measure can be found in Chapter 3 Capital Measures. Further details of the housing and homelessness package can be found in Chapter 1 Overview.
| | | | | | | | | | | | | | | | | | | | |
| | | 2016-17
$‘000 | | | 2017-18
$‘000 | | | 2018-19
$‘000 | | | 2019-20
$‘000 | | | 2020-21
$‘000 | |
National Partnership Agreement on Homelessness | | | — | | | | 29,424 | | | | — | | | | — | | | | — | |
The Australian Government will provide funding of $29.4 million in 2017-18 to renew the National Partnership Agreement on Homelessness to 30 June 2018. The Queensland Government will provide matched funding of $29.4 million in 2017-18. The Agreement will prioritise front line service delivery to support victims of domestic violence and improve services for young people at risk of homelessness.
51
Budget Measures 2017-18
| | | | | | | | | | | | | | | | | | | | |
| | | 2016-17
$‘000 | | | 2017-18
$‘000 | | | 2018-19
$‘000 | | | 2019-20
$‘000 | | | 2020-21
$‘000 | |
Government Employee Housing | | | — | | | | 11,500 | | | | 11,500 | | | | — | | | | — | |
The Government will provide increased funding of $23 million over two years from 2017-18 to further carry out backlog maintenance on the Government employee housing portfolio.
This measure is part of a larger program of works for the government employee housing portfolio. The capital component of this measure can be found in Chapter 3 Capital Measures.
| | | | | | | | | | | | | | | | | | | | |
| | | 2016-17
$‘000 | | | 2017-18
$‘000 | | | 2018-19
$‘000 | | | 2019-20
$‘000 | | | 2020-21
$‘000 | |
Community Assistance Fund for Complying with Queensland’s Smoke Alarm Laws | | | 300 | | | | 4,700 | | | | — | | | | — | | | | — | |
The Government has provided additional funding of $5 million over two years for a one off rebate to assist eligible Queenslanders to have smoke alarms that are compliant with Queensland’s new smoke alarm laws installed in their residential property.
| | | | | | | | | | | | | | | | | | | | |
| | | 2016-17
$‘000 | | | 2017-18
$‘000 | | | 2018-19
$‘000 | | | 2019-20
$‘000 | | | 2020-21
$‘000 | |
Community Service Workers Award Wage Increases | | | — | | | | 959 | | | | 2,592 | | | | 4,249 | | | | 4,896 | |
The Government is providing additional funding of $12.7 million over four years in recognition of increases to award rates for social and community service employees arising from Fair Work Australia’s 2012 Equal Remuneration Order. The funding will be allocated on a prioritised basis to non-government service providers which support dependent and vulnerable Queenslanders. Further details of this funding can be found in the Queensland Health, Department of Communities, Child Safety and Disability Services, and Department of Justice and Attorney-General sections of this chapter.
This forms part of the Government’s overall package of $137.7 million over four years from 2017-18, with $52 million ongoing from 2020-21, which will significantly contribute to the sustainability of the non-government sector. Further details of this package are in the Overview section at the front of this paper.
52
Budget Measures 2017-18
| | | | | | | | | | | | | | | | | | | | |
| | | 2016-17
$‘000 | | | 2017-18
$‘000 | | | 2018-19
$‘000 | | | 2019-20
$‘000 | | | 2020-21
$‘000 | |
Cairns Convention Centre Expansion | | | — | | | | — | | | | — | | | | — | | | | — | |
Funding of $1 million in 2017-18 is being internally reallocated by the department for development of a business case for expansion of the Cairns Convention Centre. The capital component of this measure can be found in Chapter 3 Capital Measures.
| | | | | | | | | | | | | | | | | | | | |
| | | 2016-17
$‘000 | | | 2017-18
$‘000 | | | 2018-19
$‘000 | | | 2019-20
$‘000 | | | 2020-21
$‘000 | |
Gold Coast Convention and Exhibition Centre development proposal | | | — | | | | — | | | | — | | | | — | | | | — | |
Funding of $1 million in 2017-18 is being internally reallocated by the department for development of a business case for expansion of the Gold Coast Convention and Exhibition Centre.
| | | | | | | | | | | | | | | | | | | | |
| | | 2016-17
$‘000 | | | 2017-18
$‘000 | | | 2018-19
$‘000 | | | 2019-20
$‘000 | | | 2020-21
$‘000 | |
Household Disaster Resilience | | | — | | | | — | | | | — | | | | — | | | | — | |
The Government is providing $20 million over two years, held centrally, for a household natural disaster resilience program. Stage one of this program will involve matching of Government and private sector data sets to identify those high risk areas in Queensland where household mitigation measures, as opposed to Government mitigation works, could be effective in preventing or reducing the damage caused by natural disasters.
53
Budget Measures 2017-18
| | | | | | | | | | | | | | | | | | | | |
| | | 2016-17
$‘000 | | | 2017-18
$‘000 | | | 2018-19
$‘000 | | | 2019-20
$‘000 | | | 2020-21
$‘000 | |
Improving Security of Payment for Subcontractors in the Building and Construction Industry | | | 1,700 | | | | — | | | | — | | | | — | | | | — | |
The Government has provided additional funding of $1.7 million in 2016-17 to promote public awareness of the government’s reform agenda to improve security of payment for subcontractors in the building and construction industry.
| | | | | | | | | | | | | | | | | | | | |
| | | 2016-17
$‘000 | | | 2017-18
$‘000 | | | 2018-19
$‘000 | | | 2019-20
$‘000 | | | 2020-21
$‘000 | |
Re-establishment of the Drug Court | | | — | | | | — | | | | — | | | | — | | | | — | |
Funding of $2.6 million over four years commencing 2017-18 has been reprioritised to reintroduce the Drug Court as per the election commitment and provide referral and support services.
This forms part of the Government’s total package of $32.6 million over four years ($22.7 million new funding and $9.9 million reprioritised funding) to reinstate the Drug Court and provide referral and support services. Further details of this funding can be found in the Department of Justice and Attorney-General, Queensland Health and Queensland Police Service sections of this chapter.
The capital component of this measure can be found in the Department of Justice and Attorney-General section of Chapter 3 Capital Measures.
| | | | | | | | | | | | | | | | | | | | |
| | | 2016-17
$‘000 | | | 2017-18
$‘000 | | | 2018-19
$‘000 | | | 2019-20
$‘000 | | | 2020-21
$‘000 | |
Restoration and Upgrade of Old Museum Building | | | — | | | | — | | | | — | | | | — | | | | — | |
Funding of $3 million is being internally reallocated by the department in 2017-18. This includes $1.5 million to undertake urgent repairs to meet ongoing statutory workplace health and safety and building code compliance to the Old Museum Building and funding of $1.5 million to develop a business case to determine future use and sustainability of the building.
54
Budget Measures 2017-18
Department of Infrastructure, Local Government and Planning
| | | | | | | | | | | | | | | | | | | | |
| | | 2016-17
$‘000 | | | 2017-18
$‘000 | | | 2018-19
$‘000 | | | 2019-20
$‘000 | | | 2020-21
$‘000 | |
Works for Queensland | | | 120,000 | | | | 180,000 | | | | 100,000 | | | | — | | | | — | |
The Government has provided additional funding of $400 million over three years from 2016-17 for the Works for Queensland program, supporting local governments outside South East Queensland that are facing unemployment issues to undertake job-creating maintenance and minor infrastructure works. This funding includes an additional $200 million in this Budget, building on the $200 million announced in the 2016-17 MYFER.
| | | | | | | | | | | | | | | | | | | | |
| | | 2016-17
$‘000 | | | 2017-18
$‘000 | | | 2018-19
$‘000 | | | 2019-20
$‘000 | | | 2020-21
$‘000 | |
Indigenous Water Infrastructure Program | | | 30,000 | | | | 30,000 | | | | 30,000 | | | | 30,000 | | | | — | |
The Government has provided additional funding of $120 million over four years from 2016-17 for water, wastewater and solid waste infrastructure in Indigenous communities and to develop options for a long-term infrastructure program in Indigenous communities.
| | | | | | | | | | | | | | | | | | | | |
| | | 2016-17
$‘000 | | | 2017-18
$‘000 | | | 2018-19
$‘000 | | | 2019-20
$‘000 | | | 2020-21
$‘000 | |
Cross River Rail Delivery Authority Operating Budget | | | — | | | | 20,000 | | | | — | | | | — | | | | — | |
The Government is providing increased funding of $20 million in 2017-18 to the Cross River Rail Delivery Authority to continue preliminary work on the Cross River Rail project.
55
Budget Measures 2017-18
| | | | | | | | | | | | | | | | | | | | |
| | | 2016-17
$‘000 | | | 2017-18
$‘000 | | | 2018-19
$‘000 | | | 2019-20
$‘000 | | | 2020-21
$‘000 | |
Maturing the Infrastructure Pipeline Stage 2 | | | — | | | | 10,000 | | | | — | | | | — | | | | — | |
The Government is providing increased funding of $10 million in 2017-18 to assist local governments with strategic infrastructure planning.
| | | | | | | | | | | | | | | | | | | | |
| | | 2016-17
$‘000 | | | 2017-18
$‘000 | | | 2018-19
$‘000 | | | 2019-20
$‘000 | | | 2020-21
$‘000 | |
Townsville Water Security Measures | | | — | | | | 10,000 | | | | 15,000 | | | | 100,000 | | | | 100,000 | |
The Government is providing increased funding of $225 million over four years from 2017-18 to assist with Townsville water security measures.
| | | | | | | | | | | | | | | | | | | | |
| | | 2016-17
$‘000 | | | 2017-18
$‘000 | | | 2018-19
$‘000 | | | 2019-20
$‘000 | | | 2020-21
$‘000 | |
Regional Planning Program | | | — | | | | 5,000 | | | | 5,000 | | | | — | | | | — | |
The Government is providing additional funding of $10 million over two years from 2017-18 to enable a strategic environmental assessment and to provide for land monitoring across South East Queensland.
| | | | | | | | | | | | | | | | | | | | |
| | | 2016-17
$‘000 | | | 2017-18
$‘000 | | | 2018-19
$‘000 | | | 2019-20
$‘000 | | | 2020-21
$‘000 | |
State Government Financial Aid | | | — | | | | 3,370 | | | | 3,454 | | | | 3,540 | | | | 3,628 | |
The Government is providing increased funding of $3.4 million in 2017-18, then escalated in future years to raise the State’s financial contribution in meeting costs incurred by Indigenous Councils in the provision of local government services.
56
Budget Measures 2017-18
| | | | | | | | | | | | | | | | | | | | |
| | | 2016-17
$‘000 | | | 2017-18
$‘000 | | | 2018-19
$‘000 | | | 2019-20
$‘000 | | | 2020-21
$‘000 | |
Cities Transformation Taskforce | | | 2,000 | | | | 2,988 | | | | 1,914 | | | | 1,963 | | | | 1,971 | |
The Government has provided additional funding of $12.8 million over six years from 2016-17 for ongoing work of the Cities Transformation Taskforce in leading the State’s negotiations with the Australian and local governments on the Smart Cities Plan and City Deals.
| | | | | | | | | | | | | | | | | | | | |
| | | 2016-17
$‘000 | | | 2017-18
$‘000 | | | 2018-19
$‘000 | | | 2019-20
$‘000 | | | 2020-21
$‘000 | |
Fluoridation Infrastructure Grants Program | | | — | | | | 2,500 | | | | 2,500 | | | | — | | | | — | |
The Government is providing additional funding of $5 million over two years from 2017-18 to assist smaller local governments with infrastructure costs associated with the introduction of fluoridation.
| | | | | | | | | | | | | | | | | | | | |
| | | 2016-17
$‘000 | | | 2017-18
$‘000 | | | 2018-19
$‘000 | | | 2019-20
$‘000 | | | 2020-21
$‘000 | |
Disaster Resilience | | | — | | | | — | | | | — | | | | — | | | | — | |
The Government will provide increased funding of $18 million over three years from 2018-19 held in contingency pending the Commonwealth signing and funding an extension of the National Partnership Agreement on Disaster Resilience for those years.
| | | | | | | | | | | | | | | | | | | | |
| | | 2016-17
$‘000 | | | 2017-18
$‘000 | | | 2018-19
$‘000 | | | 2019-20
$‘000 | | | 2020-21
$‘000 | |
State Assessment Referral Agency | | | — | | | | — | | | | — | | | | 8,000 | | | | 8,000 | |
The Government will provide increased funding of $8 million per annum from 2019-20 ongoing to continue the work of the State Assessment Referral Agency.
57
Budget Measures 2017-18
Department of Justice and Attorney-General
| | | | | | | | | | | | | | | | | | | | |
| | | 2016-17
$‘000 | | | 2017-18
$‘000 | | | 2018-19
$‘000 | | | 2019-20
$‘000 | | | 2020-21
$‘000 | |
Expansion of Prison Infrastructure for Women Prisoners | | | — | | | | 457 | | | | 2,104 | | | | 4,333 | | | | 4,484 | |
The Government is providing increased funding of $11.4 million over four years, and ongoing funding of $4.5 million per annum to operate additional beds at the Brisbane Women’s Correctional Centre.
The capital component of this measure can be found in Chapter 3 Capital Measures.
| | | | | | | | | | | | | | | | | | | | |
| | | 2016-17
$‘000 | | | 2017-18
$‘000 | | | 2018-19
$‘000 | | | 2019-20
$‘000 | | | 2020-21
$‘000 | |
Capricornia Correctional Centre Expansion | | | — | | | | 400 | | | | 400 | | | | 400 | | | | 1,000 | |
The Government is providing additional funding of $2.2 million over four years for the Capricornia Correctional Centre expansion.
The capital component of this measure can be found in Chapter 3 Capital Measures.
| | | | | | | | | | | | | | | | | | | | |
| | | 2016-17
$‘000 | | | 2017-18
$‘000 | | | 2018-19
$‘000 | | | 2019-20
$‘000 | | | 2020-21
$‘000 | |
Queensland Parole System Review - Immediate Reforms | | | 500 | | | | 39,437 | | | | 47,162 | | | | 49,373 | | | | 52,828 | |
The Government has provided additional funding of $249 million over six years ($59.7 million for 2021-22) to overhaul Queensland’s parole system to make the community safer including stricter supervision of parolees and improved rehabilitation of offenders.
This measure is part of a larger program reforming the Queensland Parole System, with total funding of $265 million over six years. Further details of this funding can be found in the Queensland Health section of this chapter.
The capital component of this measure can be found in Chapter 3 Capital Measures.
58
Budget Measures 2017-18
| | | | | | | | | | | | | | | | | | | | |
| | | 2016-17
$‘000 | | | 2017-18
$‘000 | | | 2018-19
$‘000 | | | 2019-20
$‘000 | | | 2020-21
$‘000 | |
Transition of 17 year olds to the Youth Justice System | | | — | | | | 38,051 | | | | 42,597 | | | | 43,764 | | | | 44,823 | |
The Government is providing additional funding of $169.2 million over four years, and ongoing funding of $44.8 million per annum to transition 17 year olds from Queensland’s adult justice system to the youth justice system.
This forms part of the Government’s total package of $199.6 million over four years to transition 17 year olds to the youth justice system. Further details of this funding can be found in the Queensland Police Service and Queensland Health sections of this chapter and the Department of Justice and Attorney-General section of Chapter 3 Capital Measures.
| | | | | | | | | | | | | | | | | | | | |
| | | 2016-17
$‘000 | | | 2017-18
$‘000 | | | 2018-19
$‘000 | | | 2019-20
$‘000 | | | 2020-21
$‘000 | |
Domestic and Family Violence Response - Specialist Domestic and Family Violence Courts | | | — | | | | 10,183 | | | | 7,718 | | | | 8,689 | | | | 8,530 | |
The Government is providing increased funding of $35.1 million over four years (which includes allocation of funding held in a whole-of-Government contingency in the 2016-17 Budget), and ongoing funding of $8.5 million per annum to continue the specialist Domestic and Family Violence court in Southport as well as further rollout to Beenleigh and Townsville, including circuit courts to Mount Isa and Palm Island. This includes increased funding for courts, magistracy, Legal Aid Queensland and Queensland Corrective Services to support the specialist domestic and family violence court expansion.
This forms part of the Government’s total package of $69.5 million over four years to rollout Specialist Domestic and Family Violence Courts, which includes $40.4 million over four years provided as a whole-of-Government contingency for this measure in the 2016-17 Budget. Further details of this package can be found in the Department of Communities, Child Safety and Disability Services and Queensland Police Service sections of this chapter and the Department of Justice and Attorney-General section of Chapter 3 Capital Measures.
This forms part of the Government’s overall package to respond to the Not Now, Not Ever report since the 2015-16 Budget.
59
Budget Measures 2017-18
| | | | | | | | | | | | | | | | | | | | |
| | | 2016-17
$‘000 | | | 2017-18
$‘000 | | | 2018-19
$‘000 | | | 2019-20
$‘000 | | | 2020-21
$‘000 | |
Youth Detention in Queensland | | | — | | | | 6,214 | | | | 6,509 | | | | 6,670 | | | | 6,834 | |
The Government is providing additional funding of $26.2 million over four years, and ongoing funding of $6.8 million per annum, to implement the Government response to the recommendations of the Independent Review of Youth Detention in Queensland, to improve practices and services pivotal to the safety, wellbeing and rehabilitation of young people in youth detention.
| | | | | | | | | | | | | | | | | | | | |
| | | 2016-17
$‘000 | | | 2017-18
$‘000 | | | 2018-19
$‘000 | | | 2019-20
$‘000 | | | 2020-21
$‘000 | |
Blue Card Efficiency Savings | | | — | | | | 5,000 | | | | — | | | | — | | | | — | |
The Government is providing increased funding of $5 million in 2017-18 for savings not realised from Blue Card Services by the former Government as part of the commitment to protect jobs and maintain the integrity of the Blue Card System. This will enable Blue Card Services to continue current staffing and capability levels.
| | | | | | | | | | | | | | | | | | | | |
| | | 2016-17
$‘000 | | | 2017-18
$‘000 | | | 2018-19
$‘000 | | | 2019-20
$‘000 | | | 2020-21
$‘000 | |
Re-establishment of the Drug Court | | | — | | | | 3,988 | | | | 5,225 | | | | 6,448 | | | | 6,527 | |
The Government is providing increased funding of $22.2 million over four years, and ongoing funding of $6.5 million per annum to reintroduce the Drug Court as per the election commitment and to provide referral and support services.
This forms part of the Government’s total package of $32.6 million over four years ($22.7 million new funding and $9.9 million reprioritised funding) to reinstate the Drug Court and provide referral and support services. Further details of this funding can be found in the Department of Housing and Public Works, Queensland Health and Queensland Police Service sections of this chapter.
The capital component of this measure can be found in Chapter 3 Capital Measures.
60
Budget Measures 2017-18
| | | | | | | | | | | | | | | | | | | | |
| | | 2016-17
$‘000 | | | 2017-18
$‘000 | | | 2018-19
$‘000 | | | 2019-20
$‘000 | | | 2020-21
$‘000 | |
Community Youth Response - Townsville | | | — | | | | 3,151 | | | | 3,617 | | | | — | | | | — | |
The Government is providing increased funding of $6.8 million over two years to continue with the Government’s critical intervention strategies under the Community Youth Response initiative in Townsville. Additional funding of $500,000 is being internally reallocated by the department in 2017-18 to fund this measure. Further details of this initiative can be found in the Queensland Police Service section of this chapter.
| | | | | | | | | | | | | | | | | | | | |
| | | 2016-17
$‘000 | | | 2017-18
$‘000 | | | 2018-19
$‘000 | | | 2019-20
$‘000 | | | 2020-21
$‘000 | |
Aurukun Heightened Response - Youth and Adult Prisoner Reintegration | | | 403 | | | | 598 | | | | — | | | | — | | | | — | |
The Government has provided additional funding of $1 million over two years to coordinate and support young people entering and exiting detention and to provide comprehensive pre and post release support to adult offenders returning to Aurukun, including a dedicated re-entry service.
Further details of this funding can be found in the Department of Aboriginal and Torres Strait Islander Partnerships, Department of Communities, Child Safety and Disability Services, Department of Environment and Heritage Protection, and the Queensland Police Service sections of this chapter.
This forms part of the Government’s overall package of $13.3 million over five years provided to address safety, support the community and improve employment outcomes. Further details of this package can be found in the Overview section of this paper.
61
Budget Measures 2017-18
| | | | | | | | | | | | | | | | | | | | |
| | | 2016-17
$‘000 | | | 2017-18
$‘000 | | | 2018-19
$‘000 | | | 2019-20
$‘000 | | | 2020-21
$‘000 | |
Coroners Court of Queensland Demand Pressures | | | — | | | | 331 | | | | — | | | | — | | | | — | |
The Government is providing additional funding of $331,000 in 2017-18 to support the coronial inquest into deaths at Dreamworld.
| | | | | | | | | | | | | | | | | | | | |
| | | 2016-17
$‘000 | | | 2017-18
$‘000 | | | 2018-19
$‘000 | | | 2019-20
$‘000 | | | 2020-21
$‘000 | |
Community Services Workers Award Wage Increases | | | — | | | | 268 | | | | 724 | | | | 1,186 | | | | 1,366 | |
The Government is providing additional funding of $3.5 million over four years in recognition of increases to award rates for social and community service employees arising from Fair Work Australia’s 2012 Equal Remuneration Order. The funding will be allocated on a prioritised basis to non-government service providers which support dependent and vulnerable Queenslanders. Further details of this funding can be found in the Department of Communities, Child Safety and Disability Services, Queensland Health and Department of Housing and Public Works sections of this chapter.
This forms part of the Government’s overall package of $137.7 million over four years from 2017-18, with $52 million ongoing from 2020-21, which will significantly contribute to the sustainability of the non-government sector. Further details on this package can be found in the Overview section of Chapter 1.
| | | | | | | | | | | | | | | | | | | | |
| | | 2016-17
$‘000 | | | 2017-18
$‘000 | | | 2018-19
$‘000 | | | 2019-20
$‘000 | | | 2020-21
$‘000 | |
Office of the Director of Public Prosecutions - Confiscations Unit | | | — | | | | 255 | | | | 489 | | | | 501 | | | | 514 | |
The Government is providing increased funding of $1.8 million over four years, and ongoing funding of $514,000 per annum for litigation to confiscate the proceeds of crime under the Criminal Proceeds Confiscation Act 2002.
62
Budget Measures 2017-18
Department of National Parks, Sport and Racing
| | | | | | | | | | | | | | | | | | | | |
| | | 2016-17
$‘000 | | | 2017-18
$‘000 | | | 2018-19
$‘000 | | | 2019-20
$‘000 | | | 2020-21
$‘000 | |
Funding to prepare and scuttle ex-HMAS Tobruk | | | 1,500 | | | | 6,000 | | | | 500 | | | | — | | | | — | |
The Government has provided additional funding of $8 million over three years to prepare and scuttle the ex-HMAS Tobruk in Queensland waters to create a world class dive site and deliver a major piece of tourism infrastructure for regional Queensland. The funding is complemented by $2.3 million from local regional councils.
| | | | | | | | | | | | | | | | | | | | |
| | | 2016-17
$‘000 | | | 2017-18
$‘000 | | | 2018-19
$‘000 | | | 2019-20
$‘000 | | | 2020-21
$‘000 | |
Stadiums Queensland | | | — | | | | 4,973 | | | | 5,085 | | | | 5,200 | | | | 5,316 | |
The Government is providing increased funding of $20.6 million over four years to Stadiums Queensland to enhance the management of the State’s premier sporting facilities.
| | | | | | | | | | | | | | | | | | | | |
| | | 2016-17
$‘000 | | | 2017-18
$‘000 | | | 2018-19
$‘000 | | | 2019-20
$‘000 | | | 2020-21
$‘000 | |
Revitalising National Parks | | | — | | | | 2,500 | | | | 2,500 | | | | — | | | | — | |
The Government is providing increased funding of $5 million over two years towards service and infrastructure programs that will enhance nature based and cultural tourism opportunities and the management of the State’s national parks to maintain the breadth and quality of visitor experiences.
The capital component of this measure can be found in Chapter 3 Capital Measures.
63
Budget Measures 2017-18
| | | | | | | | | | | | | | | | | | | | |
| | | 2016-17
$‘000 | | | 2017-18
$‘000 | | | 2018-19
$‘000 | | | 2019-20
$‘000 | | | 2020-21
$‘000 | |
Female Friendly Facilities Program | | | — | | | | 2,000 | | | | — | | | | — | | | | — | |
The Government is providing an additional $2 million for a Queensland first grants program to deliver female friendly facilities. A further $13 million is being internally reprioritised, bringing total funding for the measure to $15 million over two years.
| | | | | | | | | | | | | | | | | | | | |
| | | 2016-17
$‘000 | | | 2017-18
$‘000 | | | 2018-19
$‘000 | | | 2019-20
$‘000 | | | 2020-21
$‘000 | |
Great Barrier Reef Joint Field Management Program | | | — | | | | — | | | | 429 | | | | 437 | | | | 446 | |
The Government will provide increased funding of $1.3 million over three years and ongoing funding of $446,000 per annum (matched by the Australian Government) to support the operations of an additional long range high speed patrol vessel for the Great Barrier Reef Joint Field Management Program to protect and maintain marine and island ecosystems and tourism infrastructure in the Great Barrier Reef.
| | | | | | | | | | | | | | | | | | | | |
| | | 2016-17
$‘000 | | | 2017-18
$‘000 | | | 2018-19
$‘000 | | | 2019-20
$‘000 | | | 2020-21
$‘000 | |
Queensland State Netball Centre | | | 4,000 | | | | — | | | | — | | | | — | | | | — | |
The Government has provided increased funding of $4 million in 2016-17 for significant enhancements to the development and construction of the Queensland State Netball Centre to ensure a state of the art facility is delivered for the benefit of Queensland’s netball community.
Total funding for the Queensland State Netball Centre is $44 million with the Queensland Government providing $34 million and the Australian Government contributing $10 million.
64
Budget Measures 2017-18
Department of Natural Resources and Mines
| | | | | | | | | | | | | | | | | | | | |
| | | 2016-17
$‘000 | | | 2017-18
$‘000 | | | 2018-19
$‘000 | | | 2019-20
$‘000 | | | 2020-21
$‘000 | |
Texas Silver Mine Site | | | 1,590 | | | | 7,502 | | | | — | | | | — | | | | — | |
The Government has provided increased funding of $9.1 million over two years for the ongoing management of the disclaimed Texas Silver Mine site.
The capital component of this measure can be found in Chapter 3 Capital Measures.
| | | | | | | | | | | | | | | | | | | | |
| | | 2016-17
$‘000 | | | 2017-18
$‘000 | | | 2018-19
$‘000 | | | 2019-20
$‘000 | | | 2020-21
$‘000 | |
Strategic Resources Exploration Program | | | — | | | | 3,500 | | | | 7,000 | | | | 7,000 | | | | 2,500 | |
The Government is providing additional funding of $20 million over four years for the Strategic Resources Exploration Program. The funding will support initiatives targeted at the North West Minerals Province and further develop and diversify the Queensland resources sector.
This forms part of the Government’s overall package of $39 million over four years across several departments to deliver initiatives to support the North West Minerals Province. Further details can be found in the Department of State Development, Department of Communities, Child Safety and Disability Services and the Department of the Premier and Cabinet sections of this chapter, as well as the Department of Natural Resources and Mines section of Chapter 3 Capital Measures.
| | | | | | | | | | | | | | | | | | | | |
| | | 2016-17
$‘000 | | | 2017-18
$‘000 | | | 2018-19
$‘000 | | | 2019-20
$‘000 | | | 2020-21
$‘000 | |
Coal Mine Workers’ Health Scheme | | | 2,457 | | | | 1,280 | | | | — | | | | — | | | | — | |
The Government has provided additional funding of $3.7 million over two years to respond to the independent review of the respiratory component of the Coal Mine Workers’ Health Scheme.
65
Budget Measures 2017-18
| | | | | | | | | | | | | | | | | | | | |
| | | 2016-17
$‘000 | | | 2017-18
$‘000 | | | 2018-19
$‘000 | | | 2019-20
$‘000 | | | 2020-21
$‘000 | |
Linc Energy Mine Site | | | 2,072 | | | | 743 | | | | 795 | | | | 827 | | | | 864 | |
The Government has provided additional funding of $5.3 million over five years to undertake preliminary rehabilitation works, provide management and operational oversight of the Linc Energy mine site.
This forms part of the Government’s overall package of $36.3 million over five years. Further details can be found in Chapter 3 Capital Measures and in the Department of Environment and Heritage Protection section of this chapter and Chapter 3 Capital Measures.
| | | | | | | | | | | | | | | | | | | | |
| | | 2016-17
$‘000 | | | 2017-18
$‘000 | | | 2018-19
$‘000 | | | 2019-20
$‘000 | | | 2020-21
$‘000 | |
Natural Resources Investment Program | | | — | | | | — | | | | 10,000 | | | | 10,506 | | | | 10,769 | |
The Government will provide additional funding of $42.3 million over four years from 2018-19 for the Natural Resources Investment Program. This funding will help support the sustainable management of Queensland’s water, land and vegetation resources.
| | | | | | | | | | | | | | | | | | | | |
| | | 2016-17
$‘000 | | | 2017-18
$‘000 | | | 2018-19
$‘000 | | | 2019-20
$‘000 | | | 2020-21
$‘000 | |
Queensland Reef Water Quality Program 2017-2022 | | | — | | | | — | | | | — | | | | — | | | | — | |
The Government is providing increased funding of $88.5 million over five years, held centrally, for the Great Barrier Reef Water Quality Program, as part of the Queensland Government’s commitments the protection of the Great Barrier Reef.
This is part of a comprehensive Great Barrier Reef Water Quality Program across several agencies totalling $175 million over five years from 2017-18. It will support the continuation of critical programs to assist working towards the achievement of water quality targets, including Best Practice Management programs, provision of economic support and decision-making tools for agricultural producers, the Paddock to Reef program and the Natural Resource Management Program for Reef Water Quality. This is in addition to the $100 million provided over five years from 2015-16 to address the recommendations arising from the Great Barrier Reef Water Science Taskforce.
The Department of Environment and Heritage Protection, the Department of Natural Resources and Mines, the Department of Agriculture and Fisheries, the Department of Science, Information Technology and Innovation and private sector partners will work in collaboration to deliver the program.
66
Budget Measures 2017-18
Department of Science, Information Technology and Innovation
| | | | | | | | | | | | | | | | | | | | |
| | | 2016-17
$‘000 | | | 2017-18
$‘000 | | | 2018-19
$‘000 | | | 2019-20
$‘000 | | | 2020-21
$‘000 | |
One-Stop Shop | | | 10,992 | | | | 20,000 | | | | — | | | | — | | | | — | |
The Government has provided increased funding of $31 million over two years to continue the One-Stop Shop program which is focused on delivering improvements to frontline services, encouraging innovation and better services for citizens and businesses.
| | | | | | | | | | | | | | | | | | | | |
| | | 2016-17
$‘000 | | | 2017-18
$‘000 | | | 2018-19
$‘000 | | | 2019-20
$‘000 | | | 2020-21
$‘000 | |
Digital Archive Program - Phase 1 | | | — | | | | 5,016 | | | | 7,685 | | | | — | | | | — | |
The Government is providing additional funding of $12.7 million over two years for the first phase of the four year Digital Archive Program. The program aims to develop and implement a whole-of-Government digital archiving solution for permanent value digital records.
| | | | | | | | | | | | | | | | | | | | |
| | | 2016-17
$‘000 | | | 2017-18
$‘000 | | | 2018-19
$‘000 | | | 2019-20
$‘000 | | | 2020-21
$‘000 | |
Science ICT Remediation and Renewal Program - Phase 1 | | | — | | | | 3,300 | | | | — | | | | — | | | | — | |
The Government is providing additional funding of $3.3 million in 2017-18for the first phase of the Science ICT Remediation and Renewal Program. The program aims to secure science ICT that supports services across Government. The capital component of this measure can be found in Chapter 3 Capital Measures.
67
Budget Measures 2017-18
| | | | | | | | | | | | | | | | | | | | |
| | | 2016-17
$‘000 | | | 2017-18
$‘000 | | | 2018-19
$‘000 | | | 2019-20
$‘000 | | | 2020-21
$‘000 | |
Open Data Policy and Action Plan | | | — | | | | 543 | | | | 509 | | | | — | | | | — | |
The Government is providing additional funding of $1.1 million over two years to implement the co-designed Queensland Government Open Data Policy Statement and Action Plan. The goal of the policy and action plan is to improve access to free, accurate, accessible and well-managed government data to encourage the growth of new and innovative creative services, projects and businesses in Queensland.
| | | | | | | | | | | | | | | | | | | | |
| | | 2016-17
$‘000 | | | 2017-18
$‘000 | | | 2018-19
$‘000 | | | 2019-20
$‘000 | | | 2020-21
$‘000 | |
Advance Queensland - Ignite Ideas Fund | | | — | | | | — | | | | — | | | | — | | | | — | |
The Government is reallocating $10 million over three years from within the $420 million Advance Queensland Program to the popular Advance Queensland Ignite Ideas Fund. Ignite Ideas supports Queensland small to medium enterprises and startups to commercialise their new products and services.
| | | | | | | | | | | | | | | | | | | | |
| | | 2016-17
$‘000 | | | 2017-18
$‘000 | | | 2018-19
$‘000 | | | 2019-20
$‘000 | | | 2020-21
$‘000 | |
Queensland Reef Water Quality Program 2017-2022 | | | — | | | | — | | | | — | | | | — | | | | — | |
The Government is providing increased funding of $88.5 million over five years, held centrally, for the Great Barrier Reef Water Quality Program, as part of the Queensland Government’s commitment to the protection of the Great Barrier Reef.
This is part of a comprehensive Great Barrier Reef Water Quality Program across several agencies totalling $175 million over five years from 2017-18. It will support the continuation of critical programs to assist working towards the achievement of water quality targets, including Best Practice Management programs, provision of economic support and decision-making tools for agricultural producers, the Paddock to Reef program and the Natural Resource Management Program for Reef Water Quality. This is in addition to the $100 million provided over five years from 2015-16 to address the recommendations arising from the Great Barrier Reef Water Science Taskforce.
The Department of Environment and Heritage Protection, the Department of Natural Resources and Mines, the Department of Agriculture and Fisheries, the Department of Science, Information Technology and Innovation and private sector partners will work in collaboration to deliver the program.
68
Budget Measures 2017-18
Department of State Development
| | | | | | | | | | | | | | | | | | | | |
| | | 2016-17
$‘000 | | | 2017-18
$‘000 | | | 2018-19
$‘000 | | | 2019-20
$‘000 | | | 2020-21
$‘000 |
Made in Queensland | | | 170 | | | | 13,670 | | | | 6,160 | | | | — | | | | — | |
The Government has provided $20 million over three years in grant funding to support Queensland’s manufacturing industry. Government will work with small and medium manufacturing enterprises to help them to increase their international productivity and competitiveness, and adopt innovative processes and technologies.
The Department of State Development and Queensland Treasury are jointly responsible for this initiative.
| | | | | | | | | | | | | | | | | | | | |
| | | 2016-17
$‘000 | | | 2017-18
$‘000 | | | 2018-19
$‘000 | | | 2019-20
$‘000 | | | 2020-21
$‘000 | |
Supporting Major State Development Projects | | | — | | | | 11,477 | | | | 13,142 | | | | (1,250 | ) | | | (1,250 | ) |
The Government is providing increased funding of $20.9 million over five years to continue work on the Queen’s Wharf Brisbane development.
| | | | | | | | | | | | | | | | | | | | |
| | | 2016-17
$‘000 | | | 2017-18
$‘000 | | | 2018-19
$‘000 | | | 2019-20
$‘000 | | | 2020-21
$‘000 | |
Supporting the Office of the Coordinator-General | | | — | | | | 4,231 | | | | 4,357 | | | | 4,431 | | | | 4,443 | |
The Government is providing $17.5 million over four years, and $4.4 million ongoing, to support the functions of the Office of the Coordinator-General. This includes the planning, delivery and coordination of large-scale and complex projects, and management of associated environmental impacts.
69
Budget Measures 2017-18
| | | | | | | | | | | | | | | | | | | | |
| | | 2016-17
$‘000 | | | 2017-18
$‘000 | | | 2018-19
$‘000 | | | 2019-20
$‘000 | | | 2020-21
$‘000 | |
Advance Queensland - 10-year Priority Industry Roadmaps and Action Plans | | | — | | | | 3,000 | | | | 4,000 | | | | 4,000 | | | | 4,000 | |
The Government is providing increased funding of $15 million over four years to implement the Advance Queensland Priority Industry Roadmaps and Action Plans, which will support growth and diversification of Queensland’s economy.
This measure builds on the $405 million Advance Queensland program, taking the total investment in Advance Queensland to $420 million.
| | | | | | | | | | | | | | | | | | | | |
| | | 2016-17
$‘000 | | | 2017-18
$‘000 | | | 2018-19
$‘000 | | | 2019-20
$‘000 | | | 2020-21
$‘000 | |
Regional Facilitation Teams | | | 375 | | | | 750 | | | | 375 | | | | — | | | | — | |
The Government has provided $1.5 million over three years for the Regional Facilitation Teams to identify and facilitate private sector investment and infrastructure development opportunities, including projects for consideration under the Jobs and Regional Growth Fund. The Regional Facilitation Teams initiative has total funding of $2 million. Further funding can be found in the Queensland Treasury section of this chapter.
This initiative is part of the $200 million Jobs and Regional Growth Package, targeted at growing regional economies and employment, as announced in the 2016-17 Mid Year Fiscal and Economic Review.
| | | | | | | | | | | | | | | | | | | | |
| | | 2016-17
$‘000 | | | 2017-18
$‘000 | | | 2018-19
$‘000 | | | 2019-20
$‘000 | | | 2020-21
$‘000 | |
Strategic Blueprint for Queensland’s North West Minerals Province | | | — | | | | 320 | | | | 320 | | | | 320 | | | | 320 | |
The Government is providing additional funding of $1.3 million over four years to establish a dedicated government team in the North West Minerals Province. The team and these positions will provide a clear focus on economic diversification, improved access to employment and training services, and engagement with key stakeholders and other levels of government in blueprint implementation and integrated and appropriate service delivery.
70
Budget Measures 2017-18
This forms part of the Government’s overall package of $39 million over four years across several departments to deliver initiatives to support the North West Minerals Province. Further details can be found in the Department of the Premier and Cabinet, Department of Communities, Child Safety and Disability Services and the Department of Natural Resources and Mines section of this Chapter, as well as the Department of Natural Resources and Mines section of Chapter 3 Capital Measures.
| | | | | | | | | | | | | | | | | | | | |
| | | 2016-17
$‘000 | | | 2017-18
$‘000 | | | 2018-19
$‘000 | | | 2019-20
$‘000 | | | 2020-21
$‘000 | |
Jobs and Regional Growth Fund | | | — | | | | — | | | | — | | | | — | | | | — | |
The Government has provided $130 million for the Jobs and Regional Growth Fund over three years from 2016-17. The fund will facilitate private sector projects and create employment and economic growth opportunities in regional Queensland and focuses on regions with higher than average unemployment. The fund will provide one-off financial assistance ranging from $100,000 to over $10 million in either direct grants or relief of State charges on a case-by-case basis. Queensland Treasury and the Department of State Development are jointly responsible for the fund. This initiative can also be found in the Queensland Treasury section of this chapter.
This initiative is part of the $200 million Jobs and Regional Growth Package, targeted at growing regional economies and employment, as announced in the 2016-17 Mid Year Fiscal and Economic Review.
71
Budget Measures 2017-18
Department of the Premier and Cabinet
| | | | | | | | | | | | | | | | | | | | |
| | | 2016-17
$‘000 | | | 2017-18
$‘000 | | | 2018-19
$‘000 | | | 2019-20
$‘000 | | | 2020-21
$‘000 | |
Queensland Museum - Sciencentre Transformation | | | 5,000 | | | | 4,360 | | | | — | | | | — | | | | — | |
The Government has provided additional funding of $9.4 million over two years with a further $1.6 million internally reallocated to transform the Sciencentre at the Queensland Museum into a cutting-edge, interactive Science, Technology, Engineering and Mathematics (STEM) centre to inspire the next generation of Queenslanders.
| | | | | | | | | | | | | | | | | | | | |
| | | 2016-17
$‘000 | | | 2017-18
$‘000 | | | 2018-19
$‘000 | | | 2019-20
$‘000 | | | 2020-21
$‘000 | |
Action On Ice | | | — | | | | 3,150 | | | | — | | | | — | | | | — | |
The Government is providing additional funding of $3.2 million in 2017-18 for an information awareness campaign to enhance public awareness of the nature and effects of crystal methamphetamine (Ice) as part of the Action on Ice package.
The Action on Ice package is a total of $18 million over four years to tackle the harmful use and effects of Ice in Queensland. Further details can be found in the Department of Communities, Child Safety and Disability Services, Queensland Health and Queensland Police Service sections of this chapter.
| | | | | | | | | | | | | | | | | | | | |
| | | 2016-17
$‘000 | | | 2017-18
$‘000 | | | 2018-19
$‘000 | | | 2019-20
$‘000 | | | 2020-21
$‘000 | |
Queensland Museum - State Collection Care and Preservation | | | 850 | | | | 3,150 | | | | 3,150 | | | | 3,150 | | | | 3,150 | |
The Government has provided additional funding of $13.5 million over five years and $3.2 million per annum ongoing to meet the Queensland Museum’s statutory obligations relating to the care and preservation of the State Collection.
72
Budget Measures 2017-18
| | | | | | | | | | | | | | | | | | | | |
| | | 2016-17
$‘000 | | | 2017-18
$‘000 | | | 2018-19
$‘000 | | | 2019-20
$‘000 | | | 2020-21
$‘000 | |
Indigenous Performance | | | — | | | | 2,050 | | | | — | | | | — | | | | — | |
The Government is providing additional funding of $2.1 million in 2017-18 to implement a dedicated arts incubator space for start-up Indigenous performance companies and to invest in new dance commissions performed at the Cairns Centre of Contemporary Arts and within Indigenous communities.
| | | | | | | | | | | | | | | | | | | | |
| | | 2016-17
$‘000 | | | 2017-18
$‘000 | | | 2018-19
$‘000 | | | 2019-20
$‘000 | | | 2020-21
$‘000 | |
Investing in Regional Arts | | | — | | | | 2,000 | | | | 1,500 | | | | 1,500 | | | | 1,500 | |
The Government is providing additional funding of $6.5 million over four years for Indigenous and regional arts initiatives, which will employ dedicated regionally based arts officers and provide increased community and Indigenous arts activities across the State.
| | | | | | | | | | | | | | | | | | | | |
| | | 2016-17
$‘000 | | | 2017-18
$‘000 | | | 2018-19
$‘000 | | | 2019-20
$‘000 | | | 2020-21
$‘000 | |
Rockhampton Art Gallery | | | — | | | | 2,000 | | | | — | | | | — | | | | — | |
The Government is providing additional funding of $2 million in 2017-18 towards the planned relocation of the Rockhampton Art Gallery.
| | | | | | | | | | | | | | | | | | | | |
| | | 2016-17
$‘000 | | | 2017-18
$‘000 | | | 2018-19
$‘000 | | | 2019-20
$‘000 | | | 2020-21
$‘000 | |
Building Social Cohesion | | | — | | | | 1,964 | | | | 1,814 | | | | 1,814 | | | | 1,814 | |
The Government is providing increased funding of $7.4 million over four years to build social cohesion in Queensland. This includes a state-wide communication and engagement campaign as well as supporting community-driven activities and targeted engagement with specific communities to support and strengthen communities in regional areas of Queensland.
73
Budget Measures 2017-18
| | | | | | | | | | | | | | | | | | | | |
| | | 2016-17
$‘000 | | | 2017-18
$‘000 | | | 2018-19
$‘000 | | | 2019-20
$‘000 | | | 2020-21
$‘000 | |
Queensland Family and Child Commission - Responsive Child Protection System | | | — | | | | 700 | | | | 114 | | | | 114 | | | | 114 | |
The Government is providing additional funding of $1 million over four years from 2017-18 to respond to legislative requirements to support a responsive child protection system. Further funding of $1.1 million in 2016-17 has been internally reallocated by the department.
This forms part of a $2.9 million package, which includes $800,000 in additional capital for a project to enhance the Queensland Child Death Register and reporting capability, including an ICT upgrade and migration and entry of data from existing systems and files.
Further details can be found in Chapter 3 Capital Measures.
| | | | | | | | | | | | | | | | | | | | |
| | | 2016-17
$‘000 | | | 2017-18
$‘000 | | | 2018-19
$‘000 | | | 2019-20
$‘000 | | | 2020-21
$‘000 | |
Domestic and Family Violence Response - Evaluation Framework | | | — | | | | 611 | | | | 781 | | | | 381 | | | | 366 | |
The Government is providing increased funding of $2.1 million over four years to implement a detailed framework to evaluate the outcomes and effectiveness of the Domestic and Family Violence Prevention Strategy. This forms part of the Government’s overall package to respond to the Not Now, Not Ever report since the 2015-16 Budget.
| | | | | | | | | | | | | | | | | | | | |
| | | 2016-17
$‘000 | | | 2017-18
$‘000 | | | 2018-19
$‘000 | | | 2019-20
$‘000 | | | 2020-21
$‘000 | |
Strategic Blueprint for Queensland’s North West Minerals Province | | | — | | | | — | | | | — | | | | — | | | | — | |
The Government is providing additional funding of $10 million over two years (2017-18 and 2018-19) to support the North West Minerals Province centred around Mount Isa and Cloncurry and surrounds. This supports the region by facilitating continued resources sector development, promoting greater diversification of the regional economy and creating employment opportunities, and working with businesses and communities to deliver integrated and appropriate services. Funding is to be held centrally subject to finalisation of the Strategic Blueprint.
This forms part of the Government’s overall package of $39 million over four years across several departments to deliver initiatives to support the North West Minerals Province.
74
Budget Measures 2017-18
Further details can be found in the Department of State Development, Department of Communities, Child Safety and Disability Services and the Department of Natural Resources and Mines section of this chapter, as well as the Department of Natural Resources and Mines section of Chapter 3 Capital Measures.
75
Budget Measures 2017-18
Department of Tourism, Major Events, Small Business and the Commonwealth Games
| | | | | | | | | | | | | | | | | | | | |
| | | 2016-17
$‘000 | | | 2017-18
$‘000 | | | 2018-19
$‘000 | | | 2019-20
$‘000 | | | 2020-21
$‘000 | |
Major Events funding for Tourism and Events Queensland (TEQ) | | | 5,400 | | | | 4,775 | | | | — | | | | — | | | | — | |
The Government has provided additional funding of $10.2 million over two years for TEQ to secure major events for Queensland. This funding supports the Advancing Tourism 2016-20: Growing Queensland Jobs Strategy by attracting and growing events as one of the key strategies to capitalise on Queensland’s growing tourism industry and increase market share.
| | | | | | | | | | | | | | | | | | | | |
| | | 2016-17
$‘000 | | | 2017-18
$‘000 | | | 2018-19
$‘000 | | | 2019-20
$‘000 | | | 2020-21
$‘000 | |
Continuation of the funding guarantee for Tourism and Events Queensland (TEQ) | | | — | | | | — | | | | — | | | | — | | | | 47,052 | |
The Government will provide increased funding of $47.1 million in 2020-21 to continue the restoration of funding to TEQ. This will allow TEQ to continue to carry out its core functions including promoting Queensland destinations and driving tourism growth.
| | | | | | | | | | | | | | | | | | | | |
| | | 2016-17
$‘000 | | | 2017-18
$‘000 | | | 2018-19
$‘000 | | | 2019-20
$‘000 | | | 2020-21
$‘000 | |
Tourism and Small Business Recovery Package | | | — | | | | 12,200 | | | | — | | | | — | | | | — | |
The Government is providing additional funding of $8.2 million for a Tourism and Small Business Recovery Package as part of the Operation Queensland Plan: State Recovery Plan 2017-19. Under this package, tourism and other small businesses within cyclone affected areas of the Whitsunday region may access: grants to help small businesses recover, rebuild and employ; a recovery fund targeted at rebuilding tourism infrastructure; or the ‘Go Local - keep Queensland going strong’ campaign to encourage Queenslanders to buy from local businesses. The Australian Government will provide $4 million and funding of $100,000 has also been reprioritised by the department internally to fund this measure.
76
Budget Measures 2017-18
| | | | | | | | | | | | | | | | | | | | |
| | | 2016-17
$‘000 | | | 2017-18
$‘000 | | | 2018-19
$‘000 | | | 2019-20
$‘000 | | | 2020-21
$‘000 | |
Young Tourism Leaders Network | | | 75 | | | | 150 | | | | 75 | | | | — | | | | — | |
The Government has provided additional funding of $300,000 over three years to fund the Young Tourism Leaders Network. The network is part of the Advancing Tourism 2016-20: Growing Queensland Jobs Strategy. It provides assistance to young people working in the tourism industry, to help them become leaders who will encourage and inspire youth and promote career pathways in tourism.
This initiative is part of the $200 million Jobs and Regional Growth Package, targeted at growing regional economies and employment, as announced in the 2016-17 Mid Year Fiscal and Economic Review.
| | | | | | | | | | | | | | | | | | | | |
| | | 2016-17
$‘000 | | | 2017-18
$‘000 | | | 2018-19
$‘000 | | | 2019-20
$‘000 | | | 2020-21
$‘000 | |
Cyclone Recovery Marketing Program | | | 1,500 | | | | — | | | | — | | | | — | | | | — | |
The Government has provided additional funding of $500,000 for a promotional campaign to assist Queensland’s tourism industry to recover from the effects of Severe Tropical Cyclone Debbie. The Australian Government contributed $1 million and further funding of $500,000 was reprioritised by Tourism and Events Queensland internally to fund this measure, bringing total funding for this measure to $2 million.
77
Budget Measures 2017-18
Department of Transport and Main Roads
| | | | | | | | | | | | | | | | | | | | |
| | | 2016-17
$‘000 | | | 2017-18
$‘000 | | | 2018-19
$‘000 | | | 2019-20
$‘000 | | | 2020-21
$‘000 | |
Personalised Transport Reforms Industry Adjustment Assistance Package | | | 40,000 | | | | 61,770 | | | | — | | | | — | | | | — | |
The Government has provided additional funding of $101.8 million over two years for the Personalised Transport Reforms Industry Adjustment Assistance Package. The funding will be used to help taxi and limousine licence holders adjust to more competition and take advantage of new opportunities without a fare levy. Funding will also cover the cost to implement and administer the booking entity authorisation for its first year of implementation and to waive the cost of the Taxi Industry Security Levy for 2017-18 to further minimise the financial burden on the taxi industry.
| | | | | | | | | | | | | | | | | | | | |
| | | 2016-17
$‘000 | | | 2017-18
$‘000 | | | 2018-19
$‘000 | | | 2019-20
$‘000 | | | 2020-21
$‘000 | |
Rail Transport Services | | | — | | | | 51,024 | | | | 51,266 | | | | 53,333 | | | | 55,465 | |
The Government is providing increased funding of $211.1 million over four years from 2017-18 and $55.5 million ongoing to supplement the provision of rail transport services.
| | | | | | | | | | | | | | | | | | | | |
| | | 2016-17
$‘000 | | | 2017-18
$‘000 | | | 2018-19
$‘000 | | | 2019-20
$‘000 | | | 2020-21
$‘000 | |
Transport Service Contract | | | — | | | | 25,000 | | | | — | | | | — | | | | — | |
The Government is providing increased funding of $25 million in 2017-18 for the Transport Service Contract with Queensland Rail. The funding will be used to offset costs associated with the implementation of the recommendations of the Strachan Commission of Inquiry.
78
Budget Measures 2017-18
| | | | | | | | | | | | | | | | | | | | |
| | | 2016-17
$‘000 | | | 2017-18
$‘000 | | | 2018-19
$‘000 | | | 2019-20
$‘000 | | | 2020-21
$‘000 | |
Continuation of the Local Fare Scheme and a Trial Period for the Western Cape and Gulf | | | — | | | | 6,034 | | | | 4,233 | | | | — | | | | — | |
The Government is providing increased funding of $10.3 million over two years from 2017-18. This includes funding of $8.3 million over two years to continue the current scheme to improve access to critical services in Cape York and Torres Strait regions, and $2 million in 2017-18 to expand the program to the Western Cape and Gulf for a trial period. The scheme will assist with affordability of air travel in these regional and remote low socio-economic communities.
| | | | | | | | | | | | | | | | | | | | |
| | | 2016-17
$‘000 | | | 2017-18
$‘000 | | | 2018-19
$‘000 | | | 2019-20
$‘000 | | | 2020-21
$‘000 | |
CityTrain Response Unit | | | 3,517 | | | | 3,704 | | | | 1,540 | | | | — | | | | — | |
The Government has provided additional funding of $8.8 million over three years to support the operation of the CityTrain Response Unit.
| | | | | | | | | | | | | | | | | | | | |
| | | 2016-17
$‘000 | | | 2017-18
$‘000 | | | 2018-19
$‘000 | | | 2019-20
$‘000 | | | 2020-21
$‘000 | |
Maritime Safety Activities | | | 2,315 | | | | 3,388 | | | | 2,456 | | | | 2,527 | | | | 2,604 | |
The Government has provided additional funding of $13.3 million over five years for maritime safety activities. This is fully offset by an increase in expected administered conservancy fee revenues. This funding will be used to meet additional costs as a result of increased shipping movements associated with the LNG industry, contributions to the Australian Maritime Safety Authority and a Great Barrier Reef and Torres Strait Vessel Traffic Service (REEFVTS) enhancement.
79
Budget Measures 2017-18
| | | | | | | | | | | | | | | | | | | | |
| | | 2016-17
$‘000 | | | 2017-18
$‘000 | | | 2018-19
$‘000 | | | 2019-20
$‘000 | | | 2020-21
$‘000 | |
Gold Coast Waterways Authority | | | — | | | | 1,980 | | | | 1,980 | | | | 1,980 | | | | 1,980 | |
The Government is providing increased funding of $2 million per annum to ensure that the Gold Coast Waterways Authority can deliver its capital and operational works programs.
| | | | | | | | | | | | | | | | | | | | |
| | | 2016-17
$‘000 | | | 2017-18
$‘000 | | | 2018-19
$‘000 | | | 2019-20
$‘000 | | | 2020-21
$‘000 | |
Mornington Island Runway | | | 4,500 | | | | — | | | | — | | | | — | | | | — | |
The Government has provided additional funding of $4.5 million in 2016-17 towards repairing the Mornington Island runway. The Mornington Shire Council has provided a further $1.5 million, and additional funding of $2 million has also been reprioritised by the department internally to fund this measure.
80
Budget Measures 2017-18
Electoral Commission of Queensland
| | | | | | | | | | | | | | | | | | | | |
| | | 2016-17
$‘000 | | | 2017-18
$‘000 | | | 2018-19
$‘000 | | | 2019-20
$‘000 | | | 2020-21
$‘000 | |
Redistribution Information Letter | | | — | | | | 1,250 | | | | — | | | | — | | | | — | |
The Government is providing additional funding of $1.3 million in 2017-18 for letters to inform affected voters of electoral district redistributions.
| | | | | | | | | | | | | | | | | | | | |
| | | 2016-17
$‘000 | | | 2017-18
$‘000 | | | 2018-19
$‘000 | | | 2019-20
$‘000 | | | 2020-21
$‘000 | |
Electronic Disclosure System | | | — | | | | — | | | | — | | | | — | | | | — | |
The Commission has internally reallocated funding of $1.1 million over five years from 2016-17 to maintain and support an Electronic Disclosure System (EDS). The capital component of this measure can be found in Chapter 3 Capital Measures.
| | | | | | | | | | | | | | | | | | | | |
| | | 2016-17
$‘000 | | | 2017-18
$‘000 | | | 2018-19
$‘000 | | | 2019-20
$‘000 | | | 2020-21
$‘000 | |
SEMS Replacement Project | | | — | | | | — | | | | — | | | | — | | | | — | |
The Government is providing increased funding over four years to replace the Strategic Elections Management System (SEMS). SEMS is the primary operating system fundamental to electoral administration in Queensland.
Expenditure for this measure is subject to commercial negotiation with potential providers.
81
Budget Measures 2017-18
Legislative Assembly of Queensland
| | | | | | | | | | | | | | | | | | | | |
| | | 2016-17
$‘000 | | | 2017-18
$‘000 | | | 2018-19
$‘000 | | | 2019-20
$‘000 | | | 2020-21
$‘000 | |
Broadcast of Proceedings and Members’ Video on Demand Upgrade | | | 73 | | | | — | | | | — | | | | — | | | | — | |
The Government has provided additional funding of $73,000 in 2016-17 and reprioritised ongoing funding of $61,000 per annum from 2017-18 for software licensing costs and depreciation expense for an upgrade of the system delivering public broadcast of parliamentary and committee proceedings and related Video-on-Demand (VOD) media services delivered to Members.
The capital component of this measure can be found in Chapter 3 Capital Measures.
| | | | | | | | | | | | | | | | | | | | |
| | | 2016-17
$‘000 | | | 2017-18
$‘000 | | | 2018-19
$‘000 | | | 2019-20
$‘000 | | | 2020-21
$‘000 | |
Coal Workers’ Pneumoconiosis Select Committee | | | 520 | | | | — | | | | — | | | | — | | | | — | |
The Government has provided additional funding of $520,000 in 2016-17 to the Coal Workers’ Pneumoconiosis (CWP) Select Committee for the inquiry and reporting on the re-emergence of CWP among coal mine workers in Queensland.
82
Budget Measures 2017-18
Public Safety Business Agency
| | | | | | | | | | | | | | | | | | | | |
| | | 2016-17
$‘000 | | | 2017-18
$‘000 | | | 2018-19
$‘000 | | | 2019-20
$‘000 | | | 2020-21
$‘000 | |
Queensland Government Air Aircraft Maintenance and Compliance | | | — | | | | 3,267 | | | | — | | | | — | | | | — | |
The Government is providing additional funding of $3.3 million in 2017-18 to ensure Queensland Government Air’s compliance with new Civil Aviation Safety Authority training requirements and regulations. This funding enables Queensland Government Air to continue to support the emergency helicopter network across the state for search and rescue, natural disasters, police and aeromedical operations and provide fixed wing transport services for police, government and organ transfer. The capital component of this measure can be found in Chapter 3 Capital Measures.
| | | | | | | | | | | | | | | | | | | | |
| | | 2016-17
$‘000 | | | 2017-18
$‘000 | | | 2018-19
$‘000 | | | 2019-20
$‘000 | | | 2020-21
$‘000 | |
Mount Isa Rotary Wing Base Maintenance | | | 800 | | | | 2,400 | | | | — | | | | — | | | | — | |
The Government has provided increased funding of $3.2 million over two years to maintain the Mount Isa rotary wing base until 30 June 2018. This funding allows LifeFlight to continue providing a range of helicopter rescue and aeromedical retrieval services to the people in Mount Isa and surrounding areas, ensuring the community has access to urgent aeromedical care when needed.
83
Budget Measures 2017-18
Queensland Fire and Emergency Services
| | | | | | | | | | | | | | | | | | | | |
| | | 2016-17
$‘000 | | | 2017-18
$‘000 | | | 2018-19
$‘000 | | | 2019-20
$‘000 | | | 2020-21
$‘000 | |
Queensland Fire and Emergency Service Certified Agreement 2016 | | | 2,366 | | | | 4,362 | | | | 4,989 | | | | — | | | | — | |
The Government has provided additional funding of $11.7 million over three years for the cost of the Queensland Fire and Emergency Services Certified Agreement 2016. The agreement includes an annual increase to wages and the implementation of changes to pay points and allowances.
84
Budget Measures 2017-18
Queensland Health
| | | | | | | | | | | | | | | | | | | | |
| | | 2016-17
$‘000 | | | 2017-18
$‘000 | | | 2018-19
$‘000 | | | 2019-20
$‘000 | | | 2020-21
$‘000 | |
Herston Quarter Program | | | 2,250 | | | | 4,700 | | | | 4,700 | | | | 4,900 | | | | 3,900 | |
The Government has provided additional funding of $31.5 million over eight years for Metro North Hospital and Health Service (MNHHS) to manage and implement the delivery stage of the Herston Quarter Redevelopment Project; a private sector led mixed-use development within the Herston health precinct. The funding will enable MNHHS to ensure the successful delivery of the $1.1 billion private and public sector investment in the Herston Quarter, providing world-class health, bio-medical, retail and accommodation facilities.
| | | | | | | | | | | | | | | | | | | | |
| | | 2016-17
$‘000 | | | 2017-18
$‘000 | | | 2018-19
$‘000 | | | 2019-20
$‘000 | | | 2020-21
$‘000 | |
Queensland Parole System Review - Immediate Reforms | | | — | | | | 3,000 | | | | 3,000 | | | | 3,000 | | | | 3,000 | |
The Government is providing increased funding of $3 million per annum from 2017-18 to enhance services for prisoners with acute mental health needs.
This measure is part of a larger program reforming the Queensland Parole System, with total funding of $265 million over six years. Further details can be found in the Department of Justice and Attorney-General section of this chapter and Chapter 3 Capital Measures.
| | | | | | | | | | | | | | | | | | | | |
| | | 2016-17
$‘000 | | | 2017-18
$‘000 | | | 2018-19
$‘000 | | | 2019-20
$‘000 | | | 2020-21
$‘000 | |
Community Services Workers Award Wage Increases | | | — | | | | 2,185 | | | | 5,925 | | | | 9,749 | | | | 11,246 | |
The Government is providing additional funding of $29.1 million over four years in recognition of increases to award rates for social and community service employees arising from Fair Work Australia’s 2012 Equal Remuneration Order. The funding will be allocated on a prioritised basis to non-government service providers which support dependent and vulnerable Queenslanders. Further details of this funding can be found in the Department of Communities, Child Safety and Disability Services, Department of Justice and Attorney-General and Department of Housing and Public Works sections of this chapter.
This forms part of the Government’s overall package of $137.7 million over four years from 2017-18, with $52 million ongoing from 2020-21, which will significantly contribute to the sustainability of the non-government sector. Further details on this package can be found in Chapter 1 Overview.
85
Budget Measures 2017-18
| | | | | | | | | | | | | | | | | | | | |
| | | 2016-17
$‘000 | | | 2017-18
$‘000 | | | 2018-19
$‘000 | | | 2019-20
$‘000 | | | 2020-21
$‘000 | |
Transition of 17 Year Olds to the Youth Justice System | | | — | | | | 1,500 | | | | 1,500 | | | | 1,500 | | | | 1,500 | |
The Government is providing increased funding of $1.5 million per annum for health-related services to support the transition of 17 year olds from Queensland’s adult justice system to the youth justice system.
This forms part of the Government’s total package of $199.6 million over four years to Transition 17 year olds to the Youth Justice System. Further details of this funding can be found in the Department of Justice and Attorney-General and Queensland Police Service sections of this chapter and the Department of Justice and Attorney-General section of Chapter 3 Capital Measures.
| | | | | | | | | | | | | | | | | | | | |
| | | 2016-17
$‘000 | | | 2017-18
$‘000 | | | 2018-19
$‘000 | | | 2019-20
$‘000 | | | 2020-21
$‘000 | |
Action on Ice | | | — | | | | — | | | | — | | | | — | | | | — | |
Funding of $3.3 million over four years is being internally reallocated by Queensland Health for a range of initiatives as part of the Action on Ice package. This funding will enhance the capacity of the Alcohol and Drugs Information Service, expand services provided under the Family Drug Support program, and provide additional training and resources to frontline service providers.
The Action on Ice package is a total of $18 million over four years to tackle the harmful use and effects of Ice in Queensland. Further details can be found in the Department of the Premier and Cabinet, Department of Communities, Child Safety and Disability Services and Queensland Police Service sections of this chapter.
86
Budget Measures 2017-18
| | | | | | | | | | | | | | | | | | | | |
| | | 2016-17
$‘000 | | | 2017-18
$‘000 | | | 2018-19
$‘000 | | | 2019-20
$‘000 | | | 2020-21
$‘000 | |
Operational Growth Funding | | | — | | | | — | | | | — | | | | — | | | | 728,000 | |
The Government will provide increased funding of $728 million in 2020-21 to support the ongoing growth in demand for health and ambulance services. The funding is based on growth in activity of four per cent for public hospital services and cost growth in line with the projected Consumer Price Index.
| | | | | | | | | | | | | | | | | | | | |
| | | 2016-17
$‘000 | | | 2017-18
$‘000 | | | 2018-19
$‘000 | | | 2019-20
$‘000 | | | 2020-21
$‘000 | |
Re-establishment of the Drug Court | | | — | | | | — | | | | — | | | | — | | | | — | |
Funding of $3.7 million over four years from 2017-18 and $1.1 million per annum ongoing has been internally reallocated by Queensland Health for health-related services associated with the re-introduction the Drug Court.
This forms part of the Government’s total package of $32.6 million over four years ($22.7 million new funding and $9.9 million reprioritised funding) to reinstate the Drug Court and provide referral and support services. Further details can be found in the Department of Justice and Attorney-General, Department of Housing and Public Works and Queensland Police Service sections of this chapter and in Chapter 3 Capital Measures.
87
Budget Measures 2017-18
Queensland Police Service
| | | | | | | | | | | | | | | | | | | | |
| | | 2016-17
$‘000 | | | 2017-18
$‘000 | | | 2018-19
$‘000 | | | 2019-20
$‘000 | | | 2020-21
$‘000 | |
Queensland Police Service Certified Agreement 2016 | | | 15,165 | | | | 22,097 | | | | 29,275 | | | | — | | | | — | |
The Government has provided additional funding of $66.5 million over three years for the cost of the Queensland Police Service Certified Agreement 2016. The agreement includes an annual increase to wages and recognises the increasing complexity of policing, including counter-terrorism, tackling serious organised crime, domestic and family violence and security for the 2018 Gold Coast Commonwealth Games.
| | | | | | | | | | | | | | | | | | | | |
| | | 2016-17
$‘000 | | | 2017-18
$‘000 | | | 2018-19
$‘000 | | | 2019-20
$‘000 | | | 2020-21
$‘000 | |
Police for Counter Terrorism, Rapid Action and Patrols Group and other priority areas | | | — | | | | 6,253 | | | | 8,481 | | �� | | 8,688 | | | | 8,899 | |
The Government is providing increased funding of $32.3 million over four years from 2017-18 and $8.9 million per annum ongoing for an additional 30 Counter-Terrorism police officers and an additional 20 police officers for priority areas of need to tackle crime and improve community safety. Funding of $11.4 million over four years and $3.2 million ongoing has also been internally reprioritised by the department to provide 20 additional police officers for the Townsville Rapid Action and Patrols Group.
| | | | | | | | | | | | | | | | | | | | |
| | | 2016-17
$‘000 | | | 2017-18
$‘000 | | | 2018-19
$‘000 | | | 2019-20
$‘000 | | | 2020-21
$‘000 | |
Camera Detected Offence Program | | | — | | | | 2,455 | | | | 3,338 | | | | 4,219 | | | | 4,802 | |
The Government is providing increased funding of $14.8 million over four years to target mobile speed cameras to areas of highest risk.
The funding under the Camera Detected Offence Program (CDOP) has been reprofiled to reflect expected revenues following the outcomes of the Queensland Audit Office review of the Camera Scheduling and Reporting System and is reviewed annually.
The Government is providing total increased funding of $45 million over four years across departments as part of CDOP. Further funding can be found in the Department of Transport and Main Roads and Queensland Police Service sections of Chapter 3 Capital Measures.
88
Budget Measures 2017-18
| | | | | | | | | | | | | | | | | | | | |
| | | 2016-17
$‘000 | | | 2017-18
$‘000 | | | 2018-19
$‘000 | | | 2019-20
$‘000 | | | 2020-21
$‘000 | |
Domestic and Family Violence Response - Specialist Domestic and Family Violence Courts | | | — | | | | 1,734 | | | | 1,811 | | | | 2,455 | | | | 2,524 | |
The Government is providing increased funding of $8.5 million over four years (which includes allocation of funding held in a whole-of-Government contingency in the 2016-17 Budget) and $2.5 million ongoing for additional prosecutorial staff to continue supporting the Specialist Domestic and Family Violence courts in Southport as well as further rollout to Beenleigh and Townsville (civil) including circuit courts to Mount Isa and Palm Island.
This forms part of the Government’s total package of $69.5 million over four years to rollout Specialist Domestic and Family Violence Courts, which includes $40.4 million over four years provided as a whole-of-Government contingency for this measure in the 2016-17 Budget. Further details of this funding can be found in the Department of Communities, Child Safety and Disability Services and Department of Justice and Attorney-General sections of this chapter and the Department of Justice and Attorney-General section of Chapter 3 Capital Measures.
This forms part of the Government’s overall package to respond to the Not Now, Not Ever report since the 2015-16 Budget.
| | | | | | | | | | | | | | | | | | | | |
| | | 2016-17
$‘000 | | | 2017-18
$‘000 | | | 2018-19
$‘000 | | | 2019-20
$‘000 | | | 2020-21
$‘000 | |
Project Booyah | | | 532 | | | | 1,617 | | | | 1,619 | | | | 1,724 | | | | 1,873 | |
The Government has provided increased funding of $7.4 million over five years and ongoing funding of $1.9 million per annum to continue Project Booyah in nine locations. Project Booyah is an early intervention program for at risk young people which seeks to address participants’ disengagement with family, community and education, and reduce offending. Additional funding of $1.4 million per annum has also been internally reprioritised by the department to fund this measure.
89
Budget Measures 2017-18
| | | | | | | | | | | | | | | | | | | | |
| | | 2016-17
$‘000 | | | 2017-18
$‘000 | | | 2018-19
$‘000 | | | 2019-20
$‘000 | | | 2020-21
$‘000 | |
Transition of 17 year olds to the Youth Justice System | | | — | | | | 1,500 | | | | 2,000 | | | | 2,000 | | | | 2,000 | |
The Government is providing additional funding of $7.5 million over four years and ongoing funding of $2 million per annum for policing activities associated with an increased youth justice cohort.
This forms part of the Government’s total package of $199.6 million over four years to Transition 17 year olds to the Youth Justice System. Further details of this funding can be found in the Department of Justice and Attorney-General and Queensland Health sections of this chapter and the Department of Justice and Attorney-General section of Chapter 3 Capital Measures.
| | | | | | | | | | | | | | | | | | | | |
| | | 2016-17
$‘000 | | | 2017-18
$‘000 | | | 2018-19
$‘000 | | | 2019-20
$‘000 | | | 2020-21
$‘000 | |
Action on Ice - Roadside Drug Testing Program | | | — | | | | 972 | | | | 969 | | | | 1,096 | | | | 1,045 | |
The Government is providing increased funding of $4.1 million over four years to expand roadside drug testing by up to 12,500 tests per annum as part of the Action on Ice Package.
The Action on Ice Package is a total of $18 million over four years to tackle the harmful use and effects of Ice in Queensland. Further details can be found in the Department of the Premier and Cabinet, Department of Communities, Child Safety and Disability Services and Queensland Health sections of this chapter.
| | | | | | | | | | | | | | | | | | | | |
| | | 2016-17
$‘000 | | | 2017-18
$‘000 | | | 2018-19
$‘000 | | | 2019-20
$‘000 | | | 2020-21
$‘000 | |
Aurukun Heightened Response - Aurukun Policing Model | | | 854 | | | | 569 | | | | — | | | | — | | | | — | |
The Government has provided increased funding of $1.4 million over two years to maintain high visibility policing in Aurukun until December 2017. This funding will enable an increased number of police and policing operations to ensure peace and good order in the community and support the delivery of the Government’s Aurukun Four-Point Plan.
Further details of this funding can be found in the Department of Aboriginal and Torres Strait Islander Partnerships, the Department of Communities, Child Safety and Disability Services, the Department of Environment and Heritage Protection and the Department of Justice and Attorney-General sections of this chapter.
90
Budget Measures 2017-18
This forms part of the Government’s overall package of $13.3 million over five years provided to address safety, support the community and improve employment outcomes. Further details of this package can be found in the Overview section of this paper.
| | | | | | | | | | | | | | | | | | | | |
| | | 2016-17
$‘000 | | | 2017-18
$‘000 | | | 2018-19
$‘000 | | | 2019-20
$‘000 | | | 2020-21
$‘000 | |
Community Youth Response - Townsville | | | — | | | | 249 | | | | 283 | | | | — | | | | — | |
The Government is providing additional funding of $532,000 over two years to provide additional prosecutorial staff to support the Specialist High Risk Youth Court as part of the Government’s critical intervention strategies under the Community Youth Response in Townsville.
Further details of this funding can be found in the Department of Justice and Attorney-General section of this chapter.
| | | | | | | | | | | | | | | | | | | | |
| | | 2016-17
$‘000 | | | 2017-18
$‘000 | | | 2018-19
$‘000 | | | 2019-20
$‘000 | | | 2020-21
$‘000 | |
Additional Civilian Prosecutors | | | — | | | | — | | | | — | | | | — | | | | — | |
Funding of $7.1 million over two years from 2016-17 has been internally reallocated by the department to provide additional prosecutorial staff across the State. These additional staff will assist Police Prosecution Corps to overcome significant increases in workload and ensure prosecutorial services meet the expectations of the community and the judiciary.
| | | | | | | | | | | | | | | | | | | | |
| | | 2016-17
$‘000 | | | 2017-18
$‘000 | | | 2018-19
$‘000 | | | 2019-20
$‘000 | | | 2020-21
$‘000 | |
Operation Oscar Merchant | | | — | | | | — | | | | — | | | | — | | | | — | |
Funding of $906,000 in 2016-17 has been internally reallocated by the department for high visibility, targeted, and intelligence-based policing in Townsville as part of Operation Oscar Merchant. This Operation increased community safety and enabled the recommendations and findings of the Stronger Communities Action Group to be implemented.
91
Budget Measures 2017-18
| | | | | | | | | | | | | | | | | | | | |
| | | 2016-17
$‘000 | | | 2017-18
$‘000 | | | 2018-19
$‘000 | | | 2019-20
$‘000 | | | 2020-21
$‘000 | |
Re-Establishment of the Drug Court | | | — | | | | — | | | | — | | | | — | | | | — | |
Funding of $3.6 million over four years and $1 million ongoing has been internally reallocated by the department to provide additional prosecutorial staff to support the establishment of the Drug Court in Brisbane.
This forms part of the Government’s total package of $32.6 million over four years ($22.7 million new funding and $9.9 million reprioritised funding) to reinstate the Drug Court and provide referral and support services. Further details of this funding can be found in the Department of Housing and Public Works, Queensland Health and Department of Justice and Attorney-General sections of this chapter.
The capital component of this measure can be found in the Department of Justice and Attorney-General section of Chapter 3 Capital Measures.
92
Budget Measures 2017-18
Queensland Treasury
| | | | | | | | | | | | | | | | | | | | |
| | | 2016-17
$‘000 | | | 2017-18
$‘000 | | | 2018-19
$‘000 | | | 2019-20
$‘000 | | | 2020-21
$‘000 | |
Jobs and Regional Growth Fund | | | 1,083 | | | | 88,833 | | | | 40,083 | | | | — | | | | — | |
The Government has provided $130 million for the Jobs and Regional Growth Fund over three years as part of the broader $200 million Jobs and Regional Growth Package. The fund will facilitate private sector projects and create employment and economic growth opportunities in regional Queensland and focuses on regions with higher than average unemployment. The fund will provide one-off financial assistance ranging from $100,000 to over $10 million in either direct grants or relief of State charges on a case-by-case basis.
The fund will support regional growth and job creation, assist business to grow or expand in Queensland and target businesses and sectors such as agriculture, resources, tourism, manufacturing and construction. Queensland Treasury and the Department of State Development are jointly responsible for the fund. This initiative can also be found in the Department of State Development section of this chapter.
| | | | | | | | | | | | | | | | | | | | |
| | | 2016-17
$‘000 | | | 2017-18
$‘000 | | | 2018-19
$‘000 | | | 2019-20
$‘000 | | | 2020-21
$‘000 | |
Back to Work - Regional Employment Package | | | — | | | | 50,000 | | | | — | | | | — | | | | — | |
The Government is providing increased funding of $50 million in 2017-18 to support continuation of the Back to Work regional program.
93
Budget Measures 2017-18
| | | | | | | | | | | | | | | | | | | | |
| | | 2016-17
$‘000 | | | 2017-18
$‘000 | | | 2018-19
$‘000 | | | 2019-20
$‘000 | | | 2020-21
$‘000 | |
Back to Work - South East Queensland | | | 51 | | | | 13,977 | | | | 13,490 | | | | — | | | | — | |
The Government has provided additional funding of $27.5 million over three years to administer a package of employer support payments in South East Queensland (SEQ). The package is designed to stimulate economic and labour market conditions in SEQ by giving businesses the confidence to employ youth and long-term unemployed. This is similar to the arrangement for regional Queensland employers under the current Back to Work Program.
| | | | | | | | | | | | | | | | | | | | |
| | | 2016-17
$‘000 | | | 2017-18
$‘000 | | | 2018-19
$‘000 | | | 2019-20
$‘000 | | | 2020-21
$‘000 | |
Queensland First Home Owners’ Grant | | | — | | | | 30,000 | | | | — | | | | — | | | | — | |
The Government is providing increased funding of $30 million in 2017-18 to extend the temporary increase in the Queensland First Home Owners’ Grant from $15,000 to $20,000 for a further six months. This will assist first home buyers to enter the housing market. The increased grant will be extended to eligible transactions entered into between 1 July 2017 and 31 December 2017 (both dates inclusive), being transactions for the purchase or construction of new houses, units or townhouses valued at less than $750,000.
| | | | | | | | | | | | | | | | | | | | |
| | | 2016-17
$‘000 | | | 2017-18
$‘000 | | | 2018-19
$‘000 | | | 2019-20
$‘000 | | | 2020-21
$‘000 | |
Office of State Revenue - Transformation Program | | | — | | | | 8,731 | | | | 14,269 | | | | 11,850 | | | | 7,941 | |
The Government is providing additional funding of $49.2 million over five years to implement the Office of State Revenue Transformation Program. This will enable the delivery of an upgraded ICT platform and support improved revenue management services into the future. It is estimated that the program will result in a whole-of-government revenue increase of up to $197 million over the next five years.
The capital component of this measure can be found in Chapter 3 Capital Measures. The revenue component of this measure can be found in Chapter 4 Revenue Measures.
94
Budget Measures 2017-18
| | | | | | | | | | | | | | | | | | | | |
| | | 2016-17
$‘000 | | | 2017-18
$‘000 | | | 2018-19
$‘000 | | | 2019-20
$‘000 | | | 2020-21
$‘000 | |
Government partnership with the Mates in Construction program | | | 500 | | | | 500 | | | | — | | | | — | | | | — | |
The Government has provided additional funding of $1 million over two years to support the Mates in Construction Program. This program contributes to the stronger community awareness and capacity priority area by customising mental health and suicide prevention awareness, training and intervention services and programs to the needs of the construction industry.
| | | | | | | | | | | | | | | | | | | | |
| | | 2016-17
$‘000 | | | 2017-18
$‘000 | | | 2018-19
$‘000 | | | 2019-20
$‘000 | | | 2020-21
$‘000 | |
Queensland Trade and Investment Strategy 2017-2022 | | | 1,302 | | | | 9,711 | | | | 8,273 | | | | 7,949 | | | | 7,762 | |
The Government has provided additional funding of $35 million over five years to deliver 22 initiatives under the Advancing Trade and Investment - Queensland Trade and Investment Strategy 2017-22. The initiatives will help to boost exports, attract job-creating investment and strengthen Queensland’s regions.
| | | | | | | | | | | | | | | | | | | | |
| | | 2016-17
$‘000 | | | 2017-18
$‘000 | | | 2018-19
$‘000 | | | 2019-20
$‘000 | | | 2020-21
$‘000 | |
Regional Facilitation Teams | | | 125 | | | | 250 | | | | 125 | | | | — | | | | — | |
The Government has provided $500,000 over three years for the Regional Facilitation Teams to identify and facilitate private sector investment and infrastructure development opportunities, including projects for consideration under the Jobs and Regional Growth Fund. The Regional Facilitation Teams initiative has total funding of $2 million. Further funding can be found in the Department of State Development section of this chapter.
This initiative is part of the $200 million Jobs and Regional Growth Package, targeted at growing regional economies and employment, as announced in the 2016-17 Mid Year Fiscal and Economic Review.
95
Budget Measures 2017-18
| | | | | | | | | | | | | | | | | | | | |
| | | 2016-17
$‘000 | | | 2017-18
$‘000 | | | 2018-19
$‘000 | | | 2019-20
$‘000 | | | 2020-21
$‘000 | |
Financial Assurance Framework Reform | | | — | | | | — | | | | — | | | | — | | | | — | |
The Government is providing additional funding of $39.4 million over five years from 2017-18 to implement the recommendations from the Financial Assurance Interdepartmental Committee, based on the report commissioned from the Queensland Treasury Corporation (“Review of Queensland’s Financial Assurance Framework”). This includes establishment of an interdepartmental project management office within Queensland Treasury to coordinate the whole-of-government program, including legislation and development of information systems, to implement the proposed reforms aimed at improving the management of the State’s rehabilitation risk.
The Government will be reimbursed for these costs from the contributions to be collected from the proposed new scheme.
In addition, the Department of Environment and Heritage Protection, the Department of Natural Resources and Mines and Queensland Treasury are contributing a total of $1.6 million over two years from existing resources to staff the project management office (which will not be recovered from the scheme).
| | | | | | | | | | | | | | | | | | | | |
| | | 2016-17
$‘000 | | | 2017-18
$‘000 | | | 2018-19
$‘000 | | | 2019-20
$‘000 | | | 2020-21
$‘000 | |
Social Benefit Bonds | | | — | | | | — | | | | — | | | | — | | | | — | |
The Government has entered into contracts with non-government organisations for two Social Benefit Bonds (SBBs) in 2017. The reoffending SBB will deliver services to 600 young people over 5 years aiming to reduce youth reoffending rates. The New Parent Infant Network (NEWPIN) SBB is focused on breaking the cycle of over representation of Aboriginal and Torres Strait Islander children in out-of-home care through working with families to safely reunite them with their children. Approximately 200 families are expected to be referred by the Department of Communities, Child Safety and Disability Services to the NEWPIN service. A third SBB transaction is currently in development and will target youth homelessness.
Other agencies will manage these contracts on behalf of the Government. Funding associated with this measure is commercial-in-confidence.
96
Budget Measures 2017-18
Introduction
The following tables present the relevant portfolio capital measures relating to decisions taken since the 2016-17 Budget. This does not represent the full amount of additional funding provided to agencies since the 2016-17 Budget. For further explanation, refer to Explanation of Scope and Terms in Chapter 1.
97
Budget Measures 2017-18
Department of Aboriginal and Torres Strait Islander Partnerships
| | | | | | | | | | | | | | | | | | | | |
| | | 2016-17
$‘000 | | | 2017-18
$‘000 | | | 2018-19
$‘000 | | | 2019-20
$‘000 | | | 2020-21
$‘000 | |
Cape York Peninsula Tenure Resolution Program | | | — | | | | 3,000 | | | | — | | | | — | | | | — | |
The Government is providing increased funding of $3 million in 2017-18 for land acquisitions related to the Cape York Peninsula Tenure Resolution Program.
98
Budget Measures 2017-18
Department of Education and Training
| | | | | | | | | | | | | | | | | | | | |
| | | 2016-17
$‘000 | | | 2017-18
$‘000 | | | 2018-19
$‘000 | | | 2019-20
$‘000 | | | 2020-21
$‘000 | |
Advancing Queensland Schools Program | | | 85,650 | | | | 129,560 | | | | (15,210 | ) | | | — | | | | — | |
The Government has provided additional funding of $200 million over three years to build fit for purpose learning environments that support educational outcomes. This funding includes land acquisitions for new schools, new and refurbished school halls and accelerated capital projects including administration facilities and special education upgrades.
| | | | | | | | | | | | | | | | | | | | |
| | | 2016-17
$‘000 | | | 2017-18
$‘000 | | | 2018-19
$‘000 | | | 2019-20
$‘000 | | | 2020-21
$‘000 | |
Building Future Schools Fund | | | — | | | | 28,000 | | | | 75,000 | | | | 115,000 | | | | 100,000 | |
The Government is providing additional funding of $500 million over five years from 2017-18 to address enrolment growth pressures in state schools.
| | | | | | | | | | | | | | | | | | | | |
| | | 2016-17
$‘000 | | | 2017-18
$‘000 | | | 2018-19
$‘000 | | | 2019-20
$‘000 | | | 2020-21
$‘000 | |
Adolescent Mental Health Facilities | | | — | | | | — | | | | — | | | | — | | | | — | |
Funding of $639,000 in 2019-20 has been internally reallocated by the department for education and vocational program facilities as part of a new Adolescent Extended Treatment Facility at The Prince Charles Hospital and adolescent Day Program spaces at Logan and the Gold Coast. Total capital funding for new and upgraded adolescent mental health facilities is $68.9 million over four years.
This measure is part of the South East Queensland hospital and health infrastructure package, which totals $200.6 million over four years. Further details can be found in the Queensland Health section of this chapter.
99
Budget Measures 2017-18
| | | | | | | | | | | | | | | | | | | | |
| | | 2016-17
$‘000 | | | 2017-18
$‘000 | | | 2018-19
$‘000 | | | 2019-20
$‘000 | | | 2020-21
$‘000 | |
Six Full Cohorts - 2020 Ready | | | — | | | | — | | | | 150,000 | | | | 100,000 | | | | — | |
The Government will provide additional funding of $250 million over two years for new classrooms and other infrastructure in the State’s secondary schools to cater for the 17,000 additional students expected in 2020.
100
Budget Measures 2017-18
Department of Environment and Heritage Protection
| | | | | | | | | | | | | | | | | | | | |
| | | 2016-17
$‘000 | | | 2017-18
$‘000 | | | 2018-19
$‘000 | | | 2019-20
$‘000 | | | 2020-21
$‘000 | |
Future of Queensland’s Environmental Regulator | | | — | | | | 2,046 | | | | — | | | | — | | | | — | |
The Government is providing additional funding of $2 million in 2017-18 for the development of systems to enhance environmental regulatory capability and improve engagement with the community. The expense component of this measure can be found in Chapter 2 Expense Measures.
| | | | | | | | | | | | | | | | | | | | |
| | | 2016-17
$‘000 | | | 2017-18
$‘000 | | | 2018-19
$‘000 | | | 2019-20
$‘000 | | | 2020-21
$‘000 | |
Underground Coal Gasification - Linc Energy Mine Site | | | — | | | | 1,642 | | | | — | | | | — | | | | — | |
The Government is providing increased funding of $1.6 million in 2017-18 for the acquisition of plant and equipment to manage, remediate and dispose of ground and surface water impacted by underground coal gasification by-products. The expense component of this measure can be found in Chapter 2 Expense Measures.
This forms part of the Government’s overall package of $36.3 million over five years. Further details can be found in the Department of Natural Resources and Mines sections of this chapter and Chapter 2 Expense Measures.
101
Budget Measures 2017-18
Department of Housing and Public Works
| | | | | | | | | | | | | | | | | | | | |
| | | 2016-17
$‘000 | | | 2017-18
$‘000 | | | 2018-19
$‘000 | | | 2019-20
$‘000 | | | 2020-21
$‘000 | |
Queensland Housing Strategy | | | — | | | | 149,250 | | | | 174,859 | | | | 175,825 | | | | 176,420 | |
The Government is providing additional funding of $676.4 million over four years from 2017-18 and $120 million ongoing to support delivery of the Queensland Housing Strategy 2017-2027.
Total funding of $1.795 billion over 10 years for the Queensland Housing Strategy 2017-2027 will boost the supply of social and affordable housing to respond to population growth and housing affordability pressures, leverage private industry and local government support, and enable reforms to the housing services and support system. This forms part of the Government’s ten year $1.835 billion funding package for housing and homelessness.
The expense component of this measure can be found in Chapter 2 Expense Measures. Further details of the housing and homelessness package can be found in Chapter 1 Overview.
| | | | | | | | | | | | | | | | | | | | |
| | | 2016-17
$‘000 | | | 2017-18
$‘000 | | | 2018-19
$‘000 | | | 2019-20
$‘000 | | | 2020-21
$‘000 | |
Government Employee Housing | | | — | | | | 18,505 | | | | 22,908 | | | | 10,449 | | | | 15,558 | |
The Government will provide increased funding of $67.4 million over four years from 2017-18 to ensure essential new construction and upgrade works are completed on Government employee housing and enable service delivery in locations where there are no alternative accommodation options. The expense component of this measure can be found in Chapter 2 Expense Measures.
102
Budget Measures 2017-18
| | | | | | | | | | | | | | | | | | | | |
| | | 2016-17
$‘000 | | | 2017-18
$‘000 | | | 2018-19
$‘000 | | | 2019-20
$‘000 | | | 2020-21
$‘000 | |
Construction of Government Employee Housing in Aurukun | | | 1,280 | | | | 11,811 | | | | 9,509 | | | | — | | | | — | |
The Government has provided additional funding of $22.6 million over three years from 2016-17 for the construction of 24 units of accommodation in Aurukun. These residences will satisfy urgent requirements for the provision of secure housing for government employees to support enhanced service delivery in this area.
| | | | | | | | | | | | | | | | | | | | |
| | | 2016-17
$‘000 | | | 2017-18
$‘000 | | | 2018-19
$‘000 | | | 2019-20
$‘000 | | | 2020-21
$‘000 | |
Cairns Convention Centre Expansion | | | — | | | | — | | | | 88,000 | | | | 88,000 | | | | — | |
The Government will provide $176 million over two years from 2018-19 to extend the Cairns Convention Centre, following consideration of a business case in 2017-18. The expense component of this measure can be found in Chapter 2 Expense Measures.
103
Budget Measures 2017-18
Department of Infrastructure, Local Government and Planning
| | | | | | | | | | | | | | | | | | | | |
| | | 2016-17
$‘000 | | | 2017-18
$‘000 | | | 2018-19
$‘000 | | | 2019-20
$‘000 | | | 2020-21
$‘000 | |
Cross River Rail | | | — | | | | — | | | | 62,000 | | | | 1,061,000 | | | | 829,000 | |
The Government will provide increased funding of $1.952 billion over three years from 2018-19 to the Cross River Rail Delivery Authority to progress the Cross River Rail project. This, in addition to funding previously allocated, brings total funding for the project to $2.812 billion over four years.
This $5.409 billion project is the Government’s highest infrastructure priority with significant potential to boost jobs and economic growth, and add value to commercial and residential development sites across the region.
104
Budget Measures 2017-18
Department of Justice and Attorney-General
| | | | | | | | | | | | | | | | | | | | |
| | | 2016-17
$‘000 | | | 2017-18
$‘000 | | | 2018-19
$‘000 | | | 2019-20
$‘000 | | | 2020-21
$‘000 | |
Capricornia Correctional Centre Expansion | | | — | | | | 7,500 | | | | 21,000 | | | | 47,000 | | | | 110,000 | |
The Government is providing additional funding of $200 million over five years ($14.5 million for 2021-22) for an extra 164 beds to provide additional prisoner capacity. This expansion will also deliver additional infrastructure for increased prison industries, car park expansion, and upgrades to the waste water, mechanical services and electronic security systems. The expense component of this measure can be found in Chapter 2 Expense Measures. | |
| | | 2016-17
$‘000 | | | 2017-18
$‘000 | | | 2018-19
$‘000 | | | 2019-20
$‘000 | | | 2020-21
$‘000 | |
Expansion of Prison Infrastructure for Women Prisoners | | | — | | | | 4,500 | | | | 8,000 | | | | — | | | | — | |
The Government is providing increased funding of $12.5 million over two years to deliver infrastructure for additional beds at Brisbane Women’s Correctional Centre. Further funding of $3.5 million in 2017-18 is being reprioritised by the department to fund this measure. The expense component of this measure can be found in Chapter 2 Expense Measures. | |
| | | 2016-17
$‘000 | | | 2017-18
$‘000 | | | 2018-19
$‘000 | | | 2019-20
$‘000 | | | 2020-21
$‘000 | |
Transition of 17 year olds to the Youth Justice System | | | — | | | | 16,886 | | | | — | | | | — | | | | — | |
The Government is providing increased funding of $16.9 million in 2017-18 for capital works to support the transition of 17 year olds into the youth justice system. This forms part of the Government’s total package of $199.6 million over four years to transition 17 year olds to the youth justice system. Further details of this funding can be found in the Department of Justice and Attorney-General, Queensland Police Service and Queensland Health sections of Chapter 2 Expense Measures. | |
105
Budget Measures 2017-18
| | | | | | | | | | | | | | | | | | | | |
| | | 2016-17
$‘000 | | | 2017-18
$‘000 | | | 2018-19
$‘000 | | | 2019-20
$‘000 | | | 2020-21
$‘000 | |
Courthouse Infrastructure | | | — | | | | 10,000 | | | | 6,000 | | | | — | | | | — | |
The Government is providing increased funding of $16 million over two years to upgrade and maintain courthouse infrastructure, including increased funding of $7.5 million for repair work at the Rockhampton courthouse.
| | | | | | | | | | | | | | | | | | | | |
| | | 2016-17
$‘000 | | | 2017-18
$‘000 | | | 2018-19
$‘000 | | | 2019-20
$‘000 | | | 2020-21
$‘000 | |
Domestic and Family Violence Response - Specialist Domestic and Family Violence Courts | | | — | | | | 10,000 | | | | 10,000 | | | | — | | | | — | |
The Government is providing increased funding of $20 million over two years for capital works at Townsville and Beenleigh courthouses to support the rollout of specialist domestic and family violence courts in Queensland.
This forms part of the Government’s total package of $69.5 million over four years to rollout Specialist Domestic and Family Violence Courts, which includes $40.4 million over four years provided as a whole-of-Government contingency for this measure in the 2016-17 Budget. Further details of this package can be found in the Department of Communities, Child Safety and Disability Services, the Department of Justice and Attorney-General and Queensland Police Service sections of Chapter 2 Expense Measures.
This forms part of the Government’s overall package to respond to the Not Now, Not Ever report since the 2015-16 Budget.
| | | | | | | | | | | | | | | | | | | | |
| | | 2016-17
$‘000 | | | 2017-18
$‘000 | | | 2018-19
$‘000 | | | 2019-20
$‘000 | | | 2020-21
$‘000 | |
Audio Visual Capability in the Criminal Justice System | | | — | | | | 4,965 | | | | 7,208 | | | | 6,936 | | | | 6,256 | |
The Government is providing additional funding of $31.6 million over five years ($6.3 million for 2021-22) reducing to $4.2 million per annum ongoing from 2022-23, to expand and upgrade existing audio visual capability in the criminal justice system.
106
Budget Measures 2017-18
| | | | | | | | | | | | | | | | | | | | |
| | | 2016-17
$‘000 | | | 2017-18
$‘000 | | | 2018-19
$‘000 | | | 2019-20
$‘000 | | | 2020-21
$‘000 | |
Re-establishment of the Drug Court | | | — | | | | 500 | | | | — | | | | — | | | | — | |
The Government is providing increased funding of $500,000 in 2017-18 to provide facilities for the re-establishment of the Drug Court.
This forms part of the Government’s total package of $32.6 million over four years ($22.7 million new funding and $9.9 million reprioritised funding) to reinstate the Drug Court and provide referral and support services.
Further details of this funding can be found in the Department of Housing and Public Works, the Department of Justice and Attorney-General, Queensland Health and Queensland Police Service sections of Chapter 2 Expense Measures.
| | | | | | | | | | | | | | | | | | | | |
| | | 2016-17
$‘000 | | | 2017-18
$‘000 | | | 2018-19
$‘000 | | | 2019-20
$‘000 | | | 2020-21
$‘000 | |
Queensland Parole System Review - Immediate Reforms | | | 1,000 | | | | — | | | | — | | | | — | | | | — | |
The Government has provided additional funding of $1 million in 2016-17 to implement Global Positioning System monitoring to enhance supervision of parolees and community safety.
This measure is part of a larger program reforming the Queensland Parole System, with total funding of $265 million over six years. Further details of this funding can be found in the Queensland Health and the Department of Justice and Attorney-General sections of Chapter 2 Expense Measures.
107
Budget Measures 2017-18
Department of National Parks, Sport and Racing
| | | | | | | | | | | | | | | | | | | | |
| | | 2016-17
$‘000 | | | 2017-18
$‘000 | | | 2018-19
$‘000 | | | 2019-20
$‘000 | | | 2020-21
$‘000 | |
Revitalising National Parks | | | — | | | | 15,000 | | | | 20,000 | | | | — | | | | — | |
The Government is providing increased funding of $35 million over two years to enhance critical infrastructure including nature based tourism opportunities and the management of the State’s national parks to protect natural and cultural values and maintain the breadth and quality of visitor experiences.
The expense component of this measure can be found in Chapter 2 Expense Measures.
| | | | | | | | | | | | | | | | | | | | |
| | | 2016-17
$‘000 | | | 2017-18
$‘000 | | | 2018-19
$‘000 | | | 2019-20
$‘000 | | | 2020-21
$‘000 | |
Daisy Hill Koala Bushland Precinct | | | 500 | | | | 1,800 | | | | — | | | | — | | | | — | |
The Government has provided increased funding of $2.3 million to improve and upgrade facilities in the Daisy Hill Koala Bushland Precinct in preparation for the Gold Coast 2018 Commonwealth Games. A further $1 million has been internally reprioritised by the department, bringing total funding to $3.3 million over two years.
108
Budget Measures 2017-18
Department of Natural Resources and Mines
| | | | | | | | | | | | | | | | | | | | |
| | | 2016-17
$‘000 | | | 2017-18
$‘000 | | | 2018-19
$‘000 | | | 2019-20
$‘000 | | | 2020-21
$‘000 | |
Strategic Resources Exploration Program | | | — | | | | 2,595 | | | | 3,545 | | | | 435 | | | | 550 | |
The Government is providing additional funding of $7.1 million over four years for the Strategic Resources Exploration Program. The funding will support initiatives targeted at the North West Minerals Province and further develop and diversify the Queensland resources sector. This forms part of the Government’s overall package of $39 million over four years across several departments to deliver initiatives to support the North West Minerals Province. The expense component of this measure can be found in Chapter 2 Expense Measures. Further details of this package can be found in the Department of State Development, the Department of Communities, Child Safety and Disability Services and the Department of the Premier and Cabinet sections of Chapter 2 Expense Measures. | |
| | | 2016-17
$‘000 | | | 2017-18
$‘000 | | | 2018-19
$‘000 | | | 2019-20
$‘000 | | | 2020-21
$‘000 | |
Texas Silver Mine Site | | | 400 | | | | 1,600 | | | | — | | | | — | | | | — | |
The Government has provided additional funding of $2 million over two years for the ongoing management of the disclaimed Texas Silver Mine site. The expense component of this measure can be found in Chapter 2 Expense Measures. | |
109
Budget Measures 2017-18
| | | | | | | | | | | | | | | | | | | | |
| | | 2016-17
$‘000 | | | 2017-18
$‘000 | | | 2018-19
$‘000 | | | 2019-20
$‘000 | | | 2020-21
$‘000 | |
Linc Energy Mine Site | | | — | | | | 223 | | | | 80 | | | | 50 | | | | 50 | |
The Government is providing additional funding of $403,000 over four years to 2020-21, ongoing from 2021-22 to provide management and operational oversight of the Linc Energy Limited mine site. This forms part of the Government’s overall package of $36.3 million over five years.
The expense component of this measure can be found in Chapter 2 Expense Measures. Further details can be found in the Department of Environment and Heritage Protection section of Chapter 2 Expense Measures and Chapter 3 Capital Measures.
110
Budget Measures 2017-18
Department of Science, Information Technology and Innovation
| | | | | | | | | | | | | | | | | | | | |
| | | 2016-17
$‘000 | | | 2017-18
$‘000 | | | 2018-19
$‘000 | | | 2019-20
$‘000 | | | 2020-21
$‘000 | |
Science ICT Remediation and Renewal Program - Phase 1 | | | — | | | | 2,880 | | | | — | | | | — | | | | — | |
The Government is providing additional funding of $2.9 million in 2017-18 for the first phase of the Science ICT Remediation and Renewal Program. The program aims to secure science ICT that supports services across Government. The expense component of this measure can be found in Chapter 2 Expense Measures.
111
Budget Measures 2017-18
Department of the Premier and Cabinet
| | | | | | | | | | | | | | | | | | | | |
| | | 2016-17
$‘000 | | | 2017-18
$‘000 | | | 2018-19
$‘000 | | | 2019-20
$‘000 | | | 2020-21
$‘000 | |
Arts Infrastructure and Refurbishment | | | — | | | | 6,000 | | | | 4,000 | | | | 4,000 | | | | 3,500 | |
The Government is providing additional funding of $17.5 million over four years for an Arts Infrastructure Investment Fund administered under the new Arts Infrastructure Investment framework, which will prioritise infrastructure projects on State owned arts and cultural facilities.
| | | | | | | | | | | | | | | | | | | | |
| | | 2016-17
$‘000 | | | 2017-18
$‘000 | | | 2018-19
$‘000 | | | 2019-20
$‘000 | | | 2020-21
$‘000 | |
Queensland Family and Child Commission - Responsive Child Protection System | | | — | | | | 800 | | | | — | | | | — | | | | — | |
The Government is providing $800,000 in additional capital in 2017-18 for a project to enhance the Queensland Child Death Register and reporting capability, including an ICT upgrade and migration and entry of data from existing systems and files.
This forms part of a $2.9 million total package, which includes $2.1 million in additional expenses. Further details can be found in Chapter 2 Expense Measures.
112
Budget Measures 2017-18
Department of Transport and Main Roads
| | | | | | | | | | | | | | | | | | | | |
| | | 2016-17
$‘000 | | | 2017-18
$‘000 | | | 2018-19
$‘000 | | | 2019-20
$‘000 | | | 2020-21
$‘000 | |
Additional road projects funded in partnership with Federal Government | | | — | | | | 5,796 | | | | 40,204 | | | | 33,800 | | | | 37,200 | |
The Government is providing additional funding of $117 million over four years for state matching funding based on federal-state funding negotiations for projects committed by the Australian Government during the 2016 federal election. The projects include the Pacific Motorway - Gateway Motorway merge upgrade, Pacific Motorway - Mudgeeraba to Varsity Lakes six-laning, Mount Lindesay Highway upgrades and the Walkerston Bypass (near Mackay). | |
| | | 2016-17
$‘000 | | | 2017-18
$‘000 | | | 2018-19
$‘000 | | | 2019-20
$‘000 | | | 2020-21
$‘000 | |
Ferny Grove Station Precinct TOD Project | | | — | | | | 1,200 | | | | 3,600 | | | | 4,200 | | | | — | |
The Government is providing additional funding of $9 million over three years for the construction of additional commuter car spaces at the Ferny Grove rail station as part of the Ferny Grove Station Precinct Transit Oriented Development (TOD) project. | |
| | | 2016-17
$‘000 | | | 2017-18
$‘000 | | | 2018-19
$‘000 | | | 2019-20
$‘000 | | | 2020-21
$‘000 | |
Camera Detected Offence Program | | | — | | | | (23,650 | ) | | | (27,650 | ) | | | 36,398 | | | | 43,898 | |
The Government is providing increased funding of $29 million over four years to reduce the incidence of road trauma on our roads. The funding under the Camera Detected Offence Program (CDOP) has been reprofiled to reflect expected revenues following the outcomes of the Queensland Audit Office review of the Camera Scheduling and Reporting System and is reviewed annually. The Government is providing total increased funding of $45 million over four years across departments as part of CDOP. Further funding can be found in the Queensland Police Service section of this Chapter. The expense component of this initiative can be found in the Queensland Police Service section of Chapter 2 Expense Measures. | |
113
Budget Measures 2017-18
Electoral Commission of Queensland
| | | | | | | | | | | | | | | | | | | | |
| | | 2016-17
$‘000 | | | 2017-18
$‘000 | | | 2018-19
$‘000 | | | 2019-20
$‘000 | | | 2020-21
$‘000 | |
Electronic Disclosure System | | | 2,700 | | | | — | | | | — | | | | — | | | | — | |
The Government has provided additional funding of $2.7 million for the development of an Electronic Disclosure System (EDS). An EDS provides greater transparency of political donations in Queensland. The system enables the reporting and recording of gifts, donations and loans electronically by stakeholders and provides the information to the general public in real time. The expense component of this measure can be found in Chapter 2 Expense Measures.
114
Budget Measures 2017-18
Legislative Assembly of Queensland
| | | | | | | | | | | | | | | | | | | | |
| | | 2016-17
$‘000 | | | 2017-18
$‘000 | | | 2018-19
$‘000 | | | 2019-20
$‘000 | | | 2020-21
$‘000 | |
Broadcast of Proceedings and Members’ Video on Demand Upgrade | | | 439 | | | | — | | | | — | | | | — | | | | — | |
The Government has provided additional funding of $439,000 to upgrade the existing infrastructure and software platform delivering public broadcast of parliamentary and committee proceedings and related Video-on-Demand (VOD) media services delivered to Members.
The expense component of this measure can be found in Chapter 2 Expense Measures.
| | | | | | | | | | | | | | | | | | | | |
| | | 2016-17
$‘000 | | | 2017-18
$‘000 | | | 2018-19
$‘000 | | | 2019-20
$‘000 | | | 2020-21
$‘000 | |
Parliamentary Annexe Lift Upgrade Program | | | 885 | | | | — | | | | — | | | | — | | | | — | |
The Government has provided additional funding of $885,000 in 2016-17 for the urgent upgrade of two high use lifts within the Parliamentary Annexe.
115
Budget Measures 2017-18
Public Safety Business Agency
| | | | | | | | | | | | | | | | | | | | |
| | | 2016-17
$‘000 | | | 2017-18
$‘000 | | | 2018-19
$‘000 | | | 2019-20
$‘000 | | | 2020-21
$‘000 | |
Queensland Government Air Aircraft Maintenance and Compliance | | | 6,010 | | | | 6,087 | | | | — | | | | — | | | | — | |
The Government is providing additional funding of $12.1 million over two years for mandatory maintenance of Queensland Government Air’s rotary and fixed wing aircraft. This funding enables Queensland Government Air to continue to support the emergency helicopter network across the state for search and rescue, natural disasters, police and aeromedical operations and provide fixed wing transport services for police, government and organ transfer. The expense component of this measure can be found in Chapter 2 Expense Measures.
116
Budget Measures 2017-18
Queensland Fire and Emergency Services
| | | | | | | | | | | | | | | | | | | | |
| | | 2016-17
$‘000 | | | 2017-18
$‘000 | | | 2018-19
$‘000 | | | 2019-20
$‘000 | | | 2020-21
$‘000 | |
Accelerated Rural Fire Service Fleet Program | | | — | | | | 10,691 | | | | 19,405 | | | | (10,691 | ) | | | (19,405 | ) |
The government is providing funding of $30.1 million over two years to 2018-19 to provide an accelerated fleet replacement program for Rural Fire Brigades. Equivalent funding of $30.1 million will be internally reallocated from 2019-20 and 2020-21 to support the implementation of this program. The funding will enable the Department to acquire 160 vehicles over two years to replace ageing vehicles and ensure the government’s continued support of rural Queensland communities.
117
Budget Measures 2017-18
Queensland Health
| | | | | | | | | | | | | | | | | | | | |
| | | 2016-17
$‘000 | | | 2017-18
$‘000 | | | 2018-19
$‘000 | | | 2019-20
$‘000 | | | 2020-21
$‘000 | |
Integrated Electronic Medical Records Program | | | 6,170 | | | | 50,500 | | | | — | | | | — | | | | — | |
The Government has provided increased funding of $56.7 million over two years to support the continued rollout of the Integrated Electronic Medical Records Program. This Program will deliver an integrated suite of digital health care services to support a patient focused, networked model of healthcare to 24 hospitals across Queensland by 2020.
| | | | | | | | | | | | | | | | | | | | |
| | | 2016-17
$‘000 | | | 2017-18
$‘000 | | | 2018-19
$‘000 | | | 2019-20
$‘000 | | | 2020-21
$‘000 | |
Health Infrastructure - priority rural and regional projects | | | — | | | | 47,600 | | | | 51,900 | | | | 96,400 | | | | 12,500 | |
The Government is providing additional funding of $208.4 million over four years for essential upgrades to health facilities and supporting infrastructure in rural and regional areas across the State. The funding will facilitate major redevelopments at Kingaroy Hospital, Blackall Hospital and Sarina Hospital, the redevelopment of the clinical services building and the relocation of the breast screen clinic at Townsville Hospital, the refurbishment of the emergency department and specialist outpatient facilities at Maryborough Hospital, a new mental health unit at Cairns Hospital, and the replacement of the primary health care centre on Mer (Murray) Island.
The program will also support upgrades to staff accommodation at various locations across the North West, Torres and Cape, Cairns and Hinterland and Townsville Hospital and Health Services.
118
Budget Measures 2017-18
| | | | | | | | | | | | | | | | | | | | |
| | | 2016-17
$‘000 | | | 2017-18
$‘000 | | | 2018-19
$‘000 | | | 2019-20
$‘000 | | | 2020-21
$‘000 | |
Health Infrastructure - South East Queensland - planning for growth | | | — | | | | 15,000 | | | | 14,600 | | | | 30,000 | | | | 63,163 | |
The Government is providing additional funding of $122.8 million over four years as an initial investment to enhance public hospital capacity and services in South East Queensland, including $19.6 million to expand the emergency department at Caboolture Hospital and $103.2 million for detailed planning and preparatory works for proposed redevelopments at Logan, Caboolture and Ipswich hospitals. Funding of $9 million in 2017-18 has also been internally reallocated by Queensland Health for the preparation of detailed business cases for proposed redevelopments at Logan, Caboolture and Ipswich Hospitals, bringing total funding for this measure to $131.8 million.
The South East Queensland hospital and health infrastructure package is a total of $200.6 million over four years. Further details can be found elsewhere in the Queensland Health section of this chapter and in the Department of Education and Training section of this chapter.
| | | | | | | | | | | | | | | | | | | | |
| | | 2016-17
$‘000 | | | 2017-18
$‘000 | | | 2018-19
$‘000 | | | 2019-20
$‘000 | | | 2020-21
$‘000 | |
Health Infrastructure - South East Queensland - adolescent mental health facilities | | | 958 | | | | 8,713 | | | | 45,320 | | | | 13,246 | | | | — | |
The Government has provided additional funding of $68.2 million over four years to establish a new Adolescent Extended Treatment Facility at The Prince Charles Hospital and two new adolescent Step Up Step Down units in Brisbane, and to refurbish two adolescent Day Program spaces at Logan and the Gold Coast.
Total capital funding for new and upgraded adolescent mental health facilities is $68.9 million over four years. Further details can be found in the Department of Education and Training section of this chapter.
This measure is part of the South East Queensland hospital and health infrastructure package, which totals $200.6 million over four years. Further details can be found elsewhere in the Queensland Health section of this chapter.
119
Budget Measures 2017-18
Queensland Police Service
| | | | | | | | | | | | | | | | | | | | |
| | | 2016-17
$‘000 | | | 2017-18
$‘000 | | | 2018-19
$‘000 | | | 2019-20
$‘000 | | | 2020-21
$‘000 | |
Counter-Terrorism and Community Safety Centre - Westgate | | | — | | | | 3,500 | | | | 24,200 | | | | 19,000 | | | | — | |
The Government is providing additional funding of $46.7 million over three years and $6.1 million over three years to be held in contingency for the delivery of a contemporary Counter-Terrorism and Community Safety Centre at the Westgate Police Academy. This facility will include an indoor firearms range, a simunition training area, scenario village, and office accommodation for training staff.
| | | | | | | | | | | | | | | | | | | | |
| | | 2016-17
$‘000 | | | 2017-18
$‘000 | | | 2018-19
$‘000 | | | 2019-20
$‘000 | | | 2020-21
$‘000 | |
Camera Detected Offence Program | | | — | | | | (350 | ) | | | (350 | ) | | | 950 | | | | 950 | |
The Government will provide increased funding of $1.2 million over four years for point-to-point and combined red light and speed cameras. The funding under the Camera Detected Offence Program (CDOP) has been reprofiled to reflect expected revenues following the outcomes of the Queensland Audit Office review of the Camera Scheduling and Reporting System and is reviewed annually.
The Government is providing total increased funding of $45 million over four years across departments as part of CDOP. Further funding can be found in the Department of Transport and Main Roads section of this Chapter. The expense component of this initiative can be found in the Queensland Police Service section of Chapter 2 Expense Measures.
120
Budget Measures 2017-18
Queensland Treasury
| | | | | | | | | | | | | | | | | | | | |
| | | 2016-17
$‘000 | | | 2017-18
$‘000 | | | 2018-19
$‘000 | | | 2019-20
$‘000 | | | 2020-21
$‘000 | |
Office of State Revenue - Transformation Program | | | — | | | | 11,699 | | | | 5,479 | | | | 561 | | | | — | |
The Government is providing additional funding of $17.7 million over three years to implement the Office of State Revenue Transformation Program. This will enable the delivery of an upgraded ICT platform and support improved revenue management services into the future.
The expense component of this measure can be found in Chapter 2 Expense Measures. The revenue component of this measure can be found in Chapter 4 Revenue Measures.
| | | | | | | | | | | | | | | | | | | | |
| | | 2016-17
$‘000 | | | 2017-18
$‘000 | | | 2018-19
$‘000 | | | 2019-20
$‘000 | | | 2020-21
$‘000 | |
Queensland Racing Integrity Commission - Compliance Enforcement Framework | | | — | | | | 2,283 | | | | 2,123 | | | | 979 | | | | 524 | |
The Government is providing additional funding of $5.9 million over four years to implement a capital works program for the Racing Science Centre. This funding will enable the upgrade of core drug testing technology and support investment in new technology to provide high quality testing services.
121
Budget Measures 2017-18
Introduction
The following tables present the relevant portfolio revenue measures relating to decisions taken since the 2016-17 Budget. For further explanation, refer to Explanation of Scope and Terms in Chapter 1.
122
Budget Measures 2017-18
Whole-of-Government
| | | | | | | | | | | | | | | | | | | | |
| | | 2016-17
$‘000 | | | 2017-18
$‘000 | | | 2018-19
$‘000 | | | 2019-20
$‘000 | | | 2020-21
$‘000 | |
Government Indexation Policy | | | — | | | | — | | | | — | | | | (25,000 | ) | | | (53,000 | ) |
The Queensland Government has decided to move to a CPI-based escalation of fees and charges and the penalty unit from 2019-20 that will replace the previous Government’s policy of an indexation rate of 3.5% per annum. From 2019-20 onwards, the CPI is projected to increase by 2.5% per annum, consistent with the mid-point of the Reserve Bank of Australia’s target band.
This change is expected to result in a reduction in revenue of $25 million in 2019-20 and $53 million in 2020-21, reducing the increase in fees and charges subject to the Government indexation policy, including motor vehicle registration fees, transport and traffic fees and the Emergency Management Levy.
123
Budget Measures 2017-18
Department of Justice and Attorney-General
| | | | | | | | | | | | | | | | | | | | |
| | | 2016-17
$‘000 | | | 2017-18
$‘000 | | | 2018-19
$‘000 | | | 2019-20
$‘000 | | | 2020-21
$‘000 | |
Justice of the Peace Qualified and Commissioners for Declaration Handbook Revised Fees | | | — | | | | 342 | | | | 300 | | | | 150 | | | | 150 | |
The Government is increasing the fees for revised Duties of Justices of the Peace (Qualified) and the Duties of Commissioners for Declarations hard copy handbooks from $19.40 to $32.70 and from $9.65 to $29.05 respectively from 1 July 2017. The handbooks have been significantly reviewed and improved for content and design.
124
Budget Measures 2017-18
Department of Natural Resources and Mines
| | | | | | | | | | | | | | | | | | | | |
| | | 2016-17
$‘000 | | | 2017-18
$‘000 | | | 2018-19
$‘000 | | �� | 2019-20
$‘000 | | | 2020-21
$‘000 | |
Extending existing drought relief arrangements | | | — | | | | — | | | | — | | | | — | | | | — | |
As part of the extension of drought relief arrangements, the Government is providing fee and rental relief of up to $4.2 million in 2017-18, provisioned centrally. This includes rebates for land rental and the waiving of water licence fees for drought affected landholders and lessees. The estimate is dependent on drought declarations and the demand for drought assistance.
The Drought Assistance Package is a total of up to $34.6 million in 2017-18 across several departments to support drought affected communities across the State. Further funding can be found in the Department of Agriculture and Fisheries, Department of Communities, Child Safety and Disability Services, and Department of Energy and Water Supply sections of Chapter 2 Expense Measures.
125
Budget Measures 2017-18
Queensland Treasury
| | | | | | | | | | | | | | | | | | | | |
| | | 2016-17
$‘000 | | | 2017-18
$‘000 | | | 2018-19
$‘000 | | | 2019-20
$‘000 | | | 2020-21
$‘000 | |
Absentee Land Tax | | | — | | | | 20,000 | | | | 21,400 | | | | 22,800 | | | | 24,200 | |
The Government is introducing a 1.5% surcharge for absentee payers of land tax, as defined under the Land Tax Act 2010. The surcharge will apply to land holdings with a taxable value of $350,000 or higher, in addition to other land tax payable. Absentee owners benefit from a high standard of services and infrastructure delivered and maintained by a broad range of taxes. The surcharge will ensure absentee owners of land make a further contribution. This will have no impact on Queensland residents.
| | | | | | | | | | | | | | | | | | | | |
| | | 2016-17
$‘000 | | | 2017-18
$‘000 | | | 2018-19
$‘000 | | | 2019-20
$‘000 | | | 2020-21
$‘000 | |
Office of State Revenue - Transformation Program | | | — | | | | 4,095 | | | | 19,318 | | | | 38,635 | | | | 57,953 | |
The Government is implementing the Office of State Revenue Transformation Program, which is designed to provide more effective and efficient revenue management services. It is estimated that this will result in a whole-of-government revenue increase of up to $197 million over the next five years.
The expense component of this measure can be found in Chapter 2 Expense Measures. The capital component of this measure can be found in Chapter 3 Capital Measures.
| | | | | | | | | | | | | | | | | | | | |
| | | 2016-17
$‘000 | | | 2017-18
$‘000 | | | 2018-19
$‘000 | | | 2019-20
$‘000 | | | 2020-21
$‘000 | |
Rebate of Payroll Tax for Apprentices and Trainees | | | — | | | | (12,000 | ) | | | — | | | | — | | | | — | |
The Government is continuing the payroll tax rebate on the wages of apprentices and trainees at the increased rate of 50 per cent until 30 June 2018. This rebate is in addition to their wages being exempt and will be used as an offset against payroll tax payable on the wages of other employees.
126
Queensland Budget 2017-18 Budget Measures Budget Paper No.4

Queensland Budget 2017-18
Budget Measures Budget Paper No.4