EXHIBIT (c)(ix)
Queensland Treasury Corporation Annual Report for the Year Ended June 30, 2017.
FORWARD-LOOKING STATEMENTS
This exhibit contains forward-looking statements. Statements that are not historical facts, including statements about the State of Queensland’s (the “State” or “Queensland”) beliefs and expectations, are forward-looking statements. These statements are based on current plans, budgets, estimates and projections and therefore you should not place undue reliance on them. The words “believe”, “may”, “will”, “should”, “estimate”, “continue”, “anticipate”, “intend”, “expect”, “forecast” and similar words are intended to identify forward-looking statements. Forward-looking statements speak only as of the date they are made, and neither the Queensland Treasury Corporation nor the State undertake any obligation to update publicly any of them in light of new information or future events.
Forward-looking statements are based on current plans, estimates and projections and, therefore, undue reliance should not be placed on them. Although the Queensland Treasury Corporation and the State believe that the beliefs and expectations reflected in such forward-looking statements are reasonable, no assurance can be given that such beliefs and expectations will prove to have been correct. Forward-looking statements involve inherent risks and uncertainties. We caution you that actual results may differ materially from those contained in any forward-looking statements.
A number of important factors could cause actual results to differ materially from those expressed in any forward-looking statement. Factors that could cause the actual outcomes to differ materially from those expressed or implied in forward-looking statements include:
| | • | | the international and Australian economies, and in particular the rates of growth (or contraction) of the State’s major trading partners; |
| | • | | the effects, both internationally and in Australia, of any subsequent economic downturn, ongoing economic, banking and sovereign debt crisis in Europe and any stalling of the protracted United States recovery; |
| | • | | increases or decreases in international and Australian domestic interest rates; |
| | • | | changes in the State’s domestic consumption; |
| | • | | changes in the State’s labor force participation and productivity; |
| | • | | downgrades in the credit ratings of the State and Australia; |
| | • | | changes in the rate of inflation in the State; |
| | • | | changes in environmental and other regulation; and |
| | • | | changes in the distribution of revenue from the Commonwealth of Australia Government to the State. |
| | | | |
| ANNUAL | | QUEENSLAND TREASURY CORPORATION | | |
| REPORT 2016-17 | | | | |
Contents
| | | | |
Queensland Treasury Corporation | | | 2 | |
| |
Role and responsibilities | | | 3 | |
| |
Chairman’s and Chief Executive’s report | | | 4 | |
| |
Creating value for the State and clients | | | 6 | |
| |
Achieving sustainable access to funding | | | 8 | |
| |
Realising operational excellence | | | 10 | |
| |
Ensuring corporate governance | | | 12 | |
| |
Financial Statements | | | 17 | |
| |
Appendices | | | 51 | |
| | | | |
| | QUEENSLAND TREASURY CORPORATION | | ANNUAL |
| | | | REPORT 2016-17 |
| | |
| 25 September 2017 | |  |
The Honourable Curtis Pitt MP
Treasurer and Minister for Trade and Investment
GPO Box 611
Brisbane QLD 4001
Dear Treasurer
I am pleased to present the Annual Report 2016-17 for Queensland Treasury Corporation.
I certify that this Annual Report complies with:
| • | | the prescribed requirements of the Financial Accountability Act 2009 and the Financial and Performance Management Standard 2009, and |
| • | | the detailed requirements set out in the Annual report requirements for Queensland Government agencies. |
A checklist outlining the annual reporting requirements can be found at page 54 of this report or accessed at www.qtc.com.au.
Sincerely

Gerard Bradley
Chairman
LEVEL 31, 111 EAGLE STREET, BRISBANE QUEENSLAND AUSTRALIA 4000
GPO BOX 1096, BRISBANE QUEENSLAND AUSTRALIA 4001
T: 07 3842 4600 • F: 07 3221 4122 • QTC.COM. AU
| | | | |
| ANNUAL | | QUEENSLAND TREASURY CORPORATION | | |
| REPORT 2016-17 | | | | |
Queensland Treasury Corporation
Queensland Treasury Corporation (QTC) has a statutory responsibility to advance the financial position of the State, and a mandate to manage and minimise financial risk in the public sector and provide value-adding financial solutions to its public sector clients. Established under the Queensland Treasury Corporation Act 1988, QTC is a corporation sole, reporting through the Under Treasurer to the Treasurer and Queensland Parliament.
| | |
| | Vision Securing Queensland’s financial success |
| |
| | Mission To deliver optimal financial outcomes through sound funding and financial risk management |
| |
| | Values Client focus We build strong partnerships with our clients to deliver simple and well-designed solutions that achieve quality outcomes for Queensland. Team spirit We work as one team, taking joint responsibility for achieving our vision and collaborating to achieve outstanding performance. Excellence We aim for excellence using flexible and agile processes to continuously improve. Respect We show respect by recognising contributions, welcoming ideas, acting with honesty, being inclusive and embracing diversity. Integrity We inspire trust and confidence in our colleagues, clients, stakeholders and investors by upholding strong professional and ethical standards. |
| |
| | 2017-20 Strategic Goals |
| | 1 State and client value |
| | 2 Sustainable funding |
| | 3 Organisational excellence |
| | | | |
| | QUEENSLAND TREASURY CORPORATION | | ANNUAL |
| | | | REPORT 2016-17 |
Queensland Treasury Corporation
ROLE AND RESPONSIBILITIES
As the Queensland Government’s central financing authority, Queensland Treasury Corporation plays a pivotal role in securing the State’s financial success.
With a focus on whole-of-State outcomes, QTC provides a range of financial services to the State and its public sector entities, including local governments. These services include debt funding and management, cash management facilities and financial risk management advisory services.
| | |
 | | Debt funding and management QTC borrows funds in the domestic and global markets in the most cost-effective manner and in a way that minimises liquidity risk and refinancing risk. QTC achieves significant economies of scale and scope by issuing, managing and administering the State’s debt funding. |
| | QTC works closely with Queensland’s public sector entities, including local governments, to assist them to effectively manage their financial transactions, minimise their financial risk and achieve the best financial solutions for their organisation and the State. |

| | Financial risk management advisory services |
| | QTC offers a range of financial risk management advisory services to clients, including: |
| | • support to ensure financial risks are identified and effectively managed |
| | • advice on financial and commercial considerations |
| | • expertise in financial transactions and structures |
| | • project management support to deliver key fiscal outcomes, and |
| | • collaboration with the financial markets and private sector institutions. |

| | Cash management facilities |
| | QTC assists the State’s public sector entities to make the best |
| | use of their surplus cash balances within a conservative risk |
| | management framework. It offers overnight and fixed-term |
| | facilities and a managed cash fund. |
| | | | |
| ANNUAL | | QUEENSLAND TREASURY CORPORATION | | |
| REPORT 2016-17 | | | | |
Chairman’s and Chief Executive’s report
In 2016-17, Queensland Treasury Corporation delivered significant whole-of-State and client benefits, successfully funded the State’s $5.9 billion borrowing program, and realised an operating profit of $353.8 million. These results were achieved following the activation of QTC’s new business operating model, including the successful implementation of new enterprise IT platforms.
| | |
 | | Operational excellence drives a successful year Solid investor demand for QTC’s AUD benchmark bonds provided the foundation of the successful execution of the $5.9 billion 2016-17 borrowing program. Despite a backdrop of improved global economic conditions, the operating environment remained challenging, with uncertainty led by geopolitical tensions and questions over monetary and fiscal policy in major economies. In addition, the Queensland economy continues to adjust following a period of significant mining investment. QTC experienced another successful year with a range of milestone events highlighting the value created for Queensland. These include: • Successful early completion of the 2016-17 term debt borrowing program and prefunding of $2.4 billion for future borrowing programs, a total of $8.3 billion. • Smoothed and extended QTC’s bond maturity profile through $2.5 billion 2027 Benchmark bond issue. • Issued 30 year bonds. • Successfully piloted a ‘virtual bond’ using a blockchain platform. • Completed $750 million issue of QTC’s first Green Bond, the largest Green Bond issue by an Australian issuer at the time. • Repatriation to Treasury of $500 million in past surpluses. Long-term assets |
| |
| | Separate from QTC’s capital markets operations, QTC’s long-term assets, which comprises the investments set aside primarily to support the State’s defined benefit superannuation, recorded an after tax operating profit of $224.6 million (2015-16: $908.6 million loss). Managed by QIC, these assets were transferred to QTC by the Queensland Government under an administrative arrangement in 2008; in return, QTC issued fixed-rate notes to the State that provide a fixed rate of return. While QTC bears the fluctuations in the value and returns on the asset portfolio, there is no cash flow effect for QTC. Any losses incurred by this segment have no impact on QTC’s capital markets activities or its ability to meet its obligations. |
| | Credit ratings |
| | Moody’s Investor Service rating outlook for Queensland was revised to stable from negative in April 2017. QTC is rated AA+/A-1+/Stable and Aa1/P-1/Stable from Standard & Poor’s and Moody’s respectively. |
| | | | |
| | QUEENSLAND TREASURY CORPORATION | | ANNUAL |
| | | | REPORT 2016-17 |
QTC’s advice benefits State
The 2016-17 financial year saw the Client Services Division continue to create significant value for the State, with a wide range of advisory projects reaping dividends for QTC’s public sector clients, including:
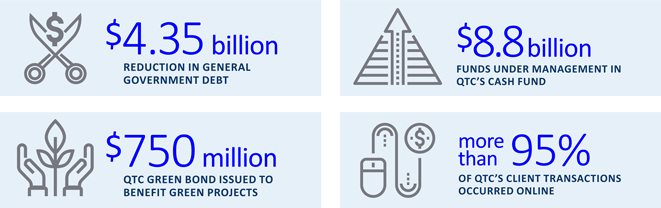
| • | | Facilitation of $4.35 billion in General Government debt reduction over the forward estimate through advice and improved cashflow management. |
| • | | Financial Assurance Review completed that identified close to $8 billion worth of liability for Government in mining rehabilitation. |
| • | | More than $600 million in new funds attracted to QTC’s cash fund as a result of repayment and investment advice. |
| • | | Structured net debt solution delivered resulting in $2.2 billion debt reduction in FY17 for the State. |
| • | | Forecasting models developed that cover 55 per cent of the State’s expenditure to better manage State finances. |
| • | | Financial Education partnership with established University of Queensland offering public sector clients the opportunity to gain the knowledge required to better manage their finances. |
Benefits realised from revitalised systems and processes
The simplification of systems and processes, the move to industry-standard software platforms and targeted recruitment has significantly increased productivity across the business. For example, more than 95 per cent of QTC’s client transactions now occur online via the QTC Link portal.
These positive results have led to increased value for our clients, and increased the overall value to the State generated by QTC.
Changes to Board membership
Stephen Roberts was appointed to QTC’s Capital Markets Board on 8 June 2017, with tenure to 30 June 2020. He brings extensive investment banking, leadership and governance expertise, developed across his career in global financial markets. Mr Roberts replaced Bill Shields who resigned on 31 December 2016.
Mr Shields made a significant contribution to QTC’s success during his 11 year tenure, bringing the benefit of his extensive experience in the banking and finance industry, government policy advice and specialisation in economics. On behalf of the Board, I thank him for his dedication and contribution.
It’s also my pleasure to again acknowledge the hard work of QTC’s employees, who have delivered significant value to the State over the 2016-17 financial year.
Looking to the future
QTC will continue to focus on fulfilling its responsibility to advance the financial position of the State, while helping manage and minimise financial risk in the public sector. QTC’s ability to cost-effectively raise funds to support the State’s borrowing program remains the cornerstone of our business. Further opportunities to help QTC’s public sector clients through the provision of advice will continue to be realised over time.
QTC’s results in the 2016-17 financial year were strong and, as the benefits continue to flow from our revitalised business model and increased capability, we anticipate another solid year of performance in 2017-18.
| | |
 | |  |
G P BRADLEY | | P C NOBLE |
| Chairman | | Chief Executive |
| 25 September 2017 | | 25 September 2017 |
Supplementary update: QTC wins prestigious industry awards
In July 2017, QTC won two awards for Operational Excellence at the International Quality and Productivity Centre Awards in:
| • | | Customer Centricity and Experience, and |
| • | | Cultural Transformation. |
Both award submissions focused on QTC’s successful Strategic Change Program, and the awards were an acknowledgement of the hard work of employees and the strong results achieved by the Program in the 2016-17 financial year.
In addition to these awards, QTC also took out the Australian HR Team of the Year (<1,000 employees) at The Australian HR Awards announced in September 2017.
| | | | |
| ANNUAL | | QUEENSLAND TREASURY CORPORATION | | |
| REPORT 2016-17 | | | | |
Creating value for the State and clients
In 2016-17, QTC contributed significant, positive financial results for the State and its public sector entities through the delivery of debt funding and management, cash management, financial advisory, and specialist public finance education services. QTC’s continued focus on delivering whole-of-State outcomes by providing advice and initiatives that enable clients to make better business decisions and improve revenues has been integral to this success.
Financial advice for the State’s public sector
In the year under review, QTC completed a broad range of financial advisory assignments to assist its clients and the State to address financial and risk management issues.
More than 200 major client advisory assignments were delivered, equivalent to $25 million in client service hours. QTC assisted clients to deliver budget savings, improve revenue and mitigate financial risks. Assignments included:
| • | | high-level, business forward planning for major Government entities |
| • | | financial assurance reviews to reduce risk and avoid cost |
| • | | surplus cash management strategies |
| • | | business sustainability and credit related advice across a range of QTC’s clients |
| • | | developing industry-specific financial modelling tools to improve clients’ business practices |
| • | | business case and project evaluation for infrastructure and assets of all sizes, and |
| • | | procurement and tender evaluation, including contract reviews and market sounding proposals. |
QTC developed forecasting models that account for 55 per cent of the State’s expenditure to support:
| • | | eight out of 16 hospital and health services |
| • | | housing, homelessness and youth justice |
| • | | the criminal justice system, and |
| • | | the Department of Education and Training. |
Delivering on the debt action plan
Working closely with Queensland Treasury, QTC facilitated the design and delivery of a number of initiatives from the review of the State’s balance sheet and implementation of the Government’s Debt Action Plan, including the:
| • | | facilitation of $4.35 billion in General Government debt reduction over the forward estimate through advice and improved cashflow management |
| • | | structuring of a net debt solution resulting in a reduction in the debt to revenue ratio of 60 per cent, and |
| • | | lengthening of the duration of core debt from 5.25 years to 5.75 years. |
Fostering strong relationships with local governments
Throughout the year, we have worked closely with our local government clients and provided a broad range of advice ranging from structural options for major council-owned assets and project evaluation to business case assessment for new council infrastructure.
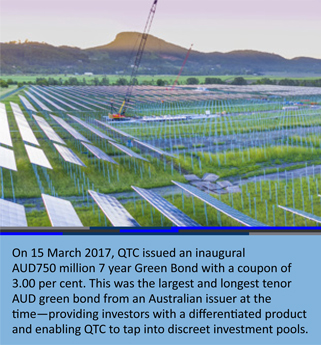
Facilitating innovative funding
On 15 March 2017, QTC issued an inaugural AUD750 million seven year Green Bond with a coupon of 3.00 per cent. This was the largest and longest tenor AUD green bond from an Australian issuer at the time. QTC Green Bonds are guaranteed by the Queensland State Government, issued under the AUD Bond Program with 144A capability and certified by the Climate Bonds Initiative.
High quality debt and cash management products
QTC continued to provide low-cost loans and high-performing investment facilities throughout 2016-17.
Debt management
QTC has continued to successfully deliver its core mandate of providing clients with a lower cost of funds—by capturing the significant economies of scale and scope in the issuance, management and administration of the State’s debt.
Cash management
QTC offers cash management products that enable its clients to maximise the value of their surplus funds. In 2016-17, QTC’s Capital Guaranteed Cash Fund provided strong returns and outperformed its benchmark, the Bloomberg AusBond Bank Bill Index, by 79 basis points. During the year, QTC’s Cash Fund attracted new clients and, on 30 September 2016, it reached a milestone with more than $10 billion of funds under management—the highest amount in its history. At the end of the 2016-17 financial year it remained one of the largest managed funds in Australia with $8.8 billion under management.
| | | | |
| | QUEENSLAND TREASURY CORPORATION | | ANNUAL |
| | | | REPORT 2016-17 |
Client access website portal
In 2016-17, QTC made significant progress with the implementation of QTC Link—a new client portal as part of the organisation’s online offering to clients. QTC Link, through its industry-standard transaction platform, enabled 96 per cent of QTC’s client transactions to take place online.
Education program
QTC’s role in equipping clients with specialist financial knowledge and capabilities has continued. From July 2016 until May 2017, more than 600 clients attended QTC-delivered courses with a post-course satisfaction evaluation of 9 out of 10.
In May 2017, QTC partnered with The University of Queensland to develop and deliver a new enhanced and expanded education program tailored specifically to public sector clients. The partnership model has enabled QTC to deliver a new accredited program, the Graduate Certificate in Business Leadership (Public Sector Finance). As a result, the number of workshops available to Queensland public sector clients has expanded to 16 with more under consideration.
Loans to clients
| | | | | | | | |
| | | TOTAL DEBT OUTSTANDING | | | TOTAL DEBT OUTSTANDING | |
| | | (MARKET VALUE) | | | (MARKET VALUE) | |
| | | 30 JUNE 17 | | | 30 JUNE 16 | |
| | | A$000 | | | A$000 | |
Government General* | | | 33 655 316 | | | | 38 394 707 | |
Energy | | | 24 999 435 | | | | 25 970 955 | |
Water | | | 13 994 598 | | | | 14 597 305 | |
Local governments | | | 6 449 434 | | | | 6 507 397 | |
Transport | | | 4 891 024 | | | | 4 276 921 | |
Education | | | 710 367 | | | | 706 016 | |
Other | | | 402 234 | | | | 369 726 | |
| | | | | | | | |
Total | | | 85 102 408 | | | | 90 823 027 | |
| | | | | | | | |
* Government General includes the following State Government departments: Education and Training, Housing and Public Works, State Development, Transport and Main Roads, Health and Treasury.
| | | | |
| ANNUAL | | QUEENSLAND TREASURY CORPORATION | | |
| REPORT 2016-17 | | | | |
Achieving sustainable access to funding
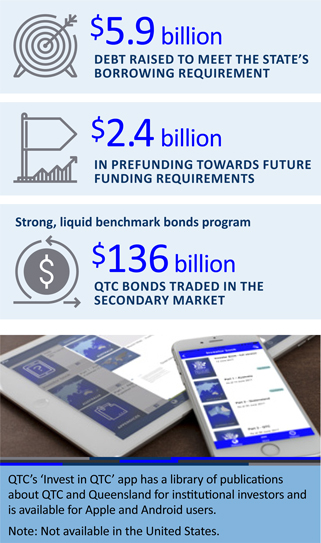
In 2016-17, QTC raised $5.9 billion of term debt to meet its clients’ annual funding requirements and refinance debt maturities. QTC also undertook an additional $2.4 billion pre-funding, reducing future borrowing programs. New strategic initiatives were implemented to further diversify QTC’s investor base, including a QTC Green Bond—the largest AUD green bond issue from an Australian issuer at the time.
Meeting the State’s funding requirements
QTC continued to demonstrate its reputation as a premium issuer with its investors, through the high-quality execution of term debt issuance. Using the strength of its AA+ credit rating, QTC provided the market with diverse, liquid lines that resulted in $8.3 billion being successfully raised for the State’s borrowing and refinancing requirement.
The original estimated term debt requirement for 2016-17 was $7.3 billion. This was revised down to $5.9 billion following the Government’s Mid-Year Fiscal and Economic Review, released in December 2016.
QTC undertook a range of activities to complete its annual borrowing program and support its bonds in the market, including:
| • | | completing the term debt requirement of $5.9 billion |
| • | | prefunding $2.4 billion towards the future funding requirements |
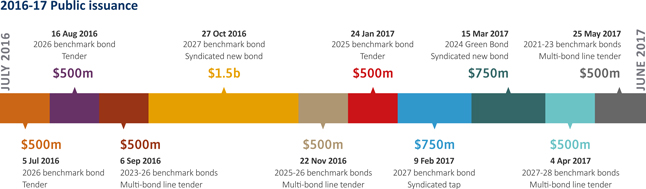
| • | | issuing $5.75 billion of benchmark bonds via public issuance, including two syndicated transactions for $2.25 billion and seven tenders for $3.5 billion |
| • | | issuing one new benchmark bond maturing in 2027 |
| • | | issuing a new 2024 green bond—the largest by an Australian issuer at the time—of $750 million by syndication, and |
| • | | issuing $615 million equivalent of new 30 year Euro and AUD bonds. |
QTC maintained its focus on providing its Fixed Income Distribution Group and investor base with greater flexibility and improved transparency.
On 14 June 2017, QTC announced its $6.8 billion term debt borrowing requirement for the 2017-18 fiscal year.
| | | | |
| | QUEENSLAND TREASURY CORPORATION | | ANNUAL |
| | | | REPORT 2016-17 |
Funding facilities
As at 30 June 2017
QTC has a diverse range of funding facilities in a variety of markets and currencies. The majority of QTC’s funding is
sourced through long-term debt facilities, with QTC’s AUD benchmark bonds comprising the principal source of funding.
| | | | | | | | |
OVERVIEW AS AT 30 JUNE 2017 | | SIZE ($M) | | MATURITIES | | CURRENCIES |
| | Domestic T-Note | | Unlimited | | 7–365 days | | AUD |
| Short-term | | Euro CP | | USD10,000 | | 1–364 days | | Multi-currency |
| | US CP | | USD10,000 | | 1–270 days | | USD |
| | AUD Bond | | Unlimited | | 13 benchmark lines: 2017-2028, 2033 | | AUD |
| | | | 3 AGG* lines: 2017-2021 | | AUD |
| | | | 1 QTC Green Bond: 2024 | | AUD |
| | | | 1 floating rate note: 2018 | | |
| Long-term | | | | | | 1 capital indexed bond: 2030 | | AUD |
| | | | | | 1 preferred line: 2047 | | |
| | Global AUD Bond | | AUD20,000 | | AGG* line: 2017 (transferable to domestic bonds) | | AUD |
| | Euro MTN | | USD10,000 | | Any maturity subject to market regulations | | Multi-currency |
| | US MTN | | USD10,000 | | 9 months - 30 years | | Multi-currency |
*AGG – Australian Government Guaranteed
Funding performance
QTC’s proactive management of the borrowing program and the management of its client funding and balance sheet activities helped to smooth and extend its maturity profile and support QTC’s bond spreads. Management of QTC’s liquid assets, funding execution, QTC’s Cash Fund, client debt transactions and debt rebalancing provided significant savings during 2016-17, while QTC’s total debt outstanding at year end was approximately $90 billion.
QTC’s issuance strategy continues to support its commitment to a diverse range of funding sources to complement its core AUD benchmark bond program. This diversity has seen it utilise a variety of instruments in the past year including green bonds, bond maturities out to 30 years and non-Australian dollar denominated bonds, as well as its AUD benchmark bond program. There was strong investor demand for each of QTC’s public issuances.
In 2017-18, QTC proactively managed its bond maturity profile to reduce refinancing risk by achieving more even maturities across the curve. This included reducing 2017 and 2018 maturities by $3 billion to reduce refinancing risk, improve credit metrics and smooth and extend the maturity profile. The issuance of $2.5 billion in a new 2027 benchmark bond also contributed to smoothing and extending QTC’s maturity profile.
QTC continued to focus on activities to expand its investor base, delivering an enhanced and effective domestic and global intermediary relationship program during the year. In partnership with Commonwealth Bank of Australia, QTC delivered a successful North Queensland investor conference. Open and transparent communication with the market remains a key focus. QTC continues to regularly engage with both its Fixed Income Distribution Group and investors through annual roadshow activities.
| | | | |
| ANNUAL | | QUEENSLAND TREASURY CORPORATION | | |
| REPORT 2016-17 | | | | |
Realising operational excellence
QTC is committed to maintaining high organisational standards to provide an environment where corporate goals can be achieved and organisational risks are actively monitored and addressed. QTC’s Strategic Change Program delivered significantly over and above the targeted benefits this financial year.
Operational excellence
In 2016-17, QTC activated its new business operating model and a range of new technologies that enhanced its financial and risk management systems and processes.
The successful implementation of new IT platforms automated many formerly manual processes, leading to significant productivity gains across the organisation. In addition, QTC’s ability to create value for clients has been substantially enhanced following the creation of new roles and the recruitment of a significant number of new people. Highlights include:
| • | | transition from 250 applications to four core software platforms |
| • | | 96 per cent of client transactions completed online – more than 50 per cent in excess of target |
| • | | reduction in time spent rebalancing portfolios from approximately 120 hours to approximately 6 hours per month |
| • | | employee productivity increased, and reduced employee induction times |
| • | | 76 per cent employee engagement – a 33 per cent increase in 12 months |
| • | | 73 per cent reduction in the number of policy documents, and |
| • | | new employees rate recruitment satisfaction at 88 per cent. Our focus on achieving operational excellence continues, with more gains to be made as we continue to incrementally improve our systems, processes and our approach to the attraction and retention of high calibre employees. |
Corporate risk management and efficiency
QTC manages its risks within an enterprise-wide risk management framework. The framework supports the achievement of QTC’s corporate objectives by providing assurance that QTC’s risks are identified, assessed and adequately and appropriately managed.
QTC produces a risk appetite statement that establishes clear boundaries in which QTC’s material risks should be managed.
The framework identifies key internal controls, and through periodic attestation by control owners, assurance is given to management and the Board that these controls are operating effectively.
Throughout 2016-17, QTC managed its portfolio market risk exposures, including interest rate, foreign exchange and counterparty risk, within its Board-approved risk management framework. QTC continues to hold a portfolio of diverse, liquid financial securities to meet the State’s liquidity requirements, consistent with its internal and external policies.
High performance workforce
QTC recruits from the global financial industry to attract and retain its high calibre of employees. Pursuant to the Queensland Treasury Corporation Act 1988, QTC employees are hired on individual contracts, with employment practices aligned to the financial markets in which QTC operates.
QTC’s Board regularly reviews QTC’s remuneration framework, which comprises fixed and variable remuneration. The reviews are benchmarked against remuneration data from the Financial Institutions Remuneration Group (FIRG) that provides salary survey data for the Australian finance industry. QTC’s variable remuneration framework provides an opportunity for an annual short-term incentive for eligible employees designed to ensure market competitiveness and reward outstanding organisational, group and individual performance. The QTC Board approves the entitlement to, and the quantum of, the annual review of fixed remuneration and variable short-term incentives.
To realise the intent and benefits of QTC’s organisational transformation, this year’s focus areas have been on recruitment and induction of new employees aligned to the new business operating model and organisational structure, and on delivering the anticipated ‘end state’ organisational culture—agile, energised, outperforming and engaged.
Key initiatives to support these focus areas included targeted recruitment, leadership development, talent management and succession planning programs, professional development initiatives, and culture and diversity programs. Culture transformation has been supported by a series of organisation-wide and team-based culture development programs. An employee engagement and culture survey, held during the Strategic Change Program, measured an employee engagement rate of 76 per cent.
Leadership development continues to be an area of organisational priority. In the year under review, focus has included a foundational leadership program for QTC’s emerging leaders, and leadership coaching refreshers for QTC’s senior leaders.
| | | | |
| | QUEENSLAND TREASURY CORPORATION | | ANNUAL |
| | | | REPORT 2016-17 |
A focus on diversity and wellbeing
QTC’s Strategic Change Program identified a range of opportunities in workforce composition, flexible work arrangements and employee wellbeing.
QTC’s Diversity and Inclusion Strategy recognises that diversity of perspective and experience improves performance, manages risk, and improves decision-making. Under the strategy’s three priority streams of culture, disability and gender, a number of initiatives were implemented, including:
| • | | activities to celebrate the 26 nationalities represented in QTC’s workforce |
| • | | two partnerships with external organisations to provide employment opportunities for people with a disability, and |
| • | | targeted mentoring for women in non-traditional roles. |
The focus on diversity has resulted in a continued increase of women in senior leadership roles, with females now comprising 44 per cent of Managing Directors and Executive Directors. This improvement compares favourably to the gender mix in senior leadership roles when compared to 2012, when only 20 per cent of these roles were held by women.
The implementation of the Strategic Change Program resulted in changes to the workforce profile. At the end of the 2016-17 financial year, there were 183 full-time equivalent employees (including fixed-term employees). The separation rate for the year was 38.6 per cent.
QTC’s policies support flexible working, where flexibility will contribute to QTC achieving its corporate objectives. Flexible working arrangements in place at QTC during the reporting period included part-time work, job share, purchased annual leave, phased retirement and flexible hours of work.
QTC has a corporate health and wellbeing program that provides activities to promote physical and mental wellbeing. Activities for the 2016-17 financial year have included flu vaccinations, health assessments, skin checks, team sports, healthy eating seminars, and mental health and resilience sessions.
QTC continued its practice of regularly reviewing and updating its policies and procedures to comply with changes in the legislative and regulatory environment and to ensure employees have access to avenues through which to raise concerns, including an internal grievance process.
| | | | |
| ANNUAL | | QUEENSLAND TREASURY CORPORATION | | |
| REPORT 2016-17 | | | | |
Ensuring corporate governance
QTC is committed to maintaining high standards of corporate governance to support its strong market reputation and ensure that organisational goals are met and risks are monitored and appropriately addressed. QTC’s corporate governance practices are continually reviewed and updated in line with industry guidelines and standards.
QTC and its Boards
QTC was established by the Queensland Treasury Corporation Act 1988 (the QTC Act) as a corporation sole (ie, a corporation that consists solely of a nominated office holder). The Under Treasurer of Queensland is QTC’s nominated office holder. QTC has delegated its powers to its two boards:
| • | | the Queensland Treasury Corporation Capital Markets Board (the Board), which was established in 1991 and manages all of QTC’s operations except those relating to certain superannuation and other long-term assets, and |
| • | | the Long Term Asset Advisory Board, which was established in July 2008 and advises in relation to certain superannuation and other long-term assets that were transferred to QTC from Queensland Treasury on 1 July 2008. |
QTC Capital Markets Board
QTC and the Capital Markets Board have agreed the terms and administrative arrangements for the exercise of the powers that have been delegated to the Board by QTC (as the corporation sole).
The Board operates in accordance with its charter, which sets out its commitment to various corporate governance principles and standards, the roles and responsibilities of the Board and its members (based on its delegated powers), and the conduct of meetings. The charter provides that the role and functions of the Board include:
| • | | overseeing QTC’s operations, including its control and accountability systems |
| • | | approving the strategic direction of QTC and significant corporate strategic initiatives |
| • | | approving key policies and corporate performance objectives |
| • | | setting the risk appetite within which management is expected to operate |
| • | | approving the annual budget as proposed by management |
| • | | approving financial and other reporting to the market and stakeholders |
| • | | approving the remuneration framework |
| • | | monitoring of financial, operational and corporate performance against agreed outcomes |
| • | | monitoring and measuring the performance of QTC’s management and implementation of strategy and policies, including assessing whether appropriate resources are available |
| • | | reviewing and monitoring systems of risk management and internal compliance and controls, and |
| • | | monitoring compliance with all relevant legal, tax and regulatory obligations. |
The Board typically holds monthly meetings (except in January, April and November) and may, whenever necessary, hold additional meetings.
Board appointments
The Board comprises board members who are appointed by the Governor-in-Council, pursuant to section 10(2) of the QTC Act, with consideration given to each Board member’s qualifications, experience, skills, strategic ability and commitment to contribute to QTC’s performance and achievement of its corporate objectives. QTC’s Board is entirely constituted of non-executive directors.
Conflict of interest
Board members are required to monitor and disclose any actual or potential conflicts of interest. Unless the Board determines otherwise, a conflicted Board member may not receive any Board papers, attend any meetings or take part in any decisions relating to declared interests.
Performance and remuneration
To ensure continuous improvement and to enhance overall effectiveness, the Board conducts an annual assessment of its performance as a whole. Board members’ remuneration is determined by the Governor-in-Council (details are disclosed in QTC’s financial statements).
Board committees
The Board has established three committees, each with its own terms of reference, to assist it in overseeing and governing various QTC activities.
Accounts and Audit Committee
The Accounts and Audit Committee has responsibility for the:
| • | | adequacy and effectiveness of internal controls, including for the prevention of fraud |
| • | | integrity of financial statements |
| • | | adequacy and effectiveness of compliance monitoring, and |
The Accounts and Audit Committee must have at least three members and meet at least four times a year.
| | | | |
| | QUEENSLAND TREASURY CORPORATION | | ANNUAL |
| | | | REPORT 2016-17 |
During the year the Accounts and Audit Committee recommended the adoption of the half year and annual financial statements, reviewed external and internal audit reports and the progress in implementing the recommendations from those reports, and reviewed the Queensland Audit Office’s Client Service Plan and QTC’s Internal Audit Plan.
As required by the Audit Committee Guidelines: Improving Accountability and Performance issued by Queensland Treasury, QTC’s Accounts and Audit Committee has observed its terms of reference and has had due regard to the Audit Committee Guidelines.
Human Resources Committee
The Human Resources Committee has responsibility for:
| • | | the appropriateness of any new or amended human resources policy |
| • | | the framework for, and review of, employee remuneration and performance, and |
| • | | employment terms and conditions. |
The Human Resources Committee must have at least three members and meet at least three times a year. The Human Resources Committee has observed its terms of reference.
Funding and Markets Committee
The core responsibilities of the Funding and Markets Committee is to assist the Board by making recommendations about the policy to enhance the performance and management of risk in the areas of funding accessibility (including liquidity) and balance sheet management, and to support QTC’s risk appetite with a focus on effectiveness and performance.
The Committee must have at least three members and meet at least four times a year. The Funding and Markets Committee has observed its terms of reference.
| | | | | | | | | | | | | | | | |
| | | BOARD | | | ACCOUNTS
& AUDIT
COMMITTEE | | | FUNDING &
MARKETS
COMMITTEE | | | HUMAN
RESOURCES
COMMITTEE | |
Meetings held | | | 10 | | | | 4 | | | | 4 | | | | 3 | |
Gerard Bradley | | | 10 | | | | 2 | † | | | 4 | | | | 3 | |
Warwick Agnew | | | 9 | | | | 4 | | | | — | | | | — | |
Tonianne Dwyer | | | 10 | | | | — | | | | — | | | | 3 | |
Anne Parkin | | | 10 | | | | 4 | | | | — | | | | 2 | |
Stephen Roberts^ | | | 1 | | | | — | | | | 0 | | | | — | |
Bill Shields* | | | 4 | | | | — | | | | 1 | | | | — | |
Jim Stening | | | 9 | | | | — | | | | 4 | | | | — | |
Karen Smith-Pomeroy§ | | | 10 | | | | 4 | | | | 4 | | | | — | |
| * | Mr Shields resigned from the Board effective 31 December 2016. He attended four Board meetings out of five held during the period. He also attended one Funding and Markets Committee meeting held out of two during the period. |
| ^ | Mr Roberts joined the Board on 8 June 2017. He attended one Board meeting out of one held during the period. Mr Roberts was appointed to the Funding and Markets Committee on 15 June 2017, however no Committee meetings were held during the period. |
| † | Mr Bradley attended two meetings as the Chairman of the Board. |
| § | Ms Smith-Pomeroy was a Funding and Markets Committee member until 15 June 2017. |
| | | | |
| ANNUAL | | QUEENSLAND TREASURY CORPORATION | | |
| REPORT 2016-17 | | | | |
QTC’s Capital Markets Board as at 30 June 2017
Board members are appointed by the Governor-in-Council, pursuant to section 10(2) of the Queensland Treasury Corporation Act 1988 on the recommendation of the Treasurer and in consultation with the Under Treasurer. Members are chosen on their ability and commitment to contribute to QTC’s performance and achievement of its stated objectives.
| | | | |

| | GERARD BRADLEY BCOM, DIPADVACC, FCA, FCPA, FAICD, FIML Chair Appointed 10 May 2012 with tenure to 30 June 2019 Board Committees • Member, Human Resources Committee • Member, Funding and Markets Committee | | Prior to his appointment as the Chair of QTC’s Board, Mr Bradley was the Under Treasurer and Under Secretary of the Queensland Treasury Department, a position he held from 1998 to 2012. He was also a QTC Board member from 2000-2007. Mr Bradley has extensive experience in public sector finance gained in both the Queensland and South Australian treasury departments. He was Under Treasurer of the South Australian Department of Treasury and Finance from 1996 to 1998, and of Queensland’s Treasury Department from 1995 to 1996. Mr Bradley held various positions in Queensland Treasury from 1976 to 1995, with responsibility for the preparation and management of the State Budget and the fiscal and economic development of Queensland. He is currently a Non-Executive Director and Chairman of Queensland Treasury Holdings Pty Ltd and related companies, and a Non-Executive Director of Star Entertainment Group Ltd, Pinnacle Investment Management Group Limited and the Winston Churchill Memorial Trust. |
| | |
 | | WARWICK AGNEW BECON, MSOCSC (ECON), MAPPFIN GRADUATE OF AUSTRALIAN INSTITUTE OF COMPANY DIRECTORS Appointed 13 November 2014 with tenure to 30 June 2020 Board Committee • Member, Accounts and Audit Committee | | Warwick Agnew is Queensland Treasury’s Deputy Under Treasurer, Agency Performance and Investment, previously holding the positions of Deputy Under Treasurer, Commercial Advisory and prior the department’s Chief Operating Officer. Throughout his career, Mr Agnew has held senior leadership positions across both public and private sector organisations including roles with Queensland Treasury and Trade, Queensland Treasury Corporation and ASX-listed entities, Macquarie Capital and Transfield Services. Mr Agnew’s extensive experience has seen him undertake senior roles involving social and economic infrastructure projects, economic analysis and policy, financial and commercial procurement, corporate finance advisory services, and operations and maintenance services at a national level. Mr Agnew represents Queensland Treasury on the Long Term Asset Advisory Board and holds a Director position on the Queensland Rural and Industry Development Authority Board and the Public Trustee Investment Board. Mr Agnew is an Independent Director on the Board of Surf Lifesaving Queensland. |
| | |
 | | TONIANNE DWYER BJURIS (HONS), LLB (HONS), GAICD Appointed 14 February 2013 with tenure to 30 June 2020 Board Committee • Chair, Human Resources Committee | | Tonianne Dwyer is a lawyer by profession with a career of more than 25 years in international investment banking and finance in both executive management and board positions. Ms Dwyer’s executive experience covered a broad range of sectors, including real estate investment and development, financial services, health and aged care, education, research and development, and media. She held senior roles with Hambros Bank Limited, Societe Generale and Quintain Estates & Development PLC including a role with the finance division of the UK Department of Health. Over her executive career she had experience in the UK, Europe and Wall Street. Ms Dwyer currently holds directorships with Metcash Limited, DEXUS Property Group, DEXUS Wholesale Property Fund, ALS Limited and Oz Minerals Limited. She is also a Senator and Deputy Chancellor of the University of Queensland. |
| | | | |
| | QUEENSLAND TREASURY CORPORATION | | ANNUAL |
| | | | REPORT 2016-17 |
| | | | |
 | | ANNE PARKIN B SCIENCE (HONS), DIP. ED, GRAD DIP SEC, MBA, MAICD, F FIN Appointed 1 July 2016 with tenure to 30 June 2019 Board Committees • Member, Accounts and Audit Committee • Member, Human Resources Committee | | Anne Parkin has more than 25 years’ of international management and board level experience across Asia-Pacific banking and financial services. Ms Parkin has held diverse leadership roles in domestic and global broking and banking, superannuation administration, retail management and education in both the public and private sectors. At an executive level, Anne has experience operating in highly regulated businesses including banking with Credit Suisse, UBS, and in Australian superannuation. Ms Parkin is Chairman of Eco Fuels Innovations and previously, was a Non-Executive Director of both Credit Suisse Securities in Malaysia and the Philippines. As an Executive Director, she was a member of the Hong Kong Control Committee responsible for oversight of operational risk for Credit Suisse Hong Kong and its affiliates, while as Operations Executive, she was accountable for operational matters with local regulators including the Hong Kong Monetary Authority and Hong Kong Securities & Futures Commission. In recognition of her expertise in the Asia-Pacific, Ms Parkin was invited to participate in the Asia Securities Industry & Financial Markets Association (ASIFMA). |
| | |
 | | STEPHEN ROBERTS BECON Appointed 8 June 2017 with tenure to 20 June 2020 Board Committee • Member, Funding and Markets Committee | | Stephen Roberts brings extensive investment banking, leadership and governance expertise, developed across his career in the global financial markets. He is the former Chief Executive and Chief Country Officer of Citigroup Australia, where he was responsible for the Citi franchise in Australia and New Zealand. Prior to that, Mr Roberts was the Managing Director, Institutional Business, Citigroup Australia, with responsibility for the institutional business, including corporate and investment banking, markets, and transaction services. He has also held senior roles with Salomon Brothers/Citigroup Hong Kong, Lehman Brothers in Hong Kong, Salomon Brothers in London, Melbourne, Sydney and New York. Mr Roberts is a current Director of the Great Barrier Reef Foundation, a Director of the Bradman Foundation, and an Adjunct Professor of Finance, Sydney University. |
| | |
 | | KAREN SMITH- POMEROY ADIP (ACCOUNTING), GAICD, FIPA, FFIN Appointed 9 July 2015 with tenure to 8 July 2019 Board Committee • Chair, Accounts and Audit Committee | | Karen Smith-Pomeroy is an experienced financial services senior executive with a specialty in risk and governance. She held senior executive roles with Suncorp Group Limited from1997 to 2014, including Executive Director, Suncorp Group subsidiary entities from 2009 to 2014. She has also held positions on a number of Boards and committees including Queensland Department of Local Government, Community Recovery and Resilience, CS Energy Limited and Tarong Energy Corporation Limited. Ms Smith-Pomeroy is a Non-Executive Director of National Affordable Housing Consortium Limited, Stanwell Corporation Limited, InFocus Limited and Kina Securities Limited. She is a Queensland Advisory Board member of Australian Super and is also an Independent Audit Committee member of the Queensland Department of Infrastructure, Local Government and Planning, and South Bank Corporation. |
| | |
 | | JIM STENING DIPFINSERV, FAICD Appointed 13 November 2014 with tenure to 30 June 2020 Board Committee • Chair, Funding and Markets Committee | | Jim Stening has more than 30 years’ experience in financial markets in the fixed income asset class, including hands-on trading and investing in Australian and global capital markets. Mr Stening has extensive experience in debt markets, business development, executive management and corporate governance across a diverse range of economic cycles. He has held senior roles at NAB, Merrill Lynch and Banco Santander in addition to his role as founder and Managing Director of FIIG Securities Limited, Australia’s largest specialist fixed-income firm. Mr Stening is the Managing Director of FIIG Securities Limited (and related companies) and Chairman of OzFish Unlimited. |
| | | | |
| ANNUAL | | QUEENSLAND TREASURY CORPORATION | | |
| REPORT 2016-17 | | | | |
Long Term Asset Advisory Board
The Long Term Asset Advisory Board (LTAAB) was established in July 2008, following the transfer of certain superannuation and other long-term assets from Treasury to QTC (primarily for reasons relating to market volatility).
The LTAAB has power delegated from QTC to:
| • | | manage the sufficiency of the funding of the long-term assets |
| • | | set investment objectives and strategies for the long-term assets |
| • | | set the appropriate investment structure for the long-term assets, and |
| • | | monitor investment performance of the long-term assets. |
The LTAAB holds meetings at least four times per year and held six in the year under review.
The LTAAB members are appointed by the Governor-in-Council, pursuant to section 10(2) of the QTC Act.
The members of LTAAB are:
| | |
Name | | Position |
| Jim Murphy, Under Treasurer | | Chairperson |
| Philip Noble, Chief Executive, QTC | | Member |
| Wayne Cannon, State Actuary | | Member |
| Dennis Molloy, Deputy Under Treasurer (Economics and Fiscal) | | Member |
| Warwick Agnew, Deputy Under Treasurer (Agency Performance and Investment) | | Member |
The LTAAB has observed its terms of reference.
Auditors
In accordance with the provisions of the Auditor-General Act 2009, the Queensland Audit Office is the external auditor for QTC. The Queensland Audit Office has the responsibility for providing Queensland’s Parliament with assurances as to the adequacy of QTC’s discharge of its financial and administrative obligations.
The Financial and Performance Management Standard 2009 (Qld) (Standard) governs the operation of QTC’s internal audit function. QTC outsourced its independent internal audit function to Ernst and Young (EY) for the 2016-17 financial year. Internal audit reports to the Accounts and Audit Committee and is conducted under an Internal Audit Policy,
consistent with the relevant audit and ethical standards. The role of internal audit is to support QTC’s corporate governance framework by providing the Board (through the Accounts and Audit Committee) with:
| • | | assurance that QTC has effective, efficient and economical internal controls in place to support the achievement of its objectives, including the management of risk, and |
| • | | advice with respect to QTC’s internal controls and business processes. |
Internal audit is responsible for:
| • | | developing an annual audit plan, based on the assessment of financial and business risks (based on QTC’s approved significant risks and internal workshops) aligned with QTC’s strategic goals and objectives, and approved by the Accounts and Audit Committee |
| • | | providing regular audit reports and periodic program management reports to the management team and the Accounts and Audit Committee, and |
| • | | working constructively with QTC’s management team to challenge and improve established and proposed practices and to put forward ideas for process improvement. |
In the year under review, EY completed its internal audits in accordance with the approved annual audit plan.
QTC has had due regard to Treasury’s Audit Committee guidelines, in establishing and supervising its outsourced internal audit function and, together with the Accounts and Audit Committee, in overseeing and monitoring the internal audit function.
Management team
The responsibility for the day-to-day operation and administration of QTC is delegated by the Board to the Chief Executive and the Executive Management Team. The Chief Executive is appointed by the Board. Executives are appointed by the Chief Executive. As with the Board, Executive Management Team appointments are made on the basis of qualifications, experience, skills, strategic ability, and commitment to contribute to QTC’s performance and achievement of its corporate objectives
QTC’s Executive Management Team as at 30 June 2017
| | |
| Philip Noble | | Chief Executive |
| Grant Bush | | Deputy Chief Executive and Managing Director, Funding and Markets |
| Mark Girard | | Managing Director, Client Advisory |
| Rupert Haywood | | Managing Director, Risk and Financial Operations |
| Jane Keating | | Managing Director, Corporate Services |
| | | | |
| | QUEENSLAND TREASURY CORPORATION | | ANNUAL |
| | | | REPORT 2016-17 |
Financial Statements
For the year ended 30 June 2017
| | | | |
Statement of comprehensive income | | | 18 | |
| |
Balance sheet | | | 19 | |
| |
Statement of changes in equity | | | 20 | |
| |
Statement of cash flows | | | 21 | |
| |
Notes to the Financial Statements | | | 22 | |
| |
∎ Capital Markets Operations | | | 24 | |
| |
∎ Long Term Assets | | | 39 | |
| |
∎ Other information | | | 41 | |
| |
Certificate of the Queensland Treasury Corporation | | | 45 | |
| |
Independent Auditor’s report | | | 46 | |
| |
Management report | | | 50 | |
| | | | |
| ANNUAL | | QUEENSLAND TREASURY CORPORATION | | |
| REPORT 2016-17 | | | | |
Statement of comprehensive income
For the year ended 30 June 2017
| | | | | | | | | | | | |
| | | NOTE | | | 2017
$000 | | | 2016
$000 | |
| | | |
CAPITAL MARKETS OPERATIONS | | | | | | | | | | | | |
| | | |
Net income on financial instruments at fair value through profit or loss | | | | | | | | | | | | |
Gain on financial assets | | | 3 | | | | 574 993 | | | | 8 380 795 | |
Loss on financial liabilities | | | 3 | | | | (476 872 | ) | | | (8 341 333 | ) |
| | | | | | | 98 121 | | | | 39 462 | |
| | | |
Other income | | | | | | | | | | | | |
Fee income | | | | | | | 82 135 | | | | 79 603 | |
Lease income | | | | | | | 37 218 | | | | 46 272 | |
Amortisation of cross border lease deferred income | | | | | | | 29 298 | | | | 4 324 | |
| | | | | | | 148 651 | | | | 130 199 | |
| | | |
Expenses | | | | | | | | | | | | |
Administration expenses | | | 4 | | | | (73 575 | ) | | | (75 713 | ) |
Depreciation on leased assets | | | 13 | | | | (29 813 | ) | | | (37 754 | ) |
| | | | | | | (103 388 | ) | | | (113 467 | ) |
Profit from capital markets operations before income tax | | | | | | | 143 384 | | | | 56 194 | |
Income tax expense | | | 5 | | | | (14 200 | ) | | | (9 310 | ) |
Profit from capital markets operations after income tax | | | | | | | 129 184 | | | | 46 884 | |
| | | |
LONG TERM ASSETS | | | | | | | | | | | | |
| | | |
Net return from investments in long term assets | | | | | | | | | | | | |
Net change in fair value of unit trusts | | | | | | | 2 382 036 | | | | 1 441 186 | |
Interest on fixed rate notes | | | | | | | (2 065 828 | ) | | | (2 245 946 | ) |
Management fees | | | | | | | (91 617 | ) | | | (103 870 | ) |
Profit/(loss) from long term assets | | | | | | | 224 591 | | | | (908 630 | ) |
| | | | | | | | | | | | |
Total net profit/(loss) for the year after tax | | | | | | | 353 775 | | | | (861 746 | ) |
| | | | | | | | | | | | |
Total comprehensive income/(loss) attributable to the owner | | | | | | | 353 775 | | | | (861 746 | ) |
| | | | | | | | | | | | |
Total comprehensive income/(loss) derived from: | | | | | | | | | | | | |
Capital Markets Operations | | | | | | | 129 184 | | | | 46 884 | |
Long Term Assets | | | | | | | 224 591 | | | | (908 630 | ) |
| | | | | | | | | | | | |
Total comprehensive income/(loss) | | | | | | | 353 775 | | | | (861 746 | ) |
| | | | | | | | | | | | |
The notes on pages 22 to 44 are an integral part of these financial statements.
Note: Throughout these financial statements the Capital Markets Operations and the Long Term Assets operations have been disclosed separately to distinguish between QTC’s main central treasury management role and its additional responsibilities following the transfer of the State’s superannuation and other long term assets (refer note 1).
| | | | |
| | QUEENSLAND TREASURY CORPORATION | | ANNUAL |
| | | | REPORT 2016-17 |
Balance sheet
As at 30 June 2017
| | | | | | | | | | | | |
| | | NOTE | | | 2017
$000 | | | 2016
$000 | |
| | | |
ASSETS – CAPITAL MARKETS OPERATIONS | | | | | | | | | | | | |
Cash and cash equivalents | | | 6 | | | | 2 124 768 | | | | 1 141 617 | |
Receivables | | | | | | | 4 018 | | | | 11 326 | |
Financial assets at fair value through profit or loss | | | 7 | | | | 19 268 151 | | | | 16 516 449 | |
Derivative financial assets | | | 8 | | | | 337 559 | | | | 224 989 | |
Onlendings | | | 9 | | | | 85 101 958 | | | | 90 822 729 | |
Property, plant and equipment | | | 13 | | | | 96 584 | | | | 134 649 | |
Intangible assets | | | | | | | 19 189 | | | | 17 557 | |
Deferred tax asset | | | | | | | 2 710 | | | | 3 372 | |
| | | | | | | 106 954 937 | | | | 108 872 688 | |
| | | |
ASSETS – LONG TERM ASSETS | | | | | | | | | | | | |
Financial assets at fair value through profit or loss | | | 15 | | | | 31 714 458 | | | | 31 076 084 | |
| | | | | | | 31 714 458 | | | | 31 076 084 | |
| | | | | | | | | | | | |
Total Assets | | | | | | | 138 669 395 | | | | 139 948 772 | |
| | | |
LIABILITIES – CAPITAL MARKETS OPERATIONS | | | | | | | | | | | | |
Payables | | | | | | | 34 948 | | | | 33 448 | |
Derivative financial liabilities | | | 8 | | | | 175 192 | | | | 524 002 | |
Financial liabilities at fair value through profit or loss | | | | | | | | | | | | |
- Interest-bearing liabilities | | | 10 | (a) | | | 98 462 982 | | | | 100 679 305 | |
- Deposits | | | 10 | (b) | | | 7 428 891 | | | | 6 844 876 | |
Provision for dividend | | | 23 | | | | 500 000 | | | | 47 000 | |
Other liabilities | | | | | | | 13 322 | | | | 33 640 | |
| | | | | | | 106 615 335 | | | | 108 162 271 | |
| | | |
LIABILITIES – LONG TERM ASSETS | | | | | | | | | | | | |
Financial liabilities at amortised cost | | | | | | | 30 799 145 | | | | 30 385 361 | |
| | | | | | | 30 799 145 | | | | 30 385 361 | |
| | | | | | | | | | | | |
Total Liabilities | | | | | | | 137 414 480 | | | | 138 547 632 | |
| | | | | | | | | | | | |
| | | |
NET ASSETS | | | | | | | 1 254 915 | | | | 1 401 140 | |
| | | |
EQUITY – CAPITAL MARKETS OPERATIONS | | | | | | | | | | | | |
Retained surplus | | | | | | | 339 601 | | | | 710 417 | |
| | | | | | | 339 601 | | | | 710 417 | |
| | | |
EQUITY – LONG TERM ASSETS | | | | | | | | | | | | |
Retained surplus | | | | | | | 915 314 | | | | 690 723 | |
| | | | | | | 915 314 | | | | 690 723 | |
| | | | | | | | | | | | |
Total Equity | | | | | | | 1 254 915 | | | | 1 401 140 | |
| | | | | | | | | | | | |
The notes on pages 22 to 44 are an integral part of these financial statements.
| | | | |
| ANNUAL | | QUEENSLAND TREASURY CORPORATION | | |
| REPORT 2016-17 | | | | |
Statement of changes in equity
For the year ended 30 June 2017
| | | | | | | | | | | | | | | | |
| | | NOTE | | | CAPITAL
MARKETS
OPERATIONS | | | LONG TERM
ASSETS | | | | |
| | | | | | RETAINED
SURPLUS
$000 | | | RETAINED
SURPLUS
$000 | | | TOTAL
EQUITY
$000 | |
Balance at 1 July 2015 | | | | | | | 710 533 | | | | 1 599 353 | | | | 2 309 886 | |
Profit/(loss) for the year | | | | | | | 46 884 | | | | (908 630 | ) | | | (861 746 | ) |
Transactions with owners in their capacity as owners: | | | | | | | | | | | | | | | | |
Dividends provided for or paid | | | 23 | | | | (47 000 | ) | | | — | | | | (47 000 | ) |
Balance at 30 June 2016 | | | | | | | 710 417 | | | | 690 723 | | | | 1 401 140 | |
| | | | |
Balance at 1 July 2016 | | | | | | | 710 417 | | | | 690 723 | | | | 1 401 140 | |
Profit for the year | | | | | | | 129 184 | | | | 224 591 | | | | 353 775 | |
Transactions with owners in their capacity as owners: | | | | | | | | | | | | | | | | |
Repatriation dividend provided for or paid | | | 23 | | | | (500 000 | ) | | | — | | | | (500 000 | ) |
Balance at 30 June 2017 | | | | | | | 339 601 | | | | 915 314 | | | | 1 254 915 | |
The notes on pages 22 to 44 are an integral part of these financial statements.
| | | | |
| | QUEENSLAND TREASURY CORPORATION | | ANNUAL |
| | | | REPORT 2016-17 |
Statement of cash flows
For the year ended 30 June 2017
| | | | | | | | | | | | |
| | | NOTE | | | 2017
$000 | | | 2016
$000 | |
| | | |
CAPITAL MARKETS OPERATIONS | | | | | | | | | | | | |
| | | |
Cash flows from operating activities | | | | | | | | | | | | |
Interest received from onlendings | | | | | | | 4 000 692 | | | | 4 162 623 | |
Interest received from investments and other sources | | | | | | | 595 279 | | | | 571 729 | |
Fees received | | | | | | | 81 667 | | | | 69 306 | |
Net GST | | | | | | | 317 | | | | (4 352 | ) |
Interest paid on interest-bearing liabilities | | | | | | | (4 609 029 | ) | | | (5 124 544 | ) |
Interest paid on deposits | | | | | | | (183 508 | ) | | | (216 203 | ) |
Administration expenses paid | | | | | | | (67 596 | ) | | | (70 121 | ) |
Income tax paid | | | | | | | (9 654 | ) | | | (9 678 | ) |
Net cash used in operating activities | | | 14 | | | | (191 832 | ) | | | (621 240 | ) |
| | | |
Cash flows from investing activities | | | | | | | | | | | | |
Proceeds from sale of investments | | | | | | | 30 801 805 | | | | 35 637 771 | |
Payments for investments | | | | | | | (33 662 640 | ) | | | (33 750 857 | ) |
Net onlendings | | | | | | | 1 868 187 | | | | 2 864 368 | |
Payments for intangibles | | | | | | | (3 390 | ) | | | (15 501 | ) |
Proceeds from sale of property, plant and equipment | | | | | | | 10 471 | | | | 6 756 | |
Payments for property, plant and equipment | | | | | | | (3 905 | ) | | | — | |
Net cash (used in)/provided by investing activities | | | | | | | (989 472 | ) | | | 4 742 537 | |
| | | |
Cash flows from financing activities | | | | | | | | | | | | |
Proceeds from interest-bearing liabilities | | | | | | | 50 575 339 | | | | 40 140 535 | |
Repayment of interest-bearing liabilities | | | | | | | (48 937 845 | ) | | | (44 316 271 | ) |
Net deposits | | | | | | | 573 961 | | | | (879 586 | ) |
Dividends paid | | | | | | | (47 000 | ) | | | (41 000 | ) |
Net cash provided/(used in) financing activities | | | | | | | 2 164 455 | | | | (5 096 322 | ) |
| | | |
Net increase/(decrease) cash and cash equivalents held | | | | | | | 983 151 | | | | (975 025 | ) |
Cash and cash equivalents at 1 July | | | | | | | 1 141 617 | | | | 2 116 642 | |
Cash and cash equivalents at 30 June | | | 6 | | | | 2 124 768 | | | | 1 141 617 | |
| | | |
LONG TERM ASSETS | | | | | | | | | | | | |
No external cash flow is generated from the long term assets (refer note 1). | | | | | | | | | | | | |
The notes on pages 22 to 44 are an integral part of these financial statements.
| | | | |
| ANNUAL | | QUEENSLAND TREASURY CORPORATION | | |
| REPORT 2016-17 | | | | |
Notes to the Financial Statements
For the year ended 30 June 2017
Contents
| | | | | | |
| 1 | | General information | | | 22 | |
| | |
| 2 | | Significant accounting policies and other explanatory information | | | 22 | |
| |
Capital Markets Operations | | | | |
| | |
| 3 | | Net income on financial instruments at fair value through profit or loss | | | 24 | |
| | |
| 4 | | Administration expenses | | | 24 | |
| | |
| 5 | | Income tax expense | | | 25 | |
| | |
| 6 | | Cash and cash equivalents | | | 25 | |
| | |
| 7 | | Financial assets at fair value through profit or loss | | | 26 | |
| | |
| 8 | | Derivative financial assets and derivative financial liabilities | | | 26 | |
| | |
| 9 | | Onlendings | | | 27 | |
| | |
| 10 | | Financial liabilities at fair value through profit or loss | | | 27 | |
| | |
| 11 | | Financial risk management | | | 30 | |
| | |
| 12 | | Fair value hierarchy | | | 36 | |
| | |
| 13 | | Property, plant and equipment | | | 37 | |
| | |
| 14 | | Notes to the statement of cash flows | | | 38 | |
| |
Long Term Assets | | | | |
| | |
| 15 | | Financial assets at fair value through profit or loss | | | 39 | |
| | |
| 16 | | Financial risk management | | | 40 | |
| | |
| 17 | | Fair value hierarchy | | | 40 | |
| |
Other information | | | | |
| | |
| 18 | | Contingent liabilities | | | 41 | |
| | |
| 19 | | Related party transactions | | | 41 | |
| | |
| 20 | | Key management personnel | | | 41 | |
| | |
| 21 | | Auditor’s remuneration | | | 43 | |
| | |
| 22 | | Investments in companies | | | 44 | |
| | |
| 23 | | Dividends | | | 44 | |
| | |
| 24 | | Events subsequent to balance date | | | 44 | |
Queensland Treasury Corporation (QTC) is constituted under the Queensland Treasury Corporation Act 1988 (the Act), with the Under Treasurer designated as the Corporation Sole under section 5 (2) of the Act. QTC is domiciled in Queensland, Australia, with its principal place of business being 111 Eagle Street, Brisbane, Queensland. QTC’s ultimate parent is the State of Queensland.
QTC is the Queensland Government’s central financing authority. QTC also provides a range of financial services to the State and its public sector entities, including local governments. These services include debt funding and management, cash management facilities, financial risk management advisory services, and specialist public finance education.
These services, which form part of QTC’s Capital Markets Operations segment, are undertaken on a cost-recovery basis with QTC lending at an interest rate based on its cost of funds and with the benefits/costs of liability and asset management being passed on to its clients being Queensland public sector entities. QTC’s Capital Markets Operations can generate a profit largely reflecting the interest earned from investments held for capital and liquidity purposes. In undertaking its Capital Markets activities, QTC maintains adequate capital to manage its risks.
QTC holds a portfolio of assets which were transferred to QTC by the State Government. These assets are the investments of QTC’s Long Term Assets segment and are held to fund superannuation and other long-term obligations of the State. In return, QTC has issued to the State fixed rate notes with an interest rate of 7.0 per cent which is the expected long term average rate of return on the portfolio. This has resulted in the State receiving a fixed rate of return on the notes, while QTC absorbs the impact of fluctuations in the value and returns on the asset portfolio.
The Long Term Asset Advisory Board (LTAAB) is responsible for the oversight of the Long Term Assets which do not form part of QTC’s day-to-day Capital Markets Operations. The Long Term Assets are held in unit trusts managed by QIC Limited (QIC).
The principal accounting policies adopted in the preparation of the financial report are set out below and in the relevant notes to the financial statements.
| 2 | Significant accounting policies and other explanatory information |
These general purpose financial statements for the year ended 30 June 2017 have been prepared in accordance with Australian Accounting Standards (AASBs) and interpretations adopted by the Australian Accounting Standards Board, the requirements of the Financial Accountability Act 2009, the Financial and Performance Management Standard 2009, and the Financial reporting requirements for Queensland Government Agencies (as applicable to statutory bodies).
Compliance with International Financial Reporting Standards
QTC’s financial statements comply with International Financial Reporting Standards (IFRS) as issued by the International Accounting Standards Board. While QTC is designated as a not-for-profit entity, the Corporation has elected to comply with the requirements of IFRS as if it is a for-profit entity. Reporting as a for-profit entity does materially change the financial statements of the Corporation.
Changes in accounting policy, disclosures, standards and interpretations
The accounting policies adopted are consistent with those of the previous financial year.
New accounting standards: All new and amended accounting standards effective for the financial year were adopted. While these new and amended standards may have resulted in disclosure changes, there has been no change to the amounts recognised in these statements.
Standards and interpretations not yet adopted: Certain new accounting standards have been issued that are not mandatory for the current reporting period. The Corporation’s assessment of the impact of material changes from these standards and interpretations are set out below.
Effective for annual reporting periods beginning on or after 1 January 2017:
| • | | AASB 2016-2: Amendments to Australian Accounting Standards – Disclosure Initiative: Amendments to AASB 107 will introduce additional disclosures to include a breakdown of movements in borrowing showing cash flows, such as drawdowns and repayment of borrowings, and non-cash changes, such as acquisitions, disposals and unrealised exchange differences. |
Effective for annual periods beginning on or after 1 January 2018:
| • | | AASB 9 Financial Instruments will replace AASB 139 Financial Instruments: Recognition and measurement. The new standard specifies new classification and measurement requirements for financial assets and financial liabilities within the scope of AASB 139. The amendments require financial assets to be measured at fair value through profit or loss unless they meet the criteria for amortised cost measurement. For financial liabilities, AASB 9 has largely adopted the classification and measurement criteria currently contained in AASB 139. Under the revised standard, any change in fair value attributable to an entity’s own credit risk is to be shown in other comprehensive income, not as part of profit or loss. An exemption applies to entities which have offsetting risk profiles which allows QTC to measure both financial assets and financial liabilities at fair value through profit or loss. Therefore the new standard is not expected to change the current practice of measuring changes in fair value movements of financial instruments through profit or loss. |
| • | | AASB 15 Revenue from contracts with customers will replace AASB 118 Revenue. The new standard is based on the principle that revenue is recognised when control of a good or service transfers to a customer with the control model replacing one of risk and rewards. This is not expected to impact QTC’s recognition of revenue which primarily relates to earnings on financial instruments and fees charged on the outstanding balance of debt and investment products. |
| | | | |
| | QUEENSLAND TREASURY CORPORATION | | ANNUAL |
| | | | REPORT 2016-17 |
Effective for annual periods beginning on or after 1 January 2019:
| • | | AASB 16 Leases will change the accounting by lessees and result in the recognition of almost all leases on the balance sheet. The standard requires the recognition of a right to use asset and the liability for the present value of future lease commitments. This standard removes the current distinction between operating and financing leases. This standard will result in a lease for QTC’s principal office and associated obligations being recognised on balance sheet. |
Other than as noted above, the adoption of various Australian Accounting Standards and Interpretations on issue but not yet effective is not expected to have a material impact on the financial statements of the Corporation. However, the pronouncements may result in minor changes to how information is currently disclosed.
Basis of measurement
The financial statements are prepared on the basis of fair value measurement of assets and liabilities except where otherwise stated. Fair value is the amount for which an asset could be exchanged or liability settled between knowledgeable, willing parties in an arm’s length transaction.
Functional and presentation currency: These financial statements are presented in Australian dollars which is QTC’s functional currency.
Classification of assets and liabilities: The balance sheet is presented on a liquidity basis. Assets and liabilities are presented in decreasing order of liquidity and are not distinguished between current and non-current.
Foreign currency transactions are initially translated into Australian dollars at the rate of exchange applying at the date of the transaction. At balance date, amounts payable to and by QTC in foreign currencies have been valued using current exchange rates after taking into account interest rates and accrued interest.
Exchange gains/losses are brought to account in the statement of comprehensive income.
QTC enters into a range of transactions with counterparties which require the lodgement of collateral subject to agreed market thresholds. Where these thresholds are exceeded, QTC may be required to either pledge assets to, or be entitled to receive pledged assets from, the counterparty to secure these transactions. The assets pledged or received are primarily in the form of cash.
| (d) | Offsetting financial instruments |
QTC offsets financial assets and liabilities where there is a legally enforceable right to set-off, and there is an intention to settle on a net basis or to realise the asset and settle the liability simultaneously (refer note 11 (c) (iv)).
Securities sold under agreements to repurchase at an agreed price are retained within the financial assets at fair value through profit or loss category while the obligation to repurchase is disclosed as a deposit.
Lease income from operating leases where QTC is the lessor is recognised as income on a straight line basis over the lease term.
| (g) | Cross border leases - income recognition |
Income received on cross border leases is deferred and amortised over the term of the lease or when the obligations under the lease is expired. During the financial year, QTC terminated all remaining cross border leases and recognised any remaining deferred revenue.
Fee income includes:
| • | | Management fee income which represents income earned from the management of QTC’s onlendings and deposits recognised on an accrual basis when the service has been provided; and |
| • | | Professional fees are recognised to the extent that it is probable that the economic benefits will flow to QTC and can be measured reliably. |
| • | | Revenue on financial guarantees are recognised at inception and on an ongoing basis over the contract term. As the probability of default is extremely low due to counter indemnities the revenue receivable is reflective of fair value. |
Unless otherwise determined by the Governor in Council, the Queensland Treasury Corporation Act 1988 requires that all profits shall accrue to the benefit of the State Consolidated Fund and all losses shall be the responsibility of the State Consolidated Fund. Dividends are provided for following approval by the Board after considering QTC’s capital requirements.
Acquired computer software licences and development costs are capitalised on the basis of the costs incurred to acquire and bring to use the specific software. These assets are amortised on a straight-line basis over the period of expected benefit, which is usually between three and ten years.
The carrying value of non-financial assets is reviewed at each reporting date or where there is an indication of impairment. If an indication of impairment exists, the assets recoverable amount is determined. Any amount by which the asset’s carrying amount exceeds the recoverable amount is recorded as an impairment loss. The asset’s recoverable amount is determined as the higher of the asset’s fair value less cost of disposal or value in use.
A liability is recognised for benefits accruing to employees in respect of salaries, annual leave, long service leave and short-term incentives based on the amount expected to be paid where there is a present or constructive obligation to pay this amount as a result of past service and the obligation is capable of being measured reliably. These are measured on an undiscounted basis where the amounts are expected to be paid within the next 12 months. For amounts where the payment date is expected to exceed 12 months such as long service leave, future pay increases are projected and then discounted using a high quality bond rate. As sick leave is non-vesting, this is recognised as and when this leave is taken.
Amounts have been rounded to the nearest thousand dollars except for notes 20 and 21, which are in whole dollars and note 11(a)(ii) which is rounded to the nearest million dollars.
Comparative figures for fee income have been revised to include fees on investment products which were previously reported as interest. No other material adjustments have been made to prior year comparatives.
| (o) | Judgements and assumptions |
The preparation of the financial statements requires the use of accounting estimates. Estimates and underlying assumptions are reviewed on an ongoing basis. Revisions to accounting estimates are recognised in the period in which the estimate is revised and in any future period affected. The areas involving a higher degree of judgement or complexity, or areas where assumptions or estimates may be significant to the financial statements are shown below:
Fair value of financial assets and financial liabilities
Financial assets and financial liabilities (including derivatives) are measured at fair value by reference to quoted market prices where available. The fair value of financial instruments that are not traded in an active market is determined by reference to market quotes for similar instruments or by use of valuation techniques. Valuation techniques may include applying trading margins to the swap curve or counterparty credit spreads for similar instruments adjusted for changes in the credit worthiness of the counterparty. A margin may be applied based on the original purchase margin where an instrument is not actively traded. Judgement may be needed in selecting valuation methods or assumptions where an active market quote is not available.
Investments in Queensland Treasury Holdings Pty Ltd (QTH)
Queensland Treasury holds a 60 per cent beneficial interest in QTH and 76 per cent of the voting rights. The remaining 40 per cent beneficial interest and 24 per cent voting rights is held by QTC. QTC does not apply the equity method to its investment in QTH as it does not have control or significant influence over the entity, exposure or rights to variable returns or the power to affect those returns. Queensland Treasury controls the significant transactions and bears all the risks and benefits of QTH and accordingly, QTH is consolidated into the financial statements of Queensland Treasury.
| | | | |
| ANNUAL | | QUEENSLAND TREASURY CORPORATION | | |
| REPORT 2016-17 | | | | |
Notes to the Financial Statements
Capital Markets Operations
For the year ended 30 June 2017
| 3 | Net income on financial instruments at fair value through profit or loss |
Accounting Policy
Gain/(loss) on financial assets and financial liabilities at fair value through profit or loss includes:
| • | | interest income and interest expense |
| • | | net realised gain/(loss) from the sale of investments and the pre-redemption of borrowings |
| • | | net unrealised gain/(loss) arising from holding investments and certain onlendings, and |
| • | | net unrealised gain/(loss) from borrowings. |
These realised and unrealised gains and losses are a result of market rate movements. The majority of onlendings are provided to clients on a portfolio basis with interest costs allocated to clients based on the daily movement in the market value of the portfolio.
| | | | | | | | |
| | | 2017
$000 | | | 2016
$000 | |
| | |
Gain on financial assets at fair value through profit or loss | | | | | | | | |
Cash and cash equivalents | | | 8 126 | | | | 5 272 | |
Financial assets at fair value through profit or loss | | | 368 118 | | | | 565 334 | |
Derivatives | | | 62 528 | | | | 6 347 | |
Onlendings | | | 136 221 | | | | 7 803 842 | |
| | | | | | | | |
| | | 574 993 | | | | 8 380 795 | |
| | | | | | | | |
| |
(Loss)/gain on financial liabilities at fair value through profit or loss | | | | | |
Financial liabilities at fair value through profit or loss | | | | | |
- Short-term | | | (131 868 | ) | | | (114 193 | ) |
- Long-term | | | (422 179 | ) | | | (6 645 451 | ) |
Deposits | | | (193 499 | ) | | | (226 333 | ) |
Derivatives | | | 290 767 | | | | (1 330 029 | ) |
Other | | | (20 093 | ) | | | (25 327 | ) |
| | | | | | | | |
| | | (476 872 | ) | | | (8 341 333 | ) |
| | | | | | | | |
During the year ended 30 June 2017, long term yields rose leading to a decline in the market value of financial assets and onlendings, and a decrease in the market value of financial liabilities. The market value change offset the majority of the interest income generated from financial assets and the interest expense on financial liabilities.
| | | | | | | | |
| | | 2017
$000 | | | 2016
$000 | |
Salaries and related costs | | | 35 933 | | | | 35 744 | |
Superannuation contributions | | | 3 463 | | | | 3 779 | |
Other employee benefits (1) | | | 1 104 | | | | 4 678 | |
Contractors | | | 4 488 | | | | 11 677 | |
Consultants’ fees | | | 3 128 | | | | 2 765 | |
Information and registry services | | | 2 475 | | | | 2 630 | |
Depreciation on property, plant and equipment | | | 1 649 | | | | 1 636 | |
Amortisation and impairment on intangible assets | | | 1 757 | | | | 708 | |
Office occupancy | | | 6 045 | | | | 4 237 | |
Information and communication technology | | | 7 953 | | | | 3 628 | |
Other administration expenses | | | 5 580 | | | | 4 231 | |
| | | | | | | | |
| | | 73 575 | | | | 75 713 | |
| | | | | | | | |
| (1) | Relates to redundancy costs following a corporate restructure |
| | | | |
| | QUEENSLAND TREASURY CORPORATION | | ANNUAL |
| | | | REPORT 2016-17 |
Notes to the Financial Statements
Capital Markets Operations
For the year ended 30 June 2017
Accounting Policy
QTC is exempt from the payment of income tax under section 50-25 of the Income Tax Assessment Act 1997 (as amended). QTC makes a payment in lieu of income tax to the Queensland Government’s Consolidated Fund. The calculation of the income tax liability is based on the income of certain activities controlled by QTC’s Capital Markets Operations. No income tax is payable on the Long Term Assets segment.
| | | | | | | | |
| | | 2017
$000 | | | 2016
$000 | |
Current tax | | | 13 538 | | | | 9 654 | |
Deferred tax expense/(income) | | | 662 | | | | (344 | ) |
Total income tax expense recognised in the year | | | 14 200 | | | | 9 310 | |
Deferred income tax included in income tax expense comprises: | | | | | | | | |
Decrease/(increase) in deferred tax assets | | | 662 | | | | (344 | ) |
| | | | | | | | |
| | | 662 | | | | (344 | ) |
| | | | | | | | |
| | |
Numerical reconciliation between income tax expense and pre-tax accounting profit | | | | | | | | |
Profit/(loss) for the year before tax | | | 367 975 | | | | (852 436 | ) |
Less profits/(losses) from non-taxable portfolios: | | | | | | | | |
Capital Markets Operations | | | 96 095 | | | | 25 173 | |
Long Term Assets | | | 224 591 | | | | (908 630 | ) |
Operating profit from taxable portfolios | | | 47 289 | | | | 31 021 | |
Tax at the Australian tax rate of 30% on taxable portfolios | | | 14 187 | | | | 9 306 | |
Effect of non-deductible items: | | | 13 | | | | 4 | |
| | | | | | | | |
Income tax expense | | | 14 200 | | | | 9 310 | |
| | | | | | | | |
| 6 | Cash and cash equivalents |
Accounting Policy
Cash and cash equivalents include cash on hand and demand deposits (11am cash) which are highly liquid investments that are readily convertible to cash.
| | | | | | | | |
| | | 2017 | | | 2016 | |
| | | $000 | | | $000 | |
Cash at bank (1) | | | 989 588 | | | | 44 | |
Money market deposits | | | 1 135 180 | | | | 1 141 573 | |
| | | | | | | | |
| | | 2 124 768 | | | | 1 141 617 | |
| | | | | | | | |
| (1) | Additional cash was placed in the bank account over year end which relates to a client redraw facility that was withdrawn in early July (refer note 9). |
| | | | |
| ANNUAL | | QUEENSLAND TREASURY CORPORATION | | |
| REPORT 2016-17 | | | | |
Notes to the Financial Statements
Capital Markets Operations
For the year ended 30 June 2017
| 7 | Financial assets at fair value through profit or loss |
Accounting Policy
Financial assets on initial recognition are classified into the following categories:
| • | | Cash and cash equivalents |
| • | | Financial assets at fair value through profit or loss |
| • | | Derivative financial instruments, and |
Financial assets are recognised in the balance sheet when QTC becomes party to the contractual provisions of the financial instrument which is the settlement date of the transaction. A financial asset is derecognised when the contractual rights to the cash flows from the financial assets expire or are transferred and no longer controlled by QTC. Gains and losses on financial assets are brought to account in the statement of comprehensive income.
Financial assets at fair value through profit or loss are measured at fair value by reference to quoted market exit prices when available. If quoted market prices are not available, then fair values are estimated on the basis of pricing models or other recognised valuation techniques with consideration for the effect of counterparty credit risk.
| | | | | | | | |
| | | 2017 | | | 2016 | |
| | | $000 | | | $000 | |
Discount securities | | | 3 567 666 | | | | 2 780 561 | |
Commonwealth and state securities (1) | | | 1 515 773 | | | | 1 670 165 | |
Floating rate notes | | | 7 639 279 | | | | 7 316 680 | |
Term deposits | | | 5 232 255 | | | | 2 898 592 | |
Other investments | | | 1 313 178 | | | | 1 850 451 | |
| | | | | | | | |
| | | 19 268 151 | | | | 16 516 449 | |
| | | | | | | | |
| (1) | QTC maintains holdings of its own stocks. These holdings are netted off and therefore excluded from financial assets and financial liabilities at fair value through profit or loss. |
As at 30 June 2017, $7,590.8 million (2016 $7,927.7 million) of financial assets will mature after 12 months.
| 8 | Derivative financial assets and derivative financial liabilities |
Accounting Policy
All derivatives are measured at fair value through profit or loss with gains and losses recognised in the income statement. Derivatives are carried on the balance sheet as assets when the fair value is positive and as liabilities when the fair value is negative.
QTC uses derivative financial instruments to hedge its exposure to interest rate, foreign currency and credit risks as part of asset and liability management activities. In addition they may be used to deliver long term floating rate or long term fixed rate exposure.
| | | | | | | | |
| | | 2017 | | | 2016 | |
| | | $000 | | | $000 | |
| | |
Derivative financial assets | | | | | | | | |
Interest rate swaps | | | 62 511 | | | | 2 355 | |
Cross currency swaps | | | 176 238 | | | | 220 550 | |
Foreign exchange contracts | | | 39 | | | | 2 084 | |
Futures contracts | | | 98 771 | | | | — | |
| | | | | | | | |
| | | 337 559 | | | | 224 989 | |
| | | | | | | | |
| | |
Derivative financial liabilities | | | | | | | | |
Interest rate swaps | | | (8 317 | ) | | | (404 569 | ) |
Cross currency swaps | | | (101 649 | ) | | | (87 291 | ) |
Foreign exchange contracts | | | (9 677 | ) | | | (21 987 | ) |
Futures contracts | | | (55 549 | ) | | | (10 155 | ) |
| | | (175 192 | ) | | | (524 002 | ) |
| | | | | | | | |
Net derivatives | | | 162 367 | | | | (299 013 | ) |
| | | | | | | | |
As at 30 June 2017, $11.2 million (2016 -$235.2 million) of these derivatives have maturity dates exceeding 12 months.
| | | | |
| | QUEENSLAND TREASURY CORPORATION | | ANNUAL |
| | | | REPORT 2016-17 |
Notes to the Financial Statements
Capital Markets Operations
For the year ended 30 June 2017
Accounting Policy
QTC borrows on behalf of its clients lending at an interest rate based on its cost of funds with the benefits/costs of liability management being passed onto clients.
Onlendings are initially recognised at the amount drawn-down. Subsequent to initial recognition, onlendings are included in the balance sheet at fair value by reference to either the underlying debt portfolio, or in the case of fixed rate loans on a discounted cash flow basis.
| | | | | | | | |
| | | 2017 | | | 2016 | |
| | | $000 | | | $000 | |
Government departments and agencies | | | 33 829 520 | | | | 38 551 867 | |
Government owned corporations | | | 26 400 250 | | | | 26 917 485 | |
Statutory bodies | | | 17 996 287 | | | | 18 377 620 | |
Local governments | | | 6 449 433 | | | | 6 507 397 | |
QTC related entities | | | 130 385 | | | | 139 277 | |
Other bodies | | | 296 083 | | | | 329 083 | |
| | | | | | | | |
| | | 85 101 958 | | | | 90 822 729 | |
| | | | | | | | |
At 30 June 2017, client deposits of $3.9 billion have been placed in redraw facilities and offset in the balance sheet (2016 $6.6 billion). The gross value of onlendings at 30 June 2017 was $89.0 billion (2016 $97.4 billion). The redraw was subsequently reduced by $1.0 billion in early July.
As at 30 June 2017, $84,162.3 million (2016 $89,772.7 million) of repayments are expected to be received after 12 months.
| 10 | Financial liabilities at fair value through profit or loss |
Accounting Policy
Financial liabilities are measured at fair value through profit or loss and include interest-bearing liabilities and deposits.
Financial liabilities at fair value through profit or loss are measured at fair value by reference to quoted market exit prices when available. If quoted market prices are not available, then fair values are estimated on the basis of pricing models or other recognised valuation techniques. QTC uses mid-market rates as the basis for establishing fair values of quoted financial instruments with offsetting risk positions. In general, the risk characteristics of funds borrowed, together with the financial derivatives used to manage interest rate and foreign currency risks, closely match those of funds onlent. In all other cases, the bid-offer spread is applied where material.
Gains and losses on financial liabilities at fair value through profit or loss are brought to account in the statement of comprehensive income.
Financial liabilities are recognised in the balance sheet when QTC becomes party to the contractual provisions of the financial instrument which is the settlement date of the transaction. A financial liability is derecognised when the obligation specified in the contract is discharged, cancelled or expires.
Interest-bearing liabilities
Interest-bearing liabilities mainly consist of short-term treasury notes, Australian and overseas bonds and floating rate notes. Australian bonds include QTC’s domestic, capital indexed and public bonds. Overseas bonds include global bonds and eurobonds. Global bonds are Australian dollar denominated bonds issued overseas.
Deposits
Client deposits are accepted to either the QTC Cash Fund or Working Capital Facility (11AM Fund). Income derived from the investment of these deposits accrues to depositors daily. The amount shown in the balance sheet represents the market value of deposits held at balance date.
Collateral held and securities which are sold under agreements to repurchase are disclosed as deposits.
| (a) | Interest-bearing liabilities |
| | | | | | | | |
| | | 2017 | | | 2016 | |
| | | $000 | | | $000 | |
| | |
Interest-bearing liabilities | | | | | | | | |
Short-term | | | | | | | | |
Treasury notes | | | 4 471 325 | | | | 5 038 469 | |
Commercial paper | | | 921 564 | | | | 798 894 | |
| | | 5 392 889 | | | | 5 837 363 | |
Long-term | | | | | | | | |
AUD Bonds | | | 88 313 286 | | | | 86 386 213 | |
Floating rate notes | | | 2 505 946 | | | | 6 668 985 | |
Global AUD Bonds (1) | | | 186 138 | | | | 197 819 | |
Medium-term notes | | | 1 730 599 | | | | 1 295 393 | |
Other | | | 334 124 | | | | 293 532 | |
| | | 93 070 093 | | | | 94 841 942 | |
| | | | | | | | |
Total interest-bearing liabilities | | | 98 462 982 | | | | 100 679 305 | |
| | | | | | | | |
| (1) | Consists of AUD denominated bonds which are borrowed in the United States and Euro markets. |
| | | | |
| ANNUAL | | QUEENSLAND TREASURY CORPORATION | | |
| REPORT 2016-17 | | | | |
Notes to the Financial Statements
Capital Markets Operations
For the year ended 30 June 2017
| 10 | Financial liabilities at fair value through profit or loss continued |
| (a) | Interest-bearing liabilities continued |
QTC borrowings are guaranteed by the Queensland Government under the Queensland Treasury Corporation Act 1988. As at 30 June 2017, $83,556.6 million (2016 $84,259.5 million) of debt securities are expected to be settled after more than 12 months.
Instruments denominated in foreign currency are fully hedged resulting in no net exposure to any foreign currency. Details of QTC’s exposure to foreign currencies and the derivatives used to hedge this exposure are disclosed in note 11(a) (i).
The difference between the carrying amount of financial liabilities and the amount contractually required to be paid at maturity to the holder of the obligation is set out in the following table:
| | | | | | | | | | | | |
| | | FAIR VALUE | | | REPAYMENT
AT MATURITY | | | DIFFERENCE | |
AS AT 30 JUNE 2017 | | $000 | | | $000 | | | $000 | |
| | | |
Interest-bearing liabilities | | | | | | | | | | | | |
Short-term | | | | | | | | | | | | |
Treasury notes | | | 4 471 325 | | | | 4 485 000 | | | | (13 675 | ) |
Commercial paper | | | 921 564 | | | | 923 315 | | | | (1 751 | ) |
| | | 5 392 889 | | | | 5 408 315 | | | | (15 426 | ) |
Long-term | | | | | | | | | | | | |
AUD Bonds | | | 88 313 286 | | | | 79 079 879 | | | | 9 233 407 | |
Floating rate notes | | | 2 505 946 | | | | 2 500 000 | | | | 5 946 | |
Global AUD Bonds | | | 186 138 | | | | 181 276 | | | | 4 862 | |
Medium-term notes | | | 1 730 599 | | | | 1 659 197 | | | | 71 402 | |
Other | | | 334 124 | | | | 331 629 | | | | 2 495 | |
| | | 93 070 093 | | | | 83 751 981 | | | | 9 318 112 | |
| | | | | | | | | | | | |
Total interest-bearing liabilities | | | 98 462 982 | | | | 89 160 296 | | | | 9 302 686 | |
| | | | | | | | | | | | |
| | | |
| | | FAIR VALUE | | | REPAYMENT AT MATURITY | | | DIFFERENCE | |
AS AT 30 JUNE 2016 | | $000 | | | $000 | | | $000 | |
| | | |
Interest-bearing liabilities | | | | | | | | | | | | |
Short-term | | | | | | | | | | | | |
Treasury notes | | | 5 038 469 | | | | 5 056 000 | | | | (17 531 | ) |
Commercial paper | | | 798 894 | | | | 799 529 | | | | (635 | ) |
| | | 5 837 363 | | | | 5 855 529 | | | | (18 166 | ) |
Long-term | | | | | | | | | | | | |
AUD Bonds | | | 86 386 213 | | | | 74 020 849 | | | | 12 365 364 | |
Floating rate notes | | | 6 668 985 | | | | 6 655 400 | | | | 13 585 | |
Global AUD Bonds | | | 197 819 | | | | 185 032 | | | | 12 787 | |
Medium-term notes | | | 1 295 393 | | | | 1 087 524 | | | | 207 869 | |
Other | | | 293 532 | | | | 286 718 | | | | 6 814 | |
| | | 94 841 942 | | | | 82 235 523 | | | | 12 606 419 | |
| | | | | | | | | | | | |
Total interest-bearing liabilities | | | 100 679 305 | | | | 88 091 052 | | | | 12 588 253 | |
| | | | | | | | | | | | |
| | | | |
| | QUEENSLAND TREASURY CORPORATION | | ANNUAL |
| | | | REPORT 2016-17 |
Notes to the Financial Statements
Capital Markets Operations
For the year ended 30 June 2017
| 10 | Financial liabilities at fair value through profit or loss continued |
| | | | | | | | |
| | | 2017 | | | 2016 | |
| | | $000 | | | $000 | |
| | |
Client deposits | | | | | | | | |
Local governments | | | 3 049 454 | | | | 2 459 583 | |
Statutory bodies | | | 2 773 869 | | | | 2 481 297 | |
Government-owned Corporations | | | 920 111 | | | | 800 771 | |
Government departments and agencies | | | 44 349 | | | | 46 624 | |
QTC related entities | | | 77 329 | | | | 59 376 | |
Other depositors | | | 172 443 | | | | 175 675 | |
| | | 7 037 555 | | | | 6 023 326 | |
Collateral held | | | 75 290 | | | | 29 742 | |
Repurchase agreements | | | 316 046 | | | | 791 808 | |
| | | 391 336 | | | | 821 550 | |
| | | | | | | | |
Total deposits | | | 7 428 891 | | | | 6 844 876 | |
| | | | | | | | |
As at 30 June 2017, $6,977.2 million (2016 $6,844.9 million) will mature within 12 months.
| | | | |
| ANNUAL | | QUEENSLAND TREASURY CORPORATION | | |
| REPORT 2016-17 | | | | |
Notes to the Financial Statements
Capital Markets Operations
For the year ended 30 June 2017
| 11 | Financial risk management |
QTC’s activities expose it to a variety of financial risks including market risk (foreign exchange, interest rate, basis spreads, and credit spreads), liquidity risk, and credit risk. QTC’s financial risk management focuses on minimising financial risk exposures and managing volatility, and seeks to mitigate potential adverse effects of financial risks on the financial performance of QTC and its clients. To assist in managing financial risk, QTC uses derivative financial instruments such as foreign exchange contracts, interest rate swaps and futures contracts.
Robust systems are in place for managing financial risk and compliance. Adherence to financial risk policies are monitored daily. To ensure independence, measurement and monitoring of financial risks are performed by teams separate to those transacting.
All financial risk management activities are conducted within Board approved policies, as set out in the Financial Markets Risk Policy with new financial instruments approved by the QTC Board. All breaches of the Financial Markets Risk Policy are escalated to management, the Chief Executive, Funding and Markets Committee and presented at the next board meeting.
QTC ensures that in undertaking its capital markets activities it has adequate capital to manage its risks. Capital requirements are calculated for credit risk, market risk and operational risk with stress testing applied. Capital requirements are then applied against QTC’s capital held with reports presented to the Board.
QTC is exposed to market risk in the form of interest rate risk and foreign exchange risk with price risk not having a significant impact.
QTC’s exposure to market risk is through its borrowing and investment activities, including borrowing in advance of requirements to ensure Queensland public sector entities have ready access to funding when required and also to reduce the risk associated with refinancing maturing loans.
As a consequence of market changes, there are residual risk positions which may result in realised and unrealised accounting gains or losses being recorded during the year. Depending on whether these transactions are held to maturity, the unrealised gains or losses may be reversed in subsequent accounting periods.
QTC’s investments on behalf of its clients are held in the QTC Cash Fund. Movement in credit spreads will impact on the value of the assets held in the Cash Fund resulting in unrealised mark-to-market accounting gains or losses. QTC generally holds these assets to maturity and therefore any mark-to-market impacts from credit margin changes are typically reversed over the life of the assets. QTC does not pass these unrealised credit spread adjustments onto client, either positive or negative, in the returns to Cash Fund participants.
QTC has funding facilities that allow for borrowing in foreign currencies. At times, QTC’s Cash Fund invests in foreign currency assets. QTC enters into both forward exchange contracts and cross currency swaps to hedge the exposure of foreign currency borrowings and offshore investments from fluctuations in exchange rates.
The following table summarises the hedging effect that cross currency swaps and forward exchange contracts have had on face value offshore borrowings and investments stated in Australian dollars:
| | | | | | | | | | | | | | | | | | | | | | | | | | | | | | | | |
| | | BORROWINGS | | | OFFSHORE INVESTMENTS | | | DERIVATIVE CONTRACTS | | | NET EXPOSURE | |
| | | 2017 | | | 2016 | | | 2017 | | | 2016 | | | 2017 | | | 2016 | | | 2017 | | | 2016 | |
| | | $000 | | | $000 | | | $000 | | | $000 | | | $000 | | | $000 | | | $000 | | | $000 | |
USD | | | (820 348 | ) | | | (765 557 | ) | | | 729 101 | | | | 517 996 | | | | 91 247 | | | | 247 561 | | | | — | | | | — | |
NZD | | | (841 851 | ) | | | (739 808 | ) | | | — | | | | — | | | | 841 851 | | | | 739 808 | | | | — | | | | — | |
GBP | | | — | | | | — | | | | 29 812 | | | | 31 829 | | | | (29 812 | ) | | | (31 829 | ) | | | — | | | | — | |
YEN | | | (174 549 | ) | | | (196 673 | ) | | | — | | | | — | | | | 174 549 | | | | 196 673 | | | | — | | | | — | |
CHF | | | (149 528 | ) | | | (151 042 | ) | | | — | | | | — | | | | 149 528 | | | | 151 042 | | | | — | | | | — | |
SGD | | | — | | | | (9 972 | ) | | | — | | | | — | | | | — | | | | 9 972 | | | | — | | | | — | |
EUR | | | (596 235 | ) | | | — | | | | 52 040 | | | | 505 962 | | | | 544 195 | | | | (505 962 | ) | | | — | | | | — | |
| | | | |
| | QUEENSLAND TREASURY CORPORATION | | ANNUAL |
| | | | REPORT 2016-17 |
Notes to the Financial Statements
Capital Markets Operations
For the year ended 30 June 2017
| 11 | Financial risk management continued |
QTC lends to clients based on a duration profile specified in the client mandates. QTC then manages any mismatch between the duration profile of client loans and QTC’s funding within an Asset and Liability Management Portfolio. Duration is a direct measure of the interest rate sensitivity of a financial instrument or a portfolio of financial instruments and quantifies the change in value of a financial instrument or portfolio due to interest rate movements. All costs or benefits of managing any mismatch between client loans and QTC funding are passed on to QTC clients meaning that QTC is effectively immunised from interest rate risk with respect to these portfolios.
QTC’s interest rate risk, which results from borrowing in advance and investing surplus funds in high credit quality, highly liquid assets, is managed with consideration given to duration risk, yield curve risk, basis risk and Value-at-Risk (VaR). To manage the risk of non-parallel yield curve movements, QTC manages portfolio cash flows in a series of time periods so that the net interest rate risk in each time period can be measured.
QTC enters into interest rate swaps, forward rate agreements and futures contracts to assist in the management of interest rate risk.
In QTC’s Funding and Liquidity portfolios, interest rate swaps may be utilised to change the interest rate exposure of medium to long term fixed rate borrowings into that of a floating rate borrowing. Also, at times, floating to fixed swaps may be undertaken to generate a fixed rate term funding profile.
QTC is exposed to basis risk when interest rate swaps are used in the Funding and Liquidity portfolios. Basis risk represents a mark-to-market exposure due to movements between the swap curve and QTC’s yield curve.
QTC uses a Board approved Value-at-Risk framework to manage QTC’s exposure to market risk complemented by other measures such as defined stress tests and PVBP (change in the present value for a one basis point movement). The VaR measure estimates the potential mark-to-market loss over a given holding period at a 99 per cent confidence level. QTC uses the historical simulation approach to calculate VaR with a holding period of 10 business days.
VaR impact
The VaR at 30 June, along with the minimum, maximum and average exposure over the financial year was as follows:
| | | | | | | | |
| | | 2017 | | | 2016 | |
INTEREST RATE RISK VAR | | $M | | | $M | |
As at 30 June | | | 16 | | | | 10 | |
Average for the year | | | 14 | | | | 7 | |
Financial year - minimum | | | 10 | | | | 4 | |
Financial year - maximum | | | 16 | | | | 16 | |
The above VaR calculation does not include the potential mark-to-market impact of changes in credit spreads on the value of assets held in the QTC Cash Fund. At 30 June 2017, QTC had an exposure of approximately $0.77 million per basis point to changes in credit spreads of assets held in the QTC Cash Fund.
| (b) | Liquidity and financing risks |
QTC has a robust internal framework whereby extensive liquidity scenario analysis and forecasting is undertaken to understand assumption sensitivities to ensure there is appropriate forward looking visibility of the State’s liquidity position.
QTC debt is a Level 1 (prudentially required) asset for Australian banks under Basel III reforms with a 0% capital risk weighting. In normal and difficult market circumstances, QTC debt is likely to be in high demand. The ability to issue debt is considered a potential source of liquidity.
QTC holds appropriate liquidity (allowing for suitable haircuts of liquid assets) to meet minimum liquidity requirements as estimated today and as forecast into the future. QTC measures the minimum liquidity requirement to comfortably meet the following scenarios simultaneously:
| • | | Standard & Poor’s Liquidity Ratio – maintain a ratio greater than 80% |
| • | | Liquidity forecast – maintaining a minimum of $4 billion forecast liquidity over any pending 12 month period |
| • | | Daily cash balances – maintaining a minimum of five working days’ net cash requirements in 11AM cash, RBA repo eligible securities and Negotiable Certificates of Deposits to fund the net cash flows from assets and liabilities on QTC’s balance sheet. |
In addition QTC holds liquid assets to support public sector entity deposits and the State’s Long Term Assets. QTC considers these liquid assets as potential sources of liquidity in a liquidity crisis.
QTC maintains its AUD benchmark bond facility as its core medium to long-term funding facility and its domestic treasury note facility, euro-commercial paper facility and US commercial paper facility as its core short-term funding facilities. In addition, QTC has in place Euro and US medium-term note facilities to take advantage of funding opportunities in offshore markets. These facilities ensure that QTC is readily able to access the domestic and international financial markets.
With the exception of deposits and payables, the maturity analysis for liabilities has been calculated based on the contractual cash flows relating to the repayment of the principal (face value) and interest amounts over the contractual terms.
Deposits on account of the Cash Fund and Working Capital Facility (11AM Fund) are repayable at call while deposits held as security for stock lending and repurchase agreements are repayable when the security is lodged with QTC.
With the exception of cash and receivables, the maturity analysis for assets has been calculated based on the contractual cash flows relating to the repayment of the principal (face value) and interest amounts over the contractual terms.
In relation to client onlendings, certain loans are interest only with no fixed repayment date for the principal component (ie. loans are made based on the quality of the client’s business and its financial strength). For the purposes of completing the maturity analysis, the principal component of these loans has been included in the greater than five year time band with no interest payment assumed in this time band.
| | | | |
| ANNUAL | | QUEENSLAND TREASURY CORPORATION | | |
| REPORT 2016-17 | | | | |
Notes to the Financial Statements
Capital Markets Operations
For the year ended 30 June 2017
| 11 | Financial risk management continued |
| (b) | Liquidity and financing risks continued |
The following table sets out the contractual cash flows relating to financial assets and financial liabilities held by QTC at balance date.
| | | | | | | | | | | | | | | | | | | | | | | | | | | | |
CONTRACTUAL MATURITIES AS AT 30 JUNE 2017 | | 3 MONTHS
OR LESS $000 | | | 3 - 6
MONTHS
$000 | | | 6 - 12
MONTHS
$000 | | | 1 - 5
YEARS
$000 | | | MORE THAN
5 YEARS
$000 | | | TOTAL
$000 | | | FAIR VALUE
$000 | |
Financial assets | | | | | | | | | | | | | | | | | | | | | | | | | | | | |
Cash and cash equivalents | | | 2 124 768 | | | | — | | | | — | | | | — | | | | — | | | | 2 124 768 | | | | 2 124 768 | |
Receivables | | | 4 018 | | | | — | | | | — | | | | — | | | | — | | | | 4 018 | | | | 4 018 | |
Onlendings(1) | | | 1 061 433 | | | | 1 010 083 | | | | 2 179 578 | | | | 16 135 364 | | | | 74 321 312 | | | | 94 707 770 | | | | 85 101 958 | |
Financial assets at fair value through profit or loss | | | 6 795 137 | | | | 2 761 532 | | | | 2 445 304 | | | | 6 373 254 | | | | 1 625 981 | | | | 20 001 208 | | | | 19 268 151 | |
| | | | | | | | | | | | | | | | | | | | | | | | | | | | |
Total | | | 9 985 356 | | | | 3 771 615 | | | | 4 624 882 | | | | 22 508 618 | | | | 75 947 293 | | | | 116 837 764 | | | | 106 498 895 | |
| | | | | | | | | | | | | | | | | | | | | | | | | | | | |
Financial liabilities | | | | | | | | | | | | | | | | | | | | | | | | | | | | |
Payables and dividends | | | (34 948 | ) | | | — | | | | (500 000 | ) | | | — | | | | — | | | | (534 948 | ) | | | (534 948 | ) |
Deposits | | | (7 280 949 | ) | | | (22 377 | ) | | | (4 394 | ) | | | (21 921 | ) | | | (99 705 | ) | | | (7 429 346 | ) | | | (7 428 891 | ) |
Financial liabilities at fair value through profit or loss | | | | | | | | | | | | | | | | | | | | | | | | | | | | |
- Short-term | | | (3 940 362 | ) | | | (1 467 953 | ) | | | — | | | | — | | | | — | | | | (5 408 315 | ) | | | (5 392 889 | ) |
- Long-term | | | (5 821 893 | ) | | | (514 661 | ) | | | (6 888 134 | ) | | | (41 353 155 | ) | | | (44 646 553 | ) | | | (99 224 396 | ) | | | (93 070 093 | ) |
| | | | | | | | | | | | | | | | | | | | | | | | | | | | |
Total liabilities | | | (17 078 152 | ) | | | (2 004 991 | ) | | | (7 392 528 | ) | | | (41 375 076 | ) | | | (44 746 258 | ) | | | (112 597 005 | ) | | | (106 426 821 | ) |
| | | | | | | | | | | | | | | | | | | | | | | | | | | | |
Derivatives | | | | | | | | | | | | | | | | | | | | | | | | | | | | |
Interest rate swaps | | | (5 422 | ) | | | (5 897 | ) | | | (13 242 | ) | | | (16 996 | ) | | | — | | | | (41 557 | ) | | | 54 194 | |
Cross currency swaps | | | 124 059 | | | | 6 141 | | | | (36 909 | ) | | | (87 923 | ) | | | (46 102 | ) | | | (40 734 | ) | | | 74 589 | |
Foreign exchange contracts | | | (6 011 | ) | | | (4 180 | ) | | | — | | | | — | | | | — | | | | (10 191 | ) | | | (9 638 | ) |
Futures contracts | | | 43 222 | | | | — | | | | — | | | | — | | | | — | | | | 43 222 | | | | 43 222 | |
Net derivatives | | | 155 849 | | | | (3 936 | ) | | | (50 151 | ) | | | (104 919 | ) | | | (46 102 | ) | | | (49 260 | ) | | | 162 367 | |
Net (liabilities)/assets | | | (6 936 948 | ) | | | 1 762 688 | | | | (2 817 797 | ) | | | (18 971 377 | ) | | | 31 154 933 | | | | 4 191 499 | | | | 234 441 | |
Cumulative | | | (6 936 948 | ) | | | (5 174 260 | ) | | | (7 992 057 | ) | | | (26 963 434 | ) | | | 4 191 499 | | | | — | | | | — | |
| (1) | A large proportion of QTC’s onlendings are based on the quality of the business and financial strength of the client. Funds are therefore onlent on the basis of these businesses being going concerns and continuing to meet key credit metrics criteria such as debt to capital and interest coverage ratios. Accordingly, a significant portion of the onlendings portfolio has a loan maturity profile which is greater than five years with the interest rate risk of these loans being managed based on the client’s business risk such that the funding is structured on the underlying business profile. This results in QTC’s liability maturity profile being shorter than the asset maturity profile. Though not exposing QTC to interest rate risk, this approach does require QTC to undertake periodic refinancing of its liabilities. |
| | | | |
| | QUEENSLAND TREASURY CORPORATION | | ANNUAL |
| | | | REPORT 2016-17 |
Notes to the Financial Statements
Capital Markets Operations
For the year ended 30 June 2017
| 11 | Financial risk management continued |
| (b) | Liquidity and financing risks continued |
| | | | | | | | | | | | | | | | | | | | | | | | | | | | |
CONTRACTUAL MATURITIES AS AT 30 JUNE 2016 | | 3 MONTHS
OR LESS $000 | | | 3 - 6
MONTHS
$000 | | | 6 - 12
MONTHS
$000 | | | 1 - 5
YEARS
$000 | | | MORE THAN
5 YEARS
$000 | | | TOTAL
$000 | | | FAIR VALUE
$000 | |
Financial assets | | | | | | | | | | | | | | | | | | | | | | | | | | | | |
Cash and cash equivalents | | | 1 141 617 | | | | — | | | | — | | | | — | | | | — | | | | 1 141 617 | | | | 1 141 617 | |
Receivables | | | 11 326 | | | | — | | | | — | | | | — | | | | — | | | | 11 326 | | | | 11 326 | |
Onlendings | | | 2 254 061 | | | | 1 192 110 | | | | 2 384 219 | | | | 17 674 671 | | | | 79 005 783 | | | | 102 510 844 | | | | 90 822 729 | |
Financial assets at fair value through profit or loss | | | 5 184 364 | | | | 2 903 108 | | | | 1 448 928 | | | | 7 515 100 | | | | 976 221 | | | | 18 027 721 | | | | 16 516 449 | |
| | | | | | | | | | | | | | | | | | | | | | | | | | | | |
Total | | | 8 591 368 | | | | 4 095 218 | | | | 3 833 147 | | | | 25 189 771 | | | | 79 982 004 | | | | 121 691 508 | | | | 108 492 121 | |
| | | | | | | | | | | | | | | | | | | | | | | | | | | | |
Financial liabilities | | | | | | | | | | | | | | | | | | | | | | | | | | | | |
Payables and dividends | | | (23 920 | ) | | | (56 528 | ) | | | — | | | | — | | | | — | | | | (80 448 | ) | | | (80 448 | ) |
Deposits | | | (6 824 746 | ) | | | (20 130 | ) | | | — | | | | — | | | | — | | | | (6 844 876 | ) | | | (6 844 876 | ) |
Financial liabilities at fair value through profit or loss | | | | | | | | | | | | | | | | | | | | | | | | | | | | |
- Short-term | | | (4 380 529 | ) | | | (1 475 000 | ) | | | — | | | | — | | | | — | | | | (5 855 529 | ) | | | (5 837 363 | ) |
- Long-term | | | (3 456 106 | ) | | | (489 208 | ) | | | (4 252 963 | ) | | | (53 706 254 | ) | | | (43 206 712 | ) | | | (105 111 243 | ) | | | (94 841 942 | ) |
| | | | | | | | | | | | | | | | | | | | | | | | | | | | |
Total liabilities | | | (14 685 301 | ) | | | (2 040 866 | ) | | | (4 252 963 | ) | | | (53 706 254 | ) | | | (43 206 712 | ) | | | (117 892 096 | ) | | | (107 604 629 | ) |
| | | | | | | | | | | | | | | | | | | | | | | | | | | | |
Derivatives | | | | | | | | | | | | | | | | | | | | | | | | | | | | |
Interest rate swaps | | | (17 316 | ) | | | (868 | ) | | | (27 458 | ) | | | (198 533 | ) | | | (201 121 | ) | | | (445 296 | ) | | | (402 214 | ) |
Cross currency swaps | | | 24 544 | | | | (25 621 | ) | | | 8 430 | | | | 70 743 | | | | (218 817 | ) | | | (140 722 | ) | | | 133 259 | |
Foreign exchange contracts | | | (21 251 | ) | | | — | | | | — | | | | — | | | | — | | | | (21 251 | ) | | | (19 903 | ) |
Futures contracts | | | (10 155 | ) | | | | | | | | | | | | | | | | | | | (10 155 | ) | | | (10 155 | ) |
Net derivatives | | | (24 178 | ) | | | (26 489 | ) | | | (19 028 | ) | | | (127 790 | ) | | | (419 938 | ) | | | (617 423 | ) | | | (299 013 | ) |
Net (liabilities)/assets | | | (6 118 111 | ) | | | 2 027 863 | | | | (438 844 | ) | | | (28 644 273 | ) | | | 36 355 354 | | | | 3 181 989 | | | | 588 479 | |
Cumulative | | | (6 118 111 | ) | | | (4 090 248 | ) | | | (4 529 092 | ) | | | (33 173 365 | ) | | | 3 181 989 | | | | — | | | | | |
| | | | |
| ANNUAL | | QUEENSLAND TREASURY CORPORATION | | |
| REPORT 2016-17 | | | | |
Notes to the Financial Statements
Capital Markets Operations
For the year ended 30 June 2017
| 11 | Financial risk management continued |
| (i) | Financial markets counterparties |
Credit risk is regularly assessed, measured and managed in strict accordance with QTC’s financial markets risk policy. Exposure to credit risk is managed through regular analysis of the ability of credit counterparties to meet payment obligations.
Credit exposure is QTC’s estimate of the potential loss at balance date in relation to investments and derivative contracts (measured using Basel III compliance methodologies) in the event of non-performance by all counterparties. The credit exposure for non-derivative investments is calculated based on the market value of the instrument while exposure to derivative contracts is based only on a notional ‘add-on’ factor applied to the value of the instrument, as derivatives are marked-to-market daily with zero thresholds under all of QTC’s credit support annexes. QTC utilises collateral arrangements to limit its derivatives’ credit exposure (refer (iv) master netting arrangements).
All derivative contracts are subject to zero threshold collateral arrangements with the effect of credit valuation adjustments (CVA) and debt valuation adjustments (DVA) reflected where material. However this is typically not required due to the impact of collateral arrangements and the high credit worthiness of counterparties, hence for derivative contracts, credit risk is not a significant factor in the determination of fair value.
The following tables represent QTC’s exposure to credit risk at 30 June:
| | | | | | | | | | | | | | | | | | | | | | | | | | | | | | | | |
BY CREDIT RATING(1) 30 JUNE 2017 | | AAA
$000 | | | AA+
$000 | | | AA
$000 | | | AA-
$000 | | | A+
$000 | | | A
$000 | | | OTHER(2)
$000 | | | TOTAL
$000 | |
Cash & equivalents | | | — | | | | — | | | | — | | | | 2 124 768 | | | | — | | | | — | | | | — | | | | 2 124 768 | |
Financial assets(3) | | | 1 413 098 | | | | 381 750 | | | | 332 172 | | | | 14 848 004 | | | | 1 243 689 | | | | 570 008 | | | | 338 632 | | | | 19 127 353 | |
Derivatives | | | — | | | | — | | | | — | | | | 69 476 | | | | 44 853 | | | | — | | | | — | | | | 114 329 | |
| | | 1 413 098 | | | | 381 750 | | | | 332 172 | | | | 17 042 248 | | | | 1 288 542 | | | | 570 008 | | | | 338 632 | | | | 21 366 450 | |
| | | 6 | % | | | 2 | % | | | 2 | % | | | 80 | % | | | 6 | % | | | 2 | % | | | 2 | % | | | 100 | % |
BY CREDIT RATING(1) 30 JUNE 2016 | | | | | | | | | | | | | | | | | | | | | | | | |
Cash & equivalents | | | — | | | | — | | | | — | | | | 1 141 617 | | | | — | | | | — | | | | — | | | | 1 141 617 | |
Financial assets(3) | | | 2 324 239 | | | | 807 350 | | | | 109 071 | | | | 12 113 860 | | | | 708 555 | | | | 170 651 | | | | 139 824 | | | | 16 373 550 | |
Derivatives | | | — | | | | — | | | | — | | | | 249 308 | | | | 41 344 | | | | 41 937 | | | | 1 636 | | | | 334 225 | |
Other | | | — | | | | — | | | | — | | | | 585 403 | | | | 387 065 | | | | — | | | | — | | | | 972 468 | |
| | | 2 324 239 | | | | 807 350 | | | | 109 071 | | | | 14 090 188 | | | | 1 136 964 | | | | 212 588 | | | | 141 460 | | | | 18 821 860 | |
| | | 12 | % | | | 4 | % | | | 1 | % | | | 75 | % | | | 6 | % | | | 1 | % | | | 1 | % | | | 100 | % |
| (1) | Credit rating as per Standard & Poor’s or equivalent agency |
| (2) | Includes long term ratings of A-, or a short term rating of A-1+ & A-2 |
| (3) | Financial assets are based on unsettled face value and consist mainly of discount securities, Commonwealth & State securities, floating rate notes and term deposits |
| | | | |
| | QUEENSLAND TREASURY CORPORATION | | ANNUAL |
| | | | REPORT 2016-17 |
Notes to the Financial Statements
Capital Markets Operations
For the year ended 30 June 2017
| 11 | Financial risk management continued |
| (i) | Financial markets counterparties continued |
QTC adopts a conservative approach to the management of credit risk with a strong bias to high credit quality counterparties. QTC maintains a ratings based approach in determining maximum credit exposures to counterparties which is supplemented by QTC’s credit risk analysis team performing its own credit assessment of QTC’s capital markets counterparties. The country of domicile, the counterparty’s credit metrics, size of its funding programs, asset composition and quality of the underlying security are key considerations when determining limits.
QTC has a significant concentration of credit risk to the banking sector and in particular, the domestic banking sector. This is difficult to avoid given the size of QTC’s investment portfolio and the requirement to invest with counterparties rated BBB+ or better (approximately 90 per cent of exposures are AA- or better) and to invest in highly liquid securities.
| (ii) | Onlending counterparties |
Counterparties for onlendings, with the exception of some small exposures to private companies and cooperative housing societies, are Queensland Government sector entities with approximately 68 per cent (2016: 73 per cent) of these onlendings having an explicit State Government guarantee. As a consequence, these exposures are not included in QTC’s total credit exposure.
| (iii) | Fair value attributable to credit risk of QTC’s liabilities |
QTC’s borrowings are guaranteed by the State Government, and in the case of the Australian Government Guaranteed borrowings (2017 $4,762 million), by the Commonwealth. As a result, credit risk is not a significant factor in the determination of fair value. Changes in fair value are mainly attributable to market fluctuations.
| (iv) | Master netting arrangements |
QTC enters into all derivative transactions under International Swaps and Derivatives Association (ISDA) Master Agreements. QTC does not currently have any master netting arrangements where a default event has occurred, and has therefore presented all derivative financial instruments on a gross basis in the statement of financial position. QTC also has Credit Support Annexes (CSAs) in place with each ISDA, under which collateral is transferred every business day. This further reduces QTC’s credit exposure.
The following table presents the financial instruments that are offset, or subject to enforceable master netting arrangements and other similar agreements but not offset. The column ‘net amount’ shows the impact on QTC’s balance sheet if all set-off rights were exercised.
| | | | | | | | | | | | | | | | |
| | | | | | RELATED TO AMOUNTS NOT SET OFF
IN THE BALANCE SHEET | | | | |
| | | GROSS AND
NET AMOUNTS
ON THE
BALANCE
SHEET $000 | | | FINANCIAL
INSTRUMENTS
COLLATERAL
$000 | | | CASH COLLATERAL
RECEIVED OR
GIVEN
$000 | | | NET AMOUNT
$000 | |
| | | | |
2017 | | | | | | | | | | | | | | | | |
Derivative assets: | | | | | | | | | | | | | | | | |
- subject to master netting arrangements | | | 337 559 | | | | (63 126 | ) | | | (244 936 | ) | | | 29 497 | |
Derivative liabilities: | | | | | | | | | | | | | | | | |
- subject to master netting arrangements | | | (175 192 | ) | | | — | | | | 175 652 | | | | 460 | |
Net exposure | | | 162 367 | | | | (63 126 | ) | | | (69 284 | ) | | | 29 957 | |
| | | | |
2016 | | | | | | | | | | | | | | | | |
Derivative assets: | | | | | | | | | | | | | | | | |
- subject to master netting arrangements | | | 224 989 | | | | (78 360 | ) | | | (25 917 | ) | | | 120 712 | |
Derivative liabilities: | | | | | | | | | | | | | | | | |
- subject to master netting arrangements | | | (524 002 | ) | | | — | | | | 393 230 | | | | (130 772 | ) |
Net exposure | | | (299 013 | ) | | | (78 360 | ) | | | 367 313 | | | | (10 060 | ) |
| (v) | Assets past due and impaired |
Onlendings include a provision for impairment of $0.5 million for Cooperative housing society loans where full recovery of principal and interest is considered doubtful based on the net realisable value of the underlying security.
| | | | |
| ANNUAL | | QUEENSLAND TREASURY CORPORATION | | |
| REPORT 2016-17 | | | | |
Notes to the Financial Statements
Capital Markets Operations
For the year ended 30 June 2017
Financial instruments measured at fair value have been classified in accordance with the hierarchy described in AASB 13 Fair Value Measurement. The fair value hierarchy is categorised into three levels based on the observability of the inputs used.
Level 1 – quoted prices (unadjusted) in active markets that QTC can access at measurement date for identical assets and liabilities.
Level 2 – inputs other than quoted prices included within Level 1 that are observable for the asset or liability, either directly or indirectly.
Level 3 – inputs for the asset or liability that are not based on observable market data (unobservable inputs).
All financial instruments at fair value through profit or loss are valued by reference to either quoted market prices or observable inputs with no significant adjustments applied to instruments held and therefore no financial instruments at fair value through profit or loss are classified under Level 3.
Financial assets classified as Level 1 consist primarily of short-term and tradable bank deposits, Commonwealth and semi-government bonds and futures contracts where an active market has been established. Financial liabilities classified as Level 1 consist of QTC benchmark Bonds.
Financial assets classified as Level 2 include non-actively traded corporate and semi-government bonds, certain money market securities, floating rate notes, term deposits, QTC onlendings and all over the counter derivatives. The principal inputs in determining fair value include benchmark interest
rates such as interbank rates, quoted interest rates in the swap, bond and futures markets, trading margins to the swap curve and counterparty credit spreads for similar instruments adjusted for changes in the credit worthiness of the counterparty. A margin may be applied based on the original purchase margin where the instrument is not actively traded. QTC onlendings are priced based on the underlying liability portfolio.
Financial liabilities classified as Level 2 include commercial paper, treasury notes, medium-term notes, floating rate notes, QTC Capital Index Bonds and client deposits. The principal inputs in determining fair value include benchmark interest rates such as interbank rates and quoted interest rates in the swap and bond markets. Valuations may include a fixed margin to LIBOR or swap curve. Client deposits are principally held in the QTC Cash Fund which is capital guaranteed.
Over the counter derivatives are typically valued as Level 2 and include FX forwards, FX swaps, interest rate and cross currency swaps. The principal inputs in determining fair value include quoted interest rates in the swap market, spot FX rates and basis curves.
QTC applies mid-market pricing as a practical and consistent method for fair value measurements within the bid-ask spread.
Classification of instruments into fair value hierarchy levels is reviewed semi-annually and where there has been a significant change to the valuation inputs and a transfer is deemed to occur, this is effected at the end of the relevant reporting period. No transfers between Level 1 and Level 2 were made during the year except for futures contracts which have been transferred from Level 2 to Level 1.
| | | | | | | | | | | | |
AS AT 30 JUNE 2017 | | QUOTED PRICES
LEVEL 1
$000 | | | OBSERVABLE INPUTS
LEVEL 2
$000 | | | TOTAL
$000 | |
| | | |
Financial assets | | | | | | | | | | | | |
Cash and cash equivalents | | | 2 124 768 | | | | — | | | | 2 124 768 | |
Financial assets through profit or loss | | | 5 733 080 | | | | 13 535 071 | | | | 19 268 151 | |
Onlendings | | | — | | | | 85 101 958 | | | | 85 101 958 | |
Derivative financial assets | | | 98 810 | | | | 238 749 | | | | 337 559 | |
| | | | | | | | | | | | |
Total financial assets | | | 7 956 658 | | | | 98 875 778 | | | | 106 832 436 | |
| | | | | | | | | | | | |
Financial liabilities | | | | | | | | | | | | |
Financial liabilities through profit or loss | | | | | | | | | | | | |
- Short term | | | — | | | | 5 392 889 | | | | 5 392 889 | |
- Long term | | | 85 852 647 | | | | 7 217 446 | | | | 93 070 093 | |
Deposits | | | — | | | | 7 428 891 | | | | 7 428 891 | |
Derivative financial liabilities | | | 65 226 | | | | 109 966 | | | | 175 192 | |
| | | | | | | | | | | | |
Total financial liabilities | | | 85 917 873 | | | | 20 149 192 | | | | 106 067 065 | |
| | | | | | | | | | | | |
| | | |
AS AT 30 JUNE 2016 | | | | | | | | | |
| | | |
Financial assets | | | | | | | | | | | | |
Cash and cash equivalents | | | 1 141 617 | | | | — | | | | 1 141 617 | |
Financial assets through profit or loss | | | 4 874 540 | | | | 11 641 909 | | | | 16 516 449 | |
Onlendings | | | — | | | | 90 822 729 | | | | 90 822 729 | |
Derivative financial assets | | | 2 084 | | | | 222 905 | | | | 224 989 | |
| | | | | | | | | | | | |
Total financial assets | | | 6 018 241 | | | | 102 687 543 | | | | 108 705 784 | |
| | | | | | | | | | | | |
Financial liabilities | | | | | | | | | | | | |
Financial liabilities through profit or loss | | | | | | | | | | | | |
- Short term | | | — | | | | 5 837 363 | | | | 5 837 363 | |
- Long term | | | 83 718 966 | | | | 11 122 976 | | | | 94 841 942 | |
Deposits | | | — | | | | 6 844 876 | | | | 6 844 876 | |
Derivative financial liabilities | | | 32 142 | | | | 491 860 | | | | 524 002 | |
| | | | | | | | | | | | |
Total financial liabilities | | | 83 751 108 | | | | 24 297 075 | | | | 108 048 183 | |
| | | | | | | | | | | | |
| | | | |
| | QUEENSLAND TREASURY CORPORATION | | ANNUAL |
| | | | REPORT 2016-17 |
Notes to the Financial Statements
Capital Markets Operations
For the year ended 30 June 2017
| 13 | Property, plant and equipment |
Accounting Policy
Property, plant and equipment are measured at cost less accumulated depreciation and accumulated impairment losses. Depreciation is calculated on a straight line basis over the estimated useful life of the assets. Depreciation rates for each class of asset are as follows:
| | | | |
Asset class | | Depreciation rate | |
Information technology & office equipment | | | 6 – 40 | % |
Plant and machinery | | | 10 – 30 | % |
The assets’ residual values, useful lives and depreciation methods are reviewed and adjusted, if appropriate, at each financial year end. Reconciliations of the carrying amounts for each class of property, plant and equipment are set out below:
| | | | | | | | | | | | |
DESCRIPTION | | INFORMATION
TECHNOLOGY AND
OFFICE EQUIPMENT
$000 | | | PLANT AND
MACHINERY (1)
$000 | | | TOTAL
$000 | |
| | | |
Year ended 30 June 2017 | | | | | | | | | | | | |
Cost at balance date | | | 12 028 | | | | 230 936 | | | | 242 964 | |
Accumulated depreciation and impairment | | | (7 545 | ) | | | (138 835 | ) | | | (146 380 | ) |
Net carrying amount | | | 4 483 | | | | 92 101 | | | | 96 584 | |
Movement | | | | | | | | | | | | |
Net carrying amount at 1 July 2016 | | | 2 265 | | | | 132 384 | | | | 134 649 | |
Additions | | | 3 904 | | | | — | | | | 3 904 | |
Disposals | | | (37 | ) | | | (10 470 | ) | | | (10 507 | ) |
Depreciation expense | | | (1 649 | ) | | | (29 813 | ) | | | (31 462 | ) |
Net carrying amount at 30 June 2017 | | | 4 483 | | | | 92 101 | | | | 96 584 | |
| | | |
Year ended 30 June 2016 | | | | | | | | | | | | |
Cost at balance date | | | 10 257 | | | | 303 057 | | | | 313 314 | |
Accumulated depreciation and impairment | | | (7 992 | ) | | | (170 673 | ) | | | (178 665 | ) |
Net carrying amount | | | 2 265 | | | | 132 384 | | | | 134 649 | |
Movement | | | | | | | | | | | | |
Net carrying amount at 1 July 2015 | | | 3 918 | | | | 176 888 | | | | 180 806 | |
Additions | | | 6 | | | | — | | | | 6 | |
Disposals | | | (24 | ) | | | (6 750 | ) | | | (6 774 | ) |
Depreciation expense | | | (1 635 | ) | | | (37 754 | ) | | | (39 389 | ) |
Net carrying amount at 30 June 2016 | | | 2 265 | | | | 132 384 | | | | 134 649 | |
| (1) | Plant and machinery consists mainly of buses and ferries which QTC leases to public sector entities under a whole of government operating lease facility. The leases are non-cancellable and have remaining terms of between 1 and 4 years. |
| | | | |
| ANNUAL | | QUEENSLAND TREASURY CORPORATION | | |
| REPORT 2016-17 | | | | |
Notes to the Financial Statements
Capital Markets Operations
For the year ended 30 June 2017
| 14 | Notes to the statement of cash flows |
Reconciliation of profit after tax to net cash provided by operating activities
| | | | | | | | |
DESCRIPTION | | 2017
$000 | | | 2016
$000 | |
Profit for the year | | | 129 184 | | | | 46 884 | |
| | |
Non-cash flows in operating surplus | | | | | | | | |
(Gain)/loss on interest-bearing liabilities | | | (3 285 567 | ) | | | 3 029 573 | |
(Gain)/loss on deposits held | | | (1 133 | ) | | | 65 | |
(Gain)/loss on onlendings | | | 4 018 515 | | | | (3 625 826 | ) |
(Gain)/loss on financial assets at fair value through profit or loss | | | 86 358 | | | | (16 922 | ) |
Depreciation and amortisation | | | 33 256 | | | | 40 098 | |
Doubtful debts- cooperative housing societies | | | 153 | | | | 30 | |
| | |
Changes in assets and liabilities | | | | | | | | |
Decrease/(increase) in financial assets at fair value through profit or loss | | | 32 930 | | | | (34 574 | ) |
Decrease/(increase) in deferred tax asset | | | 662 | | | | (344 | ) |
Increase in onlendings | | | (165 931 | ) | | | (15 393 | ) |
Decrease/(increase) in receivables | | | 7 626 | | | | (11 559 | ) |
Decrease in interest-bearing liabilities | | | (568 658 | ) | | | (46 127 | ) |
Increase/(decrease) in deposits | | | 11 125 | | | | (496 | ) |
(Decrease)/increase in payables and other liabilities | | | (490 352 | ) | | | 13 351 | |
Net cash used in operating activities | | | (191 832 | ) | | | (621 240 | ) |
| | | | |
| | QUEENSLAND TREASURY CORPORATION | | ANNUAL |
| | | | REPORT 2016-17 |
Notes to the Financial Statements
Long Term Assets
For the year ended 30 June 2017
| 15 | Financial assets at fair value through profit or loss |
Accounting Policy – Classification and measurement
Financial instruments on initial recognition are classified into the following categories:
| • | | Financial assets at fair value through profit or loss, and |
| • | | Financial liabilities at amortised cost. |
Financial assets at fair value through profit or loss
Financial assets at fair value through profit or loss include investments held in unit trusts which consist of investments held and managed by QIC and include cash, international equities and other diversified products. These investments are measured at market value based on the hard close unit price quoted by QIC adjusted for fees outstanding on the account and net of any GST recoverable.
Financial liabilities at amortised cost
Financial liabilities at amortised cost consist of fixed rate notes issued to the State Government in exchange for a portfolio of assets. The fixed rate notes are initially recognised at par value, which equated to the fair value of the financial assets acquired. Deposits and withdrawals can be made from the notes based on changes in the State Government’s long-term liabilities. The notes have a term of 50 years. Interest on the fixed rate notes is capitalised monthly and the rate is reviewed annually.
Financial liabilities at amortised cost are measured using the effective interest method. The effective interest method is a method of calculating the amortised cost of a financial instrument and allocating the interest income or interest expense over the relevant period. In this way, interest is recognised in the statement of comprehensive income in the period in which it accrues.
| | | | | | | | |
| | | 2017
$000 | | | 2016
$000 | |
Investments in unit trusts and other holdings- QIC: | | | | | | | | |
| | |
Movement during the year: | | | | | | | | |
Opening balance | | | 31 076 084 | | | | 34 655 724 | |
Net withdrawals | | | (1 743 662 | ) | | | (5 020 826 | ) |
Net change in fair value of unit trusts | | | 2 382 036 | | | | 1 441 186 | |
Closing balance | | | 31 714 458 | | | | 31 076 084 | |
| | |
Comprised of the following asset classes: | | | | | | | | |
| | |
Defensive assets | | | | | | | | |
Cash | | | 7 481 652 | | | | 7 887 964 | |
Fixed interest | | | 5 944 533 | | | | 4 008 827 | |
| | |
Growth assets | | | | | | | | |
Equities | | | 3 500 091 | | | | 4 430 175 | |
Diversified alternatives | | | 6 961 071 | | | | 7 037 635 | |
| | |
Unlisted assets | | | | | | | | |
Infrastructure | | | 2 891 681 | | | | 3 059 369 | |
Private equities | | | 2 459 109 | | | | 2 417 159 | |
Real estate | | | 2 476 321 | | | | 2 234 955 | |
| | | | | | | | |
| | | 31 714 458 | | | | 31 076 084 | |
| | | | | | | | |
| | | | |
ANNUAL | | QUEENSLAND TREASURY CORPORATION | | |
REPORT 2016-17 | | | | |
Notes to the Financial Statements
Long Term Assets
For the year ended 30 June 2017
| 16 | Financial risk management |
The Long Term Assets are invested in unlisted unit trusts held with QIC. The trusts hold investments in a variety of financial instruments including derivatives, which expose these assets to credit risk, liquidity risk and market risk due to changes in interest rates, foreign exchange rates, property and equity prices. However, as these investments are long term in nature, market fluctuations are expected to even out over the term of the investment.
Long Term Asset Advisory Board (LTAAB) determines the investment objectives, risk profiles and strategy for the Long Term Assets within the framework provided by the Government. It is responsible for formulating a strategic asset allocation to achieve the objectives of the investments in line with the required risk profile. Risk management policies are established to identify and analyse the risks and to set appropriate risk limits and controls, as well as to monitor risks and adherence against these limits.
QIC provides assistance to LTAAB in discharging its responsibilities. QIC’s role includes recommending to LTAAB, investment product objectives, risk profiles and strategic asset allocations to achieve objectives within the targets and risk controls set. As the lead investment manager, QIC is responsible for implementing the investment strategy. In addition, independent oversight of the investment advice and services provided by QIC, including periodic strategic reviews of QIC’s activities and performance, is provided by an external consultant.
LTAAB is responsible for setting the interest rate applicable on the fixed rate note liability of QTC, which was set at 7.0 per cent from 1 July 2015 and retained for 2016-17, based on the expected long term average rate of return on the portfolio.
Long Term Assets expose QTC to market risk, including interest rate risk, foreign currency risk, property risk and equity price risk, resulting from its investments in unit trusts and the underlying movement in the net asset value through these trusts.
Market risk is mitigated through a diversified portfolio of investments in unit trusts held with QIC in accordance with the investment strategy approved by LTAAB (refer note 15). The investment strategy targets a widely diversified portfolio across a broad range of asset classes and therefore credit risk is minimised. Market risk is based on the risk that the unit price of the fund will change and therefore the portfolio does not have exposure directly to interest rate, foreign currency or credit risk.
QIC adheres to prudential controls contained in the Investment Management Agreement. Under this agreement, derivative products are not permitted to be used for speculative purposes but are used as hedging instruments against existing positions or for efficient trading and asset allocation purposes to assist in achieving the overall investment returns and volatility objectives of the portfolio.
The market risk of the Long Term Assets comprises the risk that the unit price of the funds in which the assets are invested will change during the next reporting period (effectively price risk). A sensitivity analysis for the key types of market risk that apply to the investments of the funds has been undertaken by QIC. QIC has provided a range of reasonably possible changes in key risk variables including the ASX 200, the MSCI World ex Australia Equities Index, the RBA official cash rate, the Bank of England official cash rate and real estate capitalisation rates.
The foreign currency exposure of QTC’s total investment portfolio is 100% hedged. For this reason sensitivity to foreign exchange rate movements has not been calculated at the asset class level.
Based on these changes to key risk variables and applying a range of valuation methodologies, a reasonably possible change in profit and equity on applicable investments held at 30 June is as follows:
| | | | | | | | | | | | | | | | | | | | | | | | | | | | | | | | |
| | | 2017 CHANGE | | | 2017 PROFIT/EQUITY | | | 2016 CHANGE | | | 2016 PROFIT/EQUITY | |
| | | Low
% | | | High
% | | | Decrease
$000 | | | Increase
$000% | | | Low
% | | | High
% | | | Decrease
$000 | | | Increase
$000 | |
Cash and fixed interest(1) | | | -1 | % | | | 1 | % | | | (62 930 | ) | | | 62 930 | | | | -1 | % | | | 1 | % | | | (100 501 | ) | | | 100 501 | |
Equities | | | -10 | % | | | 10 | % | | | (350 327 | ) | | | 350 327 | | | | -10 | % | | | 10 | % | | | (443 582 | ) | | | 443 582 | |
Diversified alternatives(2) | | | -9 | % | | | 9 | % | | | (625 078 | ) | | | 625 078 | | | | -9 | % | | | 9 | % | | | (625 072 | ) | | | 625 072 | |
Infrastructure | | | -10 | % | | | 10 | % | | | (289 146 | ) | | | 289 146 | | | | -10 | % | | | 10 | % | | | (306 327 | ) | | | 306 372 | |
Private equities | | | -10 | % | | | 10 | % | | | (246 085 | ) | | | 246 085 | | | | -10 | % | | | 10 | % | | | (242 853 | ) | | | 242 853 | |
Real estate | | | -8 | % | | | 8 | % | | | (190 367 | ) | | | 199 315 | | | | -8 | % | | | 8 | % | | | (175 433 | ) | | | 184 624 | |
| | | | | | | | | | | | | | | | | | | | | | | | | | | | | | | | |
| | | | | | | | | | | (1 763 933 | ) | | | 1 772 881 | | | | | | | | | | | | (1 893 768 | ) | | | 1 903 004 | |
| | | | | | | | | | | | | | | | | | | | | | | | | | | | | | | | |
| (1) | Cash and fixed interest includes exposure to interest rate and inflation overlays on hedging instruments. |
| (2) | Diversified alternatives include exposure to both price and interest rate risk. |
No external cash flows are generated from the Long Term Assets as deposits and withdrawals from the fixed rate notes result in a corresponding change in the investment held and do not expose QTC to liquidity risk arising from these daily movements. Interest on the fixed rate notes and distributions and fees on the Long Term Assets are capitalised.
Financial instruments have been classified in accordance with the hierarchy described in AASB 13 Fair Value Measurement, as per note 12.
Investments in unit trusts are valued by QIC using fair value methodologies adjusted for fees outstanding. QIC reports the net asset value based on the unit price at measurement date (classified as Level 2- Observable inputs).
As at 30 June 2017, investments in unit trusts are valued at $31,714 million (2016 $31,076 million).
The Board considers that the carrying value of financial liabilities recorded at amortised cost in the financial statements approximates their fair value. For the purposes of the fair value hierarchy, the fixed rate notes are categorised as level 3 – Unobservable inputs.
| | | | |
| | QUEENSLAND TREASURY CORPORATION | | ANNUAL |
| | | | REPORT 2016-17 |
Notes to the Financial Statements
Other Information
For the year ended 30 June 2017
The following contingent liabilities existed at balance date:
| • | | QTC has provided guarantees to the value of $790 million (2016 $562 million) to support the commercial activities of various Queensland public sector entities. In each case, a counter indemnity has been obtained by QTC from the appropriate public sector entity. |
| • | | QTC can lend stock to support the liquidity of QTC bonds in the financial markets. At 30 June 2017 and 30 June 2016, no QTC inscribed stock was lent to other financial institutions. |
| 19 | Related party transactions |
QTC’s related parties is one that it controls, is controlled by, under common control or can exert significant influence over. It includes members of QTC’s key management personnel and their related parties.
| (a) | Ultimate controlling entity |
The immediate controlling entity and ultimate controlling entity is the Under Treasurer of Queensland as the Corporation Sole of QTC. No remuneration is payable by QTC to the Under Treasurer in relation to this role.
| (b) | Key management personnel |
Disclosures relating to key management personnel are set out in note 20.
| (c) | Investments in companies |
Details of investments in associates and other companies are set out in note 22.
| (d) | Transactions with related parties |
Transactions undertaken with related parties during the year include:
| • | | loans and associated interest and fees received from public sector entities (refer note 3 and note 9) |
| • | | investment of cash surpluses, interest paid and fees received (refer note 3 and note 10), and |
| • | | advisory services to other state government agencies. |
The above transactions were in the normal course of business and on commercial terms and conditions. These exclude certain advisory and other services provided to Queensland Treasury, its associated companies and other related parties. However, with respect to advisory services, QTC may seek reimbursement of some costs from time to time particularly where these relate to external charges.
QTC may from time to time indirectly hold a small amount of investments in QTC Bonds via its investments in unit trusts managed by QIC. QTC does not have direct legal ownership of these assets and therefore no adjustment has been made in the financial statements. QTC through the Long Term Assets have paid $91.6 million in management fees to QIC (2016: $103.9 million).
The nature and amount of any individually significant transactions with principal related parties are disclosed below.
| • | | QTC may incur costs in relation to consultancy and training services provided to government entities from time to time. For the prior financial year QTC incurred costs on behalf of the State or State entities for the performance of consultancy services for which these costs are reimbursed. These services were in the form of an agency arrangement for which QTC does not bear any significant risks or benefits and as such costs have been offset in the financial statements. The amount of these costs offset during the prior financial year totalled $19.5 million. |
| • | | QTC has a shareholding in Queensland Treasury Holdings Pty Ltd and its associated entities (QTH group). The QTH group hold deposits (refer note 10) and loans (refer note 9) with QTC that are provided on an arm’s length basis and are subject to QTC’s normal terms and conditions. QTC also provide company secretariat services to the QTH group on a cost recovery basis. |
QTC undertake the following agency arrangements on behalf of its clients.
| • | | QTC provides services on behalf of Queensland Treasury under a GOC Cash Management facility. QTC is not exposed to the risks and benefits of this facility and therefore does not recognise these deposits on its balance sheet. QTC charges a fee for this service. The balance of deposits under this facility at year end was $1,345.1 million. |
| • | | QTC may enter into derivative transactions from time to time on behalf of its clients. These arrangements have back to back contracts between QTC and the client and QTC and the market. In this way QTC is not exposed to the risks and benefits of these contracts and do not recognise these on-balance sheet. The notional value of these derivative arrangements at 30 June 2017 was $200.4 million. |
| 20 | Key management personnel |
Key management personnel are defined as those persons having authority and responsibility for planning, directing and controlling the activities of QTC, being members of the Board and the Executive Management Team.
QTC has designated its powers to its two boards, the Capital Markets Board and the Long Term Asset Advisory Board. Both boards are appointed by the Governor-in-Council, pursuant to section 10(2) of the Queensland Treasury Corporation Act 1988.
The Executive Management Team set the strategic direction and control of the major activities of the organisation.
| (c) | Remuneration principles |
Capital Markets Board – Directors
The process for reviewing Board remuneration requires any increase in the Board’s remuneration to be approved by the Treasurer and endorsed by Cabinet. Remuneration was last increased effective 1 July 2012.
Long Term Asset Advisory Board – Directors
No remuneration is payable by QTC to the directors of the Long Term Asset Advisory Board.
Executives and employees
QTC employees (including executive management) are employed on individual contracts and are appointed pursuant to the Queensland Treasury Corporation Act 1988.
As the majority of QTC’s employees are sourced from the financial markets in which it operates, it is crucial that QTC’s employment practices are competitive with these markets.
The remuneration framework comprises both fixed and variable remuneration (in the form of an annual short-term incentive (STI) opportunity) which are approved by the QTC Board annually. Both components are market-competitive and linked to performance.
Remuneration governance
The Human Resources Committee of the Board is responsible for governance of remuneration practices and arrangements, with the Board maintaining absolute responsibility and decision making for remuneration matters.
QTC receives annual industry benchmarking data from the Financial Industry Remuneration Group (FIRG) database, which is mapped to relevant organisations within the FIRG membership. Analysis and advice is obtained from external consultants to ensure that we continue to align QTC roles to the market.
Fixed remuneration
The fixed remuneration of each QTC employee is reviewed in July each year and is benchmarked against the FIRG remuneration data. Fixed remuneration levels are set around the FIRG market median position of a relevant sub-set of the FIRG database, and role scope, experience, skills and performance are considered when determining the remuneration level of each employee.
| | | | |
| ANNUAL | | QUEENSLAND TREASURY CORPORATION | | |
| REPORT 2016-17 | | | | |
Notes to the Financial Statements
Other information
For the year ended 30 June 2017
| 20 | Key management personnel continued |
| (c) | Remuneration principles continued |
Variable remuneration - short-term incentives
QTC’s variable remuneration framework provides an annual short-term incentive opportunity for eligible employees, aligned to financial year performance.
This opportunity is designed to differentiate and reward outstanding organisational, group and individual performance, and to align performance at these levels with incentive outcomes. It also aims to ensure market competitiveness, with ‘target’ STI outcomes aligned to the conservative market position and approved at Board level each year. For the 2016-17 year, STI payments were made to eligible staff in July.
Variable remuneration - executive management
For the 2016-17 year, where executive management have performed strongly against corporate and individual KPIs, they were eligible to receive a short-term incentive payment based on a percentage of their total fixed remuneration. For 2016-17,
short-term incentive ‘targets’ for executive management ranged
between 40% and 60%. However, the short term incentives are at risk with no payment made for underperformance and additional premiums of up to 50% of the target short-term incentive paid for above target performance.
The outcomes for the executive management are aligned to achievements measured against both corporate and individual KPIs; the overall corporate performance, based on the achievement of targets set out in QTC’s Strategic Plan 2016-20 and Corporate Plan 2016-17, has the higher weighting (60% of the outcome).
QTC’s overall performance for 2016-17, documented in the annual performance assessment that is reviewed and approved by QTC’s Board, was considered to be very strong across QTC’s whole-of-State, client, funding and operational activities. Based on the corporate performance assessed as exceeding expectations, the short-term incentives paid to the executive management broadly ranged between 53% and 80% of their total fixed remuneration.
| (d) | Remuneration by category |
| | | | | | | | |
| | | 2017 | | | 2016 | |
| | | $ | | | $ | |
| | |
Capital Markets Operations | | | | | | | | |
| | |
Directors | | | | | | | | |
Short-term employment benefits(1) | | | 314 057 | | | | 319 094 | |
Post-employment benefits(4) | | | 26 723 | | | | 22 335 | |
| | | | | | | | |
Total | | | 340 780 | | | | 341 429 | |
| | | | | | | | |
| | |
Executive management | | | | | | | | |
Short-term employment benefits(2) | | | 3 717 213 | | | | 2 855 281 | |
Long-term employment benefits(3) | | | 63 495 | | | | 54 681 | |
Post-employment benefits(4) | | | 116 254 | | | | 111 221 | |
| | | | | | | | |
Total | | | 3 896 962 | | | | 3 021 183 | |
| | | | | | | | |
| (1) | Directors’ short-term benefits include board member and committee fees, and in relation to the Chairman, also includes the provision of a car park. |
| (2) | Executive management personnel’s short-term benefits include wages, annual leave taken, short-term incentives and non-monetary benefits such as car parks and motor vehicle benefits (where applicable). |
| (3) | Long-term employment benefits relate to long-service leave. |
| (4) | Post-employment benefits include superannuation contributions made by the Corporation. |
Details of the nature and amount of each major element of the remuneration are as follows:
| | | | | | | | | | | | | | | | | | | | | | | | |
| | | SHORT-TERM | | | POST-EMPLOYMENT | | | | | | | |
| | | EMPLOYMENT BENEFITS | | | BENEFITS | | | TOTAL | |
| | | 2017 | | | 2016 | | | 2017 | | | 2016 | | | 2017 | | | 2016 | |
| | | $ | | | $ | | | $ | | | $ | | | $ | | | $ | |
Gerard Bradley- Chairman | | | 124 266 | | | | 122 818 | | | | 10 529 | | | | 10 529 | | | | 134 795 | | | | 133 347 | |
Warwick Agnew(1) | | | — | | | | — | | | | — | | | | — | | | | — | | | | — | |
Stephen Bizzell(2) | | | — | | | | 30 571 | | | | — | | | | — | | | | — | | | | 30 571 | |
Tonianne Dwyer | | | 40 210 | | | | 40 209 | | | | 3 820 | | | | 3 820 | | | | 44 030 | | | | 44 029 | |
Anne Parkin(3) | | | 42 467 | | | | — | | | | 4 166 | | | | — | | | | 46 633 | | | | — | |
Bill Shields(4) | | | 20 716 | | | | 41 432 | | | | — | | | | — | | | | 20 716 | | | | 41 432 | |
Karen Smith-Pomeroy(5) | | | 43 856 | | | | 43 855 | | | | 4 166 | | | | 4 166 | | | | 48 022 | | | | 48 021 | |
Stephen Roberts(6) | | | 2 332 | | | | — | | | | 222 | | | | — | | | | 2 554 | | | | — | |
Jim Stening | | | 40 210 | | | | 40 209 | | | | 3 820 | | | | 3 820 | | | | 44 030 | | | | 44 029 | |
| | | | | | | | | | | | | | | | | | | | | | | | |
Total | | | 314 057 | | | | 319 094 | | | | 26 723 | | | | 22 335 | | | | 340 780 | | | | 341 429 | |
| | | | | | | | | | | | | | | | | | | | | | | | |
| (1) | No remuneration is payable to the Queensland Treasury representative |
| (2) | Resigned 12 March 2016 |
| (4) | Resigned 31 December 2016 |
| (5) | Appointed 9 July 2015 |
| (6) | Appointed 8 June 2017 |
| | | | |
| | QUEENSLAND TREASURY CORPORATION | | ANNUAL |
| | | | REPORT 2016-17 |
Notes to the Financial Statements
Other information
For the year ended 30 June 2017
| 20 | Key management personnel continued |
| (d) | Remuneration by category continued |
Details of the nature and amount of each major element of the remuneration of the executive management personnel are as follows:
| | | | | | | | | | | | | | | | | | | | | | | | |
| | | SHORT-TERM EMPLOYMENT BENEFITS | | | POST- EMPLOYMENT
BENEFITS | | | LONG-TERM
BENEFITS | | | TOTAL | |
30 JUNE 2017 | | BASE
$ | | | SHORT-TERM
INCENTIVE
$ | | | NON-
MONETARY
$ | | | $ | | | $ | | | $ | |
Chief Executive | | | 678 587 | | | | 464 668 | | | | 14 861 | | | | 19 548 | | | | 18 019 | | | | 1 195 683 | |
Deputy Chief Executive and Managing Director, Funding and Markets(1) | | | 527 788 | | | | 437 250 | | | | 10 182 | | | | 19 548 | | | | 14 239 | | | | 1 009 007 | |
Managing Director, Client Advisory(1) | | | 328 661 | | | | 208 688 | | | | 10 829 | | | | 19 548 | | | | 11 150 | | | | 578 876 | |
Managing Director, | | | | | | | | | | | | | | | | | | | | | | | | |
Risk and Financial Operations(1) | | | 329 251 | | | | 211 689 | | | | 10 039 | | | | 19 548 | | | | 9 251 | | | | 579 778 | |
Managing Director, Corporate Services(1) | | | 290 509 | | | | 169 600 | | | | 24 611 | | | | 38 062 | | | | 10 836 | | | | 533 618 | |
| | | | | | | | | | | | | | | | | | | | | | | | |
Total | | | 2 154 796 | | | | 1 491 895 | | | | 70 522 | | | | 116 254 | | | | 63 495 | | | | 3 896 962 | |
| | | | | | | | | | | | | | | | | | | | | | | | |
| (1) | Position effective from 1 July 2016 following corporate restructure |
| | | | | | | | | | | | | | | | | | | | | | | | |
| | | SHORT-TERM EMPLOYMENT BENEFITS | | | POST-EMPLOYMENT
BENEFITS | | | LONG-TERM
BENEFITS | | | TOTAL | |
30 JUNE 2016 | | BASE
$ | | | SHORT-TERM
INCENTIVE
$ | | | NON-
MONETARY
$ | | | $ | | | $ | | | $ | |
Chief Executive | | | 640 675 | | | | 418 341 | | | | 26 111 | | | | 24 242 | | | | 18 461 | | | | 1 127 830 | |
Executive General Manager, | | | 383 039 | | | | 320 000 | | | | 23 573 | | | | 37 536 | | | | 10 635 | | | | 774 783 | |
Funding & Markets(1)(2) | | | | | | | | | | | | | | | | | | | | | | | | |
Chief Operating Officer(2) | | | 317 907 | | | | 180 000 | | | | 14 326 | | | | 30 201 | | | | 13 780 | | | | 556 214 | |
Executive General Manager, Client Services(2) | | | 321 983 | | | | 195 000 | | | | 14 326 | | | | 19 242 | | | | 11 805 | | | | 562 356 | |
| | | | | | | | | | | | | | | | | | | | | | | | |
Total | | | 1 663 604 | | | | 1 113 341 | | | | 78 336 | | | | 111 221 | | | | 54 681 | | | | 3 021 183 | |
| | | | | | | | | | | | | | | | | | | | | | | | |
| (1) | Appointed 17 August 2015 |
| (2) | Positions effective to 30 June 2016 |
QTC’s Capital Markets Board members’ directorships are disclosed in the corporate governance section of the Annual Report. No remuneration is paid or payable by QTC to the Under Treasurer as QTC’s Corporation Sole.
There are no transactions between QTC and entities controlled by key management personnel or loans to/from key management personnel during the financial year.
The external auditor (Auditor-General of Queensland) does not provide any consulting services to QTC. Details of amounts paid or payable to the auditor of QTC (GST exclusive) are shown below:
| | | | | | | | |
| | | 2017
$ | | | 2016
$ | |
| | |
Audit services | | | | | | | | |
Audit and review of QTC financial statements | | | 400 000 | | | | 390 000 | |
| | | | |
| ANNUAL | | QUEENSLAND TREASURY CORPORATION | | |
| REPORT 2016-17 | | | | |
Notes to the Financial Statements
Other information
For the year ended 30 June 2017
| 22 | Investments in companies |
Investments in the following companies are held at cost:
| | |
NAME | | PRINCIPAL ACTIVITIES |
| Queensland Treasury Holdings Pty Ltd (QTH) | | Holding company for a number of subsidiaries and strategic investments held on behalf of the State of Queensland |
| Queensland Lottery Corporation Pty Ltd | | Holds the Golden Casket lottery licence and trade marks |
| DBCT Holdings Pty Ltd | | Holds the bulk coal terminal tenure and facilities at Dalrymple Bay near Mackay, which it has leased under a long term lease arrangement |
| Queensland Airport Holdings (Mackay) Pty Ltd | | Owns the Mackay airport land and infrastructure which it has leased under a 99 year lease arrangement |
| Queensland Airport Holdings (Cairns) Pty Ltd | | Owns the Cairns airport land and infrastructure which it has leased under a 99 year lease arrangement |
| Brisbane Port Holdings Pty Ltd | | Owns the Port of Brisbane tenure and infrastructure which it has leased under a 99 year lease arrangement |
QTH is incorporated and domiciled in Brisbane, Australia. QTH holds a 100 per cent beneficial interest in the companies listed above. QTC does not apply the equity method to its investment in QTH (refer note 2 (o) Judgments and Assumptions).
Each year the board determines the appropriate level of dividends to be declared taking into consideration the financial situation of the Corporation. In the current year, the board decided to provide a repatriation dividend of $500 million from past surpluses. In the prior financial year a dividend of $47 million was provided for out of that year’s profit.
| 24 | Events subsequent to balance date |
There are no matters or circumstances which have arisen since the end of the financial year that have significantly affected or may significantly affect the operations of QTC, the results of those operations or the state of affairs of QTC in future years.
| | | | |
| | QUEENSLAND TREASURY CORPORATION | | ANNUAL |
| | | | REPORT 2016-17 |
Certificate of the Queensland Treasury Corporation
The foregoing general purpose financial statements have been prepared in accordance with the Financial Accountability Act 2009 and other prescribed requirements.
The Directors draw attention to note 2(a) to the financial statements, which includes a statement of compliance with International Financial Reporting Standards.
We certify that in our opinion:
| (i) | the prescribed requirements for establishing and keeping the accounts have been complied with in all material respects |
| (ii) | the foregoing annual financial statements have been drawn up so as to present a true and fair view of Queensland Treasury Corporation’s assets and liabilities, financial position and financial performance for the year ended 30 June 2017, and |
| (iii) | the management report includes a fair review of the information required under article 3(2)(c) of the Law of January 11, 2008 on transparency requirements for issuers of securities on the Luxembourg Stock Exchange. |
The financial statements are authorised for issue on the date of signing this certificate which is signed in accordance with a resolution of the Capital Markets Board.
| | |
| | |
| G P BRADLEY | | P C NOBLE |
| Chairman | | Chief Executive |
Brisbane
18 August 2017
| | | | |
| ANNUAL | | QUEENSLAND TREASURY CORPORATION | | |
| REPORT 2016-17 | | | | |
Independent Auditor’s report
To the Capital Markets Board of Queensland Treasury Corporation
Report on the audit of the financial report
Opinion
I have audited the accompanying financial report of Queensland Treasury Corporation. The financial report comprises the balance sheet as at 30 June 2017, the statement of comprehensive income, statement of changes in equity and statement of cash flows for the year then ended, notes to the financial statements including summaries of significant accounting policies and other explanatory information, and the certificate given by the Chairman and Chief Executive.
In my opinion, the financial report:
| a) | gives a true and fair view of Queensland Treasury Corporation’s financial position as at 30 June 2017, and its financial performance for the year then ended; |
| b) | complies with the Financial Accountability Act 2009, the Financial and Performance Management Standard 2009 and Australian Accounting Standards; and |
| c) | also complies with International Financial Reporting Standards as disclosed in Note 2(a). |
Basis for opinion
I conducted my audit in accordance with the Auditor-General of Queensland Auditing Standards, which incorporate the Australian Auditing Standards. My responsibilities under those standards are further described in the Auditor’s Responsibilities for the Audit of the Financial Report section of my report.
I am independent of the entity in accordance with the ethical requirements of the Accounting Professional and Ethical Standards Board’s APES 110 Code of Ethics for Professional Accountants (the Code) that are relevant to my audit of the financial report in Australia. I have also fulfilled my other ethical responsibilities in accordance with the Code and the Auditor-General of Queensland Auditing Standards. I believe that the audit evidence I have obtained is sufficient and appropriate to provide a basis for my opinion.
Key audit matter
Key audit matters are those matters that, in my professional judgement, were of most significance in my audit of the financial report of the current period. These matters were addressed in the context of the audit of the financial report as whole, and in forming the auditor’s opinion thereon, and I do not provide a separate opinion on these matters.
Gain on onlendings ($136 million), loss on financial liabilities at fair value through profit or loss ($554 million) and gain on derivatives ($353 million)
Refer to notes 2(o) and 3 in the financial report
Key audit matter
In the current financial year, Queensland Treasury Corporation finalised the replacement of its legacy middle and back office system which calculates gain/(loss) on onlendings, financial liabilities at fair value through profit or loss and derivatives. The replacement of this system required additional audit evidence to support the gains/ losses on these instruments to ensure that the gains/(losses) were materially correct.
Gains/(losses) on onlendings and derivatives represents 16% and 36% of the total gain/ (loss) on financial assets respectively, and gain/(loss) on financial liabilities at fair value through profit or loss represents 72% of gains/(losses) on financial liabilities. These have a material impact on the statement of comprehensive income.
| | | | |
| | QUEENSLAND TREASURY CORPORATION | | ANNUAL |
| | | | REPORT 2016-17 |
Gains/(losses) on financial assets and financial liabilities were a key audit matter for the following reasons:
| • | | management used alternative models to support the calculation of gains/(losses) on onlendings, financial liabilities at fair value through profit or loss and derivatives reported in the financial statements for the financial year ended 30 June 2017, |
| • | | the methodology used in the calculation of gains/(losses) on onlendings, and financial liabilities at fair value through profit or loss and derivatives was complex as they depend on: |
| | - | the opening and closing market values of onlendings, financial liabilities and derivatives (together known as ‘financial instruments’) |
| | - | cash flow transactions for the financial year ended 30 June 2017. |
| • | | incorrect valuation of the financial instruments and incorrect quantum of cash flow transactions can have a material impact on the interest income and income expense calculated by the models. |
| • | | gains/(losses) on financial assets and financial liabilities were the most material component of the statement of comprehensive income. |
How my audit addressed the key audit matter
Management’s models calculate gains/(losses) on onlendings, financial liabilities at fair value through profit or loss and derivatives as a sum of the movement in the market value of financial instruments and the interest cash flow transactions for the financial year ended 30 June 2017.
My procedures included, but were not limited to:
Step 1: Assessing the model and inputs
a) assessed the adequacy of management’s controls over the process for calculating gains/(losses) on onlendings, financial liabilities at fair value through profit or loss and derivatives including the controls over the integrity of the model used.
b) confirmed the movement in the market values of financial instruments for the financial year ended 30 June 2017 by:
| | i. | agreeing the market values of financial instruments in the model at the start of the period to the audited financial statements as at 30 June 2016 |
| | ii. | agreeing the market values of financial instruments in the models as at 30 June 2017 to the valuation testing undertaken (refer step 2 below on the work performed over market values) |
| | iii. | calculating the overall movement in the market value of the financial instruments as the difference between i and ii above. |
c) agreed a sample of the cash flow transactions used in the models to the supporting documentation to ensure accuracy of the cash flows.
d) recalculated the interest income and interest expense by summing the output in b) and c) above.
e) reviewed and assessed the formula used in the models to ensure the calculation is materially correct and that there are no inconsistencies in the formula applied.
Step 2: Recalculating the market value of non-derivative financial instruments as at 30 June 2017
a) obtained the prices/input from an independent source and tested a sample of valuations of the onlending balances and compared these to the values determined by QTC.
b) using the same pricing source, determined the valuation of financial liabilities at fair value through profit or loss and compared these to the values determined by QTC.
c) agreed the gains/(losses) on onlendings and financial liabilities at fair value through profit or loss derived from the models to the general ledger.
| | | | |
| ANNUAL | | QUEENSLAND TREASURY CORPORATION | | |
| REPORT 2016-17 | | | | |
Step 3: Recalculating the market value of derivative financial instruments as at 30 June 2017
a) engaged a specialist, to assess the valuation of derivative balances. This included an assessment of the reasonableness of the valuation methodology applied by QTC and the key inputs in the yield curve by:
| | • | | comparing the yield rates against those from Bloomberg, a third-party pricing source that is available by subscription and widely used in the financial services industry |
| | • | | reviewing the reasonableness of the inputs used, such as cash flows, interest rates etc where market data is not available by comparing these inputs to a comparable financial instrument. |
b) In engaging a specialist to assist me in addressing the key audit matter:
| | • | | evaluated their qualifications, competence, capabilities, and objectivity |
| | • | | assessed the nature, scope and objectives of the work completed for appropriateness |
| | • | | evaluated the findings and conclusions for relevance, reasonableness and are consistency with other audit evidence obtained. |
c) agreed the gains/(losses) on derivatives derived from the models to the general ledger.
Other information
The Board is responsible for the other information. The information comprises the information included in the entity’s annual report for the year ended 30 June 2017, but does not include the financial report and my auditor’s report thereon.
My opinion on the financial report does not cover the other information and accordingly I do not express any form of assurance conclusion thereon.
In connection with my audit of the financial report, my responsibility is to read the other information and, in doing so, consider whether the other information is materially inconsistent with the financial report or my knowledge obtained in the audit or otherwise appears to be materially misstated.
If based on the work performed, I conclude that there is a material misstatement of this other information, I am required to report that fact. I have nothing to report in this regard.
Responsibilities of the Board for the financial report
The Board is responsible for the preparation of the financial report that gives a true and fair view in accordance with the Financial Accountability Act 2009, the Financial and Performance Management Standard 2009 and Australian Accounting Standards, and for such internal control as the Board determines is necessary to enable the preparation of the financial report that is free from material misstatement, whether due to fraud or error.
The Board is also responsible for assessing Queensland Treasury Corporation’s ability to continue as a going concern, disclosing, as applicable, matters relating to going concern and using the going concern basis of accounting, unless it is intended to abolish the entity or otherwise cease operations.
Auditor’s responsibilities for the audit of the financial report
My objectives are to obtain reasonable assurance about whether the financial report as a whole is free from material misstatement, whether due to fraud or error, and to issue an auditor’s report that includes my opinion. Reasonable assurance is a high level of assurance, but is not a guarantee that an audit conducted in accordance with the Australian Auditing Standards will always detect a material misstatement when it exists. Misstatements can arise from fraud or error and are considered material if, individually or in aggregate, they could reasonably be expected to influence the economic decisions of users taken on the basis of this financial report.
| | | | |
| | QUEENSLAND TREASURY CORPORATION | | ANNUAL |
| | | | REPORT 2016-17 |
As part of an audit in accordance with the Australian Auditing Standards, I exercise professional judgement and maintain professional scepticism throughout the audit. I also:
| • | | Identify and assess the risks of material misstatement of the financial report, whether due to fraud or error, design and perform audit procedures responsive to those risks, and obtain audit evidence that is sufficient and appropriate to provide a basis for my opinion. The risk of not detecting a material misstatement resulting from fraud is higher than for one resulting from error, as fraud may involve collusion, forgery, intentional omissions, misrepresentations, or the override of internal control. |
| • | | Obtain an understanding of internal control relevant to the audit in order to design audit procedures that are appropriate in the circumstances, but not for expressing an opinion on the effectiveness of the entity’s internal control. |
| • | | Evaluate the appropriateness of accounting policies used and the reasonableness of accounting estimates and related disclosures made by the Board. |
| • | | Conclude on the appropriateness of the Board’s use of the going concern basis of accounting and, based on the audit evidence obtained, whether a material uncertainty exists related to events or conditions that may cast significant doubt on the entity’s ability to continue as a going concern. If I conclude that a material uncertainty exists, I am required to draw attention in my auditor’s report to the related disclosures in the financial report or, if such disclosures are inadequate, to modify my opinion. I base my conclusions on the audit evidence obtained up to the date of my auditor’s report. However, future events or conditions may cause the entity to cease to continue as a going concern. |
| • | | Evaluate the overall presentation, structure and content of the financial report, including the disclosures, and whether the financial report represents the underlying transactions and events in a manner that achieves fair presentation. |
I communicate with the Board regarding, among other matters, the planned scope and timing of the audit and significant audit findings, including any significant deficiencies in internal control that I identify during my audit.
From the matters communicated with the Board, I determine those matters that were of most significance in the audit of the financial report of the current period and are therefore the key audit matters.
Report on other legal and regulatory requirements
In accordance with s.40 of the Auditor-General Act 2009, for the year ended 30 June 2017:
a) I received all the information and explanations I required.
b) In my opinion, the prescribed requirements in relation to the establishment and keeping of accounts were complied with in all material respects.
| | |
 | |  |
| BRENDAN WORRALL | | Queensland Audit Office |
| Auditor-General of Queensland | | Brisbane |
| | | | |
| ANNUAL | | QUEENSLAND TREASURY CORPORATION | | |
| REPORT 2016-17 | | | | |
Management report
For the year ended 30 June 2017
Review of Operations
QTC made an operating profit for the year ended 30 June 2017 of AUD 353.8 million consisting of the following operating segment results:
Capital Markets Operations
During the period from 1 July 2016 to 30 June 2017, QTC continued in its ordinary course of business as the State of Queensland’s central financing authority and corporate treasury services provider. The operating profit after tax for the year ended 30 June 2017 for the Capital Markets Operations segment was AUD 129.2 million.
Long Term Assets
QTC holds a portfolio of assets which were transferred to QTC by the State Government under an administrative arrangement. These assets are the investments of QTC’s Long Term Assets segment and were accumulated to fund superannuation and other long-term obligations of the State. In return for the portfolio of assets, QTC issued to the State fixed rate notes which has resulted in the State receiving a fixed rate of return on the notes, while QTC bears the impact of fluctuations in the value and returns on the asset portfolio.
The operating profit after tax for the Long Term Assets segment was AUD 224.6 million with positive returns received across all asset classes.
Principal risks and uncertainties
Financial markets were volatile for the first half of 2016-17 following the unexpected results of the Brexit referendum and US Presidential election. Despite this volatility, risk assets performed strongly and bond yields rose, due to indications of looser policy settings and consistent improvement in global economic conditions. In the second half, risk assets continued to perform well, however bond and foreign exchange markets reversed their earlier moves based on rising geopolitical risks and questions over the size and timing of fiscal easing in the US.
How financial markets deal with rising interest rates and a removal of the liquidity provided by asset purchase programs is a key risk for 2017-18. Yields increased at the end of 2016-17 as several global central banks indicated the possibility of tightening monetary policy settings. Investors are likely to focus on geopolitical tensions and the strength of the global and domestic economies in the financial year ahead. We do not expect these uncertainties will have a material impact on QTC’s Capital Markets performance or its ability to fund the State’s borrowing requirement in 2017-18.
| | | | |
| | QUEENSLAND TREASURY CORPORATION | | ANNUAL |
| | | | REPORT 2016-17 |
Appendices
| | | | |
Appendix A – Statutory and mandatory disclosures | | | 52 | |
| |
Appendix B – Glossary | | | 53 | |
| |
Appendix C – Compliance checklist | | | 54 | |
| |
Appendix D – Contacts | | | 55 | |
| | | | |
| ANNUAL | | QUEENSLAND TREASURY CORPORATION | | |
| REPORT 2016-17 | | | | |
Appendix A – Statutory and mandatory disclosures
QTC is required to make various disclosures in its Annual Report. QTC is also required to make various disclosures on the Queensland Government’s Open Data website (qld.gov.au/data) in lieu of inclusion in its Annual Report. This Appendix sets out those mandatory disclosure statements that are not included elsewhere in the report or made available on the Open Data website.
Information systems and record keeping
During the year, QTC continued its compliance with the provisions of the Public Records Act 2002, and its implementation of the Information Standard 40: Recordkeeping and Information Standard 31: Retention and Disposal of Public Records.
QTC has continued its work with State Archives on the development of a QTC-specific Local Retention and Disposal Schedule, and provides training to staff in the appropriate management of public records in all formats, including email.
During the year, QTC continued to enhance its electronic document management system for improved information management and storage cost reduction.
Public Sector Ethics Act
QTC provides the following information pursuant to obligations under section 23 of the Public Sector Ethics Act 1994 (Qld) to report on action taken to comply with certain sections of the Act.
QTC employees are required to comply with QTC’s Code of Conduct for employees, which aligns with the ethics principles and values in the Public Sector Ethics Act 1994 (Qld), as well as the Code of Ethics and Code of Conduct established by the Australian Financial Markets Association of which QTC is a member. Both codes are available to employees via QTC’s intranet. Copies of these codes can be inspected by contacting QTC’s Human Resources Group (see Appendix E for contact details). Appropriate education and training about the code of conduct has been provided to QTC staff.
QTC’s human resource management and corporate governance policies and practices ensure that QTC:
| • | | acts ethically with regard to its Code of Conduct and within appropriate law, policy and convention, and |
| • | | addresses the systems and processes necessary for the proper direction and management of its business and affairs. |
QTC is committed to:
| • | | observing high standards of integrity and fair-dealing in the conduct of its business, and |
| • | | acting with due care, diligence and skill. |
QTC’s Compliance Policy requires that QTC and all employees comply with the letter and the spirit of all relevant laws and regulations, industry standards, and relevant government policies, as well as QTC’s own policies and procedures.
Remuneration: Board and Committee
For the year ending 30 June 2017, the remuneration and committee fees of the QTC Capital Market Board members (excluding superannuation contributions and non-monetary benefits) were as follows:
| | | | | | | | | | |
Board | | | | | Committee | | | |
Chairperson | | $ | 100,527 | | | Chairperson | | $ | 6,658 | |
Member | | $ | 33,551 | | | Member | | $ | 5,152 | |
The total remuneration payments made to the members of the QTC Capital Market Board was $327,349 and the total on-costs (including travel, accommodation, and hiring of motor vehicles for the members) was $19,515.
No payments in relation to remuneration or on-costs (including travel, accommodation, and hiring of motor vehicles for the members) were made to members of the Long Term Asset Advisory Board in the year ending 30 June 2017.
Related entities
The related entities in Note 22 are not equity accounted in the financial report of the Queensland Treasury Corporation. These entities are consolidated into Queensland Treasury’s financial report.
| | | | |
| | QUEENSLAND TREASURY CORPORATION | | ANNUAL |
| | | | REPORT 2016-17 |
Appendix B – Glossary
Australian Government Guarantee (AGG): Also known as the Commonwealth Government Guarantee. In response to the global financial crisis, on 25 March 2009, the Australian Government provided a time-limited, voluntary guarantee over existing and new Australian state and territory government borrowing. On 16 June 2009, the Queensland Government took up the guarantee on all existing QTC AUD denominated benchmark bond lines (global and domestic) with a maturity date of between 12 months and 180 months (1-15 years). The RBA approved QTC’s application on 11 December 2009. The AGG was withdrawn for new borrowings after 31 December 2010.
Basis point: One hundredth of one per cent (0.01 per cent).
Bitcoin: A type of digital currency in which encryption techniques are used to regulate the generation of units of currency and verify the transfer of funds, operating independently of a central bank.
Blockchain: Allows secure online transactions via a digital ledger in which transactions made in bitcoin or another cryptocurrency are recorded chronologically and publicly. The information is decentralised and cannot be copied.
Bond: A financial instrument where the borrower agrees to pay the investor a rate of interest for a fixed period of time. A typical bond will involve regular interest payments and a return of principal at maturity.
Commonwealth Government Guarantee (CGG):
See Australian Government Guarantee above.
CP (commercial paper): A short-term money market instrument issued at a discount with the full face value repaid at maturity. CP can be issued in various currencies with a term to maturity of less than one year.
Credit rating: Measures a borrower’s creditworthiness and provides an international framework for comparing the credit quality of issuers and rated debt securities. Rating agencies allocate three kinds of ratings: issuer credit ratings, long-term debt and short-term debt. Issuer credit ratings are among the most widely watched. They measure the creditworthiness of the borrower including its capacity and willingness to meet financial obligations. QTC has a strong rating from two rating agencies—Standard & Poor’s, and Moody’s.
Cryptobond: A bond issued using blockchain technology.
Cryptocurrency: A type of digital currency that uses cryptography for security and anti-counterfeiting measures.
Fixed Income Distribution Group: A group of financial intermediaries who market and make prices in QTC’s debt instruments.
Floating rate notes (FRNs): A debt instrument which pays a variable rate of interest (coupon) at specified dates over the term of the debt, as well as repaying the principal of the maturity date. The floating rate is usually a money market reference rate, such as BBSW, plus a fixed margin. Typically the interest is paid quarterly or monthly.
GOC: Government-owned Corporation.
Green Bond: QTC Green Bonds are guaranteed by the Queensland State Government, issued under the AUD Bond Program with 144A capability and certified by the Climate Bonds Initiative. Proceeds from QTC Green Bonds are to be used to fund qualifying green projects and assets for the State of Queensland. The proceeds are allocated to specific projects that support Queensland’s transition to a low-carbon and climate resilient economy. The qualifying green projects and QTC’s Green Bond Framework have been certified by the Climate Bonds Initiative and verified by DNV GL, an approved third-party assurance provider.
Issue price: The price at which a new security is issued in the primary market.
Liquid: Markets or instruments are described as being liquid, and having depth, if there are enough buyers and sellers to absorb sudden shifts in supply and demand without price distortions.
Market value: The price at which an instrument can be purchased or sold in the current market.
MTN (Medium-Term Note): A financial debt instrument that can be structured to meet an investor’s requirements in regards to interest rate basis, currency and maturity. MTNs usually have maturities between 9 months and 30 years.
QTC: Queensland Treasury Corporation.
RBA: Reserve Bank of Australia.
T-Note (Treasury Note): A short-term money market instrument issued at a discount with the full face value repaid at maturity. T-Notes are issued in Australian dollars with a term to maturity of less than 1 year.
| | | | |
| ANNUAL | | QUEENSLAND TREASURY CORPORATION | | |
| REPORT 2016-17 | | | | |
Appendix C – Compliance checklist
| | | | | | |
SUMMARY OF REQUIREMENT | | | | BASIS FOR REQUIREMENT | | ANNUAL REPORT REFERENCE |
| LETTER OF COMPLIANCE | | A letter of compliance from the accountable officer or statutory body to the relevant Minister/s | | ARRs – section 7 | | Page 1 |
| | | |
| ACCESSIBILITY | | Table of contents Glossary | | ARRs – section 9.1 | | Inside front cover
Appendix B |
| | Public availability | | ARRs – section 9.2 | | Appendix D |
| | Interpreter service statement | | Queensland Government
Language Services Policy
ARRs – section 9.3 | | Appendix D |
| | Copyright notice | | Copyright Act 1968
ARRs – section 9.4 | | Back cover |
| | | |
| GENERAL | | Introductory information | | ARRs – section 10.1 | | Page 2 |
| INFORMATION | | Agency role and main functions | | ARRs – section 10.2 | | Page 2-3, back cover |
| | Operating environment | | ARRs – section 10.3 | | Pages 3-11, 13 |
| | | |
NON-FINANCIAL PERFORMANCE | | Government’s objectives for the community | | ARRs – section 11.1 | | Pages 6-11 |
| | Agency objectives and performance indicators | | ARRs – section 11.3 | | Pages 4-11 |
| | | |
| FINANCIAL PERFORMANCE | | Summary of financial performance | | ARRs – section 12.1 | | Pages 4-5, Notes to
Financial
Statements: Pages
22-45 |
| | | |
| GOVERNANCE – | | Organisational structure | | ARRs – section 13.1 | | Pages 12-16 |
| MANAGEMENT | | Executive management | | ARRs – section 13.2 | | Page 5, 16 |
| AND STRUCTURE | | Public Sector Ethics Act 1994 | | Public Sector Ethics Act 1994
ARRs – section 13.4 | | Appendix A |
| | | |
GOVERNANCE – RISK MANAGEMENT | | Risk management | | ARRs – section 14.1 | | Page 10 |
| AND | | Audit committee | | ARRs – section 14.2 | | Pages 12-13 |
| ACCOUNTABILITY | | Internal audit | | ARRs – section 14.3 | | Page 16 |
| | Information systems and recordkeeping | | ARRs – section 14.5 | | Appendix A |
| | | |
| GOVERNANCE – HUMAN RESOURCES | | Workforce planning and performance | | ARRs – section 15.1 | | Pages 10-11 |
| | | |
| OPEN DATA | | Consultancies | | ARRs – section 33.1 | | Appendix A |
| | Overseas travel | | ARRs – section 33.2 | | Appendix A |
| | Queensland Language Services Policy | | ARRs – section 33.3 | | Appendix A |
| | | |
FINANCIAL STATEMENTS | | Certification of financial statements | | FAA – section 62
FPMS –sections 42, 43 and 50 ARRs – section 17.1 | | Page 45 |
| | Independent Auditor’s Report | | FAA – section 62
FPMS – section 50 ARRs – section 17.2 | | Pages 46-47 |
Note: This checklist excludes reference to any requirements that do not apply to QTC for the current reporting period.
FAA: Financial Accountability Act 2009; FPMS: Financial and Performance Management Standard 2009; ARRs: Annual report requirements for Queensland Government agencies
| | | | |
| | QUEENSLAND TREASURY CORPORATION | | ANNUAL |
| | | | REPORT 2016-17 |
Appendix D – Contacts
Queensland Treasury Corporation
Level 31, 111 Eagle Street
Brisbane Queensland Australia
GPO Box 1096
Brisbane Queensland
Australia 4001
| | |
| Telephone: | | +61 7 3842 4600 |
| Facsimile: | | +61 7 3221 4122 |
| |
| Email: | | enquiry@qtc.com.au |
| Internet: | | www.qtc.com.au |
Queensland Treasury Corporation’s annual and half-yearly reports (ISSN 1837-1256 print; ISSN 1837-1264 online) are available on QTC’s website at www.qtc.com.au/about-qtc/annual-reports. If you would like a copy of a report posted to you, please call QTC’s reception on +61 7 3842 4600.
If you would like to comment on a report, please complete the online enquiry form located on our website.
| | |
| | | Telephone |
| Queensland Treasury Corporation Reception | | +61 7 3842 4600 |
| Stock Registry (Link Market Services Ltd) | | 1800 777 166 |

QTC is committed to providing accessible services to Queensland residents from culturally and linguistically diverse backgrounds. If you have difficulty understanding this report, please contact QTC’s reception on +61 7 3842 4600 and we will arrange for an interpreter to assist you.
| | | | |
| ANNUAL | | QUEENSLAND TREASURY CORPORATION | | |
| REPORT 2016-17 | | | | |
Appendix D – Contacts continued
Dealer panels as at 30 June 2017
Note: actual dealer entities may vary depending on the facility and location of the dealer.
| | |
DOMESTIC AND GLOBAL AUD BOND
FACILITY DISTRIBUTION GROUP | | TELEPHONE |
| Australia and New Zealand Banking Group Ltd |
| Domestic (Australia) | | +61 2 8037 0220 |
| Global (London) | | +44 203 229 2070 |
| Bank of America Merrill Lynch |
| Domestic (Australia) | | +61 2 9226 5570 |
| Global (London) | | +44 207 995 6750 |
| Citigroup Global Markets Australia Ltd |
| Domestic (Australia) | | +61 2 8225 6440 |
| Global (London) | | +44 207 986 9521 |
| Commonwealth Bank of Australia |
| Domestic (Australia) | | +61 2 9117 0020 |
| Global (London) | | +44 207 329 6444 |
| Deutsche Capital Markets Australia1 |
| Domestic (Australia) | | +61 2 8258 1444 |
| Global (London) | | +44 207 547 1931 |
| JP Morgan |
| Domestic (Australia) | | +61 2 9003 7988 |
| Global (London) | | +44 207 742 1829 |
| National Australia Bank Ltd |
| Domestic (Australia) | | +61 2 9295 1166 |
| Global (London) | | +44 207 796 4761 |
| Nomura International Plc |
| Domestic (Australia) | | +61 2 8062 8000 |
| Global (London) | | +44 207 103 6631 |
| RBC Capital Markets |
| Domestic (Australia) | | +61 2 9033 3222 |
| Global (London) | | +44 207 029 0094 |
| UBS Investment Bank2 |
| Domestic (Australia) | | +61 2 9324 2222 |
| Global (London) | | +44 207 567 3645 |
| TD Securities |
| Domestic (Australia) | | +61 1800 646 497 |
| Global (London) | | +44 207 628 4334 |
| Westpac Banking Corporation |
| Domestic (Australia) | | +61 2 8204 2711 |
| Global (London) | | +44 207 7621 7620 |
| | |
PANEL MEMBERS | | TELEPHONE |
| QTC Treasury Note Facility Dealer Panel |
| Australia and New Zealand Banking Group Ltd | | +61 2 8037 0360 |
| Commonwealth Bank of Australia Ltd (Sydney) | | +61 2 9117 0020 |
| Deutsche Bank AG (Sydney) | | +61 2 8258 2288 |
| National Australia Bank Ltd (Sydney) | | +61 2 9295 1133 |
| Westpac Banking Corporation Ltd (Sydney) | | +61 2 8204 2744 |
| US Commercial Paper Facility Dealer Panel |
| Bank of America Merrill Lynch | | +1 646 855 6333 |
| Citigroup Global Markets Inc (New York) | | +1 212 723 6252 |
| UBS Securities | | +1 203 719 7014 |
| Multicurrency Euro Commercial Paper Facility Dealer Panel |
| Bank of America Merrill Lynch | | +44 207 996 8904 |
| Barclays Bank Plc (Hong Kong) | | +852 2903 3201 |
| Citigroup International Plc (London)3 | | +44 207 986 9070 |
| UBS Ltd (Hong Kong) | | +852 2971 6455 |
| Multicurrency Euro Medium-Term Note Facility Dealer Panel4 |
| Includes all Domestic and Global AUD Bond Facility Distribution Group | | |
| Multicurrency US Medium-Term Note Facility Dealer Panel |
| Australia and New Zealand | | +1 212 801 9160 |
| Banking Group Limited | | |
| Bank of America Merrill Lynch | | +1 646 855 8032 |
| Citigroup (New York) | | +1 212 723 6171 |
| Commonwealth Bank of Australia | | +44 207 329 6444 |
| Daiwa Capital Markets Europe Limited | | +61 3 9916 1313 |
| Deutsche Bank Securities Inc (New York)3 | | +1 212 250 6801 |
| JP Morgan | | +1 212 834 4533 |
| National Australia Bank (New York) | | +1 212 916 9677 |
| RBC Capital Markets (New York) | | +1 212 858 833 |
| TD Securities | | +1 212 827 7199 |
| UBS Investment Bank | | +1 203 719 1830 |
| 1 | Lead Manager – United States |
| 4 | Lead Arranger – UBS Ltd (London) |
| | | | |
| | QUEENSLAND TREASURY CORPORATION | | ANNUAL |
| | | | REPORT 2016-17 |
Appendix D – Contacts continued
Issuing and paying agents
| | | | | | | | |
| | | CONTACT | | TELEPHONE | | FACSIMILE | | EMAIL |
AUD Treasury Notes Austraclear Services Ltd Sydney | | Help Desk | | 1300 362 257 | | +61 2 9256 0456 | | cad@asx.com.au |
AUD Domestic Bonds Link Market Services Ltd | | Markings/Transfers | | +61 2 8571 6488 | | +61 2 9287 0315 | | qtcops@linkmarketservices.com.au |
AUD Global Bonds Deutsche Bank Trust Company Americas | | Client Services | | +1 904 645 1216 | | +1 615 866 3887 | | dwac.processing@db.com |
Euro Commercial Paper Deutsche Bank AG, London | | Client Services | | +44 207 545 8000 | | +44 207 547 6149 | | tss-gds.row@db.com |
US Commercial Paper Deutsche Bank Trust Company Americas | | Client Services | | +1 866 770 0355 | | +1 732 578 2655 | | mmi.operations@db.com |
Euro Medium-Term Notes Deutsche Bank AG, London | | Client Services | | +44 207 545 8000 | | +44 207 547 6149 | | tss-gds.row@db.com |
US Medium-Term Notes Deutsche Bank Trust Company Americas | | Client Services | | +1 866 797 2808 | | +1 212 461 4450 | | mtn.operations@db.com |
Information for institutional investors
Core to its key funding principles, QTC is committed to being open and transparent with investors and its partners in the financial markets.
Through its website, QTC provides a range of information for investors on its various funding facilities and annual borrowing program. The website also provides information and links about Australia and Queensland to help investors gain a better understanding of:
| • | | the different levels of government in Australia |
| • | | the forms of fiscal support the Australian Government provides to the states and territories |
| • | | relevant governance practices, legislation and polices |
| • | | financial data and budget information, and |
| • | | economic and trade data. |
QTC also offers investors the ability to subscribe to quarterly funding updates.
Website: qtc.qld.gov.au/institutional-investors
Quarterly investor updates: Subscribe from the institutional investor section of the website
Invest in QTC app: QTC’s ‘Invest in QTC’ app has a library of publications about QTC and Queensland for institutional investors and is available from the App Store and Google Play.
Note: App is not available in the United States.
Bloomberg ticker: qtc
| | |
 | | GPO Box 1096 Brisbane Q Australia 4001 Telephone: +61 7 3842 4600 Facsimile: +61 7 3221 4122 www.qtc.com.au |
© Queensland Treasury Corporation 2017